hedge fund industry snapshot -...
TRANSCRIPT
Hedge Fund Industry SnapshotData as of April 2013
AmericasNew York: +800 773-2889 San Francisco: +415 617-8554
Citi Prime Finance | Market Commentary
www.citigroupgcib.com | Report Date: May 2013
EMEAEMEA: +44 0 207-986-0822
Asia PacHong Kong: +852 2501-8356Tokyo: +813 6270-3165Singapore: +65 6432-1223Australia: +612 8225-6424
This report has been prepared by members of Citi Prime Finance and is not a research report. This report does not constitute advice on investments or a solicitation to buy or sell any financial instrument. Please see final pages for Market Commentary Disclosures.
Table of Contents
Monthly Highlights 1
Hedge Fund Industry Overview AUM, Performance Industry Flows
2
Hedge Fund Stats by Strategy 4
Performance at a Glance Hedge Fund Performance Citi HARP vs. HFRI Fund of Fund Performance Securities Market Performance
5
Short Flows Data US Short Sales & Short Cover by Sector US Short Sales & Short Cover by Industry Group
8
Hedge Fund (Fund Level) Profiles Fund Structure Fund Analytics
11
Risk vs. Return Metrics 13
By Strategy Performance vs. Respective Benchmark(s) Leverage Profile Hedge Fund Performance by Size Hedge Fund Performance by Age
14
Firm Disclaimers and Market Commentary Disclosures 25
Contacts 26
HighlightsPerformance, AUM & Flows Composite hedge fund performance, equal-weighted across funds, was up in April 2013 with performance ranging from +0.70% to +0.81%. Returns were
lower than the previous month which experienced +0.72% to +1.45% over the same period.
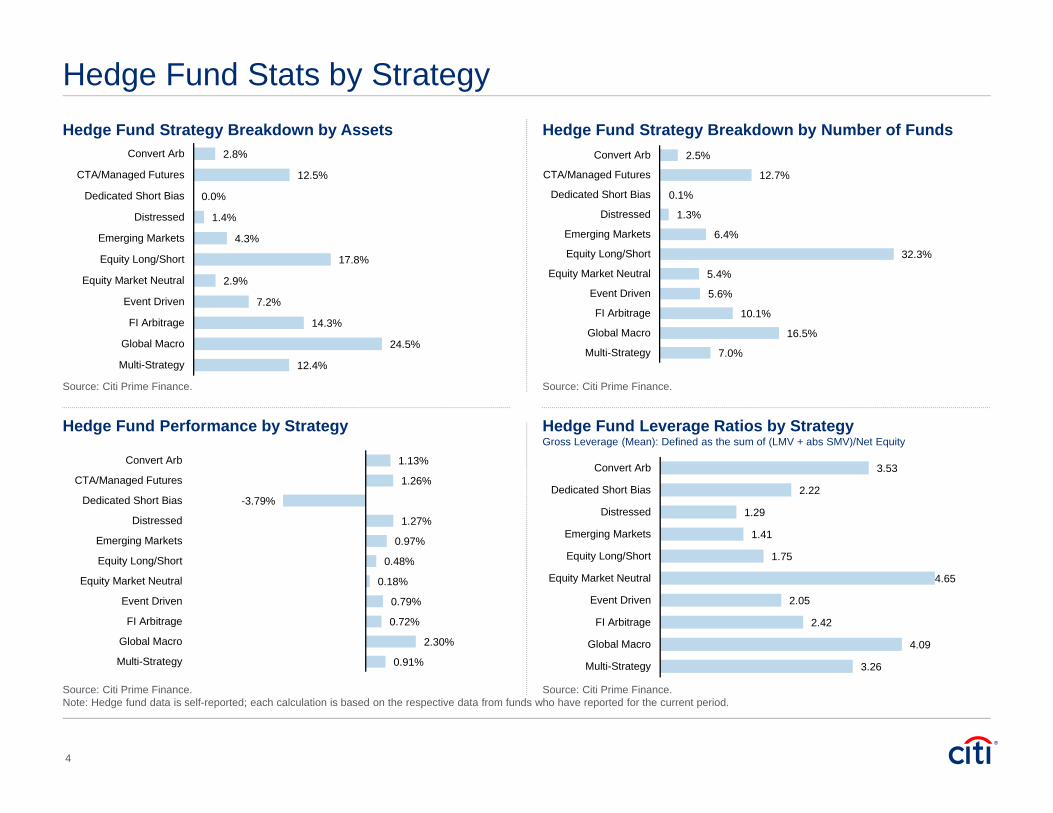
Hedge fund strategy wise, top performing strategies in April 2013 include Global Macro +2.30%, Distressed +1.27% , CTA/Managed Futures +1.26% and Convertible Arbitrage at +1.13% . The lowest performing strategies include Dedicated Short -3.79%, Equity Market Neutral +0.18%.
According to eVestment|HFN, industry assets for April 2013 increased for the sixth consecutive month, finishing net positive at +$31.14 billion. Gains were attributed mostly from performance totaling +$30.63 billion while net positive investor flows accounted for +$0.51 billion.
Net positive investor flows of +$0.51 billion for April 2013 marks the third period of net positive flows since January 2013. April 2013 flows are lower than the mean monthly flows for 2012 which stand at +$1.75 billion. April 2012 net flows were -$5.93 billion over the same period
Fund Profiles Across the subset of hedge funds reporting performance and AUM, the monthly median performance for large single funds (>$500 million) was +1.2%,
medium single funds ($100–$500 million) +1.0% and small single funds (<$100 million) +0.6%.
Liquidity terms continued its consistent pattern from the recent reporting periods showing little changes to redemption notice periods with 64% of funds requiring 30 days or less notice for redemption. Across the entire subset of reporting funds, the majority (52%) required no lockup (42%) or less than 1 year lock up (10%).
Consistent throughout recent reporting periods, large funds ( >$500 million AUM) continue to hold a large portion of industry AUM (72%) compared to medium funds ($100–$500 million) at 20% and small funds (<$100 million) holding only 8%.
Leverage, Shorts and Futures Market Positioning On a global basis, we calculate gross leverage (as measured on a mean basis) at 2.0x in April 2013 versus 2.01x in March and 1.97x in February.
Looking across both long leverage and gross leverage, the following strategies showed the highest uses of leverage: Equity Market Neutral (4.65x ), Global Macro (4.09x), Convertible Arbitrage (3.53x), and Multi Strategy (3.26x).
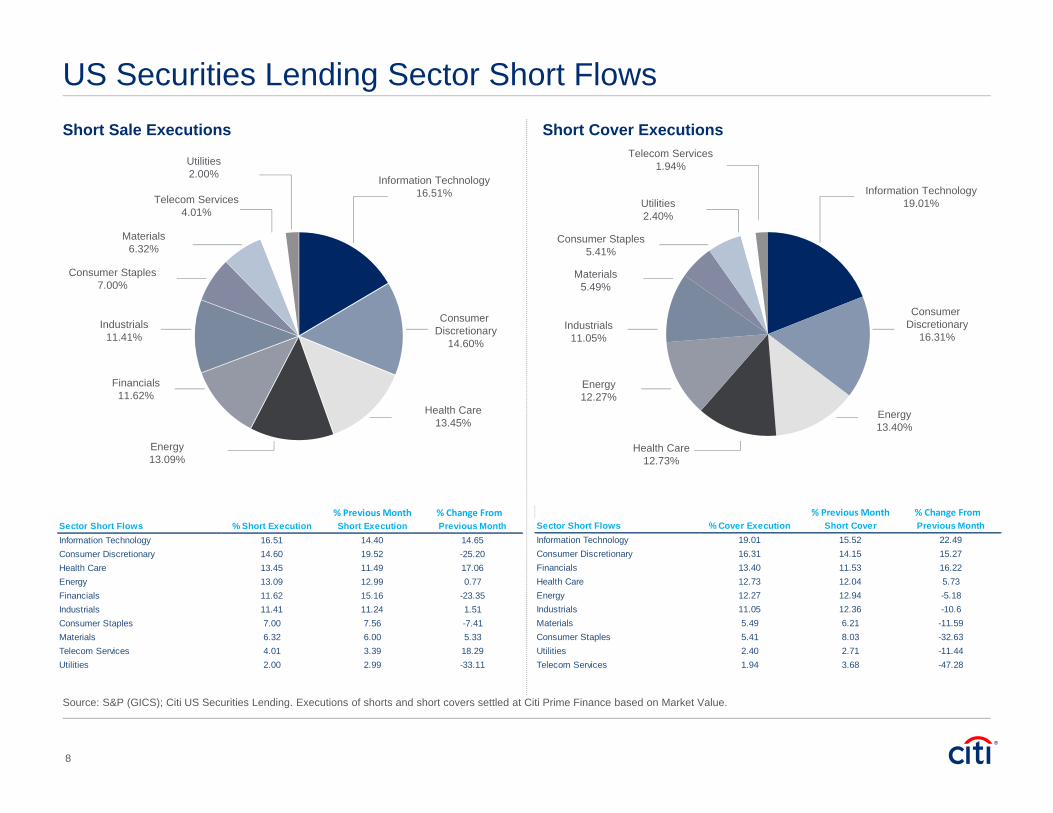
Citi US short flows data included in this month’s report show decreased interest in the Consumer Discretionary and Financials sectors. These sectors accounted for 26.22% of short executions and 29.71% of short covers in April vs. 34.69 % of short executions and 34.69 % of short covers in March 2013.
Large speculator net long positioning in gold (futures & options) was the biggest mover in April. For the previous two months the largest change in large speculator positioning of the contracts had been in EuroFX contracts. With gold prices down sharply over the course of the month, the CFTC figures unsurprisingly show a drop in the net long exposure to 5.7% of total open interest, down from 10.1% at the end of March. Large speculator net positioning in S&P (large & e-minis) contracts showed little change holding at 3.2% of total open interest. At the same time they built a net long position in 10-Year treasuries and cut a net short position in the EuroFX contracts.
1
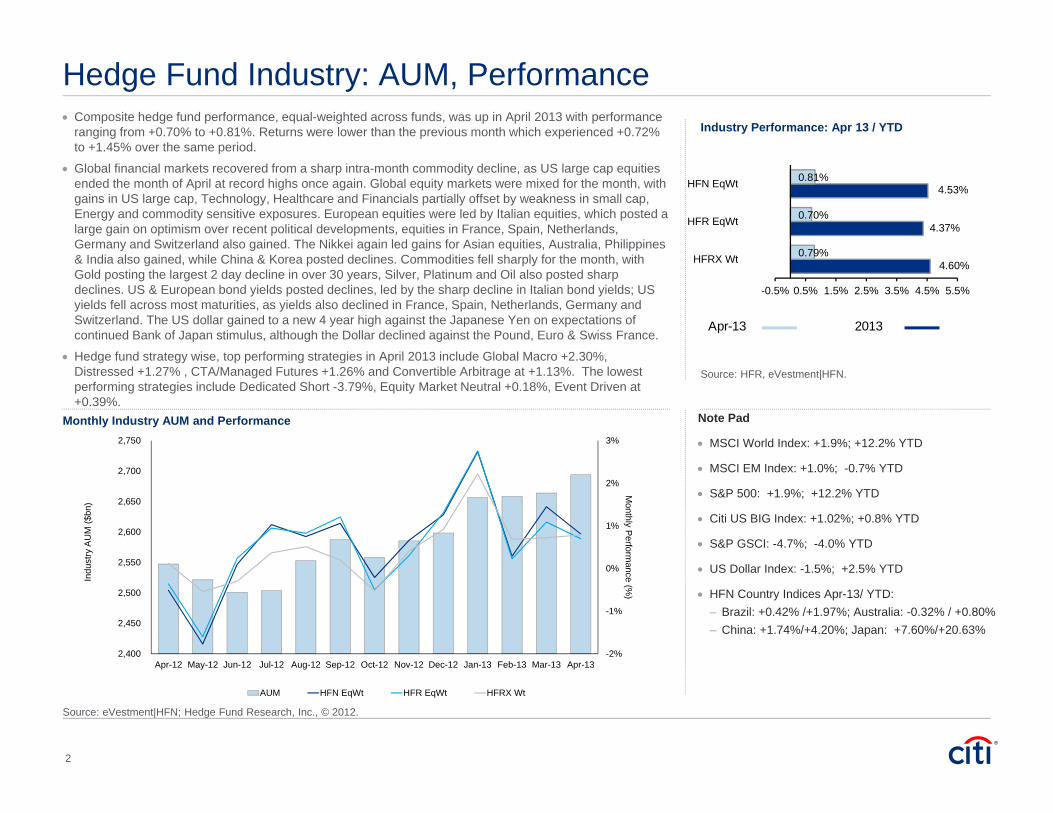
Composite hedge fund performance, equal-weighted across funds, was up in April 2013 with performance ranging from +0.70% to +0.81%. Returns were lower than the previous month which experienced +0.72% to +1.45% over the same period.
Global financial markets recovered from a sharp intra-month commodity decline, as US large cap equities ended the month of April at record highs once again. Global equity markets were mixed for the month, with gains in US large cap, Technology, Healthcare and Financials partially offset by weakness in small cap, Energy and commodity sensitive exposures. European equities were led by Italian equities, which posted a large gain on optimism over recent political developments, equities in France, Spain, Netherlands, Germany and Switzerland also gained. The Nikkei again led gains for Asian equities, Australia, Philippines & India also gained, while China & Korea posted declines. Commodities fell sharply for the month, with Gold posting the largest 2 day decline in over 30 years, Silver, Platinum and Oil also posted sharp declines. US & European bond yields posted declines, led by the sharp decline in Italian bond yields; US yields fell across most maturities, as yields also declined in France, Spain, Netherlands, Germany and Switzerland. The US dollar gained to a new 4 year high against the Japanese Yen on expectations of continued Bank of Japan stimulus, although the Dollar declined against the Pound, Euro & Swiss France.
Hedge fund strategy wise, top performing strategies in April 2013 include Global Macro +2.30%, Distressed +1.27% , CTA/Managed Futures +1.26% and Convertible Arbitrage at +1.13%. The lowest performing strategies include Dedicated Short -3.79%, Equity Market Neutral +0.18%, Event Driven at +0.39%.
Hedge Fund Industry: AUM, Performance
Source: eVestment|HFN; Hedge Fund Research, Inc., © 2012.
Source: HFR, eVestment|HFN.
Industry Performance: Apr 13 / YTD
Monthly Industry AUM and Performance Note Pad
MSCI World Index: +1.9%; +12.2% YTD
MSCI EM Index: +1.0%; -0.7% YTD
S&P 500: +1.9%; +12.2% YTD
Citi US BIG Index: +1.02%; +0.8% YTD
S&P GSCI: -4.7%; -4.0% YTD
US Dollar Index: -1.5%; +2.5% YTD
HFN Country Indices Apr-13/ YTD: – Brazil: +0.42% /+1.97%; Australia: -0.32% / +0.80%– China: +1.74%/+4.20%; Japan: +7.60%/+20.63%
2
4.60%
4.37%
4.53%
0.79%
0.70%
0.81%
-0.5% 0.5% 1.5% 2.5% 3.5% 4.5% 5.5%
HFRX Wt
HFR EqWt
HFN EqWt
Apr-13 2013
-2%
-1%
0%
1%
2%
3%
2,400
2,450
2,500
2,550
2,600
2,650
2,700
2,750
Apr-12 May-12 Jun-12 Jul-12 Aug-12 Sep-12 Oct-12 Nov-12 Dec-12 Jan-13 Feb-13 Mar-13 Apr-13
Monthly Perform
ance (%)
Indu
stry
AU
M ($
bn)
AUM HFN EqWt HFR EqWt HFRX Wt
Hedge Fund Industry: Change in Industry Assets
Source: eVestment|HFN.
Source: eVestment|HFN.
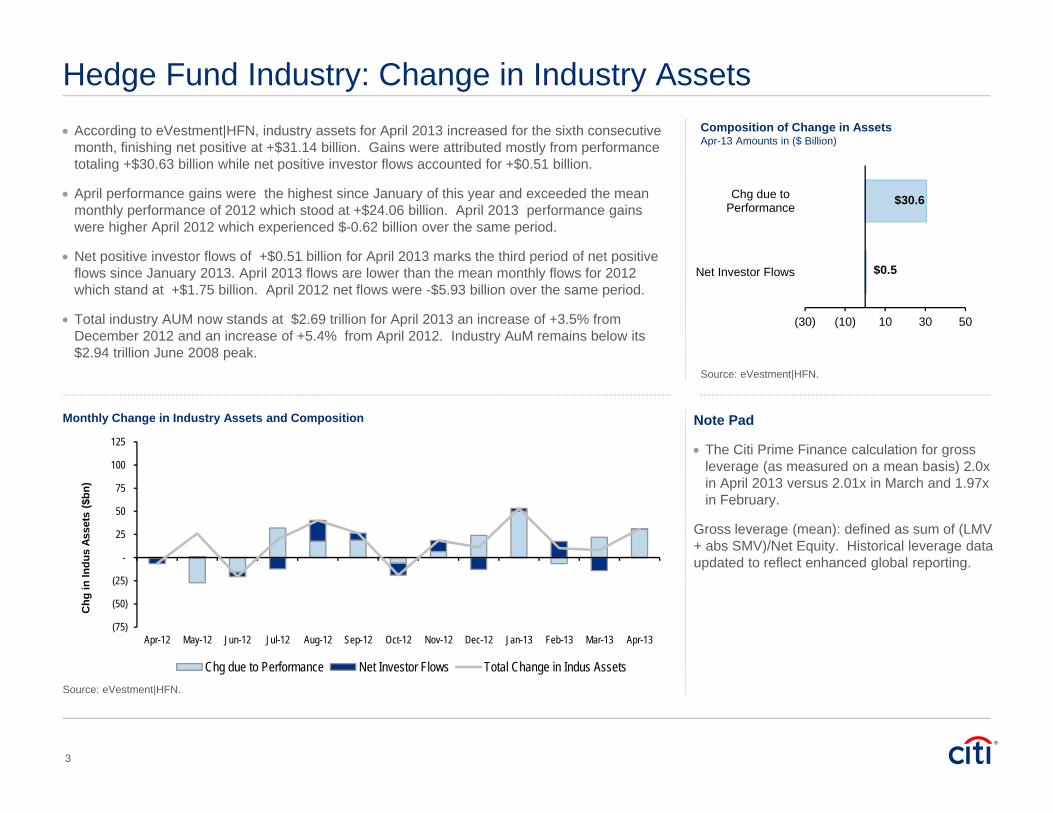
According to eVestment|HFN, industry assets for April 2013 increased for the sixth consecutive month, finishing net positive at +$31.14 billion. Gains were attributed mostly from performance totaling +$30.63 billion while net positive investor flows accounted for +$0.51 billion.
April performance gains were the highest since January of this year and exceeded the mean monthly performance of 2012 which stood at +$24.06 billion. April 2013 performance gains were higher April 2012 which experienced $-0.62 billion over the same period.
Net positive investor flows of +$0.51 billion for April 2013 marks the third period of net positive flows since January 2013. April 2013 flows are lower than the mean monthly flows for 2012 which stand at +$1.75 billion. April 2012 net flows were -$5.93 billion over the same period.
Total industry AUM now stands at $2.69 trillion for April 2013 an increase of +3.5% from December 2012 and an increase of +5.4% from April 2012. Industry AuM remains below its $2.94 trillion June 2008 peak.
Composition of Change in AssetsApr-13 Amounts in ($ Billion)
Monthly Change in Industry Assets and Composition Note Pad
The Citi Prime Finance calculation for gross leverage (as measured on a mean basis) 2.0x in April 2013 versus 2.01x in March and 1.97x in February.
Gross leverage (mean): defined as sum of (LMV + abs SMV)/Net Equity. Historical leverage data updated to reflect enhanced global reporting.
3
$0.5
$30.6
(30) (10) 10 30 50
Net Investor Flows
Chg due toPerformance
(75)
(50)
(25)
-
25
50
75
100
125
Apr-12 May-12 Jun-12 Jul-12 Aug-12 Sep-12 Oct-12 Nov-12 Dec-12 Jan-13 Feb-13 Mar-13 Apr-13
Chg
in In
dus
Asse
ts ($
bn)
Chg due to Performance Net Investor Flows Total Change in Indus Assets
Hedge Fund Stats by Strategy
Note: Hedge fund data is self-reported; each calculation is based on the respective data from funds who have reported for the current period.Source: Citi Prime Finance.
Source: Citi Prime Finance.Source: Citi Prime Finance.
Source: Citi Prime Finance.
Hedge Fund Strategy Breakdown by Assets Hedge Fund Strategy Breakdown by Number of Funds
Hedge Fund Performance by Strategy Hedge Fund Leverage Ratios by StrategyGross Leverage (Mean): Defined as the sum of (LMV + abs SMV)/Net Equity
4
2.8%
12.5%
0.0%
1.4%
4.3%
17.8%
2.9%
7.2%
14.3%
24.5%
12.4%
Convert Arb
CTA/Managed Futures
Dedicated Short Bias
Distressed
Emerging Markets
Equity Long/Short
Equity Market Neutral
Event Driven
FI Arbitrage
Global Macro
Multi-Strategy
2.5%
12.7%
0.1%
1.3%
6.4%
32.3%
5.4%
5.6%
10.1%
16.5%
7.0%
Convert Arb
CTA/Managed Futures
Dedicated Short Bias
Distressed
Emerging Markets
Equity Long/Short
Equity Market Neutral
Event Driven
FI Arbitrage
Global Macro
Multi-Strategy
3.53
2.22
1.29
1.41
1.75
4.65
2.05
2.42
4.09
3.26
Convert Arb
Dedicated Short Bias
Distressed
Emerging Markets
Equity Long/Short
Equity Market Neutral
Event Driven
FI Arbitrage
Global Macro
Multi-Strategy
1.13%
1.26%
-3.79%
1.27%
0.97%
0.48%
0.18%
0.79%
0.72%
2.30%
0.91%
Convert Arb
CTA/Managed Futures
Dedicated Short Bias
Distressed
Emerging Markets
Equity Long/Short
Equity Market Neutral
Event Driven
FI Arbitrage
Global Macro
Multi-Strategy
Monthly Performance by StrategyCTA/Managed Futures
Dedicated Short Bias Distressed
Equity Long/Short Equity Market Neutral Event Driven
FI Arbitrage Global Macro Multi-Strategy
Emerging Markets
Convertible Arbitrage
Source: Citi Prime Finance.Note: Hedge fund data is self-reported; each calculation is based on the respective data from funds who have reported for the current period.
Monthly Median
Trailing 60 Month Median
5
-4%-2%0%2%4%
2/9/20123/11/20124/10/20125/11/20126/10/20127/10/20128/10/20129/9/201210/10/201211/9/201212/9/20121/9/20132/8/20133/11/20134/10/2013-4%
-2%
0%
2%
4%
4 5 6 7 8 9 10 11 12 1 2
-8%-5%-3%0%3%5%
4 5 6 7 8 9 10 11 12 1 2-2%
0%
2%
4%
2 3 4 5 6 7 8 9 10 11 12 1 2 3 4-6%-4%-2%0%2%4%
4 5 6 7 8 9 10 11 12 1 2
-5%
-3%
-1%
1%
3%
4 5 6 7 8 9 10 11 12 1 2-5%
-3%
-1%
1%
3%
2 3 4 5 6 7 8 9 10 11 12-4%-2%0%2%4%
2 3 4 5 6 7 8 9 10 11 12
-1%0%1%2%3%4%
4 5 6 7 8 9 10 11 12 1 2-2%
0%
2%
4%
4 5 6 7 8 9 10 11 12 1 2 -2%
0%
2%
4%
4 5 6 7 8 9 10 11 12 1 2
Apr-13 M ar-13 Apr-12
1.3% 0.5% -0.2%
0.42% 0.04% 0.19%
Apr-13 M ar-13 Apr-12-3.8% -3.2% 1.4%-0.27% -0.92% -0.29%
Apr-13 M ar-13 Apr-121.3% 1.6% 0.0%1.07% 0.98% 0.52%
Apr-13 M ar-13 Apr-121.0% -0.5% -0.4%
0.94% 0.50% 0.67%
Apr-13 M ar-13 Apr-12
0.5% 1.8% -0.8%
0.76% 0.52% 0.43%
Apr-13 M ar-13 Apr-12
0.2% 0.7% -0.5%
0.55% 0.37% 0.37%
Apr-13 M ar-13 Apr-12
0.7% 0.7% 0.5%
0.81% 0.70% 0.66%
Apr-13 M ar-13 Apr-12
2.3% 1.0% -0.6%
0.53% 0.16% 0.35%
Apr-13 M ar-13 Apr-12
0.9% 1.4% -0.3%
0.77% 0.50% 0.57%
Apr-13 M ar-13 Apr-12
1.1% 0.9% -0.3%
0.95% 0.84% 0.57%
Apr-13 M ar-13 Apr-12
0.8% 1.3% -0.4%
0.87% 0.61% 0.49%

Citi Liquid Hedge Fund Replicator (HARP)
Mar-13 Feb-13 Mar-12 YTD-13
Citi Harp 1.11% -0.60% -1.30% 1.48%
HFRIFOF 0.90% 0.30% 0.05% 3.36%
Citi HARP Index vs. Benchmark (monthly rolling)
Citi HARP is a liquid investable index, which aims at approximating the performance of the hedge fund sector
Source: Citi and Hedge Fund Research, Inc., © www.hedgefundresearch.comHFRIFOF Index is the HFRI Funds of Funds Composite Index
Annualized Performance:
Last 12-Month
Citi HARP Index
HFRIFOF
Annualised Return 0.76% 4.78%
Annualised Volatility 3.81% 3.35%
Sharpe Ratio 0.18 1.50
Correlation 81% -
The purpose of the Index is to approximate in broad termsthe performance of the hedge fund sector by achieving asimilarity between the pattern of the returns of the Indexand the pattern of the returns of a Benchmark - the HFRIFund of Funds Composite Index.
The Index contains weighted components. Thecomponents are a money market component and variousindex components. Each index component represents aclass of asset in which the hedge fund sector is assumedto invest: bond, commodity, equity and foreign exchange.
The weighting within the Index of each component isdetermined monthly. Every month, a multiple linearregression algorithm is used to identify the appropriateweighting.
-5%
-4%
-3%
-2%
-1%
0%
1%
2%
3%
4%
5%
Mar-12 May-12 Jul-12 Sep-12 Nov-12 Jan-13 Mar-13
Citi HARP IndexHFRIFOF Index

Source: Citi Prime Finance; FactSet; Citigroup Index LLC.
US Equities(Large Cap vs. Small Cap)
Global Equities Developed vs. Emerging)
Fixed Income(High-Grade vs. High-Yield)
Commodities(US$ Performance)
7
Market Performance
-8%
-6%
-4%
-2%
0%
2%
4%
6%
8%
4/30/20132/28/201312/31/201210/31/20128/31/20126/29/20124/30/2012-15%
-10%
-5%
0%
5%
10%
15%
20%
4/30/20132/28/201312/31/201210/31/20128/31/20126/29/20124/30/2012
-2%
-1%
-1%
0%
1%
1%
2%
2%
3%
4/30/20132/28/201312/31/201210/31/20128/31/20126/29/20124/30/2012-15%
-12%
-9%
-6%
-3%
0%
3%
6%
9%
4/30/20132/28/201312/31/201210/31/20128/31/20126/29/20124/30/2012
Apr-13 Mar-13 Apr-12 YTD-13S&P 500 1.9% 3.8% -0.6% 12.2%RUS 2000 -0.4% 4.6% -1.5% 11.6%S&P Mid 0.6% 4.8% -0.2% 13.6%
Apr-13 Mar-13 Apr-12 YTD-13MSCI World 3.2% 2.4% -1.1% 11.0%MSCI EM 1.0% -1.9% -1.2% -0.7%
Apr-13 Mar-13 Apr-12 YTD-13Citi US BIG Index 1.0% 0.1% 1.1% 0.8%Citi HY Bond Index 1.9% 1.1% 1.0% 4.7%
Apr-13 Mar-13 Apr-12 YTD-13S&P GSCI -4.7% 0.8% -0.5% -4.0%US-$ Index -1.5% 1.3% -0.3% 2.5%US 2yr Note 0.2% 0.2% 0.3% 1.0%
US Securities Lending Sector Short Flows
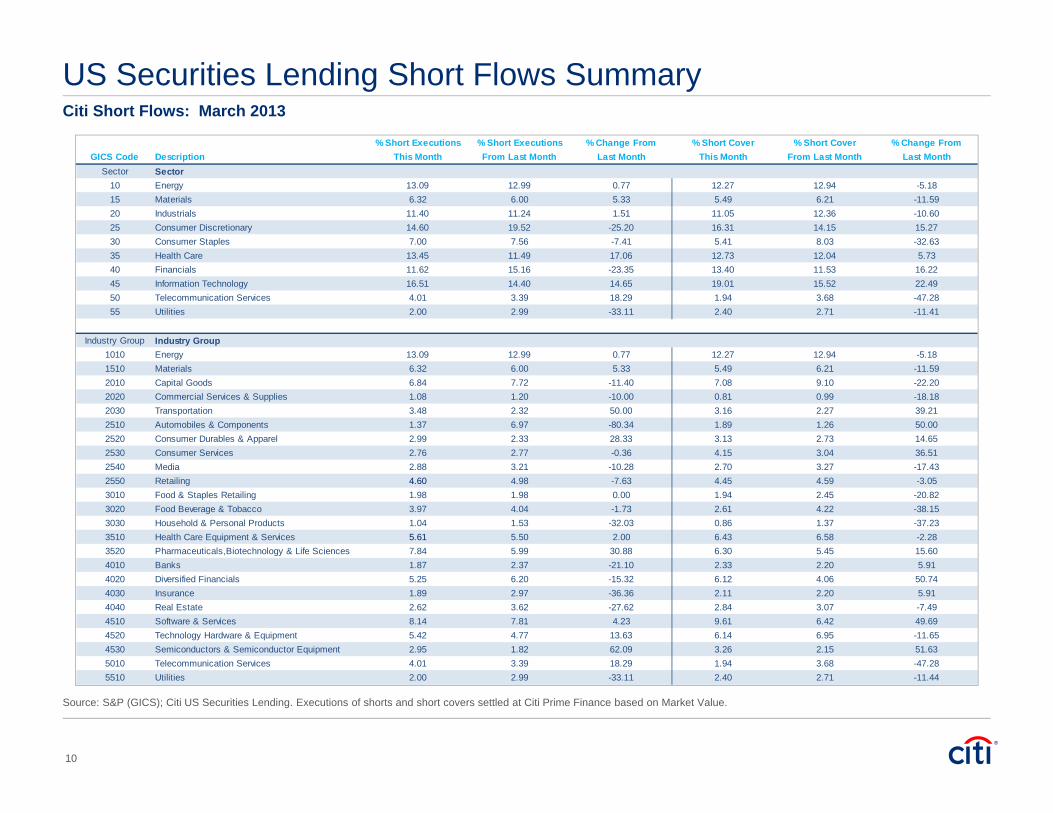
Source: S&P (GICS); Citi US Securities Lending. Executions of shorts and short covers settled at Citi Prime Finance based on Market Value.
Short Sale Executions Short Cover Executions
Industrials11.41%
Utilities2.00%
Telecom Services4.01%
Financials11.62%
Consumer Staples7.00%
Energy13.09%
Consumer Discretionary
14.60%
Information Technology16.51%
Health Care13.45%
Industrials11.05%
Energy12.27%
Utilities2.40%
Telecom Services1.94%
Materials5.49%
Information Technology19.01%
Health Care12.73%
Consumer Discretionary
16.31%
Energy13.40%
8
Consumer Staples5.41%
Materials6.32%
% Previous Month % Change From Sector Short Flows % Short Execution Short Execution Previous MonthInformation Technology 16.51 14.40 14.65Consumer Discretionary 14.60 19.52 -25.20Health Care 13.45 11.49 17.06Energy 13.09 12.99 0.77Financials 11.62 15.16 -23.35Industrials 11.41 11.24 1.51Consumer Staples 7.00 7.56 -7.41Materials 6.32 6.00 5.33Telecom Services 4.01 3.39 18.29Utilities 2.00 2.99 -33.11
% Previous Month % Change From Sector Short Flows % Cover Execution Short Cover Previous MonthInformation Technology 19.01 15.52 22.49Consumer Discretionary 16.31 14.15 15.27Financials 13.40 11.53 16.22Health Care 12.73 12.04 5.73Energy 12.27 12.94 -5.18Industrials 11.05 12.36 -10.6Materials 5.49 6.21 -11.59Consumer Staples 5.41 8.03 -32.63Utilities 2.40 2.71 -11.44Telecom Services 1.94 3.68 -47.28

US Securities Lending Industry Group Short Flows
Source: S&P (GICS); Citi US Securities Lending. Executions of shorts and short covers settled at Citi Prime Finance based on Market Value.
Citi Industry Group Short Flows (% Short)
9
% Previous Month % Change From Industry % Short Execution Short Execution Previous MonthEnergy 13.09 12.99 0.77Software & Services 8.14 7.81 4.23Pharmaceuticals, Biotechnology & Life 7.84 5.99 30.88Capital Goods 6.84 7.72 -11.40Materials 6.32 6.00 5.33Health Care Equipment & Services 5.61 5.50 2.00Technology Hardware and Equipment 5.42 4.77 13.63Diversfied Financials 5.25 6.20 -15.32Retailing 4.60 4.98 -7.63Telecom Services 4.01 3.39 18.29Food Beverage & Tobacco 3.97 4.04 -1.73Transportation 3.48 2.32 50.00Consumer Durables & Apparel 2.99 2.33 28.33Semiconductors and Semiconductor 2.95 1.82 62.09Media 2.88 3.21 -10.28Consumer Services 2.76 2.77 -0.36Real Estate 2.62 3.62 -27.62Utilities 2.00 2.99 -33.11Food & Staples Retailing 1.98 1.98 0.00Insurance 1.89 2.97 -36.36Banks 1.87 2.37 -21.10Automobiles & Components 1.37 6.97 -80.34Commercial Services & Supplies 1.08 1.20 -10.00Household and Personal Products 1.04 1.53 -32.03
% Previous Month % Change From Industry % Cover Execution Short Cover Previous MonthEnergy 12.27 12.94 -5.18Software & Services 9.61 6.42 49.69Capital Goods 7.08 9.10 -22.20Health Care Equipment & Services 6.43 6.58 -2.28Pharmaceuticals, Biotechnology & Life 6.30 5.45 15.60Technology Hardware and Equipment 6.14 6.95 -11.65Diversified Financials 6.12 4.06 50.74Materials 5.49 6.21 -11.59Retailing 4.45 4.59 -3.05Consumer Services 4.15 3.04 36.51Semiconductors and Semiconductor 3.26 2.15 51.63Transportation 3.16 2.27 39.21Consumer Durables & Apparel 3.13 2.73 14.65Real Estate 2.84 3.07 -7.49Media 2.70 3.27 -17.43Food Beverage & Tobacco 2.61 4.22 -38.15Utilities 2.40 2.71 -11.44Banks 2.33 2.20 5.91Insurance 2.11 2.20 5.91Food & Staples Retailing 1.94 2.45 -20.82Telecom Services 1.94 3.68 -47.28Automobiles & Components 1.89 1.26 50.00Household & Personal Products 0.86 1.37 -37.23Commercial Services & Supplies 0.81 0.99 -18.18
02468101214
Auto
mob
iles
&C
ompo
nent
s
Bank
s
Cap
ital G
oods
Com
mer
cial
Ser
vice
s&
Sup
plie
s
Con
sum
erD
urab
les
& A
ppar
el
Con
sum
erS
ervi
ces
Div
ersi
fied
Fina
ncia
ls
Ene
rgy
Food
& S
tapl
esR
etai
ling
Food
Bev
erag
e &
Toba
cco
Hea
lth C
are
Equi
pmen
t &S
ervi
ces
Hou
seho
ld &
Per
sona
lP
rodu
cts
Insu
ranc
e
Mat
eria
ls
Med
ia
Pha
rmac
eutic
als,
Bio
tech
nolo
gy &
Life
Rea
l Est
ate
Ret
ailin
g
Sem
icon
duto
rs &
Sem
icon
duct
or
Softw
are
&S
ervi
ces
Tech
nolo
gyH
ardw
are
&E
quip
men
t
Tele
com
mun
icat
ion
Ser
vice
s
Tran
spor
tatio
n
Util
ities
Short Execution Short Cover
Source: S&P (GICS); Citi US Securities Lending. Executions of shorts and short covers settled at Citi Prime Finance based on Market Value.
US Securities Lending Short Flows SummaryCiti Short Flows: March 2013
10
% Short Executions % Short Executions % Change From % Short Cover % Short Cover % Change FromGICS Code Description This Month From Last Month Last Month This Month From Last Month Last Month
Sector Sector10 Energy 13.09 12.99 0.77 12.27 12.94 -5.1815 Materials 6.32 6.00 5.33 5.49 6.21 -11.5920 Industrials 11.40 11.24 1.51 11.05 12.36 -10.6025 Consumer Discretionary 14.60 19.52 -25.20 16.31 14.15 15.2730 Consumer Staples 7.00 7.56 -7.41 5.41 8.03 -32.6335 Health Care 13.45 11.49 17.06 12.73 12.04 5.7340 Financials 11.62 15.16 -23.35 13.40 11.53 16.2245 Information Technology 16.51 14.40 14.65 19.01 15.52 22.4950 Telecommunication Services 4.01 3.39 18.29 1.94 3.68 -47.2855 Utilities 2.00 2.99 -33.11 2.40 2.71 -11.41
Industry Group Industry Group1010 Energy 13.09 12.99 0.77 12.27 12.94 -5.181510 Materials 6.32 6.00 5.33 5.49 6.21 -11.592010 Capital Goods 6.84 7.72 -11.40 7.08 9.10 -22.202020 Commercial Services & Supplies 1.08 1.20 -10.00 0.81 0.99 -18.182030 Transportation 3.48 2.32 50.00 3.16 2.27 39.212510 Automobiles & Components 1.37 6.97 -80.34 1.89 1.26 50.002520 Consumer Durables & Apparel 2.99 2.33 28.33 3.13 2.73 14.652530 Consumer Services 2.76 2.77 -0.36 4.15 3.04 36.512540 Media 2.88 3.21 -10.28 2.70 3.27 -17.432550 Retailing 4.60 4.98 -7.63 4.45 4.59 -3.053010 Food & Staples Retailing 1.98 1.98 0.00 1.94 2.45 -20.823020 Food Beverage & Tobacco 3.97 4.04 -1.73 2.61 4.22 -38.153030 Household & Personal Products 1.04 1.53 -32.03 0.86 1.37 -37.233510 Health Care Equipment & Services 5.61 5.50 2.00 6.43 6.58 -2.283520 Pharmaceuticals,Biotechnology & Life Sciences 7.84 5.99 30.88 6.30 5.45 15.604010 Banks 1.87 2.37 -21.10 2.33 2.20 5.914020 Diversified Financials 5.25 6.20 -15.32 6.12 4.06 50.744030 Insurance 1.89 2.97 -36.36 2.11 2.20 5.914040 Real Estate 2.62 3.62 -27.62 2.84 3.07 -7.494510 Software & Services 8.14 7.81 4.23 9.61 6.42 49.694520 Technology Hardware & Equipment 5.42 4.77 13.63 6.14 6.95 -11.654530 Semiconductors & Semiconductor Equipment 2.95 1.82 62.09 3.26 2.15 51.635010 Telecommunication Services 4.01 3.39 18.29 1.94 3.68 -47.285510 Utilities 2.00 2.99 -33.11 2.40 2.71 -11.44
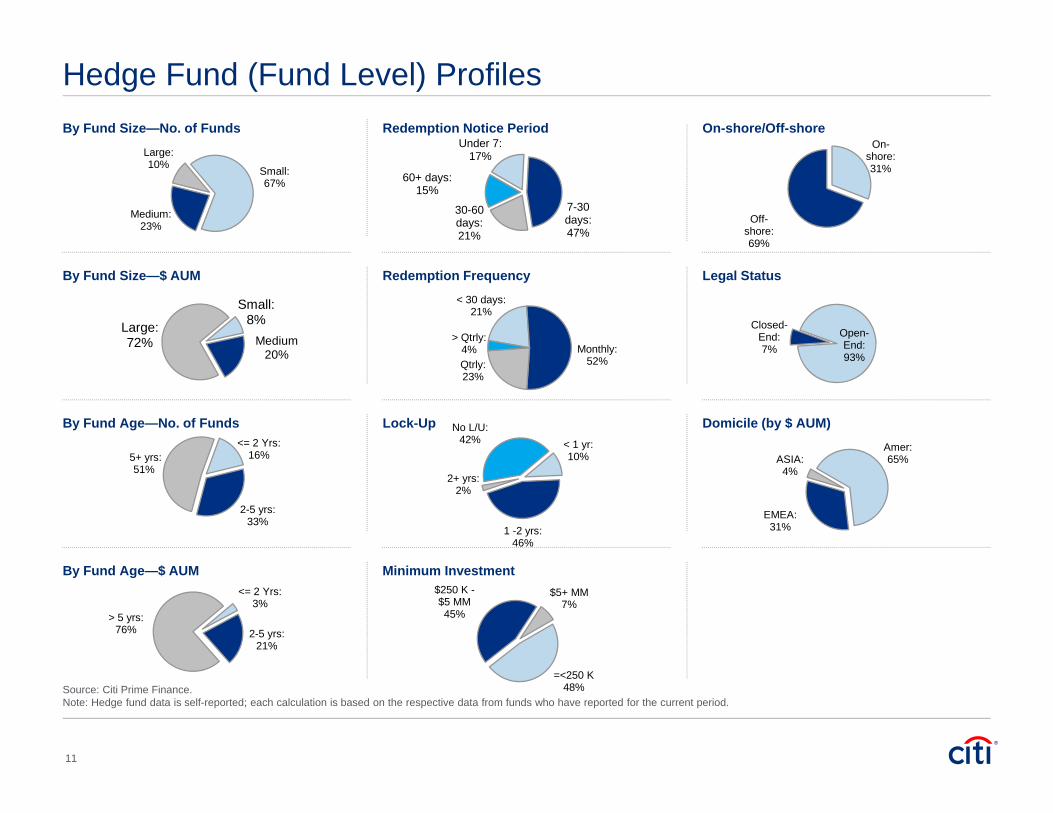
Hedge Fund (Fund Level) Profiles
Source: Citi Prime Finance.Note: Hedge fund data is self-reported; each calculation is based on the respective data from funds who have reported for the current period.
On-shore/Off-shore
By Fund Size—$ AUM Redemption Frequency
By Fund Age—No. of Funds Lock-Up Domicile (by $ AUM)
By Fund Age—$ AUM Minimum Investment
Legal Status
Redemption Notice PeriodBy Fund Size—No. of Funds
11
Small:67%
Medium:23%
Large:10%
Small:8%
Medium20%
Large:72%
<= 2 Yrs:16%
2-5 yrs:33%
5+ yrs:51%
<= 2 Yrs:3%
2-5 yrs:21%
> 5 yrs:76%
Under 7:17%
7-30 days:47%
30-60 days:21%
60+ days:15%
< 30 days:21%
Monthly:52%Qtrly:
23%
> Qtrly:4%
< 1 yr:10%
1 -2 yrs:46%
2+ yrs:2%
No L/U:42%
=<250 K48%
$250 K -$5 MM45%
$5+ MM7%
On-shore:31%
Off-shore:69%
Open-End:93%
Closed-End:7%
Amer:65%
EMEA:31%
ASIA:4%
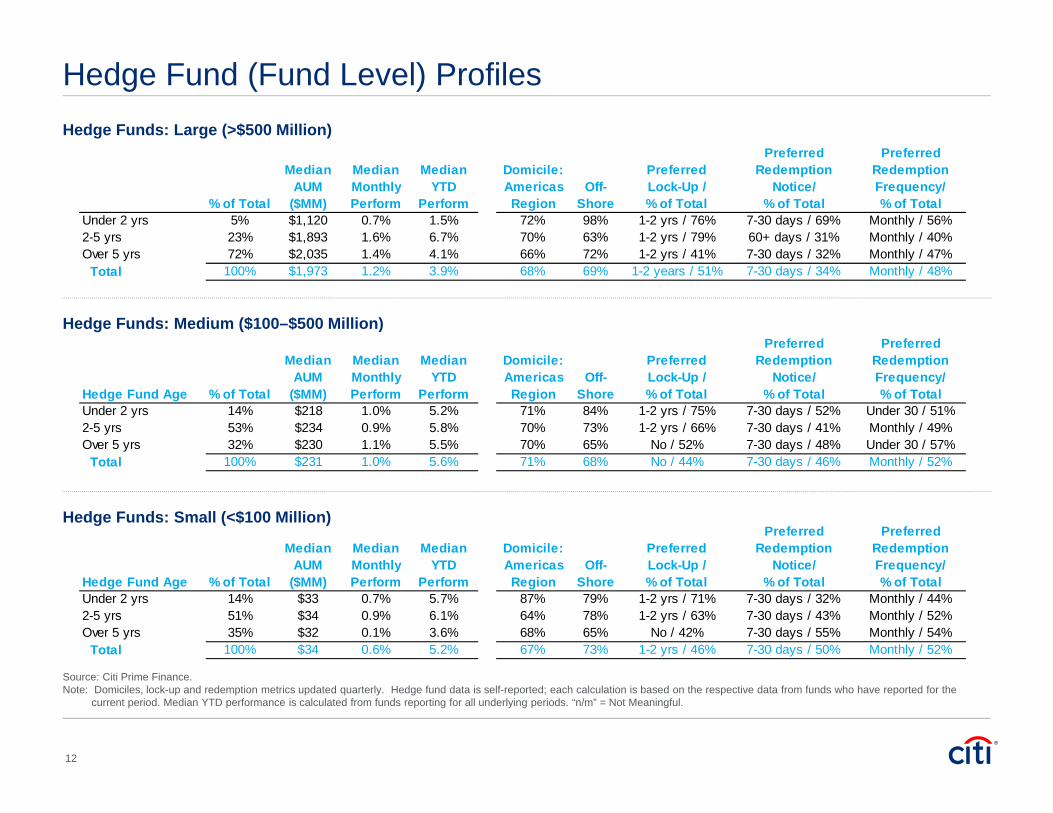
Hedge Fund (Fund Level) Profiles
Source: Citi Prime Finance.Note: Domiciles, lock-up and redemption metrics updated quarterly. Hedge fund data is self-reported; each calculation is based on the respective data from funds who have reported for the
current period. Median YTD performance is calculated from funds reporting for all underlying periods. “n/m” = Not Meaningful.
Hedge Funds: Large (>$500 Million)
Hedge Funds: Medium ($100–$500 Million)
Hedge Funds: Small (<$100 Million)
12
% of Total
MedianAUM
($MM)
Median Monthly Perform
Median YTD
Perform
Domicile:AmericasRegion
Off-Shore
Preferred Lock-Up /% of Total
PreferredRedemption
Notice/ % of Total
PreferredRedemptionFrequency/% of Total
Under 2 yrs 5% $1,120 0.7% 1.5% 72% 98% 1-2 yrs / 76% 7-30 days / 69% Monthly / 56%2-5 yrs 23% $1,893 1.6% 6.7% 70% 63% 1-2 yrs / 79% 60+ days / 31% Monthly / 40%Over 5 yrs 72% $2,035 1.4% 4.1% 66% 72% 1-2 yrs / 41% 7-30 days / 32% Monthly / 47% Total 100% $1,973 1.2% 3.9% 68% 69% 1-2 years / 51% 7-30 days / 34% Monthly / 48%
Hedge Fund Age % of Total
MedianAUM
($MM)
Median Monthly Perform
Median YTD
Perform
Domicile:AmericasRegion
Off-Shore
Preferred Lock-Up /% of Total
PreferredRedemption
Notice/ % of Total
PreferredRedemptionFrequency/% of Total
Under 2 yrs 14% $218 1.0% 5.2% 71% 84% 1-2 yrs / 75% 7-30 days / 52% Under 30 / 51%2-5 yrs 53% $234 0.9% 5.8% 70% 73% 1-2 yrs / 66% 7-30 days / 41% Monthly / 49%Over 5 yrs 32% $230 1.1% 5.5% 70% 65% No / 52% 7-30 days / 48% Under 30 / 57% Total 100% $231 1.0% 5.6% 71% 68% No / 44% 7-30 days / 46% Monthly / 52%
Hedge Fund Age % of Total
MedianAUM
($MM)
Median Monthly Perform
Median YTD
Perform
Domicile:AmericasRegion
Off-Shore
Preferred Lock-Up /% of Total
PreferredRedemption
Notice/ % of Total
PreferredRedemptionFrequency/% of Total
Under 2 yrs 14% $33 0.7% 5.7% 87% 79% 1-2 yrs / 71% 7-30 days / 32% Monthly / 44%2-5 yrs 51% $34 0.9% 6.1% 64% 78% 1-2 yrs / 63% 7-30 days / 43% Monthly / 52%Over 5 yrs 35% $32 0.1% 3.6% 68% 65% No / 42% 7-30 days / 55% Monthly / 54% Total 100% $34 0.6% 5.2% 67% 73% 1-2 yrs / 46% 7-30 days / 50% Monthly / 52%
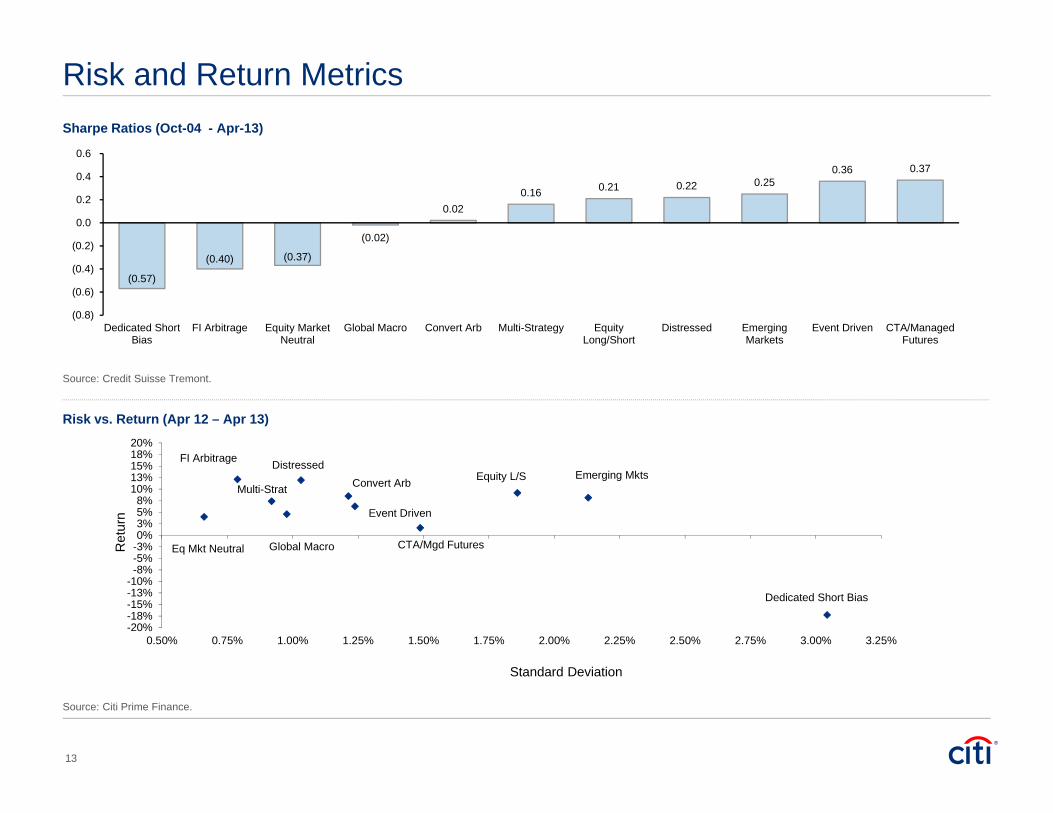
Risk and Return Metrics
Source: Credit Suisse Tremont.
Risk vs. Return (Apr 12 – Apr 13)
Sharpe Ratios (Oct-04 - Apr-13)
13
Source: Citi Prime Finance.
(0.57)
(0.40) (0.37)
(0.02)
0.020.16 0.21 0.22 0.25
0.36 0.37
(0.8)
(0.6)
(0.4)
(0.2)
0.0
0.2
0.4
0.6
Dedicated ShortBias
FI Arbitrage Equity MarketNeutral
Global Macro Convert Arb Multi-Strategy EquityLong/Short
Distressed EmergingMarkets
Event Driven CTA/ManagedFutures
Convert Arb
CTA/Mgd Futures
Dedicated Short Bias
DistressedEmerging MktsEquity L/S
Eq Mkt Neutral
Event Driven
FI Arbitrage
Global Macro
Multi-Strat
-20%-18%-15%-13%-10%-8%-5%-3%0%3%5%8%
10%13%15%18%20%
0.50% 0.75% 1.00% 1.25% 1.50% 1.75% 2.00% 2.25% 2.50% 2.75% 3.00% 3.25%
Ret
urn
Standard Deviation
Convertible Arbitrage
Source: Citi Prime Finance.
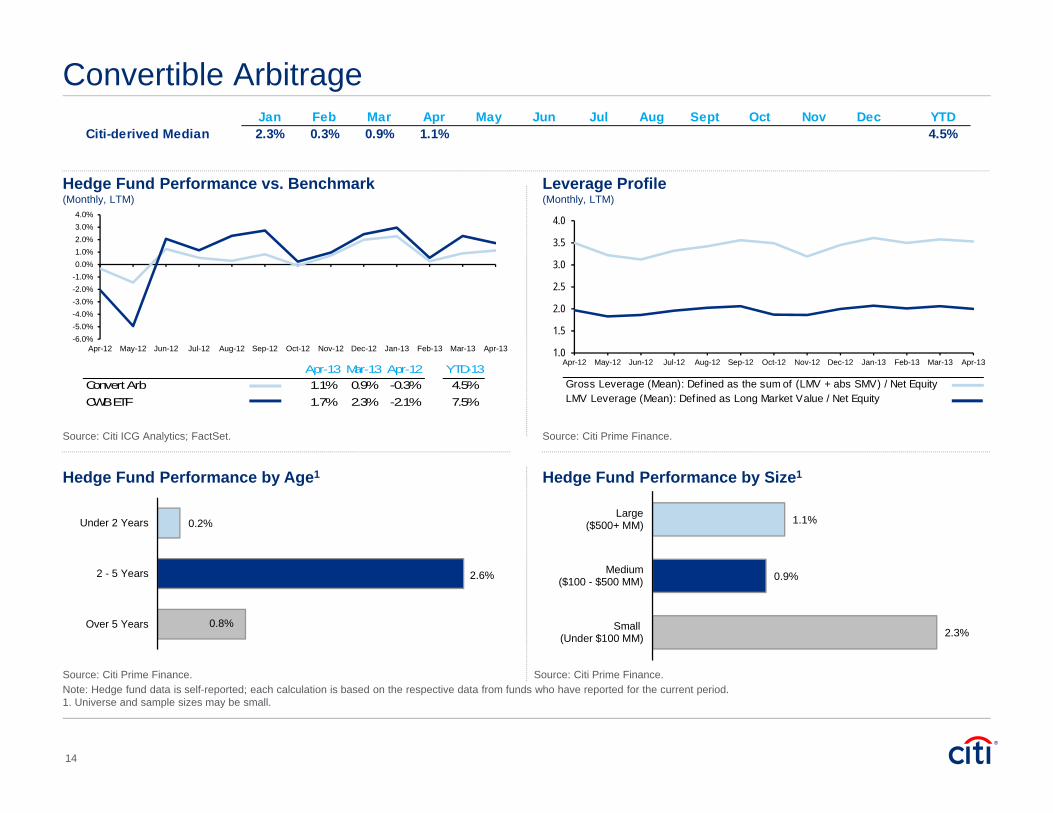
Source: Citi ICG Analytics; FactSet. Source: Citi Prime Finance.
Note: Hedge fund data is self-reported; each calculation is based on the respective data from funds who have reported for the current period.1. Universe and sample sizes may be small.
Hedge Fund Performance vs. Benchmark(Monthly, LTM)
Leverage Profile(Monthly, LTM)
Hedge Fund Performance by Age1 Hedge Fund Performance by Size1
14
Gross Leverage (Mean): Def ined as the sum of (LMV + abs SMV) / Net EquityLMV Leverage (Mean): Def ined as Long Market Value / Net Equity
Source: Citi Prime Finance.
1.0
1.5
2.0
2.5
3.0
3.5
4.0
Apr-12 May-12 Jun-12 Jul-12 Aug-12 Sep-12 Oct-12 Nov-12 Dec-12 Jan-13 Feb-13 Mar-13 Apr-13
Jan Feb Mar Apr May Jun Jul Aug Sept Oct Nov Dec YTDCiti-derived Median 2.3% 0.3% 0.9% 1.1% 4.5%
Apr-13 Mar-13 Apr-12 YTD-13Convert Arb 1.1% 0.9% -0.3% 4.5%CWB ETF 1.7% 2.3% -2.1% 7.5%
-6.0%-5.0%-4.0%-3.0%-2.0%-1.0%0.0%1.0%2.0%3.0%4.0%
Apr-12 May-12 Jun-12 Jul-12 Aug-12 Sep-12 Oct-12 Nov-12 Dec-12 Jan-13 Feb-13 Mar-13 Apr-13
0.2%
2.6%
0.8%
Under 2 Years
2 - 5 Years
Over 5 Years
1.1%
0.9%
2.3%
Large($500+ MM)
Medium($100 - $500 MM)
Small(Under $100 MM)
CTA/Managed Futures
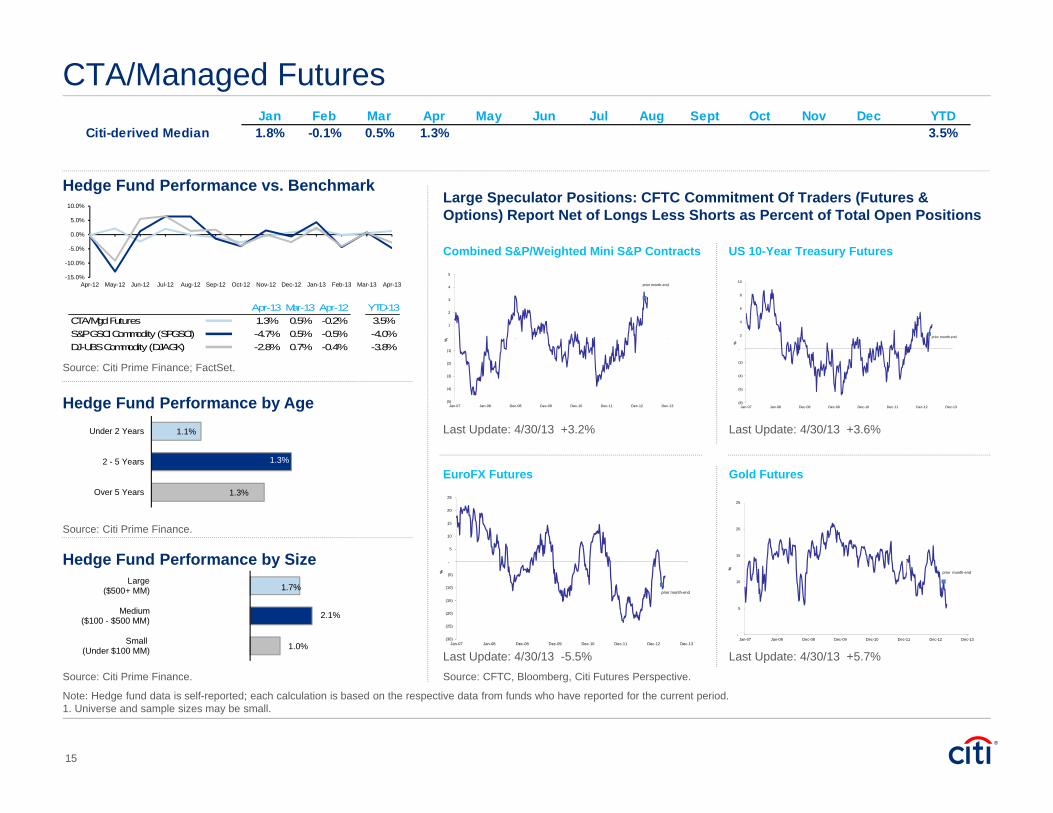
Source: Citi Prime Finance.
Source: Citi Prime Finance; FactSet.
Source: CFTC, Bloomberg, Citi Futures Perspective.Source: Citi Prime Finance.
Note: Hedge fund data is self-reported; each calculation is based on the respective data from funds who have reported for the current period.1. Universe and sample sizes may be small.
Hedge Fund Performance vs. BenchmarkLarge Speculator Positions: CFTC Commitment Of Traders (Futures & Options) Report Net of Longs Less Shorts as Percent of Total Open Positions
Hedge Fund Performance by Age
Hedge Fund Performance by Size
Combined S&P/Weighted Mini S&P Contracts US 10-Year Treasury Futures
EuroFX Futures Gold Futures
Last Update: 4/30/13 +3.2% Last Update: 4/30/13 +3.6%
Last Update: 4/30/13 -5.5% Last Update: 4/30/13 +5.7%
15
(5)
(4)
(3)
(2)
(1)
-
1
2
3
4
5
Jan-07 Jan-08 Dec-08 Dec-09 Dec-10 Dec-11 Dec-12 Dec-13
%
prior month-end
(8)
(6)
(4)
(2)
-
2
4
6
8
10
Jan-07 Jan-08 Dec-08 Dec-09 Dec-10 Dec-11 Dec-12 Dec-13
%
prior month end
(30)
(25)
(20)
(15)
(10)
(5)
-
5
10
15
20
25
Jan-07 Jan-08 Dec-08 Dec-09 Dec-10 Dec-11 Dec-12 Dec-13
%
prior month-end
-
5
10
15
20
25
Jan-07 Jan-08 Dec-08 Dec-09 Dec-10 Dec-11 Dec-12 Dec-13
%
prior month-end
Jan Feb Mar Apr May Jun Jul Aug Sept Oct Nov Dec YTDCiti-derived Median 1.8% -0.1% 0.5% 1.3% 3.5%
Apr-13 Mar-13 Apr-12 YTD-13CTA/Mgd Futures 1.3% 0.5% -0.2% 3.5%S&P GSCI Commodity (SPGSCI) -4.7% 0.5% -0.5% -4.0%DJ-UBS Commodity (DJAGK) -2.8% 0.7% -0.4% -3.8%
-15.0%
-10.0%
-5.0%
0.0%
5.0%
10.0%
Apr-12 May-12 Jun-12 Jul-12 Aug-12 Sep-12 Oct-12 Nov-12 Dec-12 Jan-13 Feb-13 Mar-13 Apr-13
1.1%
1.3%
1.3%
Under 2 Years
2 - 5 Years
Over 5 Years
1.7%
2.1%
1.0%
Large($500+ MM)
Medium($100 - $500 MM)
Small(Under $100 MM)
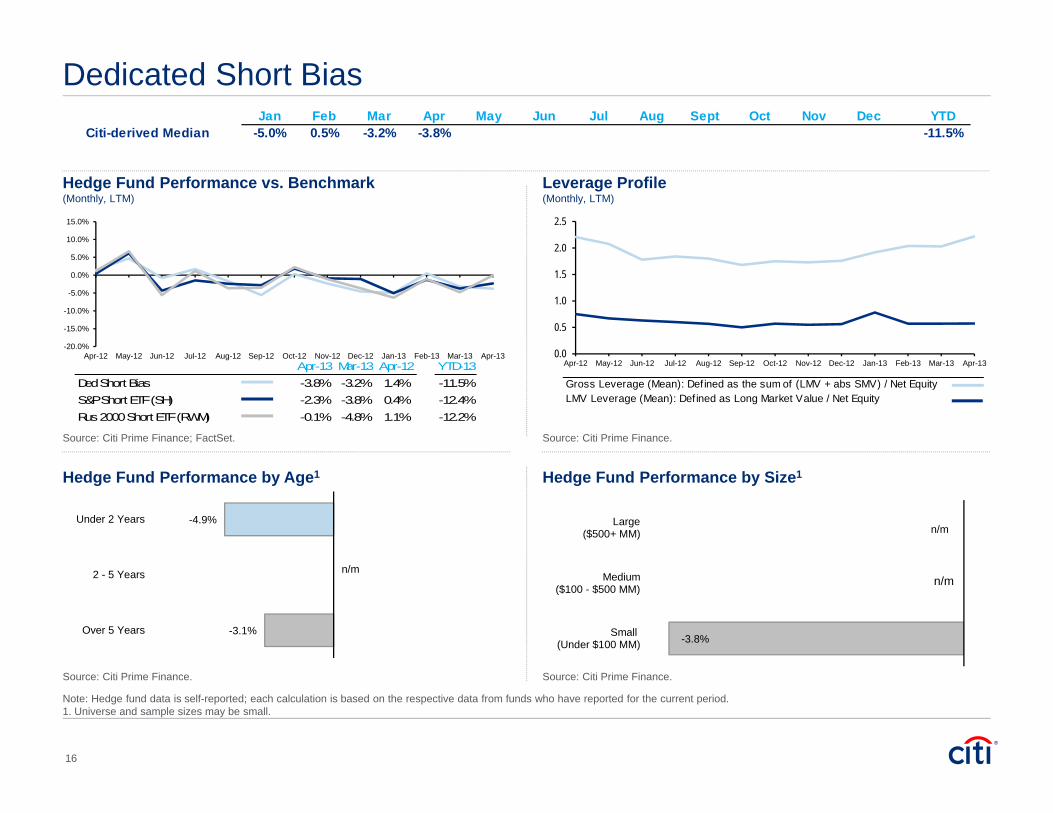
Dedicated Short Bias
Source: Citi Prime Finance. Source: Citi Prime Finance.
Source: Citi Prime Finance; FactSet. Source: Citi Prime Finance.
Note: Hedge fund data is self-reported; each calculation is based on the respective data from funds who have reported for the current period.1. Universe and sample sizes may be small.
Hedge Fund Performance vs. Benchmark(Monthly, LTM)
Leverage Profile(Monthly, LTM)
Hedge Fund Performance by Age1 Hedge Fund Performance by Size1
16
Gross Leverage (Mean): Def ined as the sum of (LMV + abs SMV) / Net EquityLMV Leverage (Mean): Def ined as Long Market Value / Net Equity
0.0
0.5
1.0
1.5
2.0
2.5
Apr-12 May-12 Jun-12 Jul-12 Aug-12 Sep-12 Oct-12 Nov-12 Dec-12 Jan-13 Feb-13 Mar-13 Apr-13
Jan Feb Mar Apr May Jun Jul Aug Sept Oct Nov Dec YTDCiti-derived Median -5.0% 0.5% -3.2% -3.8% -11.5%
Apr-13 Mar-13 Apr-12 YTD-13Ded Short Bias -3.8% -3.2% 1.4% -11.5%S&P Short ETF (SH) -2.3% -3.8% 0.4% -12.4%Rus 2000 Short ETF (RWM) -0.1% -4.8% 1.1% -12.2%
-20.0%
-15.0%
-10.0%
-5.0%
0.0%
5.0%
10.0%
15.0%
Apr-12 May-12 Jun-12 Jul-12 Aug-12 Sep-12 Oct-12 Nov-12 Dec-12 Jan-13 Feb-13 Mar-13 Apr-13
-4.9%
n/m
-3.1%
Under 2 Years
2 - 5 Years
Over 5 Years
n/m
n/m
-3.8%
Large($500+ MM)
Medium($100 - $500 MM)
Small(Under $100 MM)
Distressed
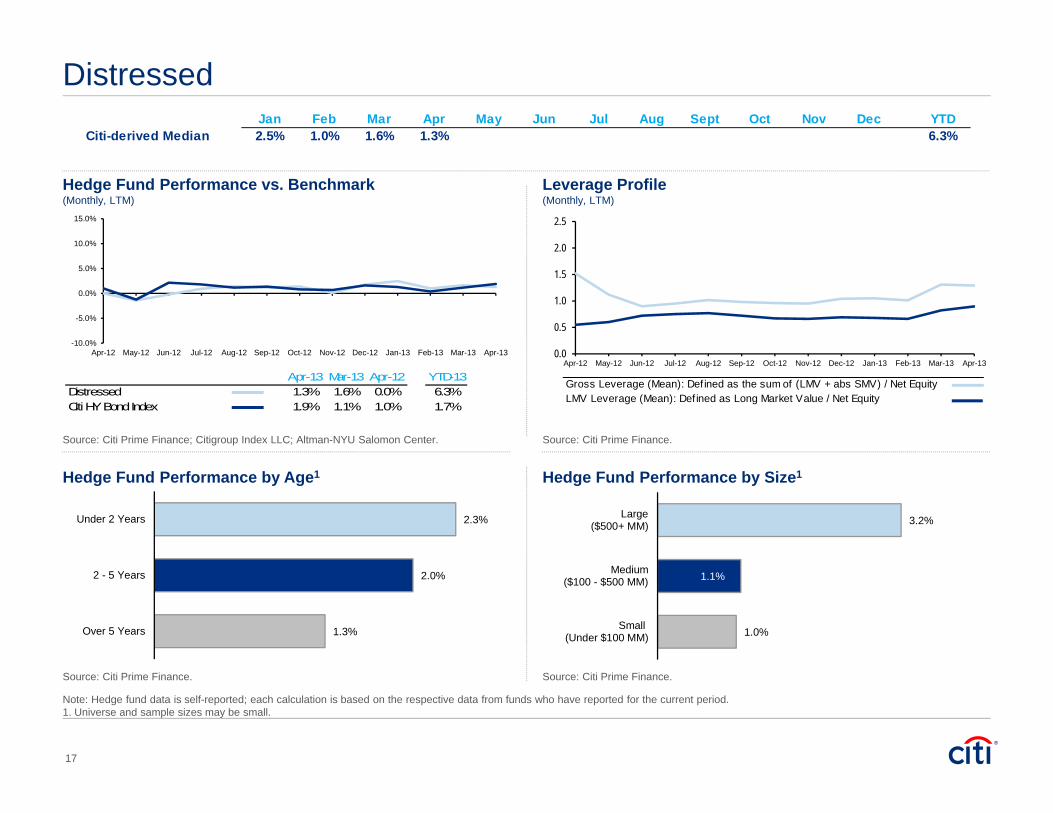
Source: Citi Prime Finance. Source: Citi Prime Finance.
Source: Citi Prime Finance; Citigroup Index LLC; Altman-NYU Salomon Center. Source: Citi Prime Finance.
Note: Hedge fund data is self-reported; each calculation is based on the respective data from funds who have reported for the current period.1. Universe and sample sizes may be small.
Hedge Fund Performance vs. Benchmark(Monthly, LTM)
Leverage Profile(Monthly, LTM)
Hedge Fund Performance by Age1 Hedge Fund Performance by Size1
17
Gross Leverage (Mean): Def ined as the sum of (LMV + abs SMV) / Net EquityLMV Leverage (Mean): Def ined as Long Market Value / Net Equity
0.0
0.5
1.0
1.5
2.0
2.5
Apr-12 May-12 Jun-12 Jul-12 Aug-12 Sep-12 Oct-12 Nov-12 Dec-12 Jan-13 Feb-13 Mar-13 Apr-13
Jan Feb Mar Apr May Jun Jul Aug Sept Oct Nov Dec YTDCiti-derived Median 2.5% 1.0% 1.6% 1.3% 6.3%
Apr-13 Mar-13 Apr-12 YTD-13Distressed 1.3% 1.6% 0.0% 6.3%Citi HY Bond Index 1.9% 1.1% 1.0% 1.7%
-10.0%
-5.0%
0.0%
5.0%
10.0%
15.0%
Apr-12 May-12 Jun-12 Jul-12 Aug-12 Sep-12 Oct-12 Nov-12 Dec-12 Jan-13 Feb-13 Mar-13 Apr-13
2.3%
2.0%
1.3%
Under 2 Years
2 - 5 Years
Over 5 Years
3.2%
1.1%
1.0%
Large($500+ MM)
Medium($100 - $500 MM)
Small(Under $100 MM)
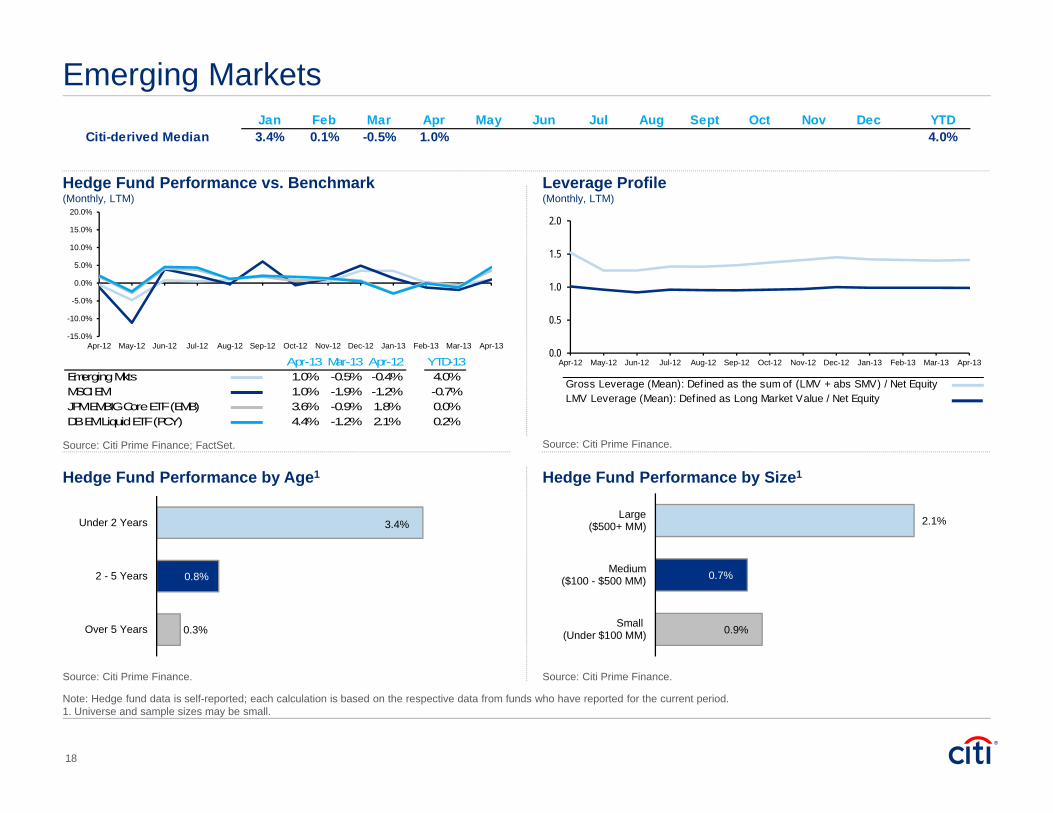
Emerging Markets
Source: Citi Prime Finance. Source: Citi Prime Finance.
Source: Citi Prime Finance; FactSet. Source: Citi Prime Finance.
Note: Hedge fund data is self-reported; each calculation is based on the respective data from funds who have reported for the current period.1. Universe and sample sizes may be small.
Hedge Fund Performance vs. Benchmark(Monthly, LTM)
Leverage Profile(Monthly, LTM)
Hedge Fund Performance by Age1 Hedge Fund Performance by Size1
18
Gross Leverage (Mean): Def ined as the sum of (LMV + abs SMV) / Net EquityLMV Leverage (Mean): Def ined as Long Market Value / Net Equity
0.0
0.5
1.0
1.5
2.0
Apr-12 May-12 Jun-12 Jul-12 Aug-12 Sep-12 Oct-12 Nov-12 Dec-12 Jan-13 Feb-13 Mar-13 Apr-13
Jan Feb Mar Apr May Jun Jul Aug Sept Oct Nov Dec YTDCiti-derived Median 3.4% 0.1% -0.5% 1.0% 4.0%
Apr-13 Mar-13 Apr-12 YTD-13Emerging Mkts 1.0% -0.5% -0.4% 4.0%MSCI EM 1.0% -1.9% -1.2% -0.7%JPM EMBIG Core ETF (EMB) 3.6% -0.9% 1.8% 0.0%DB EM Liquid ETF (PCY) 4.4% -1.2% 2.1% 0.2%
-15.0%
-10.0%
-5.0%
0.0%
5.0%
10.0%
15.0%
20.0%
Apr-12 May-12 Jun-12 Jul-12 Aug-12 Sep-12 Oct-12 Nov-12 Dec-12 Jan-13 Feb-13 Mar-13 Apr-13
3.4%
0.8%
0.3%
Under 2 Years
2 - 5 Years
Over 5 Years
2.1%
0.7%
0.9%
Large($500+ MM)
Medium($100 - $500 MM)
Small(Under $100 MM)
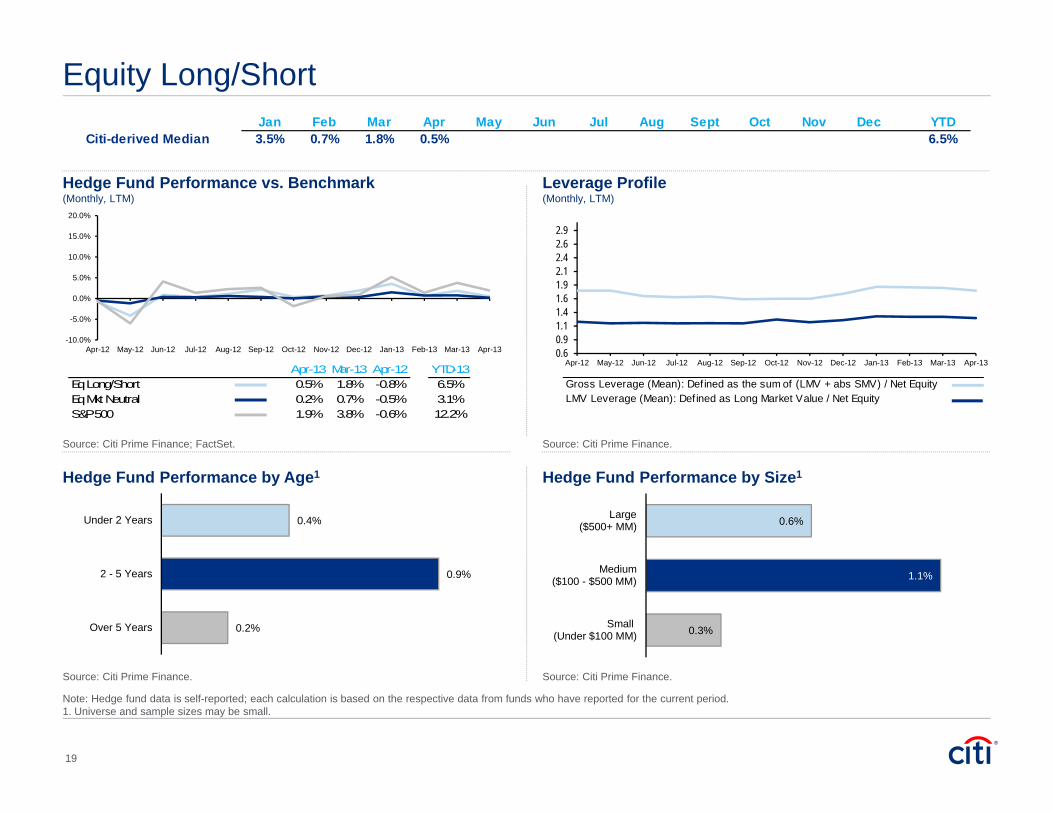
Equity Long/Short
Source: Citi Prime Finance. Source: Citi Prime Finance.
Source: Citi Prime Finance; FactSet. Source: Citi Prime Finance.
Note: Hedge fund data is self-reported; each calculation is based on the respective data from funds who have reported for the current period.1. Universe and sample sizes may be small.
Hedge Fund Performance vs. Benchmark(Monthly, LTM)
Leverage Profile(Monthly, LTM)
Hedge Fund Performance by Age1 Hedge Fund Performance by Size1
19
Gross Leverage (Mean): Def ined as the sum of (LMV + abs SMV) / Net EquityLMV Leverage (Mean): Def ined as Long Market Value / Net Equity
0.60.91.11.41.61.92.12.42.62.9
Apr-12 May-12 Jun-12 Jul-12 Aug-12 Sep-12 Oct-12 Nov-12 Dec-12 Jan-13 Feb-13 Mar-13 Apr-13
Jan Feb Mar Apr May Jun Jul Aug Sept Oct Nov Dec YTDCiti-derived Median 3.5% 0.7% 1.8% 0.5% 6.5%
Apr-13 Mar-13 Apr-12 YTD-13Eq Long/Short 0.5% 1.8% -0.8% 6.5%Eq Mkt Neutral 0.2% 0.7% -0.5% 3.1%S&P 500 1.9% 3.8% -0.6% 12.2%
-10.0%
-5.0%
0.0%
5.0%
10.0%
15.0%
20.0%
Apr-12 May-12 Jun-12 Jul-12 Aug-12 Sep-12 Oct-12 Nov-12 Dec-12 Jan-13 Feb-13 Mar-13 Apr-13
0.4%
0.9%
0.2%
Under 2 Years
2 - 5 Years
Over 5 Years
0.6%
1.1%
0.3%
Large($500+ MM)
Medium($100 - $500 MM)
Small(Under $100 MM)
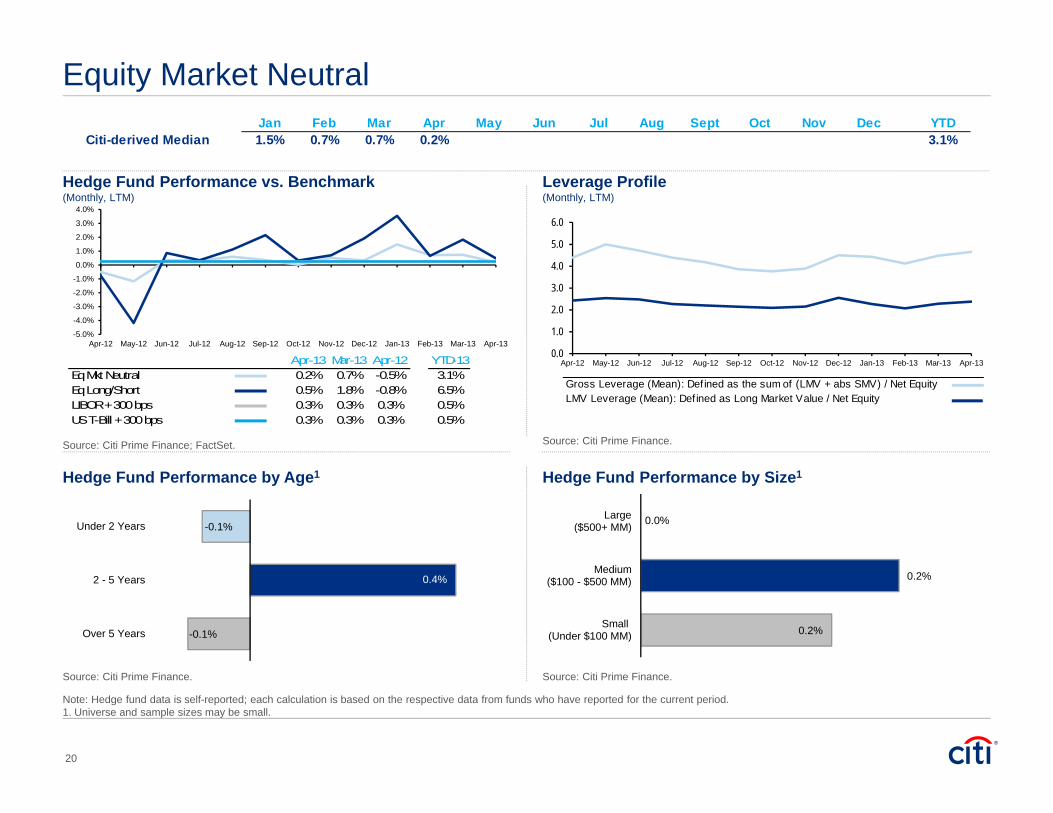
Equity Market Neutral
Source: Citi Prime Finance. Source: Citi Prime Finance.
Source: Citi Prime Finance; FactSet. Source: Citi Prime Finance.
Note: Hedge fund data is self-reported; each calculation is based on the respective data from funds who have reported for the current period.1. Universe and sample sizes may be small.
Hedge Fund Performance vs. Benchmark(Monthly, LTM)
Leverage Profile(Monthly, LTM)
Hedge Fund Performance by Age1 Hedge Fund Performance by Size1
20
Gross Leverage (Mean): Def ined as the sum of (LMV + abs SMV) / Net EquityLMV Leverage (Mean): Def ined as Long Market Value / Net Equity
0.0
1.0
2.0
3.0
4.0
5.0
6.0
Apr-12 May-12 Jun-12 Jul-12 Aug-12 Sep-12 Oct-12 Nov-12 Dec-12 Jan-13 Feb-13 Mar-13 Apr-13
Jan Feb Mar Apr May Jun Jul Aug Sept Oct Nov Dec YTDCiti-derived Median 1.5% 0.7% 0.7% 0.2% 3.1%
Apr-13 Mar-13 Apr-12 YTD-13Eq Mkt Neutral 0.2% 0.7% -0.5% 3.1%Eq Long/Short 0.5% 1.8% -0.8% 6.5%LIBOR + 300 bps 0.3% 0.3% 0.3% 0.5%US T-Bill + 300 bps 0.3% 0.3% 0.3% 0.5%
-5.0%
-4.0%
-3.0%
-2.0%
-1.0%
0.0%
1.0%
2.0%
3.0%
4.0%
Apr-12 May-12 Jun-12 Jul-12 Aug-12 Sep-12 Oct-12 Nov-12 Dec-12 Jan-13 Feb-13 Mar-13 Apr-13
-0.1%
0.4%
-0.1%
Under 2 Years
2 - 5 Years
Over 5 Years
0.0%
0.2%
0.2%
Large($500+ MM)
Medium($100 - $500 MM)
Small(Under $100 MM)
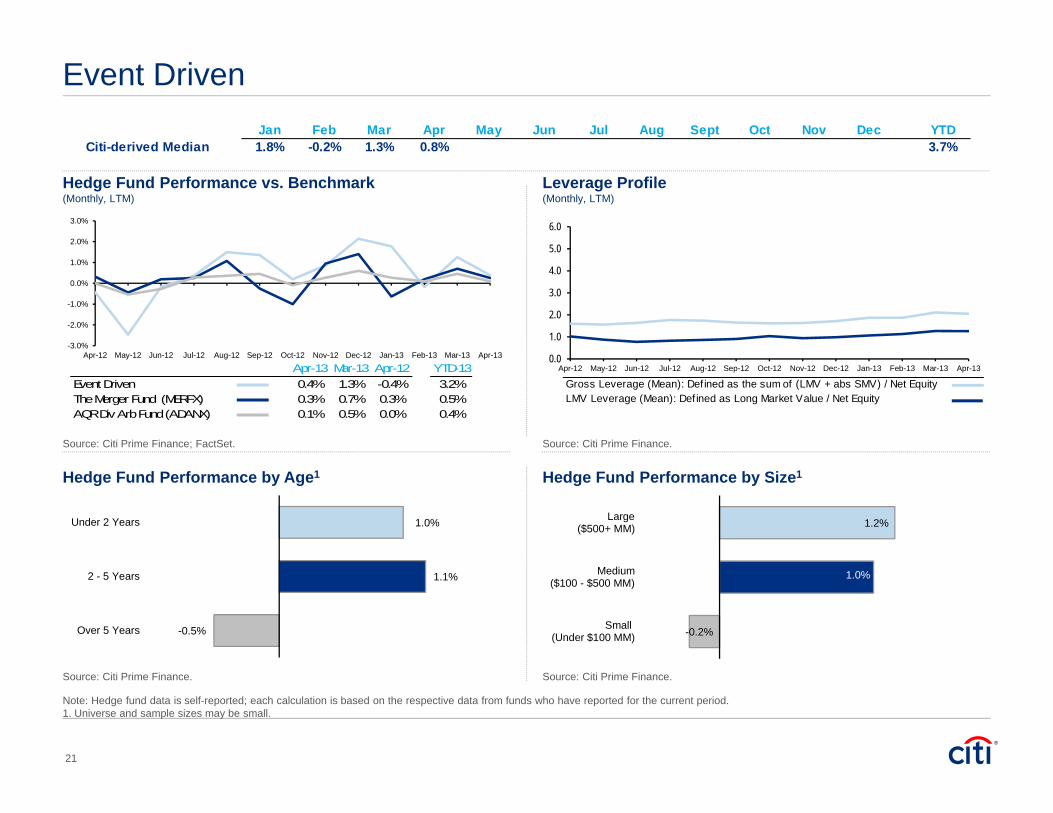
Event Driven
Source: Citi Prime Finance. Source: Citi Prime Finance.
Source: Citi Prime Finance; FactSet. Source: Citi Prime Finance.
Note: Hedge fund data is self-reported; each calculation is based on the respective data from funds who have reported for the current period.1. Universe and sample sizes may be small.
Hedge Fund Performance vs. Benchmark(Monthly, LTM)
Leverage Profile(Monthly, LTM)
Hedge Fund Performance by Age1 Hedge Fund Performance by Size1
21
Gross Leverage (Mean): Def ined as the sum of (LMV + abs SMV) / Net EquityLMV Leverage (Mean): Def ined as Long Market Value / Net Equity
0.0
1.0
2.0
3.0
4.0
5.0
6.0
Apr-12 May-12 Jun-12 Jul-12 Aug-12 Sep-12 Oct-12 Nov-12 Dec-12 Jan-13 Feb-13 Mar-13 Apr-13
Jan Feb Mar Apr May Jun Jul Aug Sept Oct Nov Dec YTDCiti-derived Median 1.8% -0.2% 1.3% 0.8% 3.7%
Apr-13 Mar-13 Apr-12 YTD-13Event Driven 0.4% 1.3% -0.4% 3.2%The Merger Fund (MERFX) 0.3% 0.7% 0.3% 0.5%AQR Div Arb Fund (ADANX) 0.1% 0.5% 0.0% 0.4%
-3.0%
-2.0%
-1.0%
0.0%
1.0%
2.0%
3.0%
Apr-12 May-12 Jun-12 Jul-12 Aug-12 Sep-12 Oct-12 Nov-12 Dec-12 Jan-13 Feb-13 Mar-13 Apr-13
1.0%
1.1%
-0.5%
Under 2 Years
2 - 5 Years
Over 5 Years
1.2%
1.0%
-0.2%
Large($500+ MM)
Medium($100 - $500 MM)
Small(Under $100 MM)
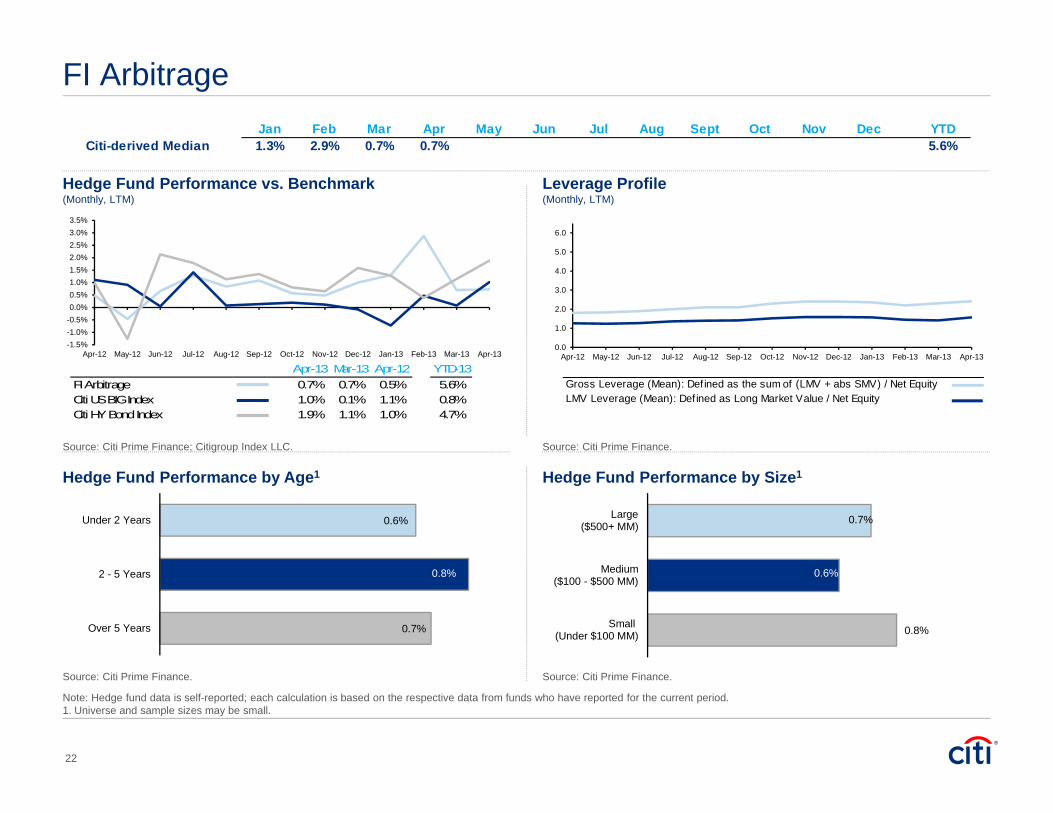
FI Arbitrage
Source: Citi Prime Finance. Source: Citi Prime Finance.
Source: Citi Prime Finance; Citigroup Index LLC. Source: Citi Prime Finance.
Note: Hedge fund data is self-reported; each calculation is based on the respective data from funds who have reported for the current period.1. Universe and sample sizes may be small.
Hedge Fund Performance vs. Benchmark(Monthly, LTM)
Leverage Profile(Monthly, LTM)
Hedge Fund Performance by Age1 Hedge Fund Performance by Size1
22
Gross Leverage (Mean): Def ined as the sum of (LMV + abs SMV) / Net EquityLMV Leverage (Mean): Def ined as Long Market Value / Net Equity
0.0
1.0
2.0
3.0
4.0
5.0
6.0
Apr-12 May-12 Jun-12 Jul-12 Aug-12 Sep-12 Oct-12 Nov-12 Dec-12 Jan-13 Feb-13 Mar-13 Apr-13
Jan Feb Mar Apr May Jun Jul Aug Sept Oct Nov Dec YTDCiti-derived Median 1.3% 2.9% 0.7% 0.7% 5.6%
Apr-13 Mar-13 Apr-12 YTD-13FI Arbitrage 0.7% 0.7% 0.5% 5.6%Citi US BIG Index 1.0% 0.1% 1.1% 0.8%Citi HY Bond Index 1.9% 1.1% 1.0% 4.7%
-1.5%-1.0%-0.5%0.0%0.5%1.0%1.5%2.0%2.5%3.0%3.5%
Apr-12 May-12 Jun-12 Jul-12 Aug-12 Sep-12 Oct-12 Nov-12 Dec-12 Jan-13 Feb-13 Mar-13 Apr-13
0.6%
0.8%
0.7%
Under 2 Years
2 - 5 Years
Over 5 Years
0.7%
0.6%
0.8%
Large($500+ MM)
Medium($100 - $500 MM)
Small(Under $100 MM)

Global Macro
Source: Citi Prime Finance. Source: Citi Prime Finance; FactSet.
Source: Citi Prime Finance; FactSet. Source: Citi Prime Finance; FactSet.
Note: Hedge fund data is self-reported; each calculation is based on the respective data from funds who have reported for the current period.1. Universe and sample sizes may be small.
Hedge Fund Performance vs. Benchmark(Monthly, LTM)
Leverage Profile(Monthly, LTM)
Hedge Fund Performance by Age1 Hedge Fund Performance by Size1
23
Gross Leverage (Mean): Def ined as the sum of (LMV + abs SMV) / Net EquityLMV Leverage (Mean): Def ined as Long Market Value / Net Equity
0.0
1.0
2.0
3.0
4.0
5.0
6.0
7.0
Apr-12 May-12 Jun-12 Jul-12 Aug-12 Sep-12 Oct-12 Nov-12 Dec-12 Jan-13 Feb-13 Mar-13 Apr-13
Jan Feb Mar Apr May Jun Jul Aug Sept Oct Nov Dec YTDCiti-derived Median 2.2% -0.5% 1.0% 2.3% 5.0%
Apr-13 Mar-13 Apr-12 YTD-13Global Macro 2.3% 1.0% -0.6% 5.0%MSCI World 3.2% 2.4% -1.1% 5.3%US$-Index -1.5% 1.3% -0.3% 2.8%
-10.0%
-8.0%
-6.0%
-4.0%
-2.0%
0.0%
2.0%
4.0%
6.0%
8.0%
Apr-12 May-12 Jun-12 Jul-12 Aug-12 Sep-12 Oct-12 Nov-12 Dec-12 Jan-13 Feb-13 Mar-13 Apr-13
1.5%
0.7%
0.9%
Under 2 Years
2 - 5 Years
Over 5 Years
1.2%
1.0%
0.8%
Large($500+ MM)
Medium($100 - $500 MM)
Small(Under $100 MM)
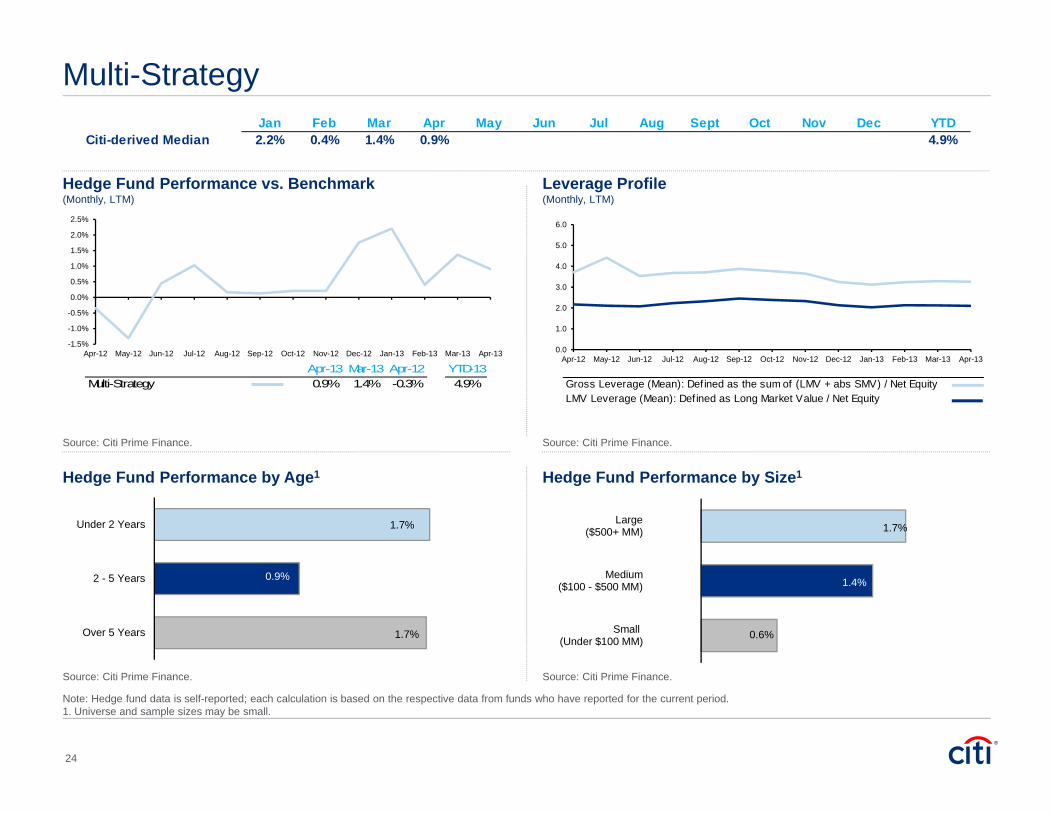
Multi-Strategy
Source: Citi Prime Finance. Source: Citi Prime Finance.
Source: Citi Prime Finance. Source: Citi Prime Finance.
Note: Hedge fund data is self-reported; each calculation is based on the respective data from funds who have reported for the current period.1. Universe and sample sizes may be small.
Hedge Fund Performance vs. Benchmark(Monthly, LTM)
Leverage Profile(Monthly, LTM)
Hedge Fund Performance by Age1 Hedge Fund Performance by Size1
24
Gross Leverage (Mean): Def ined as the sum of (LMV + abs SMV) / Net EquityLMV Leverage (Mean): Def ined as Long Market Value / Net Equity
0.0
1.0
2.0
3.0
4.0
5.0
6.0
Apr-12 May-12 Jun-12 Jul-12 Aug-12 Sep-12 Oct-12 Nov-12 Dec-12 Jan-13 Feb-13 Mar-13 Apr-13
Jan Feb Mar Apr May Jun Jul Aug Sept Oct Nov Dec YTDCiti-derived Median 2.2% 0.4% 1.4% 0.9% 4.9%
Apr-13 Mar-13 Apr-12 YTD-13Multi-Strategy 0.9% 1.4% -0.3% 4.9%
-1.5%
-1.0%
-0.5%
0.0%
0.5%
1.0%
1.5%
2.0%
2.5%
Apr-12 May-12 Jun-12 Jul-12 Aug-12 Sep-12 Oct-12 Nov-12 Dec-12 Jan-13 Feb-13 Mar-13 Apr-13
1.7%
0.9%
1.7%
Under 2 Years
2 - 5 Years
Over 5 Years
1.7%
1.4%
0.6%
Large($500+ MM)
Medium($100 - $500 MM)
Small(Under $100 MM)
Firm Disclaimers and Market Commentary DisclosuresThis communication has been prepared by employees of Citi and is distributed by or through its locally authorized affiliates (collectively, the “Firm”). Employees preparing this communication are not Research Analysts and are not employees of Citi Investment Research (CIRA) and the information in this communication (the “Message”) is not intended to constitute “research” as that term is defined by applicable regulations. Any reference to a research report or research recommendation is not intended to represent the whole report and is not in itself considered a recommendation or research report. Please contact your Firm representative for a copy of a comprehensive research report. All views, opinions and estimates expressed in the Message constitute the author’s and/or the Firm’s judgment as of the date of the Message, may change without notice and may differ from those views, opinions and estimates expressed by other Firm personnel.
IRS Circular 230 Disclosure: Citigroup Inc. and its affiliates do not provide tax or legal advice. Any discussion of tax matters in these materials (i) is not intended or written to be used, and cannot be used or relied upon, by you for the purpose of avoiding any tax penalties and (ii) may have been written in connection with the “promotion or marketing” of any transaction contemplated hereby (“Transaction”). Accordingly, you should seek advice based on your particular circumstances from an independent tax advisor. The Message is provided for information and discussion purposes only and is not a representation or recommendation by the Firm. It does not constitute an offer or solicitation to purchase or sell any financial instruments, and does not take into account the investment objectives or financial situation of any particular person. Investors should obtain advice based on their own individual circumstances from their own tax, financial, legal and other advisors before making an investment decision, and only make such decisions on the basis of the investor’s own objectives, experience and resources. The information contained in the Message is based on generally available information and, although obtained from sources believed by the Firm to be reliable, its accuracy and completeness cannot be assured, and such information may be incomplete or condensed. Certain personnel or business areas of the Firm may have access to or may have acquired material non-public information that may have an impact (positive or negative) on the information contained in the Message, but that is not available to or known by the author of the Message.
The Firm may be the issuer of, may make a market in or may trade as principal in the financial instruments referred to in the Message or other related financial instruments. The Firm may perform or seek to perform investment banking and other services for the issuer of any such financial instruments. The author of the Message may have discussed the information contained therein with others within or outside the Firm and the author and/or such other Firm personnel may have already acted on the basis of this information (including by trading for the Firm’s proprietary accounts or communicating the information contained herein to other customers of the Firm). Compensation of Firm personnel may include consideration of the performance of such department’s activities.
The Firm, the Firm’s personnel (including those with whom the author may have consulted in the preparation of this communication), and other customers of the Firm may be long or short the financial instruments referred to in the Message, may have acquired such positions at prices and market conditions that are no longer available, may be a director or office of any company referenced herein and may have interests different from or adverse to your interests.
Investments in financial instruments carry significant risk, including the possible loss of the principal amount invested. Financial instruments denominated in a foreign currency are subject to exchange rate fluctuations, which may have an adverse effect on the price or value of an investment in such products. No liability is accepted by the Firm for any loss (whether direct, indirect or consequential) that may arise from any use of the information contained in or derived from the Message.
Unless otherwise indicated, the Message is not intended to forecast or predict future events. Past performance is not a guarantee or indication of future results. Any prices provided in the Message (other than those that are identified as being historical) are indicative only and do not represent firm quotes as to either price or size. You should contact your local representative directly if you are interested in buying or selling any financial instrument, or pursuing any trading strategy, mentioned herein.
Although the Firm is affiliated with Citibank, N.A. (together with its subsidiaries and branches worldwide, “Citibank”), you should be aware that none of the other financial instruments mentioned in the Message (unless expressly stated otherwise) are (i) insured by the Federal Deposit Insurance Corporation or any other governmental authority, or (ii) deposits or other obligations of, or guaranteed by, Citibank or any other insured depository institution.
The information in this Message may be confidential or otherwise protected by law. If you are not the intended recipient of the Message, please delete and do not disclose or make improper use of it, and promptly notify the sender. The Message contains data compilations, writings and information that are proprietary to the Firm and protected under copyright and other intellectual property laws, and may not be redistributed or otherwise transmitted by you to any other person for any purpose. Electronic messages are not necessarily secure or error-free and can contain viruses, and the sender is not liable for any of these occurrences. The Firm reserves the right to monitor, record and retain electronic messages.
We are required to obtain, verify and record certain information that identifies each entity that enters into a formal business relationship with us. We will ask for complete name, street address and tax payer ID number. We may also request corporate formation documents, or other forms of identification, to verify information provided.
Copyright © Citi 2012. All Rights Reserved. Citi and Citi Arc Design are trademarks and service marks of Citigroup Inc. or its affiliates and are used and registered throughout the world.
25
Contacts
For Further Information, Please Contact
Sandy [email protected]
This report has been prepared by members of Citi Prime Finance and is not a research report. This report does not constitute advice on investments or a solicitation to buy or sell any financial instrument. Please see Market Commentary Disclosures.
26