hedge fund industry snapshot -...
TRANSCRIPT
Hedge Fund Industry SnapshotData as of March 2012
This report has been prepared by members of Citi ICG Analytics and Prime Finance and is not a research report. This report does not constitute advice on investments or a solicitation to buy or sell any financial instrument. Please see final pages for Market Commentary Disclosures.
AmericasNew York: 800 773 2889 Boston: 617 346 9335San Francisco: 415 617 8554
EMEAEMEA: 44 (0) 207 986 0822
Asia PacHong Kong: 852 2501 8356Tokyo: 813 6270 3165Singapore: 65 6432 1223Australia: 612 8225 6424
www.citigroupgcib.com
Market CommentaryReport Date: April 2012

Data as of Mar-2012
1
Table of ContentsMonthly Highlights 2
Hedge Fund Industry Overview 3– AUM, Performance– Industry Flows
Hedge Fund Stats by Strategy 5
Performance at a Glance 6– Hedge Fund Performance– Citi HARP vs. HFRI Fund of Fund Performance– Securities Market Performance
Short Flows Data 9– U.S. Short Sales & Short Cover by Sector– U.S. Short Sales & Short Cover by Industry Group
Hedge Fund (Fund Level) Profiles 12– Fund Structure– Fund Analytics
Risk vs. Return Metrics 14
By Strategy 15– Performance vs. Respective Benchmark(s)– Leverage Profile – Hedge Fund Performance by Size– Hedge Fund Performance by Age
Firm Disclaimers and Market Commentary Disclosures 26
Contacts 27
Data as of Mar-2012
2
Highlights-
Performance, AUM & Flows:
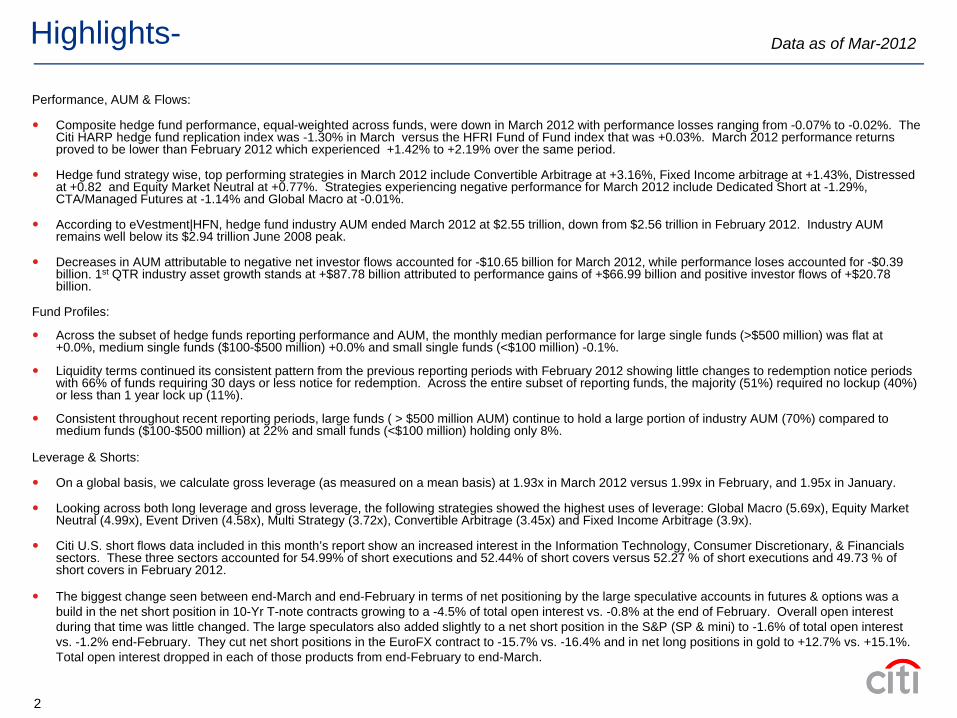
Composite hedge fund performance, equal-weighted across funds, were down in March 2012 with performance losses ranging from -0.07% to -0.02%. The Citi HARP hedge fund replication index was -1.30% in March versus the HFRI Fund of Fund index that was +0.03%. March 2012 performance returns proved to be lower than February 2012 which experienced +1.42% to +2.19% over the same period.
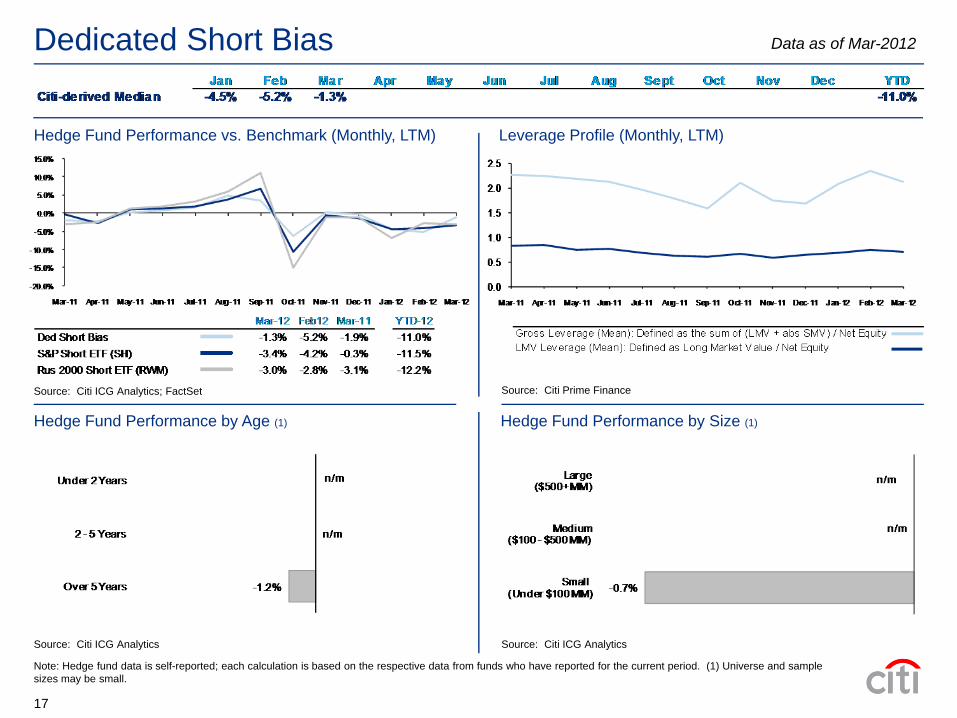
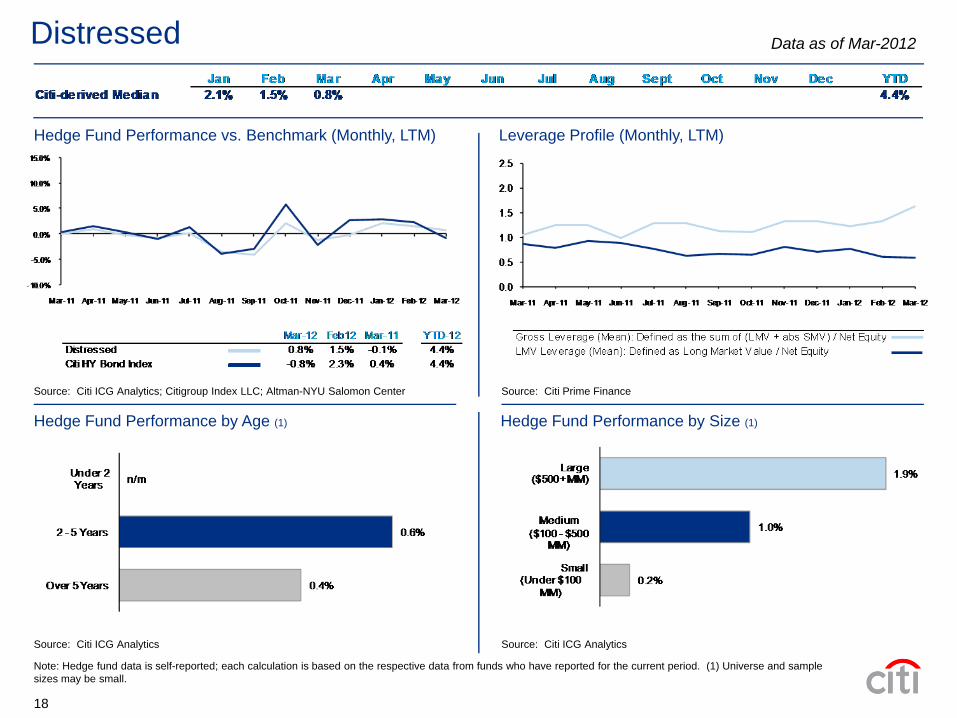
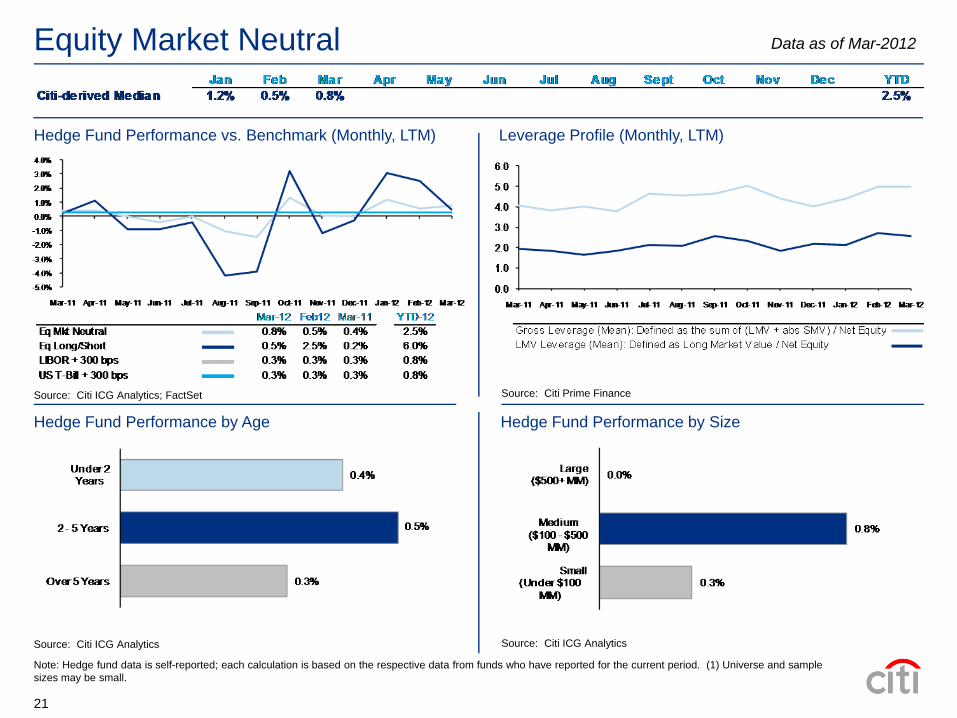
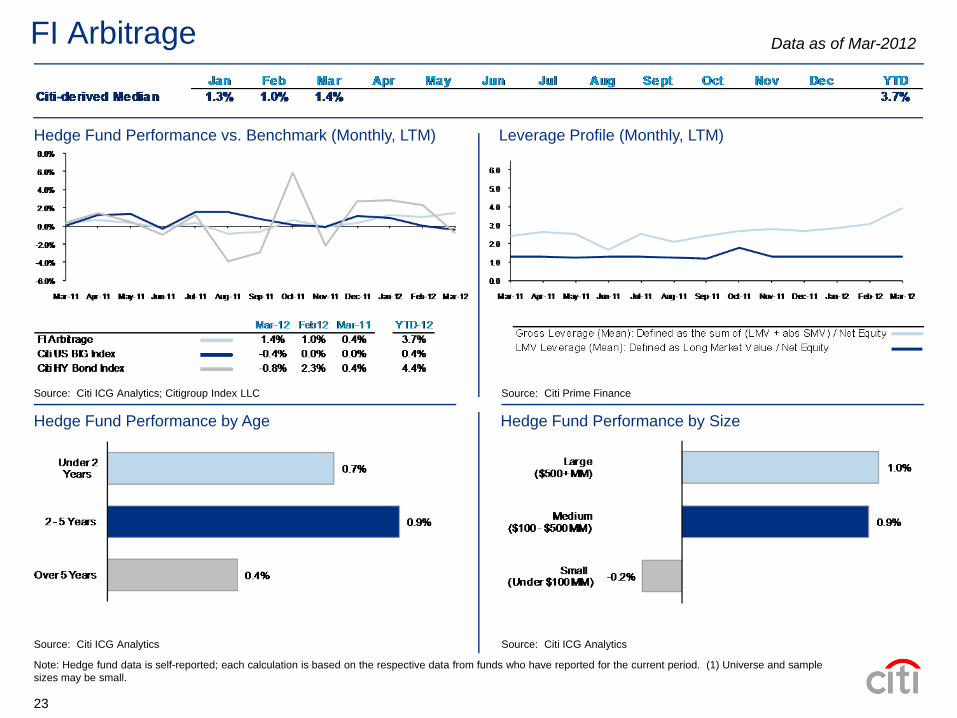
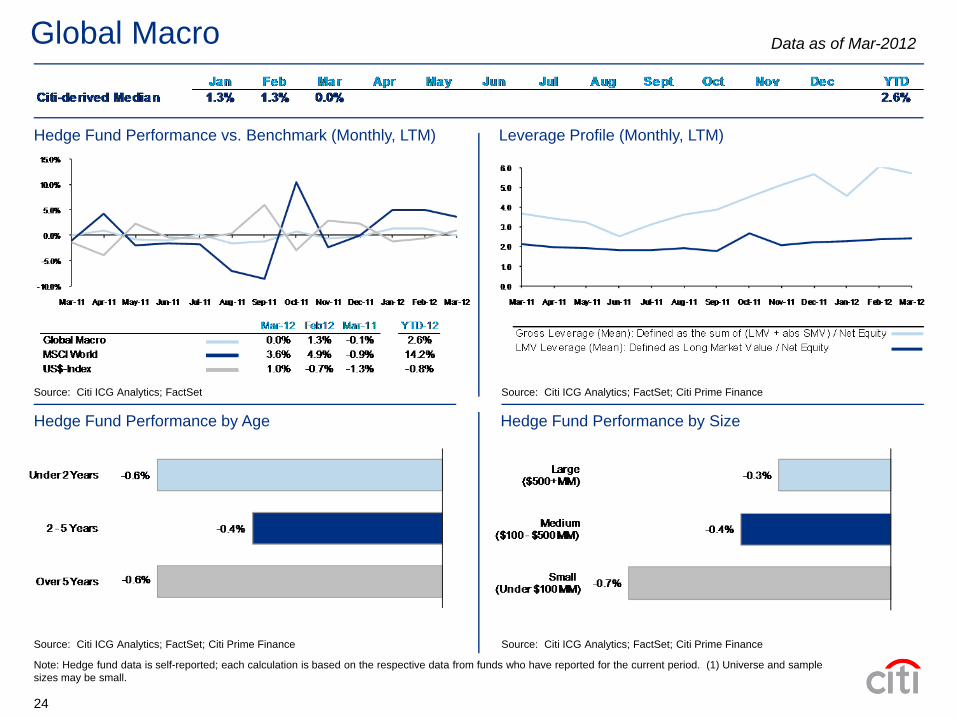
Hedge fund strategy wise, top performing strategies in March 2012 include Convertible Arbitrage at +3.16%, Fixed Income arbitrage at +1.43%, Distressed at +0.82 and Equity Market Neutral at +0.77%. Strategies experiencing negative performance for March 2012 include Dedicated Short at -1.29%, CTA/Managed Futures at -1.14% and Global Macro at -0.01%.
According to eVestment|HFN, hedge fund industry AUM ended March 2012 at $2.55 trillion, down from $2.56 trillion in February 2012. Industry AUM remains well below its $2.94 trillion June 2008 peak.
Decreases in AUM attributable to negative net investor flows accounted for -$10.65 billion for March 2012, while performance loses accounted for -$0.39 billion. 1st QTR industry asset growth stands at +$87.78 billion attributed to performance gains of +$66.99 billion and positive investor flows of +$20.78 billion.
Fund Profiles:
Across the subset of hedge funds reporting performance and AUM, the monthly median performance for large single funds (>$500 million) was flat at +0.0%, medium single funds ($100-$500 million) +0.0% and small single funds (<$100 million) -0.1%.
Liquidity terms continued its consistent pattern from the previous reporting periods with February 2012 showing little changes to redemption notice periods with 66% of funds requiring 30 days or less notice for redemption. Across the entire subset of reporting funds, the majority (51%) required no lockup (40%) or less than 1 year lock up (11%).
Consistent throughout recent reporting periods, large funds ( > $500 million AUM) continue to hold a large portion of industry AUM (70%) compared to medium funds ($100-$500 million) at 22% and small funds (<$100 million) holding only 8%.
Leverage & Shorts:
On a global basis, we calculate gross leverage (as measured on a mean basis) at 1.93x in March 2012 versus 1.99x in February, and 1.95x in January.
Looking across both long leverage and gross leverage, the following strategies showed the highest uses of leverage: Global Macro (5.69x), Equity Market Neutral (4.99x), Event Driven (4.58x), Multi Strategy (3.72x), Convertible Arbitrage (3.45x) and Fixed Income Arbitrage (3.9x).
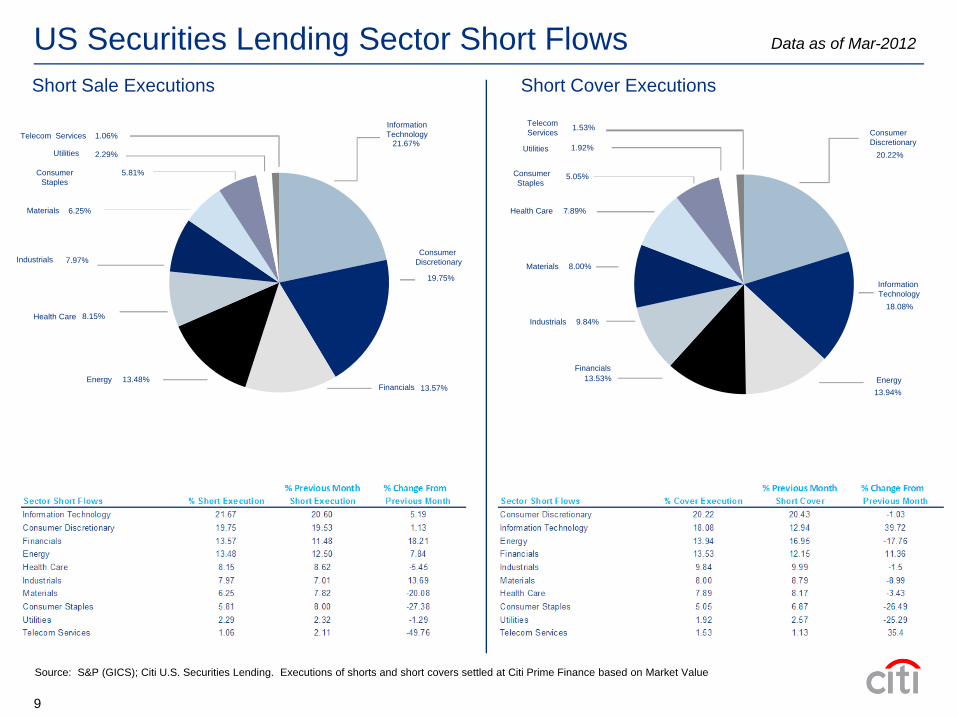
Citi U.S. short flows data included in this month’s report show an increased interest in the Information Technology, Consumer Discretionary, & Financials sectors. These three sectors accounted for 54.99% of short executions and 52.44% of short covers versus 52.27 % of short executions and 49.73 % of short covers in February 2012.
The biggest change seen between end-March and end-February in terms of net positioning by the large speculative accounts in futures & options was a build in the net short position in 10-Yr T-note contracts growing to a -4.5% of total open interest vs. -0.8% at the end of February. Overall open interest during that time was little changed. The large speculators also added slightly to a net short position in the S&P (SP & mini) to -1.6% of total open interest vs. -1.2% end-February. They cut net short positions in the EuroFX contract to -15.7% vs. -16.4% and in net long positions in gold to +12.7% vs. +15.1%. Total open interest dropped in each of those products from end-February to end-March.

Data as of Mar-2012
3
Hedge Fund Industry: AUM, Performance
Monthly Industry AUM and Performance
Source: eVestment|HFN; Hedge Fund Research, Inc., © 2010; www.hedgefundresearch.com
Industry Performance: Mar-12 / YTD
Source: eVestment|HFN
Composite hedge fund performance, equal-weighted across funds, were down in March 2012 with performance losses ranging from -0.07% to -0.02%. Returns were lower than last month’s (February 2012 +1.42% to +2.19%). Year to data performance gains range from +3.16% to +4.99% compared to +0.41% to +1.70% over the same period year ago.
Financial markets produced mixed performance for March, as strength in US economic data and optimism with regard to resolution of European sovereign debt crisis were offset by mixed performance in Asian and Emerging market equities, rising yields and commodity weakness. US equities posted gains with leadership from Financials and Technology partially offset by weakness in Energy & Commodity exposures. US yields rose across the curve on continued improvement in housing and employment data contributing to lower expectations for near term quantitative easing, while the US dollar was mixed, posting a gain against the Japanese Yen.
Hedge fund strategy wise, top performing strategies in March include Convertible Arbitrage at +3.16%, Fixed Income arbitrage at +1.43%, Distressed at +0.82 and Equity Market Neutral at +0.77%. Strategies experiencing negative performance for March 2012 include Dedicated Short at -1.29%, CTA/Managed Futures at -1.14% and Global Macro at -0.01%.
Industry AUM, estimated at $2.55 trillion for March 2012 according to eVestment|HFN is down from February’s $2.56 trillion. Depending on the source, estimates of industry AUM ranges from $2.13 to $2.55 trillion compared to the Q2 2008 peak range of $1.9 to $2.94 trillion.
Note Pad: MSCI World Index: +1.3%; +11.3% YTD
MSCI EM Index: -3.3%; +14.1% YTD
S&P 500: +3.3%; +12.3% YTD
Citi US BIG Index: -0.6%; +0.3% YTD
S&P GSCI: -2.4%; +6.1% YTD
U.S. Dollar Index: +1.0%; -0.8% YTD
HFN Country Indices December/YTD: Brazil -1.49% / +10.22%; Russia -2.17%/ +15.51%; India: -4.47% / +16.86%; China: -2.56% / +3.65%

Data as of Mar-2012
4
Hedge Fund Industry: Change in Industry Assets
Monthly Change in Industry Assets and Composition
Source: eVestment|HFN
Composition of Change in Assets: Mar-12 Amounts in ($ bn)
Source: eVestment|HFN
According to eVestment|HFN, the estimated change in industry assets for March 2012 was negative, finishing the month down -$11.03 billion. Losses were attributed mostly from negative net investor flows at -$10.65 billion. Performance was down slightly from February 2012 with accounting for losses of -$0.39 billion. 1st Quarter industry asset growth stands at +$87.78 Billion from performance gains of +$66.99 billion and positive investor flows of +$20.78 billion.
March 2012 marks the first month since November 2011 where performance contributed negatively to AUM. March 2012 performance loses of -$0.39 billion were lower than the previous month (February 2012 +$34.69 billion). 1st Quarter industry performance gains stand at +$66.99 billion compared to +$33.86 billion the same period last year.
Negative net investor inflows of -$10.65 billion for March 2012 marks the first period of negative net flows for 2012. March 2012 net flows are lower than year ago, as investor inflows totaled +$12.96 billion over the same period.
Total industry AUM of $2.55 trillion for March 2012 is down -0.22% from $2.56 trillion in February 2012. Industry AUM levels are still well below the June 2008 peak estimated by eVestment|HFN at $2.94 trillion.
Note Pad:
The Citi Prime Finance calculation for end-March gross leverage (as measured on a mean basis) was 1.93x, compared to recent months: February (1.99x), January (1.95x), December (1.89x)
Gross leverage (mean): defined as sum of (LMV + abs SMV) / Net Equity

Data as of Mar-2012
5
Hedge Fund Stats by StrategyHedge Fund Strategy Breakdown by Assets
Note: Hedge fund data is self-reported; each calculation is based on the respective data from funds who have reported for the current period.
Hedge Fund Strategy Breakdown by Number of Funds
Hedge Fund Performance by Strategy Hedge Fund Leverage Ratios by StrategyGross Leverage (Mean): Defined as the sum of (LMV + abs SMV) / Net Equity
Source: Citi ICG Analytics Source: Citi ICG Analytics
Source: Citi ICG Analytics Source: Citi Prime Finance
Data as of Mar-2012
6
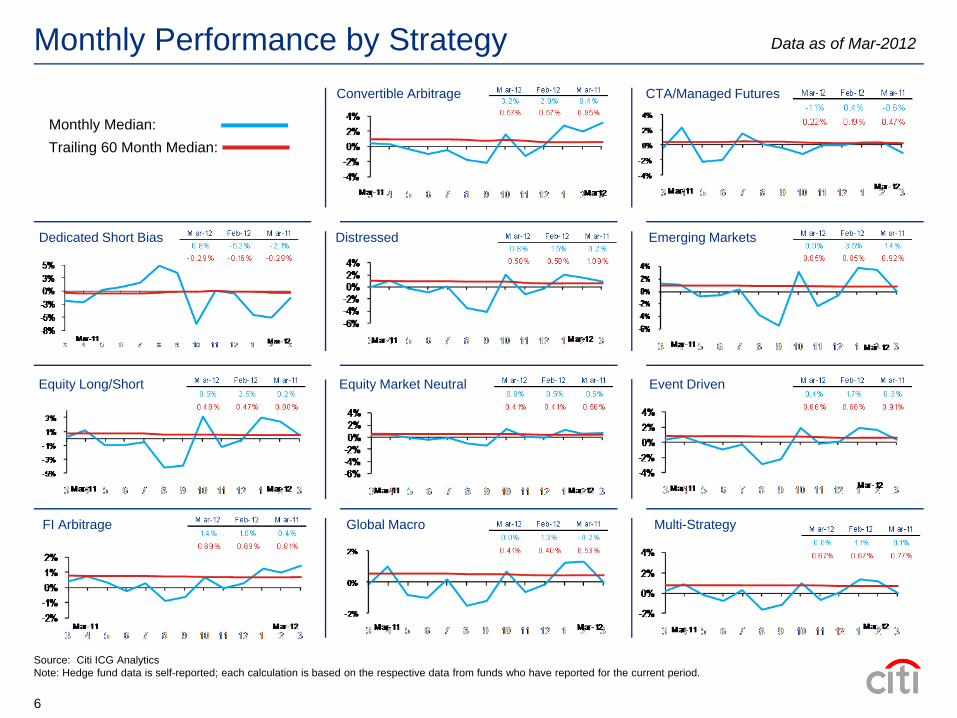
Monthly Performance by Strategy
Monthly Median:Trailing 60 Month Median:
CTA/Managed Futures
Dedicated Short Bias Distressed
Equity Long/Short Equity Market Neutral Event Driven
FI Arbitrage Global Macro Multi-Strategy
Emerging Markets
Convertible Arbitrage
Source: Citi ICG AnalyticsNote: Hedge fund data is self-reported; each calculation is based on the respective data from funds who have reported for the current period.
Data as of Mar-2012
7
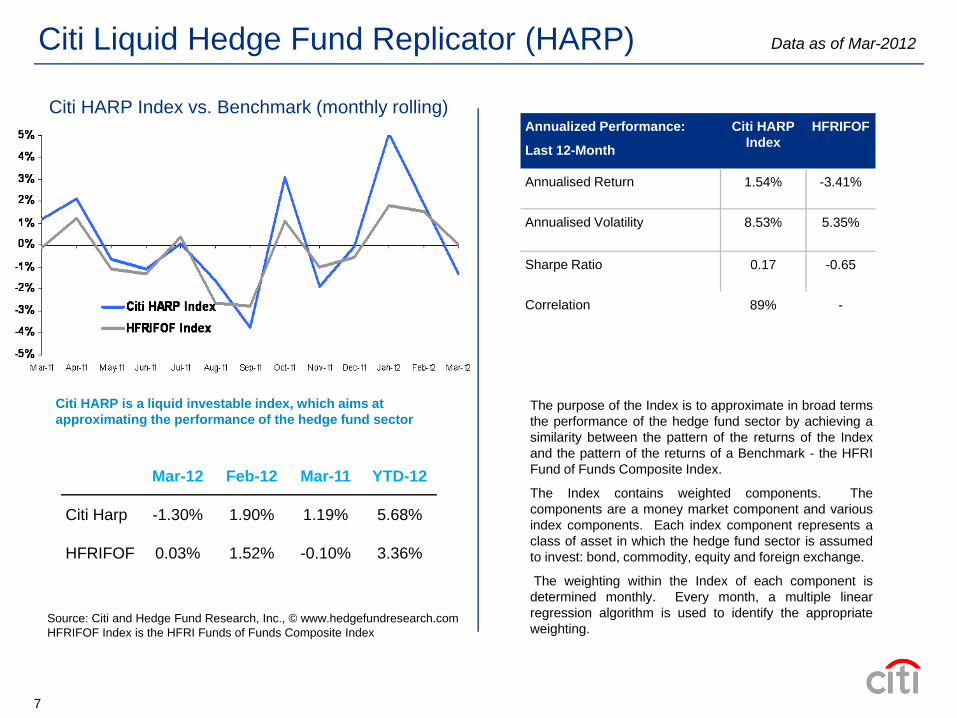
Citi Liquid Hedge Fund Replicator (HARP)
Mar-12 Feb-12 Mar-11 YTD-12
Citi Harp -1.30% 1.90% 1.19% 5.68%
HFRIFOF 0.03% 1.52% -0.10% 3.36%
Citi HARP Index vs. Benchmark (monthly rolling)
Citi HARP is a liquid investable index, which aims at approximating the performance of the hedge fund sector
Source: Citi and Hedge Fund Research, Inc., © www.hedgefundresearch.comHFRIFOF Index is the HFRI Funds of Funds Composite Index
Annualized Performance:
Last 12-Month
Citi HARP Index
HFRIFOF
Annualised Return 1.54% -3.41%
Annualised Volatility 8.53% 5.35%
Sharpe Ratio 0.17 -0.65
Correlation 89% -
The purpose of the Index is to approximate in broad termsthe performance of the hedge fund sector by achieving asimilarity between the pattern of the returns of the Indexand the pattern of the returns of a Benchmark - the HFRIFund of Funds Composite Index.
The Index contains weighted components. Thecomponents are a money market component and variousindex components. Each index component represents aclass of asset in which the hedge fund sector is assumedto invest: bond, commodity, equity and foreign exchange.
The weighting within the Index of each component isdetermined monthly. Every month, a multiple linearregression algorithm is used to identify the appropriateweighting.

Data as of Mar-2012
8
Global Equities (Developed vs. Emerging)
Market PerformanceUS Equities (Large Cap vs. Small Cap)
Commodities (US$ performance)Fixed Income (High-Grade vs. High-Yield)
Source: Citi ICG Analytics; FactSet; Citigroup Index LLC; Altman-NYU Salomon Center defaulted Debt Security Indexes.
Data as of Mar-2012
9
Financials13.53%
13.94%
18.08%
Utilities
1.53%Telecom Services
1.92%
ConsumerStaples
5.05%
Materials
9.84%
Health Care 7.89%
Consumer Discretionary
8.00%
20.22%
US Securities Lending Sector Short FlowsShort Sale Executions Short Cover Executions
Source: S&P (GICS); Citi U.S. Securities Lending. Executions of shorts and short covers settled at Citi Prime Finance based on Market Value
21.67%
19.75%
Industrials
13.48%
Utilities
1.06%Telecom Services
2.29%
Consumer Staples
5.81%
8.15%
Materials 6.25%
Health Care
7.97%
13.57%
Information Technology
Industrials
EnergyEnergy
Information Technology
Financials
Consumer Discretionary
Data as of Mar-2012
10
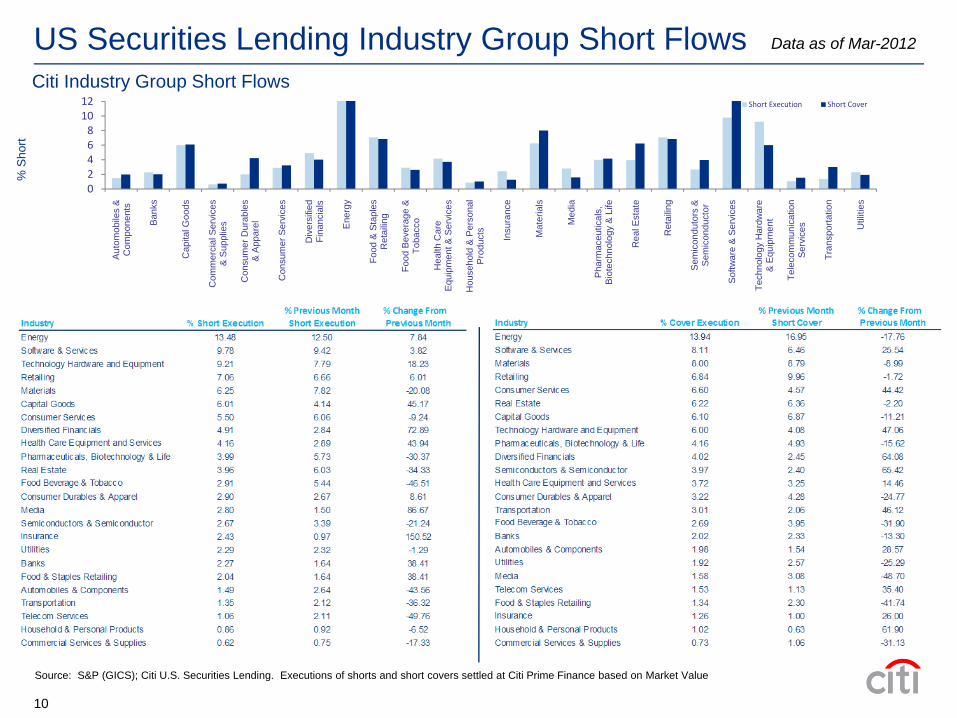
US Securities Lending Industry Group Short FlowsCiti Industry Group Short Flows
% S
hort
Source: S&P (GICS); Citi U.S. Securities Lending. Executions of shorts and short covers settled at Citi Prime Finance based on Market Value
02468
1012
Aut
omob
iles
&
Com
pone
nts
Ban
ks
Cap
ital G
oods
Com
mer
cial
Ser
vice
s &
Sup
plie
s
Con
sum
er D
urab
les
& A
ppar
el
Con
sum
er S
ervi
ces
Div
ersi
fied
Fina
ncia
ls
Ene
rgy
Food
& S
tapl
es
Ret
ailin
g
Food
Bev
erag
e &
To
bacc
o
Hea
lth C
are
Equ
ipm
ent &
Ser
vice
s
Hou
seho
ld &
Per
sona
l P
rodu
cts
Insu
ranc
e
Mat
eria
ls
Med
ia
Pha
rmac
eutic
als,
B
iote
chno
logy
& L
ife
Rea
l Est
ate
Ret
ailin
g
Sem
icon
duto
rs &
S
emic
ondu
ctor
Sof
twar
e &
Ser
vice
s
Tech
nolo
gy H
ardw
are
& E
quip
men
t
Tele
com
mun
icat
ion
Ser
vice
s
Tran
spor
tatio
n
Util
ities
Short Execution Short Cover
Data as of Mar-2012
11
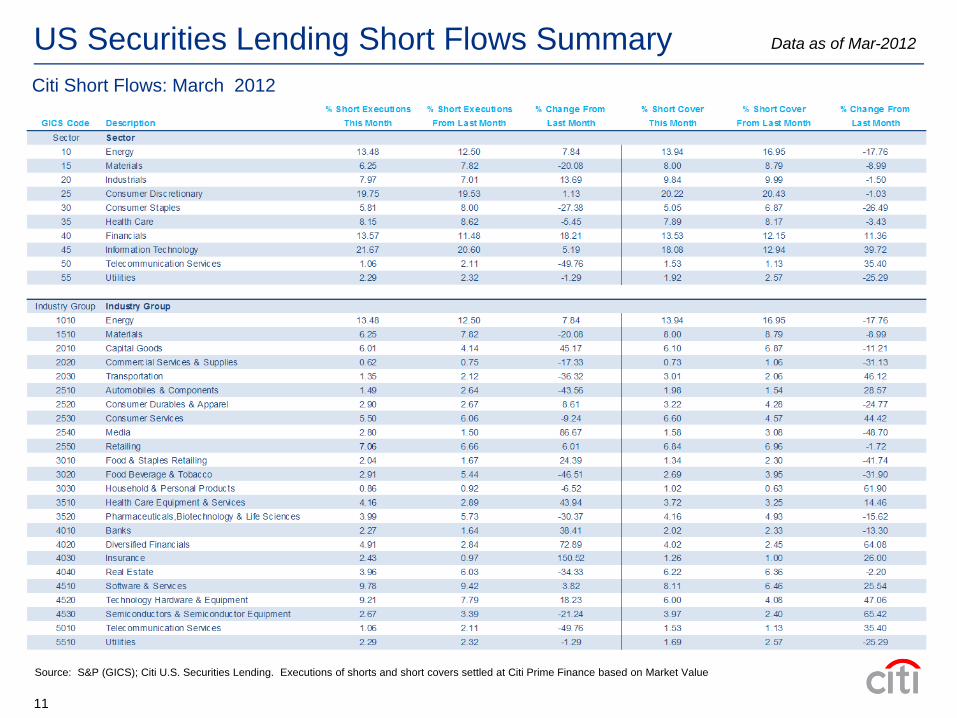
US Securities Lending Short Flows SummaryCiti Short Flows: March 2012
Source: S&P (GICS); Citi U.S. Securities Lending. Executions of shorts and short covers settled at Citi Prime Finance based on Market Value

Data as of Mar-2012
12
Hedge Fund (Fund Level) ProfilesBy Fund Size—No. of Funds Redemption Notice Period On-shore/Off-shore
By Fund Size—$ AUM Redemption Frequency Legal Status
By Fund Age—No. of Funds Lock-Up Domicile (by $ AUM)
By Fund Age—$ AUM Minimum Investment
Source: Citi ICG AnalyticsNote: Hedge fund data is self-reported; each calculation is based on the respective data from funds who have reported for the current period.
Open-End:93%
Closed-End:7%

Data as of Mar-2012
13
Hedge Fund (Fund Level) ProfilesHedge Funds: Large (>$500 MM)
Hedge Funds: Medium ($100 – $500 MM)
Hedge Funds: Small (<$100 MM)
Source: Citi ICG AnalyticsNote: Hedge fund data is self-reported; each calculation is based on the respective data from funds who have reported for the current period. Median YTD performance is calculated from funds reporting for all underlying periods. - “n/m” = Not Meaningful.

Data as of Mar-2012
14
Risk and Return MetricsSharpe Ratios (Jun-94 – Mar-12)
Source: Citi ICG Analytics
Risk vs. Return (Mar-11 – Mar-12)
Source: Credit Suisse Tremont
Data as of Mar-2012
15
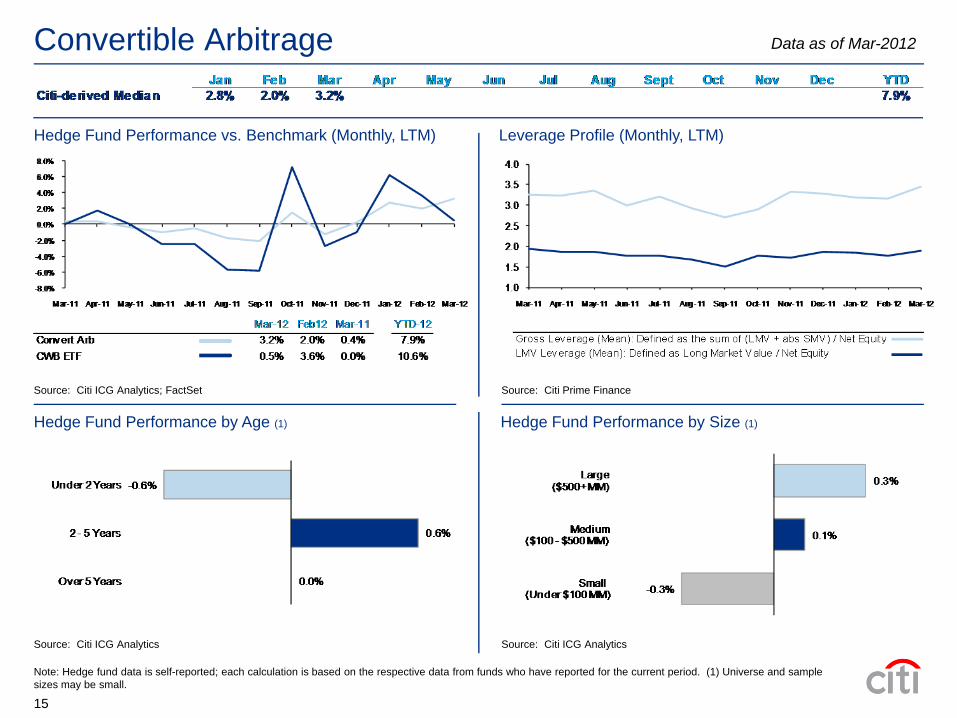
Convertible Arbitrage
Leverage Profile (Monthly, LTM)Hedge Fund Performance vs. Benchmark (Monthly, LTM)
Hedge Fund Performance by Age (1) Hedge Fund Performance by Size (1)
Source: Citi ICG Analytics Source: Citi ICG Analytics
Source: Citi ICG Analytics; FactSet Source: Citi Prime Finance
Note: Hedge fund data is self-reported; each calculation is based on the respective data from funds who have reported for the current period. (1) Universe and sample sizes may be small.

Data as of Mar-2012
16
CTA/Managed Futures
Hedge Fund Performance vs. Benchmark
Hedge Fund Performance by Age
Hedge Fund Performance by Size
Large Speculator Positions: CFTC Commitment Of Trader (Futures & Options) Report Net of Longs Less Shorts As Percent of Total Open Positions
Source: Citi ICG Analytics
Source: Citi ICG Analytics
Source: Citi ICG Analytics; FactSet
Source: CFTC, Bloomberg, Citi Futures Perspective
Note: Hedge fund data is self-reported; each calculation is based on the respective data from funds who have reported for the current period. (1) Universe and sample sizes may be small.
Combined S&P / Weighted Mini S&P Contracts U.S. 10-Year Treasury Futures
EuroFX Futures Gold Futures
Last Update: 3/27/12 -4.5%
Last Update: 3/27/12 -15.7%
Last Update: 3/27/12 -1.6%
Last Update: 3/27/12 +12.7%
Data as of Mar-2012
17
Dedicated Short Bias
Hedge Fund Performance by Age (1) Hedge Fund Performance by Size (1)
Source: Citi ICG Analytics Source: Citi ICG Analytics
Source: Citi ICG Analytics; FactSet Source: Citi Prime Finance
Leverage Profile (Monthly, LTM)Hedge Fund Performance vs. Benchmark (Monthly, LTM)
Note: Hedge fund data is self-reported; each calculation is based on the respective data from funds who have reported for the current period. (1) Universe and sample sizes may be small.
Data as of Mar-2012
18
Distressed
Hedge Fund Performance by Age (1) Hedge Fund Performance by Size (1)
Source: Citi ICG Analytics Source: Citi ICG Analytics
Source: Citi ICG Analytics; Citigroup Index LLC; Altman-NYU Salomon Center Source: Citi Prime Finance
Leverage Profile (Monthly, LTM)Hedge Fund Performance vs. Benchmark (Monthly, LTM)
Note: Hedge fund data is self-reported; each calculation is based on the respective data from funds who have reported for the current period. (1) Universe and sample sizes may be small.

Data as of Mar-2012
19
Emerging Markets
Hedge Fund Performance by Age Hedge Fund Performance by Size
Source: Citi ICG Analytics Source: Citi ICG Analytics
Source: Citi ICG Analytics; FactSet Source: Citi Prime Finance
Leverage Profile (Monthly, LTM)Hedge Fund Performance vs. Benchmark (Monthly, LTM)
Note: Hedge fund data is self-reported; each calculation is based on the respective data from funds who have reported for the current period. (1) Universe and sample sizes may be small.

Data as of Mar-2012
20
Equity Long/Short
Hedge Fund Performance by Age Hedge Fund Performance by Size
Source: Citi ICG Analytics Source: Citi ICG Analytics
Source: Citi ICG Analytics; FactSet Source: Citi Prime Finance
Leverage Profile (Monthly, LTM)Hedge Fund Performance vs. Benchmark (Monthly, LTM)
Note: Hedge fund data is self-reported; each calculation is based on the respective data from funds who have reported for the current period. (1) Universe and sample sizes may be small.
Data as of Mar-2012
21
Equity Market Neutral
Hedge Fund Performance by Age Hedge Fund Performance by Size
Source: Citi ICG Analytics Source: Citi ICG Analytics
Source: Citi ICG Analytics; FactSet Source: Citi Prime Finance
Leverage Profile (Monthly, LTM)Hedge Fund Performance vs. Benchmark (Monthly, LTM)
Note: Hedge fund data is self-reported; each calculation is based on the respective data from funds who have reported for the current period. (1) Universe and sample sizes may be small.

Data as of Mar-2012
22
Event Driven
Hedge Fund Performance by Age Hedge Fund Performance by Size
Source: Citi ICG Analytics Source: Citi ICG Analytics
Source: Citi ICG Analytics; FactSet Source: Citi Prime Finance
Leverage Profile (Monthly, LTM)Hedge Fund Performance vs. Benchmark (Monthly, LTM)
Note: Hedge fund data is self-reported; each calculation is based on the respective data from funds who have reported for the current period. (1) Universe and sample sizes may be small.
Data as of Mar-2012
23
FI Arbitrage
Source: Citi ICG Analytics Source: Citi ICG Analytics
Source: Citi ICG Analytics; Citigroup Index LLC Source: Citi Prime Finance
Leverage Profile (Monthly, LTM)Hedge Fund Performance vs. Benchmark (Monthly, LTM)
Hedge Fund Performance by Age Hedge Fund Performance by Size
Note: Hedge fund data is self-reported; each calculation is based on the respective data from funds who have reported for the current period. (1) Universe and sample sizes may be small.
Data as of Mar-2012
24
Global Macro
Hedge Fund Performance by Age Hedge Fund Performance by Size
Source: Citi ICG Analytics; FactSet; Citi Prime Finance Source: Citi ICG Analytics; FactSet; Citi Prime Finance
Source: Citi ICG Analytics; FactSet Source: Citi ICG Analytics; FactSet; Citi Prime Finance
Leverage Profile (Monthly, LTM)Hedge Fund Performance vs. Benchmark (Monthly, LTM)
Note: Hedge fund data is self-reported; each calculation is based on the respective data from funds who have reported for the current period. (1) Universe and sample sizes may be small.
Data as of Mar-2012
25
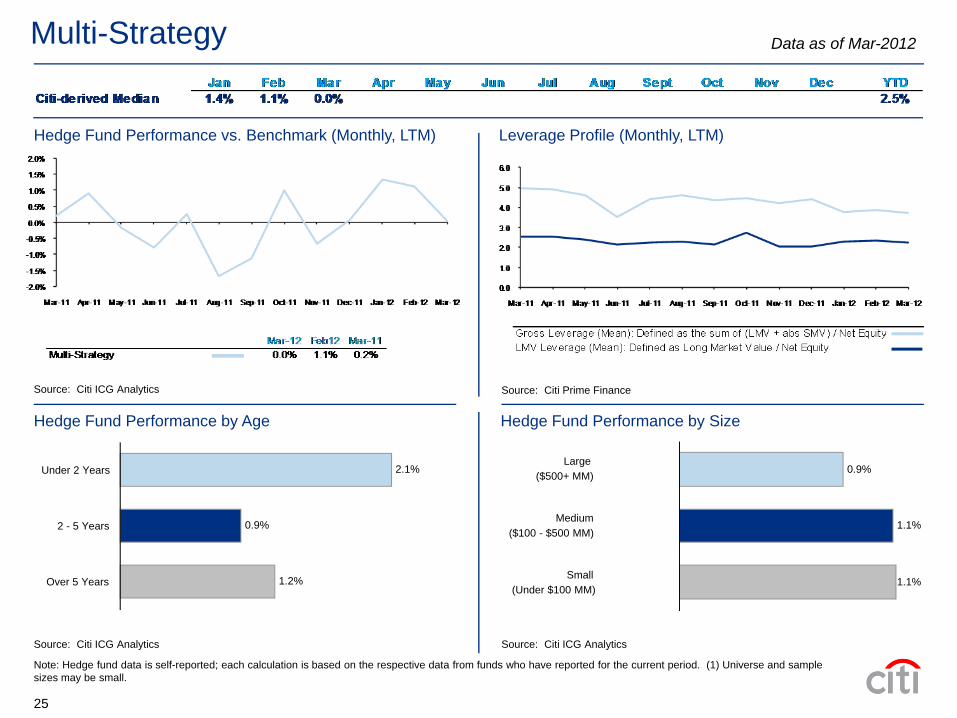
Multi-Strategy
Hedge Fund Performance by Age Hedge Fund Performance by Size
Source: Citi ICG Analytics Source: Citi ICG Analytics
Source: Citi ICG Analytics Source: Citi Prime Finance
Leverage Profile (Monthly, LTM)Hedge Fund Performance vs. Benchmark (Monthly, LTM)
Note: Hedge fund data is self-reported; each calculation is based on the respective data from funds who have reported for the current period. (1) Universe and sample sizes may be small.
2.1%
0.9%
1.2%
Under 2 Years
2 - 5 Years
Over 5 Years
0.9%
1.1%
1.1%
Large ($500+ MM)
Medium ($100 - $500 MM)
Small(Under $100 MM)

Data as of Mar-2012
26
This communication has been prepared by employees of Citi and is distributed by or through its locally authorized affiliates (collectively, the “Firm”). Employees preparing this communication are not Research Analysts and are not employees of Citi Investment Research (CIRA) and the information in this communication (the “Message”) is not intended to constitute “research” as that term is defined by applicable regulations. Any reference to a research report or research recommendation is not intended to represent the whole report and is not in itself considered a recommendation or research report. Please contact your Firm representative for a copy of a comprehensive research report. All views, opinions and estimates expressed in the Message constitute the author’s and/or the Firm’s judgment as of the date of the Message, may change without notice and may differ from those views, opinions and estimates expressed by other Firm personnel.
IRS Circular 230 Disclosure: Citigroup Inc. and its affiliates do not provide tax or legal advice. Any discussion of tax matters in these materials (i) is not intended or written to be used, and cannot be used or relied upon, by you for the purpose of avoiding any tax penalties and (ii) may have been written in connection with the “promotion or marketing” of any transaction contemplated hereby (“Transaction”). Accordingly, you should seek advice based on your particular circumstances from an independent tax advisor. The Message is provided for information and discussion purposes only and is not a representation or recommendation by the Firm. It does not constitute an offer or solicitation to purchase or sell any financial instruments, and does not take into account the investment objectives or financial situation of any particular person. Investors should obtain advice based on their own individual circumstances from their own tax, financial, legal and other advisors before making an investment decision, and only make such decisions on the basis of the investor’s own objectives, experience and resources. The information contained in the Message is based on generally available information and, although obtained from sources believed by the Firm to be reliable, its accuracy and completeness cannot be assured, and such information may be incomplete or condensed. Certain personnel or business areas of the Firm may have access to or may have acquired material non-public information that may have an impact (positive or negative) on the information contained in the Message, but that is not available to or known by the author of the Message.
The Firm may be the issuer of, may make a market in or may trade as principal in the financial instruments referred to in the Message or other related financial instruments. The Firm may perform or seek to perform investment banking and other services for the issuer of any such financial instruments. The author of the Message may have discussed the information contained therein with others within or outside the Firm and the author and/or such other Firm personnel may have already acted on the basis of this information (including by trading for the Firm’s proprietary accounts or communicating the information contained herein to other customers of the Firm). Compensation of Firm personnel may include consideration of the performance of such department’s activities.
The Firm, the Firm’s personnel (including those with whom the author may have consulted in the preparation of this communication), and other customers of the Firm may be long or short the financial instruments referred to in the Message, may have acquired such positions at prices and market conditions that are no longer available, may be a director or office of any company referenced herein and may have interests different from or adverse to your interests.
Investments in financial instruments carry significant risk, including the possible loss of the principal amount invested. Financial instruments denominated in a foreign currency are subject to exchange rate fluctuations, which may have an adverse effect on the price or value of an investment in such products. No liability is accepted by the Firm for any loss (whether direct, indirect or consequential) that may arise from any use of the information contained in or derived from the Message.
Unless otherwise indicated, the Message is not intended to forecast or predict future events. Past performance is not a guarantee or indication of future results. Any prices provided in the Message (other than those that are identified as being historical) are indicative only and do not represent firm quotes as to either price or size. You should contact your local representative directly if you are interested in buying or selling any financial instrument, or pursuing any trading strategy, mentioned herein.
Although the Firm is affiliated with Citibank, N.A. (together with its subsidiaries and branches worldwide, “Citibank”), you should be aware that none of the other financial instruments mentioned in the Message (unless expressly stated otherwise) are (i) insured by the Federal Deposit Insurance Corporation or any other governmental authority, or (ii) deposits or other obligations of, or guaranteed by, Citibank or any other insured depository institution.
The information in this Message may be confidential or otherwise protected by law. If you are not the intended recipient of the Message, please delete and do not disclose or make improper use of it, and promptly notify the sender. The Message contains data compilations, writings and information that are proprietary to the Firm and protected under copyright and other intellectual property laws, and may not be redistributed or otherwise transmitted by you to any other person for any purpose. Electronic messages are not necessarily secure or error-free and can contain viruses, and the sender is not liable for any of these occurrences. The Firm reserves the right to monitor, record and retain electronic messages.
We are required to obtain, verify and record certain information that identifies each entity that enters into a formal business relationship with us. We will ask for complete name, street address and tax payer ID number. We may also request corporate formation documents, or other forms of identification, to verify information provided.
Copyright © Citi 2010. All Rights Reserved. Citi and Citi Arc Design are trademarks and service marks of Citigroup Inc. or its affiliates and are used and registered throughout the world.
Firm Disclaimers and Market Commentary Disclosures
Data as of Mar-2012
27
This report has been prepared by members of Citi ICG Analytics and Prime Finance and is not a research report. This report does not constitute advice on investments or a solicitation to buy or sell any financial instrument. Please see Market Commentary Disclosures.
For further information, please contact:
Prime Finance: Mark Aldoroty, [email protected] 212-723-5640
Contacts