health workforce projections: tools for health workforce ... · health workforce projections: tools...
TRANSCRIPT

Health Workforce Projections: Tools for health workforce strategic
plan development
Nonglak Pagaiya, PhDSirindhorn College of Public Health, Khon Kaen
GHSA Meeting: 4‐year Workplan Development & Strengthening Workforce Development 7‐8 February 2017, Bangkok, Thailand
1

Why HRH is important?
Human Resources for Health (HRH), Health Workforce• skilled personal delivery• “HRH ” use other resources• “HRH ” critical factor for the health system• “HRH ” consume 60 – 80 % of the operational Budget
2

Presentation Topics
• Relationship of HRH and health service system• Principle of HRH Projection
– Information for HRH projection– Population ratio– Health Needs– Health Demand– Service Target
• HRH projection and HRH Planning
3

4
1. Relationship of HRH and health service system
Health NeedsDemographicDisease Burden
Epidemics
ContextGlobalization
Socio‐economic
NumberShortage
DistributionRural / UrbanPublic / PrivateGP / Specialist
Skill MixHealth team imbalance
MotivatedRemuneration
Non‐financial incentiveWorkplace safetyPatient relationship
Driving Forces Workforce Challenges
Accessible
Qualified
Cost‐effective
Responsive to needs
Services objectives
Health SystemPublic sector reform
TechnologyConsumer preference
Health NeedsDemographicDisease Burden
Epidemics
ContextGlobalization
Socio‐economic
Health SystemPublic sector reform
TechnologyConsumer preference
Health NeedsDemographicDisease Burden
Epidemics
ContextGlobalization
Socio‐economic
WHO 20064

5
1. Demographical transition Increase of elderly, decrease of childrenThailand: from 10.9 % in 2005 and to 15% in 2015 and to 23% in 2025
2. Disease burden Communicable diseases (CD)Increase of chronic: DM, HT, Heart disease
3. Epidemiological transitionEmergence of new diseases: AVIAN Flu, SARS, H1N1,
ZiKaAccident, Emergency & Disaster
Dynamic of Health Needs
5

6
1.Health Care Reform UHC implementation have changed service delivery system/
financial system/ HRH
In Thailand: service utilization increased after UHC 2. Public sector reform Public sector reform– reduce government staff
Decentralization to local authorities 3. Technology changes Improve communication channel
Require appropriate skill- skill substitutions4. Consumer expectation high expectation for quality of care
Dynamic of Health system
6

7
1.Globalization International trade: increase foreign patients to use services
in Thailand, increase 13.04 – 15.87% annually
Asian Community, FTA– Free flow of HRH and patients among countries Medical Hub Policy
2. Macroeconomic policy
Expand of private hospital: Thailand, beds increased from 7.4 % in 1973 to 20.2% in 2005
Other Contexts
7

What aspects of HRH should be prepared?• Right Number
– Adequate type and number of HRH• Right Distribution
– Equity distribution of HRH in relation to: • Rural VS Urban, • Level of Care (primary, secondary, tertiary, supra‐tertiary), • Public VS private• Prevention and curative care
• Right Skill mix– Appropriate skills related to population health needs– Health team balance, skill mix
• Motivated HRH– Retention, motivated to work– High productivity
8
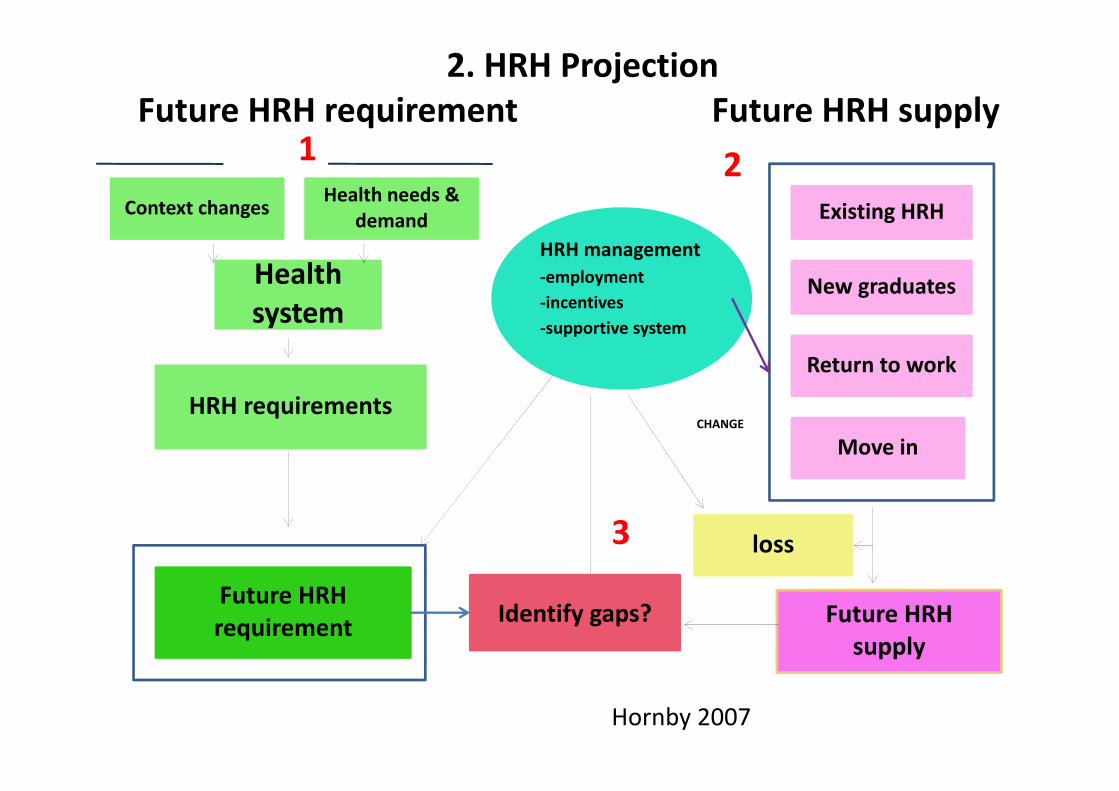
Context changes Health needs & demand
Health system
HRH requirements
HRH management‐employment‐incentives‐supportive system
Future HRH supply
Existing HRH
New graduates
Return to work
Move in
loss
CHANGE
Future HRH requirement Future HRH
supplyIdentify gaps?
Future HRH requirement2. HRH Projection
1 2
3
Hornby 2007

Plan (Project) long,
Act short,
Update often
Plan (Project) long,
Act short,
Update often
Principle of HRP :Principle of HRP :

HRH requirement
projection methods
• Population ratio• Health Needs
• Health Demand • Service Target

Information for HRH projection
• Projected Population• Economic situation and trend• Epidemiology information• Service utilization of both public and private sectors
12

Information for HRH projectionStaff norm• Standard of working hour in each country, i.e., in
Thailand-HRH work 230 days per year, and 6-8 hour per day
• Working hour per year is 1,680 hourProductivity• Outputs in relation to inputs, i.e., 360 pairs of shoes
produced by 12 workers– the average productivity of each worker is 30
• Physician can provide services at out patient department at about 7-12 minutes/ case

Productivity data sources
• Professional councils/ associations• Expert Opinion• Study• Mix of 3 approaches
14
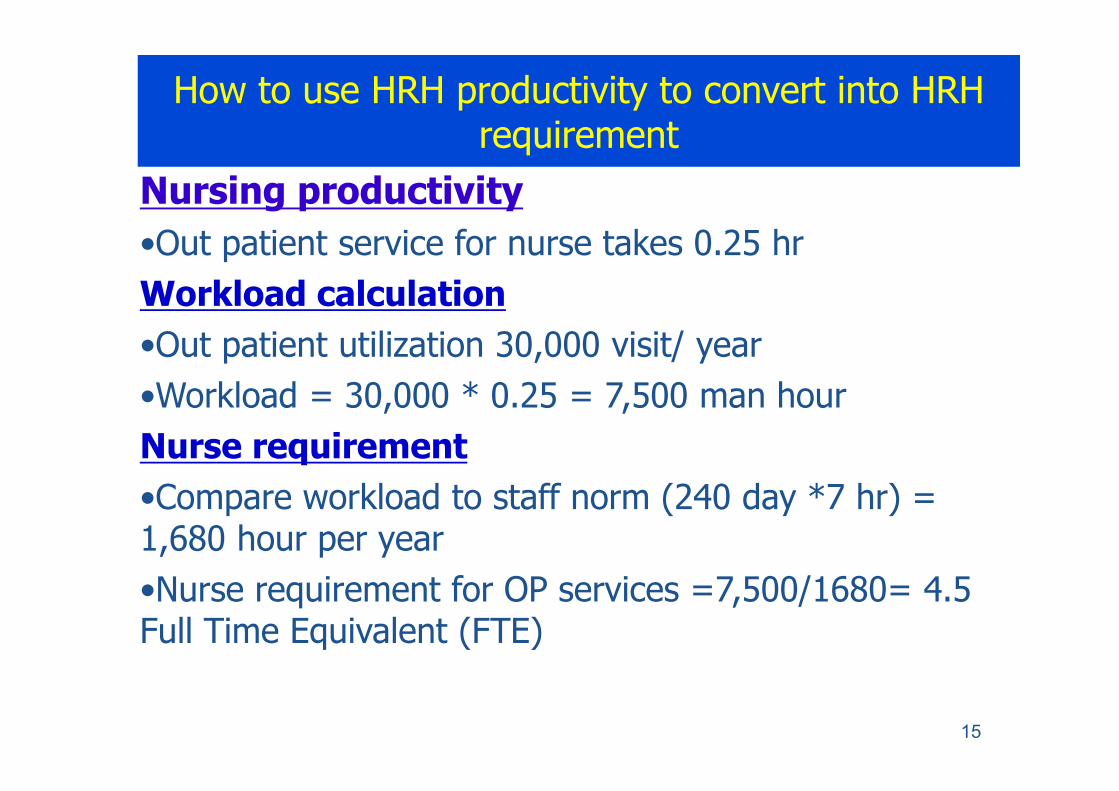
How to use HRH productivity to convert into HRH requirement
Nursing productivity•Out patient service for nurse takes 0.25 hrWorkload calculation•Out patient utilization 30,000 visit/ year•Workload = 30,000 * 0.25 = 7,500 man hourNurse requirement•Compare workload to staff norm (240 day *7 hr) = 1,680 hour per year•Nurse requirement for OP services =7,500/1680= 4.5 Full Time Equivalent (FTE)
15

2.1 Population ratio method.
Demographic trend National Planning Board
International comparison Ratio in favored areas Recommended standard (bench mark) Past trends Expert opinions
AffordabilityDemand
Projectedfuture population
CurrentPopulation
Projected futureHRH
requirement
Required futureHRH/population
ratio
CurrentHRH/population
ratio
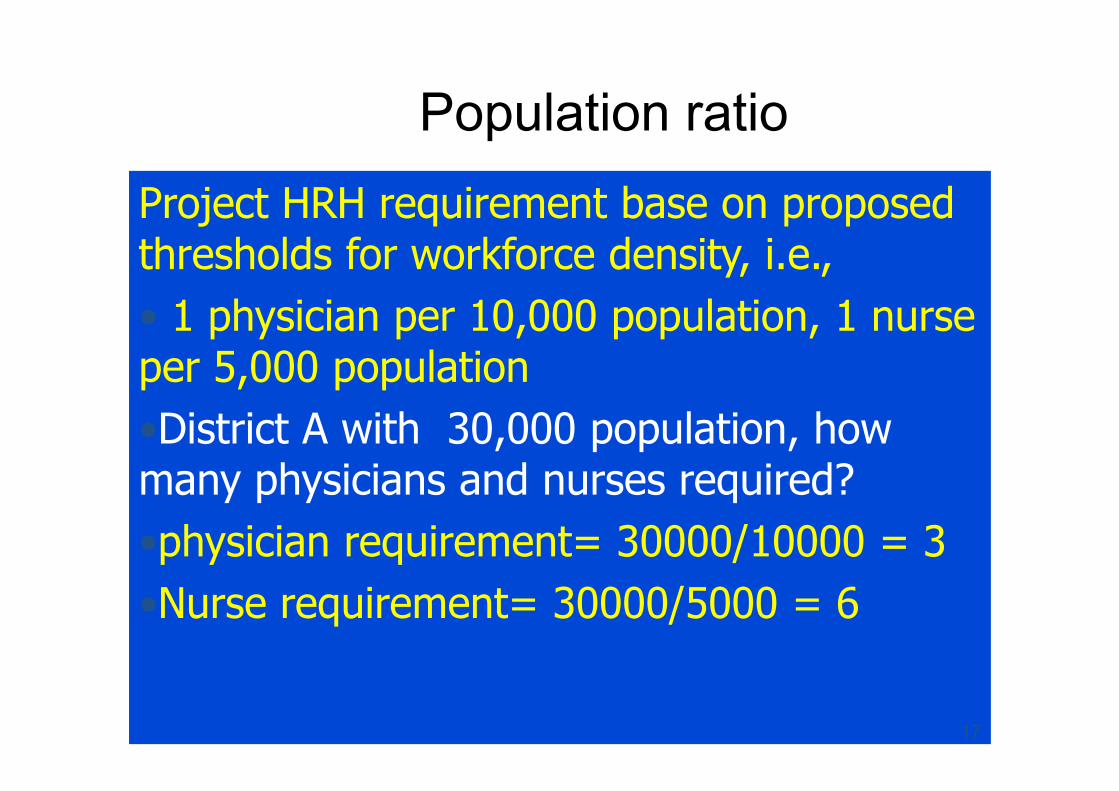
Population ratioProject HRH requirement base on proposed thresholds for workforce density, i.e., • 1 physician per 10,000 population, 1 nurse per 5,000 population•District A with 30,000 population, how many physicians and nurses required? •physician requirement= 30000/10000 = 3•Nurse requirement= 30000/5000 = 6
17

18
Population ratio
• Strengths– For stable health system and all people access to care– Simple and require less data – population growth and
standard population ratio• Weakness
– Individual cadre projection, lack of teamwork or skill mix projection
– Does not address other key factors– Limitations to solve distribution problems– Homogeneity of HRH productivity and population
health needs
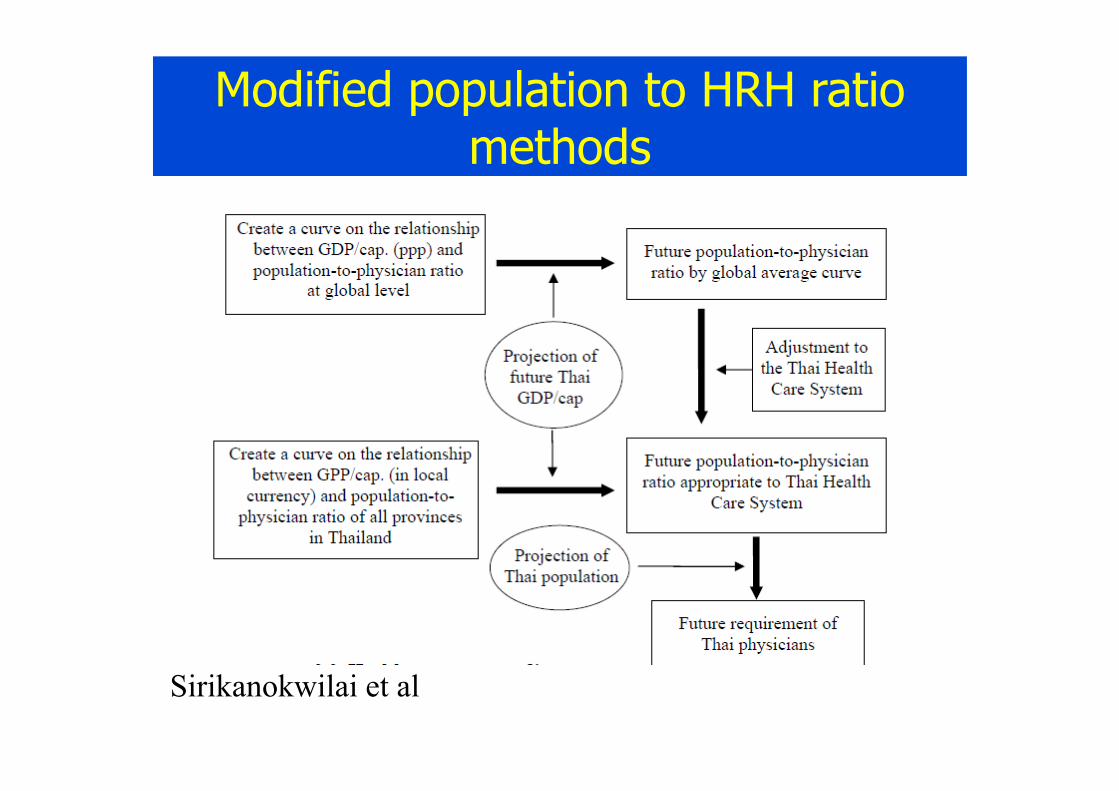
Modified population to HRH ratio methods
Sirikanokwilai et al
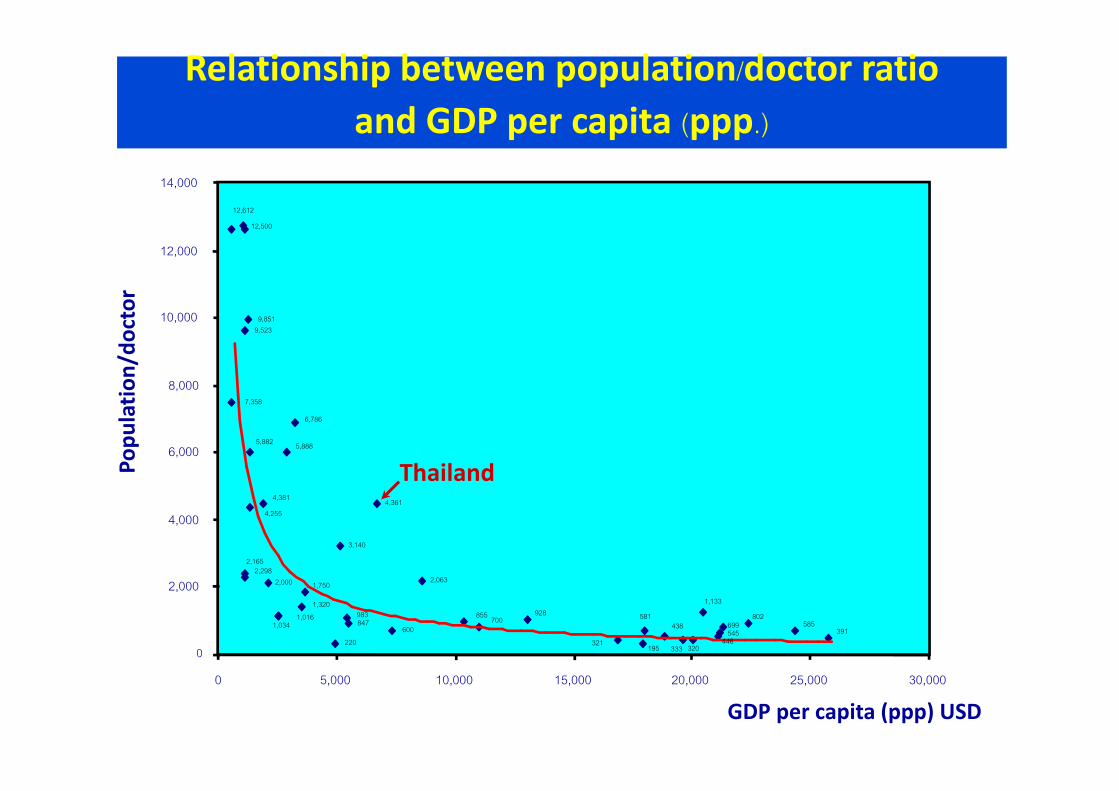
Relationship between population/doctor ratioand GDP per capita (ppp.)
7,358
12,612
2,298
9,523
2,165
12,500
9,851
4,255
5,882
4,381
2,000
1,0161,034
5,888
6,786
1,320
1,750
220
3,140
983847
4,361
600
2,063
855700
928
321195
581438
320333
1,133
446545699
802585
391
0
2,000
4,000
6,000
8,000
10,000
12,000
14,000
0 5,000 10,000 15,000 20,000 25,000 30,000
GDP per capita (ppp) USD
Popu
latio
n/do
ctor
Thailand
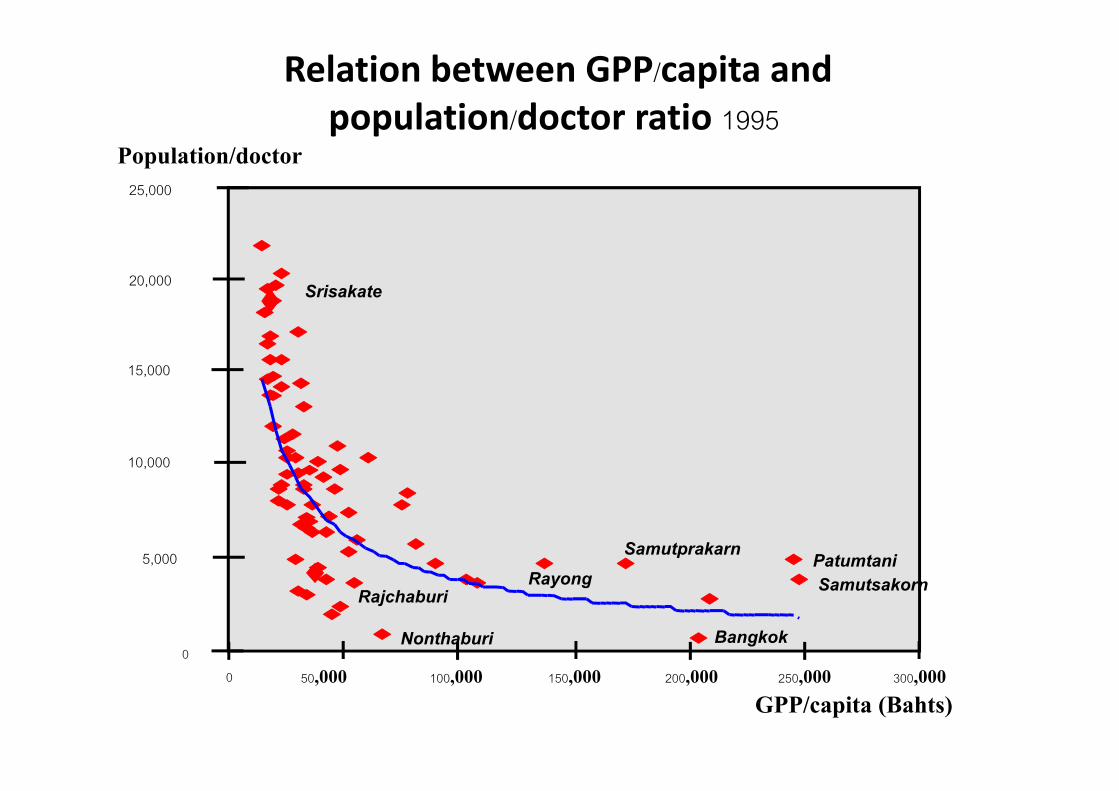
Relation between GPP/capita andpopulation/doctor ratio 1995
5,000
10,000
15,000
20,000
25,000
Nonthaburi
Rajchaburi
PatumtaniSamutsakorn
SamutprakarnRayong
50,000 100,000 150,000 200,000 250,000 300,0000
GPP/capita (Bahts)
Srisakate
0
Population/doctor
Bangkok

2.2 Health needs methods2.2 Health needs methods
Expertopinions
Health needs(Epidemiological
information)
Kind, quality, frequency, numberof services needed to reach a standard of good health care.
• Affordability• Demand
Service targets
Productivitynorms
HRH/population
Total HRHrequired
Cadre mixes and time requiredby each cadre to perform
the services

Health Need Method
• Use epidemiological data, health problem and professional judgment to design service provision
• Use “staff norm and productivity” convert into HRH requirement, for example dental health services
23
Health problem services Target HRH
Adult 50%-out patients-prevention service
30% DentistDental nurse
Children 80%-out patients-prevention service
50% DentistDental nurse

Health Needs method
• Strength– Comprehensive health services and HRH requirement cover curative, promotion, protection and rehabilitation services
– Facilitate skill mix approach• Weakness
– Require accurate health information system– Need technical support in HRH projection– Trend to rely on professional judgment
24
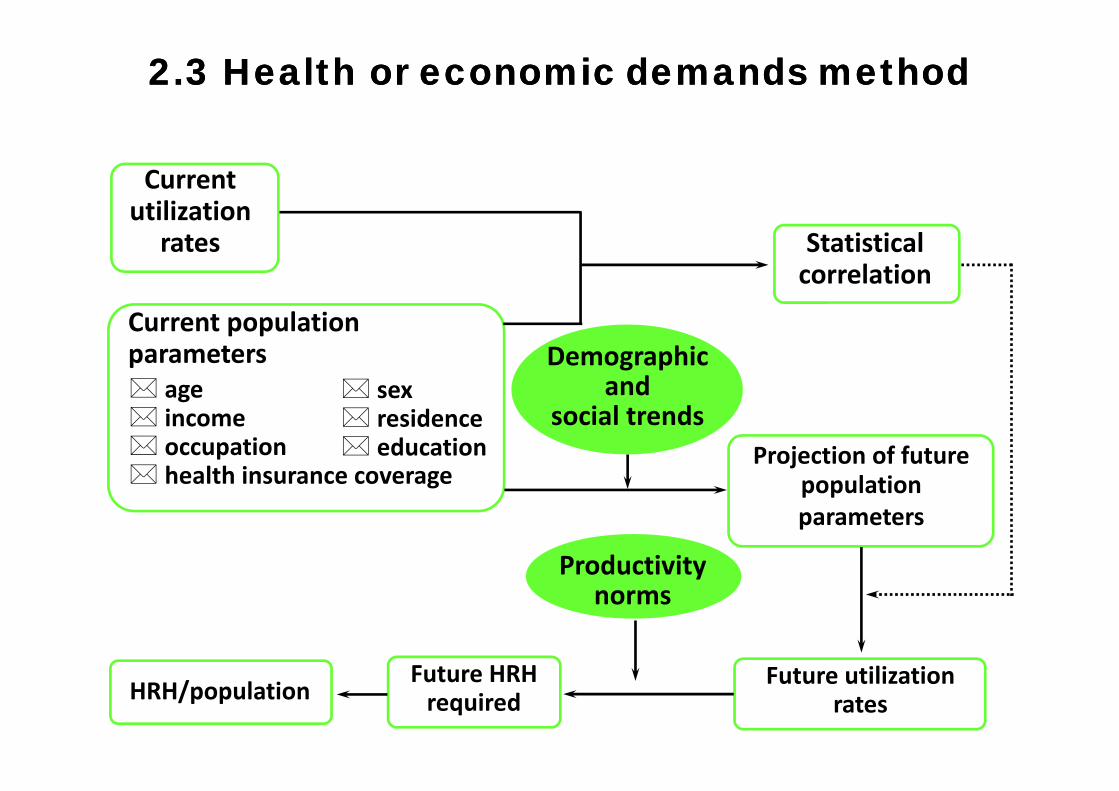
2.3 Health or economic demands method2.3 Health or economic demands method
Currentutilization
rates
Demographic and
social trends
Productivitynorms
HRH/population Future utilizationrates
Future HRHrequired
Projection of future populationparameters
Current populationparameters age income occupation health insurance coverage
sex residence education
Statisticalcorrelation
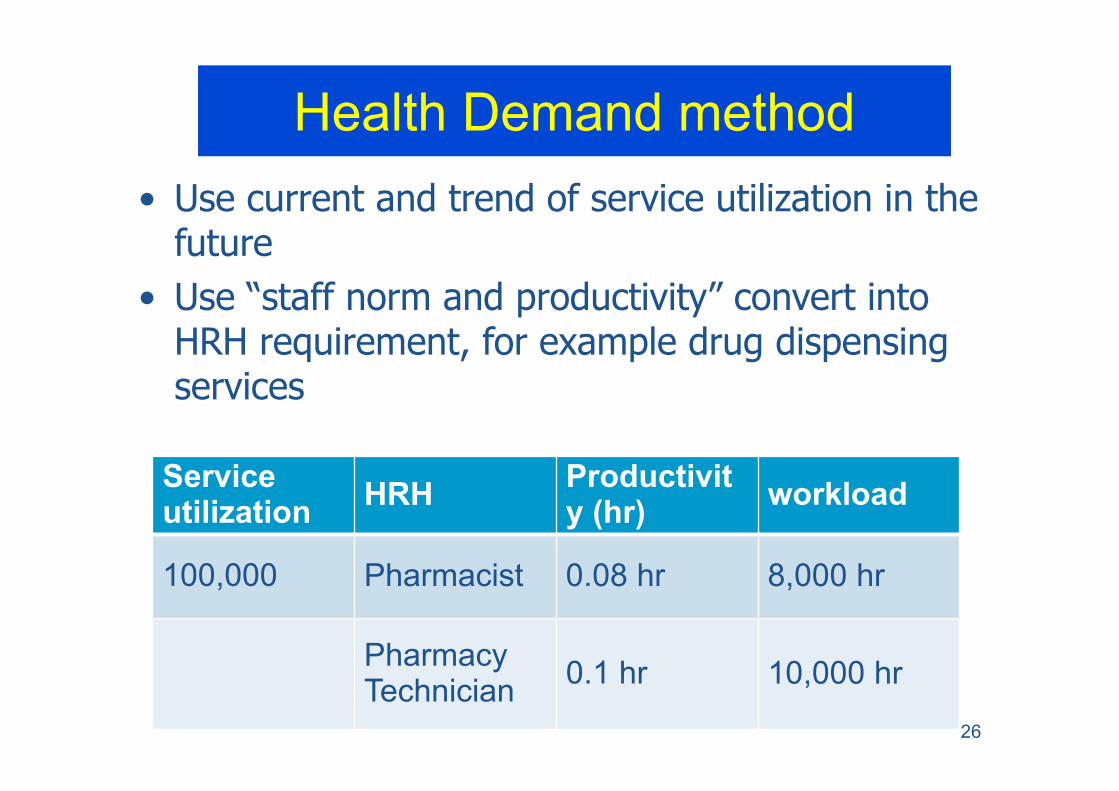
Health Demand method• Use current and trend of service utilization in the
future• Use “staff norm and productivity” convert into
HRH requirement, for example drug dispensing services
26
Service utilization HRH Productivit
y (hr) workload
100,000 Pharmacist 0.08 hr 8,000 hr
Pharmacy Technician 0.1 hr 10,000 hr

Health Demand
• Strength– For stable health system and all people access to care– For private‐dominated health system
• Weakness– Curative‐oriented approach– requires consideration of multiple variables– Require accurate health information system– Need technical support in HRH projection– Limit to use in country with inequity access to care/ capacity to pay
27

Expert opinion Planners
Healthauthority
Past trends Health needs Economic demands Development of the delivery system
Productivitynorms
Staffingstandards
Service targets Health services facilities development targets
Total HRH requiredHRH/population
2.4 Service targets method
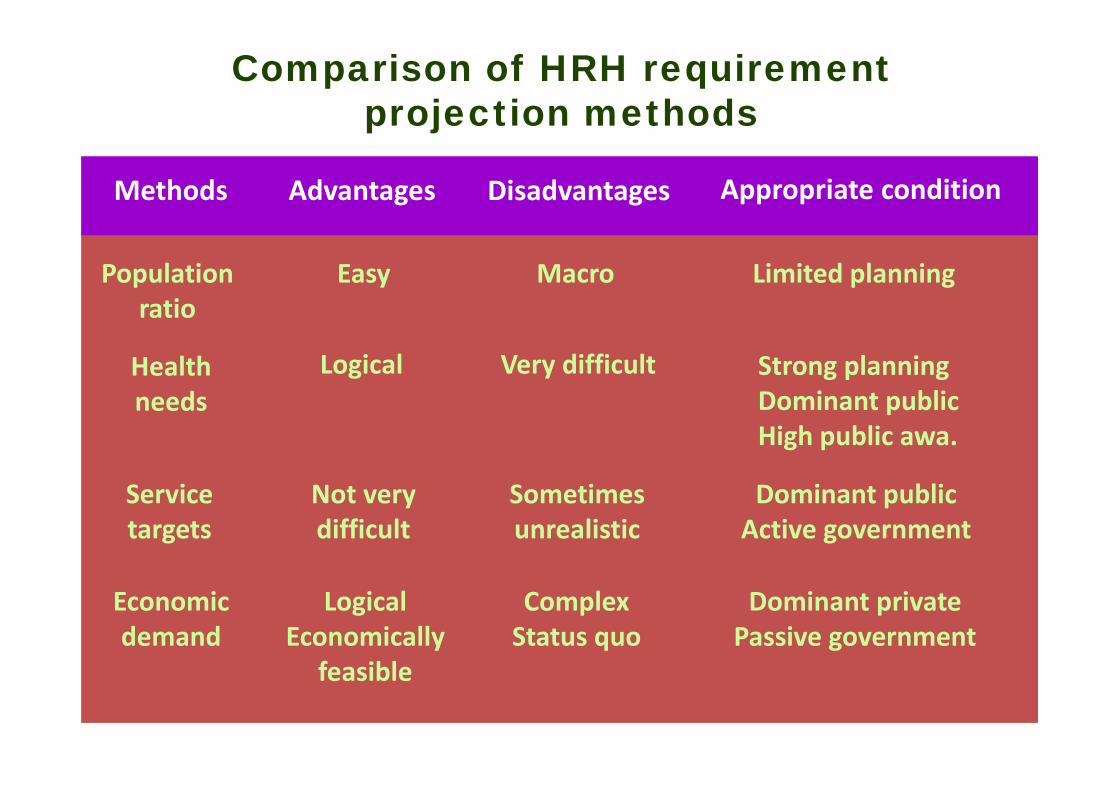
Comparison of HRH requirementprojection methods
Methods Advantages Disadvantages Appropriate condition
Populationratio
Easy Macro Limited planning
Healthneeds
Logical Very difficult Strong planningDominant publicHigh public awa.
Servicetargets
Not verydifficult
Sometimesunrealistic
Dominant publicActive government
Economicdemand
LogicalEconomically
feasible
ComplexStatus quo
Dominant privatePassive government

3. HRH Projection lead to HRH Planning
30
Future HRH requirement Future HRH
supplyIdentify gaps?
Measures to redress gaps

Policy Levers to shape HWF labor market
Source: Sousa et al 2013 31