new 2025 physician workforce projections · new 2025 physician workforce projections ... supply and...
TRANSCRIPT

Atul Grover, M.D., Ph.D.March 25, 2015
New 2025 Physician
Workforce Projections
Congressional Staff Briefing

© 2015 AAMC. May not be reproduced without permission.
AAMC: Med. Schools, Hospitals, MDs
Membership includes:
• 141 U.S. medical schools (MD programs)
Nearly 300 major teaching hospitals
Each = 4+ approved/active residency programs
• 41 Department of Veterans Affairs medical centers
• 93 Academic and scientific societies
Over 300,000 “voices”:
• 128,000 faculty members
Faculty in basic science and clinical departments
Staff of physician practice groups and hospitals
• 86,000 medical students and 110,000 residents
2

© 2015 AAMC. May not be reproduced without permission.
Extraordinary clinical care• COTH hospitals comprise only 5% of all hospitals but account for:
37% of charity care
23% of all hospital care
25% of all Medicaid in-patient days
20% of all Medicare in-patient days
• 88,577 full-time MDs work in medical school clinical departments
Cutting edge research• Over half of NIH Extramural Research Awards go to an AAMC medical
school and/or teaching hospital
Education and training
• 74% of all residents train at an AAMC hospital
AAMC Hospitals’ 3-Part Mission Advances Health
3

© 2015 AAMC. May not be reproduced without permission.
AAMC Has Commissioned New Physician Workforce Projections
Overview
• Workforce Projections
• The “Match”
• Federal Programs
4
New Projections Released
to Public on March 3;
Available at www.aamc.org

© 2015 AAMC. May not be reproduced without permission.
5
New Physician Workforce Projections:
Continued Shortages

© 2015 AAMC. May not be reproduced without permission.
Indicators of Physician Shortages
Longer waiting times for an appointment
Both primary care and specialists
Most vulnerable – low income, complex patients
Backlog of unfilled positions for doctors – e.g.:
19% of WY population lives in underserved area
31% of MS population
25% of DC population
Classic example: VA waiting time delays
Many vets waited months. Health worsened.
Thousands of unfilled physician vacancies: In Oct. 70% of VA physician vacancies = specialists
Source: http://hrc.nwlc.org/status-indicators/people-medically-underserved-areas
6

© 2015 AAMC. May not be reproduced without permission.
In October, 70% of VA Physician Vacancies = Specialists
Source: AAMC Analysis of Job Postings from VA Physician
Careers Website, October 27 – 31, 2014
http://www.vacareers.va.gov/careers/physicians/index.asp
25%
70%
Percent of VA Physician Vacancies
Prim. Care
Specialists
Other
5%
Other = Non-Care
Givers
7

© 2015 AAMC. May not be reproduced without permission.
Highlights of Findings: Demand Is Growing Faster Than Supply
Continued Shortages for All Physicians
• All scenarios project continued shortages of total physician workforce in 2025
Shortages under Multiple, Different Scenarios
• Scenarios: Demographic, physician work hours and retirement, APRN, retail clinics
• Biggest factor: Demographics – aging Boomers
• Biggest shortages: surgical specialties
8

© 2015 AAMC. May not be reproduced without permission.
In Sum: New, National* Physician
Workforce Projections for 2025
9
Primary Care: 12,500 – 31,100
Specialty Care: 28,200 – 63,700**• Med specialists – 5,100 – 12,300
• Surg specialists – 23,100 – 31,600
• Other specialists – 2,400 – 20,200
All Physicians: 46,100 – 90,400**
* The study did not address regional and local shortages, only national
** Projections don’t add up because of microsimulation model used

© 2015 AAMC. May not be reproduced without permission.
Findings: What the Graphs Will Show YouP
hys
icia
ns
Time
Solid line = Demand
Dotted line = Supply
10

© 2015 AAMC. May not be reproduced without permission.
2025 Projections
All Physicians
Findings: Demand Is Growing Faster
than Supply
11

© 2015 AAMC. May not be reproduced without permission.
Supply Versus Demand: All Physicians
700,000
750,000
800,000
850,000
900,000
950,000
2013 2014 2015 2016 2017 2018 2019 2020 2021 2022 2023 2024 2025
Full
Tim
e E
qu
ival
en
t P
hys
icia
ns
Year
Demand (ACA + MC)
Demand (ACA)
Demand (ACA + RetailClinics)Demand (Demographics)
Demand (APRN Moderate)
Demand (APRN High)
Supply (Retire Later +2)
Supply (GME Growth)
Supply (Status Quo)
Supply (Millennial Hours)
Supply (Retire Earlier -2)
12

© 2015 AAMC. May not be reproduced without permission.
All Physician Shortage Summary
90,400
46,100
110,500
3,200 -
20,000
40,000
60,000
80,000
100,000
120,000
2013 2014 2015 2016 2017 2018 2019 2020 2021 2022 2023 2024 2025
Pro
ject
ed
Sh
ort
fall
of
Ph
ysic
ian
s
Year
2015Range
13

© 2015 AAMC. May not be reproduced without permission.
All Physicians: Continued Shortages in 2025
New Projections for 2025:
46,100 – 90,400 Shortage
14

© 2015 AAMC. May not be reproduced without permission.
2025 Projections
Primary Care
Physicians
Findings: Demand Is Growing Faster
than Supply
15

Primary Care Physician Shortage Summary
31,100
12,500
44,900
(4,800)
(10,000)
-
10,000
20,000
30,000
40,000
50,000
2013 2014 2015 2016 2017 2018 2019 2020 2021 2022 2023 2024 2025
Pro
ject
ed
Sh
ort
fall
of
Ph
ysic
ian
s
Year
2015Range
16

© 2015 AAMC. May not be reproduced without permission.
Primary Care: Continued Shortages in 2025
New Projections for 2025:
12,500 – 31,100 Shortage
17

© 2015 AAMC. May not be reproduced without permission.
2025 Projections
“Med/Surg”
Specialties
Findings: Demand Is Growing Faster
than Supply
18

“Med/Surg” Specialty Shortage Summary
63,700
28,200
70,200
8,000
-
10,000
20,000
30,000
40,000
50,000
60,000
70,000
80,000
2013 2014 2015 2016 2017 2018 2019 2020 2021 2022 2023 2024 2025
Pro
ject
ed
Sh
ort
fall
of
Ph
ysic
ian
s
Year
2015Range
19

© 2015 AAMC. May not be reproduced without permission.
New Projections for 2025:
28,200 – 63,700 Shortage
“Med/Surg Specialties:” Cont’d. Shortages
20

© 2015 AAMC. May not be reproduced without permission.
Projected Med/Surg Shortage Larger Than Projected Primary Care Shortage
12,500
28,20031,100
63,700
0
10,000
20,000
30,000
40,000
50,000
60,000
70,000
Primary Care Range Med/Surg Specialty Range
Ranges of Projected Physician Shortages in Year 2025
Low End of Range High End of Range21

© 2015 AAMC. May not be reproduced without permission.
Explanations
22

Why a Physician Shortage? Demand Is Growing Faster than Supply
• Many factors, but demographics = biggest
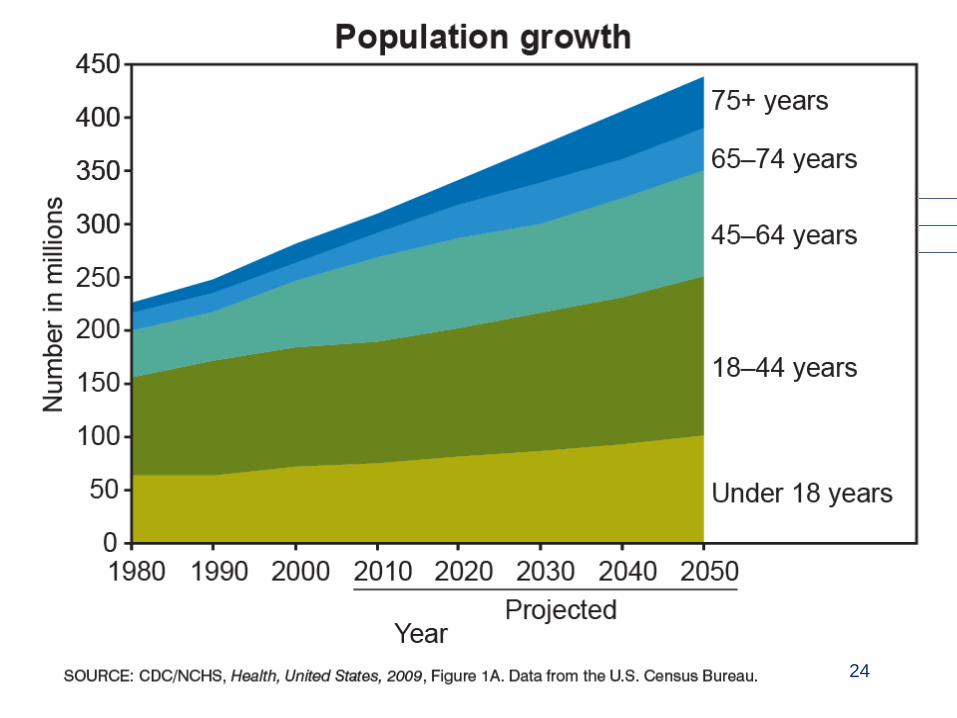
• The population is growing larger, older
The elderly have greater health care needs, particularly specialty care
46% projected growth in elderly; 5% for young
Medicine keeps more people alive longer; living quality lives, but with more illnesses
Over next 20 years, 36 million people added to Medicare (using most services) ~ 20% population
• Even the best prevention will not eliminate disease but, rather, delay it
23
24

A Growing, Aging Population Matters
25HHS/HRSA The Physician Workforce: Projections and Research into Current Issues Affecting
Supply and Demand, December 2008 at http://bhpr.hrsa.gov/healthworkforce/reports/physwfissues.pdf
Physician utilization/100,000 people by age
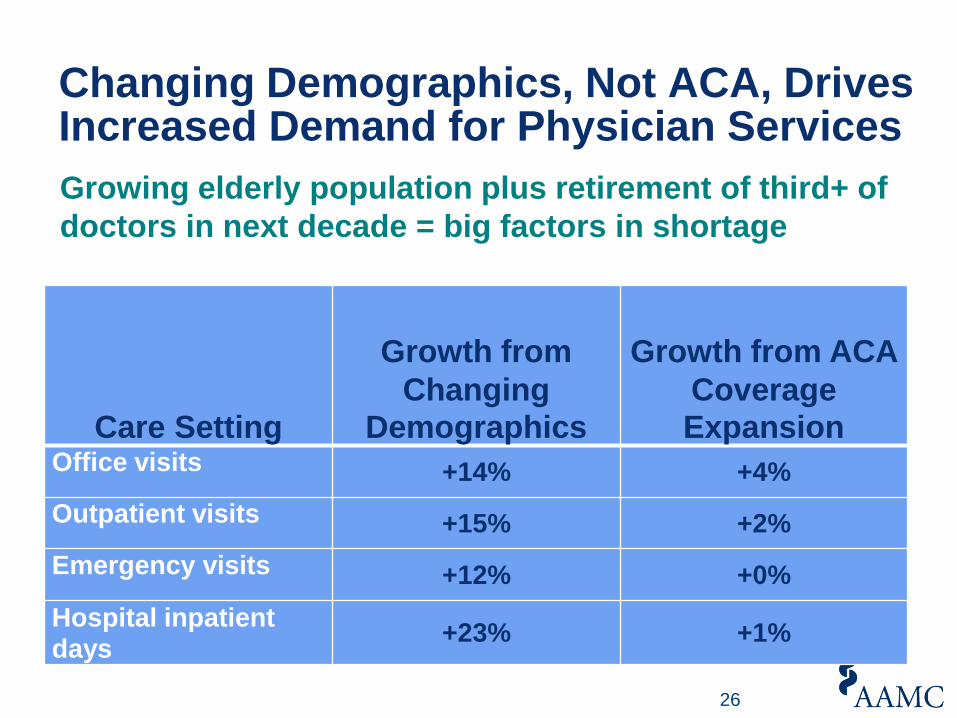
Care Setting
Growth from
Changing Demographics
Growth from ACA
Coverage Expansion
Office visits +14% +4%
Outpatient visits +15% +2%
Emergency visits +12% +0%
Hospital inpatient days
+23% +1%
Changing Demographics, Not ACA, Drives Increased Demand for Physician Services
26
Growing elderly population plus retirement of third+ of
doctors in next decade = big factors in shortage

Why a Physician Shortage? Supply Not Likely to Keep Pace with Demand
• Number of physicians per capita will decrease in next decade if we don’t train more
• Number of hours /week worked = big difference
Older physicians work longer hours than younger “Millennials” – Will that continue?
• Age of retirement also a big factor
36% of doctors now = age 55+
Most will retire in the next decade
But will they retire sooner or later – even a year or 2 delay makes a big difference to future supply
27

© 2015 AAMC. May not be reproduced without permission. 28
The “Match” in 2015

Why a Physician Shortage? Another Factor Is Too Few Residency Slots
“Match Day” Illustrates
How this Works
Imagine you are someone who wants to be a
practicing doctor…
29

What Does It Take to Become a Doctor?Years and years of learning and assessment
4 years + 4 years + 3 to 7+ years Life-long
In between med school and residency is the “Match”…
30

© 2014 AAMC. May not be reproduced without permission.
Before a Med School Grad Can Practice, She or He Must Undergo Residency Training…
• To get a residency, MD school grads and many DO school grads apply through the “Match”
• The “Match” is a computerized system that matches applicants with residency programs
• The results are announced one day each March – “Match Day.” This year it was March 20.
• BUT…
31

© 2014 AAMC. May not be reproduced without permission.
BUT Many MD, DO School Grads Don’t Match in First Round
• Just because a student successfully graduates doesn’t mean she or he will be matched.
• On Match Day 2015, over 1,700 new MD, DO grads were not matched
• Thousands more also didn’t initially match:
858 previous years’ MD grads of US schools
2,354 US MD grads of overseas schools
3,725 non-US grads of overseas schools
• Many match in 2nd round called SOAP* – but many others remain without a residency
Source: NRMP *SOAP results not released until April
32

© 2014 AAMC. May not be reproduced without permission.
Active Physicians by Specialty - Primary Care Overshadows Specialists: 2014 Picture
All Primary Care Physicians > 350,000
Source: AAMC Center for Workforce Studies
33

© 2014 AAMC. May not be reproduced without permission.
Primary Care Continues to Over Shadow Specialties in Match: 2015 Picture
In 2015 Match, 27,293 residencies = offered nationwide. Potential primary care residencies = 46.3%.
• Family medicine: 3,195
• Internal medicine: 6,770
• Pediatrics: 2,668
Total: 12,633 = potential primary care = 46.3% of all residencies offered
In contrast:*
• Child neurology – 104 residencies offered = 0.38% of all offered
• Thoracic surgery – 35 residencies offered = 0.13% of all offered
• Dermatology – 22 residencies offered = 0.08% of all offered
Source: NRMP * = PGY-1 positions 34

Why a Shortage of Residency Slots for MD, DO School Graduates on Match Day?
In response to physician shortage projections more than 10 years ago…
• MD, DO schools began increasing number of students admitted – med school entrants to increase 30% by 2018
But since 1997 Medicare caps # of residencies at each hospital for which it will pay part of GME costs
• Cap = 1996 level - that has limited growth in residencies
We have # of MD, DO school grads…
• But growth in residency slots is not keeping pace
35

© 2015 AAMC. May not be reproduced without permission. 36
Federal Program Recommendations

© 2015 AAMC. May not be reproduced without permission.
Medicare GME Payments 101
1. Direct Graduate Medical Education (DGME)Payments—Resident Training
Partially “reimburse[s] teaching hospitals for Medicare’s share of the costs of salaries and fringe benefits paid to residents, interns, and teaching faculty, and certain overhead costs relating to teaching activities.” U.S. Congress, 1999
2. Indirect Medical Education (IME) Payments—Patient Care
Percentage add-on reimbursement to the basic per-case (MS-DRG) payment paid to teaching hospitals
Since 1997, Medicare DGME and IME support capped at 1996 levels.
37

© 2015 AAMC. May not be reproduced without permission.
Medicare Only Covered 20% of All DGME Costs of Teaching Hospitals in FY 2012
Teaching Hospital DGME CostsFY 2012
Medicare Payments DGME Costs Absorbed by Hospitals
$3.3 billion in Medicare
Payments
$12.9 billion DGME
Costs Absorbed by Hospitals
Total DGME
Costs =
$16.2 billion
38
© 2015 AAMC. May not be reproduced without permission.
• Despite cap on Medicare GME, the law permits creation of new teaching hospitals
They can have new residency slots and receive Medicare GME support
AAMC helps hospitals explore becoming teaching
• But few hospitals decide to become teaching hospitals, because the costs are prohibitive
Even with Medicare GME payments most states have few teaching hospitals
How Do We Avoid a Doc Shortage in 2025, and Make Sure Med Grads Get Residencies Today?
39

© 2015 AAMC. May not be reproduced without permission.
Major Teaching Hospitals = 5% of All Hospitals
Examples – major teaching hospitals % of all hospitals, varies by state:
• Kansas – 0.6%• Texas – 2%• Colorado – 2%VS• Mass. – 15%• New York – 25%• Wash., DC – 31%
S
The law does permit
hospitals to become
new teaching hospitals:
AAMC has prepared
guide to help them
There is another way to
see these numbers…
40

© 2015 AAMC. May not be reproduced without permission.
Another Way to See How Few Hospitals = Teaching Hospitals
602 15597
108219
6240
59 818
3294
1102
NUMBER OF ALL TEACHING HOSPITALS COMPARED TO ALL HOSPITALS BY STATE AND
USA IN FY 2012All Hospitals Teaching Hospitals
41

© 2015 AAMC. May not be reproduced without permission.
42
Percent of Hospitals in Each State = Teaching

© 2015 AAMC. May not be reproduced without permission.
AAMC recommends a comprehensive strategy:
• Promote innovations in health care delivery – new ways to deliver care – team-based care, technology, etc.
• Increase residency slots Medicare will support
• Lift Medicare GME cap modestly
• Help hospitals that want to become teaching
• Champion accountability for use of GME funds
• Strengthen federal investment in programs such as NHSC and Title VII that address maldistribution in rural, poor, underserved areas
How Do We Avoid a Doc Shortage in 2025, and Make Sure Grads Get Residencies Today?
43

© 2015 AAMC. May not be reproduced without permission.
Innovation in Care Delivery
• AMCs = leaders in exploring models of delivery of care at local, regional, national levels More health professionals, more teamwork, more
reimbursement reform, more technology
• AMCs = leaders in CMMI awards 45% of Health Care Innovation Award grantees
34% of the Innovation Advisors Program
18% of all CMS Accountable Care Organizations (ACOs)
38% of Pioneer ACOs
17% of Medicare Shared Savings Program participants
• AMCs = 2/3 of awardees receiving PCORI funds
• Goal is high quality, cost effective care in which all providers work at the top of their training
44

© 2015 AAMC. May not be reproduced without permission.
Raise # of residency slots Medicare will support
• Lift 1997 cap on number residents for which a hospital can receive Medicare GME payment- 3,000/year/5 years
Bipartisan legislation to be introduced this spring
• Provide technical assistance to hospitals exploring the option to become a teaching hospital
AAMC has updated handbook, provides staff assistance
• Champion add’l. accountability for use of GME payments
Establish Medicare IME Performance Adjustment Program – reward performance
Require HHS Secretary to publish annual report on use of Medicare GME payments
45
Modest Increase in Residency Slots

© 2015 AAMC. May not be reproduced without permission.
National Health Service Corps (NHSC)
There are shortages of doctors in low-income, rural/urban areas - medically underserved areas
NHSC provides loan repayment to physicians who go to underserved areas after residency
• Also scholarships to students
Program proven to address maldistribution of docs
• 55% of NHSC clinicians stay in underserved areas at least 10 years
NHSC Stakeholders Coalition, including AAMC, recommends $287.4 million discretionary appropriation for FY 2016
46

© 2015 AAMC. May not be reproduced without permission.
Title VII Funding for Health Professionals
Title VII of PHSA helps address geographic distribution and specialty shortages by authorizing grants for education and training:
• Workforce supply, including primary care and interdisciplinary educational opportunities
• Workforce distribution, including training opportunities in rural and underserved settings
• Workforce diversity, including recruitment, retention, and faculty development
AAMC joins Reps. Burgess, DeGette & Sen. Jack Reed to recommend $280 million for Title VII in FY 2016.
Separately AAMC recommends $300 million for CHGME.
47

© 2015 AAMC. May not be reproduced without permission.48
In the End, This Is What It’s All About…

© 2015 AAMC. May not be reproduced without permission. 49
Before Q&A, a few words about…
• The Congressional Academic Medicine Caucus
• George Washington University Medical
Center’s PME – April 9
• Packets for New Member Offices
© 2015 AAMC. May not be reproduced without permission.
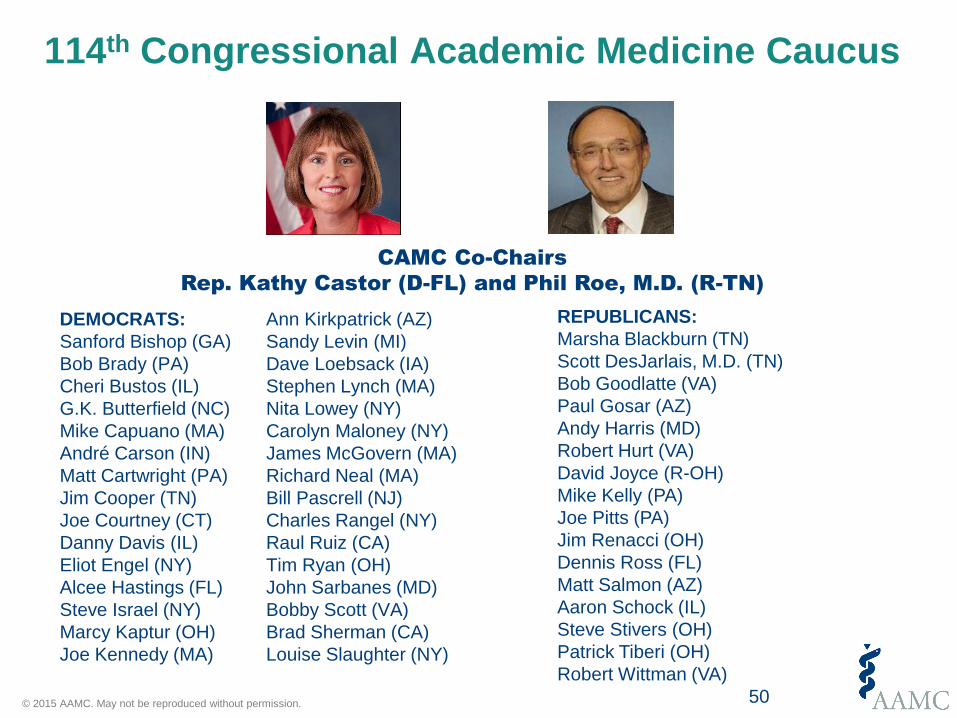
114th Congressional Academic Medicine Caucus
CAMC Co-Chairs
Rep. Kathy Castor (D-FL) and Phil Roe, M.D. (R-TN)
DEMOCRATS:
Sanford Bishop (GA)
Bob Brady (PA)
Cheri Bustos (IL)
G.K. Butterfield (NC)
Mike Capuano (MA)
André Carson (IN)
Matt Cartwright (PA)
Jim Cooper (TN)
Joe Courtney (CT)
Danny Davis (IL)
Eliot Engel (NY)
Alcee Hastings (FL)
Steve Israel (NY)
Marcy Kaptur (OH)
Joe Kennedy (MA)
Ann Kirkpatrick (AZ)
Sandy Levin (MI)
Dave Loebsack (IA)
Stephen Lynch (MA)
Nita Lowey (NY)
Carolyn Maloney (NY)
James McGovern (MA)
Richard Neal (MA)
Bill Pascrell (NJ)
Charles Rangel (NY)
Raul Ruiz (CA)
Tim Ryan (OH)
John Sarbanes (MD)
Bobby Scott (VA)
Brad Sherman (CA)
Louise Slaughter (NY)
REPUBLICANS:
Marsha Blackburn (TN)
Scott DesJarlais, M.D. (TN)
Bob Goodlatte (VA)
Paul Gosar (AZ)
Andy Harris (MD)
Robert Hurt (VA)
David Joyce (R-OH)
Mike Kelly (PA)
Joe Pitts (PA)
Jim Renacci (OH)
Dennis Ross (FL)
Matt Salmon (AZ)
Aaron Schock (IL)
Steve Stivers (OH)
Patrick Tiberi (OH)
Robert Wittman (VA)
50

© 2015 AAMC. May not be reproduced without permission.
Encourage Your Member of Congress
to Join the CAMC
Rep. Roe’s office:
Rep. Castor’s office:
* If your Representative was a member in the 113th
Congress, they will automatically be rejoined. If they no
longer wish to be a member, they must opt-out of the caucus.
For more info on the caucus: www.aamc.org/CAMC
51

© 2015 AAMC. May not be reproduced without permission. 52
CAMC Website

**