health care spending trends and impact on affordability
TRANSCRIPT

Health Care Spending Trends and Impact on AffordabilityDr. David Auerbach, Director of Research and Cost Trends, Health Policy Commission

2
Since 2009, total health care spending growth in Massachusetts has been
below the national rate.
Notes: U.S. data includes Massachusetts. U.S. data point for 2018 is partially projected. MA data point for 2018 is preliminary.
Sources: CMS National Healthcare Expenditure Accounts, Personal Health Care Expenditures Data (U.S. 2014-2018); CMS State Healthcare Expenditure Accounts
(U.S. 2000-2014 and MA 2000-2014); CHIA Annual Report THCE Databooks (MA 2014-2018).
Annual growth in per capita health care spending, Massachusetts and the U.S., 2000-2018

3
Medicare spending growth in Massachusetts was above the national rate
in 2018 in nearly all categories of care.
Notes: U.S. data includes Massachusetts. Growth in spending by service category reflects all Fee-For-Service Medicare beneficiaries. Prescription drug spending is
calculated per enrollee in Medicare Part D. All other categories of spending reflect growth per beneficiary in either Part A or Part B.
Sources: Centers for Medicare and Medicaid Services, 2017-2018.
Medicare spending growth per Medicare beneficiary, Massachusetts and the U.S., 2017-2018
Medicare

4
Spending levels in Massachusetts continue to be above the national
average for Medicare beneficiaries in nearly all categories of care.
Medicare spending per Medicare beneficiary, Massachusetts and the U.S., 2018
Notes: U.S. data includes Massachusetts. Data reflects Fee-for-Service Medicare beneficiaries. Prescription drug spending is calculated per enrollee in Medicare Part D.
All other categories of spending reflect growth per beneficiary in either Part A or Part B.
Sources: Centers for Medicare and Medicaid Services, 2018.
Medicare

5
Massachusetts inpatient hospital admission rates show little change
since 2014 and continue to exceed the U.S. average.
Notes: U.S. data includes Massachusetts.
Sources: Kaiser Family Foundation analysis of American Hospital Association data (U.S., 2001-2017), HPC analysis of Center for Health Information
and Analysis Hospital Inpatient Database (MA 2018).
Inpatient hospital admission rate per 1,000 residents, Massachusetts and the U.S., 2001-2018
All payers
6
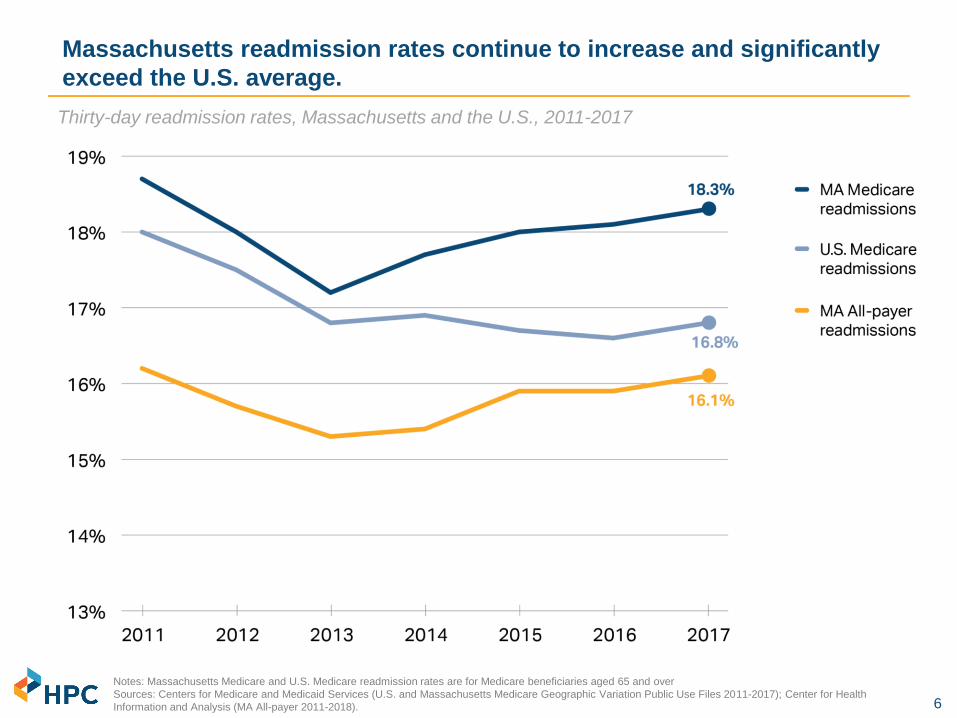
Massachusetts readmission rates continue to increase and significantly
exceed the U.S. average.
Notes: Massachusetts Medicare and U.S. Medicare readmission rates are for Medicare beneficiaries aged 65 and over
Sources: Centers for Medicare and Medicaid Services (U.S. and Massachusetts Medicare Geographic Variation Public Use Files 2011-2017); Center for Health
Information and Analysis (MA All-payer 2011-2018).
Thirty-day readmission rates, Massachusetts and the U.S., 2011-2017

7
The rate of inpatient discharges to institutional post-acute care continued
to decline, as care shifts to lower-cost settings.
Note: Out-of-state residents are excluded. Rates adjusted for age, sex, and changes in DRG mix. Several hospitals were excluded (UMass, Clinton, Cape Cod,
Falmouth, Marlborough) due to coding irregularities in the data.
Sources: HPC analysis of Center for Health Information and Analysis Hospital Inpatient Discharge Database (2010-2018) and Agency for Healthcare Research and
Quality, Healthcare Cost and Utilization Project.
Massachusetts discharge rates to post-acute care settings following an inpatient admission, 2010-2018
All payers
MA discharges to
institutional care are
closing the gap with the
U.S., while the gap in
rates of discharge to
home health is large and
growing.

8
Commercial spending growth in Massachusetts has been below the
national rate every year since 2013.
Annual growth in commercial medical spending per enrollee, Massachusetts and the U.S., 2006-2018
Commercial
Notes: U.S. data includes Massachusetts. U.S. data point for 2018 is partially projected. MA data point for 2018 is preliminary.
Sources: CMS National Healthcare Expenditure Accounts, Personal Health Care Expenditures Data (U.S. 2014-2018) ; CMS State Healthcare Expenditure Accounts
(U.S. 2000-2014 and MA 2000-2014); CHIA Annual Report THCE Databooks (MA 2014-2018).

9
Unit price increases continued to drive most of the spending growth
among Massachusetts’ largest insurers over the past three years.
Average annual growth in spending by component for top three Massachusetts payers, 2016-2018
Notes: Average of medical expenditure trend by year 2016-2018. BCBSMA = Blue Cross Blue Shield of Massachusetts; THP = Tufts Health Plan;
HPHC = Harvard Pilgrim Health Care.
Source: HPC analysis of Pre-Filed Testimony pursuant to the 2019 Annual Cost Trends Hearing
Commercial

10
Annual commercial spending per member varies more than $2,000 by
provider group; spending grew 24% on average from 2013 – 2018.
Notes: Analysis includes the ten largest provider groups and commercial spending for BCBSMA, Tufts, and HPHC members only. Members included are those in
HMO or POS products which require choice of a primary care provider.
Source: HPC analysis of Center for Health Information and Analysis 2016-2019 Annual Reports, TME Databook
Commercial
Total medical expenditures (unadjusted) per member by managing provider organization, 2013-2018

11
Commercial inpatient spending grew 11% even as volume fell 14%
between 2013 and 2018.
Notes: Data points indicate % growth from previous year (2013=0). Volume data correspond to fiscal years while spending data are calendar years.
Sources: CHIA Hospital Inpatient Discharge Data, 2013-2018. Commercial full-claims TME from CHIA Annual Report TME Databooks. 2019 Annual report (for 2017-
2018 growth and 2016-2017 growth), 2018 Annual Report (for 2015-2016), 2017 Annual Report (for 2014-2015) and 2016 Annual Report (for 2013-2014 growth).
Cumulative change in commercial inpatient hospital volume and spending per enrollee (percentages)
and absolute, 2013-2018
Spending per commercial
discharge grew 29%
(5.2% annually),
from $14,500 to $18,700,
from 2013 to 2018.
Commercial
Commercial
spending
Commercial
discharges

12
Over the past five years, inpatient Medicare discharges have increased
while commercial inpatient discharges have decreased.
Notes: Out of state residents (~5% of discharges) are excluded from this analysis. Medicaid also includes "Low-margin government" discharges. All
other payers (Other government, self/pay) are not illustrated, but accounted for in percentage calculations.
Sources: HPC analysis of Center for Health Information and Analysis Inpatient Discharge Database, 2014-2018.
Total inpatient hospital discharges by payer, Massachusetts, 2014-2018
All payers

13
Since 2010, the share of newborns and commercial discharges at
community hospitals has declined, especially in the past two years.
Notes: Discharges that could be appropriately treated in community hospitals were determined based on expert clinician assessment of the acuity of care provided, as reflected by
the cases’ diagnosis-related groups (DRGs). The Center for Health Information and Analysis defines community hospitals as general acute care hospitals that do not support large
teaching and research programs.
Sources: HPC analysis of Center for Health Information and Analysis Hospitals Inpatient Discharge Database (2010-2018).
Massachusetts share of discharges in community hospitals, 2010-2018
All payers

14
While overall APM adoption was stagnant in 2018, there is variation
among Massachusetts insurers for their HMO and PPO members.
Notes: Aetna was excluded from this analysis due to data anomalies. Other MA includes AllWays, Fallon, HNE, BMCHP, THPP, HPI, and Unicare. National payers
includes United and Cigna.
Source: HPC analysis of Center for Health Information and Analysis Annual Report APM Databooks (2016-2018).
Commercial membership under alternative payment method (APM) and fee-for-service (FFS)
contracts by payer, 2016-2018. Labels indicate percentage under an APM by product category.
Commercial

15
While Massachusetts has among the highest employer-sponsored insurance
premiums, Connector premiums remain the second lowest in the U.S.
Notes: U.S. data includes Massachusetts. Employer premiums are averages based on a large sample of employers within each state. Exchange data represent the weighted
average annual premium for the second-lowest silver (Benchmark) plan based on county-level data in each state. Exchange premiums grew in 2018 partly due to the
discontinuation of cost-sharing reduction subsidies by the federal government.
Sources: Kaiser Family Foundation analysis of premium data from healthcare.gov (marketplace premiums 2014-2019); Agency for Healthcare Research and Quality (AHRQ)
Medical Expenditure Panel Survey (MEPS), (commercial premiums 2013-2018).
Annual premium for single coverage in the employer market and average annual unsubsidized benchmark
premium for a 40-year-old in the ACA Exchanges, Massachusetts and the U.S., 2013-2019
Commercial

16
Massachusetts has the 3rd highest average family premium in the U.S.;
premiums exceed $30,000 for one in 10 Massachusetts residents.
Notes: Mean premiums and 90th percentile represent the three-year average from 2016 to 2018.
Source: HPC analysis of Agency for Healthcare Research and Quality (AHRQ) Medical Expenditure Panel Survey (MEPS), 2016-2018
Average and 90th percentile of family premiums by state averaged across 2016-2018
Commercial
17
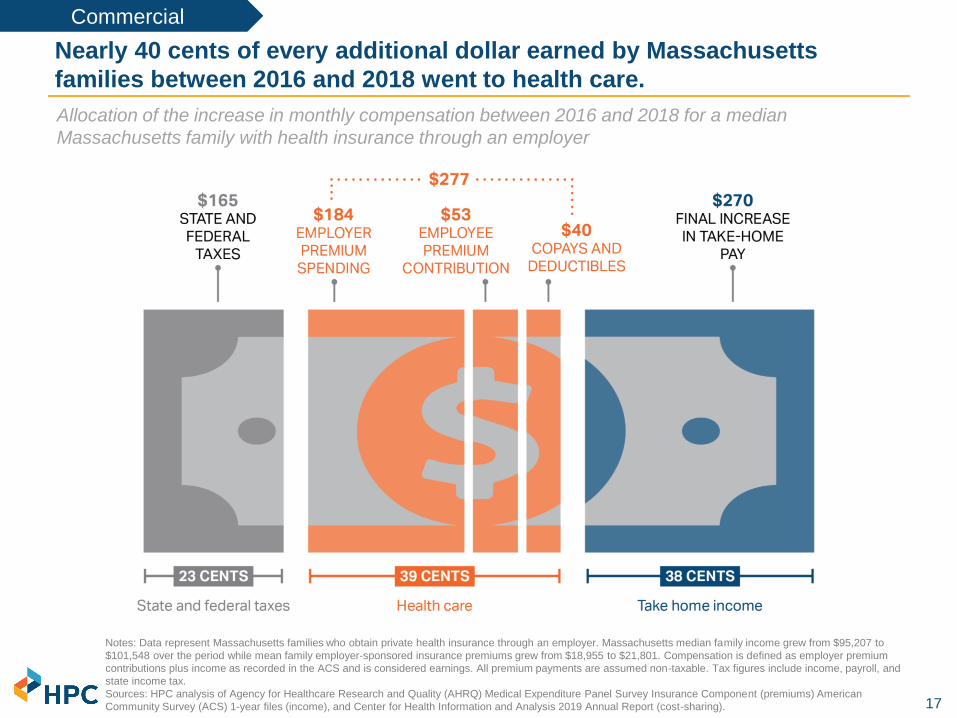
Nearly 40 cents of every additional dollar earned by Massachusetts
families between 2016 and 2018 went to health care.
Allocation of the increase in monthly compensation between 2016 and 2018 for a median
Massachusetts family with health insurance through an employer
Notes: Data represent Massachusetts families who obtain private health insurance through an employer. Massachusetts median family income grew from $95,207 to
$101,548 over the period while mean family employer-sponsored insurance premiums grew from $18,955 to $21,801. Compensation is defined as employer premium
contributions plus income as recorded in the ACS and is considered earnings. All premium payments are assumed non-taxable. Tax figures include income, payroll, and
state income tax.
Sources: HPC analysis of Agency for Healthcare Research and Quality (AHRQ) Medical Expenditure Panel Survey Insurance Component (premiums) American
Community Survey (ACS) 1-year files (income), and Center for Health Information and Analysis 2019 Annual Report (cost-sharing).
Commercial

18
Health care spending for Massachusetts families with employer-sponsored
coverage exceeded $2,000 per month in 2018.
Monthly health care spending for an average Massachusetts family, by category, 2016 vs. 2018
Notes: Spending reflects members with employer-sponsored commercial coverage. Prescription drug spending does not account for rebates.
Source: HPC analysis of Center for Health Information and Analysis Annual Report, 2019, Agency for Healthcare Research and Quality (AHRQ)
Medical Expenditure Panel Survey (MEPS), 2016-2018, CPS Annual Social and Economic Supplement.
Commercial

19
23% of Massachusetts middle-class families spend more than a quarter of
all earnings on health care.
Notes: Estimates are a three-year average of middle class families from 2016-2018; middle class definition is based on General Social Survey (GSS) occupational prestige
scores; “high burden” families are those whose total spending on healthcare (premiums, over-the-counter and other out-of-pocket spending) exceeds 25% of their total
compensation. Premiums include employer and employee premium contributions and earnings (compensation) includes employer premium contribution. Disability or activity
limitation was defined as difficulty walking or climbing stairs, dressing or bathing, hearing, seeing, or having a health problem or a disability which prevents work or limits the kind
or amount of work they can perform. College degree was defined as having a B.A. or higher degree in the family. Single-parent families are those in families who did not report
being in a married couple family (male or female reference person). Worse health was defined as those reporting a health status “poor,” “fair” or “good.”
Source: HPC's analysis of data from the CPS Annual Social and Economic Supplement (ASEC), 2016-8 and Agency for Healthcare Research and Quality (AHRQ) Medical
Expenditure Panel Survey (MEPS), 2016-2018 (premiums).
Characteristics of middle-class families with employer-sponsored health insurance that spend more
than a quarter of earnings on health care (high burden families), 2016-2018 average