observations on trends in prescription drug spending
TRANSCRIPT
Department of Health and Human Services Office of the Assistant Secretary for Planning and Evaluation
http://aspe.hhs.gov
ASPE ISSUE BRIEF
Observations on Trends in Prescription Drug Spending
March 8, 2016
Key findings
• Expenditures on prescription drugs are rising and are projected to continue to rise faster
than overall health spending thereby increasing this sector’s share of health care
spending.
• ASPE estimates that prescription drug spending in the United States was about $457
billion in 2015, or 16.7 percent of overall personal health care services. Of that $457
billion, $328 billion (71.9 percent) was for retail drugs and $128 billion (28.1 percent)
was for non-retail drugs.
• Factors underlying the rise in prescription drug spending from 2010 to 2014 can be
roughly allocated as follows: 10 percent of that rise was due to population growth; 30
percent to an increase in prescriptions per person; 30 percent to overall, economy-wide
inflation; and 30 percent to either changes in the composition of drugs prescribed toward
higher price products or price increases for drugs that together drove average price
increases in excess of general inflation.
• Expenditures on specialty drugs generally appear to be rising more rapidly than
expenditures on other drugs, though estimates of specialty drug expenditures are highly
sensitive to which drugs are considered “specialty” products.
ASPE Issue Brief Page 2
March 2016
Introduction
The rising cost of prescription medicines is putting pressure on public and family budgets in the
United States. A recent nationally-representative poll of more than 1,200 adults found that the
affordability of prescription drugs tops the public’s list of priorities for the President and
Congress, including “making sure that high-cost drugs are affordable to those who need them”
and “government action to lower prescription drug prices”. In particular, 77 percent of adults
believe that “making sure that high-cost drugs for chronic conditions, such as HIV, hepatitis,
mental illness and cancer, are affordable to those who need them” is a top priority.1
Many new drug products confer enormous clinical benefits to patients, but the cost associated
with some of these therapies may place a financial strain on patients who might face high out-of-
pocket costs even if they are insured. In addition, spending on prescription drugs contributes to
overall health care spending growth and creates pressure on this portion of federal and state
budgets. To inform discussion on the challenges posed by the rising cost of prescription drugs,
this paper briefly discusses the magnitude of the recent rise in prescription drug spending, the
relative importance of various factors which underlie it, and the contribution of drug spending to
the overall rise in health care spending in recent years.
Estimates of Drug Spending Based on the National Health Expenditure Accounts
The most widely used estimates of prescription drug spending in the United States come from
the National Health Expenditure Accounts (NHEA). The NHEA estimates include only retail
prescription drug spending (drug spending at outlets that directly serve patients); non-retail
prescription drug spending (spending by medical providers for drugs they provide directly to
patients) is classified under the spending category corresponding to the provider purchasing the
drugs, such as hospital spending or physician services spending. Thus, most estimates of
prescription drug spending in the United States omit the non-retail portion of drug spending and
present an incomplete picture of the total cost associated with prescription drugs. The Assistant
Secretary for Planning and Evaluation (ASPE) estimates that the United States spent about $457
billion on retail plus non-retail prescription drugs in 2015, which was 16.7 percent of the
estimated $2.729 trillion spent on overall personal health care services. Of that $457 billion,
$328 billion was for retail drugs and $128 billion was for non-retail drugs. These estimates are
based on data from the NHEA2 and a recent analysis that estimates non-retail drugs as
accounting for 28 percent of all drug spending.3
1 Kaiser Family Foundation, Kaiser Health Tracking Poll: October 2015, October 28, 2015. See
http://kff.org/health-costs/poll-finding/kaiser-health-tracking-poll-october-2015/ accessed November 13, 2015. 2 The NHEA, produced by the Office of the Actuary at the Centers for Medicare & Medicaid Services (CMS),
provides estimates of total national spending on health care services by category. Its “Prescription Drug
Expenditures” category represents retail sales of human-use dosage-form drugs, biological drugs, and diagnostic
products that are available only by a prescription. Non-retail drug expenditures are counted separately. For example,
a drug that is administered in a physician’s office is counted under “Physician and Clinical Expenditures”, and
analogously for hospitals, nursing homes, and other non-retail settings. 3 Altarum Institute, Center for Sustainable Health Spending Data Brief: A Ten Year Projection of the Prescription
Drug Share of National Health Expenditures Including Non-Retail, Addendum Update August 2015. That analysis
suggests that the ratio of non-retail drug spending to retail drug spending is about 0.4, or alternatively, that non-retail
drug spending is about 28 percent of all (retail plus non-retail) drug spending.
ASPE Issue Brief Page 3
March 2016
Growth in spending on prescription drugs slowed substantially about a decade ago, due to greater
generic product entry and fewer new blockbuster products being introduced. 4
In particular, 2008
to 2012 was a period of unusually slow growth in drug spending—about 2 percent per year. This
slower growth was one factor that contributed to the relatively slow growth in total health care
spending during that period. In 2014, growth in drug spending accelerated, and the contribution
of drugs to growth in total health care costs rose as well.
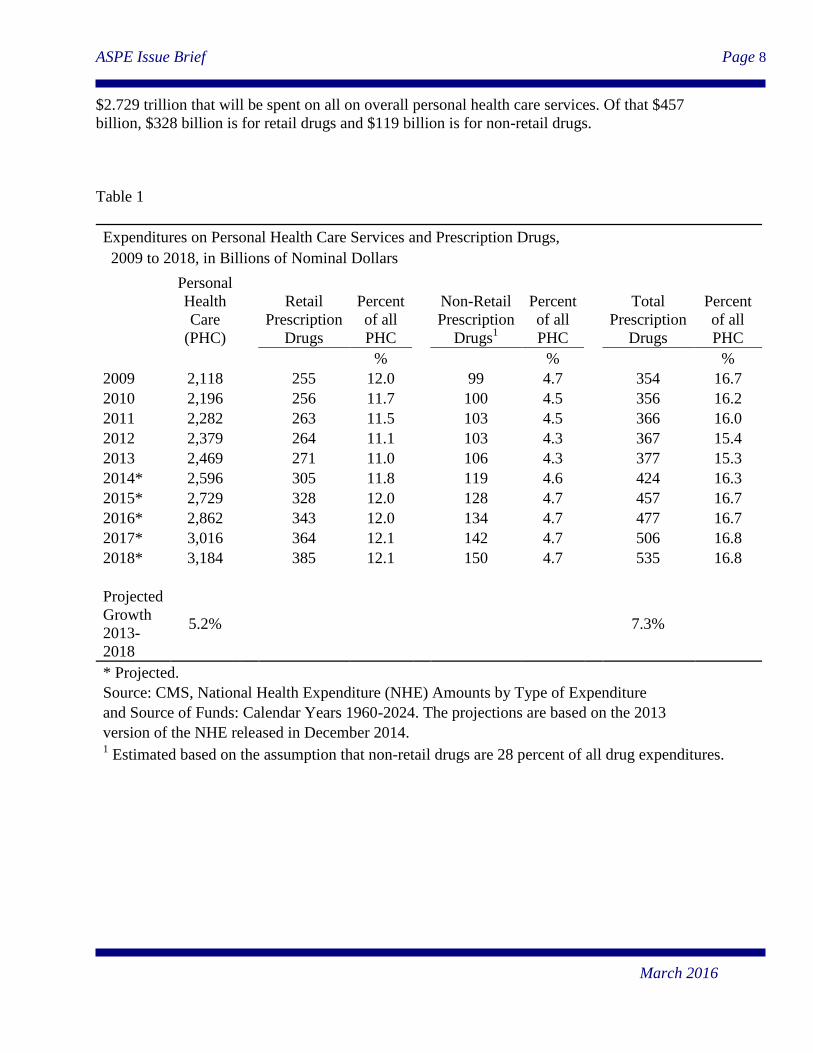
Table 1 shows estimates of spending on all personal health care services, retail prescription
drugs, and non-retail prescription drugs between 2009 and 2018.5 After a period of subdued
growth extending through 2013 , drug spending rose by a remarkable 12.6 percent in 2014, and
drug spending growth is estimated to have remained elevated in 2015. Although analysts do not
expect the rates of increase seen in 2014 and 2015 to continue, current projections reflect an
expectation of higher rates of growth during the next few years compared to the 2008-2013
period. Cumulatively from 2013 to 2018, prescription drug spending is projected to rise by an
average of 7.3 percent annually. Since NHEA projections of total personal health care services
indicate growth at a slower pace of 5.2 percent between 2013 and 2018, prescription drugs are
projected to comprise a greater percentage of all health care spending. Assuming that total drug
spending grows at the same projected rate as the retail component, total drug spending will reach
$535 billion in 2018, or 16.8 percent of all personal health care spending compared to 15.3
percent in 2013. Such a rise might appear modest, however it should be noted that during the
1990s retail prescription drugs typically accounted for about 7 percent of health care spending
(data on non-retail drugs are not available for that period). This underscores the importance of
prescription drugs as a potential contributor to long-term growth in health care costs.
In some cases, the use of particular drugs might lead to reduced expenditures in other areas such
as hospital care if, for example, fewer acute health events occur as a result of medication use.
However, evidence suggests that a rise in prescription drug therapy tends to raise aggregate
expenditures rather than lower them even if there are some offsetting cost reductions in some
particular areas.6
Estimates from IMS Health National Prescription Audit
Another source of information on prescription drug expenditures comes from IMS Health’s
National Prescription Audit (NPA). The IMS NPA Retail channel tracks the volume of
pharmaceutical prescriptions dispensed through chain store pharmacies, independent store
4 Cynthia Smith, Cathy Cowan, Stephen Heffler, and Aaron Catlin, “National Health Spending In 2004: Recent
Slowdown Led By Prescription Drug Spending”, Health Affairs, 25, no.1 (2006):186-196. 5 Estimates of total drug spending (retail plus non-retail) in this paper are based on retail drug spending from the
NHEA and calculated under the assumption that non-retail drugs comprise a fixed 28 percent of all spending on all
prescription drugs. 6 For a discussion of prescription drug spending and offsets in other forms of spending, see Martin Gaynor, Jian Li,
and William B Vogt, “Substitution, Spending Offsets, and Prescription Drug Benefit Design”, Forum for Health
Economics & Policy, Volume 10, Issue 2, July 2007.
ASPE Issue Brief Page 4
March 2016
pharmacies, and food store pharmacies. The IMS NPA data on the number of prescriptions and
expenditures represent nationally projected estimates based on a sample of 46,400 pharmacies.7
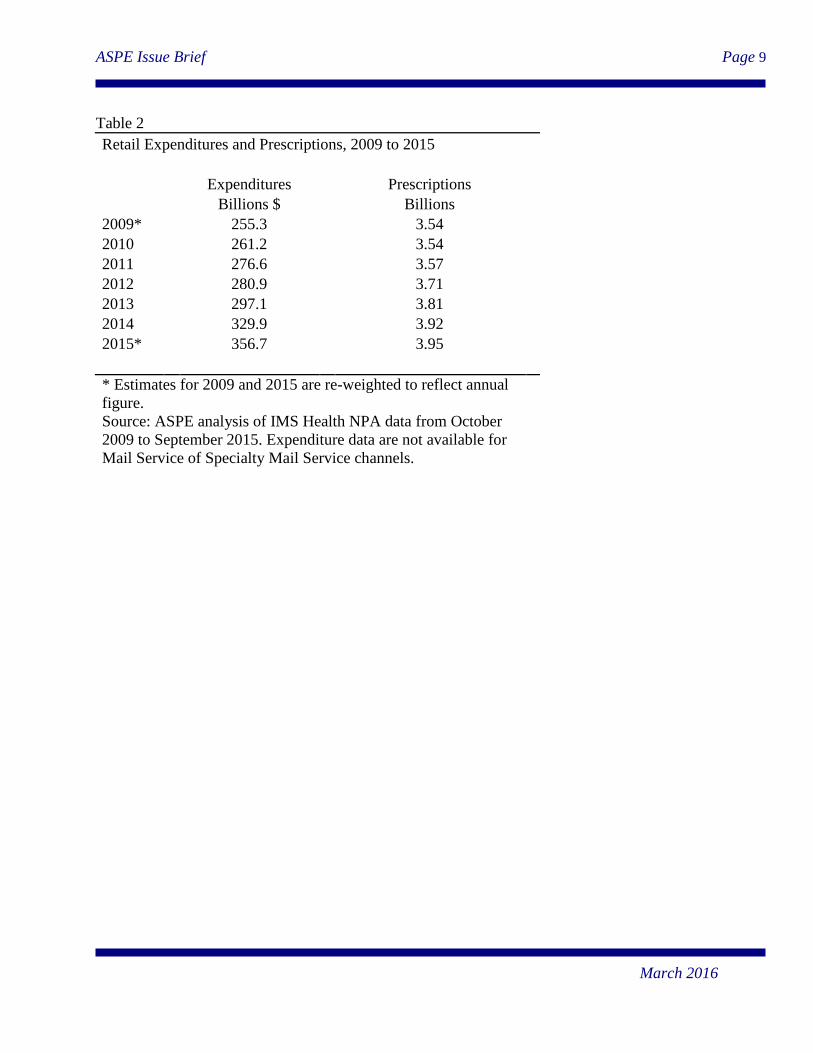
Table 2 shows the estimates of retail expenditures and number of prescriptions by year between
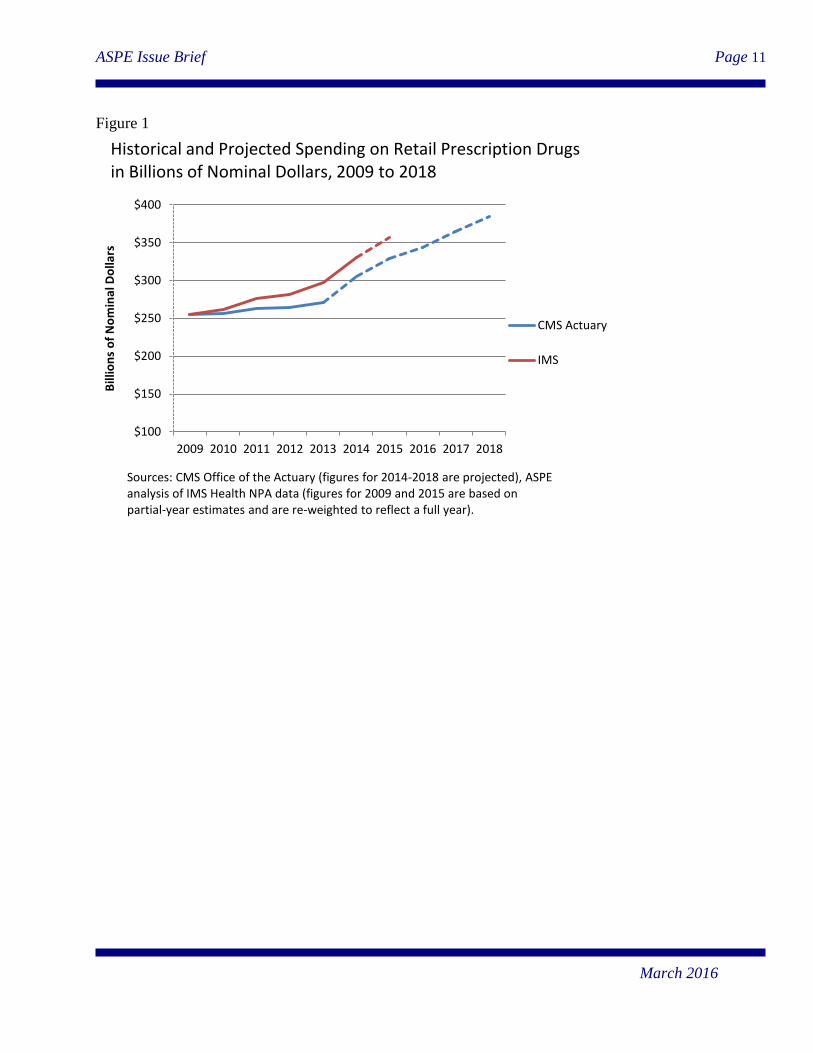
2009 and 2015.8 The IMS NPA estimates suggest somewhat higher levels of spending and rates
of growth than those suggested by corresponding estimates from the NHEA. (See Figure 1) For
2014, the most recent year for which full-year data are available, IMS estimates suggest that
retail prescription expenditures were $330 billion, or about $25 billion higher than the NHEA
projection. In the IMS estimates, the average annual rate of growth from 2010—the earliest
available full-year of IMS data—to 2014 was 6.0 percent, compared to 4.5 percent for retail
drugs in the NHEA projections.
The disparity between the two sources appears to be growing over time (see Figure 1). The
majority of this disparity is likely because the IMS spending data are based on the gross price
before rebates while the NHEA spending data is based on the net price after an adjustment for
rebates is applied.9 (As a conceptual matter, net-of-rebate estimates like those provided by
NHEA are generally preferable to the gross-of-rebate estimates provided by IMS. However,
tracking rebates is relatively challenging in practice.)
Forecasts based on a recent analysis by IMS Health predict continued growth in spending on
both retail and non-retail prescription drugs in the coming years.10
Under these projections,
annual growth in real (inflation-adjusted) expenditures on prescription drugs ranges from 5
percent to 8 percent per year during 2014 to 2015—rates of growth that are greater than those
projected in the NHEA for retail drugs. Note that because the NHEA projected figures are in
nominal dollars (not adjusted for inflation), the underlying difference between the two sets of
projections is even greater.
Decomposing the Changes in Retail Drug Spending
A rise in spending on prescription drugs can occur when a greater quantity of prescriptions is
dispensed or when the average price per prescription rises. For purposes of discussing the rising
cost of prescription drugs—especially the burden of high-priced drugs—it is useful to try to
decompose the recent rise in spending into its component parts: prices and quantities.
The IMS data show that both estimated expenditures and number of prescriptions increased
substantially during the last five years (see Table 2). The total number of prescriptions rose from
about 3.54 billion in 2010 to 3.92 billion in 2014, an increase of approximately 11 percent.
7 The NPA also includes number of prescriptions by mail service, but no expenditure data for that channel.
8 The IMS NPA data are available for the previous six years, on a rolling monthly basis (or 72 months beginning in
October 2009, ending in September 2015.), so only partial-year data are available for 2009 and 2015. To make these
estimates comparable with the calendar year estimates from the NHEA, the 2009 and 2015 IMS estimates are re-
weighted to reflect annual figures. 9 CMS, National Health Expenditure Accounts: Methodology Paper, 2014, Definitions, Sources, and Methods,
December 2015, https://www.cms.gov/Research-Statistics-Data-and-Systems/Statistics-Trends-and-
Reports/NationalHealthExpendData/Downloads/DSM-14.pdf. 10
IMS Institute for Healthcare Informatics, Global Outlook for Medicines through 2018, November 2014.
ASPE Issue Brief Page 5
March 2016
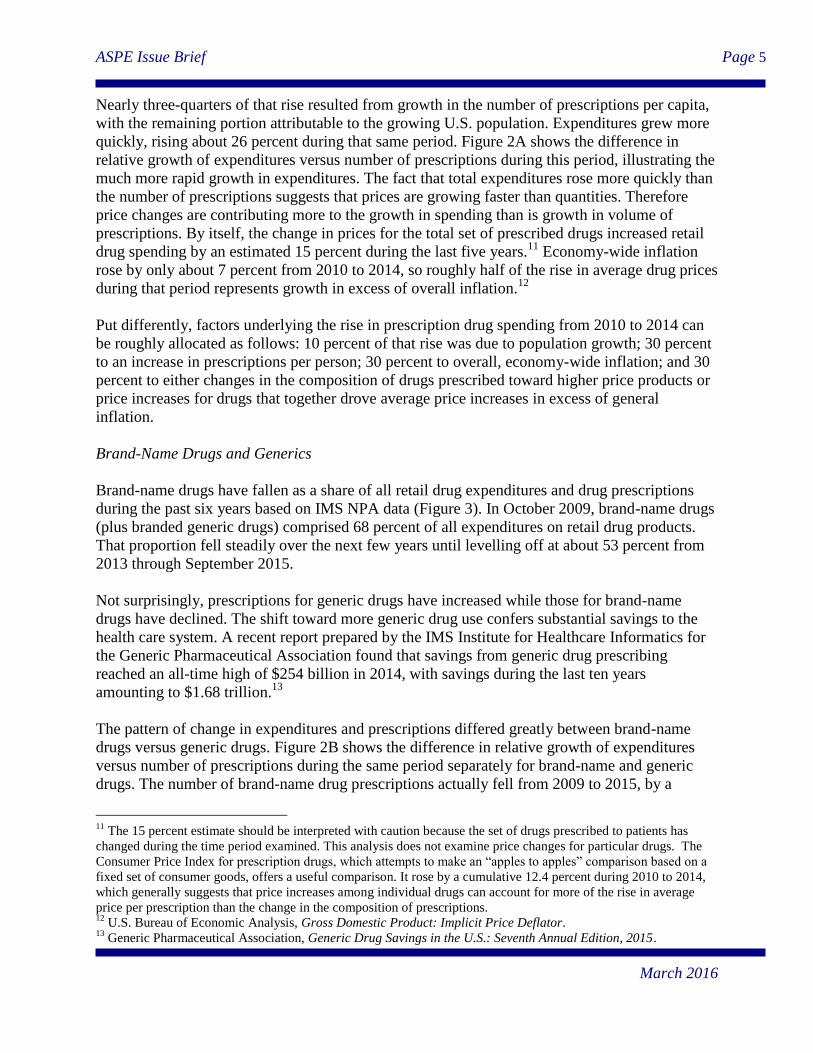
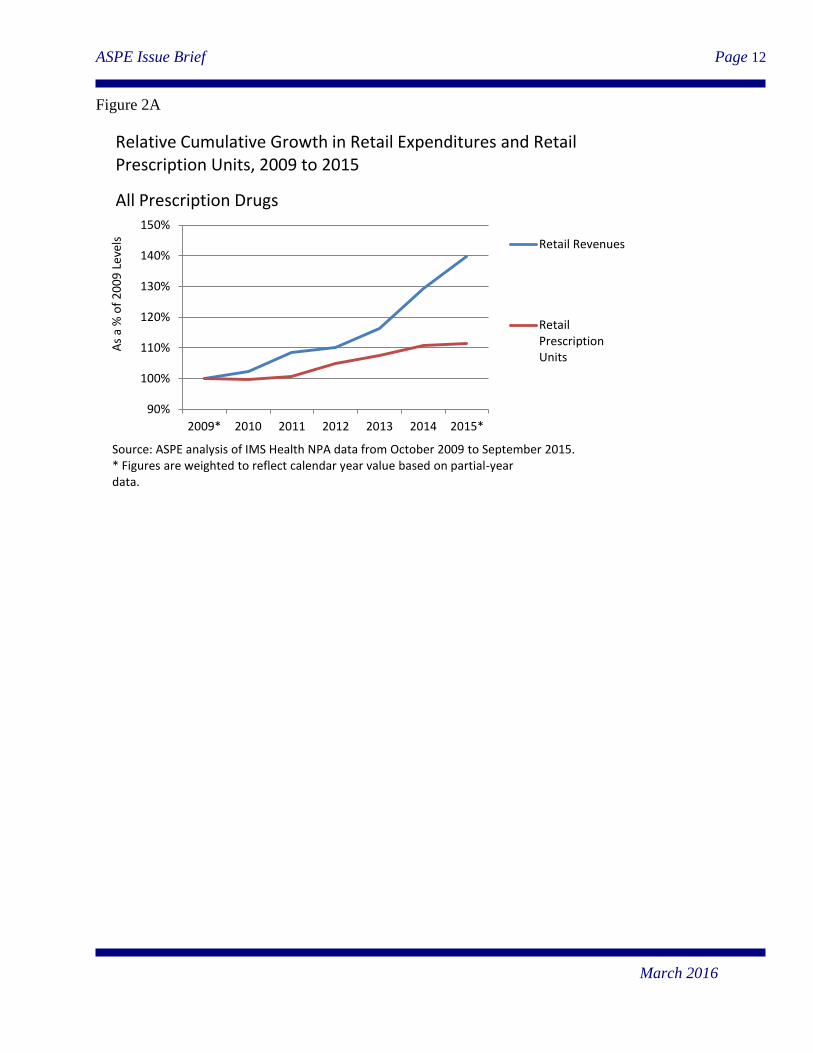
Nearly three-quarters of that rise resulted from growth in the number of prescriptions per capita,
with the remaining portion attributable to the growing U.S. population. Expenditures grew more
quickly, rising about 26 percent during that same period. Figure 2A shows the difference in
relative growth of expenditures versus number of prescriptions during this period, illustrating the
much more rapid growth in expenditures. The fact that total expenditures rose more quickly than
the number of prescriptions suggests that prices are growing faster than quantities. Therefore
price changes are contributing more to the growth in spending than is growth in volume of
prescriptions. By itself, the change in prices for the total set of prescribed drugs increased retail
drug spending by an estimated 15 percent during the last five years.11
Economy-wide inflation
rose by only about 7 percent from 2010 to 2014, so roughly half of the rise in average drug prices
during that period represents growth in excess of overall inflation.12
Put differently, factors underlying the rise in prescription drug spending from 2010 to 2014 can
be roughly allocated as follows: 10 percent of that rise was due to population growth; 30 percent
to an increase in prescriptions per person; 30 percent to overall, economy-wide inflation; and 30
percent to either changes in the composition of drugs prescribed toward higher price products or
price increases for drugs that together drove average price increases in excess of general
inflation.
Brand-Name Drugs and Generics
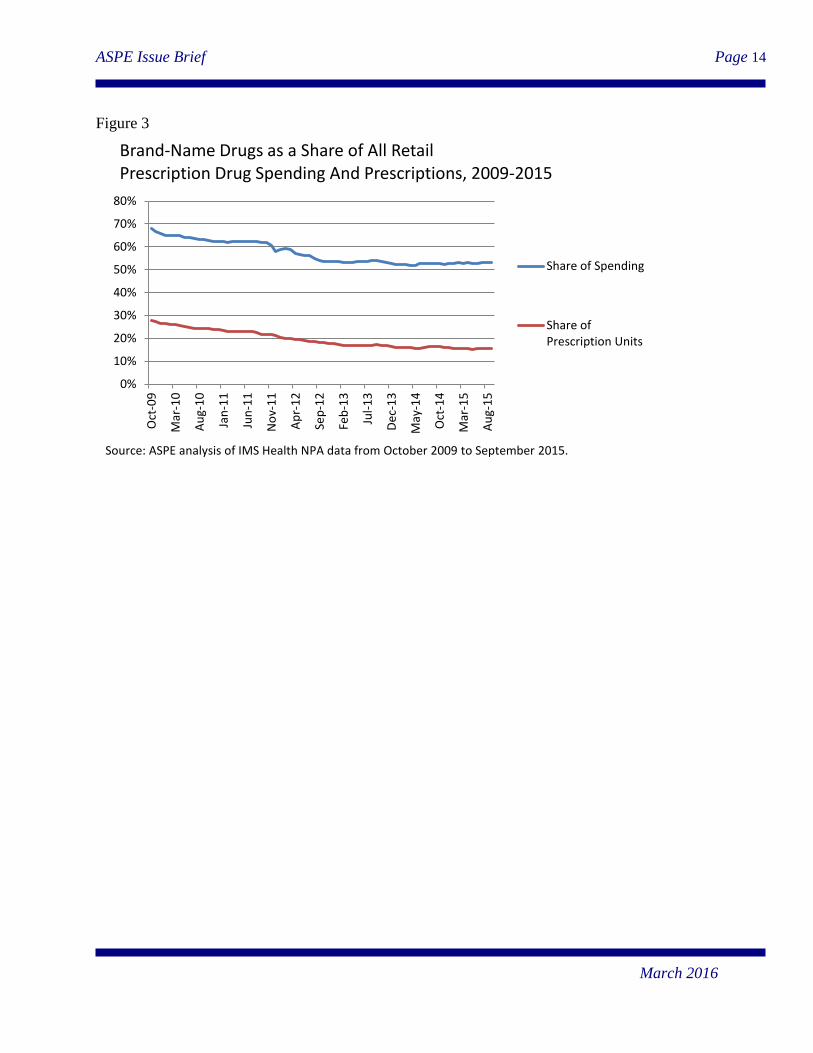
Brand-name drugs have fallen as a share of all retail drug expenditures and drug prescriptions
during the past six years based on IMS NPA data (Figure 3). In October 2009, brand-name drugs
(plus branded generic drugs) comprised 68 percent of all expenditures on retail drug products.
That proportion fell steadily over the next few years until levelling off at about 53 percent from
2013 through September 2015.
Not surprisingly, prescriptions for generic drugs have increased while those for brand-name
drugs have declined. The shift toward more generic drug use confers substantial savings to the
health care system. A recent report prepared by the IMS Institute for Healthcare Informatics for
the Generic Pharmaceutical Association found that savings from generic drug prescribing
reached an all-time high of $254 billion in 2014, with savings during the last ten years
amounting to $1.68 trillion.13
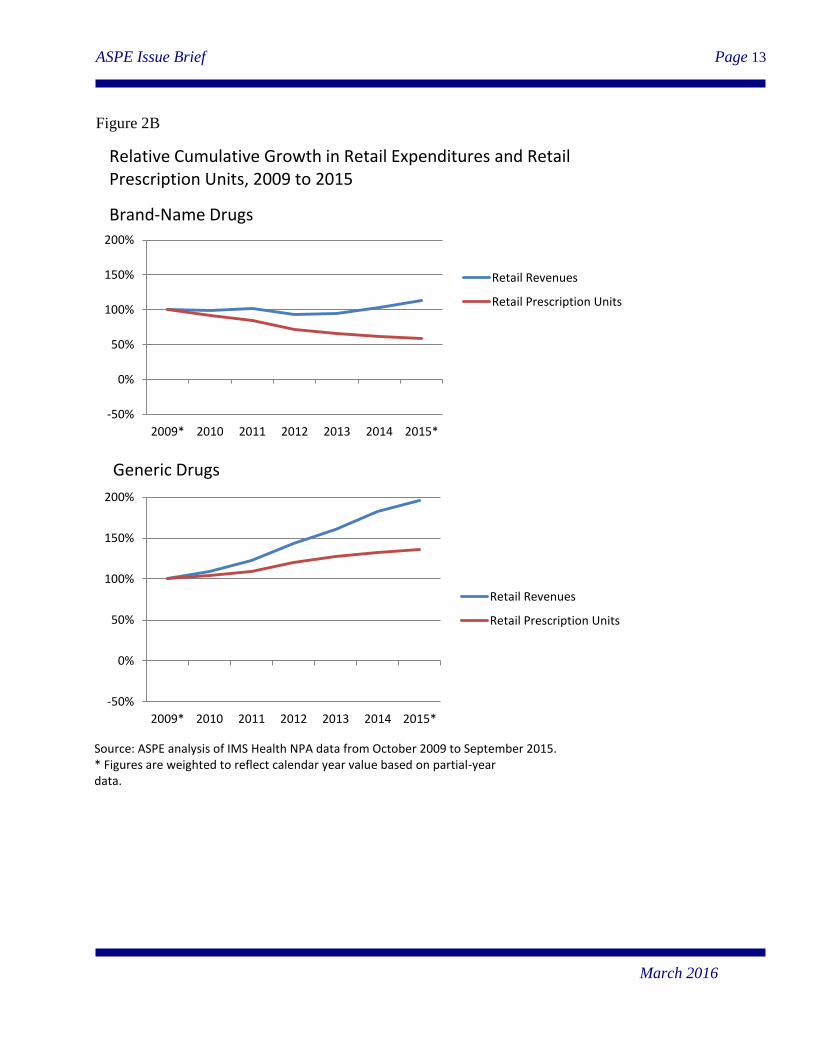
The pattern of change in expenditures and prescriptions differed greatly between brand-name
drugs versus generic drugs. Figure 2B shows the difference in relative growth of expenditures
versus number of prescriptions during the same period separately for brand-name and generic
drugs. The number of brand-name drug prescriptions actually fell from 2009 to 2015, by a
11
The 15 percent estimate should be interpreted with caution because the set of drugs prescribed to patients has
changed during the time period examined. This analysis does not examine price changes for particular drugs. The
Consumer Price Index for prescription drugs, which attempts to make an “apples to apples” comparison based on a
fixed set of consumer goods, offers a useful comparison. It rose by a cumulative 12.4 percent during 2010 to 2014,
which generally suggests that price increases among individual drugs can account for more of the rise in average
price per prescription than the change in the composition of prescriptions. 12
U.S. Bureau of Economic Analysis, Gross Domestic Product: Implicit Price Deflator. 13
Generic Pharmaceutical Association, Generic Drug Savings in the U.S.: Seventh Annual Edition, 2015.
ASPE Issue Brief Page 6
March 2016
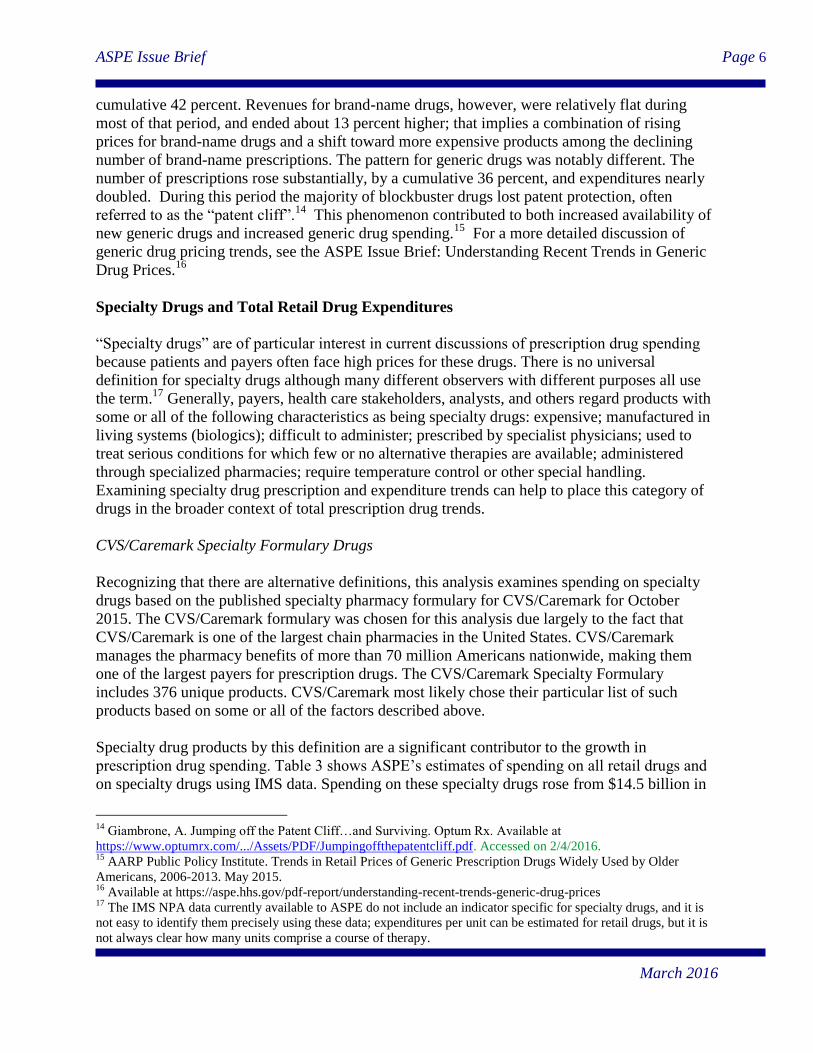
cumulative 42 percent. Revenues for brand-name drugs, however, were relatively flat during
most of that period, and ended about 13 percent higher; that implies a combination of rising
prices for brand-name drugs and a shift toward more expensive products among the declining
number of brand-name prescriptions. The pattern for generic drugs was notably different. The
number of prescriptions rose substantially, by a cumulative 36 percent, and expenditures nearly
doubled. During this period the majority of blockbuster drugs lost patent protection, often
referred to as the “patent cliff”.14
This phenomenon contributed to both increased availability of
new generic drugs and increased generic drug spending.15
For a more detailed discussion of
generic drug pricing trends, see the ASPE Issue Brief: Understanding Recent Trends in Generic
Drug Prices.16
Specialty Drugs and Total Retail Drug Expenditures
“Specialty drugs” are of particular interest in current discussions of prescription drug spending
because patients and payers often face high prices for these drugs. There is no universal
definition for specialty drugs although many different observers with different purposes all use
the term.17
Generally, payers, health care stakeholders, analysts, and others regard products with
some or all of the following characteristics as being specialty drugs: expensive; manufactured in
living systems (biologics); difficult to administer; prescribed by specialist physicians; used to
treat serious conditions for which few or no alternative therapies are available; administered
through specialized pharmacies; require temperature control or other special handling.
Examining specialty drug prescription and expenditure trends can help to place this category of
drugs in the broader context of total prescription drug trends.
CVS/Caremark Specialty Formulary Drugs
Recognizing that there are alternative definitions, this analysis examines spending on specialty
drugs based on the published specialty pharmacy formulary for CVS/Caremark for October
2015. The CVS/Caremark formulary was chosen for this analysis due largely to the fact that
CVS/Caremark is one of the largest chain pharmacies in the United States. CVS/Caremark
manages the pharmacy benefits of more than 70 million Americans nationwide, making them
one of the largest payers for prescription drugs. The CVS/Caremark Specialty Formulary
includes 376 unique products. CVS/Caremark most likely chose their particular list of such
products based on some or all of the factors described above.
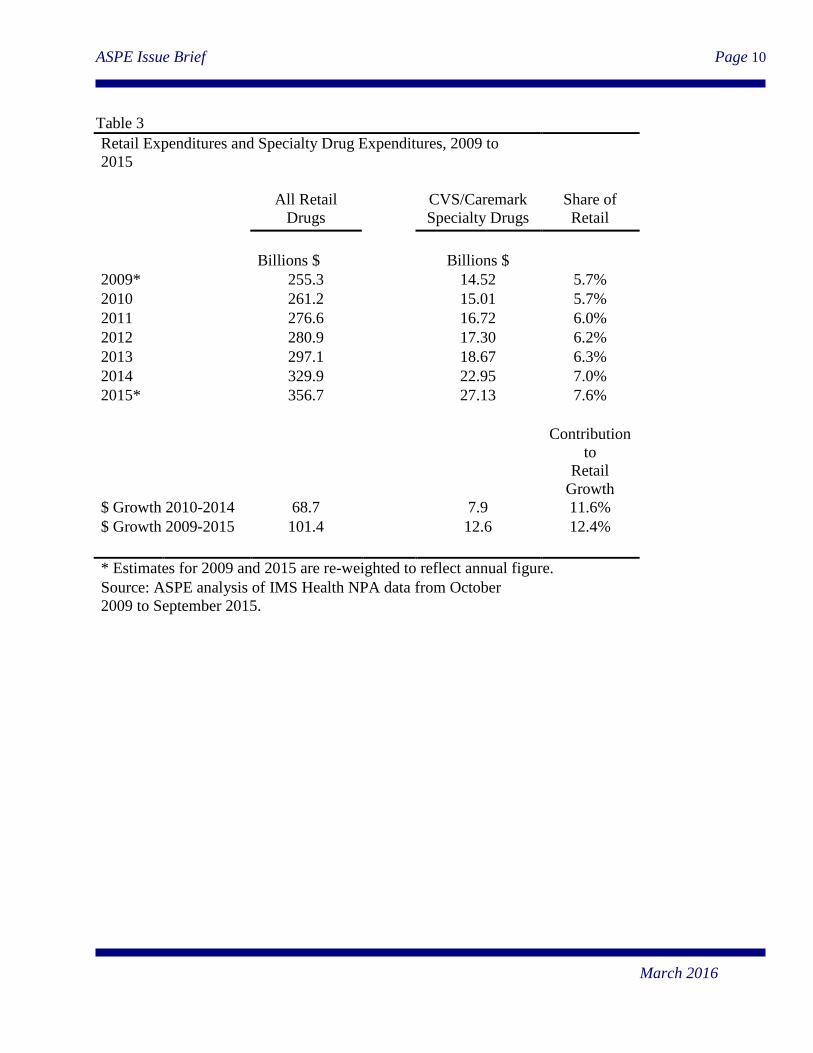
Specialty drug products by this definition are a significant contributor to the growth in
prescription drug spending. Table 3 shows ASPE’s estimates of spending on all retail drugs and
on specialty drugs using IMS data. Spending on these specialty drugs rose from $14.5 billion in
14
Giambrone, A. Jumping off the Patent Cliff…and Surviving. Optum Rx. Available at
https://www.optumrx.com/.../Assets/PDF/Jumpingoffthepatentcliff.pdf. Accessed on 2/4/2016. 15
AARP Public Policy Institute. Trends in Retail Prices of Generic Prescription Drugs Widely Used by Older
Americans, 2006-2013. May 2015. 16
Available at https://aspe.hhs.gov/pdf-report/understanding-recent-trends-generic-drug-prices 17
The IMS NPA data currently available to ASPE do not include an indicator specific for specialty drugs, and it is
not easy to identify them precisely using these data; expenditures per unit can be estimated for retail drugs, but it is
not always clear how many units comprise a course of therapy.
ASPE Issue Brief Page 7
March 2016
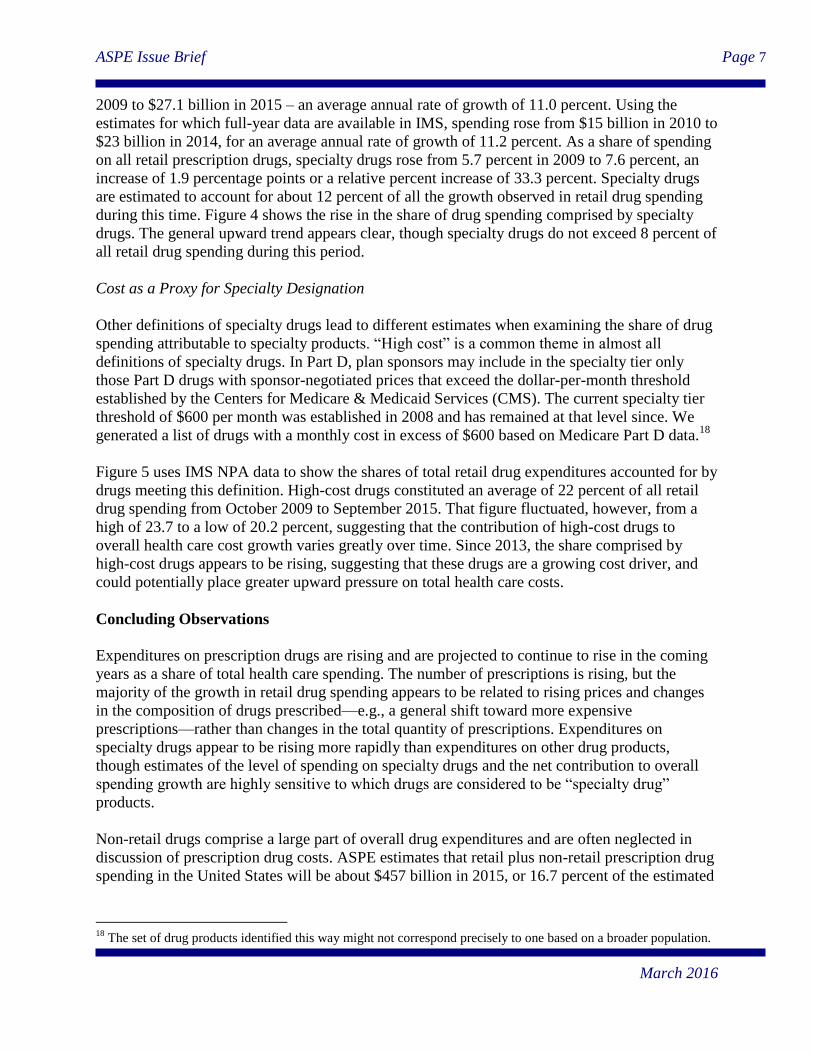
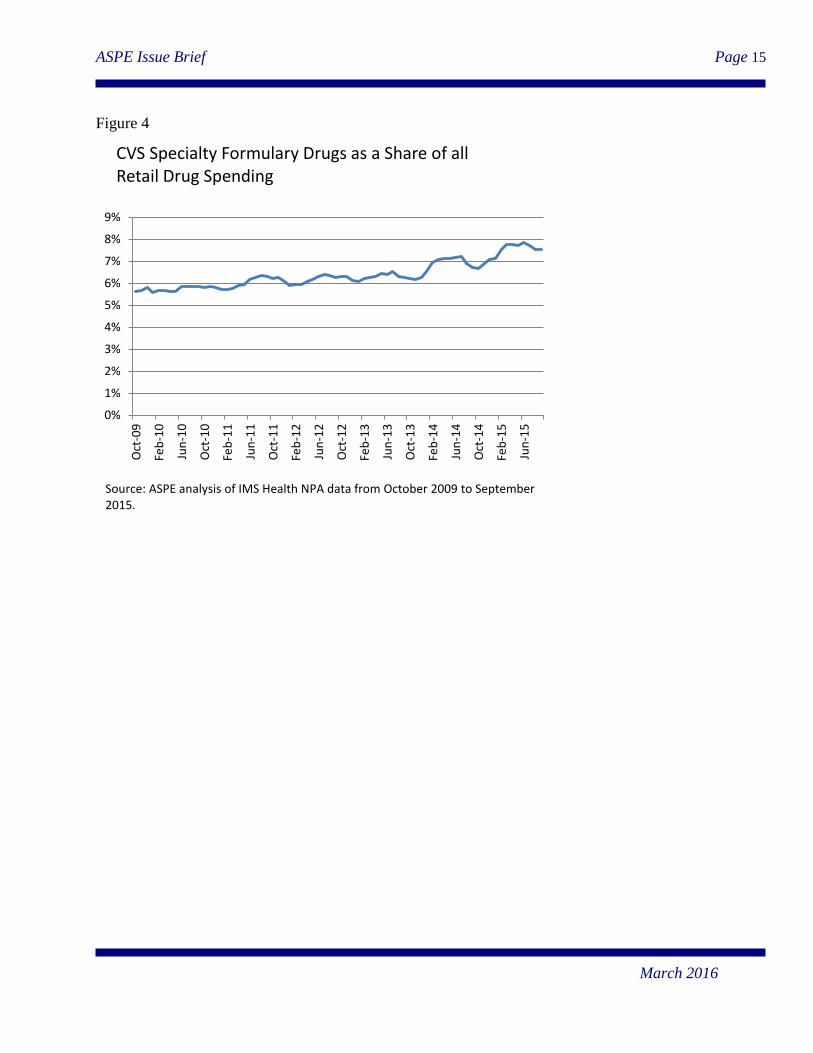
2009 to $27.1 billion in 2015 – an average annual rate of growth of 11.0 percent. Using the
estimates for which full-year data are available in IMS, spending rose from $15 billion in 2010 to
$23 billion in 2014, for an average annual rate of growth of 11.2 percent. As a share of spending
on all retail prescription drugs, specialty drugs rose from 5.7 percent in 2009 to 7.6 percent, an
increase of 1.9 percentage points or a relative percent increase of 33.3 percent. Specialty drugs
are estimated to account for about 12 percent of all the growth observed in retail drug spending
during this time. Figure 4 shows the rise in the share of drug spending comprised by specialty
drugs. The general upward trend appears clear, though specialty drugs do not exceed 8 percent of
all retail drug spending during this period.
Cost as a Proxy for Specialty Designation
Other definitions of specialty drugs lead to different estimates when examining the share of drug
spending attributable to specialty products. “High cost” is a common theme in almost all
definitions of specialty drugs. In Part D, plan sponsors may include in the specialty tier only
those Part D drugs with sponsor-negotiated prices that exceed the dollar-per-month threshold
established by the Centers for Medicare & Medicaid Services (CMS). The current specialty tier
threshold of $600 per month was established in 2008 and has remained at that level since. We
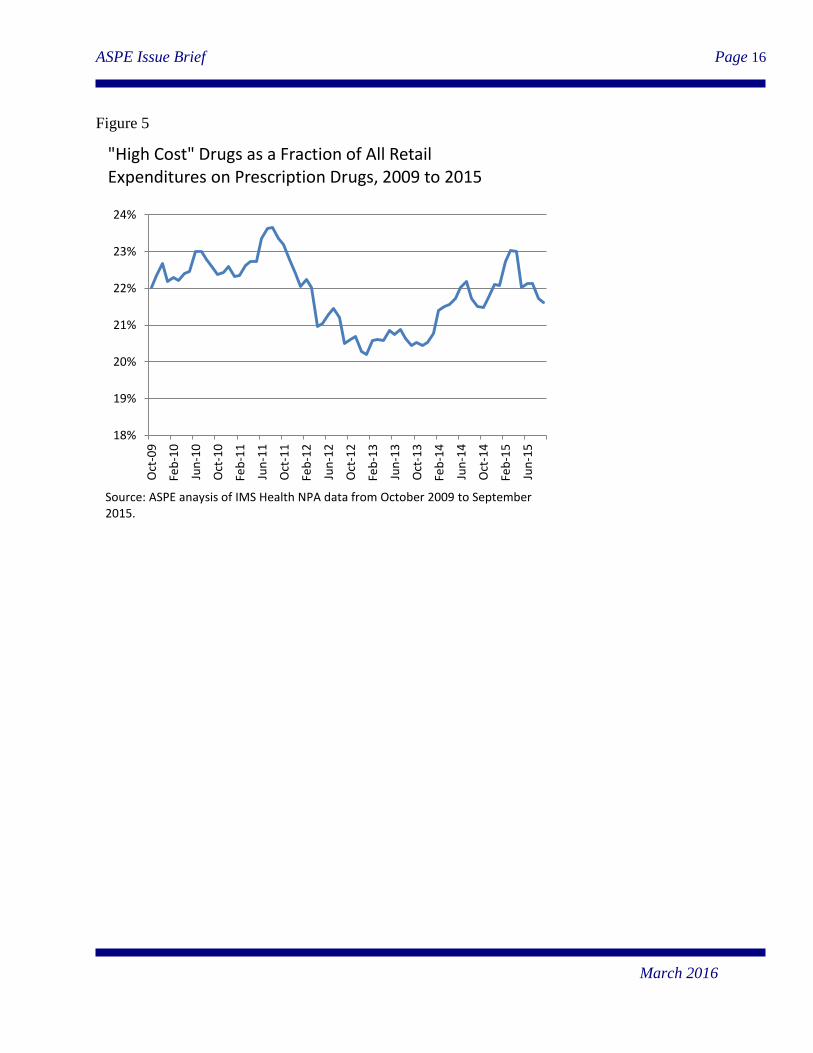
generated a list of drugs with a monthly cost in excess of $600 based on Medicare Part D data.18
Figure 5 uses IMS NPA data to show the shares of total retail drug expenditures accounted for by
drugs meeting this definition. High-cost drugs constituted an average of 22 percent of all retail
drug spending from October 2009 to September 2015. That figure fluctuated, however, from a
high of 23.7 to a low of 20.2 percent, suggesting that the contribution of high-cost drugs to
overall health care cost growth varies greatly over time. Since 2013, the share comprised by
high-cost drugs appears to be rising, suggesting that these drugs are a growing cost driver, and
could potentially place greater upward pressure on total health care costs.
Concluding Observations
Expenditures on prescription drugs are rising and are projected to continue to rise in the coming
years as a share of total health care spending. The number of prescriptions is rising, but the
majority of the growth in retail drug spending appears to be related to rising prices and changes
in the composition of drugs prescribed—e.g., a general shift toward more expensive
prescriptions—rather than changes in the total quantity of prescriptions. Expenditures on
specialty drugs appear to be rising more rapidly than expenditures on other drug products,
though estimates of the level of spending on specialty drugs and the net contribution to overall
spending growth are highly sensitive to which drugs are considered to be “specialty drug”
products.
Non-retail drugs comprise a large part of overall drug expenditures and are often neglected in
discussion of prescription drug costs. ASPE estimates that retail plus non-retail prescription drug
spending in the United States will be about $457 billion in 2015, or 16.7 percent of the estimated
18
The set of drug products identified this way might not correspond precisely to one based on a broader population.
ASPE Issue Brief Page 8
March 2016
$2.729 trillion that will be spent on all on overall personal health care services. Of that $457
billion, $328 billion is for retail drugs and $119 billion is for non-retail drugs.
Table 1
Expenditures on Personal Health Care Services and Prescription Drugs,
2009 to 2018, in Billions of Nominal Dollars
Personal
Health
Care
(PHC)
Retail
Prescription
Drugs
Percent
of all
PHC
Non-Retail
Prescription
Drugs1
Percent
of all
PHC
Total
Prescription
Drugs
Percent
of all
PHC
%
%
%
2009 2,118
255 12.0
99 4.7
354 16.7
2010 2,196
256 11.7
100 4.5
356 16.2
2011 2,282
263 11.5
103 4.5
366 16.0
2012 2,379
264 11.1
103 4.3
367 15.4
2013 2,469
271 11.0
106 4.3
377 15.3
2014* 2,596
305 11.8
119 4.6
424 16.3
2015* 2,729
328 12.0
128 4.7
457 16.7
2016* 2,862
343 12.0
134 4.7
477 16.7
2017* 3,016
364 12.1
142 4.7
506 16.8
2018* 3,184
385 12.1
150 4.7
535 16.8
Projected
Growth
2013-
2018
5.2% 7.3%
* Projected.
Source: CMS, National Health Expenditure (NHE) Amounts by Type of Expenditure
and Source of Funds: Calendar Years 1960-2024. The projections are based on the 2013
version of the NHE released in December 2014. 1 Estimated based on the assumption that non-retail drugs are 28 percent of all drug expenditures.
ASPE Issue Brief Page 9
March 2016
Table 2
Retail Expenditures and Prescriptions, 2009 to 2015
Expenditures
Prescriptions
Billions $
Billions
2009*
255.3
3.54
2010
261.2
3.54
2011
276.6
3.57
2012
280.9
3.71
2013
297.1
3.81
2014
329.9
3.92
2015*
356.7
3.95
* Estimates for 2009 and 2015 are re-weighted to reflect annual
figure.
Source: ASPE analysis of IMS Health NPA data from October
2009 to September 2015. Expenditure data are not available for
Mail Service of Specialty Mail Service channels.
ASPE Issue Brief Page 10
March 2016
Table 3
Retail Expenditures and Specialty Drug Expenditures, 2009 to
2015
All Retail
Drugs
CVS/Caremark
Specialty Drugs
Share of
Retail
Billions $ Billions $
2009* 255.3 14.52 5.7%
2010 261.2 15.01 5.7%
2011 276.6 16.72 6.0%
2012 280.9 17.30 6.2%
2013 297.1 18.67 6.3%
2014 329.9 22.95 7.0%
2015* 356.7 27.13 7.6%
Contribution
to
Retail
Growth
$ Growth 2010-2014 68.7 7.9 11.6%
$ Growth 2009-2015 101.4 12.6 12.4%
* Estimates for 2009 and 2015 are re-weighted to reflect annual figure.
Source: ASPE analysis of IMS Health NPA data from October
2009 to September 2015.
ASPE Issue Brief Page 11
March 2016
Figure 1
$100
$150
$200
$250
$300
$350
$400
2009 2010 2011 2012 2013 2014 2015 2016 2017 2018
Bill
ion
s o
f N
om
inal
Do
llars
CMS Actuary
IMS
Sources: CMS Office of the Actuary (figures for 2014-2018 are projected), ASPE analysis of IMS Health NPA data (figures for 2009 and 2015 are based on partial-year estimates and are re-weighted to reflect a full year).
Historical and Projected Spending on Retail Prescription Drugs in Billions of Nominal Dollars, 2009 to 2018
ASPE Issue Brief Page 12
March 2016
Figure 2A
90%
100%
110%
120%
130%
140%
150%
2009* 2010 2011 2012 2013 2014 2015*
As
a %
of
20
09
Lev
els Retail Revenues
RetailPrescriptionUnits
Relative Cumulative Growth in Retail Expenditures and Retail Prescription Units, 2009 to 2015
All Prescription Drugs
Source: ASPE analysis of IMS Health NPA data from October 2009 to September 2015. * Figures are weighted to reflect calendar year value based on partial-year data.
ASPE Issue Brief Page 13
March 2016
Figure 2B
-50%
0%
50%
100%
150%
200%
2009* 2010 2011 2012 2013 2014 2015*
Retail Revenues
Retail Prescription Units
Relative Cumulative Growth in Retail Expenditures and Retail Prescription Units, 2009 to 2015
Brand-Name Drugs
-50%
0%
50%
100%
150%
200%
2009* 2010 2011 2012 2013 2014 2015*
Generic Drugs
Retail Revenues
Retail Prescription Units
Source: ASPE analysis of IMS Health NPA data from October 2009 to September 2015. * Figures are weighted to reflect calendar year value based on partial-year data.
ASPE Issue Brief Page 14
March 2016
Figure 3
0%
10%
20%
30%
40%
50%
60%
70%
80%
Oct
-09
Mar
-10
Au
g-1
0
Jan
-11
Jun
-11
No
v-1
1
Ap
r-1
2
Sep
-12
Feb
-13
Jul-
13
De
c-1
3
May
-14
Oct
-14
Mar
-15
Au
g-1
5
Brand-Name Drugs as a Share of All Retail Prescription Drug Spending And Prescriptions, 2009-2015
Share of Spending
Share ofPrescription Units
Source: ASPE analysis of IMS Health NPA data from October 2009 to September 2015.
ASPE Issue Brief Page 15
March 2016
Figure 4
0%
1%
2%
3%
4%
5%
6%
7%
8%
9%
Oct
-09
Feb
-10
Jun
-10
Oct
-10
Feb
-11
Jun
-11
Oct
-11
Feb
-12
Jun
-12
Oct
-12
Feb
-13
Jun
-13
Oct
-13
Feb
-14
Jun
-14
Oct
-14
Feb
-15
Jun
-15
CVS Specialty Formulary Drugs as a Share of all Retail Drug Spending
Source: ASPE analysis of IMS Health NPA data from October 2009 to September 2015.
ASPE Issue Brief Page 16
March 2016
Figure 5
18%
19%
20%
21%
22%
23%
24%
Oct
-09
Feb
-10
Jun
-10
Oct
-10
Feb
-11
Jun
-11
Oct
-11
Feb
-12
Jun
-12
Oct
-12
Feb
-13
Jun
-13
Oct
-13
Feb
-14
Jun
-14
Oct
-14
Feb
-15
Jun
-15
"High Cost" Drugs as a Fraction of All Retail Expenditures on Prescription Drugs, 2009 to 2015
Source: ASPE anaysis of IMS Health NPA data from October 2009 to September 2015.