health care costs from birth to death sponsored by … · health care costs—from birth to death...
TRANSCRIPT

Health Care Costs—From Birth to Death
Sponsored by
Society of Actuaries
Prepared by
Dale H. Yamamoto June 2013
Part of the Health Care Cost Institute’s
Independent Report Series – Report 2013-1
© 2013 Society of Actuaries, All Rights Reserved
This study was funded and supported by the Society of Actuaries, and is part of the Health Care Cost Institute’s series of
independent research projects using its commercial health care claims database. Any opinions and conclusions expressed are
those of the author and not those of the Society of Actuaries or its members nor the Health Care Cost Institute. Neither the
Society of Actuaries nor the Health Care Cost Institute make any representation or warranty as to the accuracy of the information.

© 2013 Society of Actuaries, All Rights Reserved - i - Version 2
Executive Summary This study used commercial data held by the Health Care Cost Institute (HCCI) and Medicare fee-for-
service data to analyze health care cost differences by age and their contribution to overall health care
cost change. The commercial data includes claims from 2002 through 2010 and the Medicare data
includes claims from 2006 through 2010. This analysis offers insights into the following questions:
What is the impact of the aging of America and its contribution to historical health care cost trends?
How will health care reform impact premium rates (specifically, the Affordable Care Act’s limitation
on premium rate differences between the highest and lowest age-based rate)?
How might changes in age-related eligibility impact Medicare spending?
What differences in costs exist by age and by different groups (e.g., gender, employee/dependent,
group/individual and plan type)?
How do various disease conditions impact costs by age?
How can better understanding of age-related costs help improve actuarial valuations of retiree
health care programs?
Overall In general, the analysis shows that health care costs increase by age with the exception of the very
youngest ages. Costs, on average, are very high in the first year or two of birth and drop significantly by
age five. At that point, costs increase modestly through the teen years. Female costs then begin to
accelerate more quickly during child-bearing ages and flatten out in the 40s before increasing again.
Male costs are relatively flat in the 20s and begin to accelerate after age 30, but remain lower on a per
person basis than females in the same age group. The “cross-over age” occurs in the early 60s, when per
capita spending for males exceeds that for females. Medicare costs (excluding private and Medicaid-
financed long-term care) for beneficiaries age 65 and older continue to increase with age. Males
continue to have higher costs than females for whom per person costs start to decline around age 90.
Commercial Aging Curve (Chart 1) Medicare Aging Curve (Chart 10)
The preceding two charts are from the main text of the report. Chart 1 shows the age/gender curve for
the commercial population from birth to age 64. The Medicare Aging Curve (Chart 10) shows the
continuing aging curve for the 65 and over Medicare population. Separate indices were developed for
-
0.50
1.00
1.50
2.00
2.50
3.00
3.50
4.00
0 10 20 30 40 50 60
2002 Male 2010 Male 2002 Female 2010 Female
0.00
0.20
0.40
0.60
0.80
1.00
1.20
1.40
1.60
1.80
2.00
65 70 75 80 85 90 95 100
2006 Male 2006 Female 2007 Male 2007 Female 2008 Male
2008 Female 2009 Male 2009 Female 2010 Male 2010 Female

© 2013 Society of Actuaries, All Rights Reserved - ii - Version 2
the commercial and Medicare populations due to their different provider reimbursement rates (i.e.,
negotiated discount versus administratively set prices). Using indices rather than costs also allows for
comparison between years. Both commercial and Medicare costs were based on “allowed charges,”
which are the costs of health care services that reflect discounts (in the case of commercial plans) and
include both the amounts owed by the health plan (or the federal government) and the insured member
(or Medicare beneficiary).
Key Uses and Findings 1. The changing demographics of age and gender have contributed from 7 percent to 10 percent of the
real growth in per capita health care costs (less than 0.5 percent per year) depending on the period
studied. This is consistent with other studies’ findings.
2. Inpatient services showed the most variation in use by age, in particular, with female costs
increasing during child-bearing ages and then decreasing until they begin to increase again in the
mid-40s. (This study looked at costs by inpatient, outpatient, professional and outpatient
prescription drugs.) Outpatient and prescription drug costs were relatively stable with exponential
growth by age.
3. Chronic conditions in the young (under age 30) take a higher relative toll on that population than
they do for the older population. For commercial members under age 30 identified with cancer or
circulatory conditions, there was significant variation by age in the ratio of their costs to the costs of
the entire population under age 30, and their costs were much higher on average. In contrast, when
costs for members age 30 and older with three chronic conditions—cancer, circulatory and
musculoskeletal conditions—were compared to the total cost of that population, results showed
relatively stable ratios of those with the condition compared to all (around 2 to 1) members above
age 30.
4. Between 2002 and 2010, an established pattern of an increase in health care costs for females in
their child-bearing years (20-44) has shifted outward by three years – meaning that higher costs for
women are occurring later in the child-bearing window. This may reflect well-documented recent
trends of women delaying childbirth.
5. The age-related premium policy established by CMS in its implementation of the Affordable Care Act
will increase premiums for younger individuals and decrease them for older individuals purchasing
individual health insurance. By analyzing the underlying costs per age for the population (both male
and female) and comparing it to the new approach for individual coverage purchased in state-based
exchanges, we found that premiums for individuals in their 20s will subsidize the cost of health
insurance for individuals in their 60s. For example, the average cost index for those age 21 through
29 is 27 percent higher under the CMS proposed age curve compared to 3 percent lower for those
age 60 through 64.
6. Changes in the eligibility age for Medicare would raise the average per capita cost for the Medicare
population because younger and relatively healthier beneficiaries would no longer be eligible. If the
eligibility age were changed from age 65 to age 70 for example, while total Medicare spending
would decline overall, the per capita cost would increase 12 percent because the 65 to 69 year old

© 2013 Society of Actuaries, All Rights Reserved - iii - Version 2
participants are generally the lower cost members. The costs of that change would be borne by the
federal government and beneficiaries through their subsidized premiums.
7. The future health care needs for a retiree vary by the retiree’s current age and their expected
lifetime, but are estimated to be about $146,400 for someone currently age 65 with an average
expected lifetime of 20 years ($292,800 for a couple of the same age). That amount includes health
care costs not paid for by the federal government through the Medicare program (including
Medicare Parts B and C premiums). If they think they will live until age 90 (25 years instead of 20
years) they will need $220,600 (or $441,200 for a couple). These amounts are for the “average”
retiree and do not include long term care costs that some retirees may incur.
From the government’s perspective, they will spend, on average, nearly $450,000 for the new
age 65 Medicare beneficiary during their expected lifetime (20 years).
8. For retirees suffering from certain chronic conditions (cancer, circulatory and musculoskeletal),
health care costs not paid for by the federal government through Medicare can easily exceed
$300,000 (twice the estimates for all individuals).

© 2013 Society of Actuaries, All Rights Reserved - iv - Version 2
Contents Executive Summary ........................................................................................................................................ i
Overall ........................................................................................................................................................ i
Key Uses and Findings ............................................................................................................................... ii
Introduction .................................................................................................................................................. 1 Overall Pre-Medicare Costs .......................................................................................................................... 1
Costs by Year ............................................................................................................................................. 1
Costs by Insured Group ............................................................................................................................. 3
Costs by Product Type ............................................................................................................................... 4
Costs by Relationship ................................................................................................................................ 4
Unisex Cost Curve ..................................................................................................................................... 5
Pre-Medicare Costs by Service ...................................................................................................................... 7 Inpatient Facility Costs .............................................................................................................................. 7
Outpatient Facility Costs ........................................................................................................................... 8
Professional Service Costs ......................................................................................................................... 8
Pharmacy Costs ......................................................................................................................................... 9
Overall Medicare Costs ............................................................................................................................... 10 Costs by Year ........................................................................................................................................... 11
Medicare Costs by Service .......................................................................................................................... 12 Inpatient Facility Costs ............................................................................................................................ 12
Outpatient Facility Costs ......................................................................................................................... 14
Professional Service Costs ....................................................................................................................... 16
Pharmacy Costs ....................................................................................................................................... 17
Medicare Benefit Payments ........................................................................................................................ 18 Combined Net Medicare Costs ................................................................................................................... 21 Commercial Medicare Data ........................................................................................................................ 23 Health Care Costs by Condition .................................................................................................................. 23
Implications of Conditions .................................................................................................................. 27
Five-Year Age Group Curve ......................................................................................................................... 28 Aging in Health Care Costs of the United States ......................................................................................... 30 Follow-Up Studies ....................................................................................................................................... 33 Data, Methods and Assumptions ................................................................................................................ 33
Data ......................................................................................................................................................... 33
Methods .................................................................................................................................................. 34
Assumptions ............................................................................................................................................ 37
Appendix ..................................................................................................................................................... 38

© 2013 Society of Actuaries, All Rights Reserved - 1 - Version 2
Introduction This study was made possible by detailed claims data available from the Health Care Cost Institute
(HCCI) from its database of commercial medical claims and the five-percent sample of Medicare claims.
The commercial data included claims for all services including inpatient, outpatient, professional and
prescription drugs. The Medicare data included data for the fee-for-service members under the
Medicare Hospital Insurance program (HI or Part A) and the Supplementary Medical Insurance program
(SMI or Part B). Data was not available for the Medicare prescription drug program (Part D).
The commercial data included book-of-business data for three major health plan carriers with over 30
million members and $130 billion in claims in 2010. The Medicare data for 2010 included 1.2 million
members and over $14 billion in claims.
Both the commercial data and the Medicare data are allowed charges. That is, they are the amounts
that the benefit calculations are based on, after provider discounts, and before any plan design
provisions are applied. Since there is a large difference in allowed charges between commercial carriers
and Medicare that is documented in other studies, the aging curve analysis has been done separately for
the two sets of data. In addition, this study also analyzed the age curve for the costs that Medicare does
not pay (i.e., the Medicare allowed charge minus the Medicare benefit payment) as these are the
amounts that other private payers may pay in supplemental coverage to Medicare.
Overall Pre-Medicare Costs Commercial data from the HCCI database were compiled for calendar years 2002 through 2010. The
data was separately compiled by insured group (individual versus employer-sponsored or group
business), product type (HMO versus POS/PPO product lines) and by major diagnosis groups (by
standard DRG for inpatient care and assignment based on major diagnosis codes for other services).
Per capita costs were summarized by single age and gender for each year. These costs were graduated
using the Whitaker-Henderson method and are primarily shown in graphic form throughout this report.
The costs were indexed to the average cost for each year weighted by the aggregate 2010 membership.
Using the same membership as weights eliminates the effect of changing demographics over time.
Detailed results are shown in tables in the appendix.
Costs by Year The following chart shows the cost index for 2002 and 2010 for all insured groups, product types and
diagnostic groups. Note that this was not a longitudinal study of the same members but an analysis of
costs by age and gender for those enrolled in the plans in each year. That is, an annual snapshot of costs
of then covered members.

© 2013 Society of Actuaries, All Rights Reserved - 2 - Version 2
Chart 1: Aggregate Commercial Costs by Age 2002 and 2010
At a high level, the age curve is not significantly different between the two years for this pre-Medicare
population. There are two key findings from the above chart by comparing the 2002 lines to the 2010
lines. One, relative per capita costs have increased between 2002 and 2010 for both males and females
from around ages 8 to 20. Two, the increase in costs for females have shifted almost three years for
those in their 20s likely due to the delay in childbirth. This is consistent with other studies and anecdotal
commentary. It is supported by the birth rate statistics from the U.S. Census Bureau. The following table
shows the birth rate per 1,000 women for the same two years.
Table 1. Births per 1,000 Women1
Ages 2002 2010 % Change
15 to 19 years 55.9 29.3 - 48%
20 to 24 years 90.0 87.3 - 3%
25 to 29 years 97.2 96.6 - 1%
30 to 34 years 83.6 82.6 - 1%
35 to 39 years 41.9 50.7 21%
40 to 44 years 11.9 12.6 6%
The above chart shows decreased birth rates for women to age 34 and an increase for women 35 to 44
which are consistent with the change in the female age curve over the same ages.
In general, relative per capita costs are high in the first year of life and decline until around age 8 and
remain relatively level until age 20 for females and 30 for males. There is a rapid increase in relative
costs for females at child-bearing ages to about age 30 and the cost levels off during the 30s and early
40s and then begins to increase through to Medicare age. Whereas, male costs begin to increase at age
1. U.S. Census Bureau. Current Population Reports, Fertility of American Women. Washington: U.S. Census Bureau,
2010.
-
0.50
1.00
1.50
2.00
2.50
3.00
0 10 20 30 40 50 60
2002 Male 2010 Male 2002 Female 2010 Female

© 2013 Society of Actuaries, All Rights Reserved - 3 - Version 2
30 and continue to increase through to Medicare age. Male relative costs are below female relative
costs for most ages until they cross over at about age 60. The cross-over age has moved from age 61 in
2002 to age 59 in 2010. It is beyond the scope of this paper to speculate why this change has happened
but it is interesting to also study the age curve by service (inpatient, outpatient, professional services
and prescription drugs) as the cross-over ages are very different.
Costs by Insured Group The following chart shows costs by individual versus group business for the 2009 and 2010 calendar
years.
Chart 2: Individual and Group Costs by Age for 2009-10
Individual and group business show similar relative cost patterns by age with the individual slopes
slightly flatter than the group slopes. The maternity bump seen in the group age slope for females is less
pronounced in the individual business and the index (i.e., costs relative each group’s average) is
generally less than the group market at most ages. This is likely because many individual plans do not
cover maternity costs. The age slope for males are very similar for the two markets with slightly higher
costs at the younger ages in the individual market compared to the group market that is likely reflecting
risk selection in the market.
It is important to keep in mind that the differences in the age curve between individual and group
business is not an indicator of cost relationships between the two business segments. Each business
group’s age curve is a representation of the relative differences in costs by age and gender within the
business group. Therefore, it is valid to state that males aged 30 are a lower cost than females of the
same age, on average, and are lower cost than older males for both the individual and group business
segments. It is not valid to say that a male age 30 covered under an individual contract is higher cost
than a male age 30 covered under a group contract.
-
0.50
1.00
1.50
2.00
2.50
3.00
0 10 20 30 40 50 60
2009-10 Individual Male 2009-10 Individual Female 2009-10 Group Male 2009-10 Group Female

© 2013 Society of Actuaries, All Rights Reserved - 4 - Version 2
Costs by Product Type The PPO/POS versus HMO product type comparison is made with the group market because the
individual market exposure in the collected data is not as robust as the group market. From an analysis
perspective, focusing on just the group market eliminates any bias that there may be between the group
and individual markets. The following shows the costs by PPO/POS and HMO plan types by age and
gender for the 2009 and 2010 calendar years.
Chart 3: HMO versus PPO/POS Costs by Age for 2009-10
The relative costs by age are very similar between PPO/POS and HMO plan types with some variations
that fit anecdotal commentary about why people select the two types of plans. Young families
oftentimes elect HMO coverage for its more robust coverage of routine care and maternity benefits. The
similarity of the age curve slopes indicates that there is little difference between plan types to flatten
the costs by age. However, it should be kept in mind that the predominant type of HMO network is an
independent physician arrangement (IPA) rather than a group or staff model for the insurers included in
this analysis.
The comment made when comparing the individual to group age curves applies with this comparison.
The index for each market type is relative to the average cost for that particular market and is not an
indicator of relative cost differences between the HMO and PPO/POS markets.
Costs by Relationship Costs by subscriber and dependent members yield interesting results. The following chart shows the
results of the total commercial group coverage population between subscriber and dependent
members. About one percent of the population was excluded because of the lack of relationship code.
-
0.50
1.00
1.50
2.00
2.50
3.00
0 10 20 30 40 50 60
2009-10 HMO Male 2009-10 HMO Female 2009-10 PPO/POS Male 2009-10 PPO/POS Female

© 2013 Society of Actuaries, All Rights Reserved - 5 - Version 2
Chart 4: Subscriber versus Dependent Costs by Age for 2009-10 (Group Only)
Of course, there are no costs for subscribers at the children’s ages, but beyond age 20 for males and 50
for females there is a relatively uniform difference between subscriber and dependent costs. For
dependents under age 18, there is a small difference in costs by gender. The male and female age curve
for dependents dramatically diverge beginning at age 18. Dependent males above age 20 are about 20
percent higher than the same aged subscriber male. Females above age 50 are about 12 percent higher
than their subscriber counterparts. During child-bearing ages, dependent females have accelerated costs
at about five years before subscriber females. Dependent female costs show a peak in their index at age
30 and decline for a short period. Subscriber female costs do not show a similar peak in slope but rather
have a steady increase. Female costs converge at about age 38 and begin diverging again at about age
45.
Unisex Cost Curve The Affordable Care Act requires insurers to develop premium rates that vary by age only and not
gender. In addition, they are limited to a maximum 3:1 ratio of the highest rate to the lowest rate.
Recent regulations have proposed a uniform age curve that states may adopt. The following compares
the 2010 relative cost curve of an average unisex set of per capita costs and the proposed age curve to
the gender based cost curves. The underlying data is group PPO/POS coverages for 2010.
0.00
0.50
1.00
1.50
2.00
2.50
3.00
3.50
0 10 20 30 40 50 60 70
Subscriber Male Subscriber Female
Dependent Male Dependent Female

© 2013 Society of Actuaries, All Rights Reserved - 6 - Version 2
Chart 5: Unisex Cost Curve by Age for 2010
Chart 5 shows the unisex aging curve (the black dashed line) based on the membership underlying the
2010 experience data. Since the membership is close to 50/50 male/female, the resulting curve is very
close to the average of the male and female curves.
The grey dashed line shows the proposed standard age curve from CMS to meet the ACA’s 3:1 rate ratio
limit in their proposed regulations issued November 26, 2012.2 It was adjusted for the membership of
the same 2010 experience data. The proposed age curve is flat under age 21 and, as stated in the
proposed regulations, is not part of the 3:1 rate restriction. The proposed regulation interprets the 3:1
limitation to be a constraint on premium rates for adults and not children. The proposed flat index
under age 21 is about 0.47 when setting the proposed age curve to the same indexing as the study uses
(i.e., relative to the average cost). The data from the study averages to an index of 0.53 for those under
age 21. This average is highly dependent on the enrollment distribution for the under age 21 population
so the difference in the average is not surprising. The proposed age curve is higher from age 21 through
age 35 than the calculated unisex age curve of the study’s data. From ages 35 through 55, the proposed
age curve is very close to the calculated unisex age curve and then begins to diverge (lower) after age
55. Assuming that all of the membership in the database continues to be insured, this implies that young
adults (those age 21 through 35) will subsidize older adults (aged 60 and older) in the new health
insurance programs. On average, the young adults (age 21 through 35) cost index is 15 percent higher3
under the CMS proposed age curve and the older adults (age 60-64) are 3 percent lower. At the
extreme, the age 21 average person’s cost index is 50 percent higher under the proposed age curve and
the age 64 average person is 7 percent lower. From a gender perspective, males will subsidize females
2 Patient Protection and Affordable Care Act; Health Insurance Market Rules; Rate Review, Centers for Medicare &
Medicaid Services, HHS, Proposed Rule, Federal Register, Vol. 77, No. 227, November 26, 2012, page 70595. 3 For those age 21 through 29, the proposed age curve is 27 percent higher than the study’s unisex age curve.
0.00
0.50
1.00
1.50
2.00
2.50
3.00
3.50
0 10 20 30 40 50 60
Male Female Unisex CMS Proposed

© 2013 Society of Actuaries, All Rights Reserved - 7 - Version 2
for most years until age 60 where the proposed unisex index is less than both the male and female
indices.
Pre-Medicare Costs by Service Per capita costs were summarized by single age and gender for each year by major service categories
(inpatient facility, outpatient facility, professional services and prescription drugs). The following charts
show the results for all experience years by each major service for the group PPO line of business. All
other lines of business show similar results but the group PPO line has greater exposure and therefore
more credible data broken down by service. Each chart uses the same scale. Detailed results are shown
in tables in the appendix.
Inpatient Facility Costs The inpatient facility costs by age showed the greatest variation by age. The index by gender is very
consistent from year to year. The index at the very earliest ages has values exceeding 10.0. The
graduation method does not do a very good job in smoothing data that have extreme changes, so raw
data results are shown for ages 3 through 7. Other than the child-bearing ages for females, the inpatient
facility curve is nearly unchanged over the last ten years.
Chart 6: Inpatient Facility Costs by Age and Experience Year
Inpatient costs show a very significant cost increase for females during the child-bearing ages reflecting
the costs of delivery with a distinctive peak in the early 30s. Inpatient services exceed the 2.00 cost
index (i.e., over two times the average cost of the whole group) at the oldest ages for both male and
female and this variance has been consistent over time. Inpatient costs show the greatest difference of
-
0.50
1.00
1.50
2.00
2.50
3.00
3.50
4.00
0 2 4 6 8 10 12 14 16 18 20 22 24 26 28 30 32 34 36 38 40 42 44 46 48 50 52 54 56 58 60 62 64
2002-03 Male 2002-03 Female 2004-05 Male 2004-05 Female
2006-07 Male 2006-07 Female 2008-09 Male 2008-09 Female
2010 Male 2010 Female

© 2013 Society of Actuaries, All Rights Reserved - 8 - Version 2
male over female costs after age 50 than any of the other service groups. Also, the cross-over age where
male costs exceed female costs is around age 50 instead of age 60 for all services combined.
Outpatient Facility Costs After the slight decline and rise during the adolescent ages, the outpatient facility costs by age exhibit a
consistently increasing age curve. The bump seen in the overall costs during child-bearing ages is not as
evident with these costs. Female costs by ages show greater variation over the years than the male
costs. In particular, their costs have lowered relative to the average over the years for females in their
20s and have increased for females in their 40s and 50s.
Chart 7: Outpatient Facility Costs by Age and Experience Year
Female costs show a relatively steady increase in costs during adulthood while male cost increases are
more exponential. Costs at the youngest ages are relatively modest with costs below the overall average
(i.e., index less than 1.00) for all ages.
Professional Service Costs Professional service costs show very high costs at the earliest ages that declines sharply and then level
off from ages 5 through about 22 and then begin increasing throughout adulthood. A very rapid increase
in costs is evident for females during child-bearing ages. In addition, the apparent shift over the years
for females in those years reflects the observed delay of child birth discussed earlier in this report.
-
0.50
1.00
1.50
2.00
2.50
3.00
3.50
4.00
0 2 4 6 8 10 12 14 16 18 20 22 24 26 28 30 32 34 36 38 40 42 44 46 48 50 52 54 56 58 60 62 64
2002-03 Male 2002-03 Female 2004-05 Male 2004-05 Female
2006-07 Male 2006-07 Female 2008-09 Male 2008-09 Female
2010 Male 2010 Female

© 2013 Society of Actuaries, All Rights Reserved - 9 - Version 2
Chart 8: Professional Service Costs by Age and Experience Years
Professional service costs show a very similar curve as the overall cost curve although the male costs do
not exceed female costs at any adult age.
The female age curve has flattened out over the years with relative costs throughout the childbearing
ages lower in the more recent years and also at the older ages. The male age curve has remained
relatively stable over the years with slightly lower relative costs in the late 20s and early 30s.
Pharmacy Costs Pharmacy costs increase during early childhood and crest in the late teens. Male costs then drop until
the mid-20s and begin a geometric increase after, while females do not experience a similar drop. The
aging curves for males do not seem to differ over the years while females appear to trend downward
over the nine year period. Both the male and female age curves have increased relative to the average
in the teen years and early 20s.
-
0.50
1.00
1.50
2.00
2.50
3.00
3.50
4.00
0 2 4 6 8 10 12 14 16 18 20 22 24 26 28 30 32 34 36 38 40 42 44 46 48 50 52 54 56 58 60 62 64
2002-03 Male 2002-03 Female 2004-05 Male 2004-05 Female
2006-07 Male 2006-07 Female 2008-09 Male 2008-09 Female
2010 Male 2010 Female

© 2013 Society of Actuaries, All Rights Reserved - 10 - Version 2
Chart 9: Pharmacy Costs by Age and Experience Years
Overall Medicare Costs The Medicare 5% samples only include data for fee-for-service Medicare beneficiaries and have both
allowed charges (the amount on which Medicare benefits are based) and the amount of the Medicare
benefit payment. The following analysis reviews cost relativities of both the Medicare total allowed
charge and the Medicare net allowed amount. The Medicare net allowed amount is determined as the
difference of the Medicare total allowed amount and the Medicare benefit payment. This is, in essence,
the amount of costs that may be considered allowable charges for any private supplemental plan
(e.g., employer-sponsored integrated plan, individual Medicare supplement or Medigap plan). A third
Medicare cost that could be analyzed by age and gender is the Medicare benefit payment amount itself.
Such an age curve could be used by someone projecting the cost of Medicare benefit payments. In
general, the shape of a Medicare benefit payment age curve will be very similar to the allowed charge so
this particular measure is not shown in this study except for a very high level comparison in Chart 20.
Data is available for calendar years 2006 through 2010. Unless specified, the Medicare charts do not
include prescription drugs, as the Part D (the Medicare outpatient prescription drug program) data is not
included.
-
0.50
1.00
1.50
2.00
2.50
3.00
3.50
4.00
0 2 4 6 8 10 12 14 16 18 20 22 24 26 28 30 32 34 36 38 40 42 44 46 48 50 52 54 56 58 60 62 64
2002-03 Male 2002-03 Female 2004-05 Male 2004-05 Female
2006-07 Male 2006-07 Female 2008-09 Male 2008-09 Female
2010 Male 2010 Female
© 2013 Society of Actuaries, All Rights Reserved - 11 - Version 2
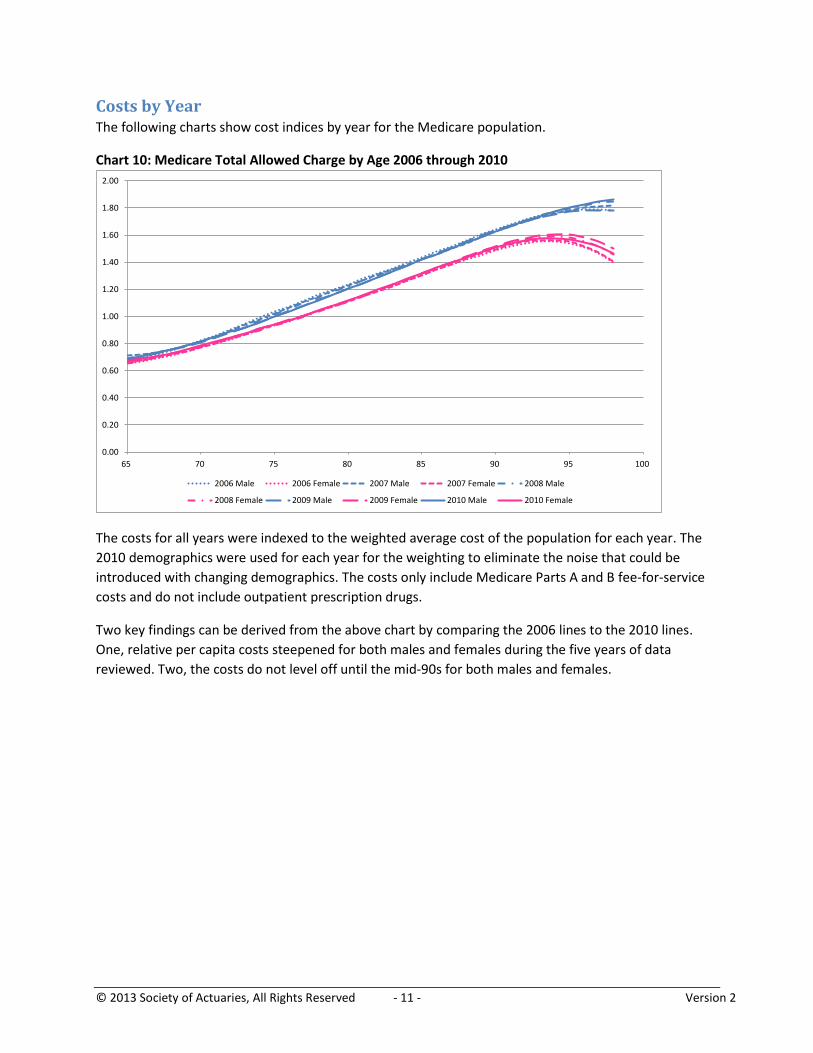
Costs by Year The following charts show cost indices by year for the Medicare population.
Chart 10: Medicare Total Allowed Charge by Age 2006 through 2010
The costs for all years were indexed to the weighted average cost of the population for each year. The
2010 demographics were used for each year for the weighting to eliminate the noise that could be
introduced with changing demographics. The costs only include Medicare Parts A and B fee-for-service
costs and do not include outpatient prescription drugs.
Two key findings can be derived from the above chart by comparing the 2006 lines to the 2010 lines.
One, relative per capita costs steepened for both males and females during the five years of data
reviewed. Two, the costs do not level off until the mid-90s for both males and females.
0.00
0.20
0.40
0.60
0.80
1.00
1.20
1.40
1.60
1.80
2.00
65 70 75 80 85 90 95 100
2006 Male 2006 Female 2007 Male 2007 Female 2008 Male
2008 Female 2009 Male 2009 Female 2010 Male 2010 Female

© 2013 Society of Actuaries, All Rights Reserved - 12 - Version 2
Chart 11: Medicare Net Allowed Amount by Age 2006 through 2010
The relative cost curve is flatter for the above Medicare net allowed amounts than the underlying
Medicare total allowed charges. The key difference would be the Medicare benefit design that results in
a lower proportion of inpatient costs in the net allowed amount than in the Medicare total allowed
charge. Inpatient costs for the Medicare net allowed amounts primarily include the Part A inpatient
deductible with the coinsurance payments for long term hospital stays to a lesser degree. The difference
in the shape of the curve from the Medicare net allowed amount chart implies that inpatient cost by age
is the key driver of the Medicare total allowed charge curve trend over time. During the five year
period, it visibly appears that the cost curve has flattened. The 2006 age curve seems to be an anomaly
relative to the other four years and suggests that it should be ignored.4
Medicare Costs by Service Similar to the pre-Medicare analysis by service, per capita costs were summarized by single age and
gender for each year by major service categories (inpatient facility, outpatient facility, professional and
prescription drugs) for Medicare members. The following charts show the results for all experience
years by each major service, first for Medicare Total Allowed Charge, then for Medicare Net Allowed
Amount. All charts are shown with a scale from 0.00 to 2.00 except for inpatient facility costs that use an
expanded scale to 3.00. Detailed results are shown in tables in the appendix.
Inpatient Facility Costs The inpatient facility costs by age showed the greatest variation of the four service categories. The
indexes at the oldest ages have values exceeding 2.0. In addition, other than the older ages, the
inpatient facility curve is nearly unchanged over the last ten years. 4 This anomaly was shown to CMS Office of the Actuary and they were not aware of any design difference between
2006 and the other years that would yield such a difference.
0.00
0.20
0.40
0.60
0.80
1.00
1.20
1.40
1.60
1.80
2.00
65 70 75 80 85 90 95 100
2006 Male 2006 Female 2007 Male 2007 Female 2008 Male
2008 Female 2009 Male 2009 Female 2010 Male 2010 Female

© 2013 Society of Actuaries, All Rights Reserved - 13 - Version 2
Chart 12: Inpatient Facility Costs by Age and Experience Year—Medicare Total Allowed Charge
Chart 13: Inpatient Facility Costs by Age and Experience Year—Medicare Net Allowed Amount
0.00
0.50
1.00
1.50
2.00
2.50
3.00
65 67 69 71 73 75 77 79 81 83 85 87 89 91 93 95 97
2006 Male 2006 Female 2007 Male 2007 Female2008 Male 2008 Female 2009 Male 2009 Female2010 Male 2010 Female
0.00
0.50
1.00
1.50
2.00
2.50
3.00
65 67 69 71 73 75 77 79 81 83 85 87 89 91 93 95 97
2006 Male 2006 Female 2007 Male 2007 Female2008 Male 2008 Female 2009 Male 2009 Female2010 Male 2010 Female

© 2013 Society of Actuaries, All Rights Reserved - 14 - Version 2
The age curve for Medicare allowed charges is very similar for all study years but departs at the older
ages. The male age curve for 2010 shows an increasing cost trend relative to the average over the other
experience years but there is not a consistent change by year. The 2009 age curve is very similar to the
2006 age curve but the 2007 and 2008 age curves are between the 2006 and 2010 age curves. The
female age curve at these older ages show more sporadic variation with the 2009 age curve having the
highest index values and the 2010 age curve in the middle of the high 2009 age curve and the low 2006
age curve.
The curve for the Medicare net allowed amounts produces an interesting pattern relative to the
Medicare total allowed charge cost curve. First the 2006 curve seems to be much different than the
other years and should probably be disregarded in any trend observations. However, it is consistent with
the following years in that the Medicare net allowed amount cost curve is flattening out between 2007
and 2010.
The Medicare net allowed amount age curve also declines in the early years of Medicare coverage
before increasing again in the mid-70s and finally declining again in the mid-90s. The declining curve in
the 60s and the 90s are probably for different reasons. In the 60s, it is likely that the length of stay is less
than later ages so that the Part A inpatient deductible is a greater percentage of the Medicare total
allowed charge. This also implies that the hospital admission rate declines in the 60s which may be true
as the healthier beneficiaries who were working start to enroll in Medicare. The decline in the 90s seems
to correlate with the decline in overall Medicare total allowed charges.
Outpatient Facility Costs The outpatient facility costs by age exhibit a consistently increasing age curve until the mid-90s. Costs by
ages show greater variation in the later ages and indicate higher cost levels over time. The relative
female costs also decline at a greater rate in the 90s than the relative male costs.

© 2013 Society of Actuaries, All Rights Reserved - 15 - Version 2
Chart 14: Outpatient Facility Costs by Age and Experience Year—Medicare Total Allowed Charge
Chart 15: Outpatient Facility Costs by Age and Experience Year—Medicare Net Allowed Amount
0.00
0.20
0.40
0.60
0.80
1.00
1.20
1.40
1.60
1.80
2.00
65 67 69 71 73 75 77 79 81 83 85 87 89 91 93 95 97
2006 Male 2006 Female 2007 Male 2007 Female2008 Male 2008 Female 2009 Male 2009 Female2010 Male 2010 Female
0.00
0.20
0.40
0.60
0.80
1.00
1.20
1.40
1.60
1.80
2.00
65 67 69 71 73 75 77 79 81 83 85 87 89 91 93 95 97
2006 Male 2006 Female 2007 Male 2007 Female2008 Male 2008 Female 2009 Male 2009 Female2010 Male 2010 Female

© 2013 Society of Actuaries, All Rights Reserved - 16 - Version 2
Medicare net allowed amounts reflect a relatively flatter aging curve than the Medicare total allowed
charges. In fact, after peaking in the late 70s, the relative costs begin to decline. There appears to be an
increasing relative cost trend at the older ages over the years. Both the 2009 and 2010 age curves for
both males and females are higher than the 2006 through 2008 age curves which are relatively close
together.
Professional Service Costs Professional service costs show increasing costs until the mid-80s and then decline. The variation of the
curve over time is not as great as the inpatient and outpatient facility cost curves. However, it does
show an increasing cost relative to the average cost at the older ages over time. Both the male and
female age curves peak in the mid-80s and declines steadily at the older ages.
Chart 16: Professional Service Costs by Age and Experience Years—Medicare Total Allowed Charge
0.00
0.20
0.40
0.60
0.80
1.00
1.20
1.40
1.60
1.80
2.00
65 67 69 71 73 75 77 79 81 83 85 87 89 91 93 95 97
2006 Male 2006 Female 2007 Male 2007 Female2008 Male 2008 Female 2009 Male 2009 Female2010 Male 2010 Female

© 2013 Society of Actuaries, All Rights Reserved - 17 - Version 2
Chart 17: Professional Costs by Age and Experience Years—Medicare Net Allowed Amount
Professional service net allowed amounts show a similar curve as the total allowed charge cost curve
because of the design of the Part B program (i.e., relatively low deductible and 80 percent benefit with
no out-of-pocket limit).
Pharmacy Costs Medicare Part D pharmacy costs were not available from the 5% Medicare sample but there was data
available for the commercial business. This data shows an increasing cost curve until about age 80 and
then declines. Similar to the other Medicare data, costs show increasing relative costs over the last five
years.
0.00
0.20
0.40
0.60
0.80
1.00
1.20
1.40
1.60
1.80
2.00
65 67 69 71 73 75 77 79 81 83 85 87 89 91 93 95 97
2006 Male 2006 Female 2007 Male 2007 Female2008 Male 2008 Female 2009 Male 2009 Female2010 Male 2010 Female

© 2013 Society of Actuaries, All Rights Reserved - 18 - Version 2
Chart 18: Pharmacy Costs by Age and Experience Years—Medicare Ages
There are not as marked differences in the age curve by gender as the other services. The indices are
very close by gender in the 60s and begin to diverge in the 70s for all study years. There is a trend in the
female index showing higher relative costs over the years at ages above 80 while the male costs seem to
show declining relative costs with the 2010 index lower than the other years.
Medicare Benefit Payments A natural conclusion in studying the age curves for the total allowed Medicare charges and the net
allowed amounts would imply that the Medicare benefit payment would be the steepest slope. The
following chart compares the three for the 2010 study period (all costs exclude prescription drugs).
0.00
0.20
0.40
0.60
0.80
1.00
1.20
1.40
1.60
1.80
2.00
65 67 69 71 73 75 77 79 81 83 85 87 89 91 93 95 97
2006 Male 2006 Female 2007 Male 2007 Female
2008 Male 2008 Female 2009 Male 2009 Female
2010 Male 2010 Female
© 2013 Society of Actuaries, All Rights Reserved - 19 - Version 2
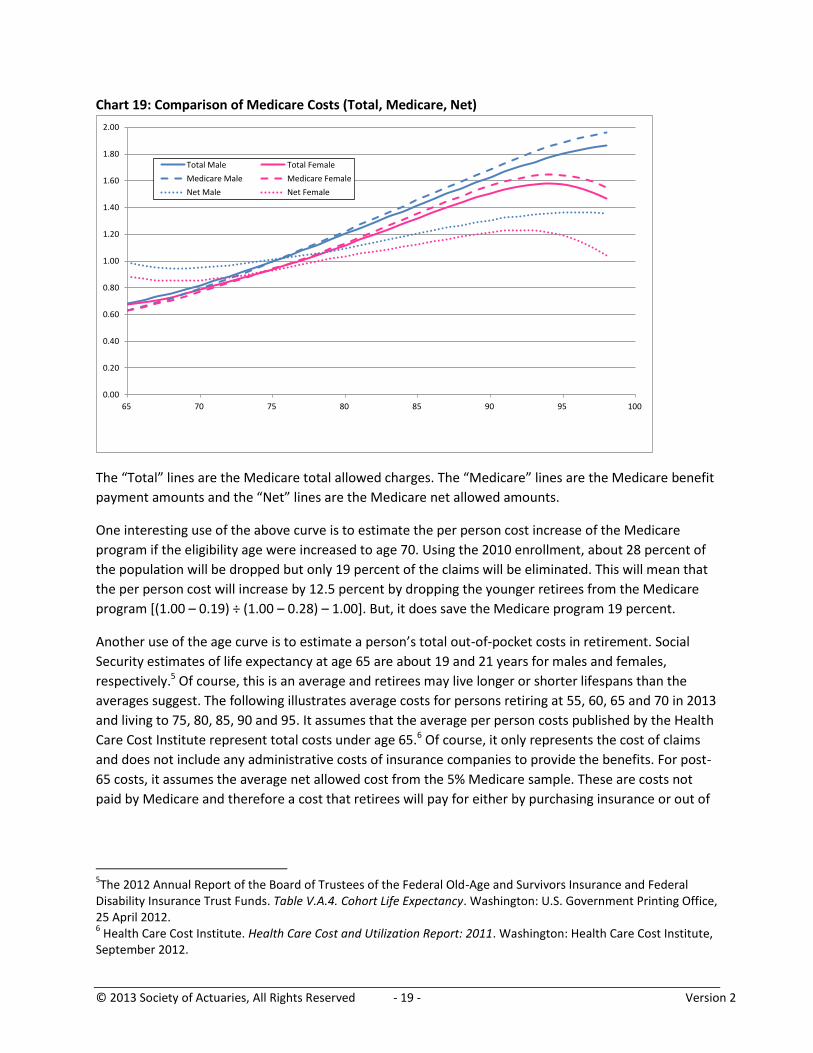
Chart 19: Comparison of Medicare Costs (Total, Medicare, Net)
The “Total” lines are the Medicare total allowed charges. The “Medicare” lines are the Medicare benefit
payment amounts and the “Net” lines are the Medicare net allowed amounts.
One interesting use of the above curve is to estimate the per person cost increase of the Medicare
program if the eligibility age were increased to age 70. Using the 2010 enrollment, about 28 percent of
the population will be dropped but only 19 percent of the claims will be eliminated. This will mean that
the per person cost will increase by 12.5 percent by dropping the younger retirees from the Medicare
program [(1.00 – 0.19) ÷ (1.00 – 0.28) – 1.00]. But, it does save the Medicare program 19 percent.
Another use of the age curve is to estimate a person’s total out-of-pocket costs in retirement. Social
Security estimates of life expectancy at age 65 are about 19 and 21 years for males and females,
respectively.5 Of course, this is an average and retirees may live longer or shorter lifespans than the
averages suggest. The following illustrates average costs for persons retiring at 55, 60, 65 and 70 in 2013
and living to 75, 80, 85, 90 and 95. It assumes that the average per person costs published by the Health
Care Cost Institute represent total costs under age 65.6 Of course, it only represents the cost of claims
and does not include any administrative costs of insurance companies to provide the benefits. For post-
65 costs, it assumes the average net allowed cost from the 5% Medicare sample. These are costs not
paid by Medicare and therefore a cost that retirees will pay for either by purchasing insurance or out of
5The 2012 Annual Report of the Board of Trustees of the Federal Old-Age and Survivors Insurance and Federal
Disability Insurance Trust Funds. Table V.A.4. Cohort Life Expectancy. Washington: U.S. Government Printing Office, 25 April 2012. 6 Health Care Cost Institute. Health Care Cost and Utilization Report: 2011. Washington: Health Care Cost Institute,
September 2012.
0.00
0.20
0.40
0.60
0.80
1.00
1.20
1.40
1.60
1.80
2.00
65 70 75 80 85 90 95 100
Total Male Total Female
Medicare Male Medicare Female
Net Male Net Female

© 2013 Society of Actuaries, All Rights Reserved - 20 - Version 2
their pockets. In addition, retirees will be required to pay the Medicare Part B and D premiums which
vary by income but most retirees will pay the standard premium rates which are used in this exhibit.7
Table 2: Health Care Costs in Retirement for Single Retiree in 2013
Retirement
Age
Life Expectancy
75 80 85 90 95
55 $ 206,200 $ 276,300 $ 372,400 $ 501,500 $ 672,500
60 123,400 176,500 249,300 347,200 476,800
65 50,900 91,200 146,400 220,600 318,800
70 23,000 53,700 95,500 151,800 226,200
The above amounts are for a single retiree in 2013. For a family of two, the amounts should be doubled.
They represent the present value of future expected health care costs that are not paid by Medicare. If
the above numbers were discounted to a present value number, they will be less. For example, the
$146,400 amount for an age 65 retiree living until age 85 would be $104,100 discounted at 3 percent
per year.
Fidelity Investments has been estimating a similar cost of medical expenses in retirement for the last
few years. Their latest estimate from 2012 was that a 65-year old couple would need $240,000 to cover
medical expenses thought retirement. That number is comparable to the 65 year old living to 85 shown
above which would be about $293,000 ($146,400 × 2).8
The Medicare payment costs can be used to illustrate the cost of providing Medicare benefits by the
government. Since the Medicare Parts A, B and C are financed in different ways, it is not easy to add up
their costs in a comparable fashion from the annual Trustees report. Starting with the 5% Medicare
sample in 2010, we can calculate the estimated costs per person in 2013 using the assumed trend rates
shown in the Methodology section. The resulting projected costs are shown below:
Table 3: Projected Medicare Costs for Single Retiree in 2013
Retirement
Age
Life Expectancy
75 80 85 90 95
65 $ 130,100 $ 250,700 $ 433,900 $ 705,400 $ 1,092,900
70 61,900 153,800 292,700 498,500 792,200
75 -- 72,600 178,600 334,500 557,100
80 -- -- 83,700 202,600 371,300
Assuming an average life expectancy to age 85 for a new Medicare beneficiary at age 65, the federal
government will spend, on average, $433,900 for their Medicare coverage. The chart also shows the
sensitivity of the government obligation to differences in life expectancy. If the new Medicare
7 See the Methodology section for details on the health care trend rate and other assumptions used in the
projections. 8 In Fidelity Investment’s press release, they assume that males have a life expectancy of 17 years and 20 years for
females. Fidelity. Fidelity Estimates Couples Retiring In 2012 Will Need $240,000 To Pay Medical Expenses Throughout Retirement. Boston: Fidelity, 12 May 2012.

© 2013 Society of Actuaries, All Rights Reserved - 21 - Version 2
beneficiaries were to live for 25 years instead of 20 years on average, the obligation increases by
63 percent to $705,400.
Combined Net Medicare Costs Using the net cost curves above can be used to derive plan specific age curves. For example, if we
assume the 2010 study year is an appropriate aging curve for the Medicare population and the plan’s
costs are allocated by the following:9
Inpatient 20%
Outpatient 10%
Professional 10%
Pharmacy 60%
Then the following age curve assumption may be derived.
Table 4: Development of Plan Specific Medicare Age Curve
20.00% 10.00% 10.00% 60.00% 100.00%
Inpatient Outpatient Professional Pharmacy Total
Age Male Female Male Female Male Female Male Female Male Female
65 1.296 0.873 0.996 1.022 0.763 0.836 0.778 0.769 0.902 0.822
66 1.184 0.801 1.004 1.018 0.800 0.858 0.834 0.824 0.917 0.842
67 1.091 0.745 1.015 1.014 0.835 0.880 0.883 0.872 0.933 0.862
68 1.018 0.706 1.026 1.011 0.869 0.901 0.927 0.915 0.949 0.881
69 0.964 0.682 1.038 1.010 0.902 0.922 0.965 0.951 0.966 0.900
70 0.927 0.672 1.050 1.009 0.934 0.942 0.999 0.982 0.983 0.918
71 0.904 0.673 1.062 1.008 0.964 0.961 1.028 1.007 1.000 0.936
72 0.890 0.683 1.072 1.006 0.993 0.979 1.052 1.029 1.016 0.952
73 0.884 0.699 1.080 1.003 1.022 0.995 1.072 1.046 1.030 0.968
74 0.884 0.720 1.088 0.998 1.048 1.010 1.089 1.061 1.044 0.982
75 0.888 0.745 1.092 0.993 1.074 1.024 1.103 1.073 1.056 0.995
76 0.896 0.774 1.095 0.986 1.098 1.036 1.114 1.083 1.067 1.007
77 0.911 0.809 1.095 0.978 1.120 1.047 1.124 1.089 1.078 1.018
78 0.932 0.851 1.092 0.970 1.141 1.056 1.132 1.094 1.089 1.029
79 0.962 0.900 1.088 0.961 1.159 1.064 1.137 1.097 1.099 1.040
80 1.001 0.958 1.082 0.952 1.175 1.070 1.137 1.096 1.108 1.051
81 1.047 1.023 1.076 0.943 1.189 1.075 1.132 1.092 1.115 1.062
82 1.102 1.096 1.068 0.933 1.200 1.078 1.120 1.084 1.119 1.071
83 1.162 1.173 1.058 0.924 1.210 1.079 1.102 1.073 1.121 1.079
84 1.228 1.253 1.047 0.914 1.216 1.077 1.079 1.060 1.119 1.085
85 1.297 1.333 1.035 0.903 1.221 1.074 1.052 1.044 1.116 1.091
9 The 20%/10%/10%/60% allocation above is appropriate for a typical large employer-sponsored plan using
Medicare carve-out coordination. If the plan design or Medicare coordination method is different, another allocation may need to be used. For a Medicare Advantage product where the plan is responsible for all of the Medicare allowed charges, a similar calculation should be done on the Medicare total allowed charge age/gender curve.

© 2013 Society of Actuaries, All Rights Reserved - 22 - Version 2
20.00% 10.00% 10.00% 60.00% 100.00%
Inpatient Outpatient Professional Pharmacy Total
Age Male Female Male Female Male Female Male Female Male Female
86 1.369 1.414 1.023 0.893 1.223 1.068 1.023 1.026 1.112 1.095
87 1.442 1.494 1.009 0.884 1.223 1.060 0.993 1.007 1.108 1.097
88 1.515 1.572 0.994 0.874 1.221 1.051 0.965 0.988 1.103 1.100
89 1.588 1.645 0.978 0.865 1.216 1.039 0.937 0.970 1.099 1.101
90 1.659 1.712 0.961 0.856 1.209 1.024 0.912 0.952 1.096 1.102
91 1.729 1.768 0.943 0.845 1.199 1.008 0.888 0.935 1.093 1.100
92 1.798 1.810 0.924 0.833 1.186 0.988 0.865 0.919 1.090 1.096
93 1.864 1.834 0.903 0.817 1.171 0.966 0.845 0.904 1.087 1.088
94 1.928 1.838 0.882 0.797 1.152 0.941 0.825 0.889 1.084 1.075
95 1.989 1.818 0.859 0.773 1.131 0.912 0.806 0.875 1.080 1.057
96 2.045 1.773 0.834 0.742 1.107 0.879 0.789 0.862 1.076 1.034
97 2.098 1.702 0.808 0.706 1.080 0.843 0.772 0.849 1.072 1.005
98 2.146 1.604 0.780 0.663 1.050 0.803 0.757 0.836 1.066 0.969
Graphically, the resulting age curve is shown in Chart 21.
Chart 20: Net Medicare Costs by Age for Specific Plan Design
The resulting curve is a relatively flat aging line varying from 0.82 to 1.12.
0.00
0.20
0.40
0.60
0.80
1.00
1.20
1.40
1.60
1.80
2.00
65 67 69 71 73 75 77 79 81 83 85 87 89 91 93 95 97
Male Female

© 2013 Society of Actuaries, All Rights Reserved - 23 - Version 2
Commercial Medicare Data The HCCI database includes data for covered members younger and older than age 65. Unfortunately,
the commercial data does not have indicators for active/retired status for members over age 65 or, at
the time of the study, indicators of which data is for Medicare Advantage members. . The observed age
cost curve for the commercial post-65 per capita costs shows a consistently declining relative cost. This
can be explained by a mix of active members, where the insured plan is primary, and retired members,
where Medicare is primary at the earlier years, plus a mixture of Medicare Advantage members, where
there is no direct offset of charges for Medicare payments in the data. The resulting age curve may be
useful if a similar mix of active/retired members and type of plan is being studied. However, because
they are very different populations, any such analysis should split out these populations to better
understand their cost patterns.
Chart 21: Commercial Costs by Age Over 65
The above chart shows the raw data for all commercial data. All of the separate splits of data by market
segment and plan type were similar. Because these results are likely due to a non-homogeneous mix of
actives and retirees, and types of insurance coverage, the analysis of post-65 costs is limited to the use
of the Medicare 5% sample with the exception of the prescription drug data which was shown in the
prior section. The same issue of mixing of data with Medicare offsets and without offsets is not an issue
with the prescription drug data.
Health Care Costs by Condition Three different conditions were analyzed for cost variations by age including cancer, circulatory and
musculoskeletal conditions. These three were chosen because they had the most occurrences for both
0.00
0.20
0.40
0.60
0.80
1.00
1.20
1.40
1.60
1.80
2.00
66 68 70 72 74 76 78 80 82 84 86 88 90
Male Female

© 2013 Society of Actuaries, All Rights Reserved - 24 - Version 2
the commercial and Medicare populations. For uniformity of plan type, the group PPO members only
are studied for the commercial population.
The data was reviewed in two different ways. One was to develop a cost index for the population with
the disease and compare it to the overall index. The second method was to compare the disease
population cost index to the overall cost index to derive a cost ratio for the disease population relative
to the overall population. The second approach creates an interesting measure that makes it easier to
show both the commercial and Medicare populations together, so that method is used for most of the
analysis.
The following chart shows the relationship of costs for those with cancer compared to the total
population for the commercial group.
Chart 22: Cost Index of Members with Cancer Diagnosis versus Total Members
For the two study periods (2002-03 and 2009-10), the resulting indices are relatively similar with high
costs for those with cancer at the younger ages and converging in the twenties and then diverging again
at the older ages.
-
2.00
4.00
6.00
8.00
10.00
12.00
14.00
0 2 4 6 8 10 12 14 16 18 20 22 24 26 28 30 32 34 36 38 40 42 44 46 48 50 52 54 56 58 60 62 64
2002-03 Male 2002-03 Female
2002-03 Male Cancer 2002-03 Female Cancer
2009-10 Male 2009-10 Female
2009-10 Male Cancer 2009-10 Female Cancer

© 2013 Society of Actuaries, All Rights Reserved - 25 - Version 2
Chart 23: Cost Ratio of Members with Cancer Diagnosis to Total Members – 2009-10
Since the 2002-03 and 2009-10 study periods showed similar aging curves, only the 2009-10 study
period is shown in these ratio charts. The above chart also brings in similar data for the Medicare
population. Note that even though these are two separate data sources, the ratio indices are very
compatible and join at age 65 with remarkably similar results.
For members with cancer, health care costs are extremely high compared to total members for children
and stabilizes around 3.0 (i.e., three-times average costs) during the working years of adults and
gradually decreases over age 65. For males, the ratio declines more rapidly than females at the older
ages and goes below the average 1.00 starting in the mid-80s.
0.0
2.0
4.0
6.0
8.0
10.0
12.0
14.0
16.0
18.0
20.0
0 10 20 30 40 50 60 70 80 90 100
Male Female

© 2013 Society of Actuaries, All Rights Reserved - 26 - Version 2
Chart 24: Cost Ratio of Members with Circulatory Diagnosis to Total Members – 2009-10
Members with circulatory conditions have a similar ratio to average costs as those with cancer except
the ratio levels off at 1.5 instead of 3.0 during the working years and decreases slowly above age 65
stabilizing at about 1.0.
0.0
2.0
4.0
6.0
8.0
10.0
12.0
14.0
16.0
18.0
20.0
0 10 20 30 40 50 60 70 80 90
Male Female

© 2013 Society of Actuaries, All Rights Reserved - 27 - Version 2
Chart 25: Cost Ratio of Members with Musculoskeletal Diagnosis to Total Members – 2009-10
Members with musculoskeletal conditions show a different ratio pattern than the other two conditions
and have much less variation from the average (note the Y-axis scale is kept at 0.0 to 20.0, the same as
for the other two conditions). The index rises in the early years and somewhat stabilizes during the teen
years and twenties and then begin to decrease from the 30s on. The ratio actually goes below 1.0 for
members over age 75 meaning that their health care costs are less than the average.
Implications of Conditions
In general, members with some type of identified condition have costs higher than the average. As the
prevalence of these conditions change over time, it will influence costs by age—especially at the
younger ages. Two ratios to watch are the ones that dip below the average (males over 85 for cancer
conditions and both genders over age 75 for musculoskeletal conditions) if different treatments become
available for patients at those ages, costs could increase.
For the three conditions studied, the following chart shows the prevalence of each between the 2002-03
and 2009-10 study periods. For example, in the 2002-03 data, 2.4 percent of the members had cancer as
their primary diagnosis.
Condition 2002-03 2009-10
Cancer 2.4% 2.6%
Circulatory 2.8% 3.1%
Musculoskeletal 7.3% 8.6%
0.0
2.0
4.0
6.0
8.0
10.0
12.0
14.0
16.0
18.0
20.0
0 10 20 30 40 50 60 70 80 90 100
Male Female

© 2013 Society of Actuaries, All Rights Reserved - 28 - Version 2
Five-Year Age Group Curve Age/gender medical costs are often summarized by costs in five-year age groups (children grouped as
one group despite the recognized high costs in the early years). The following table was derived from
the Group PPO data from the 2010 study period. As discussed above, commercial costs above age 65
included a mix of active (private plan primary) and retired (Medicare primary) so that an active cost age
65 and over is not readily available. The following table extrapolated the age 65 cost by fitting a
geometric curve to the age 60 through 64 costs. Costs after age 65 were based on the increase in costs
of the Medicare allowable charge costs and net costs including prescription drugs. Active costs over age
70 were assumed the average of ages 70 through 74.
Table 5: Five-Year Age/Gender Table
Group Age Male Female
Children
0.533 0.533
Actives < 20 0.500 0.587
20-24 0.394 0.625
25-29 0.410 0.922
30-34 0.515 1.165
35-39 0.646 1.200
40-44 0.805 1.229
45-49 1.016 1.349
50-54 1.339 1.587
55-59 1.740 1.835
60-64 2.233 2.184
65-69 2.786 2.618
70+ 3.338 3.087
Retiree (Total) 65-69 0.766 0.746
(with Rx) 70-74 0.918 0.880
75-79 1.084 1.021
80-84 1.246 1.171
85-89 1.388 1.309
90-94 1.511 1.397
95+ 1.606 1.351
Retiree (Net) 65-69 0.933 0.886
(with Rx) 70-74 1.025 0.973
75-79 1.089 1.040
80-84 1.111 1.071
85-89 1.073 1.044
90-94 1.004 0.958
95+ 0.931 0.827

© 2013 Society of Actuaries, All Rights Reserved - 29 - Version 2
A specific use of the above table is to use it for retiree medical actuarial valuations when a premium rate
is provided that is based on a blend of active employee and pre-65 retiree experience. Assuming that
active employee and retiree morbidity is the same at the same age, a $6,000 blended premium rate and
the following demographics, the single premium rate may be split by age and group.
Table 6: Example of Splitting Blended Premium Rate
Age/Gender
Member Count Factor Premium Rate
Group Age Male Female Male Female Male Female
Actives < 20 50 20 0.500 0.587 2,347 2,755
20-24 80 75 0.394 0.625 1,850 2,935
25-29 100 125 0.410 0.922 1,925 4,330
30-34 200 200 0.515 1.165 2,416 5,472
35-39 225 250 0.646 1.200 3,034 5,636
40-44 225 250 0.805 1.229 3,780 5,769
45-49 250 300 1.016 1.349 4,773 6,336
50-54 200 200 1.339 1.587 6,286 7,454
55-59 150 200 1.740 1.835 8,172 8,617
60-64 100 50 2.233 2.184 10,487 10,254
65-69 50 50 2.786 2.618 13,081 12,292
70+ 10 0 3.338 3.087 15,675 14,495
Total 3,360 1.205 $ 5,659
Retiree 50-54 10 20 1.339 1.587 6,286 7,454
55-59 50 50 1.740 1.835 8,172 8,617
60-64 100 100 2.233 2.184 10,487 10,254
Total 330 2.017 $ 9,471
Total 3,690 1.278 $ 6,000
In the above table, the member count (employees, retirees and covered dependents) and the $6,000
blended premium are the given numbers. Cross-multiplying the member counts with the age/gender
factors develops the total average 1.278 factor as well as the 1.205 and 2.017 average factors for actives
and retirees, respectively. The premium rates are developed by multiplying the appropriate age/gender
factor with the average age-adjusted premium rate of $4,696 ($6,000 ÷ 1.278). For example, the male
age 20-24 rate is $4,696 × 0.394 = $1,850.
As a result, the average active employee’s premium rate is $5,659 or about 94 percent of the blended
rate and the average pre-65 retiree premium rate is $9,471 or 158 percent of the blended rate (and 167
percent of the active rate).

© 2013 Society of Actuaries, All Rights Reserved - 30 - Version 2
Readers using the age curve developed in this study are encouraged to read a study by Jeff Petertil that
appeared in the North American Actuarial Journal.10 In Table 4 of that study, a representative age curve
table for a group of retirees was presented, in a form showing one-year age-to-age factors by age
bands. For comparison purposes to this current study, the factors from that representative age curve
were converted to a comparable cost index for the under age 65 commercial population and the
Medicare population. The representative table starts at age 50 as the analysis was specifically for health
care costs in retirement.
Chart 26: Comparison of 2010 Age Curve with Petertil Table
Pre-Medicare Retiree Post-Medicare Retiree
The representative age curve was intended to be a unisex age curve. It does a pretty good job following
pre-Medicare retiree 2010 experience—a little high before age 60 and a little low after 60. The post-
Medicare representative age curve produces a steeper curve than 2010 experience age curve that was
developed in Table 4 of this study. Depending on design, the 2010 experience age curve will change
which makes this comparison more difficult.
Aging in Health Care Costs of the United States The preceding charts and discussion have shown that there have been slight changes in the “shape” of
the health care cost curve over the last decade. The change in the shape of the curve may be attributed
to many variables including generational attitudes toward health, treatment pattern changes of
conditions over time, changing medical technology and the availability of more and different drug
treatments. However, one use of the resulting age curve is to demonstrate its overall contribution to
health care cost trends over the last several years. Assuming the shape of the curve is similar for the
total United States population, the above indices can be applied to the age of the U.S. population at
various years to determine the impact of aging on health care costs.
The following table shows the U.S. population by age groupings at various years along with the total
national health expenditures per capita.
10
Petertil, Jeffrey P. "Aging Curves for Health Care Costs In retirement." North American Actuarial Journal 9.3 (2005): 22-49.
0.500
0.600
0.700
0.800
0.900
1.000
1.100
1.200
1.300
1.400
1.500
65 70 75 80 85 90 95
Male Female Petertil
0.500
0.600
0.700
0.800
0.900
1.000
1.100
1.200
1.300
1.400
1.500
50 51 52 53 54 55 56 57 58 59 60 61 62 63 64
Male Female Petertil

© 2013 Society of Actuaries, All Rights Reserved - 31 - Version 2
Table 7: Impact of Aging on Health Care Cost Trends from 1930-2010
Gender Age Group 1930 1950 1970 1990 2010 Index
Male Under 20 24,013,884 25,922,460 39,138,579 36,524,801 42,575,112 0.500
20 to 24 5,336,815 5,606,293 7,917,269 9,675,596 11,056,339 0.394
25 to 29 4,860,180 5,972,078 6,621,567 10,695,936 10,675,799 0.410
30 to 34 4,561,786 5,624,723 5,595,790 10,876,933 10,063,421 0.515
35 to 39 4,679,860 5,517,544 5,412,423 9,902,243 9,996,641 0.646
40 to 44 4,136,459 5,070,269 5,818,813 8,691,984 10,399,409 0.805
45 to 49 3,671,924 4,526,366 5,851,334 6,810,597 11,182,579 1.016
50 to 54 3,131,645 4,128,648 5,347,916 5,514,738 10,966,236 1.339
55 to 59 2,425,992 3,630,046 4,765,821 5,034,370 9,580,184 1.740
60 to 64 1,941,508 3,037,838 4,026,972 4,947,047 8,158,625 2.233
65 to 69 1,417,812 2,424,561 3,122,084 4,532,307 5,892,007 2.786
70 to 74 991,647 1,628,829 2,315,000 3,409,306 4,268,737 3.338
75 to 79 547,604 1,001,798 1,560,661 2,399,768 3,183,507 3.943
80 to 84 251,138 504,958 875,584 1,366,094 2,302,229 4.532
85 and over 117,010 236,828 542,379 857,698 1,807,168 5.187
Female Under 20 23,595,107 25,176,662 37,831,821 34,797,085 40,660,924 0.587
20 to 24 5,533,563 5,875,535 8,453,752 9,344,716 10,611,599 0.625
25 to 29 4,973,428 6,270,182 6,855,426 10,617,109 10,477,448 0.922
30 to 34 4,558,635 5,892,284 5,834,646 10,985,954 10,030,407 1.165
35 to 39 4,528,785 5,728,842 5,694,428 10,060,874 10,085,603 1.200
40 to 44 3,853,736 5,133,704 6,162,141 8,923,802 10,499,772 1.229
45 to 49 3,370,355 4,544,099 6,264,605 7,061,976 11,465,341 1.349
50 to 54 2,844,159 4,143,540 5,756,102 5,835,775 11,399,093 1.587
55 to 59 2,219,685 3,605,074 5,207,207 5,497,386 10,199,011 1.835
60 to 64 1,809,713 3,021,637 4,589,812 5,669,120 8,828,565 2.184
65 to 69 1,352,793 2,578,375 3,869,541 5,579,428 6,623,327 2.618
70 to 74 958,357 1,783,120 3,128,831 4,585,517 5,057,301 3.087
75 to 79 558,786 1,150,609 2,274,173 3,721,601 4,129,865 3.585
80 to 84 283,538 620,386 1,408,727 2,567,645 3,447,852 4.110
85 and over 155,120 340,073 968,522 2,222,467 3,725,588 4.692
Average Index 0.956 1.073 1.115 1.206 1.299
Annual % change
0.6% 0.2% 0.4% 0.4%
NHE per capita $ 29 $ 83 $ 356 $ 2,854 $ 8,417
Annual % change -- 5.3% 7.5% 11.0% 5.6%
Source: NHE for 1930 and 1950 from Social Security Administration; 1970 - 2010 from Centers for Medicare and Medicaid Services
The above chart was developed using the 2010 age curve developed in this paper (the last column
labeled “Index”). Using this one stable age curve as a constant is used to show how the population
change over the years has contributed to cost increases without the noise created by using different age
curves for different years because the shape of the curve may be changing because of contributing
factors other than age and gender. The middle columns under the labels 1930 to 2010 are the total
population of the United States for each year. Using the population as weights, an “Average Index” is
calculated for each year. For example, the weighted average of the index column using the population in
1930 is 0.956. The effect of aging can be developed by using these average index numbers for each
period. The average annual change is developed by taking the 20th root for each 20-year change. For

© 2013 Society of Actuaries, All Rights Reserved - 32 - Version 2
example, the most recent annual change from 1990 to 2010 was developed by dividing 1.299 by 1.206
and taking the 20th root [0.4% = (1.299 ÷ 1.206)0.05-1.00]
National health expenditure per capita costs have increased between 5 to 11 percent per year for the
four 20-year periods since 1930 and the aging demographics have contributed less than 0.5 percent
each year except 1930 to 1950. The annual average increase in the NHE was 7.3 percent from 1930
through 2010 while the average aging index increased at 0.4 percent. Over this same time period, the
consumer price index grew from an average of 16.7 in 1930 to an average of 218.06 in 2010—an annual
average of 3.3 percent.11 Assuming CPI is a reasonable proxy for inflation, the NHE grew at a real rate of
4.0 percent and aging accounted for about 10 percent of the real growth.
This result is consistent with other studies. For example, a Health Affairs article12 from 2012 estimated
that demographic effects (age and gender) on real per capita health spending growth from 1960 through
2007 accounted for 7.2 percent. CPI growth from 1950 through 2010 and 1970 through 2010 was 3.7
percent and 4.4 percent, respectively.13 The annual NHE per capita growth from the same years was 8.0
percent and 8.2 percent so real NHE per capita growth was 4.3 percent from 1950 and 3.8 percent from
1970. The average annual change in the average aging index from 1950 through 2010 was 0.3 percent
and from 1970 through 2010 it was 0.4 percent. Demographic changes therefore accounted for 7.5
percent of the health care growth from 1950 and 10.0 percent from 1970. The Health Affairs article
related real growth to GDP and using the implicit price deflator as a measure of inflation produces
slightly different results with demographic changes accounting for 7.0 percent and 8.7 percent of real
per capita health care growth from 1950 and 1970 to 2010, respectively.14
The aging curve index was extrapolated beyond age 70 from the commercial age curve by using the
Medicare aging curve. A refinement of this aging factor development would be to account for the
difference between Medicare and commercial plan payments but that difference has changed over time
since the adoption of Medicare. The author does not believe that such refinement will significantly
change the result.
11
During the same time period, the implicit price deflator, which is often cited as a better measure of inflation, increased an average of 3.0 percent. 12
Smith, Sheila, Joseph P. Newhouse, and Mark S. Freeland. "Income, insurance, and technology: Why does health spending outpace economic growth?." Health Affairs 28.5 (2009): 1276-1284. 13
The average CPI-U for 1930 was 16.7, for 1950 it was 24.1, for 1970 it was 38.8 and for 2010 it was 218.1, U.S. Bureau of Labor Statistics. Consumer Price Index, All Urban Consumers. Washington: Department of Labor, 2012. 14
The implicit price deflator for the five years shown (1930-2010) were 10.226, 14.656, 24.338, 72.262 and 110.993, Implicit Price Deflators for Gross Domestic Product, U.S. Department of Commerce, Bureau of Economic Analysis.

© 2013 Society of Actuaries, All Rights Reserved - 33 - Version 2
Follow-Up Studies The results of this study have produced several different analysis of how health care costs vary by age
and gender. However, as the author compiled results, there were limitations to the available data that
would have been useful for other analysis. The additional data and studies that could be done include:
There was not coding available in the database to identify members who were actively working
versus retired. It would be nice to have this additional data to study the impact that retired status
has on costs relative to the active employee population.
The commercial data for members over age 65 were not used in this study because the data
included a mix of active and retired members (active members over age 65 are likely still covered by
the employer plan as their primary coverage) and types of coverage (Medicare Advantage HMO,
PPO and private fee-for-service; employer coverage, individual coverage—MA claims would not
include a Medicare offset whereas employer and individual coverage would). These separate
indicators are needed to effectively use the post-age 65 commercial data.
Interesting analysis has been done in other studies regarding health care costs in the last year of life
relative to other years. This database includes an extremely valuable base to do further studies in
this area so mortality statistics will need to be merged into this claims database to do such a study.
There was an observed increase in relative costs (i.e., higher index) for both males and females in
pharmacy costs in their teens and early 20s. Further analysis could be done to better understand the
drivers in the increase.
Data, Methods and Assumptions The key source of data was the Health Care Cost Institute (HCCI) commercial data from 2001 through
2010. The Medicare fee-for-service analysis was based on the 5 percent sample of Medicare data for
years 2006 through 2010. Summarized data was received by the researcher for use in this analysis. This
section documents the data received, methods used to evaluate the data and any assumptions used to
develop results.
Data Summarized data was prepared by the data analytics group employed by HCCI for this study. In general,
the data received for the commercial and Medicare datasets were similar with some slight differences in
claim amounts received so that analysis could be made of costs not paid by Medicare. In general, the
following data was received.
Calendar year: Data was grouped by single years based on member enrollment, fill date for
pharmacy data, admission date for inpatient stays and service date for other providers.
Commercial data was received for years 2001 through 2010 and Medicare data for years 2006
through 2010. After review, the 2001 calendar year data was not used due to significantly lower
exposures relative to the other years. Enrollment data is included for all years, including
members with no claims.

© 2013 Society of Actuaries, All Rights Reserved - 34 - Version 2
Plan type: Data was grouped by HMO and PPO/POS/FFS. Medicare claims were classified as
PPO/POS/FFS.
Market segment: Individual and group business segments were separately identified.
Age: The HCCI data only include the members’ year of birth. Age was calculated based on set
calculations utilized by HCCI which is to determine the age monthly by subtracting an assumed
birthday of July 1 of the year of birth from the reporting month. For this data, the lowest age
was used for the reported data. Therefore, newborns are classified as age -1 in the data
received. Ages for commercial data were capped at age 90 and age 98 for the Medicare data.
Gender: Male and female indicators were provided.
Subscriber relationship: Self and dependent indicators were provided.
Primary disease condition: Each member was assigned to a single major diagnostic category
based on DRGs for inpatient stays and ICD-9 diagnosis codes for other services.
Medical member months: Each record includes the number of months a member was eligible
for coverage whether or not a claim was reported. That is, zero cost claimants are included.
Pharmacy member months: Since not all members in the database have both medical and
outpatient pharmacy claims data submitted, a separate count of the number of months a
member was eligible for pharmacy coverage is included.
Inpatient facility allowed amount: Total covered amount (allowed charge) is summarized for all
inpatient service stays. These include hospital stays as well as skilled nursing facilities, hospice
and mental health hospitals.
Outpatient facility allowed amount: Total outpatient facility allowed charges include all
identified facility charges that are not inpatient charges.
Professional and other allowed amount: All professional charges identified by HCCI which are
basically those that do not have a valid revenue code that identifies them as a facility claim.
Pharmacy allowed amount: Outpatient pharmacy costs are separately identified in the data
warehouse. Amounts reported include all charges eligible for benefit payment including
ingredient costs, dispensing fees and taxes.
In addition, the Medicare data included amounts so that both the total allowed charge (the Medicare
allowable amount) and the Medicare benefit payment could be identified. For post-65 analysis, both the
total Medicare allowed charge as well as the Medicare net charge is studied. The net charge is the
amount that may be supplemented by private plans and represents the difference between the total
allowed charge and the Medicare benefit payment.
Methods Data was summarized for several different study segments for this research to answer specific
questions. At a high level, the following key hypotheses are explored in this research:
1. How has the health care cost curve changed over time?
2. Is there a difference in the health care cost curve between individual and group business?
3. Is there a difference in the health care cost curve by product (HMO versus PPO/POS)?
4. What are the differences in the health care cost curve by major services (inpatient facility,
outpatient facility, professional and pharmacy)?
5. What is the pattern of health care costs by age for some key diagnostic groups?

© 2013 Society of Actuaries, All Rights Reserved - 35 - Version 2
Separately for the post-65 population, how does the health care cost curve differ between the total
allowed costs of Medicare compared to the amounts that may be supplemented by private insurance
(the net costs)?
In order to develop the above comparisons, the total data had to be split among several different pieces.
As some of the pieces were split, it was evident that the volatility in results due to small exposures
deemed the analysis immaterial due to significance of differences. For example, the early years of
individual data had relatively low exposures and the resulting age curve looked significantly different
than later years but that may be due solely to the lower exposures and not a real change in utilization.
After summarizing costs by age, an underlying pattern of claims was evident in most analysis but for an
easier visual comparison of the data points, it was important to smooth the data. The Whittaker-
Henderson graduation method was chosen to smooth data.15 The following two charts illustrate how the
raw data was transformed to the graduated smooth data.
Chart 27: Individual HMO data for calendar year 2010
The smoothed data provides a pretty good representation of the underlying data. The r2 for the above
data is 0.562 for males and 0.916 for females for all ages. The correlation is low for males because of the
fluctuations in the childhood ages. The r2 for males aged 20 and over is 0.968 and 0.958 for females.
In contrast, the group PPO/POS data for the same year required less smoothing.
15
A special thank you to Stuart Klugman with the Society of Actuaries who eagerly helped set up the spreadsheet formulas for smoothing the data using the Whittaker-Henderson graduation method.
0
2,000
4,000
6,000
8,000
10,000
12,000
0 10 20 30 40 50 60 70
Raw Male Graduated Male
Raw Female Graduated Female

© 2013 Society of Actuaries, All Rights Reserved - 36 - Version 2
Chart 28: Group PPO/POS data for calendar year 2010
The r2 for males is 0.981 and it is 0.980 for females for all ages. The major differences in the smoothing
came at the earlier ages where the slopes are much more dramatic than they are in the adult ages. The
r2 for ages 20 and over is 1.000 for males and 0.999 for females. The big blips in data that are apparent
in the individual HMO example is not evident at all in the group PPO/POS example, the key difference
being the exposures between the two. The individual HMO data includes 230,000 lives and the group
PPO/POS data includes 31 million lives.
The commercial pharmacy data was extended at the oldest ages to match the ages provided in the
Medicare data. The commercial data lumped all costs for those aged 90 and over in one cell. The
Medicare data went out to age 98. The commercial data was extrapolated by fitting an exponential
curve to the commercial data ages 85 through 89.
Some data that was provided by HCCI was not used in this analysis after analyzing the data as above.
These include:
2001 calendar year commercial data: The exposures were relatively low compared to other
years (less than five million compared to all of the other years that included about 14 million in
each year and with 2010 that included over 33 million lives).
Commercial data for members over age 65: It was hoped this data could be compared to the
Medicare data for consistency but due to inconsistent observed results, it was decided that
there were too many variables affecting the cost curve so that it was not reliable. For all study
years, this data showed a steady decrease by age from 65 through age 90 (ages 90 and above
were combined). This was not consistent to the Medicare sample data. Possible reasons for the
results are that active and retired members could not be separated as the indicator is not in the
current HCCI database. Since most active members would have the Medicare as secondary
coverage and the reported commercial data is net of Medicare, there will be an increasing
0
2,000
4,000
6,000
8,000
10,000
12,000
0 10 20 30 40 50 60 70
Raw Male Graduated Male
Raw Female Graduated Female

© 2013 Society of Actuaries, All Rights Reserved - 37 - Version 2
percentage of members with Medicare primary as older members are studied. Therefore, the
youngest members will have costs that do not net out Medicare and the oldest members will
have Medicare costs netted out of their charges. Also, those covered by Medicare Advantage
PPO plans will not have a Medicare offset as the plans are paid directly by Medicare. In other
data, Medicare Advantage members tend to be younger than the total Medicare population
which biases toward higher costs for younger post-65 members.
Age 64 data is a mix of members with and without Medicare coverage due to the calculation of
the age.
Only three diagnostic categories are being studied as the others have relatively low exposures
and the volatility by age is too great.
Assumptions No assumptions are used to replace data or to project data except for the commercial pharmacy data
for ages 90 through 98 described in the methods section. All results are used without adjustment. An
implicit assumption when study years are grouped is that such grouping does not materially impact the
resulting age curve. The data could have trended to a consistent year (e.g., if 2002 and 2003 data were
grouped, the 2002 data could have trended to 2003). Given that such trending may perhaps need to be
different by age, gender and other characteristics, it was decided not to trend.
Tables 2 and 3 assume a health care trend rate in its underlying projections. A number of trend rates
may be selected by different health care experts. For illustrative purposes for this chart, the trend rates
calculated by the CMS Office of the Actuary in their latest projections of the national health expenditure
are used for both the pre- and post-Medicare costs.16 They project trends to 2021. After 2021, the 2021
trend rate is continued. The following table shows the trend rates used.
Year Trend Rate
2010-11 3.1%
2011-12 3.4%
2012-13 2.9%
2013-14 6.4%
2014-15 4.7%
2015-16 5.3%
2016-17 5.0%
2017-18 5.2%
2018-19 5.5%
2019-20 5.8%
2020+ 5.7%
The above trend rates were used for all medical costs including projecting the Medicare Part B premium.
16
Office of the Actuary. National Health Expenditure Projections 2011-2021: Table 1, National health expenditures per capita annual change. Washington: Centers for Medicare & Medicaid Services, 2012.

© 2013 Society of Actuaries, All Rights Reserved - 38 - Version 2
2013 per person costs used in the Table 2 projections include:
Pre-65 allowed cost: $ 4,838
Post-65 net allowed cost (medical only): 2,033
Post-65 prescription drug cost: 1,112
Medicare Part B premium: 1,259
Note that the pre-65 cost per person is from the latest HCCI report on total allowed charges for 2011 of
$4,547; the post-65 net allowed cost of $1,853 is from the 2010 data of the 5% Medicare sample and the
post-65 prescription drug costs of $2,703 in 2010 from the commercial data. To approximate the impact
of the Medicare Part D program, retirees pay about 25 percent of the standard benefit which pays about
half of the drug costs and the remaining costs are paid by the federal government and the
pharmaceutical industry. They will also ultimately have to pay 25 percent of the cost of the drugs in the
form of copays or coinsurance. Therefore, the projections will start with a $1,014 cost
($2,703 × 0.50 × 0.25 + $2,703 × 0.25) in 2010.
Table 3 assumes that the total Medicare per person cost in 2010 is $11,746 ($9,719 + $2,703 × 0.75).
Trending for three years to 2013 is $12,885.
Appendix The following pages provide the detailed tables underlying each chart included in this study. In addition,
an Excel file is available with same tables.
Chart 1: Aggregate Commercial Costs by Age 2002 and 2010
Chart 2: Individual and Group Costs by Age for 2009-10
Chart 3: HMO versus PPO/POS Costs by Age for 2009-10
Chart 4: Subscriber versus Dependent Costs by Age for 2009-10
Chart 5: Unisex Cost Curve by Age for 2010
Chart 6: Inpatient Facility Costs by Age and Experience Year
Chart 7: Outpatient Facility Costs by Age and Experience Year
Chart 8: Professional Costs by Age and Experience Years
Chart 9: Pharmacy Costs by Age and Experience Years
Chart 10: Commercial Costs by Age Over 65
Chart 11: Medicare Total Allowed Amount by Age 2006 through 2010
Chart 12: Medicare Net Allowed Amount by Age 2006 through 2010
Chart 13: Inpatient Facility Costs by Age and Experience Year—Total Allowed Amount
Chart 14: Inpatient Facility Costs by Age and Experience Year—Net Allowed Amount
Chart 15: Outpatient Facility Costs by Age and Experience Year—Total Allowed Amount

© 2013 Society of Actuaries, All Rights Reserved - 39 - Version 2
Chart 16: Outpatient Facility Costs by Age and Experience Year—Net Allowed Amount
Chart 17: Professional Costs by Age and Experience Years—Total Allowed Amount
Chart 18: Professional Costs by Age and Experience Years—Net Allowed Amount
Chart 19: Pharmacy Costs by Age and Experience Years—Medicare Ages
Chart 20: Comparison of Medicare Costs (Gross, Medicare, and Net)
Chart 21: Net Medicare Costs by Age for Specific Plan Design
Chart 22: Cost Index of Members with Cancer Diagnosis versus Total Members
Chart 23: Cost Ratio of Members with Cancer Diagnosis to Total Members – 2009-10
Chart 24: Cost Ratio of Members with Circulatory Diagnosis to Total Members – 2009-10
Chart 25: Cost Ratio of Members with Musculoskeletal Diagnosis to Total Members – 2009-10
Chart 26: Comparison of 2010 Age Curve with Petertil Table
Chart 27: Individual HMO data for calendar year 2010
Chart 28: Group PPO/POS data for calendar year 2010

© 2013 Society of Actuaries, All Rights Reserved - 40 - Version 2
Chart 1: Aggregate Commercial Costs by Age 2002 and 2010
2002 2010 Age Male Female Male Female
0 2.28 1.94 2.49 2.12 1 1.63 1.38 1.73 1.46 2 1.11 0.93 1.14 0.96 3 0.73 0.61 0.72 0.61 4 0.48 0.39 0.46 0.38 5 0.33 0.26 0.33 0.27 6 0.25 0.20 0.28 0.22 7 0.23 0.18 0.28 0.22 8 0.25 0.20 0.31 0.25 9 0.28 0.23 0.35 0.28
10 0.33 0.26 0.39 0.32 11 0.37 0.30 0.42 0.35 12 0.40 0.34 0.45 0.39 13 0.43 0.37 0.48 0.43 14 0.45 0.41 0.50 0.47 15 0.47 0.44 0.52 0.50 16 0.47 0.48 0.53 0.54 17 0.46 0.51 0.53 0.56 18 0.45 0.55 0.51 0.58 19 0.43 0.59 0.49 0.59 20 0.41 0.63 0.46 0.60 21 0.39 0.68 0.43 0.61 22 0.38 0.74 0.40 0.64 23 0.38 0.80 0.39 0.68 24 0.38 0.86 0.38 0.73 25 0.39 0.93 0.39 0.79 26 0.40 0.99 0.40 0.86 27 0.42 1.05 0.41 0.93 28 0.44 1.10 0.43 1.00 29 0.46 1.14 0.45 1.06 30 0.49 1.17 0.47 1.11 31 0.51 1.20 0.49 1.15 32 0.53 1.21 0.52 1.18 33 0.55 1.21 0.54 1.20 34 0.58 1.20 0.56 1.21 35 0.60 1.19 0.59 1.21 36 0.63 1.18 0.61 1.21 37 0.65 1.17 0.64 1.20 38 0.68 1.16 0.67 1.20 39 0.71 1.15 0.70 1.19 40 0.74 1.15 0.73 1.19 41 0.77 1.16 0.77 1.20 42 0.81 1.17 0.80 1.21 43 0.84 1.19 0.84 1.22 44 0.88 1.22 0.87 1.24 45 0.93 1.25 0.91 1.26 46 0.98 1.29 0.96 1.29 47 1.03 1.34 1.01 1.33 48 1.08 1.39 1.06 1.37 49 1.14 1.44 1.12 1.42 50 1.21 1.49 1.19 1.47 51 1.28 1.54 1.26 1.52 52 1.35 1.60 1.33 1.57 53 1.42 1.65 1.41 1.62 54 1.50 1.70 1.48 1.66 55 1.58 1.76 1.57 1.71 56 1.66 1.81 1.65 1.76 57 1.74 1.87 1.74 1.81 58 1.83 1.92 1.83 1.87 59 1.92 1.98 1.93 1.93 60 2.01 2.04 2.02 1.99 61 2.11 2.11 2.12 2.07 62 2.21 2.17 2.23 2.15 63 2.31 2.23 2.34 2.23 64 2.41 2.29 2.46 2.32

© 2013 Society of Actuaries, All Rights Reserved - 41 - Version 2
Chart 2: Individual and Group Costs by Age for 2009-10
2009-10 Individual 2009-10 Group Age Male Female Male Female
0 1.88 1.34 2.55 2.18 1 1.49 1.08 1.70 1.45 2 1.17 0.85 1.07 0.91 3 0.90 0.67 0.65 0.55 4 0.69 0.52 0.42 0.34 5 0.54 0.41 0.31 0.25 6 0.43 0.34 0.29 0.23 7 0.37 0.29 0.31 0.25 8 0.33 0.27 0.34 0.27 9 0.33 0.28 0.37 0.30
10 0.35 0.30 0.39 0.32 11 0.38 0.33 0.41 0.35 12 0.42 0.37 0.44 0.38 13 0.46 0.41 0.46 0.41 14 0.50 0.46 0.49 0.45 15 0.54 0.51 0.51 0.50 16 0.57 0.55 0.53 0.53 17 0.59 0.59 0.53 0.56 18 0.60 0.62 0.51 0.58 19 0.60 0.64 0.48 0.59 20 0.60 0.67 0.44 0.60 21 0.59 0.69 0.41 0.61 22 0.58 0.70 0.39 0.64 23 0.57 0.72 0.38 0.68 24 0.56 0.75 0.38 0.73 25 0.56 0.77 0.38 0.80 26 0.56 0.80 0.39 0.87 27 0.56 0.84 0.41 0.94 28 0.57 0.87 0.43 1.01 29 0.58 0.91 0.45 1.07 30 0.59 0.95 0.47 1.12 31 0.60 0.98 0.49 1.15 32 0.61 1.01 0.52 1.18 33 0.63 1.03 0.54 1.20 34 0.64 1.05 0.56 1.20 35 0.66 1.06 0.58 1.20 36 0.68 1.07 0.61 1.20 37 0.70 1.08 0.64 1.19 38 0.72 1.09 0.67 1.19 39 0.75 1.10 0.70 1.19 40 0.77 1.11 0.73 1.19 41 0.81 1.13 0.77 1.20 42 0.84 1.14 0.80 1.21 43 0.88 1.17 0.84 1.22 44 0.92 1.19 0.87 1.24 45 0.96 1.23 0.91 1.26 46 1.01 1.26 0.96 1.29 47 1.06 1.30 1.01 1.33 48 1.11 1.34 1.06 1.38 49 1.17 1.39 1.12 1.43 50 1.23 1.43 1.19 1.48 51 1.29 1.48 1.26 1.53 52 1.36 1.52 1.34 1.58 53 1.44 1.57 1.41 1.63 54 1.52 1.61 1.49 1.68 55 1.60 1.66 1.57 1.72 56 1.68 1.71 1.66 1.77 57 1.77 1.76 1.74 1.82 58 1.85 1.81 1.83 1.88 59 1.94 1.86 1.93 1.94 60 2.02 1.92 2.02 2.01 61 2.10 1.97 2.12 2.09 62 2.18 2.03 2.23 2.18 63 2.26 2.08 2.34 2.27 64 2.34 2.13 2.46 2.37

© 2013 Society of Actuaries, All Rights Reserved - 42 - Version 2
Chart 3: HMO versus PPO/POS Costs by Age for 2009-10
2009-10 HMO 2009-10 PPO/POS Age Male Female Male Female
0 1.70 1.49 2.56 2.18 1 1.30 1.13 1.72 1.46 2 0.98 0.84 1.09 0.92 3 0.72 0.61 0.67 0.56 4 0.54 0.45 0.42 0.35 5 0.42 0.33 0.31 0.25 6 0.35 0.27 0.29 0.23 7 0.32 0.24 0.30 0.24 8 0.32 0.24 0.33 0.27 9 0.34 0.26 0.37 0.30
10 0.37 0.29 0.39 0.32 11 0.40 0.33 0.42 0.35 12 0.44 0.38 0.44 0.38 13 0.48 0.42 0.47 0.41 14 0.51 0.46 0.49 0.45 15 0.53 0.50 0.51 0.50 16 0.54 0.54 0.52 0.53 17 0.54 0.58 0.52 0.56 18 0.54 0.62 0.50 0.57 19 0.52 0.65 0.47 0.58 20 0.51 0.69 0.44 0.58 21 0.49 0.73 0.41 0.60 22 0.47 0.77 0.38 0.62 23 0.45 0.82 0.37 0.66 24 0.44 0.88 0.37 0.71 25 0.44 0.94 0.37 0.78 26 0.44 1.00 0.39 0.85 27 0.44 1.06 0.40 0.92 28 0.45 1.12 0.42 0.99 29 0.46 1.17 0.45 1.05 30 0.48 1.21 0.47 1.10 31 0.49 1.24 0.49 1.14 32 0.51 1.25 0.51 1.17 33 0.53 1.26 0.54 1.19 34 0.55 1.25 0.56 1.20 35 0.57 1.24 0.59 1.20 36 0.60 1.23 0.61 1.20 37 0.62 1.21 0.64 1.19 38 0.65 1.19 0.67 1.19 39 0.68 1.17 0.70 1.19 40 0.72 1.16 0.74 1.20 41 0.75 1.15 0.77 1.21 42 0.79 1.15 0.80 1.22 43 0.83 1.16 0.84 1.23 44 0.86 1.17 0.88 1.25 45 0.91 1.20 0.92 1.28 46 0.95 1.23 0.96 1.31 47 1.00 1.27 1.01 1.34 48 1.05 1.31 1.07 1.39 49 1.11 1.36 1.13 1.44 50 1.17 1.41 1.20 1.49 51 1.24 1.46 1.27 1.54 52 1.32 1.51 1.34 1.59 53 1.40 1.56 1.41 1.64 54 1.48 1.61 1.49 1.69 55 1.56 1.66 1.57 1.74 56 1.65 1.71 1.66 1.78 57 1.75 1.76 1.74 1.83 58 1.85 1.82 1.83 1.89 59 1.95 1.89 1.92 1.95 60 2.06 1.96 2.02 2.02 61 2.17 2.05 2.11 2.10 62 2.28 2.14 2.22 2.18 63 2.40 2.24 2.33 2.28 64 3.52 3.28 3.33 3.22

© 2013 Society of Actuaries, All Rights Reserved - 43 - Version 2
Chart 4: Subscriber versus Dependent Costs by Age for 2009-10
Subscriber Dependent Age Male Female Male Female
0
2.78 2.37 1
1.86 1.58
2
1.17 0.99 3
0.71 0.60
4
0.45 0.37 5
0.34 0.28
6
0.32 0.25 7
0.34 0.27
8
0.37 0.30 9
0.40 0.33
10
0.43 0.35 11
0.45 0.38
12
0.47 0.41 13
0.50 0.45
14
0.53 0.49 15
0.56 0.54
16
0.58 0.59 17
0.58 0.63
18 0.20 0.21 0.57 0.65 19 0.21 0.27 0.55 0.68 20 0.23 0.35 0.53 0.70 21 0.26 0.44 0.52 0.73 22 0.29 0.54 0.51 0.78 23 0.33 0.63 0.51 0.86 24 0.36 0.71 0.52 0.95 25 0.39 0.79 0.54 1.05 26 0.41 0.87 0.56 1.15 27 0.43 0.94 0.59 1.24 28 0.45 1.00 0.61 1.32 29 0.47 1.06 0.63 1.37 30 0.49 1.12 0.66 1.41 31 0.51 1.16 0.68 1.42 32 0.54 1.20 0.69 1.42 33 0.56 1.23 0.71 1.41 34 0.58 1.26 0.73 1.39 35 0.61 1.27 0.75 1.36 36 0.64 1.28 0.78 1.34 37 0.67 1.28 0.80 1.32 38 0.70 1.29 0.84 1.31 39 0.74 1.29 0.87 1.30 40 0.77 1.30 0.91 1.30 41 0.81 1.31 0.95 1.30 42 0.84 1.32 0.99 1.31 43 0.88 1.33 1.04 1.32 44 0.92 1.35 1.09 1.35 45 0.96 1.37 1.14 1.38 46 1.00 1.40 1.20 1.42 47 1.06 1.43 1.26 1.47 48 1.11 1.48 1.33 1.53 49 1.18 1.52 1.40 1.59 50 1.25 1.57 1.49 1.66 51 1.32 1.62 1.57 1.72 52 1.40 1.67 1.66 1.79 53 1.47 1.72 1.76 1.86 54 1.56 1.76 1.85 1.92 55 1.64 1.81 1.95 1.99 56 1.73 1.85 2.05 2.05 57 1.82 1.91 2.15 2.11 58 1.92 1.97 2.26 2.18 59 2.01 2.04 2.36 2.25 60 2.12 2.12 2.48 2.34 61 2.23 2.20 2.59 2.43 62 2.34 2.29 2.72 2.53 63 2.45 2.39 2.85 2.64 64 2.58 2.49 2.98 2.76

© 2013 Society of Actuaries, All Rights Reserved - 44 - Version 2
Chart 5: Unisex Cost Curve by Age for 2010
Age Male Female Unisex CMS Proposed
Unisex
0 2.86 2.44 2.65 0.48 1 1.81 1.54 1.68 0.48 2 1.06 0.90 0.98 0.48 3 0.60 0.51 0.56 0.48 4 0.38 0.31 0.34 0.48 5 0.31 0.25 0.28 0.48 6 0.31 0.25 0.28 0.48 7 0.35 0.28 0.31 0.48 8 0.37 0.30 0.34 0.48 9 0.38 0.31 0.35 0.48
10 0.39 0.32 0.36 0.48 11 0.40 0.34 0.37 0.48 12 0.42 0.36 0.39 0.48 13 0.45 0.40 0.43 0.48 14 0.49 0.45 0.47 0.48 15 0.52 0.50 0.51 0.48 16 0.54 0.55 0.54 0.48 17 0.54 0.58 0.56 0.48 18 0.52 0.59 0.55 0.48 19 0.48 0.59 0.53 0.48 20 0.44 0.58 0.51 0.48 21 0.40 0.59 0.50 0.75 22 0.38 0.61 0.50 0.75 23 0.37 0.65 0.51 0.75 24 0.37 0.71 0.54 0.75 25 0.38 0.78 0.59 0.75 26 0.39 0.85 0.63 0.77 27 0.41 0.92 0.68 0.78 28 0.42 0.99 0.72 0.81 29 0.45 1.05 0.76 0.84 30 0.47 1.11 0.80 0.85 31 0.49 1.15 0.83 0.87 32 0.51 1.18 0.86 0.89 33 0.54 1.19 0.88 0.90 34 0.56 1.20 0.89 0.91 35 0.59 1.20 0.91 0.91 36 0.61 1.20 0.92 0.92 37 0.64 1.20 0.93 0.93 38 0.67 1.20 0.94 0.93 39 0.71 1.20 0.96 0.94 40 0.74 1.21 0.98 0.96 41 0.77 1.22 1.00 0.97 42 0.80 1.23 1.02 0.99 43 0.84 1.24 1.05 1.02 44 0.88 1.26 1.07 1.05 45 0.92 1.28 1.10 1.08 46 0.96 1.31 1.14 1.12 47 1.01 1.34 1.18 1.17 48 1.06 1.38 1.23 1.22 49 1.13 1.43 1.29 1.28 50 1.20 1.49 1.35 1.34 51 1.27 1.54 1.41 1.40 52 1.34 1.59 1.47 1.46 53 1.41 1.64 1.53 1.53 54 1.49 1.69 1.59 1.60 55 1.57 1.73 1.66 1.67 56 1.66 1.78 1.72 1.75 57 1.74 1.83 1.79 1.82 58 1.84 1.89 1.86 1.91 59 1.93 1.95 1.94 1.95 60 2.02 2.02 2.02 2.03 61 2.12 2.10 2.11 2.10 62 2.23 2.18 2.21 2.15 63 2.35 2.27 2.31 2.21 64 2.47 2.37 2.42 2.24

© 2013 Society of Actuaries, All Rights Reserved - 45 - Version 2
Chart 6: Inpatient Facility Costs by Age and Experience Year
2002-03 2004-05 2006-07 2008-09 2010 Age Male Female Male Female Male Female Male Female Male Female
0 7.16 5.92 6.80 6.26 7.47 6.42 7.68 6.42 7.53 6.41 1 4.00 3.34 3.73 3.42 4.06 3.50 4.08 3.42 4.25 3.63 2 1.81 1.53 1.64 1.48 1.73 1.51 1.68 1.41 1.96 1.69 3 0.33 0.26 0.36 0.30 0.30 0.27 0.36 0.29 0.41 0.31 4 0.23 0.25 0.24 0.23 0.24 0.25 0.28 0.27 0.27 0.27 5 0.20 0.19 0.20 0.19 0.22 0.21 0.26 0.22 0.23 0.24 6 0.23 0.17 0.19 0.16 0.20 0.19 0.24 0.19 0.25 0.23 7 0.19 0.16 0.18 0.14 0.21 0.16 0.21 0.20 0.22 0.19 8 0.19 0.14 0.21 0.19 0.25 0.20 0.28 0.24 0.25 0.21 9 0.25 0.20 0.26 0.24 0.27 0.23 0.28 0.25 0.30 0.25
10 0.27 0.22 0.27 0.25 0.26 0.22 0.26 0.23 0.30 0.26 11 0.26 0.23 0.25 0.25 0.24 0.22 0.25 0.22 0.29 0.26 12 0.25 0.23 0.24 0.25 0.24 0.23 0.26 0.23 0.29 0.27 13 0.26 0.25 0.25 0.26 0.26 0.27 0.29 0.27 0.30 0.30 14 0.29 0.28 0.28 0.29 0.30 0.32 0.33 0.33 0.34 0.35 15 0.32 0.33 0.32 0.33 0.35 0.38 0.38 0.38 0.38 0.39 16 0.36 0.37 0.36 0.37 0.39 0.42 0.42 0.43 0.42 0.44 17 0.39 0.41 0.39 0.40 0.42 0.45 0.43 0.45 0.44 0.46 18 0.40 0.44 0.40 0.43 0.43 0.47 0.43 0.46 0.44 0.48 19 0.39 0.47 0.40 0.46 0.42 0.47 0.41 0.46 0.42 0.48 20 0.37 0.52 0.39 0.49 0.41 0.48 0.39 0.46 0.39 0.48 21 0.35 0.57 0.38 0.53 0.39 0.51 0.37 0.49 0.36 0.50 22 0.33 0.63 0.36 0.59 0.38 0.56 0.36 0.54 0.34 0.54 23 0.32 0.71 0.35 0.67 0.37 0.63 0.35 0.61 0.32 0.60 24 0.31 0.80 0.34 0.76 0.36 0.71 0.34 0.70 0.32 0.69 25 0.31 0.89 0.34 0.86 0.36 0.81 0.33 0.80 0.32 0.80 26 0.31 0.98 0.34 0.96 0.36 0.91 0.33 0.90 0.33 0.91 27 0.32 1.07 0.34 1.05 0.36 1.00 0.33 1.01 0.33 1.02 28 0.33 1.15 0.34 1.13 0.36 1.09 0.34 1.11 0.34 1.12 29 0.35 1.21 0.35 1.20 0.36 1.16 0.36 1.19 0.35 1.21 30 0.36 1.26 0.36 1.24 0.37 1.22 0.38 1.26 0.36 1.28 31 0.38 1.29 0.37 1.27 0.38 1.25 0.40 1.29 0.37 1.33 32 0.40 1.29 0.39 1.28 0.40 1.26 0.41 1.31 0.39 1.34 33 0.41 1.28 0.41 1.26 0.42 1.25 0.42 1.29 0.41 1.33 34 0.44 1.25 0.44 1.23 0.45 1.22 0.43 1.26 0.43 1.30 35 0.46 1.20 0.46 1.17 0.48 1.17 0.45 1.21 0.45 1.25 36 0.50 1.14 0.49 1.11 0.50 1.12 0.48 1.16 0.48 1.19 37 0.53 1.08 0.53 1.05 0.53 1.06 0.52 1.10 0.51 1.13 38 0.57 1.02 0.56 0.99 0.56 1.00 0.55 1.05 0.54 1.07 39 0.60 0.98 0.59 0.95 0.59 0.96 0.59 1.00 0.57 1.01 40 0.63 0.95 0.63 0.91 0.63 0.92 0.62 0.96 0.61 0.96 41 0.67 0.94 0.67 0.89 0.67 0.90 0.65 0.93 0.64 0.93 42 0.70 0.93 0.72 0.88 0.71 0.89 0.69 0.92 0.69 0.92 43 0.75 0.94 0.77 0.88 0.76 0.90 0.74 0.92 0.73 0.92 44 0.80 0.95 0.82 0.90 0.82 0.92 0.80 0.94 0.78 0.93 45 0.86 0.97 0.88 0.93 0.87 0.94 0.87 0.96 0.84 0.96 46 0.92 1.01 0.95 0.97 0.93 0.98 0.94 1.00 0.90 0.99 47 1.00 1.05 1.03 1.02 1.00 1.02 1.01 1.04 0.96 1.03 48 1.08 1.10 1.13 1.08 1.08 1.08 1.09 1.08 1.03 1.07 49 1.18 1.15 1.24 1.14 1.17 1.13 1.18 1.13 1.11 1.12 50 1.29 1.21 1.35 1.20 1.27 1.19 1.27 1.18 1.21 1.18 51 1.41 1.26 1.46 1.26 1.38 1.25 1.38 1.24 1.31 1.23 52 1.53 1.32 1.56 1.31 1.49 1.31 1.49 1.31 1.41 1.30 53 1.65 1.38 1.67 1.36 1.61 1.37 1.61 1.38 1.53 1.36 54 1.77 1.44 1.78 1.41 1.73 1.43 1.73 1.45 1.66 1.43 55 1.89 1.51 1.90 1.47 1.85 1.50 1.85 1.52 1.80 1.50 56 2.02 1.60 2.03 1.56 1.98 1.57 1.98 1.59 1.94 1.58 57 2.15 1.69 2.18 1.66 2.13 1.66 2.11 1.67 2.08 1.66 58 2.29 1.79 2.34 1.77 2.28 1.77 2.24 1.76 2.22 1.75 59 2.44 1.90 2.51 1.89 2.45 1.89 2.38 1.87 2.36 1.86 60 2.60 2.02 2.68 2.01 2.63 2.01 2.53 1.99 2.51 1.97 61 2.78 2.13 2.86 2.14 2.82 2.15 2.69 2.13 2.66 2.10 62 2.95 2.23 3.03 2.29 3.00 2.30 2.85 2.28 2.83 2.24 63 3.12 2.33 3.20 2.45 3.18 2.46 3.02 2.45 3.02 2.38 64 3.28 2.43 3.35 2.63 3.36 2.64 3.20 2.63 3.23 2.53

© 2013 Society of Actuaries, All Rights Reserved - 46 - Version 2
Chart 7: Outpatient Facility Costs by Age and Experience Year
2002-03 2004-05 2006-07 2008-09 2010 Age Male Female Male Female Male Female Male Female Male Female
0 0.94 0.71 0.86 0.64 0.86 0.64 0.85 0.62 0.86 0.61 1 0.83 0.63 0.78 0.59 0.78 0.58 0.77 0.57 0.77 0.56 2 0.73 0.56 0.70 0.53 0.69 0.53 0.69 0.52 0.68 0.51 3 0.63 0.49 0.62 0.47 0.61 0.47 0.61 0.46 0.60 0.46 4 0.55 0.43 0.54 0.42 0.54 0.42 0.54 0.42 0.53 0.42 5 0.49 0.38 0.48 0.38 0.47 0.37 0.48 0.37 0.47 0.38 6 0.43 0.35 0.42 0.34 0.42 0.34 0.43 0.34 0.42 0.34 7 0.39 0.32 0.37 0.31 0.38 0.31 0.39 0.32 0.38 0.32 8 0.35 0.30 0.34 0.29 0.35 0.29 0.35 0.30 0.35 0.29 9 0.33 0.28 0.32 0.28 0.33 0.27 0.33 0.28 0.33 0.28
10 0.32 0.27 0.31 0.27 0.32 0.27 0.33 0.28 0.33 0.28 11 0.33 0.28 0.32 0.28 0.33 0.28 0.34 0.29 0.34 0.29 12 0.35 0.30 0.34 0.30 0.35 0.30 0.36 0.31 0.36 0.32 13 0.39 0.34 0.37 0.33 0.38 0.34 0.39 0.36 0.40 0.38 14 0.43 0.40 0.41 0.39 0.43 0.40 0.44 0.42 0.45 0.44 15 0.46 0.46 0.46 0.45 0.48 0.47 0.49 0.49 0.50 0.51 16 0.49 0.52 0.49 0.51 0.52 0.53 0.53 0.56 0.54 0.57 17 0.50 0.57 0.51 0.56 0.54 0.58 0.55 0.60 0.55 0.61 18 0.50 0.60 0.52 0.61 0.53 0.61 0.54 0.62 0.55 0.62 19 0.49 0.63 0.50 0.64 0.51 0.62 0.51 0.61 0.53 0.62 20 0.47 0.66 0.49 0.66 0.49 0.63 0.48 0.60 0.50 0.61 21 0.45 0.69 0.47 0.68 0.46 0.63 0.45 0.60 0.47 0.61 22 0.45 0.72 0.46 0.71 0.45 0.65 0.43 0.62 0.45 0.62 23 0.45 0.76 0.45 0.74 0.44 0.68 0.43 0.65 0.44 0.64 24 0.47 0.81 0.46 0.78 0.44 0.71 0.43 0.69 0.43 0.68 25 0.48 0.86 0.47 0.83 0.44 0.76 0.44 0.73 0.44 0.72 26 0.50 0.90 0.49 0.87 0.46 0.80 0.45 0.78 0.44 0.77 27 0.53 0.94 0.51 0.91 0.47 0.85 0.47 0.83 0.46 0.82 28 0.55 0.98 0.52 0.95 0.49 0.89 0.49 0.87 0.48 0.87 29 0.57 1.01 0.54 0.98 0.51 0.93 0.51 0.92 0.50 0.92 30 0.58 1.03 0.56 1.01 0.53 0.97 0.53 0.96 0.52 0.96 31 0.60 1.05 0.58 1.04 0.56 1.01 0.55 1.00 0.55 1.01 32 0.62 1.07 0.60 1.06 0.58 1.04 0.57 1.04 0.57 1.04 33 0.64 1.09 0.62 1.08 0.60 1.07 0.59 1.07 0.59 1.08 34 0.65 1.10 0.64 1.10 0.62 1.09 0.61 1.10 0.61 1.11 35 0.67 1.12 0.66 1.11 0.65 1.12 0.64 1.13 0.64 1.14 36 0.70 1.13 0.69 1.13 0.68 1.14 0.67 1.15 0.66 1.17 37 0.72 1.14 0.71 1.14 0.70 1.16 0.69 1.18 0.69 1.20 38 0.75 1.16 0.74 1.16 0.73 1.19 0.72 1.21 0.72 1.23 39 0.78 1.18 0.76 1.19 0.75 1.22 0.75 1.24 0.75 1.27 40 0.80 1.20 0.79 1.21 0.78 1.25 0.78 1.28 0.77 1.31 41 0.83 1.22 0.82 1.24 0.81 1.28 0.81 1.31 0.80 1.34 42 0.85 1.24 0.85 1.27 0.84 1.31 0.83 1.34 0.83 1.37 43 0.88 1.27 0.88 1.29 0.87 1.34 0.86 1.37 0.85 1.40 44 0.92 1.29 0.91 1.31 0.90 1.36 0.89 1.39 0.88 1.42 45 0.96 1.33 0.94 1.35 0.93 1.39 0.92 1.42 0.92 1.44 46 1.00 1.37 0.98 1.39 0.96 1.42 0.96 1.45 0.96 1.46 47 1.05 1.42 1.02 1.44 1.01 1.46 1.01 1.49 1.01 1.50 48 1.11 1.48 1.08 1.49 1.07 1.51 1.07 1.54 1.07 1.54 49 1.17 1.54 1.16 1.55 1.14 1.57 1.14 1.60 1.14 1.59 50 1.24 1.59 1.24 1.61 1.22 1.64 1.22 1.66 1.21 1.65 51 1.30 1.64 1.32 1.66 1.29 1.70 1.29 1.71 1.28 1.70 52 1.37 1.68 1.39 1.70 1.37 1.74 1.36 1.75 1.34 1.74 53 1.43 1.71 1.46 1.74 1.43 1.77 1.42 1.78 1.40 1.77 54 1.50 1.74 1.52 1.77 1.50 1.79 1.48 1.80 1.46 1.80 55 1.57 1.77 1.59 1.80 1.56 1.82 1.55 1.82 1.53 1.82 56 1.64 1.80 1.67 1.83 1.64 1.86 1.62 1.85 1.60 1.85 57 1.72 1.85 1.75 1.86 1.71 1.90 1.70 1.88 1.68 1.88 58 1.80 1.90 1.83 1.90 1.80 1.94 1.79 1.93 1.77 1.92 59 1.89 1.96 1.90 1.95 1.89 2.00 1.88 1.98 1.86 1.96 60 1.97 2.01 1.98 1.99 1.98 2.06 1.97 2.04 1.96 2.02 61 2.05 2.07 2.07 2.05 2.08 2.12 2.06 2.11 2.05 2.08 62 2.12 2.12 2.16 2.11 2.18 2.19 2.15 2.18 2.14 2.14 63 2.18 2.17 2.27 2.19 2.27 2.28 2.24 2.24 2.23 2.21 64 2.24 2.21 2.39 2.29 2.36 2.37 2.34 2.30 2.31 2.28

© 2013 Society of Actuaries, All Rights Reserved - 47 - Version 2
Chart 8: Professional Costs by Age and Experience Years
2002-03 2004-05 2006-07 2008-09 2010 Age Male Female Male Female Male Female Male Female Male Female
0 2.89 2.48 2.75 2.42 2.79 2.42 2.88 2.52 2.85 2.51 1 1.91 1.64 1.82 1.59 1.83 1.58 1.85 1.62 1.90 1.67 2 1.20 1.04 1.15 0.99 1.13 0.98 1.12 0.98 1.21 1.06 3 0.74 0.64 0.72 0.60 0.70 0.60 0.69 0.59 0.77 0.66 4 0.49 0.42 0.49 0.40 0.49 0.42 0.50 0.42 0.54 0.45 5 0.39 0.33 0.40 0.32 0.42 0.35 0.45 0.37 0.44 0.37 6 0.36 0.31 0.38 0.31 0.41 0.34 0.45 0.37 0.43 0.35 7 0.38 0.32 0.39 0.32 0.42 0.35 0.45 0.38 0.43 0.36 8 0.39 0.33 0.40 0.33 0.42 0.36 0.45 0.38 0.44 0.37 9 0.40 0.34 0.40 0.34 0.42 0.36 0.44 0.38 0.44 0.38
10 0.41 0.35 0.40 0.34 0.41 0.36 0.44 0.39 0.45 0.40 11 0.42 0.36 0.40 0.35 0.42 0.37 0.44 0.40 0.45 0.42 12 0.43 0.38 0.42 0.36 0.43 0.39 0.45 0.43 0.47 0.44 13 0.45 0.40 0.44 0.39 0.45 0.43 0.47 0.47 0.49 0.48 14 0.47 0.44 0.46 0.43 0.48 0.48 0.50 0.52 0.51 0.52 15 0.49 0.48 0.49 0.48 0.51 0.54 0.53 0.57 0.53 0.56 16 0.49 0.52 0.50 0.52 0.52 0.58 0.54 0.61 0.54 0.60 17 0.48 0.56 0.50 0.56 0.51 0.62 0.53 0.64 0.53 0.62 18 0.46 0.59 0.48 0.59 0.49 0.63 0.50 0.64 0.50 0.62 19 0.43 0.61 0.45 0.62 0.45 0.63 0.45 0.62 0.46 0.61 20 0.40 0.65 0.42 0.64 0.41 0.63 0.40 0.61 0.42 0.61 21 0.38 0.70 0.39 0.69 0.38 0.65 0.37 0.62 0.38 0.61 22 0.37 0.77 0.38 0.74 0.36 0.69 0.35 0.66 0.36 0.65 23 0.38 0.85 0.38 0.82 0.36 0.75 0.35 0.72 0.36 0.70 24 0.40 0.95 0.39 0.90 0.37 0.82 0.36 0.80 0.36 0.78 25 0.42 1.04 0.42 1.00 0.39 0.91 0.38 0.88 0.38 0.86 26 0.45 1.14 0.44 1.08 0.41 0.99 0.40 0.97 0.40 0.95 27 0.48 1.22 0.46 1.17 0.44 1.07 0.42 1.05 0.42 1.04 28 0.50 1.28 0.49 1.23 0.46 1.14 0.45 1.13 0.45 1.12 29 0.53 1.34 0.51 1.29 0.48 1.21 0.47 1.20 0.47 1.20 30 0.55 1.38 0.53 1.33 0.50 1.26 0.50 1.26 0.50 1.26 31 0.57 1.41 0.55 1.35 0.53 1.30 0.52 1.30 0.52 1.31 32 0.59 1.42 0.57 1.37 0.55 1.32 0.54 1.33 0.55 1.34 33 0.60 1.43 0.60 1.37 0.57 1.33 0.57 1.34 0.57 1.36 34 0.62 1.42 0.61 1.37 0.59 1.33 0.59 1.35 0.59 1.36 35 0.64 1.40 0.63 1.36 0.61 1.33 0.61 1.34 0.61 1.36 36 0.66 1.38 0.65 1.35 0.64 1.32 0.64 1.33 0.64 1.35 37 0.68 1.35 0.67 1.33 0.66 1.30 0.66 1.32 0.66 1.34 38 0.70 1.32 0.69 1.31 0.68 1.29 0.68 1.31 0.68 1.33 39 0.72 1.30 0.71 1.29 0.70 1.28 0.71 1.31 0.71 1.32 40 0.74 1.29 0.73 1.28 0.73 1.28 0.73 1.31 0.74 1.32 41 0.77 1.28 0.76 1.27 0.76 1.28 0.76 1.31 0.76 1.32 42 0.79 1.28 0.78 1.27 0.78 1.29 0.78 1.31 0.78 1.33 43 0.82 1.28 0.81 1.28 0.80 1.30 0.80 1.32 0.81 1.33 44 0.84 1.30 0.84 1.29 0.83 1.31 0.83 1.33 0.83 1.34 45 0.87 1.32 0.87 1.31 0.86 1.33 0.85 1.34 0.86 1.35 46 0.90 1.35 0.90 1.34 0.89 1.35 0.89 1.36 0.89 1.36 47 0.94 1.39 0.93 1.38 0.92 1.38 0.92 1.39 0.92 1.39 48 0.98 1.43 0.98 1.42 0.97 1.43 0.97 1.43 0.96 1.42 49 1.02 1.47 1.03 1.47 1.02 1.47 1.02 1.48 1.01 1.46 50 1.07 1.50 1.08 1.52 1.08 1.52 1.07 1.52 1.06 1.50 51 1.12 1.54 1.13 1.56 1.14 1.57 1.13 1.56 1.11 1.54 52 1.16 1.57 1.19 1.60 1.20 1.61 1.18 1.60 1.17 1.58 53 1.21 1.59 1.24 1.63 1.25 1.64 1.23 1.63 1.22 1.61 54 1.26 1.62 1.29 1.66 1.30 1.67 1.28 1.66 1.27 1.64 55 1.32 1.65 1.34 1.69 1.35 1.70 1.34 1.68 1.33 1.67 56 1.38 1.69 1.40 1.72 1.41 1.73 1.39 1.71 1.39 1.70 57 1.44 1.72 1.46 1.76 1.48 1.77 1.46 1.74 1.45 1.73 58 1.50 1.76 1.53 1.80 1.55 1.81 1.52 1.77 1.51 1.76 59 1.57 1.79 1.60 1.84 1.63 1.86 1.59 1.82 1.58 1.80 60 1.64 1.83 1.68 1.88 1.71 1.92 1.66 1.87 1.65 1.85 61 1.70 1.86 1.76 1.93 1.80 1.98 1.74 1.93 1.73 1.90 62 1.76 1.89 1.84 1.98 1.88 2.03 1.82 2.00 1.81 1.96 63 1.81 1.92 1.92 2.03 1.97 2.09 1.92 2.07 1.90 2.03 64 1.85 1.94 2.01 2.08 2.06 2.15 2.02 2.13 2.00 2.10

© 2013 Society of Actuaries, All Rights Reserved - 48 - Version 2
Chart 9: Pharmacy Costs by Age and Experience Years
2002-03 2004-05 2006-07 2008-09 2010 Age Male Female Male Female Male Female Male Female Male Female
0 0.26 0.19 0.25 0.18 0.26 0.20 0.28 0.21 0.26 0.20 1 0.27 0.21 0.27 0.21 0.28 0.21 0.27 0.21 0.25 0.20 2 0.27 0.22 0.28 0.22 0.29 0.22 0.26 0.21 0.25 0.19 3 0.28 0.22 0.29 0.23 0.30 0.23 0.26 0.21 0.25 0.20 4 0.28 0.22 0.29 0.23 0.31 0.24 0.27 0.21 0.26 0.20 5 0.29 0.23 0.30 0.23 0.32 0.25 0.29 0.22 0.29 0.21 6 0.30 0.23 0.32 0.24 0.34 0.25 0.32 0.23 0.32 0.22 7 0.31 0.23 0.33 0.24 0.37 0.26 0.35 0.24 0.35 0.24 8 0.33 0.24 0.35 0.25 0.39 0.27 0.38 0.26 0.39 0.25 9 0.35 0.24 0.38 0.25 0.41 0.28 0.41 0.27 0.42 0.27
10 0.37 0.25 0.40 0.26 0.43 0.28 0.44 0.28 0.46 0.29 11 0.39 0.27 0.43 0.28 0.46 0.30 0.46 0.30 0.49 0.31 12 0.43 0.29 0.47 0.31 0.49 0.31 0.50 0.32 0.54 0.34 13 0.46 0.32 0.51 0.34 0.52 0.34 0.54 0.36 0.59 0.38 14 0.49 0.36 0.55 0.37 0.56 0.38 0.59 0.40 0.64 0.43 15 0.50 0.40 0.57 0.41 0.59 0.42 0.63 0.45 0.67 0.48 16 0.49 0.43 0.56 0.45 0.58 0.46 0.63 0.50 0.68 0.53 17 0.46 0.46 0.52 0.49 0.55 0.50 0.60 0.53 0.65 0.56 18 0.41 0.48 0.46 0.51 0.49 0.52 0.53 0.55 0.58 0.58 19 0.36 0.49 0.39 0.53 0.41 0.54 0.45 0.56 0.51 0.59 20 0.31 0.51 0.33 0.54 0.35 0.54 0.38 0.57 0.44 0.59 21 0.28 0.52 0.29 0.55 0.30 0.55 0.33 0.57 0.39 0.59 22 0.26 0.55 0.26 0.57 0.28 0.56 0.31 0.57 0.35 0.59 23 0.26 0.58 0.26 0.59 0.27 0.58 0.30 0.59 0.34 0.60 24 0.27 0.62 0.27 0.62 0.28 0.60 0.31 0.61 0.34 0.61 25 0.28 0.66 0.28 0.65 0.29 0.63 0.32 0.63 0.34 0.63 26 0.31 0.70 0.31 0.68 0.31 0.67 0.34 0.66 0.35 0.65 27 0.33 0.73 0.33 0.71 0.34 0.70 0.35 0.69 0.37 0.67 28 0.36 0.76 0.36 0.74 0.36 0.73 0.38 0.71 0.39 0.70 29 0.39 0.78 0.38 0.76 0.39 0.75 0.40 0.74 0.42 0.72 30 0.42 0.81 0.41 0.79 0.41 0.78 0.43 0.76 0.44 0.75 31 0.45 0.83 0.43 0.81 0.44 0.80 0.46 0.78 0.47 0.77 32 0.49 0.86 0.47 0.84 0.48 0.83 0.49 0.81 0.50 0.80 33 0.53 0.89 0.50 0.87 0.51 0.86 0.52 0.84 0.53 0.83 34 0.57 0.91 0.54 0.90 0.55 0.90 0.55 0.87 0.57 0.86 35 0.61 0.94 0.58 0.93 0.59 0.93 0.59 0.91 0.60 0.89 36 0.65 0.98 0.62 0.96 0.63 0.96 0.63 0.94 0.64 0.93 37 0.69 1.01 0.67 0.99 0.67 0.99 0.67 0.98 0.68 0.96 38 0.74 1.04 0.71 1.02 0.72 1.03 0.72 1.02 0.73 1.00 39 0.78 1.08 0.76 1.05 0.77 1.06 0.77 1.06 0.77 1.04 40 0.82 1.12 0.81 1.09 0.82 1.09 0.82 1.09 0.83 1.08 41 0.87 1.16 0.86 1.13 0.87 1.12 0.87 1.12 0.88 1.11 42 0.91 1.20 0.90 1.17 0.92 1.16 0.92 1.15 0.93 1.15 43 0.96 1.24 0.95 1.21 0.97 1.20 0.97 1.19 0.99 1.18 44 1.01 1.30 1.00 1.27 1.03 1.25 1.03 1.23 1.04 1.21 45 1.07 1.36 1.05 1.32 1.08 1.30 1.08 1.27 1.10 1.25 46 1.14 1.43 1.11 1.39 1.13 1.36 1.14 1.33 1.15 1.29 47 1.21 1.50 1.17 1.46 1.19 1.42 1.19 1.39 1.21 1.34 48 1.27 1.58 1.24 1.54 1.25 1.49 1.25 1.45 1.27 1.40 49 1.34 1.67 1.32 1.62 1.32 1.57 1.31 1.52 1.34 1.47 50 1.41 1.75 1.39 1.71 1.39 1.65 1.38 1.59 1.41 1.54 51 1.48 1.83 1.47 1.79 1.47 1.73 1.46 1.67 1.48 1.62 52 1.55 1.92 1.54 1.87 1.55 1.82 1.54 1.76 1.56 1.70 53 1.62 2.00 1.61 1.95 1.64 1.90 1.63 1.85 1.64 1.78 54 1.69 2.09 1.68 2.03 1.72 1.98 1.72 1.94 1.73 1.87 55 1.76 2.17 1.75 2.11 1.79 2.05 1.81 2.03 1.82 1.96 56 1.83 2.25 1.83 2.19 1.87 2.13 1.90 2.11 1.91 2.05 57 1.91 2.31 1.91 2.27 1.94 2.20 1.98 2.19 1.99 2.13 58 1.99 2.38 1.99 2.35 2.02 2.28 2.06 2.26 2.08 2.22 59 2.07 2.44 2.08 2.43 2.10 2.36 2.14 2.35 2.17 2.30 60 2.15 2.49 2.17 2.50 2.19 2.45 2.23 2.44 2.26 2.38 61 2.22 2.54 2.27 2.57 2.29 2.52 2.33 2.53 2.36 2.47 62 2.29 2.58 2.36 2.65 2.40 2.60 2.44 2.63 2.47 2.57 63 2.35 2.60 2.44 2.73 2.52 2.68 2.57 2.73 2.59 2.67 64 2.39 2.62 2.53 2.80 2.65 2.75 2.71 2.83 2.72 2.78

© 2013 Society of Actuaries, All Rights Reserved - 49 - Version 2
Chart 10: Medicare Total Allowed Charge by Age 2006 through 2010
2006 2007 2008 2009 2010 Age Male Female Male Female Male Female Male Female Male Female
65 0.68 0.65 0.71 0.67 0.69 0.66 0.69 0.67 0.69 0.67 66 0.70 0.67 0.72 0.68 0.71 0.68 0.71 0.69 0.71 0.69 67 0.72 0.69 0.74 0.70 0.73 0.70 0.73 0.70 0.73 0.71 68 0.75 0.71 0.76 0.72 0.76 0.72 0.75 0.73 0.76 0.73 69 0.78 0.74 0.78 0.74 0.78 0.75 0.78 0.75 0.79 0.76 70 0.82 0.77 0.82 0.77 0.81 0.78 0.81 0.78 0.82 0.78 71 0.86 0.80 0.85 0.80 0.85 0.81 0.84 0.81 0.85 0.81 72 0.90 0.83 0.89 0.84 0.88 0.84 0.88 0.84 0.89 0.84 73 0.95 0.87 0.94 0.87 0.93 0.87 0.92 0.88 0.92 0.88 74 0.99 0.90 0.98 0.90 0.97 0.90 0.96 0.91 0.96 0.91 75 1.03 0.94 1.02 0.94 1.01 0.93 1.00 0.94 1.00 0.94 76 1.08 0.97 1.07 0.97 1.06 0.97 1.04 0.98 1.04 0.97 77 1.12 1.01 1.11 1.01 1.10 1.00 1.08 1.01 1.08 1.01 78 1.16 1.05 1.15 1.04 1.14 1.04 1.12 1.04 1.12 1.04 79 1.20 1.08 1.19 1.08 1.18 1.07 1.16 1.08 1.16 1.08 80 1.24 1.12 1.23 1.11 1.22 1.11 1.20 1.12 1.20 1.12 81 1.28 1.16 1.27 1.15 1.26 1.15 1.25 1.16 1.25 1.16 82 1.32 1.19 1.31 1.19 1.30 1.19 1.29 1.19 1.29 1.20 83 1.35 1.23 1.34 1.22 1.34 1.23 1.33 1.23 1.33 1.24 84 1.39 1.27 1.38 1.26 1.38 1.28 1.38 1.27 1.37 1.28 85 1.44 1.31 1.42 1.30 1.42 1.32 1.42 1.31 1.42 1.32 86 1.48 1.34 1.46 1.34 1.46 1.36 1.47 1.36 1.46 1.36 87 1.52 1.38 1.50 1.38 1.50 1.40 1.51 1.40 1.50 1.40 88 1.56 1.42 1.54 1.42 1.55 1.44 1.55 1.44 1.54 1.44 89 1.60 1.45 1.58 1.46 1.59 1.48 1.59 1.48 1.59 1.47 90 1.64 1.49 1.62 1.50 1.63 1.52 1.63 1.52 1.63 1.51 91 1.68 1.51 1.66 1.53 1.67 1.55 1.67 1.55 1.67 1.53 92 1.71 1.54 1.70 1.55 1.71 1.57 1.70 1.58 1.70 1.56 93 1.74 1.55 1.73 1.56 1.74 1.59 1.73 1.60 1.74 1.57 94 1.76 1.55 1.76 1.56 1.77 1.59 1.75 1.61 1.77 1.58 95 1.78 1.54 1.79 1.55 1.80 1.58 1.77 1.60 1.80 1.57 96 1.79 1.51 1.80 1.52 1.82 1.56 1.78 1.58 1.83 1.55 97 1.79 1.46 1.81 1.47 1.84 1.52 1.79 1.55 1.85 1.51 98 1.78 1.40 1.82 1.41 1.85 1.46 1.78 1.50 1.87 1.47

© 2013 Society of Actuaries, All Rights Reserved - 50 - Version 2
Chart 11: Medicare Net Allowed Amount by Age 2006 through 2010
2006 2007 2008 2009 2010 Age Male Female Male Female Male Female Male Female Male Female
65 0.88 0.78 0.97 0.86 1.03 0.83 0.98 0.86 0.99 0.89 66 0.87 0.78 0.96 0.85 1.00 0.84 0.97 0.85 0.97 0.87 67 0.87 0.78 0.95 0.84 0.98 0.84 0.96 0.84 0.95 0.86 68 0.87 0.78 0.95 0.84 0.97 0.84 0.95 0.84 0.95 0.85 69 0.88 0.79 0.94 0.84 0.96 0.85 0.95 0.85 0.95 0.85 70 0.90 0.80 0.95 0.85 0.96 0.86 0.95 0.86 0.95 0.86 71 0.91 0.82 0.96 0.86 0.96 0.86 0.96 0.87 0.96 0.87 72 0.93 0.84 0.97 0.87 0.97 0.87 0.97 0.88 0.97 0.88 73 0.95 0.86 0.99 0.89 0.98 0.88 0.98 0.90 0.98 0.89 74 0.98 0.88 1.00 0.90 1.00 0.90 1.00 0.91 1.00 0.91 75 1.00 0.91 1.02 0.92 1.01 0.91 1.02 0.93 1.01 0.93 76 1.03 0.94 1.05 0.94 1.03 0.93 1.04 0.94 1.02 0.95 77 1.05 0.97 1.07 0.96 1.05 0.95 1.05 0.96 1.04 0.97 78 1.08 1.00 1.09 0.98 1.07 0.97 1.07 0.98 1.06 1.00 79 1.10 1.03 1.11 1.00 1.09 0.99 1.09 1.00 1.07 1.02 80 1.13 1.06 1.12 1.02 1.11 1.01 1.10 1.02 1.09 1.04 81 1.16 1.09 1.14 1.04 1.13 1.03 1.12 1.04 1.11 1.05 82 1.19 1.13 1.16 1.06 1.15 1.06 1.14 1.06 1.14 1.07 83 1.22 1.16 1.18 1.09 1.17 1.08 1.16 1.08 1.16 1.09 84 1.25 1.20 1.20 1.11 1.19 1.11 1.18 1.11 1.18 1.11 85 1.29 1.24 1.22 1.13 1.22 1.13 1.20 1.13 1.20 1.12 86 1.33 1.28 1.24 1.16 1.24 1.16 1.23 1.16 1.23 1.14 87 1.37 1.32 1.26 1.18 1.26 1.18 1.25 1.18 1.25 1.16 88 1.41 1.36 1.28 1.21 1.29 1.20 1.27 1.20 1.27 1.18 89 1.45 1.39 1.30 1.23 1.31 1.23 1.29 1.23 1.29 1.20 90 1.49 1.42 1.32 1.25 1.32 1.24 1.31 1.25 1.31 1.21 91 1.52 1.45 1.34 1.26 1.34 1.26 1.33 1.26 1.32 1.23 92 1.54 1.46 1.36 1.26 1.35 1.26 1.35 1.27 1.34 1.23 93 1.56 1.46 1.37 1.26 1.36 1.26 1.36 1.27 1.35 1.23 94 1.57 1.45 1.38 1.24 1.37 1.25 1.37 1.26 1.36 1.21 95 1.56 1.42 1.39 1.21 1.38 1.23 1.38 1.24 1.36 1.19 96 1.55 1.37 1.39 1.17 1.38 1.19 1.38 1.21 1.36 1.15 97 1.53 1.31 1.38 1.11 1.37 1.14 1.38 1.16 1.36 1.10 98 1.49 1.22 1.36 1.04 1.36 1.08 1.37 1.10 1.36 1.04

© 2013 Society of Actuaries, All Rights Reserved - 51 - Version 2
Chart 12: Inpatient Facility Costs by Age and Experience Year—Total Allowed Charge
2006 2007 2008 2009 2010
Age Male Female Male Female Male Female Male Female Male Female
65 0.64 0.51 0.68 0.54 0.65 0.53 0.66 0.55 0.66 0.55
66 0.65 0.53 0.68 0.54 0.66 0.54 0.67 0.55 0.67 0.56
67 0.66 0.54 0.68 0.55 0.67 0.56 0.68 0.57 0.68 0.57
68 0.69 0.57 0.69 0.57 0.69 0.58 0.69 0.58 0.70 0.59
69 0.72 0.59 0.71 0.60 0.72 0.61 0.71 0.61 0.72 0.62
70 0.75 0.63 0.74 0.63 0.74 0.64 0.74 0.64 0.75 0.65
71 0.79 0.66 0.78 0.67 0.78 0.67 0.77 0.68 0.78 0.69
72 0.84 0.71 0.83 0.71 0.82 0.71 0.81 0.72 0.82 0.72
73 0.89 0.75 0.88 0.76 0.86 0.75 0.85 0.76 0.86 0.76
74 0.94 0.80 0.93 0.80 0.91 0.79 0.90 0.81 0.90 0.80
75 0.99 0.85 0.98 0.85 0.96 0.84 0.95 0.86 0.95 0.85
76 1.04 0.90 1.03 0.90 1.02 0.89 1.00 0.91 1.00 0.90
77 1.10 0.96 1.08 0.96 1.08 0.94 1.06 0.96 1.05 0.95
78 1.15 1.02 1.14 1.01 1.13 1.00 1.11 1.01 1.11 1.00
79 1.21 1.08 1.20 1.07 1.19 1.06 1.17 1.07 1.17 1.06
80 1.27 1.14 1.26 1.13 1.25 1.13 1.23 1.13 1.23 1.12
81 1.33 1.21 1.32 1.19 1.31 1.20 1.29 1.20 1.30 1.19
82 1.39 1.28 1.38 1.26 1.38 1.27 1.36 1.26 1.36 1.27
83 1.46 1.35 1.45 1.33 1.45 1.34 1.43 1.34 1.43 1.34
84 1.53 1.42 1.52 1.41 1.52 1.42 1.51 1.41 1.51 1.42
85 1.61 1.49 1.59 1.48 1.59 1.50 1.59 1.49 1.58 1.50
86 1.68 1.57 1.66 1.56 1.66 1.58 1.67 1.57 1.66 1.58
87 1.76 1.64 1.73 1.64 1.74 1.67 1.75 1.65 1.73 1.66
88 1.84 1.72 1.81 1.72 1.82 1.75 1.83 1.74 1.81 1.73
89 1.92 1.79 1.89 1.80 1.91 1.83 1.91 1.82 1.89 1.81
90 2.00 1.86 1.97 1.88 1.99 1.90 1.98 1.90 1.97 1.88
91 2.08 1.93 2.05 1.95 2.07 1.97 2.06 1.97 2.05 1.95
92 2.15 1.98 2.13 2.00 2.15 2.03 2.13 2.04 2.13 2.01
93 2.21 2.03 2.20 2.05 2.23 2.08 2.20 2.09 2.21 2.06
94 2.27 2.06 2.27 2.08 2.30 2.11 2.26 2.13 2.29 2.09
95 2.31 2.07 2.33 2.09 2.37 2.13 2.31 2.15 2.37 2.11
96 2.35 2.05 2.38 2.07 2.43 2.12 2.35 2.16 2.45 2.11
97 2.37 2.02 2.43 2.03 2.49 2.10 2.38 2.15 2.52 2.09
98 2.39 1.95 2.47 1.97 2.53 2.05 2.41 2.11 2.58 2.06

© 2013 Society of Actuaries, All Rights Reserved - 52 - Version 2
Chart 13: Inpatient Facility Costs by Age and Experience Year—Net Allowed Amount
2006 2007 2008 2009 2010
Age Male Female Male Female Male Female Male Female Male Female
65 0.92 0.62 1.19 0.80 1.23 0.77 1.25 0.83 1.30 0.87
66 0.87 0.59 1.12 0.73 1.16 0.74 1.15 0.76 1.18 0.80
67 0.84 0.57 1.05 0.69 1.10 0.71 1.08 0.71 1.09 0.75
68 0.81 0.56 0.99 0.66 1.04 0.69 1.01 0.67 1.02 0.71
69 0.80 0.56 0.94 0.64 0.99 0.67 0.96 0.65 0.96 0.68
70 0.79 0.57 0.90 0.64 0.94 0.66 0.92 0.65 0.93 0.67
71 0.79 0.59 0.88 0.65 0.91 0.66 0.90 0.66 0.90 0.67
72 0.80 0.62 0.86 0.67 0.89 0.67 0.88 0.67 0.89 0.68
73 0.81 0.65 0.86 0.69 0.87 0.68 0.88 0.69 0.88 0.70
74 0.82 0.70 0.87 0.71 0.87 0.70 0.89 0.72 0.88 0.72
75 0.84 0.74 0.88 0.74 0.87 0.72 0.90 0.75 0.89 0.75
76 0.87 0.80 0.90 0.77 0.88 0.76 0.92 0.78 0.90 0.77
77 0.91 0.87 0.93 0.82 0.90 0.80 0.93 0.82 0.91 0.81
78 0.95 0.94 0.96 0.87 0.93 0.86 0.95 0.87 0.93 0.85
79 1.00 1.01 1.00 0.93 0.96 0.91 0.98 0.92 0.96 0.90
80 1.06 1.10 1.04 0.99 1.00 0.98 1.01 0.98 1.00 0.96
81 1.12 1.19 1.09 1.06 1.05 1.05 1.05 1.04 1.05 1.02
82 1.20 1.28 1.14 1.14 1.11 1.12 1.10 1.11 1.10 1.10
83 1.28 1.38 1.19 1.22 1.18 1.20 1.15 1.19 1.16 1.17
84 1.38 1.49 1.26 1.31 1.25 1.28 1.22 1.27 1.23 1.25
85 1.49 1.60 1.32 1.40 1.33 1.37 1.29 1.35 1.30 1.33
86 1.60 1.72 1.40 1.49 1.41 1.45 1.36 1.44 1.37 1.41
87 1.71 1.84 1.48 1.58 1.49 1.54 1.44 1.53 1.44 1.49
88 1.83 1.95 1.56 1.67 1.57 1.62 1.52 1.62 1.52 1.57
89 1.94 2.06 1.65 1.75 1.65 1.70 1.59 1.70 1.59 1.65
90 2.05 2.15 1.73 1.83 1.73 1.78 1.67 1.78 1.66 1.71
91 2.15 2.23 1.82 1.89 1.80 1.84 1.75 1.85 1.73 1.77
92 2.24 2.29 1.90 1.94 1.87 1.89 1.82 1.90 1.80 1.81
93 2.30 2.33 1.97 1.97 1.93 1.92 1.89 1.93 1.86 1.83
94 2.35 2.34 2.03 1.98 1.99 1.94 1.95 1.94 1.93 1.84
95 2.38 2.31 2.09 1.95 2.05 1.92 2.01 1.93 1.99 1.82
96 2.38 2.25 2.13 1.90 2.09 1.89 2.06 1.90 2.05 1.77
97 2.37 2.15 2.17 1.81 2.13 1.82 2.11 1.84 2.10 1.70
98 2.33 2.02 2.19 1.70 2.16 1.73 2.15 1.75 2.15 1.60

© 2013 Society of Actuaries, All Rights Reserved - 53 - Version 2
Chart 14: Outpatient Facility Costs by Age and Experience Year—Total Allowed Charge
2006 2007 2008 2009 2010
Age Male Female Male Female Male Female Male Female Male Female
65 0.71 0.79 0.72 0.78 0.76 0.75 0.69 0.75 0.69 0.76
66 0.73 0.80 0.74 0.80 0.76 0.78 0.72 0.77 0.72 0.78
67 0.75 0.81 0.76 0.81 0.77 0.80 0.74 0.80 0.74 0.79
68 0.78 0.83 0.78 0.83 0.78 0.83 0.77 0.82 0.77 0.82
69 0.81 0.86 0.80 0.85 0.80 0.85 0.79 0.85 0.80 0.84
70 0.84 0.88 0.83 0.87 0.82 0.87 0.82 0.87 0.83 0.86
71 0.87 0.91 0.87 0.90 0.85 0.90 0.85 0.90 0.86 0.89
72 0.90 0.93 0.90 0.92 0.88 0.92 0.88 0.92 0.89 0.92
73 0.93 0.96 0.93 0.95 0.92 0.95 0.91 0.95 0.92 0.94
74 0.97 0.98 0.97 0.97 0.95 0.98 0.94 0.98 0.95 0.97
75 1.00 1.01 1.00 1.00 0.98 1.00 0.98 1.00 0.98 1.00
76 1.03 1.03 1.03 1.02 1.02 1.02 1.01 1.03 1.01 1.04
77 1.06 1.05 1.06 1.05 1.05 1.05 1.04 1.05 1.04 1.07
78 1.09 1.07 1.09 1.07 1.08 1.07 1.07 1.08 1.07 1.10
79 1.11 1.10 1.11 1.10 1.11 1.09 1.10 1.10 1.10 1.12
80 1.14 1.12 1.14 1.12 1.13 1.12 1.13 1.13 1.13 1.15
81 1.16 1.14 1.16 1.15 1.16 1.14 1.16 1.16 1.16 1.17
82 1.19 1.16 1.18 1.17 1.19 1.17 1.19 1.19 1.19 1.19
83 1.21 1.19 1.20 1.20 1.21 1.20 1.22 1.22 1.22 1.22
84 1.24 1.21 1.23 1.22 1.24 1.23 1.25 1.25 1.25 1.24
85 1.26 1.23 1.25 1.25 1.26 1.26 1.28 1.27 1.28 1.26
86 1.29 1.26 1.27 1.27 1.29 1.29 1.31 1.30 1.31 1.29
87 1.31 1.28 1.30 1.30 1.31 1.31 1.34 1.33 1.34 1.31
88 1.34 1.30 1.33 1.32 1.34 1.34 1.37 1.35 1.37 1.33
89 1.36 1.32 1.35 1.34 1.36 1.36 1.40 1.37 1.40 1.35
90 1.39 1.33 1.38 1.35 1.39 1.38 1.43 1.39 1.43 1.37
91 1.41 1.34 1.40 1.36 1.41 1.39 1.45 1.40 1.45 1.38
92 1.43 1.34 1.43 1.36 1.43 1.39 1.47 1.41 1.47 1.39
93 1.45 1.33 1.45 1.36 1.45 1.38 1.49 1.41 1.49 1.39
94 1.46 1.31 1.46 1.33 1.46 1.35 1.50 1.39 1.50 1.37
95 1.48 1.27 1.48 1.30 1.47 1.32 1.50 1.36 1.50 1.35
96 1.48 1.22 1.48 1.25 1.48 1.26 1.50 1.32 1.50 1.31
97 1.49 1.16 1.49 1.18 1.48 1.19 1.49 1.26 1.49 1.25
98 1.49 1.08 1.49 1.10 1.48 1.10 1.48 1.18 1.48 1.18
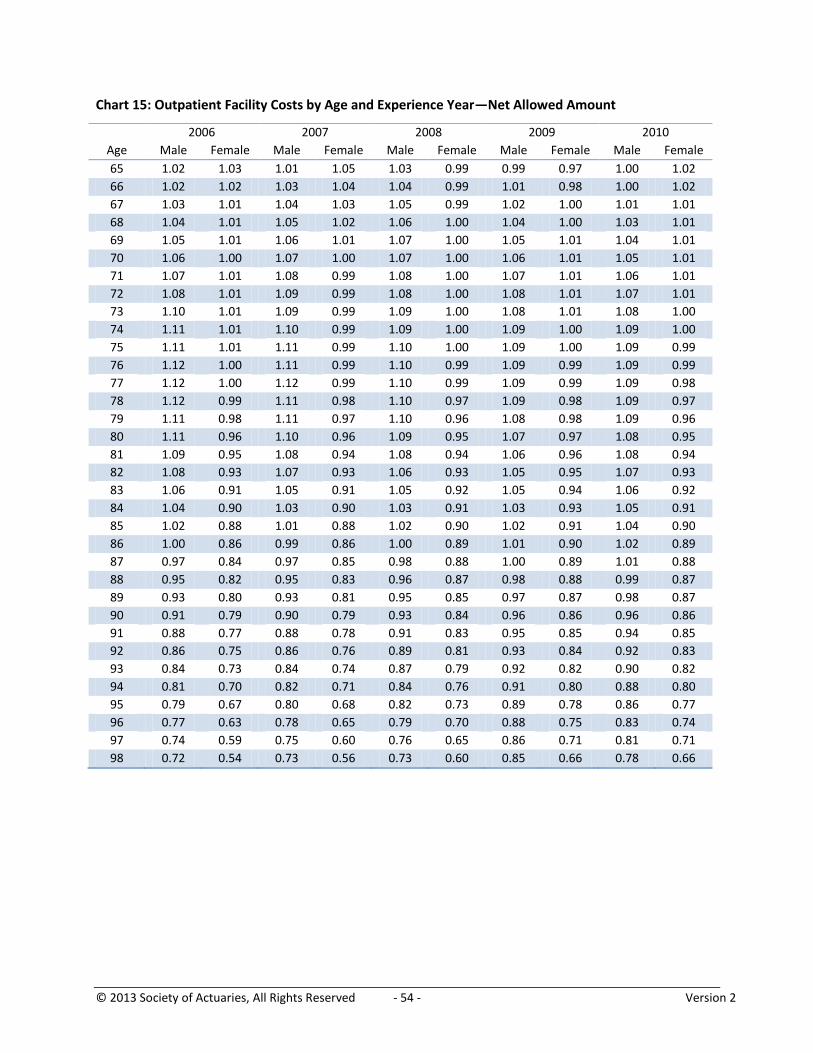
© 2013 Society of Actuaries, All Rights Reserved - 54 - Version 2
Chart 15: Outpatient Facility Costs by Age and Experience Year—Net Allowed Amount
2006 2007 2008 2009 2010
Age Male Female Male Female Male Female Male Female Male Female
65 1.02 1.03 1.01 1.05 1.03 0.99 0.99 0.97 1.00 1.02
66 1.02 1.02 1.03 1.04 1.04 0.99 1.01 0.98 1.00 1.02
67 1.03 1.01 1.04 1.03 1.05 0.99 1.02 1.00 1.01 1.01
68 1.04 1.01 1.05 1.02 1.06 1.00 1.04 1.00 1.03 1.01
69 1.05 1.01 1.06 1.01 1.07 1.00 1.05 1.01 1.04 1.01
70 1.06 1.00 1.07 1.00 1.07 1.00 1.06 1.01 1.05 1.01
71 1.07 1.01 1.08 0.99 1.08 1.00 1.07 1.01 1.06 1.01
72 1.08 1.01 1.09 0.99 1.08 1.00 1.08 1.01 1.07 1.01
73 1.10 1.01 1.09 0.99 1.09 1.00 1.08 1.01 1.08 1.00
74 1.11 1.01 1.10 0.99 1.09 1.00 1.09 1.00 1.09 1.00
75 1.11 1.01 1.11 0.99 1.10 1.00 1.09 1.00 1.09 0.99
76 1.12 1.00 1.11 0.99 1.10 0.99 1.09 0.99 1.09 0.99
77 1.12 1.00 1.12 0.99 1.10 0.99 1.09 0.99 1.09 0.98
78 1.12 0.99 1.11 0.98 1.10 0.97 1.09 0.98 1.09 0.97
79 1.11 0.98 1.11 0.97 1.10 0.96 1.08 0.98 1.09 0.96
80 1.11 0.96 1.10 0.96 1.09 0.95 1.07 0.97 1.08 0.95
81 1.09 0.95 1.08 0.94 1.08 0.94 1.06 0.96 1.08 0.94
82 1.08 0.93 1.07 0.93 1.06 0.93 1.05 0.95 1.07 0.93
83 1.06 0.91 1.05 0.91 1.05 0.92 1.05 0.94 1.06 0.92
84 1.04 0.90 1.03 0.90 1.03 0.91 1.03 0.93 1.05 0.91
85 1.02 0.88 1.01 0.88 1.02 0.90 1.02 0.91 1.04 0.90
86 1.00 0.86 0.99 0.86 1.00 0.89 1.01 0.90 1.02 0.89
87 0.97 0.84 0.97 0.85 0.98 0.88 1.00 0.89 1.01 0.88
88 0.95 0.82 0.95 0.83 0.96 0.87 0.98 0.88 0.99 0.87
89 0.93 0.80 0.93 0.81 0.95 0.85 0.97 0.87 0.98 0.87
90 0.91 0.79 0.90 0.79 0.93 0.84 0.96 0.86 0.96 0.86
91 0.88 0.77 0.88 0.78 0.91 0.83 0.95 0.85 0.94 0.85
92 0.86 0.75 0.86 0.76 0.89 0.81 0.93 0.84 0.92 0.83
93 0.84 0.73 0.84 0.74 0.87 0.79 0.92 0.82 0.90 0.82
94 0.81 0.70 0.82 0.71 0.84 0.76 0.91 0.80 0.88 0.80
95 0.79 0.67 0.80 0.68 0.82 0.73 0.89 0.78 0.86 0.77
96 0.77 0.63 0.78 0.65 0.79 0.70 0.88 0.75 0.83 0.74
97 0.74 0.59 0.75 0.60 0.76 0.65 0.86 0.71 0.81 0.71
98 0.72 0.54 0.73 0.56 0.73 0.60 0.85 0.66 0.78 0.66

© 2013 Society of Actuaries, All Rights Reserved - 55 - Version 2
Chart 16: Professional Costs by Age and Experience Years—Total Allowed Charge
2006 2007 2008 2009 2010
Age Male Female Male Female Male Female Male Female Male Female
65 0.73 0.80 0.74 0.79 0.72 0.79 0.73 0.81 0.72 0.81
66 0.77 0.83 0.78 0.82 0.76 0.82 0.77 0.83 0.76 0.83
67 0.80 0.86 0.81 0.85 0.80 0.85 0.80 0.86 0.80 0.86
68 0.84 0.88 0.84 0.87 0.84 0.88 0.84 0.89 0.84 0.88
69 0.88 0.91 0.88 0.90 0.88 0.91 0.88 0.91 0.88 0.91
70 0.92 0.93 0.92 0.93 0.92 0.94 0.91 0.94 0.92 0.93
71 0.96 0.96 0.96 0.95 0.95 0.96 0.95 0.96 0.95 0.96
72 1.00 0.98 1.00 0.98 0.99 0.98 0.99 0.98 0.99 0.98
73 1.04 1.00 1.03 1.00 1.03 1.00 1.02 1.00 1.02 1.00
74 1.08 1.02 1.07 1.02 1.06 1.02 1.05 1.02 1.05 1.02
75 1.11 1.04 1.10 1.04 1.10 1.04 1.09 1.04 1.08 1.04
76 1.15 1.05 1.14 1.05 1.13 1.05 1.12 1.05 1.11 1.05
77 1.17 1.06 1.17 1.06 1.16 1.06 1.14 1.06 1.14 1.06
78 1.20 1.07 1.19 1.07 1.19 1.07 1.17 1.07 1.16 1.07
79 1.22 1.08 1.21 1.08 1.21 1.08 1.19 1.08 1.19 1.08
80 1.24 1.08 1.23 1.08 1.23 1.08 1.21 1.09 1.21 1.09
81 1.25 1.08 1.24 1.08 1.24 1.09 1.23 1.09 1.22 1.09
82 1.26 1.08 1.26 1.08 1.25 1.09 1.24 1.09 1.23 1.10
83 1.27 1.08 1.26 1.08 1.26 1.08 1.25 1.09 1.25 1.10
84 1.27 1.07 1.27 1.07 1.26 1.08 1.26 1.08 1.25 1.09
85 1.27 1.06 1.27 1.07 1.26 1.07 1.26 1.08 1.26 1.09
86 1.26 1.05 1.26 1.06 1.26 1.07 1.26 1.07 1.26 1.08
87 1.26 1.04 1.26 1.05 1.25 1.06 1.25 1.06 1.26 1.07
88 1.25 1.02 1.25 1.03 1.25 1.04 1.25 1.04 1.25 1.06
89 1.24 1.01 1.24 1.02 1.23 1.03 1.24 1.03 1.25 1.04
90 1.22 0.99 1.23 1.00 1.22 1.01 1.23 1.01 1.23 1.02
91 1.21 0.97 1.21 0.98 1.20 0.99 1.21 1.00 1.22 1.00
92 1.19 0.94 1.20 0.96 1.18 0.97 1.19 0.98 1.20 0.98
93 1.17 0.92 1.18 0.94 1.16 0.95 1.17 0.95 1.18 0.95
94 1.14 0.89 1.15 0.91 1.14 0.92 1.14 0.93 1.16 0.92
95 1.11 0.86 1.13 0.87 1.11 0.89 1.11 0.90 1.13 0.89
96 1.08 0.82 1.10 0.83 1.08 0.86 1.08 0.86 1.10 0.85
97 1.05 0.78 1.07 0.79 1.05 0.82 1.05 0.83 1.07 0.81
98 1.02 0.73 1.03 0.74 1.01 0.78 1.01 0.79 1.03 0.77
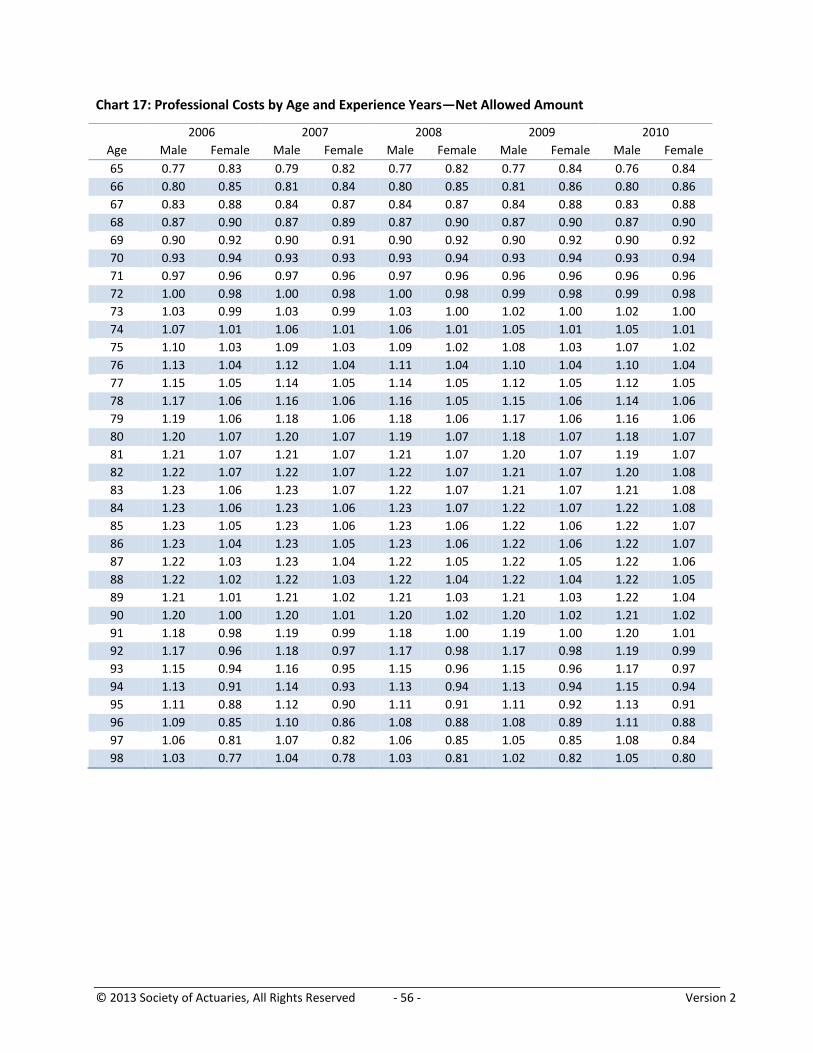
© 2013 Society of Actuaries, All Rights Reserved - 56 - Version 2
Chart 17: Professional Costs by Age and Experience Years—Net Allowed Amount
2006 2007 2008 2009 2010
Age Male Female Male Female Male Female Male Female Male Female
65 0.77 0.83 0.79 0.82 0.77 0.82 0.77 0.84 0.76 0.84
66 0.80 0.85 0.81 0.84 0.80 0.85 0.81 0.86 0.80 0.86
67 0.83 0.88 0.84 0.87 0.84 0.87 0.84 0.88 0.83 0.88
68 0.87 0.90 0.87 0.89 0.87 0.90 0.87 0.90 0.87 0.90
69 0.90 0.92 0.90 0.91 0.90 0.92 0.90 0.92 0.90 0.92
70 0.93 0.94 0.93 0.93 0.93 0.94 0.93 0.94 0.93 0.94
71 0.97 0.96 0.97 0.96 0.97 0.96 0.96 0.96 0.96 0.96
72 1.00 0.98 1.00 0.98 1.00 0.98 0.99 0.98 0.99 0.98
73 1.03 0.99 1.03 0.99 1.03 1.00 1.02 1.00 1.02 1.00
74 1.07 1.01 1.06 1.01 1.06 1.01 1.05 1.01 1.05 1.01
75 1.10 1.03 1.09 1.03 1.09 1.02 1.08 1.03 1.07 1.02
76 1.13 1.04 1.12 1.04 1.11 1.04 1.10 1.04 1.10 1.04
77 1.15 1.05 1.14 1.05 1.14 1.05 1.12 1.05 1.12 1.05
78 1.17 1.06 1.16 1.06 1.16 1.05 1.15 1.06 1.14 1.06
79 1.19 1.06 1.18 1.06 1.18 1.06 1.17 1.06 1.16 1.06
80 1.20 1.07 1.20 1.07 1.19 1.07 1.18 1.07 1.18 1.07
81 1.21 1.07 1.21 1.07 1.21 1.07 1.20 1.07 1.19 1.07
82 1.22 1.07 1.22 1.07 1.22 1.07 1.21 1.07 1.20 1.08
83 1.23 1.06 1.23 1.07 1.22 1.07 1.21 1.07 1.21 1.08
84 1.23 1.06 1.23 1.06 1.23 1.07 1.22 1.07 1.22 1.08
85 1.23 1.05 1.23 1.06 1.23 1.06 1.22 1.06 1.22 1.07
86 1.23 1.04 1.23 1.05 1.23 1.06 1.22 1.06 1.22 1.07
87 1.22 1.03 1.23 1.04 1.22 1.05 1.22 1.05 1.22 1.06
88 1.22 1.02 1.22 1.03 1.22 1.04 1.22 1.04 1.22 1.05
89 1.21 1.01 1.21 1.02 1.21 1.03 1.21 1.03 1.22 1.04
90 1.20 1.00 1.20 1.01 1.20 1.02 1.20 1.02 1.21 1.02
91 1.18 0.98 1.19 0.99 1.18 1.00 1.19 1.00 1.20 1.01
92 1.17 0.96 1.18 0.97 1.17 0.98 1.17 0.98 1.19 0.99
93 1.15 0.94 1.16 0.95 1.15 0.96 1.15 0.96 1.17 0.97
94 1.13 0.91 1.14 0.93 1.13 0.94 1.13 0.94 1.15 0.94
95 1.11 0.88 1.12 0.90 1.11 0.91 1.11 0.92 1.13 0.91
96 1.09 0.85 1.10 0.86 1.08 0.88 1.08 0.89 1.11 0.88
97 1.06 0.81 1.07 0.82 1.06 0.85 1.05 0.85 1.08 0.84
98 1.03 0.77 1.04 0.78 1.03 0.81 1.02 0.82 1.05 0.80

© 2013 Society of Actuaries, All Rights Reserved - 57 - Version 2
Chart 18: Pharmacy Costs by Age and Experience Years—Medicare Ages
2006 2007 2008 2009 2010
Age Male Female Male Female Male Female Male Female Male Female
65 0.95 0.97 0.87 0.89 0.85 0.86 0.84 0.83 0.78 0.77
66 0.96 0.97 0.90 0.91 0.88 0.90 0.88 0.87 0.83 0.82
67 0.97 0.97 0.92 0.94 0.92 0.93 0.92 0.90 0.88 0.87
68 0.99 0.98 0.95 0.96 0.95 0.96 0.96 0.93 0.93 0.91
69 1.00 0.99 0.98 0.98 0.98 0.98 0.99 0.96 0.97 0.95
70 1.01 1.00 1.00 1.00 1.01 1.00 1.02 0.98 1.00 0.98
71 1.03 1.01 1.02 1.01 1.03 1.02 1.04 1.00 1.03 1.01
72 1.04 1.02 1.04 1.03 1.05 1.04 1.06 1.01 1.05 1.03
73 1.06 1.02 1.05 1.04 1.07 1.05 1.08 1.03 1.07 1.05
74 1.07 1.03 1.07 1.05 1.08 1.06 1.09 1.04 1.09 1.06
75 1.08 1.04 1.08 1.05 1.09 1.06 1.10 1.04 1.10 1.07
76 1.09 1.04 1.09 1.06 1.11 1.06 1.11 1.05 1.11 1.08
77 1.10 1.04 1.10 1.07 1.11 1.07 1.12 1.05 1.12 1.09
78 1.10 1.04 1.11 1.07 1.12 1.07 1.13 1.05 1.13 1.09
79 1.10 1.04 1.11 1.07 1.12 1.07 1.13 1.06 1.14 1.10
80 1.10 1.03 1.10 1.07 1.11 1.06 1.13 1.06 1.14 1.10
81 1.09 1.02 1.09 1.06 1.10 1.06 1.12 1.05 1.13 1.09
82 1.08 1.01 1.08 1.06 1.08 1.05 1.11 1.05 1.12 1.08
83 1.06 0.99 1.06 1.04 1.06 1.04 1.09 1.04 1.10 1.07
84 1.05 0.97 1.04 1.02 1.04 1.03 1.07 1.03 1.08 1.06
85 1.03 0.95 1.01 1.00 1.02 1.01 1.04 1.01 1.05 1.04
86 1.01 0.93 0.99 0.98 0.99 0.99 1.02 1.00 1.02 1.03
87 0.98 0.90 0.97 0.96 0.97 0.97 1.00 0.98 0.99 1.01
88 0.96 0.88 0.95 0.93 0.95 0.94 0.97 0.96 0.96 0.99
89 0.94 0.85 0.94 0.91 0.93 0.92 0.95 0.94 0.94 0.97
90 0.93 0.83 0.92 0.89 0.92 0.89 0.93 0.92 0.91 0.95
91 0.91 0.80 0.91 0.87 0.90 0.86 0.92 0.91 0.89 0.94
92 0.89 0.77 0.90 0.85 0.89 0.83 0.90 0.90 0.87 0.92
93 0.87 0.75 0.89 0.83 0.87 0.81 0.89 0.88 0.84 0.90
94 0.86 0.73 0.88 0.81 0.86 0.78 0.88 0.87 0.82 0.89
95 0.84 0.70 0.87 0.79 0.85 0.76 0.87 0.86 0.81 0.88
96 0.83 0.68 0.87 0.78 0.84 0.74 0.86 0.85 0.79 0.86
97 0.81 0.66 0.86 0.76 0.82 0.72 0.85 0.84 0.77 0.85
98 0.80 0.64 0.85 0.74 0.81 0.70 0.84 0.82 0.76 0.84

© 2013 Society of Actuaries, All Rights Reserved - 58 - Version 2
Chart 19: Comparison of Medicare Costs (Total, Medicare, Net)
Total Charge Medicare Benefit Net Amount
Age Male Female Male Female Male Female
65 0.69 0.67 0.63 0.63 0.99 0.89
66 0.71 0.69 0.66 0.65 0.97 0.87
67 0.73 0.71 0.69 0.68 0.95 0.86
68 0.76 0.73 0.72 0.71 0.95 0.85
69 0.79 0.76 0.76 0.74 0.95 0.85
70 0.82 0.78 0.79 0.77 0.95 0.86
71 0.85 0.81 0.83 0.80 0.96 0.87
72 0.89 0.84 0.87 0.84 0.97 0.88
73 0.92 0.88 0.91 0.87 0.98 0.89
74 0.96 0.91 0.95 0.91 1.00 0.91
75 1.00 0.94 1.00 0.94 1.01 0.93
76 1.04 0.97 1.04 0.98 1.02 0.95
77 1.08 1.01 1.08 1.01 1.04 0.97
78 1.12 1.04 1.13 1.05 1.06 1.00
79 1.16 1.08 1.18 1.09 1.07 1.02
80 1.20 1.12 1.22 1.13 1.09 1.04
81 1.25 1.16 1.27 1.18 1.11 1.05
82 1.29 1.20 1.32 1.22 1.14 1.07
83 1.33 1.24 1.36 1.27 1.16 1.09
84 1.37 1.28 1.41 1.31 1.18 1.11
85 1.42 1.32 1.46 1.36 1.20 1.12
86 1.46 1.36 1.50 1.40 1.23 1.14
87 1.50 1.40 1.55 1.44 1.25 1.16
88 1.54 1.44 1.60 1.48 1.27 1.18
89 1.59 1.47 1.64 1.52 1.29 1.20
90 1.63 1.51 1.69 1.56 1.31 1.21
91 1.67 1.53 1.73 1.59 1.32 1.23
92 1.70 1.56 1.77 1.62 1.34 1.23
93 1.74 1.57 1.82 1.64 1.35 1.23
94 1.77 1.58 1.85 1.65 1.36 1.21
95 1.80 1.57 1.89 1.64 1.36 1.19
96 1.83 1.55 1.92 1.62 1.36 1.15
97 1.85 1.51 1.94 1.59 1.36 1.10
98 1.87 1.47 1.96 1.55 1.36 1.04

© 2013 Society of Actuaries, All Rights Reserved - 59 - Version 2
Chart 20: Net Allowed Amount by Age for Specific Plan Design
20.00% 10.00% 10.00% 60.00% 100.00%
Inpatient Outpatient Professional Pharmacy Total
Age Male Female Male Female Male Female Male Female Male Female
65 1.296 0.873 0.996 1.022 0.763 0.836 0.778 0.769 0.902 0.822
66 1.184 0.801 1.004 1.018 0.800 0.858 0.834 0.824 0.917 0.842
67 1.091 0.745 1.015 1.014 0.835 0.880 0.883 0.872 0.933 0.862
68 1.018 0.706 1.026 1.011 0.869 0.901 0.927 0.915 0.949 0.881
69 0.964 0.682 1.038 1.010 0.902 0.922 0.965 0.951 0.966 0.900
70 0.927 0.672 1.050 1.009 0.934 0.942 0.999 0.982 0.983 0.918
71 0.904 0.673 1.062 1.008 0.964 0.961 1.028 1.007 1.000 0.936
72 0.890 0.683 1.072 1.006 0.993 0.979 1.052 1.029 1.016 0.952
73 0.884 0.699 1.080 1.003 1.022 0.995 1.072 1.046 1.030 0.968
74 0.884 0.720 1.088 0.998 1.048 1.010 1.089 1.061 1.044 0.982
75 0.888 0.745 1.092 0.993 1.074 1.024 1.103 1.073 1.056 0.995
76 0.896 0.774 1.095 0.986 1.098 1.036 1.114 1.083 1.067 1.007
77 0.911 0.809 1.095 0.978 1.120 1.047 1.124 1.089 1.078 1.018
78 0.932 0.851 1.092 0.970 1.141 1.056 1.132 1.094 1.089 1.029
79 0.962 0.900 1.088 0.961 1.159 1.064 1.137 1.097 1.099 1.040
80 1.001 0.958 1.082 0.952 1.175 1.070 1.137 1.096 1.108 1.051
81 1.047 1.023 1.076 0.943 1.189 1.075 1.132 1.092 1.115 1.062
82 1.102 1.096 1.068 0.933 1.200 1.078 1.120 1.084 1.119 1.071
83 1.162 1.173 1.058 0.924 1.210 1.079 1.102 1.073 1.121 1.079
84 1.228 1.253 1.047 0.914 1.216 1.077 1.079 1.060 1.119 1.085
85 1.297 1.333 1.035 0.903 1.221 1.074 1.052 1.044 1.116 1.091
86 1.369 1.414 1.023 0.893 1.223 1.068 1.023 1.026 1.112 1.095
87 1.442 1.494 1.009 0.884 1.223 1.060 0.993 1.007 1.108 1.097
88 1.515 1.572 0.994 0.874 1.221 1.051 0.965 0.988 1.103 1.100
89 1.588 1.645 0.978 0.865 1.216 1.039 0.937 0.970 1.099 1.101
90 1.659 1.712 0.961 0.856 1.209 1.024 0.912 0.952 1.096 1.102
91 1.729 1.768 0.943 0.845 1.199 1.008 0.888 0.935 1.093 1.100
92 1.798 1.810 0.924 0.833 1.186 0.988 0.865 0.919 1.090 1.096
93 1.864 1.834 0.903 0.817 1.171 0.966 0.845 0.904 1.087 1.088
94 1.928 1.838 0.882 0.797 1.152 0.941 0.825 0.889 1.084 1.075
95 1.989 1.818 0.859 0.773 1.131 0.912 0.806 0.875 1.080 1.057
96 2.045 1.773 0.834 0.742 1.107 0.879 0.789 0.862 1.076 1.034
97 2.098 1.702 0.808 0.706 1.080 0.843 0.772 0.849 1.072 1.005
98 2.146 1.604 0.780 0.663 1.050 0.803 0.757 0.836 1.066 0.969

© 2013 Society of Actuaries, All Rights Reserved - 60 - Version 2
Chart 21: Commercial Costs by Age Over 65
Age Male Female
66 1.27 1.11 67 1.29 1.10 68 1.27 1.05 69 1.22 1.03 70 1.21 0.98 71 1.18 0.94 72 1.14 0.93 73 1.11 0.92 74 1.14 0.89 75 1.08 0.88 76 1.05 0.88 77 1.01 0.87 78 1.01 0.86 79 1.01 0.86 80 0.98 0.87 81 0.97 0.87 82 0.94 0.83 83 0.95 0.84 84 0.91 0.85 85 0.92 0.85 86 0.88 0.84 87 0.87 0.81 88 0.85 0.81 89 0.84 0.82 90 0.83 0.79 91 0.72 0.71

© 2013 Society of Actuaries, All Rights Reserved - 61 - Version 2
Chart 22: Cost Index of Members with Cancer Diagnosis versus Total Members
2002-03 Overall 2002-03 Cancer 2009-10 Overall 2009-10 Cancer Age Male Female Male Female Male Female Male Female
0 2.93 2.44 10.26 8.98 2.97 2.53 11.97 9.52 1 1.84 1.54 9.05 7.97 1.80 1.53 10.48 8.38 2 1.06 0.89 7.94 7.02 1.00 0.84 9.11 7.33 3 0.58 0.49 6.92 6.16 0.54 0.45 7.85 6.35 4 0.34 0.29 6.00 5.36 0.36 0.29 6.70 5.47 5 0.26 0.22 5.17 4.65 0.33 0.26 5.68 4.67 6 0.27 0.22 4.44 4.01 0.35 0.28 4.77 3.96 7 0.30 0.24 3.81 3.45 0.38 0.31 3.98 3.34 8 0.33 0.27 3.27 2.97 0.39 0.32 3.33 2.82 9 0.35 0.28 2.83 2.56 0.39 0.32 2.81 2.39
10 0.35 0.29 2.47 2.23 0.38 0.32 2.41 2.06 11 0.36 0.30 2.19 1.96 0.39 0.33 2.12 1.81 12 0.38 0.32 1.99 1.75 0.41 0.35 1.93 1.64 13 0.40 0.34 1.85 1.61 0.44 0.39 1.82 1.54 14 0.43 0.38 1.75 1.51 0.49 0.45 1.77 1.48 15 0.45 0.43 1.70 1.45 0.52 0.50 1.75 1.46 16 0.47 0.47 1.67 1.43 0.55 0.55 1.76 1.47 17 0.47 0.51 1.67 1.44 0.55 0.58 1.77 1.48 18 0.45 0.54 1.68 1.47 0.52 0.59 1.78 1.49 19 0.42 0.57 1.70 1.52 0.47 0.58 1.78 1.51 20 0.39 0.60 1.72 1.59 0.43 0.58 1.78 1.52 21 0.37 0.64 1.74 1.66 0.39 0.58 1.76 1.53 22 0.36 0.69 1.76 1.74 0.38 0.61 1.74 1.54 23 0.36 0.76 1.79 1.82 0.37 0.66 1.71 1.56 24 0.37 0.83 1.81 1.90 0.37 0.72 1.68 1.59 25 0.39 0.90 1.83 1.99 0.38 0.79 1.64 1.63 26 0.41 0.98 1.86 2.07 0.39 0.86 1.61 1.68 27 0.43 1.04 1.88 2.14 0.41 0.93 1.58 1.75 28 0.45 1.10 1.91 2.22 0.43 1.00 1.56 1.83 29 0.47 1.14 1.94 2.30 0.45 1.06 1.55 1.92 30 0.49 1.18 1.97 2.39 0.47 1.11 1.55 2.02 31 0.52 1.20 2.00 2.47 0.50 1.15 1.56 2.12 32 0.54 1.22 2.04 2.56 0.52 1.18 1.59 2.24 33 0.56 1.23 2.07 2.66 0.54 1.20 1.63 2.35 34 0.58 1.23 2.11 2.75 0.56 1.20 1.68 2.47 35 0.61 1.22 2.16 2.86 0.59 1.21 1.74 2.60 36 0.64 1.21 2.21 2.97 0.61 1.20 1.81 2.74 37 0.66 1.19 2.27 3.08 0.65 1.20 1.89 2.88 38 0.69 1.18 2.34 3.20 0.68 1.20 1.97 3.03 39 0.72 1.17 2.42 3.33 0.71 1.20 2.06 3.20 40 0.75 1.17 2.51 3.46 0.74 1.21 2.15 3.36 41 0.78 1.18 2.61 3.59 0.78 1.22 2.26 3.52 42 0.81 1.19 2.71 3.72 0.81 1.23 2.36 3.66 43 0.85 1.21 2.82 3.86 0.84 1.24 2.48 3.79 44 0.89 1.23 2.94 3.99 0.88 1.26 2.59 3.90 45 0.93 1.27 3.06 4.12 0.92 1.28 2.71 4.00 46 0.98 1.31 3.18 4.25 0.97 1.31 2.82 4.08 47 1.04 1.36 3.30 4.38 1.01 1.35 2.94 4.16 48 1.10 1.41 3.42 4.51 1.07 1.39 3.06 4.24 49 1.16 1.46 3.54 4.63 1.14 1.45 3.17 4.32 50 1.23 1.52 3.66 4.75 1.21 1.50 3.30 4.41 51 1.30 1.57 3.79 4.88 1.28 1.56 3.43 4.51 52 1.37 1.62 3.93 5.00 1.35 1.61 3.57 4.62 53 1.45 1.66 4.07 5.14 1.42 1.66 3.73 4.74 54 1.52 1.71 4.23 5.28 1.50 1.70 3.89 4.87 55 1.60 1.76 4.39 5.42 1.58 1.75 4.06 5.01 56 1.68 1.82 4.56 5.57 1.67 1.79 4.22 5.14 57 1.76 1.87 4.73 5.71 1.75 1.84 4.38 5.27 58 1.85 1.93 4.90 5.86 1.84 1.90 4.54 5.39 59 1.94 1.99 5.07 6.00 1.94 1.96 4.67 5.51 60 2.04 2.06 5.23 6.14 2.03 2.04 4.80 5.62 61 2.13 2.11 5.38 6.27 2.13 2.12 4.91 5.72 62 2.22 2.17 5.52 6.39 2.23 2.20 5.01 5.81 63 2.30 2.22 5.64 6.50 2.35 2.29 5.10 5.89 64 2.37 2.26 5.75 6.60 2.47 2.39 5.18 5.96

© 2013 Society of Actuaries, All Rights Reserved - 62 - Version 2
Chart 23: Cost Ratio of Members with Cancer Diagnosis to Total Members – 2009-10
Age Male Female Age Male Female
0 4.03 3.76 65 1.99 2.07 1 5.82 5.48 66 1.94 2.04 2 9.14 8.69 67 1.89 2.01 3 14.45 14.03 68 1.84 1.97 4 18.78 18.76 69 1.79 1.93 5 17.43 17.78 70 1.75 1.88 6 13.54 13.95 71 1.70 1.84 7 10.50 10.89 72 1.65 1.79 8 8.56 8.91 73 1.60 1.75 9 7.28 7.58 74 1.54 1.70
10 6.30 6.52 75 1.49 1.66 11 5.46 5.56 76 1.45 1.62 12 4.73 4.68 77 1.40 1.57 13 4.11 3.92 78 1.35 1.53 14 3.65 3.33 79 1.31 1.48 15 3.34 2.91 80 1.26 1.43 16 3.21 2.66 81 1.22 1.38 17 3.24 2.54 82 1.17 1.33 18 3.44 2.52 83 1.13 1.29 19 3.77 2.58 84 1.08 1.25 20 4.15 2.63 85 1.04 1.21 21 4.47 2.61 86 0.99 1.18 22 4.64 2.52 87 0.95 1.15 23 4.64 2.37 88 0.91 1.12 24 4.51 2.21 89 0.88 1.09 25 4.31 2.07 90 0.84 1.06 26 4.07 1.96 91 0.81 1.04 27 3.85 1.88 92 0.78 1.03 28 3.64 1.83 93 0.76 1.02 29 3.45 1.81 94 0.74 1.02 30 3.29 1.82 95 0.72 1.03 31 3.15 1.85 96 0.71 1.05 32 3.06 1.90 97 0.70 1.09 33 3.01 1.97 98 0.69 1.14 34 2.98 2.05 35 2.96 2.16 36 2.94 2.27 37 2.92 2.40 38 2.90 2.53 39 2.89 2.66 40 2.90 2.78 41 2.91 2.89 42 2.92 2.98 43 2.93 3.05 44 2.94 3.10 45 2.94 3.11 46 2.93 3.11 47 2.90 3.08 48 2.85 3.04 49 2.80 2.99 50 2.74 2.94 51 2.68 2.90 52 2.65 2.88 53 2.62 2.87 54 2.59 2.86 55 2.56 2.86 56 2.53 2.86 57 2.50 2.86 58 2.46 2.84 59 2.42 2.81 60 2.37 2.76 61 2.31 2.70 62 2.24 2.64 63 2.17 2.57 64 2.10 2.50

© 2013 Society of Actuaries, All Rights Reserved - 63 - Version 2
Chart 24: Cost Ratio of Members with Circulatory Diagnosis to Total Members – 2009-10
Age Male Female Age Male Female
0 3.53 5.01 65 1.47 1.26 1 4.87 6.94 66 1.43 1.24 2 7.28 10.43 67 1.39 1.22 3 10.97 15.92 68 1.36 1.21 4 13.63 20.11 69 1.34 1.19 5 12.18 18.08 70 1.33 1.18 6 9.23 13.57 71 1.32 1.17 7 7.12 10.28 72 1.31 1.16 8 5.91 8.36 73 1.30 1.15 9 5.25 7.25 74 1.29 1.15
10 4.86 6.54 75 1.28 1.14 11 4.54 5.97 76 1.27 1.14 12 4.22 5.43 77 1.26 1.13 13 3.88 4.91 78 1.25 1.13 14 3.57 4.43 79 1.24 1.12 15 3.33 4.06 80 1.22 1.10 16 3.19 3.82 81 1.21 1.09 17 3.18 3.73 82 1.19 1.07 18 3.29 3.76 83 1.18 1.05 19 3.49 3.86 84 1.16 1.04 20 3.69 3.93 85 1.15 1.02 21 3.81 3.87 86 1.13 1.01 22 3.77 3.65 87 1.12 1.00 23 3.60 3.33 88 1.10 0.98 24 3.35 2.98 89 1.09 0.97 25 3.08 2.64 90 1.08 0.97 26 2.83 2.35 91 1.07 0.96 27 2.61 2.11 92 1.06 0.96 28 2.43 1.92 93 1.06 0.97 29 2.28 1.76 94 1.05 0.98 30 2.16 1.64 95 1.05 1.00 31 2.07 1.55 96 1.06 1.03 32 2.01 1.50 97 1.07 1.08 33 1.97 1.46 98 1.08 1.14 34 1.94 1.45 35 1.92 1.45 36 1.89 1.46 37 1.86 1.47 38 1.84 1.49 39 1.82 1.51 40 1.80 1.52 41 1.80 1.54 42 1.80 1.55 43 1.80 1.57 44 1.80 1.58 45 1.80 1.58 46 1.80 1.58 47 1.80 1.57 48 1.80 1.55 49 1.79 1.53 50 1.78 1.50 51 1.77 1.47 52 1.76 1.45 53 1.74 1.44 54 1.72 1.42 55 1.70 1.41 56 1.67 1.40 57 1.63 1.40 58 1.60 1.39 59 1.57 1.38 60 1.54 1.37 61 1.51 1.36 62 1.48 1.35 63 1.46 1.34 64 1.44 1.33

© 2013 Society of Actuaries, All Rights Reserved - 64 - Version 2
Chart 25: Cost Ratio of Members with Musculoskeletal Diagnosis to Total Members – 2009-10
Age Male Female Age Male Female
0 0.52 0.56 65 1.25 1.16 1 0.73 0.79 66 1.23 1.14 2 1.10 1.21 67 1.20 1.12 3 1.71 1.91 68 1.18 1.10 4 2.21 2.56 69 1.15 1.08 5 2.10 2.51 70 1.12 1.05 6 1.73 2.12 71 1.10 1.03 7 1.48 1.87 72 1.07 1.02 8 1.38 1.80 73 1.05 1.00 9 1.38 1.86 74 1.02 0.98
10 1.43 1.97 75 1.00 0.97 11 1.49 2.06 76 0.98 0.95 12 1.52 2.07 77 0.96 0.93 13 1.52 1.99 78 0.94 0.92 14 1.50 1.86 79 0.93 0.90 15 1.48 1.74 80 0.91 0.87 16 1.49 1.66 81 0.89 0.85 17 1.54 1.62 82 0.88 0.83 18 1.64 1.65 83 0.86 0.81 19 1.79 1.71 84 0.85 0.80 20 1.94 1.77 85 0.84 0.78 21 2.06 1.79 86 0.83 0.77 22 2.12 1.75 87 0.82 0.76 23 2.12 1.66 88 0.82 0.75 24 2.08 1.55 89 0.81 0.74 25 2.02 1.45 90 0.81 0.73 26 1.96 1.36 91 0.81 0.73 27 1.91 1.29 92 0.82 0.73 28 1.87 1.23 93 0.82 0.73 29 1.83 1.18 94 0.83 0.75 30 1.79 1.15 95 0.84 0.77 31 1.76 1.13 96 0.85 0.80 32 1.74 1.12 97 0.87 0.84 33 1.72 1.12 98 0.90 0.91 34 1.71 1.13 35 1.69 1.15 36 1.67 1.18 37 1.64 1.21 38 1.62 1.25 39 1.59 1.28 40 1.58 1.31 41 1.56 1.34 42 1.55 1.37 43 1.53 1.39 44 1.52 1.41 45 1.51 1.43 46 1.50 1.43 47 1.49 1.44 48 1.48 1.43 49 1.46 1.43 50 1.44 1.42 51 1.43 1.41 52 1.41 1.40 53 1.40 1.39 54 1.38 1.38 55 1.36 1.38 56 1.34 1.37 57 1.32 1.37 58 1.31 1.36 59 1.30 1.35 60 1.29 1.34 61 1.28 1.33 62 1.27 1.32 63 1.26 1.31 64 1.25 1.30

© 2013 Society of Actuaries, All Rights Reserved - 65 - Version 2
Chart 26: Comparison of 2010 Age Curve with Petertil Table
Age Male Female Petertil Age Male Female Petertil
50 0.671 0.834 0.794 65 0.902 0.822 0.777 51 0.711 0.864 0.820 66 0.917 0.842 0.800 52 0.751 0.892 0.847 67 0.933 0.862 0.824 53 0.792 0.919 0.875 68 0.949 0.881 0.849 54 0.835 0.946 0.904 69 0.966 0.900 0.874 55 0.881 0.972 0.934 70 0.983 0.918 0.901 56 0.928 0.999 0.967 71 1.000 0.936 0.923 57 0.978 1.028 1.002 72 1.016 0.952 0.946 58 1.029 1.060 1.038 73 1.030 0.968 0.970 59 1.081 1.095 1.075 74 1.044 0.982 0.994 60 1.134 1.134 1.114 75 1.056 0.995 1.019 61 1.191 1.177 1.161 76 1.067 1.007 1.039 62 1.251 1.225 1.210 77 1.078 1.018 1.060 63 1.316 1.275 1.260 78 1.089 1.029 1.081 64 1.385 1.327 1.313 79 1.099 1.040 1.103
80 1.108 1.051 1.125 81 1.115 1.062 1.136 82 1.119 1.071 1.148 83 1.121 1.079 1.159 84 1.119 1.085 1.171 85 1.116 1.091 1.182 86 1.112 1.095 1.188 87 1.108 1.097 1.194 88 1.103 1.100 1.200 89 1.099 1.101 1.206 90 1.096 1.102 1.212 91 1.093 1.100 1.212 92 1.090 1.096 1.212 93 1.087 1.088 1.212 94 1.084 1.075 1.212 95 1.080 1.057 1.212 96 1.076 1.034 1.212 97 1.072 1.005 1.212 98 1.066 0.969 1.212

© 2013 Society of Actuaries, All Rights Reserved - 66 - Version 2
Chart 27: Individual HMO data for calendar year 2010
Raw Graduated Raw Graduated
Age Male Female Male Female Age Male Female Male Female
0 23,902 8,831 6,202 5,130 35 2,179 4,478 2,257 4,150
1 5,409 5,565 4,997 4,182 36 2,152 5,453 2,366 4,125
2 1,592 3,134 3,980 3,363 37 2,797 3,764 2,482 4,082
3 2,861 1,524 3,148 2,673 38 2,048 3,969 2,605 4,029
4 1,399 1,124 2,494 2,110 39 2,800 3,615 2,735 3,973
5 1,587 1,511 2,009 1,669 40 2,288 3,904 2,871 3,924
6 1,129 1,189 1,675 1,341 41 3,421 3,727 3,011 3,891
7 1,375 1,027 1,472 1,116 42 3,769 3,761 3,155 3,879
8 985 1,235 1,376 981 43 3,482 3,584 3,303 3,895
9 1,553 1,225 1,363 922 44 3,360 4,153 3,457 3,942
10 3,397 1,376 1,406 926 45 3,247 3,646 3,618 4,020
11 1,265 927 1,484 979 46 4,202 4,244 3,789 4,129
12 2,322 1,097 1,577 1,071 47 3,994 4,074 3,974 4,267
13 1,380 1,077 1,671 1,190 48 4,050 4,433 4,176 4,431
14 1,558 1,226 1,755 1,329 49 4,246 4,692 4,399 4,616
15 1,609 1,489 1,823 1,480 50 4,990 5,113 4,644 4,819
16 2,333 2,362 1,870 1,637 51 4,695 5,616 4,912 5,036
17 2,036 1,791 1,895 1,795 52 4,519 5,111 5,205 5,264
18 2,125 1,863 1,898 1,954 53 5,688 5,830 5,522 5,503
19 1,494 2,184 1,883 2,112 54 5,854 5,384 5,857 5,751
20 1,627 2,144 1,856 2,271 55 5,728 5,285 6,208 6,009
21 2,319 2,431 1,820 2,432 56 6,328 6,436 6,567 6,274
22 1,279 2,400 1,783 2,595 57 7,257 6,512 6,928 6,545
23 1,475 2,765 1,750 2,762 58 8,333 6,854 7,283 6,818
24 1,339 2,304 1,724 2,931 59 7,789 7,068 7,625 7,090
25 1,855 3,298 1,710 3,104 60 7,724 7,779 7,951 7,358
26 1,253 2,814 1,709 3,275 61 7,487 7,658 8,256 7,619
27 2,254 3,371 1,722 3,443 62 9,770 7,876 8,539 7,871
28 1,782 3,769 1,749 3,603 63 8,616 8,342 8,797 8,113
29 1,718 3,748 1,789 3,750 64 8,363 7,968 9,031 8,344
30 1,762 4,008 1,841 3,879
31 2,005 3,985 1,905 3,987
32 2,035 3,882 1,980 4,069
33 2,394 4,443 2,064 4,124
34 2,174 4,049 2,156 4,150
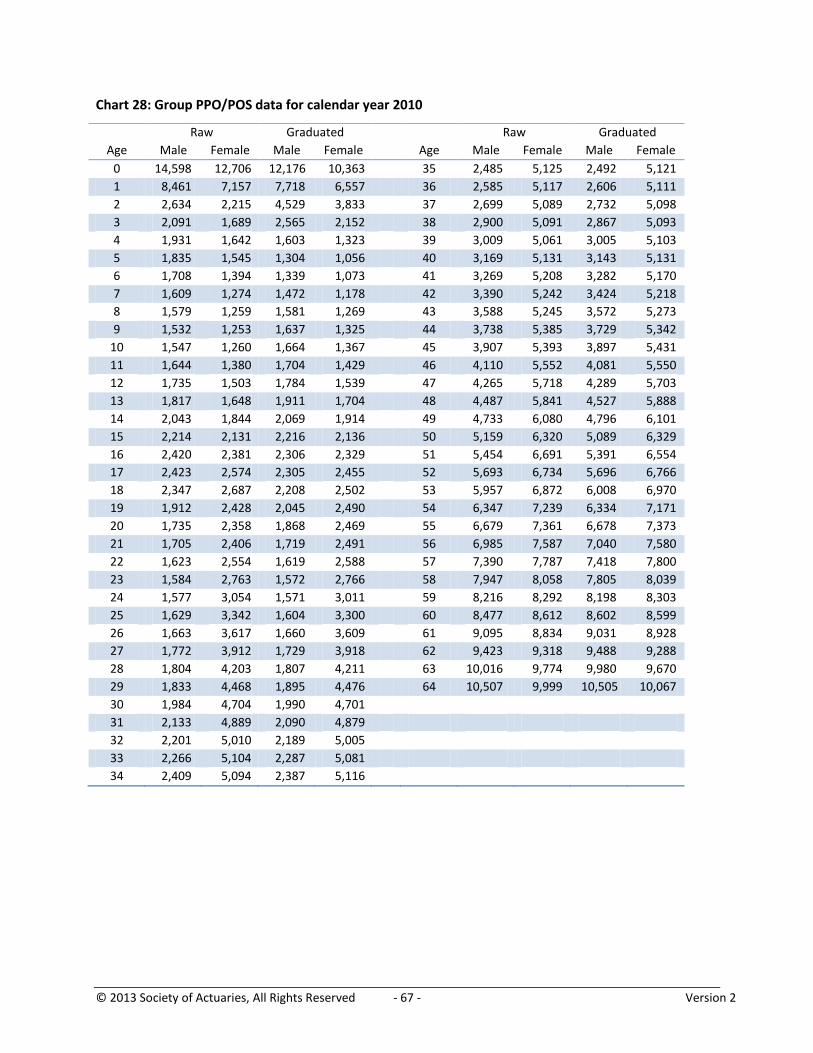
© 2013 Society of Actuaries, All Rights Reserved - 67 - Version 2
Chart 28: Group PPO/POS data for calendar year 2010
Raw Graduated Raw Graduated
Age Male Female Male Female Age Male Female Male Female
0 14,598 12,706 12,176 10,363 35 2,485 5,125 2,492 5,121
1 8,461 7,157 7,718 6,557 36 2,585 5,117 2,606 5,111
2 2,634 2,215 4,529 3,833 37 2,699 5,089 2,732 5,098
3 2,091 1,689 2,565 2,152 38 2,900 5,091 2,867 5,093
4 1,931 1,642 1,603 1,323 39 3,009 5,061 3,005 5,103
5 1,835 1,545 1,304 1,056 40 3,169 5,131 3,143 5,131
6 1,708 1,394 1,339 1,073 41 3,269 5,208 3,282 5,170
7 1,609 1,274 1,472 1,178 42 3,390 5,242 3,424 5,218
8 1,579 1,259 1,581 1,269 43 3,588 5,245 3,572 5,273
9 1,532 1,253 1,637 1,325 44 3,738 5,385 3,729 5,342
10 1,547 1,260 1,664 1,367 45 3,907 5,393 3,897 5,431
11 1,644 1,380 1,704 1,429 46 4,110 5,552 4,081 5,550
12 1,735 1,503 1,784 1,539 47 4,265 5,718 4,289 5,703
13 1,817 1,648 1,911 1,704 48 4,487 5,841 4,527 5,888
14 2,043 1,844 2,069 1,914 49 4,733 6,080 4,796 6,101
15 2,214 2,131 2,216 2,136 50 5,159 6,320 5,089 6,329
16 2,420 2,381 2,306 2,329 51 5,454 6,691 5,391 6,554
17 2,423 2,574 2,305 2,455 52 5,693 6,734 5,696 6,766
18 2,347 2,687 2,208 2,502 53 5,957 6,872 6,008 6,970
19 1,912 2,428 2,045 2,490 54 6,347 7,239 6,334 7,171
20 1,735 2,358 1,868 2,469 55 6,679 7,361 6,678 7,373
21 1,705 2,406 1,719 2,491 56 6,985 7,587 7,040 7,580
22 1,623 2,554 1,619 2,588 57 7,390 7,787 7,418 7,800
23 1,584 2,763 1,572 2,766 58 7,947 8,058 7,805 8,039
24 1,577 3,054 1,571 3,011 59 8,216 8,292 8,198 8,303
25 1,629 3,342 1,604 3,300 60 8,477 8,612 8,602 8,599
26 1,663 3,617 1,660 3,609 61 9,095 8,834 9,031 8,928
27 1,772 3,912 1,729 3,918 62 9,423 9,318 9,488 9,288
28 1,804 4,203 1,807 4,211 63 10,016 9,774 9,980 9,670
29 1,833 4,468 1,895 4,476 64 10,507 9,999 10,505 10,067
30 1,984 4,704 1,990 4,701
31 2,133 4,889 2,090 4,879
32 2,201 5,010 2,189 5,005
33 2,266 5,104 2,287 5,081
34 2,409 5,094 2,387 5,116