head impact exposure in youth football practice drills
TRANSCRIPT

1
2016 Ohio State University Injury Biomechanics Symposium
This paper has not been peer- reviewed.
Head Impact Exposure in Youth Football Practice Drills
Mireille Kelley1, Joeline Kane
2, Mark Espeland
3, Logan Miller
1, Joel Stitzel
1, Jillian Urban
1
1Virginia Tech-Wake Forest University School of Biomedical Engineering and Sciences,
2Wake
Forest University, 3Wake Forest University, Department of Health Sciences
ABSTRACT
The purpose of this study is to evaluate frequency and magnitude of head impacts in practice
drills within a single youth football team. On-field head impact data were collected from 9
athletes (age = 11.1 ± 0.6 years, weight = 97.6 ± 12.2 lbs.) participating in an age and weight
restricted youth football team for a single season. Head impact data were collected with the
Head Impact Telemetry (HIT) System head acceleration measurement device. Video was
recorded for all practices and games and video analysis was performed to verify head impacts
and assign each impact to a specific drill. Drills were identified as: dummy/sled tackling, install,
kickoff practice, Oklahoma, one-on-one, open field tackling, passing, position skill work, multi-
player tackle, tackling drill stations, and scrimmage. Mixed effects linear models were fitted and
Wald tests were used to assess differences in head accelerations and number of impacts. There
were significant differences in mean linear (p<0.0001) and rotational (p=0.003) acceleration
and number of impacts per player (p<0.0001) among drills. Open field tackling drills had the
highest median/95th
percentile linear accelerations of 24.7g/96.4g and resulted in significantly
higher mean head accelerations compared to several other drills. The multi-player tackling drill
resulted in the highest head impact frequency of 6.6 impacts per player in a drill session. This
study demonstrates the variability in head impact exposure among practice drills. These data,
along with future research, may inform organizations on ways to structure their practice to limit
high impact and high frequency drills and make sports safer for youth.
INTRODUCTION
Approximately 5 million athletes play organized football in the United States; 2,000
NFL, 100,000 college, 1.3 million high school, and 3.5 million youth (Powell and Barber-Foss
1999; Guskiewicz, Weaver et al. 2000; Daniel, Rowson et al. 2012). Despite making up the
largest proportion of football athletes, youth football has seen declines in participation in recent
years (SFIA 2013; SFIA 2015). Although several factors may be attributing to the decline in
participation, concern over injuries, particularly concussion and the long-term side effects of
repetitive head impacts, have been suggested as major factors (Institute 2014). However, youth
football participation and long-term neurological deficits are still not well understood. A study
by Stamm et al. demonstrated an association between involvement in tackle football prior to age
12 and cognitive impairment in former NFL players later in life, but a similar study by Solomon

2
2016 Ohio State University Injury Biomechanics Symposium
This paper has not been peer- reviewed.
et al. failed to find an association between participation in football prior to high school and later-
life neurological deficits (Stamm, Bourlas et al. 2015; Solomon, Kuhn et al. 2016). Further
research is necessary to better understand the long-term effects of exposure to repetitive head
impacts. In particular, more head impact exposure data are needed in the youth football
population. Although impact data from youth athletes are scarce, preliminary data suggest that
youth football players sustain head impacts approaching the magnitude of high school and
collegiate football players (Daniel, Rowson et al. 2012; Pellman, Lovell et al. 2006; Rowson,
Brolinson et al. 2009; Rowson, Goforth et al. 2009; Cobb, Urban et al. 2013). Additionally, a
study of head impact exposure in youth football athletes aged 7-8 years showed that impacts
greater than 80g were occurring during practices, not games (Daniel, Rowson et al. 2012).
In an effort to reduce risk of concussion and overall head impact exposure, some football
organizations have taken steps to implement rule changes that affect practice structure. For
example, in 2012 Pop Warner limited the amount of contact allowed at each practice and
eliminated several full speed head-on blocking or tackling drills (2012). Cobb et al. studied the
effect of limiting contact in practices in youth football by comparing one team that adopted the
aforementioned practice limitations on contact and two teams that did not (Cobb, Urban et al.
2013). Players participating on the team with contact limitations had 37-46% fewer head impacts
for the entire season than those on the teams that did not implement contact limitations (Cobb,
Urban et al. 2013). Football organizations have also implemented educational programs such as
the Heads Up Football program to train coaches on tackling technique, proper equipment fitting,
and strategies to reduce player-to-player contact and concussion (Football ; Kerr, Yeargin et al.
2015; 2016). A study evaluating the effectiveness of the Heads Up Football program found that
leagues implementing this program accumulated significantly fewer head impacts per practice
compared to leagues that did not (Kerr, Yeargin et al. 2015).
These studies have shown that head impact exposure can be directly controlled by
coaches, leagues, and organizations by adopting rules and regulations to limit contact or improve
the quality of contact. However, it is yet to be determined how specific practice drills play a role
in the head impact exposure measured on the field. The objective of this study is to evaluate the
frequency and magnitude of head impacts in practice drills within a single youth football team
through biomechanical data collection and detailed video analysis.
METHODS
On-field head impact data from athletes participating in a local youth football team were
collected during one season of play. The study protocol was approved by the Wake Forest
School of Medicine Institutional Review Board and participant assent and parental consent were
properly acquired for participation in the study. The athletes enrolled in the study participate in a
youth football league in which athletes are placed on teams based on age and weight
requirements set by the national governing organization. The athletes evaluated in this study
participated in a team with the age and weight requirements of 10 years old or younger with a
maximum weight of 119 lbs. or 11 years old with maximum weight of 99 lbs.
Head impact data were collected by instrumenting the helmets of youth football players
with the Head Impact Telemetry (HIT) System head acceleration measurement device during all
preseason, regular season, and play-off practices and games. Each study participant was issued a

3
2016 Ohio State University Injury Biomechanics Symposium
This paper has not been peer- reviewed.
Riddell Speed helmet with the HIT System installed. The HIT System includes an encoder,
which is an array of six spring-mounted single-axis accelerometers oriented normal to the
surface of the head, a telemetry unit, data storage device, and battery pack. The encoder is
designed to fit between the existing padding of a Riddell Speed helmet. The spring-mounted
accelerometers allow the encoder to remain in contact with the head throughout the duration of a
head impact, ensuring measurement of head acceleration, not helmet acceleration (Manoogian,
McNeely et al. 2006). The data from the encoder are transmitted wirelessly via radio wave
transmission to the sideline base unit. The data are then used to compute peak and resultant
linear acceleration, estimated peak resultant rotational acceleration, location of impact, and other
biomechanical indicators. The HIT System has been extensively described in previous literature
and been found to reliably compute peak linear acceleration, peak rotational acceleration, and
impact location (Beckwith, Greenwald et al. 2012; Broglio, Eckner et al. 2012).
Video was recorded for all practices and games and post-season video analysis was
performed to remove false impacts (e.g. dropped helmet) and to record the name, start time, and
end time for each drill to pair the video with the biomechanical data such that each head impact
was identified as belonging to a specific drill. Drill names and descriptions were provided by the
coaches for the team and were classified as: dummy/sled tackling, install, kickoff practice, multi-
player tackle, Oklahoma, one-on-one, open field tackling, passing drill, position skill work,
scrimmage, and tackling drill stations (Table 1).

4
2016 Ohio State University Injury Biomechanics Symposium
This paper has not been peer- reviewed.
Table 1: Descriptions of each drill classification
Drill Description Purpose
Dummy/Sled
tackling Players tackle dummy or sled
Reinforce wrapping while tackling and
improve form for blocking
Install Full 11-on-11 intra-team
scrimmage
Within-team practice of offense and
defense game strategy in a game-like
situation
Kickoff
practice Special teams install
Practice alignment and responsibilities for
different kickoff scenarios
Multi-player
tackle
One offensive player versus two
or three defensive players
Improve blocking/tackling form and
technique and encourage athletes to move
their feet
Oklahoma Two vs. two or three vs. three
tackling drill
Simulate game speed while working to
improve blocking, running, and tackling
technique in a confined space
One-on-One
One vs. one tackling drill with
the two athletes starting less
than 3 yards apart
Improve one-on-one tackling form and
technique
Open Field
Tackling
One vs. one tackling drill with
the two athletes starting greater
than 3 yards apart at an angle
Improve form and technique for tackling in
full speed game-like situations
Passing drill Athletes receive passes from
coaches
Improving passing/catching skills and
hand-eye coordination
Position Skill
Work
Offense and defense skill-set
specific drills
Practice offensive or defensive specific
skills and game strategy
Scrimmage Inter-team scrimmage with
another team
Practice of offense and defense game
strategy in a game-like situation between
adjacent age and weight classified teams
Tackling Drill
Stations
Separate team into smaller
groups and complete a series of
tackling drills.
Practice tackling drills in smaller groups
with a higher coach to player ratio than
whole team tackling drills
All verified head impacts collected over the season were used to quantify head impact
exposure for all practice drills in terms of impact magnitude, frequency, and location. Mixed
effects linear models were fitted and Wald tests were used to assess differences among drills in
the associated linear and rotational accelerations and the number of impacts. We analyzed raw
data to provide means of linear and rotational accelerations and analyzed log-transformed data to
provide means of number of impacts; but also conducted interference on log-transformed
acceleration data to confirm statistical significance. A Bonferroni correction was applied for all
statistical tests to account for multiple comparisons and control the overall alpha level to be 0.05.
All statistical analyses were performed using SAS software version 9.4 for Windows (SAS
Institute Inc., Cary, NC, USA).

5
2016 Ohio State University Injury Biomechanics Symposium
This paper has not been peer- reviewed.
RESULTS
A total of 3,761 head impacts were recorded from 9 athletes during 36 practices and 11
games. Practices accounted for 2,171 (57.7%) head impacts and games accounted for 1,590
(42.3%) head impacts (Table A1). All athletes were monitored by a certified athletic trainer for
signs and symptoms of concussion and no head impacts measured in this study resulted in a
clinically diagnosed concussion. The average ± standard deviation age and weight of the athletes
on the team was 11.1 ± 0.6 years old and 97.6 ± 12.2 lbs., respectively. The distribution of the
total number of head impacts experienced during a season among players was right skewed and
ranged from 169 to 1003 head impacts, with a median value of 350. The distributions of head
impact magnitudes varied among players with the 95th
percentile linear acceleration ranging
from 43.7g to 63.7g (Figures 1 and 2).
Figure 1: Athlete and team average 95th percentile linear acceleration vs. total number of
impacts in season. Team average is shown with standard deviation error bars.
(A) (B)
Figure 2: Cumulative distribution plots of (A) linear and (B) rotational acceleration for each
athlete and the team.
The distribution of head impact magnitudes varied among practice drills (Figure 3).
Additionally, head impact magnitude was not proportional to the frequency of head impacts for
0 200 400 600 800 1000 120040
45
50
55
60
65
Total Number of Head Impacts
95
th P
erce
nti
le L
inea
r A
ccel
era
tio
n (
g)
Individual Athlete
Team Average
0 20 40 60 80 100 120 1400
0.2
0.4
0.6
0.8
1
Linear Acceleration (g)
CD
F
Empirical CDF
Individual Athlete
Team
0 1000 2000 3000 4000 5000 6000 7000 8000 90000
0.2
0.4
0.6
0.8
1
Rotational Acceleration (rad/s2)
CD
F
Empirical CDF
Individual Athlete
Team

6
2016 Ohio State University Injury Biomechanics Symposium
This paper has not been peer- reviewed.
each drill (Figure 4). A summary of impact frequency and impact magnitude for each drill is
shown in Table A1. Open field tackling drills had median/95th percentile linear accelerations of
24.7/96.4g, which was the highest magnitude of all drills practiced by the team. Install was the
most common drill with 1,217 impacts and had a median/95th percentile linear acceleration of
19.7/51.7g. The drills with the lowest magnitude head impacts were dummy/sled tackling,
passing drills, and multi-player tackle.
(A) (B)
Figure 3: Distribution of (A) linear and (B) rotational acceleration for each of the practice drills.
(A) (B)
Figure 4: 95th percentile linear acceleration vs. (A) total number of head impacts in the season
and (B) average number of impacts per player per drill session.
There were significant differences in mean linear (p<0.0001) and rotational (p=0.003)
acceleration measured between drills (Figure 5). Open field tackling had significantly greater
mean linear acceleration than install (p<0.0001), kickoff practice (p=0.004), multi-player tackle
(p=0.0002), passing drill (p=0.004), position skill work (p=0.01), and scrimmage (p=0.02). One-
on-one had significantly greater mean linear acceleration than install (p=0.003) and multi-player
tackle (p=0.02). Additionally, open field tackling had significantly greater mean rotational
acceleration than install (p<0.0001), kickoff practice (p=0.0009), multi-player tackle (p=0.01),
40
50
60
70
80
90
100
0 200 400 600 800 1000 1200 1400
95
thP
erce
nti
le L
inea
r A
ccel
erati
on
(g)
Total Number of Head Imapcts
40
50
60
70
80
90
100
0 2 4 6 8 10 12
95
thP
erce
nti
le L
inea
r
Acc
eler
atio
n (
g)
Total Number of Head Imapcts
Dummy/Sled tackling Install Kickoff practice Multi-player tackle Oklahoma One-on-One
Open Field Tackling Passing drill Position Skill Work Scrimmage Tackling Drill Stations
40
50
60
70
80
90
100
0 2 4 6 8 10 12
95
thP
erce
nti
le L
inea
r
Acc
eler
atio
n (
g)
Total Number of Head Imapcts
Dummy/Sled tackling Install Kickoff practice Multi-player tackle Oklahoma One-on-One
Open Field Tackling Passing drill Position Skill Work Scrimmage Tackling Drill Stations
40
50
60
70
80
90
100
0 2 4 6 8 10 12
95
thP
erce
nti
le L
inea
r
Acc
eler
atio
n (
g)
Total Number of Head Imapcts
Dummy/Sled tackling Install Kickoff practice Multi-player tackle Oklahoma One-on-One
Open Field Tackling Passing drill Position Skill Work Scrimmage Tackling Drill Stations
40
50
60
70
80
90
100
0 2 4 6 8 10 12
95
thP
erce
nti
le L
inea
r
Acc
eler
atio
n (
g)
Total Number of Head Imapcts
Dummy/Sled tackling Install Kickoff practice Multi-player tackle Oklahoma One-on-One
Open Field Tackling Passing drill Position Skill Work Scrimmage Tackling Drill Stations
40
50
60
70
80
90
100
0 2 4 6 8 10 12
95
thP
erce
nti
le L
inea
r
Acc
eler
atio
n (
g)
Total Number of Head Imapcts
Dummy/Sled tackling Install Kickoff practice Multi-player tackle Oklahoma One-on-One
Open Field Tackling Passing drill Position Skill Work Scrimmage Tackling Drill Stations
40
50
60
70
80
90
100
0 2 4 6 8 10 12
95
thP
erce
nti
le L
inea
r
Acc
eler
atio
n (
g)
Total Number of Head Imapcts
Dummy/Sled tackling Install Kickoff practice Multi-player tackle Oklahoma One-on-One
Open Field Tackling Passing drill Position Skill Work Scrimmage Tackling Drill Stations
40
50
60
70
80
90
100
0 1 2 3 4 5 6 7
95
th P
erce
nti
le L
inea
r A
ccel
era
tio
n (
g)
Average Number of Head Imapcts

7
2016 Ohio State University Injury Biomechanics Symposium
This paper has not been peer- reviewed.
Oklahoma (p=0.02), passing drill (p=0.04), position skill work (p=0.002), and scrimmage
(p=0.01).
(A) (B)
Figure 5: Mean and 95% confidence interval of (A) linear and (B) rotational acceleration for
each drill. Lines connecting drills indicate significant differences in accelerations.
The mean number of impacts measured per athlete was evaluated for each drill session
(Figure 6). The drill with the highest mean [95% confidence interval] number of impacts was
multi-player tackle with 6.6 [4.4, 9.8] impacts, which was significantly greater than the mean
number of impacts for dummy/sled tackling (p=0.002), kickoff practice (p=0.0002), one-on-one
tackling (p=0.04), open field tackling (0.001), passing drill (p<0.0001), and position skill work
(p=0.0004). Oklahoma had the second highest mean number of impacts with 5.1 [3.6, 7.2]
impacts and had significantly greater number of impacts than dummy/sled tackling (p=0.02),
kickoff practice (p=0.003), open field tackling (p=0.02), passing drill (p<0.0001), and position
skill work (p=0.01). Install had significantly greater mean number of impacts than dummy/sled
tackling (p=0.02), kickoff practice (p<0.0001), open field tackling (p=0.004), passing drill
(p<0.0001), and position skill work (p=0.001). One-on-one and tackling drill stations had
significantly greater mean number of impacts than passing drill (p=0.02 and p=0.04,
respectively).
0
5
10
15
20
25
30
35
40
45
Lin
ear
Acc
eler
atio
n (
g)
0
200
400
600
800
1000
1200
1400
1600
1800
2000
Rota
tion
al A
ccel
erat
ion
(ra
d/s
2)

8
2016 Ohio State University Injury Biomechanics Symposium
This paper has not been peer- reviewed.
Figure 6: Number of impacts for each athlete for each drill in a practice session with 95%
confidence interval. Lines connecting drills indicate significant differences in number of impacts.
Refer to Table A1 for exact values.
Impacts to the front of the helmet were most common for all drills, except dummy/sled
tackling (Figures 7 and 8). While only considering impacts equal to or greater than 60g, impacts
to the top of the helmet were most common in the Oklahoma, one-on-one, open field tackling,
and position skill work drills (50%, 86%, 44%, and 50% respectively). Impacts to the front of the
helmet were most common for impacts measured over 60g during install, multi-player tackle,
and tackling drill stations (45%, 100%, and 67%, respectively).
0
2
4
6
8
10
12
Nu
mber
of
Impac
ts

9
2016 Ohio State University Injury Biomechanics Symposium
This paper has not been peer- reviewed.
Figure 7: Percentage of head impacts by impact location for each drill. Refer to Table A1
for total number of impacts for each drill.
Figure 8: Percentage of head impacts greater than 60g by impact location for each drill. No
impacts equal to or greater than 60g were measured during dummy/Sled tackling and passing
drill. Refer to Table A1 for number of impacts above 60g for each drill.
46%
12%18% 16% 12% 14%
29% 32%
21%16%
8%
23%
56%51%
60%
55%
39%
33%
52%
46%
35%58%
15% 18% 16%
13%
17%
18%
23%
10%
11%
31%
17%
15% 14% 16%11%
16%
28%
15%6%
23%18% 17%
0%
10%
20%
30%
40%
50%
60%
70%
80%
90%
100%P
erce
nta
ge
of
Hea
d I
mpac
tsBack Front Side Top
11%
50%
13%22%
50%
45%
100%
38%11%
40%
67%
5%
14%
22% 10%
50%11%
39%
50% 50%
86%
44%50%
22%
0%
10%
20%
30%
40%
50%
60%
70%
80%
90%
100%
Per
cen
tag
e o
f H
ead
Im
pac
ts
Back Front Side Top

10
2016 Ohio State University Injury Biomechanics Symposium
This paper has not been peer- reviewed.
DISCUSSION
By evaluating the head impact frequency and magnitude for all drills practiced by a youth
football team, we demonstrated the variability in head impact exposure between drills. Open
field tackling resulted in the highest median and 95th percentile linear and rotational
accelerations (Table A1) with significantly greater mean head accelerations compared to several
of the drills practiced by the team. Despite resulting in very high magnitude impacts, it was a
relatively low frequency drill compared to other drills practiced by this team. This drill only
occurred in 5 practices with an average of 2.0 [1.4, 2.8] impacts per player, so it made a
relatively small contribution to the total number of impacts an athlete experienced in a practice
and over the course of a season. As described in Table 1, the purpose of open field tackling drills
is to improve tackling technique and positioning in game-like situations, but this drill may
expose athletes to high magnitude head impacts, which are often greater than those experienced
in games and may not be an accurate simulation of game-like scenarios. These results suggest
that open field tackling drills may be modified such that the athletes start at a shorter distance
apart, however considerations may be made to remove this drill entirely from youth football
practice structures.
The one-on-one tackling drill was similar to open field tackling as both were player
versus player tackling drills, but the one-on-one drill had the athletes start less than 3 yards from
each other and there was a greater focus on improving form and technique rather than simulating
game-like speed. One-on-one tackling had the second highest mean linear and rotational
accelerations. Although it was still a high impact magnitude drill, the lower head impact
magnitudes compared to open field tackling may be partially due to the athletes starting closer
together and tackling at lower speeds. This drill had significantly higher mean number of impacts
per athlete than passing drill, but only contributed 5% of all practice impacts. Therefore, similar
to open field tackling, one-on-one was a lower frequency, but high magnitude drill.
Another tackling drill was the Oklahoma drill, but unlike open field and one-on-one
tackling drills, Oklahoma was a high frequency drill with the second highest number of impacts
per athlete (Table A1). The high frequency of impacts per athlete in a practice session is partially
due to this drill involving four to six athletes in each play, rather than just two, so each athlete
participates in more iterations of this drill during a practice. Another high frequency drill was
multi-player tackle, which had a mean number of impacts per player of 6.6 [4.4, 9.8], the highest
of all drills evaluated in this study. However, multi-player tackle had the second lowest 95th
percentile linear acceleration of 44.1g, with only the passing drill having a lower 95th percentile
linear acceleration. Additionally, this drill accounted for 7.6% of all practice impacts, only 3.4%
of impacts greater than 60g, and 0% of impacts greater than 80g. Although multi-player tackle is
still a tackling drill, it was more focused on blocking and encouraging the athletes to move their
feet rather than tackling the opposing player to the ground. This shift in focus may be one of the
reasons this drill generally had lower magnitudes of head impacts, but higher frequency when
compared to other tackling drills.
The position skill work drill had the second highest 95th percentile linear acceleration,
but because the team separated into offensive and defensive skill groups, it is suspected that the
defensive skill group was contributing a greater proportion of high magnitude impacts compared
to the offensive skill group. The defensive skill group often did one-on-one and sled tackling
drills, while the offensive skill group would typically focus on passing-type drills. However,
further analysis will be needed to understand if one skill group has greater head impact exposure
11
2016 Ohio State University Injury Biomechanics Symposium
This paper has not been peer- reviewed.
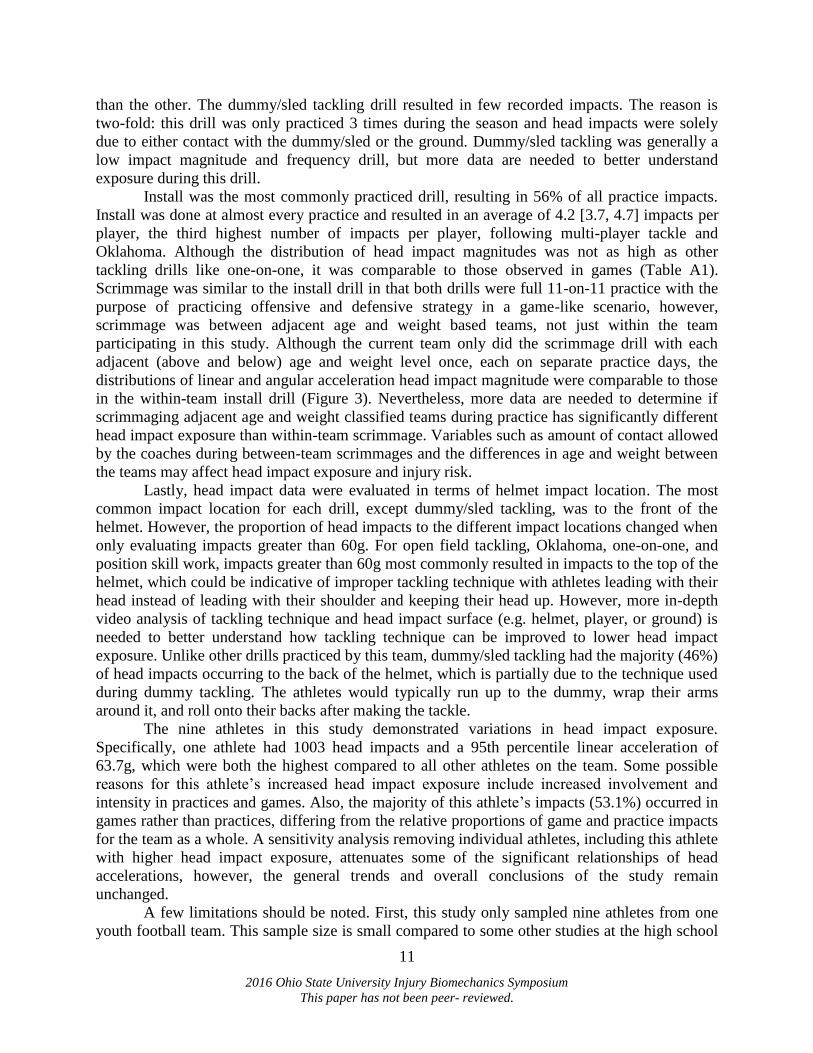
than the other. The dummy/sled tackling drill resulted in few recorded impacts. The reason is
two-fold: this drill was only practiced 3 times during the season and head impacts were solely
due to either contact with the dummy/sled or the ground. Dummy/sled tackling was generally a
low impact magnitude and frequency drill, but more data are needed to better understand
exposure during this drill.
Install was the most commonly practiced drill, resulting in 56% of all practice impacts.
Install was done at almost every practice and resulted in an average of 4.2 [3.7, 4.7] impacts per
player, the third highest number of impacts per player, following multi-player tackle and
Oklahoma. Although the distribution of head impact magnitudes was not as high as other
tackling drills like one-on-one, it was comparable to those observed in games (Table A1).
Scrimmage was similar to the install drill in that both drills were full 11-on-11 practice with the
purpose of practicing offensive and defensive strategy in a game-like scenario, however,
scrimmage was between adjacent age and weight based teams, not just within the team
participating in this study. Although the current team only did the scrimmage drill with each
adjacent (above and below) age and weight level once, each on separate practice days, the
distributions of linear and angular acceleration head impact magnitude were comparable to those
in the within-team install drill (Figure 3). Nevertheless, more data are needed to determine if
scrimmaging adjacent age and weight classified teams during practice has significantly different
head impact exposure than within-team scrimmage. Variables such as amount of contact allowed
by the coaches during between-team scrimmages and the differences in age and weight between
the teams may affect head impact exposure and injury risk.
Lastly, head impact data were evaluated in terms of helmet impact location. The most
common impact location for each drill, except dummy/sled tackling, was to the front of the
helmet. However, the proportion of head impacts to the different impact locations changed when
only evaluating impacts greater than 60g. For open field tackling, Oklahoma, one-on-one, and
position skill work, impacts greater than 60g most commonly resulted in impacts to the top of the
helmet, which could be indicative of improper tackling technique with athletes leading with their
head instead of leading with their shoulder and keeping their head up. However, more in-depth
video analysis of tackling technique and head impact surface (e.g. helmet, player, or ground) is
needed to better understand how tackling technique can be improved to lower head impact
exposure. Unlike other drills practiced by this team, dummy/sled tackling had the majority (46%)
of head impacts occurring to the back of the helmet, which is partially due to the technique used
during dummy tackling. The athletes would typically run up to the dummy, wrap their arms
around it, and roll onto their backs after making the tackle.
The nine athletes in this study demonstrated variations in head impact exposure.
Specifically, one athlete had 1003 head impacts and a 95th percentile linear acceleration of
63.7g, which were both the highest compared to all other athletes on the team. Some possible
reasons for this athlete’s increased head impact exposure include increased involvement and
intensity in practices and games. Also, the majority of this athlete’s impacts (53.1%) occurred in
games rather than practices, differing from the relative proportions of game and practice impacts
for the team as a whole. A sensitivity analysis removing individual athletes, including this athlete
with higher head impact exposure, attenuates some of the significant relationships of head
accelerations, however, the general trends and overall conclusions of the study remain
unchanged.
A few limitations should be noted. First, this study only sampled nine athletes from one
youth football team. This sample size is small compared to some other studies at the high school
12
2016 Ohio State University Injury Biomechanics Symposium
This paper has not been peer- reviewed.
and collegiate level (Urban, Davenport et al. 2013; Liao, Lynall et al. 2016). Second, the results
are a limited snapshot of the youth population, as youth football leagues include athletes from 5-
15 years old. However, this study of head impact exposure in youth football practice drills is
ongoing and future work will be conducted to evaluate head impact exposure in practice drills
for multiple seasons and between age and weight based teams at the youth level. Third, factors
such as league-specific or organization-specific regulations for practices and games may
influence head impact exposure. This work is part of a multi-site study and will be expanded
upon to include several youth leagues within various national organizations and
demographic/cultural backgrounds. Fourth, the HIT system has some measurement error, but the
error in 5DOF acceleration measurements are within the range of acceptable error for other
measurement devices and methods (Beckwith, Greenwald et al. 2012).
CONCLUSIONS
This study quantified head impact exposure in youth football practice drills for a single
youth football team and found that head impact exposure varies significantly between drills.
Further research is needed to fully understand the role of coach/athlete interaction, corrective
behavior, and proper tackling technique on head impact exposure. Evaluating head impact
exposure in youth football practice drills is an important step in informing coaches, leagues, and
organizations on methods to restructure practice and implement rules and regulations to reduce
head impact exposure and make sports safer for youth.
ACKNOWLEDGEMENTS
Research reported in this publication was supported by the National Institute of
Neurological Disorders And Stroke of the National Institutes of Health under Award Number
R01NS094410. The content is solely the responsibility of the authors and does not necessarily
represent the official views of the National Institutes of Health. The authors thank the youth
football league’s coordinators, coaches, parents, athletes, and athletic trainer whose support
made this study possible. The authors also thank Megan Anderson and Leslie Hoyt for their
valuable assistance in data collection.
REFERENCES
(2012). "Rule Changes Regarding Practice & Concussion Prevention." Retrieved April 4, 2016,
from
http://www.popwarner.com/About_Us/Pop_Warner_News/Rule_Changes_Regarding_Pr
actice___Concussion_Prevention_s1_p3977.htm.
(2016). "Heads Up Football." Retrieved April 12, 2016, from
http://www.nflfoundation.org/health-safety.

13
2016 Ohio State University Injury Biomechanics Symposium
This paper has not been peer- reviewed.
Beckwith, J. G., R. M. Greenwald, et al. (2012). "Measuring head kinematics in football:
correlation between the head impact telemetry system and Hybrid III headform." Ann
Biomed Eng 40(1): 237-248.
Broglio, S. P., J. T. Eckner, et al. (2012). "Field-based measures of head impacts in high school
football athletes." Curr Opin Pediatr 24(6): 702-708.
Cobb, B. R., J. E. Urban, et al. (2013). "Head impact exposure in youth football: elementary
school ages 9-12 years and the effect of practice structure." Ann Biomed Eng 41(12):
2463-2473.
Daniel, R. W., S. Rowson, et al. (2012). "Head impact exposure in youth football." Ann Biomed
Eng 40(4): 976-981.
Football, U. "Heads Up Football." Retrieved March 1, 2016, from
http://usafootball.com/headsup.
Guskiewicz, K. M., N. L. Weaver, et al. (2000). "Epidemiology of concussion in collegiate and
high school football players." Am J Sports Med 28(5): 643-650.
Institute, T. A. (2014). Project Play Survey of Parents on Youth Sports Issues.
Kerr, Z. Y., S. W. Yeargin, et al. (2015). "Comprehensive Coach Education Reduces Head
Impact Exposure in American Youth Football." Orthop J Sports Med 3(10):
2325967115610545.
Liao, S., R. C. Lynall, et al. (2016). "The Effect of Head Impact Location on Day of Diagnosed
Concussion in College Football." Med Sci Sports Exerc.
Manoogian, S., D. McNeely, et al. (2006). "Head acceleration is less than 10 percent of helmet
acceleration in football impacts." Biomed Sci Instrum 42: 383-388.
Pellman, E. J., M. R. Lovell, et al. (2006). "Concussion in professional football: recovery of NFL
and high school athletes assessed by computerized neuropsychological testing--Part 12."
Neurosurgery 58(2): 263-274; discussion 263-274.
Powell, J. W. and K. D. Barber-Foss (1999). "Traumatic brain injury in high school athletes."
JAMA 282(10): 958-963.
Rowson, S., G. Brolinson, et al. (2009). "Linear and angular head acceleration measurements in
collegiate football." J Biomech Eng 131(6): 061016.
Rowson, S., M. W. Goforth, et al. (2009). "Correlating cumulative sub-concussive head impacts
in football with player performance - biomed 2009." Biomed Sci Instrum 45: 113-118.
SFIA (2013). 2013 Sports, Fitness and Leisure Activities Topline Participation Report.
SFIA (2015). 2015 U.S. Trends in Team Sports Report.
Solomon, G. S., A. W. Kuhn, et al. (2016). "Participation in Pre-High School Football and
Neurological, Neuroradiological, and Neuropsychological Findings in Later Life: A
Study of 45 Retired National Football League Players." Am J Sports Med.
Stamm, J. M., A. P. Bourlas, et al. (2015). "Age of first exposure to football and later-life
cognitive impairment in former NFL players." Neurology 84(11): 1114-1120.
Urban, J. E., E. M. Davenport, et al. (2013). "Head impact exposure in youth football: high
school ages 14 to 18 years and cumulative impact analysis." Ann Biomed Eng 41(12):
2474-2487.

14
2016 Ohio State University Injury Biomechanics Symposium
This paper has not been peer- reviewed.
APPENDIX
Table A1: Summary of impact frequency and impact magnitude for each practice drill. Average
number of impacts per player is computed per practice session
Dri
ll
Du
mm
y/S
led
tack
lin
g
Inst
all
Kic
ko
ff
pra
ctic
e
Mu
lti-
pla
yer
tack
le
Ok
lah
om
a
On
e-o
n-O
ne
Op
en F
ield
Ta
ckli
ng
Pa
ssin
g d
rill
Po
siti
on
Sk
ill
Wo
rk
Scr
imm
ag
e
Ta
ckli
ng
Dri
ll
Sta
tion
s
All
Pra
ctic
es
All
Ga
mes
N
(To
tal)
13
12
17
57
16
4
14
8
10
9
52
31
15
6
89
13
5
21
71
15
90
N
(Im
pa
cts
> 6
0)
0
38
2
3
8
7
9
0
10
2
9
88
60
N
(Im
pa
cts
>8
0g
)
0
12
0
0
3
3
5
0
4
1
1
29
18
Nu
mb
er o
f
Ses
sio
ns
3
33
10
3
5
7
5
17
12
2
4
36
11
Av
era
ge
Nu
mb
er o
f
Imp
act
s P
er P
lay
er
[95
% C
on
fid
ence
In
terv
al]
1.4
1 [
0.8
0, 2
.50
]
4.1
6 [
3.7
1, 4
.65
]
1.8
9 [
1.4
0, 2
.54
]
6.5
8 [
4.4
1, 9
.82
]
5.1
0 [
3.5
9, 7
.24
]
2.6
9 [
2.0
1,
3.6
1]
2.0
1 [
1.4
3, 2
.82
]
1.2
0 [
0.8
7, 1
.67
]
2.3
1 [
1.8
1, 2
.93
]
3.4
0 [
2.0
5, 5
.64
]
3.2
0 [
2.0
3, 5
.04
]
6.1
9 [
5.4
7, 7
.00
]
12
.37
[10
.08
, 1
5.1
8]
Lin
ear
Acc
eler
ati
on
(g)
50
th
Per
cen
tile
18
19
.7
18
.7
21
.4
22
.85
22
.6
24
.65
17
19
.5
18
.9
21
.2
20
.1
20
.9
95
th
Per
cen
tile
48
.7
51
.7
50
.98
44
.08
61
.57
64
.8
96
.41
42
.84
69
.04
50
.8
63
.32
56
.1
54
Ro
tati
on
al
Acc
eler
ati
on
(ra
d/s
2)
50
th
Per
cen
tile
90
5.5
1
95
3.1
6
83
3.1
1
10
18
.4
10
74
.28
89
4.6
2
13
26
.38
95
0.3
90
2.5
6
86
9.7
8
10
10
.19
96
0.1
98
6.8
95
th
Per
cen
tile
15
76
.34
22
70
.22
20
63
.35
22
79
.67
29
57
.98
25
78
.56
38
09
.24
23
42
.76
25
54
.24
21
97
.59
25
24
.49
23
35
.9
24
30
.5