harworth group plc annual report and financial statements 2017 · 6 harworth group plc annual...
TRANSCRIPT

Harworth Group plcAnnual Report and Financial Statements 2017
www.harworthgroup.com

Harworth Group plc Annual Report and Financial Statements 2017
18,000+ potential homes
(2016: 17,000+)21.6m sq. ft potential employment space
(2016: 18.19m sq. ft)
300MW of potential capacity to the
National Grid(2016: 300MW)
Up to £2.9bn in Gross Value Added to UK plc
(2016: £2.8bn)
Harworth works safely and responsibly in making this difference
57 employees*(2016: 52)
*As at date of report
0 Riddor reports filed by Harworth in 2017(2016: nil)
Harworth is a leading land and property developer and investor which owns and manages a portfolio of c.21,000 acres of land on 136 sites located throughout the North of England and the Midlands. It specialises in the regeneration of former coalfield sites and other brownfield land into new residential developments and employment areas.
at a glance
Once completed our developments could make a huge difference to the North of England and the Midlands. They have the potential to deliver:
159.7MWlow carbon capacity
(2016: 144.5MW)
12.1m sq. ft of consented land for commercial space
(2016: c.10m sq. ft)
10,448housing plots with planning consent(2016: 9,529 plots)

Harworth Group plc Annual Report and Financial Statements 2017 1
STRATEGIC REPORTCORPORATE GOVERNANCE
FINANCIAL STATEMENTS
Contents
Strategic report
2 Our strategy4 How we add value6 The markets we operate in7 Performance vs Key Financial Measures8 Our year10 Former Chairman’s statement12 Chief Executive’s statement16 Capital Growth in 2017 18 Case study: Thoresby20 Income Generation in 2017 22 Case study: Logistics North24 Acquisitions in 2017 26 Case study: Coalville28 Financial Review36 Managing Risk44 Business continuity assessments46 Harworth and its stakeholders48 Operating responsibly 48 Our communities 52 Our environment 53 Our responsibilities55 Our People
Corporate Governance
60 Board of Directors and Company Secretary62 Former Chairman’s introduction64 Statement of Corporate Governance72 Directors’ remuneration report86 Audit Committee report90 Nomination Committee report92 Directors’ report97 Statement of Directors’ responsibilities
Financial statements
98 Independent auditors’ report104 Consolidated income statement105 Consolidated statement of comprehensive income106 Balance sheets107 Consolidated statement of changes in equity108 Company statement of changes in equity109 Statementsofcashflows110 Notestothefinancialstatements
Company information
142 Company information and investor timetable143 Definitionsandabbreviationsused
Our StrategyRead more on page 2
How we add valueRead more on page 4
Former Chairman’s StatementRead more on page 10
Chief Executive’s StatementRead more on page 12
Business SegmentsRead more on page 16
Financial ReviewRead more on page 28
Corporate GovernanceRead more on page 58
Financial StatementsRead more on page 98
More information can be found by going to our website: www.harworthgroup.com

2 Harworth Group plc Annual Report and Financial Statements 2017
Strategic priority KPIs (see page 7 for 2017 performance) Where we are Where we want to be Key risks
DevelopmentDriving the capital growth of our portfolio through delivery of planning permissions, remediation and infrastructure, before crystallising sales value.
EPRA NNNAV growth and total return
per shareValue Gains
12.5% p.a. EPRA NNNAV per share growth and total return of 13.2% in 2016 and 2017
We continue to aim to grow NNNAV by at least 10% per annum as a consistent average through the property cycle
InvestmentEnsuring sustainable income generation through asset management of existing rental sites and direct development of new space.
ProfitexcludingValue Gains Interest cover
We are covering our overheads and interest costs and have been increasing the resilience of our income streams
Our ambition remains to cover the overheads, interest, tax and dividends from ongoing rental and other operating income
SectorsConcentrating on those property markets with strong, through-the-cycle returns (currently housebuilding and industrial & logistics).
Consented residential plots
Consented commercial space
Our current focus is on the “beds and sheds” sectors which have strong fundamentals in the regions we operate in
Our sectoral focus will remain on residential and commercial in the medium-term as these suit our urban edge-of-settlement and regional locations
RegionsLeveraging our strong relationships in our core areas in the North of England and Midlands, whilst seeking to expand into adjacent areas.
Number of sites Number of acres
Our portfolio remains focused on the North of England with an increasing emphasis on the Midlands and the North West
We want to expand the portfolio into other stable growth areas to diversify the portfolio, with adjacent areas targetedfirst
AcquisitionsReplenishing our landbank by utilising capital to buy new sites to maintain net asset value growth across the portfolio (including joint ventures).
Investment in acquisitions in
the year
Disposals less development spend
We have been investing c.£25-£30m p.a. over the last three years to replenish and grow the portfolio in order to sustain future growth
We want to keep replenishing the portfolio and delivering EPRA NNNAV growth which will require the same, or higher, levels of acquisitions
FinancingMaintaining the Group’s low Balance sheet gearing to complement risk-appropriate high operational gearing.
Net loan to value Net debt2017 year-end gearing (7.0%) was lower than target given better than expected sales and a delayed acquisition
Ideal target range gearing is of the order of 10%-15% net loan to value
Our vision is to be the UK’s leading developer of brownfield land and regeneration partner of choice, delivering a total return to shareholders of over 10% per annum through the property cycle.
We have six strategic priorities in place to deliver this vision.
Our strategyVision and strategy remain clear and robust
Turn to page 36 to read about our Key Risks

Harworth Group plc Annual Report and Financial Statements 2017 3
STRATEGIC REPORTCORPORATE GOVERNANCE
FINANCIAL STATEMENTS
Strategic priority KPIs (see page 7 for 2017 performance) Where we are Where we want to be Key risks
DevelopmentDriving the capital growth of our portfolio through delivery of planning permissions, remediation and infrastructure, before crystallising sales value.
EPRA NNNAV growth and total return
per shareValue Gains
12.5% p.a. EPRA NNNAV per share growth and total return of 13.2% in 2016 and 2017
We continue to aim to grow NNNAV by at least 10% per annum as a consistent average through the property cycle
InvestmentEnsuring sustainable income generation through asset management of existing rental sites and direct development of new space.
ProfitexcludingValue Gains Interest cover
We are covering our overheads and interest costs and have been increasing the resilience of our income streams
Our ambition remains to cover the overheads, interest, tax and dividends from ongoing rental and other operating income
SectorsConcentrating on those property markets with strong, through-the-cycle returns (currently housebuilding and industrial & logistics).
Consented residential plots
Consented commercial space
Our current focus is on the “beds and sheds” sectors which have strong fundamentals in the regions we operate in
Our sectoral focus will remain on residential and commercial in the medium-term as these suit our urban edge-of-settlement and regional locations
RegionsLeveraging our strong relationships in our core areas in the North of England and Midlands, whilst seeking to expand into adjacent areas.
Number of sites Number of acres
Our portfolio remains focused on the North of England with an increasing emphasis on the Midlands and the North West
We want to expand the portfolio into other stable growth areas to diversify the portfolio, with adjacent areas targetedfirst
AcquisitionsReplenishing our landbank by utilising capital to buy new sites to maintain net asset value growth across the portfolio (including joint ventures).
Investment in acquisitions in
the year
Disposals less development spend
We have been investing c.£25-£30m p.a. over the last three years to replenish and grow the portfolio in order to sustain future growth
We want to keep replenishing the portfolio and delivering EPRA NNNAV growth which will require the same, or higher, levels of acquisitions
FinancingMaintaining the Group’s low Balance sheet gearing to complement risk-appropriate high operational gearing.
Net loan to value Net debt2017 year-end gearing (7.0%) was lower than target given better than expected sales and a delayed acquisition
Ideal target range gearing is of the order of 10%-15% net loan to value
Risk icon key
Markets Delivery Politics Finance People Legal & Regulatory
Governance & internal controls
Communications & stakeholder management
Capital Growth Income Generation Acquisitions

4 Harworth Group plc Annual Report and Financial Statements 2017
How we add valueThe Harworth effect
Acquisitions and land assembly – Wehavealargelandbankofbrownfieldland and former industrial assets across the North of England and the Midlands, owning c.21,000 acres of land on 136 sites. An important part of our strategy is to replenish our portfolio with acquisitions to ensure the growth of the business.
Masterplanning – Our core skill as a business is to create a strategic vision and plan for all our sites which, when brought to market with planning permission for residential or commercial uses, creates value.
Planning approval – Our Strategic Land team has secured planning consents for close to 11,000 residential plots and 12 million sq. ft of commercial space since 2008. A large proportion of these consents are taken forward as Harworth’s Major Developments – often seen as showcase projects for regeneration.
How we add valueTheHarwortheffect
Harworth operates its business through two segments (Capital Growth and Income Generation) which are replenished through Acquisitions. CAPITAL GROWTH focuses on maximising value by developing the property portfolio and includes taking sites through the development cycle from masterplanning inception through to plot sale and build out. INCOME GENERATION focuses on retaining and effectively managing selected land and property assets to generate a long-term recurring income stream. ACQUISITIONS focuses on replenishing our land and property portfolio with new sites in order to assure the sustainable growth of the business.
Capital Realisation
Time

Harworth Group plc Annual Report and Financial Statements 2017 5
STRATEGIC REPORTCORPORATE GOVERNANCE
FINANCIAL STATEMENTS
Plot sale and build out – We either sell engineered land for residential or commercial purposes, or retain land to grow our income portfolio – either through leasing directly developed commercial units or renting out land.
Land remediation & infrastructure development – Once a use for a site hasbeenidentified,weapplyvalueengineering principles through our in-house development team in remediating land and creating development platforms that match the proposed use.
Asset management – Finally, we actively asset manage our landholdings and built commercial space to deliver further value from the portfolio. Asset management also includes repurposing our built space, where appropriate, regearing leases in order to grow our income and managing our Business Space and Natural Resources sites to ensure overheads are minimised andtenantsaresatisfied.
Recurring income
Capital Receipt
Time
Indi
cativ
e Va
lue
Add
Acquisitions
Capital Growth
Income Generation
Risk icon key
Markets Delivery Politics Finance People Legal & Regulatory
Governance & internal controls
Communications & stakeholder management
Turn to page 36 to read about our Key Risks

6 Harworth Group plc Annual Report and Financial Statements 2017
The markets we operate inOur markets are supportive of growth
M1
M69
M6
M6 Tol l
M1
M11
M25
A3(M)
A1(M)
A1(M)
A1(M)
M25
M23
M2M26M3
M4
M20
M40
M40
M42
M5
M50
M5
M6
M6
M6
A74(M)
M74
M56
M62M61
M62
M180M18
M56
M57
M54
M8
Manchester
Leicester
Birmingham
Coventry
Derby Nottingham
Sheffield
Stoke-on-Trent
Liverpool
Bristol
Gloucester
Cardiff
Plymouth
Cambridge
MiltonKeynes
Folkestone
Dover
Felixstowe
London
Middlesbrough
Scarborough
Whitehaven
Dumfries
Carlisle
Leeds
Immingham
Grimsby
York
NewcastleUpon Tyne
Edinburgh
Glasgow
(103 FREEHOLD AS BELOW AND 33 OVERAGES/COMMERCIAL CLAWBACKS)
YORKSHIRE
45 sites
EAST MIDLANDS
25 sites
NORTH WEST
6 sites
WEST MIDLANDS
NORTH EAST
19 sites
8 sites
Our core markets across the North of England and the Midlands are well suited to our strategy and business model.
Residential• National housing under-supply is driving consistently strong
demand for land from housebuilders.• House price growth in our regions remains positive and is
forecast to grow further.• Government stimulus measures in place to underpin
affordabilityofnewhomes,includingHelptoBuyandnewfunding announced in the Autumn Statement.
Commercial• Strong demand for well-located industrial space across the
regions driven by the growth of e-tailing.• Supply continues to be squeezed across all regions, driving
yield compression. • Industrial sector is forecast to continue to outperform both
theofficeandretailmarkets.• Local support for sustainable new commercial development
remains strong.
136 SITES ACROSS THE UK (103 FREEHOLD AS BELOW AND 33 OVERAGES/COMMERCIAL CLAWBACKS)
The markets we operate inOur markets are supportive of growth
Performance vs. Key Financial Measures
Logistics NorthWaverley

Harworth Group plc Annual Report and Financial Statements 2017 7
STRATEGIC REPORTCORPORATE GOVERNANCE
FINANCIAL STATEMENTS
Performance vs. Key Financial Measures
Performance vs. Key Financial Measures
Development
NNNAV per share growth Value Gains
2017
2016
£47.4m
£43.7m
12.5%
12.5%
13.2%Total Return
13.2%Total Return
Sectors
Number of consented residential plots
Consented commercial space (sq. ft)
2017
2016
10,448
12,130,000
9,529
9,950,000
Acquisitions
Acquisitions and JV Investments(£’000)
Disposals less development(£’000)
2017
2016
30,265
14,018
32,314
28,829
Safety
Riddor reports Accidents (all minor)*
2017
2016
* Includes figures for contractors
0
10
06
Investment
PEVG Interest Cover
2017
2016
* Profit excluding Value Gains
£2.2m
3.41x
£2.2m
2.83x
Regions
Number of sites Acres
2017
2016
136
21,005
142
21,977
Financing
Net LTV (%) Net Debt (£’000)
2017
2016
7.0%
32,275
9.9%
39,471
Employees
Employees Employee satisfaction (%)
2017
2016
57*
87%
52
84%
* As at date of report
Turn to page 2 to read about our Strategic Priorities

8 Harworth Group plc Annual Report and Financial Statements 2017
Our yearKey 2017 Achievements
Acquisitions and land assembly Masterplanning Planning approval
Land remediation & infrastructure development
Plot sale and build out Asset management
• Successful £27.1m equity raise in March for new acquisitions, all deployed in year
• Five strategic sites purchased in 2017 that could potentially deliver a further c.1,000 plots and over 5m sq. ft of additional commercial space
• Options signed on four sites and preferred bidder position onafurthersignificantsite.
• 10,448 consented residential plots and 12.13m sq. ft of consented commercial space under ownership as at 31 December 2017(1); vast majority utilised within the Major Developments division
• Land to be promoted in the planning system between 2018 and 2020 for a further 4,552 plots plus c.5.9m sq. ft of commercial space(1).
• Major outline planning consents secured in April at Kellingley (1.45m sq. ft of commercial space) and in October at Thoresby (800 residential plots and 0.25m sq. ft of commercial space)
• In total, planning secured for 825 residential plots and c.3m sq. ft of commercial space in 2017.
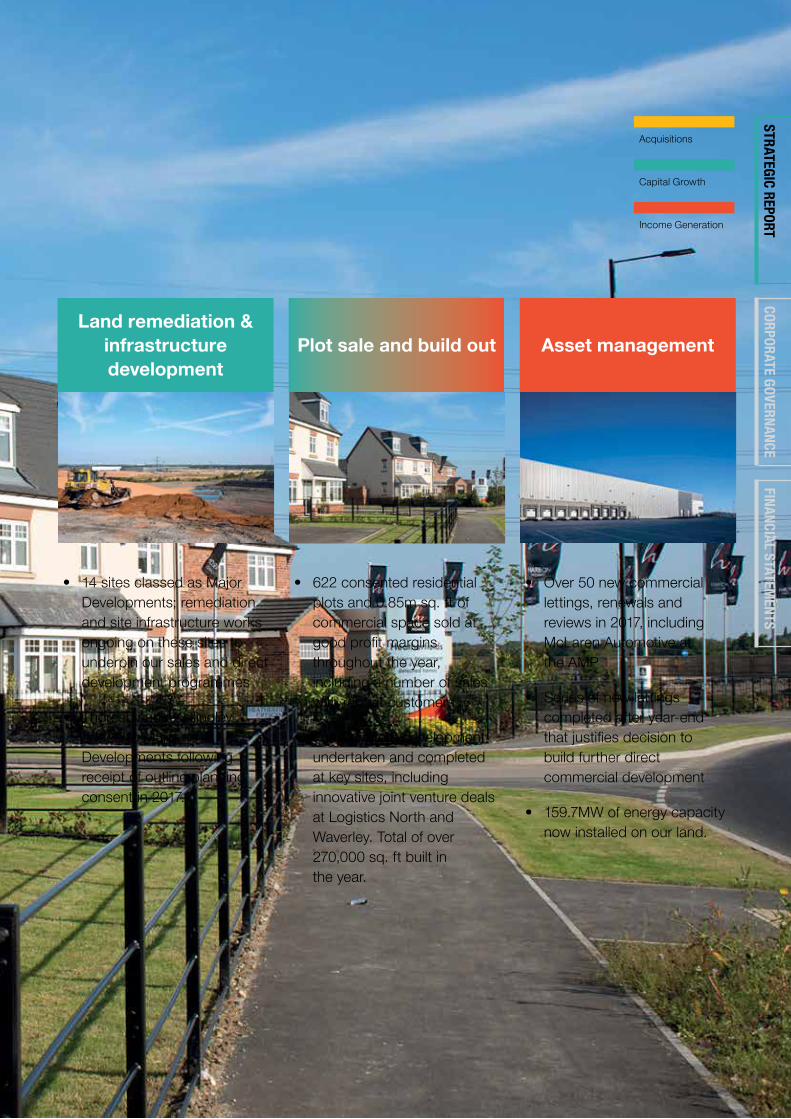
• 14 sites classed as Major Developments; remediation and site infrastructure works ongoing on these sites to underpin our sales and direct development programmes
• Thoresby and Kellingley added to Major Developments following receipt of outline planning consent in 2017.
• 622 consented residential plots and 0.85m sq. ft of commercial space sold at goodprofitmarginsthroughout the year, including a number of sales with repeat customers
• Further direct development undertaken and completed at key sites, including innovative joint venture deals at Logistics North and Waverley. Total of over 270,000 sq. ft built in the year.
• Over 50 new commercial lettings, renewals and reviews in 2017, including McLaren Automotive at the AMP
• Series of new lettings completed after year-end thatjustifiesdecisiontobuild further direct commercial development
• 159.7MW of energy capacity now installed on our land.
(1) Includes freehold and partnership sites.
Harworth delivered excellent performance throughout 2017 across its business areas of CAPITAL GROWTH, INCOME GENERATION and ACQUISITIONS.
Set out below are the highlights of the year.
Our yearKey 2017 Achievements
Harworth Group plc Annual Report and Financial Statements 2017 9
STRATEGIC REPORTCORPORATE GOVERNANCE
FINANCIAL STATEMENTS
Acquisitions and land assembly Masterplanning Planning approval
Land remediation & infrastructure development
Plot sale and build out Asset management
• Successful £27.1m equity raise in March for new acquisitions, all deployed in year
• Five strategic sites purchased in 2017 that could potentially deliver a further c.1,000 plots and over 5m sq. ft of additional commercial space
• Options signed on four sites and preferred bidder position onafurthersignificantsite.
• 10,448 consented residential plots and 12.13m sq. ft of consented commercial space under ownership as at 31 December 2017(1); vast majority utilised within the Major Developments division
• Land to be promoted in the planning system between 2018 and 2020 for a further 4,552 plots plus c.5.9m sq. ft of commercial space(1).
• Major outline planning consents secured in April at Kellingley (1.45m sq. ft of commercial space) and in October at Thoresby (800 residential plots and 0.25m sq. ft of commercial space)
• In total, planning secured for 825 residential plots and c.3m sq. ft of commercial space in 2017.
• 14 sites classed as Major Developments; remediation and site infrastructure works ongoing on these sites to underpin our sales and direct development programmes
• Thoresby and Kellingley added to Major Developments following receipt of outline planning consent in 2017.
• 622 consented residential plots and 0.85m sq. ft of commercial space sold at goodprofitmarginsthroughout the year, including a number of sales with repeat customers
• Further direct development undertaken and completed at key sites, including innovative joint venture deals at Logistics North and Waverley. Total of over 270,000 sq. ft built in the year.
• Over 50 new commercial lettings, renewals and reviews in 2017, including McLaren Automotive at the AMP
• Series of new lettings completed after year-end thatjustifiesdecisiontobuild further direct commercial development
• 159.7MW of energy capacity now installed on our land.
(1) Includes freehold and partnership sites.
Acquisitions
Capital Growth
Income Generation
10 Harworth Group plc Annual Report and Financial Statements 2017
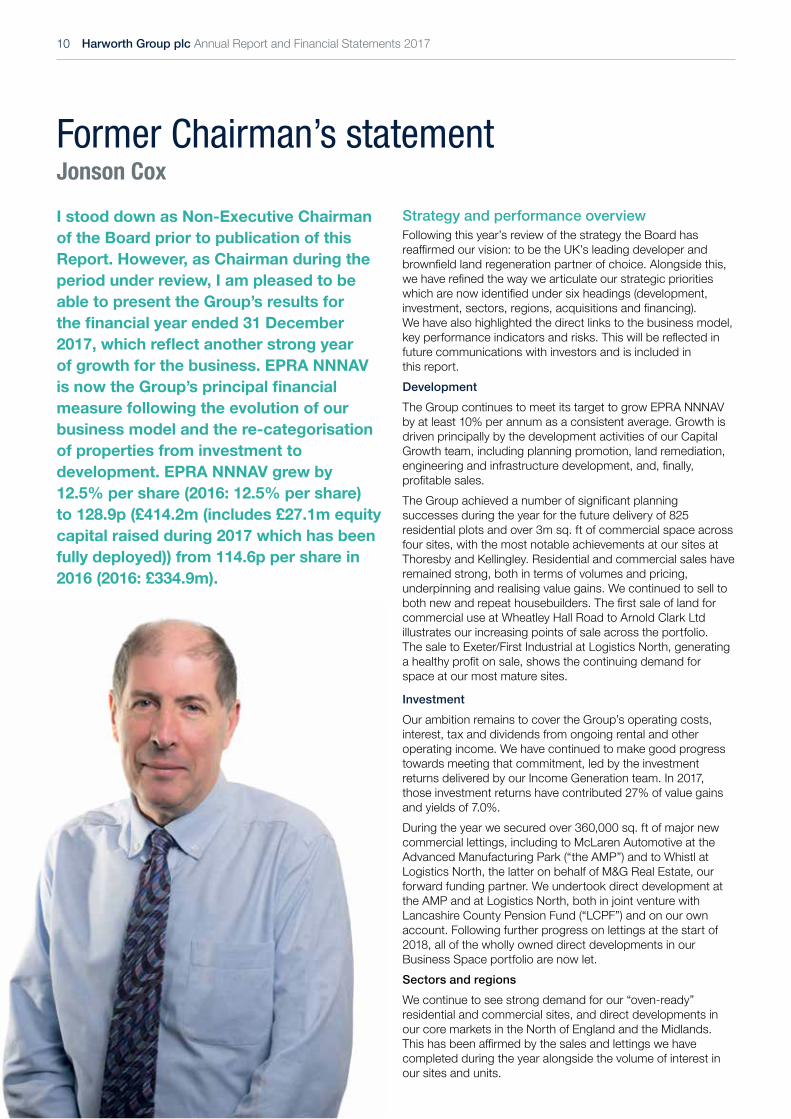
Former Chairman’s statementJonson Cox
I stood down as Non-Executive Chairman of the Board prior to publication of this Report. However, as Chairman during the period under review, I am pleased to be able to present the Group’s results for the financial year ended 31 December 2017, which reflect another strong year of growth for the business. EPRA NNNAV is now the Group’s principal financial measure following the evolution of our business model and the re-categorisation of properties from investment to development. EPRA NNNAV grew by 12.5% per share (2016: 12.5% per share) to 128.9p (£414.2m (includes £27.1m equity capital raised during 2017 which has been fully deployed)) from 114.6p per share in 2016 (2016: £334.9m).
Strategy and performance overviewFollowing this year’s review of the strategy the Board has reaffirmedourvision:tobetheUK’sleadingdeveloperandbrownfieldlandregenerationpartnerofchoice.Alongsidethis,wehaverefinedthewaywearticulateourstrategicprioritieswhicharenowidentifiedundersixheadings(development,investment,sectors,regions,acquisitionsandfinancing).We have also highlighted the direct links to the business model, keyperformanceindicatorsandrisks.Thiswillbereflectedinfuture communications with investors and is included in this report.DevelopmentThe Group continues to meet its target to grow EPRA NNNAV by at least 10% per annum as a consistent average. Growth is driven principally by the development activities of our Capital Growth team, including planning promotion, land remediation, engineeringandinfrastructuredevelopment,and,finally,profitablesales.TheGroupachievedanumberofsignificantplanningsuccesses during the year for the future delivery of 825 residential plots and over 3m sq. ft of commercial space across four sites, with the most notable achievements at our sites at Thoresby and Kellingley. Residential and commercial sales have remained strong, both in terms of volumes and pricing, underpinning and realising value gains. We continued to sell to bothnewandrepeathousebuilders.Thefirstsaleoflandforcommercial use at Wheatley Hall Road to Arnold Clark Ltd illustrates our increasing points of sale across the portfolio. The sale to Exeter/First Industrial at Logistics North, generating ahealthyprofitonsale,showsthecontinuingdemandforspace at our most mature sites.
InvestmentOur ambition remains to cover the Group’s operating costs, interest, tax and dividends from ongoing rental and other operating income. We have continued to make good progress towards meeting that commitment, led by the investment returns delivered by our Income Generation team. In 2017, those investment returns have contributed 27% of value gains and yields of 7.0%.During the year we secured over 360,000 sq. ft of major new commercial lettings, including to McLaren Automotive at the Advanced Manufacturing Park (“the AMP”) and to Whistl at Logistics North, the latter on behalf of M&G Real Estate, our forward funding partner. We undertook direct development at the AMP and at Logistics North, both in joint venture with Lancashire County Pension Fund (“LCPF”) and on our own account. Following further progress on lettings at the start of 2018, all of the wholly owned direct developments in our Business Space portfolio are now let. Sectors and regionsWe continue to see strong demand for our “oven-ready” residential and commercial sites, and direct developments in our core markets in the North of England and the Midlands. Thishasbeenaffirmedbythesalesandlettingswehavecompleted during the year alongside the volume of interest in our sites and units.
Former Chairman’s statementJonson Cox

Harworth Group plc Annual Report and Financial Statements 2017 11
STRATEGIC REPORTCORPORATE GOVERNANCE
FINANCIAL STATEMENTS
AcquisitionsWe recognise the importance of sustained momentum in the business. By the end of 2017 we had successfully deployed the £27.1m of equity raised in March 2017 through the acquisition of fivenewsiteswithresidentialandcommercialdevelopmentpotential.Thoseacquisitionshavealreadyproducedsignificantrevaluation gains during the year, cementing our record of growth from the sites we have acquired since 2014, when the business began to replenish its portfolio.We have a healthy pipeline, with six options now in place on circa 417 acres of potential development land and a number of acquisition opportunities being explored, including a substantial brownfieldsiteonwhichwearepreferredbidder.FinancingIn February 2018, we extended the availability of our debt funding by agreeing a two-year extension to our £75.0m revolving credit facility with RBS to February 2023 with only a 10 bps increase in margin to 210 bps. In 2017 we also secured a £5.0m increase in our bonding facility to £15.0m. We have continued to use public infrastructure loans to accelerate development. Our net loan to value remains low at 7.0% (2016: 9.9%) or 20.8% when calculated against the income portfolio (2016: 31.3%). We believe our policy of prudent gearing is well suited for land-focussed development businesses such as ourselves.
DividendThe Company’s policy is to grow the dividend in line with the growth of the business, and pay it from recurring income and realised value gains from disposals. The Board will not distribute unrealised gains recognised on the revaluation of property and will retain a proportion of its recurring income and realised gains for reinvestment in acquisitions. We declared and paid an interim dividend of 0.253p per share in October 2017. TheBoardisrecommendingafinaldividendof0.575ppershare(2016finaldividend:0.523p).Thisgivesatotaldividendof 0.828p per share (2016: 0.753p) being a 10% growth in dividend per share for the year. Subject to shareholder approval atthe2018AnnualGeneralMeeting,thefinaldividendwillbepaid on 1 June 2018 to shareholders on the register as at close of business on 4 May 2018. The ex-dividend date will be 3 May 2018.
Succession I have now been Chairman for more than seven years, during which time I am pleased that Harworth has grown into the respectedregenerationbusinessitistoday.Inthefiveyearssince Harworth became a standalone business, following our solventrestructuringofUKCoal,theGroup’sEPRANNNAV,including capital raised, has grown by an average of c.14% per annum to £414.2m.With strong foundations in place, now is the right time to hand the reins to my successor, for the next stage of Harworth’s growth and development. As previously announced, I will not be standing for re-election at this year’s Annual General
Meeting and I welcome Alastair Lyons CBE as my successor. Alastair’sappointmenttookeffecton7March2018,atwhichpoint I stepped down as Chairman, and retired from the Board at the end of March.
Our people and partnersI feel privileged to have worked with a talented and hardworking team at Harworth, supported also by our advisors and partners. The team continues to grow and mature with the business. Since publication of the 2016 Annual Report, we recruitedforfivenewrolesandmadeanumberofpromotions.Fourofthoserecruitswerewomen,confirmingthatpromotingdiversity across the business remains a priority. I would like to take this opportunity to thank all of the Harworth team and my Board colleagues for their hard work and contribution throughout the time I have been Chairman. I would also like to extend my thanks to our investors and wider stakeholders for their support through the transformation of Harworth over the last seven years.
OutlookHarworth is well positioned for the future. It has a robust strategy and business model, a proven track record and a pipeline of opportunities for replenishing its strategic land bank and property portfolio. Its core markets in the North of England and the Midlands continue to perform well. There continues to be a shortage of housing in the areas in which it operates and strong fundamentals underpinning growth in the logistics and advanced manufacturing sectors. Government policy remains largelysupportive,withstrongbackingforbrownfielddevelopment, prominent housing initiatives including the extension of Help to Buy, and a continued focus on regional investment and devolution. Against this backdrop, the outlook for the business remains favourable. I wish the entire Harworth team the very best for the future. Jonson Cox Chairman (as at 31 December 2017) 24 April 2018
Harworth is well positioned for the future. It has a robust strategy and business model, a proven track record and a pipeline of opportunities for replenishing its strategic land bank and property portfolio.
JONSON COX – CHAIRMAN (AS AT 31 DECEMBER 2017)

12 Harworth Group plc Annual Report and Financial Statements 2017
Chief Executive’s statementOwen Michaelson
Chief Executive’s statementOwen Michaelson
This is another excellent set of results reflecting a strong year of progress for the business. The Group once again delivered a year of double-digit EPRA NNNAV per share growth of 12.5% (2016: 12.5%), with EPRA NNNAV of £414.2m at the year-end (2016: £334.9m). This includes value gains of £47.4m(1) (2016: £43.7m), ahead of our expectations, and profit excluding value gains rose marginally to £2.24m(2) (2016: £2.21m).
Delivering our strategyAgainst the backdrop of our strategic priorities, our operational focus also remains unchanged: extracting maximum value from ourpredominantlybrownfieldlandportfoliointheNorthofEngland and the Midlands to grow EPRA NNNAV; building our recurring income base to cover operating costs; and acquiring brownfieldandurbanextensionlandandpropertyto
underpin the sustainability of our long-term business model. We do this by continuing to use our masterplanning, technical, placemaking and asset management expertise to transform redundant land into places where people want to live and work, whilst applying the same skills in targeting future areas in which to invest our management time and capital. Our core markets across the North of England and the Midlands are well suited to our strategy and business model. Demand for new homes in our markets remains steady, reflectedbyboththerateofsalesachievedbyourhousebuildingpartnersonoursitesandacontinueddeficitinthenumberofnewhomesbuiltversustheofficialnationaltargetof 300,000 new homes per year. The rise of e-tailing and the increasing demands of consumers also continues to support demand for logistics and distribution space, with the industrial sectorforecasttooutperformboththeofficeandretailmarketsover the next few years. This is further augmented by a largely supportive legislative framework and a number of recent Government announcements, including the publication of the IndustrialStrategyWhitePaperandfurtherfinancialsupportmade available within the Chancellor’s Autumn Statement to acceleratehousebuildingacrosstheUK.
Capital GrowthOur Capital Growth team has continued to make good progress in maximising value from our portfolio through three principal management actions: securing planning consents on major schemes; preparing land for redevelopment; and delivering sales above book value for future residential and commercial development. All have underpinned value gains made during the year.During the year we achieved planning successes on four sites for the delivery of 825 residential plots and over 3m sq. ft of commercial space. Two of these are worthy of particular highlight. In April, we secured consent for 1.45m sq. ft of new commercial space at Kellingley in Selby, North Yorkshire, less thaneighteenmonthsaftertheUK’slastdeepmineoperationsended there. Further planning success was achieved in October, when we received consent at the former Thoresby Colliery site in Nottinghamshire for 800 new homes alongside 250,000 sq. ft of new commercial space, just over two years after mining ended there. Both sites now form part of our Major Developments segment. As at 31 December 2017, total consented residential plots under ownership stood at 10,448 plots and consented commercial space on our land at 12.13m sq. ft. We also have live applications in the planning system for 1,308 new plots and 325,000 sq. ft of commercial space. These form part of a wider pipeline of planning applications for the next three years, comprising more than 4,500 residential plots (of which c.1,500 plots are for Planning Promotion Agreements (“PPAs”) on third-party land) and 5.9m sq. ft of commercial space to underpin the Group’s future disposals programme.
(1) Value gains (including development properties) comprises value gains (£41.6m) plus the increase in the fair market value of development properties (£5.8m).
(2) Profitexcludingvaluegainsisoperatingprofitbeforeexceptionalitemsplusjointventures(£43.8m) less value gains (£41.6m) and pension costs (£nil).

Harworth Group plc Annual Report and Financial Statements 2017 13
STRATEGIC REPORTCORPORATE GOVERNANCE
FINANCIAL STATEMENTS
The team continues to plan carefully whether and when to dispose of sites to maximise the return from our portfolio. In 2017 we achieved receipts in excess of book value, realising cash which can be reinvested in bringing other sites and acquisitions forward. A total of 622 residential plots were sold across six parcels to national and regional housebuilders during the year. This included sales to longstanding partners including Taylor Wimpey and Avant Homes alongside new partners such as Keepmoat Homes and SkyHouse, demonstrating the popularity of our product.We also sold land with planning consent for over 850,000 sq. ft ofcommercialspaceacrossfiveparcels,includingthreeheadline deals. In May, we entered into a joint venture with LCPF to develop the next phase of Logistics North in Bolton. Land totalling 31.2 acres was conditionally sold to Multiply Logistics North Holdings Limited, our joint venture, for the development of 564,000 sq. ft of commercial space over the next two years. Harworth retains a 20% stake in the joint venture and will also undertake development and asset management for separate management and promote fees. As at 31 December 2017, two of the three phases had been sold into the joint venture for the direct development of c.435,000 sq. ft of new commercial space.Thefinalquarterof2017includedtwofurtherkeycommercialland transactions. We executed a land sale of 18.3 acres at Logistics North to Exeter/First Industrial for £10.1m, representing its second major investment in the site over the past two years and setting a new benchmark price per acre for the site. In addition, we sold a 6-acre plot at Riverdale Park, DoncastertoArnoldClarkLtdfor£2.5m,representingthefirstland sale at the 112-acre site since its purchase for £8.5m in December 2015.
Income GenerationDuring the year, our Income Generation team has maintained its push to grow resilient, recurring income. This has included increased direct development space which we intend to hold for long-term rents, in response to a continued undersupply of good quality new units in the regions. The team continues to asset manage our existing Business Space portfolio to reduce voids and increase rental returns, whilst also deriving rental returns and royalties from energy generation, environmental technologies and the agricultural portfolio. As a by-product of our remediation, engineering and development activities, we also seek to generate income from recycled aggregates. Lettings progress was strong during the year, including the long-term lettings of over 360,000 sq. ft of directly developed industrial space with a number of new headline rents being set. The year began with Whistl taking a ten-year lease in January for a 225,000 sq. ft unit at Logistics North, just six weeks after we had overseen practical completion of the unit on behalf of M&G Real Estate, our forward funding partner. This was followedinMaybythestartofconstructionoffivefurthercommercialunitsatLogisticsNorth:threeasthefirstphaseofthe ‘Multiply Logistics North’ joint venture with LCPF totalling c.164,000 sq. ft; and two units (C4 and C5) totalling c.52,800sq.ftusinginternalfunds.Allfiveunitspractically
completed in the fourth quarter of 2017. Within two weeks of practical completion of units C4 and C5 at Logistics North, we agreed a ten-year lease for C4 at a new headline rent for Logistics North. We have also undertaken direct development at the AMP to meet growing occupier interest. In April, we achieved practical completion on six new units totalling 51,750 sq. ft, with a leading advancedmanufacturerbecomingourfirsttenantforac.11,000 sq. ft unit at a headline rent of £7.25psf on a 15-year lease. This was followed in December by Spendor Audio taking a15-yearleaseonac.26,000sq.ftunitaspartoftheirUKexpansion. The strength of the AMP as a business location was further demonstrated in July, with McLaren Automotive taking a 20-year lease on a new 75,000 sq. ft unit that we will be constructing on its behalf. McLaren will take occupation in the spring following practical completion. The space will be used to house McLaren’s new Composites Technology Centre, which willbeusedtobuildcarbon-fibrechassisforsportscarsfrom 2019.During the year, our team also increased income from other underlying assets within our c.1.9m sq. ft Business Space portfolio, with a total of over 50 new, renewed and reviewed commercial lettings being completed in the year. This was further bolstered by the purchase in November of a DHL distribution unit in Droitwich, Worcestershire with an annualised rent roll of £450,000. Asset management opportunities have alreadybeenidentifiedtogrowtheunderlyingvalueofthissitein future, alongside longer-term development plans. All of this activity led to Business Space revenue in 2017 of £8.4m (2016: £6.2m). The weighted average unexpired lease term (“WAULT”)acrosstheportfoliostandsat7.5years(2016: 7.5 years).
With clear momentum in place across all aspects of the business, alongside favourable market conditions and positive Government sentiment towards residential and commercial development onbrownfieldland,weremainconfidentin our ability to grow EPRA NNNAV across our portfolio and to increase our recurring income base to cover the operating costs of the business.
OWEN MICHAELSON – CHIEF EXECUTIVE

14 Harworth Group plc Annual Report and Financial Statements 2017
Chief Executive’s statementContinued
Our revenues for the period were also bolstered by the work of our Natural Resources and Operations teams. A total of 159.7MW of energy capacity is now installed on our land, providing a long-term income stream from a combination of ground rents and royalties. The team’s focus remains on growing future income from alternative technologies with better short-term prospects and from maintaining income from our tippingoperations,whichhastheaddedbenefitofsupportingsite remediation.
AcquisitionsThe successful completion of our £27.1m equity raise in March to accelerate the continued expansion of our strategic landbank was a key milestone for funding our future growth prospects. Our Acquisitions team deployed the proceeds in 2017 through theacquisitionoffivesiteswhichhavesupplementedourstrategic landbank and will improve the quality of our recurring incomebase.Thesefivetransactionsplusacquisitioncosts,allied with initial planning and infrastructure costs, account for the full £27.1m of new equity raised. All are forecast to support our ongoing delivery of a double digit internal rate of return, withtheDecember2017valuationalreadyreflectingsignificantvalue growth from these acquisitions during the year.Thetwomostnotableacquisitionswereidentifiedatthetimeof the placing and were adjacent to our existing landholdings, thusrealisingsignificantmarriagevalueaspartofouryear-endvaluationprocess.Thefirst,CoalvilleinLeicestershire,isa145-acre site purchased for £11.8m plus costs. It neighbours ourexistingCoalvilledevelopmentandalreadybenefitsfroman existing planning permission for 914 new homes. This acquisition has created a combined site with planning permission for the delivery of over 2,000 new residential plots and associated community facilities over a likely 15-year development pipeline. Thesecond,ChatterleyValleyinStaffordshire,isan88-acresitepurchased for £2.6m plus costs that borders our existing 24-acrefreeholdsite.TheentiresitebenefitsfromGovernmentEnterprise Zone status and an extant planning permission to deliver up to 1.2m sq. ft of new commercial development. Replenishing and growing our strategic landbank is essential to maintain delivery of our target of double-digit EPRA NNNAV
growth per annum through the property cycle. With this in mind, we have entered into six option agreements to acquire strategic land sites that extend to approximately 250 acres, comprising a mixture of potential residential and commercial sites located in, and adjacent to, our core regions. These sites have the potential to deliver a further 1,500 residential plots and 1.3m sq. ft of new commercial space should these options be taken up.
Strong business momentumThe continuing strong performance of the business, coupled with the robust nature of the markets we operate in, means that wealreadyhavesignificantmomentumin2018.Wehaveagreed over 50% of the year’s expected sales, underpinning the Group’s performance for the year ahead, although we still expect performance to be second half weighted. Inthefirsttwomonthsof2018,wehavesecuredanumberoflong-term lettings which will bolster our income portfolio, at headlinerentsforeachdevelopment,clearlyreflectingindustrialrental growth and supporting ongoing valuation uplifts. At Logistics North, a ten-year lease was agreed in January with Vaclensa Ltd for unit C5, achieving a new headline rent of £7psf. This was followed in February by two further lettings acrosstheportfolio.ThefirstwastoBritishSteelLtdwhocompleted a 15-year lease on the remaining Phase 2 R-evolution unit, totalling c.15,000 sq. ft, at the AMP at a new headline rate of £7.50psf. The second letting in February saw leading motor retailer Motor Depot Ltd taking a 15-year lease on our Helix unit at Gateway 36 at a new headline rent at the development of £5psf.This lettings progress has underpinned our decision to proceed on two further direct developments which will grow our recurring income base. Construction of Phase 3 of R-evolution at the AMP, c.56,000 sq. ft of new commercial space, has now begun alongside the second phase of the ‘Multiply Logistics North’ development that will deliver a further c.270,000 sq. ft of commercial space at Logistics North. Interest in our future commercial pipeline is already strong, driven by both the maturity of our developments such as Logistics North and the AMP, and a continued lack of supply of high-quality units in the regions in which we operate.
Chief Executive’s statementContinued
Rail Sidings at KellingleyFlass Lane

Harworth Group plc Annual Report and Financial Statements 2017 15
STRATEGIC REPORTCORPORATE GOVERNANCE
FINANCIAL STATEMENTS
Our reputation for being straightforward and acting swiftly in making new acquisitions also stands us in good stead in identifying an acquisitions pipeline, with no shortage of opportunities currently. Prior to the end of February, we signed aPPAforakeysiteinDerbyshirethatunifieseightseparatelandowners in attempting to secure a major new residential consent.TheCinderhillsitetotals421acresandbenefitsfromadraft housing allocation within the emerging Amber Valley Local Plan for up to 3,000 new homes, alongside 500,000 sq. ft of commercial space. This draft plan has now been submitted to the Government for further examination in the Spring. With clear momentum in place across all aspects of the business, alongside favourable market conditions and positive Government sentiment towards residential and commercial developmentonbrownfieldland,weremainconfidentinourability to grow EPRA NNNAV across our portfolio and to increase our recurring income base to cover the operating costs of the business.
PeopleOur continued strong performance has necessitated growing our team in line with the increasing workload of the business. Our people remain as committed, diligent and steadfast as ever in maximising the value of our portfolio and creating great new places for people to live and work. My thanks goes out to the team, our trusted delivery partners and professional teams for their hard work in making the Group what it is today.Finally, on behalf of the Board and the Harworth team, I would like to express my thanks to Jonson Cox who has served as our Chairman since November 2010 and helped us navigate through many challenges in creating the business we have today. Successful businesses do not just happen. They require a combination of skill, leadership and good market judgements. I would like to express my sincere thanks for Jonson’s leadership and guidance over the past seven years. I would also like to welcome Alastair Lyons as our new Chairman.Owen Michaelson Chief Executive 24 April 2018
Gateway 36Waverley
R-evolution Phase 3 at AMPSolar farm at Oxcroft

16 Harworth Group plc Annual Report and Financial Statements 2017
Capital Growth in 2017Phil Wilson, Managing Director, Capital Growth
Capital Growth in 2017Phil Wilson, Managing Director, Capital Growth
The Capital Growth segment of the business continues to maximise the value of Harworth’s portfolio by developing its land and property portfolio to its optimum extent, thereby growing NNNAV. Our active management of sites – principally securing beneficial planning consents, preparing land for redevelopment and delivering sales above book value – remains the principal driver of NNNAV, with 80% of revaluation gains in 2017 directly attributable to management actions.
Strategic Land in 2017Our focus on planning preparation and promotion in 2016 was rewarded in 2017 in the form of a number of outline planning consents being secured in the year. In April 2017, we secured consent from Selby District Council for 1.45m sq. ft of new commercial employment space at the 151-acre former KellingleyCollieryinNorthYorkshire,theUK’slastdeepmine.Planning was secured less than eighteen months on from the siteclosingitsdoorsasamine,areflectionoftheteam’sabilityto recognise the inherent strengths of a site’s assets and to unify stakeholders behind a compelling vision for regeneration. The site is now being promoted with rail companies to take advantageofitsliverailconnectiontotheHulltoWakefieldline.The team’s other major success in 2017 was securing outline consent in October 2017 on the 450-acre former Thoresby Colliery in Nottinghamshire. Newark & Sherwood District Council granted consent at the Midlands’ last deep mine for 800 new homes and 250,000 sq. ft of employment space, just over two years after this site also closed. Demolition of the site’s former industrial structures is almost complete, with the site’sfirstresidentialparcelof11-acresnowbeingpreparedinreadiness for housebuilders to bid on it in the second half of 2018. Planning was also secured on two other sites in the portfolio, with a further 25 residential plots and 1.3m sq. ft of commercial space added to our consented landbank. PPAs also continue to be signed with third-party landowners as a source of strategic land and to provide further income to the business should a planning consent be secured. We signed a further three PPAs in 2017 with the potential to deliver c.425 housing plots, bringing the total number of housing plots we are promoting through PPAs to c.1,800.
Delivering our Major Developments in 2017: engineering, plot sales and build outValue growth through planning continues to be supplemented by the preparation of an increased number of sites for either the sale of engineered land for residential or commercial purposes or for retention for the construction of commercial space to increase our income portfolio – with 14 of our sites now classifiedas‘MajorDevelopments’.Withdemandforresidentialand commercial land continuing to remain strong in our core markets, Major Developments disposals in 2017 achieved a healthy price over book value with the receipts subsequently reinvested in bringing forward further sites in our strategic landbank for development.The team continues to plan carefully whether and when to dispose of sites to maximise the return from our portfolio. A total of 622 engineered residential plots were sold across six parcels to national and regional housebuilders during the year. In H1 2017, this included sales at Waverley to Taylor Wimpey (130 plots) and Avant Homes (61 plots), alongside a sale at Flass Lane, Castleford to Keepmoat (157 plots) and a sale at Village Farm, Durham to Bloc Group (10 plots). In H2 2017, two further residential sales were made at Waverley to Avant Homes (220 plots) and SkyHouse (44 plots). The latter, a 21st-century take on the Victorian back-to-back home, is the

Harworth Group plc Annual Report and Financial Statements 2017 17
STRATEGIC REPORTCORPORATE GOVERNANCE
FINANCIAL STATEMENTS
firststarterhomeproductthatwillbedeliveredatWaverley,alongside the 800+ family-oriented homes that have already been delivered on-site since 2012.We also sold land with planning consent for over 850,000 sq. ft ofcommercialspaceacrossfiveparcelsacrosstheyear.InMay, we entered into a joint venture with LCPF to develop the next phase of Logistics North in Bolton. Land totalling 31.2 acres was conditionally sold to Multiply Logistics North Holdings Limited, our joint venture, for the development of 564,000 sq. ft of commercial space over the next two years. Harworth retains a 20% stake in the joint venture and will also undertake development and asset management for separate management and promote fees. As at 31 December 2017, two of the three phases have been sold into the joint venture for the direct development of c.435,000 sq. ft of new commercial space, with c.164,000 sq. ft across three units already built.The second half of 2017 included three further commercial land transactions. In August, we sold 3.4 acres of engineered land toLidl(UK)forthemtobuildac.12,450sq.ftnewsupermarketatTorneParkinDoncaster,adjacenttothefirsttwophasesofresidential development being brought forward at the site by Taylor Wimpey and Harron Homes. This was supplemented by twosignificantdealsinDecember.Weexecutedalandsaleof 18.3 acres at Logistics North to Exeter/First Industrial in December for £10.1m, representing its second major investment in the site over the past two years and setting a new benchmark price per acre for the site. In addition, we sold a 6-acre plot at Riverdale Park, Doncaster to Arnold Clark Ltd for £2.5m,representingthefirstlandsaleatthe112-acresitesinceits purchase for £8.5m in December 2015.Following all of this activity, total consented residential plots under ownership or management (including sites where we are promoting third party interests through PPAs) stand at 10,448 plots (2016: 9,529 plots) and consented commercial space on our land at 12.13m sq. ft (2016: 9.95m sq. ft).
Looking forward to 2018Ourcoremarketscontinuetoofferstrongopportunitiesforgrowth. Demand for residential land remains strong, with the UKstilldeliveringwellbelowthe300,000newhomesperyearrequired and both large and small housebuilders reporting good demand for new homes across the North of England and the Midlands. Demand for well-connected industrial, manufacturing and logistics space also remains good, with an under-supply of new units of all sizes being reported across the regions. With a number of our sites being located close to key motorway and principal road junctions, we are well-placed to take advantage of this trend.The fundamentals for the ‘beds and sheds’ sectors in our regions continue to align with our in-house team’s experience in bringing forward residential and commercial land to the market in good locations whilst delivering new commercial space for a range of occupiers. Our focus therefore remains similar to that which we reported in 2016:• We will continue with our stated strategy of exploiting
portfolio opportunities by optimising land use and securing planning consents for both residential and commercial
uses. We have live applications in the planning system for 1,308 new plots and 325,000 sq. ft of commercial space. These form part of a wider pipeline of planning applications for the next three years, comprising more than 4,500 residential plots (of which c.1,500 plots are for PPAs on third-party land) and 5.9m sq. ft of commercial space to underpin the Group’s future disposals programme.
• We will also continue to invest in the sites in our portfolio with the highest value enhancement potential, whilst increasing our points of sale to increase value creation and to diversify risk. Our 14 Major Developments sites, including ourflagshipschemesatWaverleyandLogisticsNorth,provide further outlets for us to build new commercial units that can be retained as income-producing assets.
• Lower value sites with little development potential will continue to be sold to free-up management time to devote to sites with the highest value enhancement potential.
Phil Wilson Managing Director, Capital Growth 24 April 2018
The fundamentals for the ‘beds and sheds’ sectors in our regions continue to align with our in-house team’s experience in bringing forward residential and commercial land to the market in good locations whilst delivering new commercial space for a range of occupiers.
PHIL WILSON – MANAGING DIRECTOR, CAPITAL GROWTH
CGI of SkyHouse at Waverley
18 Harworth Group plc Annual Report and Financial Statements 2017
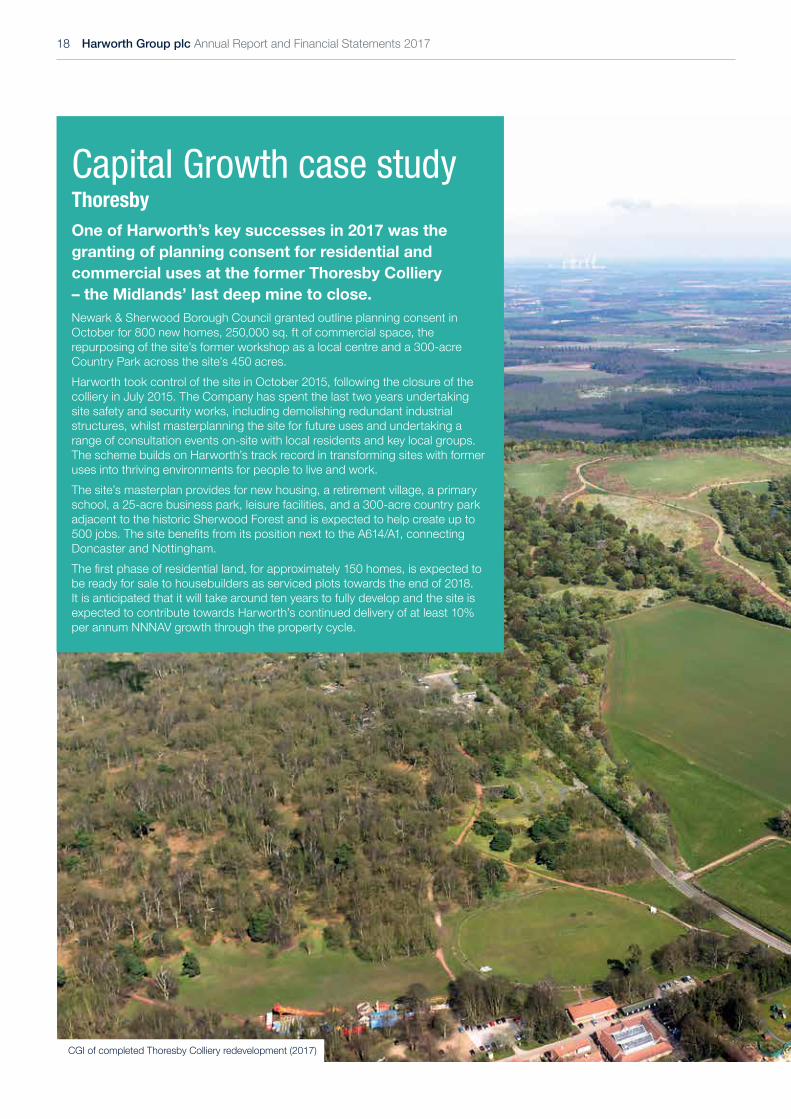
Capital Growth case studyThoresbyOne of Harworth’s key successes in 2017 was the granting of planning consent for residential and commercial uses at the former Thoresby Colliery – the Midlands’ last deep mine to close.Newark & Sherwood Borough Council granted outline planning consent in October for 800 new homes, 250,000 sq. ft of commercial space, the repurposing of the site’s former workshop as a local centre and a 300-acre Country Park across the site’s 450 acres.Harworth took control of the site in October 2015, following the closure of the colliery in July 2015. The Company has spent the last two years undertaking site safety and security works, including demolishing redundant industrial structures, whilst masterplanning the site for future uses and undertaking a range of consultation events on-site with local residents and key local groups. The scheme builds on Harworth’s track record in transforming sites with former uses into thriving environments for people to live and work.The site’s masterplan provides for new housing, a retirement village, a primary school, a 25-acre business park, leisure facilities, and a 300-acre country park adjacent to the historic Sherwood Forest and is expected to help create up to 500jobs.ThesitebenefitsfromitspositionnexttotheA614/A1,connectingDoncaster and Nottingham.Thefirstphaseofresidentialland,forapproximately150homes,isexpectedtobe ready for sale to housebuilders as serviced plots towards the end of 2018. It is anticipated that it will take around ten years to fully develop and the site is expected to contribute towards Harworth’s continued delivery of at least 10% per annum NNNAV growth through the property cycle.
CGI of completed Thoresby Colliery redevelopment (2017)

Harworth Group plc Annual Report and Financial Statements 2017 19
STRATEGIC REPORTCORPORATE GOVERNANCE
FINANCIAL STATEMENTS
Key facts
Location Edwinstowe, North Nottinghamshire
Total site area 450 acres: 150 acres for residential and commercial development 300 acres for Country Park adjacent to Sherwood Forest
Outline consent granted in October 2017
800 new homes 250,000 sq. ft of new commercial space Adaptation of former workshop building for local centre uses
Size of first plot being prepared for housebuilders
c.10 acres for 150 homes

20 Harworth Group plc Annual Report and Financial Statements 2017
Income Generation in 2017Ian Ball, Executive Director, Income Generation
Income Generation in 2017Ian Ball, Executive Director, Income Generation
The Income Generation segment of the business continues to make strong progress in creating, managing and retaining selected land and property assets to generate long-term recurring income and support capital growth in the form of NNNAV – particularly from the new commercial space that we are building and letting. The total Income Generation segment contributed revenue of £18.2m(2016:£17.4m)andgrossprofitof£12.8m(2016: £12.5m). After the deduction of the overheads of the business,thisdeliveredprofitexcludingvaluegainsof£2.24m(2016:£2.21m).Thisreflectstheongoingprofitabilityofthebusinesswhichisnotreliantonvaluegainsorprofitsfromthesale of properties and is, therefore, less susceptible to movements in the property cycle. As part of the Group’s strategy, the income that we derive is focused on covering four key costs:• the running costs of the business (including strategic land
promotion);• our interest costs; and ultimately• tax; and• a sustainable and rising dividend to shareholders.
Business Space in 2017At the end of December 2017, our Business Space portfolio consisted of a total of 17 business parks and development sites where we receive both rent and service charges. These sites comprise a total of c.1.9m sq. ft of built space and 436 acres of developmentland,with94.4%ofourportfolioclassifiedas‘industrial’ to cover a range of commercial uses.Income from our Business Space portfolio continued to grow in 2017, with Business Space revenues rising in 2017 to £8.4m (2016: £6.2m). We now have 108 individual tenants across the portfolioandaportfolioWAULTof7.5years,withover84%ofour space now let. This was driven by three principal management actions – the swift letting of newly built space; letting success across the portfolio; and acquiring income-producing property.We completed over 360,000 sq. ft of long-term lettings in the yearonfivenewcommercialbuildingsthatwehavebuiltorarein-build at the AMP and Logistics North. Whilst this included Whistl taking a 10-year lease in January 2017 on M&G Real Estate’s ‘Logistics 225’ unit at Logistics North that Harworth built on its behalf, we also completed four pre-lets or lettings on our directly built space during the year. This included McLaren Automotive taking a 20-year lease at the AMP in July 2017 for a 75,000 sq. ft unit that we are building on its behalf, for practical completion in April 2018. Three other deals related to two developments that we practically completed during 2017. In April 2017, we practically completed 51,750 sq. ft of new commercial space across four units at the AMP known as ‘R-evolution Phase 2’, with two long-term lettings being secured in the year. An advanced manufacturer took a 15-year lease on a 11,044 sq. ft unit within eight weeks of practical completion, whilst Spendor Audio signed a 15-year lease for a 25,962 sq. ft unit at a new headline rent at the development of £7.50psf. In addition, we completed two new commercial units known as ‘R-evolution’ at Logistics North, totalling 52,871 sq. ft that practically completed in December 2017. Within 2 weeks, Northern Building Plastics took a 10-year lease on the 24,987 sq. ft unit.This letting success formed part of the overall success across the wider Business Space business in the year, with the completion of over 50 new commercial lettings, renewals and reviews in 2017 generating a total of £1.1m of additional recurring rent per annum. This was further bolstered by the purchase of the 8.7-acre site at Berry Hill Industrial Estate in Droitwich, Worcestershire, from DHL, for £5.2m plus acquisition costs in November. This site currently comprises a 112,416 sq. ft commercial unit, that has immediately been leased back to DHL.Thefive-yeartermatapassingrentof£450,000perannum, which represented a net initial yield of 8.15% and a reversionary yield of 8.65%, supports our strategy of developing better quality, more resilient income across the portfolio.As referred to in ‘Capital Growth’, our year also included the completionofthefirstthreeunitsof‘MultiplyLogisticsNorth’,our Joint Venture with the LCPF. These units, totalling c.164,000 sq. ft, practically completed in November 2017 and are now being promoted to commercial occupiers for long-term leasehold occupation.

Harworth Group plc Annual Report and Financial Statements 2017 21
STRATEGIC REPORTCORPORATE GOVERNANCE
FINANCIAL STATEMENTS
Natural Resources in 2017Wecontinuetoretainasignificantnaturalresourcesportfolioacross our geographies. This comprises rent and royalties from low-carbon energy developments including solar farms, wind farms and coal mine methane extraction operations, alongside Short-Term Operating Reserve (STOR) operations, tipping and composting works and our agricultural portfolio. This portfolio generates a long-term base rent of c.£2m and a royalty income of c.£2m.We grew income from renewables in 2017, with a further net 15MW of capacity installed on our land in the year. Core income from 159.7MW of low-carbon energy developments is now in place, alongside income from tipping operations on a number of sites in Yorkshire and the East Midlands.A large part of 2017 involved the team developing proposals to tap into alternative technologies that have strong Governmental support, including the emerging battery storage market. We expect a number of these proposals to result in deals in 2018.
Operations in 2017Income from the Operations business comprises revenue from therecyclingandsaleofcoalfines,aggregatesandscrapthatareby-products from the development process. Whilst regulatory changeshavesignalledtheendofcoal-firedpowerstationsbytheendof2025,coalfinesremainakeysourceoffuelforpowerstation operators in the short-term – meaning that it remains a sourceofincomefromfivesitesfollowingitsremovalaspartofthe land restoration and remediation process.Income continues to be generated from the supply to DRAX powerstationinNorthYorkshireandRatcliffepowerstationinNottinghamshire, with a new customer, EDF Energy, taking coal finestosupporttheoperationofCottamandWestBurtonpowerstations in Nottinghamshire in 2017. Income also continued to be generated from the sale of aggregates that are by-products from the demolition and remediation of a number of our sites.
Looking forward to 2018As with Capital Growth, our core markets remain robust and we areconfidentthatwecanfurthergrowourrecurringincomebasethrough our Business Space portfolio in 2018. Demand for well-connected industrial and logistics space remains good owingtoanunder-supplyofnewunitsofallsizes,whichbenefitsboththeAMPandLogisticsNorthgiventheirproximitytotheUKmotorwaynetwork.Thisconfidencewasunderpinnedbyourstart to the year, with three key lettings agreed by February. Vaclensatooka10-yearleaseonthefinal27,884sq.ft‘R-evolution’ unit at Logistics North at a headline rent at £7psf, whilst British Steel Limited took a 15-year lease on the c.15,500 sq.ftfinal‘R-evolutionPhase2’unitattheAMPataheadlinerentof£7.50psf.Finally,wesuccessfullyleasedthefinalvacantunitatGateway 36 in Barnsley to Motor Depot Limited, with the company taking a 15-year lease at the 75,277 sq. ft “Helix” unit at a headline rent of £5psf.As a result of this activity, our wholly owned direct developments in the Business Space portfolio are fully let. This has underpinned our decision to speculatively develop the third phase of “R-evolution” at the AMP, comprising 55,750 sq. ft of additional commercial space that is due to practically complete in
September 2018. Where appropriate, we will continue to progress selected direct developments to ‘move up the value curve’ and deliver long-term income on our highest value and best-connected sites.Our Business Space team will also continue to explore joint venture transactions on our most valuable sites in order to capture development management, asset management and promotion fees from third parties. This includes the letting of all co-ownedunitsintheportfolio,includingthefirstthreeunitsofthe ‘Multiply Logistics North’ development and the remaining M&G Real Estate-owned Logistics 175 unit, also at Logistics North.Effectiveassetmanagementwillremaininplacetodrivefurther value and income from our present portfolio, including further reducing our vacancy rate and regearing leases as appropriate, whilst also working with Acquisitions colleagues to grow our recurring income by identifying additional income producing acquisitions.Elsewhere, positive interest remains for multi-energy schemes across a number of our sites, to address current system imbalances. Natural Resources management time will continue to focus on driving income from well-supported new technologies to address energy imbalances, including battery storage, whilst progressing planned existing schemes within our pipeline.Wewillaimtomaintaincoalfinessalesinthemedium-term, given the required blend of power sources neededtokeepthelightsonintheUKandtoalsosupportoursite remediation process as we open up further sites for redevelopment. Where possible, this means that we will look to securelargercontractsfromourexistingcoalfinescustomers–DRAX,Uniper(Ratcliffe)andEDF(CottamandWestBurton)– to build a more resilient Operations business in the short-term.Ian Ball Executive Director, Income Generation 24 April 2018
R-evolutionPhase2UnitatAMP,Rotherham
Where appropriate, we will continue to progress selected direct developments to ‘move up the value curve’ and deliver long-term income on our highest value and best-connected sites.

22 Harworth Group plc Annual Report and Financial Statements 2017
Income Generation case studyLogistics NorthSignificant progress was made at Logistics North in 2017 in building and letting a range of new commercial space for tenants, providing a long-term recurring income stream for the business whilst also being a source of value gains. The year began with Whistl taking a ten-year lease on Logistics 225 – the c.225,000 sq. ft unit built by Harworth on behalf of M&G Real Estate. The unit now acts as Whistl’s North West distribution headquarters, with a ten-year lease being signed at a North West industrial headline rent of £6psf.With Whistl’s deal highlighting the extent of demand at the site, Harworth then began the construction of three new units to hold for income purposes. These included two speculative development commercial units totalling c.52,900 sq. ft, aimed at small and medium-sized businesses, alongside a c.1,800 sq. ft drive-thru facility built on behalf of Costa, which took a 15-year lease from July 2017. UnitsC4andC5practicallycompletedinDecember2017andwithintwoweekshad been let to long-term tenants. Northern Building Plastics took a 10-year lease onthec.25,000sq.ftUnitC4,whilstVaclensatooka15-yearleaseonthec.27,900sq.ftUnitC5ataheadlinerentforthedevelopmentof£7psf.Further evidence of Logistics North’s success followed in May, with Harworth entering into a joint venture with LCPF to develop the next phase of commercial units at the site. Land totalling 31.2 acres was conditionally sold to Multiply Logistics North Holdings Limited, our joint venture, for the development of 564,000 sq. ft of commercial space over the next two years. Harworth retains a 20% stake in the joint venture and will also undertake development and asset management for separate management and promote fees. As at 31 December 2017, two of the three phases had been sold into the joint venture for the direct development of c.435,000 sq. ft of new commercial space, with the partnership’sfirstthreeunits–totalling164,000sq.ft–alreadypracticallycomplete. As at March 2018, two of these units were in legals.2018 will see the second phase of Multiply Logistics North practically complete – six new units totalling c.270,000 sq. ft ready for occupation for manufacturing or distribution uses. Leasehold interest is also being sought on all remaining plots at Logistics North, which could deliver units of up to 250,000 sq. ft.
Aerial of Logistics North, February 2018

Harworth Group plc Annual Report and Financial Statements 2017 23
STRATEGIC REPORTCORPORATE GOVERNANCE
FINANCIAL STATEMENTS
Key facts
Location Bolton, Greater Manchester
Full extent of Multiply Logistics North development
10 new units totalling 564,000 sq. ft, set over 31.2 acres
Phase 1 Multiply space built by December 2017
3 new units totalling c.164,000 sq. ft
Other commercial space built by Harworth for income purposes in 2017
UnitsC4andC5,totallingc.52,900sq.ftNew drive through unit for Costa, totalling c.1,800 sq. ft
Tenants signed up between January 2017 and March 2018
Whistl (M&G Real Estate’s Logistics 225) Vaclensa, Northern Building Plastics (UnitsC4andC5) Costa (drive-through unit) 2 other units in legals
Phase 2 Multiply space now being built 6 new units totalling c.270,000 sq. ft that will be practically complete in Q4 2018

24 Harworth Group plc Annual Report and Financial Statements 2017
Acquisitions in 2017Gary Owens, Director, Acquisitions
Replenishing our land and property portfolio to ensure the sustainable growth of the business remains one of our six strategic priorities. Utilising capital to purchase: new, significant, mainly brownfield development sites; edge of settlement, strategic land opportunities; or business parks with asset management and/or development opportunities form the backbone of our acquisitions strategy, with a dedicated team now in place to deliver it.Following the successful £27.1m equity raise in March 2017 fornewacquisitions,wedeployedalloftheproceedsonfivestrategic sites in the year that could potentially deliver a further c.1,000 plots and over 5m sq. ft of additional commercial space.Crucially,anumberofthesesitesrealisedsignificantcapital growth marriage value at year-end, owing to their proximity to landholdings within the existing portfolio, whilst
also deriving income as we continue to improve the quality of the business’ recurring income base. In addition, we signed options on another four sites and secured preferred bidder positiononafurthersignificantsite,providingastronglandpipeline for further growth.
March 2017 equity raiseFollowing the publication of our preliminary results on 6 March 2017, we successfully undertook an equity placing that raised £27.1m (net of expenses). This involved placing 29,226,974 new Ordinary Shares (representing 9.9% of the Company’s share capital prior to the placing) at a price of 95.0 pence per share (representing a discount of approximately 1.6% to the closing mid-market price of the Company’s shares on the day before the announcement of the placing) to accelerate the continued expansion of our strategic landbank.At the time of placing, we advised shareholders that there were no shortage of opportunities to deploy the proceeds in our core markets of the North of England and the Midlands. By November, we had successfully deployed all of this new equity on principally Capital Growth opportunities, with a projected rate of return in each case above our target rate.
Acquisitions made in 2017OurfirstthreeacquisitionsweremadeinAugust2017foratotalconsiderationof£16.3mpluscostsonsitesidentifiedaspartofthe equity placing.Coalville, LeicestershireThefirst,CoalvilleinLeicestershire,isa145-acresitepurchased for £11.8m plus costs. It neighbours our existing Coalvilledevelopmentandalreadybenefitsfromanexistingplanning permission for 914 new homes. This creates a combined site with planning permission for over 2,000 new residential plots and provides a 15-year development pipeline, realisingsignificantmarriagevalueatyear-end.Chatterley Valley, StaffordshireThesecond,ChatterleyValleyinStaffordshire,isan88-acresitepurchased for £2.6m plus costs that borders our existing 24-acrefreeholdsite.TheentiresitebenefitsfromGovernmentEnterprise Zone status and an extant planning permission to deliver up to 1.2m sq. ft of new commercial development. Thecombinedsitealsobenefitsfromaliverailconnectionand,similarlytoCoalville,realisedsignificantmarriagevalueatyear-end.Wingates, BoltonThefinalacquisition,WingatesinBolton,involvedthefreeholdpurchase or option to purchase three land parcels totalling 73 acres. The land is adjacent to Junction 6 of the M61, two motorway junctions north of our existing Logistics North development, and borders 221 acres of land that we already own. When all of this land is combined, it could deliver a further 2.4m sq. ft of commercial employment space for both manufacturing and distribution businesses. This site now forms part of our strategic planning pipeline between now and 2020.OurfinaltwoacquisitionsintheyearcompletedinDecember 2017.
Acquisitions in 2017Gary Owens, Director, Acquisitions

Harworth Group plc Annual Report and Financial Statements 2017 25
STRATEGIC REPORTCORPORATE GOVERNANCE
FINANCIAL STATEMENTS
Strategic land site, DoncasterOur penultimate purchase of the year was a privately sourced 131-acre site in Doncaster, South Yorkshire, for £3.0m plus acquisition costs, with an option agreement for a further 131 neighbouring acres. Adjacent to Junction 5 of the M18 and inaboroughwherewealreadyhavesignificantlandholdings,this site also forms part of our future strategic planning pipeline, as it has the potential to deliver 2.4m sq. ft of distribution, manufacturing and engineering space.Berry Hill industrial estate, WorcestershireOurfinalpurchaseoftheyearwasan8.7-acresiteatBerryHillindustrial estate in Droitwich, Worcestershire, from DHL, for £5.2m plus acquisition costs. Three miles from Junction 5 of the M5, the site currently comprises a 112,416 sq. ft commercial unit, that has immediately been leased back to DHL.Thefive-yeartermatapassingrentof£450,000perannum represents a net initial yield of 8.15% and a reversionary yield of 8.65%, supporting the Group’s strategy of increasing and improving the quality of its recurring income base, whilst in the longer-term, the site’s very low density of 30% provides attractive upside opportunity for a whole or partial site redevelopment.Withsignificantvaluegainsbeingachievedontheseacquisitions in 2017, given marriage value capture, this has supported an overall return rate on all acquisitions made since 2014 of over 15% per annum. Acquired sites now account for over a quarter of the value of the portfolio.In addition to these acquisitions, we also have four further option agreements in place to acquire, in aggregate, approximately 250 acres of strategic land. These sites – two in the North West, one in Yorkshire and one in the East Midlands – could deliver in aggregate over 1,500 residential plots and 1,300,000 sq. ft of new commercial space if taken up.
Looking forward to 2018The outlook for our principal markets in the North of England and Midlands remains strong, with a scarcity of good quality new commercial space continuing to drive the allocation of new sites and occupier demand for well-connected new space. We have an annual target of acquiring land with the ability to deliver over 1,000 residential units and over 1m sq. ft of commercial space, translating to over 200 acres of net developable land. Whilst this target is a challenging one, our track record as a business, our ability to transact quickly, the fact that existing strong relationships with public bodies are in place and the four land options already available to the business provide a solid foundation to make further purchases that will deliver a double-digit rate of return.Good opportunities remain available to Harworth across its coreregions,specificallywithinourtargetgrowthareasoftheMidlands and North West. Our aim is to secure new opportunities across the following three key areas: • Thepurchaseofmajorbrownfieldlanddevelopment
opportunities, including distressed land sales, surplus governmentestatedisposalsandformercoal-firedpower
stations. These sites underpin our strategy and will maximise the expertise and track record within the team, delivering value returns through value add initiatives.
• Strategic promotion of edge of settlement sites. We intend to grow our strategic land portfolio through PPAs and options, targeting edge of settlement sites that can be promoted through the local development plan process.
• The purchase of income producing business parks. We remain committed to strengthening our recurring income base by acquiring multi-let business parks that offeropportunitiestoaddvaluethroughassetmanagementand development, in a similar manner to Berry Hill industrial estate.
Gary Owens Director, Acquisitions 24 April 2018
Coalville
Chatterley Valley
Crucially, a number of these sites realised significantcapitalgrowthmarriagevalueat year-end, owing to their proximity to landholdings within the existing portfolio.
GARY OWENS – DIRECTOR, ACQUISITIONS

26 Harworth Group plc Annual Report and Financial Statements 2017
Acquisitions case studyPurchase of site for future residential development at Coalville, LeicestershireThe purchase of 145 acres of land at Coalville, Leicestershire for £11.8m plus costs in August 2017 was our first major site purchase following the successful raising of £27.1m of new equity in March 2017.This land already has an outline planning permission for housing, which could deliver 914 new homes across 76 net developable acres. Crucially, the site is also adjacent to our existing 200-acre Coalville site, which has planning consent for 1,102 new homes. This combined scheme is now Harworth’s second largest residential development, behind Waverley, and provides a 15-year pipeline of land for residential sales.The purchase delivered immediate marriage value as recognised in the 2017 valuation, whilst our development appraisal forecasts a rate of return in excess of our required hurdle rate.Ourfocushasnowshiftedtovalueengineeringthefirstdevelopmentplatformstoselltohousebuilders.Weplantoselectthesite’sfirsthousebuilderin2018,with a further 15 years of sales and development across the full scheme to follow. Work will also take place to optimise the existing planning consent across both sites to maximise eventual returns.
Aerial of coalville site, September 2017
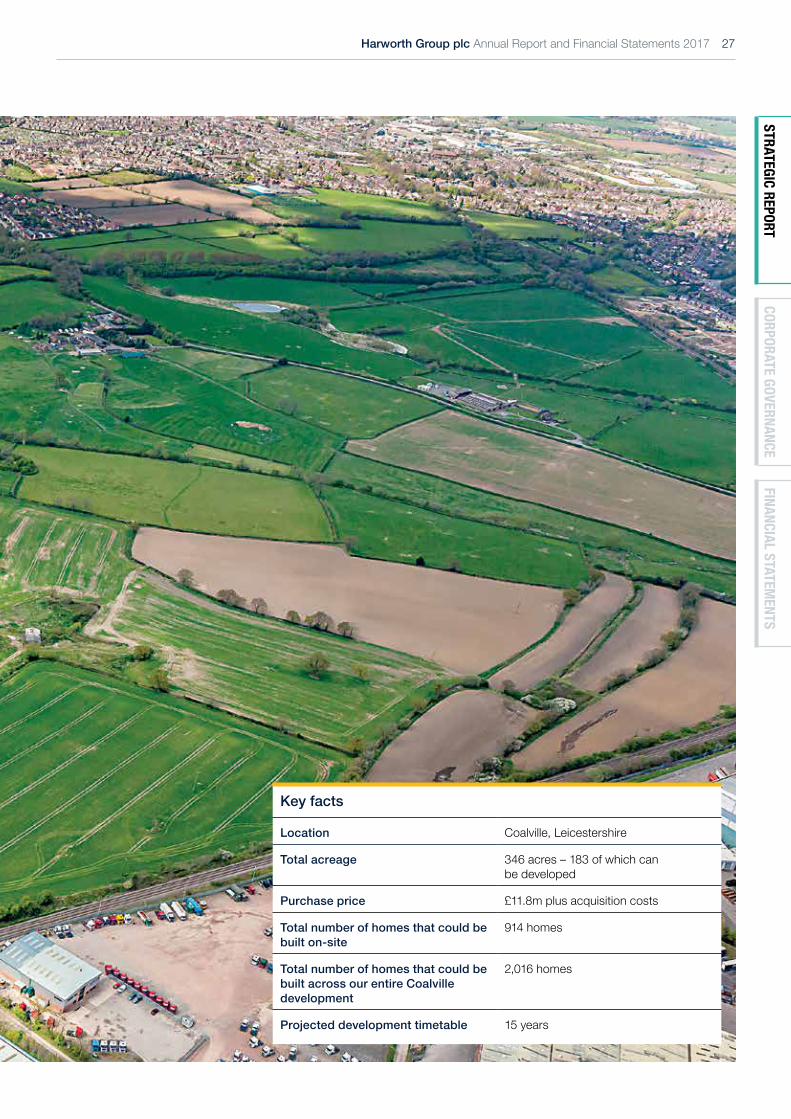
Harworth Group plc Annual Report and Financial Statements 2017 27
STRATEGIC REPORTCORPORATE GOVERNANCE
FINANCIAL STATEMENTS
Key facts
Location Coalville, Leicestershire
Total acreage 346 acres – 183 of which can be developed
Purchase price £11.8m plus acquisition costs
Total number of homes that could be built on-site
914 homes
Total number of homes that could be built across our entire Coalville development
2,016 homes
Projected development timetable 15 years

28 Harworth Group plc Annual Report and Financial Statements 2017
Financial ReviewAndrew Kirkman, Finance Director
Financial ReviewAndrew Kirkman, Finance Director
OverviewFurthersignificantprogresswasmadeacrossthebusinessin2017,whichresultedinanotheryearofdoubledigitgrowthinEPRA NNNAV. This growth was after including the impact of the March 2017 equity capital raise which had the impact of a c.2.0% dilution in net assets per share. EPRA NNNAV rose by 12.5% to 128.9p per share (£414.2m) compared to 114.6p per share as at 31 December 2016 (£334.9m). NAV per share increased to 127.4p (£409.3m) as at 31 December 2017, which is an 11.2% increase on the NAV per share as at 31 December 2016 of 114.6p (£334.9m).Operatingprofitbeforeexceptionalitemsin2017was£39.7m(2016:£45.2m).However,thestatutorymeasuredoesnotnowcapturethegrowthandprofitabilityofthebusinessfullyasweareconductingsomeofouractivitiesthroughjointventures(2017:£4.0m,2016: £0.6m) and, as set out below, the revaluation gains on development properties post re-categorisation (2017: £5.8m, 2016: £nil) falloutsideofthismeasure.Takingaccountofbothoftheseadditionalsourcesofvaluecreation,operatingprofitswhichcontributedtoEPRANNNAVroseby8.1%to£49.6m(2016:£45.8m)reflectingactivemanagementacrossourportfolio.WeconsiderthattheoperatingprofitswhichcontributedtoEPRANNNAVgrowthof£49.6m(2016:£45.8m)canbestbeunderstoodas being composed of two elements:• Valuegains(£47.4m;2016:£43.7m)–profitsondisposalsofinvestment,developmentandavailableforsaleproperties£10.7m
(2016: £8.8m) and revaluation gains on our property portfolio of £36.7m (2016: £34.9m). Revaluation gains comprise: revaluation movementsoninvestmentpropertyof£32.1m(2016:£33.6m),profitsfromjointventuresof£4.0m(2016:£0.6m),gainsonoverages of £0.6m (2016: £0.7m) and revaluation movements on development properties of £5.8m (2016: £nil) less a net realisable value provision of development properties of £5.8m (2016: £nil). As development properties are held as inventory, the revaluationgainisnotincludedintheBalancesheet.InsteadtherevaluationamountisverifiedbyBNPParibasandSavills,ourexternalpropertysurveyors.ProfitfromjointventuresareincludedwithinthismeasureasourjointventuresconductsimilaroperationstoHarworth,albeitindifferentownershipstructures,andtheprincipalprofitsinthejointventurestodatehavebeenfrom revaluation gains; and
• Profitexcludingvaluegains(£2.2m;2016:£2.2m)–thisshowstheongoingprofitabilityofthebusinesswhichisnotreliantonpropertyvaluegainsorprofitsfromthesalesofpropertiesandisthereforelesssusceptibletomovementsinthepropertycycle.Profitexcludingvaluegainsroseby1.2%in2017.
Thegraphbelowshowsthegaininnetassetvalue,acrossthedifferentmeasures,over2017:
95p
100p
105p
110p
115p
120p
125p
130p
135p
Closing NAV/ EPRA NNNAV/
EPRA NAV
Tax/ Interest rate Swap
DividendsOther (Pensions, EBT, Current Tax)
Interest and finance costs
Value GainsProfit excluding Value Gains
Capital Raise
Opening NAV/ EPRA NAV
114.6p 127.4p
5.2p
0.8p
(1.9)p 13.0p
1.8p
(0.7)p (0.1)p (0.8)p (0.3)p
(2.5)p1.5p
2.1p
Earnings per share rose by 15.4% to 15.8p (2016: 13.7p(1))reflectingtheprogressinprofitsaswellastherecognitionofpreviouslyunrecognised deferred tax assets following greater certainty of their recoverability. The total dividend per share for 2017 rose by 10% to0.828p(2016:0.753p)reflectingthelong-runambitiontodeliverthroughthecycledouble-digitgrowthinEPRANNNAV.Netdebtat£32.3mor7.0%netloantovalue(2016:£39.5mand9.9%)reflectsHarworth’scontinuingprudentgearingpolicy.In February 2018, the Group extended the term of its £75.0m revolving credit facility with RBS, such that it now ends in February 2023.
Note: (1) The2016EPShasbeenrestatedfollowingdiscussionswiththeFinancialReportingCouncilandtheirreviewofthe2016FinancialStatements,whichdidnotcorrectlyreflecttheeffectoftheMay
2016 1 for 10 share consolidation on EPS.

Harworth Group plc Annual Report and Financial Statements 2017 29
STRATEGIC REPORTCORPORATE GOVERNANCE
FINANCIAL STATEMENTS
Business model and property categorisationHarworthhasbecomemorefirmlyestablishedinrecentyears,particularlyasaresultoftheeffectivere-listinginMarch2015andthedevelopment of a successful track record. At the same time, our business model has matured and evolved, notably with moves into adjacent activities such as direct development and forward funding deals. As a consequence, following the capital raise in March 2017, which was to accelerate the acquisition of strategic land for development, we reviewed our most advanced and active sites and re-categorisedcertainpropertiestoreflecttheintentionsforthesites.ThemajorityofWaverley,LogisticsNorthandPrinceofWaleswere re-categorised as development sites and as such are now disclosed within inventory. Development sites are held on the Balance sheet at cost rather than fair/market value, albeit at the point of re-categorisation the property is transferred at fair value. The Balance sheet value of these three development sites at the point of re-categorisation was £77.7m. FollowingfurtherevolutionofHarworth’sbusinessmodelduring2017,wehaverefinedourthinkinginthelightofsiteandmarketopportunities, and concluded that it is appropriate, on the whole, to re-categorise all properties which have received planning permission as development properties. For until sites receive planning permission, our view is that the land is held for a currently undetermined future use and should thus be held as investment property. The only site within Major Developments that has not been re-categorised as a development property is Lounge in Leicestershire for which its future use is undetermined as a result of the proposed HS2 Phase 2b route.Property categorisation is reviewed as at 30 June and 31 December each year. Following the 2017 year-end review, a further £151.4m has been re-categorised from investment property. The Balance sheet value of all development sites as at 31 December 2017was£210.5m(reflectingsalesanddevelopmentexpenditureatthethreesitesre-categorisedinthefirsthalf).Themarketvalueofalldevelopmentsitesasat31December2017was£216.3mreflectingthe£5.8mupliftinvalueofthesesites,whichisappropriatelynotreflectedintheBalancesheet.Inordertohighlightthemarketvalueofdevelopmentsitesandbeconsistentwithour investment properties, we are using EPRA NNNAV, which includes the market value of development properties, less notional deferred tax, as our primary metric. We will continue to report EPRA NAV which is EPRA NNNAV excluding deferred tax and the marktomarketmovementonfinancialinstruments.
Furthersignificantprogresswasmadeacross the business in 2017, which resulted in another year of double digit growth in EPRA NNNAV.
ANDREW KIRKMAN – FINANCE DIRECTOR

30 Harworth Group plc Annual Report and Financial Statements 2017
Financial ReviewContinued
The table below sets out our top ten sites by value, split by their categorisation, and showing the total acres, residential plots and commercial space:
Housing plots Commercial spaceSite Type Total Acres Consented Sold Built Consented Built
Waverley Development 454 3,890 1,218 800 – –Coalville Development 346 2,016 0 0 – –Rossington Development 334 1,200 170 100 0.1m sq. ft 0 sq. ftLounge Investment 103 – – – 0.8m sq. ft 0 sq. ftWaverley (AMP) Investment 115 – – – 2.1m sq. ft 1.2m sq. ftAsfordby Investment 141 – – – 0.3m sq. ft 0.3m sq. ftGateway 36 Investment 430 – – – 0.2m sq. ft 0.2m sq. ftHarworth Development 440 996 118 118 0.8m sq. ft 0 sq. ftWalton Summit Investment 19 – – – 0.3m sq. ft 0.3m sq. ftThoresby Development 460 800 0 0 0.3m sq. ft 0 sq. ft
TOTAL 2,842 8,902 1,506 1,018 4.9m sq. ft 2.0m sq. ft
March 2017 equity placingFollowing the publication of our preliminary results on 6 March 2017, we successfully undertook an equity placing that raised £27.1m (net of expenses). This involved placing 29,226,974 Ordinary Shares (representing 9.9% of Harworth’s share capital prior to the placing) at a price of 95.0 pence per share (representing a discount of approximately 1.6% to the closing mid-market price of Harworth’s shares on the day before the announcement of the placing) to accelerate the continued expansion of our strategic land bank.During2017,wehaveinvestedalloftheproceedsfromtheequityplacinginfiveacquisitionsat:ChatterleyValleynearStoke;CoalvilleinLeicestershire;WingatesnearBolton;astrategicsitenearDoncaster;andaDHLdepotinDroitwich.Thefirstthreesites were all adjacent to existing Harworth properties. The total consideration including costs was £26.0m with additional spend expected on these sites during 2018 for planning and initial development expenditure.
Operating profitRevenues in 2017 were £53.7m (2016: £33.7m) split between revenue from operations £23.9m (2016: £33.7m) and revenue from the disposal of development properties £29.8m (2016: £nil). Revenue from operations is split between: Income Generation £18.2m (2016:£17.4m),whererevenuemainlycomprisesrentalandroyaltyincometogetherwithsomesalesofcoalfinesandsalvage;andCapitalGrowth£5.7m(2016:£16.3m).TheincreaseinrevenuefromIncomeGenerationreflectedimprovedlettingsandbusinessspaceacquisitionsmadeinlate2016andin2017.ThereductioninrevenuefromCapitalGrowthreflectedthecompletioninDecember2016ofthetwounitsatLogisticsNorthwhichwereforwardfundedbyM&GRealEstate.Therevenuein2017reflectedamounts received on completion of the work including a promote fee on the letting of the larger 225,000 sq. ft unit to Whistl in January 2017. The smaller 175,000 sq. ft unit continues to be actively marketed on behalf of M&G Real Estate.Revenue and cost of sales include amounts for the M&G Real Estate forward funding contract at Logistics North as Harworth acted as principal in this transaction. This principal relationship was as a result of Harworth having exposure to potential construction and credit risks as well as the potential rewards of managing the construction on time and to budget, and letting the buildings favourably and early. Cost of sales now comprises three elements being: sales of development properties; operating costs for business space, natural resources,agriculturallandandcoalfinesactivities;andcostsinrelationtotheM&GRealEstatecontractfortheconstructionandlettingofunits.Costofsalesincreasedto£37.7m(2016:£20.9m)includingsomelargemovementsbeingthefirst-timerecognitionofsales of development property of £27.9m (2016: £nil) and a reduction in costs associated with the M&G Real Estate contract to £3.7m (2016: £15.6m).
Financial ReviewContinued
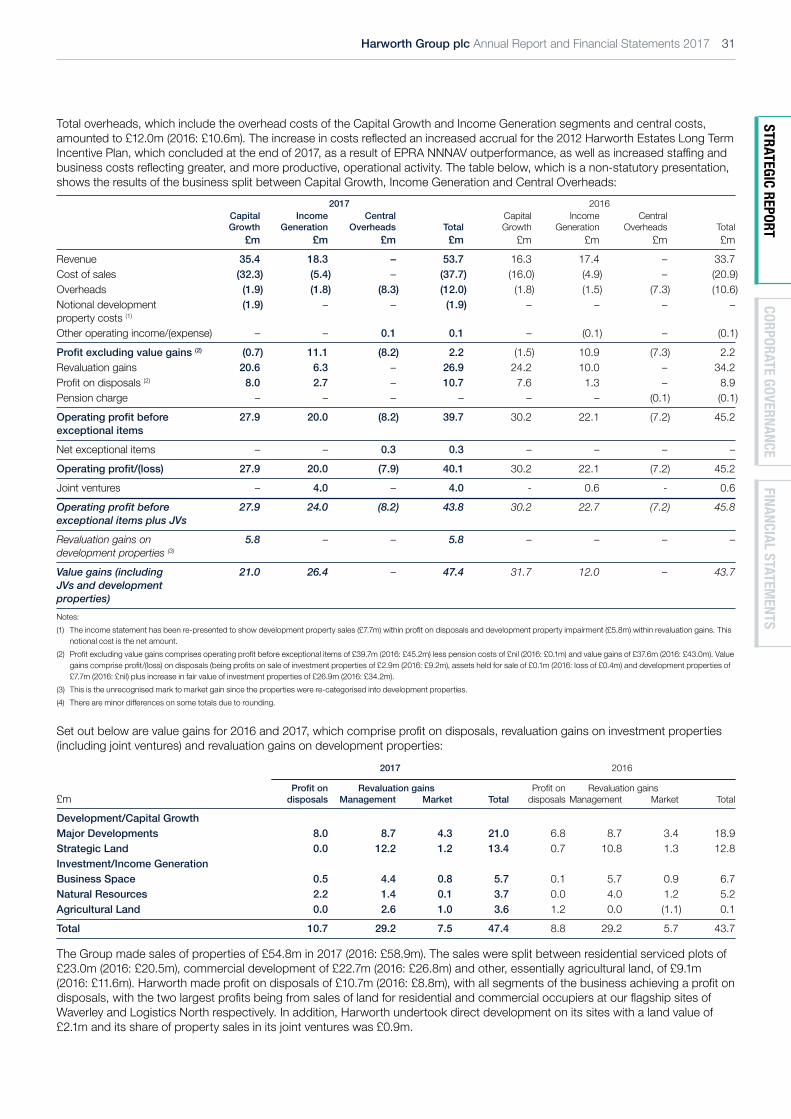
Harworth Group plc Annual Report and Financial Statements 2017 31
STRATEGIC REPORTCORPORATE GOVERNANCE
FINANCIAL STATEMENTS
Total overheads, which include the overhead costs of the Capital Growth and Income Generation segments and central costs, amountedto£12.0m(2016:£10.6m).Theincreaseincostsreflectedanincreasedaccrualforthe2012HarworthEstatesLongTermIncentivePlan,whichconcludedattheendof2017,asaresultofEPRANNNAVoutperformance,aswellasincreasedstaffingandbusinesscostsreflectinggreater,andmoreproductive,operationalactivity.Thetablebelow,whichisanon-statutorypresentation,shows the results of the business split between Capital Growth, Income Generation and Central Overheads:
2017 2016Capital Growth
Income Generation
Central Overheads Total
Capital Growth
Income Generation
Central Overheads Total
£m £m £m £m £m £m £m £m
Revenue 35.4 18.3 – 53.7 16.3 17.4 – 33.7Cost of sales (32.3) (5.4) – (37.7) (16.0) (4.9) – (20.9) Overheads (1.9) (1.8) (8.3) (12.0) (1.8) (1.5) (7.3) (10.6) Notional development property costs (1)
(1.9) – – (1.9) – – – –
Other operating income/(expense) – – 0.1 0.1 – (0.1) – (0.1)
Profit excluding value gains (2) (0.7) 11.1 (8.2) 2.2 (1.5) 10.9 (7.3) 2.2Revaluation gains 20.6 6.3 – 26.9 24.2 10.0 – 34.2Profitondisposals(2) 8.0 2.7 – 10.7 7.6 1.3 – 8.9Pension charge – – – – – – (0.1) (0.1)
Operating profit before exceptional items
27.9 20.0 (8.2) 39.7 30.2 22.1 (7.2) 45.2
Net exceptional items – – 0.3 0.3 – – – –
Operating profit/(loss) 27.9 20.0 (7.9) 40.1 30.2 22.1 (7.2) 45.2
Joint ventures – 4.0 – 4.0 - 0.6 - 0.6
Operating profit before exceptional items plus JVs
27.9 24.0 (8.2) 43.8 30.2 22.7 (7.2) 45.8
Revaluation gains on development properties (3)
5.8 – – 5.8 – – – –
Value gains (including JVs and development properties)
21.0 26.4 – 47.4 31.7 12.0 – 43.7
Notes: (1) Theincomestatementhasbeenre-presentedtoshowdevelopmentpropertysales(£7.7m)withinprofitondisposalsanddevelopmentpropertyimpairment(£5.8m)withinrevaluationgains.This
notional cost is the net amount.(2) Profitexcludingvaluegainscomprisesoperatingprofitbeforeexceptionalitemsof£39.7m(2016:£45.2m)lesspensioncostsof£nil(2016:£0.1m)andvaluegainsof£37.6m(2016:£43.0m).Value
gainscompriseprofit/(loss)ondisposals(beingprofitsonsaleofinvestmentpropertiesof£2.9m(2016:£9.2m),assetsheldforsaleof£0.1m(2016:lossof£0.4m)anddevelopmentpropertiesof£7.7m (2016: £nil) plus increase in fair value of investment properties of £26.9m (2016: £34.2m).
(3) This is the unrecognised mark to market gain since the properties were re-categorised into development properties.(4) Thereareminordifferencesonsometotalsduetorounding.
Setoutbelowarevaluegainsfor2016and2017,whichcompriseprofitondisposals,revaluationgainsoninvestmentproperties(including joint ventures) and revaluation gains on development properties:
2017 2016
£mProfit on
disposalsRevaluation gains Profiton
disposalsRevaluation gains
Management Market Total Management Market Total
Development/Capital GrowthMajor Developments 8.0 8.7 4.3 21.0 6.8 8.7 3.4 18.9Strategic Land 0.0 12.2 1.2 13.4 0.7 10.8 1.3 12.8Investment/Income GenerationBusiness Space 0.5 4.4 0.8 5.7 0.1 5.7 0.9 6.7Natural Resources 2.2 1.4 0.1 3.7 0.0 4.0 1.2 5.2Agricultural Land 0.0 2.6 1.0 3.6 1.2 0.0 (1.1) 0.1
Total 10.7 29.2 7.5 47.4 8.8 29.2 5.7 43.7
The Group made sales of properties of £54.8m in 2017 (2016: £58.9m). The sales were split between residential serviced plots of £23.0m (2016: £20.5m), commercial development of £22.7m (2016: £26.8m) and other, essentially agricultural land, of £9.1m (2016:£11.6m).Harworthmadeprofitondisposalsof£10.7m(2016:£8.8m),withallsegmentsofthebusinessachievingaprofitondisposals,withthetwolargestprofitsbeingfromsalesoflandforresidentialandcommercialoccupiersatourflagshipsitesofWaverley and Logistics North respectively. In addition, Harworth undertook direct development on its sites with a land value of £2.1m and its share of property sales in its joint ventures was £0.9m.

32 Harworth Group plc Annual Report and Financial Statements 2017
Financial ReviewContinued
Cashproceedsfromsaleswere£46.6m(2016:£53.4m)reflectingthesalesintheyearof£54.8m(2016:£58.9m)lessdeferredconsideration on sales in the year of £14.3m (2016: £10.9m) plus deferred consideration received from sales in prior year of £6.1m (2016: £5.4m).In 2017, the Group achieved revaluation gains of £36.7m (2016: £34.9m) comprising: revaluation gains from investment properties, including overages of £32.7m (2016: £34.3m), revaluation gains from joint ventures of £4.0m (2016: £0.6m), revaluation gains from development properties of £5.8m (2016: £nil) less impairment of development properties of £5.8m (2016: £nil). All of the revaluation gains for development properties relate to Major Developments sites.Wehavesplittherevaluationgainsof£36.7m(2016:£34.9m)toreflectthecontributionfromactivemanagementof£29.2m(2016: £29.2m) and market movements of £7.5m (2016: £5.7m). Whilst there is a degree of subjectivity in this split, it highlights that the majority of the value gains continue to come from active management. The principal 2017 revaluation gains across the divisions were as follows: • Major Developments – Capture of marriage value from 2017 acquisitions which adjoined existing sites (Chatterley Valley and
Coalville) together with movements at maturing developments; • Strategic Land – Outline planning consent granted at Thoresby (800 residential plots) and Kellingley (1.45m sq. ft of
commercial space);• BusinessSpace–Increasesfromdirectdevelopmentlettingsandprogressatrecentacquisitionsoffsetbysomeageing
assets;• NaturalResources–Profitablesalesforfutureenergyschemesandgainsfromassetmanagementoffsetbydeclinesinfixed
life assets; and• Agricultural Land – Aftercare and restoration advances at former surface mines.
Exceptional itemsExceptional items in 2017 comprised three separate items which, as before, relate to sundry receipts and costs from the Group’s legacy activities. The total amounts in 2017 were a credit of £0.3m (2016: £nil).
TaxationThe income statement credit for taxation in the year was £7.8m (2016: £3.6m charge) which comprised a deferred tax credit of £9.3m (2016: £3.6m charge) and a current year tax charge of £1.5m (2016: £nil). The movement in deferred tax comprised the following:• a £5.9m credit due to the execution of a contract which resulted in increased certainty that the losses would not be lost;• a number of chargeable gains and losses have crystallised in the period as a result of a number of disposals of investment
property and the categorisation of properties from investment property to development property. These gains have been offsetagainsttaxlossesthatwerepreviouslynotrecognisedfromadeferredtaxperspective.Thelossescrystallisedhavebeen recognised whereas inherent capital losses have not. As such, there has been a credit to deferred tax of £13.2m;
• the increase in valuation of the investment properties in the period together with the impact of indexation on the inherent gains in the investment property portfolio for the period, along with some other smaller movements in deferred tax items, have given rise to a £5.9m deferred tax charge in the period; and
• following the submission of the tax computations and returns for prior periods, the Group utilised tax attributes resulting in a deferred tax charge of £3.9m.
The current tax charge comprised the following:• acurrentyeartaxchargeof£1.9m(2016:£nil)resultingfromprofitsonsalesofdevelopmentproperties;and• a land remediation relief tax credit of £0.3m (2016: £nil).The Group is still utilising brought forward tax losses but as a result of categorising sites from investment to development, Harworth has started to pay tax on development property sales. In the current period, in terms of cash tax paid or received, Harworth received cash in respect of the land remediation relief claim and recovery of VAT on deal fees of £0.3m (2016: £nil).At 31 December 2017, the Group had deferred tax liabilities of £13.0m (2016: £23.4m), related to unrealised gains on investment properties and had recognised deferred tax assets of £7.5m (2016: £8.5m). The net deferred tax liability was £5.5m (2016: £14.9m). Full details of the movements in tax are set out in note 9. Duetorecentchangesintaxlegislation,thereismuchgreaterflexibilityintheutilisationoftaxlossesarisingafter1April2017.However,theselosses,andthoselossesaccruedhistoricallyaresubjecttoa50%restriction.WhilsttheGrouphasasignificantlevel of accrued tax losses, these are in the form of capital losses which fall outside of these rules. As such, these rules are likely tohavealimitedimpactonthegroup’staxprofilegoingforward.

Harworth Group plc Annual Report and Financial Statements 2017 33
STRATEGIC REPORTCORPORATE GOVERNANCE
FINANCIAL STATEMENTS
Recent legislation has aligned the computation of capital gains on disposals of properties between individuals and corporates by removingthebenefittocorporatesofindexation.Thiswillhavetheimpactofincreasingthetaxliabilitiesinfutureperiods.
Earnings per share and dividendsEarnings per share increased to 15.76p (2016: 13.65p) and underlying earnings per share, excluding exceptional items, increased to15.65p(2016:13.65p).Theseincreasesreflectthepositiveprogressmadeintheyearwithrespecttoprofitsandtax.The2016EPS has been restated following discussions with the Financial Reporting Council and their review of the 2016 Financial Statements,whichdidnotcorrectlyreflecttheeffectoftheMay1for10shareconsolidationonEPS.Aninterimdividendof0.253ppershare(2016interim:0.230p)equivalentto£813k(2016interim:£672k)forthe2017financialyearwaspaidon13October2017.Afinaldividendforthe2017financialyearof0.575ppershare(2016final:0.523p)isproposed.Thetotal dividend for the year of 0.828p per share (2016: 0.753p) is in line with our progressive dividend policy and represents a 10% increaseovertheprioryear,reflectingongoinggrowthandconfidenceinthebusiness.Thetotaldividendof£2.7m(2016:£2.2m)is due to the 10% growth in the dividend and the c.10% increase in the number of shares following the March 2017 equity capital raise.Thefinaldividendwillbepaidon1June2018toshareholdersontheregisteratthecloseofbusinesson4May2018.Theex-dividend date will be 3 May 2018.
Net assetsAs set out below, NAV increased to £409.3m as at 31 December 2017 from £334.9m as at 31 December 2016. This increase wasasaresultofmovementsintheyear,beingoperatingprofitbeforeexceptionalsplusjointventuresof£43.8m,theMarch2017equity capital raise of £27.1m, a tax credit of £7.8m, less interest costs of £2.3m and dividends of £2.7m plus other movements of £0.7m.
31 December 2017
£m
31 December 2016
£m
Investment and development properties (including investments in joint ventures, assets held for sale, overages and occupied properties)
457.1 400.3
Cash 8.4 13.0Other assets 31.5 25.2
Total assets 497.0 438.5Gross borrowings 40.6 52.5Deferred tax liability 5.5 14.9Derivativefinancialinstruments 0.1 0.4Other liabilities 41.5 35.8
Net assets 409.3 334.9
Number of shares in issue 321,250,750 292,269,786
Net assets per share 127.4p 114.6p
EPRA NNNAV per share (1) 128.9p 114.6p
EPRA NAV per share (2) 131.0p 119.8p
Notes: (1) NAV (£409.3m; 2016: £334.9m) plus market value of development properties (£5.8m; 2016: £nil) less notional deferred tax (£1.0m; 2016: £nil) divided by number of shares in issue(2) EPRA NNNAV (£414.2m; 2016: £350.1m) excluding deferred tax liability (£5.5m; 2016: £14.9m), notional deferred tax on development properties (£1.0m; 2016: £nil) and mark to market movement
onfinancialinstruments(£0.1m;2016:£0.4m)dividedbynumberofsharesinissue
Financing strategy and fundingHarworth’sfinancingstrategyistobeprudentlygearedaswebelievethatthisgivestheGroupanumberofadvantages:• allows working capital swings to be managed appropriately given that infrastructure spend is usually in advance of sales and
thus net debt can increase by over £30m during the year;• givestheGrouptheabilitytocompleteacquisitionsquickly,whichisoftenadifferentiatingfactorinacompetitivesituation;• ensuresthatwedonotcombinefinancialgearingwithHarworth’sexistingoperationalgearing.Suchoperationalgearingisthe
appropriate levels of exposure we take in terms of planning, remediation/engineering, letting and sales risks; and• higher gearing levels are not easily supported by Harworth’s existing activities – we do not gear our Capital Growth properties
being our Strategic Land and Major Developments’ sites.
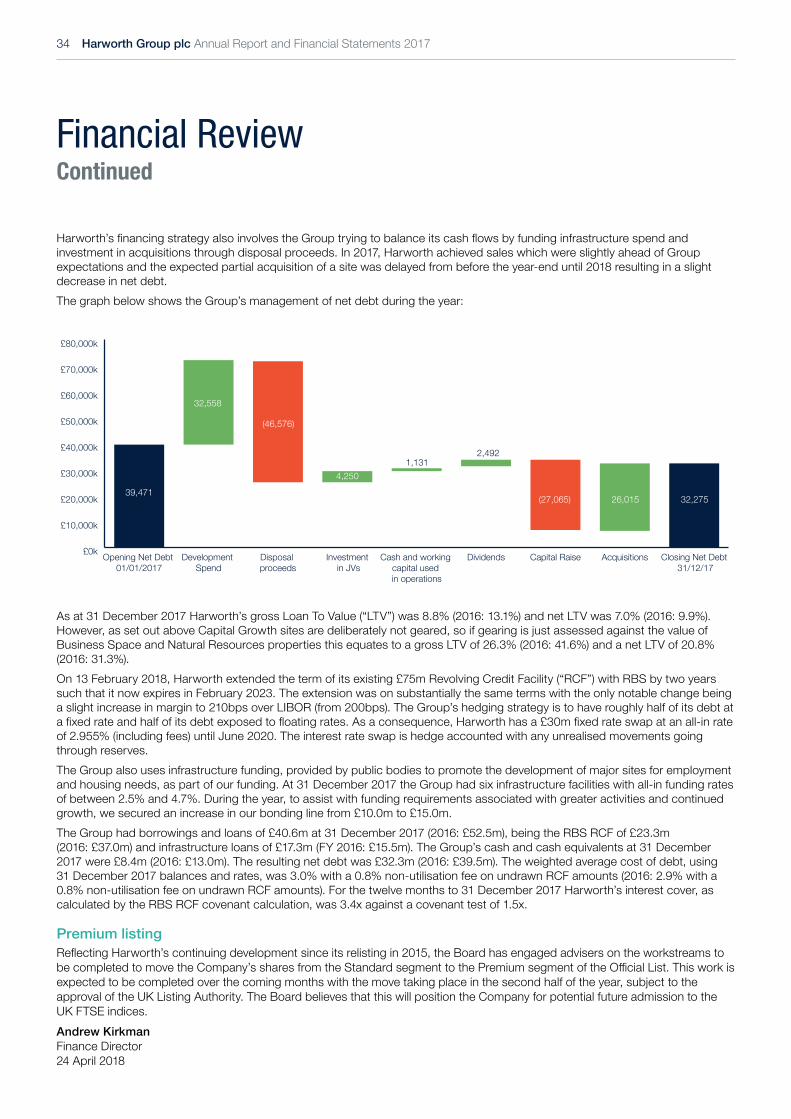
34 Harworth Group plc Annual Report and Financial Statements 2017
Financial ReviewContinued
Harworth’sfinancingstrategyalsoinvolvestheGrouptryingtobalanceitscashflowsbyfundinginfrastructurespendandinvestment in acquisitions through disposal proceeds. In 2017, Harworth achieved sales which were slightly ahead of Group expectations and the expected partial acquisition of a site was delayed from before the year-end until 2018 resulting in a slight decrease in net debt.The graph below shows the Group’s management of net debt during the year:
£0k
£10,000k
£20,000k
£30,000k
£40,000k
£50,000k
£60,000k
£70,000k
£80,000k
Closing Net Debt 31/12/17
AcquisitionsCapital RaiseDividendsCash and working capital used in operations
Investment in JVs
Disposal proceeds
Development Spend
Opening Net Debt 01/01/2017
39,471
32,558
(46,576)
4,2501,131
2,492
(27,065) 32,27526,015
As at 31 December 2017 Harworth’s gross Loan To Value (“LTV”) was 8.8% (2016: 13.1%) and net LTV was 7.0% (2016: 9.9%). However, as set out above Capital Growth sites are deliberately not geared, so if gearing is just assessed against the value of Business Space and Natural Resources properties this equates to a gross LTV of 26.3% (2016: 41.6%) and a net LTV of 20.8% (2016: 31.3%).On 13 February 2018, Harworth extended the term of its existing £75m Revolving Credit Facility (“RCF”) with RBS by two years such that it now expires in February 2023. The extension was on substantially the same terms with the only notable change being a slight increase in margin to 210bps over LIBOR (from 200bps). The Group’s hedging strategy is to have roughly half of its debt at afixedrateandhalfofitsdebtexposedtofloatingrates.Asaconsequence,Harworthhasa£30mfixedrateswapatanall-inrateof 2.955% (including fees) until June 2020. The interest rate swap is hedge accounted with any unrealised movements going through reserves. The Group also uses infrastructure funding, provided by public bodies to promote the development of major sites for employment and housing needs, as part of our funding. At 31 December 2017 the Group had six infrastructure facilities with all-in funding rates of between 2.5% and 4.7%. During the year, to assist with funding requirements associated with greater activities and continued growth, we secured an increase in our bonding line from £10.0m to £15.0m.The Group had borrowings and loans of £40.6m at 31 December 2017 (2016: £52.5m), being the RBS RCF of £23.3m (2016: £37.0m) and infrastructure loans of £17.3m (FY 2016: £15.5m). The Group’s cash and cash equivalents at 31 December 2017 were £8.4m (2016: £13.0m). The resulting net debt was £32.3m (2016: £39.5m). The weighted average cost of debt, using 31 December 2017 balances and rates, was 3.0% with a 0.8% non-utilisation fee on undrawn RCF amounts (2016: 2.9% with a 0.8% non-utilisation fee on undrawn RCF amounts). For the twelve months to 31 December 2017 Harworth’s interest cover, as calculated by the RBS RCF covenant calculation, was 3.4x against a covenant test of 1.5x.
Premium listingReflectingHarworth’scontinuingdevelopmentsinceitsrelistingin2015,theBoardhasengagedadvisersontheworkstreamstobecompletedtomovetheCompany’ssharesfromtheStandardsegmenttothePremiumsegmentoftheOfficialList.Thisworkisexpected to be completed over the coming months with the move taking place in the second half of the year, subject to the approvaloftheUKListingAuthority.TheBoardbelievesthatthiswillpositiontheCompanyforpotentialfutureadmissiontotheUKFTSEindices.Andrew Kirkman Finance Director 24 April 2018

Harworth Group plc Annual Report and Financial Statements 2017 35
STRATEGIC REPORTCORPORATE GOVERNANCE
FINANCIAL STATEMENTS
Harworth’s Finance Team, March 2018

36 Harworth Group plc Annual Report and Financial Statements 2017
Managing Risk
Managing Risk
The Board has ultimate responsibility for determining the risk appetite of the Group and for the implementation and regular review of policies, processes and controls to mitigate and manage risk. The Board recognises that not all risks can be eliminated at an acceptable cost and that there are some risks which, given the nature of the Group’s business and the growing track record and experience of the team, it is prepared to accept. The Board also acknowledges that the Group’s insurance programme plays an important part in mitigating the impact of certain inherent risks which are neither acceptable nor capable of removal.Following the Company’s acquisition of Harworth Estates in March 2015, the Group undertook a review of its principal risks and uncertainties which led to the development of a Group Risk Register.During 2017, as part of its ongoing continual improvement programme, the Group undertook another detailed review of its principal risks and uncertainties, including those that would threaten its strategic priorities, business model, future performance, solvency or liquidity. This review was led by our Company Secretary in conjunction with the Board, the Audit Committee, the Executive Committee and the Senior Management Team. The Group’s current risk profile was mapped, with individual risks grouped into eight new categories, being: (R1) markets; (R2) delivery; (R3) politics; (R4) finance; (R5) people; (R6) legal and regulatory; (R7) governance and internal controls; and (R8) communications and stakeholder management. Risks were scored on a “heat map”, from “very low” to “very high”, according to residual risk status (after accounting for mitigation measures already in place), materiality and anticipated movement in risk over the next 12 months. This has led to further refinement of the Group’s Risk Register. This detailed review has confirmed that there has been no material change in the Group’s overall risk profile since publication of the 2016 Annual Report and the profile remains in line with the Board’s risk appetite, with all categories scored as either medium or low risk at the date of this report.
5 Severe 5 10 15 20 25
4 Major 4 8 12 16 20
3 Material 3 6 9 12 15
2 Minor 2 4 6 8 10
1 Insignificant 1 2 3 4 5
LIKELIHOOD1 Highly unlikely
<15%2 Unlikely15-35%
3 Possible36-65%
4 Likely66-85%
5 Highly likely>85%
R2
R6 R8
R4 R7
R5
R1R3
Overall residual risk status (after mitigation)*
Very low 1-2
Low 3-5
Medium 6-10
High 11-16
Very high 20-25
Anticipated movement in risk profile in next 12 months
Increasing
Unchanged
Decreasing
* Impact risk scoring determined by one or more of Balance sheet, P&L or reputational inputs
IMPA
CT

Harworth Group plc Annual Report and Financial Statements 2017 37
STRATEGIC REPORTCORPORATE GOVERNANCE
FINANCIAL STATEMENTS
Going forward, the Board will review its risk appetite and the overall risk profile of the business annually, in conjunction with its review of strategy, to ensure that appetite and profile continue to align.The Board has delegated to the Audit Committee responsibility for periodic, detailed review of the Group Risk Register and the Group’s internal control systems and procedures. The Audit Committee carries out an interim review of the Group Risk Register in June and a full review in November each year. The Executive Committee has ultimate responsibility on a day-to-day basis for the Group’s risk profile, the implementation of, and adherence to, risk management controls and procedures, and for monitoring the continued effectiveness of the same. This includes a six-monthly formal review following which recommendations are made to inform the Audit Committee’s interim and full-year reviews. The Group operates predominantly from a single office in Rotherham, with a relatively small team and short reporting lines. As such, members of the Executive Committee are closely involved in day-to-day operations and so are often able to identify new and changing risks and respond in a timely manner. The Executive Committee is also informed by regular feedback from its experienced Senior Management Team on existing and new operational risks, and the effectiveness of our internal controls and procedures. Our Company Secretary facilitates the process by which feedback is taken from the Senior Management Team, shared with the Executive Committee and acted upon.Finally, alongside the Group Risk Register, our Estates, Environment and Safety (“EES”) team maintains a site risk register, which continuously monitors the risk status of each of our sites. Material changes in the risk status of our sites are reported to the Board on a monthly basis and incorporated into the periodic reviews of the Group Risk Register.
Key risk management initiatives since the publication of the 2016 Annual Report• A further, detailed review of the Board’s risk appetite and the Group’s risk profile leading to refinements to the Group Risk Register.• A further review of the Group’s insurance programme for the 2018 renewal, leading to a change of property and liability insurer, cover
enhancements and material premium savings.• An external review engagement was performed by KPMG LLP (“KPMG”) of selected internal financial controls and of the need for an internal audit
function.• Implementation of: Anti-corruption and Bribery policy, a new business development approvals process and register; and an Anti-facilitation of tax
evasion policy. Key risk management initiatives identified for implementation and/or progress in 2018• An external audit of cyber-security resilience and business continuity plan and procedures (second half of 2018).• Completion of active workstreams to ensure the Group is GDPR compliant before 25 May 2018 (first half of 2018).• External review and refinement of our whistleblowing policy and procedures (first half of 2018).• Mandatory training for employees on management of the following issues: modern slavery, bribery and corruption; facilitation of tax evasion and
GDPR (first half of 2018).• Notification to our existing suppliers of our Supplier Code of Conduct on modern slavery and human trafficking (ongoing).
Board: Ultimate responsibility for risk appetite and management;
annual review of risk appetite and profile, in conjunction with
strategy review
Audit Committee: Interim and full review of Group Risk Register every six months;
delegated responsibility for monitoring internal controls and processes, including overseeing
periodic, external audit ofcontrols and the need for an
internal audit function
Senior Management Team: Implementation of internal
controls and processes; review of operational risks with (and
feedback to) Company Secretary, to inform
Executive Committee and Audit Committee review of Group Risk Register
EES: Regular site visits and
maintenance of site risk register, material changes to which are reported to the Board monthly and are incorporated in reviews
of the Group Risk Register
Executive Committee: responsible for monitoring day-to-day risk profile and
ensuring implementation of, adherence to, and effectiveness
of, internal controls and processes; detailed review of Group Risk
Register every six months with recommendation to
the Audit Committee

38 Harworth Group plc Annual Report and Financial Statements 2017
Managing RiskContinued
Principal risks and uncertaintiesThe tables below set out the Group’s principal risks and uncertainties, reflecting the detailed review and evolution of the Group Risk Register referred to on page 36. Each risk category has a current risk status, reflecting residual risk after accounting for mitigation measures already in place. Some of those measures are listed, together with (where applicable) any further measures we have identified for implementation over the next 12 months. The Group is subject to both external and internal risk factors which could have a material effect, both positive and negative, on the operation and performance of the business. External factors, which are largely outside of the Group’s control, include macro-economic and political factors. As negotiations continue for the UK’s withdrawal from the EU, the Board expects that the Group will continue to operate in an uncertain economic and political climate in the short to medium term. Whilst the Group is not immune to that uncertainty, it is mitigated by the positive economic and consumer trends in our core markets, with the residential, logistics and manufacturing sectors in the North of England and the Midlands continuing to have solid fundamentals and favourable performance.
KeyCurrent risk profile
Very Low Low Medium High Very High
Our estimate of the current level of risk taking account of controls and mitigation already in place. Risk is difficult to estimate with accuracy and so may be more or less than indicated.
Anticipated movement in risk profile in next 12 months
Increasing Unchanged Decreasing
Current assessment of anticipated movement in risk
Link to Strategy
Link to Strategic Priorities
Development Investment Sectors Regions Acquisitions Gearing
Summary of the Group’s Risk Profile
Risk categories Markets (R1) Delivery (R2) Politics (R3) Finance (R4) People (R5) Legal + Reg’tory (R6)
Governance + Controls (R7)
Communications + S’h M’mnt (R8)
Risk appetite
Risk profile
Expected change
Note: based on the detailed review of risk appetite and risk profile undertaken by the Board and referred to on page 36.
Managing RiskContinued
Turn to page 2 to read about Our strategy

Harworth Group plc Annual Report and Financial Statements 2017 39
STRATEGIC REPORTCORPORATE GOVERNANCE
FINANCIAL STATEMENTS
R1. Markets Exposure to largely external factors
Commentary: A downturn in one or more of the property markets in which we operate, being the residential, logistics and manufacturing sectors in the North of England and the Midlands, could: limit value gains across our portfolio or, in extreme cases, cause parts of our portfolio to drop in value; restrict the number of planned sales we make; and/or result in underperformance by our Income Generation assets. Those adverse consequences could be exacerbated if our strategy does not evolve to respond to changes in our core markets.
Current risk status: Strategic priorities potentially impacted: Anticipated movement in risk:
Mitigation and controls already in place:• The diversity of our portfolio (sectors and geography) mitigates against a downturn in one of our core markets. Our core
regional markets are typically less volatile than the London and South East markets. The Income Generation portfolio includes a diversity of income streams which has a similarly mitigating effect.
• Value gains are generally driven more by active management than market movements.• We build headroom into our sales forecasts by identifying potential alternative sales in the event that planned sales do not
proceed as quickly as anticipated. • We can control our working capital movements by managing acquisitions and development spend to respond to market
movements. Our cash flow forecasts also provide for a minimum £5m “buffer” throughout the year. • The Executive Committee monitors, and updates the Board on, prevailing market conditions continuously and keeps the
strategy under review, to ensure that it evolves with market movements.
Further actions to be taken to mitigate and manage risk:• We are taking steps to widen our geographical footprint, to mitigate against market movements at a regional level.• Our development plans and projected sales will inform our strategy on acquisitions and masterplans, to ensure we maintain
a balanced mix of commercial and residential sites across our portfolio.• We will continue to grow and strengthen our recurring income portfolio, through acquisitions, asset management and
targeted direct development, to further improve the sustainability of the business during periods of market downturn.

40 Harworth Group plc Annual Report and Financial Statements 2017
Managing RiskContinued
R2. Delivery Exposure to both external and internal factors
Commentary: Our ability to generate EPRA NNNAV growth and/or grow our investment returns could be adversely affected by external factors, such as: a sparsity of attractive, strategic land acquisition opportunities; adverse planning decisions; or market-driven increases in development costs, or by internal factors, such as poor operational delivery.
Current risk status: Strategic priorities potentially impacted: Anticipated movement in risk:
Mitigation and controls already in place for external factors:• Our dedicated Acquisitions team is now well-established and continues to grow, with a dedicated Technical Manager
recruited into the team during 2017. The Executive Committee regularly reviews strategic priorities and the availability of capital to ensure the team can focus its time and resources appropriately.
• Our Strategic Land team has a proven track record for promoting schemes through the planning application process. Success is achieved through careful masterplanning and preparation of applications, alongside tireless stakeholder management at a local level.
R3. Politics Largely subject to external factors
Commentary: Changes in national and/or local government policy, including planning, could impact the Group’s activities.
Current risk status: Strategic priorities potentially impacted: Anticipated movement in risk:
(1)
Mitigation and controls already in place:• The diversity of our portfolio affords a degree of mitigation to adverse political changes which could impact our markets.• We make representations on our own, alongside partners and in conjunction with key industry bodies, to minimise the
prospect of adverse policy changes being enacted.• Our Strategic Land team monitors closely the political landscape and climate at a local level where we have current or
prospective planning promotions. This informs our masterplanning and promotion strategy. • We are proactively engaging with HS2 Limited to minimise the potential impact of the proposed HS2 route on our
Gateway 45 and Lounge sites.
Further actions to be taken to mitigate and manage risk:• We will input into upcoming Government consultations on land value capture and other policy matters which could affect the
Group’s activities.
(1) The anticipated increase to risk over the next 12 months reflects: (A) Government sentiment and initiatives in relation to land value capture; and (B) the inherent uncertainty in the current political climate as the Government enters the advanced stages of negotiation on the UK’s departure from the European Union.

Harworth Group plc Annual Report and Financial Statements 2017 41
STRATEGIC REPORTCORPORATE GOVERNANCE
FINANCIAL STATEMENTS
R4. Finance Subject to both external and internal factors
Commentary: It remains our ambition to cover the Group’s operating costs, interest, tax and dividends from ongoing rental and other operating income. A shortfall in income could impair our ability to maintain activity levels to deliver EPRA NNNAV growth and investment returns during periods of market downturn. It could also result in an interest cover covenant breach on our revolving credit facility.We use debt capital, in the form of bank debt, infrastructure loans and a bonding facility, to help fund our activities. If that capital is temporarily unavailable, or only available at a materially increased cost, that could fetter our ability to grow EPRA NNNAV and/or investment returns.Gaps in our insurance programme could lead to an irrecoverable financial loss.
Current risk status: Strategic priorities potentially impacted: Anticipated movement in risk:
Mitigation and controls already in place:• We undertook an equity raise in March 2017 to fund acceleration of our acquisitions pipeline, whilst maintaining our policy of
prudent gearing. At the end of the financial year ended 31 December 2017, our Net Loan to Value was 7.0% or 20.8% when calculated against the income portfolio.
• We have extended the term of our £75m revolving credit facility with RBS to 13th February 2023 and have increased our bonding facility from £10m to £15m. We have a £30m fixed rate swap at an all-in-rate of 2.955% (including fees) until June 2020.
• Since 2014 (when we began to replenish our portfolio) we have spent £33.1m (at 31/12/17) on investment properties, acquiring £2.99m of rental income to replace wasting income assets such as our coal fines sales and coal mine methane royalties.
• We have undertaken selective direct development on certain of our sites, both solely and in joint venture, to grow our recurring income. At the date of this Report, all of our wholly owned direct developments are fully let.
• Our business model has evolved to include planning promotion, construction management, letting promotion and asset management for third parties. These generate income, although we recognise that they represent variable, rather than recurring income.
• We appointed a new insurance broker (Marsh) in 2016 and have carried out thorough reviews of our insurance programme for the 2017 and 2018 renewals, resulting in material improvements in cover.
Further actions to be taken to mitigate and manage risk:• We have earmarked funding for further income acquisitions in 2018-2020. • Given the success of our direct development activities in 2017 and the strength of occupational demand at the AMP and
Logistics North, we have commenced construction of further phases of direct development.
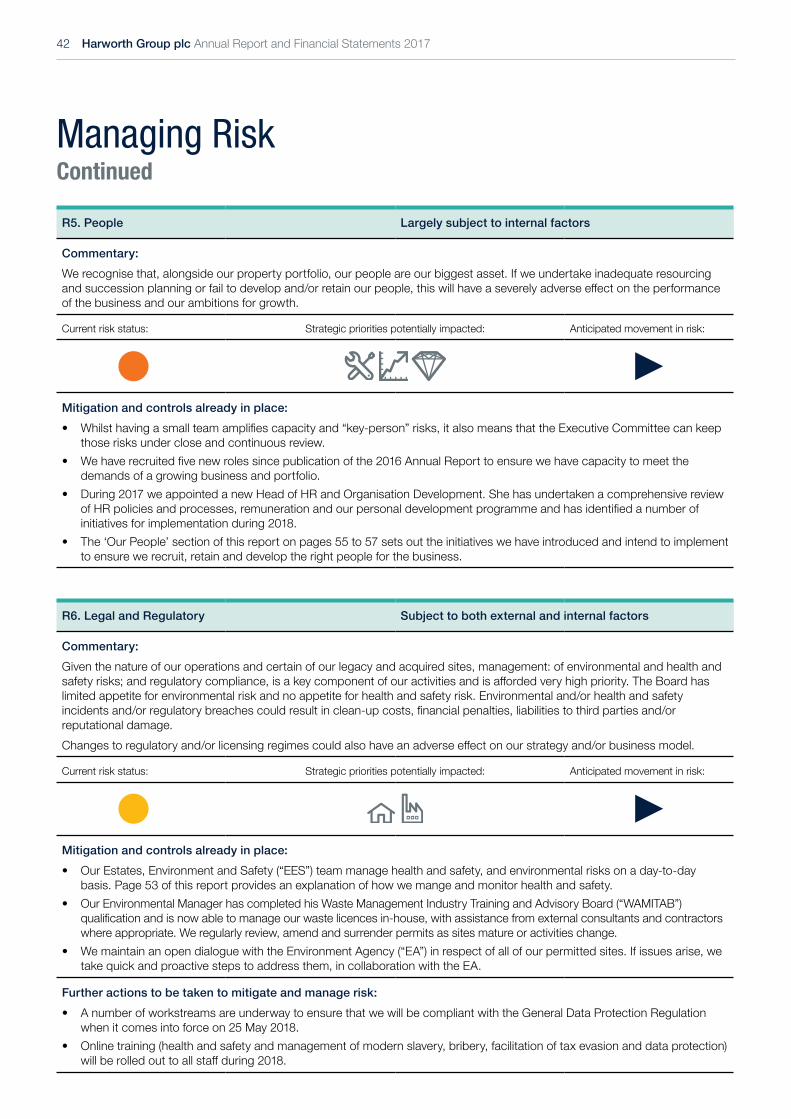
42 Harworth Group plc Annual Report and Financial Statements 2017
Managing RiskContinued
R5. People Largely subject to internal factors
Commentary: We recognise that, alongside our property portfolio, our people are our biggest asset. If we undertake inadequate resourcing and succession planning or fail to develop and/or retain our people, this will have a severely adverse effect on the performance of the business and our ambitions for growth.
Current risk status: Strategic priorities potentially impacted: Anticipated movement in risk:
Mitigation and controls already in place:• Whilst having a small team amplifies capacity and “key-person” risks, it also means that the Executive Committee can keep
those risks under close and continuous review.• We have recruited five new roles since publication of the 2016 Annual Report to ensure we have capacity to meet the
demands of a growing business and portfolio.• During 2017 we appointed a new Head of HR and Organisation Development. She has undertaken a comprehensive review
of HR policies and processes, remuneration and our personal development programme and has identified a number of initiatives for implementation during 2018.
• The ‘Our People’ section of this report on pages 55 to 57 sets out the initiatives we have introduced and intend to implement to ensure we recruit, retain and develop the right people for the business.
R6. Legal and Regulatory Subject to both external and internal factors
Commentary: Given the nature of our operations and certain of our legacy and acquired sites, management: of environmental and health and safety risks; and regulatory compliance, is a key component of our activities and is afforded very high priority. The Board has limited appetite for environmental risk and no appetite for health and safety risk. Environmental and/or health and safety incidents and/or regulatory breaches could result in clean-up costs, financial penalties, liabilities to third parties and/or reputational damage.Changes to regulatory and/or licensing regimes could also have an adverse effect on our strategy and/or business model.
Current risk status: Strategic priorities potentially impacted: Anticipated movement in risk:
Mitigation and controls already in place:• Our Estates, Environment and Safety (“EES”) team manage health and safety, and environmental risks on a day-to-day
basis. Page 53 of this report provides an explanation of how we mange and monitor health and safety.• Our Environmental Manager has completed his Waste Management Industry Training and Advisory Board (“WAMITAB”)
qualification and is now able to manage our waste licences in-house, with assistance from external consultants and contractors where appropriate. We regularly review, amend and surrender permits as sites mature or activities change.
• We maintain an open dialogue with the Environment Agency (“EA”) in respect of all of our permitted sites. If issues arise, we take quick and proactive steps to address them, in collaboration with the EA.
Further actions to be taken to mitigate and manage risk:• A number of workstreams are underway to ensure that we will be compliant with the General Data Protection Regulation
when it comes into force on 25 May 2018.• Online training (health and safety and management of modern slavery, bribery, facilitation of tax evasion and data protection)
will be rolled out to all staff during 2018.

Harworth Group plc Annual Report and Financial Statements 2017 43
STRATEGIC REPORTCORPORATE GOVERNANCE
FINANCIAL STATEMENTS
R7. Governance and Internal Controls Largely subject to internal factors
Commentary: Deficiencies in our governance measures and/or internal controls and processes (including cyber-security measures) could lead to inefficiencies, financial underperformance, or even financial loss and/or liability.
Current risk status: Strategic priorities potentially impacted: Anticipated movement in risk:
Mitigation and controls already in place:• Whilst we are a standard listed Company on the London Stock Exchange we comply with the UK Corporate Governance
Code on a comply or explain basis, with explanations for only limited instances of non-compliance in our Annual Report. The high standards of governance to which we aspire are reflected in the fact that we are in the process of applying to the UKLA to step up to a Premium Listing.
• Our revised Delegated Authorities Policy, introduced in 2016, is now well established, as are improved Board and Executive Committee processes and governance measures.
• An external review of some of our internal financial controls was undertaken by KPMG in Q4 of 2017. The results of that review were reported to the Audit Committee and recommendations for improvements are being implemented.
• We are progressing a number of active workstreams to ensure that we will be compliant with the General Data Protection Regulation when it comes into force on 25 May 2018.
• Our risk review process, which is led by our Company Secretary, includes regular meetings with the Senior Management Team at which opportunities to improve internal controls, such as the process for vetting, appointing and/or paying contractors, are identified. The Audit Committee undertakes a review of the effectiveness of internal controls and processes annually.
Further actions to be taken to mitigate and manage risk:• An external cyber-security and business interruption review will be undertaken during 2018.• Our internal controls and processes are subject to ongoing review, including external audits on an annual basis, to ensure
they remain “fit for purpose” as the business grows and delivers across more and more sites.
R8. Communications and stakeholder management Subject to both internal and external factors
Commentary: Working with a broad spectrum of stakeholders is fundamental to our business activities and performance. If we do not communicate and maintain strong relationships with them this will lead to operational underperformance and, ultimately, underperformance of our share price.
Current risk status: Strategic priorities potentially impacted: Anticipated movement in risk:
Mitigation and controls already in place:• Communications tracker maintained including bi-weekly review to ensure that our external communications remain timely and
appropriate. This tracker records, where possible, Harworth’s planned activities for the next six months.• Please see the Harworth and its stakeholders section of this report on pages 46 and 47 for an explanation of the means by
which we identify, engage with, and consider the interests of our stakeholders.

44 Harworth Group plc Annual Report and Financial Statements 2017
Business continuity assessments
The Directors have assessed the Group’s prospects, both as a going concern and in the context of its viability longer term. This assessment informs the following distinct statements:1. The Directors considered it appropriate to adopt the going concern basis of accounting in the preparation of the Company’s
and Group’s financial statements.2. The Directors have a reasonable expectation that the Company and the Group will be able to continue in operation and meet
its liabilities as they fall due over the period of their assessment.Both assessments are closely linked to the Directors’ robust assessment of the principal risks facing the Group (including those that would threaten its business model, future performance, solvency or liquidity), which is outlined on pages 36 to 43.
Going concern statementAccounting standards require that the Directors satisfy themselves that it is reasonable for them to conclude whether it is appropriate to prepare financial statements on a going concern basis. There has been no material uncertainty identified which would cast significant doubt upon the Group’s ability to continue using the going concern basis of accounting for a period of at least 12 months following the approval of this Annual Report. In assessing going concern, the Directors take into account the Group’s cash flows, solvency and liquidity positions and borrowing facilities. At year end, the Group had cash and cash equivalents of £8.4m, net debt of £32.3m and a net loan to value of 7.0%. The Group has a £75m revolving credit facility with RBS, which contains typical financial covenants and now runs until February 2023. At the year end there was headroom of £51.7m on that facility. It also had infrastructure loans totalling £17.2m. The financial position of the Group, including information on cash flow, can be found in the Financial Statements on pages 98 to 141. In determining whether there are material uncertainties, the Directors consider the Group’s business activities, together with factors that are likely to affect its future development and position (see Our strategy (pages 2 and 3), How we add value (pages 4 and 5), The markets we operate in (page 6) and the Group’s principal risks and uncertainties (pages 36 to 43).
Viability statement Viability period and rationaleIn accordance with provision C.2.2 of the Code, the Directors have assessed the prospect of the Group over a longer period than the 12 months required by the ‘Going Concern’ statement. The Board conducted this review for a period of five years ending 31 December 2022, with three years of detailed assessment and two years of outline numbers. This period was selected for the following reasons:• the Group’s strategic review covers a five-year period;• for a major scheme five years is a reasonable approximation of the time taken from obtaining planning permission and
remediating the site to letting the property and/or developing significant parts of the site; and• most leases contain a five-year rent review pattern and therefore five years allows for the forecasts to include the reversion
arising from those reviews.Key assumptions and sensitivity analysisThe five-year strategic review focuses on the expected growth of the business primarily in terms of EPRA NNNAV but also dividends. The strategic review also considers the Group’s recurring income, cash flows, covenant compliance (particularly interest cover), financing headroom and other key financial ratios over the period. These metrics are subject to sensitivity analysis which involves flexing a number of the main assumptions underlying the forecast both individually and in unison. The main assumptions relate to the forecast supply and demand dynamics for the residential and commercial property markets, and the availability of acquiring new sites. Where appropriate, analysis is carried out to evaluate the potential impact of the Group’s principal risks actually occurring. The five-year review also makes certain assumptions about the normal level of capital recycling likely to occur and considers whether additional financing facilities will be required.Principal risks and uncertaintiesThe principal risks and uncertainties that are considered relate to economic assumptions, income generation variability and appropriate staffing levels. Principally, these fall within the Markets, Delivery, Politics and People categories of risk identified on pages 36 to 43. Sensitivity analysis has been applied in terms of income generation, cash flow and EPRA NNNAV impacts, particularly from changes in value gains. These risks are fairly well balanced on the up and downside. No mitigating or remedial actions have been identified but, if needed, more cash could be generated through increased sales and/or reduced development spend and acquisitions, and, if needed, such cash could be targeted toward the acquisition of income generating properties.Viability assessmentBased on the results of this analysis, the Directors have a reasonable expectation that the Group will be able to continue in operation and meet its liabilities as they fall due over the five-year period of their assessment.
Business continuity assessments

STRATEGIC REPORTCORPORATE GOVERNANCE
FINANCIAL STATEMENTS
Harworth Group plc Annual Report and Financial Statements 2017 45
Our Operations team in action at Thoresby

Our AdvisersWe work with a select group of professional advisers who know our business extremely well. At an operational level, we work with a small legal panel and core groups of accountancy firms and property agencies. At a corporate level, we have spent time identifying advisers who are the right fit for Harworth and who have become our trusted advisers. These include our corporate legal advisers, DLA, our brokers, Canaccord and Peel Hunt, our communications advisers, FTI Consulting, our remuneration consultants, Kepler, and our insurance brokers, Marsh. Our connections are as much with individuals at those firms as the firms themselves and have been made at all levels of our respective businesses, which makes for lasting relationships. All relationships remain subject to ongoing reviews.
Our Contractors and SuppliersOn our wide range of projects we work with a preferred group of contractors and suppliers who have a track record for delivery and with whom we have built trusted relationships. With some we work under an umbrella framework agreement and with most we work to a suite of precedent documents, which makes for consistency of approach. The most important aspects of these relationships are a collaborative approach, and regular and open dialogue to ensure that there are few surprises and solutions are identified and delivered quickly where projects change and develop.
Our FundersThe Group’s core debt facility is a £75m revolving credit facility with The Royal Bank of Scotland (RBS), which is complemented by a suite of public sector infrastructure loans (currently c.£17.3m) and a flexible bonding facility provided by HCC Insurance, which facilitates our development activity.The keys to our funder relationships are transparency (about the performance of the business) and delivery (against our covenants and undertakings). As the business, and its requirement for debt, continue to grow, these relationships will remain fundamental to maintaining business momentum.
Our Customers: commercial occupiers and housebuildersOur reputation for engagement with existing and prospective commercial occupiers and housebuilders is fundamental to our placemaking credentials and ability to monetise the value in our portfolio and consequently recycle capital.The maturity of sites such as the AMP and Logistics North and our track record in delivering direct development for the likes of McLaren Automotive and Whistl, demonstrate our now established, but still growing, reputation for working with owner occupiers and tenants to create development platforms and deliver built space which is fit for purpose.We have continued to make residential sales to both new and repeat housebuilders, evidencing our reputation for delivery and the increasing strength and breadth of our housebuilder relationships.As our residential sites mature we are reviewing our estates management function to ensure that our residential developments remain attractive places to live. This will include a degree of engagement with homeowners and occupiers.
Harworth and its stakeholders
Harworth and its stakeholders
The Board recognises that identifying, engaging with, and understanding the impact of decisions on the Group’s key stakeholders is fundamental to the long-term sustainability and success of the business, as well as being a core element of the Directors’ duties under the Companies Act. The Group’s key stakeholders can be grouped into ten main categories as shown below. Whilst there are unlikely to be regular, material changes to the constituency of these stakeholders, they will remain subject to regular review. The Board feels that, overall, the Group engages proactively with its various stakeholders and considers a broad range of interests when decisions are made, both strategic and operational, but acknowledges that further work needs to be done to ensure that appropriate levels of engagement are identified and maintained, and stakeholder interests become an embedded part of Harworth’s decision-making processes.
46 Harworth Group plc Annual Report and Financial Statements 2017
Our Communities, Our Environment, and Our ResponsibilitesSee “Operating responsibly” on pages 48 to 54 for further detail.

STRATEGIC REPORTCORPORATE GOVERNANCE
FINANCIAL STATEMENTS
Our Joint Venture PartnersWe have four principal joint venture partners to help deliver a number of our schemes:• Evans Properties, our partner at Gateway 45
in Leeds;• Dransfield Properties, with whom we are bringing
forward the local centre at our flagship Waverley site;• LCPF, with whom we partner on the Multiply scheme
at Logistics North in Bolton; and• M&G Real Estate, our forward funding partner on the
LN225 and LN175 units at Logistics North.These ventures are only successful because of the collaborative relationships we have established with our partners. There are three key principles to this approach:• utilising our complementary skill sets in delivering
initiatives;• maintaining open and regular dialogue to ensure
interests remain aligned; and • setting clear milestones for delivery and creating a
track record of achievement.
Our Public Sector PartnersWe have built strong working relationships with local authorities, in particular their planning and economic development functions, in working up, securing and implementing planning consents for our landholdings across the North of England and the Midlands. This approach involves early engagement on our initial ideas for sites to ensure that our plans for each site are consistent with the economic strategies for, and conditions within, that particular area.In addition, public sector funding remains a key part of our funding strategy and we have used a mixture of public grant and loan finance to deliver both on- and off-site infrastructure works to ‘open up’ sites for development and to fund the construction of new commercial units. This has involved working with agencies including Homes England (the former Homes & Communities Agency) and a number of regional Local Enterprise Partnerships, in addition to local authorities.Finally, we continue to make regular contributions to public policy consultations run by both Central and Local Government, ranging from the National Planning Policy Framework through to key infrastructure projects such as HS2.
Our ShareholdersWe continue to benefit from a loyal and supportive shareholder base, some of whom have held the Company’s shares since Harworth Estates became a standalone business, and indeed before. The Board recognises the importance of open and regular communications with Shareholders. To that end, we have made a concerted effort over the last 12 months to explain better how the Group creates value from its portfolio. This effort has included a Capital Markets Morning in January 2017, an improved articulation of the business model in investor communications and a marked increase in the regularity of our RNS and RNS Reach announcements. Towards the end of 2017, we also engaged FTI Consulting to help improve our investor communications and relations approach. This has already led to a more structured investor relations and communications timetable, which will include a briefing and site visits for institutional Shareholders and analysts planned for June of this year. The Group benefits from there being representatives on the Board from its two largest shareholders: the Peel Group and the Pension Protection Fund (“PPF”). Steven Underwood (Peel Group) and Martyn Bowes (PPF) provide an ongoing shareholder perspective on key strategic and operational decisions. The Board ensures that it remains attuned to the views of its other major investors, via regular reports and feedback collated by, and briefings from, its brokers, as well as market expectations via analyst research notes.
Regulatory BodiesWe recognise how important it is that the Environment Agency (“EA”) and Health and Safety Executive (“HSE”), the two regulatory bodies with whom we deal most, have confidence in the way we undertake our activities.We maintain an open dialogue with the EA in relation to all of our permitted sites, both at local and central levels. We are proactive in reporting monitoring results to the EA and work closely with it to review, amend and surrender permits when sites mature or activities change, and to address issues quickly if they arise. On the rare occasions that incidents occur at our sites, we are quick to liaise with the HSE, typically on a precautionary basis.
Harworth Group plc Annual Report and Financial Statements 2017 47
Our PeopleSee pages 55 to 57 for detail.

48 Harworth Group plc Annual Report and Financial Statements 2017
Operating responsibly
Operating responsibly
Harworth takes its responsibilities as a socially aware and responsible regeneration company extremely seriously. We are proud that our developments have helped to bring new life to former industrial areas, whilst also being able to support a number of key community initiatives that have an effect beyond our day-to-day work.
Acting responsibly in making this difference, both through minimising the environmental effect of our work, and in working safely and with appropriate regard to our legal responsibilities, also forms a critical part of being socially responsible in what we deliver day-to-day. This section explains how we deliver this in practice.
Our communitiesIn its work over the past decade, Harworth has helped to deliver thousands of new jobs and homes on its land across the North of England and the Midlands. In the case of Waverley and Logistics North, these are leading examples of regeneration in the North of England, replacing many times over the jobs that were lost when mining ended.Using our land and property experience to deliver future schemes in the same vein as Waverley and Logistics North is essential in both regenerating former industrial areas and in supporting the growth of UK plc. The recently published Industrial Strategy White Paper sets out a long-term plan for the rebalancing and growth of the national economy, building on national strengths and helping to deliver a highly skilled, competitive economy for the UK. Together with strategies to deliver the ‘Northern Powerhouse’ and the ‘Midlands Engine’, these provide the context to secure a step change in investment and growth across the North and Midlands. The provision of new commercial land and property to facilitate new inward investment and indigenous growth has an extremely important role to play.Housing also has an important role to play in creating the conditions for economic and productivity growth. This is highlighted in the Industrial Strategy, with £11.6bn of investment focused on housing through the National Productivity Investment Fund. Building a sufficient number of high quality houses to meet the needs of the economy is vital in order to attract and retain skilled workers and support economic growth across the North and the Midlands. Whilst the number of completions has been increasing, further growth is required to meet demand and address the shortfall in supply which has worsened following the drop in house building in many areas since the financial crisis.
With sites in eleven Local Enterprise Partnership (“LEP”) areas across the North and Midlands (including residential sites in six LEP areas), Harworth can contribute to delivering these economic growth ambitions through development of commercial floorspace, residential properties and low carbon energy, supporting the LEPs as they seek to meet their economic objectives and generate lasting change for communities. Economic consultancy Ekosgen has estimated that Harworth’s portfolio of sites has the potential to accommodate 59,000 jobs that would generate c.£2.9bn of Gross Value Added per annum when fully built out and occupied. Harworth’s landholding also has the potential to deliver more than 18,000 new homes. This potential is significant in supporting the delivery of sustainable new developments to improve the quality of life for people in the North of England and the Midlands.On a day-to-day basis, our work in local communities has also meant that we have been able to support a number of important social causes to extend the impact of what we do. The three case studies from 2017 shown within this section provide a snapshot of the sort of projects we support in the North of England and the Midlands.
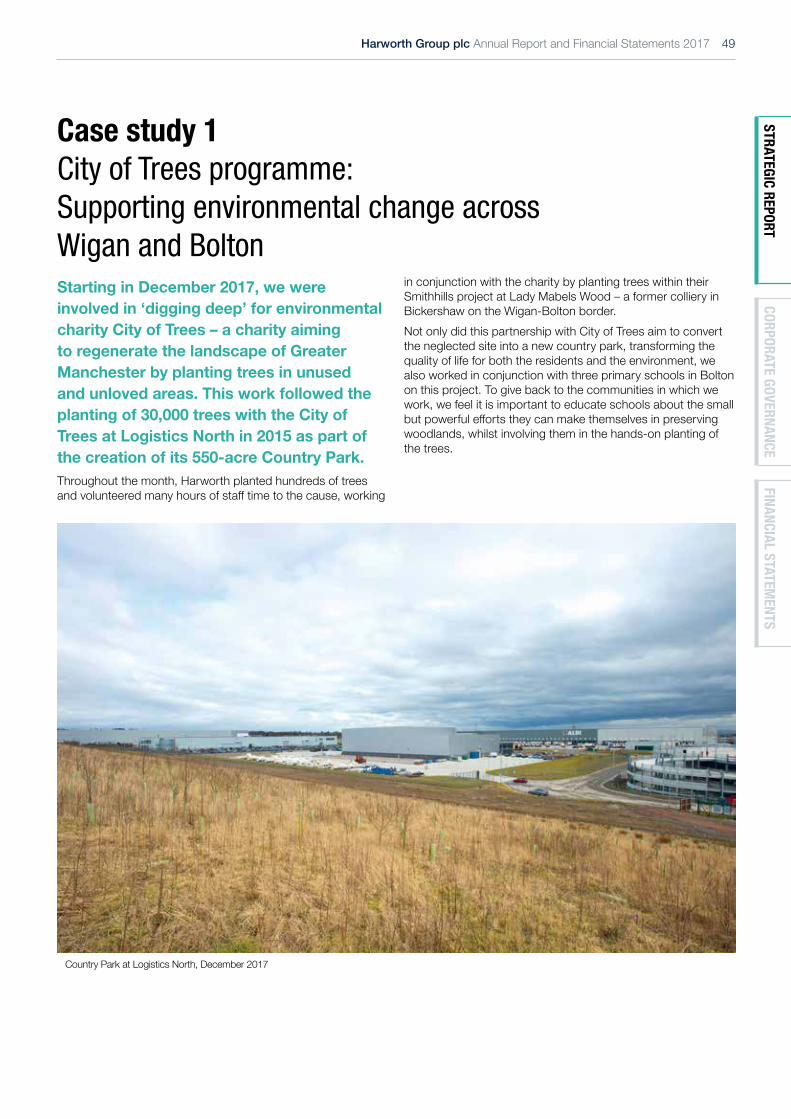
Harworth Group plc Annual Report and Financial Statements 2017 49
STRATEGIC REPORTCORPORATE GOVERNANCE
FINANCIAL STATEMENTS
Case study 1 City of Trees programme: Supporting environmental change across Wigan and BoltonStarting in December 2017, we were involved in ‘digging deep’ for environmental charity City of Trees – a charity aiming to regenerate the landscape of Greater Manchester by planting trees in unused and unloved areas. This work followed the planting of 30,000 trees with the City of Trees at Logistics North in 2015 as part of the creation of its 550-acre Country Park.Throughout the month, Harworth planted hundreds of trees and volunteered many hours of staff time to the cause, working
in conjunction with the charity by planting trees within their Smithhills project at Lady Mabels Wood – a former colliery in Bickershaw on the Wigan-Bolton border. Not only did this partnership with City of Trees aim to convert the neglected site into a new country park, transforming the quality of life for both the residents and the environment, we also worked in conjunction with three primary schools in Bolton on this project. To give back to the communities in which we work, we feel it is important to educate schools about the small but powerful efforts they can make themselves in preserving woodlands, whilst involving them in the hands-on planting of the trees.
Country Park at Logistics North, December 2017

50 Harworth Group plc Annual Report and Financial Statements 2017
Case study 2 Urban Outreach at Logistics North: Giving something back over ChristmasOver the Christmas period, Harworth and the LCPF helped to spread a bit of festive cheer by offering the use of one of the newly built ‘Multiply’ units at our Logistics North site in Bolton to local charity Urban Outreach free of charge. The use of this large working space served as a distribution headquarters to Urban Outreach Chief Executive Dave Bagley and his army of 100+ volunteers to pack and distribute several hundred hampers to families across Bolton who would otherwise have struggled to put food on the table for Christmas.
The charity had already packed some goods at Central Baptist Church but it needed a base for finishing its mammoth packing feat and preparing the hampers for distribution. Over 1,000 hampers were distributed in a single day.Leader of Bolton Council, Cllr Cliff Morris, said: “This is the best of Bolton coming together to help people in need and it shows true Christmas spirit. We were contacted by Dave to see if we could help the charity with a base and it is fantastic that Harworth and the Lancashire County Pension Fund responded so quickly and offered a solution.”Mr Bagley said: “This is how Bolton rolls and the use of the unit makes it much easier to plan our deliveries. 2017 is proving to be the biggest year ever – 2,050 children along with over 2,060 adults will have an incredible Christmas thanks to everyone’s combined efforts.”
Christmas hamper packing at Logistics North, December 2017

Harworth Group plc Annual Report and Financial Statements 2017 51
STRATEGIC REPORTCORPORATE GOVERNANCE
FINANCIAL STATEMENTS
Case study 3 Active Towns programme at Waverley: Encouraging greater physical activity through estate-based interventionStarting in September 2017, Harworth has established an innovative partnership with Sheffield Hallam University, in which a team of experts and academics with Health and Sport backgrounds are working collaboratively with Harworth to construct an ‘active environment’ prototype at our Waverley development in Rotherham. After a funding boost of almost £30,000 from Innovate UK, the project has been designed to prioritise the views of local communities. It is prepared to work on ideas that are put forward by residents and employees for using the site to encourage people to become more active, including the wider use of Waverley’s 7km perimeter trails and the installation of new community gardens. Earlier this year, the University’s
Advanced Wellbeing Research Centre (“AWRC”) and Outdoor Recreational Research Group received £50,000 from the Higher Education Innovation Fund to begin this new partnership.Residents believe that more parks and community orientated spaces, fitness opportunities and an increase in child friendly play spaces are key to future development. Additionally, AMP employees are keen to see the site become increasingly walk and cycle friendly. Harworth and Sheffield Hallam University will be testing a range of ideas in the first half of 2018 to encourage workers and residents to become more active.The proposed project coincides with the AWRC’s aims to create innovations that will improve the nation’s health, tackling key challenges such as static levels of physical activity, mental health and rising obesity. The main aim of this project is to create a new environment which makes a positive impact on one of the key challenges within modern society.
Public open space at Waverley, December 2017

52 Harworth Group plc Annual Report and Financial Statements 2017
Operating responsiblyContinued
Our environmentHarworth and its predecessor business has over twenty years’ experience in tackling large, complex, brownfield sites. We have a reputation for delivering new developments responsibly, whilst also recycling value from materials that can be recycled for uses elsewhere. In addition, we consistently aim to reduce our environmental impact as a business through active resource management and waste minimisation. This section explains how we minimise our environmental impact across all of our operations as one of the UK’s leading regeneration companies.
Redeveloping sites in a responsible mannerIn bringing forward sites for redevelopment – whether for residential, commercial or low-carbon uses – we apply five key principles in reducing our environmental impact across our estate.1) Remediation and restorationWe work with a small number of trusted contractors to decontaminate previously polluted land and remove dangerous underground structures at a range of brownfield sites across the UK – eventually preparing land for redevelopment. Waverley’s redevelopment is the most striking example of the transformation of a site. 2) Re-using public assetsWe believe that former industrial assets should be retained to support future development uses where practicable and Harworth has followed this principle across a number of its brownfield sites. Assets reconditioned and reused for new purposes include railheads, substations, access roads and enhanced public open spaces that surround our sites.3) DemolitionWe are experts in project managing complex demolition works in a safe and efficient manner. Over the past three years we have safely and successfully demolished the former Daw Mill Colliery in Warwickshire, formerly the UK’s largest coal mine, the former Alcan Aluminium Smelter in Northumberland and also Harworth Tower, Nottinghamshire’s tallest building, at the former Harworth Colliery. We have also started demolition at the former Thoresby and Kellingley colleries in preparation for redevelopment.4) Material recoveryWhether it is coal slurry, metals, concrete or fill material, we have the capability to extract the maximum value from derelict land and property, raising revenue that can ultimately be put to preparing land for eventual redevelopment whilst also being environmentally responsible. The team has been able to extract and sell over 1.1m tonnes of coal slurry to power station operators to produce electricity between 2011 and 2017 – a material previously considered as waste.
5) Minimising public impactThe team has been able to achieve all of this whilst minimising disruption to residents, businesses and other Groups that are close to the sites where we are working. We pride ourselves in maintaining clear communication and professionalism through all stages of the development process, building on our track record as a responsible regeneration Company.
Reducing greenhouse gas emissions from our operationsHarworth also operates a Safety, Health and Environmental Management System (“SHEMS”) to ensure the effective control of environmental risk and operates a management system to ensure environmental issues are considered at all levels. The policy advocates the promotion of sustainable and environmental opportunities by active resource management and waste minimisation.We declared in our 2016 Annual Report that we were aiming to improve performance in 2017 by implementing an improvement plan covering three discrete areas:• Examining the prospect of smart working to reduce staff
fuel usage;• Investing in energy efficient measures at our properties where
these are cost effective, including the use of LED and passive lighting systems, where appropriate; and
• Analysing opportunities to manage plant journeys more efficiently at operational sites.
We are pleased to report that we implemented a number of actions to reduce fuel consumed per employee and electricity consumption across our estate:• Smart Working where staff have organised their diaries
to reduce business miles, with CO2e per employee reducing; and
• Isolating the electricity supply to buildings which are unoccupied, ensuring lighting or heating cannot be accidentally left on.
Although we were able to reduce yellow plant journeys on sites we previously worked on in 2016, we increased the number of sites where we operated yellow plant – both in the Major Developments we are bringing forward and the number of sites where we are recovering coal fines as part of the site restoration process. As a result, the overall amount of gas oil used in plant did increase in 2017. This statement outlines the greenhouse gas emissions arising from Harworth’s activities for 2017 and it follows the Environmental Reporting Guidelines set by the Department for Environment, Food and Rural Affairs.
Operating responsiblyContinued

Harworth Group plc Annual Report and Financial Statements 2017 53
STRATEGIC REPORTCORPORATE GOVERNANCE
FINANCIAL STATEMENTS
Emissions are reported in tonnes of CO2 equivalents (CO2e) and refer to three areas:Scope 1 Fuel use in vehicles for staff in pursuance
of their dutiesScope 2 Gas oil used in plant at operational sitesScope 3 Electricity (non-rechargeable) usage on
Harworth sites.
Emission source
Tonnes of CO2e
(2017)Ratio
(2017)
Tonnes of CO2e
(2016)Ratio
(2016)
Scope 1 Fuel for staff vehicles 254 4.8:11 243 4.8:1Scope 2 Gas oil used in plant 1,848 308:12 1,326 265:1Scope 3 Electricity usage 632 37.2:13 639 42.6:1
Total 2,734 2,208
Notes: Ratios are calculated against the following quantifiable factors:1 Average employee numbers (2017: 53, 2016: 51)2 Number of sites where gas oil is used in plant (2017: 6, 2016: 5)3 Number of business parks that we operate (2017: 17, 2016: 15)
We aim to improve performance further in 2018 by taking forward the following actions on our sites:• Continue the smart working programme where staff plan
efficiently to reduce their business miles;• Ensure all newly acquired properties are run as cost
effectively as possible; and• Continue using well maintained yellow plant and periodically
reviewing operational techniques.
Our responsibilitiesIn addition to being responsible in our operations, Harworth is also committed to being a responsible employer as part of its role as an employer of choice. This includes appropriately developing and supporting its staff (as described in ‘Our People’ from page 55), alongside working safely and fully complying with all relevant aspects of UK law as this section explains.
Health and safetyHealth and safety has an extremely high profile in our business. Day-to-day review and management rests with our EES team, led by our Associate Director of EES. With effect from the start of 2018, the EES team reports to our Company Secretary, who has a wider responsibility for risk, compliance and governance. Our Chief Executive has ultimate responsibility for all health and safety matters.Our EES team ensures that health and safety is embedded into all of our activities. The team hosted a mandatory safety training day for all employees in July 2017. Our 2018 initiatives will include mandatory health and safety training in the form of online tuition and testing carried out by a third party provider. There is also targeted training for certain employees, such as training on CDM and asbestos which was delivered to our Major Developments and Operations teams in the first quarter of 2018.Harworth’s SHEMS is based on the Plan, Do, Check and Act model advocated by the HSE. The EES team maintains a “site risk register” which rates each of our sites as “low risk”, “medium risk” or “high risk”, from a health and safety perspective. A medium or high risk rating recognises that action needs to be taken at the site, whether within a
prescribed timetable (medium risk sites) or immediately (high risk sites). All our low and medium risk sites are inspected at least annually and our high risk-rated sites are inspected more regularly. At the date of this Report, there were no “high risk” sites in the site risk register. Material risk movements in our site risk register are fed into the bi-annual review of the Group Risk Register. Further proactive safety initiatives are undertaken in the form of health and safety inspections and audits. The geographical spread of our sites is large and the type of sites is varied. Any issues reported, whether they are incidents or accidents, are logged and appropriate follow up action is undertaken. This process is key to identifying areas for improvement across the portfolio. There were only ten minor accidents recorded at our sites during the year. For completeness, this statistic includes accidents involving contractors at our demolition sites, where our contractors take responsibility for health and safety whilst works are ongoing.There were no RIDDOR accidents or incidents reported by Harworth or indeed any contractors working on Harworth sites during the year. Since publication of the 2016 Annual Report, we have increased our engagement of JPW Consultancy Limited (“JPW”), an external health and safety consultant, to advise on health and safety issues across the business. JPW focuses on health and safety at our Major Development sites, including management of consortium meetings between Harworth and stakeholders at these sites, such as contractors and local authorities. In terms of monitoring health and safety across our portfolio:• Meetings are held between our Company Secretary and the
EES team monthly, following which our Associate Director of EES reports to both our Executive Committee and the Board;
• Reference is always made to health and safety in the Chief Executive’s monthly overview and update to the Board;
• There are quarterly safety meetings hosted by our Associate Director of EES, attended by the Executive Committee and employees from a cross-section of the business; and
• Our Associate Director of EES meets with the Board in January of each year to report on key issues encountered and actions undertaken during the previous year and priorities for the coming year.
Tackling modern slavery, bribery and corruption and facilitation of tax evasion We are committed to having in place practices to safeguard respect for human rights, to combat slavery and human trafficking in our business and those of third party contractors, to ensure that no corruption or bribery takes place in our business or supply chain and to ensure that our employees do not deliberately or inadvertently act in such a way as to facilitate tax evasion. In June 2017, the Company published its first Modern Slavery Statement, a copy of which appears on our website at www.harworthgroup.com/investors/reports-presentations/.The Company will publish its second Modern Slavery Statement before the end of June 2018, which will reflect the progress that has been made on the workstreams identified in
54 Harworth Group plc Annual Report and Financial Statements 2017
Operating responsiblyContinued
the 2017 statement. In terms of progress to date, we can report that: (A) our Company Secretary has instructed one of the Group’s legal panel firms, Gateley plc (“Gateleys”) to prepare and deliver training on tackling modern slavery and human trafficking and we expect that training to be conducted in the second or third quarters of 2018; (B) all new suppliers have committed to complying with our Supplier Code of Conduct on anti-slavery and human trafficking; (C) we have notified 145 of our existing suppliers of our expectation that they will comply with our Supplier Code of Conduct and demonstrate zero-tolerance of modern slavery and human trafficking; and (D) the review of, and updates to, our suite of construction agreement precedents, which has been facilitated by one of our legal panel firms, will be completed shortly and those updated precedents impose obligations on our contractors and consultants in relation to anti-slavery and human trafficking. Since publication of the 2016 Annual Report, the following new policies have been introduced:• Anti-Corruption and Bribery;• Gifts, Donations, Sponsorship and Hospitality; and• Anti-facilitation of tax evasion.
All employees have been made aware of these new policies. They are available on the Group’s shared drive and reminders are sent to employees periodically. Our policies on anti-corruption and bribery and anti-facilitation of tax evasion are also published on our website. The Gifts, Donations, Sponsorship and Hospitality policy introduces a more robust regime for the approval of business development activity at all levels of the business and a register of all activity. That register is monitored by the Company Secretary on a regular basis and will be reviewed by the Audit Committee on an annual basis.
General data protection regulations (GDPR)We do not hold extensive amounts of personal data, but recognise the importance of protecting the data that we do control. A number of workstreams are being undertaken to ensure that the Group will be compliant with the General Data Protection Regulation when it comes into force on 25 May 2018. Those workstreams include: an internal audit and “mapping” exercise of personal data; the creation of a “Personal Data Master Record” which will be subject to regular review; changes to our employee terms and conditions; the implementation of a new data protection policy, with accompanying operational guidelines, such as for handling data subject rights; new fair-collection (privacy) notices; data processing terms and conditions for third parties with whom we share data; and a suite of training materials. Our retained corporate lawyers, DLA, are advising on and assisting with a number of these workstreams.

Harworth Group plc Annual Report and Financial Statements 2017 55
STRATEGIC REPORTCORPORATE GOVERNANCE
FINANCIAL STATEMENTS
The Harworth team is a small but growing team of dedicated and experienced professionals who continue to drive consistent returns from our strategic land and investment property portfolio, demonstrated by the extent to which value gains are driven by active management of the Group’s assets. It is critical to the Group’s continued performance and growth ambitions that we recruit, retain and develop the right people. We can only achieve that if we engage with our employees, create an environment in which they can develop their skills and experience, and reward them for their hard work and contribution.
Employee numbers and costsThe average number of persons, including Executive Directors, employed by the Group and our staff costs are set out in Note 6 to the financial statements.
Employee engagement The Board recognises the importance of engaging with employees and considering the interests of employees when making decisions. Whilst there is already some engagement between the Board and wider Harworth team, such as site visits hosted by our operational teams, the Board is keen to improve the level of engagement, both informally and formally. One of the most important aspects of our employee engagement strategy is our newly formed People Steering Group, which we established in the first half of 2018. It comprises a group of eight employees from different teams across the business, with a variety of groups represented by an appropriate mix of people, based on (amongst other things) length of service, experience and gender.The purpose of The People Steering Group is twofold. From an operational perspective, it will take a lead in identifying and developing a “people agenda” and in proposing and implementing initiatives to drive that agenda. The group will, for example, help to formulate an agenda and format for our annual staff conference. The group will also be a forum for engagement between the Board and employees. It met with two of our Non-Executive Directors in March 2018, with the intention that similar meetings will be repeated periodically, so that the Board remains briefed and familiar with the views and concerns of employees. Our annual staff survey is now into its third year, covering a range of themes including communication, development, morale and motivation. Once again there was a high completion rate, with 98% of employees responding to the survey, up from 96% in 2016. This reflects the fact that the annual survey is a meaningful exercise with feedback driving tangible initiatives. In 2017, in response to feedback from the 2016 survey, we:• focussed on promoting entrepreneurship at our annual staff
conference;• introduced communications breakfasts for all employees,
hosted by our teams on a rolling basis so that thought leadership and case studies can be shared;
• introduced “CEO breakfasts” giving every employee (in small groups) an opportunity to share their thoughts on a range of topics with our Chief Executive; and
• ran a time management course for some of our employees (and will roll this out for all employees in 2018).
We have identified further initiatives from the 2017 survey results and are looking to implement those during 2018, including a continued focus on time and capacity management.In addition to the new initiatives identified above, we have continued to use the Harworth newsletter, annual staff conference and post results employee roadshows to cascade information to our teams. This is a priority for the business, to mitigate against any risk of a “silo effect” as the business, and our teams, grow.
Our cultureWe believe we have a positive working culture at Harworth, based on the results of our employee survey over the last three years and the fact that we were identified by Property Week in February 2018 as one of the 50 Best Places to Work in Property. However, until we formally identify the fundamentals of our culture and values, it is difficult for the Board and Executive Committee to ensure that they are preserved and promoted across the business. With that objective, over the next 12 to 18 months, our newly appointed Head of HR and Organisation Development will lead a collaborative process with our employees to identify what makes Harworth a good place to work, with a view to defining better our positive culture and values so that we can use it as a framework for behaviour and decision-making across all aspects of the business.
Recruitment, retention and developmentReflecting the momentum in, and continued growth of, the business, we have recruited five new roles since publication of our 2016 Annual Report into our Acquisitions, Strategic Land, Major Developments, Finance and Business Support teams. All of our employees have undertaken an externally facilitated personality profile exercise, which helps us to understand the dynamics of our teams and informs our recruitment of new employees and our plans for CPD of existing team members. During 2017 we overhauled our appraisal process so that all employees will now have bi-annual performance reviews. In 2017, a significant number of our employees attended external training courses. This included a second wave of employees who completed an external leadership programme, comprising six modules. A third wave will start the course shortly. Two of our employees continue to work towards professional qualifications and we continue to provide financial support to a number of our employees in renewing their
Our People
Our People

56 Harworth Group plc Annual Report and Financial Statements 2017
Our PeopleContinued
memberships of professional bodies, both in terms of ongoing CPD requirements and renewal fees.External coaching continues to be available to our Executive Committee and Senior Management Team and we encourage them all to use this resource from time to time.There were three strategic promotions at the end of 2017, including one promotion to our Senior Management Team. This reflects the growing experience and strength in depth of our teams.
Recognition and reward We offer a comprehensive employee benefits package for all employees, which includes a pension scheme with substantial employer contributions, private medical insurance, life insurance and income protection.Bonuses for all employees are awarded, in part, for performance against Group Financial Targets, which are aligned with the Group’s strategy for long-term, sustainable growth and applied consistently across the Group. In 2017, these targets were based on NNNAV gains, sales volume, acquisitions and profit excluding value gains.During 2017, the first awards were made to our Senior Management Team under the newly established Senior Management Deferred Share Bonus Plan. A second set of awards were made earlier this month. The performance measures for these awards mirror aspects of the Executive Committee long-term incentive plan, incentivising and rewarding our Senior Management whilst aligning their interests with those of shareholders. The options which vest under this plan will be satisfied by shares purchased in the market.
We also established the Harworth Group Save As You Earn scheme, which gives employees an opportunity (annually) to save up to £500 a month over 3 years and then purchase shares in the Company at a discount of 20% to the market price of the shares at the outset of the scheme. We see the SAYE Scheme as a tangible way in which our employees can share in, as well as contribute to, the Group’s success.Whilst offering an appropriate remuneration package for our employees will always be a priority, recognition is important too. During 2017, we have put greater emphasis on celebrating successes, such as at our staff conference, quarterly breakfast briefings and employee roadshows and in our newsletter.
Diversity And Equal OpportunitiesLike much of the real estate and construction sectors, we have a significant challenge to become the gender balanced business we want to be. We are working hard to achieve that objective but recognise that it will take time. The analysis over the page demonstrates the gender imbalance across the Harworth team, particularly amongst the Board, Executive Committee and Senior Management Team (figures in brackets denote the position at the date our 2016 Annual Report was published). We are also mindful that there are no individuals from an ethnic minority background working at Harworth.Harworth has a diversity policy which provides that we are “committed to providing equal opportunities… avoiding unlawful discrimination in employment… and ensuring that no job applicant or employee receives less favourable treatment or is disadvantaged on the grounds of gender, race, disability, sexual orientation, religion or belief, age, and pregnancy or maternity”. However, given the extent of the diversity challenge
Our PeopleContinued
Harworth’s team for Tour de Yorkshire Sportive

Harworth Group plc Annual Report and Financial Statements 2017 57
STRATEGIC REPORTCORPORATE GOVERNANCE
FINANCIAL STATEMENTS
facing the Group, the Board acknowledges the need for a more progressive policy, which must underpin proactive initiatives. To that end, as part of a wider review of employment terms and policies Gateleys has undertaken a review of our diversity policy and will be helping us to refine the policy in 2018.Notwithstanding the need for improvements to the Group’s diversity policy, there are already some initiatives in place designed to ensure that opportunities for recruitment, development and promotion are available to all and to promote both gender and ethnic diversity in the business:• towards the end of 2016, the Remuneration Committee
approved enhancements to the Group’s maternity, paternity and adoption pay policy;
• eight of our employees work part-time, whether that be a reduced number of days or reduced hours every day, including two members of our Senior Management Team, and employees have the opportunity to work flexibly; and
• we have tasked our recruitment consultants with presenting candidate “long-lists” with a gender balance and one or more individuals of an ethnic minority background, wherever possible.
Some progress has been made since publication of the 2016 Annual Report. Of the five new roles for which the Group recruited, a majority (4) were filled by female candidates. However, there has been recruitment for two replacement roles in that period, one of which was vacated by a female and filled by a male. There were three promotions during the year. Two of those were junior promotions of male employees. The third was a promotion of a female employee to the Senior Management Team. It is important to note that, whilst the Group’s desire to
improve diversity will be a consideration in decisions on recruitment and promotion, selections will continue to be made based on merit and ability. Whilst Harworth is not obliged to publish gender pay gap analysis, we are keen to be transparent about the extent of the diversity challenge we face. To that end, the Board has decided to undertake gender pay gap analysis and report on it voluntarily. The results of that analysis appear below:
Gender pay gap
Mean gender pay gap 50%Median gender pay gap 46%Mean bonus gender pay gap 85%Median bonus gender pay gap 75%
Proportion of men and women in each quartile band
LowerLower middle
Upper middle Upper
Males 64% 69% 100% 90%Female 36% 31% 0% 10%
We believe that our gender pay gap is more a function of historic trends across the property and construction sectors than reflective of a “Harworth” approach. These figures reflect the fact that, historically, men have held the vast majority of the most senior jobs in the property, construction and mining sectors and, as such, our gender imbalance is particularly stark at the Executive Committee and Senior Management Team levels. We are making efforts to address this, but the fact we operate with a small team, with limited turnover (itself a positive) means that it will take time to address current imbalances.Whilst Harworth has a long way to go in improving diversity across its business, we have long been, and remain, committed to creating a working environment that is free from discrimination, harassment and victimisation, where everyone feels valued and respected. This approach includes:• promoting equality and fairness for all in our employment; • making reasonable adjustments for disabled employees
and giving full and fair consideration to disabled applicants for roles in our business; and
• providing equal opportunities for CPD and promotion within our business to any disabled employees.
The strategic report is approved by the Board and signed on its behalf by:Owen Michaelson Chief Executive 24 April 2018
MaleFemale
Board Executive Committee
Senior Management Team All employees
7/1 6/0
18/2 42/15
(7/1) (6/0)
(18/1) (40/12)

Corporate Governance
58 Harworth Group plc Annual Report and Financial Statements 2017
Corporate Governance
60 Board of Directors and Company Secretary 62 Former Chairman’s introduction 64 Statement of Corporate Governance72 Directors’ remuneration report86 Audit Committee report90 Nomination Committee report92 Directors’ report97 Statement of Directors’ responsibilities
STRATEGIC REPORTCORPORATE GOVERNANCE
FINANCIAL STATEMENTS
Harworth Group plc Annual Report and Financial Statements 2017 59

60 Harworth Group plc Annual Report and Financial Statements 2017
Board of Directors and Company Secretary
Board of Directors and Company Secretary
Jonson Cox Alastair Lyons Owen Michaelson Andrew Kirkman Lisa Clement Anthony Donnelly Andrew Cunningham Steven Underwood Martyn Bowes Chris BirchFormer Chairman* Chairman* Chief Executive Finance Director Senior Independent Director Non-Executive Director Non-Executive Director Non-Executive Director Non-Executive Director Group General Counsel and
Company SecretaryN R N R R N R A A N R A
Term of officeJoined the Board on 15 November 2010 as Executive Chairman. Non-Executive Chairman since December 2012. Last re-elected in May 2017. Stepped down as Chairman and Chair of the Nomination Committee on 6 March 2018 (replaced by Alastair Lyons). Resigned as a Non-Executive Director on 31 March 2018.
Term of officeJoined the Board on 7 March 2018.
Term of officeJoined the Board on 24 March 2015 having previously been Chief Executive of HEPGL from 28 September 2012 and of the Harworth Estates division of UK Coal since August 2010. Last re-elected in May 2017.
Term of officeJoined the Board on 1 January 2016. Last re-elected in May 2017.
Term of officeJoined the Board on 15 December 2011. Last re-elected in May 2017.Chair of the Remuneration Committee and Senior Independent Director.
Term of officeJoined the Board on 24 March 2015 having previously been a Non-Executive Director of HEPGL from 10 December 2012 and a Director of the Harworth Estates division of UK Coal from January 2011. Last re-elected in May 2017.
Term of officeJoined the Board on 26 April 2016. Elected in May 2017. Chair of the Audit Committee.
Term of officeJoined the Board on 2 August 2010. Last re-elected in May 2017.
Term of officeJoined the Board on 24 March 2015 having previously been a Non-Executive Director of HEPGL from 19 March 2013. Last re-elected in May 2017.
Term of officeAppointed on 6 June 2016.
Length of service7 years 5 months (to 31 March 2018)
Length of service2 months
Length of service3 years 2 months (7 years 9 months including appointment to HEPGL and Harworth Estates division of UK Coal)
Length of service2 years 4 months
Length of service6 years 5 months
Length of service3 years 2 months (7 years 4 months including appointment to HEPGL and Harworth Estates division of UK Coal)
Length of service2 years
Length of service7 years 9 months
Length of service3 years 2 months (5 years 2 months including appointment to HEPGL)
IndependentNo
IndependentYes
IndependentNo
IndependentNo
IndependentYes
IndependentYes
IndependentYes
IndependentNo, representative of the Peel Group
IndependentNo, representative of the PPF
Skills and experienceJonson’s early career was with Royal Dutch Shell and Kelda Group. He joined Anglian Water as Chief Executive from 2004 until 2010. He was a Non-Executive Director of Wincanton plc from 2005 to 2014. In November 2012 he was appointed Chairman of the Water Services Regulation Authority (Ofwat).Jonson joined the Board in 2010 to lead the former UK Coal through its 2012 restructuring. He served as Non-Executive Chairman following the restructuring and led the Company through its 2015 acquisition of Harworth Estates.
Skills and experienceAlastair is Non-Executive Chairman of Welsh Water and Deputy Chairman of Bovis Homes Group PLC (but will retire from the latter role in May 2018). He was Non-Executive Chairman of Admiral Group plc from 2000 to 2017 and of Serco Group plc and Towergate Insurance until June 2015. Previously in his executive career, Alastair was Chief Executive of the National Provident Institution and the National and Provincial Building Society, Managing Director of the Insurance Division of Abbey National plc and Director of Corporate Projects at National Westminster Bank plc. He has a broad base of business experience with a particular focus on mortgage lending and insurance industries. He was awarded the CBE in 2001 for services to social security having served as a non-executive director of the Department for Work and Pensions and the Department of Social Security.
Skills and experienceOwen has more than 26 years’ experience in the remediation of brownfield land and has held executive roles at the Peel Group, Black Country Properties and Viridor. Prior to becoming the Chief Executive of Harworth Group plc, he took over the stand-alone operations of Harworth Estates at the commencement of the restructuring of the former UK Coal in August 2010. He established the business as a recognised developer of brownfield land, before being appointed to the Board of Harworth Group plc following its acquisition of Harworth Estates in 2015.
Skills and experiencePrior to joining Harworth, Andrew was Finance Director of Viridor, the recycling and renewable energy subsidiary of Pennon Group plc, for five years. He has also previously held a number of other senior finance roles, including Chief Financial Officer at Balfour Beatty Capital and Global Head of Corporate Finance at Bovis Lend Lease. Andrew is a Fellow of the Institute of Chartered Accountants and has an MA in politics, philosophy and economics from Oxford University.
Skills and experienceLisa was formerly Chief Financial Officer of Sea Containers Limited, Managing Director of Capita Learning and Development and has held senior divisional roles at Cendant Inc and BPP Holdings plc.
Skills and experienceAfter early finance roles with Scottish and Newcastle Breweries from 1986, Anthony joined Morrison Homes Limited as Finance Director in 1990. In 2000 he was appointed Managing Director of Scotland-based AWG Property Limited and was subsequently appointed Chairman. He has consequently overseen the workout and extraction of value from an extensive commercial and residential property portfolio across the UK and Ireland and its transformation into a strategic and income generating portfolio.
Skills and experienceAndrew graduated from Cambridge University and then trained as a chartered accountant with Deloitte Haskins and Sells (a predecessor firm of PwC). In 1989 he was made a corporate finance and audit partner. In 1996 he was appointed Finance Director of Grainger plc, which was to become the UK’s largest listed residential investor, and then Chief Executive in 2009. He retired from Grainger plc at the end of 2015. Andrew is a Fellow of the Institute of Chartered Accountants and of the Royal Institution of Chartered Surveyors.
Skills and experienceSteven is Chief Executive of the Peel Group of companies and brings to the Board the extensive experience of the Peel Group in brownfield land remediation and regeneration.
Skills and experienceMartyn originally trained as an accountant and as a banker. He has spent the majority of his career in banking, most recently from 2001 to 2007 with Barclays Capital as Managing Director, Real Estate Finance. Since leaving Barclays he has pursued a portfolio business career, which in 2012 involved a takeover with fellow Directors of the South of England based Welbeck Land real estate business. Martyn now acts as Finance Director for Welbeck Land and also maintains other interests in debt advisory and healthcare.
Skills and experienceChris graduated from Sheffield University in 2003 with a first class LLB and a distinction in the Legal Practice Course. He joined Eversheds LLP, where he qualified as a solicitor in 2005 and spent 12 years as a corporate restructuring lawyer, before joining Harworth as Group General Counsel and Company Secretary in June 2016.
External appointmentsChairman of Water Services Regulation Authority (Ofwat) and the Cory Group. Advisor to I Squared Capital LLP. Director of Viridian Holdings Ltd and Stonebrook Associates Ltd.
External appointmentsChairman of Welsh Water (Dwr Cymru) and Deputy Chairman of Bovis Homes Group PLC (but will retire from his role at Bovis Homes at its next AGM in May 2018).
External appointmentsBoard member for Sheffield City Region Local Enterprise Partnership.
External appointmentsNone.
External appointmentsDirector of Everything But The Cow Limited.
External appointmentsDirector of various private limited companies in the AWG Group.
External appointmentsThe Banks Group Limited, Cussins Limited, and Cussins (North East) Limited. Commissioner at The Port of Blyth.
External appointmentsAlternate Director of Intu Properties plc. Director of multiple private limited companies, mostly connected to the Peel Group.
External appointmentsDirector of multiple private limited companies in the Welbeck Land Group. Non-Executive Director at Clouston Group and Conger Finance Limited.
External appointmentsNone.
* On 7 March 2018, Alastair Lyons was appointed Non-Executive Chairman in place of Jonson Cox. On 31 March 2018, Jonson Cox resigned as a Non-Executive Director.

STRATEGIC REPORTCORPORATE GOVERNANCE
FINANCIAL STATEMENTS
Harworth Group plc Annual Report and Financial Statements 2017 61
Jonson Cox Alastair Lyons Owen Michaelson Andrew Kirkman Lisa Clement Anthony Donnelly Andrew Cunningham Steven Underwood Martyn Bowes Chris BirchFormer Chairman* Chairman* Chief Executive Finance Director Senior Independent Director Non-Executive Director Non-Executive Director Non-Executive Director Non-Executive Director Group General Counsel and
Company SecretaryN R N R R N R A A N R A
Term of officeJoined the Board on 15 November 2010 as Executive Chairman. Non-Executive Chairman since December 2012. Last re-elected in May 2017. Stepped down as Chairman and Chair of the Nomination Committee on 6 March 2018 (replaced by Alastair Lyons). Resigned as a Non-Executive Director on 31 March 2018.
Term of officeJoined the Board on 7 March 2018.
Term of officeJoined the Board on 24 March 2015 having previously been Chief Executive of HEPGL from 28 September 2012 and of the Harworth Estates division of UK Coal since August 2010. Last re-elected in May 2017.
Term of officeJoined the Board on 1 January 2016. Last re-elected in May 2017.
Term of officeJoined the Board on 15 December 2011. Last re-elected in May 2017.Chair of the Remuneration Committee and Senior Independent Director.
Term of officeJoined the Board on 24 March 2015 having previously been a Non-Executive Director of HEPGL from 10 December 2012 and a Director of the Harworth Estates division of UK Coal from January 2011. Last re-elected in May 2017.
Term of officeJoined the Board on 26 April 2016. Elected in May 2017. Chair of the Audit Committee.
Term of officeJoined the Board on 2 August 2010. Last re-elected in May 2017.
Term of officeJoined the Board on 24 March 2015 having previously been a Non-Executive Director of HEPGL from 19 March 2013. Last re-elected in May 2017.
Term of officeAppointed on 6 June 2016.
Length of service7 years 5 months (to 31 March 2018)
Length of service2 months
Length of service3 years 2 months (7 years 9 months including appointment to HEPGL and Harworth Estates division of UK Coal)
Length of service2 years 4 months
Length of service6 years 5 months
Length of service3 years 2 months (7 years 4 months including appointment to HEPGL and Harworth Estates division of UK Coal)
Length of service2 years
Length of service7 years 9 months
Length of service3 years 2 months (5 years 2 months including appointment to HEPGL)
IndependentNo
IndependentYes
IndependentNo
IndependentNo
IndependentYes
IndependentYes
IndependentYes
IndependentNo, representative of the Peel Group
IndependentNo, representative of the PPF
Skills and experienceJonson’s early career was with Royal Dutch Shell and Kelda Group. He joined Anglian Water as Chief Executive from 2004 until 2010. He was a Non-Executive Director of Wincanton plc from 2005 to 2014. In November 2012 he was appointed Chairman of the Water Services Regulation Authority (Ofwat).Jonson joined the Board in 2010 to lead the former UK Coal through its 2012 restructuring. He served as Non-Executive Chairman following the restructuring and led the Company through its 2015 acquisition of Harworth Estates.
Skills and experienceAlastair is Non-Executive Chairman of Welsh Water and Deputy Chairman of Bovis Homes Group PLC (but will retire from the latter role in May 2018). He was Non-Executive Chairman of Admiral Group plc from 2000 to 2017 and of Serco Group plc and Towergate Insurance until June 2015. Previously in his executive career, Alastair was Chief Executive of the National Provident Institution and the National and Provincial Building Society, Managing Director of the Insurance Division of Abbey National plc and Director of Corporate Projects at National Westminster Bank plc. He has a broad base of business experience with a particular focus on mortgage lending and insurance industries. He was awarded the CBE in 2001 for services to social security having served as a non-executive director of the Department for Work and Pensions and the Department of Social Security.
Skills and experienceOwen has more than 26 years’ experience in the remediation of brownfield land and has held executive roles at the Peel Group, Black Country Properties and Viridor. Prior to becoming the Chief Executive of Harworth Group plc, he took over the stand-alone operations of Harworth Estates at the commencement of the restructuring of the former UK Coal in August 2010. He established the business as a recognised developer of brownfield land, before being appointed to the Board of Harworth Group plc following its acquisition of Harworth Estates in 2015.
Skills and experiencePrior to joining Harworth, Andrew was Finance Director of Viridor, the recycling and renewable energy subsidiary of Pennon Group plc, for five years. He has also previously held a number of other senior finance roles, including Chief Financial Officer at Balfour Beatty Capital and Global Head of Corporate Finance at Bovis Lend Lease. Andrew is a Fellow of the Institute of Chartered Accountants and has an MA in politics, philosophy and economics from Oxford University.
Skills and experienceLisa was formerly Chief Financial Officer of Sea Containers Limited, Managing Director of Capita Learning and Development and has held senior divisional roles at Cendant Inc and BPP Holdings plc.
Skills and experienceAfter early finance roles with Scottish and Newcastle Breweries from 1986, Anthony joined Morrison Homes Limited as Finance Director in 1990. In 2000 he was appointed Managing Director of Scotland-based AWG Property Limited and was subsequently appointed Chairman. He has consequently overseen the workout and extraction of value from an extensive commercial and residential property portfolio across the UK and Ireland and its transformation into a strategic and income generating portfolio.
Skills and experienceAndrew graduated from Cambridge University and then trained as a chartered accountant with Deloitte Haskins and Sells (a predecessor firm of PwC). In 1989 he was made a corporate finance and audit partner. In 1996 he was appointed Finance Director of Grainger plc, which was to become the UK’s largest listed residential investor, and then Chief Executive in 2009. He retired from Grainger plc at the end of 2015. Andrew is a Fellow of the Institute of Chartered Accountants and of the Royal Institution of Chartered Surveyors.
Skills and experienceSteven is Chief Executive of the Peel Group of companies and brings to the Board the extensive experience of the Peel Group in brownfield land remediation and regeneration.
Skills and experienceMartyn originally trained as an accountant and as a banker. He has spent the majority of his career in banking, most recently from 2001 to 2007 with Barclays Capital as Managing Director, Real Estate Finance. Since leaving Barclays he has pursued a portfolio business career, which in 2012 involved a takeover with fellow Directors of the South of England based Welbeck Land real estate business. Martyn now acts as Finance Director for Welbeck Land and also maintains other interests in debt advisory and healthcare.
Skills and experienceChris graduated from Sheffield University in 2003 with a first class LLB and a distinction in the Legal Practice Course. He joined Eversheds LLP, where he qualified as a solicitor in 2005 and spent 12 years as a corporate restructuring lawyer, before joining Harworth as Group General Counsel and Company Secretary in June 2016.
External appointmentsChairman of Water Services Regulation Authority (Ofwat) and the Cory Group. Advisor to I Squared Capital LLP. Director of Viridian Holdings Ltd and Stonebrook Associates Ltd.
External appointmentsChairman of Welsh Water (Dwr Cymru) and Deputy Chairman of Bovis Homes Group PLC (but will retire from his role at Bovis Homes at its next AGM in May 2018).
External appointmentsBoard member for Sheffield City Region Local Enterprise Partnership.
External appointmentsNone.
External appointmentsDirector of Everything But The Cow Limited.
External appointmentsDirector of various private limited companies in the AWG Group.
External appointmentsThe Banks Group Limited, Cussins Limited, and Cussins (North East) Limited. Commissioner at The Port of Blyth.
External appointmentsAlternate Director of Intu Properties plc. Director of multiple private limited companies, mostly connected to the Peel Group.
External appointmentsDirector of multiple private limited companies in the Welbeck Land Group. Non-Executive Director at Clouston Group and Conger Finance Limited.
External appointmentsNone.
KEY A = member of the Audit Committee N = member of the Nomination Committee R = member of the Remuneration CommitteeA = Chair of the Audit CommitteeN = Chair of the Nomination CommitteeR = Chair of the Remuneration Committee
* During the year, Andrew was appointed, but subsequently resigned, as Chairman of Aviva Investors Secure Income REIT PLC.

62 Harworth Group plc Annual Report and Financial Statements 2017
Former Chairman’s introduction
Dear Shareholder,Whilst I stood down as Non-Executive Chairman of the Board prior to publication of this Annual Report and Financial Statements, as Chairman during the period under review it falls to me to present the Company’s Corporate Governance Statement, on behalf of the Board. It comprises the Statement of Corporate Governance, the Directors’ remuneration report, the Audit Committee report, the Nomination Committee report, the Directors’ report and the Statement of Directors’ responsibilities. The Board is accountable to all stakeholders for good corporate governance. It recognises the importance of good governance as a foundation for long-term, sustainable growth and is committed to demonstrating high standards and continuous improvement in this regard. These reports explain the Company’s governance framework and policies, which are subject to regular review and refinement. While, at the date of this report, the Company remains a standard listed Company on the London Stock Exchange, it aims to comply with the UK Corporate Governance Code (the Code), and workstreams are underway to apply to the FCA for the Company’s shares to be moved from a standard listing to a premium listing. I am pleased to report that, save as explained in the Directors’ report on page 96, the Company has complied with the Code for the period under review. The Company is monitoring the consultation process in respect of the proposed introduction of a revised Code and will continue to review and update its policies and procedures to ensure compliance with the new, revised Code.
Composition of the BoardThere were no changes to the composition of the Board or the Board committees during the period under review. However, on 7 March 2018 Alastair Lyons replaced me as Chairman of the Board and I resigned from the Board with effect from 31 March 2018. Alastair will also become Chair of the Nomination Committee and take my place as a member of the Remuneration Committee. We continue to adopt best practice of submitting all Directors for election or re-election at the Annual General Meeting.The Nomination Committee’s focus in 2017 was on the appointment of my replacement, which was announced in December. Succession planning is underway for the two longest-serving independent Non-Executive Directors. During 2018 a comprehensive review of succession and development plans is being undertaken by our newly appointed Head of HR & Organisation Development. This will ensure that there are succession plans in place at all levels of the business and all employees have the opportunity to reach their full potential. The Nomination Committee will use those plans to inform its detailed review of succession plans for the Executive Directors and wider Executive Committee. The Board recognises the value that can be derived from a broader range of ideas, skills, experience and perspectives at all levels of the business, but particularly at Board, Executive Committee and Senior Management Team levels. It also acknowledges a better balance is needed across the business in terms of gender and ethnicity. This is a big challenge and will take time to address fully, but remains an ongoing and important objective.
Former Chairman’s introduction
Harworth acknowledges a better balance is needed across the business in terms of gender and ethnicity. This is a big challenge and will take time to address fully, but remains an ongoing and important objective.
JONSON COX – CHAIRMAN(AS AT 31 DECEMBER 2017)

STRATEGIC REPORTCORPORATE GOVERNANCE
FINANCIAL STATEMENTS
Harworth Group plc Annual Report and Financial Statements 2017 63
Leadership and AccountabilityWe aim to deliver above-market EPRA NNNAV growth with the foundation of a strong Balance sheet and a sustainable business capable of surviving property market fluctuations with a resilient, recurring income stream. We set ourselves stretching strategic and financial objectives but within a culture of robust risk management.The Board adds value through constructive dialogue with, and challenge to, the Executive Directors and wider Executive Committee to create accountability and drive performance. To that end, all Directors must have a good knowledge of the Group’s business and the markets in which it operates. The Board timetable includes site visits, which help to improve knowledge and understanding of our key sites and, at the same time, are an opportunity for our Non-Executive Directors to get to know better the operational teams driving value growth from our portfolio. The Board also receives detailed operational updates from the Capital Growth, Income Generation and Acquisitions divisions each on a bi-annual basis, so that all Directors are alive to the operational challenges facing the business, which is the backdrop against which performance is delivered. Once again, there has been a strong focus on risk management and internal controls this year. The Audit Committee has overseen another comprehensive review of the Group’s insurance programme, a detailed review of the Board’s risk appetite and the Group’s risk profile; and an external review of some of the Group’s internal financial controls. The Audit Committee report on pages 86 to 89 contains further details. The Board and Executive Committee undertook the annual review of the Group’s strategy in September. That review re-affirmed the fundamentals of the Group’s long-term strategy, although we did resolve to refine the way we articulate our strategic priorities to stakeholders. This is reflected in the Strategic Report on page 2. We believe the medium-term outlook is positive given the ongoing performance of our core markets in the North of England and Midlands, the continued shortage of housing, the fundamentals underpinning manufacturing and logistics markets and the largely supportive backdrop of Government policy and sentiment.Having established a formal internal Board evaluation process at the end of 2016, during 2017 we: implemented action points to address the areas identified for improvement, most notably on inductions and continuous professional development for Directors; undertook evaluations for each of our Board committees; have analysed the results and are addressing areas for improvement; and implemented a programme of 360 degree self-appraisals for all of our Non-Executive Directors. Individual appraisals have demonstrated that each Non-Executive Director continues to contribute effectively and demonstrate commitment to the role. Another internal Board evaluation was undertaken in the first quarter of 2018. It was pleasing to see that the results reflected the actions taken in response to feedback the previous year. The results do identify further areas for improvement, and these will be looked at during the balance of 2018. In accordance with the Code, we will instruct an external Board evaluation towards the end of this year.
RemunerationOur remuneration policy and arrangements are designed to support the Group’s objectives. Having made some changes to our Chief Executive’s bonus entitlement and our Finance Director’s salary and bonus entitlement, we believe that the current remuneration packages are appropriate for incentivising management to drive long-term value growth. The Remuneration Policy tabled at the 2016 Annual General Meeting received overwhelming support from Shareholders. A summary of the policy appears at pages 75 to 77. The policy will be reviewed towards the end of 2018 and early part of 2019, with a view to an updated policy being tabled at the 2019 Annual General Meeting.
Annual General MeetingOur Annual General Meeting will be held at 2.00 p.m. on Tuesday 29 May 2018 at The Bessemer Conference Room, AMP Technology Centre, Advanced Manufacturing Park, Brunel Way, Waverley, Rotherham, S60 5WG. That meeting will be chaired by my successor, Alastair Lyons. I would like to encourage all Shareholders to attend.Jonson Cox Chairman (as at 31 December 2017) 24 April 2018

64 Harworth Group plc Annual Report and Financial Statements 2017
Statement of Corporate Governance
Board
Executive Directors
Audit Committee
Approval of strategy, oversight, guidance
and challenge
Implementation of strategy and overall responsibility for
operational management
Leadership of business segments, reporting into
Executive Committee
Nomination Committee
Remuneration Committee
Executive Committee
SeniorManagement
Team
Role of the BoardThe Company is headed by a Board of Directors. Its key responsibilities are summarised in the table below. The Group’s delegated authorities policy was subject to a detailed review and updated in November 2016 and remains fit for purpose. It includes matters reserved for the Board. Examples of Board reserved matters are also set out in the table below.
Key responsibilities Examples of reserved matters
• Set objectives and strategy for delivery of value to Shareholders.
• Monitor management performance against strategy and targets.
• Provide constructive challenge to management proposals and activity.
• Stewardship of the Group’s resources and overall responsibility for management of the Group to ensure long-term viability, sustainability and growth of the business.
• Ensure engagement with stakeholders and consideration of stakeholders interests in decision-making.
• Ultimate responsibility for risk appetite and management.
• Group strategy and budgets.• Constitution and the structure of the corporate Group and
its capital.• Annual and half-year reports and financial statements, and the
declaration of dividends.• The Group’s principal banking facilities and hedging
arrangements.• Material sales, lettings, acquisitions and joint ventures.• Risk appetite and insurance programme.• Appointment of Non-Executive Directors, Executive Directors
and Company Secretary.• Policies relating to whistleblowing, bribery, data protection,
anti-facilitation of tax evasion, modern slavery and business continuity.
The Board has delegated certain responsibilities to the Remuneration, Audit and Nomination Committees. The terms of reference of those committees can be found on the Group’s website at www.harworthgroup.com/investors/governance. Those terms of reference were last updated in December 2017.
Statement of Corporate Governance

STRATEGIC REPORTCORPORATE GOVERNANCE
FINANCIAL STATEMENTS
Harworth Group plc Annual Report and Financial Statements 2017 65
Role of the Executive CommitteeThe Executive Committee has responsibility for implementing the Group’s strategy and oversight of day-to-day management of the Group’s business, with reference to, and challenge from, the Board on Board reserved matters. It comprises the Chief Executive, Finance Director and Group General Counsel and Company Secretary, together with: the Managing Director, Capital Growth; the Executive Director, Income Generation; and the Director, Acquisitions.
Role of the Senior Management TeamThe Senior Management Team comprises ten senior employees who lead each of the Group’s business segments, being: Strategic Land; Major Developments; Business Space; Building Delivery; Natural Resources; Operations; EES; HR; Communications and Finance. Each member of the Senior Management Team reports to a member of the Executive Committee.As well as ensuring that certain matters are reserved to the Board, the Group’s delegated authorities policy ensures that operational decisions are made at the most appropriate level in the business.
Composition of the Board
Non-independent Non-Executive
Directors, 2
Independent Non-Executive Directors, 3
Chairman, 1(independent)1
Executive Directors, 2
1 As at the date of this Report
The Board is made up of the Chairman, Chief Executive, Finance Director and five Non-Executive Directors. The Directors’ biographies appear on pages 60 and 61.
The Board considers that its Non-Executive Directors bring the requisite judgement, knowledge and experience to the Board’s deliberations. They have no financial or contractual interests in the Group, other than interests in Ordinary Shares as disclosed in the Directors’ interests in Ordinary Shares section of the Directors’ remuneration report at page 84. The composition of the Board is reviewed regularly by the Nomination Committee to ensure an effective balance of skills and experience on the Board.
IndependenceThe Code recommends that, as a Company outside of the FTSE 350, the Company should have at least two independent Non-Executive Directors. During the year under review, the now former Chairman (Jonson Cox), previously held the role as an executive of the Company prior to the restructuring of the former UK Coal in 2012, thereafter continuing in the role in a non-executive capacity. As such, the Board recognised that he was not independent. Jonson Cox stepped down as Chairman on 6 March 2018 and resigned as a Non-Executive Director on 31 March 2018. He was replaced as Chairman on 7 March 2018 by Alastair Lyons. The Board considers that the new Chairman is independent. The Board considers that Lisa Clement, Anthony Donnelly and Andrew Cunningham are independent.The Board recognises that Steven Underwood, who is a Director and representative of the Peel Group, which is the largest Shareholder in the Company, and Martyn Bowes, who is the representative of the Pension Protection Fund, which holds 25% of the issued capital, are not independent. The Board considers that their skills and experience are relevant to the business and they contribute to the realisation of the Group’s strategy. Both Shareholder relationships are governed by relationship agreements.Going forward, there will be four independent and four non-independent directors on the Board. The Board considers this balance to be appropriate, but will keep the position under review, particularly given that the proposed new Code provides that a majority of the Board, including the Chairman, should be independent.

66 Harworth Group plc Annual Report and Financial Statements 2017
Statement of Corporate Governancecontinued
Role/Committee Key responsibilities
Chairman Jonson Cox(Alastair Lyons, from 7 March 2018)
• Overall leadership of the Board, with responsibility for ensuring its effectiveness by facilitating a constructive dialogue between the Board and the Executive Committee
• Ensures that a fixed schedule of matters is retained for the Board’s review and approval • With support from the Company Secretary, sets the annual Board agenda programme and
Board meeting agendas, ensures that directors receive accurate, timely and clear information, and ensures that there is adequate time available for discussion of agenda items in particular strategic issues
• Ensures there is ongoing and effective communication with Shareholders• Ensures that the Board identifies the Group’s key stakeholders, that there is appropriate
engagement with them, and their interests are considered when decisions are made
Chief ExecutiveOwen Michaelson
• Responsible for all operational matters within the parameters of the authorities delegated by the Board
• Leads on the formulation of strategy which, once agreed by the Board, falls to him to implement• Leads and chairs the Executive Committee• Responsible for the Group’s risk profile, including health and safety and environmental policies,
procedures and matters• Ensures that the Board is appraised of all material matters• Responsible for the Company’s profile with Shareholders• Leads the establishment and maintenance of an appropriate culture and code of ethics for
the Group• Responsible for formulation and implementation of people strategy
Finance DirectorAndrew Kirkman
• Supports the Chief Executive on strategy and risk• Leads on all financial matters, including tax and treasury• Responsible for leading the raising of any new equity capital• Leads on investor relations• Reviews the financial analysis of all major transactions including acquisitions, sales and
capital investments • Leads on M&A and portfolio acquisitions• Responsible for insurance and pensions, in conjunction with the Company Secretary• Responsible for internal controls, systems and processes, in conjunction with the Company
Secretary
Senior Independent DirectorLisa Clement
• Provides a sounding board for the Chairman• Acts as an intermediary for other Non-Executive Directors• Available to Shareholders if they have concerns where communication through the Chairman or
Executive Directors is not successful or appropriate• Leads the process for appointing a new Chairman• Leads the annual appraisal of the Chairman’s performance
Non-Executive DirectorsLisa Clement Anthony DonnellyAndrew CunninghamSteven UnderwoodMartyn Bowes
• Help to formulate a strategy for the Group and monitor the delivery of that strategy• Provide constructive challenge to the Executive Directors on matters referred to the Board• Scrutinise the performance of the business against the strategy, agreed objectives and targets• Review and scrutinise financial information and internal risk controls• Available for meetings if requested by major Shareholders
Statement of Corporate Governancecontinued

STRATEGIC REPORTCORPORATE GOVERNANCE
FINANCIAL STATEMENTS
Harworth Group plc Annual Report and Financial Statements 2017 67
Role/Committee Key responsibilities
Remuneration Committee Lisa Clement (chair)Anthony DonnellyJonson Cox (Alastair Lyons from 7 March 2018)Steven Underwood
• Determines and agrees with the Board the Company’s remuneration policy for Executive Directors
• Determines the salaries, bonuses, long-term incentive arrangements, pension arrangements, other benefits and contract terms of the Executive Directors and members of the Executive Committee
• Determines the long-term incentive arrangements of the Senior Management Team• Monitors salary and bonus levels of all employees• Approves grant of options for Save-As-You-Earn Scheme• Carries out an annual review of benefits available to all Group employees• Responsible for changes to certain Group-wide employment policies
Nomination Committee Jonson Cox (chair) (Alastair Lyons from 7 March 2018)Lisa ClementAndrew Cunningham
• Leads the process for Board appointments by making recommendations to the Board, both for filling Board vacancies and appointing additional persons to the Board, following evaluation of the balance of skills, knowledge and experience on the Board
• Carries out a regular review (typically annually) of succession and development planning for the Executive Directors, the Chairman and Non-Executive Directors and members of the Executive Committee, to maintain an appropriate balance of skills and experience on the Board and on the Executive Committee
• Considers and makes recommendations to the Board on its composition, balance and membership and on the endorsement of Directors for re-election at the AGM
Note: the Chairman will not chair the Committee when it deals with the appointment of a successor to the chairmanship. This process will be led by the Senior Independent Director (and was in 2017)
Audit Committee Andrew Cunningham (chair)Anthony DonnellySteven Underwood
• Reviews the integrity of the Company’s annual and interim reports, preliminary and interim results announcements and any other formal announcements relating to its financial performance
• Reviews the effectiveness of the Group’s system of internal financial and risk controls.• Reviews the Group’s insurance programme.• Reviews the terms of appointment, independence, effectiveness and remuneration of the
Company’s external auditors and makes recommendations to the Board on the reappointment of the external auditors. Leads the re-tendering process for the appointment of external auditors, if applicable.
• Reviews and if necessary updates the Group’s risk register.• Reviews the Group’s anti-bribery policy (including an annual review of the Group’s hospitality
register) and other policies relating to financial security, business ethics and compliance• Reviews the adequacy of the Group’s cyber-security measures and business continuity plans
and procedures
Group General Counsel and Company SecretaryChris Birch
• Secretary to the Board and its committees• Ensures that all Board reserved matters are referred to the Board for review and approval and
that all Board procedures are complied with• Advises on regulatory compliance (including GDPR, Bribery Act, Modern Slavery Act, Criminal
Finances Act) and Corporate Governance• Prepares Board and committee agendas and collates and distributes papers • Available to advise the Directors on all legal and compliance matters• Assists the Chairman with Board evaluations and Director inductions and development• Responsible for internal controls, systems and processes, in conjunction with the Finance
Director• Responsible for insurance and pensions, in conjunction with the Finance Director• Responsible for cyber-security and business continuity planning and procedures• Manages EES team

68 Harworth Group plc Annual Report and Financial Statements 2017
Statement of Corporate Governancecontinued
Board activities in 2017The activities of the Board during the year ended 31 December 2017 included (operational approvals not listed):
Month Activities Strategy DeliveryRisk and
governance FinanceShareholder
relations
January Capital Markets Day ✔
Annual update from AD of EES ✔
Capital Growth operational update ✔
February FYE 2016 Preliminary results and final dividend ✔ ✔
Board evaluation feedback and action points ✔
Acquisitions operational update ✔
March Approval of share placing ✔ ✔ ✔
FYE 2016 Annual Report and Financial Statements ✔ ✔
Income Generation operational update ✔
April Public sector funding update ✔
Feedback from preliminary results investor roadshow ✔
Capital Growth operational update ✔
May Annual General Meeting ✔
H2 investor relations programme ✔
Acquisitions operational update ✔
June People plan ✔ ✔ ✔ ✔
July FYE 2017 Interim results ✔ ✔
Income Generation update ✔
September Strategy review ✔
Feedback from interim results investor roadshow ✔
October Emerging government policies ✔
Capital Growth operational update ✔
November Draft budget and strategic plan ✔ ✔
Extension of term of revolving credit facility ✔
Real Estate market - broker update ✔
December Final budget and strategic plan ✔ ✔
Insurance programme renewal ✔
Prospective appointment of new Chairman ✔
Board diversityThe Board recognises that, to enable it to meet its responsibilities, it is important that the Board’s composition is sufficiently diverse so as to reflect a broad range of skills, knowledge and experience.The Board is acutely aware of the fact there is only one woman and no individuals of an ethnic minority amongst the Board and Executive Committee and only two women and no individuals of an ethnic minority on the Senior Management Team. The Board recognises that the Company faces a significant challenge to address the significant, historic imbalances in the workforce and is committed to doing so over time. The Board has not, and will not, set arbitrary numerical targets for diversity and future appointments will continue to be made based on merit and objective criteria to ensure that the best candidates are appointed for all roles. However, diversity is an active and important consideration in all succession plans and Harworth is committed to giving women and ethnic minorities every opportunity to apply for the new and replacement roles for which we recruit, as the business continues to grow, and to ensuring that there are adequate measures in place to support their progress and development within the organisation. Further information on the Group’s diversity policy and initiatives appears in the ‘Our People’ section of this report on pages 55 to 57.
Insurance and advice for DirectorsThe Company maintains an appropriate level of Directors and Officers insurance for claims made against the Directors in that capacity. That insurance does not extend to fraudulent or dishonest activity. All Directors have access to the advice and services of the Company Secretary. The Board has established a procedure by which any Director, for the purpose of furthering his or her duties, may take independent professional advice at the Company’s expense. No Director had reason to use this facility in 2017.
Contractual terms and conditionsThe Chief Executive and the Finance Director have service contracts, which may be terminated by the Company on not more than six months’ notice. Termination of the Chairman’s appointment is also subject to six months’ notice, whilst the appointments of all other Non-Executive Directors are subject to three months’ notice. There are no Directors on fixed term contracts. There are no contractual clauses that give any of the Directors an entitlement to compensation exceeding their due payment in lieu of notice.

STRATEGIC REPORTCORPORATE GOVERNANCE
FINANCIAL STATEMENTS
Harworth Group plc Annual Report and Financial Statements 2017 69
External appointments, conflicts of interest and time commitmentUpon appointment, each Director is required to notify the Company of its external board appointments, other significant commitments and any actual or potential conflict of interest. Where a Director proposes to take on additional external responsibilities, the Chairman and Chief Executive, with advice from the Company Secretary, consider whether such appointment could give rise to potential conflicts of interest. Each Director has an opportunity to disclose actual or potential conflicts of interests to the Board, either by way of general notice or at the beginning of each Board meeting and Board committee meeting. The Articles of Association provide that the Board can authorise actual and potential conflicts of interest of Directors.Where actual or potential conflicts of interest arise, the relevant Director does not receive Board papers and is excluded from discussions and voting on the subject matter that gives rise to the conflict. Steven Underwood and Martyn Bowes are Board representatives of the Peel Group and the Pension Protection Fund respectively. The Board has approved any actual or potential conflicts of interest that may arise as a result thereof. Steven Underwood has previously declared by way of general notice, and the Board has approved, a potential conflict of interest arising from the fact that he is Peel Group’s Board representative and an executive Director of a number of Peel Group companies one or more of which may deal with Harworth at an operational level from time to time. These include Peel Environmental Limited (“PEL”), with whom Harworth Estates Limited entered into certain joint venture arrangements in 2011. Those joint venture arrangements were varied during 2017, with the approval of Shareholders at the 2017 Annual General Meeting. This resulted in options being granted to PEL in respect of three sites (also approved by Shareholders). PEL exercised two of those options during the second half of 2017. During 2017, the Board also considered a prospective sale of land to a joint venture to which the Peel Group were party. That sale did not proceed. The joint venture variations (including the new options granted to PEL) and prospective sale gave rise to conflicts of interest for Steven Underwood. Whilst those conflicts were approved by the Board, Steven Underwood did not receive Board papers, was not present for any Board discussions relating to, and did not vote on, those matters. Andrew Cunningham has previously declared by way of general notice, and the Board has approved, a potential conflict of interest arising from his appointment as Non-Executive Director of The Banks Group Limited and the fact that Harworth Estates Limited has entered into a joint venture arrangement with Banks Property Limited for the remediation, promotion and sale of land at the former Bates Colliery in Blyth. No actual conflict of interest has arisen. Andrew Cunningham has also made a general declaration of interest in connection with his appointment as a Commissioner of The Port of Blyth but no conflict of interest has arisen in this regard. During 2017, the Board approved Owen Michaelson’s appointment to the Board of the Sheffield City Region Local Enterprise Partnership. No conflicts of interest have arisen as a result of that appointment. The Executive Directors are also Directors of a number of Group subsidiary companies.Each Non-Executive Director is aware of the need to allocate sufficient time to the Company to discharge their responsibilities effectively. This includes Board and Board committee meetings, attendance at the Annual General Meeting, site visits, CPD, participation in evaluations, participation in the recruitment of
Directors to the Board, and meetings with employees, shareholders and other stakeholders, where appropriate.
Tenure and re-electionThe Articles of Association of the Company provide that one third of the Directors should be subject to re-election by Shareholders. The Board considers it good practice for all Directors to be subject to election or re-election at every Annual General Meeting and, as such, all Directors will stand for election or re-election by Shareholders at the 2018 Annual General Meeting.The terms of appointment of all Directors appear on pages 60 and 61. The Board is mindful that, under the Code, Non-Executive Directors will be deemed to lose their independence after nine years in office and that Anthony Donnelly (taking account of his time as a director of HEPGL and the “Harworth Estates” division of UK Coal) and Lisa Clement have been on the Board for over 7 years and 6 years, respectively. As such, having secured the appointment of a new Chairman, the Nomination Committee’s focus will now turn to plans for their succession.
EffectivenessInduction, professional development and external adviceThe Chairman and the Company Secretary are responsible for preparing and coordinating an induction programme when new Directors are appointed to the Board. Following Board evaluation feedback, the induction programme for new Directors has been improved and Alastair Lyons has recently undertaken an extensive induction in the period leading up to his appointment in March 2018. Also in response to Board evaluation feedback, steps were taken during 2017 to introduce some more structure to the CPD of Directors. Board packs now include external CPD briefings for Directors, with a short synopsis prepared by the Company Secretary. In addition, the Company Secretary provides written and verbal updates to the Board and the Board committees, as appropriate, on governance and regulatory changes, such as the General Data Protection Regulation and proposals for revisions to the Code. Annually, external professional firms will deliver CPD workshops for the Board and Board committees. KPMG hosted a session with the Board in October 2017 and plans are in place for DLA to do the same in 2018, with similar sessions timetabled for the Board committees. Performance evaluationFormal Board and Board committee evaluations are now undertaken annually. The first set of committee evaluations were undertaken in the second half of 2017, led by the committee chairs alongside the Company Secretary. A second full Board evaluation was undertaken in the first quarter of 2018. The results reflected improvements made during 2017 in response to feedback from the 2016 evaluation but also identified areas for continuous improvement, which will be explored in the second half of 2018. Aligned with the Code requirements for FTSE 350 companies, the Company intends to instruct an external Board evaluation towards the end of 2018. Annual appraisals of each Non-Executive Director are also undertaken on a rolling basis.
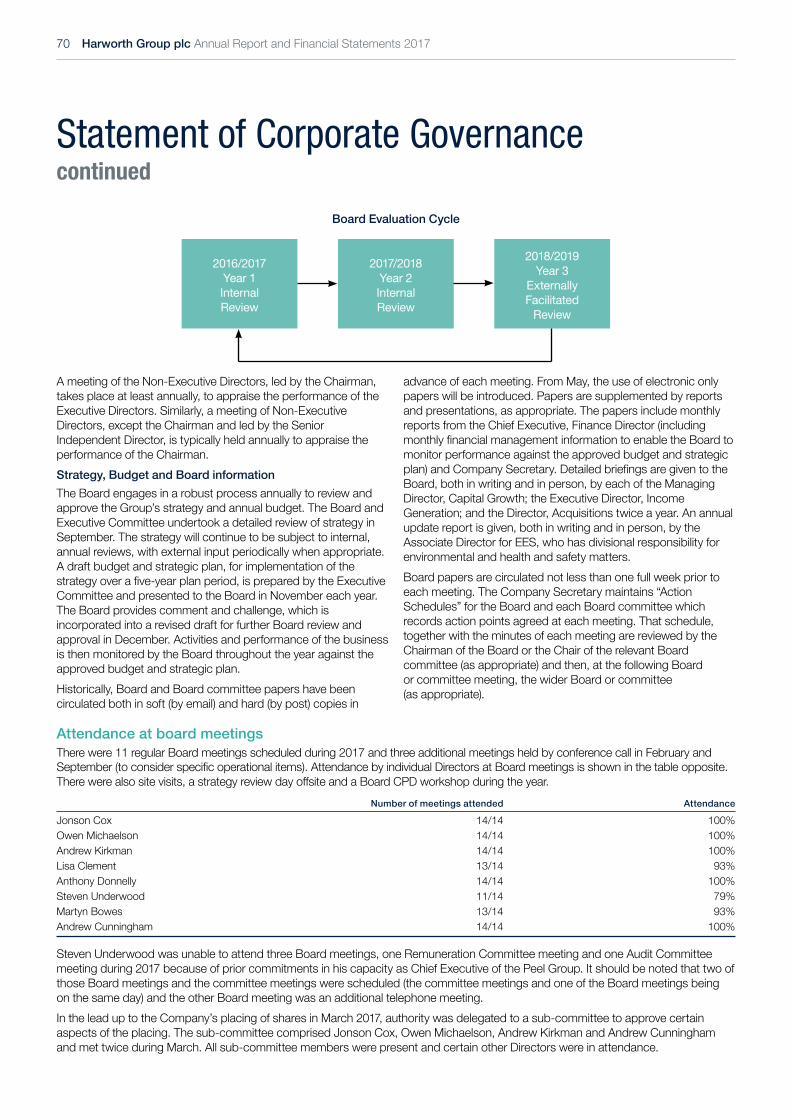
70 Harworth Group plc Annual Report and Financial Statements 2017
Statement of Corporate Governancecontinued
A meeting of the Non-Executive Directors, led by the Chairman, takes place at least annually, to appraise the performance of the Executive Directors. Similarly, a meeting of Non-Executive Directors, except the Chairman and led by the Senior Independent Director, is typically held annually to appraise the performance of the Chairman.Strategy, Budget and Board informationThe Board engages in a robust process annually to review and approve the Group’s strategy and annual budget. The Board and Executive Committee undertook a detailed review of strategy in September. The strategy will continue to be subject to internal, annual reviews, with external input periodically when appropriate. A draft budget and strategic plan, for implementation of the strategy over a five-year plan period, is prepared by the Executive Committee and presented to the Board in November each year. The Board provides comment and challenge, which is incorporated into a revised draft for further Board review and approval in December. Activities and performance of the business is then monitored by the Board throughout the year against the approved budget and strategic plan. Historically, Board and Board committee papers have been circulated both in soft (by email) and hard (by post) copies in
advance of each meeting. From May, the use of electronic only papers will be introduced. Papers are supplemented by reports and presentations, as appropriate. The papers include monthly reports from the Chief Executive, Finance Director (including monthly financial management information to enable the Board to monitor performance against the approved budget and strategic plan) and Company Secretary. Detailed briefings are given to the Board, both in writing and in person, by each of the Managing Director, Capital Growth; the Executive Director, Income Generation; and the Director, Acquisitions twice a year. An annual update report is given, both in writing and in person, by the Associate Director for EES, who has divisional responsibility for environmental and health and safety matters. Board papers are circulated not less than one full week prior to each meeting. The Company Secretary maintains “Action Schedules” for the Board and each Board committee which records action points agreed at each meeting. That schedule, together with the minutes of each meeting are reviewed by the Chairman of the Board or the Chair of the relevant Board committee (as appropriate) and then, at the following Board or committee meeting, the wider Board or committee (as appropriate).
Attendance at board meetingsThere were 11 regular Board meetings scheduled during 2017 and three additional meetings held by conference call in February and September (to consider specific operational items). Attendance by individual Directors at Board meetings is shown in the table opposite. There were also site visits, a strategy review day offsite and a Board CPD workshop during the year.
Number of meetings attended Attendance
Jonson Cox 14/14 100%Owen Michaelson 14/14 100%Andrew Kirkman 14/14 100%Lisa Clement 13/14 93%Anthony Donnelly 14/14 100%Steven Underwood 11/14 79%Martyn Bowes 13/14 93%Andrew Cunningham 14/14 100%
Steven Underwood was unable to attend three Board meetings, one Remuneration Committee meeting and one Audit Committee meeting during 2017 because of prior commitments in his capacity as Chief Executive of the Peel Group. It should be noted that two of those Board meetings and the committee meetings were scheduled (the committee meetings and one of the Board meetings being on the same day) and the other Board meeting was an additional telephone meeting.In the lead up to the Company’s placing of shares in March 2017, authority was delegated to a sub-committee to approve certain aspects of the placing. The sub-committee comprised Jonson Cox, Owen Michaelson, Andrew Kirkman and Andrew Cunningham and met twice during March. All sub-committee members were present and certain other Directors were in attendance.
2016/2017 Year 1 Internal Review
2017/2018 Year 2 Internal Review
2018/2019 Year 3
Externally Facilitated
Review
Board Evaluation Cycle

STRATEGIC REPORTCORPORATE GOVERNANCE
FINANCIAL STATEMENTS
Harworth Group plc Annual Report and Financial Statements 2017 71
Internal controls and riskThe Board acknowledges its responsibility for identifying business risks, determining risk appetite and ensuring the maintenance of a robust system of internal controls and processes to monitor and manage risk. Pages 38 to 43 of the Strategic Report identify the principal risks and uncertainties facing the Group, the current risk profile of the business and the anticipated movements in that profile over the next 12 months. Page 37 of the Strategic Report and page 89 of the Audit Committee report explain how internal controls and processes for managing risk are monitored, which now includes an annual external review of certain controls and of the Group’s need for an internal audit function. The principal internal controls of the Group are summarised below. Based on the Audit Committee’s most recent review, the Board is satisfied that there are in place effective systems for managing and mitigating significant risk.Delegated authoritiesThe Company’s delegated authorities policy determines matters reserved exclusively for the Board and also provides a framework for decision-making throughout the business. It was subject to a detailed review and update in November 2016.Cash managementTreasury actions of the Company are limited and controlled jointly by the Finance Director, Chief Executive and Company Secretary who are responsible for placing deposits, for arranging borrowings and for making payments.Risk register During 2017, as part of its ongoing continual improvement programme, the Group undertook another detailed review of its principal risks and uncertainties. This review was led by our Company Secretary in conjunction with the Board, the Audit Committee, the Executive Committee and the Senior Management Team. This review has led to a further refinement of the Group’s Risk Register. Further details are set out in the Strategic Report on pages 36 to 43.
Communication with ShareholdersThe Board places great emphasis on open and regular communications with Shareholders. The Chief Executive and Finance Director meet and present to large investors, institutional Shareholders and analysts after the publication of the Company’s preliminary and interim results. The Company also hosted a Capital Markets Morning in January 2017 in London for existing and potential institutional Shareholders with the purpose of better explaining how the Group drives value from its portfolio. A briefing and collection of site visits for institutional Shareholders and analysts is planned for June of this year with a similar objective. The Board regularly receives feedback from the Company’s brokers and the Executive Directors on the views of major Shareholders, particularly after publication of annual and half-year results. It receives and reviews quarterly reports on the main changes to the composition of the Company’s share register and copies of notes prepared by analysts.The Company benefits from there being representatives on the Board from its two largest Shareholders. They provide ongoing Shareholder feedback and perspective on key strategic decisions.The Chairman and Senior Independent Director are available to meet with the Company’s Shareholders, on request, to discuss governance and strategy. The Company Secretary is also available and deals with Shareholder queries throughout the year.
The Company has a planned programme of announcements throughout the year, prepared by our Associate Director of Partnerships and Communications with support from FTI Consultancy and reviewed regularly by the Board to ensure that investors are updated regularly on progress in the business. The annual and interim reports, together with the www.harworthgroup.com website, are our principal means of communication with all Shareholders during the year. Copies of all reports, Shareholder presentations and communications are available on the investors section of the website.The Chairman, Senior Independent Director and/or Company Secretary will engage with Shareholders in the event of a substantial vote against any resolution proposed at an Annual General Meeting.
Annual General MeetingThe Board encourages Shareholders to attend, participate and exercise their right to vote at the Annual General Meeting. The Annual Report and Financial Statements and Notice of Annual General Meeting are sent to Shareholders at least 20 working days before the meeting. The resolutions to be proposed at the Annual General Meeting to be held on 29 May 2018, together with the explanatory notes, appear in the separate Notice of Annual General Meeting accompanying this Annual Report. The Notice is also available on our website at www.harworthgroup.com/investors/reports-presentations. Separate resolutions are proposed on each substantially separate issue. All Directors normally attend the Annual General Meeting and are available to answer questions, both formally during the meeting and informally both before and after the meeting. The Board welcomes questions from Shareholders.For each resolution the proxy appointment forms provide Shareholders with the option to direct their proxy vote either for or against the resolution or to withhold their vote. All valid proxy appointments are properly recorded and counted. Information on the number of shares represented by proxy, the proxy votes for and against each resolution, and the number of shares in respect of which the vote was withheld for each resolution, together with the voting result, are given at the meeting and made available on the Company’s website. A vote withheld will not be counted in the calculation of the proportion of the votes for and against a resolution.
The Statement of Corporate Governance has been approved by the Board on its behalf by:Jonson Cox Chairman (as at 31 December 2017) 24 April 2018
72 Harworth Group plc Annual Report and Financial Statements 2017
Directors’ remuneration report
Chair’s introductionDear Shareholder,On behalf of the Board, I am pleased to present the Directors’ Remuneration Report for the year ended 31 December 2017, for which we will be seeking approval at the Annual General Meeting on 29 May 2018.
The Remuneration PolicyThe Company’s Remuneration Policy has been designed to support the Group’s strategy and help retain and incentivise a management team with the requisite skills, knowledge and experience to deliver strong, long-term, sustainable growth for Shareholders. We believe that the remuneration of the Executive Directors reflects appropriately the strong performance of the Group and management’s contribution. The Remuneration Policy was approved by Shareholders at the 2016 Annual General Meeting with over 99% shareholder support.
This reportThis report is divided into 3 sections: this Chair’s introduction, an ‘at a glance’ summary of the Remuneration Policy, and the annual Directors’ remuneration report, which explains how the policy was implemented in 2017 and how it will be implemented in 2018.This report has been prepared in accordance with the provisions of the Companies Act 2006 and the Large and Medium-sized Companies and Groups (Accounts and Report) (Amendment) Regulations 2013 (the Regulations). It also meets the requirements of the UK Listing Authority’s Listing Rules and the Disclosure and Transparency Rules and the principles of the Code on a comply or explain basis. In accordance with the Regulations, the following sections of the Directors’ remuneration report are subject to audit: the single total figure of remuneration for Directors and accompanying notes (pages 78 and 79); scheme interests awarded during the financial year (pages 80 and 81); payments to past Directors (page 82); and the statement of Directors’ shareholdings and share interests (page 84). The remaining sections of the report are not subject to audit.
Salary increases for 2018The salary of the Chief Executive has been increased by 2.5%, in line with the median salary increases applied across the wider workforce. With effect from 1 January 2018, the salary of the Finance Director has been increased from £205,000 to £235,000, in recognition of the additional responsibility he has taken on for leading the Group’s M&A and large-scale (portfolio) acquisition activity, in furtherance of the Group’s ambitious plans for growth.
PensionThe pension arrangements of the Executive Directors remain unchanged. They may elect to receive a pension contribution of 10% of salary (which is consistent with the contributions made for all other employees) or an equivalent cash allowance.
Members and attendance at meetings during the year ended 31 December 2017
Lisa ClementChair and Senior Independent Director
4(4)
Anthony DonnellyIndependent Non-Executive Director
4(4)
Steven UnderwoodNon-Executive Director (not independent)
3(4)
Jonson CoxChairman (not independent)
4(4)
Key responsibilities
• Determines and agrees with the Board the Company’s remuneration policy for Executive Directors.
• Determines the salaries, bonuses, long-term incentive arrangements, pension arrangements, other benefits and contract terms of the Executive Directors and members of the Executive Committee.
• Determines the long-term incentive arrangements of the Senior Management Team.
• Monitors salary and bonus levels of all employees.• Approves grant of options for Group Save-As-You-Earn Scheme.• Carries out an annual review of benefits available to all Group
employees.• Responsible for changes to certain Group-wide employee
policies.
The Committee’s terms of reference, which were last reviewed and updated in December 2017, are set out on the Company’s website and can be found at www.harworthgroup.com/investors/governance/The Board undertakes an annual evaluation of the Committee’s performance to ensure its continued ability to discharge its key responsibilities.
Directors’ remuneration report

STRATEGIC REPORTCORPORATE GOVERNANCE
FINANCIAL STATEMENTS
Harworth Group plc Annual Report and Financial Statements 2017 73
BonusThe annual bonus will continue to operate on the basis of a combination of financial performance (including NNNAV, sales volume, strategic business development and profit excluding value gains), and personal objectives. The Chief Executive’s bonus opportunity has been increased to 125% for 2018 only. This remains below the exceptional limit of 150% approved by Shareholders. This is the first time that the Chief Executive’s bonus opportunity has exceeded 100% of salary and reflects the additional stretch in the targets for 2018. Any payment of bonus in excess of 100% of salary will be deferred for one year, in accordance with the Remuneration Policy. The financial performance targets and personal/strategic objectives for the Chief Executive’s 2018 bonus will be reported in the 2019 Annual Report. With effect from 1 January 2018, the bonus opportunity of the Finance Director has been increased to 100%. This is an ongoing increase in recognition of the additional responsibility he has taken on for leading the Group’s M&A and large-scale (portfolio) acquisition activity, in furtherance of the Group’s ambitious plans for growth.
Long Term Incentive Plan At the 2016 Annual General Meeting, Shareholders approved the adoption of a new Long Term Incentive Plan (LTIP) with over 99% Shareholder support. The first awards under that LTIP were made to Executive Directors and other members of the Executive Committee shortly after the 2016 Annual General Meeting. Following a review of the performance measures adopted for the 2016 awards, the Committee concluded that those measures remained appropriate. However, for the 2017 awards the total returns performance targets were considered by the Committee and adjusted to range from 8% p.a. (threshold) to 12% p.a. (stretch) having ranged from 8% p.a. (threshold) to 14% p.a. (stretch) for the 2016 awards, to align better with the Company’s plans over the relevant 3 years. For the 2018 LTIP awards the performance measures and targets remain unchanged.
Key activities of the Committee since publication of the 2016 Annual Report
• Reviewing the 2016 Remuneration Policy approved by Shareholders to ensure it continues to align with Group strategy and Shareholders’ interests.
• Approving the 2017 Directors’ Remuneration Report.• Approving base salary increases for the Executive Directors and
members of the Executive Committee and an increase in bonus entitlement for the Executive Directors.
• Adjudicating 2017 bonus outcomes.• Approving 2018 bonus targets.• Approving the vesting of awards under the Harworth Estates
Property Group Limited 2012 LTIP.• Reviewing performance for the 2016 and 2017 LTIP awards and
projections for those awards.• Approving 2018 LTIP awards and performance measures for the
Executive Committee and Senior Management Team.• Reviewing a report on Group-wide remuneration for 2018. • Carrying out an annual review of Group-wide employee benefits.• Approving invitations and grant of options pursuant to the
Group-wide Save As You Earn Scheme.• First meeting with People Steering Group, attended by the Chair
of the Committee.• Review of gender-pay gap calculations.
Shareholding guidelinesDuring 2016, the Committee introduced shareholding guidelines of 100% of gross salary for Executive Directors. Until the relevant shareholding levels are attained, 50% of any long-term incentive which vests to the relevant Executive Director (after payment of tax) must be retained.
Senior management deferred share bonus planDuring 2017, the Committee approved the adoption of a deferred share bonus plan for the Senior Management Team, to help align senior management with Shareholders’ interests, and to retain and incentivise senior members of the team who make a significant contribution to value growth, but are not members of the Executive Committee and so do not participate in the LTIP. The first awards under that new scheme were made in 2017 alongside the 2017 LTIP awards to the Executive Committee. Those awards vest subject to absolute total return achieving the same performance targets as in the LTIP. Further awards have been made to the Senior Management Team under the plan alongside the 2018 LTIP awards to the Executive Committee. The absolute total return performance targets remain unchanged. Any awards that vest will be satisfied with shares purchased in the market.
Harworth Estates long term incentive plan (2012)Following the establishment of Harworth Estates as a standalone business at the end of 2012, a one-off cash-based long-term incentive plan was introduced by HEPGL to reward value created by the Group in the period 1 January 2013 to 31 December 2017. Awards under that scheme vested upon approval of the Group’s financial statements for the year ended 31 December 2017 and payments were made in March this year. The payments made to the Chief Executive and Finance Director are included in the Single Total Figure of Remuneration for Executive Directors which appears on page 78. It is important to note that this scheme was a one-off scheme and covered performance over a five-year period.
Chairman and Non-Executive DirectorsThe fees for the Chairman (£160,000) and the basic fees for Non-Executive Directors (£42,500) have remained unchanged during 2017. Andrew Cunningham received an additional fee of £7,500 for chairing the Audit Committee, and I received additional fees of £7,500 for chairing the Remuneration Committee and £3,000 as Senior Independent Director. The additional fees for Committee Chairs remain unchanged for 2018. With effect from 1 January 2018, the additional fee payable to the Senior Independent Director has been increased to £7,500, in recognition of the increased time commitment that the role at Harworth entails. This increase was determined by the Chairman and Executive Directors in accordance with the Company’s Remuneration Policy. The Committee considers that NED fees appropriately reflect the work and responsibilities associated with each role.
Save As You Earn SchemeAt the 2017 Annual General Meeting, Shareholders approved a Save As You Earn Scheme for all employees. Following that approval, employees were invited to participate in the scheme and shares were offered to participants at a 20% discount to the prevailing market value. It was pleasing to see that more than half of our employees chose to participate in the scheme. It is the intention that invitations to participate in the scheme will be sent annually and the 2018 invitations have been issued following publication of the preliminary results for the year ended 31 December 2017.

74 Harworth Group plc Annual Report and Financial Statements 2017
Directors’ remuneration reportcontinued
Directors’ remuneration reportcontinued
Gender pay gap reportingAlthough not obliged to publish a gender pay gap report, the Company acknowledges the challenge it faces to improve gender and ethnic diversity at all levels of the business and wants to be transparent about the extent of that challenge and the progress it is making in meeting it. As such, we have decided to voluntarily report on the Company’s gender pay gap within the ‘Our People’ section of this report at page 57.
Engagement with our employeesThe Board recognises the importance of engaging with, and considering the interests of, the Group’s employees in its decisions. The Committee ensures it is aware of the remuneration and benefits of the wider workforce when setting remuneration packages of Executive Directors and Executive Committee members. The Committee already undertakes an annual review of Group-wide benefits and reviews a report prepared by the Head of HR and Organisation Development on Group-wide salary increases and bonus payments, which informs the
Committee’s decisions on Executive Director and Executive Committee remuneration. The Committee also oversees awards under the senior management deferred share bonus plan. In my capacity as Chair of the Committee, I met with the newly formed People Steering Group in March 2018, together with Martyn Bowes. That meeting was the first of a regular programme of meetings between members of the Board and the People Steering Group at which the Board will engage with employee representatives on a host of issues including remuneration.I will be available at the Annual General Meeting to respond to questions and discuss any aspect of the Remuneration Policy, annual Remuneration report or the Committee’s activities. Lisa Clement Chair of Remuneration Committee 24 April 2018

STRATEGIC REPORTCORPORATE GOVERNANCE
FINANCIAL STATEMENTS
Harworth Group plc Annual Report and Financial Statements 2017 75
Remuneration Policy – at a glance Our Remuneration Policy was approved by Shareholders at the 2016 AGM with more than 99% of votes in favour and is expected to continue until 2019. The full policy can be found in the 2015 Annual Report, which is also on the Company’s website (www.harworthgroup.com/investors/reports-presentations/), and a summary is outlined below.
Remuneration principles
Attract, retain and motivate high calibre executives
Reflect best practice, investor expectations and pay conditions
across the workforce
Reward exceptional performance
Align pay with the Group’s long-term strategic plan and
value created for Shareholders
SalaryWhat is it for? How is it determined? How much is it?
To provide competitive base reward that recognises the individual’s skill and experience
Salaries are reviewed annually with reference to similar roles at comparable companies, individual contribution and experience, and the average pay review across the workforce
+2.5% for Chief Executive for 2018, in line with average annual pay review across the Group. An above-average increase for the Finance Director to reflect increase in responsibilities.
1 January 2017 1 January 2018CEO £301,000 £308,525FD £205,000 £235,000
Pension and benefitsWhat is it for? What does it consist of? How much is it?
To provide competitive benefits Group pension scheme or cash in lieuCar allowance and fuel (or such other benefits that the Committee deems appropriate)
10% of salary
Varies by role and individual circumstances, cost is reviewed periodically
Annual bonusWhat is it for? How does it operate? What performance is measured? How much is it?
To incentivise and reward strong performance against financial and personal annual targets, aligned with progress against the strategic plan and value delivered to Shareholders
Paid in cash*Malus and clawback apply (up to 2 years post-employment) in case of misconduct, misstatement, miscalculation or at the Committee’s discretion*If bonuses are (exceptionally) >100% of salary, any amount over 100% of salary would be deferred in shares for up to 3 years
At least 75% financial and no more than 25% personal, with Committee discretion to add underpins or override outcomes if they are misaligned with underlying performance 2018 performance conditions: CEO FDFinancial* 76% 75%Personal** 24% 25%Payment subject to health and safety, business reputation, covenant compliance, financial irregularity and leadership underpins * EPRA NNNAV gains: 47% (CEO) 60% (FD), sales volume: 12% (CEO) 15% (FD), profit excluding value gains: 8% (CEO) 10% (FD) and strategic development of the business: 33% (CEO) 15% (FD)** Payments for achieving personal/strategic objectives may be reduced in the event targets are missed
Up to 100% of salary (or exceptionally 150%)
Maximum for 2018:CEO 125% of salaryFD 100% of salary
What pays out?(as a % of maximum)
Below Target 0%Target 50%Maximum 100%
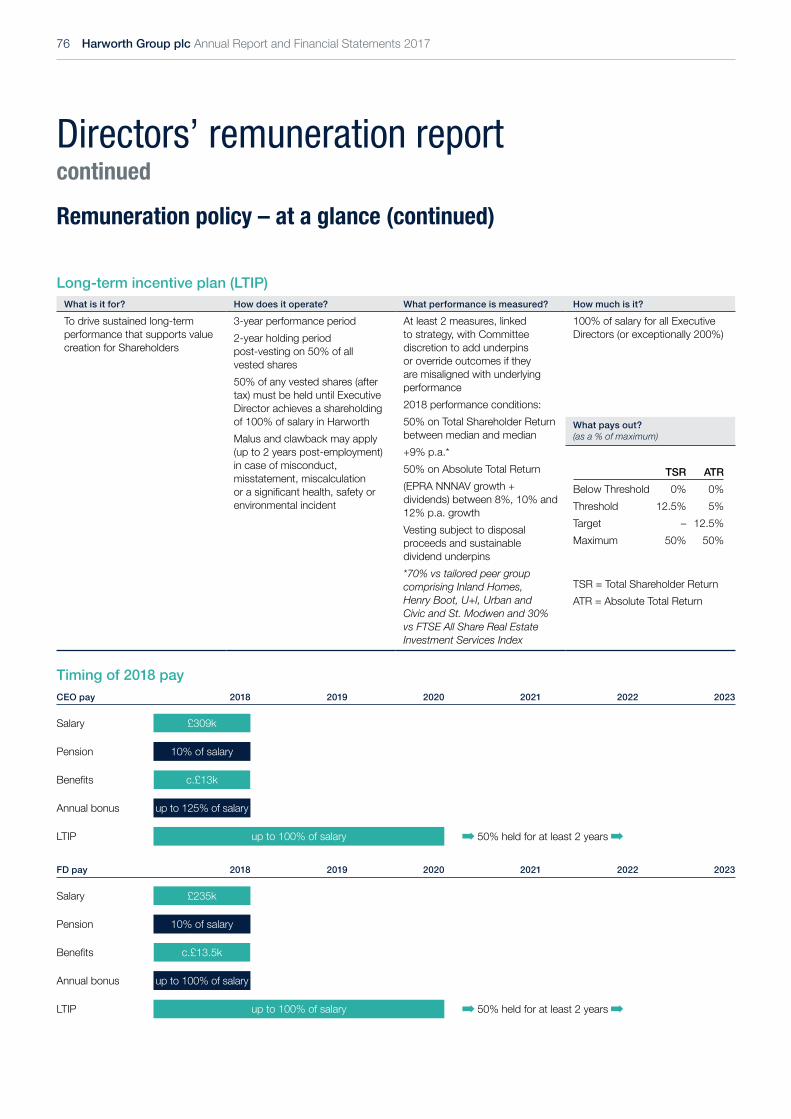
76 Harworth Group plc Annual Report and Financial Statements 2017
Directors’ remuneration reportcontinued
Long-term incentive plan (LTIP)What is it for? How does it operate? What performance is measured? How much is it?
To drive sustained long-term performance that supports value creation for Shareholders
3-year performance period2-year holding period post-vesting on 50% of all vested shares50% of any vested shares (after tax) must be held until Executive Director achieves a shareholding of 100% of salary in HarworthMalus and clawback may apply (up to 2 years post-employment) in case of misconduct, misstatement, miscalculation or a significant health, safety or environmental incident
At least 2 measures, linked to strategy, with Committee discretion to add underpins or override outcomes if they are misaligned with underlying performance2018 performance conditions:50% on Total Shareholder Return between median and median +9% p.a.*50% on Absolute Total Return (EPRA NNNAV growth + dividends) between 8%, 10% and 12% p.a. growthVesting subject to disposal proceeds and sustainable dividend underpins *70% vs tailored peer group comprising Inland Homes, Henry Boot, U+I, Urban and Civic and St. Modwen and 30% vs FTSE All Share Real Estate Investment Services Index
100% of salary for all Executive Directors (or exceptionally 200%)
What pays out?(as a % of maximum)
TSR ATRBelow Threshold 0% 0%Threshold 12.5% 5%Target – 12.5%Maximum 50% 50% TSR = Total Shareholder ReturnATR = Absolute Total Return
Timing of 2018 payCEO pay 2018 2019 2020 2021 2022 2023
Salary £309k
Pension 10% of salary
Benefits c.£13k
Annual bonus up to 125% of salary
LTIP up to 100% of salary 50% held for at least 2 years
FD pay 2018 2019 2020 2021 2022 2023
Salary £235k
Pension 10% of salary
Benefits c.£13.5k
Annual bonus up to 100% of salary
LTIP up to 100% of salary 50% held for at least 2 years
Remuneration policy – at a glance (continued)

STRATEGIC REPORTCORPORATE GOVERNANCE
FINANCIAL STATEMENTS
Harworth Group plc Annual Report and Financial Statements 2017 77
Performance scenarios for 2018 pay ( £’000s)
£0 £100 £200 £300 £400 £500 £600 £700 £800 £900 £1000 £1100
Owen Michaelson
Single figure of total remuneration (£000s)
Fixed pay
Annual bonus
LTIP
Andrew Kirkman
£0 £100 £200 £300 £400 £500 £600 £700 £800 £900 £1000 £1100
Minimum
On-target
Maximum
100% £352 29%
57% 31% 12%
34% 37% 29%
£622
£1,046
Single figure of total remuneration (£000s)
Fixed pay
Annual bonus
LTIP
Minimum
On-target
Maximum
100% 32%
61% 26% 13%
37% 32%32% £742
£448
£272
Performance scenario Fixed pay Annual bonus LTIP
Minimum Salary (as at 1 January 2018) plus Pension (10% of salary) plus Benefits (based on 2017 actual)
None None
On-target 50% of maximum 25% of maximum(1)
Maximum 100% of maximum 100% of maximum
(1) Given that there are only threshold and maximum performance triggers for the TSR performance measure, the “on-target” performance scenario for the LTIP reflects vesting at the threshold performance trigger for TSR (12.5%) and vesting at the target performance trigger (12.5%) for ATR.
NED fees
How are they structured? What are the fees in 2018?
Chairman receives a single all-inclusive fee, set by the Committee NEDs receive a base fee plus additional fees for acting as a Committee Chair or Senior Independent Director. Their fees are set by the Chairman and Executive Directors.
1 January 2018Chairman fee £160,000NED base fee £42,500Audit and Remuneration Committee Chair £7,500Senior Independent Director £7,500

78 Harworth Group plc Annual Report and Financial Statements 2017
Directors’ remuneration reportcontinued
The Remuneration CommitteeMembership, attendance, key responsibilities and activities of the Committee are summarised in the Chair’s introduction.The Company Secretary is secretary to the Committee. The following individuals may be invited to attend Committee meetings on certain occasions to provide advice and to help the Committee to make informed decisions: • Owen Michaelson, Chief Executive Officer• Andrew Kirkman, Finance Director• Head of HR and Organisation Development• Representatives of Kepler Associates (see further below).No individuals are involved in decisions relating to their own remuneration.The Committee has retained Kepler Associates, a brand of Mercer and part of the MMC Group of companies (“Kepler”), to provide independent advice on executive remuneration matters. Kepler was appointed by the Committee in 2015 following a competitive selection process, through which the Committee has satisfied itself that Kepler’s advice is objective and independent. Kepler is a signatory to the Code of Conduct for Remuneration Consultants in the UK, details of which can be found on the Remuneration Consulting Group’s website at www.remunerationconsultantsgroup.com. Services provided by Kepler during the period under review included advice on the overall remuneration packages for the Executive Directors, advising on the performance conditions for awards under the LTIP scheme and reviewing and advising on the Directors’ remuneration report, as well as other ad-hoc advice related to remuneration. The fees paid to Kepler in relation to advice provided to the Committee for 2017 were £22,733 plus VAT. The Committee evaluates the support provided by Kepler annually. Other than advice on remuneration, no other services were provided by Kepler to the Group. The Company does retain Marsh, which is also a member of the MMC Group of companies, as its insurance brokers. The Committee considered that appointment and concluded that it does not impair Kepler’s independence.
External appointmentsNone of the Executive Directors currently hold external directorship appointments, although Owen Michaelson has been appointed as a member of the Board of the Sheffield City Region Local Enterprise Partnership, which was approved by the Board on the basis that it requires a limited time commitment and helps to promote both the profile and local relationships of the Group. Owen Michaelson receives no fee for that appointment.
Single total figure of remuneration for Executive DirectorsThe table below sets out a single figure for the total remuneration received by each Executive Director of the Company for the financial year ended 31 December 2017 with a comparison to the previous year, representing payments received in respect of the period for which each individual was a Director of the Company.
Owen Michaelson
Andrew Kirkman
2017 2016 2017 2016£ £ £ £
Salary 301,000 293,550 205,000 200,000Taxable benefits(1) 12,810 12,320 13,669 12,857Relocation allowance – – – 75,000Single-year variable(2) 242,681 264,195 128,600 138,375Multiple-year variable(3) 805,475 – 175,740 –Pension benefit(4) 30,100 29,355 20,500 20,000 29,355 21,375 2,667 13,614
Total 1,392,066 599,420 543,509 446,232
(1) Taxable benefits consist primarily of car and fuel allowance. For 2017 these were £11,826 for Owen Michaelson (£11,579 for 2016) and £12,879 for Andrew Kirkman (£12,417 for 2016). Other benefits included life assurance and health insurance.
(2) Annual bonus payments for performance during 2017 were received by Owen Michaelson and Andrew Kirkman, details of which are included below in “Incentive outcomes for year ending 31 December 2017”. The annual bonus for 2017 was paid in March 2018.
(3) The Harworth Estates 2012 LTIP, which was a cash-based LTIP scheme implemented in 2013 with a five year performance period, vested on the approval of the financial statements for the financial year ended 31 December 2017. Payments were made in March 2018. This was a one-off scheme and no previous or future payments have been or will be made under the scheme. No other LTIP awards vested based on performance periods ending during 2016 or 2017.
(4) Owen Michaelson and Andrew Kirkman participated in the Company’s defined contribution scheme, in relation to which the Company contributed 10% of salary.
Annual Remuneration report

STRATEGIC REPORTCORPORATE GOVERNANCE
FINANCIAL STATEMENTS
Harworth Group plc Annual Report and Financial Statements 2017 79
Single total figure of remuneration for Non-Executive Directors The table below sets out a single figure for the total remuneration received by each Non-Executive Director of the Company for the financial years ended 31 December 2016 and 31 December 2017, representing payments received in respect of the period for which each individual was a Director of the Company.
Base feeCommittee chair fees SID fee Total
2017 2016 2017 2016 2017 2016 2017 2016£ £ £ £ £ £ £
J. Cox 160,000 160,000 – – – – 160,000 160,000L. Clement 42,500 42,500 7,500 7,500 3,000 750 53,000 50,750S. Underwood(1) 42,500 42,500 – – – – 42,500 42,500A. Donnelly 42,500 42,500 – – – – 42,500 42,500M. Bowes 42,500 42,500 – – – – 42,500 42,500A. Cunningham 42,500 29,008 7,500 1,200 – – 50,000 30,208P Hickson(2) – 21,667 – – – – – 21,667
(1) The fees for Steven Underwood are paid to Peel Management Limited.(2) Peter Hickson resigned on 26 April 2016.
Incentive outcomes for year ended 31 December 2017Annual bonusAnnual bonuses for 2017 were paid to both Executive Directors based on a combination of financial performance and personal objectives. Maximum annual bonus opportunities were 100% of salary for Owen Michaelson and 75% of salary for Andrew Kirkman. Performance was measured based 75% on financial and 25% on personal performance for both Owen Michaelson and Andrew Kirkman. Performance against targets and subsequent vesting of 2017 annual bonuses are set out in the tables below. Financial performance outcomesFor 2017 bonuses, no bonus was paid for achieving below Target, 50% of bonus was paid for achieving Target, increasing on a straight-line basis to 100% of bonus paid for achieving Stretch performance.
Performance targets(£’000s)
Measure
Weight (% of financial performance) ‘Target’ ‘Stretch’ Actual performance
Vesting outcome
NAV gains 60% 38,900 46,700 47,400 100%Sales volume 15% 50,000 56,000 57,800(1) 100%Acquisition (strategic development of the business)
15% Deployment of equity raise proceeds
Target’ plus material additional
acquisitions
Equity raise proceeds deployed
50%
Profit excluding value gains 10% 2,200 2,750 2,240 50%
Total vesting on financial performance outcomes
Owen Michaelson (75% weighting) 87.5%
Andrew Kirkman (75% weighting) 87.5%
(1) This sales figure includes internal sales for direct development and sales by joint ventures.

80 Harworth Group plc Annual Report and Financial Statements 2017
Directors’ remuneration reportcontinued
Personal performance outcomes
Executive Director Achievements during the yearVesting of
component
O. Michaelson (25% weighting) • To reduce the share price discount to EPRA NNNAV, through business results, business profile and investor relations.
• To present and obtain Board approval of a five-year strategic plan which, over the plan period, delivers a consistent 10% return and achieves the Company’s ambitious growth plans.
• To grow the Company’s reputation into a nationally recognised go-to regional brownfield land developer winning large scale redevelopment opportunities.
60%
A. Kirkman (25% weighting) • To reduce the share price discount to EPRA NNNAV, through business results, business profile and investor relations.
• To manage the Company’s Balance sheet, debt facilities and all forms of equity to fund the strategic plan.
• To show clear leadership and support for all team members to develop a standard form of capital appraisal for all projects enabling the Board to make clear judgements and comparisons on the prioritisation of capital.
• To develop a clear and transparent tax management and mitigation plan which optimises the Company’s position and allows the tax losses and tax assets held by the business to be properly understood, modelled and protected.
72%
Overall bonus outcomes Overall bonus outcome
Financial Personal vestingSum product of
weighting and vest%
Executive Weighting Vesting Weighting Vesting % of bonus % of salary
O. Michaelson 75% 87.5% 25% 60% 80.6% 80.6%A. Kirkman 75% 87.5% 25% 72% 83.6% 62.7%
The overall bonus outcomes for the Chief Executive and Finance Director reflect a strong year of performance for the business, with EPRA NNNAV growth of 12.5%, the deployment of the proceeds of the March 2017 equity raise (c.£27m) on strategic land acquisitions and more stability in the Group’s recurring income stream.
Scheme interests awarded during 20172017 LTIP awardsLTIP awards of 100% of salary were made in 2017 to Owen Michaelson and Andrew Kirkman under the LTIP approved by Shareholders at the 2016 AGM.
Executive Director Type of award Date of awardNumber of shares
granted Face value(1)% receivable at threshold(2)
End of performance
period
O. Michaelson 2017 LTIP 5 April 2017 310,256 301,000 17.5% 31 December 2019A. Kirkman 2017 LTIP 5 April 2017 211,304 205,000 17.5% 31 December 2019
(1) Face value based on the average share price on the three trading days immediately preceding the date of grant of 97p.(2) 25% vesting for threshold performance of 50% of the award based on TSR performance and 10% vesting for threshold performance of 50% of the award based on ATR performance.
Annual Remuneration report (continued)

STRATEGIC REPORTCORPORATE GOVERNANCE
FINANCIAL STATEMENTS
Harworth Group plc Annual Report and Financial Statements 2017 81
For all participants, awards will vest after three years in accordance with the performance conditions outlined in the table below, subject to achieving the additional underpins that 30% of value created comes from disposal proceeds and that dividends are sustainable. For Executive Directors, 50% of any vested shares will be subject to a minimum two-year post-vesting holding period. No award will vest below threshold performance and vesting will increase on a straight-line basis between defined levels of performance.
Total Shareholder return(1) (50% weighting)
Absolute total return (50% weighting)
Vesting schedule
3-year TSR outperformance
of median p.a.
% of element vesting
3-year ATR p.a.
% of element vesting
Threshold 0% 25% 8% 10%Target – – 10% 25%Maximum 9% 100% 12% 100%
(1) For 2017 awards, 70% of the TSR outperformance condition is measured vs the median of Harworth’s 5 closest listed peers: Inland Homes, Henry Boot, U+I, Urban and Civic and St. Modwen, and 30% vs the FTSE All Share Real Estate Investment Services Index.
Harworth Estates LTIPThe full details of the scheme are provided in the notes to the Remuneration Policy in the 2015 Annual Report. Details of the scheme interests awarded to Andrew Kirkman on appointment are outlined below, together with the scheme interests that had been awarded to Owen Michaelson at the outset of the scheme.
Performance conditions
ExecutiveNumber of
units granted Threshold Target Stretch
O. Michaelson 275 £ value created: £121m £150m £231mA. Kirkman 60 £ per unit: £600 £2,600 £5,000
Any vesting of units under the Harworth Estates LTIP was subject to one-third of value created coming from disposal proceeds.The awards under the Harworth Estates LTIP vested upon approval of the Group’s financial statements for the financial year ended 31 December 2017 and payments were made in March 2018. During the period 1 January 2013 to 31 December 2017 the value created by HEPGL and its subsidiaries for the purposes of the scheme was £161,112,000 and the disposal proceeds underpin was satisfied. This resulted in a payment of £2,929 to participants for each unit held. The following payments were made to Owen Michaelson and Andrew Kirkman under the scheme:
Executive Payment under Harworth Estates LTIP
O. Michaelson £805,475A. Kirkman £175,740
This was a one-off scheme with a five-year performance period. No previous payments and no future payments have been or will be made under the scheme.
Percentage change in CEO remunerationThe table below shows how the percentage change in the Chief Executive’s salary, benefits and bonus between 2016 and 2017 compares with the percentage change in the average of each of those components of pay for the employees of the Group as a whole.
Salary £’000 Percentage
change
Taxable benefits £’000 Percentage
change
Bonus £’000 Percentage
change
2017 2016 2017 2016 2017 2016
CEO Pay 301 294 2.5% 10 10 0% 243 264 -8%
Average per employee 2.5% 0% 8%
Relative importance of spend on payTotal employee pay expenditure Distributions to Shareholders
2017 2016 % change 2017 2016 % change
£7.849m £6.363m 23% £2.7m 0.828p per share
£2.2m 0.743p per share
10%
Staff costs increased between 2016 and 2017 due to an increase in the size of the workforce and additional accrual for the HEPGL 2012 LTIP to reflect increased payments resulting from outperformance.

82 Harworth Group plc Annual Report and Financial Statements 2017
Directors’ remuneration reportcontinued
Total dividends for the financial year ended 31 December 2016 were 0.753p per share, resulting in total dividends of £2.2m, ignoring the March 2017 equity raise. Total dividends for the financial year ended 31 December 2017 are 0.828p per share, resulting in total dividends of £2.7m. Part of this increase in total dividends is attributable to the March 2017 equity raise. As such, the percentage change is shown above on a per share basis.
Review of past performanceThe following graph charts the Total Shareholder Return (TSR) of the Company and the FTSE Small Cap Index over the period from the Company’s relisting on 24 March 2015 to 31 December 2017. The FTSE Small Cap Index represents the most appropriate broad index comparison for a Company of Harworth’s size. The table below shows the Chief Executive’s ‘single-figure’ remuneration over the same period.Historical TSR performanceGrowth in the value of a hypothetical £100 holding over the period from re-listing on 24 March 2015 to 31 December 2017:
Historical CEO remuneration2015 2016 2017
£ £ £
CEO single figure remuneration (£’000) 480 599 1,392Short term incentive award as a % of maximum opportunity 85.6% 90% 80.6%Long term incentive award as a % of maximum opportunity n/a n/a n/a(1)
(1) Excludes vesting of Harworth Estates LTIP as this was a one-off scheme put in place by HEPGL in 2013.
Payment paid to past directorsDuring the year, no payments were made to past Directors.
Exit payments made in the yearNo exit payments were paid to former Directors during the year.
Implementation of Executive Directors’ remuneration policy for 2018Base salaryPositioning of base salary is approached on an individual basis, taking account of advice received from the Committee’s independent advisors on the rates of salary for similar roles in selected Groups of comparable companies, the individual performance and experience of each Executive Director, the responsibilities of the Executive Director and increases awarded to the wider workforce.The Committee approved the following base salary increases for 2018:
Executive DirectorAnnual base salary at
1 January 2017Annual base salary at
1 January 2018Percentage
increase
O. Michaelson £301,000 £308,525 2.5%A. Kirkman £205,000 £235,000 14.6%
A typical salary increase of 2.5% was awarded across the Group at the annual pay review, effective 1 January 2018.
£0
£20
£40
£60
£80
£100
£120
£140
£160
Harworth
FTSE Small Cap
31 December 1731 December 1631 December 1524th March 15
Annual Remuneration report (continued)
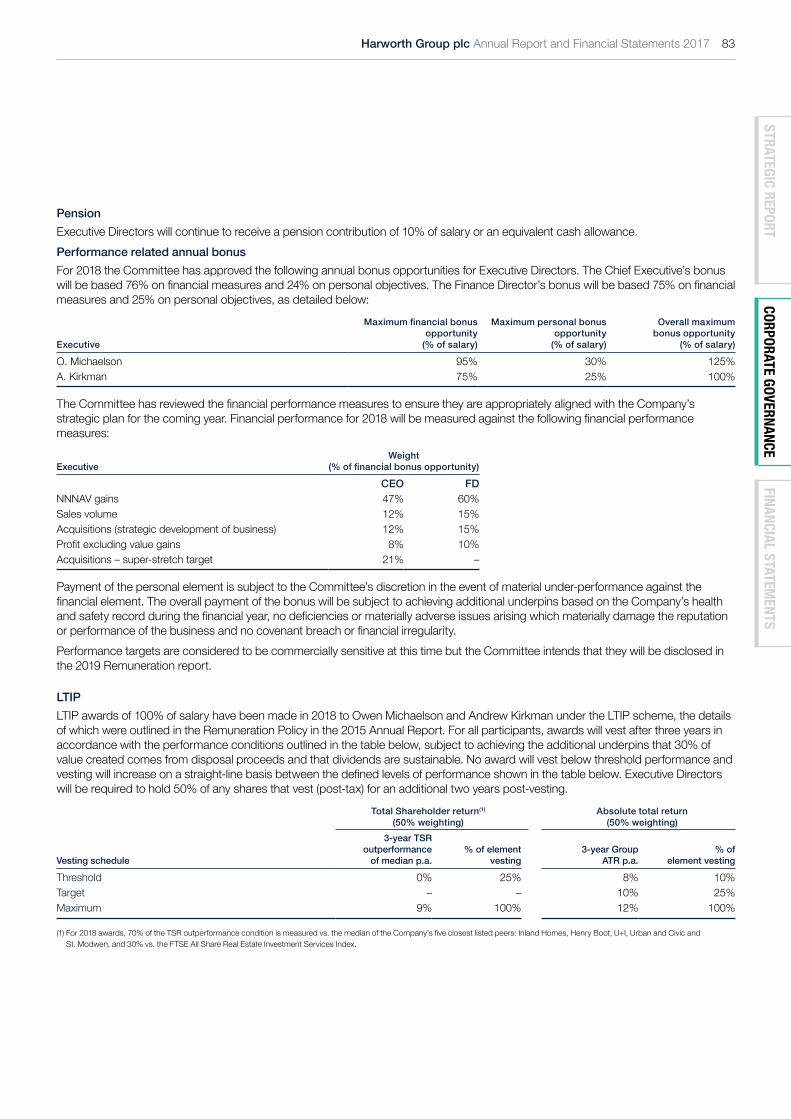
STRATEGIC REPORTCORPORATE GOVERNANCE
FINANCIAL STATEMENTS
Harworth Group plc Annual Report and Financial Statements 2017 83
PensionExecutive Directors will continue to receive a pension contribution of 10% of salary or an equivalent cash allowance.Performance related annual bonusFor 2018 the Committee has approved the following annual bonus opportunities for Executive Directors. The Chief Executive’s bonus will be based 76% on financial measures and 24% on personal objectives. The Finance Director’s bonus will be based 75% on financial measures and 25% on personal objectives, as detailed below:
Executive
Maximum financial bonus opportunity
(% of salary)
Maximum personal bonus opportunity
(% of salary)
Overall maximum bonus opportunity
(% of salary)
O. Michaelson 95% 30% 125%A. Kirkman 75% 25% 100%
The Committee has reviewed the financial performance measures to ensure they are appropriately aligned with the Company’s strategic plan for the coming year. Financial performance for 2018 will be measured against the following financial performance measures:
ExecutiveWeight
(% of financial bonus opportunity)
CEO FDNNNAV gains 47% 60%Sales volume 12% 15%Acquisitions (strategic development of business) 12% 15%Profit excluding value gains 8% 10%Acquisitions – super-stretch target 21% –
Payment of the personal element is subject to the Committee’s discretion in the event of material under-performance against the financial element. The overall payment of the bonus will be subject to achieving additional underpins based on the Company’s health and safety record during the financial year, no deficiencies or materially adverse issues arising which materially damage the reputation or performance of the business and no covenant breach or financial irregularity.Performance targets are considered to be commercially sensitive at this time but the Committee intends that they will be disclosed in the 2019 Remuneration report.
LTIPLTIP awards of 100% of salary have been made in 2018 to Owen Michaelson and Andrew Kirkman under the LTIP scheme, the details of which were outlined in the Remuneration Policy in the 2015 Annual Report. For all participants, awards will vest after three years in accordance with the performance conditions outlined in the table below, subject to achieving the additional underpins that 30% of value created comes from disposal proceeds and that dividends are sustainable. No award will vest below threshold performance and vesting will increase on a straight-line basis between the defined levels of performance shown in the table below. Executive Directors will be required to hold 50% of any shares that vest (post-tax) for an additional two years post-vesting.
Total Shareholder return(1)
(50% weighting)Absolute total return
(50% weighting)
Vesting schedule
3-year TSR outperformance
of median p.a.% of element
vesting 3-year Group
ATR p.a.% of
element vesting
Threshold 0% 25% 8% 10%Target – – 10% 25%Maximum 9% 100% 12% 100%
(1) For 2018 awards, 70% of the TSR outperformance condition is measured vs. the median of the Company’s five closest listed peers: Inland Homes, Henry Boot, U+I, Urban and Civic and St. Modwen, and 30% vs. the FTSE All Share Real Estate Investment Services Index.

84 Harworth Group plc Annual Report and Financial Statements 2017
Directors’ remuneration reportcontinued
Implementation of Non-Executive Director remuneration policy for 2018• The Chairman of the Board receives a fee of £160,000 per annum, unchanged from 2017.• Non-Executive Directors receive a base fee of £42,500 per annum, unchanged from 2017.• An additional fee of £7,500 per annum is payable to each of the Chair of the Audit Committee (Andrew Cunningham) and
the Chair of the Remuneration Committee (Lisa Clement) for chairing those respective committees, unchanged from 2017. No additional fee is paid to the Chairman for chairing the Nomination Committee.
• A further additional fee of £7,500 is paid to Lisa Clement as Senior Independent Director. This additional fee has increased from £3,000 paid in 2017.
Directors’ interests A table setting out the beneficial interests of the Directors and their families in the share capital of the Company as at 23 April 2018 (being the latest possible date prior to the publication of this report) is set out below. None of the Directors has a beneficial interest in the shares of any other Group Company. Details of Directors’ share options are also set out in the tables below. Current shareholding as a percentage of salary is based on the middle market closing price for the shares on 5 April 2018 of 109.0p.
Shares held Options held
Beneficially owned
Vested but subject to
holding period
Vested but not
exercised
Unvested and subject
to perf. conditions
Shareholding requirement % salary/fee
Current shareholding % salary/fee
Requirement met?
O. Michaelson 275,090 21,413 – 904,690 100% 105% YesA. Kirkman 200,000 – – 638,843 100% 93% NoJ. Cox(1) 716,504 – – – n/a n/a n/aL. Clement – – – – n/a n/a n/aA. Donnelly – – – – n/a n/a n/aA. Cunningham 17,333 – – – n/a n/a n/aS. Underwood 38,385 – – – n/a n/a n/aM. Bowes – – – – n/a n/a n/aA. Lyons(2) 90,000 – – – n/a n/a n/a
(1) Jonson Cox resigned on 31 March 2018.(2) Alastair Lyons was appointed on 7 March 2018.
The table above includes the following shares purchased and sold in the period between 31 December 2017 and 23 April 2018:
A. Kirkman (purchased on 6 March 2018) 60,000A. Lyons (purchased on 7 March 2018) 90,000J. Cox (sold on 7 March 2018) 150,000
Annual Remuneration report (continued)
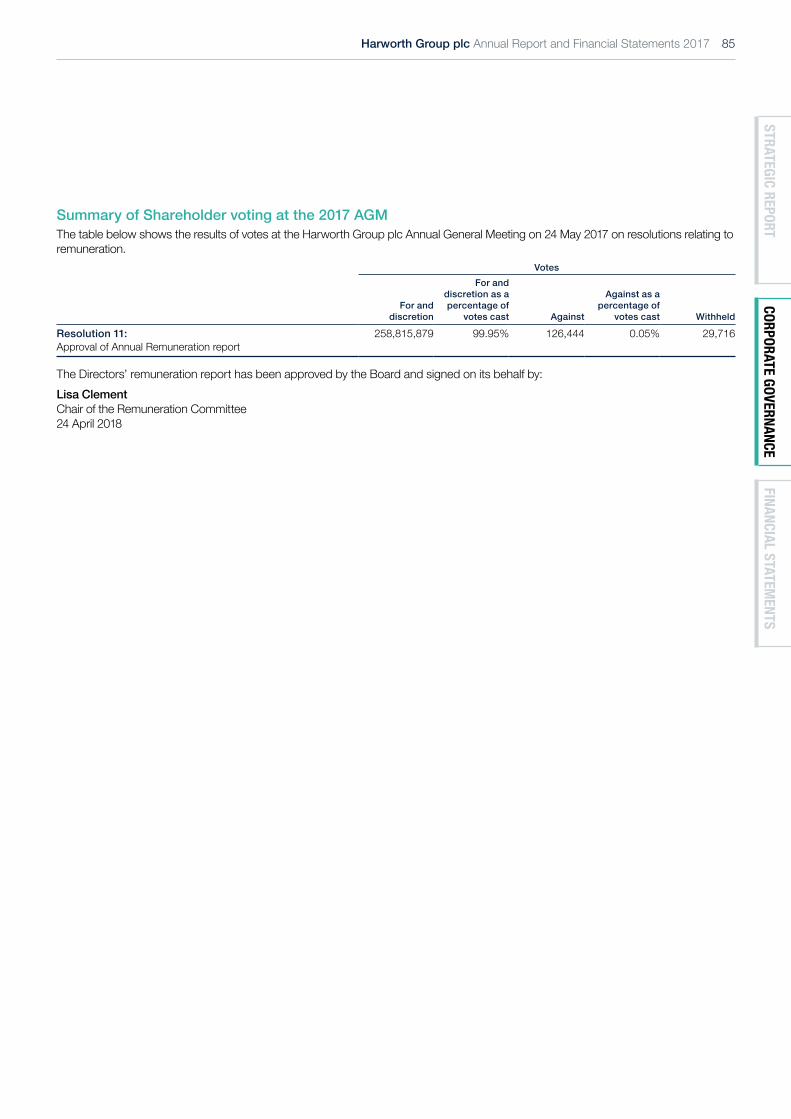
STRATEGIC REPORTCORPORATE GOVERNANCE
FINANCIAL STATEMENTS
Harworth Group plc Annual Report and Financial Statements 2017 85
Summary of Shareholder voting at the 2017 AGMThe table below shows the results of votes at the Harworth Group plc Annual General Meeting on 24 May 2017 on resolutions relating to remuneration.
Votes
For and discretion
For and discretion as a percentage of
votes cast Against
Against as a percentage of
votes cast Withheld
Resolution 11: Approval of Annual Remuneration report
258,815,879 99.95% 126,444 0.05% 29,716
The Directors’ remuneration report has been approved by the Board and signed on its behalf by:Lisa Clement Chair of the Remuneration Committee 24 April 2018

86 Harworth Group plc Annual Report and Financial Statements 2017
Audit Committee report
Members and attendance at meetings during the year ended 31 December 2017
Andrew CunninghamChair and Independent Non-Executive Director
4(4)
Anthony DonnellyIndependent Non-Executive Director
4(4)
Steven UnderwoodNon-Executive Director (not independent)
3(4)
Key responsibilities
• Reviews the integrity of the Company’s annual and interim reports, preliminary and interim results announcements and any other formal announcements relating to its financial performance.
• Reviews the effectiveness of the Group’s system of internal financial and risk controls.
• Reviews the Group’s insurance programme.• Reviews the terms of appointment, independence, effectiveness
and remuneration of the Company’s external auditors and makes recommendations to the Board on the reappointment of the external auditors. Leads the re-tendering process for the appointment of external auditors, if applicable.
• Reviews and if necessary updates the Group’s Risk Register.• Reviews the Group’s anti-bribery policy (including annual
reviews of the Group’s hospitality register) and other policies relating to financial security, business ethics and compliance.
• Reviews the adequacy of the Group’s cyber-security measures and business continuity plans and procedures.
The Committee’s terms of reference, which were last reviewed and updated in December 2017 are set out on the Company’s website and can be found at www.harworthgroup.com/investors/governance/.The Board undertakes an annual evaluation of the Committee’s performance to ensure its continued ability to discharge its key responsibilities.
Key areas of focus during the period since the publication of the 2016 Annual Report
• External review of selected internal financial controls. • Categorisation of sites as investment or development properties.• Oversight of detailed review of principal risks and uncertainties
and refinement of Group Risk Register.• Comprehensive review of the Group’s insurance programme
prior to 2018 renewal. • Scrutiny of operational cost report review process. • Approval of new policies and supplier code of conduct in
relation to bribery and corruption and facilitation of tax evasion.• Review of likely impact of International Financial Reporting
Standard (“IFRS”) 15 and IFRS 9.
Dear Shareholder,I am pleased to present the Audit Committee report for the year ended 31 December 2017. The Committee comprises three Non-Executive Directors. I chair the Committee and its other members are Steven Underwood and Anthony Donnelly. The experience of each member of the Committee is summarised on pages 60 and 61. The Board is satisfied that we have recent and relevant financial experience, in addition to all members having trained as chartered accountants. I was a partner at the predecessor firm to PricewaterhouseCoopers LLP from 1989 to 1996 and then held the role of Finance Director at Grainger plc from 1996 until 2009. The Board is also satisfied that the Committee has competence relevant to the real estate sector, given that all members hold (or in my case have held) senior positions at companies operating in that sector.The Company Secretary is secretary of the Committee. The Chairman, Chief Executive, Finance Director and the external auditors are invited to attend meetings when appropriate. The minutes of meetings of the Committee are circulated to all Directors.During the year, the Committee held four formal meetings and there were calls between the Finance Director, Company Secretary and me on the day preceding the announcement of the Company’s preliminary and interim results, so that I could authorise their release, having been delegated the authority to do so by the Board.I will be available at the Annual General Meeting to respond to any questions or discuss matters relating to the Committee’s activities.Andrew Cunningham Audit Committee Chairman 24 April 2018
Audit Committee report

STRATEGIC REPORTCORPORATE GOVERNANCE
FINANCIAL STATEMENTS
Harworth Group plc Annual Report and Financial Statements 2017 87
Annual and Interim reports The areas to which the Committee has given particular focus since the publication of the 2016 Annual Report and Financial Statements are summarised below.
Significant financial statement reporting issues considered by the Audit Committee
Categorisation of the property portfolio During the year £229.1m of property was re-categorised from investment to development property. This re-categorisation was triggered by the evolution of Harworth’s business model, including the March 2017 capital raise, as well as the consideration of site and market opportunities. The Committee reviewed the appropriateness and timing of the re-categorisation of properties and the future categorisation policy. It was concluded that the categorisation of the property portfolio was appropriate.Valuation of the property portfolioThe property portfolio, which is composed of both investment and development properties as well as assets held for sale, joint ventures, overages and owner-occupied properties, comprises the vast majority of the total assets of the business. Harworth continues to use the same independent external valuers, BNP Paribas and Savills, to value the portfolio. However, given the significance of the property values, together with the different accounting treatment for investment and development properties, there remain a number of key judgements. These key judgements are primarily regarding the future intention for the site as well as value per acre, rental amounts, yields and costs to bring the sites forward, recognising that the properties are at different stages of completion. The assumptions and methodology were reviewed for consistency and appropriateness.The deductions from the expected land values primarily include the costs to complete from external firms. Given the increasing number of Major Developments, further validation and reconciliation work has been performed on the cost reports. The methodology for, and adequacy of, the cost report totals are reviewed by the Committee. Historically, a small number of sites, an assessment has been made of the potential restoration costs that may be incurred by the Group if the obligations are not completed by the mining tenants. The surface mine sites were handed back during the year and this provision is now within the cost report totals.
Other risks considered by the Audit Committee (and highlighted in the critical accounting estimates and judgements section of the financial statements)
Going concern basis This is discussed on page 44 of the Strategic Report. Taxation The Group recorded a credit for taxation in the year of £7.8m (2016: £3.6m charge) and its first current year tax charge since re-listing of £1.5m (2016: £nil). The movements were as a result of: the execution of a contract giving greater certainty of tax loss utilisation; and the disposals, valuation movements and re-categorisation of property. The assumptions underlying these movements and the tax treatment have been reviewed by the Committee and they are comfortable with the tax position.
The Committee has reviewed the controls which are in place to ensure the completeness and accuracy of the Company’s financial records. The production and external audit of the Group’s Annual Report and Financial Statements involves a number of parties including, in addition to the external auditor, the Finance Director, Company Secretary, Financial Controller, Associate Director of Partnerships and Communications, actuary and tax accountants. The Committee has also noted (i) the reviews that are undertaken during this process by the various parties, including the external auditor, to ensure consistency and balance in the presentation of the Annual Report and Financial Statements and (ii) the verification exercise which is undertaken in respect of the financial metrics referred to in the Strategic Report and Directors’ Report.As a result, the Committee has concluded that the Annual Report and Financial Statements for the year ended 31 December 2017, when taken as a whole, is fair, balanced and understandable, and provides the information necessary for Shareholders to assess the Company’s business model, strategy and performance. The Committee has reported to the Board and the Board’s conclusions are set out in the Statement of Directors’ responsibilities included in the Directors’ Report on page 97.
External auditorsThe Committee is responsible for making recommendations to the Board on the appointment, reappointment and removal of the external auditor. The year-end audit strategy is subject to review and approval at the Committee’s meeting in September and the external auditors’ appointment is subject to a formal review at the Committee’s meeting in November each year.Having reviewed:• the independence and objectivity of the external auditor,
PricewaterhouseCoopers LLP (“PwC”), including consideration of the non-audit work it has undertaken for the Company (see further analysis below);
• the effectiveness of PwC’s audit of this Annual Report and Financial Statements; and
• the quantum of fees payable for the audit (see further analysis below),
the Committee has recommended the re-appointment of PwC as external auditor at the forthcoming Annual General Meeting. PwC, then known as Coopers and Lybrand, was first appointed as the Company’s auditors before 17 June 1994. This means that, for the purposes of the Companies Act 2006 (as amended by The Statutory Auditors and Third Country Auditors Regulations 2016) Harworth does not need to undertake an audit tender process before the financial statements for the financial year ending 31 December 2021 are audited. Nevertheless, the Committee intends to tender the audit not later than 2020, which would coincide with the expiry of Andy Ward’s term as lead audit partner. This is the third set of the Company’s Financial Statements for which Andy Ward has led PwC’s audit team. The Committee will, however, keep the position under review. There are no contractual obligations which restrict the Committee’s choice of external auditor.

88 Harworth Group plc Annual Report and Financial Statements 2017
Audit Committee reportcontinued
The Board recognises the importance of safeguarding auditor objectivity and has taken the following steps to ensure that auditor independence is not compromised:• the Committee reviews the audit appointment annually;• the Group has a policy that, save for audit-related services
(such as regulatory and statutory reporting, and work relating to circulars) and exceptional circumstances only with the Committee’s prior approval, the external auditors will not provide non-audit services to the Group;
• the Group has appointed Deloitte LLP to provide advice and assistance on most tax matters going forward and pension accounting. KPMG has been appointed to advise on tax matters relating to our joint venture agreements and to carry out an external review of selected internal financial controls;
• the Committee reviews on a regular basis all fees paid for audit, and non-audit fees, with a view to assessing reasonableness of fees, value of delivery, and any independence issues that may have arisen or may potentially arise in the future. An analysis of all audit and non-audit fees is shown above; and
• the Committee reviews the external auditors’ report to the Directors and the Committee confirming their independence in accordance with auditing standards.
Resolutions to re-appoint PwC as the Company’s external auditors and to authorise the Directors to determine its remuneration will be proposed at the forthcoming Annual General Meeting.
Establishment and implementation of policy for categorisation of propertiesIn recognition of the evolution, diversification and track record of the business and, in particular, the Group’s equity raise in March 2017 to fund the acquisition of strategic land for development, the Company has implemented a new policy on the categorisation of properties within the Group’s portfolio. This has been a workstream led by the Finance Director and overseen by the Committee. The portfolio was reviewed at the half-year, pursuant to which the majority of our Waverley, Logistics North and Prince of Wales sites, being our most active sites, were re-categorised as development sites. Another review was undertaken at the full-year, in the light of site and market opportunities, pursuant to which the majority of sites within the Major Developments segment of the business, were re-categorised as development properties. Following completion of this workstream, re-categorisations at the half-year and full-year, and consultation with the Group’s external auditors, the Committee formally approved the proposed new policy in February 2018. Further details of the policy are set out in the Financial Review on pages 29 and 30. Going forward, the Committee will oversee reviews of property categorisations at 30 June and 31 December each year.
Analysis of fees paid to the external auditors and non-audit firms for the years ended 31 December 2016 and 31 December 2017
2017 £’000
2016 £’000
Audit servicesFees payable to the external auditors for:– the audit of the Company and the consolidated financial statements 40 40– the audit of the Company’s subsidiaries financial statements 111 80– the audit of the Company’s joint ventures 8 10
Total 159 130
Non-audit servicesFees payable to the external auditors and its associates for non-audit services:– audit related assurance services 15 50– tax advisory services 7 84– tax compliance services 6 38– fees in relation to transactions – –
Total 28 172
Total fees payable to external auditors and associates for audit and non-audit services 187 302
Ratio of audit to non-audit fees paid to external auditor 5.7:1 1:1.3
Fees payable to non-audit firms for non-audit services– audit related assurance services 22 –– tax advisory services 69 13– tax compliance services 19 26– fees in relation to transactions – 25– pension accounting 5 1 5 1
Total 115 65
Audit Committee reportcontinued

STRATEGIC REPORTCORPORATE GOVERNANCE
FINANCIAL STATEMENTS
Harworth Group plc Annual Report and Financial Statements 2017 89
Risk review and management During the year, the Committee undertook an interim review of the Group’s Risk Register in June and oversaw a detailed review of the Group’s principal risks and uncertainties in the second half of the year, led by the Company Secretary, culminating in a refinement of the Group Risk Register in November. The outcome of that review is explained in more detail at pages 36 to 43 of the Strategic Report. In conjunction with the interim and detailed risk reviews, the Committee also carried out a review of, and remains satisfied as to, the effectiveness of the Company’s risk management and internal controls systems, including financial, operational and compliance controls. The Committee will continue to carry out bi-annual reviews of the register, alongside reviews of the effectiveness of the Group’s internal risk management controls.
Internal financial controlsDuring the second half of 2017, the Group instructed KPMG to undertake an external review of some of its principal financial controls and processes. KPMG reported to the Committee on the outcome of that review at the Committee’s scheduled meeting in November. KPMG identified no major deficiencies in the controls it reviewed but did identify some opportunities to improve efficiencies and risk mitigation. Those recommendations will be implemented during the course of 2018. At that same meeting, the Committee reviewed and confirmed its view that the business is not large or complex enough for a separate internal audit function. KPMG was supportive of that view. The Committee did, however, conclude that a rolling programme of annual external reviews of controls ought to be maintained. For 2018, the Group has instructed an external review of its cyber security resilience and business continuity plans and procedures.To support the Company’s application for its shares to be moved from the standard segment to the premium segment of the Official List, an external reporting accountant is undertaking a review of the Group’s financial position and prospects procedures. As well as supporting the Company’s application, the outputs from that report will assist the Committee in its ongoing review of the Group’s internal controls and processes.
Insurance programmeDuring the second half of 2017, the Company undertook another detailed review of the Group’s insurance programme, in advance of the 2018 renewal. That review has led to: (i) the Group moving its property owner’s, employee and public liability insurance cover from QBE to Tokio Marine Kiln (“TMK”), resulting in some extensions of cover and cost savings; (ii) a rate stability agreement with TMK by which premium rates will be fixed for up to three years; and (iii) following a benchmarking exercise, an increase in Directors and Officers insurance cover to £25m.
Cost reportsSince publication of the 2016 Annual Report, the Committee has overseen improvements to the process by which cost plans are regularly reviewed, validated and reconciled. This process has also been reviewed by the external auditors as part of the year-end audit process.
Financial Reporting CouncilIn 2017, the Financial Reporting Council (“FRC”) reviewed Harworth’s 2016 Annual Report and Financial Statements as part of its ongoing statutory monitoring requirements. The FRC highlighted a number of areas where enhancements could be made to our financial reporting and these improvements have been reflected in this year’s Annual Report and Financial Statements. At the FRC’s request, the Company has also restated 2016 Earnings Per Share, as the 2016 Annual Report did not correctly reflect the effect of the May 2016 1 for 10 share consolidation. The FRC is content that these improvements and restatement have answered the points raised and the matters have now been closed.When reviewing the Company’s 2016 Annual Report and Financial Statements, the FRC has made clear to us the limitations of its review as follows: (A) its review is based on the 2016 Annual Report and Financial Statements only and does not benefit from a detailed knowledge of the Group’s business or an understanding of the underlying transactions entered into; (B) communications from the FRC provide no assurance that the Company’s 2017 Annual Report and Financial Statements are correct in all material respects and are made on the basis that the FRC (and its officers, employees and agents) accepts no liability for reliance on them by the Company or any third party, including but not limited to investors and shareholders; and (C) the FRC’s role is not to verify information provided but to consider compliance with reporting requirements.
Whistle blowingFollowing a review instructed by the Company Secretary in the first quarter of 2018, Gateleys has recommended that our whistleblowing policy and procedures be updated. That firm has been instructed to implement those recommendations and a revised whistleblowing policy will be tabled for approval by the Committee in June, before it is communicated to employees. There were no whistleblowing claims reported to the Committee during 2017.
ComplianceThe Committee remains responsible for monitoring the effectiveness of, and compliance with, the Group’s policies and procedures for combating modern slavery, bribery and corruption, and the facilitation of tax evasion.The Committee is also taking the lead in making sure that the Group will be compliant with the General Data Protection Regulation when it comes into force on 25 May 2018.Further information on these policies, procedures and initiatives appear in the Strategic Report at pages 53 and 54.The Report of the Audit Committee has been approved by the Board on its behalf by:Andrew Cunningham Chair of the Audit Committee 24 April 2018
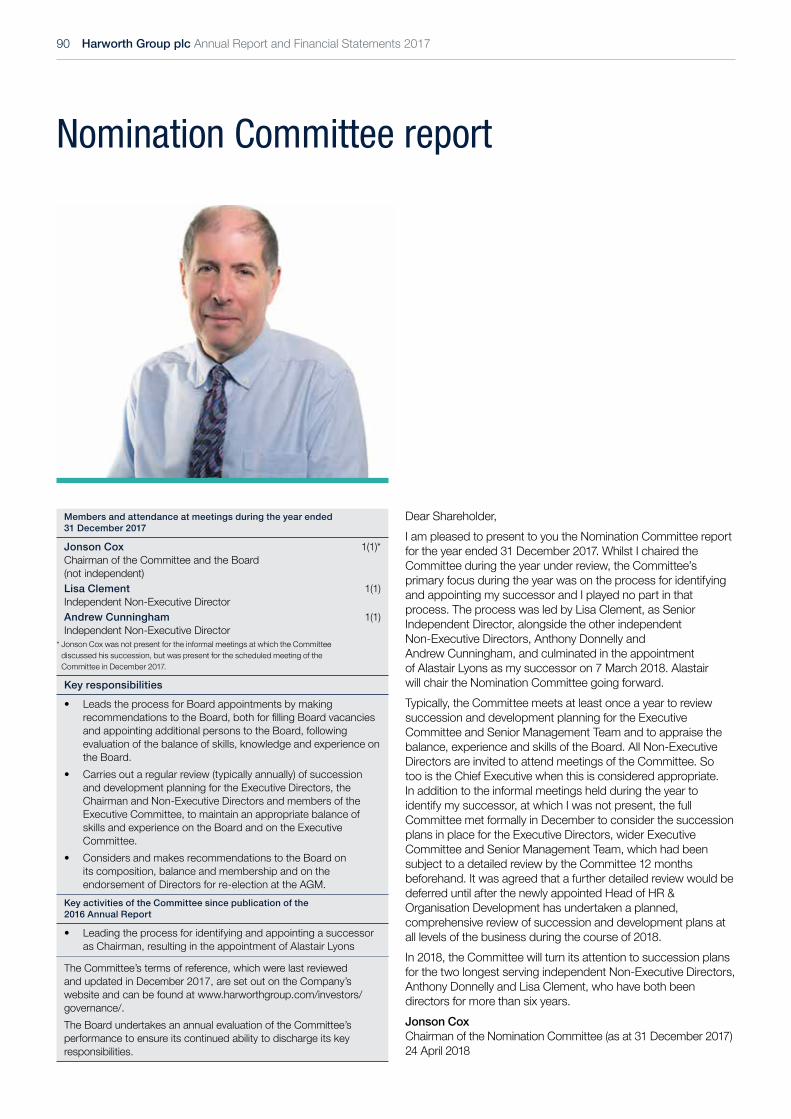
90 Harworth Group plc Annual Report and Financial Statements 2017
Nomination Committee report
Dear Shareholder,I am pleased to present to you the Nomination Committee report for the year ended 31 December 2017. Whilst I chaired the Committee during the year under review, the Committee’s primary focus during the year was on the process for identifying and appointing my successor and I played no part in that process. The process was led by Lisa Clement, as Senior Independent Director, alongside the other independent Non-Executive Directors, Anthony Donnelly and Andrew Cunningham, and culminated in the appointment of Alastair Lyons as my successor on 7 March 2018. Alastair will chair the Nomination Committee going forward. Typically, the Committee meets at least once a year to review succession and development planning for the Executive Committee and Senior Management Team and to appraise the balance, experience and skills of the Board. All Non-Executive Directors are invited to attend meetings of the Committee. So too is the Chief Executive when this is considered appropriate. In addition to the informal meetings held during the year to identify my successor, at which I was not present, the full Committee met formally in December to consider the succession plans in place for the Executive Directors, wider Executive Committee and Senior Management Team, which had been subject to a detailed review by the Committee 12 months beforehand. It was agreed that a further detailed review would be deferred until after the newly appointed Head of HR & Organisation Development has undertaken a planned, comprehensive review of succession and development plans at all levels of the business during the course of 2018.In 2018, the Committee will turn its attention to succession plans for the two longest serving independent Non-Executive Directors, Anthony Donnelly and Lisa Clement, who have both been directors for more than six years. Jonson Cox Chairman of the Nomination Committee (as at 31 December 2017) 24 April 2018
Members and attendance at meetings during the year ended 31 December 2017
Jonson CoxChairman of the Committee and the Board (not independent)
1(1)*
Lisa ClementIndependent Non-Executive Director
1(1)
Andrew CunninghamIndependent Non-Executive Director
1(1)
* Jonson Cox was not present for the informal meetings at which the Committee discussed his succession, but was present for the scheduled meeting of the Committee in December 2017.
Key responsibilities
• Leads the process for Board appointments by making recommendations to the Board, both for filling Board vacancies and appointing additional persons to the Board, following evaluation of the balance of skills, knowledge and experience on the Board.
• Carries out a regular review (typically annually) of succession and development planning for the Executive Directors, the Chairman and Non-Executive Directors and members of the Executive Committee, to maintain an appropriate balance of skills and experience on the Board and on the Executive Committee.
• Considers and makes recommendations to the Board on its composition, balance and membership and on the endorsement of Directors for re-election at the AGM.
Key activities of the Committee since publication of the 2016 Annual Report
• Leading the process for identifying and appointing a successor as Chairman, resulting in the appointment of Alastair Lyons
The Committee’s terms of reference, which were last reviewed and updated in December 2017, are set out on the Company’s website and can be found at www.harworthgroup.com/investors/governance/.The Board undertakes an annual evaluation of the Committee’s performance to ensure its continued ability to discharge its key responsibilities.
Nomination Committee report

STRATEGIC REPORTCORPORATE GOVERNANCE
FINANCIAL STATEMENTS
Harworth Group plc Annual Report and Financial Statements 2017 91
Appointment of Alastair Lyons as ChairmanThe appointment of Alastair Lyons as Chairman with effect from 7 March 2018 followed a rigorous process to identify the best candidate for the role, a process led by the Board’s independent Non-Executive Directors: Lisa Clement, Anthony Donnelly and Andrew Cunningham. Shortly after the 2017 Annual General Meeting, at which it was announced that Jonson Cox would not stand for re-election at this year’s Annual General Meeting, the Non-Executive Directors (excluding Jonson Cox) asked three external search consultancy firms for their proposals to identify a suitable successor. The Company subsequently appointed Warren Partners to conduct an executive search and recruitment process. The Company does not retain Warren Partners in any other capacity and it has no other connection with the Company. In conjunction with Warren Partners, the Non-Executive Directors prepared the selection criteria and a job specification for the role, which included the expected time commitment. At this point, it was agreed by the Board that the independent Non-Executive Directors would lead, and conduct the first stages of, the search and selection process. Warren Partners identified a “long-list” of candidates. Following a review of that “long-list” by the independent Non-Executive Directors and a meeting with Warren Partners, a “short-list” of eight candidates was identified. Warren Partners interviewed and provided feedback on all “short-list” candidates, resulting in a refined list of five candidates. The independent Non-Executive Directors interviewed all five candidates pursuant to which they identified a preferred candidate. That preferred candidate then met with the other Non-Executive Directors, the Senior Independent Director (on her own), the Executive Directors and wider Executive Committee and the external auditors. This process culminated in the Committee recommending, and the Board resolving to make an offer to, Alastair Lyons for the role. Upon Alastair accepting the role and the Board taking up references, the appointment was announced to the market on 19 December 2017.Prior to 7 March 2018, when Alastair’s appointment took effect, he has undergone an extensive induction process which has included multiple meetings with the Executive Committee, both collectively and individually, with each member of the Senior Management Team, the Company’s brokers and certain of the Company’s Shareholders, along with multiple site visits including to one target acquisition site. At the date of this Report, in addition to his role as the Company’s Chairman, Alastair is also Non-Executive Chairman of Welsh Water (Dwr Cymru) and Deputy Chairman of Bovis Homes Group PLC, although he will retire from his role at Bovis Homes at its next Annual General Meeting in May 2018.
Succession planning and board compositionThe Committee undertook a detailed review of succession and development plans for the Executive Committee and Senior Management Team in December 2016. A further review had been planned for 2018 but it was recognised by the Committee that the Group’s newly appointed Head of HR & Organisation Development will be undertaking a comprehensive review of succession and development plans across all levels of the business during the course of 2018 and, as such, the Committee resolved at its meeting in December 2017 to defer its own planned review until that process has been completed. The Committee is responsible for keeping under review the composition of the Board, to ensure that its membership comprises an appropriate balance of experience and skills and includes the right number of independent Directors.Anthony Donnelly and Lisa Clement have served on the Board for more than seven and six years respectively (factoring in Anthony Donnelly’s term of office as a director of the Harworth Estates division of UK Coal and then of HEPGL). This means that Anthony will cease to be independent under the terms of the Code in January 2020 and Lisa will cease to be independent in December 2020. Having successfully identified and appointed a successor as Chairman, the Committee will now turn its attention to the succession plans for Anthony and Lisa. It will also consider whether, in light of the terms of the proposed new Code, the Company needs to appoint an additional independent Non-Executive Director so that a majority of the Board, including the Chairman, are independent.
DiversityAlongside its property portfolio, the Company’s biggest asset is its people. The Board recognises that the Company faces a challenge to improve the diversity of its team at all levels of the business. The Company has a diversity policy which promotes equal opportunities and prohibits discrimination in employment but that policy has recently been subject to an external review pursuant to which it will be updated shortly. Further information on the Group’s diversity policy, its initiatives and objectives for, and progress in, promoting diversity appear at pages 56 and 57 of the Strategic Report. The Nomination Committee report has been approved by the Board and signed on its behalf by:Jonson Cox Chair of the Nomination Committee (as at 31 December 2017) 24 April 2018

92 Harworth Group plc Annual Report and Financial Statements 2017
Directors’ reportStatements for the year ended 31 December 2017
IntroductionThe Directors present their report and the audited consolidated financial statements for the year ended 31 December 2017.In accordance with legislation, some of the matters required to be included in this Directors’ Report have been included instead in the Strategic Report on pages 2 to 57, because the Board considers them to be of strategic importance, such as the Group’s strategic priorities, business model, markets and principal risks. Others are included in the wider Statement of Corporate Governance on pages 60 to 97.As such, the Directors’ Report should be read in conjunction with the Strategic Report (pages 2 to 57) and the wider Statement of Corporate Governance (pages 60 to 97) which are incorporated by reference into this Directors’ Report.The information required to be disclosed in the Directors’ Report can be found in this Annual Report on the pages listed below.
ReferenceAgreements with Shareholders Statement of Corporate Governance, p65Amendment of the Articles Directors’ report, p94Annual General Meeting Statement of Corporate Governance, p71Appointment and replacement of Directors Directors’ report, p94Board of Directors Board of Directors and Company Secretary, pp60-61
Directors’ report, p94 Charitable donations Directors’ report, p95Change of control Directors’ report, p95Composition and operation of administrative, management and supervisory bodies and committees
Statement of Corporate Governance, pp64-67
Directors’ insurance and indemnities Statement of Corporate Governance, p68 Directors’ report, p94
Disclosure of information to auditors Statement of Directors’ responsibilities, p97Diversity Strategic report: Our people, pp56-57Employee numbers Strategic report: Our people, p55Employee engagement Strategic report: Our people, p55Employees with disabilities Strategic report: Our people, p57Employee share scheme Strategic report: Our people, p56
Directors’ Remuneration report, p73Future developments of the business Strategic report, pp2-6Going concern and viability Strategic report, p44Greenhouse gas emissions Strategic report, pp52-53Independent auditors Audit Committee report, pp87-88
Independent auditors’ report, pp98-103Political donations Directors’ report, p95Post-Balance sheet events Strategic report: Chief Executive’s Statement, p14
Financial Statements, Note 31, p141Powers for the Company to issue or buy back shares Directors’ report, pp93-94Powers of the Directors Directors’ report, p94Profit/loss and dividends Strategic report, former Chairman’s statement, p11
Directors’ report, p93Restrictions on transfer of securities Directors’ report, p93Rights attaching to shares Directors’ report, p93Risk management and internal controls Strategic report, pp36-43
Audit Committee report, p89 Risk management – financial risks and use of financial instruments to mitigate risk Strategic report, Financial review, p34
Directors’ report, p95 Financial statements, Note 23, p134
Share capital Directors’ report, p93Significant related party agreements Financial statements, Note 30, p140Significant Shareholders Directors’ report, p95Statement of corporate governance including compliance with corporate governance code Directors’ report, p96Voting rights Directors’ report, p93
The liabilities of the Directors in connection with this Report are subject to the limitations and restrictions provided by English Company law.
Directors’ reportStatements for the year ended 31 December 2017

STRATEGIC REPORTCORPORATE GOVERNANCE
FINANCIAL STATEMENTS
Harworth Group plc Annual Report and Financial Statements 2017 93
The Company
Legal formHarworth Group plc is a Company incorporated in the United Kingdom with Company number 2649340. The principal subsidiaries and associated undertakings are listed in Note 16 of the Financial Statements.
Financial results The Group’s consolidated income statement set out on page 104 shows Group profit before taxation of £41.8m (2016: £43.5m). The net assets attributable to Shareholders of the Group increased to £409.3m (2016: £334.9m) over the financial year to 31 December 2017. The Group’s NAV and EPRA NNNAV rose by 22.2% and 18.3%, respectively, during the year. The Group’s NAV per share and EPRA NNNAV per share rose by 11.2% and 12.5% respectively. The results for the Group are reviewed in the Chairman’s Statement, the Chief Executive’s Statement and Financial Review and the detailed results are set out in the financial statements on pages 104 to 141 which accompany this report.
Share capital and authority to allot and purchase sharesThe Company’s issued share capital as at 31 December 2016 was 292,269,786 Ordinary Shares of 10 pence each. On 22 March 2017, the Company issued and allotted a further 29,226,974 Ordinary Shares of 10 pence each pursuant to a non pre-emptive placing of shares so that, as at 31 December 2017, the Company’s issued share capital was 321,496,760 Ordinary Shares of 10 pence each. Those shares were placed at a price of 95 pence, representing a discount of approximately 1.6% to the closing mid-market price of the Company’s shares on the day before the announcement of the placing. The placing raised £27.1m (net of expenses) which the Company deployed by acquiring, and making initial investments in, five new strategic land sites during 2017. There have been no further changes to the issued share capital of the Company. As such, the issued share capital of the Company at 23 April 2018 (being the latest date prior to publication of this report) was 321,496,760 Ordinary Shares of 10 pence each. The ISIN of the shares is GB00BYZJ7G42. All shares carry equal rights to dividend, voting and return of capital on the winding up of the Company, as set out in the Company’s Articles of Association, and are fully paid. No person holds shares carrying special rights with regard to control of the Company.As at 23 April 2018 (being the latest date prior to publication of this report), there are no restrictions on the transfer of securities in the Company, save for the power of the Board to refuse to transfer shares in certain circumstances prescribed by the Articles of Association, and there are no restrictions on any voting rights or deadlines, other than those prescribed by law, nor is the Company aware of any other arrangement between holders of shares which may result in restrictions on the transfer of securities or voting rights, nor any arrangement whereby a Shareholder has waived or agreed to waive dividends (other than the EBT – see below).The Harworth Group plc Employee Benefit Trust (“EBT”) holds shares for the purposes of satisfying awards that may vest under the Company’s share-based incentive schemes. The EBT may purchase shares in the Company from time to time to satisfy awards granted to Executive Directors, members of the Executive Committee and Senior Management Team, subject to the achievement of performance targets under the Company’s incentive schemes. At 31 December 2017, it held 246,010 Ordinary Shares of 10 pence each in the Company in respect of future incentive awards under the Company’s employee share schemes. Details of outstanding awards to the Executive Directors are set out in the Directors’ remuneration report on page 84. The EBT has waived its right to receive dividends on shares that it holds beneficially in respect of future awards. The trustee of the EBT exercises any voting rights on such shares in accordance with the Directors’ recommendations.Section 551 of the CA06 provides that the Directors may not allot shares unless empowered to do so by Shareholders. On 22 March 2017, the Company issued and allotted 29,226,974 Ordinary Shares of 10 pence each (representing an aggregate nominal value of approximately 9.9% of the Company’s issued share capital) for the purposes of the placing referred to above, pursuant to the authority to allot shares granted to the Company by Shareholders at the 2016 Annual General Meeting. In conjunction with the Share Capital Management Guidelines published by the Investment Association, a resolution was passed at the 2017 Annual General Meeting giving the Directors authority to allot shares up to an aggregate nominal value of one-third of the Company’s issued share capital plus a further one-third (i.e. two-thirds in all) where the allotment is in connection with a rights issue. The Company has not utilised that authority in the period since the 2017 Annual General Meeting. At the 2018 Annual General Meeting, the Directors propose to renew the authorities granted to them at the 2017 Annual General Meeting.
Allotment of shares for cashUnder Section 561 of the CA06, if the Directors wish to allot unissued shares for cash (other than pursuant to an employee share scheme) they must first offer them to existing Shareholders in proportion to their holdings (a pre-emptive offer). By a special resolution at the 2017 Annual General Meeting, the Shareholders gave authority to the Directors to dis-apply the above mentioned pre-emption and to allot shares for cash other than by way of rights to existing Shareholders, provided that the aggregate nominal value of such shares does not exceed 5% of the Company’s total issued equity capital. This authority was compliant with the Pre-Emption Group’s Statement of Principles (“PEG Principles”).The Directors have not made use of this authority since the 2017 Annual General Meeting. Prior to the 2017 Annual General Meeting, they did issue shares for non-cash consideration pursuant to the non pre-emptive share placing in March 2017 referred to above.The Directors propose to renew this authority at the 2018 Annual General Meeting.The Directors have no current plans to make use of the renewed authority should it be granted, although they consider their renewal appropriate in order to retain maximum flexibility to take advantage of business opportunities as they arise. That said, the PEG Principles request that in any rolling three-year period a Company does not make non-pre-emptive issues for cash exceeding 7.5% of the Company’s issued share capital without prior consultation with Shareholders. The Directors intend to comply with that guidance.

94 Harworth Group plc Annual Report and Financial Statements 2017
Directors’ reportContinued
Purchase of own shares The Company has authority under a Shareholders’ resolution passed at the 2017 Annual General Meeting to purchase up to 32,149,675 of the Company’s Ordinary Shares, representing approximately 10% of the Company’s total issued share capital, in the market during the period expiring at the 2018 Annual General Meeting. No shares have been purchased by the Company under the authority granted at the 2017 Annual General Meeting. A special resolution will be proposed at the 2018 Annual General Meeting to renew this authority. Although the Directors have no immediate plans to do so, they believe it is prudent to seek general authority from Shareholders to be able to act if circumstances were to arise in which they considered such purchases to be desirable. This power will only be exercised if and when, in the light of market conditions prevailing at that time, the Directors believe that such purchases would increase earnings per share and would be for the benefit of Shareholders generally. Any shares purchased under this authority will be cancelled (unless the Directors determine that they are to be held as treasury shares) and the number of shares in issue will be reduced accordingly.
Amendment of Articles of AssociationThe Articles of Association may be amended by special resolution of the Shareholders.
DividendsThe Board is recommending a final dividend of 0.575 pence per share which, together with the interim dividend of 0.253 pence per share paid in October 2017, makes a combined dividend of 0.828 pence (2016: 0.753 pence) per share. Payment of the final dividend, if approved at the 2018 Annual General Meeting, will be made on 1 June 2018 to Shareholders on the register at the close of business on 4 May 2018. The ex-dividend date will be 3 May 2018. The dividend paid in the year to 31 December 2017 and disclosed in the Statement of Changes in Equity is 0.776 pence (2016: 0.74 pence) per share, being the previous year’s final dividend of 0.523 pence per share and the interim dividend of 0.253 pence per share in respect of the year ended 31 December 2017. These were paid on 30 May 2017 and 13 October 2017 respectively.
Directors and Directors’ interests A list of the Company’s Directors who were in office during the year ended 31 December 2017 and up to the date of signing the financial statements, along with their biographies, appear in the Statement of Corporate Governance on pages 60 and 61. Details of the Directors’ remuneration and beneficial interests in, and options to acquire, Ordinary Shares in the Company as at 31 December 2017 are set out in the Directors’ Remuneration report on page 84. Details of the Directors’ beneficial interests in, and options to acquire, Ordinary Shares as at 23 April 2018 (being the latest practical date prior to publication of this report) are set out in the Directors’ remuneration report on page 84. The Directors do not have any interest in any other Group Company, other than as Directors. No Director has, or has had, a material interest, directly or indirectly, at any time during the year under review in any contract significant to the Company’s business.
Appointment, replacement and powers of Directors The appointment and replacement of Directors is governed by the Articles of Association.The Board must comprise not less than two Directors with no maximum number of Directors. Directors may be appointed by Shareholders (by ordinary resolution) or by the Board. Under the Company’s Articles of Association, any Director appointed by the Board since the last Annual General Meeting may only hold office until the date of the following Annual General Meeting, at which time that Director must stand for election by Shareholders. Alastair Lyons will, therefore, be standing for election at the 2018 Annual General Meeting.The Articles of Association also require one-third of the Directors to retire by rotation at each Annual General Meeting. Any Director who has not retired by rotation must retire at the third Annual General Meeting after his or her last appointment or re-appointment. However, in accordance with the Code, which requires all Directors of FTSE 350 companies to be subject to annual re-election by Shareholders, the Board has again decided that all other Directors will be subject to re-election at the 2018 Annual General Meeting.The Directors may exercise all of the powers of the Company, subject to compliance with relevant laws, the Company’s Memorandum and Articles of Association and any directions given by special resolution of Shareholders. These include specific restrictions regarding the Company’s power to borrow money.
Directors’ indemnities and insurance As permitted by the Articles of Association, qualifying third-party indemnities have been in place throughout the period under review and remain in force at the date of this report in respect of liabilities suffered or incurred by each Director. The deeds of indemnity are available for inspection by Shareholders at the Company’s registered office. The Company also maintains an appropriate level of Directors’ and Officers’ liability insurance in respect of legal actions against the Directors. Neither the qualifying third party indemnities nor the insurance provide cover where the Director has acted fraudulently or dishonestly.
Directors’ reportContinued

STRATEGIC REPORTCORPORATE GOVERNANCE
FINANCIAL STATEMENTS
Harworth Group plc Annual Report and Financial Statements 2017 95
Political donations No political donations were made during the year (2016: £nil). It remains the Company’s policy to not make any cash donations to political parties. This policy is strictly adhered to and there is no intention to change it. However, the definitions of ‘political donation’ and ‘political expenditure’ used in the Companies Act 2006 remain very broad, which may have the effect of covering a number of normal business activities that would not be considered political donations or political expenditure in the usual sense. These could include support for bodies engaged in law reform or governmental policy review or involvement in seminars and functions that may be attended by politicians. To avoid any possibility of inadvertently contravening the Companies Act 2006, the Directors obtained authority from Shareholders at the 2017 Annual General Meeting for certain political donations and expenditure, subject to financial limits. The Directors will seek to renew this authority at the 2018 Annual General Meeting.
Charitable donationsThe Group made charitable donations during 2017 in the aggregate sum of £22,735 (2016: £7,558).
Financial instruments and risk management The Group’s exposure to, and management of capital, liquidity, credit and interest rate risk, are set out within the Financial Review on pages 33 and 34.
General meetingsAn Annual General Meeting must be called on at least 21 days’ clear notice, although the Company gives not less than 20 working days’ notice of its Annual General Meeting in order to comply with the Code.All other general meetings are also required to be held on at least 21 days’ clear notice unless the Company offers Shareholders an electronic voting facility. A special resolution reducing the period of notice for general meetings (other than Annual General Meetings) to not less than 14 days was passed at the 2017 Annual General Meeting. The Directors are proposing to seek renewal of that authority at the 2018 Annual General Meeting. It is intended that this shorter notice period will only be used for non-routine business and where merited in the interests of Shareholders as a whole.
Substantial shareholdings As at the date of this report the Company had been notified, pursuant to paragraph 5 of the FCA’s Disclosure and Transparency Rules, of the following notifiable voting rights in its Ordinary Share capital:
Name of holderNumber of
Ordinary SharesPercentage of total
voting rights
Goodweather Holdings Limited* 88,892,667 27.65%Pension Protection Fund 80,374,189 25.00%Invesco Perpetual 31,993,428 9.95%Pelham Capital Management 27,480,851 8.55%London and Amsterdam Trust Company 11,707,922 3.64%
* Goodweather Holdings Limited is a member of the Peel Holdings Group Limited.
Change of control provisions The following significant agreement contains a provision entitling the counterparties to exercise termination rights in the event of a change of control in the Company:Under the terms of the banking facility agreement entered between RBS and HEPGL in February 2015 and amended in August 2016, December 2016, August 2017 and February 2018, if any person or Group of persons acting in concert gains direct or indirect control of HEPGL the facility will be cancelled and all outstanding loans and bonds, guarantees or letters of credit together with accrued interest shall become immediately due and payable.The rules governing the LTIP provide for the treatment of awards under the LTIP in the event of a takeover of the Company. A summary of those rules was included in the Notice of the 2016 Annual General Meeting, a copy of which is available on the Company’s website at www.harworthgroup.com/investors/.

96 Harworth Group plc Annual Report and Financial Statements 2017
Directors’ reportContinued
Agreements with related partiesAt the start of 2017 there subsisted five joint venture agreements with members of the Peel Group, which were approved by Shareholders in 2011, for the promotion and development of energy from waste schemes at five sites owned by the Group. Those joint venture arrangements were varied during 2017, with the approval of shareholders at the 2017 Annual General Meeting.
Compliance with UK Corporate Governance CodeWhilst the Company is listed on the standard segment of the Official List, it has applied the main and supporting principles of the Code, which applied during the financial year ended 31 December 2017 and is publicly available on the website of the Financial Reporting Council. The Company has complied with the provisions of the Code throughout the year ended 31 December 2017, save for the following matters:• The Audit Committee comprises two independent Non-Executive Directors (Andrew Cunningham and Anthony Donnelly) and
one non-independent Non-Executive Director (Steven Underwood). The Company considers that Mr Underwood makes a valuable and important contribution to the Committee because: (i) he is a chartered accountant; and (ii) in his role as Chief Executive of the Peel Group, he has extensive experience of reviewing and scrutinising the financial statements of a large property business. The independent Non-Executive Directors carry a majority of votes on the Committee.
• The Remuneration Committee comprises two independent Non-Executive Directors (Lisa Clement and Anthony Donnelly), the Chairman (Jonson Cox as at 31 December 2017 and now Alastair Lyons as the date of this Report) and one non-independent Non-Executive Director (Steven Underwood). The Company considers that Mr Underwood makes a valuable and important contribution to the Committee because he relays the views of the Company’s largest Shareholder on remuneration matters. The independent Non-Executive Directors carry a majority of votes on the Committee.
• Given that Jonson Cox announced at the 2017 Annual General Meeting that he would not be standing for re-election at the 2018 Annual General Meeting and his successor was identified and appointed during the course of 2017, the Non-Executive Directors did not meet during 2017 to appraise the (now former) Chairman’s performance. An appraisal of the new Chairman’s performance will be undertaken before publication of the 2018 Annual Report.
• The Senior Independent Director was unable to attend the 2017 Annual General Meeting in person, but did attend the meeting, and answered questions, by conference call. All directors will be in attendance at the 2018 Annual General Meeting.
Approval This report was approved by the Board of Directors and signed on its behalf by: Chris Birch Group General Counsel and Company Secretary 24 April 2018

STRATEGIC REPORTCORPORATE GOVERNANCE
FINANCIAL STATEMENTS
Harworth Group plc Annual Report and Financial Statements 2017 97
The Directors are responsible for preparing the Annual Report and Financial Statements in accordance with applicable law and regulations.Company law requires the Directors to prepare financial statements for each financial year. Under that law the Directors have prepared the Group financial statements in accordance with International Financial Reporting Standards (IFRSs) as adopted by the European Union and have prepared the Company financial statements in accordance with International Financial Reporting Standards (IFRSs) as adopted by the European Union. Under Company law the Directors must not approve the financial statements unless they are satisfied that they give a true and fair view of the state of affairs of the Group and Company and of the profit or loss of the Group and of the Company for that period. In preparing the financial statements, the Directors are required to:• select suitable accounting policies and then apply them consistently;• make judgements and accounting estimates that are reasonable and prudent; • for the Group financial statements, state whether applicable IFRSs as adopted by the European Union have been followed,
subject to any material departures disclosed and explained in the financial statements;• for the Company financial statements, state whether applicable IFRSs as adopted by the European Union have been followed,
subject to any material departures disclosed and explained in the financial statements;• assess the Group and Company’s ability to continue as a going concern, disclosing, as applicable, matters relating to their
going concern status; and• prepare the financial statements on the going concern basis unless it is inappropriate to presume that the Company and Group
will continue in business.The Directors are responsible for keeping adequate accounting records that are sufficient to show and explain the Group and Company’s transactions and disclose with reasonable accuracy at any time the financial position of the Group and Company and enable them to ensure that the financial statements and the Directors’ remuneration report comply with CA06 and, as regards the Group financial statements, Article 4 of the IAS Regulation. They are responsible for such internal control as they determine is necessary to enable the preparation of financial statements that are free from material misstatement, whether due to fraud or error.The Directors are also responsible for taking such steps as are reasonably open to them to safeguard the assets of the Group and hence for taking reasonable steps for the prevention and detection of fraud and other irregularities.The Directors are responsible for preparing a strategic report, corporate governance statement, directors’ remuneration report and directors’ report that complies with applicable law and regulations.The Directors are responsible for the maintenance and integrity of the corporate and financial information which appears on the Company’s website www.harworthgroup.com. Legislation in the United Kingdom governing the preparation and dissemination of financial statements may differ from legislation in other jurisdictions.Each of the Directors who were in office during the year ended 31 December 2017 and up to the date of this Report, considers that the 2017 Annual Report and Financial Statements, taken as a whole, is fair, balanced and understandable and provides the information necessary for Shareholders to assess the Company’s position, performance, business model and strategy.Each of the Directors who were in office during the year ended 31 December 2017 and up to the date of this Report, confirms to the best of their knowledge:• the Group financial statements, which have been prepared in accordance with IFRSs as adopted by the European Union, give a
true and fair view of the assets, liabilities, financial position and profit of the Group; • the Company financial statements, which have been prepared in accordance with IFRSs as adopted by the European Union,
give a true and fair view of the assets, liabilities, financial position and profit of the Company; and• the Strategic report includes a fair review of the development and performance of the business and the position of the Group
and the Company, together with a description of the principal risks and uncertainties that they face.Each of the Directors who were in office during the year ended 31 December 2017 and up to the date of this Report also confirms:• so far as the Director is aware, there is no relevant audit information of which the Company’s auditors are unaware; and• the Director has taken all the steps that he/she ought to have taken as a Director in order to make himself/herself aware of any
relevant audit information and to establish that the Company’s auditors are aware of that information.This confirmation is given and should be interpreted in accordance with the provisions of section 418 CA06.The Directors’ report, prepared in accordance with the requirements of CA06 and the FCA’s Listing and Disclosure and Transparency Rules, was approved by the Board and signed on its behalf by:Chris Birch Group General Counsel and Company Secretary 24 April 2018
Statement of Directors’ responsibilitiesin respect of the financial statements
Statement of Directors’ responsibilitiesin respect of the financial statements

98 Harworth Group plc Annual Report and Financial Statements 2017
Independent auditors’ reportto the members of Harworth Group plc
Report on the audit of the financial statementsOpinionIn our opinion, Harworth Group plc’s group financial statements and company financial statements (the “financial statements”):• give a true and fair view of the state of the group’s and of the company’s affairs as at 31 December 2017 and of the group’s
profit and the group’s and the company’s cash flows for the year then ended;• have been properly prepared in accordance with IFRSs as adopted by the European Union and, as regards the company’s
financial statements, as applied in accordance with the provisions of the Companies Act 2006; and• have been prepared in accordance with the requirements of the Companies Act 2006 and, as regards the group financial
statements, Article 4 of the IAS Regulation.We have audited the financial statements, included within the Annual Report and Financial Statements 2017 (the “Annual Report”), which comprise: the Balance sheets as at 31 December 2017; the Consolidated income statement and Consolidated statement of comprehensive income, the Statements of cash flows, and the Consolidated statement of changes in equity and Company statement of changes in equity for the year then ended; and the notes to the financial statements, which include a description of the significant accounting policies.Our opinion is consistent with our reporting to the Audit Committee.Basis for opinionWe conducted our audit in accordance with International Standards on Auditing (UK) (“ISAs (UK)”) and applicable law. Our responsibilities under ISAs (UK) are further described in the Auditors’ responsibilities for the audit of the financial statements section of our report. We believe that the audit evidence we have obtained is sufficient and appropriate to provide a basis for our opinion.IndependenceWe remained independent of the group in accordance with the ethical requirements that are relevant to our audit of the financial statements in the UK, which includes the FRC’s Ethical Standard, as applicable to listed public interest entities, and we have fulfilled our other ethical responsibilities in accordance with these requirements.To the best of our knowledge and belief, we declare that non-audit services prohibited by the FRC’s Ethical Standard were not provided to the group or the company.Other than those disclosed in note 8 to the financial statements, we have provided no non-audit services to the group or the company in the period from 1 January 2017 to 31 December 2017.
Our audit approachOverview
• Overall group materiality: £5.0m (2016: £4.6m), based on 1% of total assets.• Overall company materiality: £2.4m (2016: £2.2m), based on 1% of total assets.• We tailored the scope of our audit to ensure that we performed enough work to be able to give an
opinion on the financial statements as a whole, taking into account the geographic structure of the Group, the accounting processes and controls and the industry in which the Group operates.
• The Group is structured along two business lines being Capital Growth and Income Generation. The Group financial statements are a consolidation of the 30 reporting units within these two business lines and the Group’s centralised functions.
• Of the Group’s 30 reporting units, we identified 5 which, in our view, had the most significant effect on the Group Balance sheet and/or the Consolidated income statement due to their size or their risk characteristics. We performed a full scope audit on the Balance sheet and/or the Consolidated income statement as appropriate. The reporting units subject to full scope audit work on the Balance sheet and/or the Consolidated income statement accounted for 94% of total assets and 97% of profit before tax.
• This, together with additional procedures performed on the Group’s centralised functions, gave us the evidence we needed for our opinion on the Group financial statements as a whole.
• Valuation of investment property (£216.6m) (Refer to note 15 of the financial statements) (Group).• Valuation of development property (£210.5m) (Refer to note 17 of the financial statements) (Group).
Independent auditors’ reportto the members of Harworth Group plc

Harworth Group plc Annual Report and Financial Statements 2017 99
STRATEGIC REPORTCORPORATE GOVERNANCE
FINANCIAL STATEMENTS
The scope of our auditAs part of designing our audit, we determined materiality and assessed the risks of material misstatement in the financial statements. In particular, we looked at where the directors made subjective judgements, for example in respect of significant accounting estimates that involved making assumptions and considering future events that are inherently uncertain. We gained an understanding of the legal and regulatory framework applicable to the group and the industry in which it operates, and considered the risk of acts by the group which were contrary to applicable laws and regulations, including fraud. We designed audit procedures at group and significant component level to respond to the risk, recognising that the risk of not detecting a material misstatement due to fraud is higher than the risk of not detecting one resulting from error, as fraud may involve deliberate concealment by, for example, forgery or intentional misrepresentations, or through collusion. We focused on laws and regulations that could give rise to a material misstatement in the group and company financial statements, including, but not limited to, Companies Act 2006. Our tests included, but were not limited to, review of the financial statement disclosures to underlying supporting documentation, review of correspondence with and reports to the regulators, review of correspondence with legal advisors and enquiries of management in so far as they related to the financial statements. There are inherent limitations in the audit procedures described above and the further removed non-compliance with laws and regulations is from the events and transactions reflected in the financial statements, the less likely we would become aware of it.We did not identify any key audit matters relating to irregularities, including fraud. As in all of our audits we also addressed the risk of management override of internal controls, including testing journals and evaluating whether there was evidence of bias by the directors that represented a risk of material misstatement due to fraud. Key audit mattersKey audit matters are those matters that, in the auditors’ professional judgement, were of most significance in the audit of the financial statements of the current period and include the most significant assessed risks of material misstatement (whether or not due to fraud) identified by the auditors, including those which had the greatest effect on: the overall audit strategy; the allocation of resources in the audit; and directing the efforts of the engagement team. These matters, and any comments we make on the results of our procedures thereon, were addressed in the context of our audit of the financial statements as a whole, and in forming our opinion thereon, and we do not provide a separate opinion on these matters. This is not a complete list of all risks identified by our audit.
Key audit matter How our audit addressed the key audit matter
Valuation of investment property (£216.6m) (Refer to note 15 of the financial statements)We focused on this area because the Group’s investment property assets represent a significant proportion of the assets in the Balance sheet.The Group’s portfolio includes properties at varying stages of completion, across various sectors, including mixed-use, industrial and retail. Property valuations are subject to a high degree of judgement as they are calculated from a number of different assumptions specific to each individual property. These include actual and estimated rental values, yields, costs to complete and expected land values per acre.The Group engaged independent external valuers to value its investment properties in accordance with the Royal Institution of Chartered Surveyors (“RICS”) Valuation – Professional Standards.For the majority of properties, the residual appraisal method was used, by estimating the fair value of the completed project using a capitalisation method based on expected land values per acre less estimated costs to completion and a risk premium. Completed properties were valued on an income approach basis, taking into consideration assumptions for yields and estimated market rent.A relatively small percentage change in the valuations of individual properties, in aggregate, could result in a material impact on the financial statements.
We read the third party property valuation reports obtained by the Directors and considered if the overall approach and methodology adopted were appropriate given the nature of the properties being valued and whether they were in line with market practice. We also considered the extent to which the approach and methodology were consistent with prior years.For a sample of properties representing 67% of the value of the property portfolio, we discussed the valuation approach on a property by property basis directly with the third party valuer. We considered the specific assumptions used by the valuer for each property, including the expected land values per acre, costs to complete, estimated rental values and yields, and considered whether these were consistent with market evidence and, where relevant, actual sale proceeds on properties disposed of during the year. For properties where further investment property spend is forecast to be incurred, we obtained management estimates for the costs to completion to be incurred and for a sample of costs agreed to supporting documentation, such as tenders or agreements, to check the accuracy of the forecast costs.We found the methodologies used by the third party valuers to be consistent across the portfolio of properties and with prior years. We also found that the assumptions used were within the ranges typically used for similar valuations.

100 Harworth Group plc Annual Report and Financial Statements 2017
Independent auditors’ reportto the members of Harworth Group plc
Key audit matter How our audit addressed the key audit matter
Valuation of development property (£210.5m) (Refer to note 17 of the financial statements)We focused on this area because the Group’s development property assets represent a significant proportion of the assets in the Consolidated Balance sheet.The Group’s development properties were valued at £210.5m as at 31 December 2017. These properties are held at the lower of cost and net realisable value, in accordance with IAS 2 – Inventory, following the transfer from investment property at fair value and/or expenditure incurred during the year, resulting in a deemed cost. As qualifying costs are incurred on existing developments, these are added to the asset balance. The Group’s portfolio consists of a variety of assets at varying stages of completion, across various sectors, located throughout the UK. While during the year there were several disposals recorded, the portfolio includes certain assets transferred during the year from investment properties where they were held at fair value which could indicate a higher risk that the carrying value is higher than the net realisable value. In addition, there are assets subject to significant judgements as a result of costs to complete the development site ahead of a future sale. The UK property market has varying capital values and Estimated Rental Values (“ERVs”) across many sectors and geographic locations, increasing the risk of impairment across the portfolio due to market conditions. A change in conditions for specific assets or a relatively small percentage change in the either the property or construction markets could result in a material impact to the financial statements.
Management performed an assessment of the net realisable value for each individual asset, including producing and reviewing development appraisals. We assessed the competence and capabilities of management and were satisfied that the individuals are sufficiently qualified. We met with management to understand the status and future plans for each asset and challenge key assumptions inherent in the appraisals. We also visited a sample of assets with management.Management further supported their development appraisals with internal and external third party valuations on each individual site. We read the third party property valuation reports obtained by management and considered if the overall approach and methodology adopted were appropriate given the nature of the properties being valued and whether they were in line with market practice. Where applicable due to the advanced stage of the development, we also agreed third party documentation supporting the book value through a review of pre-letting agreements, forward sales, quantity surveyor cost to complete estimates, board minutes and planning consent forms. Where applicable due to the advanced stage of the development, we also agreed third party documentation supporting the book value through a review of pre-letting agreements, forward sales, quantity surveyor cost to complete estimates, board minutes and planning consent forms. Additionally, we performed a look-back test, comparing historic book values of assets to disposal proceeds following their sale. There have been no significant losses made on disposals in recent years, including assets previously subject to write-downs. Based on this work we are satisfied with the evidence that development and trading properties are held at the lower of cost and net realisable value. We also found that the assumptions used were within the ranges typically used for similar valuations.
How we tailored the audit scopeWe tailored the scope of our audit to ensure that we performed enough work to be able to give an opinion on the financial statements as a whole, taking into account the structure of the group and the company, the accounting processes and controls, and the industry in which they operate.The Group is structured along two business lines being Capital Growth and Income Generation. The Group financial statements are a consolidation of the 30 reporting units within these two business lines and the Group’s centralised functions. Of the Group’s 30 reporting units, we identified 5 which, in our view, had the most significant effect on the Balance sheet and/or the Consolidated income statement due to their size or their risk characteristics. We performed a full scope audit on the Balance sheet and/or the Consolidated income statement as appropriate. The reporting units subject to full scope audit work on the Balance sheet and/or the Consolidated income statement accounted for 94% of total assets and 97% of profit before tax. This, together with additional procedures performed on the Group’s centralised functions, gave us the evidence we needed for our opinion on the Group financial statements as a whole.MaterialityThe scope of our audit was influenced by our application of materiality. We set certain quantitative thresholds for materiality. These, together with qualitative considerations, helped us to determine the scope of our audit and the nature, timing and extent of our audit procedures on the individual financial statement line items and disclosures and in evaluating the effect of misstatements, both individually and in aggregate on the financial statements as a whole. Based on our professional judgement, we determined materiality for the financial statements as a whole as follows:
Group financial statements Company financial statements
Overall materiality £5.0m (2016: £4.6m). £2.4m (2016: £2.2m).How we determined it 1% of total assets. 1% of total assets.Rationale for benchmark applied The key driver of the business and determinant of
the Group’s value is direct and indirect property investments. Due to this, the key area of focus in the audit is the valuation of investment properties and carrying value of development properties. On this basis, we set an overall Group materiality level based on total assets, which is a generally accepted auditing benchmark.
The key driver of the business and determinant of the company’s value is direct and indirect property investments. Due to this, the key area of focus in the audit is the valuation of investment properties and carrying value of development properties. On this basis, we set an overall materiality level based on total assets, which is a generally accepted auditing benchmark.

Harworth Group plc Annual Report and Financial Statements 2017 101
STRATEGIC REPORTCORPORATE GOVERNANCE
FINANCIAL STATEMENTS
For each component in the scope of our group audit, we allocated a materiality that is less than our overall group materiality. The range of materiality allocated across components was between £1.4m and £4.6m. Certain components were audited to a local statutory audit materiality that was also less than our overall group materiality.We agreed with the Audit Committee that we would report to them misstatements identified during our audit above £236,000 (Group audit) (2016: £196,000) and £236,000 (Company audit) (2016: £196,000) as well as misstatements below those amounts that, in our view, warranted reporting for qualitative reasons.Going concernIn accordance with ISAs (UK) we report as follows:Reporting obligation Outcome
We are required to report if we have anything material to add or draw attention to in respect of the directors’ statement in the financial statements about whether the directors considered it appropriate to adopt the going concern basis of accounting in preparing the financial statements and the directors’ identification of any material uncertainties to the group’s and the company’s ability to continue as a going concern over a period of at least twelve months from the date of approval of the financial statements.
We have nothing material to add or to draw attention to. However, because not all future events or conditions can be predicted, this statement is not a guarantee as to the group’s and company’s ability to continue as a going concern.
Reporting on other information The other information comprises all of the information in the Annual Report other than the financial statements and our auditors’ report thereon. The directors are responsible for the other information. Our opinion on the financial statements does not cover the other information and, accordingly, we do not express an audit opinion or, except to the extent otherwise explicitly stated in this report, any form of assurance thereon. In connection with our audit of the financial statements, our responsibility is to read the other information and, in doing so, consider whether the other information is materially inconsistent with the financial statements or our knowledge obtained in the audit, or otherwise appears to be materially misstated. If we identify an apparent material inconsistency or material misstatement, we are required to perform procedures to conclude whether there is a material misstatement of the financial statements or a material misstatement of the other information. If, based on the work we have performed, we conclude that there is a material misstatement of this other information, we are required to report that fact. We have nothing to report based on these responsibilities.With respect to the Strategic Report and Directors’ report, we also considered whether the disclosures required by the UK Companies Act 2006 have been included. Based on the responsibilities described above and our work undertaken in the course of the audit, the Companies Act 2006, (CA06) and ISAs (UK) require us also to report certain opinions and matters as described below (required by ISAs (UK) unless otherwise stated).Strategic Report and Directors’ reportIn our opinion, based on the work undertaken in the course of the audit, the information given in the Strategic Report and Directors’ report for the year ended 31 December 2017 is consistent with the financial statements and has been prepared in accordance with applicable legal requirements. (CA06)In light of the knowledge and understanding of the group and company and their environment obtained in the course of the audit, we did not identify any material misstatements in the Strategic Report and Directors’ report. (CA06)The directors’ assessment of the prospects of the group and of the principal risks that would threaten the solvency or liquidity of the groupAs a result of the directors’ voluntary reporting on how they have applied the UK Corporate Governance Code (the “Code”), we are required to report to you if we have anything material to add or draw attention to regarding: • The directors’ confirmation on page 36 of the Annual Report that they have carried out a robust assessment of the principal
risks facing the group, including those that would threaten its business model, future performance, solvency or liquidity.• The disclosures in the Annual Report that describe those risks and explain how they are being managed or mitigated.• The directors’ explanation on page 44 of the Annual Report as to how they have assessed the prospects of the group, over
what period they have done so and why they consider that period to be appropriate, and their statement as to whether they have a reasonable expectation that the group will be able to continue in operation and meet its liabilities as they fall due over the period of their assessment, including any related disclosures drawing attention to any necessary qualifications or assumptions.
We have nothing to report in respect of this responsibility.

102 Harworth Group plc Annual Report and Financial Statements 2017
Independent auditors’ reportto the members of Harworth Group plc
Other Code ProvisionsAs a result of the directors’ voluntary reporting on how they have applied the Code, we are required to report to you if, in our opinion: • The statement given by the directors, on page 97, that they consider the Annual Report taken as a whole to be fair, balanced
and understandable, and provides the information necessary for the members to assess the group’s and company’s position and performance, business model and strategy is materially inconsistent with our knowledge of the group and company obtained in the course of performing our audit.
• The section of the Annual Report on page 86 describing the work of the Audit Committee does not appropriately address matters communicated by us to the Audit Committee.
We have nothing to report in respect of this responsibility. Directors’ RemunerationIn our opinion, the part of the Directors’ Remuneration Report to be audited has been properly prepared in accordance with the Companies Act 2006. (CA06)
Responsibilities for the financial statements and the auditResponsibilities of the directors for the financial statementsAs explained more fully in the Statement of Directors’ responsibilities set out on page 97, the directors are responsible for the preparation of the financial statements in accordance with the applicable framework and for being satisfied that they give a true and fair view. The directors are also responsible for such internal control as they determine is necessary to enable the preparation of financial statements that are free from material misstatement, whether due to fraud or error.In preparing the financial statements, the directors are responsible for assessing the group’s and the company’s ability to continue as a going concern, disclosing as applicable, matters related to going concern and using the going concern basis of accounting unless the directors either intend to liquidate the group or the company or to cease operations, or have no realistic alternative but to do so.Auditors’ responsibilities for the audit of the financial statementsOur objectives are to obtain reasonable assurance about whether the financial statements as a whole are free from material misstatement, whether due to fraud or error, and to issue an auditors’ report that includes our opinion. Reasonable assurance is a high level of assurance, but is not a guarantee that an audit conducted in accordance with ISAs (UK) will always detect a material misstatement when it exists. Misstatements can arise from fraud or error and are considered material if, individually or in the aggregate, they could reasonably be expected to influence the economic decisions of users taken on the basis of these financial statements. A further description of our responsibilities for the audit of the financial statements is located on the FRC’s website at: www.frc.org.uk/auditorsresponsibilities. This description forms part of our auditors’ report.

Harworth Group plc Annual Report and Financial Statements 2017 103
STRATEGIC REPORTCORPORATE GOVERNANCE
FINANCIAL STATEMENTS
Use of this reportThis report, including the opinions, has been prepared for and only for the company’s members as a body in accordance with Chapter 3 of Part 16 of the Companies Act 2006 and for no other purpose. We do not, in giving these opinions, accept or assume responsibility for any other purpose or to any other person to whom this report is shown or into whose hands it may come save where expressly agreed by our prior consent in writing.
Other required reportingCompanies Act 2006 exception reportingUnder the Companies Act 2006 we are required to report to you if, in our opinion:• we have not received all the information and explanations we require for our audit; or• adequate accounting records have not been kept by the company, or returns adequate for our audit have not been received
from branches not visited by us; or• certain disclosures of directors’ remuneration specified by law are not made; or• the company financial statements and the part of the Directors’ Remuneration Report to be audited are not in agreement with
the accounting records and returns. We have no exceptions to report arising from this responsibility. AppointmentFollowing the recommendation of the audit committee, we were appointed by the members on 22 February 1992 to audit the financial statements for the year ended 31 December 1992 and subsequent financial periods. The period of total uninterrupted engagement is 26 years, covering the years ended 31 December 1992 to 31 December 2017.
Andy Ward (Senior Statutory Auditor) for and on behalf of PricewaterhouseCoopers LLP Chartered Accountants and Statutory Auditors Leeds 24 April 2018

104 Harworth Group plc Annual Report and Financial Statements 2017
Consolidated income statementfor the year ended 31 December 2017
Note
Year ended 31 December
2017 £’000
Year ended 31 December
2016 £’000
Revenue 2 53,673 33,693Cost of sales 2 (37,678) (20,905) (20,905)
Gross profit 15,995 12,788Administrative expenses 2 (12,020) (10,457) Other gains 2 35,658 43,027Other operating income/(expense) 2 98 (204)
Operating profit before exceptional items 39,731 45,154Exceptional income 4 414 689Exceptional expense 4 (83) (682) (682)
Operating profit 40,062 45,161Share of profit of joint ventures 16 4,039 647Finance income 7 16 247Finance costs 7 (2,277) (2,588)
Profit before tax 41,840 43,467Tax credit/(charge) 9 7,843 (3,566)
Profit for the financial year 49,683 39,901
Profit per share from continuing operations attributable to the owners of the Group during the year
Note pence pence
Basic and diluted earnings per share 12 15.8 13.7*
*The 2016 earnings per share has been restated to reflect the impact of the May 2016 1 for 10 share consolidation.
The Notes on pages 110 to 141 are an integral part of the consolidated financial statements.
Consolidated income statementfor the year ended 31 December 2017

Harworth Group plc Annual Report and Financial Statements 2017 105
STRATEGIC REPORTCORPORATE GOVERNANCE
FINANCIAL STATEMENTS
Consolidated statement of comprehensive incomefor the year ended 31 December 2017
Note
Year ended 31 December
2017 £’000
Year ended 31 December
2016 £’000
Profit for the financial year 49,683 39,901Other comprehensive income/(expense) – items that will not be reclassified to profit or loss:Actuarial loss in Blenkinsopp Pension Scheme 25 (105) (269) Revaluation of Group occupied property 13 12 (17) Deferred tax on other comprehensive income/(expense) items 9 (51) 94Other comprehensive income/(expense) – items that may be reclassified subsequently to profit or loss:Fair value of financial instruments 23 244 (366)
Total other comprehensive income/(expense) 100 (558) 94
Total comprehensive income for the financial year 49,783 39,343
Consolidated statement of comprehensive incomefor the year ended 31 December 2017
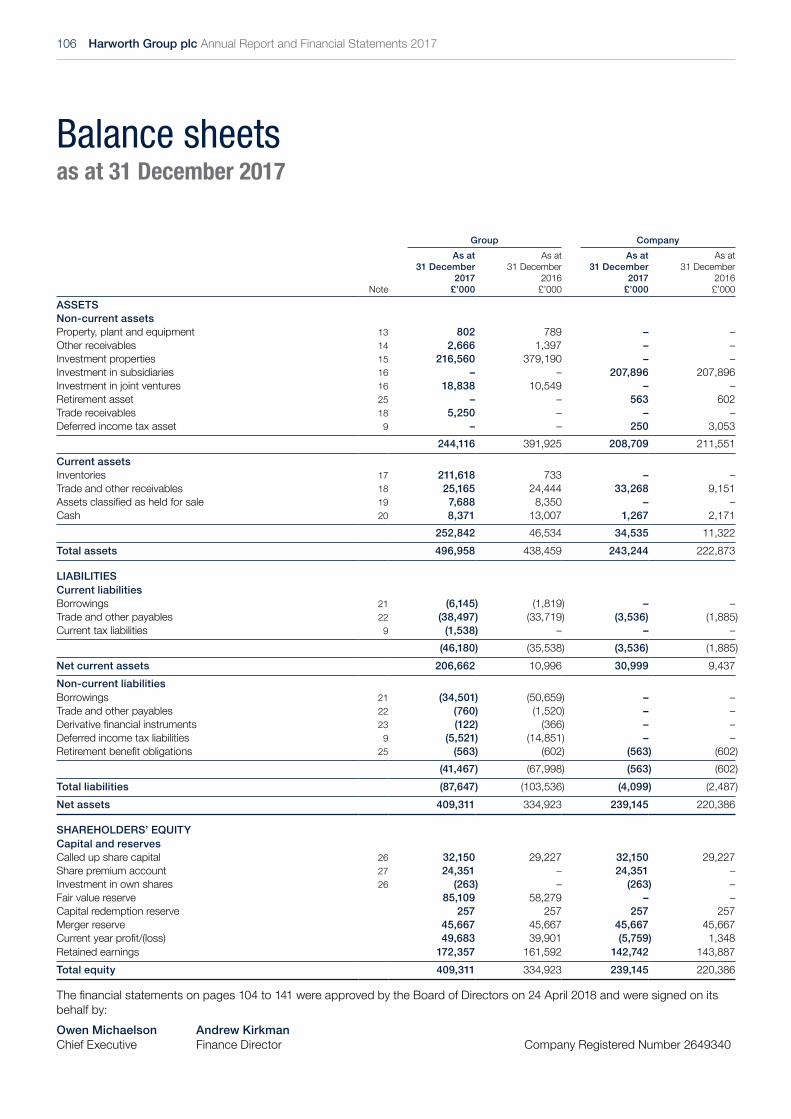
106 Harworth Group plc Annual Report and Financial Statements 2017
Balance sheetsas at 31 December 2017
Group Company
Note
As at 31 December
2017 £’000
As at 31 December
2016 £’000
As at 31 December
2017 £’000
As at 31 December
2016 £’000
ASSETSNon-current assetsProperty, plant and equipment 13 802 789 – –Other receivables 14 2,666 1,397 – –Investment properties 15 216,560 379,190 – –Investment in subsidiaries 16 – – 207,896 207,896Investment in joint ventures 16 18,838 10,549 – –Retirement asset 25 – – 563 602Trade receivables 18 5,250 – – –Deferred income tax asset 9 – – 250 3,053
244,116 391,925 208,709 211,551
Current assetsInventories 17 211,618 733 – –Trade and other receivables 18 25,165 24,444 33,268 9,151Assets classified as held for sale 19 7,688 8,350 – –Cash 20 8,371 13,007 1,267 2,171
252,842 46,534 34,535 11,322
Total assets 496,958 438,459 243,244 222,873
LIABILITIESCurrent liabilitiesBorrowings 21 (6,145) (1,819) – –Trade and other payables 22 (38,497) (33,719) (3,536) (1,885) Current tax liabilities 9 (1,538) – – – (1,885)
(46,180) (35,538) (3,536) (1,885)
Net current assets 206,662 10,996 30,999 9,437
Non-current liabilitiesBorrowings 21 (34,501) (50,659) – –Trade and other payables 22 (760) (1,520) – –Derivative financial instruments 23 (122) (366) – –Deferred income tax liabilities 9 (5,521) (14,851) – –Retirement benefit obligations 25 (563) (602) (563) (602) – –
(41,467) (67,998) (563) (602) (563) – –
Total liabilities (87,647) (103,536) (4,099) (2,487) (4,099) (563)
Net assets 409,311 334,923 239,145 220,386
SHAREHOLDERS’ EQUITYCapital and reservesCalled up share capital 26 32,150 29,227 32,150 29,227Share premium account 27 24,351 – 24,351 –Investment in own shares 26 (263) – (263) –Fair value reserve 85,109 58,279 – –Capital redemption reserve 257 257 257 257Merger reserve 45,667 45,667 45,667 45,667Current year profit/(loss) 49,683 39,901 (5,759) 1,348Retained earnings 172,357 161,592 142,742 143,887Retained earnings/(deficit)
Total equity 409,311 334,923 239,145 220,386
The financial statements on pages 104 to 141 were approved by the Board of Directors on 24 April 2018 and were signed on its behalf by:Owen Michaelson Andrew Kirkman Chief Executive Finance Director Company Registered Number 2649340
Balance sheetsas at 31 December 2017

Harworth Group plc Annual Report and Financial Statements 2017 107
STRATEGIC REPORTCORPORATE GOVERNANCE
FINANCIAL STATEMENTS
Consolidated statement of changes in equityfor the year ended 31 December 2017
Note
Called up share
capital £’000
Share premium account
£’000
Investment in own shares £’000
Fair value reserve*
£’000
Capital redemption
reserve £’000
Merger reserve £’000
Retained earnings
£’000
Total equity £’000
Balance at 1 January 2016 29,227 129,121 – 24,060 257 45,667 69,411 297,743Profit for the financial year to 31 December 2016 – – – – – – 39,901 39,901Fair value gains – – – 34,236 – – (34,236) –Other comprehensive (expense)/income:Actuarial loss in Blenkinsopp pension scheme 25 – – – – – – (269) (269) Revaluation of Group occupied property 13 – – – (17) – – – (17) Fair value of financial instruments 23 – – – – – – (366) (366) Deferred tax on actuarial loss on pension scheme 9 – – – – – – 94 94
Total comprehensive income for the year ended 31 December 2016
– – – 34,219 – – 5,124 39,343
Transactions with owners:Transfer of share premium to other distributable reserves
27 – (129,121) – – – – 129,121 –
Dividends paid – – – – – – (2,163) (2,163)
Balance at 31 December 2016 and 1 January 2017 29,227 – – 58,279 257 45,667 201,493 334,923
Profit for the financial year to 31 December 2017 – – – – – – 49,683 49,683Fair value gains – – – 32,636 – – (32,636) –Transfer of unrealised loss 17 – – – (5,818) – – 5,818 –Other comprehensive (expense)/income: Actuarial loss in Blenkinsopp pension scheme 25 – – – – – – (105) (105) Revaluation of Group occupied property 13 – – – 12 – – – 12 Fair value of financial instruments 23 – – – – – – 244 244 Deferred tax on other comprehensive (expense)/income items
9 – – – – – – (51) (51)
Total comprehensive income for the year ended 31 December 2017
– – – 26,830 – – 22,953 49,783
Transactions with owners:Share issue less costs 26 2,923 24,142 – – – – – 27,065Other transaction costs 27 – 209 – – – – – 209Purchase of own shares 26 – – (263) – – – 86 (177) Dividends paid 11 – – – – – – (2,492) (2,492)
Balance at 31 December 2017 32,150 24,351 (263) 85,109 257 45,667 222,040 409,311
*The fair value reserve relates to unrealised gains and losses arising primarily from the revaluation of investment properties and historical gains/losses from investment property that has now been transferred to development property.
Consolidated statement of changes in equityfor the year ended 31 December 2017

108 Harworth Group plc Annual Report and Financial Statements 2017
Company statement of changes in equityfor the year ended 31 December 2017
Note
Called up share
capital £’000
Share premium account
£’000
Investment in own shares £’000
Capital redemption
reserve £’000
Merger reserve £’000
Retained earnings
£’000
Total equity £’000
Balance at 1 January 2016 29,227 129,121 – 257 45,667 17,170 221,442 Profit for the financial year to 31 December 2016 – – – – – 1,348 1,348 Other comprehensive income/(expense):Actuarial loss in Blenkinsopp pension scheme 25 – – – – – (269) (269) Deferred tax on actuarial loss on pension scheme – – – – – 28 28
Total comprehensive income for the year ended 31 December 2016
– – – – – 1,107 1,107
Transactions with owners:Transfer of share premium to other distributable reserves 27 – (129,121) – – – 129,121 –Dividends paid – – – – – (2,163) (2,163)
Balance at 31 December 2016 and 1 January 2017 29,227 – – 257 45,667 145,235 220,386
Loss for the financial year to 31 December 2017 – – – – – (5,759) (5,759) Actuarial loss in Blenkinsopp pension scheme 25 – – – – – (105) (105) Deferred tax on actuarial loss on pension scheme – – – – – 18 18
Total comprehensive expense for the year ended 31 December 2017
– – – – – (5,846) (5,846)
Transactions with owners:Share issue less costs 26 2,923 24,142 – – – – 27,065Other transaction costs 27 – 209 – – – – 209Purchase of own shares 26 – – (263) – – 86 (177) Dividends paid 11 – – – – – (2,492) (2,492)
Balance at 31 December 2017 32,150 24,351 (263) 257 45,667 136,983 239,145
Company statement of changes in equityfor the year ended 31 December 2017

Harworth Group plc Annual Report and Financial Statements 2017 109
STRATEGIC REPORTCORPORATE GOVERNANCE
FINANCIAL STATEMENTS
Statements of cash flowsfor the year ended 31 December 2017
Group Company
Note
Year ended 31 December
2017 £’000
Year ended 31 December
2016 £’000
Year ended 31 December
2017 £’000
Year ended 31 December
2016 £’000
Cash flows from operating activitiesProfit/(loss) before tax for the financial year 41,840 43,467 (2,937) (1,707) Net interest payable/(receivable) 7 2,261 2,341 (501) (183) Other gains 5 (35,658) (43,027) – –Share of profit of joint ventures 16 (4,039) (647) – –Depreciation of property, plant and equipment 13 8 2 – –Pension contributions in excess of charge (144) (102) (144) (102)
Operating cash inflows/(outflows) before movements in working capital 4,268 2,034 (3,582) (1,992) Decrease in inventories 18,232 359 – –Increase in receivables (5,970) (634) (23,714) (1,584) Increase in payables 8,394 3,715 1,787 1,014
Cash generated from/(used in) operations 24,924 5,474 (25,509) (2,562) Loan arrangement fees paid (214) (150) – –Interest paid (1,277) (1,861) – –Corporation tax received 175 – – –
Cash generated from/(used in) operating activities 23,608 3,463 (25,509) (2,562)
Cash flows from investing activitiesInterest received 16 247 – 9Investment in/acquisition of joint ventures (4,250) (9,134) – –Proceeds from disposal of investment properties 24,434 53,201 – –Expenditure on investment properties (60,431) (47,528) – –Expenditure on property, plant and equipment (9) (25) – –
Cash (used in)/generated from investing activities (40,240) (3,239) – 9
Cash flows from financing activitiesNet proceeds from issue of ordinary shares 27,065 – 27,065 –Proceeds from other loans 6,502 5,187 – –Repayment of bank loans (57,000) (12,000) – –Proceeds from bank loans 43,000 – – –Repayment of other loans (5,111) (5,805) – –Investment in own shares (177) – (177) –Other transaction costs 27 209 – 209 –Dividends paid 11 (2,492) (2,163) (2,492) (2,163)
Cash generated from/(used in) financing activities 11,996 (14,781) 24,605 (2,163)
Decrease in cash (4,636) (14,557) (904) (4,716)
At 1 JanuaryCash 13,007 27,564 2,171 6,887
Decrease in cash (4,636) (14,557) (904) (4,716)
At 31 DecemberCash 8,371 13,007 1,267 2,171
Statements of cash flowsfor the year ended 31 December 2017

110 Harworth Group plc Annual Report and Financial Statements 2017
Notes to the financial statementsfor the year ended 31 December 2017
1. Accounting policiesThe principal accounting policies adopted in the preparation of these consolidated financial statements are set out below. These policies have been consistently applied to all the years presented, unless otherwise stated.
General informationHarworth Group plc (the ‘Company’) is a company limited by shares, incorporated and domiciled in the United Kingdom. The address of its registered office is Advantage House, Poplar Way, Catcliffe, Rotherham, South Yorkshire, S60 5TR.The Company is a listed public company on the London Stock Exchange.
Basis of preparationThe Group and Company financial statements of Harworth Group plc have been prepared on a going concern basis and in accordance with EU adopted International Financial Reporting Standards (“IFRS”) , IFRS IC interpretations and the Companies Act 2006 applicable to companies reporting under IFRS and therefore complies with Article 4 of the EU IAS regulations. The consolidated financial statements have been prepared under the historical cost convention, as modified by the revaluation of investment properties and financial assets and liabilities at fair value through profit or loss.
Going concern basisThese financial statements are prepared on the basis that the Group is a going concern. In forming its opinion as to going concern, the Board prepares cash flow forecasts based upon its assumptions with particular consideration to the key risks and uncertainties as summarised in ‘Managing Risk’ section of this annual report, as well as taking into account the available borrowing facilities in line with the Treasury Policy disclosed on pages 134 and 135.The key factor that has been considered in this regard is:The Group has a £75m revolving credit facility with The Royal Bank of Scotland, for a term of five years, on a non-amortising basis. The facility is in the form of a debenture security whereby there is no charge on the individual assets of the Group. The facility is subject to financial and other covenants.The covenants are based upon gearing, tangible net worth, loan to property values and interest cover. Property valuations affect the loan to value covenants. Breach of covenants could result in the need to pay down in part some of these loans, additional costs, or a renegotiation of terms or, in extremis, a reduction or withdrawal of facilities by the banks concerned.The Directors confirm their belief that it is appropriate to use the going concern basis of preparation for these financial statements.
Accounting policiesThe Group did not early adopt any new or amended standards and does not plan to early adopt any standards issued but not yet effective.
Revenue recognitionRevenue comprises rental and other land related income arising on investment properties, income from construction contracts, the sale of coal fines and the sale of development properties.Rentals are accounted for on a straight-line basis over the lease term.Income from construction contracts is recognised in line with the accounting policy for construction contracts. Revenue is recognised when the Group is acting as a principal under a contract with primary responsibility for the contract and has exposure to significant risks and rewards of the contract. Revenue from the sale of coal fines is recognised at the point of despatch.Revenue from the sale of development properties is recognised at the point of legal completion and where title has passed.Revenue is recognised to the extent that it is probable that the economic benefit will flow to the Group and the revenue can be reliably measured. All such revenue is reported net of discounts, and value added and other sales taxes.
Construction contractsContracts for the construction of substantial assets are accounted for as construction contracts. Where the outcome of a construction contract can be estimated reliably, revenue and costs are recognised by reference to the stage of completion. The assessment of the stage of completion is dependent on the nature of the contracts but will generally be based on the estimated proportion of the total contract costs which have been incurred to date. If a contract is expected to be loss making, a provision is recognised for the entire cost.
Notes to the financial statementsfor the year ended 31 December 2017

Harworth Group plc Annual Report and Financial Statements 2017 111
STRATEGIC REPORTCORPORATE GOVERNANCE
FINANCIAL STATEMENTS
Interest income and expenseInterest income and expense are recognised within ‘finance income’ and ‘finance costs’ in the income statement using the effective interest rate method. The effective interest rate method is a method of calculating the amortised cost of a financial asset or financial liability and of allocating the interest income or interest expense over the relevant period. The effective interest rate is the rate that exactly discounts estimated future cash payments or receipts throughout the expected life of the financial instrument, or a shorter period where appropriate, to the net carrying amount of the financial asset or financial liability.
Other receivables (non-current) Other receivables (non-current) relate to overages. An overage is the right to receive future payments following the sale of investment properties if specified conditions relating to the site are satisfied. The conditions may be the granting of planning permission for development on the site or practical completion of a development. Overages are initially recorded at fair value and are reviewed annually or more frequently if events or changes in circumstances indicate a potential impairment. The carrying value of overages is compared to the recoverable amount, which is the higher of value in use and the fair value less costs to sell. Any impairment is recognised immediately as an expense.
InventoriesInventories comprise development properties, land held for development, options to purchase land, planning promotion agreements and coal slurry that has been processed and is ready for sale.Development properties are included in the consolidated Balance sheet at the lower of cost and net realisable value. Net realisable value is the expected net sales proceeds of the developed property in the ordinary course of business less estimated costs to complete and anticipated selling costs. Properties re-categorised to development properties from investment properties are transferred at deemed cost, being the fair value at the date of re-categorisation. Properties are re-categorised as development properties once planning is secured and the intention to bring those properties forward for development and sale has been agreed.Land held for development is land that has planning permission and is being developed for onward sale.Options to purchase land are agreements that the Group has entered into with the landowners whereby the Group has the option to purchase the land within a limited timeframe. The landowners are not generally permitted to sell to any other party during this period, unless agreed by the Group. All costs, including the cost of entering the option, are capitalised. At each reporting date, the recoverability of the costs are considered by management and where required provisions are made such that the agreements are held at the lower of cost and net realisable value.Planning promotion agreements are agreements that the Group has entered into with the landowners whereby the Group acts as an agent to the landowners in exchange for a fee of a set percentage of the proceeds or profit of the eventual sale. The Group promotes the land through the planning process at its own expense. If the land is sold the Group will receive a fee for its services.The Group incurs various costs in promoting land held under promotion planning agreements, in some instances the agreements allow for the Group to be reimbursed certain expenditure following the conclusion of a successful sale. These costs are held in inventory at the lower of cost and net realisable value. Upon reimbursement, inventory is reduced by the value of the reimbursed cost.Coal fines that have been processed and are ready for sale are stated at the lower of cost and estimated net realisable value. Inventories comprise all of the direct costs incurred in bringing the coal fines to their present state.
Investments in joint venturesJoint ventures are those entities over whose activities the Group has joint control established by contractual agreement. Interests in joint ventures through which the Group carries on its business are classified as jointly controlled entities and accounted for using the equity method. This involves recording the investment initially at cost to the Group and then, in subsequent years, adjusting the carrying amount of the investment to reflect the Group’s share of the joint venture’s results less any impairment in carrying value and any other changes to the joint venture’s net assets such as dividends.
ImpairmentInvestments in subsidiaries are reviewed for impairment if there is any indication that the carrying amount may not be recoverable. When a review for impairment is conducted, the recoverable amount is assessed by reference to the higher of ‘value in use’ (being the present value of expected future cash flows of the relevant cash generating unit) or ‘fair value less costs to sell’. Where there is no binding sale agreement or active market, fair value less costs to sell is based on the best information available to reflect the amount the Company could receive for the cash generating unit in an arm’s length transaction.The impairment testing is carried out under the principles described in IAS 36 ‘Impairment of assets’ which includes a number of restrictions on the future cash flows that can be recognised in respect of restructurings and improvements related to capital expenditure.
Investment propertiesInvestment properties are those properties which are not occupied by the Group and which are held for long term rental yields, capital appreciation or both. Investment property also includes property that is being developed or constructed for future use as investment property by the Group. Investment properties comprise freehold land and buildings and are measured at fair value. At the end of a financial year the fair values are determined by obtaining an independent valuation prepared in accordance with the current edition of the Appraisal and Valuation Standards published by the Royal Institution of Chartered Surveyors. External, independent valuation firms having appropriate, recognised professional qualifications and recent experience in the location and category of property being valued are used.
1. Accounting policies: continued

112 Harworth Group plc Annual Report and Financial Statements 2017
Notes to the financial statementsfor the year ended 31 December 2017: continued
Investment properties are re-categorised as development properties and moved to inventory once planning is secured and the intention to bring those properties forward for development and sale has been agreed.A transfer from the fair value reserve to retained earnings is made if any net realisable value provision is required on any development property where gains had previously been recorded as an investment property. At each subsequent reporting date, investment properties are re-measured to their fair value. Movements in fair value are included in the income statement. Where specific investment properties have been identified as being for sale within the next twelve months, a sale is considered highly probable and the property is immediately available for sale, their fair value is shown under assets classified as held for sale within current assets, measured in accordance with the provisions of IAS 40 ‘Investment Property’.
Profit or loss on disposal of investment propertiesDisposals are accounted for when legal completion of the sale has occurred or there has been an unconditional exchange of contracts. Profits or losses on disposal arise from deducting the asset’s net carrying value and where appropriate a proportion of future costs attributable to the development of the overall land area from the net proceeds (being net purchase consideration less any clawback liability arising on disposal) and is recognised in the income statement. Net carrying value includes valuation in the case of investment properties.In the case of investment properties, any fair value reserve for the property disposed of is treated as realised on disposal of the property and transferred to retained earnings.
Investment properties in the course of constructionDirectly attributable costs incurred in the course of constructing a property are capitalised as part of the cost of the property. Any resultant change in value is therefore recognised through the next revaluation.
Financial assetsA financial asset is classified in this category if acquired principally for the purpose of selling in the short term. Assets in this category are classified as current assets if expected to be settled within 12 months, otherwise they are classified as non-current.Financial assets carried at fair value through profit or loss are initially recognised at fair value and transaction costs are expensed in the income statement. Financial assets are derecognised when the rights to receive cash flows from the investments have expired or have been transferred and the Group has transferred substantially all risks and rewards of ownership.Gains or losses arising from changes in the fair value of financial assets are presented in the income statement within ‘other gains’ in the period in which they arise.Interest income is recognised on financial assets by applying the effective interest rate, except for short-term recievables when the recognition of interest would be immaterial.
Financial liabilitiesLiabilities within the scope of IAS 39 are classified as financial liabilities at fair value through profit or loss or other liabilities, as appropriate.A financial liability is de-recognised when the obligation under the liability is discharged, or cancelled or expires.All loans and borrowings are classified as other liabilities. Initial recognition is at fair value less directly attributable transaction costs. After initial recognition, interest-bearing loans and borrowings are subsequently measured at amortised cost using the effective interest method.Financial liabilities included in trade and other payables are recognised initially at fair value and subsequently at amortised cost. The fair value of a non-interest bearing liability is its discounted repayment amount. If the due date of the liability is less than one year, discounting is omitted.
ProvisionsProvisions are recognised when:• The Group has a present legal or constructive obligation as a result of past events;• It is probable that an outflow of resources will be required to settle the obligation; and• The amount can be reliably estimated.
Pension obligationsThe Group contributes to defined contribution schemes for its current employees. The cost of this is charged to the consolidated income statement as incurred.
Notes to the financial statementsfor the year ended 31 December 2017: continued
1. Accounting policies: continued

Harworth Group plc Annual Report and Financial Statements 2017 113
STRATEGIC REPORTCORPORATE GOVERNANCE
FINANCIAL STATEMENTS
Blenkinsopp pensionFollowing the 2012 Restructuring the Group’s only defined benefit pension liability was for the Blenkinsopp Section of the Industry-Wide Mineworkers Pension Scheme. During the years to 31 December 2017 and 31 December 2016 all contributions have been paid to the pension fund by the Company. The Company recognises a net liability equal to the IAS 19 (revised) liability and an equal amount within non-current assets, due to its ability to call upon an indemnity from Harworth Estates Mines Property Limited for this liability if required.
Share-based paymentsEquity-settled share-based payments to employees of the Company and its subsidiary undertakings are measured at fair value of the equity instruments at the date of grant and are expensed on a straight line basis over the vesting period in the consolidated income statement. The fair value of the equity instruments is determined at the date of grant taking into account any market based vesting conditions attached to the award. Non-market based vesting conditions are taken into account in estimating the number of awards likely to vest. The estimate of the number of awards likely to vest is reviewed regularly and the expense charged adjusted accordingly.
Operating segmentsManagement has determined the operating segments based upon the operating reports reviewed by the Executive Board of Directors that are used to assess both performance and strategic decisions. Management has identified that the Executive Board of Directors is the Chief Operating Decision Maker in accordance with the requirements of IFRS 8 ‘Operating Segments’.The Group is organised into two operating segments: Income Generation and Capital Growth. Group costs are not a reportable segment. However, information about them is considered by the Executive Board in conjunction with the reportable segments.The Income Generation segment focuses on generating rental returns from the business space portfolio, rental returns and royalties from energy generation, environmental technologies and the agricultural portfolio, and income generating streams from recycled aggregates and secondary coal products. The Capital Growth segment focuses on delivering value by developing the underlying investment and development property portfolios, and includes planning and development activity, value engineering, proactive asset management and strategic land acquisitions.All operations are carried out in the United Kingdom.
ConsolidationSubsidiariesSubsidiaries are all entities (including structured entities) over which the Group has control. The Group controls an entity when the Group is exposed to, or has rights to, variable returns from its involvement with the entity and has the ability to affect those returns through its power over the entity. Subsidiaries are fully consolidated from the date on which control is transferred to the Group. They are deconsolidated from the date that control ceases.The Group applies the acquisition method to account for business combinations. The consideration transferred for the acquisition of a subsidiary is the fair value of the assets transferred, the liabilities incurred to the former owners of the acquiree and the equity interests issued by the Group. The consideration transferred includes the fair value of any asset or liability resulting from a contingent consideration arrangement. Identifiable assets acquired, and liabilities and contingent liabilities, assumed in a business combination are measured initially at their fair values at the acquisition date. The Group recognises any non-controlling interest in the acquiree on an acquisition-by-acquisition basis, either at fair value or at the non-controlling interest’s proportionate share of the recognised amounts of the acquiree’s identifiable net assets.Acquisition-related costs are expensed as incurred.If the business combination is achieved in stages, the acquisition date carrying value of the acquirer’s previously held equity interest in the acquiree is re-measured to fair value at the acquisition date; any gains or losses arising from such re-measurement are recognised in profit or loss.Intercompany transactions, balances and unrealised gains on transactions between Group companies are eliminated. Unrealised losses are also eliminated.
Exceptional itemsExceptional items are material non-recurring items excluded from management’s assessment of profit because by their nature they could distort the Group’s underlying quality of earnings. These are excluded to reflect performance in a consistent manner and in line with how the business is managed and measured on a day to day basis.
Share capital and reservesOrdinary shares are classified as equity. Incremental costs directly attributable to the issue of new ordinary shares or options are shown in equity as a deduction, net of tax, from the proceeds.Where shares are issued in direct consideration for acquiring shares in another company, and following which the Group holds at least 90% of the nominal share capital of that company, any premium on the shares issued as consideration is included in a merger reserve rather than share premium.
Property, plant and equipmentLand and buildings relate to group occupied properties. These properties are stated at their fair value, based on market values, less any subsequent accumulated depreciation or accumulated impairment loss. Depreciation is provided where it is considered
1. Accounting policies: continued

114 Harworth Group plc Annual Report and Financial Statements 2017
Notes to the financial statementsfor the year ended 31 December 2017: continued
significant having regard to the estimated remaining useful lives and residual values of individual properties. Surpluses on revaluations are transferred to the revaluation reserve. Deficits on revaluations are charged against the revaluation reserve to the extent that there are available surpluses relating to the same asset and are otherwise charged to the Statement of Comprehensive Income.Office equipment is stated at cost less accumulated depreciation and any recognised impairment loss. Depreciation is charged on these assets so as to write off the cost or valuation of assets over their estimated useful lives of 3 to 4 years, using the straight line method.
Derivatives and hedgingDerivative financial instruments such as interest rate swaps are entered into in order to manage interest rate risks arising from long-term debt. Such derivative instruments are initially recognised at fair value on the date on which a derivative contract is entered into and are subsequently re-measured at fair value. Derivatives are carried as assets when the fair value is positive and as liabilities when the fair value is negative.At the inception of a hedge relationship, the Group formally designates and documents the hedge relationship to which the Group wishes to apply hedge accounting, and the risk management objective and strategy for undertaking the hedge. The documentation includes identification of the hedging instrument, the hedge item or transaction, the nature of the risk being hedged and how the entity will assess the hedging instrument’s effectiveness in offsetting the exposure to changes in the hedged item’s fair value or cash flows attributable to the hedge risk. Such hedges are expected to be highly effective in achieving offsetting changes in fair value or cash flows and are assessed on an ongoing basis to determine that they actually have been highly effective throughout the financial reporting periods for which they are designated.The effective portion of the gain or loss on the hedging instrument is recognised directly in equity, while any ineffective portion is recognised immediately in profit or loss, such as when the hedged financial income or financial expense is recognised or when a forecast sale occurs. If the forecast transaction or firm commitment is no longer expected to occur, amounts previously recognised in equity are transferred to profit or loss. If the hedging instrument expires or is sold, terminated or exercised without replacement or rollover, or if its designation as a hedge is revoked, amounts previously recognised in equity remain in equity until the forecast transaction or firm commitment occurs.When a derivative is held as an economic hedge for a period beyond twelve months after the end of the reporting period, the derivative is classified as non-current (or separated into current and non-current portions) consistent with the classification of the underlying item. A derivative instrument that is a designated and effective hedging instrument is classified consistent with the classification of the underlying hedged item. The derivative instrument is separated into a current portion and non-current portion only if: 1) a reliable allocation can be made; and 2) it is applied to all designated and effective hedging instruments.
TaxCurrent taxThe charge or credit for current tax is based on the results for the year adjusted for items that are either not subject to taxation or for expenditure which cannot be deducted in computing the tax charge or credit. The tax charge or credit is calculated using taxation rates that have been enacted or substantively enacted at the Balance sheet date.
Deferred taxDeferred tax is recognised using the Balance sheet liability method on temporary differences between the carrying amounts of assets and liabilities in the financial statements and the corresponding tax basis used in the computation of taxable profit. Deferred tax is recognised in respect of all taxable temporary timing differences, with certain limited exceptions:• Deferred tax is not provided on the initial recognition of an asset or liability in a transaction that does not affect accounting
profit or taxable profit and is not a business combination; and • Deferred tax assets are only recognised if it is probable that there will be sufficient profits from which the future reversal of the
underlying timing differences can be deducted. In deciding whether future reversal is probable, the Directors review the Group’s forecasts and make an estimate of the aggregate deferred tax asset that should be recognised. This aggregate deferred tax asset is then allocated into the different categories of deferred tax.
Deferred tax is calculated at the tax rates that are expected to apply in the years in which timing differences reverse, based on tax rates and laws enacted or substantively enacted at the Balance sheet date. Deferred tax is charged or credited to the income statement, except where it applies to items credited or charged to equity, in which case the deferred tax is also dealt with in equity.The carrying value of the Group’s investment property is assumed to be realised by sale at the end of use. The capital gains tax rate applied is that which would apply on a direct sale of the property recorded in the Balance sheet regardless of whether the
1. Accounting policies: continued

Harworth Group plc Annual Report and Financial Statements 2017 115
STRATEGIC REPORTCORPORATE GOVERNANCE
FINANCIAL STATEMENTS
Group would structure the sale via the disposal of the subsidiary holding the asset, to which a different tax rate may apply. The deferred tax is then calculated based on the respective temporary differences and tax consequences arising from recovery through sale.
Changes in accounting policy and disclosures
a) New standards, amendments and interpretationsAt the date of the authorisation of these Financial Statements, the following standards, amendments and interpretations to existing standards are effective or mandatory for the first time for the accounting year ended 31 December 2017:
Effective from
Annual improvements (issued 2016) ‘Annual Improvements to IFRSs 2014–2016 Cycle’ 1 January 2017IAS 7 (amended 2016) ‘Disclosure Initiative’ 1 January 2017IAS 12 (amended 2016) ‘Recognition of Deferred Tax Assets for Unrealised Losses’ 1 January 2017
The adoption of these standards and interpretations has not had a significant impact on the Group.
(b) New standards, amendments and interpretations not yet adopted At the date of the authorisation of these Financial Statements, the following standards, amendments and interpretations were in issue but not yet effective:
Effective from
Annual improvements (issued 2017) ‘Annual Improvements to IFRSs 2015–2017 Cycle’ 1 January 2019*IAS 28 (amended 2017) ‘Long-term interests in Associates and Joint Ventures’ 1 January 2019*IAS 40 (amended 2016) ‘Transfers of Investment Property’ 1 January 2018*IFRIC 22 (amended 2016) ‘Foreign Currency Transactions and Advance Consideration’ 1 January 2018*IFRIC 23 (amended 2017) ‘Uncertainty over Income Tax Treatments’ 1 January 2019*IFRS 2 (amended 2016) ‘Classification and Measurement of Share-based Payment Transactions’ 1 January 2018*IFRS 4 (amended 2016) ‘Applying IFRS 9 Financial Instruments with IFRS 4 Insurance Contracts’ 1 January 2018IFRS 9 (issued 2014) ‘Financial Instruments’ 1 January 2018IFRS 9 (amended 2017) ‘Prepayment features with negative compensation’ 1 January 2019*IFRS 15 (issued 2014) ‘Revenue from Contracts with Customers’ 1 January 2018IFRS 16 (issued 2016) ‘Leases’ 1 January 2019*IFRS 17 (issued 2017) ‘Insurance contracts’ 1 January 2021*
*Not yet endorsed by the EU.
None of these is expected to have a significant effect on the financial statements of the Group, except the following, set out below:• IFRS 9, ‘Financial instruments’ addresses the classification, measurement and recognition of financial assets and financial
liabilities. It replaces the guidance in IAS 39 that relates to the classification and measurement of financial instruments. IFRS 9 retains but simplifies the mixed measurement model and establishes three primary measurement categories for financial assets: amortised cost, fair value through SOCI and fair value through profit and loss. The basis of classification depends on the entity’s business model and the contractual cash flow characteristics of the financial asset. Investments in equity instruments are required to be measured at fair value through profit or loss with the irrevocable option at inception to present changes in fair value in SOCI. There is now a new expected credit losses model that replaces the incurred loss impairment model used in IAS 39. For financial liabilities there were no changes to classification and measurement except for the recognition of changes in own credit risk in other comprehensive income, for liabilities designated at fair value through profit or loss. IFRS 9 relaxes the requirements for hedge effectiveness by replacing the bright line hedge effectiveness tests. It requires an economic relationship between the hedged item and hedging instrument and for the ‘hedged ratio’ to be the same as the one management actually uses for risk management purposes. Contemporaneous documentation is still required but is different from that currently prepared under IAS 39. The standard is effective for accounting periods beginning on or after 1 January 2018. Early adoption is permitted, subject to EU endorsement. The impact of IFRS 9 has been assessed on the financial instruments of the Group. At present, based on these assessments, management do not believe that any significant adjustments are required.
• IFRS 15, ‘Revenue from contracts with customers’ deals with revenue recognition and establishes principles for reporting useful information to users of financial statements about the nature, amount, timing and uncertainty of revenue and cash flows arising from an entity’s contracts with customers. Revenue is recognised when a customer obtains control of a good or service and thus has the ability to direct the use and obtain the benefits from the good or service. The standard replaces IAS 18 ‘Revenue’ and IAS 11 ‘Construction contracts’ and related interpretations. The standard is effective for annual periods beginning on or after 1 January 2018. The Group has performed a detailed assessment of the impact of IFRS 15 on existing revenue streams and policies. This review has highlighted that revenues relating to the sales of development properties, particularly where revenue involves a deferred element or conditions subsequent exist, are specifically affected by the standard. The Group expects the impact of implementing this standard on revenue to amount to a decrease of £2.1m for 2017.
1. Accounting policies: continued

116 Harworth Group plc Annual Report and Financial Statements 2017
Notes to the financial statementsfor the year ended 31 December 2017: continued
• IFRS 16, ‘Leases’ addresses the definition of a lease, recognition and measurement of leases and establishes principles for reporting useful information to users of financial statements about the leasing activities of both lessees and lessors. A key change arising from IFRS 16 is that most operating leases will be accounted for on Balance sheet for lessees. The standard replaces IAS 17 ‘Leases’, and related interpretations. The standard is effective for annual periods beginning on or after 1 January 2019 and earlier application is permitted, subject to EU endorsement and the entity adopting IFRS 15 ‘Revenue from contracts with customers’ at the same time. The full impact of IFRS 16 continues to be assessed, however, management does not believe it will have a significant impact.
Critical accounting estimates and judgementsThe preparation of the financial statements requires management to make judgements, estimates and assumptions that affect the application of accounting policies and the reported amounts of assets and liabilities, income and expense. Actual results may differ from these estimates.In preparing these financial statements, the significant judgements made by management in applying the Group’s accounting policies and the key sources of estimation uncertainty are as follows:
Estimation of fair value of investment propertyThe fair value of investment property reflects, amongst other things, rental income from our current leases, assumptions about rental income from future leases and the possible outcome of planning applications, in the light of current market conditions. The valuation has been arrived at primarily after consideration of market evidence for similar property, although in the case of those properties where fair value is based on their ultimate redevelopment potential, development appraisals have been undertaken to estimate the residual value of the landholding after due regard to the cost of, and revenue from, the development of the property.The Group has also estimated the extent to which existing mining tenants on investment property owned by the Group would perform their obligations to remediate land at the conclusion of mining activity and therefore the impact of any restoration obligations which may revert to the Group. The potential shortfall has been estimated at £3.2m (2016: £6.0m) and has been treated as a reduction in the valuation of the properties which these former tenants occupied. The values reported are based on significant assumptions and a change in fair values could have a material impact on the Group`s results. This is due to the sensitivity of fair value to the assumptions made as regards to variances in development costs compared to management`s own estimates. Investment properties are disclosed in note 15.
Categorisation of the property portfolioDuring the year £229.1m of property was re-categorised from investment to development property. This re-categorisation was triggered by the evolution of Harworth’s business model, including the March 2017 capital raise, as well as the consideration of site and market opportunities.
Revenue Overdue rents and royalties from the mining businesses amounting to £2.2m were included in revenue for 2016. Prior to this management concluded that there was a less than remote possibility of recoverability of this income and therefore was not recognised. A clearer outcome of the winding up of the mining businesses in 2016 gave greater visibility of the recoverability of this revenue and therefore revenue was recognised in 2016. This is a non recurring event and there is no such income remaining in 2017.
TaxationThe recognition of deferred tax assets has been reviewed and re-assessed during the year. This has resulted in the recognition of deferred tax assets of £19.1m (2016: £8.4m) based upon the certainty of recoverability. Of this £5.9m has been recognised due to the execution of a contract which resulted in increased certainty that the losses would not be lost and £13.2m is due to the crystallisation of chargeable gains and losses as a result of a number of investment property disposals and the re-categorisation of properties from investment to development properties. These gains have been offset against tax losses that were previously not recognised from a deferred tax perspective.
1. Accounting policies: continued

Harworth Group plc Annual Report and Financial Statements 2017 117
STRATEGIC REPORTCORPORATE GOVERNANCE
FINANCIAL STATEMENTS
2. Segment Information31 December 2017
Capital Growth
Group Note
Sale ofDevelopment
Properties £’000
Other Property
Activities £’000
IncomeGeneration
£’000
Unallocatedcosts
£’000Total
£’000
Revenue 29,765 5,671 18,237 – 53,673Cost of sales (27,893) (4,396) (5,389) – (37,678)
Gross profit(1) 1,872 1,275 12,848 – 15,995Administrative expenses – (1,927) (1,752) (8,341) (12,020) Other gains(2) 5 – 26,924 8,734 – 35,658Other operating income 5 – – 17 81 98
Operating profit/(loss) before exceptional items 1,872 26,272 19,847 (8,260) 39,731Net exceptional items 4 – – – 331 331
Operating profit/(loss) 1,872 26,272 19,847 (7,929) 40,062Share of profit of joint ventures 16 – 26 4,013 – 4,039Finance income 7 – – – 16 16Finance costs 7 – – – (2,277) (2,277)
Profit/(loss) before tax 1,872 26,298 23,860 (10,190) 41,840
Other information(1) Gross profit is analysed as follows: Gross profit excluding sales of development properties – 1,275 12,848 – 14,123 Gross profit on sale of development properties 7,690 – – – 7,690 Net realisable value provision on development properties (5,818) – – – (5,818)
1,872 1,275 12,848 – 15,995
(2) Other gains are analysed as follows: Increase in fair value of investment properties – 26,139 5,994 – 32,133 (Decrease) /increase in fair value of assets classified as held for sale – (113) 30 – (83) Increase in fair value of overages – 586 – – 586 Profit on disposal of investment properties – 216 2,703 – 2,919 Profit on disposal of assets classified as held for sale – 96 7 – 103
– 26,924 8,734 – 35,658

118 Harworth Group plc Annual Report and Financial Statements 2017
Notes to the financial statementsfor the year ended 31 December 2017: continued
31 December 2017 continuedSegmental assets
Note
CapitalGrowth
£’000
IncomeGeneration
£’000Unallocated
£’000Total
£’000
Property, plant and equipment 13 – – 802 802Other receivables 14 2,666 – – 2,666Investment properties 15 43,132 173,428 – 216,560Investments in joint ventures 16 1,042 17,796 – 18,838Inventories 17 211,535 83 – 211,618Non-current trade receivables 18 5,250 – – 5,250Current trade and other receivables 18 16,516 6,762 1,887 25,165Assets classified as held for sale 19 2,782 4,906 – 7,688
282,923 202,975 2,689 488,587
Unallocated assets: Cash 20 – – 8,371 8,371
Total assets 282,923 202,975 11,060 496,958
Financial liabilities are not allocated to the reporting segments as they are managed and measured on a Group basis.
31 December 2016
Group Note
CapitalGrowth
£’000
IncomeGeneration
£’000
Unallocatedcosts
£’000Total
£’000
Revenue* 16,307 17,386 – 33,693Cost of sales (15,967) (4,938) – (20,905)
Gross profit 340 12,448 – 12,788Administrative expenses (1,765) (1,416) (7,276) (10,457) Other gains(1) 5 31,653 11,374 – 43,027Other operating expenses 5 – (117) (87) (204)
Operating profit/(loss) before exceptional items 30,228 22,289 (7,363) 45,154Net exceptional items 4 – (682) 689 7
Operating profit/(loss) 30,228 21,607 (6,674) 45,161Share of profit of joint ventures 16 – 647 – 647Finance income 7 – – 247 247Finance costs 7 – – (2,588) (2,588)
Profit/(loss) before tax 30,228 22,254 (9,015) 43,467
* No activity relating to sale of development properties occurred in the year ended 31 December 2016.
Other information(1) Other gains are analysed as follows: Increase in fair value of investment properties 23,433 10,280 – 33,713 Decrease in fair value of assets classified as held for sale – (224) – (224) Increase in fair value of overages 747 – – 747 Profit on disposal of investment properties 7,473 1,693 – 9,166 Loss on disposal of assets classified as held for sale – (375) – (375)
31,653 11,374 – 43,027
2. Segment information: continued

Harworth Group plc Annual Report and Financial Statements 2017 119
STRATEGIC REPORTCORPORATE GOVERNANCE
FINANCIAL STATEMENTS
31 December 2016 continuedSegmental assets
Note
CapitalGrowth
£’000
IncomeGeneration
£’000Unallocated
£’000Total
£’000
Property, plant and equipment 13 – – 789 789Other receivables 14 1,397 – – 1,397Investment properties 15 232,886 146,304 – 379,190Investments in joint ventures 16 868 9,681 – 10,549Inventories 17 454 279 – 733Current trade and other receivables 18 10,521 1,673 12,250 24,444Assets classified as held for sale 19 6,152 2,198 – 8,350
252,278 160,135 13,039 425,452
Unallocated assets: Cash 20 – – 13,007 13,007
Total assets 252,278 160,135 26,046 438,459
Financial liabilities are not allocated to the reporting segments as they are managed and measured on a Group basis.
3. Operating profit
Note
Year ended 31 December
2017 £’000
Year ended 31 December
2016 £’000
Operating profit before tax is stated after charging:Net realisable value provision on development properties 17 5,818 –Staff costs 6 7,849 6,363Depreciation of property, plant and equipment 13 8 2
4. Exceptional itemsYear ended
31 December 2017
£’000
Year ended 31 December
2016 £’000
Exceptional income:Settlements from the administration of legacy companies 414 689
Total exceptional income 414 689
Exceptional expense:Sundry costs relating to legacy activities (83) –Under recovery relating to the cessation of coal fines activities at Rugeley and stock provision – (682)
Total exceptional expense (83) (682)
Net exceptional items 331 7
2. Segment information: continued
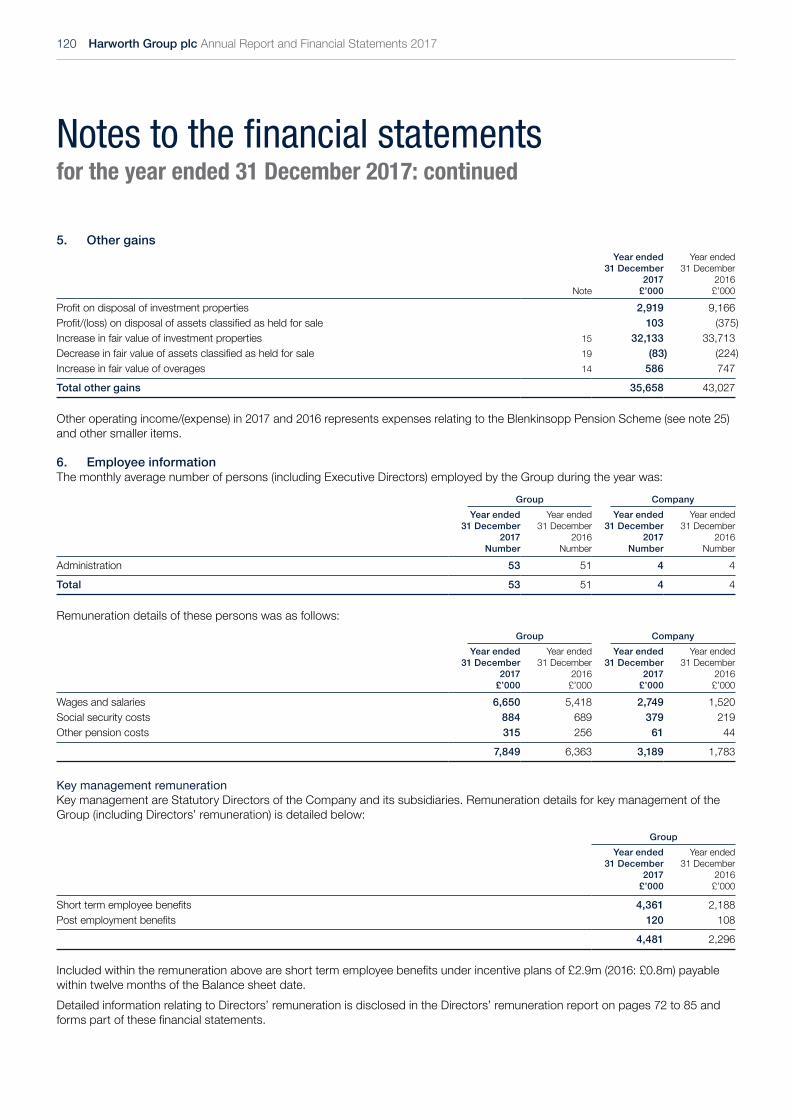
120 Harworth Group plc Annual Report and Financial Statements 2017
Notes to the financial statementsfor the year ended 31 December 2017: continued
5. Other gains
Note
Year ended 31 December
2017 £’000
Year ended 31 December
2016 £’000
Profit on disposal of investment properties 2,919 9,166Profit/(loss) on disposal of assets classified as held for sale 103 (375) Increase in fair value of investment properties 15 32,133 33,713Decrease in fair value of assets classified as held for sale 19 (83) (224) Increase in fair value of overages 14 586 747
Total other gains 35,658 43,027
Other operating income/(expense) in 2017 and 2016 represents expenses relating to the Blenkinsopp Pension Scheme (see note 25) and other smaller items.
6. Employee informationThe monthly average number of persons (including Executive Directors) employed by the Group during the year was:
Group Company
Year ended 31 December
2017 Number
Year ended 31 December
2016 Number
Year ended 31 December
2017 Number
Year ended 31 December
2016 Number
Administration 53 51 4 4
Total 53 51 4 4
Remuneration details of these persons was as follows:Group Company
Year ended 31 December
2017 £’000
Year ended 31 December
2016 £’000
Year ended 31 December
2017 £’000
Year ended 31 December
2016 £’000
Wages and salaries 6,650 5,418 2,749 1,520Social security costs 884 689 379 219Other pension costs 315 256 61 44
7,849 6,363 3,189 1,783
Key management remunerationKey management are Statutory Directors of the Company and its subsidiaries. Remuneration details for key management of the Group (including Directors’ remuneration) is detailed below:
Group
Year ended 31 December
2017 £’000
Year ended 31 December
2016 £’000
Short term employee benefits 4,361 2,188Post employment benefits 120 108
4,481 2,296
Included within the remuneration above are short term employee benefits under incentive plans of £2.9m (2016: £0.8m) payable within twelve months of the Balance sheet date.Detailed information relating to Directors’ remuneration is disclosed in the Directors’ remuneration report on pages 72 to 85 and forms part of these financial statements.
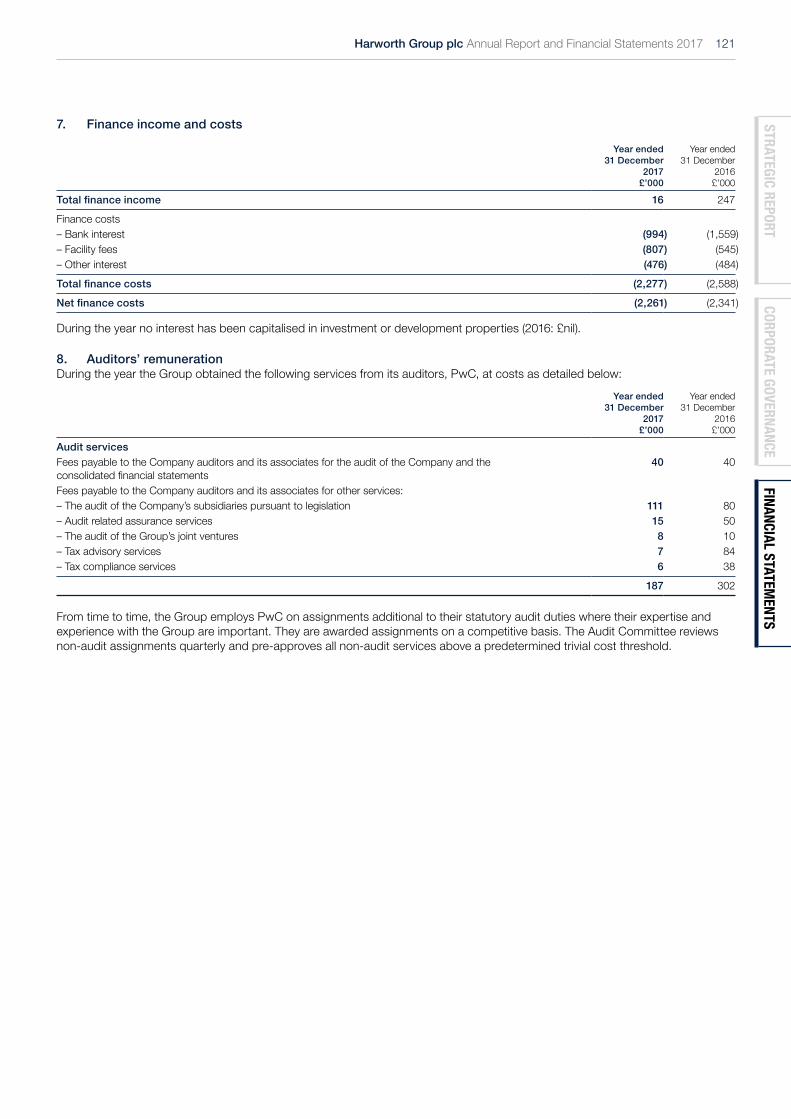
Harworth Group plc Annual Report and Financial Statements 2017 121
STRATEGIC REPORTCORPORATE GOVERNANCE
FINANCIAL STATEMENTS
7. Finance income and costs
Year ended 31 December
2017 £’000
Year ended 31 December
2016 £’000
Total finance income 16 247
Finance costs– Bank interest (994) (1,559) – Facility fees (807) (545) – Other interest (476) (484)
Total finance costs (2,277) (2,588)
Net finance costs (2,261) (2,341)
During the year no interest has been capitalised in investment or development properties (2016: £nil) .
8. Auditors’ remunerationDuring the year the Group obtained the following services from its auditors, PwC, at costs as detailed below:
Year ended 31 December
2017 £’000
Year ended 31 December
2016 £’000
Audit servicesFees payable to the Company auditors and its associates for the audit of the Company and the consolidated financial statements
40 40
Fees payable to the Company auditors and its associates for other services:– The audit of the Company’s subsidiaries pursuant to legislation 111 80– Audit related assurance services 15 50– The audit of the Group’s joint ventures 8 10– Tax advisory services 7 84– Tax compliance services 6 38
187 302
From time to time, the Group employs PwC on assignments additional to their statutory audit duties where their expertise and experience with the Group are important. They are awarded assignments on a competitive basis. The Audit Committee reviews non-audit assignments quarterly and pre-approves all non-audit services above a predetermined trivial cost threshold.

122 Harworth Group plc Annual Report and Financial Statements 2017
Notes to the financial statementsfor the year ended 31 December 2017: continued
9. Tax credit/(charge) Analysis of tax credit /(charge) in the year
Year ended 31 December
2017 £’000
Year ended 31 December
2016 £’000
Current taxCurrent year (1,874) –Adjustment in respect of prior periods 336 –
Total current tax charge (1,538) –
Deferred taxCurrent year 15,036 (2,510) Adjustment in respect of prior periods (3,898) (1,652) Effect of changes in tax rates (1,757) 2,042Re-assessment of recognition of recoverability of deferred tax assets – (1,446)
Total deferred tax credit /(charge) 9,381 (3,566)
Tax credit /(charge) 7,843 (3,566)
Other comprehensive income items
Year ended 31 December
2017 £’000
Year ended 31 December
2016 £’000
Deferred tax – current year (51) 14Deferred tax – prior year – 80
Total (51) 94
The tax for the year is lower than the standard rate of corporation tax in the UK of 19.25% (2016: 20.00%) . The differences are explained below:
Year ended 31 December
2017 £’000
Year ended 31 December
2016 £’000
Profit before tax 41,840 43,467
Profit before tax multiplied by rate of corporation tax in the UK of 19.25% (2016: 20.00%) (8,054) (8,693)
Effects of:Adjustment in respect of prior periods – deferred taxation (3,898) (1,652) Adjustment in respect of prior periods – current taxation 336 –Non-taxable income 841 129Expenses not deducted for tax purposes (1,395) (390) Revaluation gains – 4,683Changes in tax rates (1,757) 2,042Capital gains tax transferred out – 1,764Re-assessment of recognition of recoverability of deferred tax assets 6,600 (1,446) Utilisation of unrecognised deferred tax 15,170 –Deferred tax not recognised – (3)
Total tax credit /(charge) 7,843 (3,566)
The movement within the tax reconciliation of £15.2m (2016: £nil) relating to the utilisation of unrecognised deferred tax is a result of the crystallisation of a number of gains in respect of investment property due to the disposal or transfer of these properties to development property (held in inventory) . The gains on which deferred tax liabilities have been recognised and were crystallised in the year have been offset against previously unrecognised tax losses. The tax losses remaining at the end of the year have largely been recognised as a result of the execution of a contract that related to increased certainty that the losses would not be lost. As such these losses have been recognised in the year to reflect an increased deferred tax asset carried forward. This gives rise to the £6.6m disclosed in the tax reconciliation.As part of the filing of the prior year tax computations and returns, tax attributes were utilised to shelter chargeable gains arising on the disposal of properties and the transfer of properties held for sale. This gave rise to a deferred tax charge of £3.9m compared to the original tax provision prepared for inclusion within the prior year financial statements.

Harworth Group plc Annual Report and Financial Statements 2017 123
STRATEGIC REPORTCORPORATE GOVERNANCE
FINANCIAL STATEMENTS
Deferred tax The following is the analysis of deferred tax assets/(liabilities) presented in the consolidated Balance sheet:
Year ended 31 December
2017 £’000
Year ended 31 December
2016 £’000
Deferred tax liabilities (13,067) (23,352) Deferred tax assets 7,546 8,501
(5,521) (14,851)
The movement on the deferred income tax account is as follows:
Investment properties
£’000
Tax losses £’000
Other temporary differences
£’000Total
£’000 n
At 1 January 2016 (11,379) – – (11,379) Recognised in consolidated income statement (11,973) 8,427 (20) (3,566) Recognised in consolidated statement of comprehensive income – – 94 94 n
At 31 December 2016 and 1 January 2017 (23,352) 8,427 74 (14,851) Recognised in consolidated income statement 10,353 (2,522) 1,550 9,381Recognised in consolidated statement of comprehensive income (68) – 17 (51) n
At 31 December 2017 (13,067) 5,905 1,641 (5,521)
There are UK corporation tax losses carried forward of £15.9m (2016: £8.4m); these may be carried forward indefinitely as there is no time limit in respect of using these deferred tax assets.Deferred tax is calculated in full on temporary differences under the liability method using a tax rate of 17% (2016: 17%) . A reduction in the UK corporation tax rate from 20% to 19% (effective from 1 April 2017) , and a further reduction to 17% (effective from 1 April 2020) were enacted as part of the Finance Act 2015. The deferred tax liabilities are shown at 17% (2016: 18%) being the rate expected to apply to the reversal of the liability.Deferred tax assets and liabilities are offset when there is a legally enforced right to offset current tax assets against current tax liabilities and when the deferred taxes relate to the same fiscal authority. Deferred tax assets of £6.1m at 31 December 2017 have not been recognised owing to the uncertainty as to their recoverability. Deferred tax assets of £19.7m were not recognised at 31 December 2016.The Company has recognised a deferred tax asset in 2017 of £0.3m (2016: £3.1m) and has a potential deferred tax asset of £nil (2016: £nil) in respect of unused tax losses.
10. (Loss) /profit for the financial year for the parent entityAs permitted by section 408 of the Companies Act 2006, the Company’s income statement and statement of comprehensive income have not been included separately in these financial statements. The loss for the financial year was £5.8m (2016: profit £1.3m) and the total comprehensive expense for the financial year was £5.8m (2016: income £1.1m) .
11. Dividends2017 2016
Per share pence
Total £’000
Per share pence
Total £’000
Full year dividend for financial year ended 31 December 2015 – – 0.51 1,490Interim dividend for the six months ended 30 June 2016 – – 0.23 673Full year dividend for financial year ended 31 December 2016 0.52 1,680 – –Interim dividend for the six months ended 30 June 2017 0.25 812 – –
2,492 2,163
The proposed final dividend for the year ended 31 December 2017 of 0.58 pence per share makes a total dividend for the year of 0.83 pence (2016: 0.75 pence) .The proposed final dividend is subject to approval by shareholders at the Annual General Meeting and has not been included as a liability in these financial statements.
9. Tax credit/(charge): continued

124 Harworth Group plc Annual Report and Financial Statements 2017
Notes to the financial statementsfor the year ended 31 December 2017: continued
12. Earnings per shareEarnings per share has been calculated by dividing the profit attributable to ordinary shareholders by the weighted average number of shares in issue and ranking for dividend during the year. The weighted average number of shares for 31 December 2017 includes the adjustments necessary to reflect the new shares issued on 17 March 2017 (see note 26) .
Year ended 31 December
2017 £’000
Year ended 31 December
2016 £’000
Profit from continuing operations attributable to owners of the parent 49,683 39,901
Weighted average number of shares used for basic and diluted earnings per share calculation 315,296,192 292,269,786*
Basic and diluted profit per share (pence) 15.8 13.7*
* The 2016 earnings per share has been restated to reflect the impact of the May 2016 1 for 10 share consolidation following discussions with the Financial Reporting Council and their review of the 2016 Financial Statements.
13. Property, plant and equipment
Group Note
Land and Buildings
£’000
Office equipment
£’000Total
£’000
Net book value at 1 January 2016 – – –Additions at cost – 25 25Transfer from investment properties 15 783 – 783Decrease in fair value (17) – (17) Depreciation charge – (2) (2)
Net book value at 31 December 2016 and 1 January 2017 766 23 789Additions at cost 9 – 9Increase in fair value 12 – 12Depreciation charge – (8) (8)
Net book value at 31 December 2017 787 15 802
At 31 December 2017
Cost or fair value 787 25 812Accumulated depreciation – (10) (10)
Net book value 787 15 802
At 31 December 2016
Cost or fair value 766 25 791Accumulated depreciation – (2) (2)
Net book value 766 23 789
At 31 December 2017, the Group had entered into contractual commitments for the acquisitions of property, plant and equipment amounting to £nil (2016: £nil) .Information about the valuation of land and buildings is provided in note 15.

Harworth Group plc Annual Report and Financial Statements 2017 125
STRATEGIC REPORTCORPORATE GOVERNANCE
FINANCIAL STATEMENTS
14. Other receivablesThe benefit of overages is recorded as a non-current receivable as follows:
Note
Year ended 31 December
2017 £’000
Year ended 31 December
2016 £’000
At 1 January 1,397 650Additions 17 –Re-categorisation from investment properties 15 666 –Fair value gains 586 747
At 31 December 2,666 1,397
Overages were valued at 31 December 2017 and 2016 in accordance with RICS Red Book Valuation by BNP Paribas Real Estate. The same valuation process is used to value overages as described in note 15.
15. Investment propertiesInvestment property at 31 December 2017 and 31 December 2016 has been measured at fair value. The Group holds five categories of investment property being agricultural land, natural resources, business space, major developments and strategic land in the UK, which sit within the operating segments of Capital Growth and Income Generation.
Income Generation Capital Growth
Agricultural land
£’000
Natural resources
£’000
Business space £’000
Major developments
£’000
Strategic land
£’000Total
£’000
At 1 January 2016 16,763 16,954 90,896 157,589 52,415 334,617Transfers 4,617 5,682 (25,424) 64,763 (49,638) –Direct acquisitions 1,390 – 21,134 – – 22,524Subsequent expenditure 286 1,663 5,998 11,223 3,484 22,654(Decrease) /increase in fair value (894) 5,203 5,971 12,103 11,330 33,713Transfer to assets classified as held for sale (1,680) – (477) (6,153) – (8,310) Transfer to property, plant and equipment – – (783) – – (783) Disposals (376) (13) (606) (23,875) (355) (25,225)
At 31 December 2016 and 1 January 2017 20,106 29,489 96,709 215,650 17,236 379,190
Transfers between divisions – 277 11,686 4,137 (16,100) –Direct acquisitions – – 5,536 15,281 5,198 26,015Subsequent expenditure 1,684 1,154 8,960 13,100 4,261 29,159Increase in fair value 3,660 1,438 896 13,072 13,067 32,133Transfer to assets classified as held for sale (1,160) (276) (3,500) (8,492) (350) (13,778) Re-categorisation as other receivables – – – (666) – (666) Re-categorisation as development property in inventories
– – – (229,118) – (229,118)
Disposals (1,963) (782) (486) (2,964) (180) (6,375)
At 31 December 2017 22,327 31,300 119,801 20,000 23,132 216,560
Included within investment properties (agricultural land) is a provision of £3.2m (2016: £6.0m) relating to the restoration liability on sites formerly rented to mining tenants. This provision is treated as a reduction of the individual property valuations.During the year £229.1m (2016: £nil) of investment property was re-categorised to development properties. Properties that have obtained planning permission and are being taken forward for development are now held in inventory. Following further evolution of Harworth’s business model during 2017, we have refined our thinking in the light of site and market opportunities, and concluded that it is appropriate, on the whole, to re-categorise all properties which have received planning permission as development properties. Until sites receive planning permission, our view is that the land is held for a currently undetermined future use and should thus be held as investment property.
Valuation processThe properties were valued in accordance with the Royal Institution of Chartered Surveyors (RICS) Valuation – Professional Standards (the ‘Red Book’) by BNP Paribas Real Estate and Savills. Both are independent firms acting in the capacity of external valuers with relevant experience of valuations of this nature. The valuations are on the basis of Market Value as defined by the Red Book, which RICS considers meets the criteria for assessing Fair Value under International Financial Reporting Standards. The valuations are based on what is determined to be the highest and best use. When considering the highest and best use a valuer will consider, on a property by property basis, its actual and potential uses which are physically, legally and financially viable. Where the highest and best use differs from the existing use, the valuer will consider the cost and the likelihood of achieving and implementing this change in arriving at its valuation. Most of the Group’s properties have been valued on the basis of their development potential which differs from their existing use.
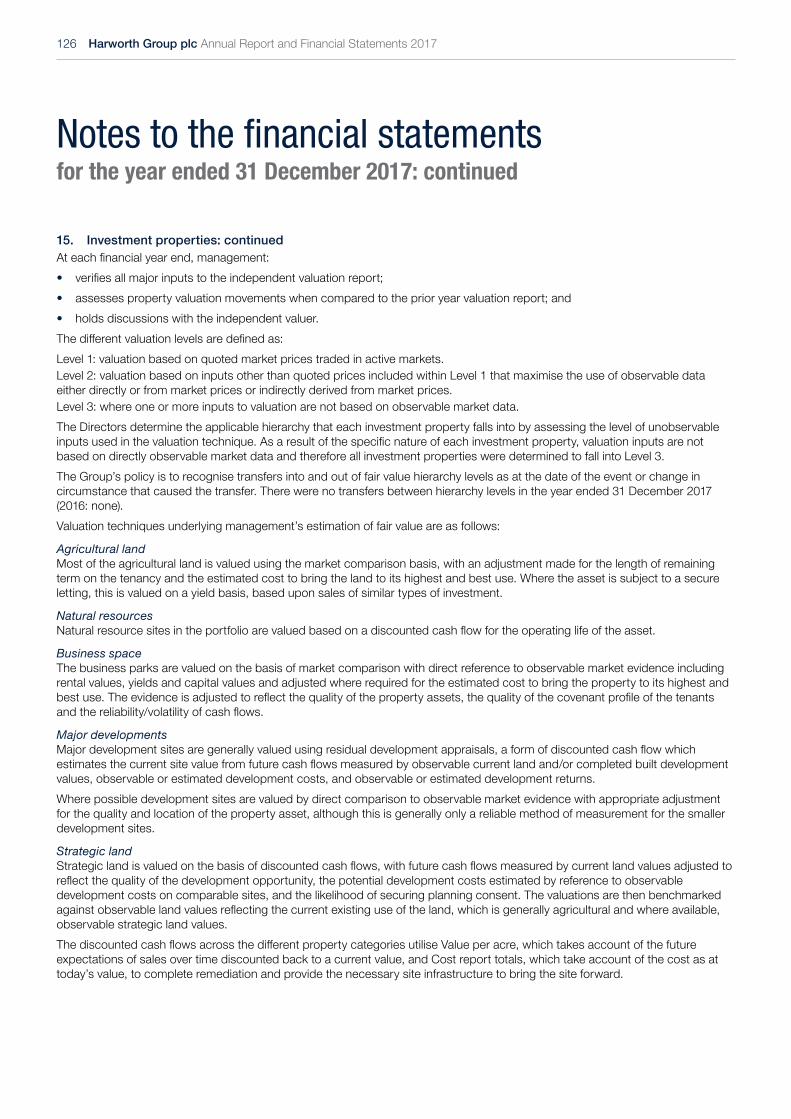
126 Harworth Group plc Annual Report and Financial Statements 2017
Notes to the financial statementsfor the year ended 31 December 2017: continued
At each financial year end, management:• verifies all major inputs to the independent valuation report;• assesses property valuation movements when compared to the prior year valuation report; and• holds discussions with the independent valuer.The different valuation levels are defined as: Level 1: valuation based on quoted market prices traded in active markets. Level 2: valuation based on inputs other than quoted prices included within Level 1 that maximise the use of observable data either directly or from market prices or indirectly derived from market prices. Level 3: where one or more inputs to valuation are not based on observable market data. The Directors determine the applicable hierarchy that each investment property falls into by assessing the level of unobservable inputs used in the valuation technique. As a result of the specific nature of each investment property, valuation inputs are not based on directly observable market data and therefore all investment properties were determined to fall into Level 3.The Group’s policy is to recognise transfers into and out of fair value hierarchy levels as at the date of the event or change in circumstance that caused the transfer. There were no transfers between hierarchy levels in the year ended 31 December 2017 (2016: none) .Valuation techniques underlying management’s estimation of fair value are as follows:
Agricultural landMost of the agricultural land is valued using the market comparison basis, with an adjustment made for the length of remaining term on the tenancy and the estimated cost to bring the land to its highest and best use. Where the asset is subject to a secure letting, this is valued on a yield basis, based upon sales of similar types of investment.
Natural resourcesNatural resource sites in the portfolio are valued based on a discounted cash flow for the operating life of the asset.
Business spaceThe business parks are valued on the basis of market comparison with direct reference to observable market evidence including rental values, yields and capital values and adjusted where required for the estimated cost to bring the property to its highest and best use. The evidence is adjusted to reflect the quality of the property assets, the quality of the covenant profile of the tenants and the reliability/volatility of cash flows.
Major developmentsMajor development sites are generally valued using residual development appraisals, a form of discounted cash flow which estimates the current site value from future cash flows measured by observable current land and/or completed built development values, observable or estimated development costs, and observable or estimated development returns.Where possible development sites are valued by direct comparison to observable market evidence with appropriate adjustment for the quality and location of the property asset, although this is generally only a reliable method of measurement for the smaller development sites.
Strategic landStrategic land is valued on the basis of discounted cash flows, with future cash flows measured by current land values adjusted to reflect the quality of the development opportunity, the potential development costs estimated by reference to observable development costs on comparable sites, and the likelihood of securing planning consent. The valuations are then benchmarked against observable land values reflecting the current existing use of the land, which is generally agricultural and where available, observable strategic land values.The discounted cash flows across the different property categories utilise Value per acre, which takes account of the future expectations of sales over time discounted back to a current value, and Cost report totals, which take account of the cost as at today’s value, to complete remediation and provide the necessary site infrastructure to bring the site forward.
15. Investment properties: continued

Harworth Group plc Annual Report and Financial Statements 2017 127
STRATEGIC REPORTCORPORATE GOVERNANCE
FINANCIAL STATEMENTS
At 31 December 2017Agricultural
landNatural
resourcesBusiness
spaceMajor
developmentsStrategic
land
Reversionary rental yield % weighted average – – 9.66 – –low – – 4.86 – –high – – 16.86 – –
Land value per acre £’000 weighted average 4 6 95 196 10low 1 1 26 196 1high 32 115 2,360 196 449
Cost report totals* £’000 – – 11,948 8,478 3,150
At 31 December 2016Agricultural
landNatural
resourcesBusiness
spaceMajor
developmentsStrategic
land
Reversionary rental yield % weighted average – – 9.65 – –low – – 5.12 – –high – – 15.03 – –
Land value per acre £’000 weighted average 4 5 67 73 24low 1 1 2 22 1high 11 115 2,225 333 337
Cost report totals* £’000 – 730 21,650 127,472 54,350
* Cost report totals represent the estimated cost to bring investment properties to their highest and best use. There is £184.3m (2016: £nil) of cost report totals that now relate to development properties (shown in inventories at deemed cost) and therefore are not disclosed in this note.
The table below shows some possible sensitivities to the key valuation metrics and the resultant changes to the valuations.
At 31 December 2017Valuation metric +/– change +/– effect on valuation
Agricultural land
Natural resources
Business space
Major developments
Strategic land
Value per acre 5% 1,116 1,565 5,990 1,000 1,156Rental 5% – – 4,872 – –Yield (e.g. 11% to 10%) 1% – – 12,564 – –Cost report totals 5% – – 597 424 158
At 31 December 2016Valuation metric +/– change +/– effect on valuation
Agricultural land
Natural resources
Business space
Major developments
Strategic land
Value per acre 5% 1,275 1,498 4,835 10,783 868Rental 5% – – 3,726 – –Yield (e.g. 11% to 10%) 1% – – 9,272 – –Cost report totals 5% – 37 1,083 6,374 2,718
The property rental income earned by the Group from its occupied investment property, all of which is leased out under operating leases amounted to £9.1m (2016: £8.4m) . Direct operating expenses arising on investment property generating rental income in the year amounted to £3.5m (2016: £3.9m) . Direct operating expenses arising on the investment property which did not generate rental income during the year amounted to £0.1m (2016: £0.1m) .The bank and other loans are secured by way of fixed equitable charges over investment properties.
15. Investment properties: continued

128 Harworth Group plc Annual Report and Financial Statements 2017
Notes to the financial statementsfor the year ended 31 December 2017: continued
16. InvestmentsInvestment in subsidiaries
Company
Year ended 31 December
2017 £’000
Year ended 31 December
2016 £’000
Cost:At 1 January 207,896 207,896Additions in the year – –Disposals in the year – –
At 31 December 207,896 207,896
Provision for impairment:At 1 January – –Additions in the year – –Disposals in the year – –
At 31 December – –
Net book amount:At 31 December 207,896 207,896
Investments in subsidiaries are stated at cost less provision for impairment. As permitted by section 616 of the Companies Act 2006, where the relief afforded under section 612 of the Companies Act 2006 applies, cost is the aggregate of the nominal value of the relevant number of the Company’s shares and the fair value of any other consideration given to acquire the share capital of the subsidiary undertakings.
Investment in joint ventures £’000
At 1 January 2016 768Acquisitions 9,134Share of profit of joint ventures 647
At 31 December 2016 and 1 January 2017 10,549
Investment in joint ventures 4,250Share of profit of joint ventures 4,039
At 31 December 2017 18,838
On 26 April 2017, the Group entered into a joint venture agreement with Lancashire County Pension Fund to establish Multiply Logistics North Holdings Limited to develop part of the site at Logistics North, near Bolton.On 16 December 2016, the Group entered into a joint venture agreement with Dransfield Properties Limited to acquire a 50% share of Waverley Square Limited. On 14 March 2016 the Group purchased a 50% share of The Aire Valley Land LLP from Keyland Developments Limited for a consideration of £8.5m plus costs of £0.5m. The Aire Valley Land LLP is a joint venture company. It controls 165 acres of land in Leeds that abuts an existing landholding of the Group on the former Skelton Grange power station site. The Group holds 50% of the ordinary issued shares of Bates Regeneration Limited, a joint venture with Banks Property Limited for the development of an investment property at Blyth, Northumberland.The Group received £nil (2016: £nil) of dividends from these joint ventures during the year.

Harworth Group plc Annual Report and Financial Statements 2017 129
STRATEGIC REPORTCORPORATE GOVERNANCE
FINANCIAL STATEMENTS
Aggregate information of the Group’s share of assets, liabilities and results of joint ventures, that are not individually material are:
As at 31 December
2017 £’000
As at 31 December
2016 £’000
Investment property 18,740 11,000Current assets 2,596 2,314
Total assets 21,336 13,314Current liabilities (2,498) (2,765)
Net investment 18,838 10,549
Year ended 31 December
2017 £’000
Year ended 31 December
2016 £’000
Revenue – –
Share of profits after tax 4,039 647
The risks associated with these investments are as follows:• Decline in the availability, and/or an increase in the cost, of credit for residential and commercial buyers; and• Decline in market conditions and values.
16. Investments: continued

130 Harworth Group plc Annual Report and Financial Statements 2017
Notes to the financial statementsfor the year ended 31 December 2017: continued
Investment in subsidiariesParticulars of the Group undertakings (including joint ventures) at 31 December 2017 are as follows:
Company name Activity
Descriptionof shares
held
Proportion ofnominal value
of issued sharecapital held by
the Company%
Coalfield Estates Limited (1) Non-trading Ordinary 100Harworth Guarantee Company Limited (1) Non-trading Ordinary 100Harworth Trustees Limited (1) Dormant Ordinary 100Harworth Secretariat Services Limited (1) Non-trading Ordinary 100Harworth Estates Property Group Limited (1) Trading Ordinary 100Harworth Estates Group Limited (1) Non-trading Ordinary 100Harworth No. 3 Limited (1) Non-trading Ordinary 100Harworth Services Limited (1) Non-trading Ordinary 100Harworth Estates Limited (1) Trading Ordinary 100Bates Regeneration Limited (2) Trading Ordinary 50EOS Inc Limited (1) Trading Ordinary 100Harworth Estates (Agricultural) Limited (1) Trading Ordinary 100Harworth Estates (Waverley Prince) Limited (1) Trading Ordinary 100Waverley Community Management Company Limited (1) Trading Ordinary 100Harworth Estates Curtilage Limited (1) Trading Ordinary 100Harworth Estates Investments Limited (1) Trading Ordinary 100Harworth Estates Mines Property Limited (1) Trading Ordinary 100Harworth Estates No 2 Limited (1) Trading Ordinary 100Harworth Estates Overage Limited (1) Trading Ordinary 100Harworth Estates Warwickshire Limited (1) Trading Ordinary 100Harworth TRR Limited (1) Dormant Ordinary 100Logistics North MC Limited (1) Trading Ordinary 12.18POW Management Company Limited (1) Trading Ordinary 100Rossington Community Management Company Limited (1) Non-trading Ordinary 100Harworth Regeneration Limited (1) Dormant Ordinary 100Mapplewell Management Company Limited (1) Non-trading Ordinary 100Gateway 45 No.1 Limited (1) Non-trading Ordinary 50The Aire Valley Land LLP (1) Trading Ordinary 50Flass Lane Management Company Limited (1) Non-trading Ordinary 100Harworth Surface Water Management (North West) Limited (1) Trading Ordinary 100Multiply Logistics North Holdings Limited (1) Trading Ordinary 20Waverley Square Limited (3) Trading Ordinary 50
All of the above companies are incorporated in England and Wales.Notes(1) Registered office at Advantage House, Poplar Way, Rotherham, South Yorkshire, S60 5TR.(2) Registered office at Inkerman House, St. Johns Road, Meadowfield, Durham, County Durham, DH7 8XL.(3) Registered office at Dransfield House, 2 Fox Valley Way, Fox Valley, Sheffield, S36 2AB.
16. Investments: continued

Harworth Group plc Annual Report and Financial Statements 2017 131
STRATEGIC REPORTCORPORATE GOVERNANCE
FINANCIAL STATEMENTS
17. InventoriesGroup
As at 31 December
2017 £’000
As at 31 December
2016 £’000
Development properties 210,471 –Planning promotion and option agreements 1,064 454Finished goods 83 279
Total inventories 211,618 733
The cost of inventory is recognised as an expense within cost of sales in the year of £28.1m (2016: £0.4m) . Finished goods are stated after a provision of £0.3m (2016: £0.3m) .The movement in the development properties is as follows:
Note £’000
At 1 January 2017 –Re-categorisation from investment properties 15 229,118Subsequent expenditure 2,424Disposals (15,253) Net realisable value provision (5,818)
At 31 December 2017 210,471
The bank and other loans are secured by fixed equitable charges over development properties. A transfer from the fair value reserve to retained earnings of £5.8m (2016: nil) was undertaken as the development property requiring the net realisable provision, stated above had, when previously classified as investment property, a revaluation gain in excess of this balance.
18. Trade and other receivablesGroup Company
Current
As at 31 December
2017 £’000
As at 31 December
2016 £’000
As at 31 December
2017 £’000
As at 31 December
2016 £’000
Trade receivables 11,572 4,179 – – Less: provision for impairment of trade receivables (207) (221) – –
Net trade receivables 11,365 3,958 – – Other receivables 12,399 19,111 284 291 Prepayments and accrued income 1,401 1,375 – –Amounts owed by subsidiary undertakings (note 30) – – 32,984 8,860
25,165 24,444 33,268 9,151
Non-current
Trade receivables 5,250 – – –
The carrying amount of trade and other receivables approximate to their fair value due to the short time frame over which the assets are realised. All of the Group’s and Company’s receivables are denominated in sterling.Included within current other receivables are £9.6m (2016: £8.4m) of deferred consideration on the sale of investment property. The non-current receivable of £5.3m relates to deferred consideration on the sale of a development property due in more than one year.The maximum exposure to credit risk at the reporting date is the carrying value of each class of receivables as disclosed in note 23. The Group and Company do not hold any collateral as security.The amounts owed to the Company by subsidiary undertakings are repayable on demand. Interest is payable at LIBOR +2%.
GroupMovements on the Group provisions for impairment of trade receivables are as follows:
Group
2017 £’000
2016 £’000
At the beginning of the year (221) (121) Receivables written off during the year as uncollectable 10 –Released/(provided) for in the year 4 (100)
At the end of the year (207) (221)
In determining the recoverability of a trade receivable the Group considers any change in the credit quality of the trade receivable from the date the credit was initially granted up to the reporting date.

132 Harworth Group plc Annual Report and Financial Statements 2017
Notes to the financial statementsfor the year ended 31 December 2017: continued
The other classes of assets within trade and other receivables for the Group contain impaired assets of £0.1m (2016: £0.1m) against which a provision of £0.1m (2016: £0.1m) is held.As at 31 December 2017, trade receivables of £0.2m (2016: £0.1m) were past due but not impaired. These mainly relate to customers for whom the arrears are being collected through agreed payment plans or where cash has been collected in 2018. The ageing of these was as follows:
Group
2017 £’000
2016 £’000
Up to 3 months 142 15Over 3 months 74 43
At the end of the year 216 58
As at 31 December 2017, trade receivables of £0.2m (2016: £0.2m) were impaired. The ageing analysis of the impaired trade receivables was as follows:
Group
2017 £’000
2016 £’000
Up to 3 months 150 46Over 3 months 57 175
At the end of the year 207 221
Provision for impairment charged to the income statement in the year was a credit of £4,000 (2016: charge of £100,000) .
CompanyThe Company had no external receivables as at 31 December 2017 (2016: £nil) . The other classes of assets within trade and other receivables do not contain impaired assets.
19. Assets classified as held for saleGroup
2017 £’000
2016 £’000
Investment propertiesAt 1 January 8,350 9,128Transferred from investment properties 13,778 8,310Subsequent expenditure 159 1,588Decrease in fair value (83) (224) Disposals (14,516) (10,452)
At 31 December 7,688 8,350
The assets classified for sale at each year end relate to investment properties expected to be sold within twelve months.
20. Cash Group Company
As at 31 December
2017 £’000
As at 31 December
2016 £’000
As at 31 December
2017 £’000
As at 31 December
2016 £’000
Cash 8,371 13,007 1,267 2,171
18. Trade and other receivables: continued

Harworth Group plc Annual Report and Financial Statements 2017 133
STRATEGIC REPORTCORPORATE GOVERNANCE
FINANCIAL STATEMENTS
21. BorrowingsGroup
As at 31 December
2017 £’000
As at 31 December
2016 £’000
Current: Secured – other loans (6,145) (1,819)
(6,145) (1,819)
Non-current: Secured – bank loans (23,437) (37,142) Secured – other loans (11,064) (13,517)
(34,501) (50,659)
At 31 December 2017, the Group had bank borrowings of £24.0m, £23.4m net of unamortised borrowings costs (2016: £38.0m, £37.1m net of unamortised borrowing costs) and a further £17.5m, £17.2m net of unamortised borrowing costs (2016: £15.6m, £15.3m net of unamortised borrowing costs) of infrastructure loans, which resulted in total borrowings of £40.6m net of unamortised borrowing costs (2016: £52.5m net of unamortised borrowing costs) . The bank borrowings are part of a £75.0m (2016: £75.0m) revolving credit facility from The Royal Bank of Scotland. The facility is repayable on 13 February 2023 (five year term) after being extended for two years on 13 February 2018. The facility is non-amortising and subject to financial and other covenants. The infrastructure loans of £17.5m (2016: £15.6m) are provided by public bodies in order to promote the development of major sites. They comprise a £0.4m (2016: £0.8m) loan from Leeds LEP in respect of the Prince of Wales site, £7.3m (2016: £11.7m) from the Homes and Community Agency in respect of Waverley and £0.1m (2016: £0.1m) for Village Farm, £2.4m (2016: £2.3m) from Sheffield City Region JESSICA Fund for Rockingham, £5.2m (2016: £0.7m) for the Advanced Manufacturing Park at Waverley and £2.1m (2016: £nil) from the North West Evergreen Limited Partnership for Units 4 and 5 at Logistics North, Bolton.The loans are drawn as work on the respective sites is progressed and they are repaid on agreed dates or when disposals are made from the sites.Current loans are stated after deduction of unamortised borrowing costs of £nil (2016: £nil) . Non-current bank and other loans are stated after deduction of unamortised borrowing costs of £0.8m (2016: £1.1m) . The bank loans and overdrafts are secured by way of fixed equitable charges over certain assets of the Group.
22. Trade and other payablesCurrent liabilities
Group Company
As at 31 December
2017 £’000
As at 31 December
2016 £’000
As at 31 December
2017 £’000
As at 31 December
2016 £’000
CurrentTrade payables 2,668 1,555 6 443Amounts owed to subsidiary undertakings (note 30) – – 53 52Taxation and social security 2,294 5,418 45 47Other creditors 3,196 2,150 18 –Accruals and deferred income 30,339 24,596 3,414 1,343
38,497 33,719 3,536 1,885
Accruals and deferred income for the Group includes £17.2m (2016: £15.4m) of liabilities relating to parcels of land that have been sold but where infrastructure costs are yet to be incurred. The amount owed by the Company to subsidiary undertakings is repayable on demand. Interest is charged at LIBOR +2%.
Non-current liabilities Group Company
As at 31 December
2017 £’000
As at 31 December
2016 £’000
As at 31 December
2017 £’000
As at 31 December
2016 £’000
Other creditors 760 1,520 – –
760 1,520 – –
Non-current creditors relate to deferred consideration due on land purchases after one year.

134 Harworth Group plc Annual Report and Financial Statements 2017
Notes to the financial statementsfor the year ended 31 December 2017: continued
23. Financial instruments and derivativesOn 21 June 2016 the Group entered into a four-year swap to fix £30m of borrowings at an all-in rate of 2.955% including fees. The interest rate swap has been measured at fair value which is determined using forward interest rates extracted from observable yield curves. The fair value of the interest rate swap at 31 December 2017 was a loss of £0.1m (2015: £0.4m) .During the year the following gain/(loss) was recognised in the other comprehensive income statement in relation to the interest rate swap:
2017 £’000
2016 £’000
Gain/(loss) on interest rate swap - cash flow hedge 244 (366)
The Group’s principal financial instruments include trade and other receivables, cash, interest bearing borrowings and trade and other payables.
Other financial assets and liabilities31 December 2017 31 December 2016
GroupBook value
£’000Fair value
£’000Book value
£’000Fair value
£’000
AssetsCash 8,371 8,371 13,007 13,007Trade and other receivables 28,741 28,741 22,792 22,792
LiabilitiesBank and other borrowings 40,646 40,646 52,478 52,478Trade and other payables 34,612 34,612 27,904 27,904
31 December 2017 31 December 2016
CompanyBook value
£’000Fair value
£’000Book value
£’000Fair value
£’000
AssetsCash 1,267 1,267 2,171 2,171Trade and other receivables 32,994 32,994 8,813 8,813
LiabilitiesTrade and other payables 3,491 3,491 2,446 2,446
In accordance with IAS 39, the Group classifies the assets and liabilities in the analysis above as ‘loans and receivables’ and ‘other financial liabilities’, respectively. At the 2017 and 2016 year ends, the Group did not have any ‘held to maturity’ or ‘available for sale’ financial assets or ‘held for trading’ financial assets and liabilities as defined by IAS 39. The fair value of bank and other borrowings equals their carrying amount, as the impact of discounting is not significant. The fair values are within Level 2 of the fair value hierarchy.
24. Financial risk managementThe Group’s overall risk management programme focuses on credit and liquidity risks to minimise potential adverse effects on the Group’s financial performance. Risk management is carried out centrally under policies approved by the Board of Directors. The Board discusses and agrees courses of action to cover material risk management areas, including credit risk and investment of excess liquidity.
Credit riskThe Group is subject to credit risk arising from outstanding receivables and committed cash and cash equivalents and deposits with banks and financial institutions. The Group’s policy is to manage credit exposure to trading counterparties within defined trading limits. The Group is exposed to counterparty credit risk on cash and cash equivalent balances. The Group and Company hold all of their cash deposits with their principal bankers.

Harworth Group plc Annual Report and Financial Statements 2017 135
STRATEGIC REPORTCORPORATE GOVERNANCE
FINANCIAL STATEMENTS
24. Financial risk management: continuedInterest rate riskThe Group’s interest rate risk arises from external borrowings which are charged at LIBOR plus 2%. From 13 February 2018 this rate has increased to LIBOR plus 2.1% following the two year extension to the facility. On 21 June 2016 the Group entered into a four-year swap with RBS to fix £30m of borrowing at an all in rate of 2.955%, including fees. The swap is hedge accounted with any unrealised movements going through reserves.The Group also has six infrastructure loans with all in funding rates of between 2.5% and 4.7%.
Liquidity riskThe Group is subject to the risk that it will not have sufficient liquid resources to fund its on-going business. The Group manages its liquidity requirements with the use of both short and long-term cash flow forecasts. The Group had net debt at 31 December 2017 of £32.3m; (2016: £39.5m) . The Group utilised cash from operating activities and investing activities for the year of £16.6m (2016: generated £0.2m) .The table below analyses the Group’s financial liabilities which will be settled on a net basis into relevant maturity groupings based on the remaining period at the Balance sheet date to the contractual maturity date. The amounts disclosed in the table are the gross contractual undiscounted cash flows.
Less than1 year £’000
Between1 and 2 years
£’000
Between 2 and 5 years
£’000
At 31 December 2017 Trade and other payables 33,852 760 –Interest payable on borrowings 697 2 61Bank and other borrowings 5,448 5,156 29,282
At 31 December 2016Trade and other payables 26,384 1,520 –Interest payable on borrowings – 34 694Bank and other borrowings 1,819 8,626 41,305
Capital risk managementThe Group is subject to the risk that its capital structure will not be sufficient to support the growth of the business. The Group’s objectives when managing capital are:• to safeguard the Group’s ability to continue as a going concern and have the resources to provide returns for Shareholders
and benefits for other Stakeholders; • to maximise returns to Shareholders by allocating capital across the business based upon the expected level of return and
risk; and• to maintain an optimal capital structure to reduce the cost of capital.The Group manages and monitors its cash balances to ensure it has sufficient capital to manage and maintain its business activities. Cash balances are disclosed in note 20.In order to maintain or adjust the capital structure, the Group may adjust the amount of dividends paid to Shareholders, return capital to Shareholders, issue new shares or sell assets to reduce debt.The Group monitors capital on the basis of net debt to equity. Net debt is total debt less cash and at 31 December 2017 this was £32.3m (2016: £39.5m) .The Group has in place a £75.0m revolving credit facility from The Royal Bank of Scotland (RBS) . The facility is a five-year term facility which ends in February 2023 (after being extended for two years from 13 February 2018) . It is on a non-amortising basis and is subject to financial and other covenants.The facility provided by RBS is subject to covenants over loan to market value of investment properties, gearing, and minimum consolidated net worth.The Group comfortably operated within these requirements throughout the year.
25. Retirement benefit obligationsDefined contribution pension schemesThe Group pays defined contribution payments to pension insurance plans. Contributions to defined contribution schemes in the year amounted to £0.3m (2016: £0.3m) . The Group has no further payment obligations once the contributions have been paid. The contributions are recognised as an expense when they are due.
Defined benefit obligationsThe Group and Company has defined benefit obligations in respect of the Blenkinsopp Section of the Industry-Wide Mineworkers’ Pension Scheme (the Blenkinsopp scheme) . This scheme is closed to new members.

136 Harworth Group plc Annual Report and Financial Statements 2017
Notes to the financial statementsfor the year ended 31 December 2017: continued
The Balance sheet amounts in respect of retirement benefit obligations are:
Group Company
As at 31 December
2017 £’000
As at 31 December
2016 £’000
As at 31 December
2017 £’000
As at 31 December
2016 £’000
Relating to continuing activitiesBlenkinsopp 563 602 563 602
Contributions to the Blenkinsopp scheme of £0.2m were made by the Group during 2017 (2016: £0.2m) . It is expected that contributions of a similar amount will be paid in 2018. At December 2017, no contributions remained unpaid (2016: £nil) .The pension scheme is valued annually by a qualified independent actuary for the purposes of IAS 19 (revised) and the preparation of financial statements. The assumptions which usually have the most significant effect on the results of the valuation are the discount rate, which is based on bond yields, and the rates of increase in pensions. There are no active members of this scheme. The main assumptions underlying the valuation of the Blenkinsopp scheme were:
As at 31 December
2017
As at 31 December
2016
Discount rate 2.50% p.a. 2.55% p.a.Rate of pension increases 2.15% p.a. 2.30% p.a.Rate of price inflation (RPI) 3.10% p.a. 3.25% p.a.Rate of price inflation (CPI) 2.10% p.a. 2.25% p.a.Rate of cash commutation 25.00% 20.00%
Year ended 31 December
2017
Year ended 31 December
2016
Longevity at age 65 for current pensioners (years) 19.6 - 22.8 18.6 – 22.0
Longevity at age 65 for future pensioners (years) 21.1 - 24.4 20.3 – 24.0
The assumed pension increases depend on the period of service accrual (before April 1997: no increases, after 1997: in line with statutory minimum increases based on consumer price inflation) .
Defined benefit obligationsThe amounts recognised in the Balance sheet:
2017 £’000
2016 £’000
2015 £’000
2014 £’000
2013 £’000
Fair value of plan assets 2,228 2,117 1,727 1,740 1,393 Present value of funding obligations (2,791) (2,719) (2,162) (2,304) (2,076)
Net liability recognised in the Balance sheet (563) (602) (435) (564) (683)
The Blenkinsopp scheme does not own any shares in the Company.The amounts recognised in the consolidated income statement are:
Year ended 31 December
2017 £’000
Year ended 31 December
2016 £’000
Expenses (32) (74) Interest cost (13) (13)
(45) (87)
25. Retirement benefit obligations: continued

Harworth Group plc Annual Report and Financial Statements 2017 137
STRATEGIC REPORTCORPORATE GOVERNANCE
FINANCIAL STATEMENTS
A further cost of £0.1m (2016: £0.3m) has been reflected in the statement of comprehensive income in the year. This represents the net effect of experience, and actuarial gains and losses on the scheme in the year.
Change in assets
Year ended 31 December
2017 £’000
Year ended 31 December
2016 £’000
Fair value of plan assets at the start of the year 2,117 1,727Interest income 55 68Actual return on scheme assets excluding interest income (19) 289Employer contributions 189 189Expenses (32) (74) Benefits paid (82) (82)
Fair value of plan assets at the end of the year 2,228 2,117
Plan assets are comprised as follows:Year ended
31 December 2017
£’000
Year ended 31 December
2016 £’000
Gilts 1,352 1,610Corporate bonds 1 511Diversified and multi-asset growth funds 543 –Sterling liquidity fund 327 –Other 5 (4)
Total 2,228 2,117
25. Retirement benefit obligations: continued
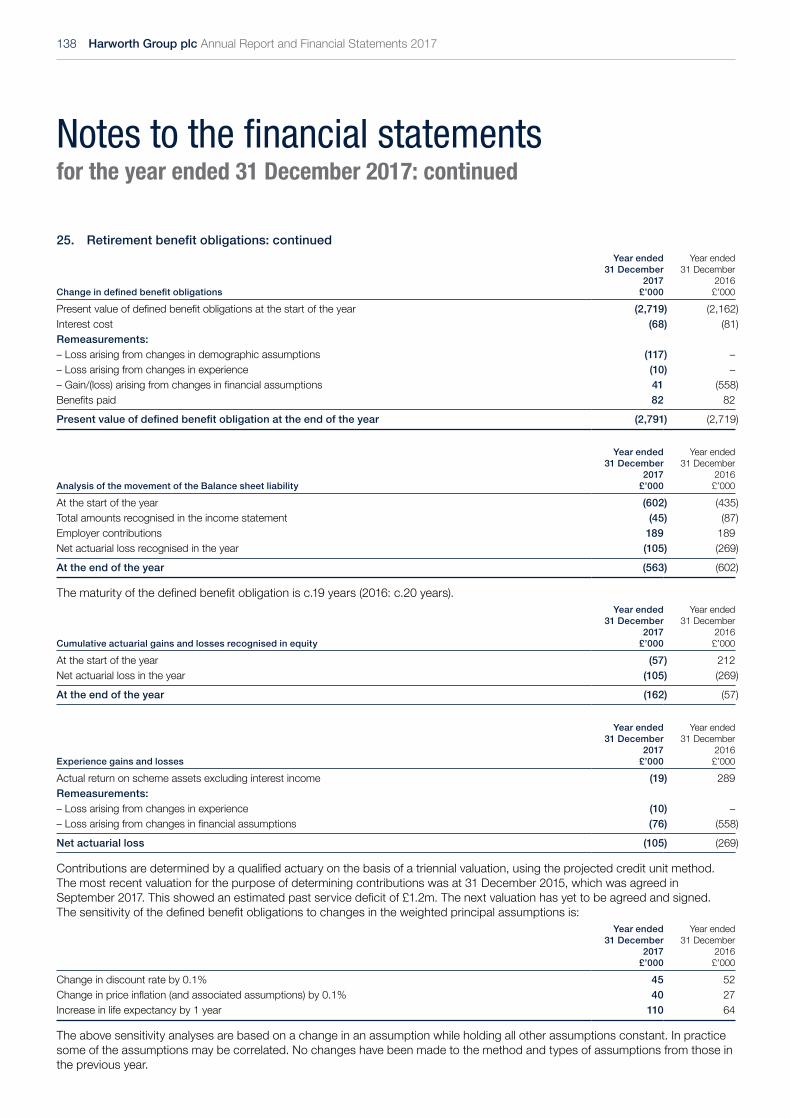
138 Harworth Group plc Annual Report and Financial Statements 2017
Notes to the financial statementsfor the year ended 31 December 2017: continued
Change in defined benefit obligations
Year ended 31 December
2017 £’000
Year ended 31 December
2016 £’000
Present value of defined benefit obligations at the start of the year (2,719) (2,162) Interest cost (68) (81) Remeasurements:– Loss arising from changes in demographic assumptions (117) –– Loss arising from changes in experience (10) –– Gain/(loss) arising from changes in financial assumptions 41 (558) Benefits paid 82 82
Present value of defined benefit obligation at the end of the year (2,791) (2,719)
Analysis of the movement of the Balance sheet liability
Year ended 31 December
2017 £’000
Year ended 31 December
2016 £’000
At the start of the year (602) (435) Total amounts recognised in the income statement (45) (87) Employer contributions 189 189Net actuarial loss recognised in the year (105) (269)
At the end of the year (563) (602)
The maturity of the defined benefit obligation is c.19 years (2016: c.20 years).
Cumulative actuarial gains and losses recognised in equity
Year ended 31 December
2017 £’000
Year ended 31 December
2016 £’000
At the start of the year (57) 212Net actuarial loss in the year (105) (269)
At the end of the year (162) (57)
Experience gains and losses
Year ended 31 December
2017 £’000
Year ended 31 December
2016 £’000
Actual return on scheme assets excluding interest income (19) 289Remeasurements:– Loss arising from changes in experience (10) –– Loss arising from changes in financial assumptions (76) (558)
Net actuarial loss (105) (269)
Contributions are determined by a qualified actuary on the basis of a triennial valuation, using the projected credit unit method. The most recent valuation for the purpose of determining contributions was at 31 December 2015, which was agreed in September 2017. This showed an estimated past service deficit of £1.2m. The next valuation has yet to be agreed and signed. The sensitivity of the defined benefit obligations to changes in the weighted principal assumptions is:
Year ended 31 December
2017 £’000
Year ended 31 December
2016 £’000
Change in discount rate by 0.1% 45 52Change in price inflation (and associated assumptions) by 0.1% 40 27Increase in life expectancy by 1 year 110 64
The above sensitivity analyses are based on a change in an assumption while holding all other assumptions constant. In practice some of the assumptions may be correlated. No changes have been made to the method and types of assumptions from those in the previous year.
25. Retirement benefit obligations: continued

Harworth Group plc Annual Report and Financial Statements 2017 139
STRATEGIC REPORTCORPORATE GOVERNANCE
FINANCIAL STATEMENTS
The Scheme exposes the Company to actuarial risks such as: investment risk, interest rate risk and longevity risk.• Investment risk: the present value of the defined benefit obligation is calculated using a discount rate determined by reference
to high quality corporate bond yields; if the return on Scheme assets is below this rate, it will create a deficit. The majority of the Scheme investments are held within index-linked government bonds or cash/liquidity funds.
• Interest rate risk: a decrease in the corporate bond interest rate will increase the liability but this would likely be partially offset by an increase in the return on the Scheme’s debt investments.
• Longevity risk: the present value of the defined benefit obligation is calculated by reference to the best estimate of the mortality of Scheme participants both during and after their employment. An increase in the life expectancy of the participants will increase the Scheme’s liability.
26. Called up share capitalOn 17 March 2017, the Company issued 29,226,974 ordinary shares at 95 pence each, with a nominal value of 10 pence each. On 26 April 2016, 3 Ordinary Shares were issued at 1 pence each and all shares in issue were consolidated from 1 pence shares into 10 pence shares.
2017 2016
Group and CompanyNumber
of shares
£’000Number
of shares
£’000
Issued and fully paidAt 1 January 292,269,786 29,227 2,922,697,857 29,227Shares issued 29,226,974 2,923 3 –Share consolidation (1 for 10) – – (2,630,428,074) –
At 31 December 321,496,760 32,150 292,269,786 29,227Own shares held (246,010) (263) – –
At 31 December 2017 321,250,750 31,887 292,269,786 29,227
The own shares represent the number and cost of shares purchased in the market and held by the Harworth Group plc Employee Benefit Trust to satisfy Long Term Incentive Plan awards for Executive Directors and Senior Executives.
Long Term Incentive PlansLong Term Incentive Plans were introduced in 2016 and 2017 for Executive Directors and Senior Executives. There were no shares outstanding at 31 December 2017 (2016: nil) . The Directors’ remuneration report which forms part of these financial statements provides details of current incentive plans.
27. Share premium account
Group and Company 2017
£’0002016
£’000
At 1 January – 129,121Transferred to other distributable reserves – (129,121) Premium on shares issued 24,842 –Costs relating to share issue (700) –Other transaction costs 209 –
At 31 December 24,351 –
On 18 May 2016, approval was granted from the High Court to cancel the £129.1m share premium account of the Company and for it to be re-designated as distributable reserves.
28. Capital and other financial commitmentsCapital expenditure contracted for at 31 December 2017 is £10.2m (2016: £4.2m) .
29. Operating lease commitmentsThe Group leases a number of vehicles, office equipment and office facilities under operating leases. The leases run between one year and three years.
25. Retirement benefit obligations: continued

140 Harworth Group plc Annual Report and Financial Statements 2017
Notes to the financial statementsfor the year ended 31 December 2017: continued
a) Future minimum lease paymentsAt 31 December 2017, the future minimum lease payments under non-cancellable leases were payable as follows:
Group Company
As at 31 December
2017 £’000
As at 31 December
2016 £’000
As at 31 December
2017 £’000
As at 31 December
2016 £’000
Less than one year 34 35 –Between one and five years 17 10 – –
51 45 – –
Amounts recognised in the income statement
Lease cost 64 60 – –
b) Future minimum lease receipts As set out in note 15 property rental income earned during the year was £9.1m (2016: £8.4m) .At 31 December 2017, the Group had contracted with tenants for the following future minimum lease payments:
Group Company
As at 31 December
2017 £’000
As at 31 December
2016 £’000
As at 31 December
2017 £’000
As at 31 December
2016 £’000
Less than one year 8,342 6,150 –Between one and five years 25,001 17,170 – – More than five years 34,814 29,039 – –
68,157 52,359 – –
30. Related party transactionsGroupThe remuneration of Directors and key management is given in note 6.
Peel GroupThe Peel Group charged £42,500 (2016: £42,500) in respect of fees for Steven Underwood, a non-executive director. The Group paid £0.8m to Peel Group in respect of a deed of release at Logistics North (2016: £nil) . £0.3m (2016: £nil) of this was subsequently re-charged to Multiply Logistics North Holdings Limited.During the year the Group made two land sales to Peel Environmental Limited amounting to £3.1m (2016: £nil) resulting in a £1.2m (2016: £nil) profit on sale. This was unpaid at the year end.
Multiply Logistics North Holdings LimitedThe Group made two land sales to Multiply Logistics North Holdings Limited during the year amounting to £8.1m (2016: £nil) , recharged costs of £0.6m (2016: £nil) and charged a development management fee of £0.2m (2016: £nil) .
Scratching CatGeoff Mason, our former Company Secretary, supplied his services through Scratching Cat Limited, a company of which he is a director. During the year charges were made in relation to company secretarial duties of £nil (2016: £0.1m) .
29. Operating lease commitments: continued

Harworth Group plc Annual Report and Financial Statements 2017 141
STRATEGIC REPORTCORPORATE GOVERNANCE
FINANCIAL STATEMENTS
CompanyThe Company carried out the following transactions with subsidiary undertakings.Details of the Company’s intercompany balances and interest at 31 December 2017 are set out below:
As at 31 December 2017 £’000
As at 31 December 2016£’000
Net Interest receivable/
(payable) in the year
£’000
Net amounts due from/(to)
£’000
Net Interest receivable/
(payable) in the year
£’000
Net amounts due from/(to)
£’000
EOS Inc Limited 308 22,774 162 7,465Harworth Estates Limited 17 709 14 1,127Harworth Guarantee Co. Limited (1) (53) (1) (52) Harworth Estates Mines Property Limited – 7,000 – –Harworth Estates Curtilage Limited – 2,000 – –Harworth Estates Property Group Limited 172 277 – 49Coalfield Estates Limited 5 224 5 219
501 32,931 180 8,808
Dividends received During the year the Company received dividends of £nil (2016: £nil) from subsidiary undertakings.
InterestDuring the year the Company received net interest of £0.5m (2016: £0.2m) from subsidiary companies.All transactions occurred whilst the related parties were subsidiary undertakings.
Receivables and indebtednessDetails of the Company’s receivables and indebtedness are set out in notes 18 and 22 and amounts due from, or owed to, related parties are set out below:
Owed to:
As at 31 December
2017 £’000
As at 31 December
2016 £’000
Harworth Guarantee Co. Limited (53) (52)
(53) (52)
Owed by:
As at 31 December
2017 £’000
As at 31 December
2016 £’000
Harworth Estates Limited 709 1,127Coalfield Estates Limited 224 219EOS Inc Limited 22,774 7,465Harworth Estates Curtilage Limited 2,000 –Harworth Estates Mines Property Limited 7,000 –Harworth Estates Property Group Limited 277 49
32,984 8,860
31. Post Balance sheet eventsFinancingOn 13 February 2018 the Group extended the terms of its existing £75m RCF with RBS by two years such that it now expires in February 2023.
ChairmanAlastair Lyons became Chairman of the Group on 7 March 2018. Jonson Cox stepped down as Chairman at this point, and retired from the Board at the end of March.
30. Related party transactions: continued

142 Harworth Group plc Annual Report and Financial Statements 2017
Company information and investor timetable Company information and investor timetable
Company information and investor timetable
Former Chairman (1) Jonson Cox
Chairman (1) Alastair Lyons
Chief Executive Owen Michaelson
Finance Director Andrew Kirkman
Non-Executive Directors Lisa Clement Anthony Donnelly Andrew Cunningham Steven UnderwoodMartyn Bowes
Company Secretary and Registered OfficeChristopher BirchAdvantage HousePoplar WayRotherham, S60 5TR
Independent AuditorsPricewaterhouseCoopers LLPChartered Accountants and Statutory AuditorsCentral Square, 29 Wellington St,Leeds, LS1 4DL
SolicitorsDLA Piper UK LLP1 St Paul’s PlaceSheffield, South Yorkshire, S1 2JX
BrokersPeel Hunt LLPMoor House120 London WallLondonEC2Y 7QR
Canaccord Genuity Limited88 Wood StreetLondon, EC2V 7QR
RegistrarsEquiniti LimitedAspect HouseSpencer Road, LancingWest Sussex, BN99 6DA
Principal bankersThe Royal Bank of Scotland3rd Floor2 Whitehall QuayLeeds, LS1 4HR
Company Registered Number2649340
Share price informationThe Company’s Ordinary Shares are traded on the London Stock Exchange.SEDOL number 07919072ISIN number GB0007190720Reuters ticket HWG.LBloomberg ticker HWG:LN
LEI Code213800R8JSSGK2KPFG21
Financial Calendar
Ex-Dividend Date Announced 3 May 2018
Record Date for Dividend Announced 4 May 2018
Annual General MeetingBessemer Room, AMP Technology Centre, Waverley, Rotherham, S60 5WG
Announced 29 May 2018
Dividend Payment Date Announced 1 June 2018
Proposed date for Interim Results Announcement 2018Interim Results to be published at www.harworthgroup.com/investors
12 September 2018
Proposed Record date for Interim Dividend 21 September 2018
Proposed date for payment of Interim Dividend 19 October 2018
Registrars All administrative enquiries relating to shareholdings should, in the first instance, be directed to Equiniti, Aspect House, Spencer Road, Lancing, West Sussex BN99 6DA (telephone: 0371 384 2301) and should clearly state the registered shareholder’s name and address.
Dividend mandate Any shareholder wishing dividends to be paid directly into a bank or building society should contact the Registrars for a dividend mandate form. Dividends paid in this way will be paid through the Bankers’ Automated Clearing System (BACS).
Website The Group has a website (www.harworthgroup.com) that gives further information on the Group.Footnotes: (1) On 7 March 2018, Alastair Lyons was appointed Non-Executive Chairman in place of Jonson Cox. On 31 March 2018, Jonson Cox resigned as a Non-Executive Director.

Harworth Group plc Annual Report and Financial Statements 2017 143
2012 Restructuring The restructuring of the former UK Coal in December 2012AGM Annual General MeetingAMP Advanced Manufacturing Park,
RotherhamATR Absolute Total ReturnAWRC Sheffield Hallam University’s
Advanced Wellbeing Research Centre
CA06 Companies Act 2006Code UK Corporate Governance Code
2016Company Harworth Group plcCPD Continuing Professional
DevelopmentDLA DLA Piper UK LLPEA Environment AgencyEBT The Harworth Group Plc
Employee Benefit TrustEES Estates, Environment and Safety
teamEPRA NAV EPRA NNNAV excluding deferred
tax, notional deferred tax on the mark to market value of development properties and the mark in market movement on financial investments
EPRA NNNAV or NNNAV NAV plus the mark to market value of development properties less notional deferred tax on this mark to market
EPS Earnings Per ShareFCA Financial Conduct AuthorityFRC Financial Reporting CouncilFRSs Financial Reporting StandardsGateleys Gateley plcGDPR General Data Protection RegulationHarworth Estates Harworth Estates Property Group
Limited and its subsidiariesHarworth or Group Harworth Group plc and its
subsidiariesHEMPL Harworth Estates Mines Property
LimitedHEPGL Harworth Estates Property Group
LimitedHICL Harworth Insurance Company
LimitedHSE Health and Safety ExecutiveIFRSs International Financial Reporting
StandardsJPW JPW Consulting LimitedKepler Kepler Associates
KPI Key Performance IndicatorKPMG KPMG LLPLCPF Lancashire County Pension FundLEP Local Enterprise PartnershipLTIP Harworth Group Plc
Long Term Incentive PlanLTV Loan To ValueNAV Net Asset ValueParent Entity Harworth Group PlcPEG Principles The Pre-emption Group PrinciplesPEL Peel Environmental LimitedPEVG Profit excluding Value GainsPPAs Planning Promotion AgreementsPPF The Pension Protection FundPRA Prudential Regulatory Authoritypsf Per square footPwC PricewaterhouseCoopers LLPRBS The Royal Bank of Scotland plcRCF Revolving Credit FacilityRegulations Large and Medium-sized
Companies and Groups (Accounts and Reports) (Amendment) Regulations 2013
RIDDOR Reporting of Injuries, Diseases and Dangerous Occurrences Regulations 2013
RNS Regulatory News ServiceSenior Management Team The team of directors and associate
directors who lead the various divisions of the business and report to the Executive Committee
SHEMS Safety, Health and Environment Management System
SOCI Statement of Comprehensive Income
STOR Short Term Operating ReserveTMK Tokio Marine KilnTSR Total Shareholder ReturnUKCMHL UK Coal Mine Holdings LimitedWAMITAB Waste Management Industry
Training and Advisory Board (UK)WAULT Weighted Average Unexpired Lease
Term
Definitions and abbreviations used

www.harworthgroup.com