handbook of material testing.pdf
DESCRIPTION
hand book of material testingTRANSCRIPT
March 2006
Handbookof
Material Testing
Handbookof
Material Testing

PREFACE
While designing a structure, engineer assumes certain value ofstrength for each of material being used therein. When thestructure is being constructed, it is the bounden duty of the fieldengineers to get the same validated by regular testing of material.The quality of materials used in any infrastructure does play a vitalrole with regard to its ultimate strength and durability in the longrun. Hence, the materials need to be tested according to certainstandard procedures developed by ASTM, BIS, RDSO to give aclear picture of material strength.
The “Handbook of Material Testing” is an attempt by IRICEN tobring together the standard test procedures for materials frequentlyused in the civil engineering infrastructure of Indian Railways. It ishoped that this will be a helpful guide to the field engineers. A listof suppliers of various testing equipments has also been providedalongwith their addresses to enable the engineers in setting up ofa field laboratory, in case the need be.
Any suggestions to ameliorate the content of this handbookwould be welcome.
Shiv Kumar
Director
IRICEN, Pune
ACKNOWLEDGEMENT
Strength and durability of any infrastructure is a reflection of thequality of materials used. Quality control of materials can only beensured through certain standard test procedures designed byASTM, BIS, RDSO and others.
The “Handbook of Material Testing” is an attempt towards thisaim, of creating a collection of standard test procedures formaterials, commonly used in civil engineering infrastructure on theIndian Railways. This will serve as a guide to the field engineers.The readers are advised in their interest to refer to the lateststandards to avoid any omission, due to changes/amendments inthe standards. The handbook also includes a list of suppliers ofmaterial testing equipments, alongwith their addresses to facilitatethe setting up of a field laboratory.
The support rendered by the faculty and staff of IRICEN in thisendeavour, needs mention. Shri Praveen Kumar, Professor/Computers and Shri J.M. Patekari, Chief Technical Assistant,have been of technical assistance and Shri Vijayakumaran. V, myPersonal Assistant, has been extremely useful in the task of wordprocessing.
I am thankful to Shri Shiv Kumar, Director/IRICEN for hisguidance and encouragement.
R.K. Verma
Sr. Professor/Track
IRICEN, Pune
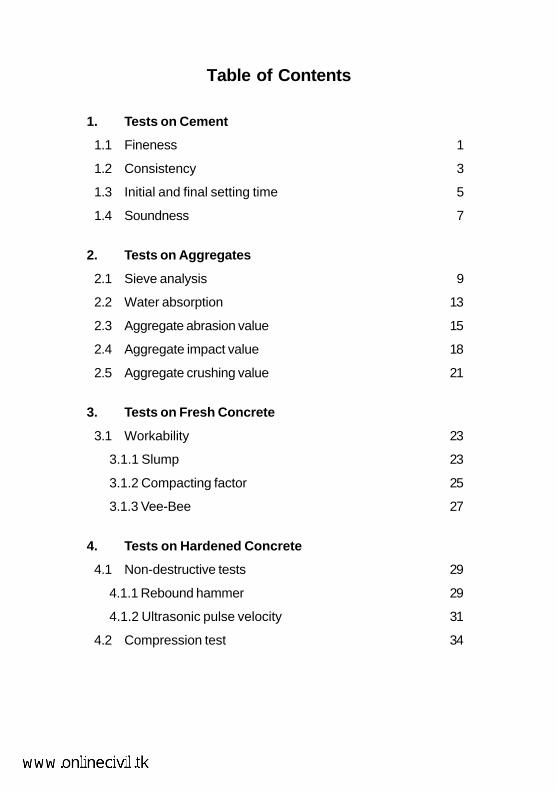
Table of Contents
1. Tests on Cement
1.1 Fineness 1
1.2 Consistency 3
1.3 Initial and final setting time 5
1.4 Soundness 7
2. Tests on Aggregates
2.1 Sieve analysis 9
2.2 Water absorption 13
2.3 Aggregate abrasion value 15
2.4 Aggregate impact value 18
2.5 Aggregate crushing value 21
3. Tests on Fresh Concrete
3.1 Workability 23
3.1.1 Slump 23
3.1.2 Compacting factor 25
3.1.3 Vee-Bee 27
4. Tests on Hardened Concrete
4.1 Non-destructive tests 29
4.1.1 Rebound hammer 29
4.1.2 Ultrasonic pulse velocity 31
4.2 Compression test 34
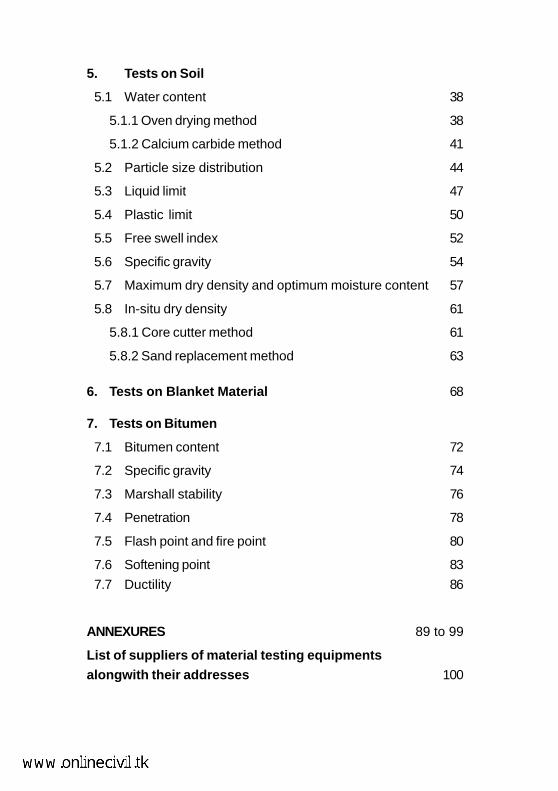
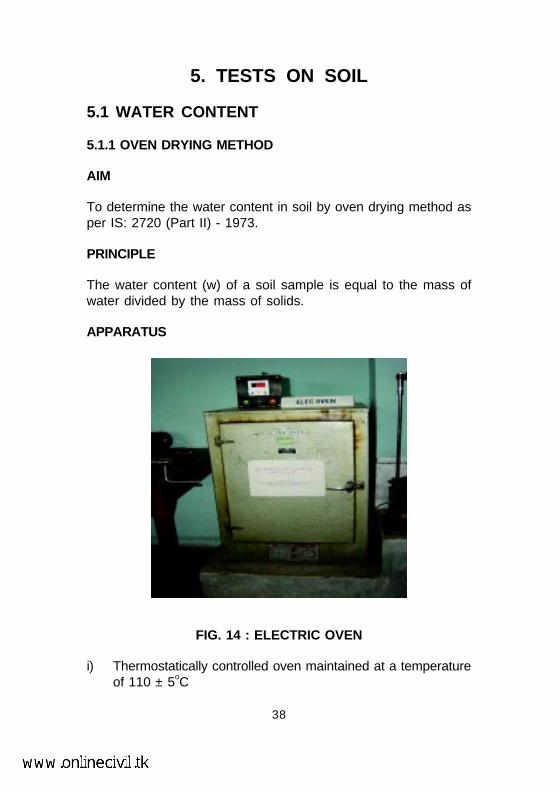
5. Tests on Soil
5.1 Water content 38
5.1.1 Oven drying method 38
5.1.2 Calcium carbide method 41
5.2 Particle size distribution 44
5.3 Liquid limit 47
5.4 Plastic limit 50
5.5 Free swell index 52
5.6 Specific gravity 54
5.7 Maximum dry density and optimum moisture content 57
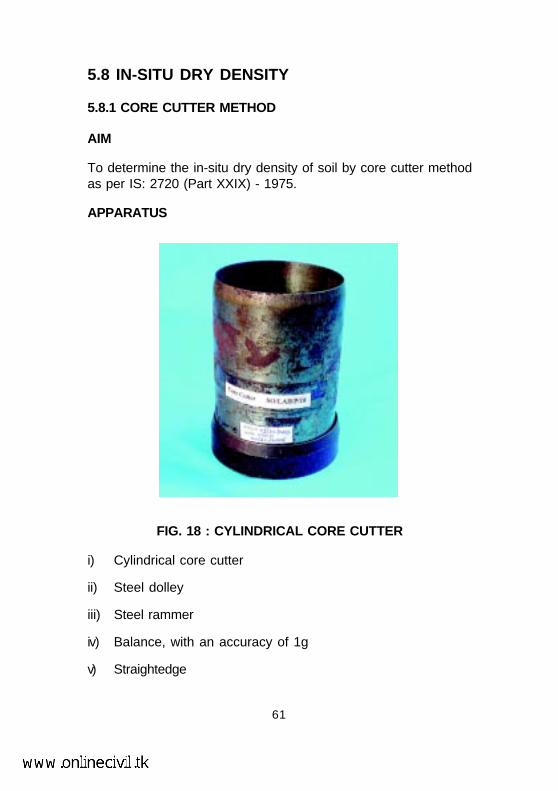
5.8 In-situ dry density 61
5.8.1 Core cutter method 61
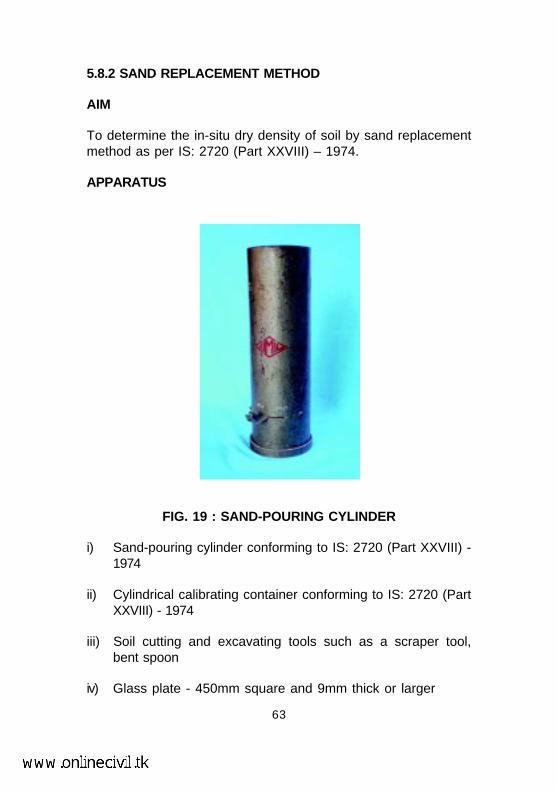
5.8.2 Sand replacement method 63
6. Tests on Blanket Material 68
7. Tests on Bitumen
7.1 Bitumen content 72
7.2 Specific gravity 74
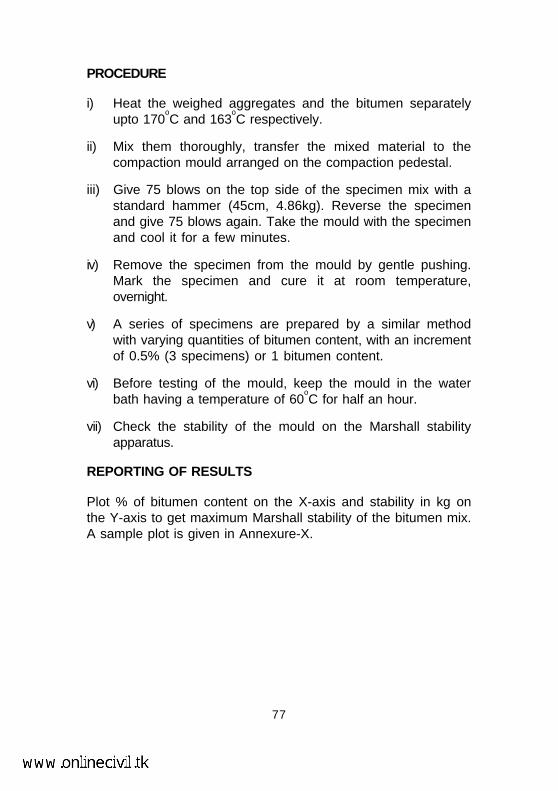
7.3 Marshall stability 76
7.4 Penetration 78
7.5 Flash point and fire point 80
7.6 Softening point 83
7.7 Ductility 86
ANNEXURES 89 to 99
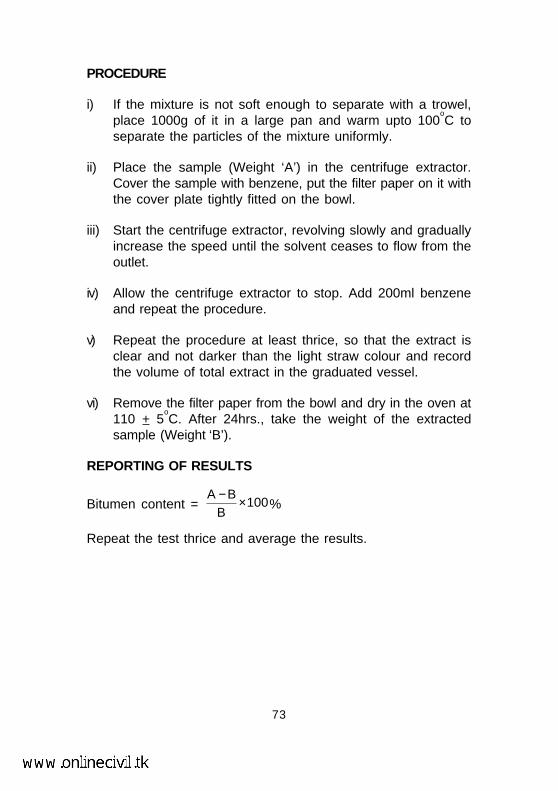
List of suppliers of material testing equipmentsalongwith their addresses 100

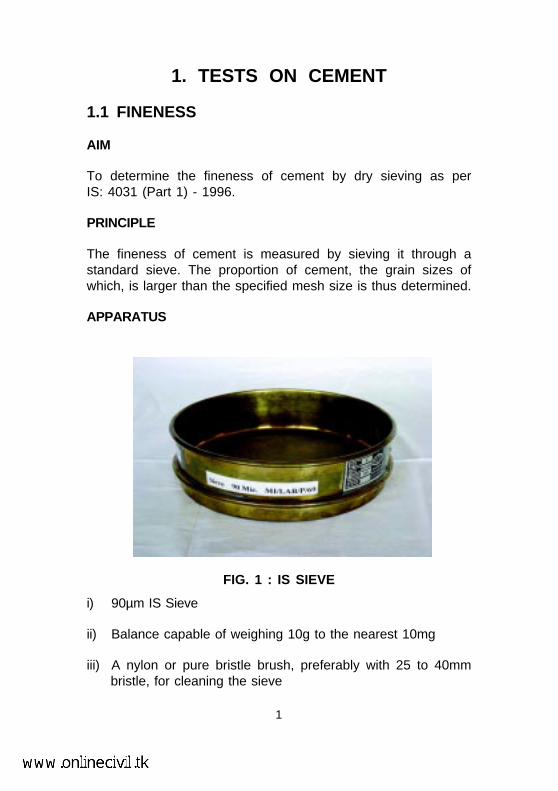
1. TESTS ON CEMENT
1.1 FINENESS
AIM
To determine the fineness of cement by dry sieving as perIS: 4031 (Part 1) - 1996.
PRINCIPLE
The fineness of cement is measured by sieving it through astandard sieve. The proportion of cement, the grain sizes ofwhich, is larger than the specified mesh size is thus determined.
APPARATUS
FIG. 1 : IS SIEVE
i) 90µm IS Sieve
ii) Balance capable of weighing 10g to the nearest 10mg
iii) A nylon or pure bristle brush, preferably with 25 to 40mmbristle, for cleaning the sieve
1
PROCEDURE
i) Weigh approximately 10g of cement to the nearest 0.01g andplace it on the sieve.
ii) Agitate the sieve by swirling, planetary and linearmovements, until no more fine material passes through it.
iii) Weigh the residue and express its mass as a percentage R1,
of the quantity first placed on the sieve to the nearest 0.1percent.
iv) Gently brush all the fine material off the base of the sieve.
v) Repeat the whole procedure using a fresh 10g sample toobtain R2. Then calculate R as the mean of R1 and R2 as apercentage, expressed to the nearest 0.1 percent. When theresults differ by more than 1 percent absolute, carry out athird sieving and calculate the mean of the three values.
REPORTING OF RESULTS
Report the value of R, to the nearest 0.1 percent, as the residueon the 90µm sieve.
2
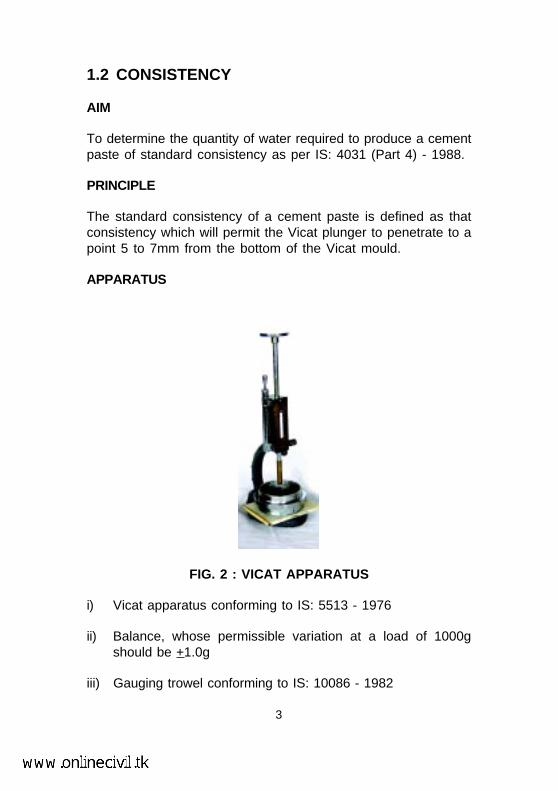
1.2 CONSISTENCY
AIM
To determine the quantity of water required to produce a cementpaste of standard consistency as per IS: 4031 (Part 4) - 1988.
PRINCIPLE
The standard consistency of a cement paste is defined as thatconsistency which will permit the Vicat plunger to penetrate to apoint 5 to 7mm from the bottom of the Vicat mould.
APPARATUS
FIG. 2 : VICAT APPARATUS
i) Vicat apparatus conforming to IS: 5513 - 1976
ii) Balance, whose permissible variation at a load of 1000gshould be +1.0g
iii) Gauging trowel conforming to IS: 10086 - 1982
3
PROCEDURE
i) Weigh approximately 400g of cement and mix it with aweighed quantity of water. The time of gauging should bebetween 3 to 5 minutes.
ii) Fill the Vicat mould with paste and level it with a trowel.
iii) Lower the plunger gently till it touches the cement surface.
iv) Release the plunger allowing it to sink into the paste.
v) Note the reading on the gauge.
vi) Repeat the above procedure taking fresh samples of cementand different quantities of water until the reading on thegauge is 5 to 7mm.
REPORTING OF RESULTS
Express the amount of water as a percentage of the weight ofdry cement to the first place of decimal.
4
1.3 INITIAL AND FINAL SETTING TIME
AIM
To determine the initial and the final setting time of cementas per IS: 4031 (Part 5) - 1988.
APPARATUS
i) Vicat apparatus conforming to IS: 5513 - 1976
ii) Balance, whose permissible variation at a load of 1000gshould be +1.0g
iii) Gauging trowel conforming to IS: 10086 - 1982
PROCEDURE
i) Prepare a cement paste by gauging the cement with 0.85times the water required to give a paste of standardconsistency (see Para 1.2).
ii) Start a stop-watch, the moment water is added to thecement.
iii) Fill the Vicat mould completely with the cement pastegauged as above, the mould resting on a non-porous plateand smooth off the surface of the paste making it level withthe top of the mould. The cement block thus prepared in themould is the test block.
A) INITIAL SETTING TIME
Place the test block under the rod bearing the needle.Lower the needle gently in order to make contact with thesurface of the cement paste and release quickly, allowing itto penetrate the test block. Repeat the procedure till theneedle fails to pierce the test block to a point 5.0 ± 0.5mmmeasured from the bottom of the mould.
5
The time period elapsing between the time, water is addedto the cement and the time, the needle fails to pierce thetest block by 5.0 ± 0.5mm measured from the bottom of themould, is the initial setting time.
B) FINAL SETTING TIME
Replace the above needle by the one with an annularattachment.
The cement should be considered as finally set when, uponapplying the needle gently to the surface of the test block,the needle makes an impression therein, while theattachment fails to do so. The period elapsing between thetime, water is added to the cement and the time, the needlemakes an impression on the surface of the test block, whilethe attachment fails to do so, is the final setting time.
REPORTING OF RESULTS
The results of the initial and the final setting time should bereported to the nearest five minutes.
6
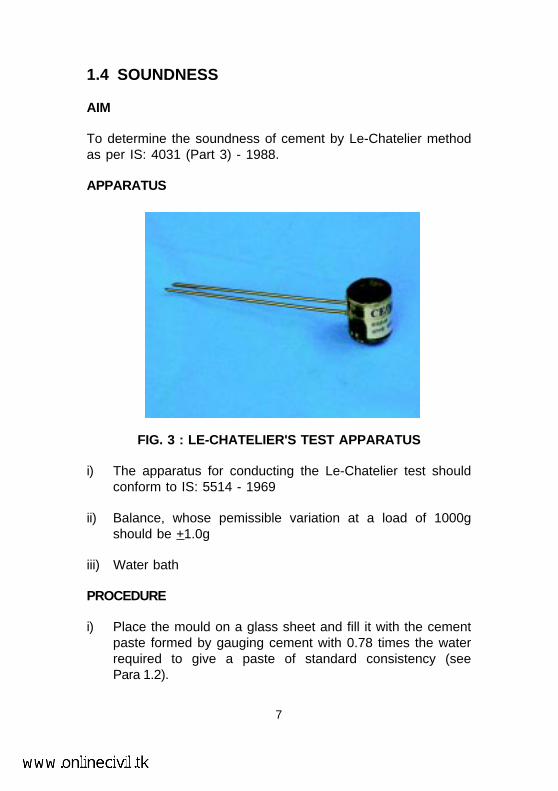
1.4 SOUNDNESS
AIM
To determine the soundness of cement by Le-Chatelier methodas per IS: 4031 (Part 3) - 1988.
APPARATUS
FIG. 3 : LE-CHATELIER'S TEST APPARATUS
i) The apparatus for conducting the Le-Chatelier test shouldconform to IS: 5514 - 1969
ii) Balance, whose pemissible variation at a load of 1000gshould be +1.0g
iii) Water bath
PROCEDURE
i) Place the mould on a glass sheet and fill it with the cementpaste formed by gauging cement with 0.78 times the waterrequired to give a paste of standard consistency (seePara 1.2).
7
ii) Cover the mould with another piece of glass sheet, place asmall weight on this covering glass sheet and immediatelysubmerge the whole assembly in water at a temperature of27 ± 2oC and keep it there for 24hrs.
iii) Measure the distance separating the indicator points to thenearest 0.5mm (say d
l ).
iv) Submerge the mould again in water at the temperatureprescribed above. Bring the water to boiling point in 25 to 30minutes and keep it boiling for 3hrs.
v) Remove the mould from the water, allow it to cool andmeasure the distance between the indicator points (say d
2 ).
vi) (d 2 – d
l ) represents the expansion of cement.
REPORTING OF RESULTS
Calculate the mean of the two values to the nearest 0.5mm torepresent the expansion of cement.
8
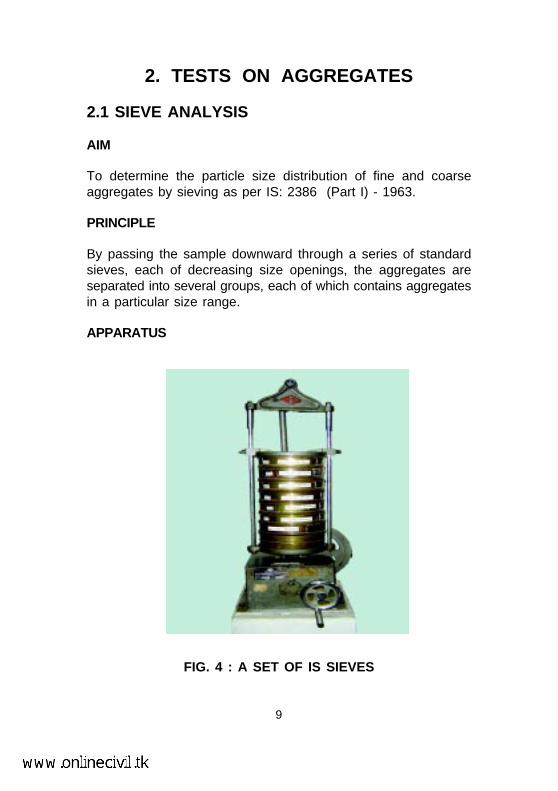
2. TESTS ON AGGREGATES
2.1 SIEVE ANALYSIS
AIM
To determine the particle size distribution of fine and coarseaggregates by sieving as per IS: 2386 (Part I) - 1963.
PRINCIPLE
By passing the sample downward through a series of standardsieves, each of decreasing size openings, the aggregates areseparated into several groups, each of which contains aggregatesin a particular size range.
APPARATUS
FIG. 4 : A SET OF IS SIEVES
9
i) A set of IS Sieves of sizes - 80mm, 63mm, 50mm, 40mm,31.5mm, 25mm, 20mm, 16mm, 12.5mm, 10mm, 6.3mm,4.75mm, 3.35mm, 2.36mm, 1.18mm, 600µm, 300µm, 150µmand 75µm
ii) Balance or scale with an accuracy to measure 0.1 percentof the weight of the test sample
SAMPLE
The weight of sample available should not be less than theweight given below:-
Maximum size present Minimum weight ofin substantial sample despatched
proportions for testing(mm) (kg)
63 100
50 100
40 50
25 50
20 25
16 25
12.5 12
10.0 6
6.3 3
The sample for sieving should be prepared from the larger sampleeither by quartering or by means of a sample divider.
PROCEDURE
i) The test sample is dried to a constant weight at atemperature of 110 + 5
oC and weighed.
10
ii) The sample is sieved by using a set of IS Sieves.
iii) On completion of sieving, the material on each sieve isweighed.
iv) Cumulative weight passing through each sieve is calculatedas a percentage of the total sample weight.
v) Fineness modulus is obtained by adding cumulativepercentage of aggregates retained on each sieve and dividingthe sum by 100.
REPORTING OF RESULTS
The results should be calculated and reported as:
i) the cumulative percentage by weight of the total sample
ii) the percentage by weight of the total sample passingthrough one sieve and retained on the next smaller sieve, tothe nearest 0.1 percent.
The results of the sieve analysis may be recorded graphically ona semi-log graph with particle size as abscissa (log scale) andthe percentage smaller than the specified diameter as ordinate.A sample chart is provided on page 12.
11

12
Not
e -
The
ver
tical
sca
le o
f th
is c
hart
is
an a
rithm
etic
sca
le a
nd t
he h
oriz
onta
l sc
ale
is l
ogar
ithm
ic.
CH
AR
T F
OR
RE
CO
RD
ING
SIE
VE
AN
AL
YS
IS R
ES
UL
TS
SIE
VE
SIZ
ES
PERCENTAGE PASSING
75
AP
ER
TUR
E S
IZE
IN M
ICR
ON
S→
←A
PE
RTU
RE
SIZ
E IN
MIL
LIM
ETR
ES
→←
15
03
00
60
01.
182.
364.
751
01
62
55
08
021
242
585
01.
703.
356.
312
.52
04
06
3020
40
60
80
100
2.2 WATER ABSORPTION
AIM
To determine the water absorption of coarse aggregates as perIS: 2386 (Part III) - 1963.
APPARATUS
i) Wire basket - perforated, electroplated or plastic coated withwire hangers for suspending it from the balance
ii) Water-tight container for suspending the basket
iii) Dry soft absorbent cloth - 75cm x 45cm (2 nos.)
iv) Shallow tray of minimum 650 sq.cm area
v) Air-tight container of a capacity similar to the basket
vi) Oven
SAMPLE
A sample not less than 2000g should be used.
PROCEDURE
i) The sample should be thoroughly washed to remove finerparticles and dust, drained and then placed in the wirebasket and immersed in distilled water at a temperaturebetween 22 and 32
oC.
ii) After immersion, the entrapped air should be removed bylifting the basket and allowing it to drop 25 times in 25seconds. The basket and sample should remain immersedfor a period of 24 + ½ hrs. afterwards.
iii) The basket and aggregates should then be removed from thewater, allowed to drain for a few minutes, after which the
13
14
aggregates should be gently emptied from the basket on toone of the dry clothes and gently surface-dried with thecloth, transferring it to a second dry cloth when the firstwould remove no further moisture. The aggregates should bespread on the second cloth and exposed to the atmosphereaway from direct sunlight till it appears to be completelysurface-dry. The aggregates should be weighed (Weight 'A').
iv) The aggregates should then be placed in an oven at atemperature of 100 to 110
oC for 24hrs. It should then be
removed from the oven, cooled and weighed (Weight 'B').
REPORTING OF RESULTS
A - B Water absorption = ———– x 100%
B
Two such tests should be done and the individual and meanresults should be reported.
A sample proforma for the record of the test results is given inAnnexure-I.
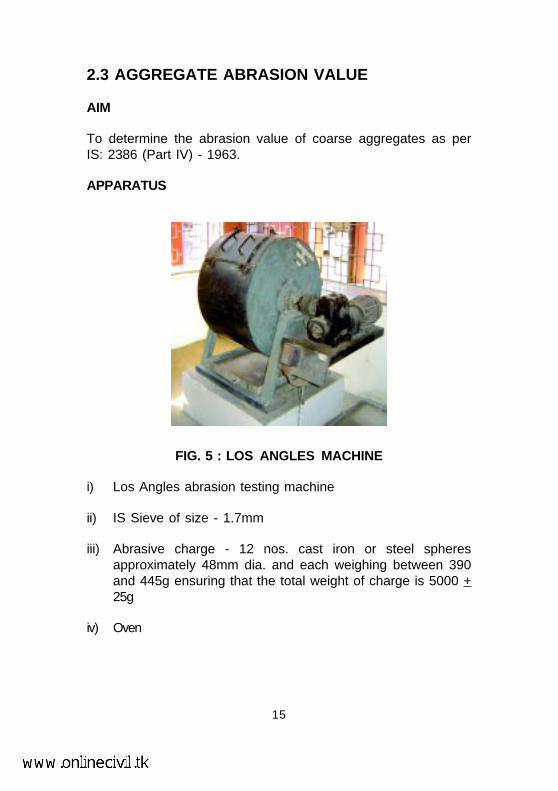
2.3 AGGREGATE ABRASION VALUE
AIM
To determine the abrasion value of coarse aggregates as perIS: 2386 (Part IV) - 1963.
APPARATUS
FIG. 5 : LOS ANGLES MACHINE
i) Los Angles abrasion testing machine
ii) IS Sieve of size - 1.7mm
iii) Abrasive charge - 12 nos. cast iron or steel spheresapproximately 48mm dia. and each weighing between 390and 445g ensuring that the total weight of charge is 5000 +25g
iv) Oven
15
16
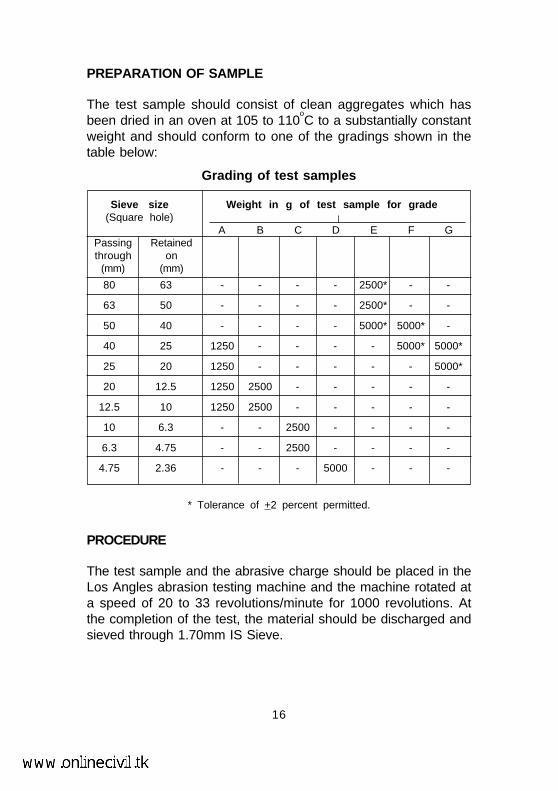
PREPARATION OF SAMPLE
The test sample should consist of clean aggregates which hasbeen dried in an oven at 105 to 110
oC to a substantially constant
weight and should conform to one of the gradings shown in thetable below:
PROCEDURE
The test sample and the abrasive charge should be placed in theLos Angles abrasion testing machine and the machine rotated ata speed of 20 to 33 revolutions/minute for 1000 revolutions. Atthe completion of the test, the material should be discharged andsieved through 1.70mm IS Sieve.
Grading of test samples
Sieve size Weight in g of test sample for grade(Square hole)
A B C D E F GPassing Retainedthrough on
(mm) (mm)
80 63 - - - - 2500* - -
63 50 - - - - 2500* - -
50 40 - - - - 5000* 5000* -
40 25 1250 - - - - 5000* 5000*
25 20 1250 - - - - - 5000*
20 12.5 1250 2500 - - - - -
12.5 10 1250 2500 - - - - -
10 6.3 - - 2500 - - - -
6.3 4.75 - - 2500 - - - -
4.75 2.36 - - - 5000 - - -
* Tolerance of +2 percent permitted.
17
REPORTING OF RESULTS
i) The material coarser than 1.70mm IS Sieve should bewashed, dried in an oven at a temperature of 100 to 110
oC to
a constant weight and weighed (Weight 'B').
ii) The proportion of loss between weight 'A' and weight 'B' ofthe test sample should be expressed as a percentage of theoriginal weight of the test sample. This value should bereported as,
A - BAggregate abrasion value = ———– x 100%
A
A sample proforma for the record of the test results is given inAnnexure-II.
18
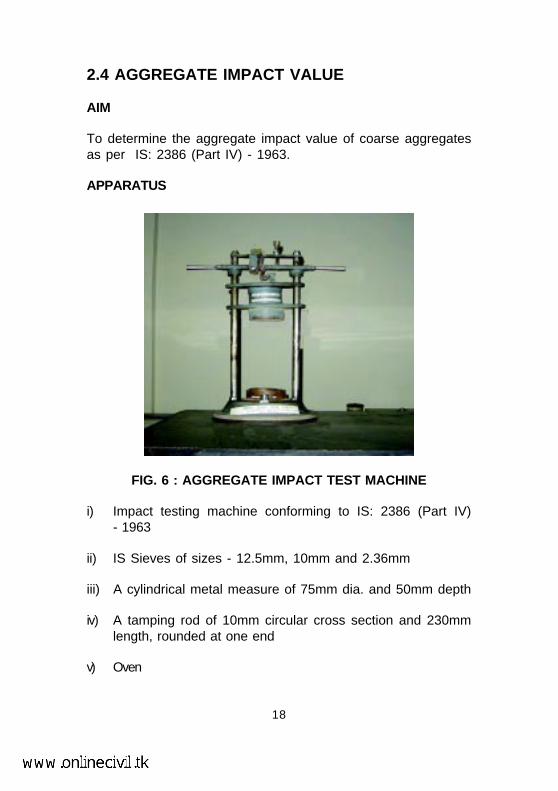
2.4 AGGREGATE IMPACT VALUE
AIM
To determine the aggregate impact value of coarse aggregatesas per IS: 2386 (Part IV) - 1963.
APPARATUS
FIG. 6 : AGGREGATE IMPACT TEST MACHINE
i) Impact testing machine conforming to IS: 2386 (Part IV)- 1963
ii) IS Sieves of sizes - 12.5mm, 10mm and 2.36mm
iii) A cylindrical metal measure of 75mm dia. and 50mm depth
iv) A tamping rod of 10mm circular cross section and 230mmlength, rounded at one end
v) Oven
PREPARATION OF SAMPLE
i) The test sample should conform to the following grading:
- Passing through 12.5mm IS Sieve 100%
- Retention on 10mm IS Sieve 100%
ii) The sample should be oven-dried for 4hrs. at a temperatureof 100 to 110
oC and cooled.
iii) The measure should be about one-third full with the preparedaggregates and tamped with 25 strokes of the tamping rod.A further similar quantity of aggregates should be added anda further tamping of 25 strokes given. The measure shouldfinally be filled to overflow, tamped 25 times and the surplusaggregates struck off, using a tamping rod as a straightedge. The net weight of the aggregates in the measureshould be determined to the nearest gram (Weight 'A').
PROCEDURE
i) The cup of the impact testing machine should be fixed firmlyin position on the base of the machine and the whole of thetest sample placed in it and compacted by 25 strokes of thetamping rod.
ii) The hammer should be raised to 380mm above the uppersurface of the aggregates in the cup and allowed to fallfreely onto the aggregates. The test sample should besubjected to a total of 15 such blows, each being deliveredat an interval of not less than one second.
REPORTING OF RESULTS
i) The sample should be removed and sieved through a2.36mm IS Sieve. The fraction passing through should beweighed (Weight 'B'). The fraction retained on the sieveshould also be weighed (Weight 'C') and if the total weight
19
(B+C) is less than the initial weight (A) by more than onegram, the result should be discarded and a fresh test done.
ii) The ratio of the weight of the fines formed to the totalsample weight should be expressed as a percentage.
BAggregate impact value = ——– x 100%
A
iii) Two such tests should be carried out and the mean of theresults should be reported.
A sample proforma for the record of the test results is given inAnnexure-III.
20
2.5 AGGREGATE CRUSHING VALUE
AIM
To determine the aggregate crushing value of coarse aggregatesas per IS: 2386 (Part IV) - 1963.
APPARATUS
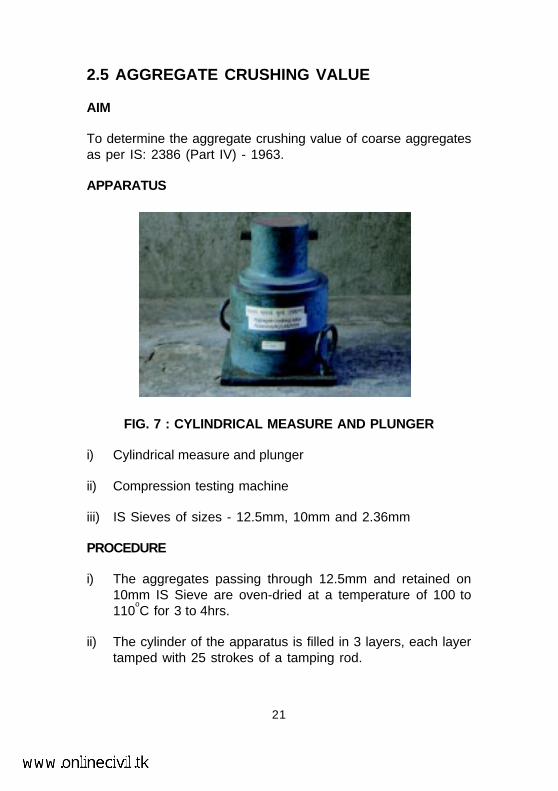
FIG. 7 : CYLINDRICAL MEASURE AND PLUNGER
i) Cylindrical measure and plunger
ii) Compression testing machine
iii) IS Sieves of sizes - 12.5mm, 10mm and 2.36mm
PROCEDURE
i) The aggregates passing through 12.5mm and retained on10mm IS Sieve are oven-dried at a temperature of 100 to110
oC for 3 to 4hrs.
ii) The cylinder of the apparatus is filled in 3 layers, each layertamped with 25 strokes of a tamping rod.
21
iii) The weight of aggregates is measured (Weight 'A').
iv) The surface of the aggregates is then levelled and theplunger inserted. The apparatus is then placed in thecompression testing machine and loaded at a uniform rateso as to achieve 40t load in 10 minutes. After this, the loadis released.
v) The sample is then sieved through a 2.36mm IS Sieve andthe fraction passing through the sieve is weighed (Weight'B').
vi) Two tests should be conducted.
REPORTING OF RESULTS
BAggregate crushing value = —— x 100%
A
The result should be recorded to the first decimal place and themean of the two results reported.
22
3. TESTS ON FRESH CONCRETE
3.1 WORKABILITY
3.1.1 SLUMP
AIM
To determine the workability of fresh concrete by slump test asper IS: 1199 - 1959.
APPARATUS
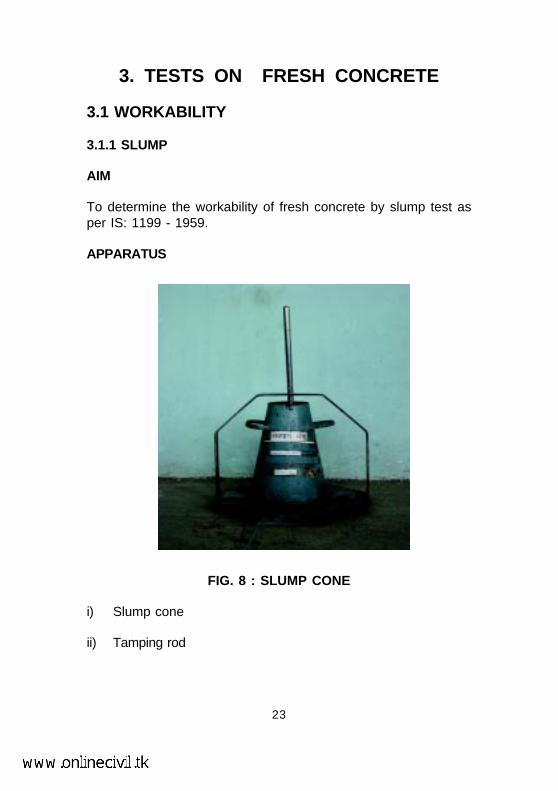
FIG. 8 : SLUMP CONE
i) Slump cone
ii) Tamping rod
23
PROCEDURE
i) The internal surface of the mould is thoroughly cleaned andapplied with a light coat of oil.
ii) The mould is placed on a smooth, horizontal, rigid and non-absorbent surface.
iii) The mould is then filled in four layers with freshly mixedconcrete, each approximately to one-fourth of the height ofthe mould.
iv) Each layer is tamped 25 times by the rounded end of thetamping rod (strokes are distributed evenly over the cross-section).
v) After the top layer is rodded, the concrete is struck off thelevel with a trowel.
vi) The mould is removed from the concrete immediately byraising it slowly in the vertical direction.
vii) The difference in level between the height of the mould andthat of the highest point of the subsided concrete ismeasured.
viii) This difference in height in mm is the slump of the concrete.
REPORTING OF RESULTS
The slump measured should be recorded in mm of subsidence ofthe specimen during the test. Any slump specimen, whichcollapses or shears off laterally gives incorrect result and if thisoccurs, the test should be repeated with another sample. If, inthe repeat test also, the specimen shears, the slump should bemeasured and the fact that the specimen sheared, should berecorded.
24
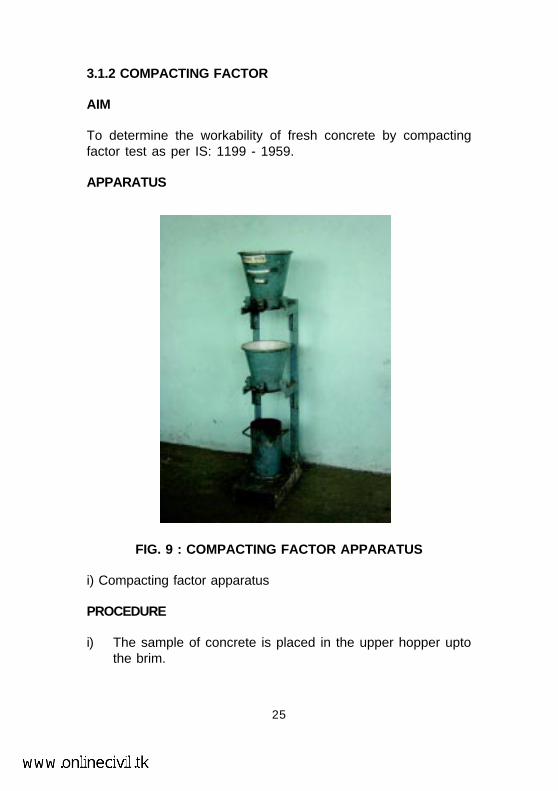
3.1.2 COMPACTING FACTOR
AIM
To determine the workability of fresh concrete by compactingfactor test as per IS: 1199 - 1959.
APPARATUS
FIG. 9 : COMPACTING FACTOR APPARATUS
i) Compacting factor apparatus
PROCEDURE
i) The sample of concrete is placed in the upper hopper uptothe brim.
25
ii) The trap-door is opened so that the concrete falls into thelower hopper.
iii) The trap-door of the lower hopper is opened and theconcrete is allowed to fall into the cylinder.
iv) The excess concrete remaining above the top level of thecylinder is then cut off with the help of plane blades.
v) The concrete in the cylinder is weighed. This is known asweight of partially compacted concrete.
vi) The cylinder is filled with a fresh sample of concrete andvibrated to obtain full compaction. The concrete in thecylinder is weighed again. This weight is known as theweight of fully compacted concrete.
REPORTING OF RESULTS
Compacting factor =
Weight of partially compacted concrete
Weight of fully compacted concrete
It should normally be stated to the nearest second decimalplace.
26
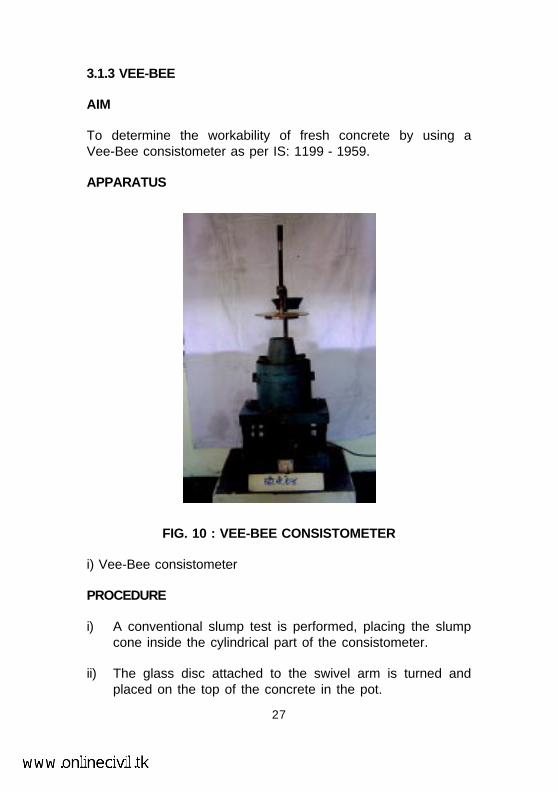
3.1.3 VEE-BEE
AIM
To determine the workability of fresh concrete by using aVee-Bee consistometer as per IS: 1199 - 1959.
APPARATUS
FIG. 10 : VEE-BEE CONSISTOMETER
i) Vee-Bee consistometer
PROCEDURE
i) A conventional slump test is performed, placing the slumpcone inside the cylindrical part of the consistometer.
ii) The glass disc attached to the swivel arm is turned andplaced on the top of the concrete in the pot.
27
iii) The electrical vibrator is switched on and a stop-watch isstarted, simultaneously.
iv) Vibration is continued till the conical shape of the concretedisappears and the concrete assumes a cylindrical shape.
v) When the concrete fully assumes a cylindrical shape, thestop-watch is switched off immediately. The time is noted.
REPORTING OF RESULTS
The consistency of the concrete should be expressed inVB-degrees, which is equal to the time in seconds, recorded inPara v), above.
28
4. TESTS ON HARDENED CONCRETE
4.1 NON-DESTRUCTIVE TESTS
4.1.1 REBOUND HAMMER
AIM
To assess the likely compresive strength of concrete by usingrebound hammer as per IS: 13311 (Part 2) - 1992.
PRINCIPLE
The rebound of an elastic mass depends on the hardness of thesurface against which its mass strikes. When the plunger of therebound hammer is pressed against the surface of the concrete,the spring-controlled mass rebounds and the extent of such arebound depends upon the surface hardness of the concrete. Thesurface hardness and therefore the rebound is taken to berelated to the compressive strength of the concrete. The reboundvalue is read from a graduated scale and is designated as therebound number or rebound index. The compressive strength canbe read directly from the graph provided on the body of thehammer.
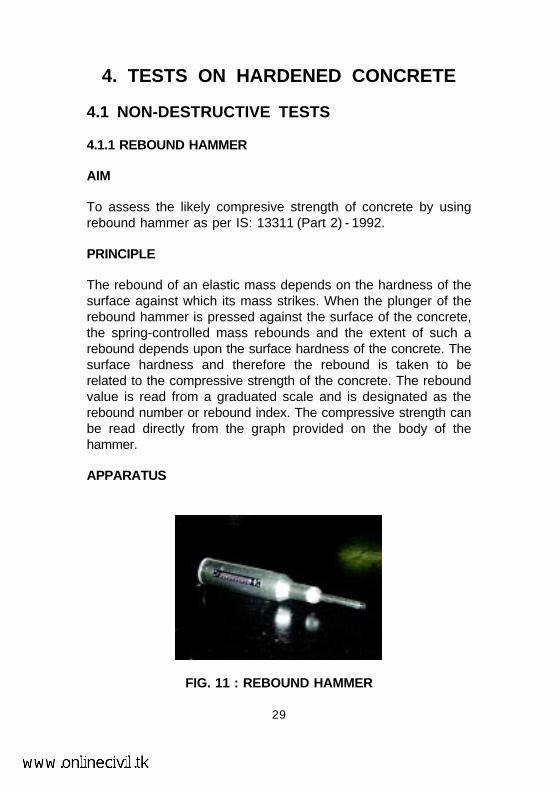
APPARATUS
FIG. 11 : REBOUND HAMMER
29
i) Rebound hammer
PROCEDURE
i) Before commencement of a test, the rebound hammershould be tested against the test anvil, to get reliableresults, for which the manufacturer of the rebound hammerindicates the range of readings on the anvil suitable fordifferent types of rebound hammer.
ii) Apply light pressure on the plunger - it will release it fromthe locked position and allow it to extend to the readyposition for the test.
iii) Press the plunger against the surface of the concrete,keeping the instrument perpendicular to the test surface.Apply a gradual increase in pressure until the hammerimpacts. (Do not touch the button while depressing theplunger. Press the button after impact, in case it is notconvenient to note the rebound reading in that position.)
iv) Take the average of about 15 readings.
INTERPRETATION OF RESULTS
The rebound reading on the indicator scale has been calibratedby the manufacturer of the rebound hammer for horizontalimpact, that is, on a vertical surface, to indicate the compressivestrength. When used in any other position, appropriate correctionas given by the manufacturer is to be taken into account.
30
4.1.2 ULTRASONIC PULSE VELOCITY
AIM
To assess the quality of concrete by ultrasonic pulse velocitymethod as per IS: 13311 (Part 1) - 1992.
PRINCIPLE
The method consists of measuring the time of travel of anultrasonic pulse passing through the concrete being tested.Comparatively higher velocity is obtained when concrete qualityis good in terms of density, uniformity, homogeneity etc.
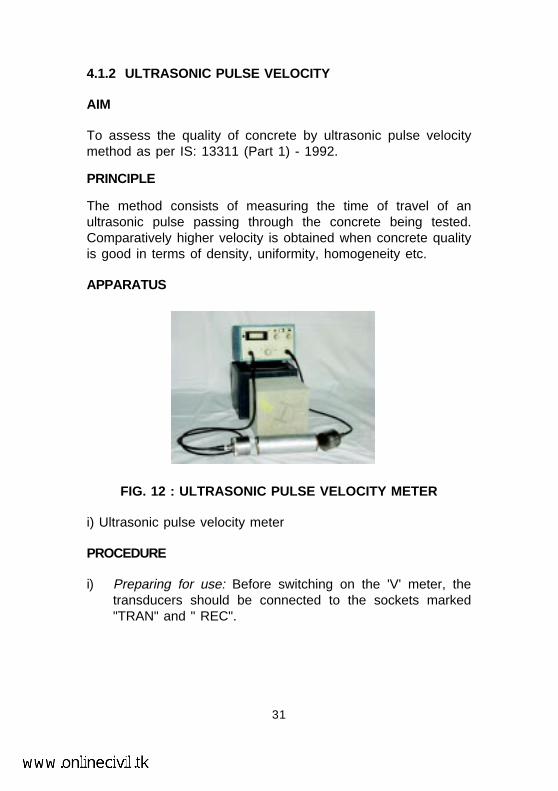
APPARATUS
FIG. 12 : ULTRASONIC PULSE VELOCITY METER
i) Ultrasonic pulse velocity meter
PROCEDURE
i) Preparing for use: Before switching on the 'V' meter, thetransducers should be connected to the sockets marked"TRAN" and " REC".
31
The 'V' meter may be operated with either:
a) the internal battery,
b) an external battery or
c) the A.C line.
ii) Set reference: A reference bar is provided to check theinstrument zero. The pulse time for the bar is engraved on it.Apply a smear of grease to the transducer faces beforeplacing it on the opposite ends of the bar. Adjust the 'SETREF' control until the reference bar transit time is obtainedon the instrument read-out.
iii) Range selection: For maximum accuracy, it isrecommended that the 0.1 microsecond range be selectedfor path length upto 400mm.
iv) Pulse velocity: Having determined the most suitable testpoints on the material to be tested, make carefulmeasurement of the path length ‘L’. Apply couplant to thesurfaces of the transducers and press it hard onto thesurface of the material. Do not move the transducers while areading is being taken, as this can generate noise signalsand errors in measurements. Continue holding thetransducers onto the surface of the material until aconsistent reading appears on the display, which is the timein microsecond for the ultrasonic pulse to travel the distance'L'.
The mean value of the display readings should be takenwhen the units digit hunts between two values.
Pulse velocity =
Path length
Travel time
32
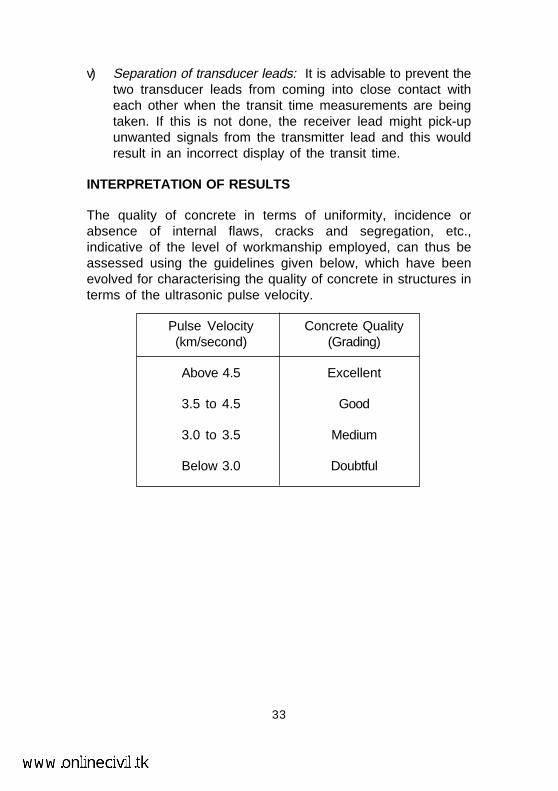
v) Separation of transducer leads: It is advisable to prevent thetwo transducer leads from coming into close contact witheach other when the transit time measurements are beingtaken. If this is not done, the receiver lead might pick-upunwanted signals from the transmitter lead and this wouldresult in an incorrect display of the transit time.
INTERPRETATION OF RESULTS
The quality of concrete in terms of uniformity, incidence orabsence of internal flaws, cracks and segregation, etc.,indicative of the level of workmanship employed, can thus beassessed using the guidelines given below, which have beenevolved for characterising the quality of concrete in structures interms of the ultrasonic pulse velocity.
Pulse Velocity Concrete Quality(km/second) (Grading)
Above 4.5 Excellent
3.5 to 4.5 Good
3.0 to 3.5 Medium
Below 3.0 Doubtful
33
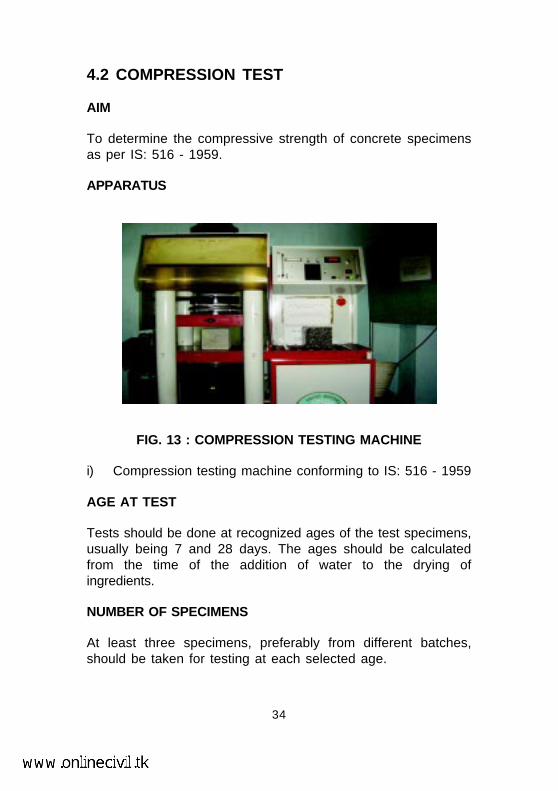
4.2 COMPRESSION TEST
AIM
To determine the compressive strength of concrete specimensas per IS: 516 - 1959.
APPARATUS
FIG. 13 : COMPRESSION TESTING MACHINE
i) Compression testing machine conforming to IS: 516 - 1959
AGE AT TEST
Tests should be done at recognized ages of the test specimens,usually being 7 and 28 days. The ages should be calculatedfrom the time of the addition of water to the drying ofingredients.
NUMBER OF SPECIMENS
At least three specimens, preferably from different batches,should be taken for testing at each selected age.
34
PROCEDURE
i) The specimens, prepared according to IS: 516 - 1959 andstored in water, should be tested immediately on removalfrom the water and while still in wet condition. Specimenswhen received dry should be kept in water for24hrs. before they are taken for testing. The dimensions ofthe specimens, to the nearest 0.2mm and their weightshould be noted before testing.
ii) The bearing surfaces of the compression testing machineshould be wiped clean and any loose sand or other materialremoved from the surfaces of the specimen, which would bein contact with the compression platens.
iii) In the case a of cubical specimen, the specimen should beplaced in the machine in such a manner that the load couldbe applied to the opposite sides of the cubes, not to thetop and the bottom. The axis of the specimen should becarefully aligned with the centre of thrust of the sphericallyseated platen. No packing should be used between thefaces of the test specimen and the steel platen of thetesting machine. As the spherically seated block is broughtto rest on the specimen, the movable portion should berotated gently by hand so that uniform seating is obtained.
iv) The load should be applied without shock and increasedcontinuosly at a rate of approximately 140kg/sq.cm/minuteuntil the resistance of the specimen to the increasing loadbreaks down and no greater load can be sustained. Themaximum load applied to the specimen should then berecorded and the appearance of the concrete and anyunusual features in the type of failure should be noted.
CALCULATION
The measured compressive strength of the specimen should becalculated by dividing the maximum load applied to thespecimen during the test by the cross - sectional area,
35
calculated from the mean dimensions of the section and shouldbe expressed to the nearest kg/sq.cm. An average of threevalues should be taken as the representative of the batch,provided the individual variation is not more than ±15% of theaverage. Otherwise repeat tests should be done.
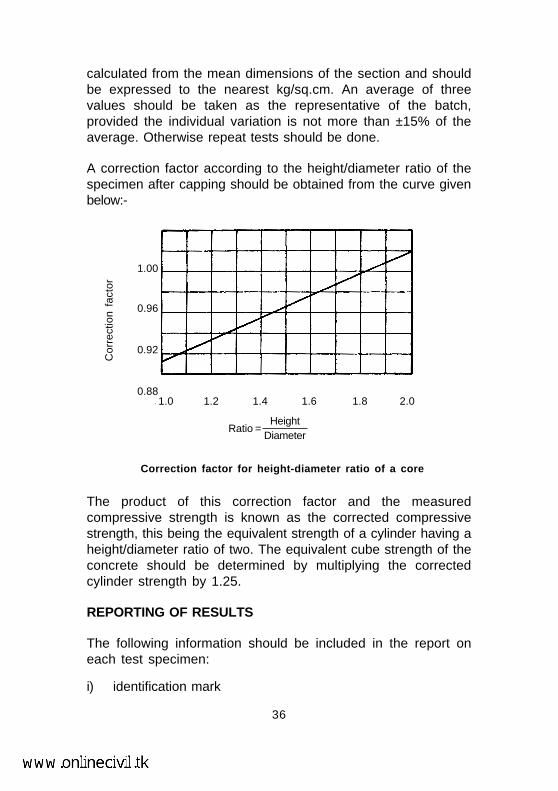
A correction factor according to the height/diameter ratio of thespecimen after capping should be obtained from the curve givenbelow:-
The product of this correction factor and the measuredcompressive strength is known as the corrected compressivestrength, this being the equivalent strength of a cylinder having aheight/diameter ratio of two. The equivalent cube strength of theconcrete should be determined by multiplying the correctedcylinder strength by 1.25.
REPORTING OF RESULTS
The following information should be included in the report oneach test specimen:
i) identification mark
36
1.00
0.96
0.92
0.881.0 1.2 1.4 1.6 1.8 2.0
Correction factor for height-diameter ratio of a core
Cor
rect
ion
fact
or
Ratio =Height
Diameter
ii) date of test
iii) age of specimen
iv) curing conditions, including date of manufacture ofspecimen
v) weight of specimen
vi) dimensions of specimen
vii) cross-sectional area
viii) maximum load
ix) compressive strength
x) appearance of fractured faces of concrete and type offracture, if unusual.
37
5. TESTS ON SOIL
5.1 WATER CONTENT
5.1.1 OVEN DRYING METHOD
AIM
To determine the water content in soil by oven drying method asper IS: 2720 (Part II) - 1973.
PRINCIPLE
The water content (w) of a soil sample is equal to the mass ofwater divided by the mass of solids.
APPARATUS
FIG. 14 : ELECTRIC OVEN
i) Thermostatically controlled oven maintained at a temperatureof 110 ± 5oC
38
ii) Weighing balance, with an accuracy of 0.04% of the weightof the soil taken
iii) Air-tight container made of non-corrodible material with lid
iv) Tongs
SAMPLE
The soil specimen should be representative of the soil mass. Thequantity of the specimen taken would depend upon the gradationand the maximum size of particles as under:
Size of particles more than Minimum quantity of the soil90 percent passing through specimen to be taken for
IS Sieve test (g)
425µm 25
2.0mm 50
4.75mm 200
9.50mm 300
19mm 500
37.5mm 1000
PROCEDURE
i) Clean the container, dry it and weigh it with the lid (Weight'W
1').
ii) Take the required quantity of the wet soil specimen in thecontainer and weigh it with the lid (Weight 'W2').
iii) Place the container, with its lid removed, in the oven till itsweight becomes constant (Normally for 24hrs.).
39
iv) When the soil has dried, remove the container from theoven, using tongs.
v) Find the weight 'W3' of the container with the lid and the dry
soil sample.
REPORTING OF RESULTS
The water content %10013
32 ×−−
=WW
WWw
An average of three determinations should be taken.
A sample proforma for the record of the test results is given inAnnexure-IV.
40
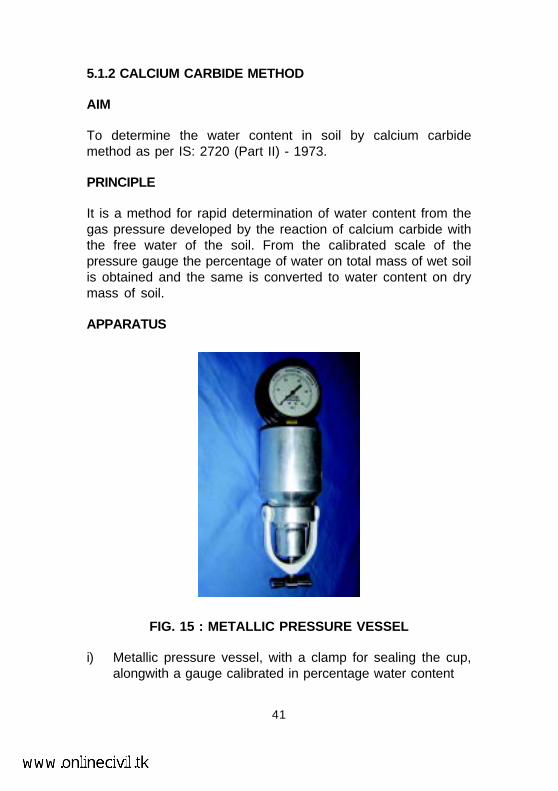
5.1.2 CALCIUM CARBIDE METHOD
AIM
To determine the water content in soil by calcium carbidemethod as per IS: 2720 (Part II) - 1973.
PRINCIPLE
It is a method for rapid determination of water content from thegas pressure developed by the reaction of calcium carbide withthe free water of the soil. From the calibrated scale of thepressure gauge the percentage of water on total mass of wet soilis obtained and the same is converted to water content on drymass of soil.
APPARATUS
FIG. 15 : METALLIC PRESSURE VESSEL
i) Metallic pressure vessel, with a clamp for sealing the cup,alongwith a gauge calibrated in percentage water content
41
ii) Counterpoised balance, for weighing the sample
iii) Scoop, for measuring the absorbent (Calcium Carbide)
iv) Steel balls - 3 steel balls of about 12.5mm dia. and 1 steelball of 25mm dia.
v) One bottle of the absorbent (Calcium Carbide)
PREPARATION OF SAMPLE
Sand - No special preparation. Coarse powders may be groundand pulverized.
Cohesive and plastic soil - Soil is tested with addition of steelball in the pressure vessels.
The test requires about 6g of sample.
PROCEDURE
i) Set up the balance, place the sample in the pan till themark on the balance arm matches with the index mark.
ii) Check that the cup and the body are clean.
iii) Hold the body horizontally and gently deposit the levelled,scoop-full of the absorbent (Calcium Carbide) inside thechamber.
iv) Transfer the weighed soil from the pan to the cup.
v) Hold cup and chamber horizontally, bringing them togetherwithout disturbing the sample and the absorbent.
vi) Clamp the cup tightly into place. If the sample is bulky,reverse the above placement, that is, put the sample in thechamber and the absorbent in the cup.
42
vii) In case of clayey soils, place all the 4 steel balls (3 smallerand 1 bigger) in the body alongwith the absorbent.
viii) Shake the unit up and down vigorously in this position forabout 15 seconds.
ix) Hold the unit horizontally, rotating it for 10 seconds, so thatthe balls roll around the inner circumference of the body.
x) Rest for 20 seconds.
xi) Repeat the above cycle until the pressure gauge reading isconstant and note the reading. Usually it takes 4 to 8minutes to achieve constant reading. This is the watercontent (m) obtained on wet mass basis.
xii) Finally, release the pressure slowly by opening the clampscrew and taking the cup out, empty the contents and cleanthe instrument with a brush.
REPORTING OF RESULTS
The water content on dry mass basis,
%100100
×−
=m
mw
43
5.2 PARTICLE SIZE DISTRIBUTION
AIM
To determine the particle size distribution of soil as per IS: 2720(Part 4) - 1985.
APPARATUS
i) A set of fine IS Sieves of sizes - 2mm, 600µm, 425µm,212µm and 75µm
ii) A set of coarse IS Sieves of sizes - 20mm, 10mm and4.75mm
iii) Weighing balance, with an accuracy of 0.1% of the weight ofsample
iv) Oven
v) Mechanical shaker
vi) Mortar with rubber pestle
vii) Brushes
viii) Trays
PREPARATION OF SAMPLE
i) Soil sample, as received from the field, should be dried in airor in the sun. In wet weather, the drying apparatus may beused in which case the temperature of the sample shouldnot exceed 60
oC. The clod may be broken with wooden
mallet to hasten drying. Tree roots and pieces of barkshould be removed from the sample.
ii) The big clods may be broken with the help of woodenmallet. Care should be taken not to break the individual soilparticles.
iii) A representative soil sample of required quantity as givenbelow is taken and dried in the oven at 105 to 120
oC.
44
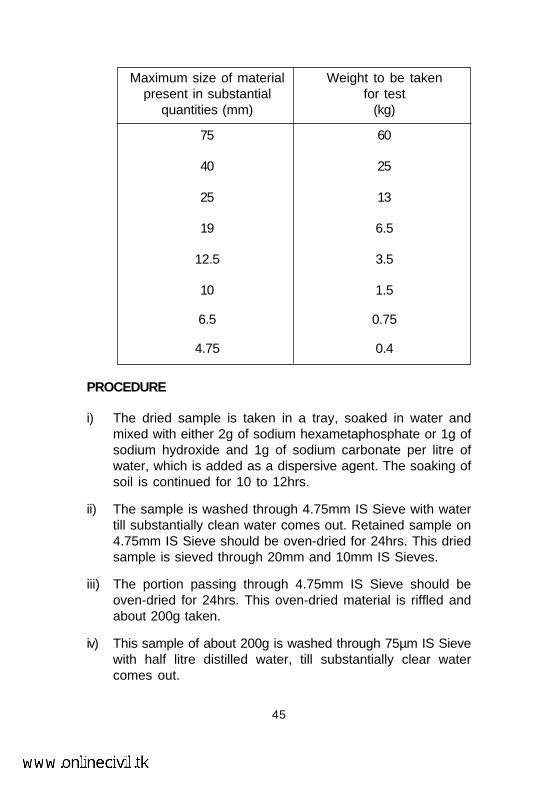
45
Maximum size of material Weight to be takenpresent in substantial for test
quantities (mm) (kg)
75 60
40 25
25 13
19 6.5
12.5 3.5
10 1.5
6.5 0.75
4.75 0.4
PROCEDURE
i) The dried sample is taken in a tray, soaked in water andmixed with either 2g of sodium hexametaphosphate or 1g ofsodium hydroxide and 1g of sodium carbonate per litre ofwater, which is added as a dispersive agent. The soaking ofsoil is continued for 10 to 12hrs.
ii) The sample is washed through 4.75mm IS Sieve with watertill substantially clean water comes out. Retained sample on4.75mm IS Sieve should be oven-dried for 24hrs. This driedsample is sieved through 20mm and 10mm IS Sieves.
iii) The portion passing through 4.75mm IS Sieve should beoven-dried for 24hrs. This oven-dried material is riffled andabout 200g taken.
iv) This sample of about 200g is washed through 75µm IS Sievewith half litre distilled water, till substantially clear watercomes out.
v) The material retained on 75µm IS Sieve is collected anddried in oven at a temperature of 105 to 120
oC for 24hrs. The
dried soil sample is sieved through 2mm, 600µm, 425µmand 212µm IS Sieves. Soil retained on each sieve isweighed.
vi) If the soil passing 75µm is 10% or more, hydrometer methodis used to analyse soil particle size.
HYDROMETER ANALYSIS
i) Particles passed through 75µm IS Sieve alongwith water arecollected and put into a 1000ml jar for hydrometer analysis.More water, if required, is added to make the soil watersuspension just 1000ml. The suspension in the jar isvigorously shaken horizontally by keeping the jar in-betweenthe palms of the two hands. The jar is put on the table.
ii) A graduated hydrometer is carefully inserted into thesuspension with minimum disturbance.
iii) At different time intervals, the density of the suspension atthe centre of gravity of the hydrometer is noted by seeingthe depth of sinking of the stem. The temperature of thesuspension is noted for each recording of the hydrometerreading.
iv) Hydrometer readings are taken at a time interval of0.5 minute, 1.0 minute, 2.0 minutes, 4.0 minutes, 15.0minutes, 45.0 minutes, 90.0 minutes, 3hrs., 6hrs., 24hrs.and 48hrs.
v) By using the nomogram given in IS: 2720 (Part 4) - 1985,the diameter of the particles for different hydrometer readingsis found out.
REPORTING OF RESULTS
After completing mechanical analysis and hydrometer analysis,the results are plotted on a semi-log graph with particle size asabscissa (log scale) and the percentage smaller than thespecified diameter as ordinate (see page 12 for sample chart).
46
5.3 LIQUID LIMIT
AIM
To determine the liquid limit of soil as per IS: 2720 (Part 5)- 1985.
PRINCIPLE
The liquid limit of fine-grained soil is the water content at whichsoil behaves practically like a liquid, but has small shearstrength. It's flow closes the groove in just 25 blows inCasagrande’s liquid limit device.
APPARATUS
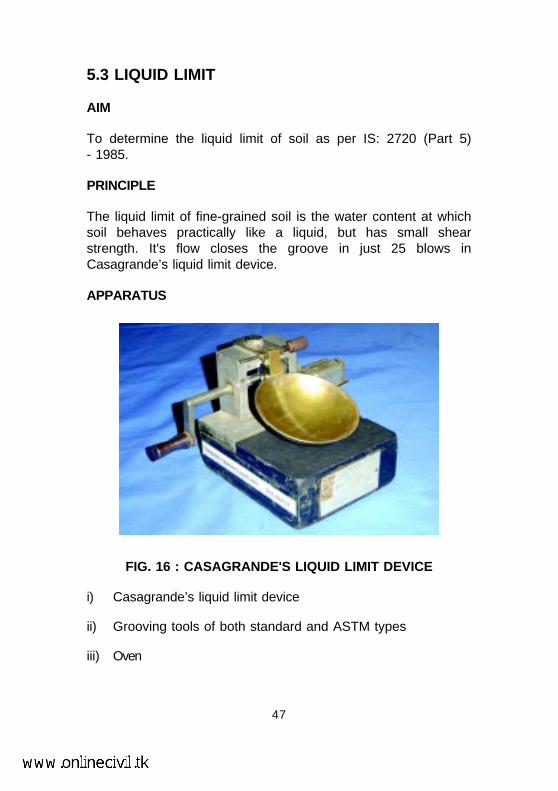
FIG. 16 : CASAGRANDE'S LIQUID LIMIT DEVICE
i) Casagrande’s liquid limit device
ii) Grooving tools of both standard and ASTM types
iii) Oven
47
iv) Evaporating dish
v) Spatula
vi) IS Sieve of size 425µm
vii) Weighing balance, with 0.01g accuracy
viii) Wash bottle
ix) Air-tight and non-corrodible container for determination ofmoisture content
PREPARATION OF SAMPLE
i) Air-dry the soil sample and break the clods. Remove theorganic matter like tree roots, pieces of bark, etc.
ii) About 100g of the specimen passing through 425µm ISSieve is mixed thoroughly with distilled water in theevaporating dish and left for 24hrs. for soaking.
PROCEDURE
i) Place a portion of the paste in the cup of the liquid limitdevice.
ii) Level the mix so as to have a maximum depth of 1cm.
iii) Draw the grooving tool through the sample along thesymmetrical axis of the cup, holding the tool perpendicularto the cup.
iv) For normal fine grained soil: The Casagrande's tool is usedto cut a groove 2mm wide at the bottom, 11mm wide at thetop and 8mm deep.
v) For sandy soil: The ASTM tool is used to cut a groove 2mmwide at the bottom, 13.6mm wide at the top and 10mmdeep.
48
vi) After the soil pat has been cut by a proper grooving tool, thehandle is rotated at the rate of about 2 revolutions persecond and the no. of blows counted, till the two parts ofthe soil sample come into contact for about 10mm length.
vii) Take about 10g of soil near the closed groove and determineits water content (see Para 5.1).
viii) The soil of the cup is transferred to the dish containing thesoil paste and mixed thoroughly after adding a little morewater. Repeat the test.
ix) By altering the water content of the soil and repeating theforegoing operations, obtain at least 5 readings in the rangeof 15 to 35 blows. Don’t mix dry soil to change itsconsistency.
x) Liquid limit is determined by plotting a ‘flow curve’ on asemi-log graph, with no. of blows as abscissa (log scale)and the water content as ordinate and drawing the beststraight line through the plotted points.
xi) Water content corresponding to 25 blows, is the value of theliquid limit.
REPORTING OF RESULTS
Report the water content corresponding to 25 blows, read fromthe 'flow curve' as the liquid limit.
A sample ‘flow curve’ is given in Annexure-V.
49
50
5.4 PLASTIC LIMIT
AIM
To determine the plastic limit of soil as per IS: 2720 (Part 5)- 1985.
PRINCIPLE
The plastic limit of fine-grained soil is the water content of thesoil below which it ceases to be plastic. It begins to crumblewhen rolled into threads of 3mm dia.
APPARATUS
i) Porcelain evaporating dish about 120mm dia.
ii) Spatula
iii) Container to determine moisture content
iv) Balance, with an accuracy of 0.01g
v) Oven
vi) Ground glass plate - 20cm x 15cm
vii) Rod - 3mm dia. and about 10cm long
PREPARATION OF SAMPLE
Take out 30g of air-dried soil from a thoroughly mixed sample ofthe soil passing through 425µm IS Sieve. Mix the soil withdistilled water in an evaporating dish and leave the soil mass fornaturing. This period may be upto 24hrs.
51
PROCEDURE
i) Take about 8g of the soil and roll it with fingers on a glassplate. The rate of rolling should be between 80 to 90 strokesper minute to form a 3mm dia.
ii) If the dia. of the threads can be reduced to less than 3mm,without any cracks appearing, it means that the watercontent is more than its plastic limit. Knead the soil toreduce the water content and roll it into a thread again.
iii) Repeat the process of alternate rolling and kneading until thethread crumbles.
iv) Collect and keep the pieces of crumbled soil thread in thecontainer used to determine the moisture content.
v) Repeat the process at least twice more with fresh samplesof plastic soil each time.
REPORTING OF RESULTS
The plastic limit should be determined for at least three portionsof the soil passing through 425µm IS Sieve. The average watercontent to the nearest whole number should be reported.
52
5.5 FREE SWELL INDEX
AIM
To determine the free swell index of soil as per IS: 2720(Part XL) - 1977.
PRINCIPLE
Free swell or differential free swell, also termed as free swellindex, is the increase in volume of soil without any externalconstraint when subjected to submergence in water.
APPARATUS
i) IS Sieve of size 425µm
ii) Oven
iii) Balance, with an accuracy of 0.01g
iv) Graduated glass cylinder- 2 nos., each of 100ml capacity
PROCEDURE
i) Take two specimens of 10g each of pulverised soil passingthrough 425µm IS Sieve and oven-dry.
ii) Pour each soil specimen into a graduated glass cylinder of100ml capacity.
iii) Pour distilled water in one and kerosene oil in the othercylinder upto 100ml mark.
iv) Remove entrapped air by gently shaking or stirring with aglass rod.
v) Allow the suspension to attain the state of equilibrium (fornot less than 24hrs.).
53
vi) Final volume of soil in each of the cylinder should be readout.
REPORTING OF RESULTS
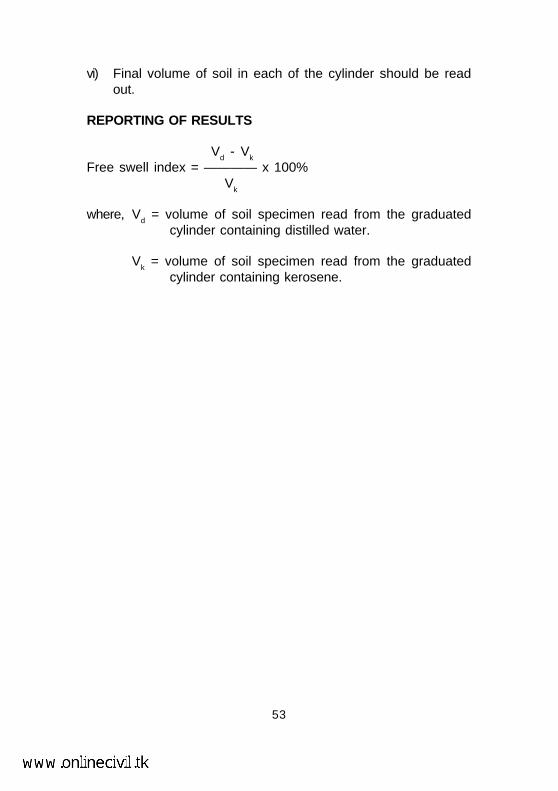
Vd - V
k
Free swell index = ———— x 100% V
k
where, Vd = volume of soil specimen read from the graduated
cylinder containing distilled water.
Vk = volume of soil specimen read from the graduated
cylinder containing kerosene.
5.6 SPECIFIC GRAVITY
AIM
To determine the specific gravity of fine-grained soil by densitybottle method as per IS: 2720 (Part III/Sec 1) - 1980.
PRINCIPLE
Specific gravity is the ratio of the weight in air of a given volumeof a material at a standard temperature to the weight in air of anequal volume of distilled water at the same stated temperature.
APPARATUS
i) Two density bottles of approximately 50ml capacityalongwith stoppers
ii) Constant temperature water bath (27.0 + 0.2oC)
iii) Vacuum desiccator
iv) Oven, capable of maintaining a temperature of 105 to 110oC
v) Weighing balance, with an accuracy of 0.001g
vi) Spatula
PREPARATION OF SAMPLE
The soil sample (50g) should if necessary be ground to passthrough a 2mm IS Sieve. A 5 to 10g sub-sample should beobtained by riffling and oven-dried at a temperature of 105 to110
oC.
PROCEDURE
i) The density bottle alongwith the stopper, should be dried ata temperature of 105 to 110
oC, cooled in the desiccator and
weighed to the nearest 0.001g (W1).
54
ii) The sub-sample, which had been oven-dried should betransferred to the density bottle directly from the desiccatorin which it was cooled. The bottles and contents togetherwith the stopper should be weighed to the nearest 0.001g(W2).
iii) Cover the soil with air-free distilled water from the glasswash bottle and leave for a period of 2 to 3hrs. for soaking.Add water to fill the bottle to about half.
iv) Entrapped air can be removed by heating the density bottleon a water bath or a sand bath.
v) Keep the bottle without the stopper in a vacuum desiccatorfor about 1 to 2hrs. until there is no further loss of air.
vi) Gently stir the soil in the density bottle with a clean glassrod, carefully wash off the adhering particles from the rodwith some drops of distilled water and see that no more soilparticles are lost.
vii) Repeat the process till no more air bubbles are observed inthe soil-water mixture.
viii) Observe the constant temperature in the bottle and record.
ix) Insert the stopper in the density bottle, wipe and weigh(W3
).
x) Now empty the bottle, clean thoroughly and fill the densitybottle with distilled water at the same temperature. Insert thestopper in the bottle, wipe dry from the outside andweigh (W4 ).
xi) Take at least two such observations for the same soil.
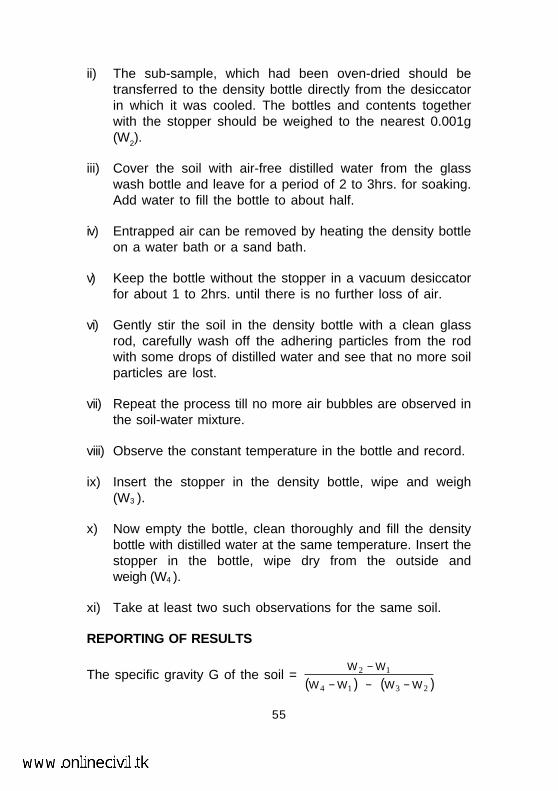
REPORTING OF RESULTS
The specific gravity G of the soil = ( ) ( )2314
12
WWWW
WW
−−−
−
55
The specific gravity should be calculated at a temperature of27oC and reported to the nearest 0.01. If the room temperature isdifferent from 27oC, the following correction should be done:-
G' = kG
where,
G' = Corrected specific gravity at 27oC
k =Relative density of water at room temperature
Relative density of water at 27oC
A sample proforma for the record of the test results is given inAnnexure-VI. Relative density of water at various temperatures,given in Annexure-VII, can be used in the above calculation.
56
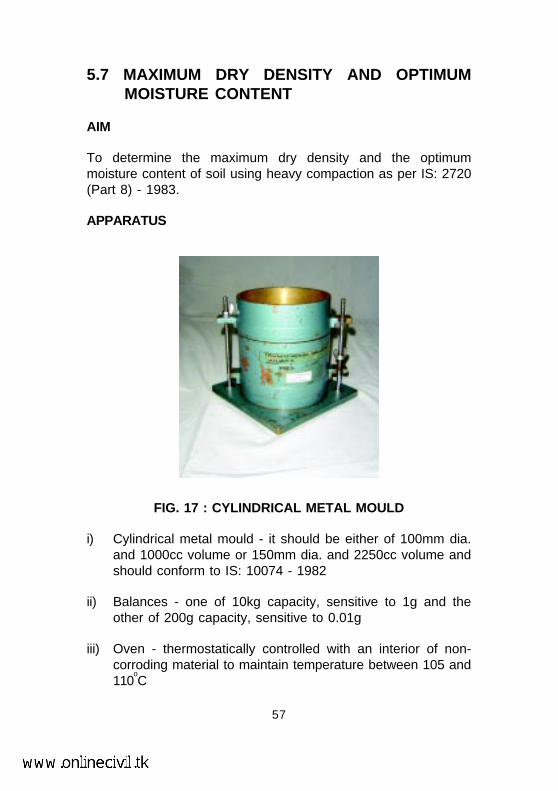
5.7 MAXIMUM DRY DENSITY AND OPTIMUM MOISTURE CONTENT
AIM
To determine the maximum dry density and the optimummoisture content of soil using heavy compaction as per IS: 2720(Part 8) - 1983.
APPARATUS
FIG. 17 : CYLINDRICAL METAL MOULD
i) Cylindrical metal mould - it should be either of 100mm dia.and 1000cc volume or 150mm dia. and 2250cc volume andshould conform to IS: 10074 - 1982
ii) Balances - one of 10kg capacity, sensitive to 1g and theother of 200g capacity, sensitive to 0.01g
iii) Oven - thermostatically controlled with an interior of non-corroding material to maintain temperature between 105 and110
oC
57
iv) Steel straightedge - 30cm long
v) IS Sieves of sizes - 4.75mm, 19mm and 37.5mm
PREPARATION OF SAMPLE
A representative portion of air-dried soil material, large enough toprovide about 6kg of material passing through a 19mm IS Sieve(for soils not susceptible to crushing during compaction) or about15kg of material passing through a 19mm IS Sieve (for soilssusceptible to crushing during compaction), should be taken.This portion should be sieved through a 19mm IS Sieve and thecoarse fraction rejected after its proportion of the total samplehas been recorded.
Aggregations of particles should be broken down so that if thesample was sieved through a 4.75mm IS Sieve, only separatedindividual particles would be retained.
PROCEDURE
A) Soil not susceptible to crushing during compaction –
i) A 5kg sample of air-dried soil passing through the 19mm ISSieve should be taken. The sample should be mixedthoroughly with a suitable amount of water depending on thesoil type (for sandy and gravelly soil - 3 to 5% and forcohesive soil - 12 to 16% below the plastic limit). The soilsample should be stored in a sealed container for aminimum period of 16hrs.
ii) The mould of 1000cc capacity with base plate attached,should be weighed to the nearest 1g (W
1 ). The mould
should be placed on a solid base, such as a concrete flooror plinth and the moist soil should be compacted into themould, with the extension attached, in five layers ofapproximately equal mass, each layer being given 25 blowsfrom the 4.9kg rammer dropped from a height of 450mmabove the soil. The blows should be distributed uniformlyover the surface of each layer. The amount of soil used
58
should be sufficient to fill the mould, leaving not more thanabout 6mm to be struck off when the extension is removed.The extension should be removed and the compacted soilshould be levelled off carefully to the top of the mould bymeans of the straight edge. The mould and soil should thenbe weighed to the nearest gram (W
2).
iii) The compacted soil specimen should be removed from themould and placed onto the mixing tray. The water content(w) of a representative sample of the specimen should bedetermined as in Para 5.1.
iv) The remaining soil specimen should be broken up, rubbedthrough 19mm IS Sieve and then mixed with the remainingoriginal sample. Suitable increments of water should beadded successively and mixed into the sample, and theabove operations i.e. Para ii) to iv) should be repeated foreach increment of water added. The total number ofdeterminations made should be at least five and themoisture contents should be such that the optimummoisture content at which the maximum dry density occurs,lies within that range.
B) Soil susceptible to crushing during compaction –
Five or more 2.5kg samples of air-dried soil passing through the19mm IS Sieve, should be taken. The samples should each bemixed thoroughly with different amounts of water and stored in asealed container as mentioned in Para A) i), above. Follow theoperations given in Para A) ii) to iv), above.
C) Compaction in large size mould –
For compacting soil containing coarse material upto 37.5mmsize, the 2250cc mould should be used. A sample weighingabout 30kg and passing through the 37.5mm IS Sieve is used forthe test. Soil is compacted in five layers, each layer being given55 blows of the 4.9kg rammer. The rest of the procedure is thesame as in Para A) or B), above.
59
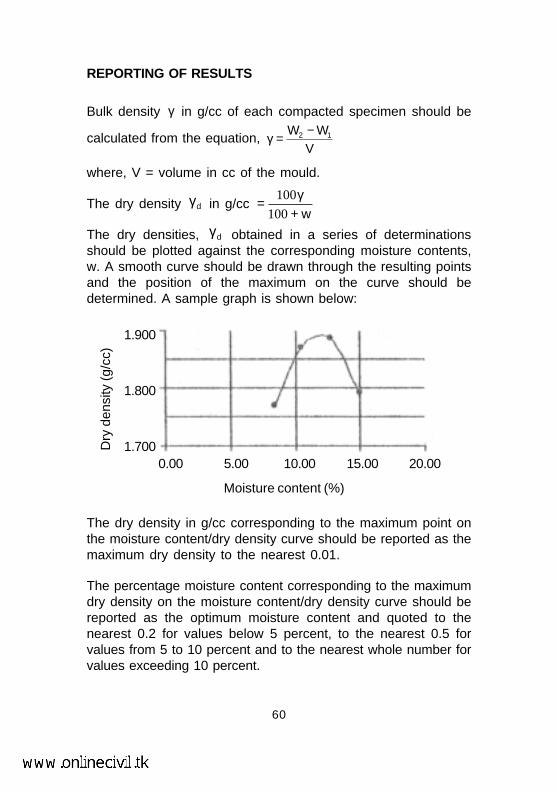
REPORTING OF RESULTS
Bulk density γ in g/cc of each compacted specimen should be
calculated from the equation, V
WW 12 −=γ
where, V = volume in cc of the mould.
The dry density dγ in g/cc w+
γ=100
100
The dry densities, dγ obtained in a series of determinationsshould be plotted against the corresponding moisture contents,w. A smooth curve should be drawn through the resulting pointsand the position of the maximum on the curve should bedetermined. A sample graph is shown below:
The dry density in g/cc corresponding to the maximum point onthe moisture content/dry density curve should be reported as themaximum dry density to the nearest 0.01.
The percentage moisture content corresponding to the maximumdry density on the moisture content/dry density curve should bereported as the optimum moisture content and quoted to thenearest 0.2 for values below 5 percent, to the nearest 0.5 forvalues from 5 to 10 percent and to the nearest whole number forvalues exceeding 10 percent.
60
Dry
den
sity
(g/
cc)
Moisture content (%)
1.900
1.800
1.7000.00 5.00 10.00 15.00 20.00
5.8 IN-SITU DRY DENSITY
5.8.1 CORE CUTTER METHOD
AIM
To determine the in-situ dry density of soil by core cutter methodas per IS: 2720 (Part XXIX) - 1975.
APPARATUS
FIG. 18 : CYLINDRICAL CORE CUTTER
i) Cylindrical core cutter
ii) Steel dolley
iii) Steel rammer
iv) Balance, with an accuracy of 1g
v) Straightedge
61
vi) Square metal tray - 300mm x 300mm x 40mm
vii) Trowel
PROCEDURE
i) The internal volume (V) of the core cutter in cc should becalculated from its dimensions which should be measured tothe nearest 0.25mm.
ii) The core cutter should be weighed to the nearest gram (W1).
iii) A small area, approximately 30cm square of the soil layer tobe tested should be exposed and levelled. The steel dollyshould be placed on top of the cutter and the latter shouldbe rammed down vertically into the soil layer until only about15mm of the dolly protrudes above the surface, care beingtaken not to rock the cutter. The cutter should then be dugout of the surrounding soil, care being taken to allow somesoil to project from the lower end of the cutter. The ends ofthe soil core should then be trimmed flat in level with theends of the cutter by means of the straightedge.
iv) The cutter containing the soil core should be weighed to thenearest gram (W
2).
v) The soil core should be removed from the cutter and arepresentative sample should be placed in an air-tightcontainer and its water content (w) determined as in Para5.1.
REPORTING OF RESULTS
Bulk density of the soil ccgV
WW 12 −=γ
Dry density of the soil ccgwd +
γ=γ100
100
Average of at least three determinations should be reported tothe second place of decimal in g/cc.
A sample proforma for the record of the test results is given inAnnexure-VIII.
62
5.8.2 SAND REPLACEMENT METHOD
AIM
To determine the in-situ dry density of soil by sand replacementmethod as per IS: 2720 (Part XXVIII) – 1974.
APPARATUS
FIG. 19 : SAND-POURING CYLINDER
i) Sand-pouring cylinder conforming to IS: 2720 (Part XXVIII) -1974
ii) Cylindrical calibrating container conforming to IS: 2720 (PartXXVIII) - 1974
iii) Soil cutting and excavating tools such as a scraper tool,bent spoon
iv) Glass plate - 450mm square and 9mm thick or larger
63
v) Metal containers to collect excavated soil
vi) Metal tray - 300mm square and 40mm deep with a 100mmhole in the centre
vii) Balance, with an accuracy of 1g
PROCEDURE
A. Calibration of apparatus
a) The method given below should be followed for thedetermination of the weight of sand in the cone of thepouring cylinder:
i) The pouring cylinder should be filled so that the level of thesand in the cylinder is within about 10mm of the top. Itstotal initial weight (W
1) should be maintained constant
throughout the tests for which the calibration is used. Avolume of sand equivalent to that of the excavated hole inthe soil (or equal to that of the calibrating container) shouldbe allowed to runout of the cylinder under gravity. Theshutter of the pouring cylinder should then be closed andthe cylinder placed on a plain surface, such as a glassplate.
ii) The shutter of the pouring cylinder should be opened andsand allowed to runout. When no further movement of sandtakes place in the cylinder, the shutter should be closedand the cylinder removed carefully.
iii) The sand that had filled the cone of the pouring cylinder(that is, the sand that is left on the plain surface) should becollected and weighed to the nearest gram.
iv) These measurements should be repeated at least thrice andthe mean weight (W
2) taken.
b) The method described below should be followed for thedetermination of the bulk density of the sand ( γ
s ):
64
i) The internal volume (V) in ml of the calibrating containershould be determined from the weight of water contained inthe container when filled to the brim. The volume may alsobe calculated from the measured internal dimensions of thecontainer.
ii) The pouring cylinder should be placed concentrically on thetop of the calibrating container after being filled to theconstant weight (W1) as in Para a) i), above. The shutter ofthe pouring cylinder should be closed during the operation.The shutter should be opened and sand allowed to runout.When no further movement of sand takes place in thecylinder, the shutter should be closed. The pouring cylindershould be removed and weighed to the nearest gram.
iii) These measurements should be repeated at least thrice andthe mean weight (W
3) taken.
B. Measurement of soil density
The following method should be followed for the measurement ofsoil density:
i) A flat area, approximately 450sq.mm of the soil to betested should be exposed and trimmed down to a levelsurface, preferably with the aid of the scraper tool.
ii) The metal tray with a central hole should be laid on theprepared surface of the soil with the hole over the portion ofthe soil to be tested. The hole in the soil should then beexcavated using the hole in the tray as a pattern, to thedepth of the layer to be tested upto a maximum of 150mm.The excavated soil should be carefully collected, leaving noloose material in the hole and weighed to the nearest gram(W
w). The metal tray should be removed before the pouring
cylinder is placed in position over the excavated hole.
iii) The water content (w) of the excavated soil should be deter-mined by the method specified in Para 5.1. Alternatively, thewhole of the excavated soil should be dried and weighed(W
d).
65
iv) The pouring cylinder, filled to the constant weight (W1) as in
Para A.a) i) above, should be so placed that the base of thecylinder covers the hole concentrically. The shutter shouldthen be opened and sand allowed to runout into the hole.The pouring cylinder and the surrounding area should not bevibrated during this period. When no further movement ofsand takes place, the shutter should be closed. Thecylinder should be removed and weighed to the nearestgram (W
4).
CALCULATIONS
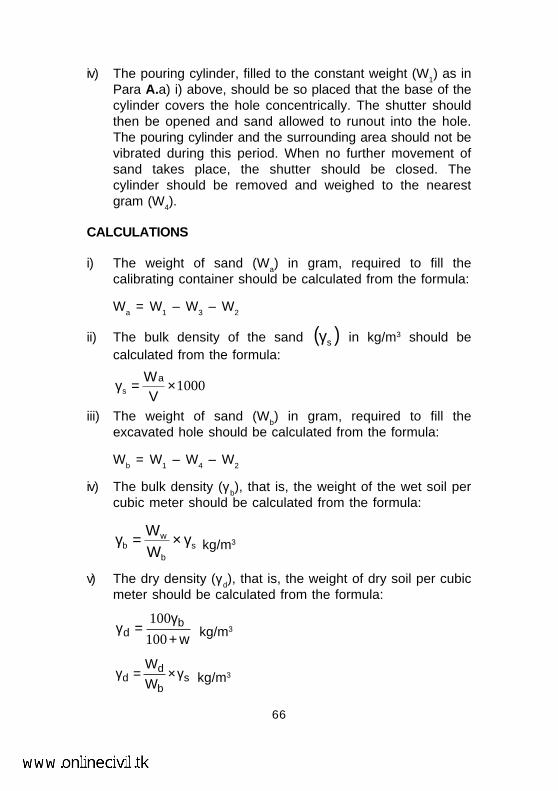
i) The weight of sand (Wa) in gram, required to fill the
calibrating container should be calculated from the formula:
Wa = W
1 – W
3 – W
2
ii) The bulk density of the sand ( )sγ in kg/m3 should becalculated from the formula:
1000×=γV
Was
iii) The weight of sand (Wb) in gram, required to fill the
excavated hole should be calculated from the formula:
Wb = W
1 – W
4 – W
2
iv) The bulk density (γ b), that is, the weight of the wet soil per
cubic meter should be calculated from the formula:
sb
wb W
W γ×=γ kg/m3
v) The dry density (γ d), that is, the weight of dry soil per cubic
meter should be calculated from the formula:
wb
d +γ
=γ100
100 kg/m3
sb
dd W
Wγ×=γ kg/m3
66
REPORTING OF RESULTS
The following values should be reported:
i) dry density of soil in kg/m3 to the nearest whole number;also to be calculated and reported in g/cc correct to thesecond place of decimal
ii) water content of the soil in percent reported to twosignificant figures.
A sample proforma for the record of the test results is given inAnnexure-IX.
67
6. TESTS ON BLANKET MATERIAL
AIM
To determine the particle size distribution of blanket material asper IRS: GE - 3, July 2003.
PRINCIPLE
i) An oven-dried sample of known weight is washed in theprescribed manner and the decanted wash water containingsuspended and dissolved matter is passed through 75µm ISSieve. The percentage reduction in weight of the originalmaterial by washing is then reported as percentage fines inthe blanket material.
ii) An oven-dried sample of known weight is separated througha set of IS Sieves of progressively smaller opening forobtaining the percentage of the material passing througheach sieve and determining the particle size distribution.
APPARATUS
i) Balance, readable and accurate to 0.1g for fine particles andto 0.5g for coarse fraction or to 0.2% of the test load,whichever is greater
ii) IS Sieves of sizes - 40mm, 20mm, 10mm, 4.75mm, 2mm,600µm, 425µm, 212µm, 75µm and bottom pan
iii) Thermostatically controlled oven of appropriate size tomaintain the temperature inside between 105 and 110
oC,
having an interior of non-corroding material
iv) Mechanical sieve shaker
v) Tray - two or more of 30cm x 20cm x 10cm
vi) Wire brushes/sieve brushes
68
PREPARATION OF SAMPLE
i) The weight of field sample should normally be approximatelyfour times the weight required for laboratory test, which isgoverned by the maximum size of particles present in thematerial in substantial quantity. Following quantities arerequired for grain size analysis:
Max. size of material Minimum weight Weight to be present in substantial of field taken for
quantities (mm) sample (kg) test (kg)
40 75 25
25 50 13
19 25 6.5
12.5 15 3.5
10 10 1.5
6.5 6 0.75
4.75 5 0.4
ii) Blanket material sample received from the field should bedried in the air or in the sun. In wet weather, a dryingapparatus may be used, in which the temperature of thesample should not exceed 60
oC.
iii) Organic matter if present, like tree roots, pieces of barks,etc. should be removed from the sample. The sample shouldbe sieved through 65mm IS Sieve and the material retainedon 65 mm sieve should be rejected.
iv) The representative sample should be thoroughly mixed andspread on a flat surface. The spread sample should be
69
divided into four quadrants and the diagonally oppositequadrants should be mixed. This process should berepeated till the desired quantity of sample is obtained.
v) The big clods if present, may be broken with the help of awooden mallet. Further pulverization if required, may be donein pestle and mortar. Care should be taken not to break theindividual coarse size particles.
PROCEDURE
i) Dry the test sample to a constant weight in athermostatically controlled oven at a temperature of 105 to110
oC and weigh it to the nearest 0.5g or 0.1% of the weight
of the sample.
Note: If large quantity of particle size greater than 4.75mmis present, it may be separated to avoid overloading ofindividual sieves by sieving, using 4.75mm sieve. Materialretained on the 4.75mm sieve is kept separately.
ii) After drying and weighing, place the test sample in thecontainer and soak it in water. The soaking of soil should becontinued for 10 to 12hrs. No dispersing agent or any othersubstance should be added to the water.
iii) Agitate the sample with sufficient vigour to result in completeseparation of all particles finer than the 75µm IS Sieve, fromthe coarser particles and bring the fine material intosuspension.
iv) The sample is washed through 4.75mm IS Sieve and 75µmIS Sieve with water till substantially clean water comes out.Material retained on sieves should be oven-dried at 105 to110
oC for 24hrs. The material retained on each sieve is
weighed to the nearest 0.1g or 0.1% of the original weight ofthe sample, whichever is greater.
v) Nest the sieves 40mm, 20mm, 10mm and 4.75mm, 2mm,600µm, 425µm, 212µm and 75µm sizes, in order of
70
decreasing size of opening from top to bottom and place thesample on the top sieve. Agitate the sieves by hand or by amechanical apparatus for a sufficient period. The materialretained on each sieve is weighed to the nearest 0.1g or0.1% of the original weight of the sample, whichever isgreater.
CALCULATION
i) Calculate the percentage passing, total percentage retainedor percentage in various sizes to the nearest 0.1% on thebasis of the total weight of the initial dry sample.
ii) Calculate the amount of material passing a 75µm sieve byworking as follows-
A = B - C
x 100%B
where,
A = percentage of material finer than 75µm sieve afterwashing
B = original dry weight of sample, in gram
C = dry weight of sample after washing, in gram
REPORTING OF RESULTS
i) Report percentage to the nearest whole number and thepercentage of material finer than 75µm sieve got by washingto the nearest 0.1%.
ii) A particle size distribution curve should be drawn on semi-log graph plotting size on the log scale against percentagefiner than the corresponding size on the ordinary scale (seepage 12).
71
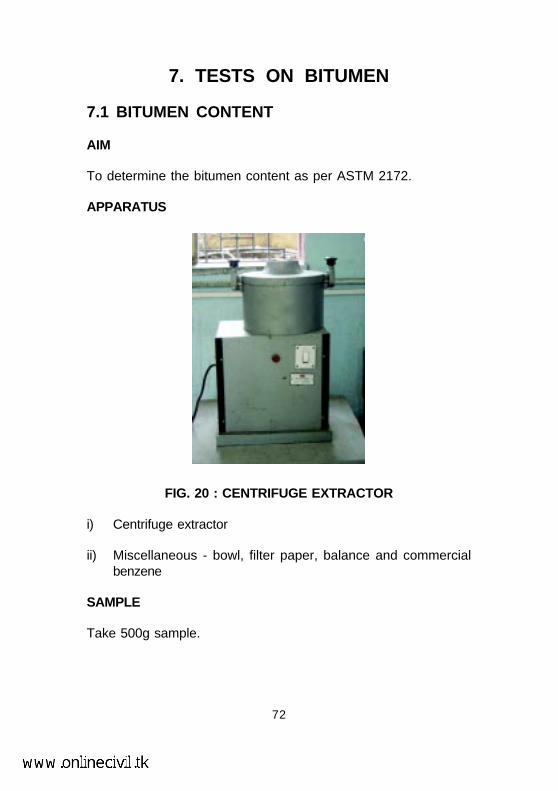
7. TESTS ON BITUMEN
7.1 BITUMEN CONTENT
AIM
To determine the bitumen content as per ASTM 2172.
APPARATUS
FIG. 20 : CENTRIFUGE EXTRACTOR
i) Centrifuge extractor
ii) Miscellaneous - bowl, filter paper, balance and commercialbenzene
SAMPLE
Take 500g sample.
72
73
PROCEDURE
i) If the mixture is not soft enough to separate with a trowel,place 1000g of it in a large pan and warm upto 100
oC to
separate the particles of the mixture uniformly.
ii) Place the sample (Weight ‘A’) in the centrifuge extractor.Cover the sample with benzene, put the filter paper on it withthe cover plate tightly fitted on the bowl.
iii) Start the centrifuge extractor, revolving slowly and graduallyincrease the speed until the solvent ceases to flow from theoutlet.
iv) Allow the centrifuge extractor to stop. Add 200ml benzeneand repeat the procedure.
v) Repeat the procedure at least thrice, so that the extract isclear and not darker than the light straw colour and recordthe volume of total extract in the graduated vessel.
vi) Remove the filter paper from the bowl and dry in the oven at110 + 5
oC. After 24hrs., take the weight of the extracted
sample (Weight ‘B’).
REPORTING OF RESULTS
Bitumen content = 100B
BA ×−%
Repeat the test thrice and average the results.
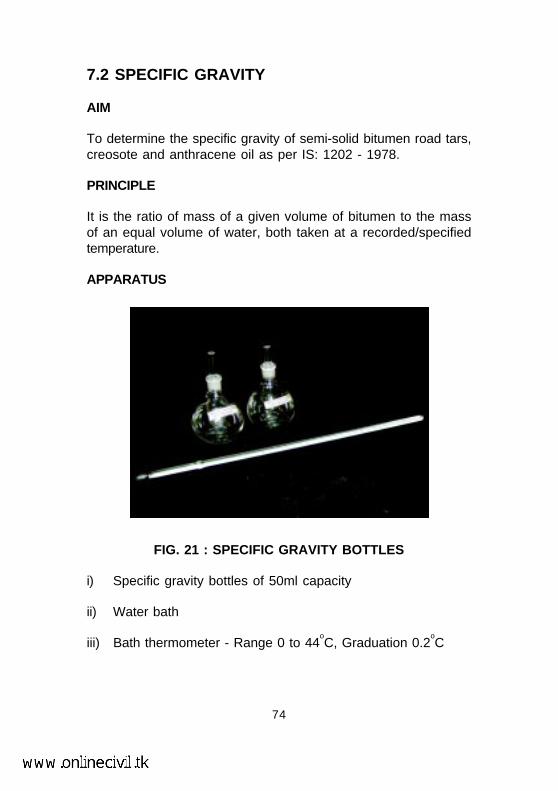
7.2 SPECIFIC GRAVITY
AIM
To determine the specific gravity of semi-solid bitumen road tars,creosote and anthracene oil as per IS: 1202 - 1978.
PRINCIPLE
It is the ratio of mass of a given volume of bitumen to the massof an equal volume of water, both taken at a recorded/specifiedtemperature.
APPARATUS
FIG. 21 : SPECIFIC GRAVITY BOTTLES
i) Specific gravity bottles of 50ml capacity
ii) Water bath
iii) Bath thermometer - Range 0 to 44oC, Graduation 0.2
oC
74
SAMPLE
Take the sample (half the volume of the specific gravity bottles).
PROCEDURE
i) Clean, dry and weigh the specific gravity bottle alongwith thestopper (Weight 'A').
ii) Fill the specific gravity bottle with freshly boiled distilledwater and insert the stopper firmly. Keep it in the water bathhaving a temperature of 27.0 + 1
oC for not less than half an
hour and weigh it (Weight 'B').
iii) Weigh the specific gravity bottle about half-filled with thematerial (Weight 'C').
iv) Weigh the specific gravity bottle about half-filled with thematerial and the other half with distilled water (Weight 'D').
v) Weigh the specific gravity bottle completely filled with thematerial (Weight 'E').
REPORTING OF RESULTS
i) Specific gravity = ( ) ( )CDABAC
−−−−
(Solids and semi-solids)
ii) Specific gravity = ABAE
−−
(Liquids)
The average of the two results should be reported.
75
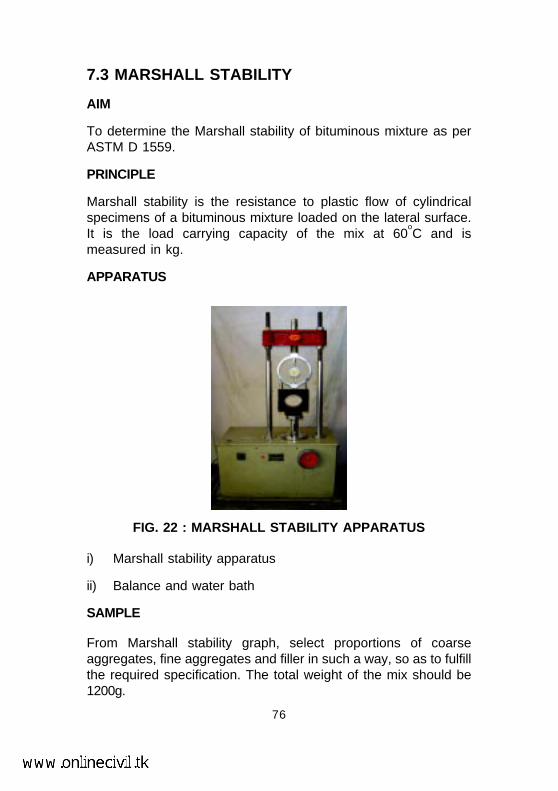
7.3 MARSHALL STABILITY
AIM
To determine the Marshall stability of bituminous mixture as perASTM D 1559.
PRINCIPLE
Marshall stability is the resistance to plastic flow of cylindricalspecimens of a bituminous mixture loaded on the lateral surface.It is the load carrying capacity of the mix at 60
oC and is
measured in kg.
APPARATUS
FIG. 22 : MARSHALL STABILITY APPARATUS
i) Marshall stability apparatus
ii) Balance and water bath
SAMPLE
From Marshall stability graph, select proportions of coarseaggregates, fine aggregates and filler in such a way, so as to fulfillthe required specification. The total weight of the mix should be1200g.
76
PROCEDURE
i) Heat the weighed aggregates and the bitumen separatelyupto 170
oC and 163
oC respectively.
ii) Mix them thoroughly, transfer the mixed material to thecompaction mould arranged on the compaction pedestal.
iii) Give 75 blows on the top side of the specimen mix with astandard hammer (45cm, 4.86kg). Reverse the specimenand give 75 blows again. Take the mould with the specimenand cool it for a few minutes.
iv) Remove the specimen from the mould by gentle pushing.Mark the specimen and cure it at room temperature,overnight.
v) A series of specimens are prepared by a similar methodwith varying quantities of bitumen content, with an incrementof 0.5% (3 specimens) or 1 bitumen content.
vi) Before testing of the mould, keep the mould in the waterbath having a temperature of 60
oC for half an hour.
vii) Check the stability of the mould on the Marshall stabilityapparatus.
REPORTING OF RESULTS
Plot % of bitumen content on the X-axis and stability in kg onthe Y-axis to get maximum Marshall stability of the bitumen mix.A sample plot is given in Annexure-X.
77
7.4 PENETRATION
AIM
To determine the penetration of bitumen as per IS: 1203 - 1978.
PRINCIPLE
The penetration of a bituminous material is the distance in tenthsof a mm, that a standard needle would penetrate vertically, into asample of the material under standard conditions of temperature,load and time.
APPARATUS
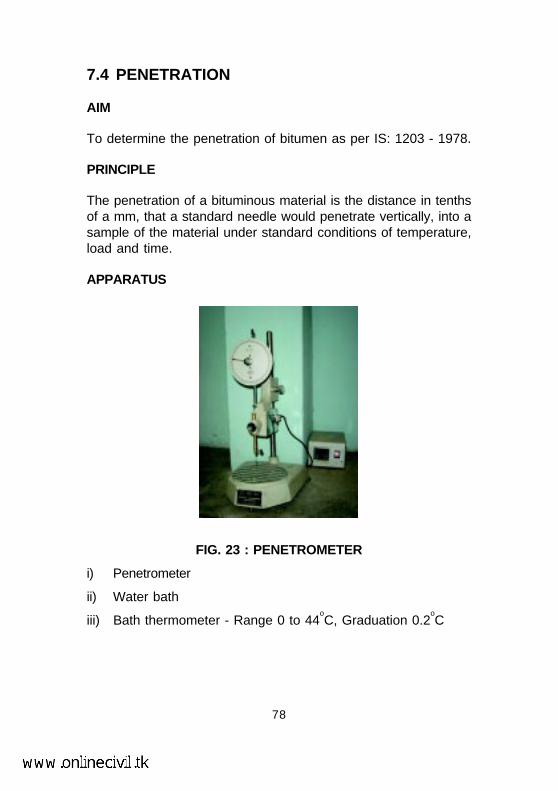
FIG. 23 : PENETROMETER
i) Penetrometer
ii) Water bath
iii) Bath thermometer - Range 0 to 44oC, Graduation 0.2
oC
78
SAMPLE
Bitumen should be just sufficient to fill the container to a depthof at least 15mm in excess of the expected penetration.
PROCEDURE
i) Soften the bitumen above the softening point (between 75and 100
oC). Stir it thoroughly to remove air bubbles and
water.
ii) Pour it into a container to a depth of at least 15mm inexcess of the expected penetration.
iii) Cool it at an atmospheric temperature of 15 to 30oC for
21
1 hrs. Then place it in a transfer dish in the water bath at
25.0 + 0.1oC for
21
1 hrs.
iv) Keep the container on the stand of the penetrationapparatus.
v) Adjust the needle to make contact with the surface of thesample.
vi) Adjust the dial reading to zero.
vii) With the help of the timer, release the needle for exactly5 seconds.
viii) Record the dial reading.
ix) Repeat the above procedure thrice.
REPORTING OF RESULTS
The value of penetration reported should be the mean of not lessthan three determinations expressed in tenths of a mm.
79
7.5 FLASH POINT AND FIRE POINT
AIM
To determine the flash point and the fire point of asphalticbitumen and fluxed native asphalt, cutback bitumen and blowntype bitumen as per IS: 1209 - 1978.
PRINCIPLE
Flash Point - The flash point of a material is the lowesttemperature at which the application of test flame causes thevapours from the material to momentarily catch fire in the form ofa flash under specified conditions of the test.
Fire Point - The fire point is the lowest temperature at which theapplication of test flame causes the material to ignite and burn atleast for 5 seconds under specified conditions of the test.
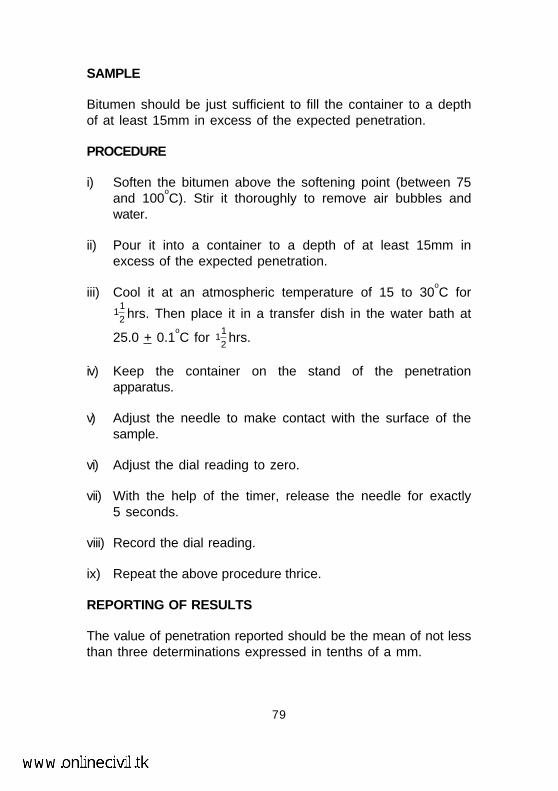
APPARATUS
FIG. 24 : PENSKY - MARTENS APPARATUS
80
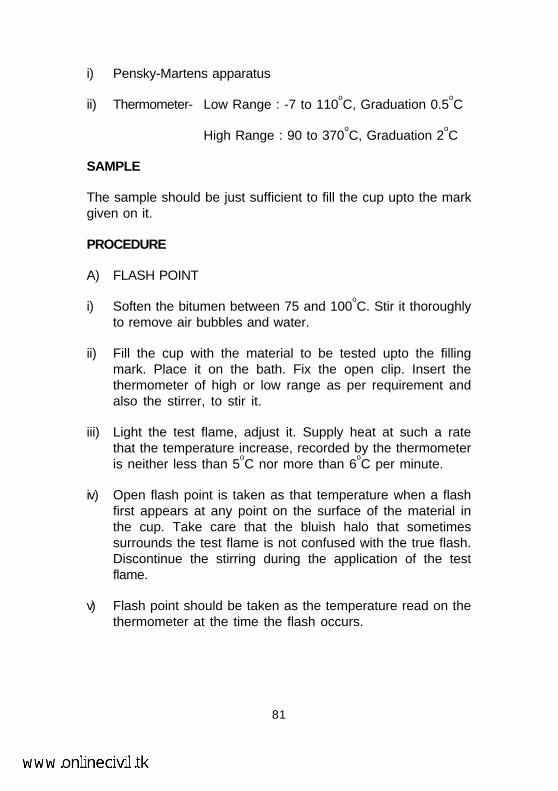
i) Pensky-Martens apparatus
ii) Thermometer- Low Range : -7 to 110oC, Graduation 0.5
oC
High Range : 90 to 370oC, Graduation 2
oC
SAMPLE
The sample should be just sufficient to fill the cup upto the markgiven on it.
PROCEDURE
A) FLASH POINT
i) Soften the bitumen between 75 and 100oC. Stir it thoroughly
to remove air bubbles and water.
ii) Fill the cup with the material to be tested upto the fillingmark. Place it on the bath. Fix the open clip. Insert thethermometer of high or low range as per requirement andalso the stirrer, to stir it.
iii) Light the test flame, adjust it. Supply heat at such a ratethat the temperature increase, recorded by the thermometeris neither less than 5
oC nor more than 6
oC per minute.
iv) Open flash point is taken as that temperature when a flashfirst appears at any point on the surface of the material inthe cup. Take care that the bluish halo that sometimessurrounds the test flame is not confused with the true flash.Discontinue the stirring during the application of the testflame.
v) Flash point should be taken as the temperature read on thethermometer at the time the flash occurs.
81
B) FIRE POINT
i) After flash point, heating should be continued at such a ratethat the increase in temperature recorded by thethermometer is neither less than 5
oC nor more than 6
oC per
minute.
ii) The test flame should be lighted and adjusted so that it is ofthe size of a bead 4mm in dia.
REPORTING OF RESULTS
i) The flash point should be taken as the temperature read onthe thermometer at the time of the flame application thatcauses a distinct flash in the interior of the cup.
ii) The fire point should be taken as the temperature read onthe thermometer at which the application of test flamecauses the material to ignite and burn for at least 5seconds.
82
7.6 SOFTENING POINT
AIM
To determine the softening point of asphaltic bitumen and fluxednative asphalt, road tar, coal tar pitch and blown type bitumen asper IS: 1205 - 1978.
PRINCIPLE
It is the temperature at which the substance attains a particulardegree of softening under specified condition of the test.
APPARATUS
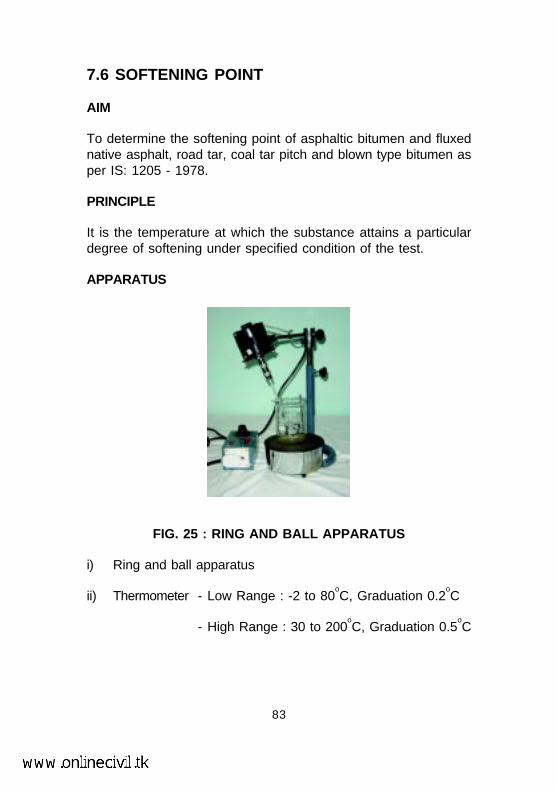
FIG. 25 : RING AND BALL APPARATUS
i) Ring and ball apparatus
ii) Thermometer - Low Range : -2 to 80oC, Graduation 0.2
oC
- High Range : 30 to 200oC, Graduation 0.5
oC
83
PREPARATION OF SAMPLE
i) The sample should be just sufficient to fill the ring. Theexcess sample should be cut off by a knife.
ii) Heat the material between 75 and 100oC. Stir it to remove
air bubbles and water, and filter it through IS Sieve 30, ifnecessary.
iii) Heat the rings and apply glycerine. Fill the material in it andcool it for 30 minutes.
iv) Remove excess material with the help of a warmed, sharpknife.
PROCEDURE
A) Materials of softening point below 80oC:
i) Assemble the apparatus with the rings, thermometer andball guides in position.
ii) Fill the beaker with boiled distilled water at a temperature5.0 ± 0.5
oC per minute.
iii) With the help of a stirrer, stir the liquid and apply heat tothe beaker at a temperature of 5.0 ± 0.5
oC per minute.
iv) Apply heat until the material softens and allow the ball topass through the ring.
v) Record the temperature at which the ball touches thebottom, which is nothing but the softening point of thatmaterial.
84

B) Materials of softening point above 80oC:
The procedure is the same as described above. The onlydifference is that instead of water, glycerine is used and thestarting temperature of the test is 35
oC.
REPORTING OF RESULTS
Record the temperature at which the ball touches the bottom.
85
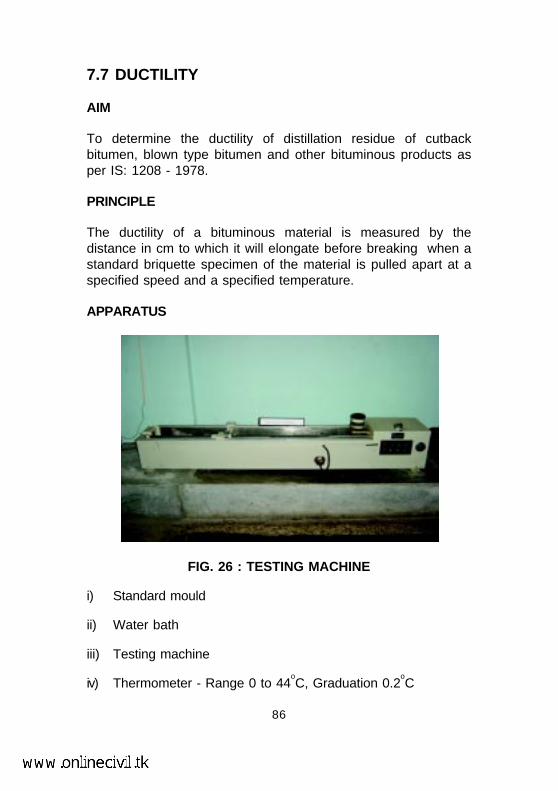
7.7 DUCTILITY
AIM
To determine the ductility of distillation residue of cutbackbitumen, blown type bitumen and other bituminous products asper IS: 1208 - 1978.
PRINCIPLE
The ductility of a bituminous material is measured by thedistance in cm to which it will elongate before breaking when astandard briquette specimen of the material is pulled apart at aspecified speed and a specified temperature.
APPARATUS
FIG. 26 : TESTING MACHINE
i) Standard mould
ii) Water bath
iii) Testing machine
iv) Thermometer - Range 0 to 44oC, Graduation 0.2
oC
86
PROCEDURE
i) Completely melt the bituminous material to be tested byheating it to a temperature of 75 to 100
oC above the
approximate softening point until it becomes thoroughly fluid.Assemble the mould on a brass plate and in order to preventthe material under test from sticking, thoroughly coat thesurface of the plate and the interior surfaces of the sides ofthe mould with a mixture of equal parts of glycerine anddextrin. While filling, pour the material in a thin stream backand forth from end to end of the mould until it is more thanlevel full. Leave it to cool at room temperature for 30 to 40minutes and then place it in a water bath maintained at thespecified temperature for 30 minutes, after which cut off theexcess bitumen by means of a hot, straight-edged puttyknife or spatula, so that the mould is just level full.
ii) Place the brass plate and mould with briquette specimen inthe water bath and keep it at the specified temperature forabout 85 to 95 minutes. Remove the briquette from theplate, detach the side pieces and the briquette immediately.
iii) Attach the rings at each end of the two clips to the pins orhooks in the testing machine and pull the two clips aparthorizontally at a uniform speed, as specified, until thebriquette ruptures. Measure the distance in cm throughwhich the clips have been pulled to produce rupture. Whilethe test is being done, make sure that the water in the tankof the testing machine covers the specimen both above andbelow by at least 25mm and the temperature is maintainedcontinuously within ± 0.5
oC of the specified temperature.
REPORTING OF RESULTS
A normal test is one in which the material between the two clipspulls out to a point or to a thread and rupture occurs where thecross-sectional area is minimum. Report the average of threenormal tests as the ductility of the sample, provided the threedeterminations be within ± 0.5 percent of their mean value.
87

88
If the values of the three determinations do not lie within ± 0.5percent of their mean, but the two higher values are within ± 0.5percent of their mean, then record the mean of the two highervalues as the test result.
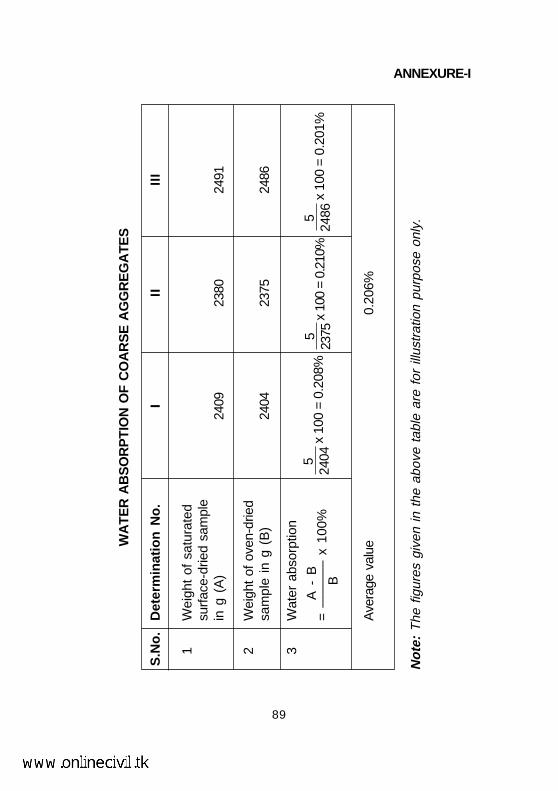
89
WA
TER
AB
SO
RP
TIO
N O
F C
OA
RS
E A
GG
RE
GA
TE
S
S.N
o.
Det
erm
inat
ion
No
.I
IIII
I
1W
eigh
t of
sat
urat
edsu
rfac
e-dr
ied
sam
ple
in g
(A
)24
0923
8024
91
2W
eigh
t of
ove
n-dr
ied
sam
ple
in g
(B
)24
0423
7524
86
3W
ater
abs
orpt
ion
A -
B=
——
—–
x 10
0%
B
Ave
rage
val
ue0.
206%
524
04x
100
=0.
208%
523
75x
100
=0.
210%
524
86x
100
=0.
201%
No
te:
The
fig
ures
giv
en in
the
abo
ve t
able
are
for
illu
stra
tion
purp
ose
only
.
ANNEXURE-I
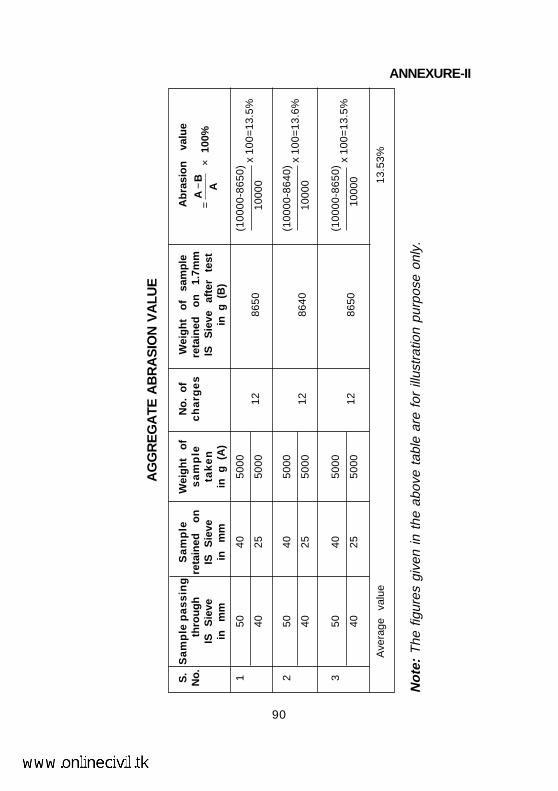
90
ANNEXURE-II
AG
GR
EG
ATE
AB
RA
SIO
N V
ALU
E
S.
Sa
mp
lep
as
sin
gS
am
ple
Wei
gh
t o
fN
o.
of
Wei
gh
t o
f sa
mp
leA
bra
sio
n
valu
eN
o.
th
rou
gh
reta
ined
o
ns
am
ple
ch
arg
es
reta
ined
o
n
1.7m
mIS
S
ieve
IS
Sie
veta
ke
nIS
S
ieve
af
ter
test
in
mm
in
mm
in g
(A
)in
g (
B)
150
4050
00(1
0000
-865
0)x
100=
13.5
%40
2550
0012
8650
1000
0
250
4050
00(1
0000
-864
0)x
100=
13.6
%40
2550
0012
8640
1000
0
350
4050
00(1
0000
-865
0)x
100=
13.5
%40
2550
0012
8650
1000
0
Ave
rage
va
lue
13.5
3%
No
te:
The
fig
ures
giv
en in
the
abo
ve t
able
are
for
illu
stra
tion
purp
ose
only
.
100%
AB
A×
−=
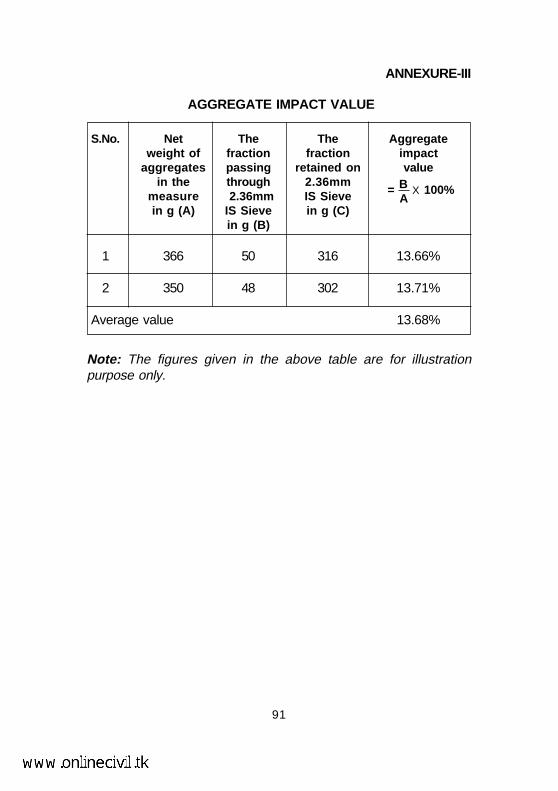
91
ANNEXURE-III
AGGREGATE IMPACT VALUE
S.No. Net The The Aggregateweight of fraction fraction impact
aggregates passing retained on valuein the through 2.36mm
measure 2.36mm IS Sievein g (A) IS Sieve in g (C)
in g (B)
1 366 50 316 13.66%
2 350 48 302 13.71%
Average value 13.68%
Note: The figures given in the above table are for illustrationpurpose only.
= B X 100%A
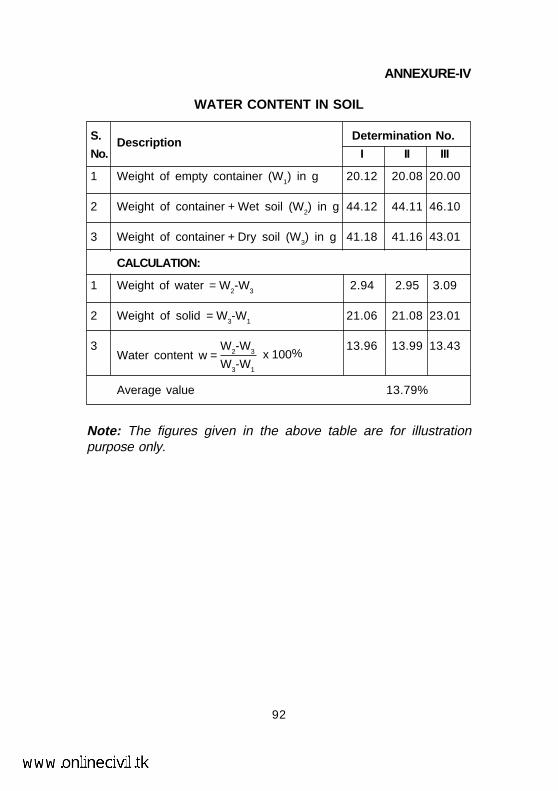
92
ANNEXURE-IV
WATER CONTENT IN SOIL
S. Determination No.
No.Description
I II III
1 Weight of empty container (W1) in g 20.12 20.08 20.00
2 Weight of container + Wet soil (W2) in g 44.12 44.11 46.10
3 Weight of container + Dry soil (W3) in g 41.18 41.16 43.01
CALCULATION:
1 Weight of water = W2-W3 2.94 2.95 3.09
2 Weight of solid = W3-W1 21.06 21.08 23.01
3Water content w =
W2-W3 x 100%13.96 13.99 13.43
W3-W1
Average value 13.79%
Note: The figures given in the above table are for illustrationpurpose only.
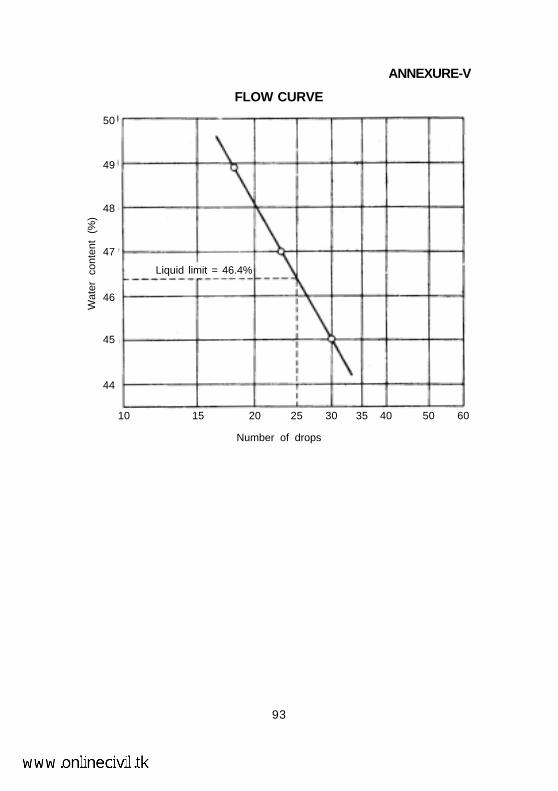
93
ANNEXURE-V
FLOW CURVE
Number of drops
Wat
er
cont
ent
(%)
Liquid limit = 46.4%
50
49
48
47
46
45
44
10 15 20 25 30 35 40 50 60
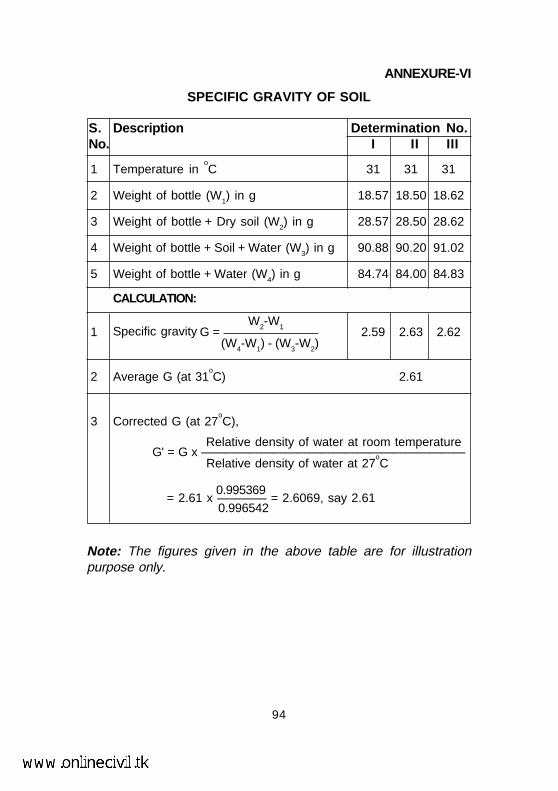
94
S. Description Determination No.No. I II III
1 Temperature in oC 31 31 31
2 Weight of bottle (W1) in g 18.57 18.50 18.62
3 Weight of bottle + Dry soil (W2) in g 28.57 28.50 28.62
4 Weight of bottle + Soil + Water (W3) in g 90.88 90.20 91.02
5 Weight of bottle + Water (W4) in g 84.74 84.00 84.83
CALCULATION:
Specific gravity W2-W11 G = 2.59 2.63 2.62
(W4-W1) - (W3-W2)
2 Average G (at 31oC) 2.61
3 Corrected G (at 27oC),
Relative density of water at room temperatureG' = G x ——————————————————————
Relative density of water at 27oC
0.995369 = 2.61 x ———— = 2.6069, say 2.61
0.996542
Note: The figures given in the above table are for illustrationpurpose only.
ANNEXURE-VI
SPECIFIC GRAVITY OF SOIL
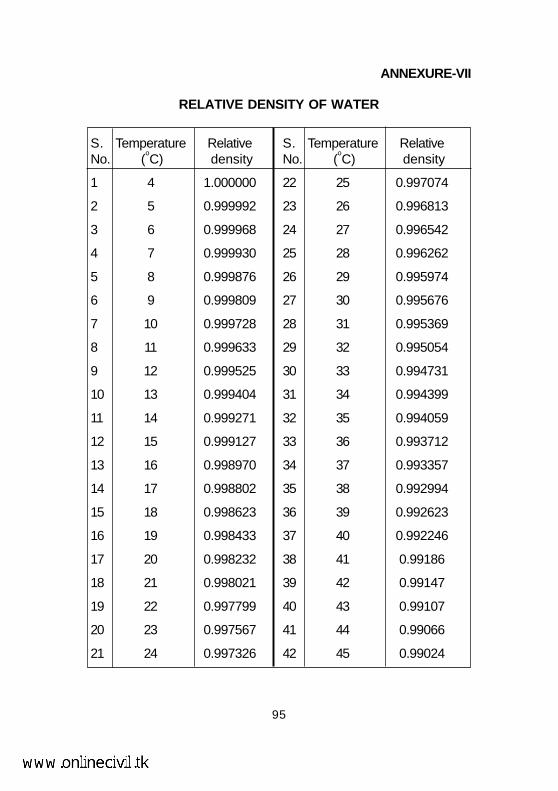
95
ANNEXURE-VII
RELATIVE DENSITY OF WATER
S. Temperature RelativeNo. (
oC) density
1 4 1.000000
2 5 0.999992
3 6 0.999968
4 7 0.999930
5 8 0.999876
6 9 0.999809
7 10 0.999728
8 11 0.999633
9 12 0.999525
10 13 0.999404
11 14 0.999271
12 15 0.999127
13 16 0.998970
14 17 0.998802
15 18 0.998623
16 19 0.998433
17 20 0.998232
18 21 0.998021
19 22 0.997799
20 23 0.997567
21 24 0.997326
S. Temperature RelativeNo. (
oC) density
22 25 0.997074
23 26 0.996813
24 27 0.996542
25 28 0.996262
26 29 0.995974
27 30 0.995676
28 31 0.995369
29 32 0.995054
30 33 0.994731
31 34 0.994399
32 35 0.994059
33 36 0.993712
34 37 0.993357
35 38 0.992994
36 39 0.992623
37 40 0.992246
38 41 0.99186
39 42 0.99147
40 43 0.99107
41 44 0.99066
42 45 0.99024
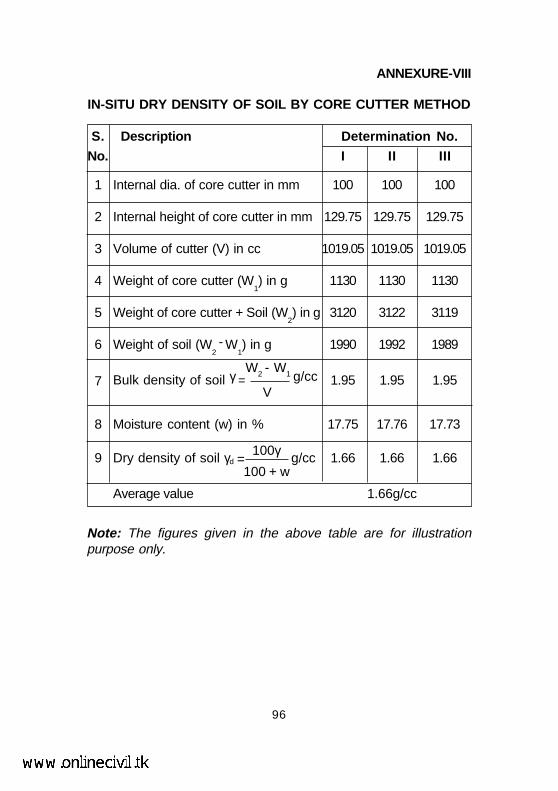
96
ANNEXURE-VIII
IN-SITU DRY DENSITY OF SOIL BY CORE CUTTER METHOD
S. Description Determination No.
No. I II III
1 Internal dia. of core cutter in mm 100 100 100
2 Internal height of core cutter in mm 129.75 129.75 129.75
3 Volume of cutter (V) in cc 1019.05 1019.05 1019.05
4 Weight of core cutter (W1) in g 1130 1130 1130
5 Weight of core cutter + Soil (W2) in g 3120 3122 3119
6 Weight of soil (W2 -
W
1) in g 1990 1992 1989
Bulk density of soil γ =W
2 - W
1 g/cc7 V
1.95 1.95 1.95
8 Moisture content (w) in % 17.75 17.76 17.73
9 Dry density of soil γd = 100γ g/cc 1.66 1.66 1.66
100 + w
Average value 1.66g/cc
Note: The figures given in the above table are for illustrationpurpose only.
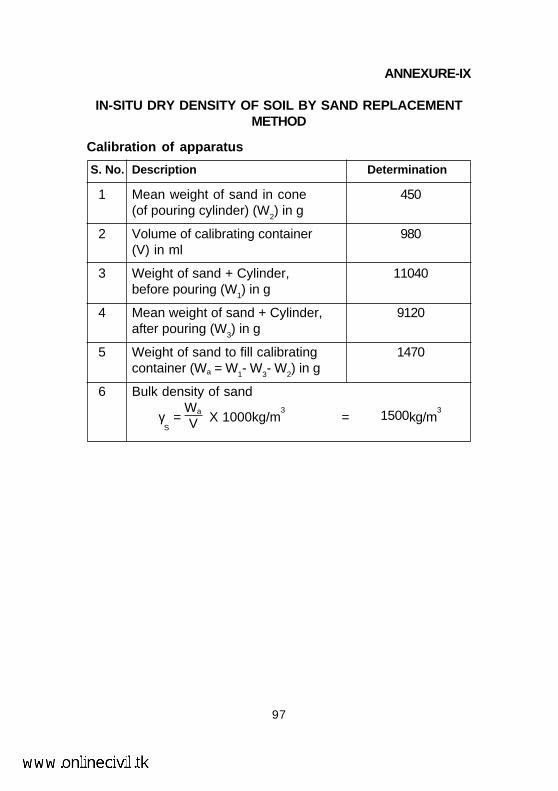
97
ANNEXURE-IX
IN-SITU DRY DENSITY OF SOIL BY SAND REPLACEMENTMETHOD
Calibration of apparatus
S. No. Description Determination
1 Mean weight of sand in cone 450(of pouring cylinder) (W
2) in g
2 Volume of calibrating container 980(V) in ml
3 Weight of sand + Cylinder, 11040before pouring (W
1) in g
4 Mean weight of sand + Cylinder, 9120after pouring (W
3) in g
5 Weight of sand to fill calibrating 1470container (Wa = W
1- W
3- W
2) in g
6 Bulk density of sand
γS
=
Wa X 1000kg/m3
= 1500kg/m3
V
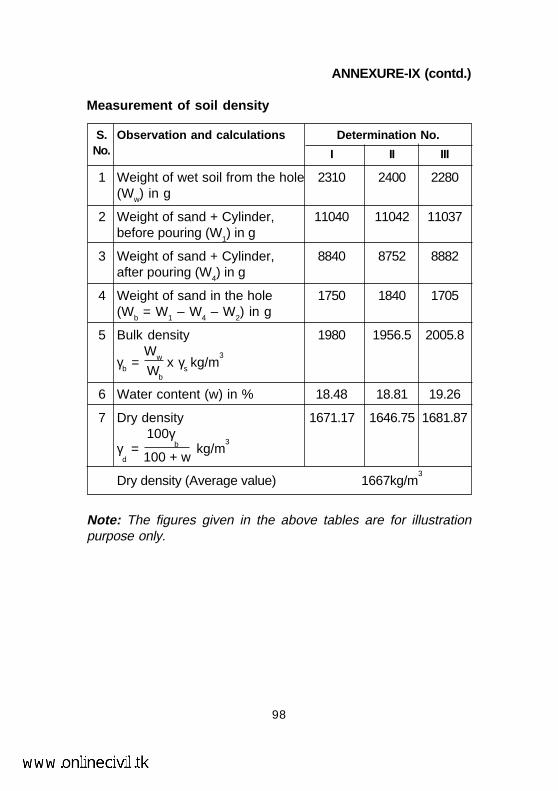
98
ANNEXURE-IX (contd.)
Measurement of soil density
S. Observation and calculations Determination No.No. I II III
1 Weight of wet soil from the hole 2310 2400 2280(Ww) in g
2 Weight of sand + Cylinder, 11040 11042 11037before pouring (W
1) in g
3 Weight of sand + Cylinder, 8840 8752 8882after pouring (W
4) in g
4 Weight of sand in the hole 1750 1840 1705(W
b = W
1 – W
4 – W
2) in g
5 Bulk density 1980 1956.5 2005.8
γb =
Ww x γ
s kg/m
3
Wb
6 Water content (w) in % 18.48 18.81 19.26
7 Dry density 1671.17 1646.75 1681.87
γd =
100γb
kg/m3
100 + w
Dry density (Average value) 1667kg/m3
Note: The figures given in the above tables are for illustrationpurpose only.
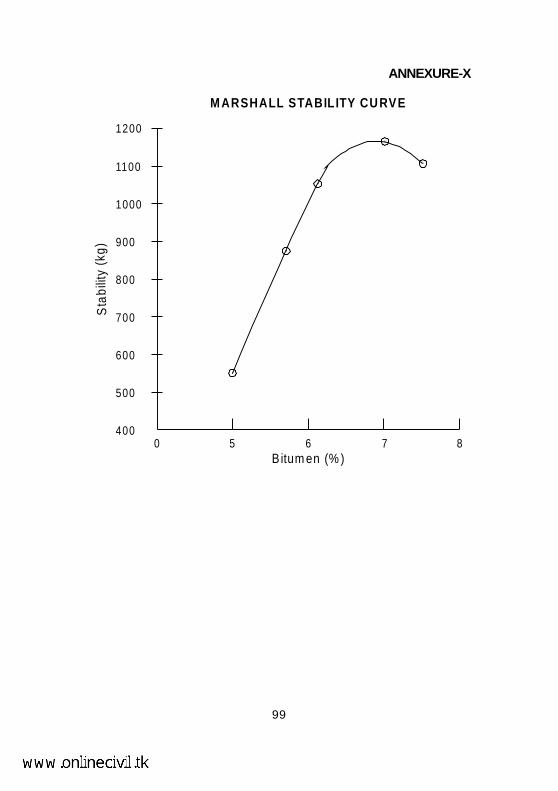
ANNEXURE-X
99
1100
1000
900
800
700
600
500
400
1200
0 5 6 7 8
.
.
.
.
.
B itum en (% )
Sta
bilit
y (k
g)M ARSHALL STABILITY CU RVE
100
LIST OF SUPPLIERS OF MATERIAL TESTINGEQUIPMENTS ALONGWITH THEIR ADDRESSES
1. AIMIL Ltd.Malhotra House, Walchand Hirachand Marg,Opp. to G.P.O. Fort, Mumbai - 400 001.
2. Testwell Scientific Instrument Pvt. Ltd.5, Nand Dham, Ground Floor,Plot No. 270, Sion Cementary Road, Sion (W) - 400 022.
3. Utile Equipments13, Jal Tarang, Prabhat Road,Lane No.1, Pune - 411 004
4. Lawerence & Mayo (India) Pvt. Ltd.3, Dr. Ambedkar Road, Pune - 411 001.
5. Laxmi Sales & Agencies84, Pannalal Nagar, Amaravati - 444 605.
6. Commander Agencies1466, Sadashiv Peth, Pune - 411 030.
7. M/s Rout Scientific & General Traders17/B, Ashiwini Society, Behind Hotel Monali,Wakadewadi, Pune - 411 005.
8. DYEGLO820/7, Shee-Krishna Kunj,Bhandarkar Institute Road,Pune - 411 004.