haiti recovery initiative metropolitan area, saint marc
TRANSCRIPT
Media Consumption Survey Haiti Recovery Initiative
Metropolitan Area, Saint Marc, Cap Haïtien and Petit Goave
Presentation –May 2011
Fourth Quarterly Evaluation
Executed by:
Intro
Sponsored by HRI, this survey has the following objectives :
Understand the media consumption habits (Radio, Television, Internet and Newspapers) among the Haitian population
Understand public perceptions of media outlets, government and International Community
Conduct the fourth quarterly survey of four
GENERAL
RADIO
TV
INTERNET
OTHER INFORMATION
NEWSPAPER

Technical Specifications 3
Population under study: Haitians in 9 communes of Metropolitan area and 3 communes in the provinces (Saint-marc, Petit-Goave and Cap-Haitien)
Interview Language : Haitian Creole
Data Collection Period: March 9th to March 18th 2011 (See timeline on next slide)
Sampling method: Random selection of households using Kish grid for interviewee
Sample size: 5445 interviews conducted
Data collection method: Interview with questionnaire
Response rate: 99% (5428 valid cases over 5445 interviewed)
Number of fieldwork personnel: 120
Confidence level: 95%
Confidence interval: 5%
Quality Control :
Intensive Training/Briefing
25% Supervisors Field Accompaniment
25% Quality Controllers Back Checking
21% Data Entry Double Verification
14% Call back Random
Technical Specifications 4
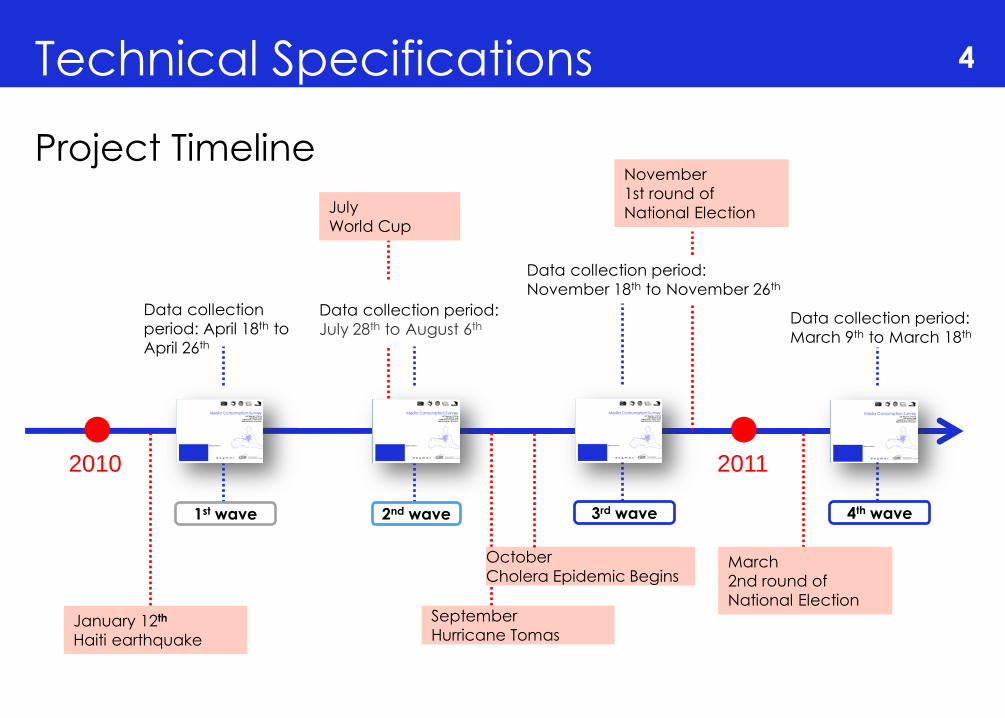
Project Timeline
2010 2011
January 12th
Haiti earthquake
1st wave
Data collection
period: April 18th to
April 26th
2nd wave
Data collection period:
July 28th to August 6th
July
World Cup
November
1st round of
National Election
3rd wave
Data collection period:
November 18th to November 26th
September
Hurricane Tomas
October
Cholera Epidemic Begins March
2nd round of
National Election
4th wave
Data collection period:
March 9th to March 18th

Audience Measurement Criteria How it works
5
Share (in %)
Percentage of total Market Share of listening/viewing consumption per
Radio or Television station
Weekly Reach (listeners/viewers)
Total cumulative audience listening to an individual Radio station or
watching a Television station for at least 30 minutes over a period of 7
days
Average Daily Reach (viewers)
Average daily audience for a Television station
Time Spent Listening (TSL) / Average Weekly Viewing
Average time consumed by station’s listeners/channel’s viewers
N.B : A glossary is available at the end of this document explaining how to
read fields in the table
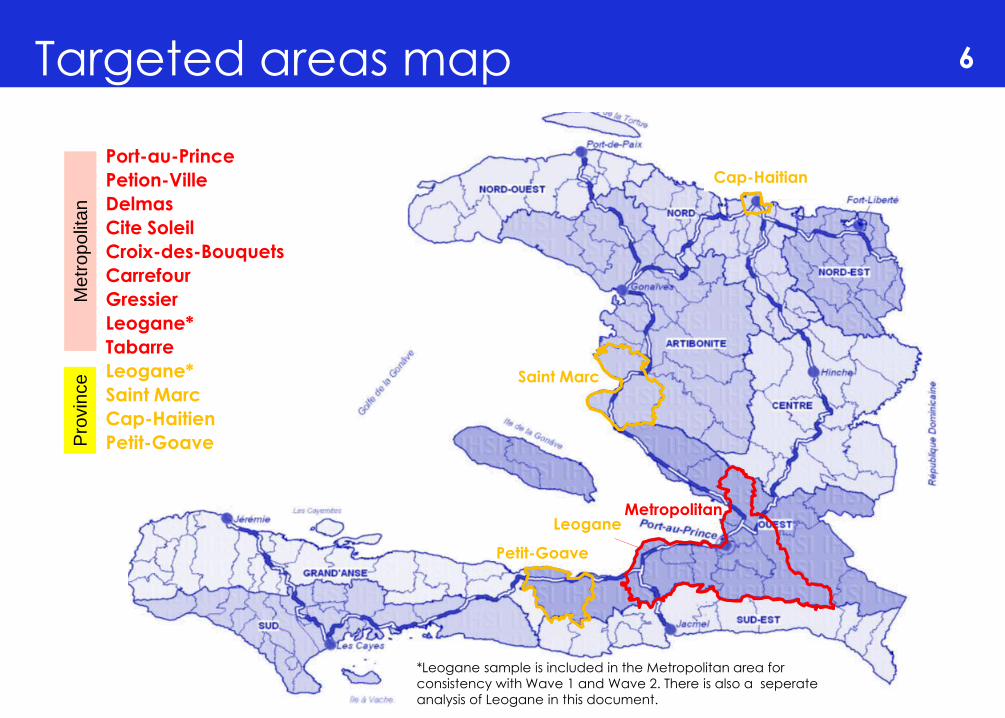
Port-au-Prince
Petion-Ville
Delmas
Cite Soleil
Croix-des-Bouquets
Carrefour
Gressier
Leogane*
Tabarre
Leogane*
Saint Marc
Cap-Haitien
Petit-Goave
Targeted areas map 6
Petit-Goave
Saint Marc
Me
tro
po
lita
n
*Leogane sample is included in the Metropolitan area for
consistency with Wave 1 and Wave 2. There is also a seperate
analysis of Leogane in this document.
Pro
vin
ce
Leogane Metropolitan
Cap-Haitian

Sample size & Interview place 7
Interviews were conducted in 12 communes divided by traditional
residences and camps. 3 communes were added in wave 3
(Saint Marc, Cap-Haitien and Petit-Goave).
Interview Place
Base: 3695 Total Sample Wave 2
Base: 3462 Total Sample Wave 1
Base: 3867 Total Sample Wave 3
Metropolitan
Base: 1022
Provinces
Repartition between camp and residence is
based on CCCM /DTM
Communes
Respondent's Place Total sample Total population
(15 years old and up)
Residence Camp Count Col % Count
Count Row % Count Row %
Metropolitan Area
Port-au-Prince 1281 83.8% 248 16.2% 1529 35.0% 565,620
Petion-Ville 435 91.2% 42 8.8% 477 10.9% 188,128
Delmas 495 75.8% 158 24.2% 653 15.0% 240,165
Cite Soleil 242 80.1% 60 19.9% 302 6.9% 159,530
Croix-des-Bouquets 149 71.6% 59 28.4% 208 4.8% 51,407
Carrefour 503 78.5% 138 21.5% 641 14.7% 279,096
Gressier 114 100.0% 114 2.6% 8,005
Leogane 208 68.0% 98 32.0% 306 7.0% 51,065
Tabarre 115 83.9% 22 16.1% 137 3.1% 78,409
Total 3542 81.1% 825 18.9% 4367 100.0% 1,621,426
Provinces
Saint Marc 299 100.0% Not applicable 299 28.2% 76,790
Cap-Haitien 461 100.0% Not applicable 461 43.4% 99,119
Petit-Goave 301 100.0% 301 28.4% 49,305
Total 1061 100.0% 1061 100.0% 225,214
Base: 4603 Base: 825 Total Sample Wave 4
57.3%
52.4%
73.6%
84.8%
42.7%
47.6%
26.4%
15.2%
0.0% 50.0% 100.0%
Wave 1
Wave 2
Wave 3
Wave 4
Residence Camp
Metropolitan
Area
8
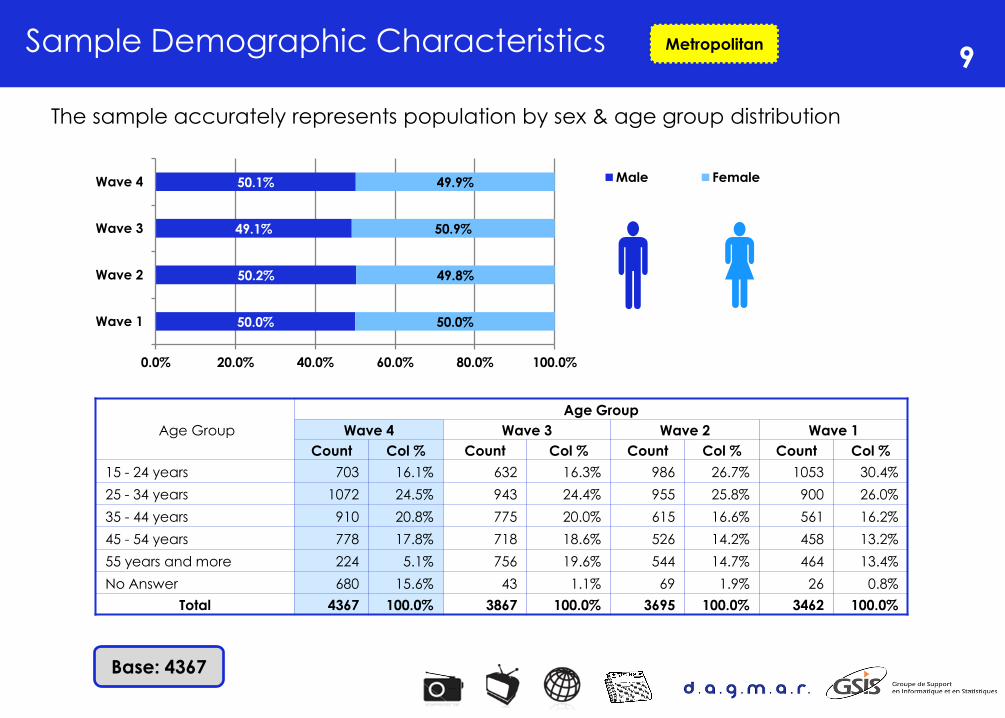
Sample Demographic Characteristics 9
The sample accurately represents population by sex & age group distribution
Base: 4367
Metropolitan
Age Group
Age Group
Wave 4 Wave 3 Wave 2 Wave 1
Count Col % Count Col % Count Col % Count Col %
15 - 24 years 703 16.1% 632 16.3% 986 26.7% 1053 30.4%
25 - 34 years 1072 24.5% 943 24.4% 955 25.8% 900 26.0%
35 - 44 years 910 20.8% 775 20.0% 615 16.6% 561 16.2%
45 - 54 years 778 17.8% 718 18.6% 526 14.2% 458 13.2%
55 years and more 224 5.1% 756 19.6% 544 14.7% 464 13.4%
No Answer 680 15.6% 43 1.1% 69 1.9% 26 0.8%
Total 4367 100.0% 3867 100.0% 3695 100.0% 3462 100.0%
50.0%
50.2%
49.1%
50.1%
50.0%
49.8%
50.9%
49.9%
0.0% 20.0% 40.0% 60.0% 80.0% 100.0%
Wave 1
Wave 2
Wave 3
Wave 4 Male Female

Sample Demographic Characteristics 10
The sample distribution by education level reached and by marital status
Base: 4367
Metropolitan
Level of education reached
Level of Education
Wave 4 Wave 3 Wave 2 Wave 1
Count Col % Count Col % Count Col % Count Col %
No formal education 499 11.4% 486 12.6% 441 11.9% 272 7.9%
Some Primary 765 17.5% 688 17.8% 627 17.0% 586 16.9%
Completed Primary 363 8.3% 387 10.0% 319 8.6% 307 8.9%
Some Secondary 1427 32.7% 1258 32.5% 1400 37.9% 1299 37.5%
Completed Secondary 695 15.9% 552 14.3% 529 14.3% 552 15.9%
In College/University 343 7.9% 280 7.2% 209 5.7% 276 8.0%
Completed college / University 206 4.7% 164 4.2% 119 3.2% 140 4.0%
Other specify 3 0.1% 6 0.2% 10 0.3% 14 0.4%
No Answer 66 1.5% 46 1.2% 41 1.1% 16 0.5%
Total 4367 100.0% 3867 100.0% 3695 100.0% 3462 100.0%
Marital Status
Marital Status
Wave 4 Wave 3 Wave 2 Wave 1
Count Col % Count Col % Count Col % Count Col %
Single 1738 39.8% 1529 39.5% 1664 45.0% 1648 47.6%
Free union 1230 28.2% 1187 30.7% 1036 28.0% 864 25.0%
Married 870 19.9% 731 18.9% 582 15.8% 569 16.4%
Widow 288 6.6% 272 7.0% 217 5.9% 182 5.3%
Separated / Divorced 136 3.1% 108 2.8% 99 2.7% 115 3.3%
No Answer 105 2.4% 40 1.0% 97 2.6% 84 2.4%
Total 4367 100.0% 3867 100.0% 3695 100.0% 3462 100.0%
Sources of
Information
11
Metropolitan

12 Sources of Information Used – 1st choice
Base: 4367
Metropolitan
What sources of information do you use to keep
informed on current events? (1st Choice)
Respondent's Place Wave 4
Previous Waves
Residence Camp Total Wave 3 Wave 2 Wave 1
Count Col % Count Col % Count Col % Col % Col % Col %
Radio 3,111 87.8% 746 90.4% 3,857 88.3% 83.7% 78.9% 78.9%
Television 253 7.1% 40 4.8% 293 6.7% 7.4% 9.9% 7.5%
Newspaper and Magazines 15 0.4% 3 0.4% 18 0.4% 0.2% 0.5% 0.2%
Internet 17 0.5% 5 0.6% 22 0.5% 0.6% 0.7% 1.1%
Word of mouth (from friends, family members) 77 2.2% 21 2.5% 98 2.2% 3.9% 7.9% 9.5%
Police Nationale d'Haiti 2 0.1% 2 0.2% 0.1% 0.1% 0.1%
Church 6 0.2% 6 0.1% 0.7% 0.9% 1.6%
Mobile phones SMS / Text Messaging 38 1.1% 9 1.1% 47 1.1% 2.9% 0.8% 0.4%
Billboards/ posters 1 0.0% 1 0.0% 0.1% 0.1% N/A
Others 1 0.1% 1 0.0% 0.1% 0.4% 0.2%
No answer 22 0.6% 22 0.5% 0.3% 0.0% 0.0%
Total 3,542 100.0% 825 100.0% 4,367 100.0% 100.00% 100.0% 100.0%
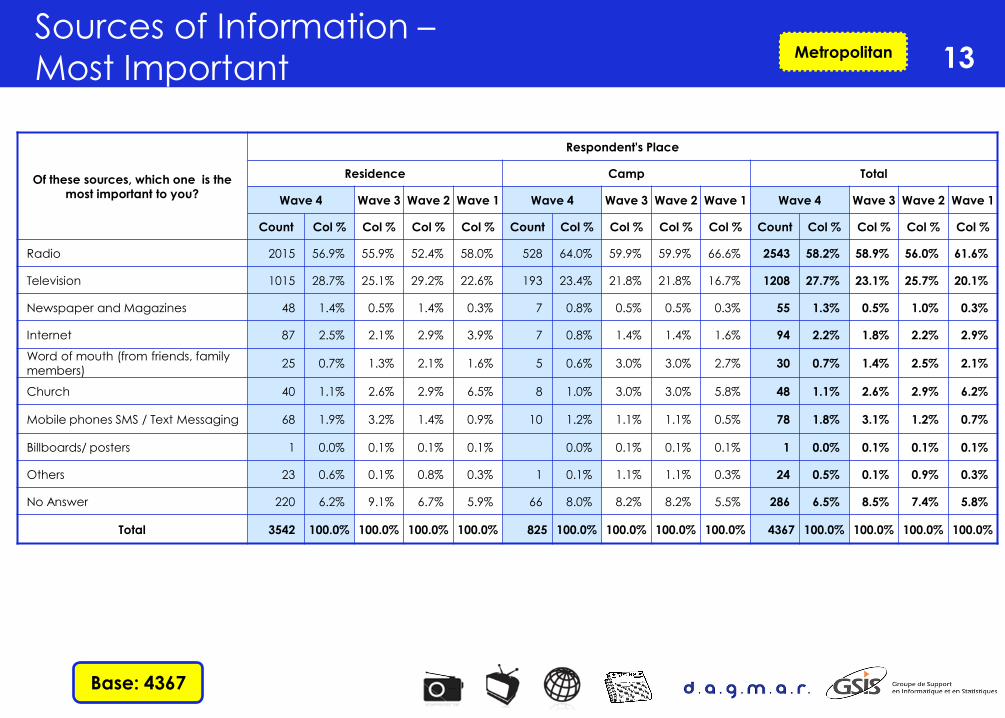
13 Sources of Information –
Most Important
Base: 4367
Metropolitan
Of these sources, which one is the
most important to you?
Respondent's Place
Residence Camp Total
Wave 4 Wave 3 Wave 2 Wave 1 Wave 4 Wave 3 Wave 2 Wave 1 Wave 4 Wave 3 Wave 2 Wave 1
Count Col % Col % Col % Col % Count Col % Col % Col % Col % Count Col % Col % Col % Col %
Radio 2015 56.9% 55.9% 52.4% 58.0% 528 64.0% 59.9% 59.9% 66.6% 2543 58.2% 58.9% 56.0% 61.6%
Television 1015 28.7% 25.1% 29.2% 22.6% 193 23.4% 21.8% 21.8% 16.7% 1208 27.7% 23.1% 25.7% 20.1%
Newspaper and Magazines 48 1.4% 0.5% 1.4% 0.3% 7 0.8% 0.5% 0.5% 0.3% 55 1.3% 0.5% 1.0% 0.3%
Internet 87 2.5% 2.1% 2.9% 3.9% 7 0.8% 1.4% 1.4% 1.6% 94 2.2% 1.8% 2.2% 2.9%
Word of mouth (from friends, family
members) 25 0.7% 1.3% 2.1% 1.6% 5 0.6% 3.0% 3.0% 2.7% 30 0.7% 1.4% 2.5% 2.1%
Church 40 1.1% 2.6% 2.9% 6.5% 8 1.0% 3.0% 3.0% 5.8% 48 1.1% 2.6% 2.9% 6.2%
Mobile phones SMS / Text Messaging 68 1.9% 3.2% 1.4% 0.9% 10 1.2% 1.1% 1.1% 0.5% 78 1.8% 3.1% 1.2% 0.7%
Billboards/ posters 1 0.0% 0.1% 0.1% 0.1% 0.0% 0.1% 0.1% 0.1% 1 0.0% 0.1% 0.1% 0.1%
Others 23 0.6% 0.1% 0.8% 0.3% 1 0.1% 1.1% 1.1% 0.3% 24 0.5% 0.1% 0.9% 0.3%
No Answer 220 6.2% 9.1% 6.7% 5.9% 66 8.0% 8.2% 8.2% 5.5% 286 6.5% 8.5% 7.4% 5.8%
Total 3542 100.0% 100.0% 100.0% 100.0% 825 100.0% 100.0% 100.0% 100.0% 4367 100.0% 100.0% 100.0% 100.0%
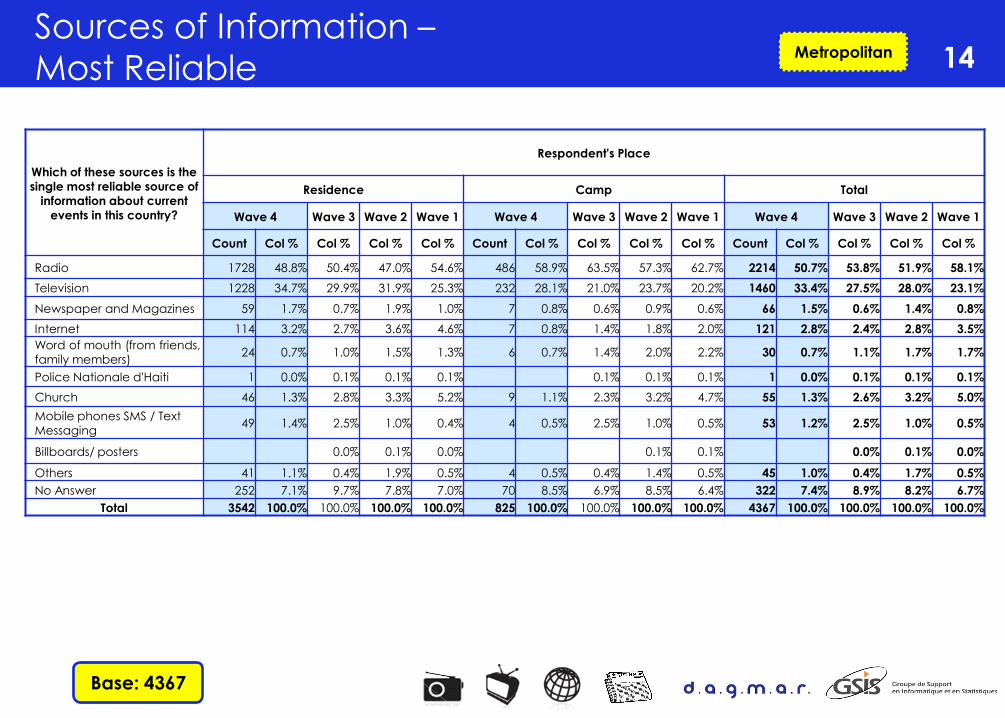
14 Sources of Information –
Most Reliable
Base: 4367
Metropolitan
Which of these sources is the
single most reliable source of
information about current
events in this country?
Respondent's Place
Residence Camp Total
Wave 4 Wave 3 Wave 2 Wave 1 Wave 4 Wave 3 Wave 2 Wave 1 Wave 4 Wave 3 Wave 2 Wave 1
Count Col % Col % Col % Col % Count Col % Col % Col % Col % Count Col % Col % Col % Col %
Radio 1728 48.8% 50.4% 47.0% 54.6% 486 58.9% 63.5% 57.3% 62.7% 2214 50.7% 53.8% 51.9% 58.1%
Television 1228 34.7% 29.9% 31.9% 25.3% 232 28.1% 21.0% 23.7% 20.2% 1460 33.4% 27.5% 28.0% 23.1%
Newspaper and Magazines 59 1.7% 0.7% 1.9% 1.0% 7 0.8% 0.6% 0.9% 0.6% 66 1.5% 0.6% 1.4% 0.8%
Internet 114 3.2% 2.7% 3.6% 4.6% 7 0.8% 1.4% 1.8% 2.0% 121 2.8% 2.4% 2.8% 3.5%
Word of mouth (from friends,
family members) 24 0.7% 1.0% 1.5% 1.3% 6 0.7% 1.4% 2.0% 2.2% 30 0.7% 1.1% 1.7% 1.7%
Police Nationale d'Haiti 1 0.0% 0.1% 0.1% 0.1% 0.1% 0.1% 0.1% 1 0.0% 0.1% 0.1% 0.1%
Church 46 1.3% 2.8% 3.3% 5.2% 9 1.1% 2.3% 3.2% 4.7% 55 1.3% 2.6% 3.2% 5.0%
Mobile phones SMS / Text
Messaging 49 1.4% 2.5% 1.0% 0.4% 4 0.5% 2.5% 1.0% 0.5% 53 1.2% 2.5% 1.0% 0.5%
Billboards/ posters 0.0% 0.1% 0.0% 0.1% 0.1% 0.0% 0.1% 0.0%
Others 41 1.1% 0.4% 1.9% 0.5% 4 0.5% 0.4% 1.4% 0.5% 45 1.0% 0.4% 1.7% 0.5%
No Answer 252 7.1% 9.7% 7.8% 7.0% 70 8.5% 6.9% 8.5% 6.4% 322 7.4% 8.9% 8.2% 6.7%
Total 3542 100.0% 100.0% 100.0% 100.0% 825 100.0% 100.0% 100.0% 100.0% 4367 100.0% 100.0% 100.0% 100.0%
RADIO
15
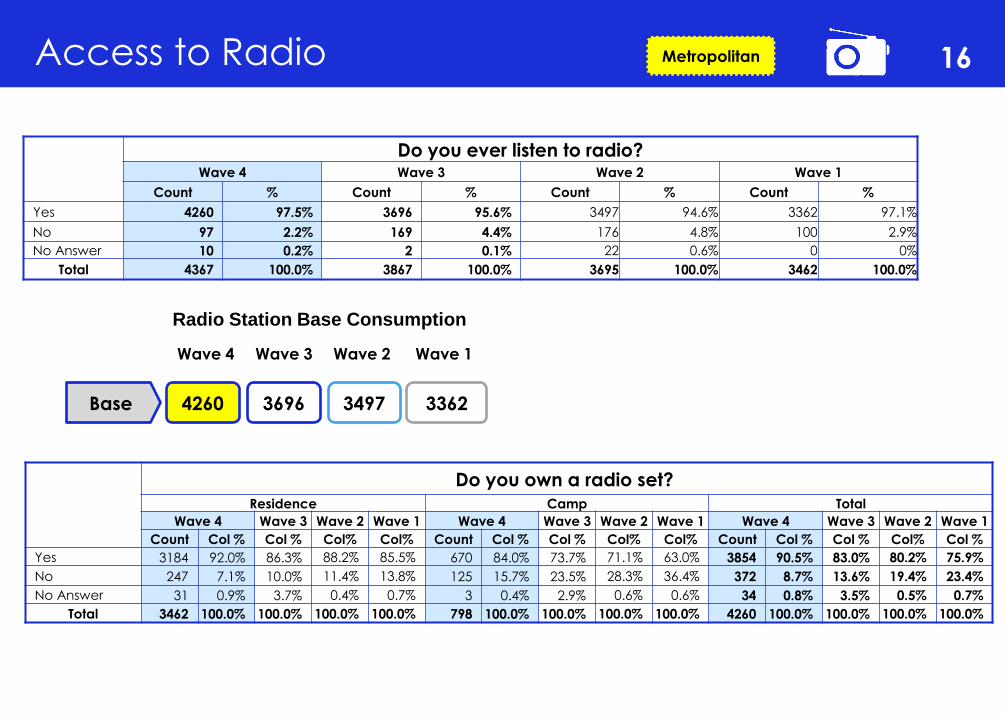
Access to Radio 16
3497 3362 3696 Base
Wave 4 Wave 3 Wave 2 Wave 1
Metropolitan
Do you ever listen to radio?
Wave 4 Wave 3 Wave 2 Wave 1
Count % Count % Count % Count %
Yes 4260 97.5% 3696 95.6% 3497 94.6% 3362 97.1%
No 97 2.2% 169 4.4% 176 4.8% 100 2.9%
No Answer 10 0.2% 2 0.1% 22 0.6% 0 0%
Total 4367 100.0% 3867 100.0% 3695 100.0% 3462 100.0%
4260
Radio Station Base Consumption
Do you own a radio set?
Residence Camp Total
Wave 4 Wave 3 Wave 2 Wave 1 Wave 4 Wave 3 Wave 2 Wave 1 Wave 4 Wave 3 Wave 2 Wave 1
Count Col % Col % Col% Col% Count Col % Col % Col% Col% Count Col % Col % Col% Col %
Yes 3184 92.0% 86.3% 88.2% 85.5% 670 84.0% 73.7% 71.1% 63.0% 3854 90.5% 83.0% 80.2% 75.9%
No 247 7.1% 10.0% 11.4% 13.8% 125 15.7% 23.5% 28.3% 36.4% 372 8.7% 13.6% 19.4% 23.4%
No Answer 31 0.9% 3.7% 0.4% 0.7% 3 0.4% 2.9% 0.6% 0.6% 34 0.8% 3.5% 0.5% 0.7%
Total 3462 100.0% 100.0% 100.0% 100.0% 798 100.0% 100.0% 100.0% 100.0% 4260 100.0% 100.0% 100.0% 100.0%
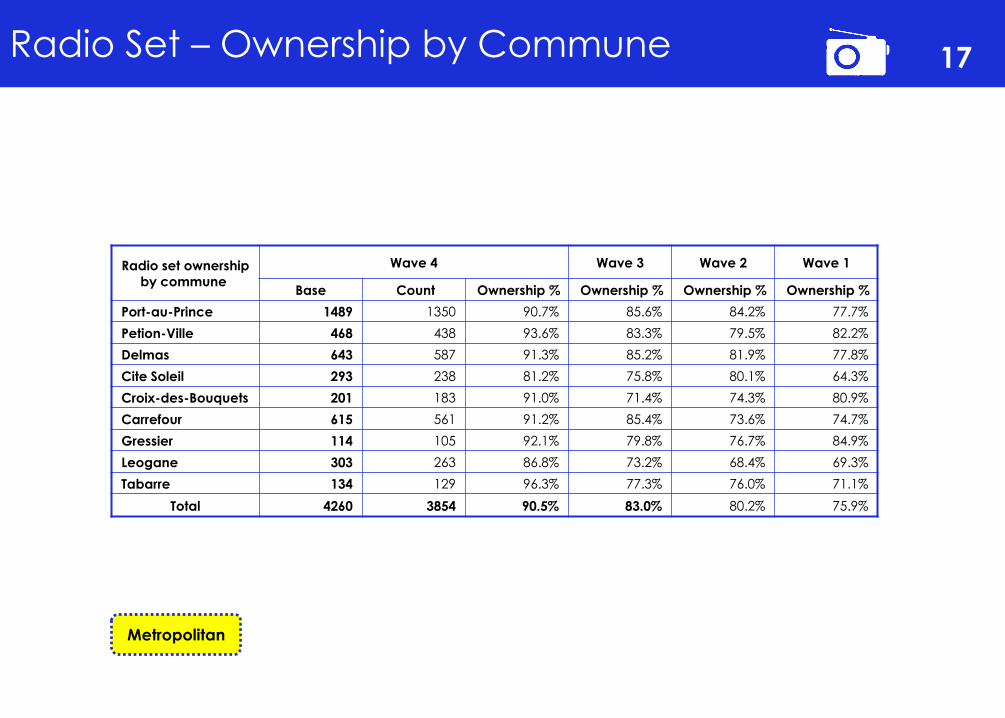
Radio Set – Ownership by Commune 17
Metropolitan
Radio set ownership
by commune
Wave 4 Wave 3 Wave 2 Wave 1
Base Count Ownership % Ownership % Ownership % Ownership %
Port-au-Prince 1489 1350 90.7% 85.6% 84.2% 77.7%
Petion-Ville 468 438 93.6% 83.3% 79.5% 82.2%
Delmas 643 587 91.3% 85.2% 81.9% 77.8%
Cite Soleil 293 238 81.2% 75.8% 80.1% 64.3%
Croix-des-Bouquets 201 183 91.0% 71.4% 74.3% 80.9%
Carrefour 615 561 91.2% 85.4% 73.6% 74.7%
Gressier 114 105 92.1% 79.8% 76.7% 84.9%
Leogane 303 263 86.8% 73.2% 68.4% 69.3%
Tabarre 134 129 96.3% 77.3% 76.0% 71.1%
Total 4260 3854 90.5% 83.0% 80.2% 75.9%
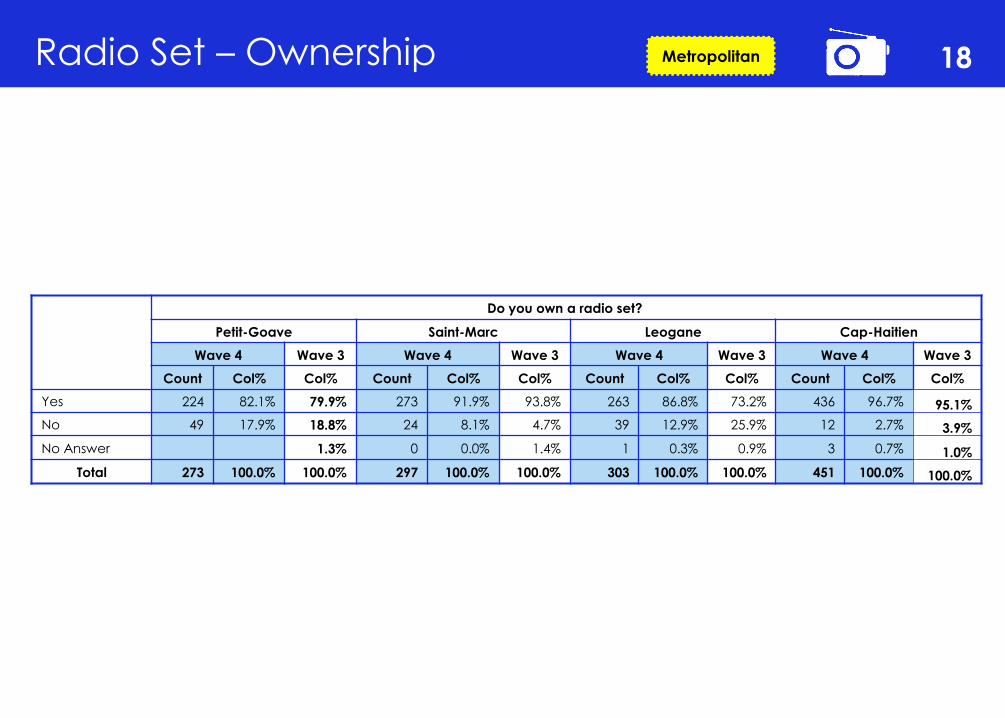
Radio Set – Ownership 18
Metropolitan
Do you own a radio set?
Petit-Goave Saint-Marc Leogane Cap-Haitien
Wave 4 Wave 3 Wave 4 Wave 3 Wave 4 Wave 3 Wave 4 Wave 3
Count Col% Col% Count Col% Col% Count Col% Col% Count Col% Col%
Yes 224 82.1% 79.9% 273 91.9% 93.8% 263 86.8% 73.2% 436 96.7% 95.1%
No 49 17.9% 18.8% 24 8.1% 4.7% 39 12.9% 25.9% 12 2.7% 3.9%
No Answer 1.3% 0 0.0% 1.4% 1 0.3% 0.9% 3 0.7% 1.0%
Total 273 100.0% 100.0% 297 100.0% 100.0% 303 100.0% 100.0% 451 100.0% 100.0%

Radio station listening – Wave 4 For all age groups (Full sample)
19 Metropolitan
RANK RADIO STATIONS W4 WEEKLY REACH
[LISTENERS]
AVERAGE
TSL [HOURS]
%SHARE
W4
%SHARE
W3
%SHARE
W2
%SHARE
W1
1 CARAIBES FM 94.5 735,151 8.0 20.2% 23.0% 22.5% 20.5%
2 SHALLOM 103.7 / INSPIRATION / LAKANSIEL 335,846 10.1 11.6% 3.0% 2.0% 1.2%
3 GUINEN 92.9 313,580 7.3 7.9% 10.0% 8.7% 9.1%
4 LUMIERE 92.1 236,391 8.8 7.2% 7.6% 7.8% 8.6%
5 SIGNAL FM 90.5 141,389 9.0 4.4% 1.7% 2.0% 2.8%
6 UNIVERS FM 101.3 103,166 10.4 3.7% 4.0% 4.4% 4.8%
7 SKY FM 96.5 76,447 12.2 3.2% 2.2% 3.7% 2.5%
8 HORIZON 2000 95.7 96,857 8.9 3.0% 7.7% 10.7% 4.3%
9 KISKEYA 88.5 111,330 7.8 3.0% 3.2% 2.0% 3.0%
10 METROPOLE 100.1 80,529 9.5 2.6% 3.0% 2.4% 2.8%
11 VISION 2000 99.3 85,353 8.7 2.5% 2.8% 2.9% 3.1%
12 IBO 98.5 64,943 9.1 2.0% 2.2% 2.6% 1.9%
13 LA VOIX DE L'EVANGILE 95.3 51,212 10.8 1.9% 3.0% 2.8% 3.1%
14 MEGASTAR 52,325 10.0 1.8% 1.7% 2.0% 2.7%
15 PLANET KREYOL 106.5 48,614 10.2 1.7% 2.0% 2.8% 2.5%
16 SOLEIL 105.5 59,747 8.0 1.7% 1.9% 2.0% 2.3%
17 ZENITH FM 102.5 54,181 7.7 1.4% 1.4% 1.2% 1.1%
18 ONE 90.1 47,872 8.8 1.4% 1.0% 1.2% 1.7%
19 ECLAIR 100.5 27,461 14.4 1.4% 1.0% 1.2% 1.4%
20 GALAXIE 104.5 39,708 9.0 1.2% 1.6% 1.3% 1.8%
21 COOL FM LEOGANE 103.9 57,521 6.1 1.2% 0.8% 0.4% 0.5%
22 NOUVELLE GENERATION 94.1 41,934 8.3 1.2% 0.8% 0.4% 0.5%
23 RADIO NATIONALE D'HAITI 102.1\105.1 40,450 7.3 1.0% 1.0% 1.2% 1.7%
24 RADIO ESPERANCE 29,688 8.3 0.8% 0.9% 0.6% 0.9%
25 SCOOP FM 107.7 23,379 9.4 0.8% 0.7% 0.2% 0.5%
26 RFI HAITI 89.3 23,008 9.3 0.7% 0.7% 0.6% 1.5%
27 ANTILLES INTERNATIONALES 96.9 17,813 10.7 0.7% 0.8% 0.3% 0.8%
28 MINUSTAH FM / MBC 94.9 18,555 10.3 0.7% 0.8% 0.3% 0.8%
29 SUPERSTAR 102.9 13,731 13.5 0.6% 0.7% 0.9% 0.8%
30 ENERGIE FM 101.7 16,700 10.9 0.6% 0.6% 1.0% 0.7%
OTHERS 265,708 8.4 7.70% 8.2% 7.5% 10.8%

Share of Radio Listening – Wave 4 Top 10 Radio Stations- For all age groups
20
Base: 3696
Metropolitan
20
.2%
11
.6%
7.9
%
7.2
%
4.4
%
3.7
%
3.2
%
3.0
%
3.0
%
2.6
%
23
.0%
3.0
%
10
.0%
7.6
%
1.7
%
4.0
%
2.2
%
7.7
%
3.2
%
3.0
%
22
.5%
2.0
%
8.7
%
7.8
%
2.0
%
4.4
%
3.7
%
10
.7%
2.0
%
2.4
%
20
.5%
1.2
%
9.1
%
8.6
%
2.8
% 4
.8%
2.5
% 4
.3%
3.0
%
2.8
%
0.0%
5.0%
10.0%
15.0%
20.0%
25.0%
CARAIBES FM
94.5
SHALLOM
103.7 /
INSPIRATION
/ LAKANSIEL
GUINEN 92.9 LUMIERE 92.1 SIGNAL FM
90.5
UNIVERS FM
101.3
SKY FM 96.5 HORIZON
2000 95.7
KISKEYA 88.5 METROPOLE
100.1
Wave 4 Wave 3 Wave 2 Wave 1
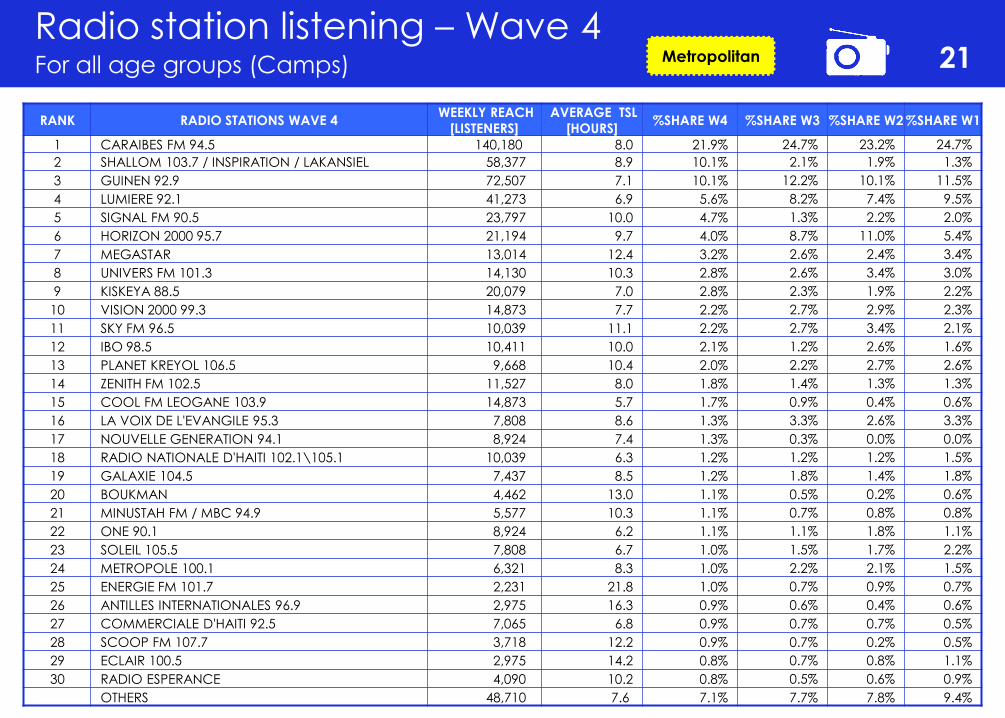
Radio station listening – Wave 4 For all age groups (Camps)
21 Metropolitan
RANK RADIO STATIONS WAVE 4 WEEKLY REACH
[LISTENERS]
AVERAGE TSL
[HOURS] %SHARE W4 %SHARE W3 %SHARE W2 %SHARE W1
1 CARAIBES FM 94.5 140,180 8.0 21.9% 24.7% 23.2% 24.7%
2 SHALLOM 103.7 / INSPIRATION / LAKANSIEL 58,377 8.9 10.1% 2.1% 1.9% 1.3%
3 GUINEN 92.9 72,507 7.1 10.1% 12.2% 10.1% 11.5%
4 LUMIERE 92.1 41,273 6.9 5.6% 8.2% 7.4% 9.5%
5 SIGNAL FM 90.5 23,797 10.0 4.7% 1.3% 2.2% 2.0%
6 HORIZON 2000 95.7 21,194 9.7 4.0% 8.7% 11.0% 5.4%
7 MEGASTAR 13,014 12.4 3.2% 2.6% 2.4% 3.4%
8 UNIVERS FM 101.3 14,130 10.3 2.8% 2.6% 3.4% 3.0%
9 KISKEYA 88.5 20,079 7.0 2.8% 2.3% 1.9% 2.2%
10 VISION 2000 99.3 14,873 7.7 2.2% 2.7% 2.9% 2.3%
11 SKY FM 96.5 10,039 11.1 2.2% 2.7% 3.4% 2.1%
12 IBO 98.5 10,411 10.0 2.1% 1.2% 2.6% 1.6%
13 PLANET KREYOL 106.5 9,668 10.4 2.0% 2.2% 2.7% 2.6%
14 ZENITH FM 102.5 11,527 8.0 1.8% 1.4% 1.3% 1.3%
15 COOL FM LEOGANE 103.9 14,873 5.7 1.7% 0.9% 0.4% 0.6%
16 LA VOIX DE L'EVANGILE 95.3 7,808 8.6 1.3% 3.3% 2.6% 3.3%
17 NOUVELLE GENERATION 94.1 8,924 7.4 1.3% 0.3% 0.0% 0.0%
18 RADIO NATIONALE D'HAITI 102.1\105.1 10,039 6.3 1.2% 1.2% 1.2% 1.5%
19 GALAXIE 104.5 7,437 8.5 1.2% 1.8% 1.4% 1.8%
20 BOUKMAN 4,462 13.0 1.1% 0.5% 0.2% 0.6%
21 MINUSTAH FM / MBC 94.9 5,577 10.3 1.1% 0.7% 0.8% 0.8%
22 ONE 90.1 8,924 6.2 1.1% 1.1% 1.8% 1.1%
23 SOLEIL 105.5 7,808 6.7 1.0% 1.5% 1.7% 2.2%
24 METROPOLE 100.1 6,321 8.3 1.0% 2.2% 2.1% 1.5%
25 ENERGIE FM 101.7 2,231 21.8 1.0% 0.7% 0.9% 0.7%
26 ANTILLES INTERNATIONALES 96.9 2,975 16.3 0.9% 0.6% 0.4% 0.6%
27 COMMERCIALE D'HAITI 92.5 7,065 6.8 0.9% 0.7% 0.7% 0.5%
28 SCOOP FM 107.7 3,718 12.2 0.9% 0.7% 0.2% 0.5%
29 ECLAIR 100.5 2,975 14.2 0.8% 0.7% 0.8% 1.1%
30 RADIO ESPERANCE 4,090 10.2 0.8% 0.5% 0.6% 0.9%
OTHERS 48,710 7.6 7.1% 7.7% 7.8% 9.4%

Radio station listening – Wave 4 Target Group 15 – 24 years old 22 Metropolitan
RANK RADIO STATIONS WAVE 4 WEEKLY REACH
[LISTENERS]
AVERAGE TSL
[HOURS] %SHARE W4 %SHARE W3 %SHARE W2 %SHARE W1
1 CARAIBES FM 94.5 107,240 8.7 18.5% 21.9% 23.1% 22.2%
2 SHALLOM 103.7 / INSPIRATION / LAKANSIEL 65,163 8.3 10.6% 2.8% 1.9% 1.6%
3 UNIVERS FM 101.3 38,353 10.2 7.7% 5.1% 5.6% 5.0%
4 SKY FM 96.5 35,747 10.7 7.5% 2.4% 3.4% 2.0%
5 GUINEN 92.9 35,002 7.4 5.1% 8.5% 7.7% 8.5%
6 LUMIERE 92.1 27,927 9.0 5.0% 4.9% 6.6% 7.4%
7 PLANET KREYOL 106.5 17,129 10.5 3.6% 2.6% 2.8% 2.6%
8 SIGNAL FM 90.5 15,639 10.7 3.3% 1.3% 2.2% 2.9%
9 HORIZON 2000 95.7 23,086 6.8 3.1% 10.5% 12.7% 4.4%
10 ECLAIR 100.5 12,660 11.0 2.7% 0.6% 1.1% 1.2%
11 ONE 90.1 14,522 8.1 2.3% 1.2% 1.3% 1.5%
12 MEGASTAR 10,799 10.8 2.3% 1.6% 1.9% 2.2%
13 VISION 2000 99.3 8,564 11.2 1.9% 2.5% 3.1% 2.5%
14 ZENITH FM 102.5 10,426 9.2 1.9% 1.2% 1.7% 1.5%
15 RCH 2000 96.1 7,075 13.2 1.9% 0.4% 0.3% 1.0%
16 NOUVELLE GENERATION 94.1 7,820 10.3 1.6% 0.3% 0.3% 0.6%
17 IBO 98.5 7,820 9.7 1.5% 3.1% 2.5% 1.7%
18 METROPOLE 100.1 8,564 7.8 1.3% 2.3% 2.1% 3.3%
19 RADIO ESPERANCE 7,447 7.5 1.1% 1.1% 0.6% 0.7%
20 LA VOIX DE L'EVANGILE 95.3 6,703 7.6 1.0% 2.4% 2.4% 2.5%
21 AMICAL LEOGANE 101.5 6,703 7.3 1.0% 1.0% 0.2% 0.4%
22 MAGIC 9 100.9 4,096 11.7 0.9% 1.0% 0.6% 0.7%
23 COOL FM LEOGANE 103.9 6,703 7.1 0.9% 1.2% 0.4% 0.6%
24 KISKEYA 88.5 7,447 6.1 0.9% 2.1% 1.6% 2.8%
25 SOLEIL 105.5 5,585 8.0 0.9% 1.2% 1.2% 1.5%
26 VISA FM 88.1 4,468 9.2 0.8% 0.9% 0.3% 0.7%
27 COMMERCIALE D'HAITI 92.5 4,468 8.9 0.8% 0.9% 1.1% 0.5%
28 RFI HAITI 89.3 2,979 11.9 0.7% 1.0% 0.6% 2.0%
29 MINUSTAH FM / MBC 94.9 3,724 9.5 0.7% 0.4% 0.6% 0.7%
30 SUPERSTAR 102.9 3,351 9.9 0.7% 0.7% 1.1% 0.8%
OTHER 67,398 8.2 7.9% 12.8% 9.0% 14.0%

Radio station listening – Wave 4 Target Group 25 – 34 years old 23 Metropolitan
RANK RADIO STATIONS WAVE 4 WEEKLY REACH
[LISTENERS]
AVERAGE TSL
[HOURS]
%SHARE
W4
%SHARE
W3
%SHARE
W2
%SHARE
W1
1 CARAIBES FM 94.5 1,925,269 8.3 19.1% 23.7% 24.4% 21.0%
2 SHALLOM 103.7 / INSPIRATION / LAKANSIEL 791,665 10.4 9.9% 3.0% 3.1% 1.1%
3 GUINEN 92.9 654,146 7.8 6.2% 10.0% 10.8% 11.7%
4 UNIVERS FM 101.3 386,541 11.6 5.4% 3.1% 2.1% 3.0%
5 SKY FM 96.5 297,339 14.7 5.3% 0.8% 2.2% 0.8%
6 LUMIERE 92.1 401,408 9.2 4.4% 8.3% 9.3% 8.7%
7 HORIZON 2000 95.7 338,223 10.1 4.1% 8.2% 8.1% 4.2%
8 SIGNAL FM 90.5 319,639 10.3 4.0% 1.7% 1.8% 4.1%
9 IBO 98.5 249,021 10.4 3.1% 2.7% 3.4% 2.3%
10 KISKEYA 88.5 226,721 11.3 3.1% 4.0% 1.8% 4.3%
11 VISION 2000 99.3 256,455 8.9 2.7% 3.0% 4.1% 3.4%
12 PLANET KREYOL 106.5 211,854 10.6 2.7% 1.5% 2.7% 0.9%
13 ECLAIR 100.5 92,918 21.3 2.4% 0.6% 1.1% 1.2%
14 METROPOLE 100.1 196,987 9.7 2.3% 3.6% 3.0% 2.9%
15 ONE 90.1 174,687 10.3 2.2% 0.6% 0.2% 1.0%
16 ZENITH FM 102.5 189,554 8.4 1.9% 1.4% 0.5% 1.1%
17 MEGASTAR 141,236 9.9 1.7% 2.2% 1.9% 2.4%
18 COOL FM LEOGANE 103.9 185,837 7.1 1.6% 0.6% 0.4% 0.0%
19 LA VOIX DE L'EVANGILE 95.3 115,219 11.4 1.6% 3.4% 2.1% 2.8%
20 NOUVELLE GENERATION 94.1 118,936 8.2 1.2% 0.3% 0.3% 0.6%
21 SOLEIL 105.5 118,936 8.0 1.1% 2.4% 2.5% 2.2%
22 SUPERSTAR 102.9 33,451 27.3 1.1% 0.6% 1.1% 1.0%
23 GALAXIE 104.5 89,202 8.4 0.9% 1.6% 1.8% 2.7%
24 ENERGIE FM 101.7 70,618 10.6 0.9% 0.9% 0.8% 0.4%
25 IMPACT / ETOILE 91.7 74,335 10.0 0.9% 0.2% 0.9% 0.4%
26 BOUKMAN 70,618 9.4 0.8% 0.6% 0.2% 0.6%
27 MINUSTAH FM / MBC 94.9 55,751 11.2 0.8% 0.5% 0.8% 0.9%
28 VISA FM 88.1 59,468 10.4 0.7% 0.7% 0.3% 0.9%
29 ANTILLES INTERNATIONALES 96.9 59,468 9.7 0.7% 0.6% 0.2% 0.5%
30 RFI HAITI 89.3 59,468 9.3 0.7% 0.7% 0.6% 1.5%
AUTRES 631,845 9.6 6.5% 8.5% 7.5% 11.4%
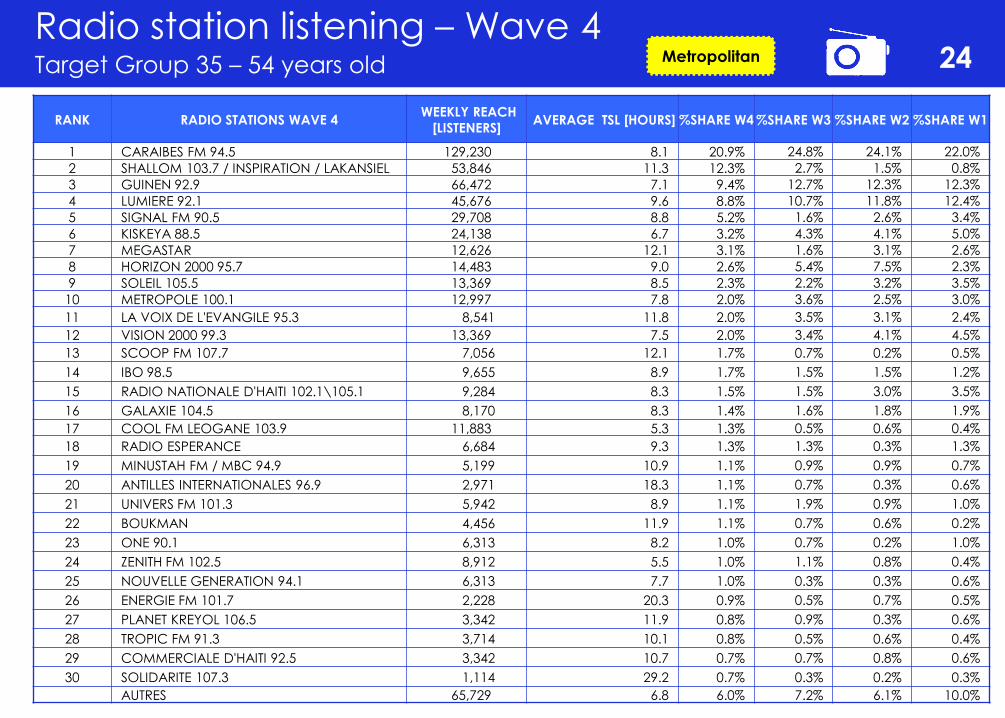
Radio station listening – Wave 4 Target Group 35 – 54 years old 24 Metropolitan
RANK RADIO STATIONS WAVE 4 WEEKLY REACH
[LISTENERS] AVERAGE TSL [HOURS] %SHARE W4 %SHARE W3 %SHARE W2 %SHARE W1
1 CARAIBES FM 94.5 129,230 8.1 20.9% 24.8% 24.1% 22.0%
2 SHALLOM 103.7 / INSPIRATION / LAKANSIEL 53,846 11.3 12.3% 2.7% 1.5% 0.8%
3 GUINEN 92.9 66,472 7.1 9.4% 12.7% 12.3% 12.3%
4 LUMIERE 92.1 45,676 9.6 8.8% 10.7% 11.8% 12.4%
5 SIGNAL FM 90.5 29,708 8.8 5.2% 1.6% 2.6% 3.4%
6 KISKEYA 88.5 24,138 6.7 3.2% 4.3% 4.1% 5.0%
7 MEGASTAR 12,626 12.1 3.1% 1.6% 3.1% 2.6%
8 HORIZON 2000 95.7 14,483 9.0 2.6% 5.4% 7.5% 2.3%
9 SOLEIL 105.5 13,369 8.5 2.3% 2.2% 3.2% 3.5%
10 METROPOLE 100.1 12,997 7.8 2.0% 3.6% 2.5% 3.0%
11 LA VOIX DE L'EVANGILE 95.3 8,541 11.8 2.0% 3.5% 3.1% 2.4%
12 VISION 2000 99.3 13,369 7.5 2.0% 3.4% 4.1% 4.5%
13 SCOOP FM 107.7 7,056 12.1 1.7% 0.7% 0.2% 0.5%
14 IBO 98.5 9,655 8.9 1.7% 1.5% 1.5% 1.2%
15 RADIO NATIONALE D'HAITI 102.1\105.1 9,284 8.3 1.5% 1.5% 3.0% 3.5%
16 GALAXIE 104.5 8,170 8.3 1.4% 1.6% 1.8% 1.9%
17 COOL FM LEOGANE 103.9 11,883 5.3 1.3% 0.5% 0.6% 0.4%
18 RADIO ESPERANCE 6,684 9.3 1.3% 1.3% 0.3% 1.3%
19 MINUSTAH FM / MBC 94.9 5,199 10.9 1.1% 0.9% 0.9% 0.7%
20 ANTILLES INTERNATIONALES 96.9 2,971 18.3 1.1% 0.7% 0.3% 0.6%
21 UNIVERS FM 101.3 5,942 8.9 1.1% 1.9% 0.9% 1.0%
22 BOUKMAN 4,456 11.9 1.1% 0.7% 0.6% 0.2%
23 ONE 90.1 6,313 8.2 1.0% 0.7% 0.2% 1.0%
24 ZENITH FM 102.5 8,912 5.5 1.0% 1.1% 0.8% 0.4%
25 NOUVELLE GENERATION 94.1 6,313 7.7 1.0% 0.3% 0.3% 0.6%
26 ENERGIE FM 101.7 2,228 20.3 0.9% 0.5% 0.7% 0.5%
27 PLANET KREYOL 106.5 3,342 11.9 0.8% 0.9% 0.3% 0.6%
28 TROPIC FM 91.3 3,714 10.1 0.8% 0.5% 0.6% 0.4%
29 COMMERCIALE D'HAITI 92.5 3,342 10.7 0.7% 0.7% 0.8% 0.6%
30 SOLIDARITE 107.3 1,114 29.2 0.7% 0.3% 0.2% 0.3%
AUTRES 65,729 6.8 6.0% 7.2% 6.1% 10.0%

Radio station listening – Wave 4 Target Group 55years old and up 25 Metropolitan
RANK RADIO STATIONS WAVE 4 WEEKLY REACH
[LISTENERS]
AVERAGE TSL
[HOURS]
%SHARE
W4
%SHARE
W3
%SHARE
W2
%SHARE
W1
1 CARAIBES FM 94.5 357,790 8.2 24.4% 25.4% 22.3% 19.8%
2 LUMIERE 92.1 195,493 8.3 13.5% 12.1% 15.1% 13.6%
3 GUINEN 92.9 180,739 8.2 12.3% 13.1% 10.7% 11.5%
4 SHALLOM 103.7 / INSPIRATION / LAKANSIEL 129,099 9.4 10.1% 3.0% 1.8% 1.0%
5 METROPOLE 100.1 44,263 15.7 5.8% 3.3% 3.3% 4.6%
6 SIGNAL FM 90.5 73,771 7.4 4.6% 3.1% 4.8% 4.0%
7 KISKEYA 88.5 66,394 7.1 3.9% 5.5% 4.4% 6.3%
8 VISION 2000 99.3 36,886 8.7 2.7% 2.9% 2.6% 3.5%
9 GALAXIE 104.5 25,820 10.7 2.3% 1.9% 1.0% 2.0%
10 NOUVELLE GENERATION 94.1 25,820 9.0 1.9% 0.3% 0.2% 0.2%
11 ANTILLES INTERNATIONALES 96.9 14,754 14.2 1.7% 0.9% 0.2% 1.1%
12 LA VOIX DE L'EVANGILE 95.3 18,443 11.0 1.7% 4.0% 5.6% 4.4%
13 RADIO NATIONALE D'HAITI 102.1\105.1 29,508 6.6 1.6% 2.2% 1.7% 3.5%
14 SOLEIL 105.5 44,263 4.3 1.6% 2.6% 4.9% 3.8%
15 HORIZON 2000 95.7 14,754 10.1 1.2% 4.3% 4.6% 1.0%
16 IBO 98.5 22,131 5.7 1.1% 0.7% 2.5% 1.1%
17 MEGASTAR 7,377 17.0 1.0% 1.8% 1.1% 1.7%
18 SCOOP FM 107.7 7,377 14.0 0.9% 1.0% 0.2% 0.3%
19 UNIVERS FM 101.3 11,066 9.0 0.8% 1.1% 1.9% 0.5%
20 SUPERSTAR 102.9 7,377 10.9 0.7% 0.5% 0.2% 0.4%
21 COOL FM LEOGANE 103.9 14,754 5.3 0.6% 0.4% 0.3% 0.4%
22 AMICAL LEOGANE 101.5 11,066 6.4 0.6% 0.5% 0.2% 0.4%
23 GRESSIER INTER GRESSIER 93.3 7,377 8.5 0.5% 0.3% 0.0% 0.0%
24 ZENITH FM 102.5 7,377 8.4 0.5% 1.3% 0.6% 0.1%
25 KADANS FM 106.9 7,377 7.1 0.4% 0.2% 0.1% 0.2%
26 RADIO ESPERANCE 11,066 4.7 0.4% 0.5% 1.3% 1.7%
27 VASCO 93.7 3,689 14.0 0.4% 0.2% 0.4% 0.7%
28 ONE 90.1 3,689 12.7 0.4% 1.0% 1.2% 1.4%
29 ANACAONA LEOGANE 103.5 7,377 5.3 0.3% 0.1% 0.0% 0.1%
30 MELODIE FM 103.3 3,689 9.8 0.3% 0.9% 0.6% 0.6%
AUTRES 896,318 5.2 0.3% 4.9% 6.2% 10.1%
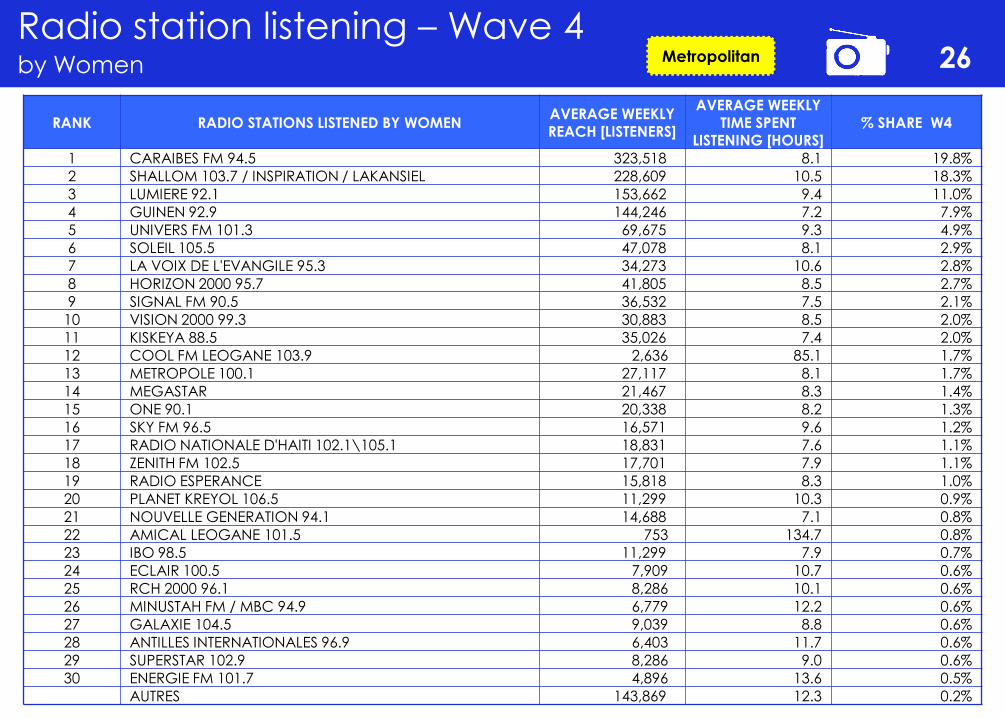
Radio station listening – Wave 4 by Women 26 Metropolitan
RANK RADIO STATIONS LISTENED BY WOMEN AVERAGE WEEKLY
REACH [LISTENERS]
AVERAGE WEEKLY
TIME SPENT LISTENING [HOURS]
% SHARE W4
1 CARAIBES FM 94.5 323,518 8.1 19.8%
2 SHALLOM 103.7 / INSPIRATION / LAKANSIEL 228,609 10.5 18.3%
3 LUMIERE 92.1 153,662 9.4 11.0%
4 GUINEN 92.9 144,246 7.2 7.9%
5 UNIVERS FM 101.3 69,675 9.3 4.9%
6 SOLEIL 105.5 47,078 8.1 2.9%
7 LA VOIX DE L'EVANGILE 95.3 34,273 10.6 2.8%
8 HORIZON 2000 95.7 41,805 8.5 2.7%
9 SIGNAL FM 90.5 36,532 7.5 2.1%
10 VISION 2000 99.3 30,883 8.5 2.0%
11 KISKEYA 88.5 35,026 7.4 2.0%
12 COOL FM LEOGANE 103.9 2,636 85.1 1.7%
13 METROPOLE 100.1 27,117 8.1 1.7%
14 MEGASTAR 21,467 8.3 1.4%
15 ONE 90.1 20,338 8.2 1.3%
16 SKY FM 96.5 16,571 9.6 1.2%
17 RADIO NATIONALE D'HAITI 102.1\105.1 18,831 7.6 1.1%
18 ZENITH FM 102.5 17,701 7.9 1.1%
19 RADIO ESPERANCE 15,818 8.3 1.0%
20 PLANET KREYOL 106.5 11,299 10.3 0.9%
21 NOUVELLE GENERATION 94.1 14,688 7.1 0.8%
22 AMICAL LEOGANE 101.5 753 134.7 0.8%
23 IBO 98.5 11,299 7.9 0.7%
24 ECLAIR 100.5 7,909 10.7 0.6%
25 RCH 2000 96.1 8,286 10.1 0.6%
26 MINUSTAH FM / MBC 94.9 6,779 12.2 0.6%
27 GALAXIE 104.5 9,039 8.8 0.6%
28 ANTILLES INTERNATIONALES 96.9 6,403 11.7 0.6%
29 SUPERSTAR 102.9 8,286 9.0 0.6%
30 ENERGIE FM 101.7 4,896 13.6 0.5%
AUTRES 143,869 12.3 0.2%
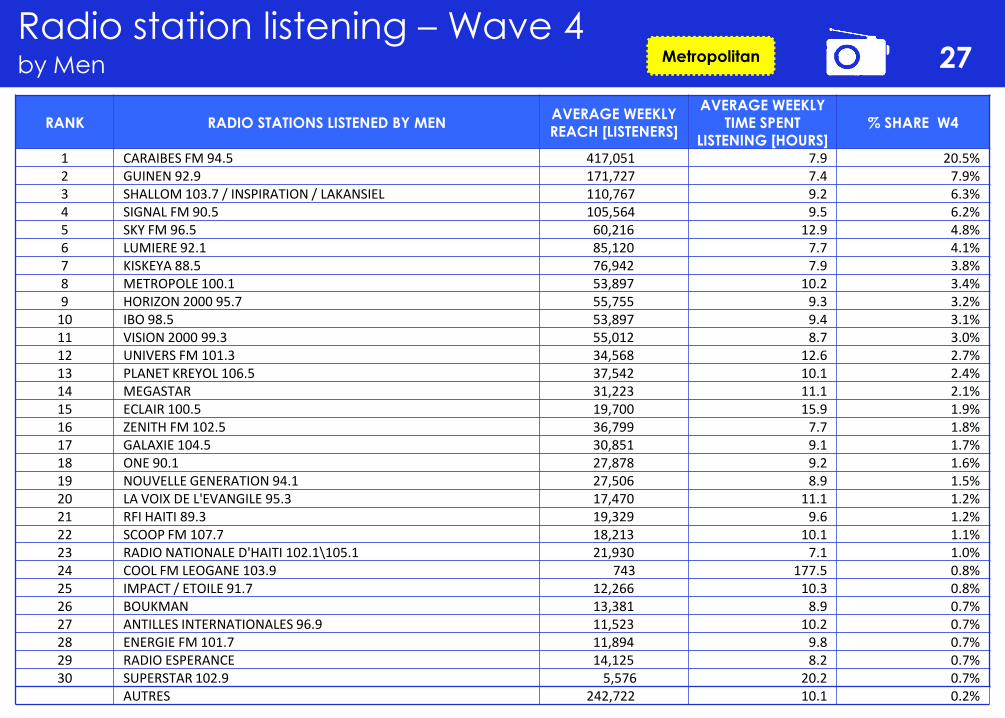
Radio station listening – Wave 4 by Men 27 Metropolitan
RANK RADIO STATIONS LISTENED BY MEN AVERAGE WEEKLY
REACH [LISTENERS]
AVERAGE WEEKLY
TIME SPENT LISTENING [HOURS]
% SHARE W4
1 CARAIBES FM 94.5 417,051 7.9 20.5% 2 GUINEN 92.9 171,727 7.4 7.9% 3 SHALLOM 103.7 / INSPIRATION / LAKANSIEL 110,767 9.2 6.3% 4 SIGNAL FM 90.5 105,564 9.5 6.2% 5 SKY FM 96.5 60,216 12.9 4.8% 6 LUMIERE 92.1 85,120 7.7 4.1% 7 KISKEYA 88.5 76,942 7.9 3.8% 8 METROPOLE 100.1 53,897 10.2 3.4% 9 HORIZON 2000 95.7 55,755 9.3 3.2%
10 IBO 98.5 53,897 9.4 3.1% 11 VISION 2000 99.3 55,012 8.7 3.0% 12 UNIVERS FM 101.3 34,568 12.6 2.7% 13 PLANET KREYOL 106.5 37,542 10.1 2.4% 14 MEGASTAR 31,223 11.1 2.1% 15 ECLAIR 100.5 19,700 15.9 1.9% 16 ZENITH FM 102.5 36,799 7.7 1.8% 17 GALAXIE 104.5 30,851 9.1 1.7% 18 ONE 90.1 27,878 9.2 1.6% 19 NOUVELLE GENERATION 94.1 27,506 8.9 1.5% 20 LA VOIX DE L'EVANGILE 95.3 17,470 11.1 1.2% 21 RFI HAITI 89.3 19,329 9.6 1.2% 22 SCOOP FM 107.7 18,213 10.1 1.1% 23 RADIO NATIONALE D'HAITI 102.1\105.1 21,930 7.1 1.0% 24 COOL FM LEOGANE 103.9 743 177.5 0.8% 25 IMPACT / ETOILE 91.7 12,266 10.3 0.8% 26 BOUKMAN 13,381 8.9 0.7% 27 ANTILLES INTERNATIONALES 96.9 11,523 10.2 0.7% 28 ENERGIE FM 101.7 11,894 9.8 0.7% 29 RADIO ESPERANCE 14,125 8.2 0.7% 30 SUPERSTAR 102.9 5,576 20.2 0.7%
AUTRES 242,722 10.1 0.2%

Radio station listening – Wave 4 by Men at Cite Soleil 28 Metropolitan
RANK RADIO STATIONS LISTENED MEN AT CITE SOLEIL AVERAGE WEEKLY REACH [LISTENERS]
AVERAGE WEEKLY
TIME SPENT LISTENING [HOURS]
% SHARE W4
1 CARAIBES FM 94.5 33,617 7.1 20.1% 2 SHALLOM 103.7 / INSPIRATION / LAKANSIEL 13,045 8.2 9.0% 3 GUINEN 92.9 16,056 5.5 7.5% 4 SIGNAL FM 90.5 8,530 7.3 5.2% 5 NOUVELLE GENERATION 94.1 6,523 8.3 4.5% 6 BOUKMAN 7,024 7.5 4.4% 7 ZENITH FM 102.5 6,523 7.9 4.4% 8 HORIZON 2000 95.7 5,519 7.8 3.6% 9 SKY FM 96.5 5,017 8.2 3.5%
10 LUMIERE 92.1 6,021 6.6 3.3% 11 KISKEYA 88.5 4,516 6.8 2.6% 12 PLANET KREYOL 106.5 3,512 8.4 2.5% 13 IBO 98.5 3,512 7.5 2.2% 14 RADIO NATIONALE D'HAITI 102.1\105.1 3,512 7.1 2.1% 15 GALAXIE 104.5 3,010 7.5 1.9% 16 UNIVERS FM 101.3 2,509 8.9 1.9% 17 COMMERCIALE D'HAITI 92.5 3,010 6.9 1.8% 18 VISION 2000 99.3 2,509 7.9 1.7% 19 IMPACT / ETOILE 91.7 2,509 7.6 1.6% 20 SCOOP FM 107.7 2,007 9.4 1.6% 21 MEGASTAR 3,010 5.6 1.4% 22 MELODIE FM 103.3 1,003 13.5 1.1% 23 RFI HAITI 89.3 1,003 12.5 1.1% 24 SOLIDARITE 107.3 1,003 12.4 1.0% 25 ONE 90.1 1,003 12.3 1.0% 26 MINUSTAH FM / MBC 94.9 1,505 7.3 0.9% 27 LA VOIX DE L'EVANGILE 95.3 1,505 7.0 0.9% 28 ENERGIE FM 101.7 1,003 10.2 0.9% 29 ANTILLES INTERNATIONALES 96.9 2,007 5.0 0.8% 30 TROPIC FM 91.3 1,003 10.0 0.8%
AUTRES 152,531 7.7 0.5%

Radio station listening – Wave 4 by Women at Cite Soleil 29 Metropolitan
RANK RADIO STATIONS LISTENED BY WOMEN AT CITE SOLEIL AVERAGE WEEKLY
REACH [LISTENERS]
AVERAGE WEEKLY
TIME SPENT LISTENING [HOURS]
% SHARE W4
1 SHALLOM 103.7 / INSPIRATION / LAKANSIEL 28,178 6.2 21.8% 2 CARAIBES FM 94.5 27,614 5.2 17.9% 3 LUMIERE 92.1 9,580 6.1 7.3% 4 GUINEN 92.9 11,271 4.2 5.8% 5 UNIVERS FM 101.3 6,199 6.4 4.9% 6 SIGNAL FM 90.5 3,945 7.5 3.7% 7 HORIZON 2000 95.7 4,508 6.0 3.3% 8 NOUVELLE GENERATION 94.1 3,381 6.6 2.8% 9 PLANET KREYOL 106.5 3,381 6.6 2.8%
10 MEGASTAR 3,945 5.5 2.7% 11 LA VOIX DE L'EVANGILE 95.3 2,818 7.4 2.6% 12 SOLEIL 105.5 3,381 5.1 2.1% 13 SKY FM 96.5 1,691 9.5 2.0% 14 BOUKMAN 2,818 5.5 1.9% 15 ECLAIR 100.5 1,127 13.5 1.9% 16 ZENITH FM 102.5 2,254 6.8 1.9% 17 RADIO ESPERANCE 2,818 5.2 1.8% 18 COMMERCIALE D'HAITI 92.5 2,254 6.1 1.7% 19 KISKEYA 88.5 2,254 5.8 1.6% 20 METROPOLE 100.1 1,691 6.7 1.4% 21 IBO 98.5 1,127 8.1 1.1% 22 VISION 2000 99.3 1,127 7.1 1.0% 23 GALAXIE 104.5 1,127 6.5 0.9% 24 SUPERSTAR 102.9 564 12.0 0.8% 25 ENERGIE FM 101.7 1,127 5.3 0.7% 26 VISA FM 88.1 564 8.5 0.6% 27 SCOOP FM 107.7 564 8.0 0.6% 28 TROPIC FM 91.3 564 8.0 0.6% 29 ORPHELIA 564 8.0 0.6% 30 IMPACT / ETOILE 91.7 564 7.0 0.5% AUTRES 15,780 1.7 0.2%
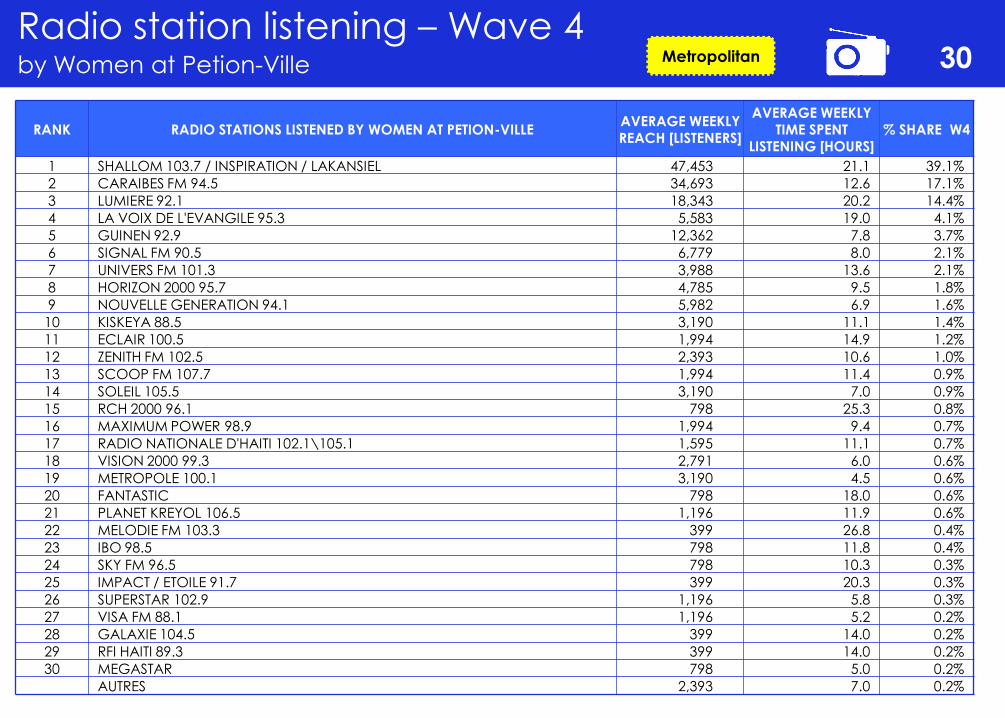
Radio station listening – Wave 4 by Women at Petion-Ville 30 Metropolitan
RANK RADIO STATIONS LISTENED BY WOMEN AT PETION-VILLE AVERAGE WEEKLY REACH [LISTENERS]
AVERAGE WEEKLY TIME SPENT
LISTENING [HOURS] % SHARE W4
1 SHALLOM 103.7 / INSPIRATION / LAKANSIEL 47,453 21.1 39.1%
2 CARAIBES FM 94.5 34,693 12.6 17.1%
3 LUMIERE 92.1 18,343 20.2 14.4%
4 LA VOIX DE L'EVANGILE 95.3 5,583 19.0 4.1%
5 GUINEN 92.9 12,362 7.8 3.7%
6 SIGNAL FM 90.5 6,779 8.0 2.1%
7 UNIVERS FM 101.3 3,988 13.6 2.1%
8 HORIZON 2000 95.7 4,785 9.5 1.8%
9 NOUVELLE GENERATION 94.1 5,982 6.9 1.6%
10 KISKEYA 88.5 3,190 11.1 1.4%
11 ECLAIR 100.5 1,994 14.9 1.2%
12 ZENITH FM 102.5 2,393 10.6 1.0%
13 SCOOP FM 107.7 1,994 11.4 0.9%
14 SOLEIL 105.5 3,190 7.0 0.9%
15 RCH 2000 96.1 798 25.3 0.8%
16 MAXIMUM POWER 98.9 1,994 9.4 0.7%
17 RADIO NATIONALE D'HAITI 102.1\105.1 1,595 11.1 0.7%
18 VISION 2000 99.3 2,791 6.0 0.6%
19 METROPOLE 100.1 3,190 4.5 0.6%
20 FANTASTIC 798 18.0 0.6%
21 PLANET KREYOL 106.5 1,196 11.9 0.6%
22 MELODIE FM 103.3 399 26.8 0.4%
23 IBO 98.5 798 11.8 0.4%
24 SKY FM 96.5 798 10.3 0.3%
25 IMPACT / ETOILE 91.7 399 20.3 0.3%
26 SUPERSTAR 102.9 1,196 5.8 0.3%
27 VISA FM 88.1 1,196 5.2 0.2%
28 GALAXIE 104.5 399 14.0 0.2%
29 RFI HAITI 89.3 399 14.0 0.2%
30 MEGASTAR 798 5.0 0.2%
AUTRES 2,393 7.0 0.2%
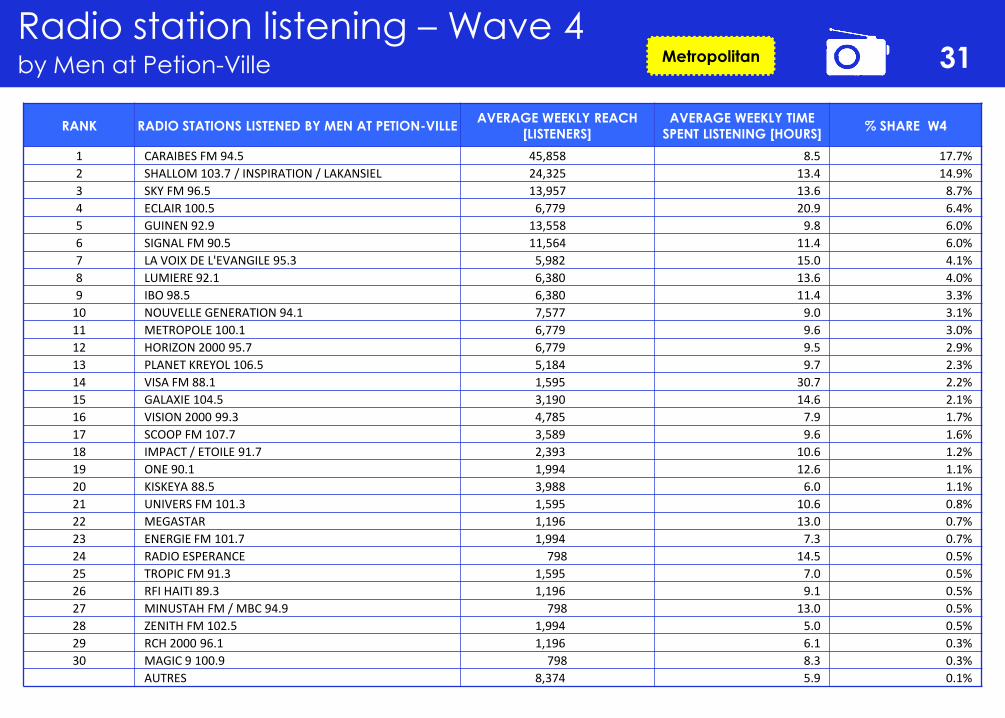
Radio station listening – Wave 4 by Men at Petion-Ville 31 Metropolitan
RANK RADIO STATIONS LISTENED BY MEN AT PETION-VILLE AVERAGE WEEKLY REACH
[LISTENERS]
AVERAGE WEEKLY TIME
SPENT LISTENING [HOURS] % SHARE W4
1 CARAIBES FM 94.5 45,858 8.5 17.7%
2 SHALLOM 103.7 / INSPIRATION / LAKANSIEL 24,325 13.4 14.9%
3 SKY FM 96.5 13,957 13.6 8.7%
4 ECLAIR 100.5 6,779 20.9 6.4%
5 GUINEN 92.9 13,558 9.8 6.0%
6 SIGNAL FM 90.5 11,564 11.4 6.0%
7 LA VOIX DE L'EVANGILE 95.3 5,982 15.0 4.1%
8 LUMIERE 92.1 6,380 13.6 4.0%
9 IBO 98.5 6,380 11.4 3.3%
10 NOUVELLE GENERATION 94.1 7,577 9.0 3.1%
11 METROPOLE 100.1 6,779 9.6 3.0%
12 HORIZON 2000 95.7 6,779 9.5 2.9%
13 PLANET KREYOL 106.5 5,184 9.7 2.3%
14 VISA FM 88.1 1,595 30.7 2.2%
15 GALAXIE 104.5 3,190 14.6 2.1%
16 VISION 2000 99.3 4,785 7.9 1.7%
17 SCOOP FM 107.7 3,589 9.6 1.6%
18 IMPACT / ETOILE 91.7 2,393 10.6 1.2%
19 ONE 90.1 1,994 12.6 1.1%
20 KISKEYA 88.5 3,988 6.0 1.1%
21 UNIVERS FM 101.3 1,595 10.6 0.8%
22 MEGASTAR 1,196 13.0 0.7%
23 ENERGIE FM 101.7 1,994 7.3 0.7%
24 RADIO ESPERANCE 798 14.5 0.5%
25 TROPIC FM 91.3 1,595 7.0 0.5%
26 RFI HAITI 89.3 1,196 9.1 0.5%
27 MINUSTAH FM / MBC 94.9 798 13.0 0.5%
28 ZENITH FM 102.5 1,994 5.0 0.5%
29 RCH 2000 96.1 1,196 6.1 0.3%
30 MAGIC 9 100.9 798 8.3 0.3%
AUTRES 8,374 5.9 0.1%

0
50
100
150
200
250
300
350
400
450
Monday to Friday top 5 radio stations listening by ½ hour time slot
32
Responses
CARAIBES FM
Morning Mid Morning After noon Night
Metropolitan
Wave 3

Monday to Friday top 5 radio stations listening by ½ hour time slot
33
Responses
Half Hours
Morning Mid Morning After noon Night
Metropolitan
Wave 4
Caraïbes Peak
Time Shows
0
50
100
150
200
250
300
350
00:0
0-0
0:2
9
00:3
0-0
0:5
9
01:0
0 -
04:5
9
05
:00
- 0
5:2
9
05:3
0 -
05:5
9
06:0
0-0
6:2
9
06:3
0-0
6:5
9
07:0
0-0
7:2
9
07:3
0-0
7:5
9
08:0
0-0
8:2
9
08:3
0-0
8:5
9
09:0
0-0
9:2
9
09:3
0-0
9:5
9
10:0
0-1
0:2
9
10:3
0-1
0:5
9
11:0
0-1
1:2
9
11:3
0-1
1:5
9
12:0
0-1
2:2
9
12:3
0-1
2:5
9
13:0
0-1
3:2
9
13:3
0-1
3:5
9
14:0
0-1
4:2
9
14:3
0-1
4:5
9
15:0
0-1
5:2
9
15
:30-1
5:5
9
16:0
0-1
6:2
9
16:3
0-1
6:5
9
17:0
0-1
7:2
9
17
:30-1
7:5
9
18:0
0-1
8:2
9
18:3
0-1
8:5
9
19:0
0-1
9:2
9
19:3
0-1
9:5
9
20:0
0-2
0:2
9
20:3
0-2
0:5
9
21:0
0-2
1:2
9
21:3
0-2
1:5
9
22:0
0-2
2:2
9
22:3
0-2
2:5
9
23:0
0-2
3:2
9
23:3
0-2
3:5
9
CARAIBES FM 94.5 SHALLOM 103.7 GUINEN 92.9 LUMIERE 92.1 SIGNAL FM 90.5
Premye okazyon
Intersection
Canal musical

Saturday Top 5 radio stations listening by ½ hour time slot
34
Half Hours
Morning Mid Morning After noon Night Responses
Metropolitan
Wave 4
Caraïbes Peak
Time Shows
0
10
20
30
40
50
60
70
80
00:0
0-0
0:2
9
00:3
0-0
0:5
9
01:0
0 -
04:5
9
05:0
0 -
05:2
9
05:3
0 -
05:5
9
06:0
0-0
6:2
9
06:3
0-0
6:5
9
07
:00-0
7:2
9
07
:30-0
7:5
9
08
:00-0
8:2
9
08:3
0-0
8:5
9
09:0
0-0
9:2
9
09:3
0-0
9:5
9
10:0
0-1
0:2
9
10:3
0-1
0:5
9
11:0
0-1
1:2
9
11:3
0-1
1:5
9
12:0
0-1
2:2
9
12:3
0-1
2:5
9
13:0
0-1
3:2
9
13:3
0-1
3:5
9
14:0
0-1
4:2
9
14:3
0-1
4:5
9
15:0
0-1
5:2
9
15:3
0-1
5:5
9
16:0
0-1
6:2
9
16:3
0-1
6:5
9
17:0
0-1
7:2
9
17:3
0-1
7:5
9
18:0
0-1
8:2
9
18:3
0-1
8:5
9
19:0
0-1
9:2
9
19:3
0-1
9:5
9
20:0
0-2
0:2
9
20:3
0-2
0:5
9
21:0
0-2
1:2
9
21:3
0-2
1:5
9
22:0
0-2
2:2
9
22:3
0-2
2:5
9
23:0
0-2
3:2
9
23
:30-2
3:5
9
CARAIBES FM 94.5 SHALLOM 103.7 GUINEN 92.9 LUMIERE 92.1 SIGNAL FM 90.5
La manne
du matin
Ranmase
Caraïbes Sport
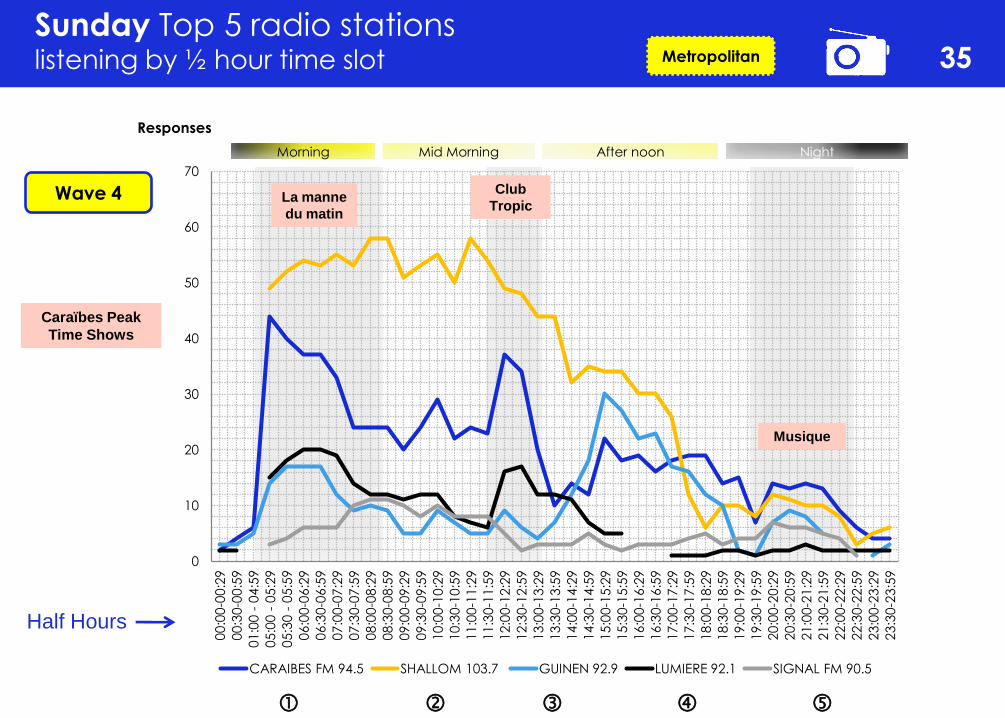
Sunday Top 5 radio stations listening by ½ hour time slot
35
Half Hours
Morning Mid Morning After noon Night
Responses
Metropolitan
Wave 4
Caraïbes Peak
Time Shows
0
10
20
30
40
50
60
70
00:0
0-0
0:2
9
00:3
0-0
0:5
9
01:0
0 -
04:5
9
05:0
0 -
05:2
9
05:3
0 -
05:5
9
06:0
0-0
6:2
9
06
:30-0
6:5
9
07:0
0-0
7:2
9
07:3
0-0
7:5
9
08:0
0-0
8:2
9
08:3
0-0
8:5
9
09:0
0-0
9:2
9
09:3
0-0
9:5
9
10:0
0-1
0:2
9
10:3
0-1
0:5
9
11:0
0-1
1:2
9
11:3
0-1
1:5
9
12:0
0-1
2:2
9
12:3
0-1
2:5
9
13:0
0-1
3:2
9
13:3
0-1
3:5
9
14:0
0-1
4:2
9
14:3
0-1
4:5
9
15:0
0-1
5:2
9
15:3
0-1
5:5
9
16:0
0-1
6:2
9
16:3
0-1
6:5
9
17:0
0-1
7:2
9
17:3
0-1
7:5
9
18:0
0-1
8:2
9
18:3
0-1
8:5
9
19
:00-1
9:2
9
19
:30-1
9:5
9
20:0
0-2
0:2
9
20:3
0-2
0:5
9
21:0
0-2
1:2
9
21:3
0-2
1:5
9
22:0
0-2
2:2
9
22:3
0-2
2:5
9
23:0
0-2
3:2
9
23:3
0-2
3:5
9
CARAIBES FM 94.5 SHALLOM 103.7 GUINEN 92.9 LUMIERE 92.1 SIGNAL FM 90.5
Musique
Club
Tropic La manne
du matin

Radio stations actually most Listened to : Wave 4,3,2,1 36
Of all the radio stations you listen to, which radio station do you listen to most often?
Base: 4260
Metropolitan
Rank Radio listened most often? Wave 4 Wave 3 Wave 2 Wave 1
1 CARAIBES FM 94.5 24.6% 31.9% 33.2% 34.1%
2 SHALLOM 103.7 / INSPIRATION / LAKANSIEL 15.0% 4.6% 3.0% N/A
3 GUINEN 92.9 8.8% 8.8% 7.4% 8.5%
4 LUMIERE 92.1 8.0% 10.3% 10.4% 11.0%
5 SIGNAL FM 90.5 4.0% 1.0% 0.8% 1.1%
6 UNIVERS FM 101.3 4.0% 4.0% 4.6% 5.6%
7 HORIZON 2000 95.7 2.9% 7.8% 11.5% 4.4%
8 SKY FM 96.5 2.9% 2.3% 4.1% 3.3%
9 SOLEIL 105.5 2.5% 2.5% 2.0% 2.0%
10 KISKEYA 88.5 1.8% 1.8% 1.0% 1.8%
OTHERS 20.8% 21.3% 19.9% 22.9%
NO ANSWER / DON'T KNOW 4.7% 3.7% 2.1% 5.3%
TOTAL 100.0% 100.0% 100.0% 100.0%

Radio stations perceived most popular : Wave 4,3,2,1 37
Which radio station would you say is the most popular?
Base: 4260
Metropolitan
Rank The most popular Radio? Wave 4 Wave 3 Wave 2 Wave 1
1 CARAIBES FM 94.5 40.3% 46.2% 50.2% 47.6%
2 GUINEN 92.9 13.3% 12.1% 9.7% 12.4%
3 SHALLOM 103.7 / INSPIRATION / LAKANSIEL 9.6% 2.2% 1.0% N/A
4 LUMIERE 92.1 6.7% 8.3% 8.4% 10.0%
5 RADIO NATIONALE D'HAITI 102.1\105.1 2.5% 2.5% 2.3% 3.5%
6 HORIZON 2000 95.7 2.3% 5.7% 7.7% 2.0%
7 SIGNAL FM 90.5 2.3% 0.5% 0.4% 0.7%
8 SKY FM 96.5 1.4% 1.0% 1.4% 1.3%
9 COOL FM LEOGANE 103.9 1.4% 0.5% 0.7% 0.4%
10 KISKEYA 88.5 1.1% 0.6% 0.7% 0.9%
OTHERS 11.4% 12.5% 11.2% 13.1%
NO ANSWER / DON'T KNOW 7.7% 7.9% 6.3% 8.1%
TOTAL 100.0% 100.0% 100.0% 100.0%

Radio stations perceived
to give the best news 38
Base: 3497
Base: 3362
Base: 3696 Which radio station gives the best news?
Base: 4260
Metropolitan
Rank Radio stations Wave 4 Wave 3 Wave 2 Wave 1
1 CARAIBES FM 94.5 29.8% 33.0% 30.0% 28.1%
2 GUINEN 92.9 23.4% 23.5% 28.5% 27.9%
3 KISKEYA 88.5 5.3% 4.1% 3.8% 5.9%
4 LUMIERE 92.1 4.6% 4.8% 4.5% 4.7%
5 SIGNAL FM 90.5 4.5% 0.4% 0.5% 1.8%
6 METROPOLE 100.1 2.5% 2.5% 2.4% 2.7%
7 RADIO NATIONALE D'HAITI 102.1\105.1 2.2% 1.9% 2.3% 2.9%
8 VISION 2000 99.3 1.6% 1.6% 1.4% 1.3%
9 COOL FM LEOGANE 103.9 0.9% 0.3% 0.4% 0.2%
10 SHALLOM 103.7 / INSPIRATION / LAKANSIEL 0.8% 0.6% 0.3% N/A
OTHERS 10.5% 11.6% 13.2% 23.6%
NO ANSWER / DON'T KNOW 13.9% 15.7% 12.7% 0.9%
TOTAL 100.0% 100.0% 100.0% 100.0%
Base: 4260
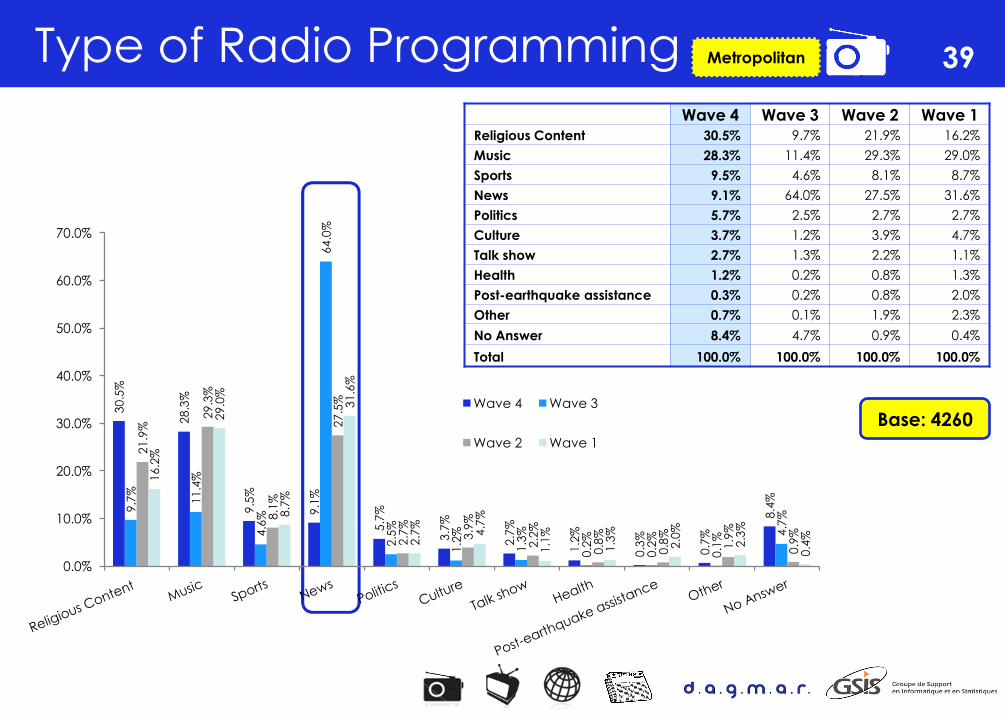
Type of Radio Programming 39 Metropolitan
Base: 4260
30
.5%
28
.3%
9.5
%
9.1
%
5.7
%
3.7
%
2.7
%
1.2
%
0.3
%
0.7
%
8.4
%
9.7
%
11
.4%
4.6
%
64
.0%
2.5
%
1.2
%
1.3
%
0.2
%
0.2
%
0.1
% 4.7
%
21
.9%
29
.3%
8.1
%
27
.5%
2.7
%
3.9
%
2.2
%
0.8
%
0.8
%
1.9
%
0.9
%
16
.2%
29
.0%
8.7
%
31
.6%
2.7
%
4.7
%
1.1
%
1.3
%
2.0
%
2.3
%
0.4
%
0.0%
10.0%
20.0%
30.0%
40.0%
50.0%
60.0%
70.0%
Wave 4 Wave 3
Wave 2 Wave 1
Wave 4 Wave 3 Wave 2 Wave 1
Religious Content 30.5% 9.7% 21.9% 16.2%
Music 28.3% 11.4% 29.3% 29.0%
Sports 9.5% 4.6% 8.1% 8.7%
News 9.1% 64.0% 27.5% 31.6%
Politics 5.7% 2.5% 2.7% 2.7%
Culture 3.7% 1.2% 3.9% 4.7%
Talk show 2.7% 1.3% 2.2% 1.1%
Health 1.2% 0.2% 0.8% 1.3%
Post-earthquake assistance 0.3% 0.2% 0.8% 2.0%
Other 0.7% 0.1% 1.9% 2.3%
No Answer 8.4% 4.7% 0.9% 0.4%
Total 100.0% 100.0% 100.0% 100.0%
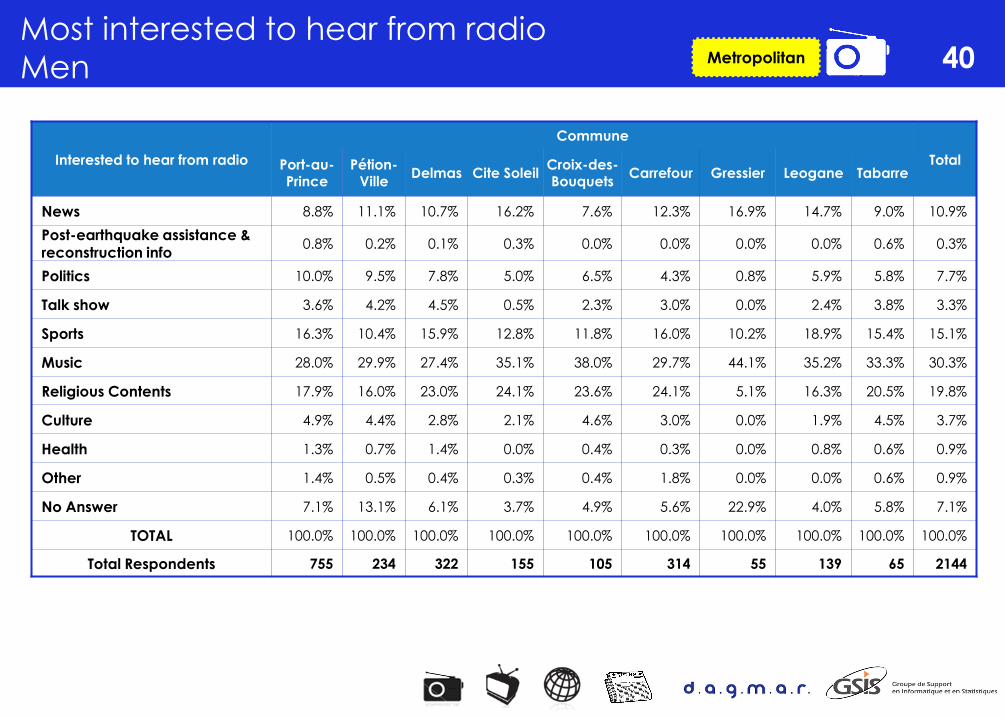
Most interested to hear from radio
Men 40 Metropolitan
Interested to hear from radio
Commune
Total Port-au-Prince
Pétion-Ville
Delmas Cite Soleil Croix-des-Bouquets
Carrefour Gressier Leogane Tabarre
News 8.8% 11.1% 10.7% 16.2% 7.6% 12.3% 16.9% 14.7% 9.0% 10.9%
Post-earthquake assistance & reconstruction info
0.8% 0.2% 0.1% 0.3% 0.0% 0.0% 0.0% 0.0% 0.6% 0.3%
Politics 10.0% 9.5% 7.8% 5.0% 6.5% 4.3% 0.8% 5.9% 5.8% 7.7%
Talk show 3.6% 4.2% 4.5% 0.5% 2.3% 3.0% 0.0% 2.4% 3.8% 3.3%
Sports 16.3% 10.4% 15.9% 12.8% 11.8% 16.0% 10.2% 18.9% 15.4% 15.1%
Music 28.0% 29.9% 27.4% 35.1% 38.0% 29.7% 44.1% 35.2% 33.3% 30.3%
Religious Contents 17.9% 16.0% 23.0% 24.1% 23.6% 24.1% 5.1% 16.3% 20.5% 19.8%
Culture 4.9% 4.4% 2.8% 2.1% 4.6% 3.0% 0.0% 1.9% 4.5% 3.7%
Health 1.3% 0.7% 1.4% 0.0% 0.4% 0.3% 0.0% 0.8% 0.6% 0.9%
Other 1.4% 0.5% 0.4% 0.3% 0.4% 1.8% 0.0% 0.0% 0.6% 0.9%
No Answer 7.1% 13.1% 6.1% 3.7% 4.9% 5.6% 22.9% 4.0% 5.8% 7.1%
TOTAL 100.0% 100.0% 100.0% 100.0% 100.0% 100.0% 100.0% 100.0% 100.0% 100.0%
Total Respondents 755 234 322 155 105 314 55 139 65 2144

Most interested to hear from radio
Women 41 Metropolitan
Interested to hear from radio for women
Commune
Total Port-au-Prince
Pétion-Ville
Delmas Cite
Soleil
Croix-des-
Bouquets Carrefour Gressier Leogane Tabarre
News 6.2% 6.6% 5.8% 7.8% 5.9% 6.9% 10.1% 15.2% 6.8% 7.2%
Post-earthquake assistance & reconstruction info
0.3% 0.0% 0.1% 0.0% 0.0% 0.0% 0.0% 0.5% 0.0% 0.2%
Politics 5.3% 4.4% 3.2% 0.3% 4.7% 2.2% 0.0% 1.9% 3.1% 3.6%
Talk show 3.3% 1.8% 1.5% 0.0% 3.8% 0.6% 0.0% 1.2% 1.2% 2.0%
Sports 4.3% 3.7% 2.2% 1.0% 0.8% 2.8% 0.0% 6.0% 3.1% 3.3%
Music 25.6% 18.9% 24.3% 26.9% 30.1% 25.3% 33.6% 37.7% 22.8% 26.0%
Religious Contents 37.4% 41.5% 45.5% 54.0% 47.9% 51.9% 25.2% 30.9% 46.3% 42.1%
Culture 5.3% 3.9% 4.2% 2.6% 1.7% 1.9% 0.8% 1.0% 4.3% 3.7%
Health 2.2% 1.7% 2.9% 0.0% 0.0% 1.0% 0.0% 0.2% 0.6% 1.6%
Other 0.7% 0.2% 0.6% 0.3% 0.0% 0.4% 0.0% 0.5% 0.0% 0.5%
No Answer 9.2% 17.3% 9.6% 7.1% 5.1% 6.9% 30.3% 4.8% 11.7% 9.7%
TOTAL 100.0% 100.0% 100.0% 100.0% 100.0% 100.0% 100.0% 100.0% 100.0% 100.0%
Total Respondents 734 234 321 138 96 301 59 164 69 2116
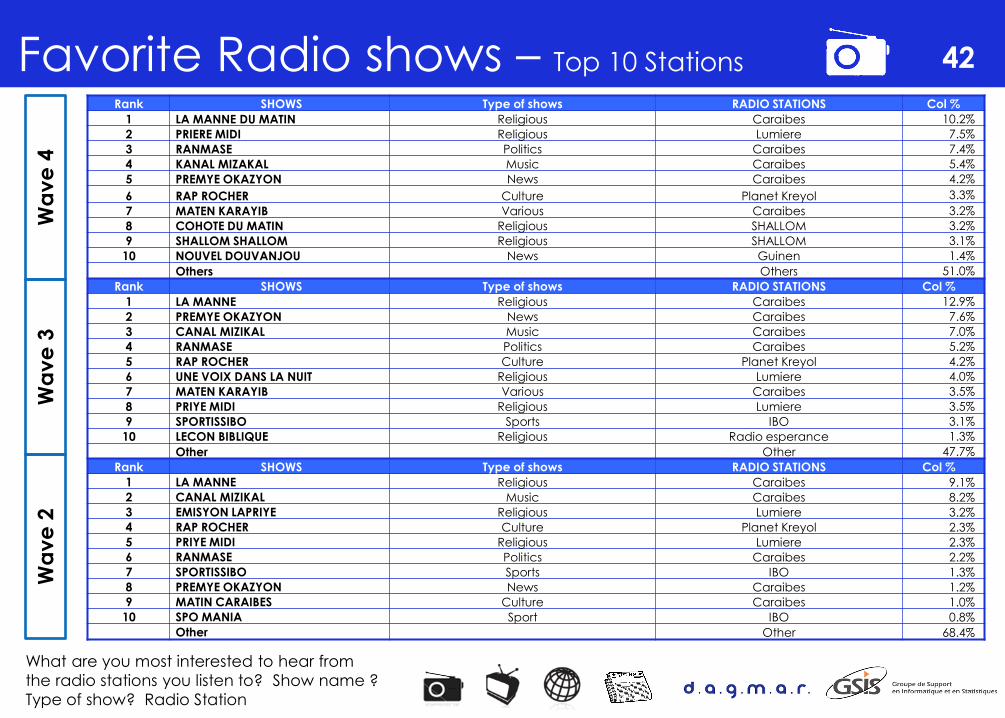
Favorite Radio shows – Top 10 Stations 42 W
ave
3
Wa
ve
4
What are you most interested to hear from
the radio stations you listen to? Show name ?
Type of show? Radio Station
Rank SHOWS Type of shows RADIO STATIONS Col %
1 LA MANNE DU MATIN Religious Caraibes 10.2%
2 PRIERE MIDI Religious Lumiere 7.5%
3 RANMASE Politics Caraibes 7.4%
4 KANAL MIZAKAL Music Caraibes 5.4%
5 PREMYE OKAZYON News Caraibes 4.2%
6 RAP ROCHER Culture Planet Kreyol 3.3%
7 MATEN KARAYIB Various Caraibes 3.2%
8 COHOTE DU MATIN Religious SHALLOM 3.2%
9 SHALLOM SHALLOM Religious SHALLOM 3.1%
10 NOUVEL DOUVANJOU News Guinen 1.4%
Others Others 51.0%
Rank SHOWS Type of shows RADIO STATIONS Col %
1 LA MANNE Religious Caraibes 12.9%
2 PREMYE OKAZYON News Caraibes 7.6%
3 CANAL MIZIKAL Music Caraibes 7.0%
4 RANMASE Politics Caraibes 5.2%
5 RAP ROCHER Culture Planet Kreyol 4.2%
6 UNE VOIX DANS LA NUIT Religious Lumiere 4.0%
7 MATEN KARAYIB Various Caraibes 3.5%
8 PRIYE MIDI Religious Lumiere 3.5%
9 SPORTISSIBO Sports IBO 3.1%
10 LECON BIBLIQUE Religious Radio esperance 1.3%
Other Other 47.7%
Rank SHOWS Type of shows RADIO STATIONS Col %
1 LA MANNE Religious Caraibes 9.1%
2 CANAL MIZIKAL Music Caraibes 8.2%
3 EMISYON LAPRIYE Religious Lumiere 3.2%
4 RAP ROCHER Culture Planet Kreyol 2.3%
5 PRIYE MIDI Religious Lumiere 2.3%
6 RANMASE Politics Caraibes 2.2%
7 SPORTISSIBO Sports IBO 1.3%
8 PREMYE OKAZYON News Caraibes 1.2%
9 MATIN CARAIBES Culture Caraibes 1.0%
10 SPO MANIA Sport IBO 0.8%
Other Other 68.4%
Wa
ve
2
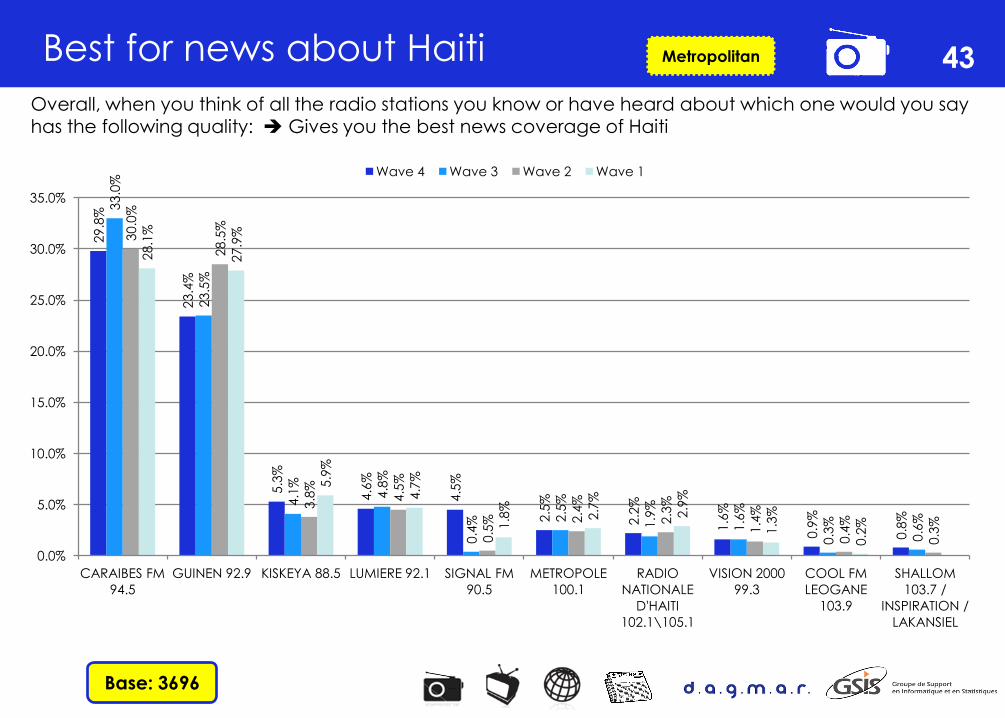
43 Best for news about Haiti
Base: 3696
Metropolitan
Overall, when you think of all the radio stations you know or have heard about which one would you say has the following quality: Gives you the best news coverage of Haiti
29.8
%
23.4
%
5.3
%
4.6
%
4.5
%
2.5
%
2.2
%
1.6
%
0.9
%
0.8
%
33.0
%
23.5
%
4.1
%
4.8
%
0.4
%
2.5
%
1.9
%
1.6
%
0.3
%
0.6
%
30.0
%
28.5
%
3.8
%
4.5
%
0.5
%
2.4
%
2.3
%
1.4
%
0.4
%
0.3
%
28.1
%
27.9
%
5.9
%
4.7
%
1.8
%
2.7
%
2.9
%
1.3
%
0.2
%
0.0%
5.0%
10.0%
15.0%
20.0%
25.0%
30.0%
35.0%
CARAIBES FM
94.5
GUINEN 92.9 KISKEYA 88.5 LUMIERE 92.1 SIGNAL FM
90.5
METROPOLE
100.1
RADIO
NATIONALE
D'HAITI
102.1\105.1
VISION 2000
99.3
COOL FM
LEOGANE
103.9
SHALLOM
103.7 /
INSPIRATION /
LAKANSIEL
Wave 4 Wave 3 Wave 2 Wave 1

ENDK* Awareness 44
Have you
heard
about ENDK?
Do you listen to
ENDK?
How often do
you listen to
ENDK?
* ENDK: Enfomasyon Nou Dwe Konnen / News you should know
Base: 4260
Base: 2773
Base: 2076
Metropolitan
Type of Place / Location Total
Residence Camp Site
Wave 4 Wave 3 Wave 2 Wave 4 Wave 3 Wave 2 Wave 4 Wave 3 Wave 2
Count Col % Col % Col % Count Col % Col % Col % Count Col % Col % Col %
Yes 2256 65.2% 62.5% 54.2% 517 64.8% 60.3% 60.3% 2773 65.1% 62.3% 55.6%
No 1172 33.9% 36.8% 45.2% 275 34.5% 38.5% 38.5% 1447 34.0% 36.9% 43.7%
No Answer 34 1.0% 0.7% 0.6% 6 0.8% 1.2% 1.2% 40 0.9% 0.8% 0.7%
Total 3462 100.0% 100.0% 100.0% 798 100.0% 100.0% 100.0% 4260 100.0% 100.0% 100.0%
Type of Place / Location Total
Residence Camp Site
Wave 4 Wave 3 Wave 2 Wave 4 Wave 3 Wave 2 Wave 4 Wave 3 Wave 2
Count Col % Col % Col % Count Col % Col % Col % Count Col % Col % Col %
Yes 1688 74.8% 75.1% 76.0% 388 75.0% 78.3% 76.9% 2076 74.9% 75.9% 76.2%
No 553 24.5% 23.8% 22.5% 127 24.6% 20.7% 20.5% 680 24.5% 23.0% 22.0%
No Answer 15 0.7% 1.2% 1.5% 2 0.4% 1.0% 2.6% 17 0.6% 1.1% 1.8%
Total 2256 100.0% 100.0% 100.0% 517 100.0% 100.0% 100.0% 2773 100.0% 100.0% 100.0%
Type of Place / Location Total
Residence Camp Site
Wave 4 Wave 3 Wave 2 Wave 4 Wave 3 Wave 2 Wave 4 Wave 3 Wave 2
Count Col % Col % Col % Count Col % Col % Col % Count Col % Col % Col %
Every day 241 14.3% 21.1% 18.6% 68 17.5% 23.3% 19.5% 309 14.9% 21.7% 18.8%
Every two days 184 10.9% 14.5% 10.9% 29 7.5% 13.1% 11.3% 213 10.3% 14.1% 11.0%
Every week 111 6.6% 9.2% 6.5% 24 6.2% 7.4% 5.7% 135 6.5% 8.7% 6.3%
At random 1058 62.7% 48.4% 36.6% 251 64.7% 47.7% 36.5% 1309 63.1% 48.2% 36.6%
No answer 94 5.6% 6.7% 27.4% 16 4.1% 8.5% 27.0% 110 5.3% 7.2% 27.3%
Total 1688 100.0% 100.0% 100.0% 388 100.0% 100.0% 100.0% 2076 100.0% 100.0% 100.0%

45 ENDK* Listening by Radio Station
•ENDK: Enfomasyon Nou Dwe Konnen /
News you should know
Top 10 ENDK listening by radio station
Metropolitan
On which radio station do you listen to ENDK?
RADIO STATONS
playing ENDK in the
metropolitan area
according Inter-News
Caraïbes FM RCH 2000 Signal FM Radio Nationale
Radio Ginen Megastar Métropole Superstar
Radio Etoile Maximum Nouvelle Génération Mélodie FM
Vision 2000 Voix de l'Évangile Radio Éclair RFM
Radio Boukman Kenskoff Inter Magik 9 Radio Solidarite
Scoop FM
Location Total Total Total
Residence Camp Site wave 4 wave 3 wave 2
Count Col % Count Col % Count Col % Count Col % Count Col %
CARAIBES FM 94.5 247 14.6% 43 11.1% 290 14.0% 354 20.2% 208 10.0%
GINEN 92.9 222 13.2% 58 14.9% 280 13.5% 216 12.3% 134 6.5%
MINUSTAH FM / MBC 94.9 219 13.0% 48 12.4% 267 12.9% 163 9.3% 185 8.9%
LUMIERE 92.1 48 2.8% 6 1.5% 54 2.6% 74 4.2% 47 2.3%
SHALLOM (INSPIRATION FM) 72 4.3% 9 2.3% 81 3.9% 32 1.8% 9 0.4%
ONE 90.1 38 2.3% 16 4.1% 54 2.6% 31 1.8% 37 1.8%
HORIZON 2000 95.7 6 0.4% 2 0.5% 8 0.4% 24 1.4% 15 0.7%
VISION 2000 99.3 12 0.7% 4 1.0% 16 0.8% 24 1.4% 20 1.0%
ANTILLES INTERNATIONALES 96.9 4 0.2% 4 1.0% 8 0.4% 20 1.1% 9 0.4%
ETOILE 91.7 172 9.8% 82 3.9%
OTHER 261 15.4% 52 13.5% 313 14.9% 262 15.2% 549 26.5%
DON’T KNOW / NO ANSWER 559 33.1% 146 37.7% 705 34.0% 377 21.5% 781 37.6%
Total 1688 100.0% 388 100.0% 2076 1 1749 100.0% 2076 100.0%

VOA* Awareness 46
Have you
heard about
VOA?
Do you listen to
VOA?
How often do
you listen to
VOA
* VOA: Voix de l’Amerique / Voice of America
Base: 4260
Base: 3270
Base: 2208
Metropolitan
Type of Place / Location Total
Residence Camp Site
Wave 4 Wave 3 Wave 2 Wave 4 Wave 3 Wave 2 Wave 4 Wave 3 Wave 2
Count Col % Col % Col % Count Col % Col % Col % Count Col % Col % Col %
Yes 2669 77.1% 74.1% 74.8% 601 75.3% 71.9% 70.7% 3270 76.8% 73.5% 73.8%
No 725 20.9% 24.2% 23.2% 186 23.3% 25.8% 26.6% 911 21.4% 24.6% 24.0%
No Answer 68 2.0% 1.7% 2.0% 11 1.4% 2.3% 2.7% 79 1.9% 1.9% 2.2%
Total 3462 100.0% 100.0% 100.0% 798 100.0% 100.0% 100.0% 4260 100.0% 100.0% 100.0%
Type of Place / Location Total
Residence Camp Site
Wave 4 Wave 3 Wave 2 Wave 4 Wave 3 Wave 2 Wave 4 Wave 3 Wave 2
Count Col % Col % Col % Count Col % Col % Col % Count Col % Col % Col %
Yes 1793 67.2% 69.7% 71.2% 415 69.1% 70.7% 70.3% 2208 67.5% 69.9% 71.0%
No 838 31.4% 28.4% 27.2% 180 30.0% 28.9% 29.0% 1018 31.1% 28.6% 27.6%
No Answer 38 1.4% 1.9% 1.7% 6 1.0% 0.4% 0.8% 44 1.3% 1.5% 1.5%
Total 2669 100.0% 100.0% 100.0% 601 100.0% 100.0% 100.0% 3270 100.0% 100.0% 100.0%
Type of Place / Location Total
Residence Camp Site
Wave 4 Wave 3 Wave 2 Wave 4 Wave 3 Wave 2 Wave 4 Wave 3 Wave 2
Count Col % Col % Col % Count Col % Col % Col % Count Col % Col % Col %
Every day 234 13.1% 16.6% 11.5% 51 12.3% 16.3% 11.5% 285 12.9% 16.5% 11.5%
Every two days 127 7.1% 10.0% 6.2% 29 7.0% 9.9% 7.3% 156 7.1% 9.9% 6.4%
Every week 122 6.8% 9.3% 6.9% 22 5.3% 10.3% 6.9% 144 6.5% 9.5% 6.9%
At random 1227 68.4% 54.7% 40.4% 302 72.8% 51.2% 35.6% 1529 69.2% 53.8% 39.3%
No answer 83 4.6% 9.5% 35.1% 11 2.7% 12.3% 38.6% 94 4.3% 10.2% 35.9%
Total 1793 100.0% 100.0% 100.0% 415 100.0% 100.0% 100.0% 2208 100.0% 100.0% 100.0%
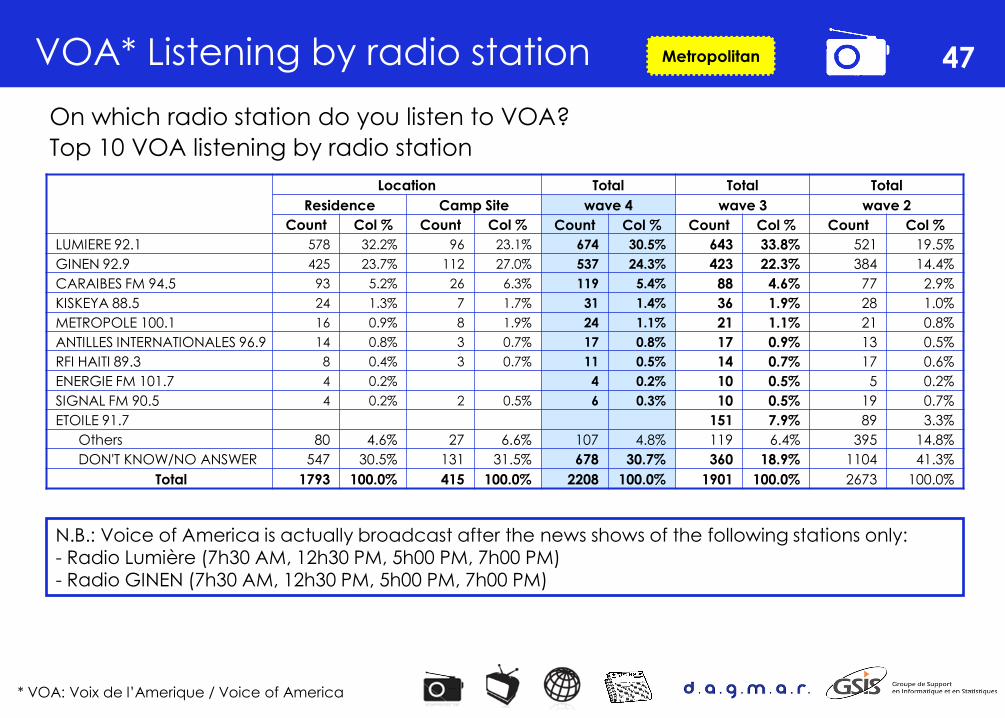
47 VOA* Listening by radio station
* VOA: Voix de l’Amerique / Voice of America
N.B.: Voice of America is actually broadcast after the news shows of the following stations only: - Radio Lumière (7h30 AM, 12h30 PM, 5h00 PM, 7h00 PM)
- Radio GINEN (7h30 AM, 12h30 PM, 5h00 PM, 7h00 PM)
Metropolitan
On which radio station do you listen to VOA?
Top 10 VOA listening by radio station
Location Total Total Total
Residence Camp Site wave 4 wave 3 wave 2
Count Col % Count Col % Count Col % Count Col % Count Col %
LUMIERE 92.1 578 32.2% 96 23.1% 674 30.5% 643 33.8% 521 19.5%
GINEN 92.9 425 23.7% 112 27.0% 537 24.3% 423 22.3% 384 14.4%
CARAIBES FM 94.5 93 5.2% 26 6.3% 119 5.4% 88 4.6% 77 2.9%
KISKEYA 88.5 24 1.3% 7 1.7% 31 1.4% 36 1.9% 28 1.0%
METROPOLE 100.1 16 0.9% 8 1.9% 24 1.1% 21 1.1% 21 0.8%
ANTILLES INTERNATIONALES 96.9 14 0.8% 3 0.7% 17 0.8% 17 0.9% 13 0.5%
RFI HAITI 89.3 8 0.4% 3 0.7% 11 0.5% 14 0.7% 17 0.6%
ENERGIE FM 101.7 4 0.2% 4 0.2% 10 0.5% 5 0.2%
SIGNAL FM 90.5 4 0.2% 2 0.5% 6 0.3% 10 0.5% 19 0.7%
ETOILE 91.7 151 7.9% 89 3.3%
Others 80 4.6% 27 6.6% 107 4.8% 119 6.4% 395 14.8%
DON'T KNOW/NO ANSWER 547 30.5% 131 31.5% 678 30.7% 360 18.9% 1104 41.3%
Total 1793 100.0% 415 100.0% 2208 100.0% 1901 100.0% 2673 100.0%
TELEVISION
48

Access to Television
49
Do you ever watch Television?
Television
Consumption
base 2682 1626 2736 Base
Wave 4 Wave 3 Wave 2 Wave 1
Metropolitan
Wave 4 Wave 3 Wave 2 Wave 1
Count Col % Count Col % Count Col % Count %
Yes 3202 73.30% 2736 70.80% 2682 72.60% 1626 57.20%
No 1165 26.70% 1131 29.20% 966 26.10% 122 41.80%
No Answer 0 0.00% 47 1.30% 29 1.00%
Total 4367 100.00% 3867 100.00% 3695 100.00% 2877 100.00%
3202
Provinces
Do you ever watch Television?
Petit-Goave Saint-Marc Leogane Cap-Haitien
Wave 4 Wave 3 Wave 4 Wave 3 Wave 4 Wave 3 Wave 4 Wave 3
Count Col% Col% Count Col% Col% Count Col% Col% Count Col% Col%
Yes 181 60.1% 77.8% 271 90.6% 72.1% 166 54.2% 45.8% 411 89.2% 78.4%
No 120 39.9% 22.2% 28 9.4% 27.9% 140 45.8% 54.2% 50 10.8% 21.6%
No Answer 0 0.0% 0.0% 0 0.0% 0.0% 0 0.0% 0.0% 0 0.0% 0.0%
Total 301 100.0% 100.0% 299 100.0% 100.0% 306 100.0% 100.0% 461 100.0% 100.0%
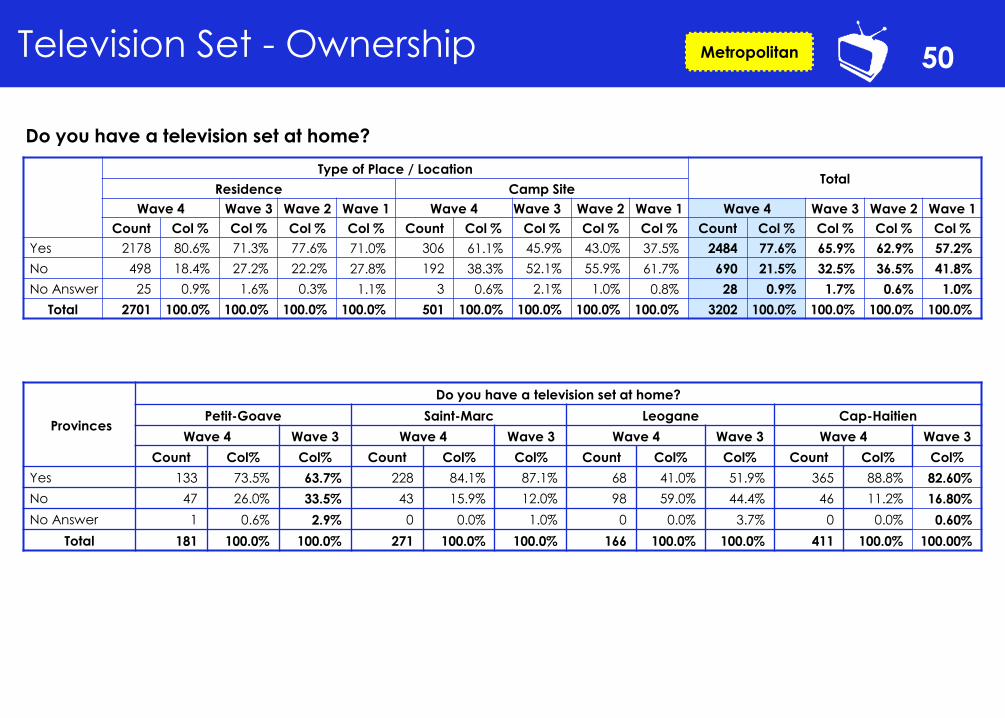
Television Set - Ownership
50
Do you have a television set at home?
Metropolitan
Type of Place / Location Total
Residence Camp Site
Wave 4 Wave 3 Wave 2 Wave 1 Wave 4 Wave 3 Wave 2 Wave 1 Wave 4 Wave 3 Wave 2 Wave 1
Count Col % Col % Col % Col % Count Col % Col % Col % Col % Count Col % Col % Col % Col %
Yes 2178 80.6% 71.3% 77.6% 71.0% 306 61.1% 45.9% 43.0% 37.5% 2484 77.6% 65.9% 62.9% 57.2%
No 498 18.4% 27.2% 22.2% 27.8% 192 38.3% 52.1% 55.9% 61.7% 690 21.5% 32.5% 36.5% 41.8%
No Answer 25 0.9% 1.6% 0.3% 1.1% 3 0.6% 2.1% 1.0% 0.8% 28 0.9% 1.7% 0.6% 1.0%
Total 2701 100.0% 100.0% 100.0% 100.0% 501 100.0% 100.0% 100.0% 100.0% 3202 100.0% 100.0% 100.0% 100.0%
Provinces
Do you have a television set at home?
Petit-Goave Saint-Marc Leogane Cap-Haitien
Wave 4 Wave 3 Wave 4 Wave 3 Wave 4 Wave 3 Wave 4 Wave 3
Count Col% Col% Count Col% Col% Count Col% Col% Count Col% Col%
Yes 133 73.5% 63.7% 228 84.1% 87.1% 68 41.0% 51.9% 365 88.8% 82.60%
No 47 26.0% 33.5% 43 15.9% 12.0% 98 59.0% 44.4% 46 11.2% 16.80%
No Answer 1 0.6% 2.9% 0 0.0% 1.0% 0 0.0% 3.7% 0 0.0% 0.60%
Total 181 100.0% 100.0% 271 100.0% 100.0% 166 100.0% 100.0% 411 100.0% 100.00%
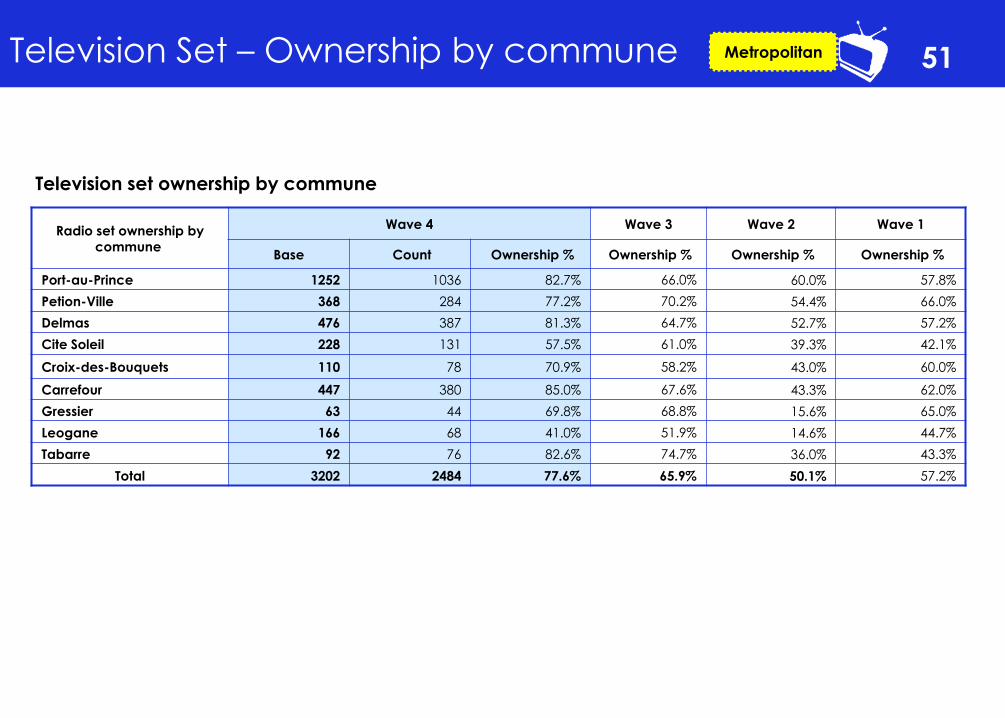
Television Set – Ownership by commune
51
Television set ownership by commune
Metropolitan
Radio set ownership by
commune
Wave 4 Wave 3 Wave 2 Wave 1
Base Count Ownership % Ownership % Ownership % Ownership %
Port-au-Prince 1252 1036 82.7% 66.0% 60.0% 57.8%
Petion-Ville 368 284 77.2% 70.2% 54.4% 66.0%
Delmas 476 387 81.3% 64.7% 52.7% 57.2%
Cite Soleil 228 131 57.5% 61.0% 39.3% 42.1%
Croix-des-Bouquets 110 78 70.9% 58.2% 43.0% 60.0%
Carrefour 447 380 85.0% 67.6% 43.3% 62.0%
Gressier 63 44 69.8% 68.8% 15.6% 65.0%
Leogane 166 68 41.0% 51.9% 14.6% 44.7%
Tabarre 92 76 82.6% 74.7% 36.0% 43.3%
Total 3202 2484 77.6% 65.9% 50.1% 57.2%
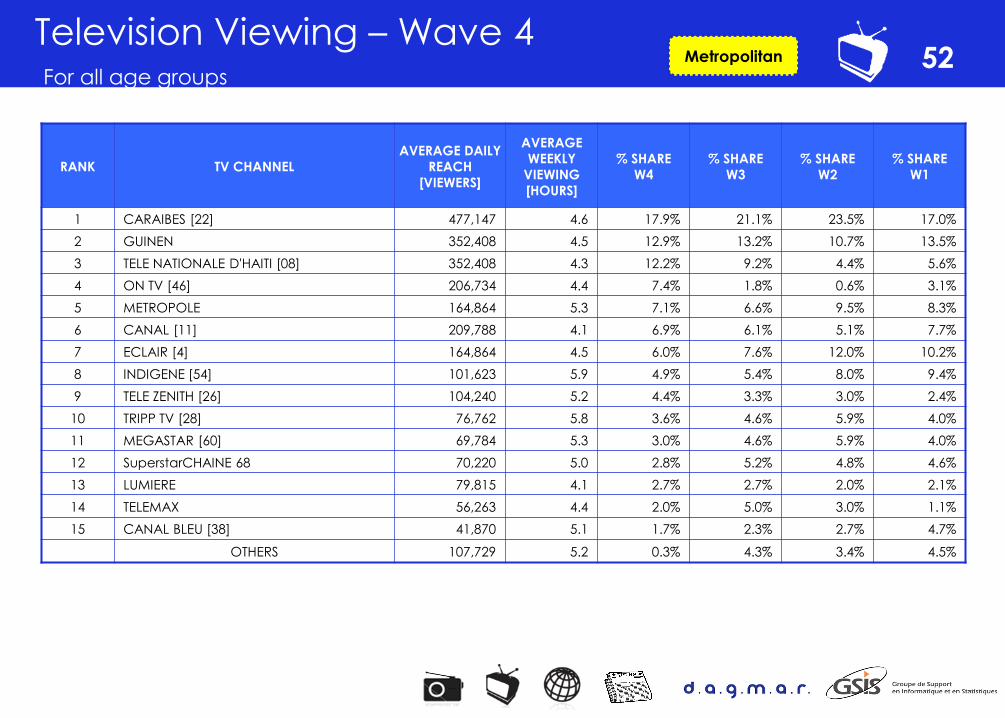
Television Viewing – Wave 4 For all age groups
52 Metropolitan
RANK TV CHANNEL
AVERAGE DAILY
REACH
[VIEWERS]
AVERAGE
WEEKLY
VIEWING
[HOURS]
% SHARE
W4
% SHARE
W3
% SHARE
W2
% SHARE
W1
1 CARAIBES [22] 477,147 4.6 17.9% 21.1% 23.5% 17.0%
2 GUINEN 352,408 4.5 12.9% 13.2% 10.7% 13.5%
3 TELE NATIONALE D'HAITI [08] 352,408 4.3 12.2% 9.2% 4.4% 5.6%
4 ON TV [46] 206,734 4.4 7.4% 1.8% 0.6% 3.1%
5 METROPOLE 164,864 5.3 7.1% 6.6% 9.5% 8.3%
6 CANAL [11] 209,788 4.1 6.9% 6.1% 5.1% 7.7%
7 ECLAIR [4] 164,864 4.5 6.0% 7.6% 12.0% 10.2%
8 INDIGENE [54] 101,623 5.9 4.9% 5.4% 8.0% 9.4%
9 TELE ZENITH [26] 104,240 5.2 4.4% 3.3% 3.0% 2.4%
10 TRIPP TV [28] 76,762 5.8 3.6% 4.6% 5.9% 4.0%
11 MEGASTAR [60] 69,784 5.3 3.0% 4.6% 5.9% 4.0%
12 SuperstarCHAINE 68 70,220 5.0 2.8% 5.2% 4.8% 4.6%
13 LUMIERE 79,815 4.1 2.7% 2.7% 2.0% 2.1%
14 TELEMAX 56,263 4.4 2.0% 5.0% 3.0% 1.1%
15 CANAL BLEU [38] 41,870 5.1 1.7% 2.3% 2.7% 4.7%
OTHERS 107,729 5.2 0.3% 4.3% 3.4% 4.5%
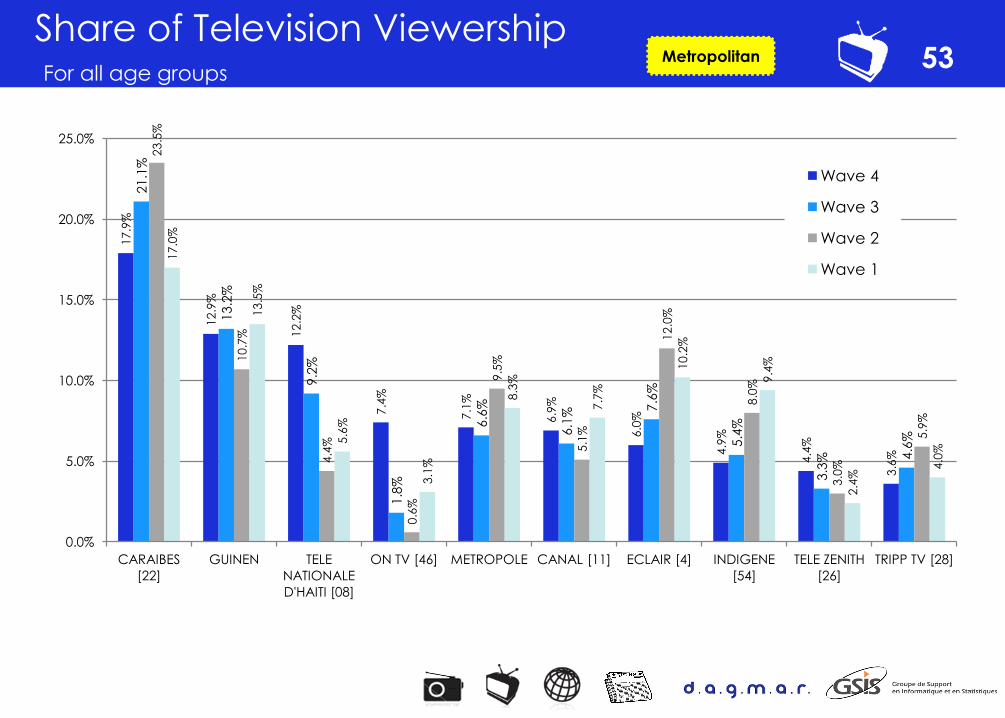
Share of Television Viewership For all age groups
53 Metropolitan
17
.9%
12
.9%
12
.2%
7.4
%
7.1
%
6.9
%
6.0
%
4.9
%
4.4
%
3.6
%
21.1
%
13.2
%
9.2
%
1.8
%
6.6
%
6.1
% 7.6
%
5.4
%
3.3
%
4.6
%
23
.5%
10
.7%
4.4
%
0.6
%
9.5
%
5.1
%
12
.0%
8.0
%
3.0
%
5.9
%
17
.0%
13
.5%
5.6
%
3.1
%
8.3
%
7.7
%
10
.2%
9.4
%
2.4
% 4
.0%
0.0%
5.0%
10.0%
15.0%
20.0%
25.0%
CARAIBES
[22]
GUINEN TELE
NATIONALE
D'HAITI [08]
ON TV [46] METROPOLE CANAL [11] ECLAIR [4] INDIGENE
[54]
TELE ZENITH
[26]
TRIPP TV [28]
Wave 4
Wave 3
Wave 2
Wave 1
0
20
40
60
80
100
120
140
160
180
200
00:0
0-0
0:2
9
00:3
0-0
0:5
9
01:0
0 -
04:5
9
05:0
0 -
05:2
9
05:3
0 -
05:5
9
06
:00-0
6:2
9
06:3
0-0
6:5
9
07:0
0-0
7:2
9
07:3
0-0
7:5
9
08:0
0-0
8:2
9
08:3
0-0
8:5
9
09
:00-0
9:2
9
09:3
0-0
9:5
9
10:0
0-1
0:2
9
10:3
0-1
0:5
9
11:0
0-1
1:2
9
11:3
0-1
1:5
9
12
:00-1
2:2
9
12:3
0-1
2:5
9
13:0
0-1
3:2
9
13:3
0-1
3:5
9
14:0
0-1
4:2
9
14:3
0-1
4:5
9
15:0
0-1
5:2
9
15:3
0-1
5:5
9
16:0
0-1
6:2
9
16:3
0-1
6:5
9
17:0
0-1
7:2
9
17:3
0-1
7:5
9
18:0
0-1
8:2
9
18:3
0-1
8:5
9
19:0
0-1
9:2
9
19:3
0-1
9:5
9
20:0
0-2
0:2
9
20:3
0-2
0:5
9
21:0
0-2
1:2
9
21:3
0-2
1:5
9
22:0
0-2
2:2
9
22:3
0-2
2:5
9
23:0
0-2
3:2
9
23:3
0-2
3:5
9
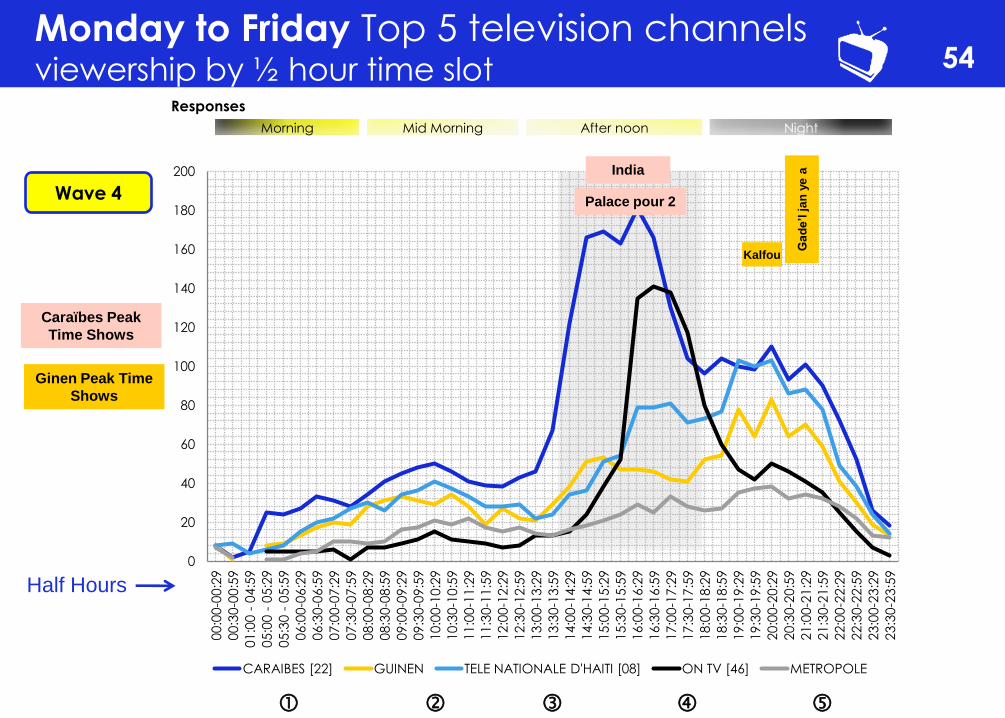
CARAIBES [22] GUINEN TELE NATIONALE D'HAITI [08] ON TV [46] METROPOLE
54 Monday to Friday Top 5 television channels viewership by ½ hour time slot
Half Hours
Responses
Morning Mid Morning After noon Night
Wave 4
India
Palace pour 2
Caraïbes Peak
Time Shows
Ginen Peak Time
Shows
Kalfou
Gade’l
ja
n y
e a
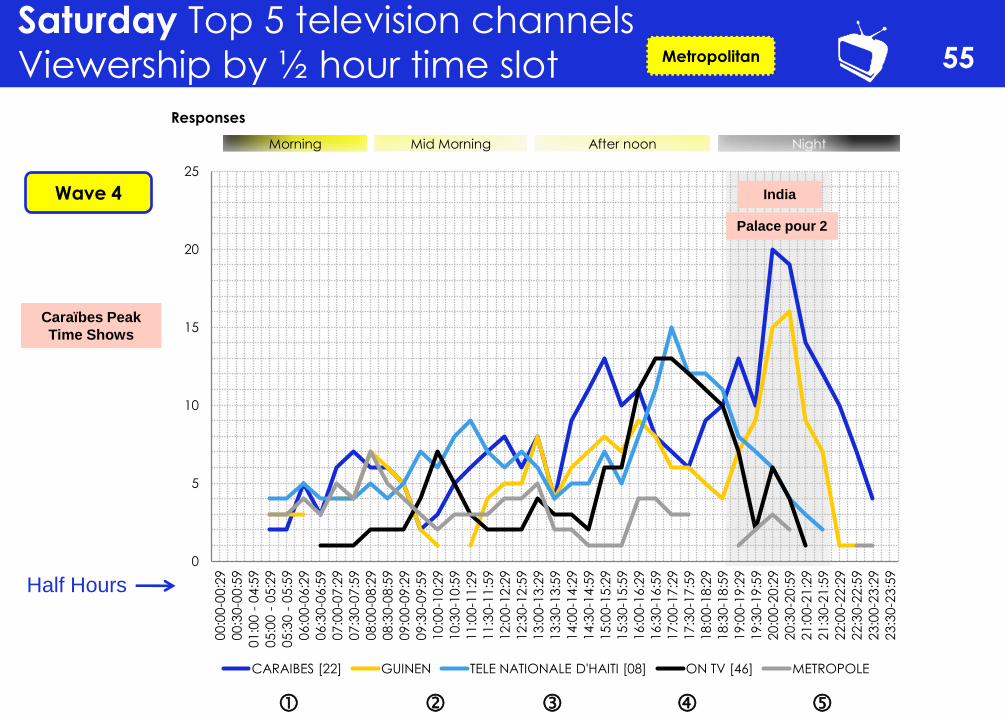
55 Saturday Top 5 television channels
Viewership by ½ hour time slot
Half Hours
Morning Mid Morning After noon Night
Responses
Wave 4
Metropolitan
Caraïbes Peak
Time Shows
0
5
10
15
20
25
00:0
0-0
0:2
9
00:3
0-0
0:5
9
01:0
0 -
04:5
9
05:0
0 -
05:2
9
05:3
0 -
05:5
9
06:0
0-0
6:2
9
06
:30-0
6:5
9
07
:00-0
7:2
9
07:3
0-0
7:5
9
08:0
0-0
8:2
9
08:3
0-0
8:5
9
09:0
0-0
9:2
9
09:3
0-0
9:5
9
10:0
0-1
0:2
9
10:3
0-1
0:5
9
11:0
0-1
1:2
9
11:3
0-1
1:5
9
12:0
0-1
2:2
9
12:3
0-1
2:5
9
13:0
0-1
3:2
9
13:3
0-1
3:5
9
14:0
0-1
4:2
9
14:3
0-1
4:5
9
15:0
0-1
5:2
9
15:3
0-1
5:5
9
16:0
0-1
6:2
9
16:3
0-1
6:5
9
17:0
0-1
7:2
9
17:3
0-1
7:5
9
18:0
0-1
8:2
9
18:3
0-1
8:5
9
19:0
0-1
9:2
9
19
:30-1
9:5
9
20:0
0-2
0:2
9
20:3
0-2
0:5
9
21:0
0-2
1:2
9
21:3
0-2
1:5
9
22:0
0-2
2:2
9
22:3
0-2
2:5
9
23:0
0-2
3:2
9
23:3
0-2
3:5
9
CARAIBES [22] GUINEN TELE NATIONALE D'HAITI [08] ON TV [46] METROPOLE
India
Palace pour 2
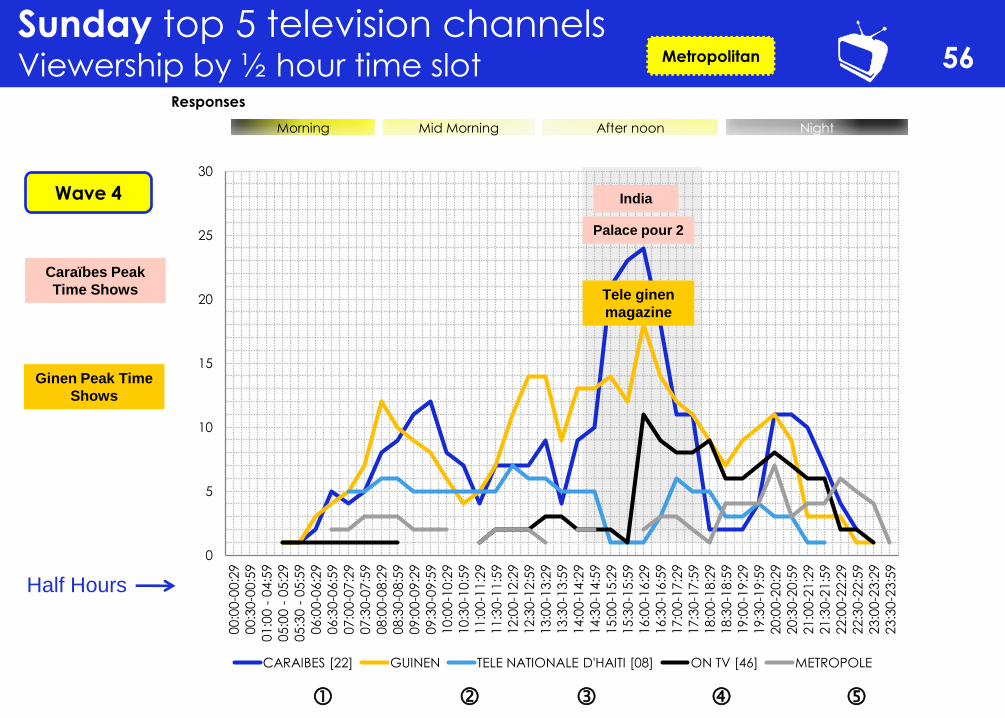
56 Sunday top 5 television channels Viewership by ½ hour time slot
Half Hours
Morning Mid Morning After noon Night
Responses
Wave 4
Metropolitan
Caraïbes Peak
Time Shows
Ginen Peak Time
Shows
0
5
10
15
20
25
30
00:0
0-0
0:2
9
00:3
0-0
0:5
9
01:0
0 -
04:5
9
05:0
0 -
05:2
9
05:3
0 -
05:5
9
06:0
0-0
6:2
9
06:3
0-0
6:5
9
07:0
0-0
7:2
9
07:3
0-0
7:5
9
08:0
0-0
8:2
9
08:3
0-0
8:5
9
09:0
0-0
9:2
9
09:3
0-0
9:5
9
10:0
0-1
0:2
9
10:3
0-1
0:5
9
11:0
0-1
1:2
9
11:3
0-1
1:5
9
12:0
0-1
2:2
9
12:3
0-1
2:5
9
13:0
0-1
3:2
9
13:3
0-1
3:5
9
14:0
0-1
4:2
9
14:3
0-1
4:5
9
15:0
0-1
5:2
9
15:3
0-1
5:5
9
16:0
0-1
6:2
9
16
:30
-16
:59
17:0
0-1
7:2
9
17:3
0-1
7:5
9
18:0
0-1
8:2
9
18:3
0-1
8:5
9
19:0
0-1
9:2
9
19:3
0-1
9:5
9
20
:00
-20
:29
20:3
0-2
0:5
9
21:0
0-2
1:2
9
21:3
0-2
1:5
9
22:0
0-2
2:2
9
22:3
0-2
2:5
9
23:0
0-2
3:2
9
23
:30
-23
:59
CARAIBES [22] GUINEN TELE NATIONALE D'HAITI [08] ON TV [46] METROPOLE
India
Palace pour 2
Tele ginen
magazine
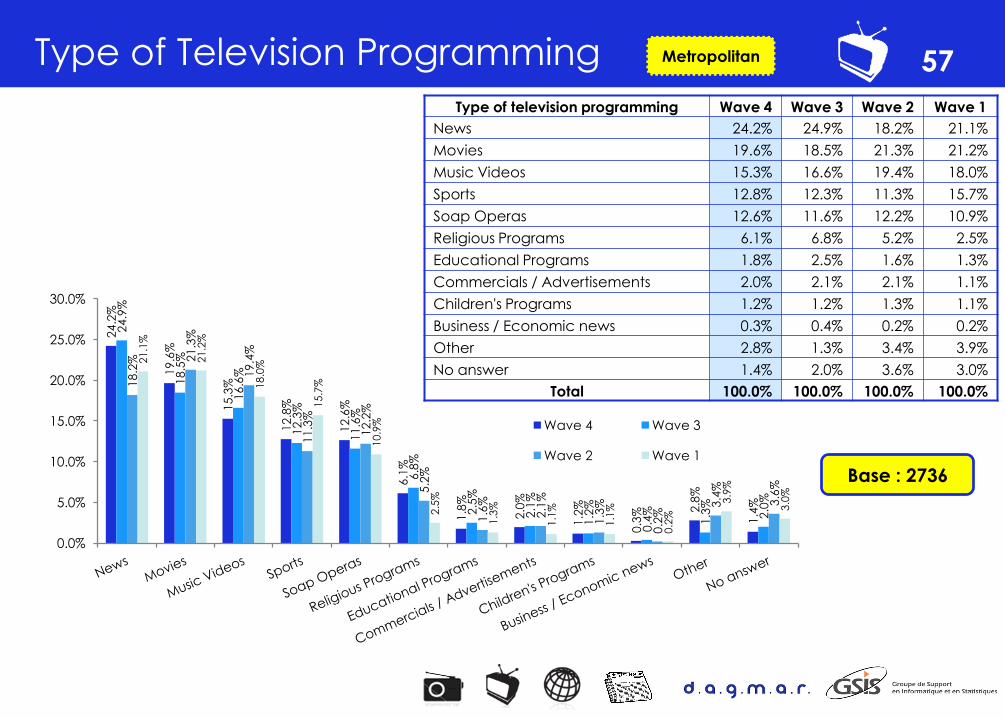
Type of Television Programming 57 Metropolitan
Base : 2736
Type of television programming Wave 4 Wave 3 Wave 2 Wave 1
News 24.2% 24.9% 18.2% 21.1%
Movies 19.6% 18.5% 21.3% 21.2%
Music Videos 15.3% 16.6% 19.4% 18.0%
Sports 12.8% 12.3% 11.3% 15.7%
Soap Operas 12.6% 11.6% 12.2% 10.9%
Religious Programs 6.1% 6.8% 5.2% 2.5%
Educational Programs 1.8% 2.5% 1.6% 1.3%
Commercials / Advertisements 2.0% 2.1% 2.1% 1.1%
Children's Programs 1.2% 1.2% 1.3% 1.1%
Business / Economic news 0.3% 0.4% 0.2% 0.2%
Other 2.8% 1.3% 3.4% 3.9%
No answer 1.4% 2.0% 3.6% 3.0%
Total 100.0% 100.0% 100.0% 100.0%
24
.2%
19
.6%
15
.3%
12
.8%
12
.6%
6.1
%
1.8
%
2.0
%
1.2
%
0.3
% 2.8
%
1.4
%
24
.9%
18
.5%
16
.6%
12
.3%
11
.6%
6.8
%
2.5
%
2.1
%
1.2
%
0.4
%
1.3
%
2.0
%
18
.2%
21
.3%
19
.4%
11
.3%
12
.2%
5.2
%
1.6
%
2.1
%
1.3
%
0.2
% 3
.4%
3.6
%
21.1
%
21.2
%
18.0
%
15.7
%
10.9
%
2.5
%
1.3
%
1.1
%
1.1
%
0.2
%
3.9
%
3.0
%
0.0%
5.0%
10.0%
15.0%
20.0%
25.0%
30.0%
Wave 4 Wave 3
Wave 2 Wave 1

58 Metropolitan
Most interested to watch on television
Men
Most interested to watch on television for Men
Commune
Total Port-au-Prince
Petion-Ville
Delmas Cite Soleil Croix-des-Bouquets
Carrefour Gressier Leogane Tabarre
News 23.5% 26.5% 23.8% 28.0% 29.9% 28.5% 21.0% 28.8% 20.2% 25.3%
Advertising 2.9% 0.0% 1.7% 0.6% 2.7% 0.6% 0.0% 0.8% 0.8% 1.7%
Music Video 15.0% 15.3% 13.8% 13.6% 17.9% 14.5% 23.5% 16.3% 17.7% 15.1%
Series 2.3% 0.9% 1.2% 0.0% 0.0% 1.1% 1.2% 0.4% 0.8% 1.4%
Soap-opera 5.2% 3.5% 1.8% 1.5% 2.7% 4.1% 2.5% 0.4% 4.0% 3.7%
Sport 20.0% 19.0% 20.9% 22.9% 16.3% 19.2% 27.2% 24.9% 18.5% 20.4%
Religious 4.7% 4.0% 6.6% 6.9% 1.6% 5.9% 1.2% 0.8% 8.1% 5.0%
Education Program 2.2% 2.0% 2.2% 1.5% 1.6% 1.4% 2.5% 0.0% 2.4% 1.9%
Movies 18.2% 19.9% 22.1% 21.7% 21.7% 18.6% 19.8% 23.3% 20.2% 19.8%
Children's Program 0.8% 2.0% 0.9% 1.2% 0.5% 0.9% 0.0% 0.0% 1.6% 0.9%
Business News 0.7% 0.4% 0.4% 0.0% 0.5% 0.0% 0.0% 0.0% 0.0% 0.4%
Others 3.5% 3.8% 3.7% 0.0% 4.3% 3.1% 0.0% 1.2% 5.6% 3.2%
No Answer 1.0% 2.7% 0.9% 2.1% 0.0% 2.0% 1.2% 3.1% 0.0% 1.4%
TOTAL 100.0% 100.0% 100.0% 100.0% 100.0% 100.0% 100.0% 100.0% 100.0% 100.0%
Total Respondents 664 191 259 135 62 237 34 92 43 1717
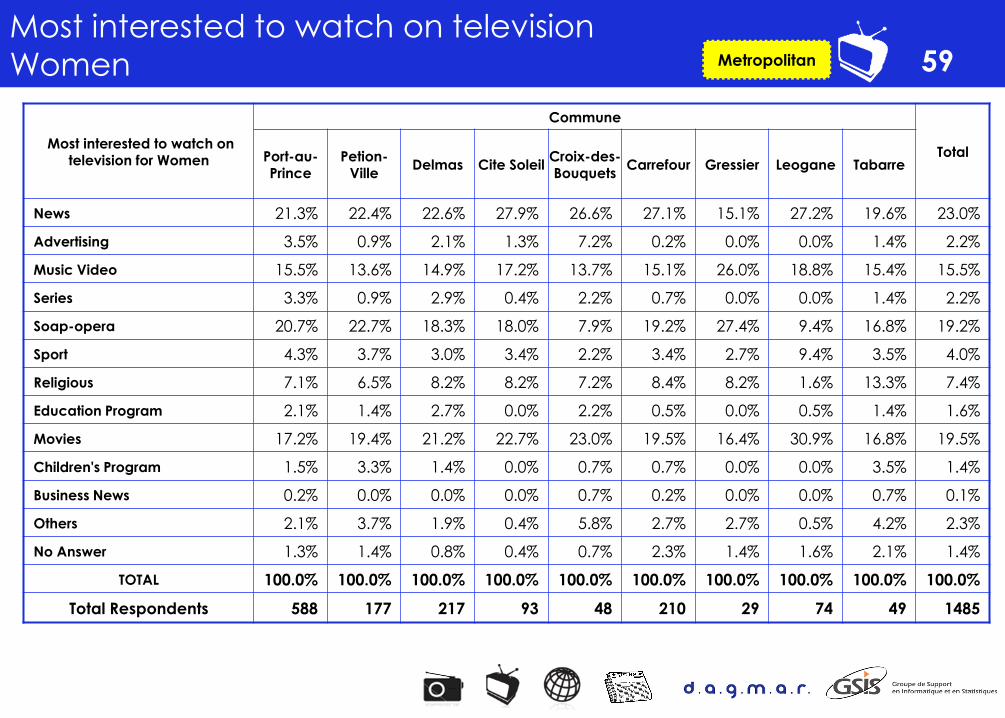
59 Metropolitan
Most interested to watch on television
Women
Most interested to watch on television for Women
Commune
Total Port-au-Prince
Petion-Ville
Delmas Cite Soleil Croix-des-Bouquets
Carrefour Gressier Leogane Tabarre
News 21.3% 22.4% 22.6% 27.9% 26.6% 27.1% 15.1% 27.2% 19.6% 23.0%
Advertising 3.5% 0.9% 2.1% 1.3% 7.2% 0.2% 0.0% 0.0% 1.4% 2.2%
Music Video 15.5% 13.6% 14.9% 17.2% 13.7% 15.1% 26.0% 18.8% 15.4% 15.5%
Series 3.3% 0.9% 2.9% 0.4% 2.2% 0.7% 0.0% 0.0% 1.4% 2.2%
Soap-opera 20.7% 22.7% 18.3% 18.0% 7.9% 19.2% 27.4% 9.4% 16.8% 19.2%
Sport 4.3% 3.7% 3.0% 3.4% 2.2% 3.4% 2.7% 9.4% 3.5% 4.0%
Religious 7.1% 6.5% 8.2% 8.2% 7.2% 8.4% 8.2% 1.6% 13.3% 7.4%
Education Program 2.1% 1.4% 2.7% 0.0% 2.2% 0.5% 0.0% 0.5% 1.4% 1.6%
Movies 17.2% 19.4% 21.2% 22.7% 23.0% 19.5% 16.4% 30.9% 16.8% 19.5%
Children's Program 1.5% 3.3% 1.4% 0.0% 0.7% 0.7% 0.0% 0.0% 3.5% 1.4%
Business News 0.2% 0.0% 0.0% 0.0% 0.7% 0.2% 0.0% 0.0% 0.7% 0.1%
Others 2.1% 3.7% 1.9% 0.4% 5.8% 2.7% 2.7% 0.5% 4.2% 2.3%
No Answer 1.3% 1.4% 0.8% 0.4% 0.7% 2.3% 1.4% 1.6% 2.1% 1.4%
TOTAL 100.0% 100.0% 100.0% 100.0% 100.0% 100.0% 100.0% 100.0% 100.0% 100.0%
Total Respondents 588 177 217 93 48 210 29 74 49 1485

Favorite TV Shows – Top 10 Channels 60 W
ave
3
Wa
ve
4
Tell us more about your favorite TV
program? Show name? TV Station /
Channel
Rank Shows Type of shows TV STATIONS Col %
1 AROYI Soap opera On TV 20.2%
2 GADE L JAN L YE news GINEN 7.7%
3 TANDE AK WE SE 2 news Canal 11 7.4%
4 DANS LES VESTIERES DES STADES sport GINEN 6.6%
5 BOUL PIK (SOCCER) Sport (soccer) CARAIBES 5.5%
6 TELE JOURNAL news Tele Nationale d'Haiti 4.9%
7 INDIA Soap opera Caraibes/eclair 4.2%
8 EURO NEWS International News CARAIBES 2.2%
9 KALFOU culture GINEN 1.7%
10 TRIPP VIBE(RAP) music video Tripp TV 1.5%
OTHERS OTHERS 38.1%
Rank Shows Type of shows TV STATIONS Col %
1 GADEL JAN L' YE A news GINEN 12.1%
2 INDIA Soap opera Caraibes/eclair 11.2%
3 DANS LES VESTIERES DES STADES sport GINEN 7.7%
4 PALACE POUR 2 Soap opera Caraibes/eclair 7.4%
5 TANDE AK WE SE 2 news Canal 11 5.5%
6 TELE JOUNAL news Tele Nationale d'Haiti 4.8%
7 TRIPP VIBE(RAP) music video Tripp TV 3.7%
8 KALFOU culture GINEN 1.7%
9 ANVANN VOTE election Media consortium 0.9%
10 KOM SI WOW education Canal bleu 0.3%
OTHERS OTHERS 44.7%
Rank Shows Type of shows TV STATIONS Col %
1 EL DIABLO Soap opera CARAIBES / ECLAIR 19.6%
2 DANS LES VESTIARES DES STADES Sport (soccer) GINEN 3.7%
3 GADE L JAN L YE Local News GINEN 2.9%
4 LA FILLE DU JARDINIER Soap opera CARAIBES / ECLAIR 1.9%
5 KALFOU Culture GINEN 1.8%
6 TANDE AK WE SE DE Local News CANAL 11 1.5%
7 EURONEWS International News CARAIBES 1.2%
8 BOUL PIK Sport (soccer) CARAIBES 1.1%
9 PASTEUR JOEL JEUNE Religious TELE SOLEIL 1.0%
10 WI FOOT Sport (soccer) TELE NATIONALE D’HAITI 0.7%
OTHERS OTHERS 64.6%
Wa
ve
2

Television stations Actually Most Watched 61
Of all the television stations you watch, which one do you watch the most?
Metropolitan
Rank Television watched most often? Wave 4 Wave 3 Wave 2 Wave 1
1 CARAIBES [22] 18.2% 24.0% 31.5% 16.2%
2 GUINEN 13.5% 12.2% 10.2% 14.1%
3 TELE NATIONALE D'HAITI [08] 11.2% 8.5% 4.4% 7.3%
4 ON TV [46] 9.1% 0.7% 0.4% 2.6%
5 CANAL [11] 7.9% 8.3% 7.3% 12.3%
6 METROPOLE 5.2% 5.3% 5.4% 4.4%
7 ECLAIR [4] 5.0% 7.3% 12.2% 9.9%
8 INDIGENE [54] 4.0% 4.9% 6.3% 7.7%
9 TRIPP TV [28] 3.6% 4.7% 5.9% 4.8%
10 LUMIERE 3.5% 4.3% 2.5% 1.5%
OTHERS 11.5% 13.4% 8.8% 12.3%
DON'T KNOW / NO ANSWER 7.3% 6.4% 5.1% 6.9%
TOTAL 100.0% 100.0% 100.0% 100.0%
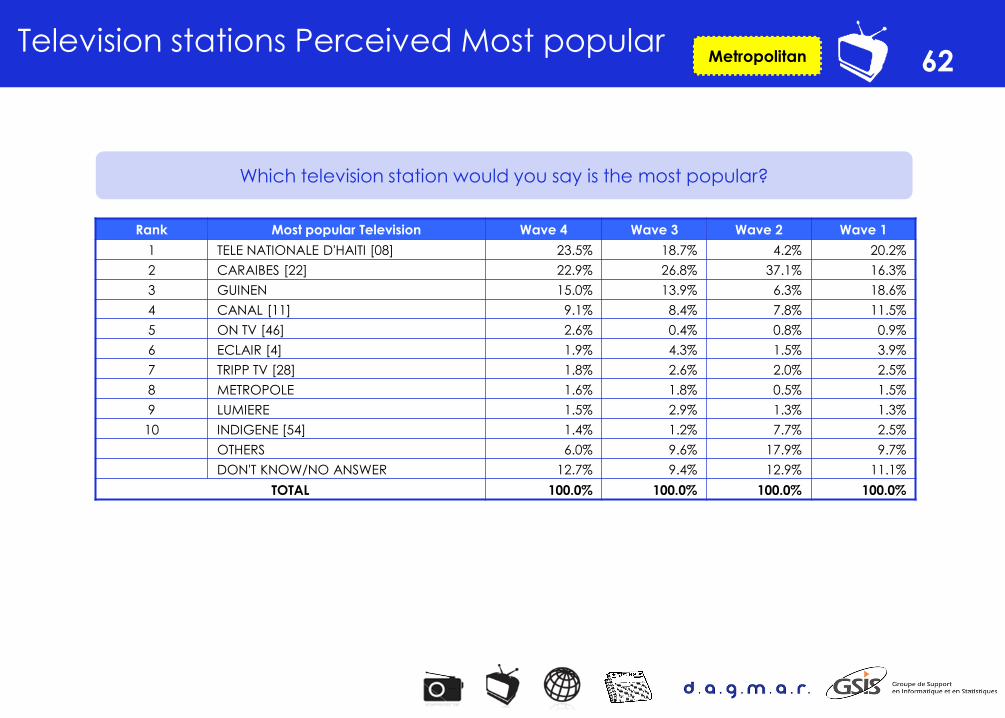
Television stations Perceived Most popular 62
Which television station would you say is the most popular?
Metropolitan
Rank Most popular Television Wave 4 Wave 3 Wave 2 Wave 1
1 TELE NATIONALE D'HAITI [08] 23.5% 18.7% 4.2% 20.2%
2 CARAIBES [22] 22.9% 26.8% 37.1% 16.3%
3 GUINEN 15.0% 13.9% 6.3% 18.6%
4 CANAL [11] 9.1% 8.4% 7.8% 11.5%
5 ON TV [46] 2.6% 0.4% 0.8% 0.9%
6 ECLAIR [4] 1.9% 4.3% 1.5% 3.9%
7 TRIPP TV [28] 1.8% 2.6% 2.0% 2.5%
8 METROPOLE 1.6% 1.8% 0.5% 1.5%
9 LUMIERE 1.5% 2.9% 1.3% 1.3%
10 INDIGENE [54] 1.4% 1.2% 7.7% 2.5%
OTHERS 6.0% 9.6% 17.9% 9.7%
DON'T KNOW/NO ANSWER 12.7% 9.4% 12.9% 11.1%
TOTAL 100.0% 100.0% 100.0% 100.0%
INTERNET
63
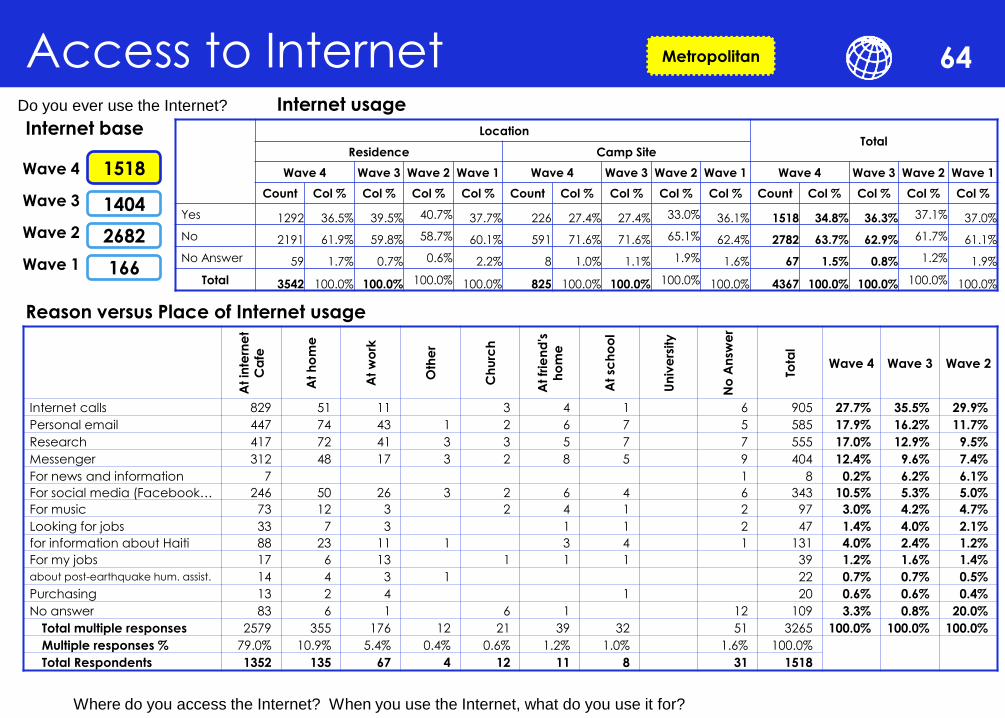
Access to Internet 64
Internet base
Reason versus Place of Internet usage
2682
1518 Wave 4
Wave 3
Wave 2
Wave 1
Internet usage
Metropolitan
Where do you access the Internet? When you use the Internet, what do you use it for?
Do you ever use the Internet?
1404
166
Location Total
Residence Camp Site
Wave 4 Wave 3 Wave 2 Wave 1 Wave 4 Wave 3 Wave 2 Wave 1 Wave 4 Wave 3 Wave 2 Wave 1
Count Col % Col % Col % Col % Count Col % Col % Col % Col % Count Col % Col % Col % Col %
Yes 1292 36.5% 39.5% 40.7% 37.7% 226 27.4% 27.4% 33.0% 36.1% 1518 34.8% 36.3% 37.1% 37.0%
No 2191 61.9% 59.8% 58.7% 60.1% 591 71.6% 71.6% 65.1% 62.4% 2782 63.7% 62.9% 61.7% 61.1%
No Answer 59 1.7% 0.7% 0.6% 2.2% 8 1.0% 1.1% 1.9% 1.6% 67 1.5% 0.8% 1.2% 1.9%
Total 3542 100.0% 100.0% 100.0% 100.0% 825 100.0% 100.0% 100.0% 100.0% 4367 100.0% 100.0% 100.0% 100.0%
At
inte
rne
t
Ca
fe
At
ho
me
At
wo
rk
Oth
er
Ch
urc
h
At
frie
nd
's
ho
me
At
sch
oo
l
Un
ive
rsity
No
An
swe
r
Tota
l
Wave 4 Wave 3 Wave 2
Internet calls 829 51 11 3 4 1 6 905 27.7% 35.5% 29.9%
Personal email 447 74 43 1 2 6 7 5 585 17.9% 16.2% 11.7%
Research 417 72 41 3 3 5 7 7 555 17.0% 12.9% 9.5%
Messenger 312 48 17 3 2 8 5 9 404 12.4% 9.6% 7.4%
For news and information 7 1 8 0.2% 6.2% 6.1%
For social media (Facebook… 246 50 26 3 2 6 4 6 343 10.5% 5.3% 5.0%
For music 73 12 3 2 4 1 2 97 3.0% 4.2% 4.7%
Looking for jobs 33 7 3 1 1 2 47 1.4% 4.0% 2.1%
for information about Haiti 88 23 11 1 3 4 1 131 4.0% 2.4% 1.2%
For my jobs 17 6 13 1 1 1 39 1.2% 1.6% 1.4%
about post-earthquake hum. assist. 14 4 3 1 22 0.7% 0.7% 0.5%
Purchasing 13 2 4 1 20 0.6% 0.6% 0.4%
No answer 83 6 1 6 1 12 109 3.3% 0.8% 20.0%
Total multiple responses 2579 355 176 12 21 39 32 51 3265 100.0% 100.0% 100.0%
Multiple responses % 79.0% 10.9% 5.4% 0.4% 0.6% 1.2% 1.0% 1.6% 100.0%
Total Respondents 1352 135 67 4 12 11 8 31 1518

News Paper
65
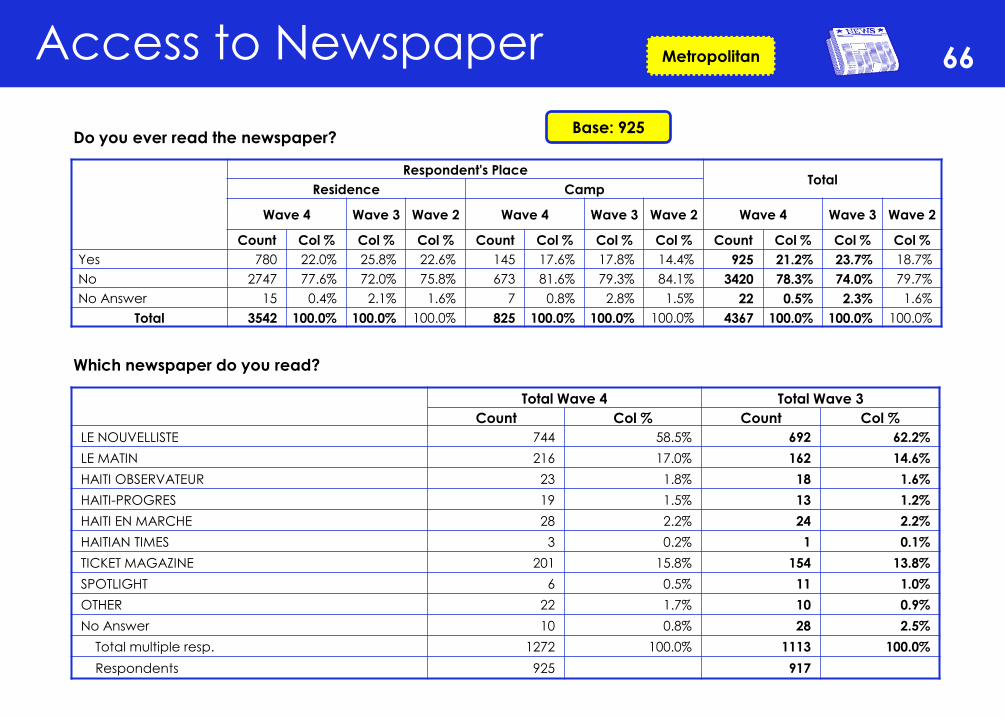
Access to Newspaper 66
Do you ever read the newspaper?
Which newspaper do you read?
Base: 925
Metropolitan
Respondent's Place Total
Residence Camp
Wave 4 Wave 3 Wave 2 Wave 4 Wave 3 Wave 2 Wave 4 Wave 3 Wave 2
Count Col % Col % Col % Count Col % Col % Col % Count Col % Col % Col %
Yes 780 22.0% 25.8% 22.6% 145 17.6% 17.8% 14.4% 925 21.2% 23.7% 18.7%
No 2747 77.6% 72.0% 75.8% 673 81.6% 79.3% 84.1% 3420 78.3% 74.0% 79.7%
No Answer 15 0.4% 2.1% 1.6% 7 0.8% 2.8% 1.5% 22 0.5% 2.3% 1.6%
Total 3542 100.0% 100.0% 100.0% 825 100.0% 100.0% 100.0% 4367 100.0% 100.0% 100.0%
Total Wave 4 Total Wave 3
Count Col % Count Col %
LE NOUVELLISTE 744 58.5% 692 62.2%
LE MATIN 216 17.0% 162 14.6%
HAITI OBSERVATEUR 23 1.8% 18 1.6%
HAITI-PROGRES 19 1.5% 13 1.2%
HAITI EN MARCHE 28 2.2% 24 2.2%
HAITIAN TIMES 3 0.2% 1 0.1%
TICKET MAGAZINE 201 15.8% 154 13.8%
SPOTLIGHT 6 0.5% 11 1.0%
OTHER 22 1.7% 10 0.9%
No Answer 10 0.8% 28 2.5%
Total multiple resp. 1272 100.0% 1113 100.0%
Respondents 925 917
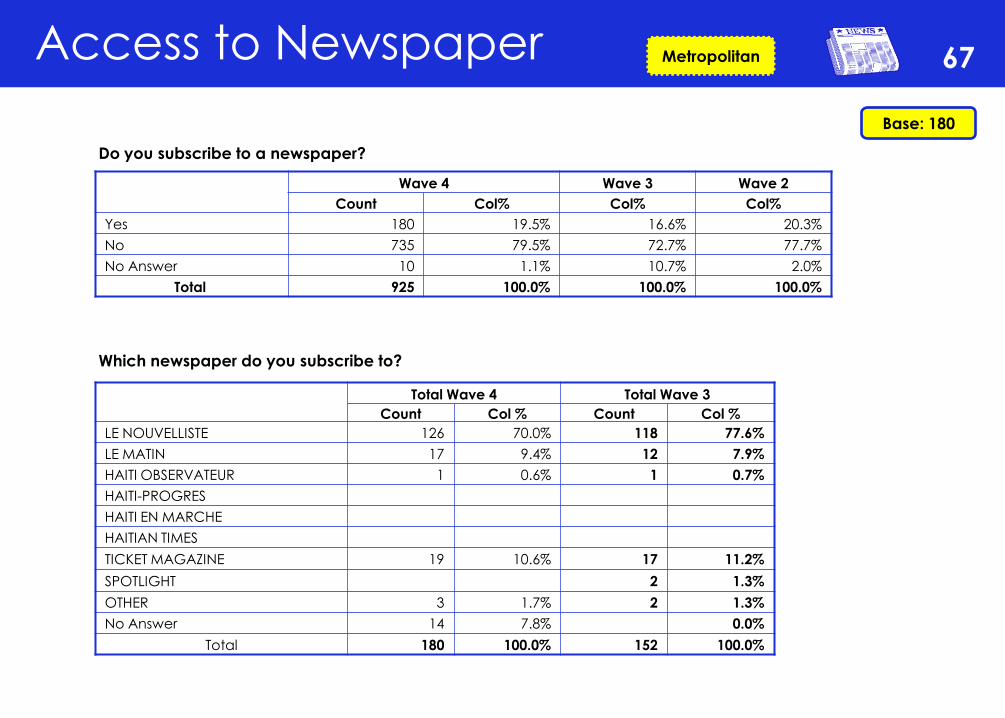
Access to Newspaper 67
Which newspaper do you subscribe to?
Do you subscribe to a newspaper?
Base: 180
Metropolitan
Wave 4 Wave 3 Wave 2
Count Col% Col% Col%
Yes 180 19.5% 16.6% 20.3%
No 735 79.5% 72.7% 77.7%
No Answer 10 1.1% 10.7% 2.0%
Total 925 100.0% 100.0% 100.0%
Total Wave 4 Total Wave 3
Count Col % Count Col %
LE NOUVELLISTE 126 70.0% 118 77.6%
LE MATIN 17 9.4% 12 7.9%
HAITI OBSERVATEUR 1 0.6% 1 0.7%
HAITI-PROGRES
HAITI EN MARCHE
HAITIAN TIMES
TICKET MAGAZINE 19 10.6% 17 11.2%
SPOTLIGHT 2 1.3%
OTHER 3 1.7% 2 1.3%
No Answer 14 7.8% 0.0%
Total 180 100.0% 152 100.0%
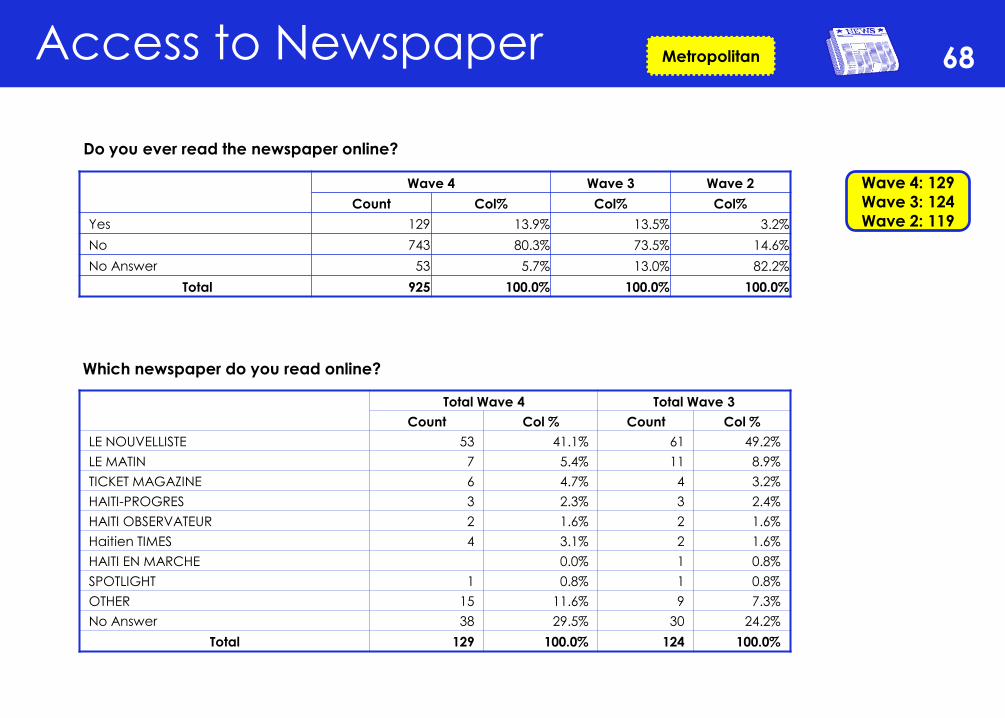
Access to Newspaper 68
Which newspaper do you read online?
Do you ever read the newspaper online?
Wave 4: 129
Wave 3: 124
Wave 2: 119
Metropolitan
Wave 4 Wave 3 Wave 2
Count Col% Col% Col%
Yes 129 13.9% 13.5% 3.2%
No 743 80.3% 73.5% 14.6%
No Answer 53 5.7% 13.0% 82.2%
Total 925 100.0% 100.0% 100.0%
Total Wave 4 Total Wave 3
Count Col % Count Col %
LE NOUVELLISTE 53 41.1% 61 49.2%
LE MATIN 7 5.4% 11 8.9%
TICKET MAGAZINE 6 4.7% 4 3.2%
HAITI-PROGRES 3 2.3% 3 2.4%
HAITI OBSERVATEUR 2 1.6% 2 1.6%
Haitien TIMES 4 3.1% 2 1.6%
HAITI EN MARCHE 0.0% 1 0.8%
SPOTLIGHT 1 0.8% 1 0.8%
OTHER 15 11.6% 9 7.3%
No Answer 38 29.5% 30 24.2%
Total 129 100.0% 124 100.0%
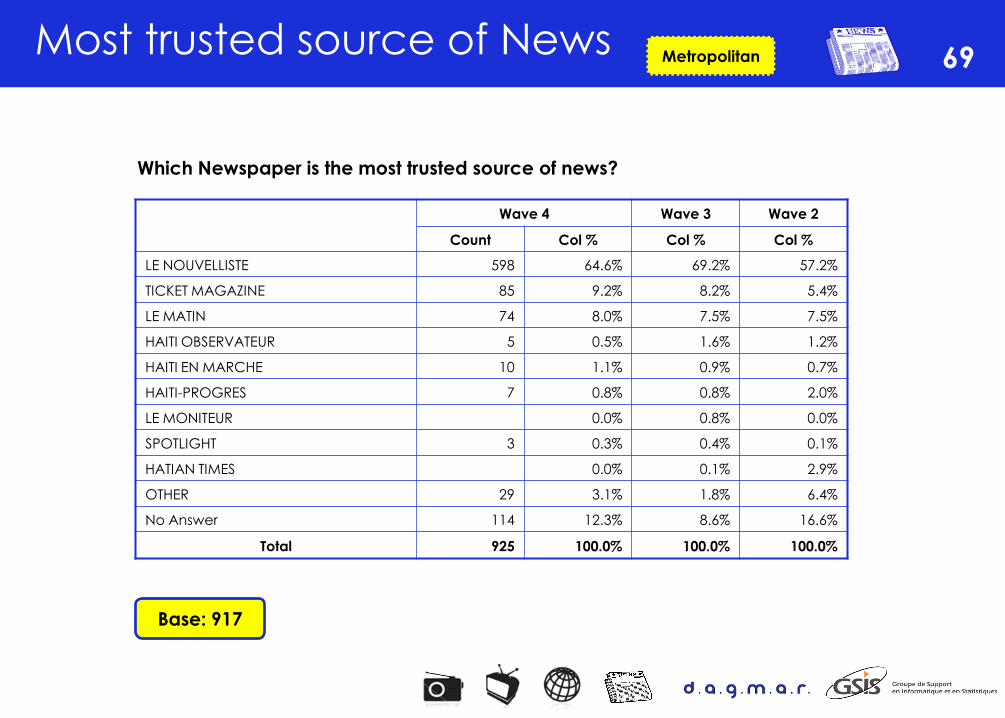
Most trusted source of News 69
Which Newspaper is the most trusted source of news?
Base: 917
Metropolitan
Wave 4 Wave 3 Wave 2
Count Col % Col % Col %
LE NOUVELLISTE 598 64.6% 69.2% 57.2%
TICKET MAGAZINE 85 9.2% 8.2% 5.4%
LE MATIN 74 8.0% 7.5% 7.5%
HAITI OBSERVATEUR 5 0.5% 1.6% 1.2%
HAITI EN MARCHE 10 1.1% 0.9% 0.7%
HAITI-PROGRES 7 0.8% 0.8% 2.0%
LE MONITEUR 0.0% 0.8% 0.0%
SPOTLIGHT 3 0.3% 0.4% 0.1%
HATIAN TIMES 0.0% 0.1% 2.9%
OTHER 29 3.1% 1.8% 6.4%
No Answer 114 12.3% 8.6% 16.6%
Total 925 100.0% 100.0% 100.0%
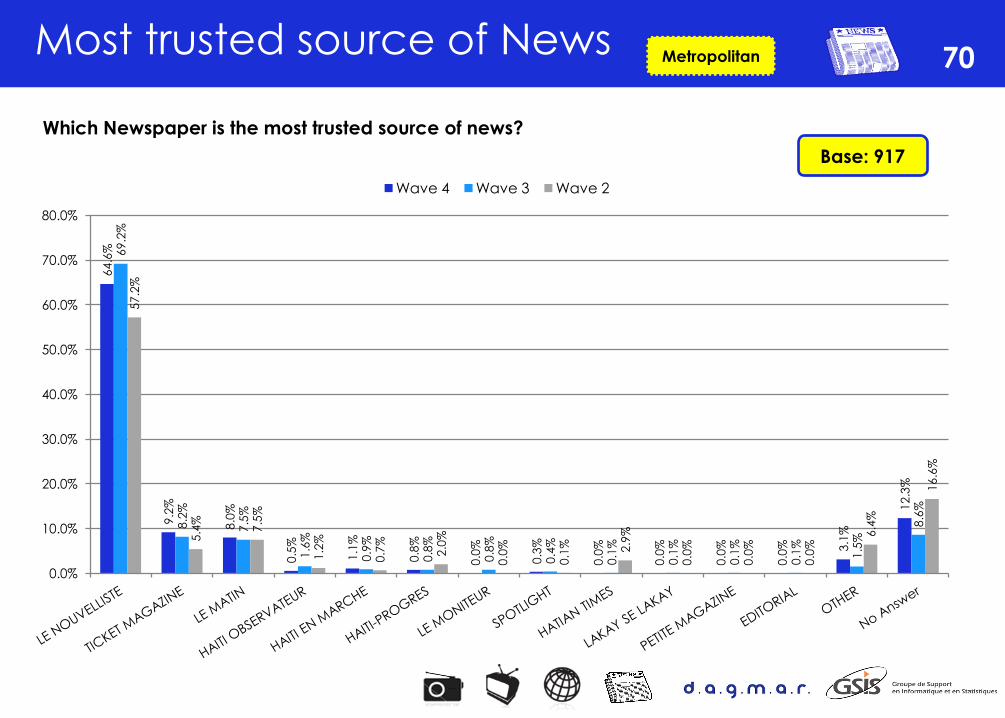
Most trusted source of News 70
Which Newspaper is the most trusted source of news?
Base: 917
Metropolitan
64
.6%
9.2
%
8.0
%
0.5
%
1.1
%
0.8
%
0.0
%
0.3
%
0.0
%
0.0
%
0.0
%
0.0
%
3.1
%
12
.3%
69
.2%
8.2
%
7.5
%
1.6
%
0.9
%
0.8
%
0.8
%
0.4
%
0.1
%
0.1
%
0.1
%
0.1
%
1.5
%
8.6
%
57
.2%
5.4
%
7.5
%
1.2
%
0.7
%
2.0
%
0.0
%
0.1
%
2.9
%
0.0
%
0.0
%
0.0
% 6
.4%
16
.6%
0.0%
10.0%
20.0%
30.0%
40.0%
50.0%
60.0%
70.0%
80.0%
Wave 4 Wave 3 Wave 2
Haiti Elections
2010
71
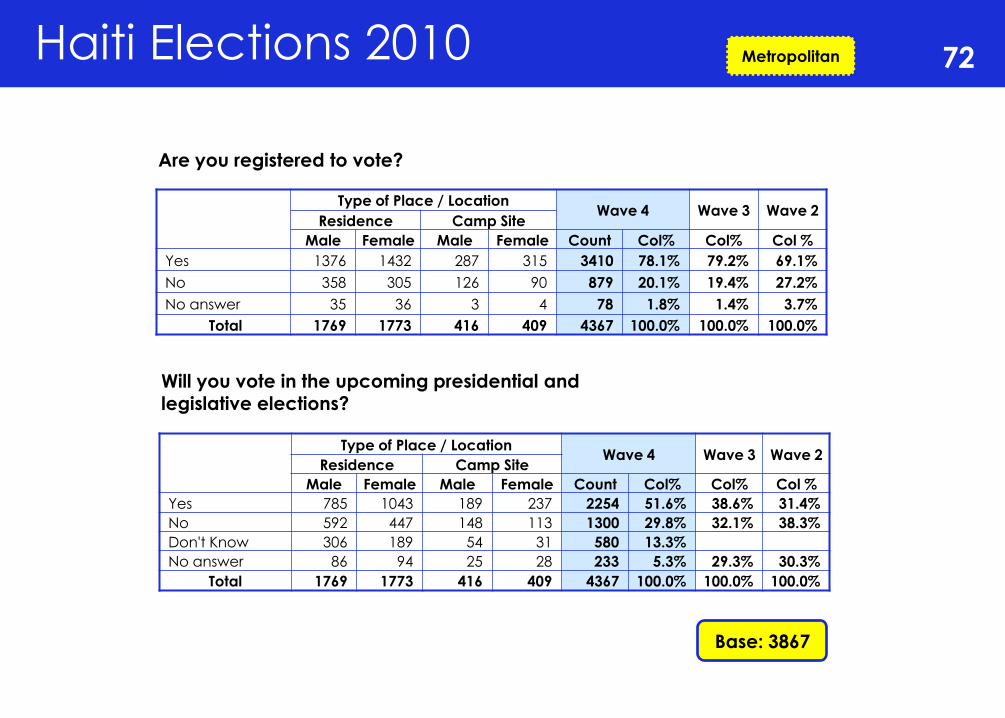
Haiti Elections 2010 72
Are you registered to vote?
Will you vote in the upcoming presidential and legislative elections?
Base: 3867
Metropolitan
Type of Place / Location Wave 4 Wave 3 Wave 2
Residence Camp Site
Male Female Male Female Count Col% Col% Col %
Yes 785 1043 189 237 2254 51.6% 38.6% 31.4%
No 592 447 148 113 1300 29.8% 32.1% 38.3%
Don't Know 306 189 54 31 580 13.3%
No answer 86 94 25 28 233 5.3% 29.3% 30.3%
Total 1769 1773 416 409 4367 100.0% 100.0% 100.0%
Type of Place / Location Wave 4 Wave 3 Wave 2
Residence Camp Site
Male Female Male Female Count Col% Col% Col %
Yes 1376 1432 287 315 3410 78.1% 79.2% 69.1%
No 358 305 126 90 879 20.1% 19.4% 27.2%
No answer 35 36 3 4 78 1.8% 1.4% 3.7%
Total 1769 1773 416 409 4367 100.0% 100.0% 100.0%
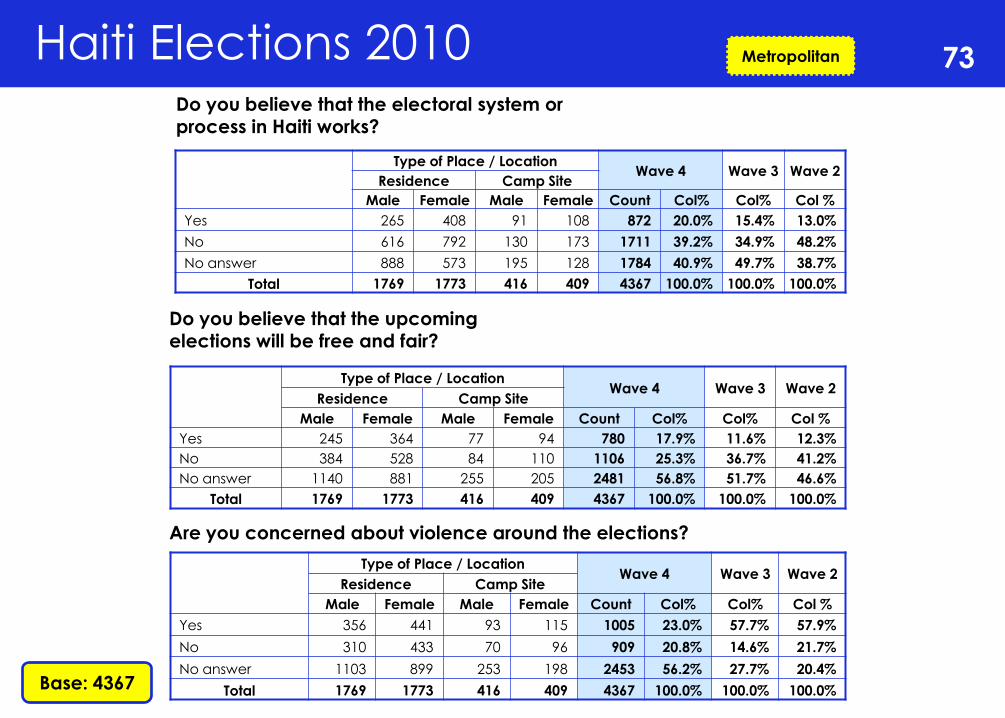
Haiti Elections 2010 73
Do you believe that the electoral system or process in Haiti works?
Do you believe that the upcoming elections will be free and fair?
Are you concerned about violence around the elections?
Base: 4367
Metropolitan
Type of Place / Location Wave 4 Wave 3 Wave 2
Residence Camp Site
Male Female Male Female Count Col% Col% Col %
Yes 265 408 91 108 872 20.0% 15.4% 13.0%
No 616 792 130 173 1711 39.2% 34.9% 48.2%
No answer 888 573 195 128 1784 40.9% 49.7% 38.7%
Total 1769 1773 416 409 4367 100.0% 100.0% 100.0%
Type of Place / Location Wave 4 Wave 3 Wave 2
Residence Camp Site
Male Female Male Female Count Col% Col% Col %
Yes 245 364 77 94 780 17.9% 11.6% 12.3%
No 384 528 84 110 1106 25.3% 36.7% 41.2%
No answer 1140 881 255 205 2481 56.8% 51.7% 46.6%
Total 1769 1773 416 409 4367 100.0% 100.0% 100.0%
Type of Place / Location Wave 4 Wave 3 Wave 2
Residence Camp Site
Male Female Male Female Count Col% Col% Col %
Yes 356 441 93 115 1005 23.0% 57.7% 57.9%
No 310 433 70 96 909 20.8% 14.6% 21.7%
No answer 1103 899 253 198 2453 56.2% 27.7% 20.4%
Total 1769 1773 416 409 4367 100.0% 100.0% 100.0%
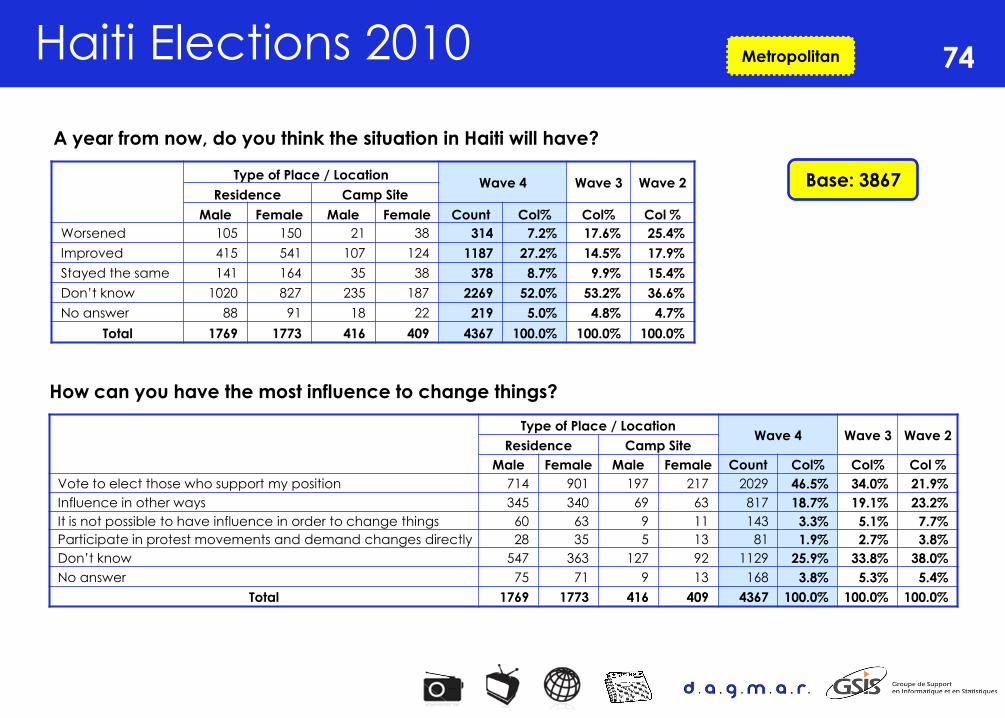
Haiti Elections 2010 74
How can you have the most influence to change things?
Base: 3867
Metropolitan
A year from now, do you think the situation in Haiti will have?
Type of Place / Location Wave 4 Wave 3 Wave 2
Residence Camp Site
Male Female Male Female Count Col% Col% Col %
Worsened 105 150 21 38 314 7.2% 17.6% 25.4%
Improved 415 541 107 124 1187 27.2% 14.5% 17.9%
Stayed the same 141 164 35 38 378 8.7% 9.9% 15.4%
Don’t know 1020 827 235 187 2269 52.0% 53.2% 36.6%
No answer 88 91 18 22 219 5.0% 4.8% 4.7%
Total 1769 1773 416 409 4367 100.0% 100.0% 100.0%
Type of Place / Location Wave 4 Wave 3 Wave 2
Residence Camp Site
Male Female Male Female Count Col% Col% Col %
Vote to elect those who support my position 714 901 197 217 2029 46.5% 34.0% 21.9%
Influence in other ways 345 340 69 63 817 18.7% 19.1% 23.2%
It is not possible to have influence in order to change things 60 63 9 11 143 3.3% 5.1% 7.7%
Participate in protest movements and demand changes directly 28 35 5 13 81 1.9% 2.7% 3.8%
Don’t know 547 363 127 92 1129 25.9% 33.8% 38.0%
No answer 75 71 9 13 168 3.8% 5.3% 5.4%
Total 1769 1773 416 409 4367 100.0% 100.0% 100.0%
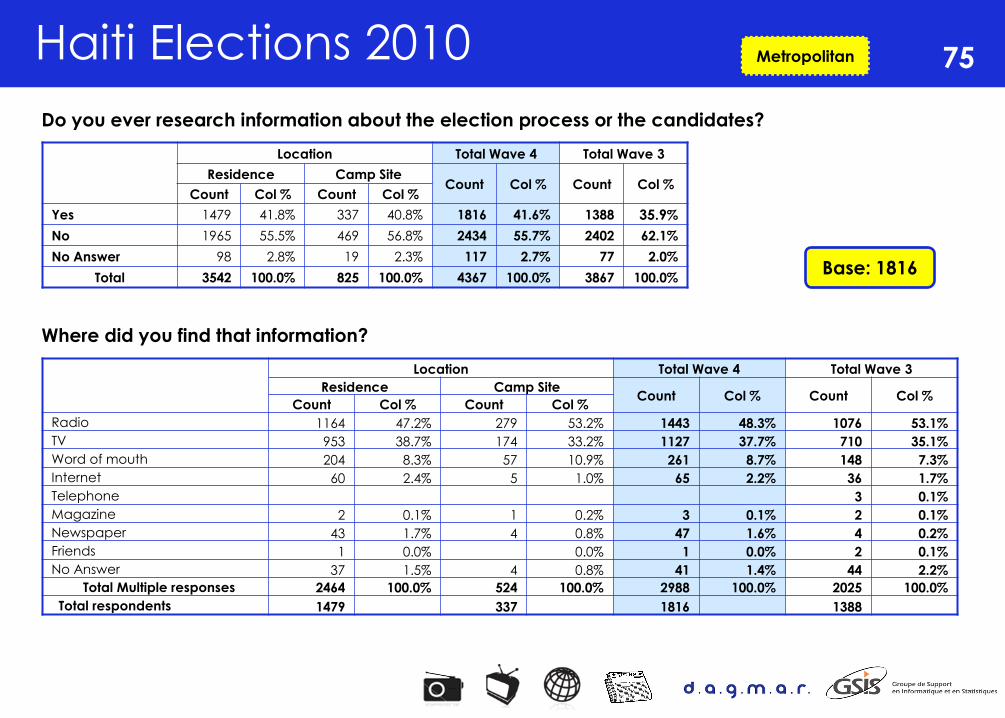
75 Haiti Elections 2010
Do you ever research information about the election process or the candidates?
Where did you find that information?
Base: 1816
Metropolitan
Location Total Wave 4 Total Wave 3
Residence Camp Site Count Col % Count Col %
Count Col % Count Col %
Yes 1479 41.8% 337 40.8% 1816 41.6% 1388 35.9%
No 1965 55.5% 469 56.8% 2434 55.7% 2402 62.1%
No Answer 98 2.8% 19 2.3% 117 2.7% 77 2.0%
Total 3542 100.0% 825 100.0% 4367 100.0% 3867 100.0%
Location Total Wave 4 Total Wave 3
Residence Camp Site Count Col % Count Col %
Count Col % Count Col %
Radio 1164 47.2% 279 53.2% 1443 48.3% 1076 53.1%
TV 953 38.7% 174 33.2% 1127 37.7% 710 35.1%
Word of mouth 204 8.3% 57 10.9% 261 8.7% 148 7.3%
Internet 60 2.4% 5 1.0% 65 2.2% 36 1.7%
Telephone 3 0.1%
Magazine 2 0.1% 1 0.2% 3 0.1% 2 0.1%
Newspaper 43 1.7% 4 0.8% 47 1.6% 4 0.2%
Friends 1 0.0% 0.0% 1 0.0% 2 0.1%
No Answer 37 1.5% 4 0.8% 41 1.4% 44 2.2%
Total Multiple responses 2464 100.0% 524 100.0% 2988 100.0% 2025 100.0%
Total respondents 1479 337 1816 1388

76 Haiti Elections 2010
Of all these sources of information, which is the one you trust the most?
Base: 1816
Metropolitan
Location Total Wave 4 Total Wave 3
Residence Camp Site Count Col % Count Col %
Count Col % Count Col %
Radio 588 39.8% 145 43.0% 733 40.4% 687 49.5%
TV 629 42.5% 121 35.9% 750 41.3% 491 35.4%
Word of mouth 22 1.5% 2 0.6% 24 1.3% 30 2.2%
Internet 21 1.4% 1 0.3% 22 1.2% 26 1.9%
Telephone 48 3.2% 4 1.2% 52 2.9% 4 0.3%
Magazine 1 0.1% 1 0.1% 2 0.1%
Newspaper 4 0.3% 2 0.6% 6 0.3% 2 0.1%
Friends 2 0.1% 2 0.1%
No Answer 164 11.1% 62 18.4% 226 12.4% 146 10.5%
Total 1479 100.0% 337 100.0% 1816 100.0% 1388 100.0%

Haiti Elections 2010 77
Do you ever listen or watch electoral debates GIAP "Anvan’n vote"?
On which media did you listen or watch the electoral debates GIAP "Anvan’n vote"?
Base: 1348
Metropolitan
Location Total Wave 4 Total Wave 3
Residence Camp Site Count Col % Count Col %
Count Col % Count Col %
Yes 1109 75.0% 239 70.9% 1348 74.2% 850 61.2%
No 287 19.4% 91 27.0% 378 20.8% 408 29.4%
No Answer 83 5.6% 7 2.1% 90 5.0% 130 9.4%
Total 1479 100.0% 337 100.0% 1816 100.0% 1388 100.0%
Location Total Wave 4 Total Wave 3
Residence Camp Site Count Col % Count Col %
Count Col % Count Col %
Radio 267 24.1% 84 35.1% 351 26.0% 223 26.2%
TV 653 58.9% 118 49.4% 771 57.2% 439 51.6%
Radio & TV simultaneous 159 14.3% 31 13.0% 190 14.1% 146 17.2%
No Answer 30 2.7% 6 2.5% 36 2.7% 42 4.9%
Total 1109 100.0% 239 100.0% 1348 100.0% 850 100.0%
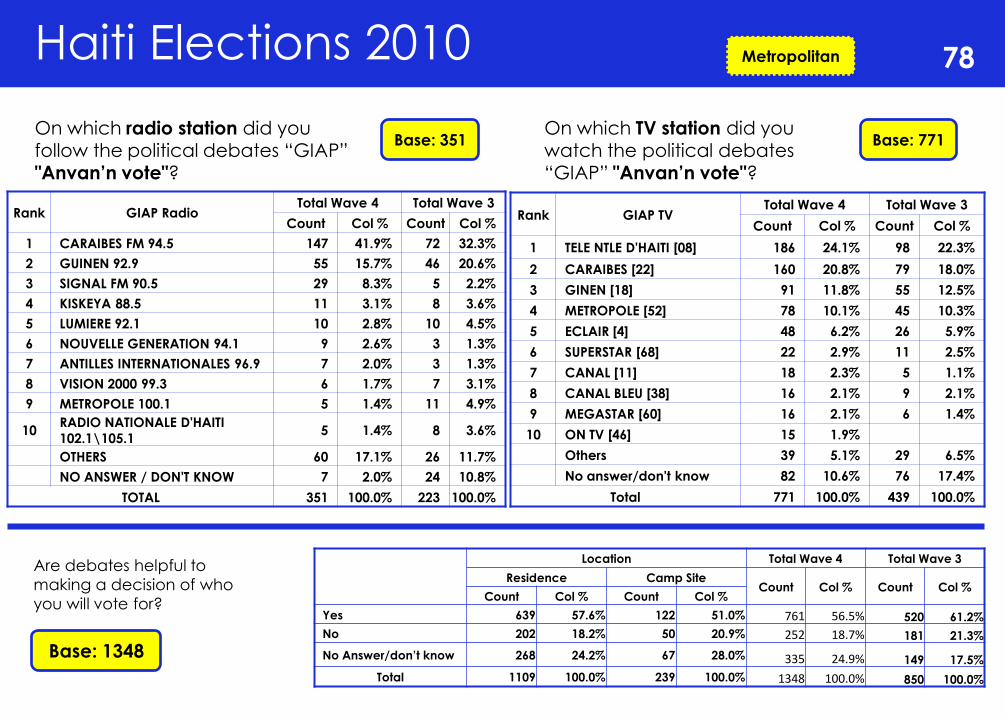
Haiti Elections 2010 78
On which radio station did you follow the political debates “GIAP” "Anvan’n vote"?
On which TV station did you watch the political debates “GIAP” "Anvan’n vote"?
Base: 351 Base: 771
Are debates helpful to
making a decision of who
you will vote for?
Metropolitan
Rank GIAP Radio Total Wave 4 Total Wave 3
Count Col % Count Col %
1 CARAIBES FM 94.5 147 41.9% 72 32.3%
2 GUINEN 92.9 55 15.7% 46 20.6%
3 SIGNAL FM 90.5 29 8.3% 5 2.2%
4 KISKEYA 88.5 11 3.1% 8 3.6%
5 LUMIERE 92.1 10 2.8% 10 4.5%
6 NOUVELLE GENERATION 94.1 9 2.6% 3 1.3%
7 ANTILLES INTERNATIONALES 96.9 7 2.0% 3 1.3%
8 VISION 2000 99.3 6 1.7% 7 3.1%
9 METROPOLE 100.1 5 1.4% 11 4.9%
10 RADIO NATIONALE D'HAITI
102.1\105.1 5 1.4% 8 3.6%
OTHERS 60 17.1% 26 11.7%
NO ANSWER / DON'T KNOW 7 2.0% 24 10.8%
TOTAL 351 100.0% 223 100.0%
Rank GIAP TV Total Wave 4 Total Wave 3
Count Col % Count Col %
1 TELE NTLE D'HAITI [08] 186 24.1% 98 22.3%
2 CARAIBES [22] 160 20.8% 79 18.0%
3 GINEN [18] 91 11.8% 55 12.5%
4 METROPOLE [52] 78 10.1% 45 10.3%
5 ECLAIR [4] 48 6.2% 26 5.9%
6 SUPERSTAR [68] 22 2.9% 11 2.5%
7 CANAL [11] 18 2.3% 5 1.1%
8 CANAL BLEU [38] 16 2.1% 9 2.1%
9 MEGASTAR [60] 16 2.1% 6 1.4%
10 ON TV [46] 15 1.9%
Others 39 5.1% 29 6.5%
No answer/don't know 82 10.6% 76 17.4%
Total 771 100.0% 439 100.0%
Location Total Wave 4 Total Wave 3
Residence Camp Site Count Col % Count Col %
Count Col % Count Col %
Yes 639 57.6% 122 51.0% 761 56.5% 520 61.2%
No 202 18.2% 50 20.9% 252 18.7% 181 21.3%
No Answer/don’t know 268 24.2% 67 28.0% 335 24.9% 149 17.5%
Total 1109 100.0% 239 100.0% 1348 100.0% 850 100.0%
Base: 1348

Citizen Perceptions on
Post-Earthquake
Assistance
79
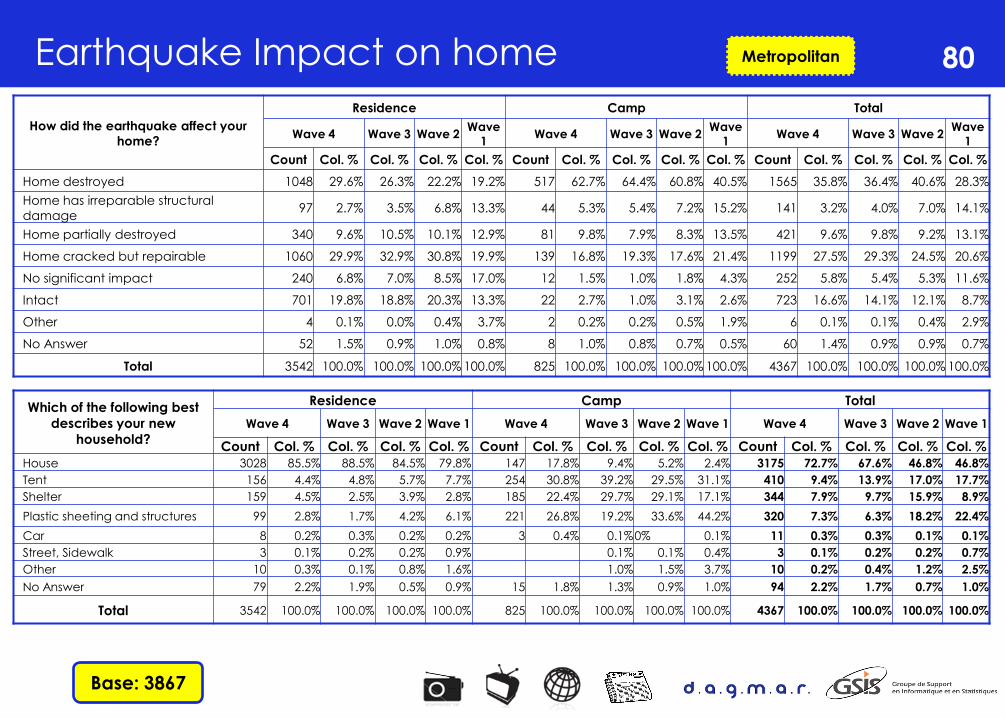
Earthquake Impact on home 80
Metropolitan
Base: 3867
How did the earthquake affect your
home?
Residence Camp Total
Wave 4 Wave 3 Wave 2 Wave
1 Wave 4 Wave 3 Wave 2
Wave
1 Wave 4 Wave 3 Wave 2
Wave
1
Count Col. % Col. % Col. % Col. % Count Col. % Col. % Col. % Col. % Count Col. % Col. % Col. % Col. %
Home destroyed 1048 29.6% 26.3% 22.2% 19.2% 517 62.7% 64.4% 60.8% 40.5% 1565 35.8% 36.4% 40.6% 28.3%
Home has irreparable structural
damage 97 2.7% 3.5% 6.8% 13.3% 44 5.3% 5.4% 7.2% 15.2% 141 3.2% 4.0% 7.0% 14.1%
Home partially destroyed 340 9.6% 10.5% 10.1% 12.9% 81 9.8% 7.9% 8.3% 13.5% 421 9.6% 9.8% 9.2% 13.1%
Home cracked but repairable 1060 29.9% 32.9% 30.8% 19.9% 139 16.8% 19.3% 17.6% 21.4% 1199 27.5% 29.3% 24.5% 20.6%
No significant impact 240 6.8% 7.0% 8.5% 17.0% 12 1.5% 1.0% 1.8% 4.3% 252 5.8% 5.4% 5.3% 11.6%
Intact 701 19.8% 18.8% 20.3% 13.3% 22 2.7% 1.0% 3.1% 2.6% 723 16.6% 14.1% 12.1% 8.7%
Other 4 0.1% 0.0% 0.4% 3.7% 2 0.2% 0.2% 0.5% 1.9% 6 0.1% 0.1% 0.4% 2.9%
No Answer 52 1.5% 0.9% 1.0% 0.8% 8 1.0% 0.8% 0.7% 0.5% 60 1.4% 0.9% 0.9% 0.7%
Total 3542 100.0% 100.0% 100.0% 100.0% 825 100.0% 100.0% 100.0% 100.0% 4367 100.0% 100.0% 100.0% 100.0%
Which of the following best
describes your new
household?
Residence Camp Total
Wave 4 Wave 3 Wave 2 Wave 1 Wave 4 Wave 3 Wave 2 Wave 1 Wave 4 Wave 3 Wave 2 Wave 1
Count Col. % Col. % Col. % Col. % Count Col. % Col. % Col. % Col. % Count Col. % Col. % Col. % Col. %
House 3028 85.5% 88.5% 84.5% 79.8% 147 17.8% 9.4% 5.2% 2.4% 3175 72.7% 67.6% 46.8% 46.8%
Tent 156 4.4% 4.8% 5.7% 7.7% 254 30.8% 39.2% 29.5% 31.1% 410 9.4% 13.9% 17.0% 17.7%
Shelter 159 4.5% 2.5% 3.9% 2.8% 185 22.4% 29.7% 29.1% 17.1% 344 7.9% 9.7% 15.9% 8.9%
Plastic sheeting and structures 99 2.8% 1.7% 4.2% 6.1% 221 26.8% 19.2% 33.6% 44.2% 320 7.3% 6.3% 18.2% 22.4%
Car 8 0.2% 0.3% 0.2% 0.2% 3 0.4% 0.1% 0% 0.1% 11 0.3% 0.3% 0.1% 0.1%
Street, Sidewalk 3 0.1% 0.2% 0.2% 0.9% 0.1% 0.1% 0.4% 3 0.1% 0.2% 0.2% 0.7%
Other 10 0.3% 0.1% 0.8% 1.6% 1.0% 1.5% 3.7% 10 0.2% 0.4% 1.2% 2.5%
No Answer 79 2.2% 1.9% 0.5% 0.9% 15 1.8% 1.3% 0.9% 1.0% 94 2.2% 1.7% 0.7% 1.0%
Total 3542 100.0% 100.0% 100.0% 100.0% 825 100.0% 100.0% 100.0% 100.0% 4367 100.0% 100.0% 100.0% 100.0%

Population Displaced – Post-Earthquake 81
Were you displaced because of the earthquake?
Are you still living in a temporary location?
Metropolitan
Base: 4367
Were you displaced
because of the
Earthquake?
Residence Camp Total
Wave 4 Wave 3 Wave 2 Wave 1 Wave 4 Wave 3 Wave 2 Wave 1 Wave 4 Wave 3 Wave 2 Wave 1
Count Col. % Col. % Col. % Col. % Count Col. % Col. % Col. % Col. % Count Col. % Col. % Col. % Col. %
Yes 1702 48.1% 43.9% 48.5% 41.5% 756 91.6% 95.7% 96.5% 80.9% 2458 56.3% 57.5% 71.3% 58.3%
No 1779 50.2% 54.4% 50.2% 53.4% 61 7.4% 3.5% 2.7% 16.7% 1840 42.1% 41.0% 27.6% 37.7%
No Answer 61 1.7% 1.7% 1.4% 5.1% 8 1.0% 0.8% 0.8% 2.4% 69 1.6% 1.4% 1.1% 4.0%
Total 3542 100.0% 100.0% 100.0% 100.0% 825 100.0% 100.0% 100.0% 100.0% 4367 100.0% 100.0% 100.0% 100.0%
Location Total Wave 4 Total Wave 3
Residence Camp Site Count Col % Count Col %
Count Col % Count Col %
Yes 276 16.2% 623 82.4% 899 36.6% 1162 52.2%
No 1426 83.8% 133 17.6% 1559 63.4% 1029 46.2%
No Answer 0 0.0% 0 0.0% 0 0.0% 34 1.5%
Total 1702 100.0% 756 100.0% 2458 100.0% 2225 100.0%
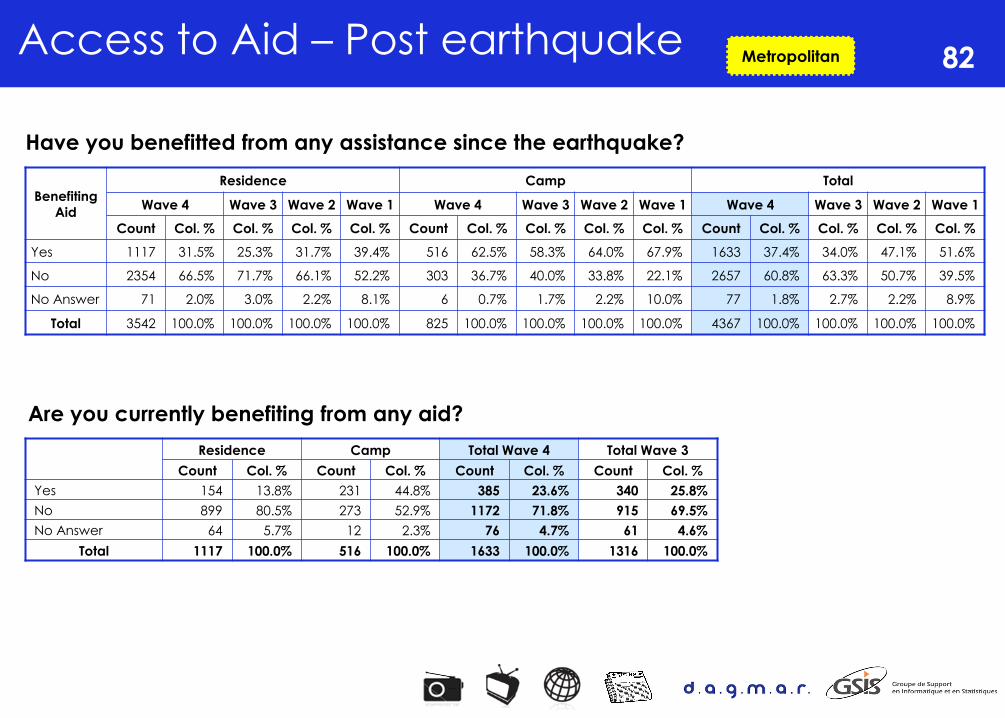
Access to Aid – Post earthquake 82
Have you benefitted from any assistance since the earthquake?
Are you currently benefiting from any aid?
Metropolitan
Benefiting
Aid
Residence Camp Total
Wave 4 Wave 3 Wave 2 Wave 1 Wave 4 Wave 3 Wave 2 Wave 1 Wave 4 Wave 3 Wave 2 Wave 1
Count Col. % Col. % Col. % Col. % Count Col. % Col. % Col. % Col. % Count Col. % Col. % Col. % Col. %
Yes 1117 31.5% 25.3% 31.7% 39.4% 516 62.5% 58.3% 64.0% 67.9% 1633 37.4% 34.0% 47.1% 51.6%
No 2354 66.5% 71.7% 66.1% 52.2% 303 36.7% 40.0% 33.8% 22.1% 2657 60.8% 63.3% 50.7% 39.5%
No Answer 71 2.0% 3.0% 2.2% 8.1% 6 0.7% 1.7% 2.2% 10.0% 77 1.8% 2.7% 2.2% 8.9%
Total 3542 100.0% 100.0% 100.0% 100.0% 825 100.0% 100.0% 100.0% 100.0% 4367 100.0% 100.0% 100.0% 100.0%
Residence Camp Total Wave 4 Total Wave 3
Count Col. % Count Col. % Count Col. % Count Col. %
Yes 154 13.8% 231 44.8% 385 23.6% 340 25.8%
No 899 80.5% 273 52.9% 1172 71.8% 915 69.5%
No Answer 64 5.7% 12 2.3% 76 4.7% 61 4.6%
Total 1117 100.0% 516 100.0% 1633 100.0% 1316 100.0%
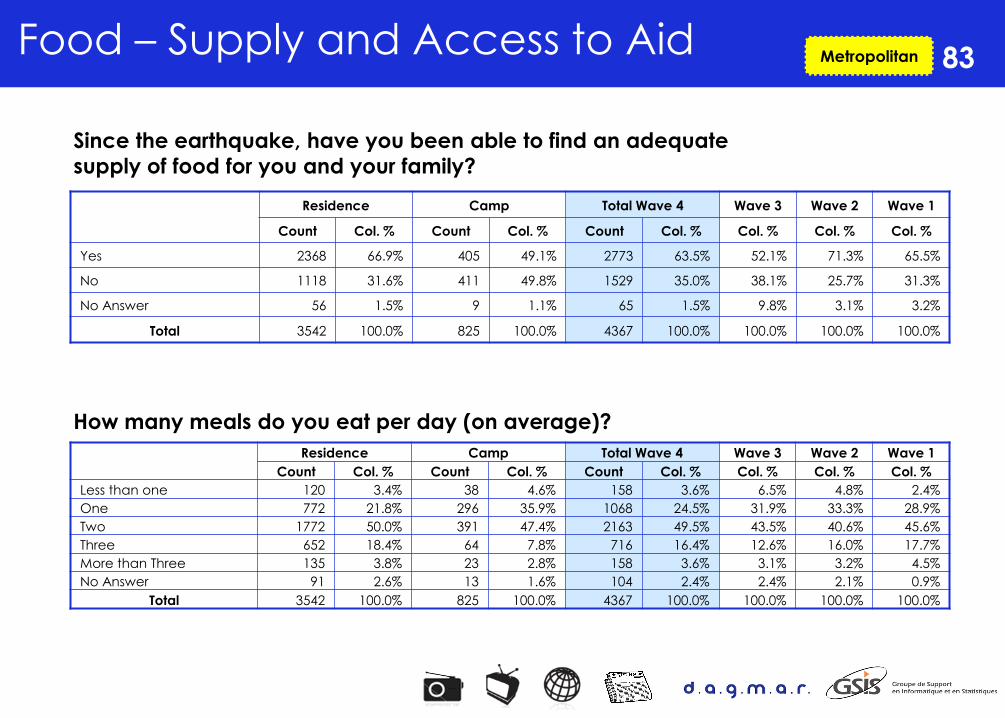
Food – Supply and Access to Aid
83
Since the earthquake, have you been able to find an adequate
supply of food for you and your family?
How many meals do you eat per day (on average)?
Metropolitan
Residence Camp Total Wave 4 Wave 3 Wave 2 Wave 1
Count Col. % Count Col. % Count Col. % Col. % Col. % Col. %
Yes 2368 66.9% 405 49.1% 2773 63.5% 52.1% 71.3% 65.5%
No 1118 31.6% 411 49.8% 1529 35.0% 38.1% 25.7% 31.3%
No Answer 56 1.5% 9 1.1% 65 1.5% 9.8% 3.1% 3.2%
Total 3542 100.0% 825 100.0% 4367 100.0% 100.0% 100.0% 100.0%
Residence Camp Total Wave 4 Wave 3 Wave 2 Wave 1
Count Col. % Count Col. % Count Col. % Col. % Col. % Col. %
Less than one 120 3.4% 38 4.6% 158 3.6% 6.5% 4.8% 2.4%
One 772 21.8% 296 35.9% 1068 24.5% 31.9% 33.3% 28.9%
Two 1772 50.0% 391 47.4% 2163 49.5% 43.5% 40.6% 45.6%
Three 652 18.4% 64 7.8% 716 16.4% 12.6% 16.0% 17.7%
More than Three 135 3.8% 23 2.8% 158 3.6% 3.1% 3.2% 4.5%
No Answer 91 2.6% 13 1.6% 104 2.4% 2.4% 2.1% 0.9%
Total 3542 100.0% 825 100.0% 4367 100.0% 100.0% 100.0% 100.0%

Food – Supply and Access to Aid 84
What is the main place where you get food supplies for you and your family?
Metropolitan
Residence Camp Wave 4 Wave 3 Wave 2 Wave 1
Count Col. % Count Col. % Count Col. % Col. % Col. % Col. %
Market Place 2925 82.6% 642 77.8% 3567 81.7% 81.1% 76.3% 70.9%
Merchant 200 5.6% 67 8.1% 267 6.1% 4.9% 4.1% 2.1%
NGO Food Distribution (Aid) 61 1.7% 37 4.5% 98 2.2% 3.3% 5.9% 13.4%
Super Market 68 1.9% 68 1.6% 1.1% 1.1% 0.7%
Friend / Family Support (Donation) 215 6.1% 66 8.0% 281 6.4% 6.8% 9.7% 9.2%
Other 13 0.4% 5 0.6% 18 0.4% 0.3% 0.8% 2.7%
No Answer 60 1.7% 8 1.0% 68 1.6% 2.5% 2.1% 1.1%
Total 3542 100.0% 825 100.0% 4367 100.0% 100.0% 100.0% 100.0%
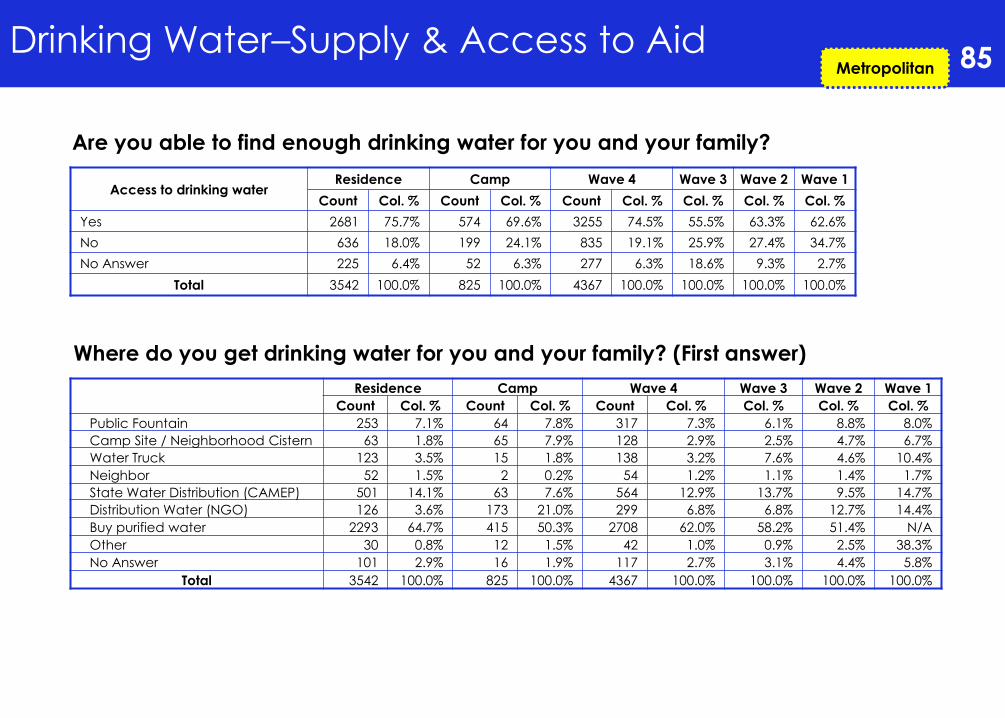
Drinking Water–Supply & Access to Aid 85
Are you able to find enough drinking water for you and your family?
Where do you get drinking water for you and your family? (First answer)
Metropolitan
Access to drinking water Residence Camp Wave 4 Wave 3 Wave 2 Wave 1
Count Col. % Count Col. % Count Col. % Col. % Col. % Col. %
Yes 2681 75.7% 574 69.6% 3255 74.5% 55.5% 63.3% 62.6%
No 636 18.0% 199 24.1% 835 19.1% 25.9% 27.4% 34.7%
No Answer 225 6.4% 52 6.3% 277 6.3% 18.6% 9.3% 2.7%
Total 3542 100.0% 825 100.0% 4367 100.0% 100.0% 100.0% 100.0%
Residence Camp Wave 4 Wave 3 Wave 2 Wave 1
Count Col. % Count Col. % Count Col. % Col. % Col. % Col. %
Public Fountain 253 7.1% 64 7.8% 317 7.3% 6.1% 8.8% 8.0%
Camp Site / Neighborhood Cistern 63 1.8% 65 7.9% 128 2.9% 2.5% 4.7% 6.7%
Water Truck 123 3.5% 15 1.8% 138 3.2% 7.6% 4.6% 10.4%
Neighbor 52 1.5% 2 0.2% 54 1.2% 1.1% 1.4% 1.7%
State Water Distribution (CAMEP) 501 14.1% 63 7.6% 564 12.9% 13.7% 9.5% 14.7%
Distribution Water (NGO) 126 3.6% 173 21.0% 299 6.8% 6.8% 12.7% 14.4%
Buy purified water 2293 64.7% 415 50.3% 2708 62.0% 58.2% 51.4% N/A
Other 30 0.8% 12 1.5% 42 1.0% 0.9% 2.5% 38.3%
No Answer 101 2.9% 16 1.9% 117 2.7% 3.1% 4.4% 5.8%
Total 3542 100.0% 825 100.0% 4367 100.0% 100.0% 100.0% 100.0%

General Perception of the Local Government on Post
Earthquake Assistance 86 Metropolitan
What is your opinion about the Local Government of Haiti's response after the January 12th Earthquake?
Local Government response
Communication Food Water
Wave 4 Wave 3 Wave 2 Wave 1 Wave 4 Wave 3 Wave 2 Wave 1 Wave 4 Wave 3 Wave 2 Wave 1
Col % Col % Col % Col % Col % Col % Col % Col % Col % Col % Col % Col %
Experienced No assistance 71.5% 73.7% 0.0% 65.8% 71.7% 75.3% 0.0% 66.5% 71.2% 75.1% 0.0% 64.6%
Did not meet my needs/my
family's needs 24.0% 20.6% 0.0% 28.5% 25.3% 21.3% 0.0% 29.3% 25.0% 20.7% 0.0% 27.8%
Met my needs/my family's needs 2.7% 3.5% 0.0% 4.2% 1.2% 1.5% 0.0% 2.8% 2.1% 2.1% 0.0% 6.1%
Exceeded my expectations 0.1% 0.3% 0.0% 0.2% 0.0% 0.3% 0.0% 0.1% 0.0% 0.3% 0.0% 0.3%
No Answer 1.7% 1.8% 0.0% 1.4% 1.7% 1.7% 0.0% 1.3% 1.6% 1.7% 0.0% 1.3%
Total 100.0% 100.0% 0.0% 100.0% 100.0% 100.0% 0.0% 100.0% 100.0% 100.0% 0.0% 100.0%
Local Government response
Shelter Security HealthCare
Wave 4 Wave 3 Wave 2 Wave 1 Wave 4 Wave 3 Wave 2 Wave 1 Wave 4 Wave 3 Wave 2 Wave 1
Col % Col % Col % Col % Col % Col % Col % Col % Col % Col % Col % Col %
Experienced No assistance 71.6% 75.4% 0.0% 66.5% 72.1% 75.6% 0.0% 65.2% 72.0% 75.5% 0.0% 65.4%
Did not meet my needs/my
family's needs 25.5% 21.0% 0.0% 29.3% 24.9% 20.6% 0.0% 28.7% 24.8% 20.9% 0.0% 28.8%
Met my needs/my family's needs 1.1% 1.5% 0.0% 2.4% 1.2% 1.6% 0.0% 4.3% 1.3% 1.6% 0.0% 3.7%
Exceeded my expectations 0.1% 0.3% 0.0% 0.2% 0.1% 0.5% 0.0% 0.1% 0.1% 0.4% 0.0% 0.2%
No Answer 1.7% 1.7% 0.0% 1.6% 1.7% 1.7% 0.0% 1.7% 1.8% 1.7% 0.0% 1.8%
Total 100.0% 100.0% 0.0% 100.0% 100.0% 100.0% 0.0% 100.0% 100.0% 100.0% 0.0% 100.0%
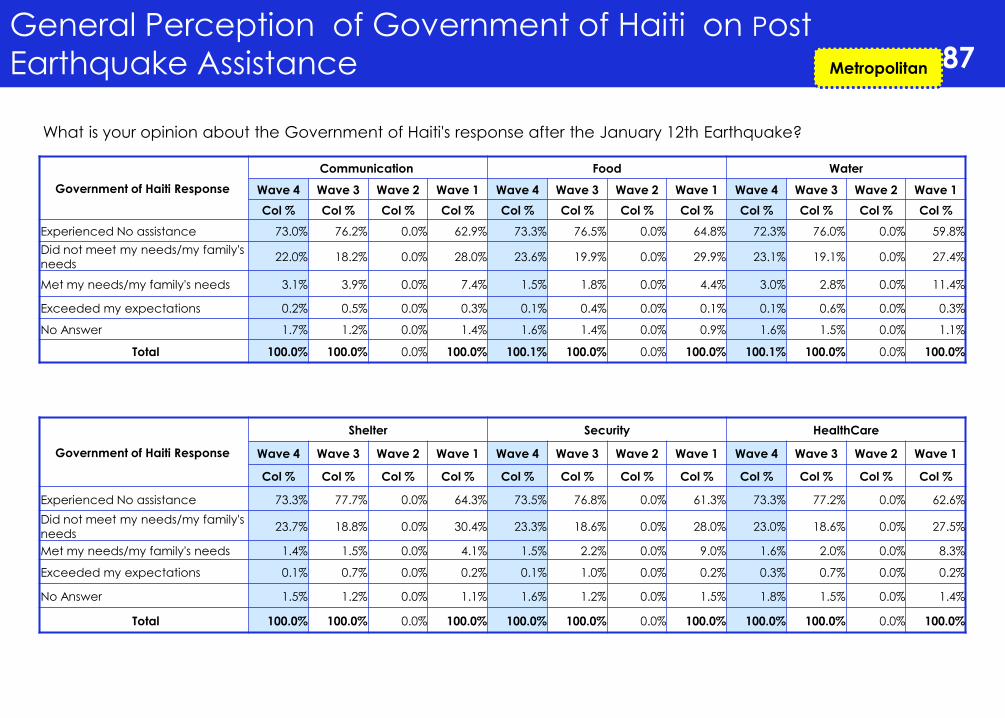
General Perception of Government of Haiti on Post
Earthquake Assistance 87 Metropolitan
What is your opinion about the Government of Haiti's response after the January 12th Earthquake?
Government of Haiti Response
Communication Food Water
Wave 4 Wave 3 Wave 2 Wave 1 Wave 4 Wave 3 Wave 2 Wave 1 Wave 4 Wave 3 Wave 2 Wave 1
Col % Col % Col % Col % Col % Col % Col % Col % Col % Col % Col % Col %
Experienced No assistance 73.0% 76.2% 0.0% 62.9% 73.3% 76.5% 0.0% 64.8% 72.3% 76.0% 0.0% 59.8%
Did not meet my needs/my family's
needs 22.0% 18.2% 0.0% 28.0% 23.6% 19.9% 0.0% 29.9% 23.1% 19.1% 0.0% 27.4%
Met my needs/my family's needs 3.1% 3.9% 0.0% 7.4% 1.5% 1.8% 0.0% 4.4% 3.0% 2.8% 0.0% 11.4%
Exceeded my expectations 0.2% 0.5% 0.0% 0.3% 0.1% 0.4% 0.0% 0.1% 0.1% 0.6% 0.0% 0.3%
No Answer 1.7% 1.2% 0.0% 1.4% 1.6% 1.4% 0.0% 0.9% 1.6% 1.5% 0.0% 1.1%
Total 100.0% 100.0% 0.0% 100.0% 100.1% 100.0% 0.0% 100.0% 100.1% 100.0% 0.0% 100.0%
Government of Haiti Response
Shelter Security HealthCare
Wave 4 Wave 3 Wave 2 Wave 1 Wave 4 Wave 3 Wave 2 Wave 1 Wave 4 Wave 3 Wave 2 Wave 1
Col % Col % Col % Col % Col % Col % Col % Col % Col % Col % Col % Col %
Experienced No assistance 73.3% 77.7% 0.0% 64.3% 73.5% 76.8% 0.0% 61.3% 73.3% 77.2% 0.0% 62.6%
Did not meet my needs/my family's needs
23.7% 18.8% 0.0% 30.4% 23.3% 18.6% 0.0% 28.0% 23.0% 18.6% 0.0% 27.5%
Met my needs/my family's needs 1.4% 1.5% 0.0% 4.1% 1.5% 2.2% 0.0% 9.0% 1.6% 2.0% 0.0% 8.3%
Exceeded my expectations 0.1% 0.7% 0.0% 0.2% 0.1% 1.0% 0.0% 0.2% 0.3% 0.7% 0.0% 0.2%
No Answer 1.5% 1.2% 0.0% 1.1% 1.6% 1.2% 0.0% 1.5% 1.8% 1.5% 0.0% 1.4%
Total 100.0% 100.0% 0.0% 100.0% 100.0% 100.0% 0.0% 100.0% 100.0% 100.0% 0.0% 100.0%

General Perception of International Community on
Post Earthquake Assistance 88 Metropolitan
What is your opinion about the International Community's response after the January 12th Earthquake?
International Community Response
Communication Food Water
Wave 4 Wave 3 Wave 2 Wave 1 Wave 4 Wave 3 Wave 2 Wave 1 Wave 4 Wave 3 Wave 2 Wave 1
Col % Col % Col % Col % Col % Col % Col % Col % Col % Col % Col % Col %
Experienced No assistance 49.7% 57.5% 0.0% 42.6% 44.7% 52.4% 0.0% 36.0% 43.8% 48.5% 0.0% 30.7%
Did not meet my needs/my family's
needs 31.0% 21.8% 0.0% 25.7% 30.7% 24.6% 0.0% 23.6% 28.2% 23.9% 0.0% 20.7%
Met my needs/my family's needs 13.3% 15.1% 0.0% 25.3% 19.4% 17.3% 0.0% 35.8% 22.6% 20.9% 0.0% 43.7%
Exceeded my expectations 2.5% 3.4% 0.0% 2.1% 2.9% 3.2% 0.0% 2.1% 3.5% 4.0% 0.0% 2.7%
No Answer 3.5% 2.2% 0.0% 4.4% 2.3% 2.5% 0.0% 2.4% 2.0% 2.7% 0.0% 2.3%
Total 100.0% 100.0% 0.0% 100.0% 100.0% 100.0% 0.0% 100.0% 100.1% 100.0% 0.0% 100.0%
International Community Response
Shelter Security Health Care
Wave 4 Wave 3 Wave 2 Wave 1 Wave 4 Wave 3 Wave 2 Wave 1 Wave 4 Wave 3 Wave 2 Wave 1
Col % Col % Col % Col % Col % Col % Col % Col % Col % Col % Col % Col %
Experienced No assistance 47.1% 52.7% 0.0% 40.9% 51.9% 59.2% 0.0% 44.0% 47.5% 53.4% 0.0% 36.5%
Did not meet my needs/my family's
needs 31.4% 24.7% 0.0% 26.9% 32.0% 24.6% 0.0% 29.8% 29.9% 23.3% 0.0% 22.4%
Met my needs/my family's needs 16.0% 16.0% 0.0% 27.2% 9.9% 10.4% 0.0% 19.9% 16.2% 15.7% 0.0% 35.3%
Exceeded my expectations 3.1% 3.8% 0.0% 2.1% 2.7% 3.0% 0.0% 1.9% 3.7% 4.9% 0.0% 2.7%
No Answer 2.4% 2.7% 0.0% 2.9% 3.5% 2.8% 0.0% 4.4% 2.7% 2.7% 0.0% 3.0%
Total 100.0% 100.0% 0.0% 100.0% 100.0% 100.0% 0.0% 100.0% 100.0% 100.0% 0.0% 100.0%
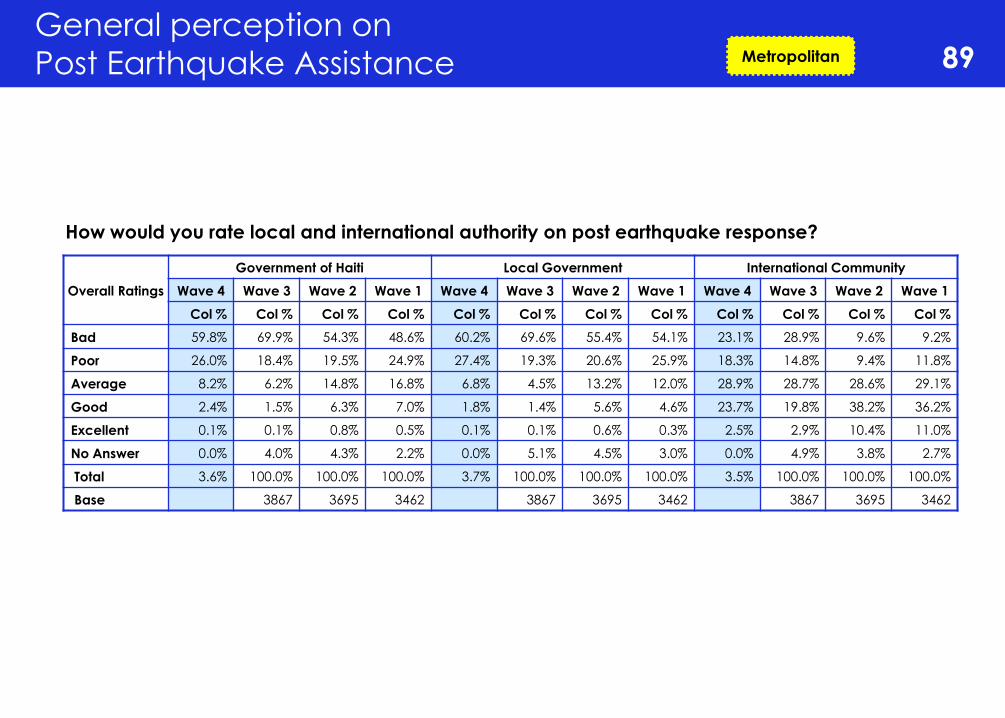
General perception on
Post Earthquake Assistance 89
How would you rate local and international authority on post earthquake response?
Metropolitan
Overall Ratings
Government of Haiti Local Government International Community
Wave 4 Wave 3 Wave 2 Wave 1 Wave 4 Wave 3 Wave 2 Wave 1 Wave 4 Wave 3 Wave 2 Wave 1
Col % Col % Col % Col % Col % Col % Col % Col % Col % Col % Col % Col %
Bad 59.8% 69.9% 54.3% 48.6% 60.2% 69.6% 55.4% 54.1% 23.1% 28.9% 9.6% 9.2%
Poor 26.0% 18.4% 19.5% 24.9% 27.4% 19.3% 20.6% 25.9% 18.3% 14.8% 9.4% 11.8%
Average 8.2% 6.2% 14.8% 16.8% 6.8% 4.5% 13.2% 12.0% 28.9% 28.7% 28.6% 29.1%
Good 2.4% 1.5% 6.3% 7.0% 1.8% 1.4% 5.6% 4.6% 23.7% 19.8% 38.2% 36.2%
Excellent 0.1% 0.1% 0.8% 0.5% 0.1% 0.1% 0.6% 0.3% 2.5% 2.9% 10.4% 11.0%
No Answer 0.0% 4.0% 4.3% 2.2% 0.0% 5.1% 4.5% 3.0% 0.0% 4.9% 3.8% 2.7%
Total 3.6% 100.0% 100.0% 100.0% 3.7% 100.0% 100.0% 100.0% 3.5% 100.0% 100.0% 100.0%
Base 3867 3695 3462 3867 3695 3462 3867 3695 3462

Domestic Assets : Sources of Energy 90
Metropolitan
Sources of Energy Wave 4 Wave 3 Wave 2 Wave 1
Count Col. % Count Col. % Count Col. % Count Col. %
Do you use electricity (EDH)?
Yes 3685 84.4% 2893 74.8% 2499 67.6% 2078 60.0%
No 646 14.8% 918 23.7% 1167 31.6% 1361 39.3%
No Answer 36 0.8% 56 1.4% 29 0.8% 23 0.7%
Do you use a generator?
Yes 278 6.4% 282 7.3% 226 6.1% 300 8.7%
No 4033 92.4% 3511 90.8% 3441 93.1% 3133 90.5%
No Answer 56 1.3% 74 1.9% 28 0.8% 29 0.8%
Do you use an inverter?
Yes 587 13.4% 499 12.9% 409 11.1% 595 17.2%
No 3724 85.3% 3275 84.7% 3251 88.0% 2840 82.0%
No Answer 56 1.3% 93 2.4% 35 0.9% 27 0.8%
Do you use charcoal as source of energy for
cooking?
Yes 3988 91.3% 3408 88.1% 3333 90.2% 3071 88.7%
No 321 7.4% 405 10.5% 331 9.0% 359 10.4%
No Answer 58 1.3% 54 1.4% 31 0.8% 32 0.9%
Do you have an Electric or Propane stove with oven?
Yes 1013 23.2% 776 20.1% 637 17.2% 761 22.0%
No 3289 75.3% 3028 78.3% 3027 81.9% 2664 76.9%
No Answer 65 1.5% 63 1.6% 31 0.8% 37 1.1%
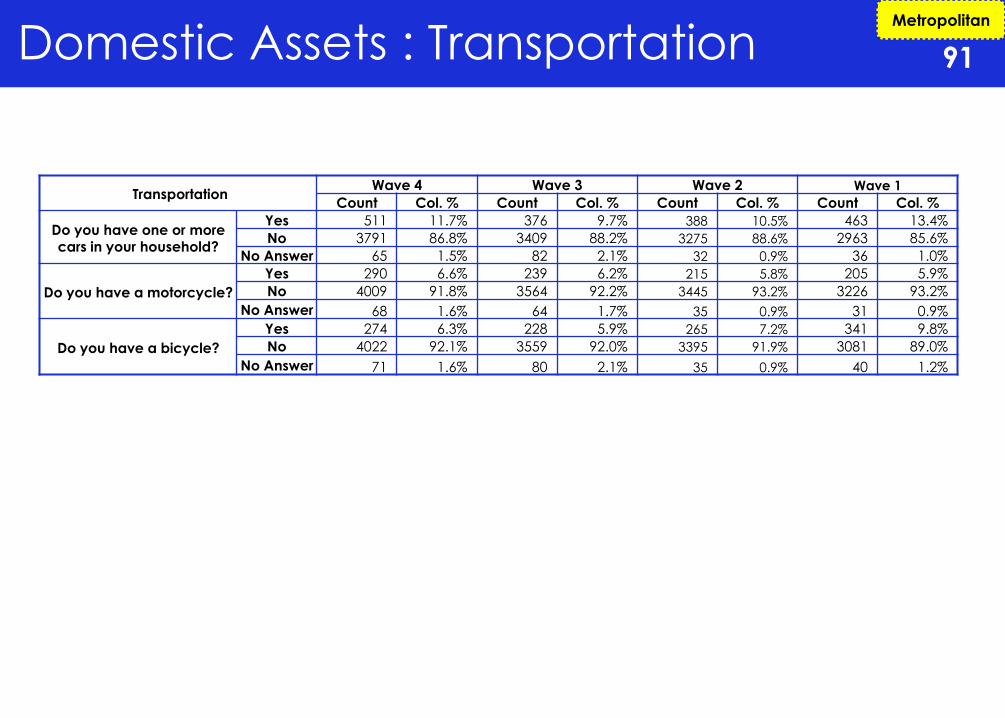
Domestic Assets : Transportation 91
Metropolitan
Transportation Wave 4 Wave 3 Wave 2 Wave 1
Count Col. % Count Col. % Count Col. % Count Col. %
Do you have one or more cars in your household?
Yes 511 11.7% 376 9.7% 388 10.5% 463 13.4%
No 3791 86.8% 3409 88.2% 3275 88.6% 2963 85.6%
No Answer 65 1.5% 82 2.1% 32 0.9% 36 1.0%
Do you have a motorcycle?
Yes 290 6.6% 239 6.2% 215 5.8% 205 5.9%
No 4009 91.8% 3564 92.2% 3445 93.2% 3226 93.2%
No Answer 68 1.6% 64 1.7% 35 0.9% 31 0.9%
Do you have a bicycle?
Yes 274 6.3% 228 5.9% 265 7.2% 341 9.8%
No 4022 92.1% 3559 92.0% 3395 91.9% 3081 89.0%
No Answer 71 1.6% 80 2.1% 35 0.9% 40 1.2%
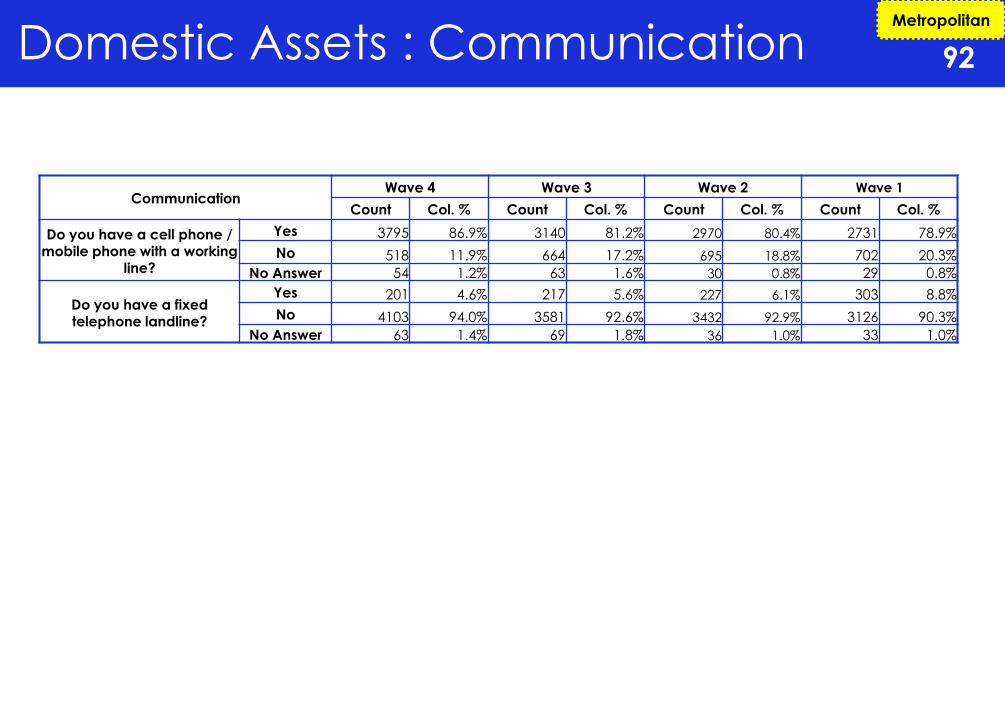
Domestic Assets : Communication 92
Metropolitan
Communication Wave 4 Wave 3 Wave 2 Wave 1
Count Col. % Count Col. % Count Col. % Count Col. %
Do you have a cell phone / mobile phone with a working
line?
Yes 3795 86.9% 3140 81.2% 2970 80.4% 2731 78.9%
No 518 11.9% 664 17.2% 695 18.8% 702 20.3%
No Answer 54 1.2% 63 1.6% 30 0.8% 29 0.8%
Do you have a fixed telephone landline?
Yes 201 4.6% 217 5.6% 227 6.1% 303 8.8%
No 4103 94.0% 3581 92.6% 3432 92.9% 3126 90.3%
No Answer 63 1.4% 69 1.8% 36 1.0% 33 1.0%
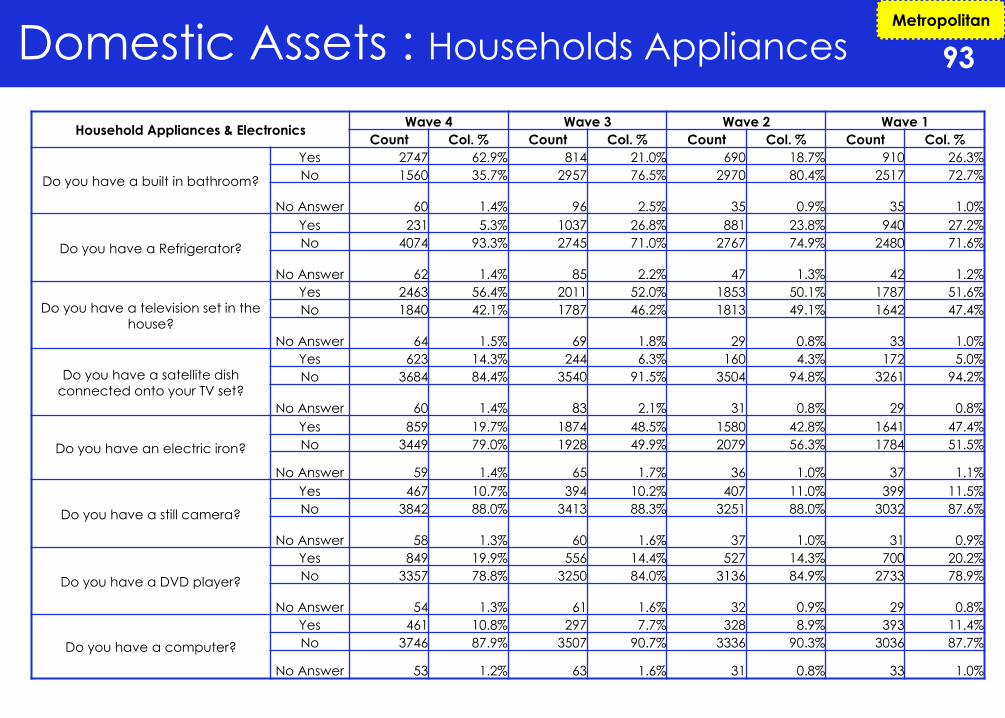
Domestic Assets : Households Appliances 93
Metropolitan
Household Appliances & Electronics Wave 4 Wave 3 Wave 2 Wave 1
Count Col. % Count Col. % Count Col. % Count Col. %
Do you have a built in bathroom?
Yes 2747 62.9% 814 21.0% 690 18.7% 910 26.3%
No 1560 35.7% 2957 76.5% 2970 80.4% 2517 72.7%
No Answer 60 1.4% 96 2.5% 35 0.9% 35 1.0%
Do you have a Refrigerator?
Yes 231 5.3% 1037 26.8% 881 23.8% 940 27.2%
No 4074 93.3% 2745 71.0% 2767 74.9% 2480 71.6%
No Answer 62 1.4% 85 2.2% 47 1.3% 42 1.2%
Do you have a television set in the
house?
Yes 2463 56.4% 2011 52.0% 1853 50.1% 1787 51.6%
No 1840 42.1% 1787 46.2% 1813 49.1% 1642 47.4%
No Answer 64 1.5% 69 1.8% 29 0.8% 33 1.0%
Do you have a satellite dish
connected onto your TV set?
Yes 623 14.3% 244 6.3% 160 4.3% 172 5.0%
No 3684 84.4% 3540 91.5% 3504 94.8% 3261 94.2%
No Answer 60 1.4% 83 2.1% 31 0.8% 29 0.8%
Do you have an electric iron?
Yes 859 19.7% 1874 48.5% 1580 42.8% 1641 47.4%
No 3449 79.0% 1928 49.9% 2079 56.3% 1784 51.5%
No Answer 59 1.4% 65 1.7% 36 1.0% 37 1.1%
Do you have a still camera?
Yes 467 10.7% 394 10.2% 407 11.0% 399 11.5%
No 3842 88.0% 3413 88.3% 3251 88.0% 3032 87.6%
No Answer 58 1.3% 60 1.6% 37 1.0% 31 0.9%
Do you have a DVD player?
Yes 849 19.9% 556 14.4% 527 14.3% 700 20.2%
No 3357 78.8% 3250 84.0% 3136 84.9% 2733 78.9%
No Answer 54 1.3% 61 1.6% 32 0.9% 29 0.8%
Do you have a computer?
Yes 461 10.8% 297 7.7% 328 8.9% 393 11.4%
No 3746 87.9% 3507 90.7% 3336 90.3% 3036 87.7%
No Answer 53 1.2% 63 1.6% 31 0.8% 33 1.0%

Provinces Synopsis
94
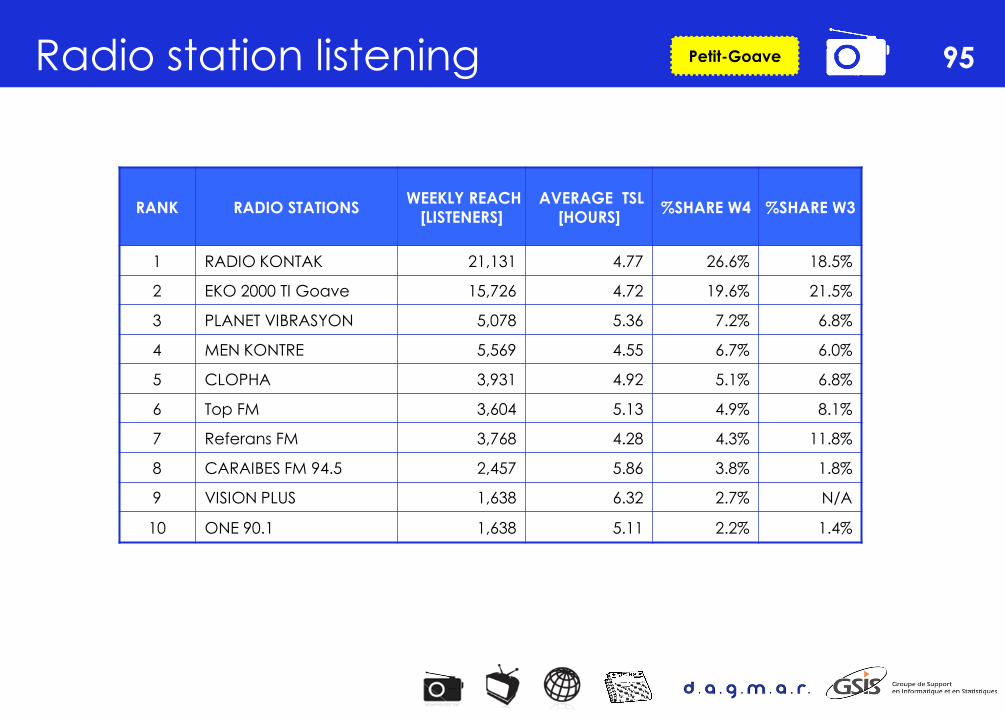
Radio station listening 95 Petit-Goave
RANK RADIO STATIONS WEEKLY REACH
[LISTENERS]
AVERAGE TSL
[HOURS] %SHARE W4 %SHARE W3
1 RADIO KONTAK 21,131 4.77 26.6% 18.5%
2 EKO 2000 TI Goave 15,726 4.72 19.6% 21.5%
3 PLANET VIBRASYON 5,078 5.36 7.2% 6.8%
4 MEN KONTRE 5,569 4.55 6.7% 6.0%
5 CLOPHA 3,931 4.92 5.1% 6.8%
6 Top FM 3,604 5.13 4.9% 8.1%
7 Referans FM 3,768 4.28 4.3% 11.8%
8 CARAIBES FM 94.5 2,457 5.86 3.8% 1.8%
9 VISION PLUS 1,638 6.32 2.7% N/A
10 ONE 90.1 1,638 5.11 2.2% 1.4%

Television viewing 96 Petit-Goave
RANK TV CHANNEL WEEKLY REACH
[VIEWERS]
AVERAGE
WEEKLY
VIEWING
[HOURS]
% SHARE W4 % SHARE W3
1 STV Petit Goave 17,354 4.1 37.3% 45.6%
2 TELE KONTAK 10,641 4.1 24.0% N/A
3 EKO TV 6,057 4.7 15.6% N/A
4 TELE PLANETE VIBRASION 6,057 4.7 14.1% 14.6%
5 TOP 1,473 3.3 2.6%
6 TELE NATIONALE PETIT GOAVE 1,637 2.9 2.6% 1.6%
7 CANAL [11] 164 11 1.0% 0.4%

Radio stations listening 97 Saint-Marc
RANK RADIO STATIONS WEEKLY REACH
[LISTENERS]
AVERAGE TSL [HOURS]
%SHARE W4 %SHARE W3
1 TET A TET 54,686 4.6 33.2% 30.0%
2 RADIO MAX 10,783 5.3 7.5% 8.9%
3 RADIO DELTA 10,013 5.3 6.9%
4 LJS 10,526 5.0 6.9% 5.4%
5 DYNASTIE FM ST Mak 10,526 4.8 6.7% 6.0%
6 REVOLUTION INTER 8,986 5.2 6.1% 8.9%
7 RADIO UNION 5,392 6.6 4.7% 3.5%
8 MEGALEXIE 6,419 5.3 4.4% 1.0%
9 SUPER GEMINI 3,594 7.2 3.4% 1.0%
10 SHEKINNAH 3,594 5.8 2.7%

Television viewing 98 Saint-Marc
RANK TV CHANNEL WEEKLY REACH
[VIEWERS]
AVERAGE WEEKLY
VIEWING [HOURS] % SHARE W4 % SHARE W3
1 TET A TETE 44,670 3.6 36.3% 15.00%
2 Dynastie St Marc 35,428 3.6 28.7% 34.40%
3 LJS 17,457 4.1 16.0%
4 Tele Kiskeya 10,269 4.5 10.4% 23.10%
5 DYNAMIQUE ST MARC 3,594 5.3 4.3%
6 SAVANNAH 2,054 6.8 3.2%
7 TVNS 513 4.7 0.5%
8 TELE NASYONAL ST MARC 513 1.8 0.2% 1.40%
9 MEGASTAR [60] 257 3.2 0.2%
10 TVD 257 3 0.2%
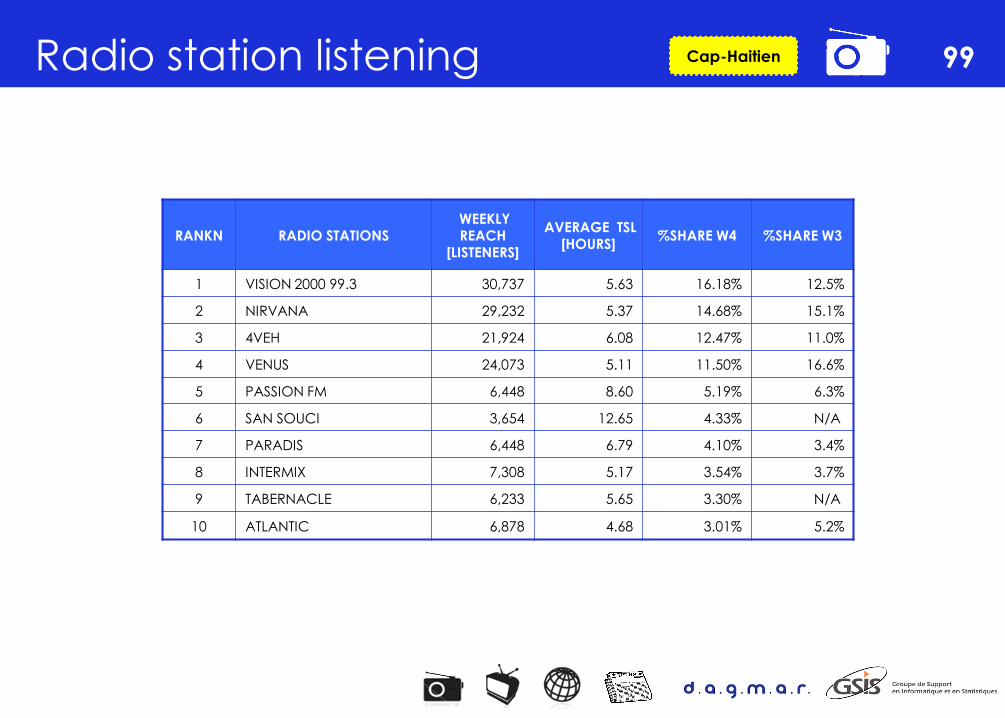
Radio station listening 99 Cap-Haitien
RANKN RADIO STATIONS WEEKLY REACH
[LISTENERS]
AVERAGE TSL [HOURS]
%SHARE W4 %SHARE W3
1 VISION 2000 99.3 30,737 5.63 16.18% 12.5%
2 NIRVANA 29,232 5.37 14.68% 15.1%
3 4VEH 21,924 6.08 12.47% 11.0%
4 VENUS 24,073 5.11 11.50% 16.6%
5 PASSION FM 6,448 8.60 5.19% 6.3%
6 SAN SOUCI 3,654 12.65 4.33% N/A
7 PARADIS 6,448 6.79 4.10% 3.4%
8 INTERMIX 7,308 5.17 3.54% 3.7%
9 TABERNACLE 6,233 5.65 3.30% N/A
10 ATLANTIC 6,878 4.68 3.01% 5.2%

Television viewing 100 Cap-Haitien
RANK TV CHANNEL WEEKLY REACH
[VIEWERS]
AVERAGE
WEEKLY
VIEWING
[HOURS]
% SHARE W4 % SHARE W3
1 RTV Cap Haitien 37,216 3.9 24.5% 24.6%
2 Paradis Cap Haitien 33,128 4.4 24.2% 23.6%
3 Tele Zenith Cap Haitien 28,826 4.6 22.0% 12.4%
4 TELE FRANTS MEUS 20,867 4.8 16.8% 14.1%
5 Tele Capois 6,884 5.3 6.1% 12.2%
6 TELE KONBIT 5,808 3.7 3.6%
7 Tele Apocalypse 4,518 3.6 2.7% 3.8%
8 TELE NASYONAL 430 2.0 0.1% 5.6%
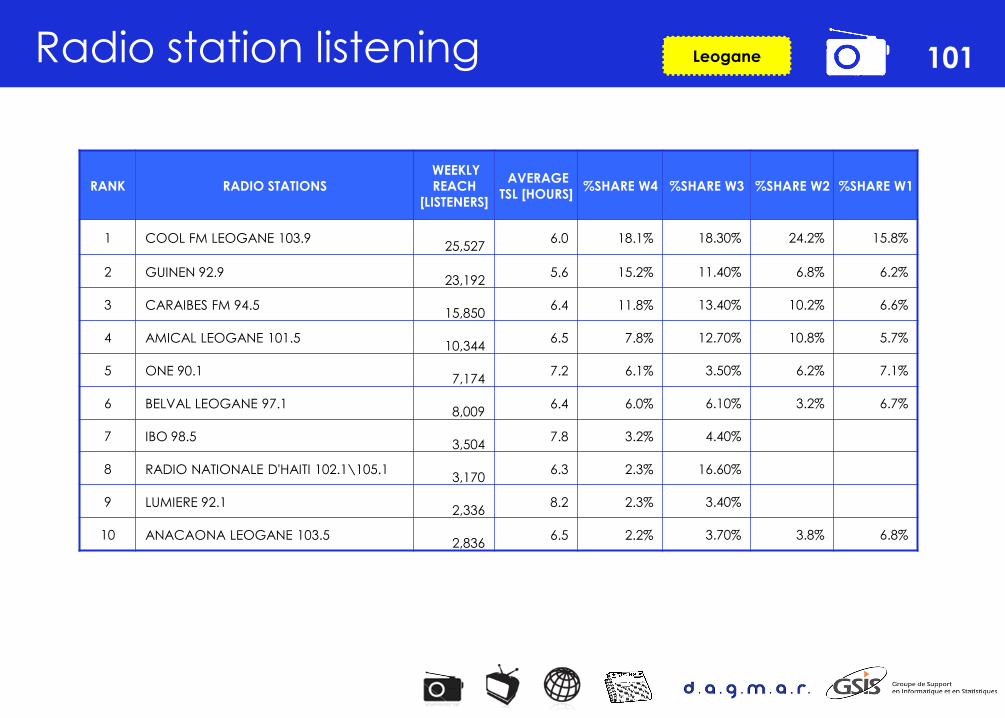
Radio station listening 101 Leogane
RANK RADIO STATIONS
WEEKLY
REACH
[LISTENERS]
AVERAGE
TSL [HOURS] %SHARE W4 %SHARE W3 %SHARE W2 %SHARE W1
1 COOL FM LEOGANE 103.9
25,527 6.0 18.1% 18.30% 24.2% 15.8%
2 GUINEN 92.9
23,192 5.6 15.2% 11.40% 6.8% 6.2%
3 CARAIBES FM 94.5
15,850 6.4 11.8% 13.40% 10.2% 6.6%
4 AMICAL LEOGANE 101.5
10,344 6.5 7.8% 12.70% 10.8% 5.7%
5 ONE 90.1
7,174 7.2 6.1% 3.50% 6.2% 7.1%
6 BELVAL LEOGANE 97.1
8,009 6.4 6.0% 6.10% 3.2% 6.7%
7 IBO 98.5
3,504 7.8 3.2% 4.40%
8 RADIO NATIONALE D'HAITI 102.1\105.1
3,170 6.3 2.3% 16.60%
9 LUMIERE 92.1
2,336 8.2 2.3% 3.40%
10 ANACAONA LEOGANE 103.5
2,836 6.5 2.2% 3.70% 3.8% 6.8%
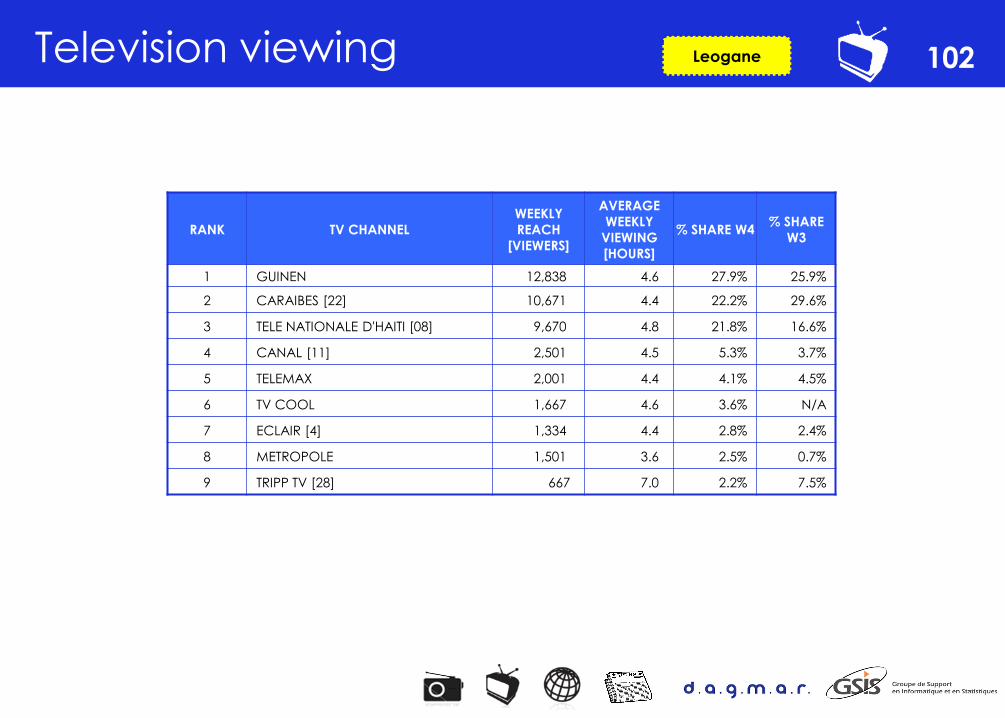
Television viewing 102 Leogane
RANK TV CHANNEL
WEEKLY
REACH
[VIEWERS]
AVERAGE
WEEKLY
VIEWING
[HOURS]
% SHARE W4 % SHARE
W3
1 GUINEN 12,838 4.6 27.9% 25.9%
2 CARAIBES [22] 10,671 4.4 22.2% 29.6%
3 TELE NATIONALE D'HAITI [08] 9,670 4.8 21.8% 16.6%
4 CANAL [11] 2,501 4.5 5.3% 3.7%
5 TELEMAX 2,001 4.4 4.1% 4.5%
6 TV COOL 1,667 4.6 3.6% N/A
7 ECLAIR [4] 1,334 4.4 2.8% 2.4%
8 METROPOLE 1,501 3.6 2.5% 0.7%
9 TRIPP TV [28] 667 7.0 2.2% 7.5%
Domestic Assets
All regions
103
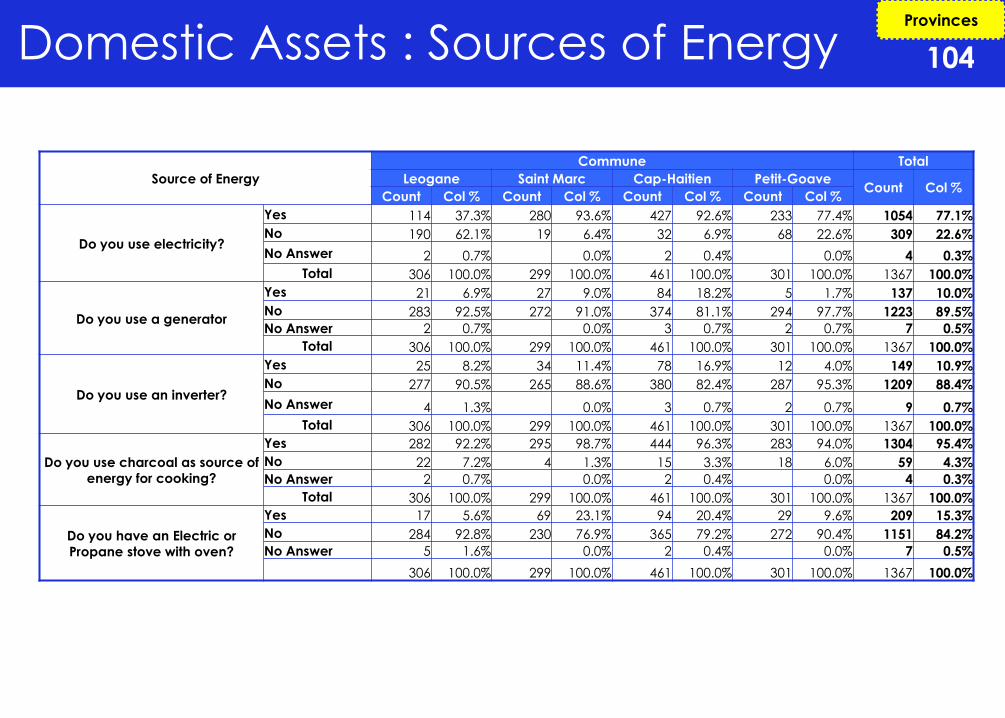
Domestic Assets : Sources of Energy 104
Provinces
Source of Energy
Commune Total
Leogane Saint Marc Cap-Haitien Petit-Goave Count Col %
Count Col % Count Col % Count Col % Count Col %
Do you use electricity?
Yes 114 37.3% 280 93.6% 427 92.6% 233 77.4% 1054 77.1%
No 190 62.1% 19 6.4% 32 6.9% 68 22.6% 309 22.6%
No Answer 2 0.7% 0.0% 2 0.4% 0.0% 4 0.3%
Total 306 100.0% 299 100.0% 461 100.0% 301 100.0% 1367 100.0%
Do you use a generator
Yes 21 6.9% 27 9.0% 84 18.2% 5 1.7% 137 10.0%
No 283 92.5% 272 91.0% 374 81.1% 294 97.7% 1223 89.5%
No Answer 2 0.7% 0.0% 3 0.7% 2 0.7% 7 0.5%
Total 306 100.0% 299 100.0% 461 100.0% 301 100.0% 1367 100.0%
Do you use an inverter?
Yes 25 8.2% 34 11.4% 78 16.9% 12 4.0% 149 10.9%
No 277 90.5% 265 88.6% 380 82.4% 287 95.3% 1209 88.4%
No Answer 4 1.3% 0.0% 3 0.7% 2 0.7% 9 0.7%
Total 306 100.0% 299 100.0% 461 100.0% 301 100.0% 1367 100.0%
Do you use charcoal as source of
energy for cooking?
Yes 282 92.2% 295 98.7% 444 96.3% 283 94.0% 1304 95.4%
No 22 7.2% 4 1.3% 15 3.3% 18 6.0% 59 4.3%
No Answer 2 0.7% 0.0% 2 0.4% 0.0% 4 0.3%
Total 306 100.0% 299 100.0% 461 100.0% 301 100.0% 1367 100.0%
Do you have an Electric or
Propane stove with oven?
Yes 17 5.6% 69 23.1% 94 20.4% 29 9.6% 209 15.3%
No 284 92.8% 230 76.9% 365 79.2% 272 90.4% 1151 84.2%
No Answer 5 1.6% 0.0% 2 0.4% 0.0% 7 0.5%
306 100.0% 299 100.0% 461 100.0% 301 100.0% 1367 100.0%
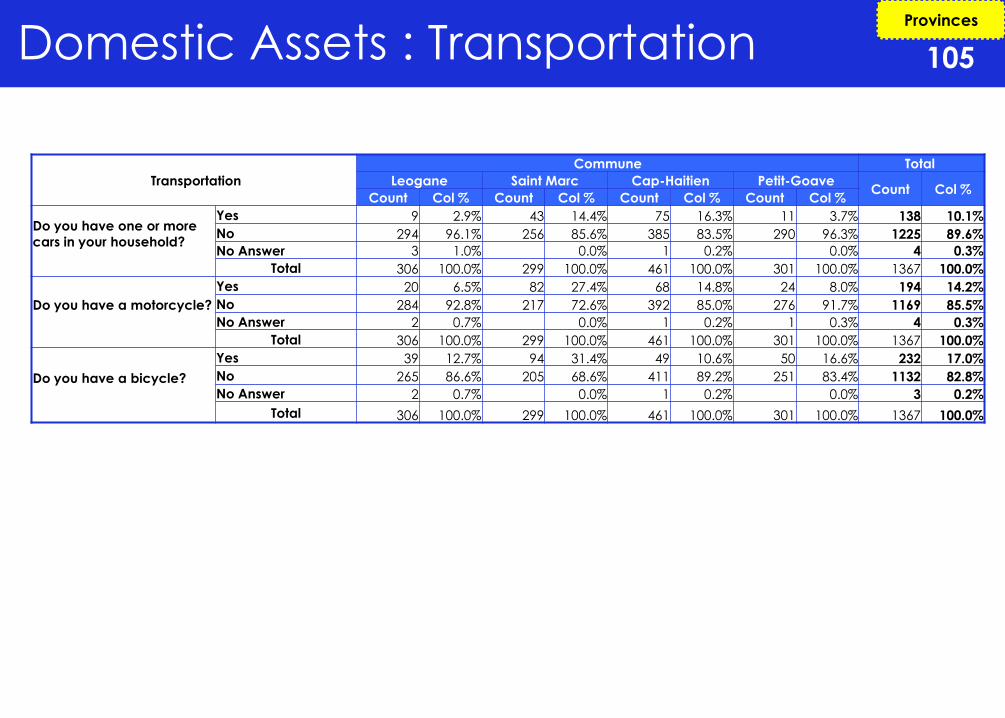
Domestic Assets : Transportation 105
Provinces
Transportation
Commune Total
Leogane Saint Marc Cap-Haitien Petit-Goave Count Col %
Count Col % Count Col % Count Col % Count Col %
Do you have one or more
cars in your household?
Yes 9 2.9% 43 14.4% 75 16.3% 11 3.7% 138 10.1%
No 294 96.1% 256 85.6% 385 83.5% 290 96.3% 1225 89.6%
No Answer 3 1.0% 0.0% 1 0.2% 0.0% 4 0.3%
Total 306 100.0% 299 100.0% 461 100.0% 301 100.0% 1367 100.0%
Do you have a motorcycle?
Yes 20 6.5% 82 27.4% 68 14.8% 24 8.0% 194 14.2%
No 284 92.8% 217 72.6% 392 85.0% 276 91.7% 1169 85.5%
No Answer 2 0.7% 0.0% 1 0.2% 1 0.3% 4 0.3%
Total 306 100.0% 299 100.0% 461 100.0% 301 100.0% 1367 100.0%
Do you have a bicycle?
Yes 39 12.7% 94 31.4% 49 10.6% 50 16.6% 232 17.0%
No 265 86.6% 205 68.6% 411 89.2% 251 83.4% 1132 82.8%
No Answer 2 0.7% 0.0% 1 0.2% 0.0% 3 0.2%
Total 306 100.0% 299 100.0% 461 100.0% 301 100.0% 1367 100.0%
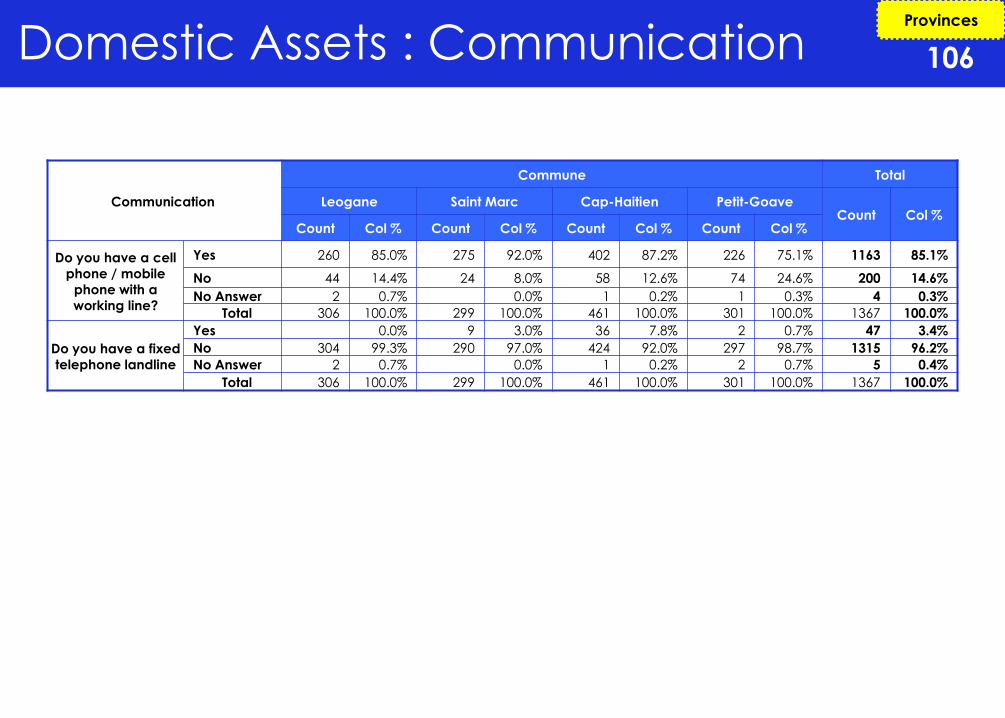
Domestic Assets : Communication 106
Provinces
Communication
Commune Total
Leogane Saint Marc Cap-Haitien Petit-Goave Count Col %
Count Col % Count Col % Count Col % Count Col %
Do you have a cell
phone / mobile
phone with a
working line?
Yes 260 85.0% 275 92.0% 402 87.2% 226 75.1% 1163 85.1%
No 44 14.4% 24 8.0% 58 12.6% 74 24.6% 200 14.6%
No Answer 2 0.7% 0.0% 1 0.2% 1 0.3% 4 0.3%
Total 306 100.0% 299 100.0% 461 100.0% 301 100.0% 1367 100.0%
Do you have a fixed
telephone landline
Yes 0.0% 9 3.0% 36 7.8% 2 0.7% 47 3.4%
No 304 99.3% 290 97.0% 424 92.0% 297 98.7% 1315 96.2%
No Answer 2 0.7% 0.0% 1 0.2% 2 0.7% 5 0.4%
Total 306 100.0% 299 100.0% 461 100.0% 301 100.0% 1367 100.0%
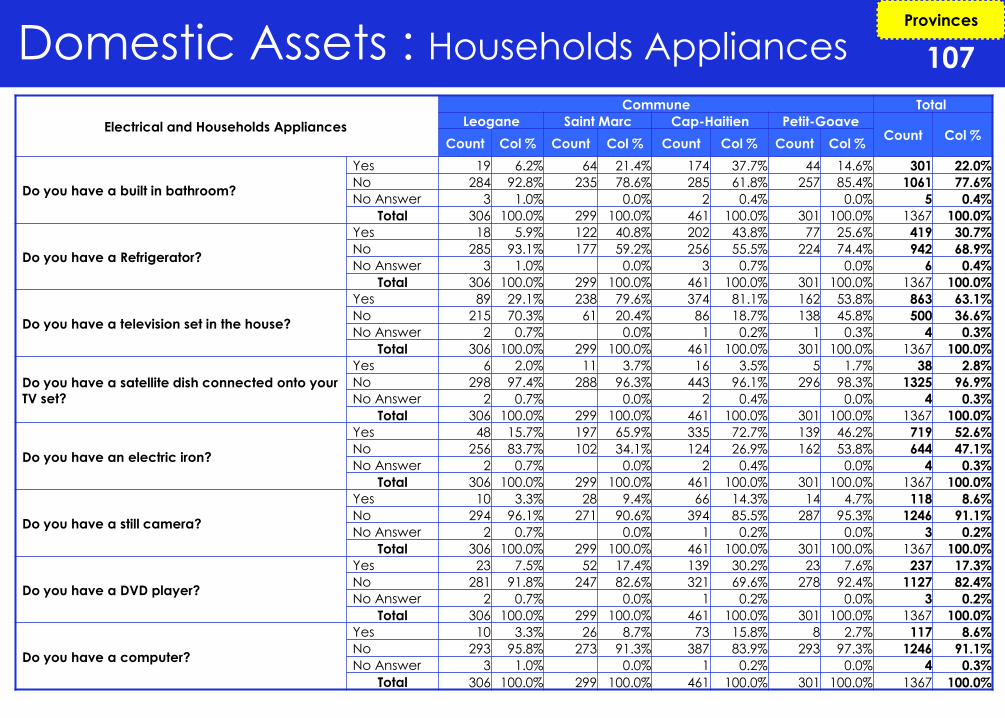
Domestic Assets : Households Appliances 107
Provinces
Electrical and Households Appliances
Commune Total
Leogane Saint Marc Cap-Haitien Petit-Goave Count Col %
Count Col % Count Col % Count Col % Count Col %
Do you have a built in bathroom?
Yes 19 6.2% 64 21.4% 174 37.7% 44 14.6% 301 22.0%
No 284 92.8% 235 78.6% 285 61.8% 257 85.4% 1061 77.6%
No Answer 3 1.0% 0.0% 2 0.4% 0.0% 5 0.4%
Total 306 100.0% 299 100.0% 461 100.0% 301 100.0% 1367 100.0%
Do you have a Refrigerator?
Yes 18 5.9% 122 40.8% 202 43.8% 77 25.6% 419 30.7%
No 285 93.1% 177 59.2% 256 55.5% 224 74.4% 942 68.9%
No Answer 3 1.0% 0.0% 3 0.7% 0.0% 6 0.4%
Total 306 100.0% 299 100.0% 461 100.0% 301 100.0% 1367 100.0%
Do you have a television set in the house?
Yes 89 29.1% 238 79.6% 374 81.1% 162 53.8% 863 63.1%
No 215 70.3% 61 20.4% 86 18.7% 138 45.8% 500 36.6%
No Answer 2 0.7% 0.0% 1 0.2% 1 0.3% 4 0.3%
Total 306 100.0% 299 100.0% 461 100.0% 301 100.0% 1367 100.0%
Do you have a satellite dish connected onto your
TV set?
Yes 6 2.0% 11 3.7% 16 3.5% 5 1.7% 38 2.8%
No 298 97.4% 288 96.3% 443 96.1% 296 98.3% 1325 96.9%
No Answer 2 0.7% 0.0% 2 0.4% 0.0% 4 0.3%
Total 306 100.0% 299 100.0% 461 100.0% 301 100.0% 1367 100.0%
Do you have an electric iron?
Yes 48 15.7% 197 65.9% 335 72.7% 139 46.2% 719 52.6%
No 256 83.7% 102 34.1% 124 26.9% 162 53.8% 644 47.1%
No Answer 2 0.7% 0.0% 2 0.4% 0.0% 4 0.3%
Total 306 100.0% 299 100.0% 461 100.0% 301 100.0% 1367 100.0%
Do you have a still camera?
Yes 10 3.3% 28 9.4% 66 14.3% 14 4.7% 118 8.6%
No 294 96.1% 271 90.6% 394 85.5% 287 95.3% 1246 91.1%
No Answer 2 0.7% 0.0% 1 0.2% 0.0% 3 0.2%
Total 306 100.0% 299 100.0% 461 100.0% 301 100.0% 1367 100.0%
Do you have a DVD player?
Yes 23 7.5% 52 17.4% 139 30.2% 23 7.6% 237 17.3%
No 281 91.8% 247 82.6% 321 69.6% 278 92.4% 1127 82.4%
No Answer 2 0.7% 0.0% 1 0.2% 0.0% 3 0.2%
Total 306 100.0% 299 100.0% 461 100.0% 301 100.0% 1367 100.0%
Do you have a computer?
Yes 10 3.3% 26 8.7% 73 15.8% 8 2.7% 117 8.6%
No 293 95.8% 273 91.3% 387 83.9% 293 97.3% 1246 91.1%
No Answer 3 1.0% 0.0% 1 0.2% 0.0% 4 0.3%
Total 306 100.0% 299 100.0% 461 100.0% 301 100.0% 1367 100.0%
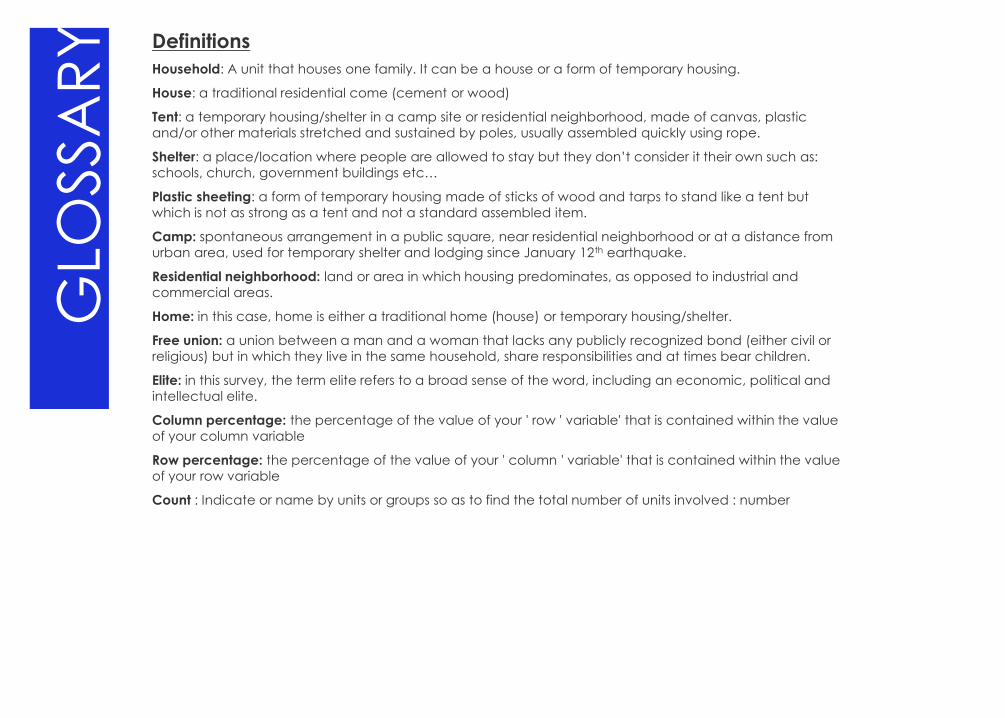
GLO
SSA
RY
Definitions
Household: A unit that houses one family. It can be a house or a form of temporary housing.
House: a traditional residential come (cement or wood)
Tent: a temporary housing/shelter in a camp site or residential neighborhood, made of canvas, plastic
and/or other materials stretched and sustained by poles, usually assembled quickly using rope.
Shelter: a place/location where people are allowed to stay but they don’t consider it their own such as:
schools, church, government buildings etc…
Plastic sheeting: a form of temporary housing made of sticks of wood and tarps to stand like a tent but
which is not as strong as a tent and not a standard assembled item.
Camp: spontaneous arrangement in a public square, near residential neighborhood or at a distance from
urban area, used for temporary shelter and lodging since January 12th earthquake.
Residential neighborhood: land or area in which housing predominates, as opposed to industrial and
commercial areas.
Home: in this case, home is either a traditional home (house) or temporary housing/shelter.
Free union: a union between a man and a woman that lacks any publicly recognized bond (either civil or
religious) but in which they live in the same household, share responsibilities and at times bear children.
Elite: in this survey, the term elite refers to a broad sense of the word, including an economic, political and
intellectual elite.
Column percentage: the percentage of the value of your ' row ' variable' that is contained within the value
of your column variable
Row percentage: the percentage of the value of your ' column ' variable' that is contained within the value
of your row variable
Count : Indicate or name by units or groups so as to find the total number of units involved : number
10
8
GLO
SSA
RY
Type of Shows / Assistance information
News: News in general is a news show that airs on a regular basis, which reports on and/or discusses local and international topics.
Politics: refers to programs, such as political debates, interviews with politicians, political analysis which can be with or without interaction with the audience (by phone, sms etc.) at the moment of the program.
A Talk show: an open radio program where the audience calls and give one’s opinion, ask questions etc.
Religious content: a show in which there is religious content, may be in the form of prayers, comments, reading excerpts of the bible, preaching etc.
Post-earthquake assistance and reconstruction information: shows in which that this specific kind of information in the radio stations.
Assistance and response in terms of communication: Capacity of entity to release valuable/helpful information to population
General
Multiple responses: in the questionnaire that was used to collect data for this survey, certain questions were allowed more than one answer. This means that one individual respondent could answer 2-3 different responses which causes there to be more answers than respondents in some cases. For those cases, the number of responses (# responses) is taken into consideration for analysis and the percent responses (% responses) although the number of respondents is stable (n=3342 for radios section).
Sample Size: For a population of N=1,621,426 and a survey sample of n=4367 the accuracy i.e. the confidence level is 95% with a margin error of 5% for a normal distribution which is a standard confidence interval for most research of this type.
Using the formula below:
Where:
Z = Z value (e.g. 1.66 for 95% confidence level) // p = percentage picking a choice, expressed as decimal //
(.5 used for sample size needed)//c = confidence interval, expressed as decimal (e.g., .04 = ±4)
10
9
n= Z 2 * (p) * (1-p) ────────── c 2

11
0
Thank you for your Attention!
Questions? Comments?
The Team of
103 Rue Villate, Petion Ville, Haiti
(509) 28 13 05 58
www.dagmarht.com
9 Rue Saint Louis Jeanty, Petion Ville, Haiti
(509) 34 46 00 99
- CONTACT INFORMATION -