a probabilistic approach to seismic hazard in metropolitan ... · a probabilistic approach to...
TRANSCRIPT
2137
Bulletin of the Seismological Society of America, Vol. 94, No. 6, pp. 2137–2163, December 2004
A Probabilistic Approach to Seismic Hazard in Metropolitan France
by Sylvie Marin, Jean-Philippe Avouac,* Marc Nicolas, and Antoine Schlupp
Abstract In this study, we applied a probabilistic methodology to seismic hazardassessment in metropolitan France. For that purpose we determined an attenuationlaw adapted to the French context. This law holds for peak ground acceleration onstiff bedrock for earthquakes with local magnitudes between 2.5 and 5.6 recorded innear field (at distances between 3 and 50 km). Geological conditions are taken intoaccount by means of a three-categories classification of lithologies based on a 1/1,000,000 geological map. The seismotectonic zonation consists of areas of diffuseseismicity characterized by a frequency-magnitude distribution. In southeasternFrance, active faults are considered in a test case and are assumed to follow thecharacteristic earthquake model. We performed hazard curves for six French citiesand maps of peak horizontal ground accelerations expected for return periods of 475,975, and 1975 years in the country. Sensitivity tests have been performed. The un-certainty introduced by ground-motion variability seems minor compared with thatdue to the choice of the attenuation law. This study points to the importance of testinginternal consistency of the various data and laws used in any seismic hazard analysis(in particular, here the type of magnitude used to predict ground motion). If not,some systematic bias is introduced that may result in systematic errors on peakground acceleration determination. We also show that the introduction of possiblyvery large and infrequent events, known only from paleoseismic investigations, mayhave a dramatic impact on the hazard, especially when long periods of time areconsidered.
Introduction
This article presents an application of probabilisticmethods to seismic hazard assessment in France. This studydiffers from previous studies that have adopted a “determin-istic” approach (Bour et al., 2000; Terrier et al., 2000). Inboth approaches it is assumed that seismicity can be repre-sented from a seismotectonic model that consists of polyg-onal zones and faults with appropriate characteristics. Thismodel is often referred to as “the seismotectonic zonation.”In a deterministic approach, only one single scenario is usedchosen from all its various possibilities, usually the mostunfavorable. Each zone or fault is then characterized by aunique maximum plausible earthquake, which is assumed tohave an evenly distributed spatial probability of occurrence.Once the reference scenario is chosen, and provided thatattenuation laws and site effects are known, such an ap-proach allows the estimatation of the (maximum) expectedground motions at any point. The resulting map is then verysensitive to any change in the geometry of the seismotec-tonic model or in the magnitude of the maximum plausibleearthquakes, as well as to any reappraisal of site effects or
*Present address: Geological and Planetary Sciences, California Instituteof Technology, Mail code 100-23, Pasadena, California 91125.
attenuation laws. Moreover, uncertainties on the various pa-rameters are usually incorporated by considering systemat-ically the most conservative sets of parameters and fixedsafety margins, yielding to probably unrealistic overesti-mations of hazard. Finally, the possibility that the groundmotion may exceed the value obtained from a deterministicmap can not be easily quantified. In view of these shortcom-ings, probabilistic methods have been designed (e.g., Cor-nell, 1968) and have become more and more popular. Aprobabilistic approach also requires a seismotectonic model,but the zones and faults are not characterized by a singlemaximum plausible earthquake. Polygonal zones are char-acterized by a frequency-magnitude distribution, generallyassumed to fit the experimentally observed power-law dis-tribution (Gutenberg and Richter, 1956). In general, faultsare assumed to obey the characteristic fault model (Schwartzand Coppersmith, 1984), which, although debated, seems areasonable assumption for seismic hazard assessment (Yeatset al., 1997). The main problem in applying probabilisticmethods, in particular, in a low-seismicity area such asFrance, is that it requires a more elaborate description of theseismotectonic model, often poorly constrained from earth-quake catalogs and seismotectonic studies. In another hand,
2138 S. Marin, J.-P. Avouac, M. Nicolas, and A. Schlupp
the activity is not high enough and the seismic cycle notshort enough, so that the observed seismicity could be usedas an assumption representative of the seismic potential inzoneless methods. In the moderate but contrasted seismicitycontext of France, a zonation that integrates a more globalknowledge about the seismotectonic model and its interpre-tation seems the best solution. In this study, we take advan-tage of the relatively good instrumental and historical seis-micity catalogs (Laboratoire de Detection et de Geophysique[LDG], 1998; SIRENE, 1996). This study builds on a pre-vious similar attempt by the Evaluation Probabiliste del’Alea Sismique (EPAS) group (EPAS, 1998a,b), from whichit differs for two major reasons: (1) we have taken into ac-count regional data to estimate the attenuation law and (2)we have incorporated some gross models to take geologicalconditions into account. At this point we have not fully ac-counted for uncertainties on the various parameters andmodels. Before a complete process of probabilistic seismichazard analysis (PSHA), with regard to uncertainties, couldbe carried out, we emphasize the need to study specificallysome stages of the analysis to give suitable answers for theFrench seismotectonic context. The results presented hereare released for information and discussion and are notmeant to be linked to any kind of regulation. In the firstsection we present an overview the seismicity of France, theattenuation laws and geological conditions on the regionalscale. Next, we present the seismotectonic zonation and themethodology used in this study. The last section presents theresulting maps and sensitivity tests.
Estimation of Ground Motions, MacroseismicEffects, and Seismotectonic Parameters
Seismicity Catalogs
We constituted a catalog of French seismicity for thepast thousand years (Fig. 1), which is based on historicaldata from the SIRENE database Bureau de Recherches Geo-logiques et Minieres (BRGM), Electricite de France (EDF),Institut de Protection et de Surete Nucleaire (IPSN), and oninstrumental events recorded and located by LDG since1962. The LDG catalog consists of relocated epicenters com-puted from regional crustal models, in which nonnaturalevents have been removed (Nicolas et al., 1998). The localmagnitude of LDG is presented in the Appendix. It is im-portant to take into account both catalogs jointly becauseactivity rates and b-values are better constrained from in-strumental seismicity, whereas maximum magnitudes de-pend more on historical data. To build this catalog, historicalearthquakes were ascribed magnitudes that were computedon the basis of a simple linear relationship between epicen-tral Medvedev-Sponheuer-Karnik (MSK) intensities and lo-cal magnitudes of LDG. We have chosen to neglect the effectof the depth because we consider that depth determinationis not accurate enough for historical events; moreover, be-cause seismicity in France is shallow (�30 km), it would
not have a significant impact. This relation was establishedusing the common events of the two databases since 1962.To reduce dispersion due to uncertainty in determination ofthe lower intensities, only events of intensity equal or greaterto the degree V–VI are considered. Dispersion remains widefor degree V, which corresponds to local magnitudes (ML)between 2.9 and 4.9 and represents 70% of the data. Therelation inferred from the 53 remaining events is:
M � 0.45I � 1.71 r � 0.37 (1)L 0
where I0 is the epicentral intensity estimated in the SIRENEdatabase, which is either a known intensity if the epicentercoincides with an observed intensity, or an estimation froma law describing the decrease of intensity with distance fromthe epicenter (Levret et al., 1994, 1996).
Although the magnitude of any particular recent earth-quake could be more accurately determined from the wholeset of macroseismic observations (Levret, 1994; Scotti et al.,1999), we believe that this approach allows a reasonablycorrect estimation of the average magnitude distribution. Forexample, Levret et al. (1994) have proposed that local LDGmagnitudes might be obtained from:
M � 0.44I � 1.48 log R � 0.48 r � 0.4 (2)
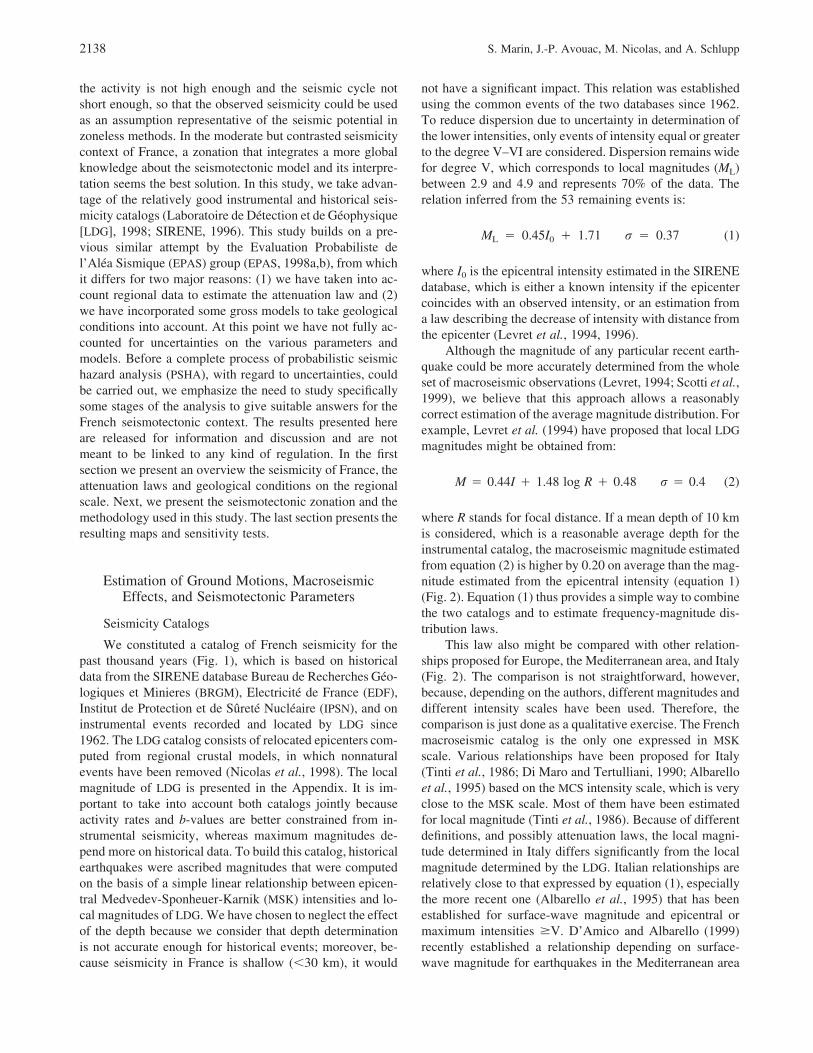
where R stands for focal distance. If a mean depth of 10 kmis considered, which is a reasonable average depth for theinstrumental catalog, the macroseismic magnitude estimatedfrom equation (2) is higher by 0.20 on average than the mag-nitude estimated from the epicentral intensity (equation 1)(Fig. 2). Equation (1) thus provides a simple way to combinethe two catalogs and to estimate frequency-magnitude dis-tribution laws.
This law also might be compared with other relation-ships proposed for Europe, the Mediterranean area, and Italy(Fig. 2). The comparison is not straightforward, however,because, depending on the authors, different magnitudes anddifferent intensity scales have been used. Therefore, thecomparison is just done as a qualitative exercise. The Frenchmacroseismic catalog is the only one expressed in MSKscale. Various relationships have been proposed for Italy(Tinti et al., 1986; Di Maro and Tertulliani, 1990; Albarelloet al., 1995) based on the MCS intensity scale, which is veryclose to the MSK scale. Most of them have been estimatedfor local magnitude (Tinti et al., 1986). Because of differentdefinitions, and possibly attenuation laws, the local magni-tude determined in Italy differs significantly from the localmagnitude determined by the LDG. Italian relationships arerelatively close to that expressed by equation (1), especiallythe more recent one (Albarello et al., 1995) that has beenestablished for surface-wave magnitude and epicentral ormaximum intensities �V. D’Amico and Albarello (1999)recently established a relationship depending on surface-wave magnitude for earthquakes in the Mediterranean area

A Probabilistic Approach to Seismic Hazard in Metropolitan France 2139
Figure 1. Historical and instrumental seismicity of France from the SIRENE (before1962) and LDG (1962–1998) databases. SIRENE epicentral intensities are convertedto local magnitudes with a simple linear relation that relies on the common events ofthe two databases since 1962.
with maximum intensity �VI. This relationship is also closeto the one we propose for France.
The macroseismic magnitude proposed by Ambraseys(1985) has been established to match surface-wave magni-tude for a northwestern European data set. The use of asurface-wave magnitude might explain the steeper slope ofthe relationship proposed by Ambraseys (1985) comparedwith other laws (Fig. 2).
Attenuation Law for Peak Horizontal GroundAcceleration in France
A few attenuation laws have been proposed in westernEurope and, in particular, in Italy. Nevertheless, the use ofthese relations for France is difficult particularly because ofthe difference in the magnitude scales. Furthermore, we willshow that these laws are not consistent with the French datarecently available. That is why we propose a preliminaryrelationship that is based on the local magnitude used for theFrench seismicity catalog of LDG and the range of magni-tudes observed in the metropolitan territory.
A preliminary ground-motion attenuation law appropri-
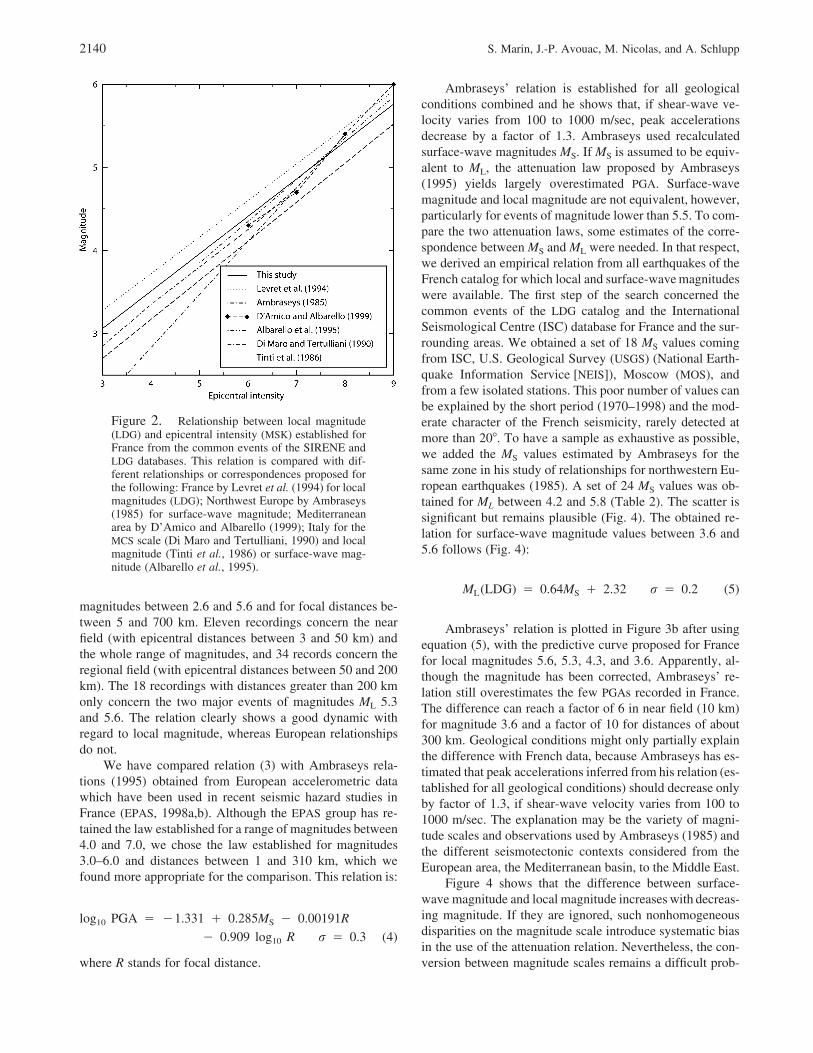
ate to the French context has been determined. This law wasestablished from 14 earthquakes located in the Alps, the Pyr-enees, and the Armorican Massif and recorded at short andregional distances by the LDG network (Table 1). Amongthese earthquakes, the two largest are the 18 February 1996,ML 5.6, Saint Paul de Fenouillet and the 15 July 1996, ML
5.3, Annecy events. All stations are settled on stiff bedrock.An estimation of their shear-wave velocities can be deducedfrom their geology settlement and leads to values between1200 and 2000 m/sec for carbonated formations and greaterthan 2500 m/sec for the eruptive formations, which representthe majority of them. The data set represents 63 ground-motion values from vertical components of velocimeters.The horizontal peak ground accelerations (PGAs) are esti-mated with the empirical relation defined by Smit (1998).After least-squares adjustment, this data set yields:
log PGA � �3.9310
� 0.78M � 1.5 log R r � 0.55 (3)L 10 log10PGA
where R stands for focal distance.The law shown in Figure 3a was established for local
2140 S. Marin, J.-P. Avouac, M. Nicolas, and A. Schlupp
Figure 2. Relationship between local magnitude(LDG) and epicentral intensity (MSK) established forFrance from the common events of the SIRENE andLDG databases. This relation is compared with dif-ferent relationships or correspondences proposed forthe following: France by Levret et al. (1994) for localmagnitudes (LDG); Northwest Europe by Ambraseys(1985) for surface-wave magnitude; Mediterraneanarea by D’Amico and Albarello (1999); Italy for theMCS scale (Di Maro and Tertulliani, 1990) and localmagnitude (Tinti et al., 1986) or surface-wave mag-nitude (Albarello et al., 1995).
magnitudes between 2.6 and 5.6 and for focal distances be-tween 5 and 700 km. Eleven recordings concern the nearfield (with epicentral distances between 3 and 50 km) andthe whole range of magnitudes, and 34 records concern theregional field (with epicentral distances between 50 and 200km). The 18 recordings with distances greater than 200 kmonly concern the two major events of magnitudes ML 5.3and 5.6. The relation clearly shows a good dynamic withregard to local magnitude, whereas European relationshipsdo not.
We have compared relation (3) with Ambraseys rela-tions (1995) obtained from European accelerometric datawhich have been used in recent seismic hazard studies inFrance (EPAS, 1998a,b). Although the EPAS group has re-tained the law established for a range of magnitudes between4.0 and 7.0, we chose the law established for magnitudes3.0–6.0 and distances between 1 and 310 km, which wefound more appropriate for the comparison. This relation is:
log PGA � �1.331 � 0.285M � 0.00191R10 S
� 0.909 log R r � 0.3 (4)10
where R stands for focal distance.
Ambraseys’ relation is established for all geologicalconditions combined and he shows that, if shear-wave ve-locity varies from 100 to 1000 m/sec, peak accelerationsdecrease by a factor of 1.3. Ambraseys used recalculatedsurface-wave magnitudes MS. If MS is assumed to be equiv-alent to ML, the attenuation law proposed by Ambraseys(1995) yields largely overestimated PGA. Surface-wavemagnitude and local magnitude are not equivalent, however,particularly for events of magnitude lower than 5.5. To com-pare the two attenuation laws, some estimates of the corre-spondence between MS and ML were needed. In that respect,we derived an empirical relation from all earthquakes of theFrench catalog for which local and surface-wave magnitudeswere available. The first step of the search concerned thecommon events of the LDG catalog and the InternationalSeismological Centre (ISC) database for France and the sur-rounding areas. We obtained a set of 18 MS values comingfrom ISC, U.S. Geological Survey (USGS) (National Earth-quake Information Service [NEIS]), Moscow (MOS), andfrom a few isolated stations. This poor number of values canbe explained by the short period (1970–1998) and the mod-erate character of the French seismicity, rarely detected atmore than 20�. To have a sample as exhaustive as possible,we added the MS values estimated by Ambraseys for thesame zone in his study of relationships for northwestern Eu-ropean earthquakes (1985). A set of 24 MS values was ob-tained for ML between 4.2 and 5.8 (Table 2). The scatter issignificant but remains plausible (Fig. 4). The obtained re-lation for surface-wave magnitude values between 3.6 and5.6 follows (Fig. 4):
M (LDG) � 0.64M � 2.32 r � 0.2 (5)L S
Ambraseys’ relation is plotted in Figure 3b after usingequation (5), with the predictive curve proposed for Francefor local magnitudes 5.6, 5.3, 4.3, and 3.6. Apparently, al-though the magnitude has been corrected, Ambraseys’ re-lation still overestimates the few PGAs recorded in France.The difference can reach a factor of 6 in near field (10 km)for magnitude 3.6 and a factor of 10 for distances of about300 km. Geological conditions might only partially explainthe difference with French data, because Ambraseys has es-timated that peak accelerations inferred from his relation (es-tablished for all geological conditions) should decrease onlyby factor of 1.3, if shear-wave velocity varies from 100 to1000 m/sec. The explanation may be the variety of magni-tude scales and observations used by Ambraseys (1985) andthe different seismotectonic contexts considered from theEuropean area, the Mediterranean basin, to the Middle East.
Figure 4 shows that the difference between surface-wave magnitude and local magnitude increases with decreas-ing magnitude. If they are ignored, such nonhomogeneousdisparities on the magnitude scale introduce systematic biasin the use of the attenuation relation. Nevertheless, the con-version between magnitude scales remains a difficult prob-
A Probabilistic Approach to Seismic Hazard in Metropolitan France 2141
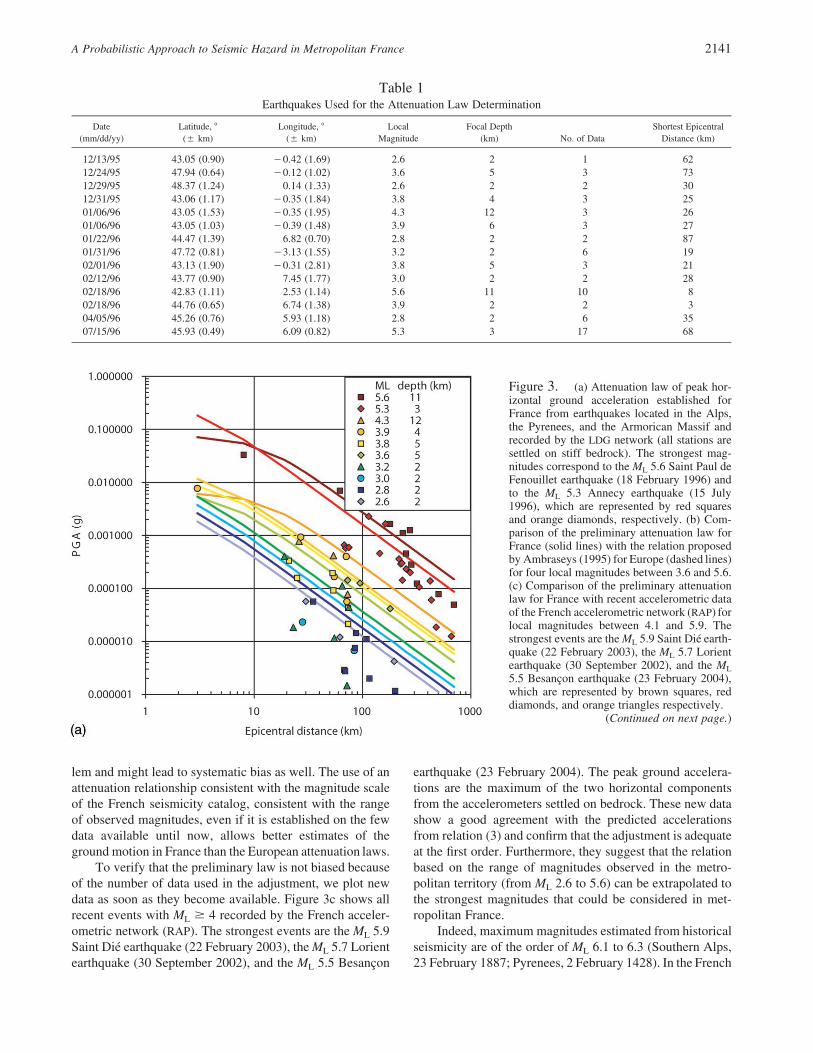
Table 1Earthquakes Used for the Attenuation Law Determination
Date(mm/dd/yy)
Latitude, �(� km)
Longitude, �(� km)
LocalMagnitude
Focal Depth(km) No. of Data
Shortest EpicentralDistance (km)
12/13/95 43.05 (0.90) �0.42 (1.69) 2.6 2 1 6212/24/95 47.94 (0.64) �0.12 (1.02) 3.6 5 3 7312/29/95 48.37 (1.24) 0.14 (1.33) 2.6 2 2 3012/31/95 43.06 (1.17) �0.35 (1.84) 3.8 4 3 2501/06/96 43.05 (1.53) �0.35 (1.95) 4.3 12 3 2601/06/96 43.05 (1.03) �0.39 (1.48) 3.9 6 3 2701/22/96 44.47 (1.39) 6.82 (0.70) 2.8 2 2 8701/31/96 47.72 (0.81) �3.13 (1.55) 3.2 2 6 1902/01/96 43.13 (1.90) �0.31 (2.81) 3.8 5 3 2102/12/96 43.77 (0.90) 7.45 (1.77) 3.0 2 2 2802/18/96 42.83 (1.11) 2.53 (1.14) 5.6 11 10 802/18/96 44.76 (0.65) 6.74 (1.38) 3.9 2 2 304/05/96 45.26 (0.76) 5.93 (1.18) 2.8 2 6 3507/15/96 45.93 (0.49) 6.09 (0.82) 5.3 3 17 68
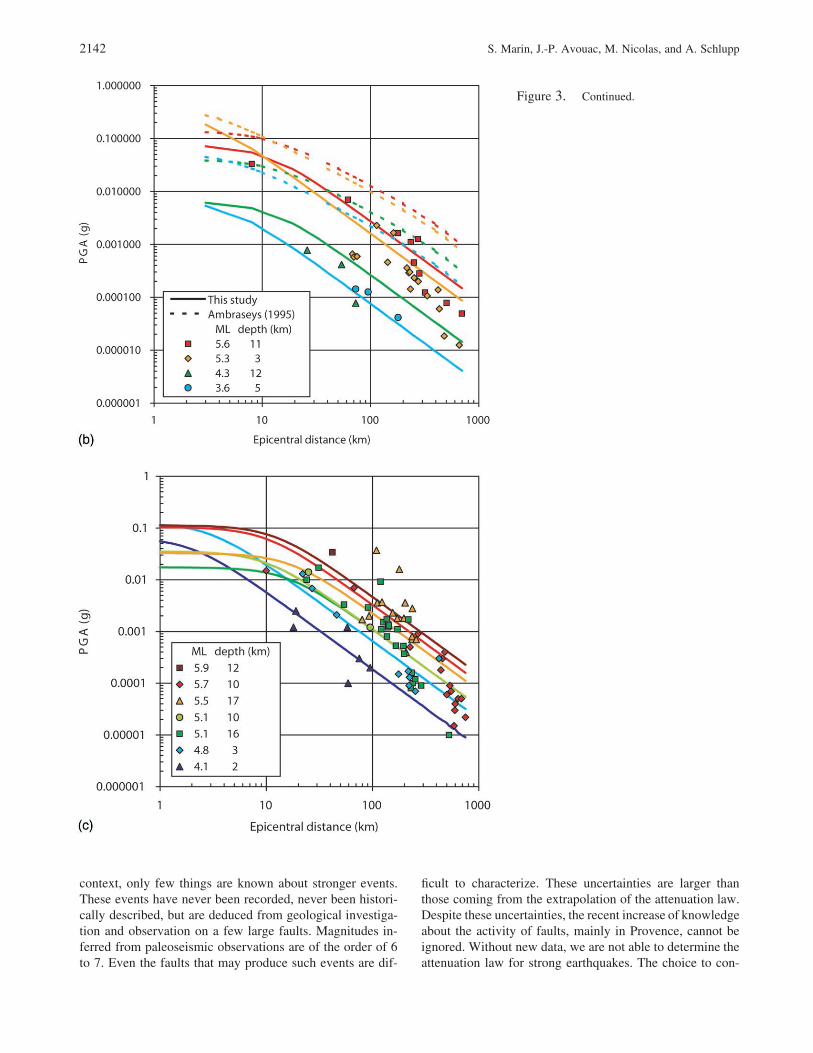
Figure 3. (a) Attenuation law of peak hor-izontal ground acceleration established forFrance from earthquakes located in the Alps,the Pyrenees, and the Armorican Massif andrecorded by the LDG network (all stations aresettled on stiff bedrock). The strongest mag-nitudes correspond to the ML 5.6 Saint Paul deFenouillet earthquake (18 February 1996) andto the ML 5.3 Annecy earthquake (15 July1996), which are represented by red squaresand orange diamonds, respectively. (b) Com-parison of the preliminary attenuation law forFrance (solid lines) with the relation proposedby Ambraseys (1995) for Europe (dashed lines)for four local magnitudes between 3.6 and 5.6.(c) Comparison of the preliminary attenuationlaw for France with recent accelerometric dataof the French accelerometric network (RAP) forlocal magnitudes between 4.1 and 5.9. Thestrongest events are the ML 5.9 Saint Die earth-quake (22 February 2003), the ML 5.7 Lorientearthquake (30 September 2002), and the ML
5.5 Besancon earthquake (23 February 2004),which are represented by brown squares, reddiamonds, and orange triangles respectively.
(Continued on next page.)
lem and might lead to systematic bias as well. The use of anattenuation relationship consistent with the magnitude scaleof the French seismicity catalog, consistent with the rangeof observed magnitudes, even if it is established on the fewdata available until now, allows better estimates of theground motion in France than the European attenuation laws.
To verify that the preliminary law is not biased becauseof the number of data used in the adjustment, we plot newdata as soon as they become available. Figure 3c shows allrecent events with ML � 4 recorded by the French acceler-ometric network (RAP). The strongest events are the ML 5.9Saint Die earthquake (22 February 2003), the ML 5.7 Lorientearthquake (30 September 2002), and the ML 5.5 Besancon
earthquake (23 February 2004). The peak ground accelera-tions are the maximum of the two horizontal componentsfrom the accelerometers settled on bedrock. These new datashow a good agreement with the predicted accelerationsfrom relation (3) and confirm that the adjustment is adequateat the first order. Furthermore, they suggest that the relationbased on the range of magnitudes observed in the metro-politan territory (from ML 2.6 to 5.6) can be extrapolated tothe strongest magnitudes that could be considered in met-ropolitan France.
Indeed, maximum magnitudes estimated from historicalseismicity are of the order of ML 6.1 to 6.3 (Southern Alps,23 February 1887; Pyrenees, 2 February 1428). In the French
2142 S. Marin, J.-P. Avouac, M. Nicolas, and A. Schlupp
Figure 3. Continued.
context, only few things are known about stronger events.These events have never been recorded, never been histori-cally described, but are deduced from geological investiga-tion and observation on a few large faults. Magnitudes in-ferred from paleoseismic observations are of the order of 6to 7. Even the faults that may produce such events are dif-
ficult to characterize. These uncertainties are larger thanthose coming from the extrapolation of the attenuation law.Despite these uncertainties, the recent increase of knowledgeabout the activity of faults, mainly in Provence, cannot beignored. Without new data, we are not able to determine theattenuation law for strong earthquakes. The choice to con-
A Probabilistic Approach to Seismic Hazard in Metropolitan France 2143
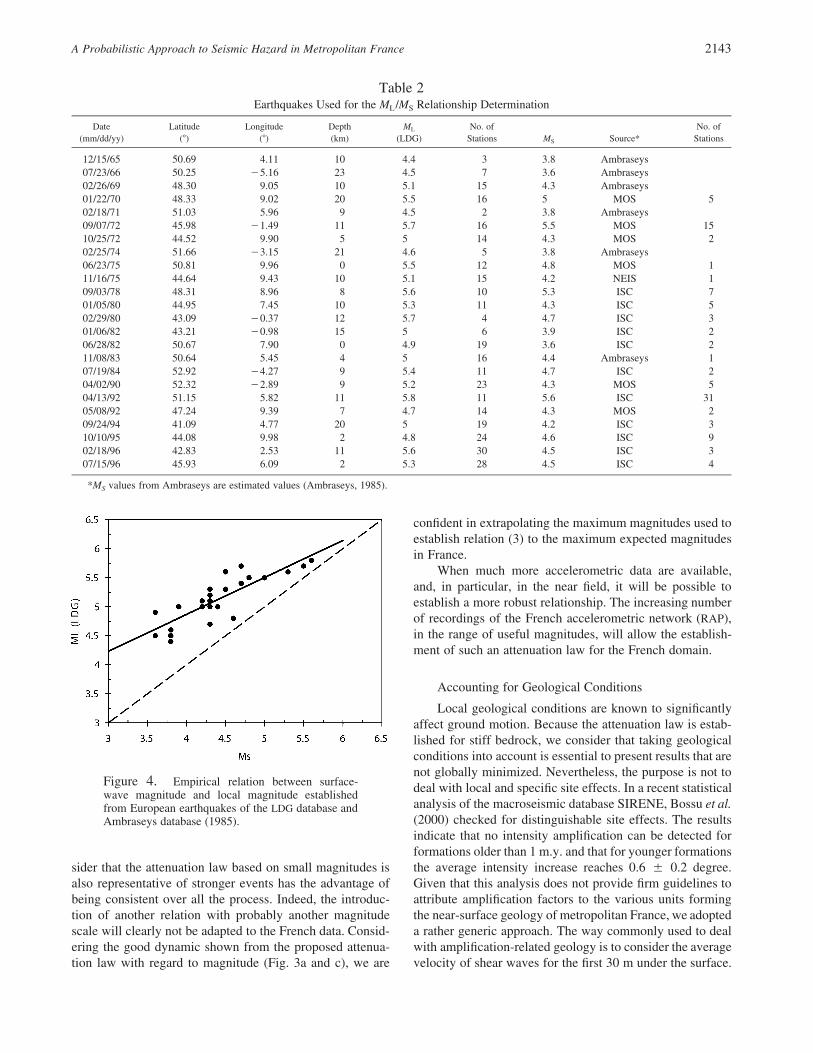
Table 2Earthquakes Used for the ML/MS Relationship Determination
Date(mm/dd/yy)
Latitude(�)
Longitude(�)
Depth(km)
ML
(LDG)No. of
Stations MS Source*No. of
Stations
12/15/65 50.69 4.11 10 4.4 3 3.8 Ambraseys07/23/66 50.25 �5.16 23 4.5 7 3.6 Ambraseys02/26/69 48.30 9.05 10 5.1 15 4.3 Ambraseys01/22/70 48.33 9.02 20 5.5 16 5 MOS 502/18/71 51.03 5.96 9 4.5 2 3.8 Ambraseys09/07/72 45.98 �1.49 11 5.7 16 5.5 MOS 1510/25/72 44.52 9.90 5 5 14 4.3 MOS 202/25/74 51.66 �3.15 21 4.6 5 3.8 Ambraseys06/23/75 50.81 9.96 0 5.5 12 4.8 MOS 111/16/75 44.64 9.43 10 5.1 15 4.2 NEIS 109/03/78 48.31 8.96 8 5.6 10 5.3 ISC 701/05/80 44.95 7.45 10 5.3 11 4.3 ISC 502/29/80 43.09 �0.37 12 5.7 4 4.7 ISC 301/06/82 43.21 �0.98 15 5 6 3.9 ISC 206/28/82 50.67 7.90 0 4.9 19 3.6 ISC 211/08/83 50.64 5.45 4 5 16 4.4 Ambraseys 107/19/84 52.92 �4.27 9 5.4 11 4.7 ISC 204/02/90 52.32 �2.89 9 5.2 23 4.3 MOS 504/13/92 51.15 5.82 11 5.8 11 5.6 ISC 3105/08/92 47.24 9.39 7 4.7 14 4.3 MOS 209/24/94 41.09 4.77 20 5 19 4.2 ISC 310/10/95 44.08 9.98 2 4.8 24 4.6 ISC 902/18/96 42.83 2.53 11 5.6 30 4.5 ISC 307/15/96 45.93 6.09 2 5.3 28 4.5 ISC 4
*MS values from Ambraseys are estimated values (Ambraseys, 1985).
Figure 4. Empirical relation between surface-wave magnitude and local magnitude establishedfrom European earthquakes of the LDG database andAmbraseys database (1985).
sider that the attenuation law based on small magnitudes isalso representative of stronger events has the advantage ofbeing consistent over all the process. Indeed, the introduc-tion of another relation with probably another magnitudescale will clearly not be adapted to the French data. Consid-ering the good dynamic shown from the proposed attenua-tion law with regard to magnitude (Fig. 3a and c), we are
confident in extrapolating the maximum magnitudes used toestablish relation (3) to the maximum expected magnitudesin France.
When much more accelerometric data are available,and, in particular, in the near field, it will be possible toestablish a more robust relationship. The increasing numberof recordings of the French accelerometric network (RAP),in the range of useful magnitudes, will allow the establish-ment of such an attenuation law for the French domain.
Accounting for Geological Conditions
Local geological conditions are known to significantlyaffect ground motion. Because the attenuation law is estab-lished for stiff bedrock, we consider that taking geologicalconditions into account is essential to present results that arenot globally minimized. Nevertheless, the purpose is not todeal with local and specific site effects. In a recent statisticalanalysis of the macroseismic database SIRENE, Bossu et al.(2000) checked for distinguishable site effects. The resultsindicate that no intensity amplification can be detected forformations older than 1 m.y. and that for younger formationsthe average intensity increase reaches 0.6 � 0.2 degree.Given that this analysis does not provide firm guidelines toattribute amplification factors to the various units formingthe near-surface geology of metropolitan France, we adopteda rather generic approach. The way commonly used to dealwith amplification-related geology is to consider the averagevelocity of shear waves for the first 30 m under the surface.
2144 S. Marin, J.-P. Avouac, M. Nicolas, and A. Schlupp
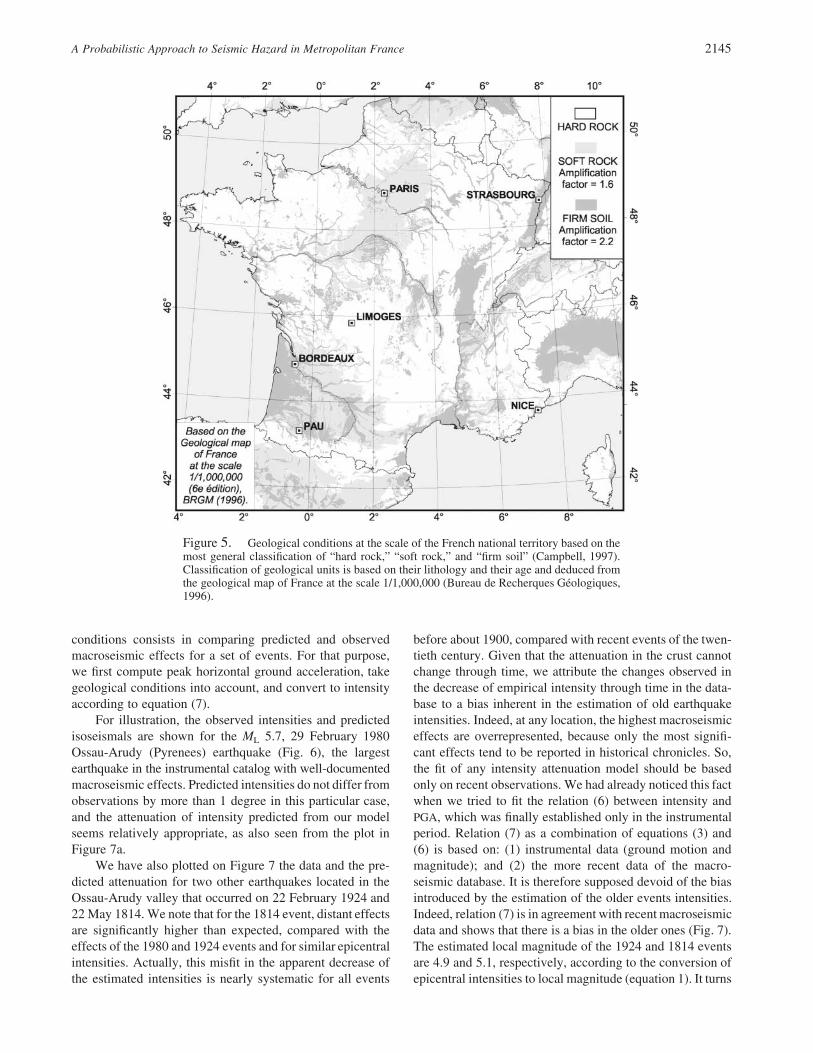
Despite that it is an oversimplification, the shear-wave ve-locity provides an acceptable first order of classification. Ofcourse, there is no widespread information about the realshear-wave velocity. Nevertheless, the “hardness” of sedi-ments, and then the shear-wave velocity, increases at firstorder with their age mainly because of the process of com-paction, sediment evolution, and surface alteration. The ob-tained classification has to be understood as a relative clas-sification. Using the geological map of France at the scale1/1,000,000 (Bureau de Recherques Geologiques, 1996), weclassified surface geology in terms of “hard rock,” “softrock,” and “firm soil” (Campbell, 1997; Petersen et al.,1997; Park and Elrick, 1998; Wald et al., 1999b; Wills etal., 2000):
• Hard rock: primarily Cretaceous and older sedimentary de-posits, metamorphic and crystalline rock, and hard vol-canic deposits (basalt);
• Soft rock: primarily Tertiary sedimentary deposits and softvolcanic deposits (ashes deposits);
• Firm soil: firm or stiff Quaternary deposits (alluvium es-pecially) with depth greater than 10 m.
Although the classification of geological units could berefined, these geologically defined units are expected to havedistinct shear-wave velocity properties (Wills et al., 2000).Velocity characteristics remain very variable in each geo-logical unit, but shear-wave velocity measurements andmore detailed geological mapping would be necessary toaccount more accurately for local conditions. The map (Fig.5) shows the distribution of the three geological conditioncategories derived from this simple approach at a scale suit-able with the resolution of this study’s results. It clearly dis-plays the main zones where the geological conditions areexpected to amplify ground motion: the Paris Basin, the Aq-uitaine Basin, the southeastern Basin, the Bresse Graben, theCoal Belt, the Molassic Basin, the Rhine Graben, and theFlanders Plains. The classification of geological conditionsat the regional scale will provide an insight into the vari-ability of the ground motion on the hazard maps that willnot be apparent otherwise.
The amplification factors are estimated according to thereference elastic response spectrum advised for French fa-cilities prone to seismic risk (Association Francaise du GenieParasismique, 1990), as the spectral ratios of the three cate-gories. The amplification factor at 1 Hz is a conservativevalue for the frequency range of interest. Therefore, we de-cided to apply this value to the PGA. Finally, the mean am-plification factors used for peak horizontal ground acceler-ation are 2.2 for the ratio firm soil / hard rock and 1.6 forthe ratio soft rock / hard rock. These mean amplificationfactors are close to amplification values estimated in othercase studies (Boore and Joyner, 1997; Harmsen, 1997; Waldand Mori, 2000; Steidl, 2000). According to the relationlinking PGA and intensity discussed in the following section(equation 6), the mean amplification factors of 1.6 and 2.2proposed for PGA correspond to mean intensity increases of
0.5 and 0.8, respectively. These values are consistent withthe site effects suggested from the study of Bossu et al.(2000). The hazard maps obtained taking geological condi-tions into account show contrasts that go through the seis-motectonic zone boundaries and that can even outshinethem. So geological conditions are important parameters forthe assessment of seismic hazard at the regional scale, evenif they only represent mean amplification factors.
Relationship between Intensity and PGA
In any seismic hazard study in which historical and in-strumental data are considered together there is a need forsome relationship between macroseismic effects and groundmotion. A common and simple assumption is that the log-arithm of peak horizontal ground acceleration correlates withintensity (Ambraseys, 1974; Murphy and O’Brien, 1977;Theodulidis and Papazachos, 1992; Wald et al., 1999a; At-kinson and Sonley, 2000; Boatwright et al., 2001). We triedto establish such a relation for France. To do so, we selecteda set of 37 earthquakes that produced intensities greater thanVI well distributed throughout France. From macroseismicdata of these events gathered in the SIRENE database andfrom the attenuation law predicting PGA, we obtained anestimation of the relation based on more than 8000 obser-vations. We tested the stability of the relation for differentperiods from 1350 to 1960 (which is the beginning of theinstrumental period for France). The result is that integrationof data prior to 1900 generates a great variability when re-lations obtained for the twentieth century and the instru-mental period are the same. This suggests that informationprior to the twentieth century is probably spoilt by too largeuncertainties and should be considered with caution (macro-seismic surveys date from the beginning of the twentiethcentury). We decided to use the stable relation obtained forthe instrumental period:
I � 10 � 2.3 log PGA r � 0.3 (6)10
By combining equation (6) with the PGA attenuationlaw (equation 3), the intensity should attenuate with distancefrom the epicenter according to:
I � 0.96 � 1.79 M � 3.45 log R (7)L 10
where R stands for focal distance.Although it has been obtained by a relatively different
approach, this relationship compares relatively well withequation (2), with maximum deviations of 0, �0.5, and �1intensity degree, respectively, for ML 4, 5, and 6. This showsthat the set of relationships proposed here is probably inter-nally consistent.
Checking the Comparison with Macroseismic Data
A simple way to validate the laws proposed previouslyto account for ground-motion attenuation and geological
A Probabilistic Approach to Seismic Hazard in Metropolitan France 2145
Figure 5. Geological conditions at the scale of the French national territory based on themost general classification of “hard rock,” “soft rock,” and “firm soil” (Campbell, 1997).Classification of geological units is based on their lithology and their age and deduced fromthe geological map of France at the scale 1/1,000,000 (Bureau de Recherques Geologiques,1996).
conditions consists in comparing predicted and observedmacroseismic effects for a set of events. For that purpose,we first compute peak horizontal ground acceleration, takegeological conditions into account, and convert to intensityaccording to equation (7).
For illustration, the observed intensities and predictedisoseismals are shown for the ML 5.7, 29 February 1980Ossau-Arudy (Pyrenees) earthquake (Fig. 6), the largestearthquake in the instrumental catalog with well-documentedmacroseismic effects. Predicted intensities do not differ fromobservations by more than 1 degree in this particular case,and the attenuation of intensity predicted from our modelseems relatively appropriate, as also seen from the plot inFigure 7a.
We have also plotted on Figure 7 the data and the pre-dicted attenuation for two other earthquakes located in theOssau-Arudy valley that occurred on 22 February 1924 and22 May 1814. We note that for the 1814 event, distant effectsare significantly higher than expected, compared with theeffects of the 1980 and 1924 events and for similar epicentralintensities. Actually, this misfit in the apparent decrease ofthe estimated intensities is nearly systematic for all events
before about 1900, compared with recent events of the twen-tieth century. Given that the attenuation in the crust cannotchange through time, we attribute the changes observed inthe decrease of empirical intensity through time in the data-base to a bias inherent in the estimation of old earthquakeintensities. Indeed, at any location, the highest macroseismiceffects are overrepresented, because only the most signifi-cant effects tend to be reported in historical chronicles. So,the fit of any intensity attenuation model should be basedonly on recent observations. We had already noticed this factwhen we tried to fit the relation (6) between intensity andPGA, which was finally established only in the instrumentalperiod. Relation (7) as a combination of equations (3) and(6) is based on: (1) instrumental data (ground motion andmagnitude); and (2) the more recent data of the macro-seismic database. It is therefore supposed devoid of the biasintroduced by the estimation of the older events intensities.Indeed, relation (7) is in agreement with recent macroseismicdata and shows that there is a bias in the older ones (Fig. 7).The estimated local magnitude of the 1924 and 1814 eventsare 4.9 and 5.1, respectively, according to the conversion ofepicentral intensities to local magnitude (equation 1). It turns

2146 S. Marin, J.-P. Avouac, M. Nicolas, and A. Schlupp
Figure 6. Comparison of observed intensities and predicted isoseismals for the 29February 1980 Ossau-Arudy (Pyrenees) earthquake. Points are observed intensitiesfrom the SIRENE database and lines are predicted isoseismals that take geologicalconditions into account.
out that these estimates are probably correct to the first orderin view of the whole set of macroseismic data.
We, however, made a more systematic comparison ofmagnitudes estimated from equation (1) and the whole setof macroseismic data. The analysis consists in adjusting lo-cal magnitude and focal depth to predict intensity accordingto the decrease law (equation 7), for a selection of 78 events.For the 35 historical events prior to the twentieth century,intensities reported tend to be systematically higher than ex-pected in the range II to IV. Large misfits are also observedin the epicentral area where they might simply relate to un-certainties on the location of the epicenter. For the 18 his-torical and 25 instrumental events of the twentieth century,the curves fitted with magnitudes and depths that are inferredfrom equation (1) show a good agreement with the decreaseof observed intensities. There is no systematic discrepancyin the magnitude estimated from equation (1) and in thepredicted decrease law (equation 7).
The 25 instrumental earthquakes for which magnitudeand depth are relatively well determined were used to checkfor the reliability of the magnitude that can be inferred fromthe epicentral intensities. We allow depth to vary of �5 kmfrom the depth of the nearest instrumental events. This stagealso enables the estimation of inherent uncertainties in themethod. For 21 of the events, the attenuation law fitted withthe instrumental parameters is in good agreement with thedecrease of observed intensity. The four remaining eventswould be best fitted with lower magnitudes and/or withgreater depths. Among them we can mention the 18 Febru-
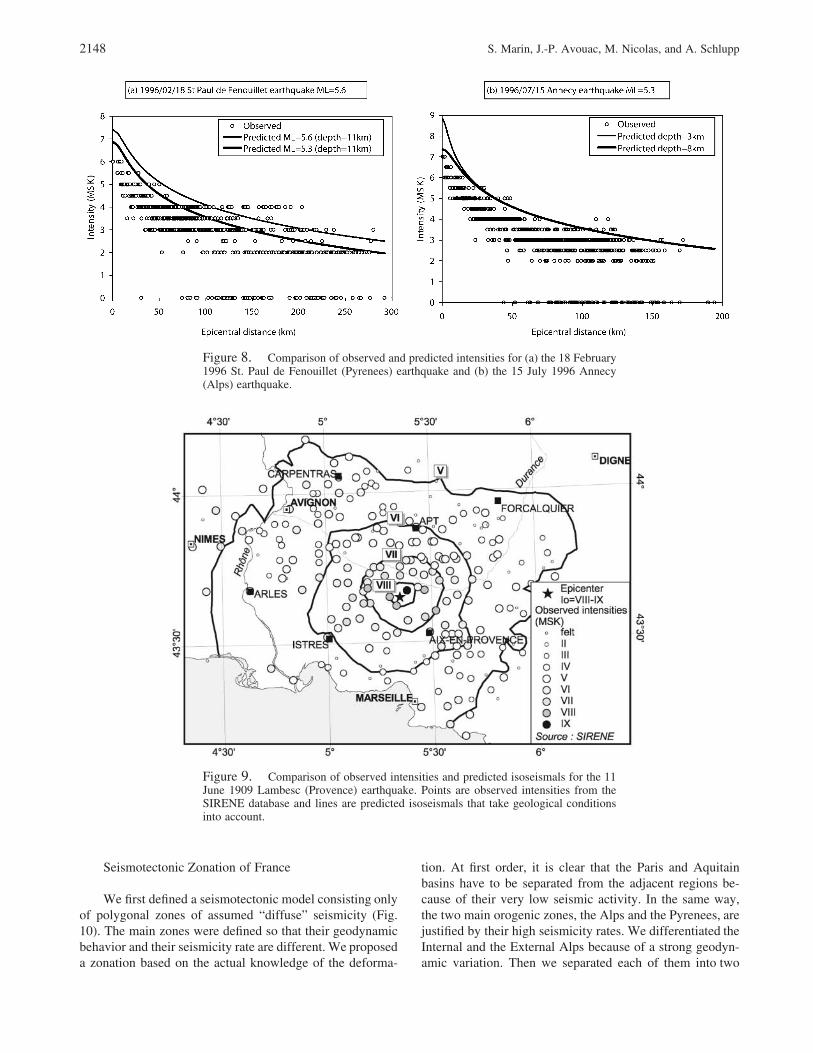
ary 1996 St Paul de Fenouillet (Eastern Pyrenees) earth-quake and the 15 July 1996 Annecy (Alps) earthquake forwhich epicentral intensities are small (VI and V, respec-tively) with regard to their instrumental characteristics (ML
5.6 and 5.3, respectively). A comparison of observed inten-sities and predicted ones for both events are presented inFigure 8. These cases show that in the lack of instrumentaldetermination, the uncertainty on the estimated local mag-nitude is of the order of �0.3, if depth is constrained to varyin �5 km from the depth of the nearest instrumental events.
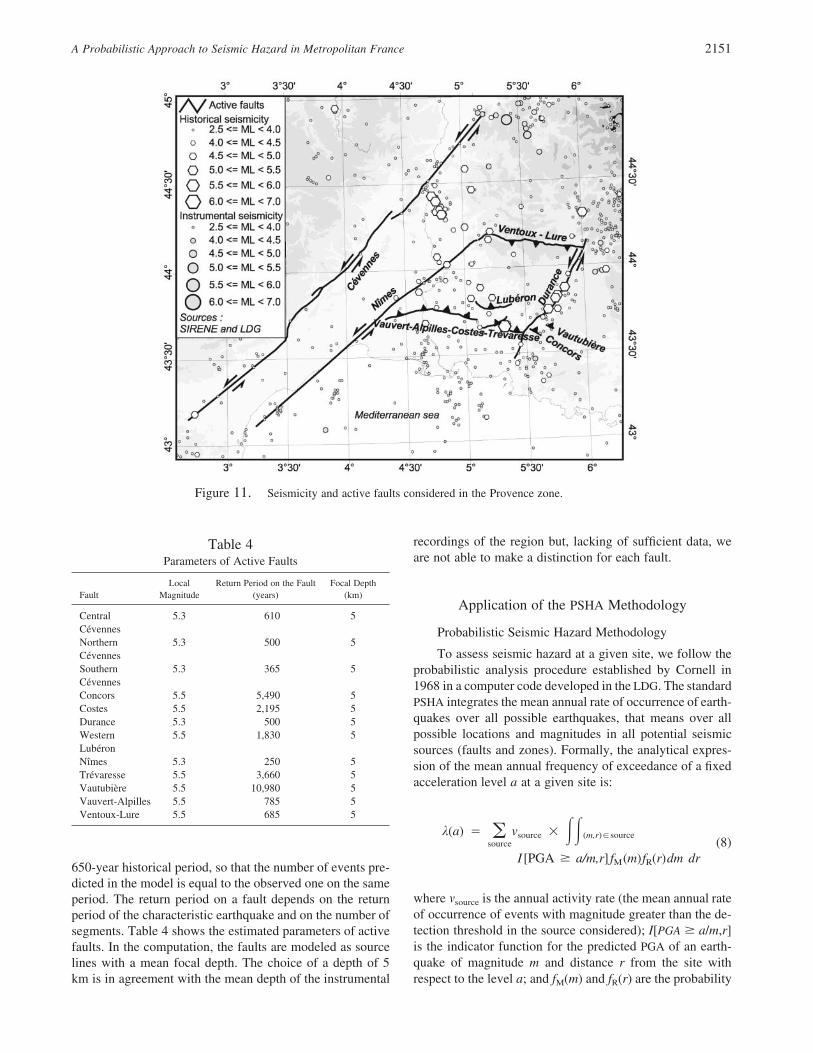
In Figure 9 we consider the 11 June 1909 Lambesc (Pro-vence) earthquake. The Lambesc earthquake is one of thestrongest earthquakes of the twentieth century felt in France.This event affected most of Provence and reached an epi-central intensity of degree VIII–IX. It is generally attributedto a surface-wave magnitude on the order of 6 (e.g., Cara etal. [1987] indicate a MS 6.3, and in a recent study Barouxet al. [2003] propose a MS 6.0). According to our modeling,the reported intensities are best fitted for a ML 5.5 magnitude,if the focal depth is supposed to be the mean focal depth ofthe region (4 km). The map shows a good agreement forintensity degrees from V to VII and an underestimation ofepicentral area corresponding to degree VIII. This may bedue to Quaternary sediments that fill the Durance valley andthat might be able to locally amplify ground motion beyondthe mean factor that we take into account. The maximumintensity degree IX reached at Rognes and identified in theSIRENE database as site effect may be due to the local to-pography (Bard et al., 1992).

A Probabilistic Approach to Seismic Hazard in Metropolitan France 2147
Figure 7. Comparison of observed and predicted intensities for three earthquakesof the Ossau-Arudy valley (Pyrenees).
2148 S. Marin, J.-P. Avouac, M. Nicolas, and A. Schlupp
Figure 8. Comparison of observed and predicted intensities for (a) the 18 February1996 St. Paul de Fenouillet (Pyrenees) earthquake and (b) the 15 July 1996 Annecy(Alps) earthquake.
Seismotectonic Zonation of France
We first defined a seismotectonic model consisting onlyof polygonal zones of assumed “diffuse” seismicity (Fig.10). The main zones were defined so that their geodynamicbehavior and their seismicity rate are different. We proposeda zonation based on the actual knowledge of the deforma-
tion. At first order, it is clear that the Paris and Aquitainbasins have to be separated from the adjacent regions be-cause of their very low seismic activity. In the same way,the two main orogenic zones, the Alps and the Pyrenees, arejustified by their high seismicity rates. We differentiated theInternal and the External Alps because of a strong geodyn-amic variation. Then we separated each of them into two
Figure 9. Comparison of observed intensities and predicted isoseismals for the 11June 1909 Lambesc (Provence) earthquake. Points are observed intensities from theSIRENE database and lines are predicted isoseismals that take geological conditionsinto account.

A Probabilistic Approach to Seismic Hazard in Metropolitan France 2149
parts, north and south, because of variation in the observedseismicity rate. The other zones are mainly large regionswhere there is no clear geodynamic information to define amore detailed zonation. Only the zonation of the Pyreneescan be refined, which will be the purpose of a sensitivitytest. Each zone is considered to have a rather homogeneousdistribution of seismicity. The Provence is a particular casewhere we tried to improve the analysis by introducing amodel of active faults that will be discussed later.
Each zone is characterized by a frequency-magnitudedistribution (Gutenberg-Richter, 1956), which is derivedfrom joint historical and instrumental seismicity catalogs ac-cording to the Weichert method (1980). It consists of themaximum-likelihood estimation of activity rate and b-valueover different time periods. The instrumental seismicity cat-alog well reproduces seismicity of the past four decades frommagnitude 2.5, which is the detection threshold of the LDGnetwork. Nevertheless, the detection threshold has changedsince the creation of the network in 1962. Indeed there is alack of events of magnitude lower than 3.5 before 1977.
Over a period of more than a thousand-years, the historicalseismicity catalog is biased by a lack of data, particularly forlow degrees of intensity. Historical seismicity is more reli-able for major earthquakes. We decided to only considerevents with epicentral intensity greater than or equal to VIIcorresponding to local magnitude 4.9. A study of the timeseries for the ranges of magnitude 5.0 to 5.5 and �5.5 helpsto determine their period of completeness for the whole seis-micity catalog. We used the instrumental period (40 years)as the reference for the number of events for each magnituderange, which represents 15 and 7 events, respectively. The in-terval considered for the series is therefore 40 years. Themethod consists of searching for the date from which thenumber of events can be considered as constant. If a 50%deviation from the reference is accepted, the periods of com-pleteness for the two magnitude ranges begin in 1840 and1880, respectively. Nevertheless, if we consider a particularzone, 50% of magnitudes greater than or equal to 5.0 haveoccurred before these dates. It means that such magnitudesin some zones have a return period greater than 150 years.
Figure 10. Seismotectonic zonation of France. 1, Northern Externals Alps; 2,Southern Externals Alps; 3, Northern Internals Alps; 4, Southern Internals Alps; 5,Apennines; 6, Aquitaine Basin; 7, Armorican Massif; 8, Paris Basin; 9, Artois-Brabant;10, Castile; 11, Corsica and Sardinia; 12, Bresse Graben; 13, Rhine Graben; 14, Ger-many; 15, Ireland and United Kingdom; 16, Jura; 17, Tyrrhenian Margin; 18, CentralMassif; 19, Mediterranean Sea; 20, Ligure Sea; 21, Molassic Basin and Switzerland;22, Black Mountain; 23, Po Plain; 24, Provence; 25, Pyrenees; 26, Burgundy Sill; 27,Rhine-Saone Sill; 28, Tuscany. Legend of seismicity is the same as in Figure 1.

2150 S. Marin, J.-P. Avouac, M. Nicolas, and A. Schlupp
So the periods of completeness can not really be constrainedby the historical catalog considering the moderate seismicactivity of the French context. To take those regional max-imum magnitudes into account, we stated that the periods ofcompleteness for the two magnitude ranges begin in 1340and 1690, respectively. Therefore, the periods of complete-ness are defined for all seismotectonic zones as ML � 5.5after 1340, ML � 4.9 after 1690, ML � 3.5 after 1962, andML � 2.5 after 1977. In practice, the method fits the slopeof the Gutenberg-Richter law on the observed frequenciesof low and intermediate magnitudes that represent only in-strumental and reliable data. The end of the distribution, forwhich frequencies are estimated with a wider uncertainty,has a lower weight. The constitution of a homogeneous seis-micity catalog based on the local magnitude, the definitionof a zonation at a scale convenient with the probabilisticapproach, and the use of the robust Weichert method, allowthe estimation of reliable Gutenberg-Richter laws for allseismotectonic zones, and for the more seismic ones as forthe less seismic ones.
Parameters of the Gutenberg-Richter law are shown inTable 3. Maximum magnitudes considered are the observedmaximum magnitudes of the zones. Magnitudes of the stron-gest historical earthquakes of each zone have been system-atically examined and possibly re-adjusted with the pre-dicted decrease law (equation 7) to be in best agreement withthe observed higher intensities in the epicentral area. Con-trary to the deterministic approach, the maximum observedmagnitude is not in itself a discriminant parameter for zo-nation because it does not allow differentiating regions withcontrasted seismicity rates and because it does not charac-terize the maximum potential magnitude of the zones. Asimple example is the “Southern Internal Alps” and the “Aq-uitaine basin” (zones 4 and 6, respectively, in Fig. 10) withfairly similar maximal known magnitudes but with stronglydifferent seismicity rates. The determination of focal depthis generally not well constrained, but nevertheless depth israther homogeneous within a region. We therefore deter-mined a mean depth representative of the information avail-able in the LDG database.
Active Faults in Provence
Active faults in France remain very poorly known, ei-ther in terms of location or seismotectonic characteristics,mainly because of the low rate of deformation. The only areawhere some active faults might be defined is in Provencewhere some quaternary deformation has been documented(Grellet et al., 1993; Lacassin et al., 1998; Baroux, 2000;Schlupp et al., 2001) even if they are still debated. We there-fore made an attempt in introducing active faults in this partof France. The interest of this exercise is to refine locallythe seismic hazard map and illustrate its sensitivity tochanges of the seismotectonic model. The fault model pro-posed here is based on the recent knowledge. It is a supportfor the probabilistic analysis and it does not claim to be adefinitive model of active faults in Provence.
Major active faults of Provence considered in this studyare shown in Figure 11. They are assumed to obey the char-acteristic earthquake model of Schwartz and Coppersmith(1984). In this first hypothesis, we consider a model of theobserved seismicity; a model for maximum possible earth-quakes will be discussed later. Therefore, the characteristicearthquake is assumed to be the maximum observed one thatcan be associated with each fault. Faults that have produceda known historical or instrumental earthquake are character-ized by the magnitudes of these earthquakes. This is the caseof the Trevaresse fault that is associated with the 1909 Lam-besc earthquake and of the Durance fault, associated withthe strongest earthquakes of the Durance Valley. Concerningfaults supposed to be active, but without any known earth-quake, we stated that their characteristic earthquake is thesame as similar faults in the vicinity. Faults are then com-posed of a number of segments that depends on the rupturelength of the characteristic earthquake and on the total lengthof the fault. The lengths of the fault segments activated dur-ing the characteristic earthquakes are estimated according tothe laws proposed by Wells and Coppersmith (1994). Thereturn period of characteristic earthquakes associated to agiven magnitude is estimated according to the frequency-magnitude law of the region of Provence established on a
Table 3Parameters of Seismotectonic Zonation
Zone a-value b-value r(a) r(b)
MaximumLocal
Magnitude
FocalDepth(km)
Northern External Alps 3.641 0.938 0.068 0.027 5.8 5Southern External Alps 4.528 1.198 0.086 0.034 6.1 5Northern Internal Alps 3.427 0.927 0.084 0.034 6.1 7Southern Internal Alps 4.828 1.207 0.060 0.024 5.4 7Apennines 4.943 1.083 0.077 0.022 7.0 15Aquitaine Basin 1.932 0.603 0.385 0.129 5.5 10Armorican Massif 4.290 1.031 0.057 0.023 5.7 10Paris Basin 3.252 1.052 0.279 0.112 4.9 10Artois-Brabant 2.583 0.789 0.129 0.052 5.7 12Castile 3.635 0.956 0.147 0.049 5.6 10Corsica and Sardinia 2.014 0.541 0.345 0.116 4.8 10Bresse Graben 2.620 0.901 0.381 0.153 4.6 10Rhine Graben 4.023 0.972 0.050 0.020 6.0 7Germany 3.717 1.014 0.346 0.100 5.3 10Ireland and United
Kingdom4.108 1.085 0.260 0.075 5.5 12
Jura 3.283 0.954 0.155 0.062 5.4 5Tyrrhenian Margin 3.086 0.865 0.106 0.043 5.4 12Central Massif 4.635 1.351 0.152 0.061 5.3 5Mediterranean Sea 2.685 0.790 0.174 0.070 5.0 10Ligure Sea 3.027 0.884 0.161 0.064 5.9 5Molassic Basin and 3.276 0.965 0.174 0.070 4.6 12SwitzerlandBlack Mountain 2.433 0.900 0.471 0.190 4.1 7Po Plain 4.111 1.134 0.214 0.071 5.7 10Provence 3.515 0.988 0.109 0.044 5.5 4Pyrenees 4.610 1.062 0.058 0.023 6.3 7Burgundy Sill 1.642 0.672 0.365 0.151 5.0 10Rhine-Saone Sill 2.905 1.095 0.648 0.260 4.0 10Tuscany 2.402 0.725 0.187 0.064 5.7 10
A Probabilistic Approach to Seismic Hazard in Metropolitan France 2151
650-year historical period, so that the number of events pre-dicted in the model is equal to the observed one on the sameperiod. The return period on a fault depends on the returnperiod of the characteristic earthquake and on the number ofsegments. Table 4 shows the estimated parameters of activefaults. In the computation, the faults are modeled as sourcelines with a mean focal depth. The choice of a depth of 5km is in agreement with the mean depth of the instrumental
recordings of the region but, lacking of sufficient data, weare not able to make a distinction for each fault.
Application of the PSHA Methodology
Probabilistic Seismic Hazard Methodology
To assess seismic hazard at a given site, we follow theprobabilistic analysis procedure established by Cornell in1968 in a computer code developed in the LDG. The standardPSHA integrates the mean annual rate of occurrence of earth-quakes over all possible earthquakes, that means over allpossible locations and magnitudes in all potential seismicsources (faults and zones). Formally, the analytical expres-sion of the mean annual frequency of exceedance of a fixedacceleration level a at a given site is:
k(a) � v �� source (m,r)�source��source (8)
I [PGA � a/m,r] f (m)f (r)dm drM R
where msource is the annual activity rate (the mean annual rateof occurrence of events with magnitude greater than the de-tection threshold in the source considered); I[PGA � a/m,r]is the indicator function for the predicted PGA of an earth-quake of magnitude m and distance r from the site withrespect to the level a; and fM(m) and fR(r) are the probability
Figure 11. Seismicity and active faults considered in the Provence zone.
Table 4Parameters of Active Faults
FaultLocal
MagnitudeReturn Period on the Fault
(years)Focal Depth
(km)
CentralCevennes
5.3 610 5
NorthernCevennes
5.3 500 5
SouthernCevennes
5.3 365 5
Concors 5.5 5,490 5Costes 5.5 2,195 5Durance 5.3 500 5WesternLuberon
5.5 1,830 5
Nımes 5.3 250 5Trevaresse 5.5 3,660 5Vautubiere 5.5 10,980 5Vauvert-Alpilles 5.5 785 5Ventoux-Lure 5.5 685 5
2152 S. Marin, J.-P. Avouac, M. Nicolas, and A. Schlupp
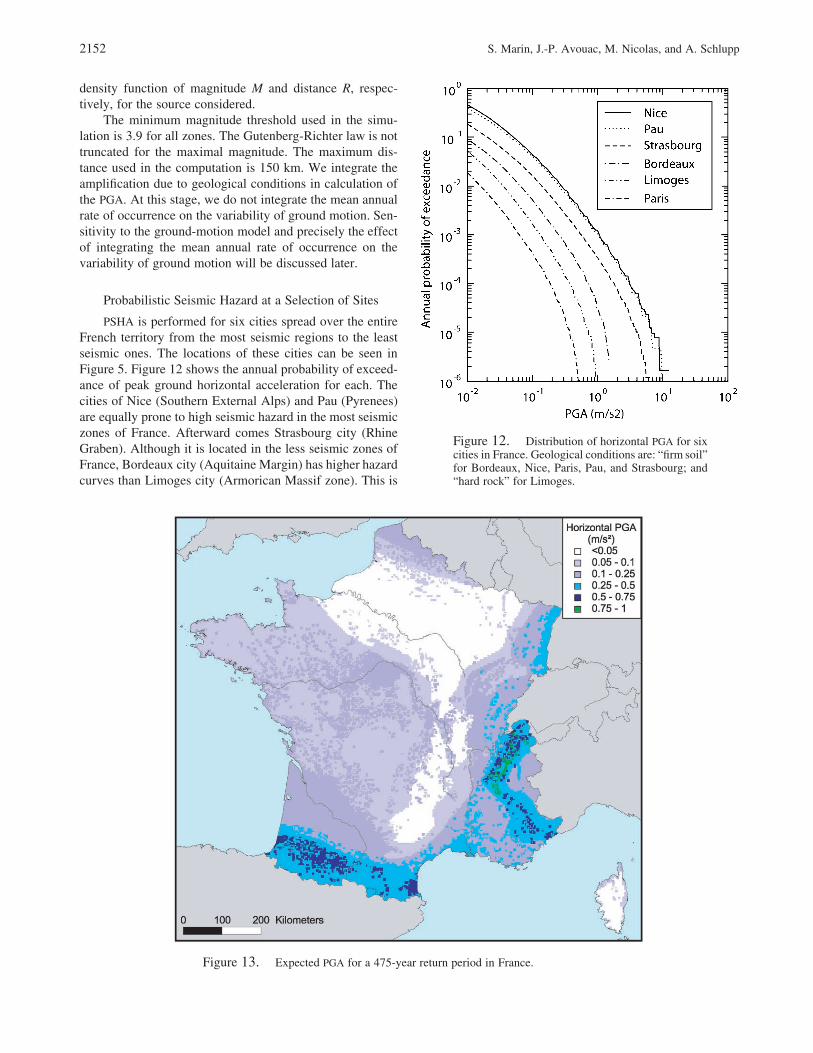
Figure 12. Distribution of horizontal PGA for sixcities in France. Geological conditions are: “firm soil”for Bordeaux, Nice, Paris, Pau, and Strasbourg; and“hard rock” for Limoges.
density function of magnitude M and distance R, respec-tively, for the source considered.
The minimum magnitude threshold used in the simu-lation is 3.9 for all zones. The Gutenberg-Richter law is nottruncated for the maximal magnitude. The maximum dis-tance used in the computation is 150 km. We integrate theamplification due to geological conditions in calculation ofthe PGA. At this stage, we do not integrate the mean annualrate of occurrence on the variability of ground motion. Sen-sitivity to the ground-motion model and precisely the effectof integrating the mean annual rate of occurrence on thevariability of ground motion will be discussed later.
Probabilistic Seismic Hazard at a Selection of Sites
PSHA is performed for six cities spread over the entireFrench territory from the most seismic regions to the leastseismic ones. The locations of these cities can be seen inFigure 5. Figure 12 shows the annual probability of exceed-ance of peak ground horizontal acceleration for each. Thecities of Nice (Southern External Alps) and Pau (Pyrenees)are equally prone to high seismic hazard in the most seismiczones of France. Afterward comes Strasbourg city (RhineGraben). Although it is located in the less seismic zones ofFrance, Bordeaux city (Aquitaine Margin) has higher hazardcurves than Limoges city (Armorican Massif zone). This is
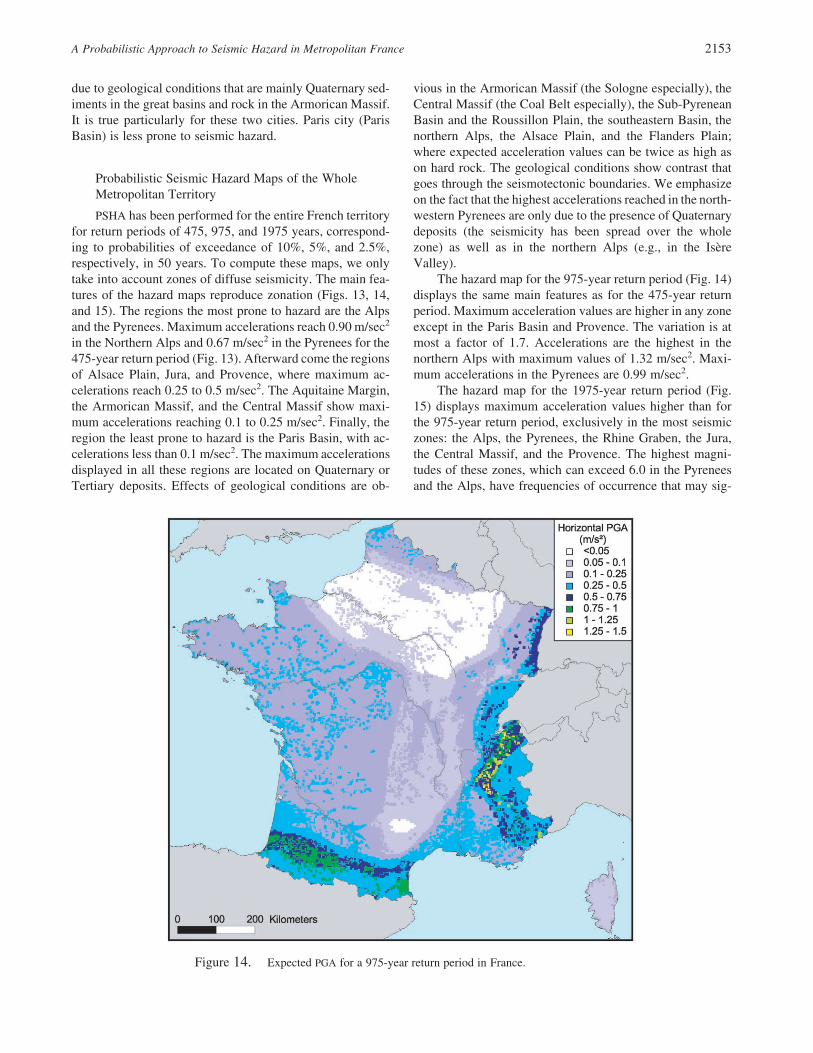
Figure 13. Expected PGA for a 475-year return period in France.
A Probabilistic Approach to Seismic Hazard in Metropolitan France 2153
due to geological conditions that are mainly Quaternary sed-iments in the great basins and rock in the Armorican Massif.It is true particularly for these two cities. Paris city (ParisBasin) is less prone to seismic hazard.
Probabilistic Seismic Hazard Maps of the WholeMetropolitan Territory
PSHA has been performed for the entire French territoryfor return periods of 475, 975, and 1975 years, correspond-ing to probabilities of exceedance of 10%, 5%, and 2.5%,respectively, in 50 years. To compute these maps, we onlytake into account zones of diffuse seismicity. The main fea-tures of the hazard maps reproduce zonation (Figs. 13, 14,and 15). The regions the most prone to hazard are the Alpsand the Pyrenees. Maximum accelerations reach 0.90 m/sec2
in the Northern Alps and 0.67 m/sec2 in the Pyrenees for the475-year return period (Fig. 13). Afterward come the regionsof Alsace Plain, Jura, and Provence, where maximum ac-celerations reach 0.25 to 0.5 m/sec2. The Aquitaine Margin,the Armorican Massif, and the Central Massif show maxi-mum accelerations reaching 0.1 to 0.25 m/sec2. Finally, theregion the least prone to hazard is the Paris Basin, with ac-celerations less than 0.1 m/sec2. The maximum accelerationsdisplayed in all these regions are located on Quaternary orTertiary deposits. Effects of geological conditions are ob-
vious in the Armorican Massif (the Sologne especially), theCentral Massif (the Coal Belt especially), the Sub-PyreneanBasin and the Roussillon Plain, the southeastern Basin, thenorthern Alps, the Alsace Plain, and the Flanders Plain;where expected acceleration values can be twice as high ason hard rock. The geological conditions show contrast thatgoes through the seismotectonic boundaries. We emphasizeon the fact that the highest accelerations reached in the north-western Pyrenees are only due to the presence of Quaternarydeposits (the seismicity has been spread over the wholezone) as well as in the northern Alps (e.g., in the IsereValley).
The hazard map for the 975-year return period (Fig. 14)displays the same main features as for the 475-year returnperiod. Maximum acceleration values are higher in any zoneexcept in the Paris Basin and Provence. The variation is atmost a factor of 1.7. Accelerations are the highest in thenorthern Alps with maximum values of 1.32 m/sec2. Maxi-mum accelerations in the Pyrenees are 0.99 m/sec2.
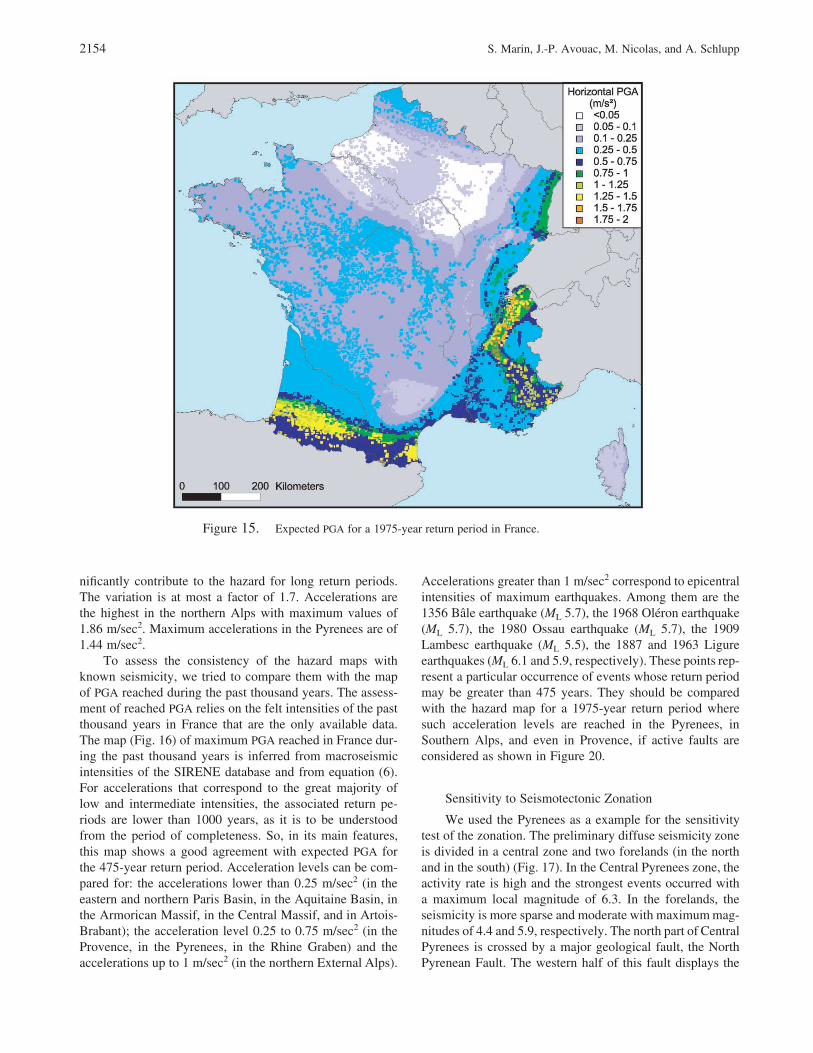
The hazard map for the 1975-year return period (Fig.15) displays maximum acceleration values higher than forthe 975-year return period, exclusively in the most seismiczones: the Alps, the Pyrenees, the Rhine Graben, the Jura,the Central Massif, and the Provence. The highest magni-tudes of these zones, which can exceed 6.0 in the Pyreneesand the Alps, have frequencies of occurrence that may sig-
Figure 14. Expected PGA for a 975-year return period in France.
2154 S. Marin, J.-P. Avouac, M. Nicolas, and A. Schlupp
nificantly contribute to the hazard for long return periods.The variation is at most a factor of 1.7. Accelerations arethe highest in the northern Alps with maximum values of1.86 m/sec2. Maximum accelerations in the Pyrenees are of1.44 m/sec2.
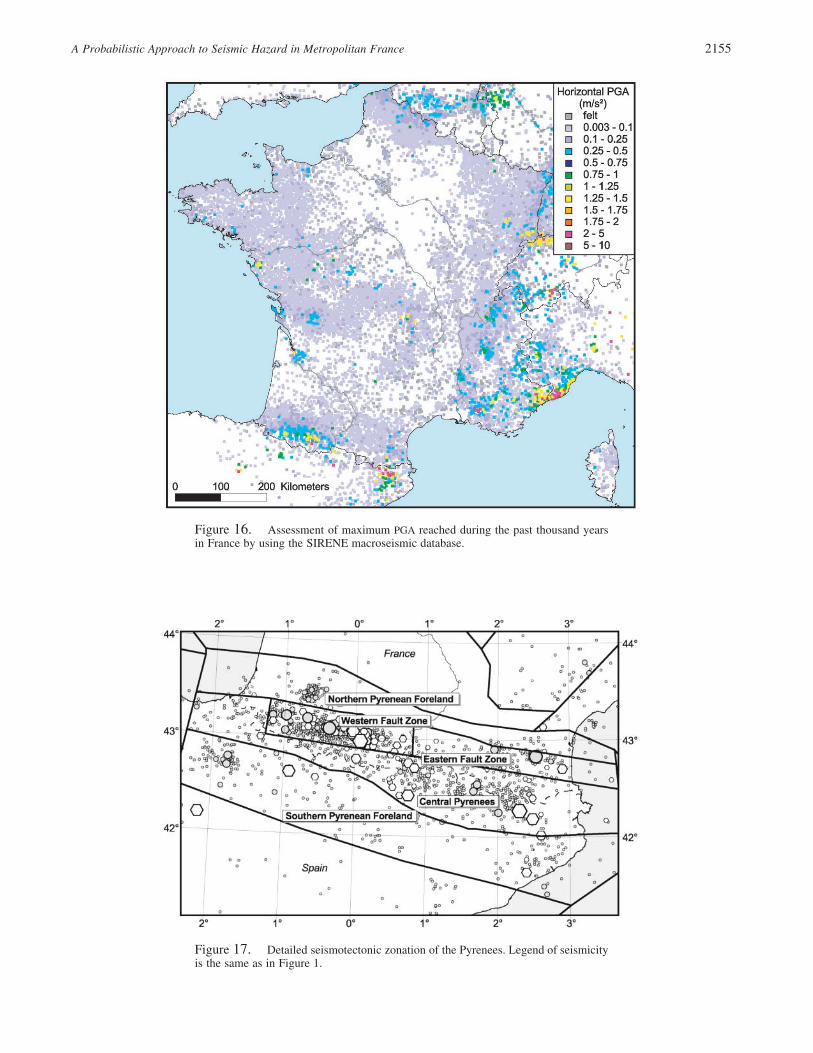
To assess the consistency of the hazard maps withknown seismicity, we tried to compare them with the mapof PGA reached during the past thousand years. The assess-ment of reached PGA relies on the felt intensities of the pastthousand years in France that are the only available data.The map (Fig. 16) of maximum PGA reached in France dur-ing the past thousand years is inferred from macroseismicintensities of the SIRENE database and from equation (6).For accelerations that correspond to the great majority oflow and intermediate intensities, the associated return pe-riods are lower than 1000 years, as it is to be understoodfrom the period of completeness. So, in its main features,this map shows a good agreement with expected PGA forthe 475-year return period. Acceleration levels can be com-pared for: the accelerations lower than 0.25 m/sec2 (in theeastern and northern Paris Basin, in the Aquitaine Basin, inthe Armorican Massif, in the Central Massif, and in Artois-Brabant); the acceleration level 0.25 to 0.75 m/sec2 (in theProvence, in the Pyrenees, in the Rhine Graben) and theaccelerations up to 1 m/sec2 (in the northern External Alps).
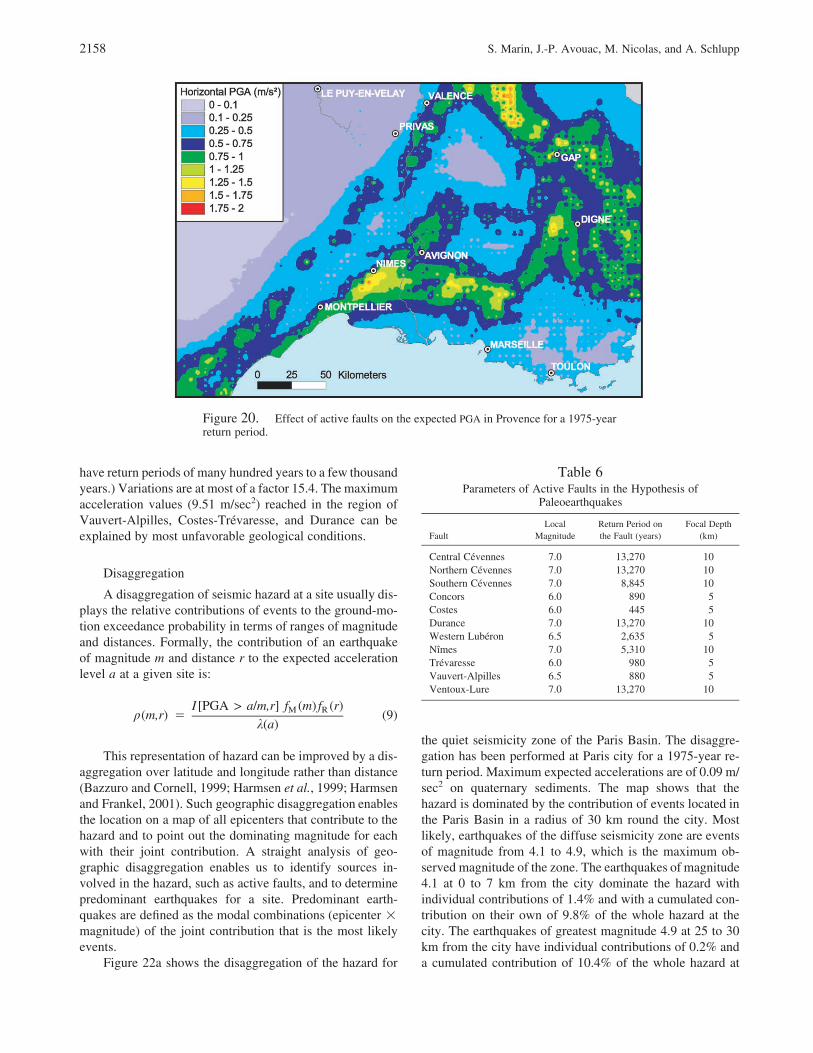
Accelerations greater than 1 m/sec2 correspond to epicentralintensities of maximum earthquakes. Among them are the1356 Bale earthquake (ML 5.7), the 1968 Oleron earthquake(ML 5.7), the 1980 Ossau earthquake (ML 5.7), the 1909Lambesc earthquake (ML 5.5), the 1887 and 1963 Ligureearthquakes (ML 6.1 and 5.9, respectively). These points rep-resent a particular occurrence of events whose return periodmay be greater than 475 years. They should be comparedwith the hazard map for a 1975-year return period wheresuch acceleration levels are reached in the Pyrenees, inSouthern Alps, and even in Provence, if active faults areconsidered as shown in Figure 20.
Sensitivity to Seismotectonic Zonation
We used the Pyrenees as a example for the sensitivitytest of the zonation. The preliminary diffuse seismicity zoneis divided in a central zone and two forelands (in the northand in the south) (Fig. 17). In the Central Pyrenees zone, theactivity rate is high and the strongest events occurred witha maximum local magnitude of 6.3. In the forelands, theseismicity is more sparse and moderate with maximum mag-nitudes of 4.4 and 5.9, respectively. The north part of CentralPyrenees is crossed by a major geological fault, the NorthPyrenean Fault. The western half of this fault displays the
Figure 15. Expected PGA for a 1975-year return period in France.
A Probabilistic Approach to Seismic Hazard in Metropolitan France 2155
Figure 17. Detailed seismotectonic zonation of the Pyrenees. Legend of seismicityis the same as in Figure 1.
Figure 16. Assessment of maximum PGA reached during the past thousand yearsin France by using the SIRENE macroseismic database.
2156 S. Marin, J.-P. Avouac, M. Nicolas, and A. Schlupp
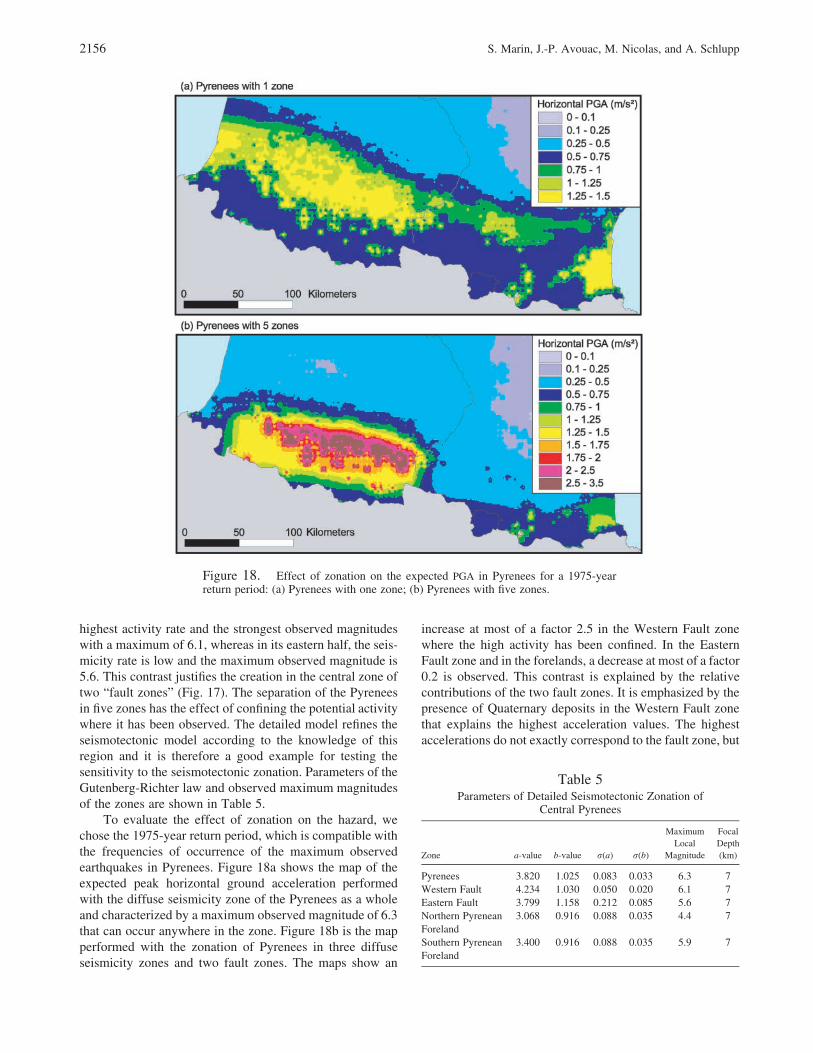
increase at most of a factor 2.5 in the Western Fault zonewhere the high activity has been confined. In the EasternFault zone and in the forelands, a decrease at most of a factor0.2 is observed. This contrast is explained by the relativecontributions of the two fault zones. It is emphasized by thepresence of Quaternary deposits in the Western Fault zonethat explains the highest acceleration values. The highestaccelerations do not exactly correspond to the fault zone, but
highest activity rate and the strongest observed magnitudeswith a maximum of 6.1, whereas in its eastern half, the seis-micity rate is low and the maximum observed magnitude is5.6. This contrast justifies the creation in the central zone oftwo “fault zones” (Fig. 17). The separation of the Pyreneesin five zones has the effect of confining the potential activitywhere it has been observed. The detailed model refines theseismotectonic model according to the knowledge of thisregion and it is therefore a good example for testing thesensitivity to the seismotectonic zonation. Parameters of theGutenberg-Richter law and observed maximum magnitudesof the zones are shown in Table 5.
To evaluate the effect of zonation on the hazard, wechose the 1975-year return period, which is compatible withthe frequencies of occurrence of the maximum observedearthquakes in Pyrenees. Figure 18a shows the map of theexpected peak horizontal ground acceleration performedwith the diffuse seismicity zone of the Pyrenees as a wholeand characterized by a maximum observed magnitude of 6.3that can occur anywhere in the zone. Figure 18b is the mapperformed with the zonation of Pyrenees in three diffuseseismicity zones and two fault zones. The maps show an
Figure 18. Effect of zonation on the expected PGA in Pyrenees for a 1975-yearreturn period: (a) Pyrenees with one zone; (b) Pyrenees with five zones.
Table 5Parameters of Detailed Seismotectonic Zonation of
Central Pyrenees
Zone a-value b-value r(a) r(b)
MaximumLocal
Magnitude
FocalDepth(km)
Pyrenees 3.820 1.025 0.083 0.033 6.3 7Western Fault 4.234 1.030 0.050 0.020 6.1 7Eastern Fault 3.799 1.158 0.212 0.085 5.6 7Northern Pyrenean 3.068 0.916 0.088 0.035 4.4 7ForelandSouthern Pyrenean 3.400 0.916 0.088 0.035 5.9 7Foreland

A Probabilistic Approach to Seismic Hazard in Metropolitan France 2157
to the regional geological conditions in the North of thiszone.
Effect of Active Faults in the Seismicity Model
We used Provence as another case example for sensi-tivity tests of the seismotectonic model. The aim in intro-ducing a model of active faults is to refine locally the seismichazard map. The diffuse seismicity zone of Provence is char-acterized by a maximum observed magnitude of 5.5, whichcan occur anywhere in the zone. The model of active faultspreviously described is then included as potential sources.We consider that the strongest events of the zone (ML 5.5and 5.3) are associated with these faults as representative oftheir characteristic earthquakes. In that case, the maximummagnitude of the remaining diffuse seismicity in the Pro-vence zone is 5.1. To evaluate the effect of active faults onthe hazard, we chose the 1975-year return period which iscompatible with the frequencies of occurrence of the char-acteristic earthquakes. The maps of expected peak horizontalground accelerations have been performed without (Fig. 19)and with (Fig. 20) the model of active faults in the regionof Provence. The maps show an increase of accelerations inthe vicinity of faults and a decrease in the background. Var-iations are at most of a factor 3 in the vicinity of faults andof a factor 0.7 in the background. As a long return period isused and the associated strongest events are localized on thefaults, the highest accelerations are concentrated near thefaults. The highest accelerations are reached along theNımes, Vauvert-Alpilles, Costes, Trevaresse, and Durancefaults where quaternary alluvial sediments induce amplifi-cation. For example, the maximum acceleration of 1.78 m/
sec2 reached in the south of Nımes city can be explained bythe simultaneous contributions of the Nımes and Vauvertfaults together with most unfavorable geological conditions.
PSHA easily enables the consideration of a hypothesisbased on the input assumptions of the seismicity model, suchas the size and the recurrence of maximum magnitude ofeach source. We studied the possibility of integrating theoccurrence of a scenario such as paleoearthquakes in themodel of active faults to improve long-term hazard assess-ments in the region of Provence. In Table 6, we consideredpossible maximum magnitudes compatible with magnitudesestimated from paleoseismic data (Combes et al., 1993).
In this hypothesis, the Vautubiere fault was excludedbecause its length may not produce an earthquake of a mag-nitude greater than 5.5, which is, in the hypothesis of pa-leoearthquakes, the maximum magnitude of the diffuse seis-micity zone of Provence. As in the model of the observedseismicity, the return period on a fault depends on the returnperiod of the characteristic earthquake and on the number ofsegments liable to produce the characteristic earthquake. Re-turn periods of characteristic earthquakes are estimated fromthe Gutenberg-Richter law of Provence extrapolated up tomagnitudes of 7.0. The effect of paleoearthquakes on thehazard map of the Provence region is shown for the 1975-year return period (Fig. 21). This map can be compared withFigure 20. As the characteristic magnitudes associated withthe faults increase, their return periods got longer. Therefore,the effect of the Cevennes, Durance, and Ventoux-Lurefaults disappears (their characteristic earthquakes have re-turn periods of ten thousand years) while the map displaysthe contributions of Nımes, Vauvert-Alpilles, Luberon, andCostes-Trevaresse faults. (Their characteristic earthquakes
Figure 19. Expected PGA in Provence for a 1975-year return period.
2158 S. Marin, J.-P. Avouac, M. Nicolas, and A. Schlupp
Figure 20. Effect of active faults on the expected PGA in Provence for a 1975-yearreturn period.
have return periods of many hundred years to a few thousandyears.) Variations are at most of a factor 15.4. The maximumacceleration values (9.51 m/sec2) reached in the region ofVauvert-Alpilles, Costes-Trevaresse, and Durance can beexplained by most unfavorable geological conditions.
Disaggregation
A disaggregation of seismic hazard at a site usually dis-plays the relative contributions of events to the ground-mo-tion exceedance probability in terms of ranges of magnitudeand distances. Formally, the contribution of an earthquakeof magnitude m and distance r to the expected accelerationlevel a at a given site is:
I [PGA > a/m,r] f (m) f (r)M Rq(m,r) � (9)
k(a)
This representation of hazard can be improved by a dis-aggregation over latitude and longitude rather than distance(Bazzuro and Cornell, 1999; Harmsen et al., 1999; Harmsenand Frankel, 2001). Such geographic disaggregation enablesthe location on a map of all epicenters that contribute to thehazard and to point out the dominating magnitude for eachwith their joint contribution. A straight analysis of geo-graphic disaggregation enables us to identify sources in-volved in the hazard, such as active faults, and to determinepredominant earthquakes for a site. Predominant earth-quakes are defined as the modal combinations (epicenter �magnitude) of the joint contribution that is the most likelyevents.
Figure 22a shows the disaggregation of the hazard for
the quiet seismicity zone of the Paris Basin. The disaggre-gation has been performed at Paris city for a 1975-year re-turn period. Maximum expected accelerations are of 0.09 m/sec2 on quaternary sediments. The map shows that thehazard is dominated by the contribution of events located inthe Paris Basin in a radius of 30 km round the city. Mostlikely, earthquakes of the diffuse seismicity zone are eventsof magnitude from 4.1 to 4.9, which is the maximum ob-served magnitude of the zone. The earthquakes of magnitude4.1 at 0 to 7 km from the city dominate the hazard withindividual contributions of 1.4% and with a cumulated con-tribution on their own of 9.8% of the whole hazard at thecity. The earthquakes of greatest magnitude 4.9 at 25 to 30km from the city have individual contributions of 0.2% anda cumulated contribution of 10.4% of the whole hazard at
Table 6Parameters of Active Faults in the Hypothesis of
Paleoearthquakes
FaultLocal
MagnitudeReturn Period onthe Fault (years)
Focal Depth(km)
Central Cevennes 7.0 13,270 10Northern Cevennes 7.0 13,270 10Southern Cevennes 7.0 8,845 10Concors 6.0 890 5Costes 6.0 445 5Durance 7.0 13,270 10Western Luberon 6.5 2,635 5Nımes 7.0 5,310 10Trevaresse 6.0 980 5Vauvert-Alpilles 6.5 880 5Ventoux-Lure 7.0 13,270 10
A Probabilistic Approach to Seismic Hazard in Metropolitan France 2159
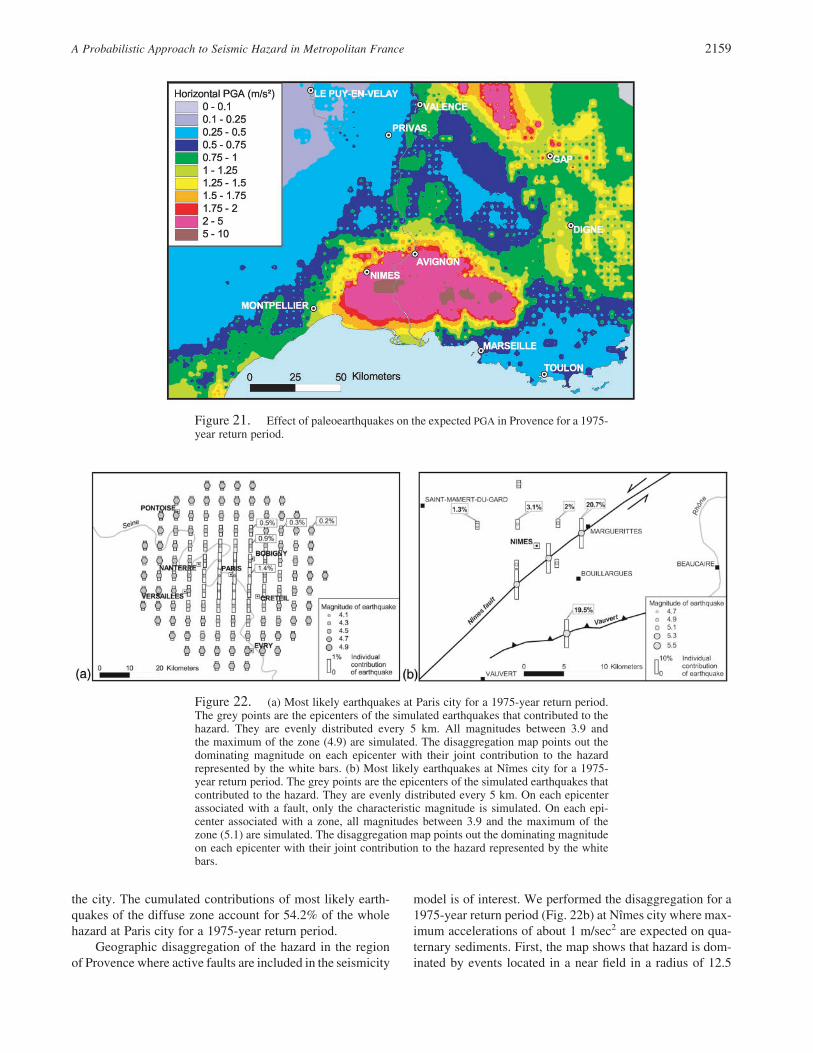
the city. The cumulated contributions of most likely earth-quakes of the diffuse zone account for 54.2% of the wholehazard at Paris city for a 1975-year return period.
Geographic disaggregation of the hazard in the regionof Provence where active faults are included in the seismicity
model is of interest. We performed the disaggregation for a1975-year return period (Fig. 22b) at Nımes city where max-imum accelerations of about 1 m/sec2 are expected on qua-ternary sediments. First, the map shows that hazard is dom-inated by events located in a near field in a radius of 12.5
Figure 21. Effect of paleoearthquakes on the expected PGA in Provence for a 1975-year return period.
Figure 22. (a) Most likely earthquakes at Paris city for a 1975-year return period.The grey points are the epicenters of the simulated earthquakes that contributed to thehazard. They are evenly distributed every 5 km. All magnitudes between 3.9 andthe maximum of the zone (4.9) are simulated. The disaggregation map points out thedominating magnitude on each epicenter with their joint contribution to the hazardrepresented by the white bars. (b) Most likely earthquakes at Nımes city for a 1975-year return period. The grey points are the epicenters of the simulated earthquakes thatcontributed to the hazard. They are evenly distributed every 5 km. On each epicenterassociated with a fault, only the characteristic magnitude is simulated. On each epi-center associated with a zone, all magnitudes between 3.9 and the maximum of thezone (5.1) are simulated. The disaggregation map points out the dominating magnitudeon each epicenter with their joint contribution to the hazard represented by the whitebars.
2160 S. Marin, J.-P. Avouac, M. Nicolas, and A. Schlupp
km round the city. It also confirms that the high accelerationvalues are due to the simultaneous contributions of theNımes and Vauvert faults. The most likely earthquakes areevents of magnitude 5.3 on the Nımes fault at 2.5 to 6 kmfrom the city. These events dominate with individual con-tributions of 20.7% and with a cumulated contribution ontheir own of 62% of the whole hazard at the city. The earth-quake of greatest magnitude 5.5 on the Vauvert fault locatedat 12.5 km from the city contributes 19.5% to the hazard.Most likely, earthquakes of the diffuse seismicity zone ofProvence located in a radius of 4 km for magnitudes 4.7 andin a radius of 9 km for magnitudes 5.1, respectively, con-tribute for 3.1% and 1.3% to the hazard. The contribution ofthe diffuse seismicity zone is minor compared with the caseof Paris with a cumulated contribution of only 11.5%. Thecumulated contributions of most likely earthquakes of thesethree sources account for 93% of the whole hazard at Nımescity for a 1975-year return period.
Sensitivity to Variability of Ground Motion
In a second stage, we check the sensitivity of the resultsto the ground-motion model through two different compar-isons: the first one concerns the variability inherent to themodel and the second one the model in itself. The first com-
parison consists in integrating the mean annual rate of oc-currence on the variability of ground motion, and the secondto use the attenuation law proposed by Ambraseys (1995)for Europe. The purpose is to study the importance of theuncertainty parameter compared with the choice of themodel.
To assess the effect of the variability of ground motionon the hazard, the formulation of the mean annual frequencyof exceedance of the acceleration level a (equation 8) canbe integrated over a Gaussian variable e defined as the log-arithmic number of standard deviations by which the loga-rithmic predicted acceleration deviates from the mean:
k(a) � v � I [PGA � a/m,r,e]� source ���source (10)
f (m) f (r) f (e) dm dr deM R e
where fe(e) is the standardized Gaussian density function ofvariable e.
In the computation we allowed a maximum deviationof one standard deviation rlogPGA for the logarithmic pre-dicted PGA (the probability density function is truncated tozero outside), with rlogPGA � 0.3:
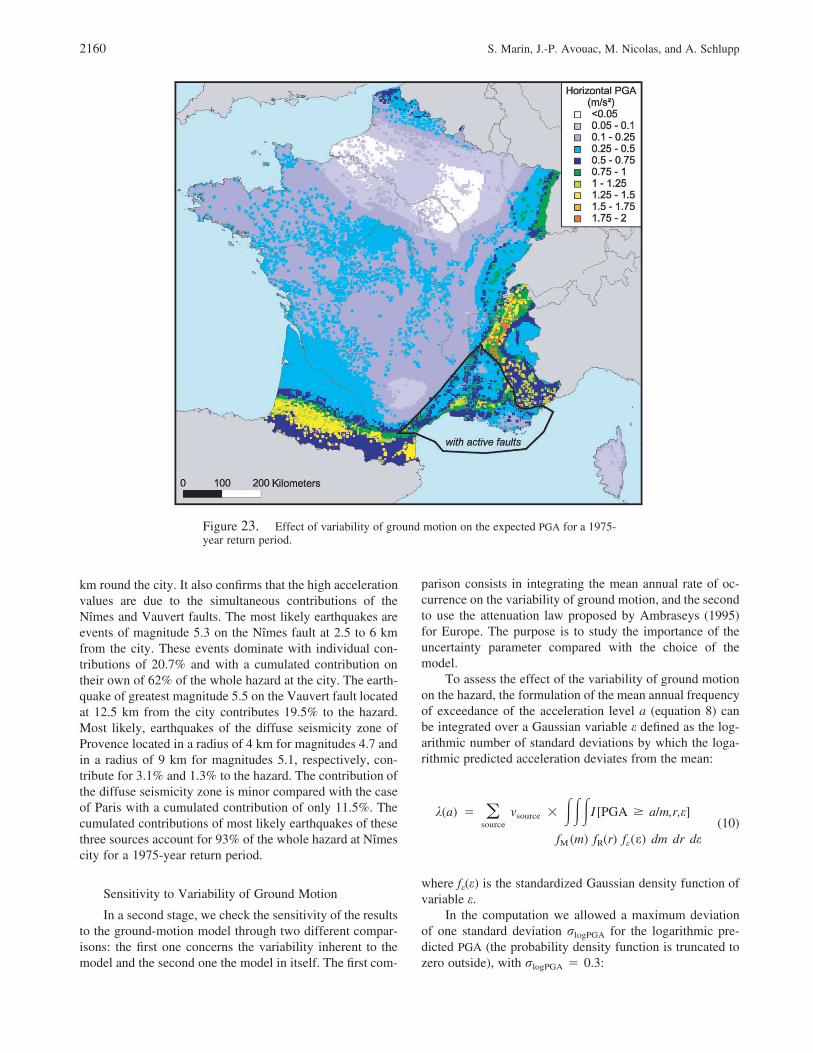
Figure 23. Effect of variability of ground motion on the expected PGA for a 1975-year return period.

A Probabilistic Approach to Seismic Hazard in Metropolitan France 2161
Figure 24. Expected PGA inferred from Ambraseys attenuation law (1995) for a475-year return period.
log PGA � �3.9310
� 0.78M � 1.5 log R � er (11)L 10 logPGA
Variability of ground motion has no significant effecton the hazard map for the 475-year return period that cor-responds to a probability of exceedance of 10% in 50 years.Only the hazard map for the 1975-year return period per-formed with the integration (Fig. 23) displays significant ef-fects compared with the map performed without the integra-tion (Fig. 15). This map corresponds to a probability ofexceedance of 2.5% in 50 years, that is, to the highest ac-celerations. Computation is performed with active faultstaken into account in the seismicity model of the Provence.The map shows local increases of accelerations in the mostseismic zones (the Alps and the Pyrenees) as well as in theless ones (the Aquitaine Basin, the Paris Basin, the Artois-Brabant). A decrease of accelerations can also be noticed forthe higher acceleration values due to faults. Variations areat most of a factor 1.4.
Sensitivity to Attenuation Law
A sensitivity study with regard to the choice of ground-motion model has been performed. For this purpose, we usedthe attenuation law proposed by Ambraseys for Europe
(1995). We mentioned before that local magnitude has to beconverted to surface-wave magnitude. The correspondinghazard map is computed for a 475-year return period (Fig.24), without geological conditions, because Ambraseys lawalready depends on various geological conditions. Withoutgeological conditions in the evaluation of expected accel-erations, the hazard map clearly delineates seismotectoniczonation boundaries. Values are globally higher than thoseobtained with the attenuation law established from Frenchdata (Fig. 13). This result was expected from the comparisonof both attenuation laws (Fig. 3b). Variations are at most ofa factor 8.2. The choice of the attenuation law is an orderabove the influence of ground-motion variability. Assess-ment of an attenuation law adapted to the French context,with respect to local magnitudes, clearly is of main impor-tance in seismic hazard analysis.
Conclusion
This study illustrates how PSHA methodology can beapplied to an area with moderate seismicity. In a recentstudy, Beauval et al. (2002) quantified the influence of theuncertainties inherent to the French seismicity catalogs (es-timation of macroseismic magnitudes, determination of pe-riods of completeness) in PSHA results. They obtained co-
2162 S. Marin, J.-P. Avouac, M. Nicolas, and A. Schlupp
efficients of variation less than 20% and 15% for the seismicparameter estimates (the activity rate and the b-value, re-spectively). As for the final results of hazard assessment, thecoefficient of variation of the PGA varies between 0 and25%. This low variability is certainly due to the Weichertmethod, which is essentially based on low magnitudes forwhich return periods are well constrained and reliable. Nev-ertheless, the present study points to the importance of test-ing internal consistency of the various data sets and laws tobe used in any seismic hazard analysis. In particular, the typeof magnitude used to characterize the seismotectonic modelmust be consistent with that used to predict ground motion.If not, some systematic bias is introduced that may result insystematic errors by a factor possibly up to 10 on PGA de-termination. We also show that the introduction of possiblevery large infrequent events, known only from paleoseismicinvestigations may have a dramatic impact on the hazard,especially when long periods of time and/or low level ofprobability of exceedance are considered. The outcome ofthe study can be expressed by maps showing the amplitudeof ground acceleration that should be expected in Francewith some level of probability over certain periods. Howeverthe sensitivity tests and estimates of uncertainties should notbe ignored because they provide some insight on the mainsource of uncertainty in such an analysis. In addition theyprovide guidelines to prioritize future research to focus onthe major factors that contribute to the uncertainties. Thedetermination of an attenuation law calibrated for local seis-micity appears as a major goal. As far as long return periodsare concerned, the detection of fault associated with thestrongest known earthquakes or with localized active defor-mation also becomes a major goal. Also there is a need forsome physical rationale, applicable in an area with little tec-tonic activity, to help define the seismotectonic model.
Acknowledgments
We wish to thank Jean-Paul Santoire who contributed to the elabo-ration of the attenuation law. We express our gratitude to Anne Replumazfor her collaboration to the research concerning the seismotectonic zona-tion. We also thank Alain Gachon and Bruno Hernandez for their helpfulcontributions to the discussion. We are grateful to Fabian Bonilla for hiscareful review of the manuscript, with many helpful suggestions and con-structive discussions on the different subjects, which considerably im-proved the presentation of our approach. We also wish to thank an anon-ymous reviewer for his useful comments.
References
Albarello, D., A. Berardi, C. Margottini, and M. Mucciarelli (1995). Ma-croseismic estimates of magnitude in Italy, Pure Appl. Geophys. 145,297–312.
Ambraseys, N. N. (1974). The correlation of intensity with ground motions,in Proc. of the 14th Conference of the European Seismological Com-mission, Trieste, Italy, 16–22 September 1974.
Ambraseys, N. N. (1985). Intensity-attenuation and magnitude-intensity re-lationships for western European earthquakes, Earthquake Eng.Struct. Dyn. 13, 733–778.
Ambraseys, N. N. (1995). The prediction of earthquake peak ground ac-celeration in Europe, Earthquake Eng. Struct. Dyn. 24, 467–490.
Association Francaise du Genie Parasismique (1990). RecommandationsAFPS 90 pour la redaction de regles relatives aux ouvrages et in-stallations a realiser dans les regions sujettes aux seismes, Pressesde l’Ecole Nationale des Ponts et Chaussees, Paris, France.
Atkinson, G. M., and E. Sonley (2000). Empirical relationships betweenModified Mercalli Intensity and response spectra, Bull. Seism. Soc.Am. 90, 537–544.
Bard, P. Y., J. L. Durville, J. P. Meneroux, and P. Mouroux (1992). TheFrench experience in seismic zonation, in Recent advances in Earth-quake Engineering and Structural Dynamics, Ouest editions, PressesAcademiques, Nantes, France, 65–88.
Baroux, E. (2000). Tectonique active en region a sismicite moderee: le casde la Provence (France). Apport d’une approche pluridisciplinaire,Ph.D. Thesis, University of Paris XI Orsay, France.
Baroux, E., N. A. Pino, G. Valensise, O. Scotti, and M. E. Cushing (2003).Source parameters of the 11 June 1909, Lambesc (Provence, southernFrance) earthquake: a reappraisal based on macroseismic, seismolog-ical, and geodetic observations, J. Geophys. Res. 108, no.B9, ESE 16,1–23.
Bazzurro, P., and C. A. Cornell (1999). Disaggregation of seismic hazard,Bull. Seism. Soc. Am. 89, 501–520.
Beauval, C., D. Bertil, F. Bonilla, and O. Scotti (2002). Impact of datauncertainties on French PSHA results using synthetic catalogues, inProc. of the 27th General Assembly of the European GeophysicalSociety, Nice, France, 21–26 April 2002.
Boatwright, J., K. Thywissen, and L. C. Seekins (2001). Correlation ofground motion and intensity for the 17 January 1994 Northridge, Cali-fornia, earthquake, Bull. Seism. Soc. Am. 91, 739–752.
Boore, D. M., and B. Joyner (1997). Site amplifications for generic rocksites, Bull. Seism. Soc. Am. 87, 327–341.
Bossu, R., O. Scotti, F. Cotton, M. Cushing, and A. Levret (2000). Deter-mination of geomechanical site effects in France from macroseismicintensities and reliability of macroseismic magnitude of historicalevents, Tectonophysics 324, 81–110.
Bour, M., P Dominique, J. L. Bles, P. Godefroy, C. Martin, and M. Terrier(2000). Zonation of metropolitan France for the application of earth-quake-resistant building regulations to critical facilities, Part 2: Seis-motectonic zonation, J. Seism. 4, 231–245.
Bureau de Recherques Geologiques (1996). Carte geologique de la Francea l’echelle du millionieme, Sixth Ed., Bureau de Recherches Geolo-giques et Minieres, Orleans, France.
Campbell, K. W. (1997). Empirical near-source attenuation relationshipsfor horizontal and vertical components of peak ground acceleration,peak ground velocity, and pseudo-absolute acceleration responsespectra, Seism. Res. Lett. 68, 154–179.
Cara, M., D. Rouland, E. Peterschmitt, and L. Trotignon (1987). Historicalinstruments and seismograms in Strasbourg, Gerlands Beitr. Geophys.96, 374–384.
Combes, P., D. Carbon, M. Cushing, T. Granier, and P. Vaskou (1993).Mise en evidence d’un paleoseisme pleistocene superieur dans la val-lee du Rhone: implications sur les connaissances de la sismicite de laFrance, C. R. Acad. Sci. Ser II 317, 689–696.
Cornell, C. A. (1968). Engineering seismic risk analysis, Bull. Seism. Soc.Am. 58, 1583–1606.
D’Amico, V., and D. Albarello (1999). The problem of regionalization inthe study of magnitude-intensity correspondences in the Mediterra-nean area: a distribution-free approach, Pure Appl. Geophys. 156,651–665.
Di Maro, R., and A. Tertulliani (1990). The relation between intensity andmagnitude for Italian earthquakes, Pure Appl. Geophys. 132, 711–718.
EPAS Working Group Autran, A., J. L. Bles, P. Combes, M. Cushing, P.Dominique, C. Durouchoux, J. C. Gariel, X. Goula, B. Mohamma-dioun, and M. Terrier (1998a). Probabilistic seismic hazard assess-ment in France, Part I: Seismotectonic zonation, in Proc. of the 11th

A Probabilistic Approach to Seismic Hazard in Metropolitan France 2163
European Conference on Earthquake Engineering, Paris, France, 6–11 September 1998.
EPAS Working Group Dominique, P., A. Autran, J. L. Bles, D. Fitzenz, F.Samarcq, M. Terrier, M. Cushing, J. C. Gariel, B. Mohammadioun,P. Combes, C. Durouchoux, and X. Goula (1998b). Part two: Prob-abilistic approach: seismic hazard map on the national territory(France), in Proc. of the 11th European Conference on EarthquakeEngineering, Paris, France, 6–11 September 1998.
Grellet, B., P. Combes, T. Granier, and H. Philip (1993). Sismotectoniquede la France metropolitaine dans son cadre geologique et geophysiqueavec atlas de 23 cartes au 1/4000000 et une carte au 1/1000000, Mem.Soc. Geol. Fr. 164.
Gutenberg, B., and C. F. Richter (1956). Earthquake magnitude, intensity,energy and acceleration, Bull. Seism. Soc. Am. 46, 105–145.
Harmsen, S. C. (1997). Determination of site amplification in the Los An-geles urban area from inversion of strong-motion records, Bull. Seism.Soc. Am. 87, 866–887.
Harmsen, S., and A. Frankel (2001). Geographic deaggregation of seismichazard in the United States, Bull. Seism. Soc. Am. 91, 13–26.
Harmsen, S., D. Perkins, and A. Frankel (1999). Deaggregation of proba-bilistic ground motions in the central and eastern United States, Bull.Seism. Soc. Am. 89, 1–13.
Laboratoire de Detection et de Geophysique (LDG) (1998). Catalogue ofFrench seismicity 1962–1998, CEA/Laboratoire de Detection et deGeophysique, Bruyeres-le-Chatel, France.
Lacassin, R., B. Meyer, L. Benedetti, R. Armijo, and P. Tapponnier (1998).Signature morphologique de l’activite de la faille des Cevennes (Lan-guedoc, France), C. R. Acad. Sci. Ser. II 326, 807–815.
Levret, A., J. C. Backe, and M. Cushing (1994). Atlas of macroseismicmaps of French earthquakes with their principal characteristics, Nat.Hazards 10, 19–46.
Levret, A., M. Cushing, and G. Peyridieu (1996). Recherche des Carac-teristiques de Seismes Historiques en France, Atlas de 140 CartesMacrosismiques, Publications de l’IPSN, Fontenay-aux-Roses,France.
Massinon, B., and J. Vogt (1985). Sismicite historique et sismicite instru-mentale, in Genie Parasismique, V. Davidovici (Editor), Presses del’Ecole Nationale des Ponts et Chaussees, Paris, France, 179–186.
Murphy, J. R., and L. J. O’Brien (1977). The correlation of peak groundacceleration amplitude with seismic intensity and other physical pa-rameters, Bull. Seism. Soc. Am. 67, 877–915.
Nicolas, M., N. Bethoux, and B. Madeddu (1998). Instrumental seismicityof the Western Alps: a revised catalogue, Pure Appl. Geophys. 152,707–731.
Park, S., and S. Elrick (1988). Prediction of shear wave velocities in south-ern California using surface geology, Bull. Seism. Soc. Am. 88, 677–685.
Peterson, M., W. Bryant, C. Cramer, M. Reichle, and C. Real (1997). Seis-mic ground motion hazard mapping incorporating site effects for LosAngeles, Orange, and Ventura counties, California: a geographicalinformation system application, Bull. Seism. Soc. Am. 87, 249–255.
Schlupp, A., G. Clauzon, and J. P. Avouac (2001). Mouvement post-messinien sur la faille de Nımes: implications pour la sismotectoniquede la Provence, Bull. Soc. Geol. Fr. 172, 697–711.
Schwartz, D. P., and K. J. Coppersmith (1984). Fault behavior and char-acteristic earthquakes: examples from the Wasatch and San Andreasfault zones, J. Geophys. Res. 89, 5681–5698.
Scotti, O., A. Levret, and B. Hernandez (1999). Verification of macro-seismic methods on five ML �5 instrumental earthquakes in France,Phys. Chem. Earth A 24, 495–499.
SIRENE (1996). Base de la Macrosismicite Francaise, Commissariat al’Energie Atomique/Institut de Protection et de Surete Nucleaire-Bureau de Recherches Geologiques et Minieres-Electricite de France.
Smit, P. M. (1998). Strong motion attenuation model for central Europe, inProc. of the 11th European Conference on Earthquake Engineering,Paris, France, 6–11 September 1998.
Steidl, J. H. (2000). Site response in Southern California for probabilisticseismic hazard analysis, Bull. Seism. Soc. Am. 90, no. 6B, S149–S169.
Terrier, M., J. L. Bles, P. Godefroy, P. Dominique, M. Bour, and C. Martin(2000). Zonation of metropolitan France for the application of earth-quake-resistant building regulations to critical facilities. Part 1: Seis-mic zonation, J. Seism. 4, 215–230.
Theodulidis, N. P., and B. C. Papazachos (1992). Dependence of strongmotion on magnitude- distance, site geology and macroseismic inten-sity for shallow earthquakes in Greece. I: peak horizontal acceleration,velocity and displacement, Soil Dyn. Earthquake Eng. 11, 387–402.
Tinti, S., T. Vittori, and F. Mulargia (1986). Regional intensity-magnituderelationships for the Italian territory, Tectonophysics 127, 129–154.
Wald, L. A., and J. Mori (2000). Evaluation of methods for estimating linearsite-response amplifications in the Los Angeles basin, Bull. Seism.Soc. Am. 90, no. 6B, S32–S42.
Wald, D. J., V. Quitoriano, T. H. Heaton, and H. Kanamori (1999a). Re-lationships between peak ground acceleration, peak ground velocity,and Modified Mercalli Intensity in California, Earthquake Spectra 15,557–564.
Wald, D. J., V. Quitoriano, T. H. Heaton, H. Kanamori, C. W. Scrivner,and C. B. Worden (1999b). Trinet “ShakeMaps”: rapid generation ofpeak ground motion and intensity maps for earthquakes in southernCalifornia, Earthquake Spectra 15, 537–555.
Weichert, D. H. (1980). Estimation of the earthquake recurrence parametersfor unequal observation periods for different magnitudes, Bull. Seism.Soc. Am. 70, 1337–1346.
Wells, D. L., and K. J. Coppersmith (1994). New empirical relationshipsamong magnitude, rupture length, rupture width, rupture area andsurface displacement, Bull. Seism. Soc. Am. 84, 974–1002.
Wills, C. J., M. Petersen, W. A. Bryant, M. Reichle, G. J. Saucedo, S. Tan,G. Taylor, and J. Treiman (2000). A site-conditions map for Californiabased on geology and shear-wave velocity, Bull. Seism. Soc. Am.90, no. 6B, S187–S208.
Yeats, R. S., K. E. Sieh, and C. R. Allen (1997). The Geology of Earth-quakes, Oxford University Press, New York.
Appendix
The local magnitude ML(LDG) is calculated from re-cords obtained by the LDG network and based on the max-imum amplitude of the S/Lg-waves on the vertical compo-nent. For each record,
M (LDG) � log A/T � B (D) � C (12)L
where A is the maximum amplitude of the S/Lg wave, T isthe corresponding period, B(D) is the corrective regional pa-rameter of attenuation at the distance D, and C is the stationcoefficient. The C coefficient is used to match the ML withan international reference, which is the mb of ISC for theML of LDG (Massinon and Vogt, 1985). The ML(LDG) isfinally obtained as the mean of all individual magnitudescalculated with this method. The LDG network is composedof about 40 stations since 1994. As the calculation of thelocal magnitude remains the same since the beginning of theinstrumental period in 1962, the national catalog is completeand homogeneous.
Laboratoire de Detection et de GeophysiqueCEA/DAM Ile de FranceBP 12, 91680 Bruyeres-le-Chatel, France
Manuscript received 30 October 2003.