h1/q2 2015 results and update on strategic progress
TRANSCRIPT
H1/Q2 2015 results and update
on strategic progress30 July 2015

Philip HamptonChairman

Ross McEwanChief Executive Officer

Today’s presentation
The strategy is working – good progress against 2015 targets
We are going further, faster on delivering our Plan
Capital ratio is up
Adjusted costs(1) are down
Returns in the Go-Forward Bank(2) are up
Restructuring continues at pace
Continue to make the bank simpler and easier to do business with
Businesses categorised into three areas
Invest to grow: UK PBB and Commercial
Reposition for returns and growth: Ulster Bank, CIB Go-Forward, UK Private Banking
Dispose or run-off: Citizens, CIB Capital Resolution, RCR, Williams & Glyn, International Private Banking
Our focus on customer service, trust and advocacy is starting to deliver results
1(1) Excluding restructuring, litigation and conduct costs. (2) See slide 15 pro-forma Go-Forward and Exit Bank profiles.
3
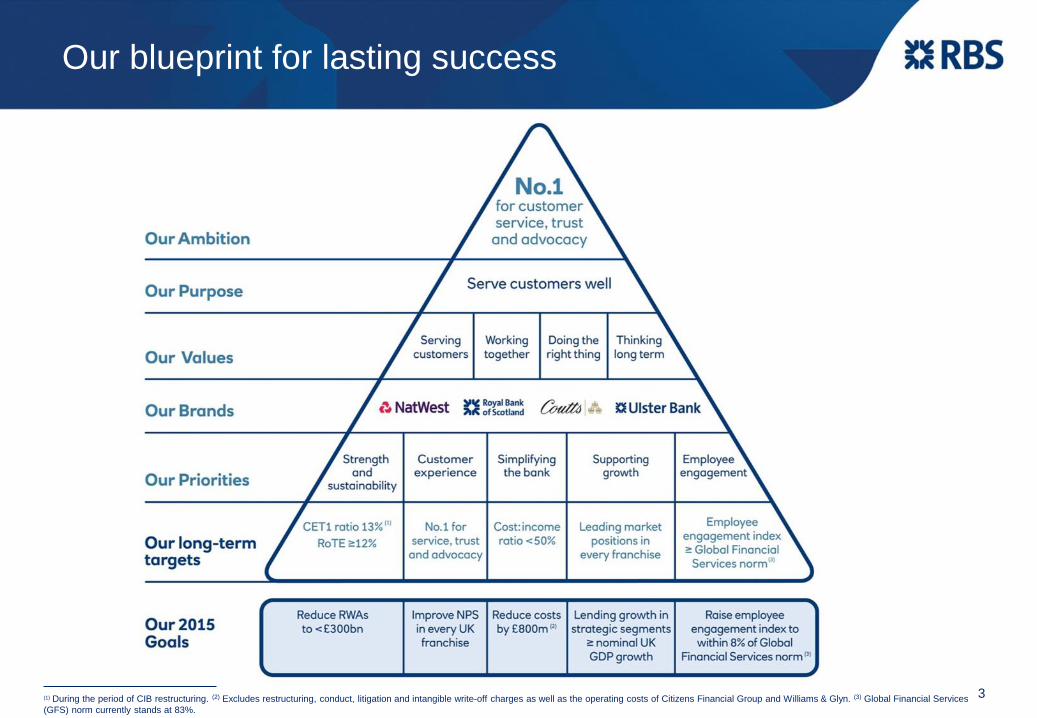
Our blueprint for lasting success
(1) During the period of CIB restructuring. (2) Excludes restructuring, conduct, litigation and intangible write-off charges as well as the operating costs of Citizens Financial Group and Williams & Glyn. (3) Global Financial Services
(GFS) norm currently stands at 83%.

Good progress against 2015 goals
Priorities 2015 Goals H1 Progress
Strength & sustainability
RWAs reduced to below £300bn
RCR exit substantially complete
Citizens exit
AT1 issuance (£2bn)
£326bn
Funded assets down 78% since
initial pool of assets identified(1)
Further sell-down priced in late July 2015(2)
AT1 issuance to be launched shortly(3)
Customer experience
Simplifying the bank
Supporting growth
Employee engagement
Improvements in NatWest Personal.
NatWest Business, RBS Business(4) Ulster
Bank Personal (Northern Ireland)(5)
Over £700m annualised cost savings
achieved in H1
2% annualised growth in UK PBB and
Commercial Banking
Progress report in Q4 2015
Lending growth in strategic segments
in line with nominal UK GDP growth
Raise employee engagement index
to within 8% of Global Financial
Services norm
Net Promoter Score (NPS)
improvement in every UK customer
franchise
Cost reduction of £800m(6)
4
(1) Funded assets are down 71% since 1 Jan 2014. (2) Following the Offering and the directed buy back, RBSG will continue to hold up to 23.4% of CFG’s shares of common stock (20.9% assuming exercise of the entire over-
allotment option).(3)Issuance subject to market conditions. (4) Further details in slide 33 (5) Source: Internal research – Coyne Research June 15 based on 4 quarter roll with latest base size 365. (6) Excludes restructuring,
conduct, litigation and intangible write-off charges as well as the operating costs of Citizens Financial Group and Williams & Glyn.

Click to edit Master title style
7
Total Number of Properties(1)
(1) Whole bank including branches and head office properties. Williams & Glyn included up to end 2015. (2) Excludes CIB and GTS. Notes: The objectives set on this slide are forward looking statements - See the last page
of this presentation.
2,9002,500
2,100
1,500
2013 2015 2016
-14% -16%
H1
2015
2014
Number of Programmes
150
182
550-67%
2013 2014 2015
Number of registered companies
849X
1050-14%
H1 2014 2014 H1 2015
We are becoming simpler
5
984
-6%
Number of products(2)
Front Book Back Book
295
2014 H1
2015
266
End
2015
144
2014 End
2015
200
146
112
-32% -22%
-18%
6
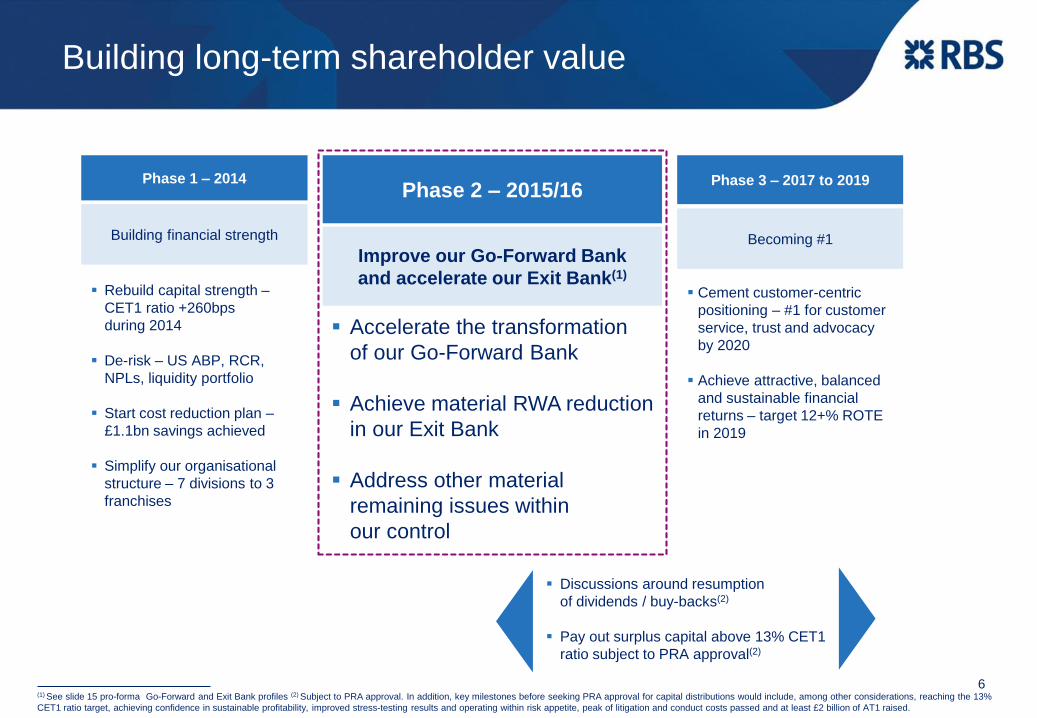
Building long-term shareholder value
Phase 1 – 2014Phase 2 – 2015/16
Phase 3 – 2017 to 2019
Building financial strength Becoming #1
Improve our Go-Forward Bank
and accelerate our Exit Bank(1)
Rebuild capital strength –
CET1 ratio +260bps
during 2014
De-risk – US ABP, RCR,
NPLs, liquidity portfolio
Start cost reduction plan –
£1.1bn savings achieved
Simplify our organisational
structure – 7 divisions to 3
franchises
Cement customer-centric
positioning – #1 for customer
service, trust and advocacy
by 2020
Achieve attractive, balanced
and sustainable financial
returns – target 12+% ROTE
in 2019
Accelerate the transformation
of our Go-Forward Bank
Achieve material RWA reduction
in our Exit Bank
Address other material
remaining issues within
our control
Discussions around resumption
of dividends / buy-backs(2)
Pay out surplus capital above 13% CET1
ratio subject to PRA approval(2)
(1) See slide 15 pro-forma Go-Forward and Exit Bank profiles (2) Subject to PRA approval. In addition, key milestones before seeking PRA approval for capital distributions would include, among other considerations, reaching the 13%
CET1 ratio target, achieving confidence in sustainable profitability, improved stress-testing results and operating within risk appetite, peak of litigation and conduct costs passed and at least £2 billion of AT1 raised.

Improving the Go-Forward Bank
Delivering for our customers in Phase 2
Priorities H1 2015 highlights
Strength &
Sustainability
Only bank/building society to have the ‘fairbanking’ 5* mark on instant access adult savings range
Investing over £600m in 2015 on IT, business resilience and regulatory related programmes
Continued focus on culture and leadership
Customer
experience
Innovation: Apple Pay, TouchID and RNIB approved cards
3% Cashback Reward account launched
NatWest mobile banking app customer Net Promoter Score improved to joint #1 in the market(1)
Customers using the mobile banking app increased 12% to 3.3 million
Simplifying
the bank
Average personal current account opening time halved to 30 minutes
Commercial Bank reduced account opening time by 25%
Rationalisation of our front and back-book product sets by up to 50%
Supporting
growth
Increased number of mortgage advisors by 28% from H1 2014
Launched £2.5 million Skills & Opportunities fund
Opening eight entrepreneurial hubs. Birmingham, Bristol and Leeds opened, with more in plan
Employee
engagement
Set target of 30% female leaders in every business by 2020
Rollout of bank-wide training to 7,500 leaders across the bank
7(1) Source: Internal NPS Drivers study, June 15 based on 3 month rolling average with latest base size NatWest (2234) Question: ‘Based on your recent experience how likely are you to recommend their online services to a
relative, friend or colleague in the next 12 months?’
8
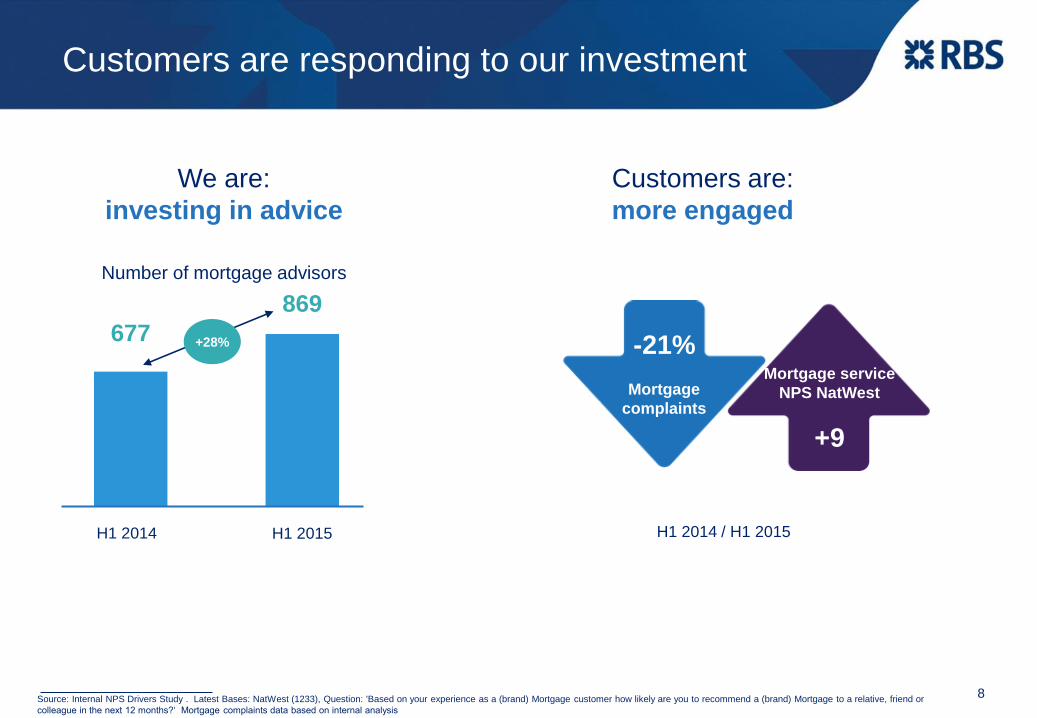
Customers are responding to our investment
Customers are:
more engaged
677
869
+28%
We are:
investing in advice
Number of mortgage advisors
H1 2014 H1 2015 H1 2014 / H1 2015
Source: Internal NPS Drivers Study . Latest Bases: NatWest (1233), Question: 'Based on your experience as a (brand) Mortgage customer how likely are you to recommend a (brand) Mortgage to a relative, friend or
colleague in the next 12 months?‘ Mortgage complaints data based on internal analysis
Mortgage service
NPS NatWest
+9
-21%
Mortgage
complaints
+43%
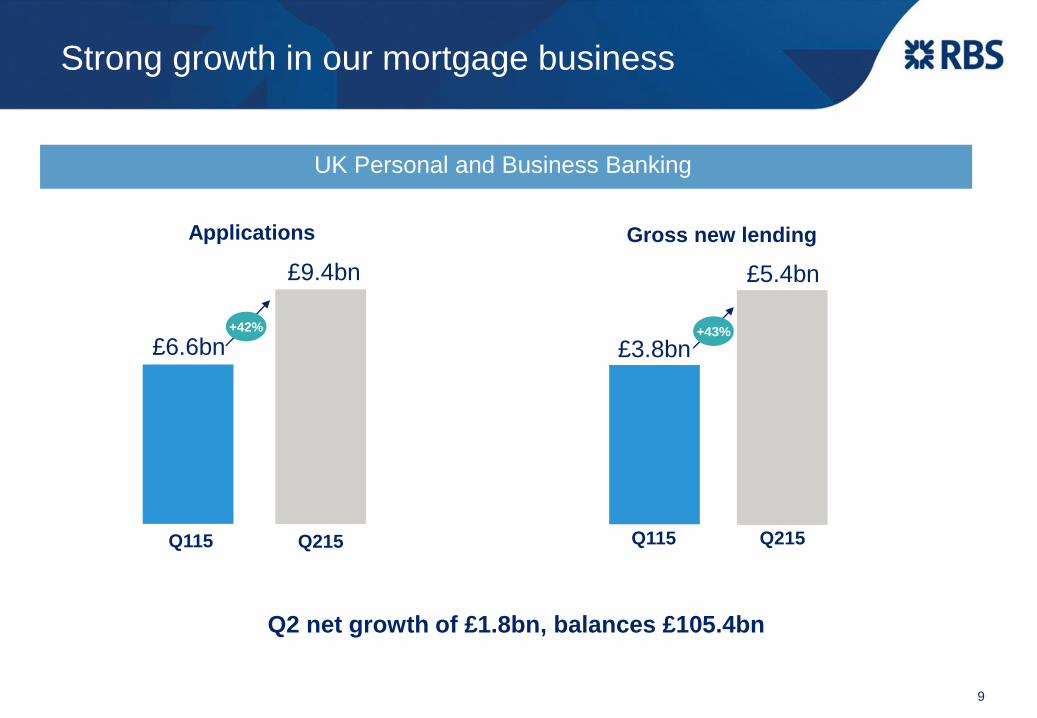
9
Q2 net growth of £1.8bn, balances £105.4bn
UK Personal and Business Banking
Q115 Q215
Applications Gross new lending
Q115 Q215
+42%
£6.6bn
£5.4bn
Strong growth in our mortgage business
£9.4bn
£3.8bn
10
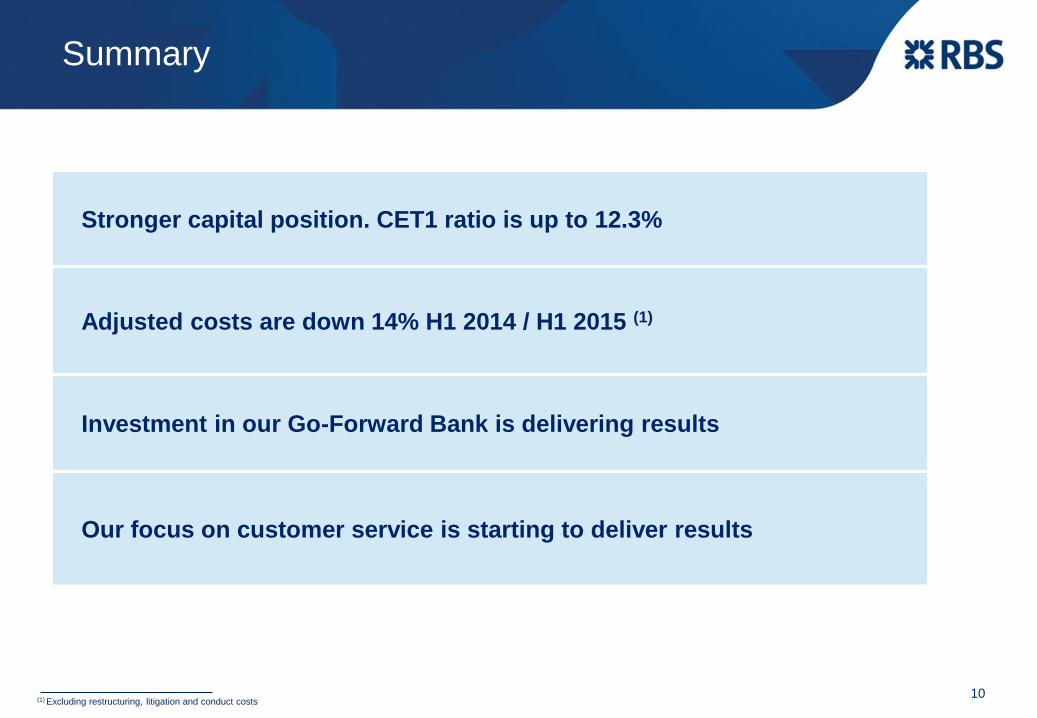
Summary
Stronger capital position. CET1 ratio is up to 12.3%
Adjusted costs are down 14% H1 2014 / H1 2015 (1)
Investment in our Go-Forward Bank is delivering results
Our focus on customer service is starting to deliver results
(1) Excluding restructuring, litigation and conduct costs
Ewen StevensonChief Financial Officer
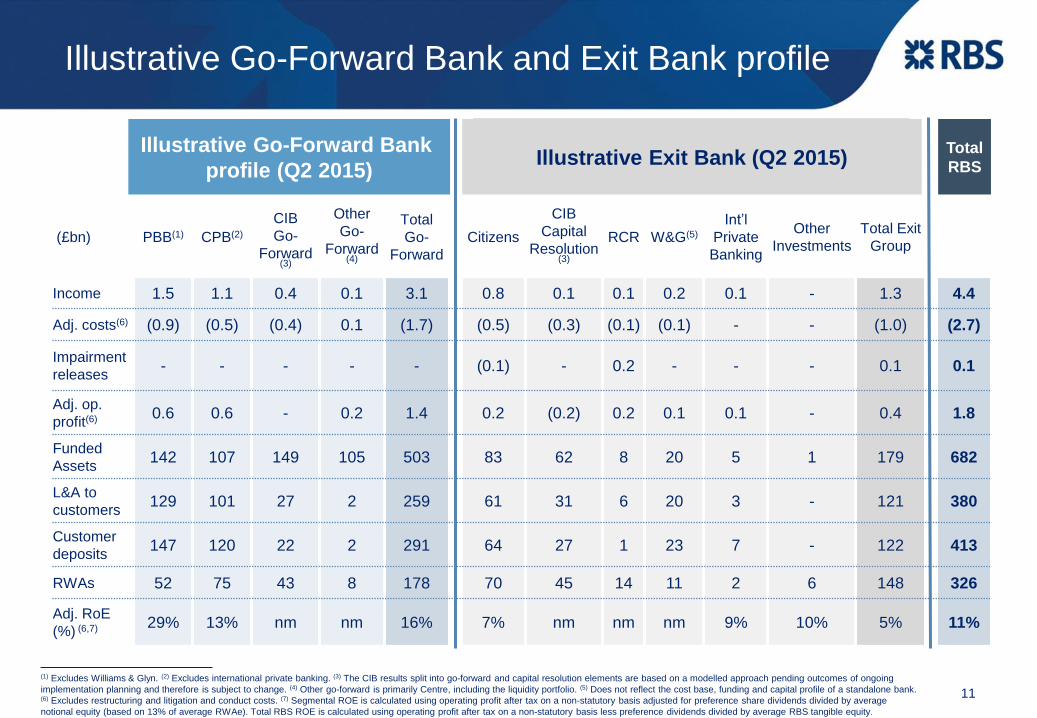
(£bn) PBB(1) CPB(2)
CIB
Go-
Forward (3)
Other
Go-
Forward (4)
Total
Go-
Forward
Citizens
CIB
Capital
Resolution(3)
RCR W&G(5)
Int’l
Private
Banking
Other
Investments
Total Exit
Group
Income 1.5 1.1 0.4 0.1 3.1 0.8 0.1 0.1 0.2 0.1 - 1.3 4.4
Adj. costs(6) (0.9) (0.5) (0.4) 0.1 (1.7) (0.5) (0.3) (0.1) (0.1) - - (1.0) (2.7)
Impairment
releases- - - - - (0.1) - 0.2 - - - 0.1 0.1
Adj. op.
profit(6) 0.6 0.6 - 0.2 1.4 0.2 (0.2) 0.2 0.1 0.1 - 0.4 1.8
Funded
Assets142 107 149 105 503 83 62 8 20 5 1 179 682
L&A to
customers129 101 27 2 259 61 31 6 20 3 - 121 380
Customer
deposits147 120 22 2 291 64 27 1 23 7 - 122 413
RWAs 52 75 43 8 178 70 45 14 11 2 6 148 326
Adj. RoE
(%) (6,7) 29% 13% nm nm 16% 7% nm nm nm 9% 10% 5% 11%
Illustrative Go-Forward Bank
profile (Q2 2015)Exit group overview (pro-forma 2014)
(1) Excludes Williams & Glyn. (2) Excludes international private banking. (3) The CIB results split into go-forward and capital resolution elements are based on a modelled approach pending outcomes of ongoing
implementation planning and therefore is subject to change. (4) Other go-forward is primarily Centre, including the liquidity portfolio. (5) Does not reflect the cost base, funding and capital profile of a standalone bank. (6) Excludes restructuring and litigation and conduct costs. (7) Segmental ROE is calculated using operating profit after tax on a non-statutory basis adjusted for preference share dividends divided by average
notional equity (based on 13% of average RWAe). Total RBS ROE is calculated using operating profit after tax on a non-statutory basis less preference dividends divided by average RBS tangible equity.
Total
RBSIllustrative Exit Bank (Q2 2015)
Illustrative Go-Forward Bank and Exit Bank profile
11
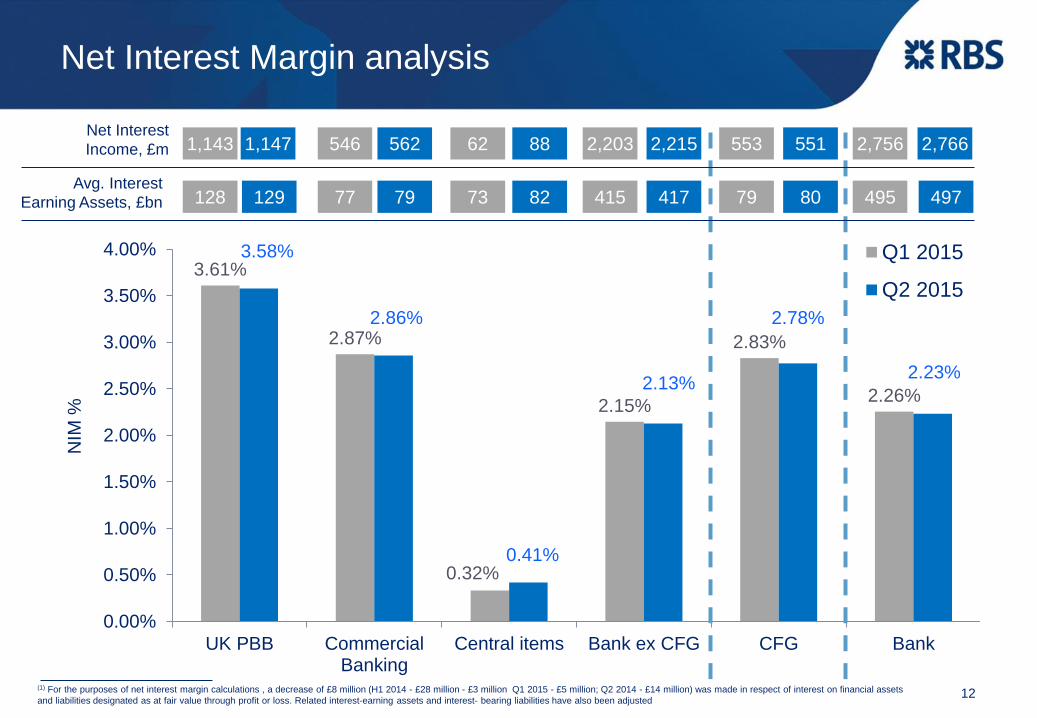
Net Interest Margin analysis
3.61%
2.87%
0.32%
2.15%
2.83%
2.26%
3.58%
2.86%
0.41%
2.13%
2.78%
2.23%
0.00%
0.50%
1.00%
1.50%
2.00%
2.50%
3.00%
3.50%
4.00%
UK PBB CommercialBanking
Central items Bank ex CFG CFG Bank
NIM
%
Q1 2015
Q2 2015
Net Interest
Income, £m
Avg. Interest
Earning Assets, £bn
1,143 1,147 546 562 2,203 2,215 553 55162 88 2,756 2,766
128 129 77 79 415 417 79 8073 82 495 497
12(1) For the purposes of net interest margin calculations , a decrease of £8 million (H1 2014 - £28 million - £3 million Q1 2015 - £5 million; Q2 2014 - £14 million) was made in respect of interest on financial assets
and liabilities designated as at fair value through profit or loss. Related interest-earning assets and interest- bearing liabilities have also been adjusted
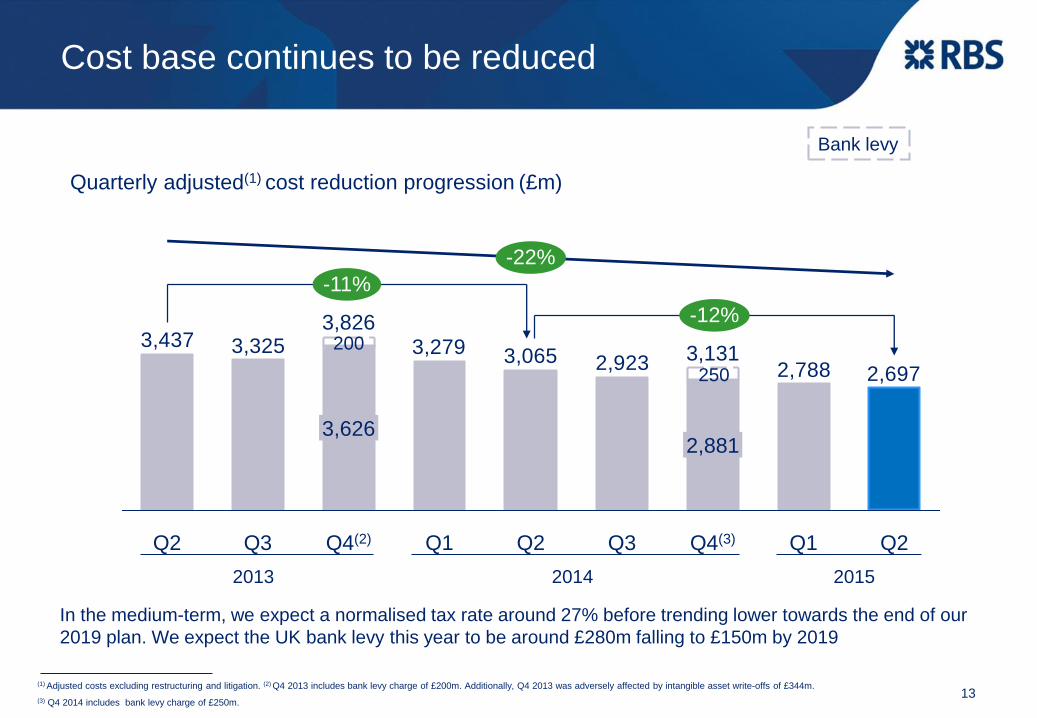
Cost base continues to be reduced
Quarterly adjusted(1) cost reduction progression (£m)
2,6972,7882,9233,0653,2793,3253,437
-11%
-22%
-12%
Q2
2,881
3,131
Q2 Q2Q4(2) Q1 Q3Q3 Q4(3) Q1
3,826
3,626
2013 2014 2015
(1) Adjusted costs excluding restructuring and litigation. (2) Q4 2013 includes bank levy charge of £200m. Additionally, Q4 2013 was adversely affected by intangible asset write-offs of £344m.
(3) Q4 2014 includes bank levy charge of £250m.13
200
250
Bank levy
In the medium-term, we expect a normalised tax rate around 27% before trending lower towards the end of our
2019 plan. We expect the UK bank levy this year to be around £280m falling to £150m by 2019
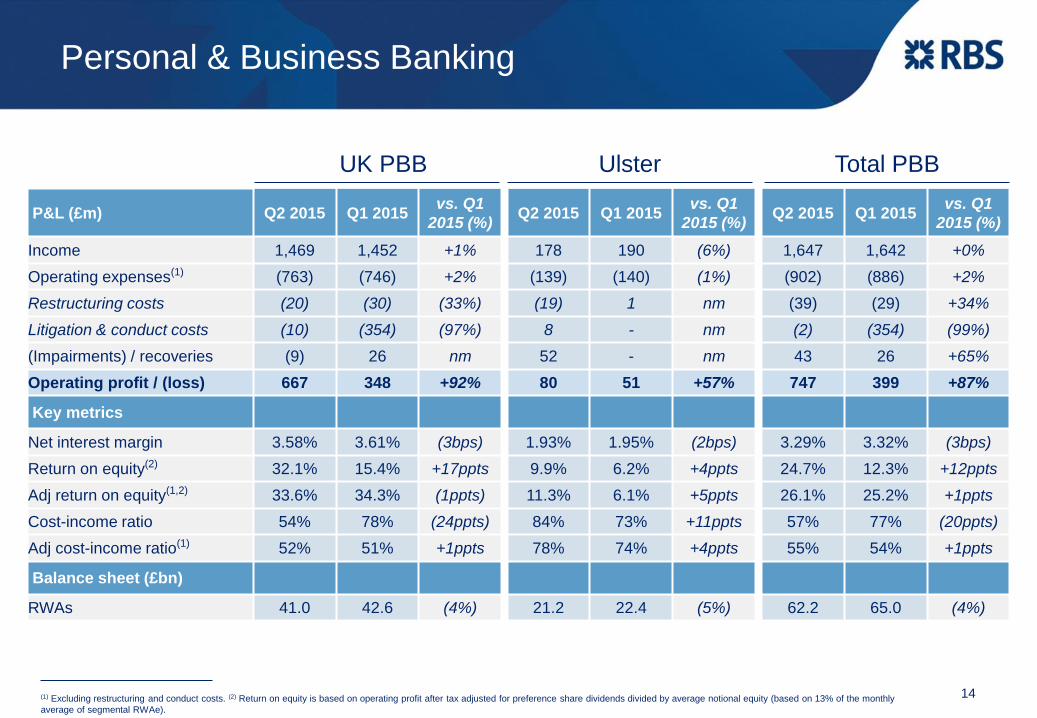
Personal & Business Banking
UK PBB Ulster Total PBB
14
P&L (£m) Q2 2015 Q1 2015vs. Q1
2015 (%)Q2 2015 Q1 2015
vs. Q1
2015 (%)Q2 2015 Q1 2015
vs. Q1
2015 (%)
Income 1,469 1,452 +1% 178 190 (6%) 1,647 1,642 +0%
Operating expenses(1) (763) (746) +2% (139) (140) (1%) (902) (886) +2%
Restructuring costs (20) (30) (33%) (19) 1 nm (39) (29) +34%
Litigation & conduct costs (10) (354) (97%) 8 - nm (2) (354) (99%)
(Impairments) / recoveries (9) 26 nm 52 - nm 43 26 +65%
Operating profit / (loss) 667 348 +92% 80 51 +57% 747 399 +87%
Key metrics
Net interest margin 3.58% 3.61% (3bps) 1.93% 1.95% (2bps) 3.29% 3.32% (3bps)
Return on equity(2) 32.1% 15.4% +17ppts 9.9% 6.2% +4ppts 24.7% 12.3% +12ppts
Adj return on equity(1,2) 33.6% 34.3% (1ppts) 11.3% 6.1% +5ppts 26.1% 25.2% +1ppts
Cost-income ratio 54% 78% (24ppts) 84% 73% +11ppts 57% 77% (20ppts)
Adj cost-income ratio(1) 52% 51% +1ppts 78% 74% +4ppts 55% 54% +1ppts
Balance sheet (£bn)
RWAs 41.0 42.6 (4%) 21.2 22.4 (5%) 62.2 65.0 (4%)
(1) Excluding restructuring and conduct costs. (2) Return on equity is based on operating profit after tax adjusted for preference share dividends divided by average notional equity (based on 13% of the monthly
average of segmental RWAe).
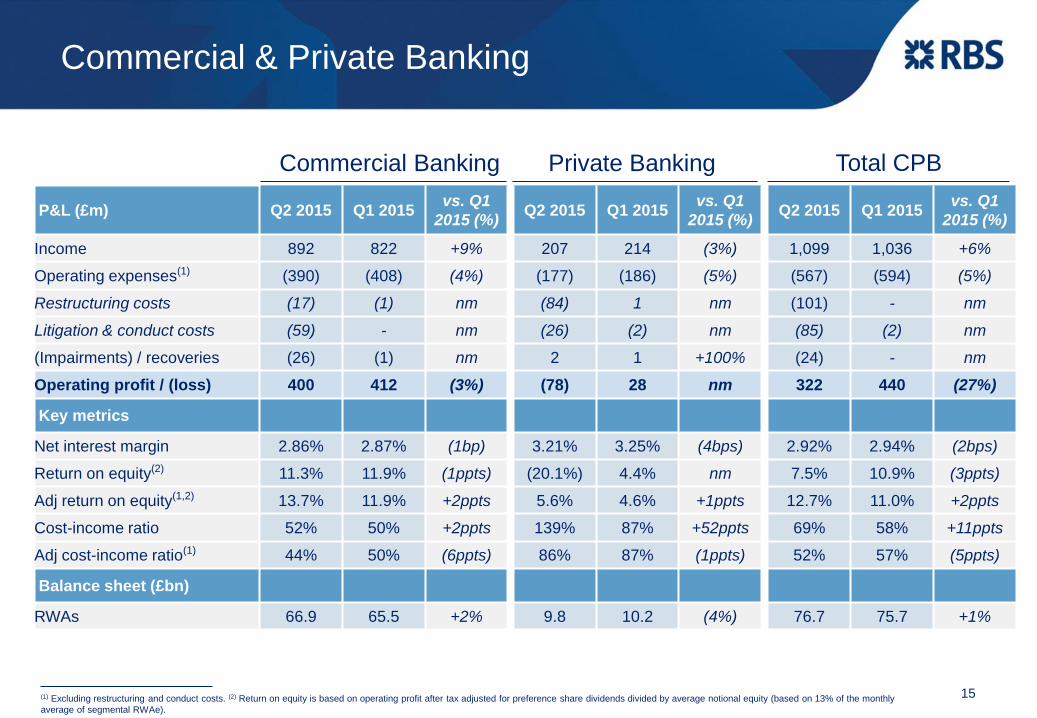
Commercial & Private Banking
Commercial Banking Private Banking Total CPB
15(1) Excluding restructuring and conduct costs. (2) Return on equity is based on operating profit after tax adjusted for preference share dividends divided by average notional equity (based on 13% of the monthly
average of segmental RWAe).
P&L (£m) Q2 2015 Q1 2015vs. Q1
2015 (%)Q2 2015 Q1 2015
vs. Q1
2015 (%)Q2 2015 Q1 2015
vs. Q1
2015 (%)
Income 892 822 +9% 207 214 (3%) 1,099 1,036 +6%
Operating expenses(1) (390) (408) (4%) (177) (186) (5%) (567) (594) (5%)
Restructuring costs (17) (1) nm (84) 1 nm (101) - nm
Litigation & conduct costs (59) - nm (26) (2) nm (85) (2) nm
(Impairments) / recoveries (26) (1) nm 2 1 +100% (24) - nm
Operating profit / (loss) 400 412 (3%) (78) 28 nm 322 440 (27%)
Key metrics
Net interest margin 2.86% 2.87% (1bp) 3.21% 3.25% (4bps) 2.92% 2.94% (2bps)
Return on equity(2) 11.3% 11.9% (1ppts) (20.1%) 4.4% nm 7.5% 10.9% (3ppts)
Adj return on equity(1,2) 13.7% 11.9% +2ppts 5.6% 4.6% +1ppts 12.7% 11.0% +2ppts
Cost-income ratio 52% 50% +2ppts 139% 87% +52ppts 69% 58% +11ppts
Adj cost-income ratio(1) 44% 50% (6ppts) 86% 87% (1ppts) 52% 57% (5ppts)
Balance sheet (£bn)
RWAs 66.9 65.5 +2% 9.8 10.2 (4%) 76.7 75.7 +1%
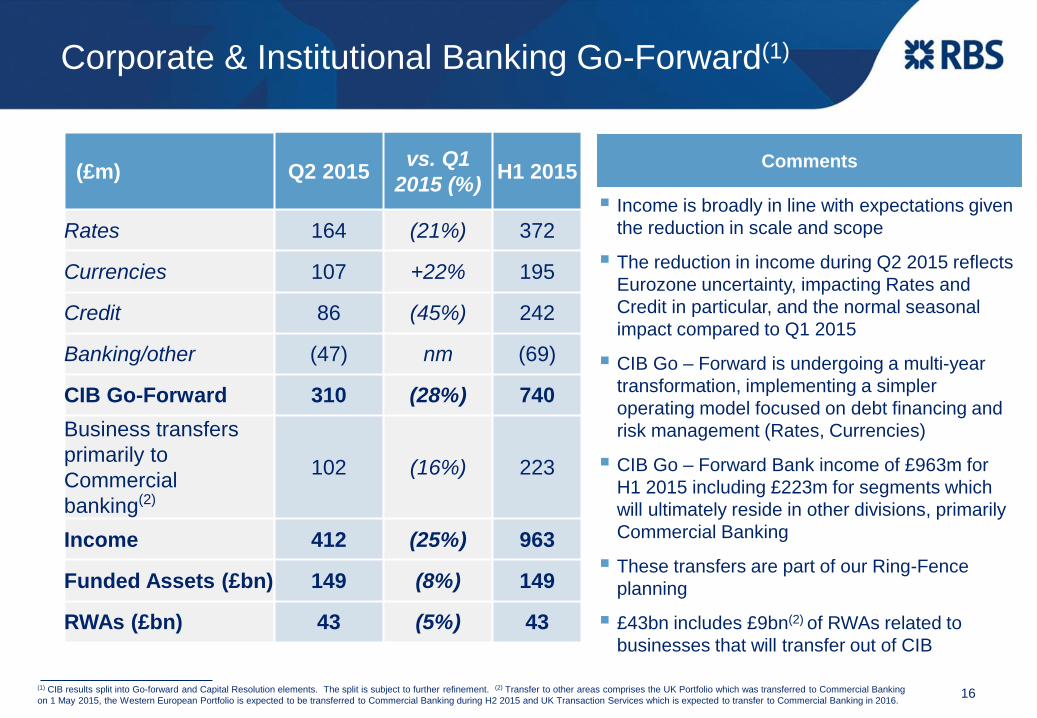
Corporate & Institutional Banking Go-Forward(1)
16
(£m) Q2 2015vs. Q1
2015 (%)H1 2015
Rates 164 (21%) 372
Currencies 107 +22% 195
Credit 86 (45%) 242
Banking/other (47) nm (69)
CIB Go-Forward 310 (28%) 740
Business transfers
primarily to
Commercial
banking(2)
102 (16%) 223
Income 412 (25%) 963
Funded Assets (£bn) 149 (8%) 149
RWAs (£bn) 43 (5%) 43
Income is broadly in line with expectations given
the reduction in scale and scope
The reduction in income during Q2 2015 reflects
Eurozone uncertainty, impacting Rates and
Credit in particular, and the normal seasonal
impact compared to Q1 2015
CIB Go – Forward is undergoing a multi-year
transformation, implementing a simpler
operating model focused on debt financing and
risk management (Rates, Currencies)
CIB Go – Forward Bank income of £963m for
H1 2015 including £223m for segments which
will ultimately reside in other divisions, primarily
Commercial Banking
These transfers are part of our Ring-Fence
planning
£43bn includes £9bn(2) of RWAs related to
businesses that will transfer out of CIB
Comments
(1) CIB results split into Go-forward and Capital Resolution elements. The split is subject to further refinement. (2) Transfer to other areas comprises the UK Portfolio which was transferred to Commercial Banking
on 1 May 2015, the Western European Portfolio is expected to be transferred to Commercial Banking during H2 2015 and UK Transaction Services which is expected to transfer to Commercial Banking in 2016.

Exit Bank
Targeting material reduction by Q4 2016
2015 2016
Citizens
Further sell-down priced in late
July 2015(1)
Targeting full exit by year end
CIB Capital
Resolution
≥£25bn target RWA reduction
for CIB(2) Further material RWA reduction
RCR Wind-down to ≤ 15% of initial
funded assets (£5.7bn)
Stub merged into CIB Capital
Resolution
Williams &
Glyn
Targeting IPO by year end
2016
International
Private
Banking
Sale announced Q1 2015
Partial completion in Q4 2015 Full exit during H1 2016
17
-
-
(1) Following the Offering and the directed buy back, RBSG will continue to hold up to 23.4% of CFG’s shares of common stock (20.9% assuming exercise of the entire over-allotment option). (2) CIB Division not
just Exit Group
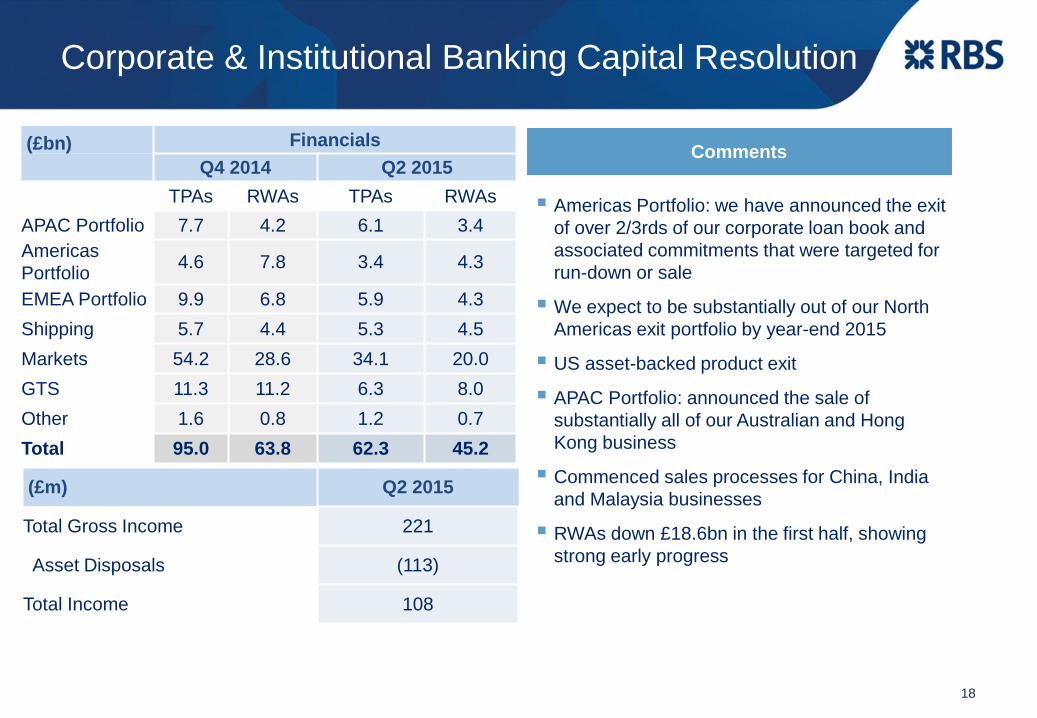
Corporate & Institutional Banking Capital Resolution
Americas Portfolio: we have announced the exit
of over 2/3rds of our corporate loan book and
associated commitments that were targeted for
run-down or sale
We expect to be substantially out of our North
Americas exit portfolio by year-end 2015
US asset-backed product exit
APAC Portfolio: announced the sale of
substantially all of our Australian and Hong
Kong business
Commenced sales processes for China, India
and Malaysia businesses
RWAs down £18.6bn in the first half, showing
strong early progress
18
Comments(£bn) Financials
Q4 2014 Q2 2015
TPAs RWAs TPAs RWAs
APAC Portfolio 7.7 4.2 6.1 3.4
Americas
Portfolio4.6 7.8 3.4 4.3
EMEA Portfolio 9.9 6.8 5.9 4.3
Shipping 5.7 4.4 5.3 4.5
Markets 54.2 28.6 34.1 20.0
GTS 11.3 11.2 6.3 8.0
Other 1.6 0.8 1.2 0.7
Total 95.0 63.8 62.3 45.2
(£m) Q2 2015
Total Gross Income 221
Asset Disposals (113)
Total Income 108

Other issues we need to address
Conduct and litigation(1) Capital resilienceRegulatory / accounting
developments
Dealing with legacy issues
Strengthening capital and
reducing balance sheet stress
volatility
Readying the bank for future
developments
Including:
US RMBS litigation,
Governmental and regulatory
investigations
On-going FX investigations
2008 capital raising class
action suit
Various UK customer redress
issues
On-going FCA investigation
into GRG Tomlinson report
Intent to launch inaugural
AT1 securities shortly subject
to market conditions
Managing for value the
existing T1 / T2 capital
stack(2)
Making final Dividend Access
Share payment (£1.18bn)
Managing defined benefit
pension deficit
Improving stress test results
Resuming dividends /
buybacks(3)
Preparing for ring-fencing
Enhancing the resolvability of
the Bank
Preparing for the introduction
of IFRS 9
19
(1) Please refer to risk factors and other uncertainties discussed in RBS’s 2014 annual report filed on Form-20F and the summary risk factors in RBS’s Interim Results. Please also refer to the litigation, investigations
and reviews section in RBS’s 2014 annual report filed on Form-20F and in the Notes to RBS’s 2015 Interim Results. (2) Subject to any regulatory approval . (3) Subject to PRA approval. In addition, key milestones
before seeking PRA approval for capital distributions would include, among other considerations, reaching the 13% CET1 ratio target, achieving confidence in sustainable profitability, improved stress-testing results
and operating within risk appetite, peak of litigation and conduct costs passed and at least £2 billion of AT1 raised.
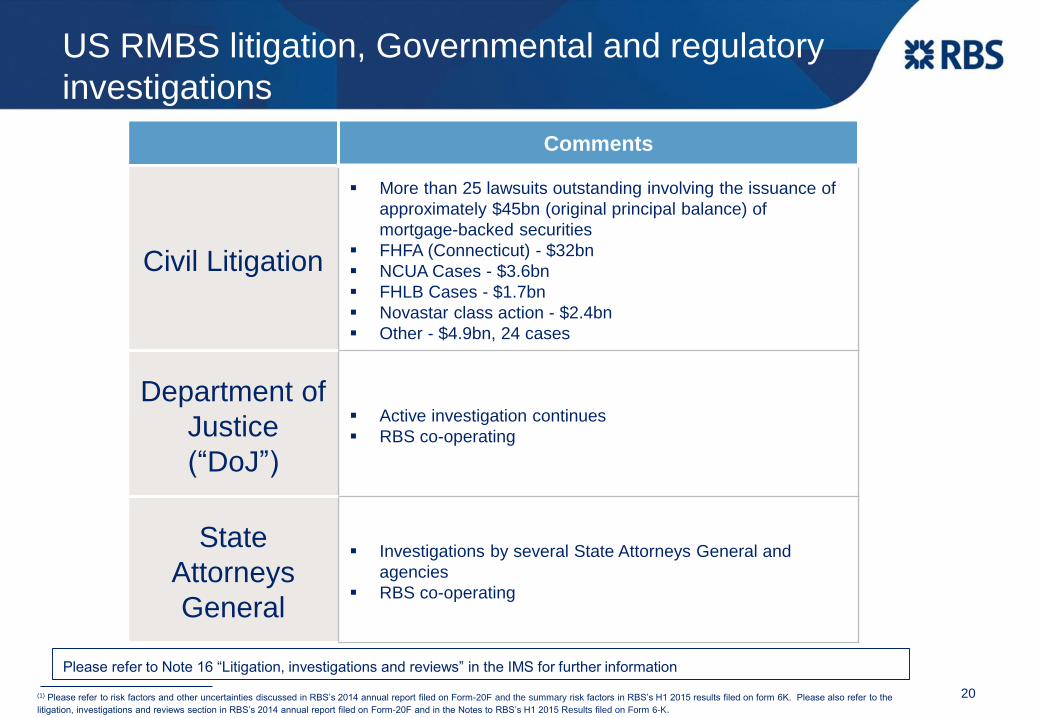
US RMBS litigation, Governmental and regulatory
investigations
Comments
Civil Litigation
More than 25 lawsuits outstanding involving the issuance of
approximately $45bn (original principal balance) of
mortgage-backed securities
FHFA (Connecticut) - $32bn
NCUA Cases - $3.6bn
FHLB Cases - $1.7bn
Novastar class action - $2.4bn
Other - $4.9bn, 24 cases
Department of
Justice
(“DoJ”)
Active investigation continues
RBS co-operating
State
Attorneys
General
Investigations by several State Attorneys General and
agencies
RBS co-operating
Please refer to Note 16 “Litigation, investigations and reviews” in the IMS for further information
20(1) Please refer to risk factors and other uncertainties discussed in RBS’s 2014 annual report filed on Form-20F and the summary risk factors in RBS’s H1 2015 results filed on form 6K. Please also refer to the
litigation, investigations and reviews section in RBS’s 2014 annual report filed on Form-20F and in the Notes to RBS’s H1 2015 Results filed on Form 6-K.

Other issues we need to address
Conduct and litigation(1) Capital resilienceRegulatory / accounting
developments
Dealing with legacy issues
Strengthening capital and
reducing balance sheet stress
volatility
Readying the bank for future
developments
Including:
US RMBS litigation,
Governmental and regulatory
investigations
On-going FX investigations
2008 capital raising class
action suit
Various UK customer redress
issues
On-going FCA investigation
into GRG Tomlinson report
Intent to launch inaugural
AT1 securities shortly subject
to market conditions
Managing for value the
existing T1 / T2 capital
stack(2)
Making final Dividend Access
Share payment (£1.18bn)
Managing defined benefit
pension deficit
Improving stress test results
Resuming dividends /
buybacks(3)
Preparing for ring-fencing
Enhancing the resolvability of
the Bank
Preparing for the introduction
of IFRS 9
21
(1) Please refer to risk factors and other uncertainties discussed in RBS’s 2014 annual report filed on Form-20F and the summary risk factors in RBS’s Interim Results. Please also refer to the litigation, investigations
and reviews section in RBS’s 2014 annual report filed on Form-20F and in the Notes to RBS’s 2015 Interim Results. (2) Subject to any regulatory approval . (3) Subject to PRA approval. In addition, key milestones
before seeking PRA approval for capital distributions would include, among other considerations, reaching the 13% CET1 ratio target, achieving confidence in sustainable profitability, improved stress-testing results
and operating within risk appetite, peak of litigation and conduct costs passed and at least £2 billion of AT1 raised.
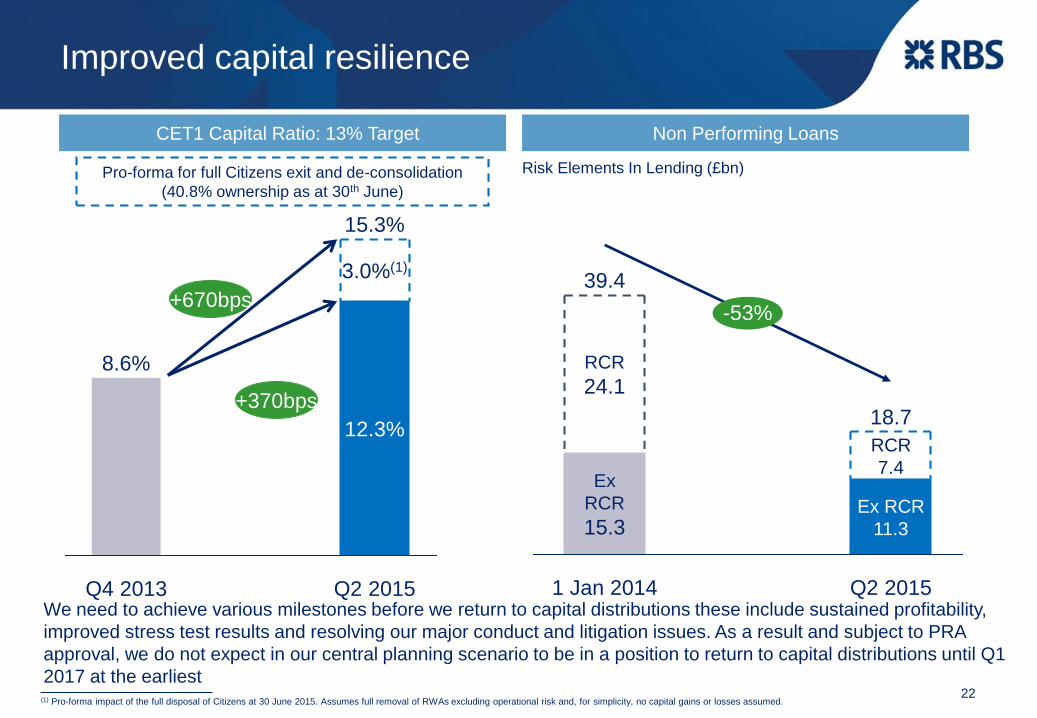
(1) Pro-forma impact of the full disposal of Citizens at 30 June 2015. Assumes full removal of RWAs excluding operational risk and, for simplicity, no capital gains or losses assumed.
Risk Elements In Lending (£bn)
Q2 2015
3.0%(1)
12.3%
15.3%
Q4 2013
8.6%
Pro-forma for full Citizens exit and de-consolidation
(40.8% ownership as at 30th June)
Ex RCR
11.3
RCR
7.4
39.4
Ex
RCR
15.3
RCR
24.1
-53%
Q2 2015
18.7
1 Jan 2014
Improved capital resilience
CET1 Capital Ratio: 13% Target Non Performing Loans
22
+670bps
+370bps
We need to achieve various milestones before we return to capital distributions these include sustained profitability,
improved stress test results and resolving our major conduct and litigation issues. As a result and subject to PRA
approval, we do not expect in our central planning scenario to be in a position to return to capital distributions until Q1
2017 at the earliest

Other issues we need to address
Conduct and litigation(1) Capital resilienceRegulatory / accounting
developments
Dealing with legacy issues
Strengthening capital and
reducing balance sheet stress
volatility
Readying the bank for future
developments
Including:
US RMBS litigation,
Governemental and
regulatory investigations
On-going FX investigations
2008 capital raising class
action suit
Various UK customer redress
issues
On-going FCA investigation
into GRG Tomlinson report
Intent to launch inaugural
AT1 securities shortly subject
to market conditions
Managing for value the
existing T1 / T2 capital
stack(2)
Making final Dividend Access
Share payment (£1.18bn)
Managing defined benefit
pension deficit
Improving stress test results
Resuming dividends /
buybacks(3)
Preparing for ring-fencing
Enhancing the resolvability of
the Bank
Preparing for the introduction
of IFRS 9
23
(1) Please refer to risk factors and other uncertainties discussed in RBS’s 2014 annual report filed on Form-20F and the summary risk factors in RBS’s Interim Results. Please also refer to the litigation, investigations
and reviews section in RBS’s 2014 annual report filed on Form-20F and in the Notes to RBS’s 2015 Interim Results. (2) Subject to any regulatory approval . (3) Subject to PRA approval. In addition, key milestones
before seeking PRA approval for capital distributions would include, among other considerations, reaching the 13% CET1 ratio target, achieving confidence in sustainable profitability, improved stress-testing results
and operating within risk appetite, peak of litigation and conduct costs passed and at least £2 billion of AT1 raised.

Focus Area Comments
Go-Forward Bank Build value through focusing on improving customer
service, enhancing growth and achieving higher returns
Exit Bank Accelerating speed of wind-down while preserving value
Targeting substantive reduction by end 2016
Other Issues
Conduct and litigation issues being progressively addressed
Capital resilience materially improving – clear path to
resuming dividends / buybacks
Conclusions
24

Summary

RBS in 2019
RBS in 2019
# 1 ServicePersonal &
Business Banking
Commercial &
Private Banking
Corporate &
Institutional Banking
Leading
market
positions
#2 UK Personal Current
Accounts
#3 ROI Personal Current
Accounts
#2 UK business bank main
relationship
#1 SME Bank
#1 UK Commercial Bank
#1 UK Private Bank
#1 UK crown
dependencies
Top 3 UK Rates, DCM, FX
Top 3 European
Structured Finance
Top 3 Western Europe
Investment Grade
Corporate DCM
Attractive
returns and
business mix
UK / Irish franchise strengths
85% of RWAs in retail and commercial/15% in Corporate & Institutional
Cost:income ratio <50%
12+% RoTE from a lower risk franchise
25Note: The objectives set under “RBS in 2019” are forward looking statements - see the last page of this presentation.

Q&A
Appendix
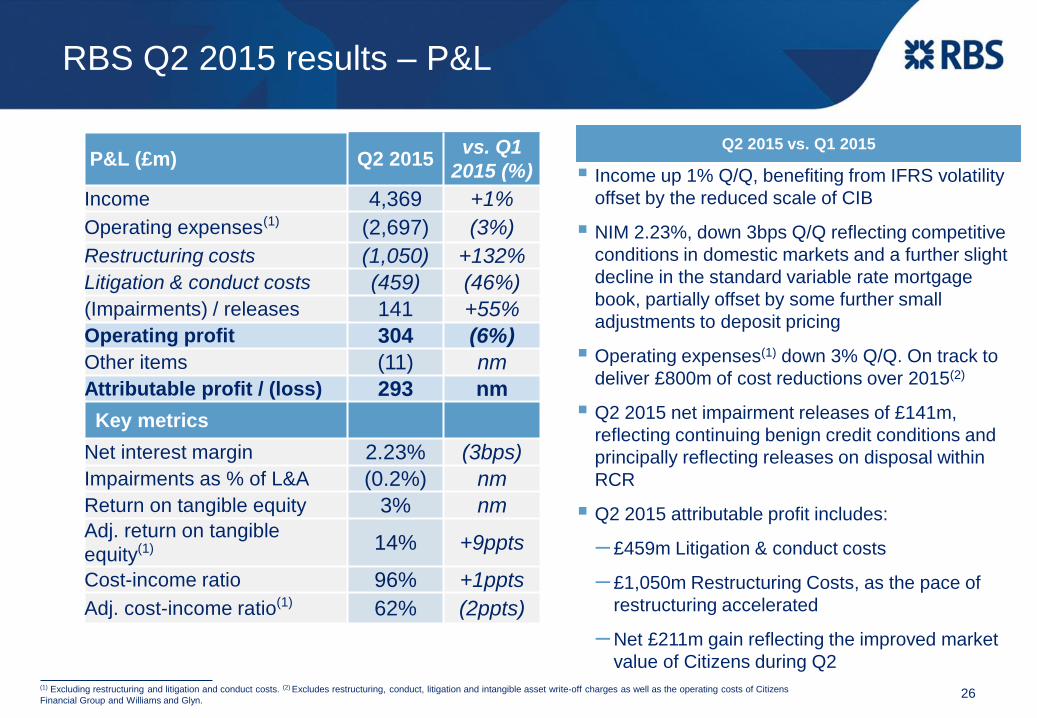
Income up 1% Q/Q, benefiting from IFRS volatility
offset by the reduced scale of CIB
NIM 2.23%, down 3bps Q/Q reflecting competitive
conditions in domestic markets and a further slight
decline in the standard variable rate mortgage
book, partially offset by some further small
adjustments to deposit pricing
Operating expenses(1) down 3% Q/Q. On track to
deliver £800m of cost reductions over 2015(2)
Q2 2015 net impairment releases of £141m,
reflecting continuing benign credit conditions and
principally reflecting releases on disposal within
RCR
Q2 2015 attributable profit includes:
– £459m Litigation & conduct costs
– £1,050m Restructuring Costs, as the pace of
restructuring accelerated
– Net £211m gain reflecting the improved market
value of Citizens during Q2(1) Excluding restructuring and litigation and conduct costs. (2) Excludes restructuring, conduct, litigation and intangible asset write-off charges as well as the operating costs of Citizens
Financial Group and Williams and Glyn.
RBS Q2 2015 results – P&L
Q2 2015 vs. Q1 2015
26
P&L (£m) Q2 2015vs. Q1
2015 (%)
Income 4,369 +1%
Operating expenses(1) (2,697) (3%)
Restructuring costs (1,050) +132%
Litigation & conduct costs (459) (46%)
(Impairments) / releases 141 +55%
Operating profit 304 (6%)
Other items (11) nm
Attributable profit / (loss) 293 nm
Key metrics
Net interest margin 2.23% (3bps)
Impairments as % of L&A (0.2%) nm
Return on tangible equity 3% nmAdj. return on tangible
equity(1) 14% +9ppts
Cost-income ratio 96% +1ppts
Adj. cost-income ratio(1) 62% (2ppts)
Q2 2015 vs. FY 2014
(1) Includes disposal groups (2) NPLs = Risk Elements in Lending in the Company Announcement.
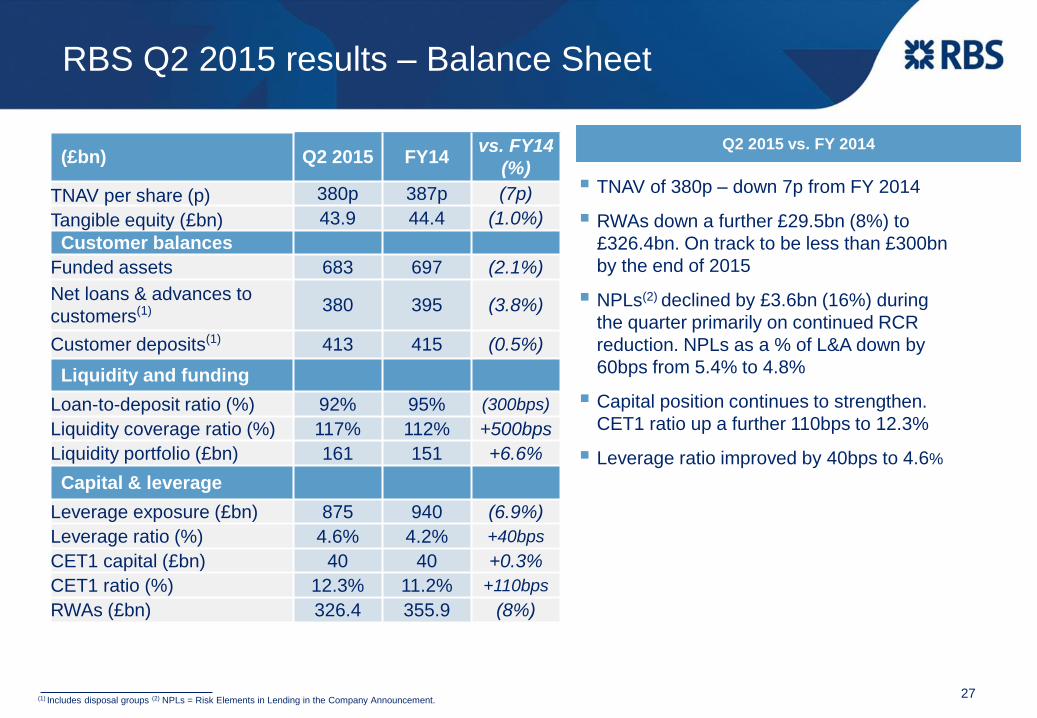
RBS Q2 2015 results – Balance Sheet
TNAV of 380p – down 7p from FY 2014
RWAs down a further £29.5bn (8%) to
£326.4bn. On track to be less than £300bn
by the end of 2015
NPLs(2) declined by £3.6bn (16%) during
the quarter primarily on continued RCR
reduction. NPLs as a % of L&A down by
60bps from 5.4% to 4.8%
Capital position continues to strengthen.
CET1 ratio up a further 110bps to 12.3%
Leverage ratio improved by 40bps to 4.6%
27
(£bn) Q2 2015 FY14vs. FY14
(%)
TNAV per share (p) 380p 387p (7p)
Tangible equity (£bn) 43.9 44.4 (1.0%)
Customer balances
Funded assets 683 697 (2.1%)
Net loans & advances to
customers(1) 380 395 (3.8%)
Customer deposits(1) 413 415 (0.5%)
Liquidity and funding
Loan-to-deposit ratio (%) 92% 95% (300bps)
Liquidity coverage ratio (%) 117% 112% +500bps
Liquidity portfolio (£bn) 161 151 +6.6%
Capital & leverage
Leverage exposure (£bn) 875 940 (6.9%)
Leverage ratio (%) 4.6% 4.2% +40bps
CET1 capital (£bn) 40 40 +0.3%
CET1 ratio (%) 12.3% 11.2% +110bps
RWAs (£bn) 326.4 355.9 (8%)
(1) Excluding restructuring and litigation and conduct costs.
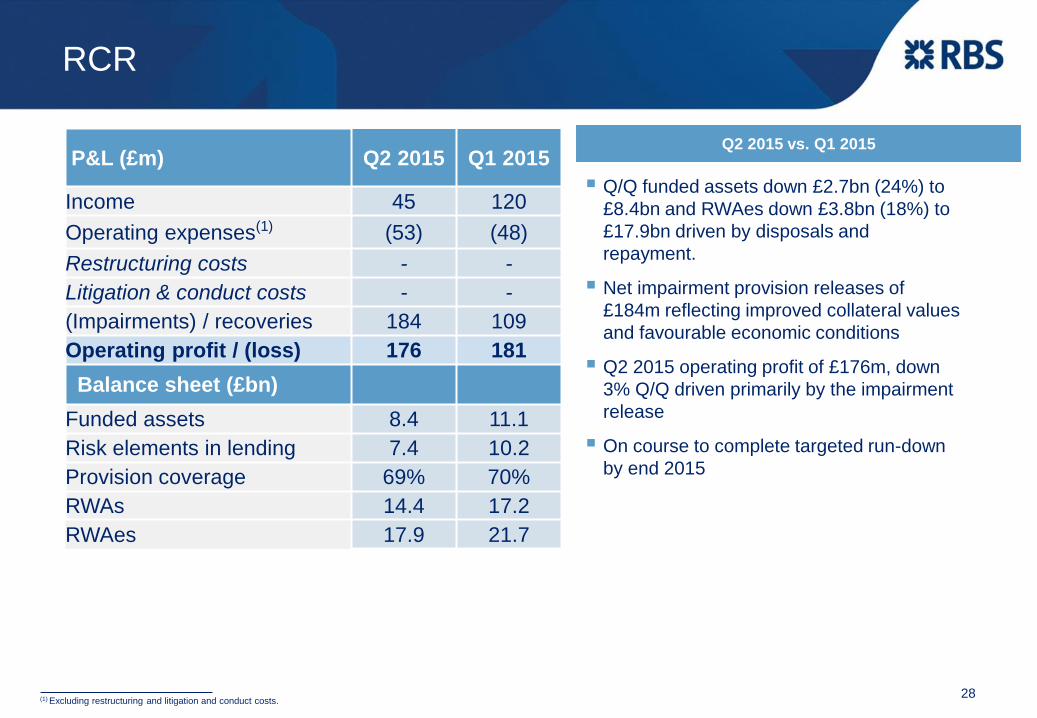
RCR
Q2 2015 vs. Q1 2015
28
Q/Q funded assets down £2.7bn (24%) to
£8.4bn and RWAes down £3.8bn (18%) to
£17.9bn driven by disposals and
repayment.
Net impairment provision releases of
£184m reflecting improved collateral values
and favourable economic conditions
Q2 2015 operating profit of £176m, down
3% Q/Q driven primarily by the impairment
release
On course to complete targeted run-down
by end 2015
P&L (£m) Q2 2015 Q1 2015
Income 45 120
Operating expenses(1) (53) (48)
Restructuring costs - -
Litigation & conduct costs - -
(Impairments) / recoveries 184 109
Operating profit / (loss) 176 181
Balance sheet (£bn)
Funded assets 8.4 11.1
Risk elements in lending 7.4 10.2
Provision coverage 69% 70%
RWAs 14.4 17.2
RWAes 17.9 21.7
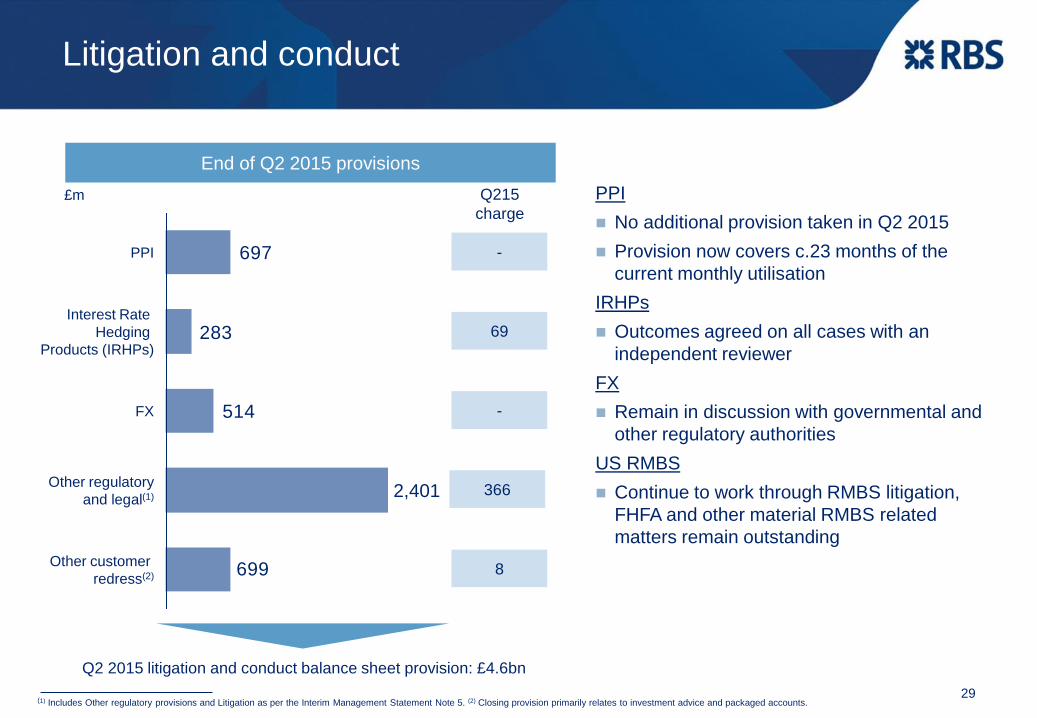
Q215
charge
-
69
366
-
£m
514
283
697
699
Other regulatory
and legal(1)
Other customer
redress(2)
2,401
FX
Interest Rate
Hedging
Products (IRHPs)
PPI
Q2 2015 litigation and conduct balance sheet provision: £4.6bn
PPI
No additional provision taken in Q2 2015
Provision now covers c.23 months of the
current monthly utilisation
IRHPs
Outcomes agreed on all cases with an
independent reviewer
FX
Remain in discussion with governmental and
other regulatory authorities
US RMBS
Continue to work through RMBS litigation,
FHFA and other material RMBS related
matters remain outstanding
End of Q2 2015 provisions
Litigation and conduct
(1) Includes Other regulatory provisions and Litigation as per the Interim Management Statement Note 5. (2) Closing provision primarily relates to investment advice and packaged accounts.
8
29

£m H1 2015 Q2 2015 Q1 2015
Reported in adjusted operating performance
CIB CR disposal losses (141) (113) (28)
RCR disposal contributions primarily within impairment
provision releases (2) 283 164 119
AFS disposal (loss)/ gains in Centre (Income) (69) (42) (27)
Risk Management (incl. IFRS volatility) in Centre (Income) 93 201 (108)
Restructuring costs (1,503) (1,050) (453)
o/w W&G restructuring costs (259) (126) (133)
o/w Write-down of the value of US premises (1) (277) - (277)
o/w Software write-downs
- CIB (1) (521) (521) -
- Private Banking (1) (82) (82) -
Total conduct & litigation costs (1) (1,315) (459) (856)
o/w PPI redress and related costs (1) (100) - (100)
o/w IRHP redress and related costs (1) (69) (69) -
o/w Litigation (1) (511) (339) (172)
o/w FX (1) (334) - (334)
o/w Other customer redress (1) (265) (8) (257)
Reported ‘below the line’
Own Credit Adjustment 288 168 120
Citizens discontinued operations operating profit post tax 344 157 187
Citizens discontinued operations gain provision 10 517 (507)
Citizens minority interest operating profit (134) (93) (55)
Citizens minority interest gain provision (156) (306) 150
(1) Fully allocated to businesses (2) See footnote 1 of pg. 60 of the IMS. .
Impact of notable items on P&L
30

Leverage ratio, %
(£bn) (£bn)
CET 1 capital 39.9 40.1
Total assets 1,051 965
Netting of derivatives (331) (267)
Securities financing transactions 25 6
Regulatory deductions & other adjustments (1) 2
Potential future exposures on derivatives 99 84
Undrawn commitments 96 85
Leverage exposure 940 875
+40bps
4.6%
Q4 2014
4.2%
Q2 2015
Leverage ratio – key drivers
31
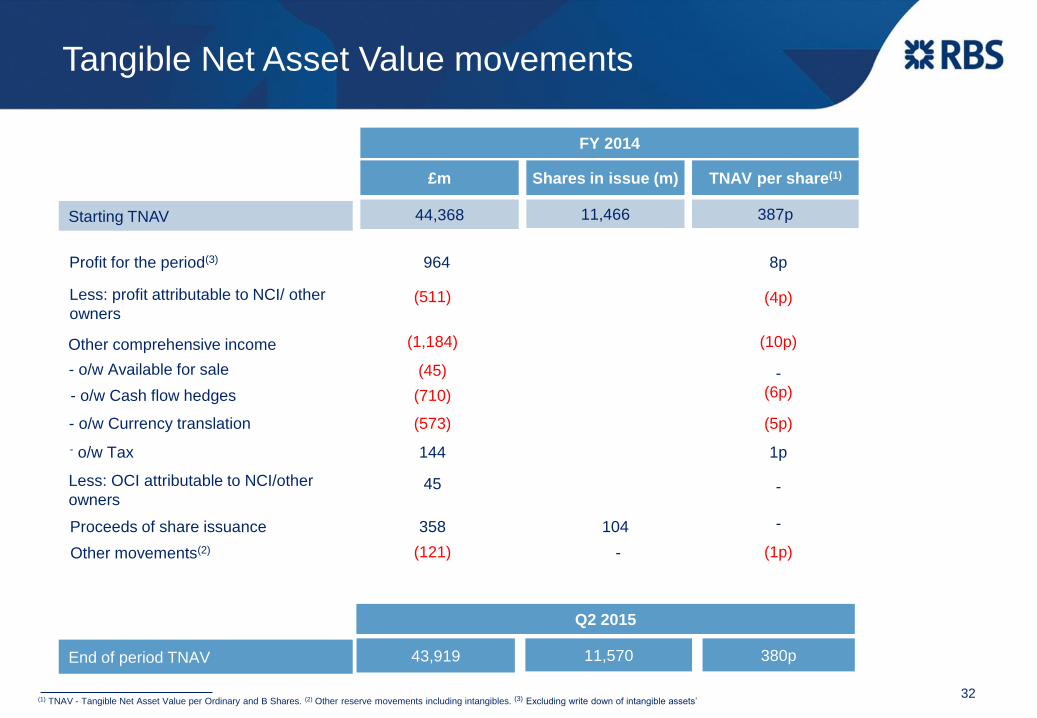
Profit for the period(3)
Starting TNAV
Less: profit attributable to NCI/ other
owners
- o/w Tax
End of period TNAV
964
44,368
(511)
144
8p
387p
(10p)
£m
Other comprehensive income (1,184)
11,466
FY 2014
Tangible Net Asset Value movements
(1) TNAV - Tangible Net Asset Value per Ordinary and B Shares. (2) Other reserve movements including intangibles. (3) Excluding write down of intangible assets’
Shares in issue (m) TNAV per share(1)
(4p)
Proceeds of share issuance
Other movements(2) (121)
43,919 380p
Q2 2015
11,570
(1p)
-358 104
32
- o/w Available for sale
- o/w Cash flow hedges
- o/w Currency translation
(45) -
(710)
(573)
Less: OCI attributable to NCI/other
owners45
(6p)
(5p)
1p
-
-
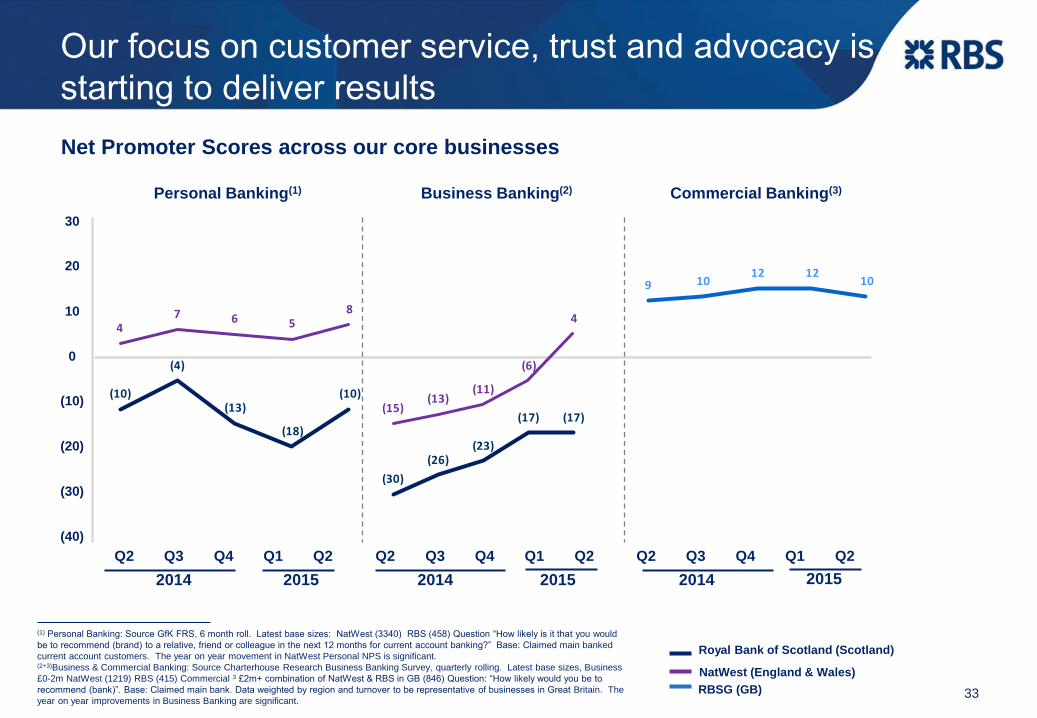
Our focus on customer service, trust and advocacy is
starting to deliver results
Royal Bank of Scotland (Scotland)
NatWest (England & Wales)
(1) Personal Banking: Source GfK FRS, 6 month roll. Latest base sizes: NatWest (3340) RBS (458) Question “How likely is it that you would
be to recommend (brand) to a relative, friend or colleague in the next 12 months for current account banking?” Base: Claimed main banked
current account customers. The year on year movement in NatWest Personal NPS is significant.(2+3)Business & Commercial Banking: Source Charterhouse Research Business Banking Survey, quarterly rolling. Latest base sizes, Business
£0-2m NatWest (1219) RBS (415) Commercial 3 £2m+ combination of NatWest & RBS in GB (846) Question: “How likely would you be to
recommend (bank)”. Base: Claimed main bank. Data weighted by region and turnover to be representative of businesses in Great Britain. The
year on year improvements in Business Banking are significant.
Net Promoter Scores across our core businesses
(10)
(4)
(13)
(18)
(10)
47 6 5
8
(40)
(30)
(20)
(10)
0
10
20
30
Q2 Q3 Q4 Q1 Q2 Q2 Q3 Q4 Q1 Q2 Q2 Q3 Q4 Q1 Q2
Personal Banking(1) Business Banking(2) Commercial Banking(3)
(30)
(26)(23)
(17) (17)(15)
(13)(11)
(6)
4
9 1012 12
10
RBSG (GB) 33
2014 2014 20142015 2015 2015

Certain sections in this document contain ‘forward-looking statements’ as that term is defined in the United States Private Securities Litigation Reform Act of 1995, such as statements that include the words
‘expect’, ‘estimate’, ‘project’, ‘anticipate’, ‘believe’, ‘should’, ‘intend’, ‘plan’, ‘could’, ‘probability’, ‘risk’, ‘Value-at-Risk (VaR)’, ‘target’, ‘goal’, ‘objective’, ‘may’, ‘endeavour’, ‘outlook’, ‘optimistic’, ‘prospects’ and
similar expressions or variations on these expressions.
In particular, this document includes forward-looking statements relating, but not limited to: The Royal Bank of Scotland Group plc’s (RBS) transformation plan (which includes RBS’s 2013/2014 strategic plan
relating to the implementation of its new divisional and functional structure and the continuation of its balance sheet reduction programme including its proposed divestments of Citizens Financial Group, Inc.
(“CFG”) and Williams & Glyn, RBS’s information technology and operational investment plan, the proposed restructuring of RBS’s CIB business and the restructuring of RBS as a result of the implementation of
the regulatory ring-fencing regime, together the “Transformation Plan”), as well as restructuring, capital and strategic plans, divestments, capitalisation, portfolios, net interest margin, capital and leverage ratios,
liquidity, risk-weighted assets (RWAs), RWA equivalents (RWAe), Pillar 2A, Maximum Distributable Amount (MDA), total loss absorbing capital (TLAC), minimum requirements for eligible liabilities (MREL),
return on equity (ROE), profitability, cost:income ratios, loan:deposit ratios, anticipated AT1 and other capital raising plans, funding and risk profile; litigation, government and regulatory investigations including
investigations relating to the setting of interest rates and foreign exchange trading and rate setting activities; costs or exposures borne by RBS arising out of the origination or sale of mortgages or mortgage-
backed securities in the US; investigations relating to business conduct and the costs of resuiting customer redress and legal proceedings; RBS’s future financial performance; the level and extent of future
impairments and write-downs; and RBS’s exposure to political risks, credit rating risk and to various types of market risks, such as interest rate risk, foreign exchange rate risk and commodity and equity price
risk. These statements are based on current plans, estimates, targets and projections, and are subject to inherent risks, uncertainties and other factors which could cause actual results to differ materially from
the future results expressed or implied by such forward-looking statements. For example, certain market risk and other disclosures are dependent on choices relying on key model characteristics and
assumptions and are subject to various limitations. By their nature, certain of the market risk disclosures are only estimates and, as a result, actual future gains and losses could differ materially from those that
have been estimated.
Other factors that could adversely affect our results and the accuracy of forward-looking statements in this document include the risk factors and other uncertainties discussed in the 2014 Annual Report and
Accounts and the 2015 Interim Results. These include the significant risks for RBS presented by the execution of the Transformation Plan; RBS’s ability to successfully implement the various initiatives that are
comprised in the Transformation Plan, particularly the balance sheet reduction programme including the divestment of Williams & Glyn and its remaining stake in CFG, the proposed restructuring of its CIB
business and the significant restructuring undertaken by RBS as a result of the implementation of the ring fence; whether RBS will emerge from implementing the Transformation Plan as a viable, competitive,
customer-focused and profitable bank; RBS’s ability to achieve its capital targets which depend on RBS’s success in reducing the size of its business; the cost and complexity of the implementation of the ring-
fence and the extent to which it will have a material adverse effect on RBS; the risk of failure to realise the benefit of RBS’s substantial investments in its information technology and operational infrastructure
and systems, the significant changes, complexity and costs relating to the implementation of the Transformation Plan, the risks of lower revenues resulting from lower customer retention and revenue
generation as RBS refocuses on the UK as well as increasing competition. In addition, there are other risks and uncertainties. These include RBS’s ability to attract and retain qualified personnel; uncertainties
regarding the outcomes of legal, regulatory and governmental actions and investigations that RBS is subject to (including active civil and criminal investigations) and any resulting material adverse effect on
RBS of unfavourable outcomes; heightened regulatory and governmental scrutiny and the increasingly regulated environment in which RBS operates; uncertainty relating to how policies of the new government
elected in the May 2015 UK election may impact RBS including a possible referendum on the UK’s membership of the EU and the consequences arising from it; operational risks that are inherent in RBS’s
business and that could increase as RBS implements its Transformation Plan; the potential negative impact on RBS’s business of actual or perceived global economic and financial market conditions and other
global risks; how RBS will be increasingly impacted by UK developments as its operations become gradually more focused on the UK; uncertainties regarding RBS exposure to any weakening of economies
within the EU and renewed threat of default or exit by certain counties in the Eurozone; the risks resulting from RBS implementing the State Aid restructuring plan including with respect to the disposal of certain
assets and businesses as announced or required as part of the State Aid restructuring plan; the achievement of capital and costs reduction targets; ineffective management of capital or changes to regulatory
requirements relating to capital adequacy and liquidity; the ability to access sufficient sources of capital, liquidity and funding when required; deteriorations in borrower and counterparty credit quality; the extent
of future write-downs and impairment charges caused by depressed asset valuations; the value and effectiveness of any credit protection purchased by RBS; the impact of unanticipated turbulence in interest
rates, yield curves, foreign currency exchange rates, credit spreads, bond prices, commodity prices, equity prices; basis, volatility and correlation risks; changes in the credit ratings of RBS; changes to the
valuation of financial instruments recorded at fair value; competition and consolidation in the banking sector; regulatory or legal changes (including those requiring any restructuring of RBS’s operations);
changes to the monetary and interest rate policies of central banks and other governmental and regulatory bodies and continued prolonged periods of low interest rates; changes in UK and foreign laws,
regulations, accounting standards and taxes; impairments of goodwill; the high dependence of RBS’s operations on its informat ion technology systems and its increasing exposure to cyber security threats; the
reputational risks inherent in RBS’s operations; the risk that RBS may suffer losses due to employee misconduct; pension fund shortfalls; the recoverability of deferred tax assets; HM Treasury exercising
influence over the operations of RBS; limitations on, or additional requirements imposed on, RBS’s activities as a result of HM Treasury’s investment in RBS; and the success of RBS in managing the risks
involved in the foregoing.
The forward-looking statements contained in this document speak only as of the date of this announcement, and RBS does not undertake to update any forward-looking statement to reflect events or
circumstances after the date hereof or to reflect the occurrence of unanticipated events.
The information, statements and opinions contained in this document do not constitute a public offer under any applicable legislation or an offer to sell or solicitation of any offer to buy any securities or financial
instruments or any advice or recommendation with respect to such securities or other financial instruments.
Forward Looking Statements