sun life: h1/q2 results
TRANSCRIPT

8/12/2019 Sun Life: H1/Q2 results
http://slidepdf.com/reader/full/sun-life-h1q2-results 1/27
SEC Number
File Number ____________
SUN LIFE FINANCIAL INC.
______________________________________________
(Company’s Full Name)
150 King Street West, Toronto, Canada ______________________________________________
(Company’s Address)
(416) 979-4800
______________________________________________
(Telephone Number)
December 31
________________________(Fiscal Year Ending)
(month & day)
To comply with SRC Rule 17 in lieu of SEC Form 17-Q
______________________________________________
Form Type
N/A
________________________________
Amendment Designation
(If applicable)
4 June 30, 201 ___________________
Period Ended Date
N/A
________________________________
(Secondary License Type and File Number)
The attached document is being filed with stock exchanges and securities regulators in Canada and the
United States. As agreed with the Philippines Securities and Exchange Commission (the “PSEC”) and the
Philippines Stock Exchange (the “PSE”), continuous disclosure documents filed by Sun Life Financial Inc.
in the Philippines will be filed in accordance with the requirements of Canadian securities regulators as to
contents, format and reporting periods. Documents filed with the PSEC and the PSE will include a cover page identifying the SEC form that would otherwise be required to be filed under the Philippines Securities
Regulation Code.

8/12/2019 Sun Life: H1/Q2 results
http://slidepdf.com/reader/full/sun-life-h1q2-results 2/27
CONSOLIDATED STATEMENTS OF OPERATIONS
For the three months ended For the six months ended
(unaudited, in millions of Canadian dollars except for per shareamounts)
June 30,2014
June 30,2013
June 30,2014
June 30,2013
Revenue
Premiums
Gross $ 3,758 $ 3,709 $ 7,396 $ 7,117
Less: Ceded 1,386 1,335 2,796 2,710Net 2,372 2,374 4,600 4,407
Net investment income (loss):
Interest and other investment income 976 1,272 2,465 2,509
Change in fair value through profit or loss assets andliabilities (Note 5) 1,814 (3,356) 3,434 (3,704)
Net gains (losses) on available-for-sale assets 48 36 105 60
Net investment income (loss) 2,838 (2,048) 6,004 (1,135)
Fee income 1,105 892 2,171 1,736
Total revenue 6,315 1,218 12,775 5,008
Benefits and expenses
Gross claims and benefits paid (Note 7) 3,136 3,047 6,339 5,958
Increase (decrease) in insurance contract liabilities (Note 7) 2,368 (2,555) 4,597 (2,333)Decrease (increase) in reinsurance assets (Note 7) (166) (76) (112) (183)
Increase (decrease) in investment contract liabilities (Note 7) 25 16 56 32
Reinsurance expenses (recoveries) (Note 8) (1,351) (1,285) (2,676) (2,543)
Commissions 465 407 905 796
Net transfer to (from) segregated funds (Note 11) (13) (1) (6) (3)
Operating expenses 1,124 989 2,247 1,946
Premium taxes 60 59 121 116
Interest expense 78 89 165 176
Total benefits and expenses 5,726 690 11,636 3,962
Income (loss) before income taxes 589 528 1,139 1,046
Less: Income tax expense (benefit) (Note 9) 134 108 251 193
Total net income (loss) from continuing operations 455 420 888 853
Less: Net income (loss) attributable to participatingpolicyholders – (1) 4 (7)
Shareholders’ net income (loss) from continuing operations 455 421 884 860
Less: Preferred shareholders’ dividends 30 30 59 59
Common shareholders’ net income (loss) from continuingoperations $ 425 $ 391 $ 825 $ 801
Common shareholders’ net income (loss) from discontinuedoperation (Note 3) $ – $ 8 $ – $ 111
Common shareholders’ net income (loss) $ 425 $ 399 $ 825 $ 912
Average exchange rates during the reporting periods:
U.S. dollars 1.09 1.02 1.10 1.02U.K. pounds 1.83 1.57 1.83 1.57
Earnings (loss) per share (Note 13)
Basic earnings (loss) per share from continuing operations $ 0.70 $ 0.65 $ 1.35 $ 1.33
Basic earnings (loss) per share from discontinued operation $ – $ 0.01 $ – $ 0.18
Basic earnings (loss) per share $ 0.70 $ 0.66 $ 1.35 $ 1.51
Diluted earnings (loss) per share from continuing operations $ 0.69 $ 0.64 $ 1.34 $ 1.32
Diluted earnings (loss) per share from discontinued operation $ – $ 0.01 $ – $ 0.18
Diluted earnings (loss) per share $ 0.69 $ 0.65 $ 1.34 $ 1.50
Dividends per common share $ 0.36 $ 0.36 $ 0.72 $ 0.72
The attached notes form part of these Interim Consolidated Financial Statements.
34 Sun Life Financial Inc. Second Quarter 2014 INTERIM CONSOLIDATED FINANCIAL STATEMENTS (UNAUDITED)

8/12/2019 Sun Life: H1/Q2 results
http://slidepdf.com/reader/full/sun-life-h1q2-results 3/27
CONSOLIDATED STATEMENTS OF COMPREHENSIVE INCOME (LOSS)
For the three months ended For the six months ended
(unaudited, in millions of Canadian dollars)June 30,
2014June 30,
2013June 30,
2014June 30,
2013
Total net income (loss) $ 455 $ 428 $ 888 $ 964
Other comprehensive income (loss), net of taxes:
Items that may be reclassified subsequently to income:
Change in unrealized foreign currency translation gains(losses):
Unrealized gains (losses) before net investmenthedges (242) 362 97 567
Unrealized gains (losses) on net investment hedges 5 (59) (1) (88)
Change in unrealized gains (losses) on available-for-saleassets:
Unrealized gains (losses) 134 (282) 264 (153)
Reclassifications to net income (loss) (31) (24) (70) (56)
Change in unrealized gains (losses) on cash flow hedges:
Unrealized gains (losses) 4 7 6 9
Reclassifications to net income (loss) (5) (5) (10) (9)
Total items that may be reclassified subsequently to income (135) (1) 286 270
Items that will not be reclassified subsequently to income:Remeasurement of defined benefit plans (30) 160 (77) 161
Total items that will not be reclassified subsequently to income (30) 160 (77) 161
Total other comprehensive income (loss) (165) 159 209 431
Total comprehensive income (loss) 290 587 1,097 1,395
Less: Participating policyholders’ comprehensive income (loss) (2) – 4 (4)
Shareholders’ comprehensive income (loss) $ 292 $ 587 $ 1,093 $ 1,399
INCOME TAXES INCLUDED IN OTHER COMPREHENSIVE INCOME (LOSS)
For the three months ended For the six months ended
(unaudited, in millions of Canadian dollars)June 30,
2014June 30,
2013June 30,
2014June 30,
2013
Income tax benefit (expense):
Items that may be reclassified subsequently to income:
Unrealized foreign currency translation gains / losses,including net investment hedges $ (1) $ 2 $ – $ (1)
Unrealized gains / losses on available-for-sale assets (35) 49 (73) 29
Reclassifications to net income for available-for-sale assets 8 (1) 20 (1)
Unrealized gains / losses on cash flow hedges (1) (6) (2) (10)
Reclassifications to net income for cash flow hedges 1 1 3 3
Total items that may be reclassified subsequently to income (28) 45 (52) 20
Items that will not be reclassified subsequently to income:
Remeasurement of defined benefit plans 10 (71) 30 (67)Total items that will not be reclassified subsequently to income 10 (71) 30 (67)
Total income tax benefit (expense) included in other
comprehensive income (loss) $ (18) $ (26) $ (22) $ (47)
The attached notes form part of these Interim Consolidated Financial Statements.
INTERIM CONSOLIDATED FINANCIAL STATEMENTS (UNAUDITED) Sun Life Financial Inc. Second Quarter 2014

8/12/2019 Sun Life: H1/Q2 results
http://slidepdf.com/reader/full/sun-life-h1q2-results 4/27

8/12/2019 Sun Life: H1/Q2 results
http://slidepdf.com/reader/full/sun-life-h1q2-results 5/27
CONSOLIDATED STATEMENTS OF CHANGES IN EQUITY
For the six months ended
(unaudited, in millions of Canadian dollars)June 30,
2014June 30,
2013
Shareholders:
Preferred shares
Balance, beginning of period $ 2,503 $ 2,503
Redemption of preferred shares (Note 10) (246) – Balance, end of period 2,257 2,503
Common shares
Balance, beginning of period 8,304 8,008
Stock options exercised 25 46
Issued under dividend reinvestment and share purchase plan (Note 10) 48 131
Balance, end of period 8,377 8,185
Contributed surplus
Balance, beginning of period 95 110
Share-based payments 2 3
Stock options exercised (5) (9)
Balance, end of period 92 104
Retained earnings
Balance, beginning of period 5,899 5,817
Net income (loss) 884 971
Redemption of preferred shares (Note 10) (4) –
Dividends on common shares (440) (434)
Dividends on preferred shares (59) (59)
Balance, end of period 6,280 6,295
Accumulated other comprehensive income (loss), net of taxes
Unrealized gains (losses) on available-for-sale assets 329 604
Unrealized cumulative translation differences, net of hedging activities 110 (464)
Unrealized gains (losses) on transfers to investment properties 6 6
Unrealized gains (losses) on derivatives designated as cash flow hedges 13 13
Cumulative changes in liabilities for defined benefit plans (32) (179)Balance, beginning of period 426 (20)
Total other comprehensive income (loss) for the period 209 428
Balance, end of period 635 408
Total shareholders’ equity, end of period $ 17,641 $ 17,495
Participating policyholders:
Retained earnings
Balance, beginning of period $ 126 $ 131
Net income (loss) 4 (7)
Balance, end of period 130 124
Accumulated other comprehensive income (loss), net of taxes
Unrealized cumulative translation differences, net of hedging activities 1 (3)
Balance, beginning of period 1 (3)
Total other comprehensive income (loss) for the period – 3
Balance, end of period 1 –
Total participating policyholders’ equity, end of period $ 131 $ 124
Total equity $ 17,772 $ 17,619
The attached notes form part of these Interim Consolidated Financial Statements.
INTERIM CONSOLIDATED FINANCIAL STATEMENTS (UNAUDITED) Sun Life Financial Inc. Second Quarter 2014

8/12/2019 Sun Life: H1/Q2 results
http://slidepdf.com/reader/full/sun-life-h1q2-results 6/27
CONSOLIDATED STATEMENTS OF CASH FLOWS
For the three months ended For the six months ended
(unaudited, in millions of Canadian dollars)June 30,
2014June 30,
2013June 30,
2014June 30,
2013
Cash flows provided by (used in) operating activities
Total income (loss) before income taxes $ 589 $ 537 $ 1,139 $ 1,209
Add: interest expense related to financing activities 75 86 160 172
Operating items not affecting cash:Increase (decrease) in contract liabilities 2,500 (3,090) 4,907 (3,407)
(Increase) decrease in reinsurance assets (279) (120) (263) (181)
Unrealized (gains) losses on investments (1,641) 3,908 (2,959) 4,365
Other non-cash items 829 132 32 (563)
Operating cash items:
Deferred acquisition costs (9) (12) (21) (23)
Realized (gains) losses on investments (205) (122) (523) 73
Sales, maturities and repayments of investments 19,066 17,414 39,556 32,427
Purchases of investments (20,324) (18,965) (41,251) (32,815)
Change in policy loans (21) (9) 14 (13)
Income taxes received (paid) (76) (71) (154) (221)
Mortgage securitization (Note 5) 120 – 213 –
Other cash items 119 (535) 60 (898)
Net cash provided by (used in) operating activities 743 (847) 910 125
Cash flows provided by (used in) investing activities
(Purchase) sale of property and equipment (22) (11) (31) (27)
Investment in and transactions with associates and jointventures (31) (288) (87) (313)
Dividends received from associates and joint ventures – – – 10
Cash received on sale of discontinued operation – – 72 –
Other investing activities (8) (11) (19) (16)
Net cash provided by (used in) investing activities (61) (310) (65) (346)
Cash flows provided by (used in) financing activities
Increase in (repayment of) borrowed funds (104) (2) (228) (9)
Issuance of subordinated debt, net of issuance costs (Note 10) 249 – 249 – Redemption of subordinated debt (Note 10) – (350) (500) (350)
Redemption of preferred shares (Note 10) (250) – (250) –
Collateral on senior financing – 1 – 13
Issuance of common shares on exercise of stock options 5 12 20 37
Dividends paid on common and preferred shares (221) (177) (444) (355)
Interest expense paid (92) (97) (166) (149)
Net cash provided by (used in) financing activities (413) (613) (1,319) (813)
Changes due to fluctuations in exchange rates (50) (23) 41 (46)
Increase (decrease) in cash and cash equivalents 219 (1,793) (433) (1,080)
Net cash and cash equivalents, beginning of period 2,672 4,544 3,324 3,831
Net cash and cash equivalents, end of period 2,891 2,751 2,891 2,751
Short-term securities, end of period 2,850 4,002 2,850 4,002
Net cash and cash equivalents and short-term securities, end of
period (Note 5) $ 5,741 $ 6,753 $ 5,741 $ 6,753
Less: Net cash and cash equivalents and short-term securities,classified as held for sale $ 1,056 $ 1,056
Net cash and cash equivalents and short-term securities, continuingoperations (Note 5) $ 5,697 $ 5,697
The attached notes form part of these Interim Consolidated Financial Statements.
38 Sun Life Financial Inc. Second Quarter 2014 INTERIM CONSOLIDATED FINANCIAL STATEMENTS (UNAUDITED)

8/12/2019 Sun Life: H1/Q2 results
http://slidepdf.com/reader/full/sun-life-h1q2-results 7/27
8/12/2019 Sun Life: H1/Q2 results
http://slidepdf.com/reader/full/sun-life-h1q2-results 8/27
In May 2014, IFRS 15 Revenue from Contracts with Customers (“IFRS 15”) was issued, which replaces IAS 11 Construction
Contracts, IAS 18 Revenue and various interpretations. IFRS 15 establishes principles about the nature, amount, timing anduncertainty of revenue arising from contracts with customers. The standard requires entities to recognize revenue to reflect thetransfer of goods or services to customers measured at the amounts an entity expects to be entitled to in exchange for those goodsor services. IFRS 15 is effective for annual periods beginning on or after January 1, 2017. Insurance and investment contracts arenot in scope of this standard. We are currently assessing the impact the adoption of this standard will have on our ConsolidatedFinancial Statements.
In July 2014, the final version of IFRS 9 Financial Instruments (“IFRS 9”) was issued, which replaces IAS 39 Financial Instruments:
Recognition and Measurement . IFRS 9 includes guidance on the classification and measurement of financial instruments,
impairment of financial assets, and hedge accounting. Financial asset classification is based on the cash flow characteristics andthe business model in which an asset is held. The classification determines how a financial instrument is accounted for andmeasured. IFRS 9 also introduces an impairment model for financial instruments not measured at fair value through profit or lossthat requires recognition of expected losses at initial recognition of a financial instrument and the recognition of full lifetime expectedlosses if certain criteria are met. A new model for hedge accounting aligns hedge accounting with risk management activities.IFRS 9 is effective for annual periods beginning on or after January 1, 2018. We are currently assessing the impact the adoption of this standard will have on our Consolidated Financial Statements.
3. Acquisition and Held for Sale Classification and DiscontinuedOperation
3.A Acquisition
On April 12, 2013, in connection with a strategic partnership between Sun Life Assurance and Khazanah Nasional Berhad(“Khazanah”), Sun Life Assurance acquired 49% of each of CIMB Aviva Assurance Berhad, a Malaysian insurance company andCIMB Aviva Takaful Berhad, a Malaysian takaful company (together, “CIMB Aviva”) from Aviva International Holdings Limited and,subsequently, Khazanah acquired 49% of CIMB Aviva from CIMB Group Holdings Berhad (“CIMB Group”). CIMB Group retained atwo percent share in CIMB Aviva. The transaction included an exclusive right to distribute insurance products of CIMB Aviva,including takaful products, through CIMB Bank’s network across Malaysia. Sun Life Assurance’s contribution to the transaction wasvalued at $301. In the third quarter of 2013, the companies acquired were renamed Sun Life Malaysia Assurance Berhad and SunLife Malaysia Takaful Berhad (together, “Sun Life Malaysia”). Our investment in Sun Life Malaysia is accounted for using the equitymethod of accounting.
3.B Held for Sale Classification and Discontinued Operation
Effective August 1, 2013, we completed the sale of our U.S. Annuities business and certain of our U.S. life insurance businesses
(“the U.S. Annuity Business”) to Delaware Life Holdings, LLC. The transaction consisted primarily of the sale of 100% of the sharesof Sun Life Assurance Company of Canada (U.S.), which included U.S. domestic variable annuity, fixed annuity and fixed indexedannuity products, corporate and bank-owned life insurance products and variable life insurance products. The sale included thetransfer of certain related operating assets, systems and employees that supported these businesses. The assets and liabilities of the U.S. Annuity Business were separately presented as assets and liabilities classified as held for sale, respectively, in our Consolidated Statements of Financial Position for 2013 prior to the closing of the sale. In the first quarter of 2014, the purchaseprice adjustment was finalized, which resulted in no change to the loss on sale of $695 recorded in Common shareholders’ netincome (loss) from discontinued operation in our 2013 Annual Consolidated Financial Statements.
Discontinued Operation
The results of operations relating to our U.S. Annuity Business in Sun Life Financial United States (“SLF U.S.”) are reflected as adiscontinued operation in our Interim Consolidated Statements of Operations.
40 Sun Life Financial Inc. Second Quarter 2014 CONDENSED NOTES TO THE INTERIM CONSOLIDATED FINANCIAL STATEMENTS (UNAUDITED)

8/12/2019 Sun Life: H1/Q2 results
http://slidepdf.com/reader/full/sun-life-h1q2-results 9/27
Common Shareholders’ Net Income (Loss) from Discontinued Operation
The components of the Common shareholders’ net income (loss) from discontinued operation included in our Interim ConsolidatedStatements of Operations are as follows:
For the three months ended For the six months ended
June 30,2014
June 30,2013
June 30,2014
June 30,2013
Net premiums $ – $ 53 $ – $ 129
Net investment income (loss) – (378) – (572)
Fee income – 147 – 293
Total revenue – (178) – (150)
Gross claims and benefits paid – 447 – 869
Changes in insurance/investment contract liabilities and reinsuranceassets, net of reinsurance recoveries – (736) – (1,341)
Net transfer to (from) segregated funds – 35 – 33
Other expenses – 67 – 126
Total benefits and expenses – (187) – (313)
Income (loss) before income taxes – 9 – 163
Income tax expense (benefit) – 1 – 52
Total net income (loss) from discontinued operation – 8 – 111
Shareholders’ net income (loss) from discontinued operation – 8 – 111Common shareholders’ net income (loss) from discontinued
operation $ – $ 8 $ – $ 111
Cash Flows from Discontinued Operation
The details of the cash flows from the discontinued operation included in our Interim Consolidated Statements of Cash Flows are asfollows:
For the three months ended For the six months ended
June 30,2014
June 30,2013
June 30,2014
June 30,2013
Net cash provided by (used in) operating activities $ – $ (242) $ – $ (195)
Net cash provided by (used in) financing activities – – – (5)
Changes due to fluctuations in exchange rates – 14 – 23
Increase (decrease) in cash and cash equivalents $ – $ (228) $ – $ (177)
4. Segmented Information
We have five reportable segments: Sun Life Financial Canada (“SLF Canada”), SLF U.S., MFS Investment Management (“MFS”),Sun Life Financial Asia (“SLF Asia”) and Corporate. These reportable segments operate in the financial services industry and reflectour management structure and internal financial reporting. Corporate includes the results of our United Kingdom business unit andour Corporate Support operations, which include run-off reinsurance operations as well as investment income, expenses, capitaland other items not allocated to our other business groups.
Revenues from our reportable segments are derived principally from life and health insurance, investment management andannuities and mutual funds. Revenues not attributed to the strategic business units are derived primarily from Corporate
investments and earnings on capital. Transactions between segments are executed and priced on an arm’s-length basis in amanner similar to transactions with third parties.
The expenses in each business segment may include costs or services directly incurred or provided on their behalf at the enterpriselevel. For other costs not directly attributable to one of our business segments, we use a management reporting framework thatuses assumptions, judgments and methodologies for allocating overhead costs and indirect expenses to our business segments.
Intersegment transactions consist primarily of internal financing agreements which are measured at fair values prevailing when thearrangements are negotiated. Intersegment investment income consists primarily of interest paid by SLF U.S. to Corporate.Intersegment fee income is primarily asset management fees paid by SLF Canada and Corporate to MFS, and by MFS to SLF U.S.Intersegment transactions are presented in the Consolidation adjustments column in the following tables.
Management considers its external clients to be individuals, corporations and other organizations. We are not reliant on anyindividual client as none are individually significant to our operations.
CONDENSED NOTES TO THE INTERIM CONSOLIDATED FINANCIAL STATEMENTS (UNAUDITED) Sun Life Financial Inc. Second Quarter 2014

8/12/2019 Sun Life: H1/Q2 results
http://slidepdf.com/reader/full/sun-life-h1q2-results 10/27
Results by segment for the three months ended June 30 are as follows:
SLFCanada
SLFU.S. MFS
SLF Asia Corporate
Consolidationadjustments Total
2014Gross premiums:
Annuities $ 511 $ 72 $ – $ – $ 3 $ – $ 586
Life insurance 883 640 – 183 25 – 1,731
Health insurance 965 470 – 4 2 – 1,441
Total gross premiums 2,359 1,182 – 187 30 – 3,758Less: ceded premiums 1,244 128 – 8 6 – 1,386
Net investment income (loss) 1,569 800 3 261 219 (14) 2,838
Fee income 221 45 756 56 44 (17) 1,105
Total revenue 2,905 1,899 759 496 287 (31) 6,315Less:
Total benefits and expenses 2,691 1,762 572 449 283 (31) 5,726
Income tax expense (benefit) 26 36 86 10 (24) – 134
Total net income (loss) fromcontinuing operations $ 188 $ 101 $ 101 $ 37 $ 28 $ – $ 455
Total net income (loss) fromdiscontinued operation (Note 3) $ – $ – $ – $ – $ – $ – $ –
2013Gross premiums:
Annuities $ 525 $ 131 $ – $ – $ 62 $ – $ 718
Life insurance 832 615 – 187 23 – 1,657
Health insurance 927 402 – 3 2 – 1,334
Total gross premiums 2,284 1,148 – 190 87 – 3,709
Less: ceded premiums 1,207 114 – 8 6 – 1,335
Net investment income (loss) (928) (512) (5) (323) (266) (14) (2,048)
Fee income 196 40 590 45 35 (14) 892
Total revenue 345 562 585 (96) (150) (28) 1,218Less:
Total benefits and expenses 65 431 462 (153) (87) (28) 690
Income tax expense (benefit) 62 12 61 11 (38) – 108
Total net income (loss) fromcontinuing operations $ 218 $ 119 $ 62 $ 46 $ (25) $ – $ 420
Total net income (loss) fromdiscontinued operation (Note 3) $ – $ 28 $ – $ – $ (20) $ – $ 8
42 Sun Life Financial Inc. Second Quarter 2014 CONDENSED NOTES TO THE INTERIM CONSOLIDATED FINANCIAL STATEMENTS (UNAUDITED)

8/12/2019 Sun Life: H1/Q2 results
http://slidepdf.com/reader/full/sun-life-h1q2-results 11/27
Results by segment for the six months ended June 30 are as follows:
SLFCanada
SLFU.S. MFS
SLF Asia Corporate
Consolidationadjustments Total
2014
Gross premiums:
Annuities $ 884 $ 138 $ – $ – $ 12 $ – $ 1,034
Life insurance 1,750 1,268 – 369 52 – 3,439
Health insurance 1,959 952 – 7 5 – 2,923
Total gross premiums 4,593 2,358 – 376 69 – 7,396
Less: ceded premiums 2,518 249 – 16 13 – 2,796
Net investment income (loss) 3,345 1,761 1 442 483 (28) 6,004
Fee income 437 88 1,484 107 86 (31) 2,171
Total revenue 5,857 3,958 1,485 909 625 (59) 12,775Less:
Total benefits and expenses 5,370 3,711 1,124 819 671 (59) 11,636
Income tax expense (benefit) 54 67 164 21 (55) – 251
Total net income (loss) from continuingoperations $ 433 $ 180 $ 197 $ 69 $ 9 $ – $ 888
Total net income (loss) fromdiscontinued operation (Note 3) $ – $ – $ – $ – $ – $ – $ –
2013
Gross premiums:
Annuities $ 819 $ 256 $ – $ – $ 119 $ – $ 1,194
Life insurance 1,639 1,157 – 358 50 – 3,204
Health insurance 1,905 804 – 5 5 – 2,719
Total gross premiums 4,363 2,217 – 363 174 – 7,117
Less: ceded premiums 2,452 225 – 21 12 – 2,710
Net investment income (loss) (456) (511) (5) 5 (141) (27) (1,135)
Fee income 389 76 1,143 85 70 (27) 1,736
Total revenue 1,844 1,557 1,138 432 91 (54) 5,008Less:
Total benefits and expenses 1,241 1,365 912 315 183 (54) 3,962
Income tax expense (benefit) 115 7 115 20 (64) – 193Total net income (loss) from continuing
operations $ 488 $ 185 $ 111 $ 97 $ (28) $ – $ 853
Total net income (loss) fromdiscontinued operation (Note 3) $ – $ 143 $ – $ – $ (32) $ – $ 111
CONDENSED NOTES TO THE INTERIM CONSOLIDATED FINANCIAL STATEMENTS (UNAUDITED) Sun Life Financial Inc. Second Quarter 2014

8/12/2019 Sun Life: H1/Q2 results
http://slidepdf.com/reader/full/sun-life-h1q2-results 12/27
5. Total Invested Assets and Related Net Investment Income
5.A Asset Classification
The carrying values of our debt securities, equity securities and other invested assets presented in our Interim ConsolidatedStatements of Financial Position consist of the following:
As at
Fair valuethrough profit
or loss Available-
for-sale Other (1) Total
June 30, 2014
Debt securities $ 48,438 $ 12,575 $ – $ 61,013
Equity securities $ 4,225 $ 856 $ – $ 5,081
Other invested assets $ 1,115 $ 112 $ 828 $ 2,055
December 31, 2013
Debt securities $ 43,662 $ 11,151 $ – $ 54,813
Equity securities $ 4,342 $ 852 $ – $ 5,194
Other invested assets $ 1,034 $ 105 $ 716 $ 1,855(1) Other consists primarily of investments accounted for using the equity method of accounting.
5.B Change in Fair Value Through Profit or Loss Assets and Liabilities
Change in fair value through profit or loss assets and liabilities recorded to net income consists of the following:
For the three months ended For the six months ended
June 30,2014
June 30,2013
June 30,2014
June 30,2013
Cash, cash equivalents and short-term securities $ (2) $ 1 $ 4 $ 2
Debt securities 959 (2,345) 2,418 (2,447)
Equity securities 174 (130) 330 (4)
Derivative investments 647 (916) 554 (1,339)
Other invested assets – 7 31 31
Investment properties 36 27 97 53
Total change in fair value through profit or loss assetsand liabilities $ 1,814 $ (3,356) $ 3,434 $ (3,704)
5.C Impairment of Available-For-Sale Assets
We recognized impairment losses on available-for-sale assets of $1 and $15 during the three and six months ended June 30, 2014,respectively ($2 and $8 for the three and six months ended June 30, 2013).
5.D Cash, Cash Equivalents and Short-Term Securities
Cash, cash equivalents and short-term securities presented in our Interim Consolidated Statements of Financial Position and Netcash, cash equivalents and short-term securities presented in our Interim Consolidated Statements of Cash Flows consist of thefollowing:
As atJune 30,
2014December 31,
2013June 30,
2013
Cash $ 962 $ 1,374 $ 1,190Cash equivalents 2,004 1,996 1,752
Short-term securities 2,850 4,266 3,148
Cash, cash equivalents and short-term securities 5,816 7,636 6,090
Less: Bank overdraft, recorded in Other liabilities 75 46 393
Net cash, cash equivalents and short-term securities $ 5,741 $ 7,590 $ 5,697
5.E Mortgage Securitization
We securitize certain insured fixed rate commercial mortgages through the creation of mortgage-backed securities under theNational Housing Act Mortgage-Backed Securities (“NHA MBS”) Program sponsored by the Canada Mortgage and Housing
44 Sun Life Financial Inc. Second Quarter 2014 CONDENSED NOTES TO THE INTERIM CONSOLIDATED FINANCIAL STATEMENTS (UNAUDITED)

8/12/2019 Sun Life: H1/Q2 results
http://slidepdf.com/reader/full/sun-life-h1q2-results 13/27
Corporation (“CMHC”). The NHA MBS are then sold to Canada Housing Trust, a government-sponsored security trust that issuessecurities to third-party investors under the Canadian Mortgage Bond (“CMB”) Program. The securitization of these assets does notqualify for derecognition as we have not transferred substantially all of the risks and rewards of ownership. Specifically, we continueto be exposed to pre-payment and interest rate risk associated with these assets. There are no expected credit losses on thesecuritized mortgages as the mortgages were already insured by the CMHC prior to securitization. These assets continue to berecognized as Mortgages and loans in our Interim Consolidated Statements of Financial Position. Proceeds from securitizationtransactions are recognized as secured borrowings and included in Other liabilities in our Interim Consolidated Statements of Financial Position.
Receipts of principal on the securitized mortgages are deposited into a principal reinvestment account (“PRA”) to meet our
repayment obligation upon maturity under the CMB program. The assets in the PRA are typically comprised of cash and cashequivalents and certain asset-backed securities. We are exposed to reinvestment risk due to the amortizing nature of the securitizedmortgages relative to our repayment obligation for the full principal amount due at maturity. We mitigate the reinvestment risk usinginterest rate swaps.
The carrying value and fair value of the securitized mortgages as at June 30, 2014 are $270 and $277, respectively ($55 and $55 asat December 31, 2013). The carrying value and fair value of the associated liabilities as at June 30, 2014 are $268 and $275,respectively ($55 and $55 as at December 31, 2013).
5.F Fair Value Measurement
The fair value methodologies and assumptions for assets and liabilities carried at fair value as well as disclosures on unobservableinputs, sensitivities and valuation processes for Level 3 assets can be found in Note 5 of our 2013 Annual Consolidated FinancialStatements.
5.F.i Fair Value Hierarchy
We categorize our assets and liabilities carried at fair value, based on the priority of the inputs to the valuation techniques used tomeasure fair value, into a three-level fair value hierarchy as follows:
Level 1: Fair value is based on the unadjusted quoted prices for identical assets or liabilities in an active market. The types of assetsand liabilities classified as Level 1 generally include cash and cash equivalents, certain U.S. government and agency securities,exchange-traded equity securities and certain segregated and mutual fund units held for account of segregated fund holders.
Level 2: Fair value is based on quoted prices for similar assets or liabilities in active markets, valuation that is based on significantobservable inputs, or inputs that are derived principally from or corroborated with observable market data through correlation or other means. The types of assets and liabilities classified as Level 2 generally include Canadian federal, provincial and municipalgovernment, other foreign government and corporate debt securities, certain asset-backed securities, over-the-counter derivatives,and certain segregated and mutual fund units held for account of segregated fund holders.
Level 3: Fair value is based on valuation techniques that require one or more significant inputs that are not based on observablemarket inputs. These unobservable inputs reflect our expectations about the assumptions market participants would use in pricingthe asset or liability. The types of assets and liabilities classified as Level 3 generally include certain corporate bonds, certain other invested assets, and investment properties.
Our assets and liabilities that are carried at fair value on a recurring basis by hierarchy level are as follows:
As at June 30, 2014 Level 1 Level 2 Level 3 Total
Assets
Cash, cash equivalents and short-term securities $ 4,718 $ 1,098 $ – $ 5,816
Debt securities – fair value through profit or loss 1,096 46,592 750 48,438
Debt securities – available-for-sale 289 12,089 197 12,575
Equity securities – fair value through profit or loss 3,290 812 123 4,225
Equity securities – available-for-sale 732 124 – 856
Derivative assets 10 1,266 – 1,276Other invested assets 509 28 690 1,227
Investment properties – – 6,054 6,054
Total invested assets $ 10,644 $ 62,009 $ 7,814 $ 80,467
Investments for account of segregated fund holders $ 27,429 $ 54,489 $ 543 $ 82,461
Total assets measured at fair value $ 38,073 $ 116,498 $ 8,357 $ 162,928
Liabilities
Investment contract liabilities $ – $ 12 $ 7 $ 19
Derivative liabilities 3 776 – 779
Total liabilities measured at fair value $ 3 $ 788 $ 7 $ 798
CONDENSED NOTES TO THE INTERIM CONSOLIDATED FINANCIAL STATEMENTS (UNAUDITED) Sun Life Financial Inc. Second Quarter 2014
8/12/2019 Sun Life: H1/Q2 results
http://slidepdf.com/reader/full/sun-life-h1q2-results 14/27
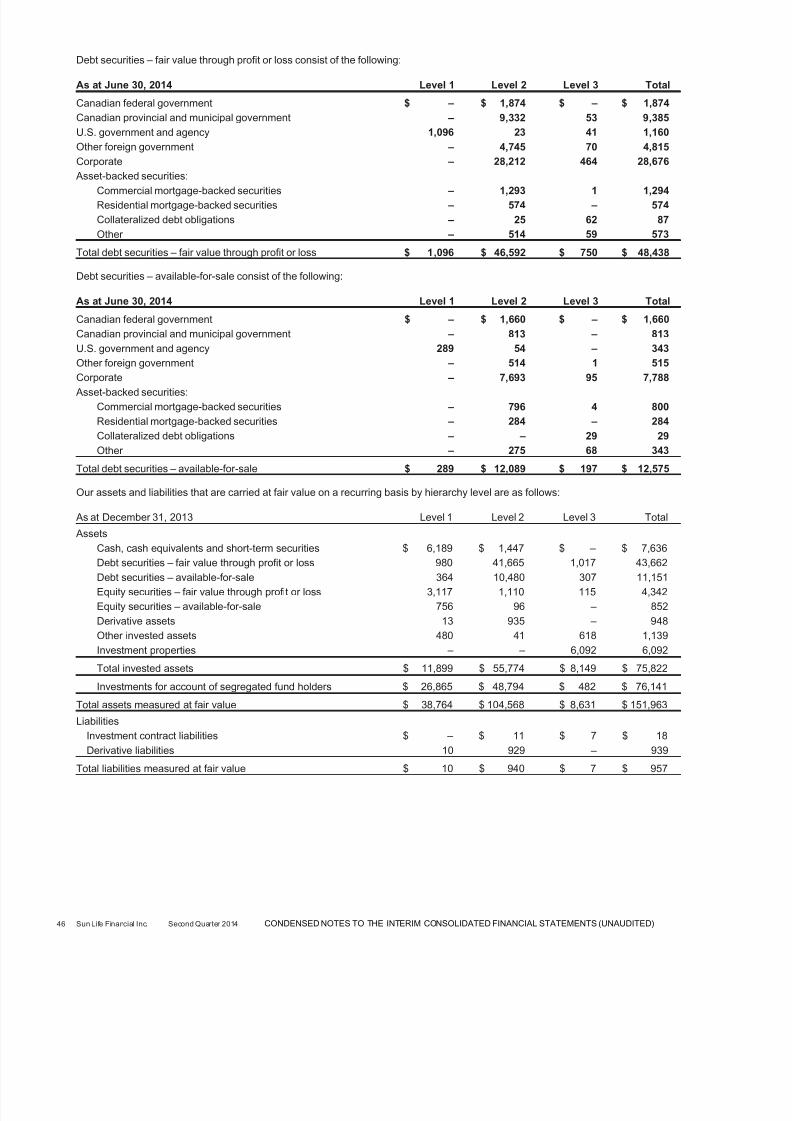
Debt securities – fair value through profit or loss consist of the following:
As at June 30, 2014 Level 1 Level 2 Level 3 Total
Canadian federal government $ – $ 1,874 $ – $ 1,874
Canadian provincial and municipal government – 9,332 53 9,385
U.S. government and agency 1,096 23 41 1,160
Other foreign government – 4,745 70 4,815
Corporate – 28,212 464 28,676
Asset-backed securities:
Commercial mortgage-backed securities – 1,293 1 1,294
Residential mortgage-backed securities – 574 – 574
Collateralized debt obligations – 25 62 87
Other – 514 59 573
Total debt securities – fair value through profit or loss $ 1,096 $ 46,592 $ 750 $ 48,438
Debt securities – available-for-sale consist of the following:
As at June 30, 2014 Level 1 Level 2 Level 3 Total
Canadian federal government $ – $ 1,660 $ – $ 1,660
Canadian provincial and municipal government – 813 – 813
U.S. government and agency 289 54 – 343
Other foreign government – 514 1 515
Corporate – 7,693 95 7,788
Asset-backed securities:
Commercial mortgage-backed securities – 796 4 800
Residential mortgage-backed securities – 284 – 284
Collateralized debt obligations – – 29 29
Other – 275 68 343
Total debt securities – available-for-sale $ 289 $ 12,089 $ 197 $ 12,575
Our assets and liabilities that are carried at fair value on a recurring basis by hierarchy level are as follows:
As at December 31, 2013 Level 1 Level 2 Level 3 Total
Assets
Cash, cash equivalents and short-term securities $ 6,189 $ 1,447 $ – $ 7,636
Debt securities – fair value through profit or loss 980 41,665 1,017 43,662
Debt securities – available-for-sale 364 10,480 307 11,151
Equity securities – fair value through profit or loss 3,117 1,110 115 4,342
Equity securities – available-for-sale 756 96 – 852
Derivative assets 13 935 – 948
Other invested assets 480 41 618 1,139
Investment properties – – 6,092 6,092
Total invested assets $ 11,899 $ 55,774 $ 8,149 $ 75,822
Investments for account of segregated fund holders $ 26,865 $ 48,794 $ 482 $ 76,141
Total assets measured at fair value $ 38,764 $ 104,568 $ 8,631 $ 151,963
Liabilities
Investment contract liabilities $ – $ 11 $ 7 $ 18
Derivative liabilities 10 929 – 939
Total liabilities measured at fair value $ 10 $ 940 $ 7 $ 957
46 Sun Life Financial Inc. Second Quarter 2014 CONDENSED NOTES TO THE INTERIM CONSOLIDATED FINANCIAL STATEMENTS (UNAUDITED)

8/12/2019 Sun Life: H1/Q2 results
http://slidepdf.com/reader/full/sun-life-h1q2-results 15/27
Debt securities – fair value through profit or loss consist of the following:
As at December 31, 2013 Level 1 Level 2 Level 3 Total
Canadian federal government $ – $ 1,873 $ 1 $ 1,874
Canadian provincial and municipal government – 8,448 40 8,488
U.S. government and agency 980 59 9 1,048
Other foreign government – 4,476 65 4,541
Corporate – 24,511 779 25,290
Asset-backed securities:
Commercial mortgage-backed securities – 1,214 6 1,220
Residential mortgage-backed securities – 521 3 524
Collateralized debt obligations – 25 71 96
Other – 538 43 581
Total debt securities – fair value through profit or loss $ 980 $ 4 1,665 $ 1,017 $ 4 3,662
Debt securities – available-for-sale consist of the following:
As at December 31, 2013 Level 1 Level 2 Level 3 Total
Canadian federal government $ – $ 997 $ – $ 997
Canadian provincial and municipal government – 534 – 534
U.S. government and agency 364 50 – 414
Other foreign government – 477 – 477
Corporate – 7,322 243 7,565
Asset-backed securities:
Commercial mortgage-backed securities – 549 22 571
Residential mortgage-backed securities – 252 – 252
Collateralized debt obligations – – 2 2
Other – 299 40 339
Total debt securities – available-for-sale $ 364 $ 10,480 $ 307 $ 11,151
There were no significant transfers between Level 1 and Level 2 for the three and six months ended June 30, 2014 andJune 30, 2013.
CONDENSED NOTES TO THE INTERIM CONSOLIDATED FINANCIAL STATEMENTS (UNAUDITED) Sun Life Financial Inc. Second Quarter 2014

8/12/2019 Sun Life: H1/Q2 results
http://slidepdf.com/reader/full/sun-life-h1q2-results 16/27
The following table provides a reconciliation of the beginning and ending balances for assets and liabilities that are categorized inLevel 3 for the three months ended June 30, 2014:
Beginningbalance
Includedin net
income(1)(3)Includedin OCI(3) Purchases Sales Settlements
Transfersinto
Level 3(2)
Transfers(out) of
Level 3(2)
Foreigncurrency
translation(4)Ending
balance
Gains(losses)
included inearnings
relating toinstruments
still held atthe reporting
date(1)
Assets
Debt securities – fair value through profit
or loss $ 1,189 $ (4) $ – $ 98 $ (14) $ (19) $ 64 $ (550) $ (14) $ 750 $ (3)
Debt securities –
available-for-sale 309 – 2 32 (8) (22) – (110) (6) 197 2
Equity securities –
fair value through
profit or loss 119 6 – – – – – – (2) 123 6
Derivative assets – – – – – – – – – – –
Other invested
assets 679 (16) 3 46 (20) – – – (2) 690 (16)
Investment properties 6,104 28 – 49 (73) – – – (54) 6,054 31
Total invested assets $ 8,400 $ 14 $ 5 $ 225 $ (115) $ (41) $ 64 $ (660) $ (78) $ 7,814 $ 20
Investments for
account of
segregated fund
holders 520 9 – 28 (10) – – – (4) 543 14
Total assets measured at
fair value $ 8,920 $ 23 $ 5 $ 253 $ (125) $ (41) $ 64 $ (660) $ (82) $ 8,357 $ 34
Liabilities(5)
Investment contract
liabilities $ 7 $ – $ – $ – $ – $ – $ – $ – $ – 7 $ –
Derivative liabilities – – – – – – – – – – –
Total liabilities measured
at fair value $ 7 $ – $ – $ – $ – $ – $ – $ – $ – $ 7 $ –
(1) Included in Net investment income (loss) in our Interim Consolidated Statements of Operations.(2) Transfers into Level 3 occur when the inputs used to price the assets and liabilities lack observable market data and as a result, no longer meet the
Level 1 or 2 definitions at the reporting date. Transfers out of Level 3 occur when the pricing inputs become more transparent and satisfy theLevel 1 or 2 criteria and are primarily the result of observable market data being available at the reporting date, thus removing the requirement torely on inputs that lack observability.
(3) Total gains and losses in net income (loss) and OCI are calculated assuming transfers into or out of Level 3 occur at the beginning of the period.For an asset or liability that transfers into Level 3 during the reporting period, the entire change in fair value for the period is included in the tableabove. For transfers out of Level 3 during the reporting period, the change in fair value for the period is excluded from the table above.
(4) Foreign currency translation relates to the foreign exchange impact of translating from functional currencies of Level 3 assets and liabilities inforeign subsidiaries to Canadian dollars.
(5) For liabilities, gains are indicated by negative numbers.
48 Sun Life Financial Inc. Second Quarter 2014 CONDENSED NOTES TO THE INTERIM CONSOLIDATED FINANCIAL STATEMENTS (UNAUDITED)
8/12/2019 Sun Life: H1/Q2 results
http://slidepdf.com/reader/full/sun-life-h1q2-results 17/27
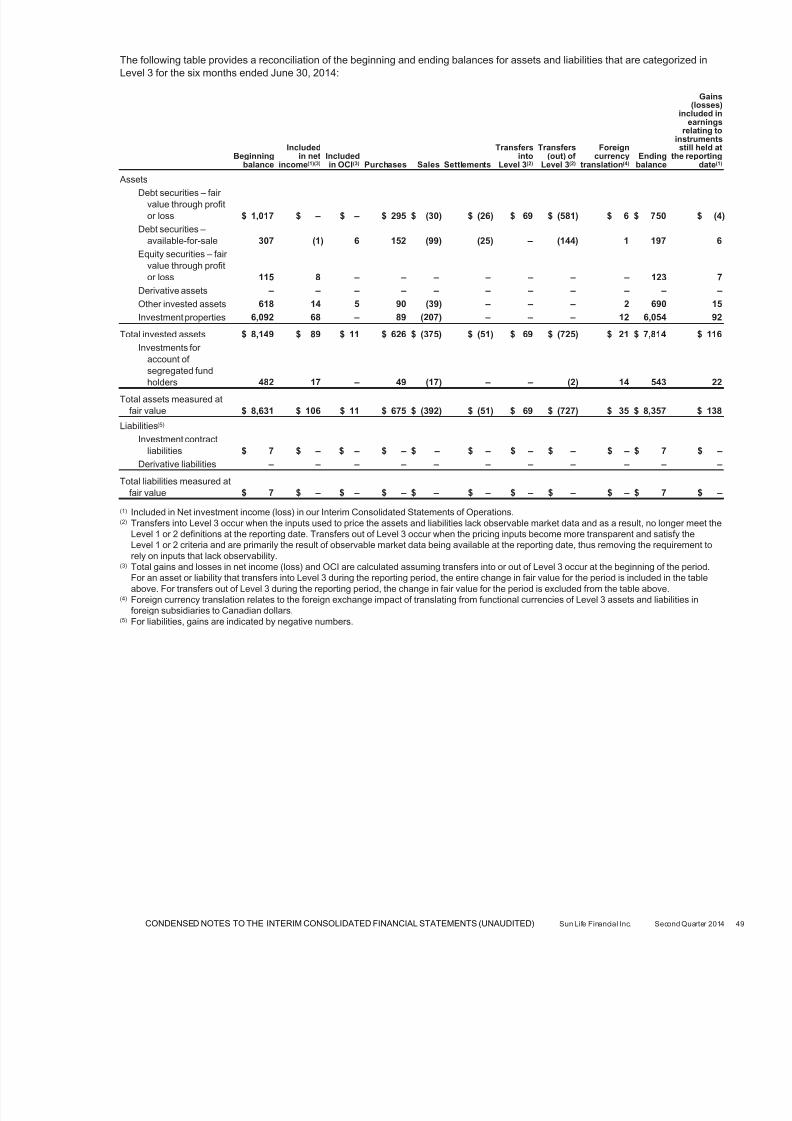
The following table provides a reconciliation of the beginning and ending balances for assets and liabilities that are categorized inLevel 3 for the six months ended June 30, 2014:
Beginningbalance
Includedin net
income(1)(3)Includedin OCI(3) Purchases Sales Settlements
Transfersinto
Level 3(2)
Transfers(out) of
Level 3(2)
Foreigncurrency
translation(4)Ending
balance
Gains(losses)
included inearnings
relating toinstruments
still held atthe reporting
date(1)
Assets
Debt securities – fair
value through profit
or loss $ 1,017 $ – $ – $ 295 $ (30) $ (26) $ 69 $ (581) $ 6 $ 750 $ (4
Debt securities –
available-for-sale 307 (1) 6 152 (99) (25) – (144) 1 197 6
Equity securities – fair
value through profit
or loss 115 8 – – – – – – – 123 7
Derivative assets – – – – – – – – – – –
Other invested assets 618 14 5 90 (39) – – – 2 690 15
Investment properties 6,092 68 – 89 (207) – – – 12 6,054 92
Total invested assets $ 8,149 $ 89 $ 11 $ 626 $ (375) $ (51) $ 69 $ (725) $ 21 $ 7,814 $ 116
Investments for
account of
segregated fundholders 482 17 – 49 (17) – – (2) 14 543 22
Total assets measured at
fair value $ 8,631 $ 106 $ 11 $ 675 $ (392) $ (51) $ 69 $ (727) $ 35 $ 8,357 $ 138
Liabilities(5)
Investment contract
liabilities $ 7 $ – $ – $ – $ – $ – $ – $ – $ – $ 7 $ –
Derivative liabilities – – – – – – – – – – –
Total liabilities measured at
fair value $ 7 $ – $ – $ – $ – $ – $ – $ – $ – $ 7 $ –
(1) Included in Net investment income (loss) in our Interim Consolidated Statements of Operations.(2) Transfers into Level 3 occur when the inputs used to price the assets and liabilities lack observable market data and as a result, no longer meet the
Level 1 or 2 definitions at the reporting date. Transfers out of Level 3 occur when the pricing inputs become more transparent and satisfy theLevel 1 or 2 criteria and are primarily the result of observable market data being available at the reporting date, thus removing the requirement to
rely on inputs that lack observability.(3) Total gains and losses in net income (loss) and OCI are calculated assuming transfers into or out of Level 3 occur at the beginning of the period.
For an asset or liability that transfers into Level 3 during the reporting period, the entire change in fair value for the period is included in the tableabove. For transfers out of Level 3 during the reporting period, the change in fair value for the period is excluded from the table above.
(4) Foreign currency translation relates to the foreign exchange impact of translating from functional currencies of Level 3 assets and liabilities inforeign subsidiaries to Canadian dollars.
(5) For liabilities, gains are indicated by negative numbers.
CONDENSED NOTES TO THE INTERIM CONSOLIDATED FINANCIAL STATEMENTS (UNAUDITED) Sun Life Financial Inc. Second Quarter 2014

8/12/2019 Sun Life: H1/Q2 results
http://slidepdf.com/reader/full/sun-life-h1q2-results 18/27
The following table provides a reconciliation of the beginning and ending balances for assets and liabilities that are categorized inLevel 3 for the three months ended June 30, 2013:
Beginningbalance
Includedin net
income(1)(3)Includedin OCI(3) Purchases Sales Settlements
Transfersinto
Level 3(2)
Transfers(out) of
Level 3(2)
Foreigncurrency
translation(4)Ending
balance
Gains(losses)
included inearnings
relating toinstruments
still held atthe reporting
date(1)
Assets
Debt securities – fair value through
profit or loss $ 1,071 $ (36) $ – $ 343 $ (26) $ (34) $ 109 $ (31) $ 25 $ 1,421 $ (17)
Debt securities –
available-for-sale 56 (13) (2) 73 (1) (1) 48 – 4 164 (1)
Equity securities –
fair value through profit
or loss 113 6 – – – – – – 3 122 7
Derivative assets 7 – – – – – – – – 7 –
Other invested assets 560 12 9 50 (23) – – – 2 610 21
Investment properties 6,026 20 – 75 (54) – – – 51 6,118 36
Total invested assets $ 7,833 $ (11) $ 7 $ 541 $ (104) $ (35) $ 157 $ (31) $ 85 $ 8,442 $ 46
Investments for
account of segregated fund
holders 438 6 – 7 (9) – 2 – 10 454 7
Total assets measured at fair value $ 8,271 $ (5) $ 7 $ 548 $ (113) $ (35) $ 159 $ (31) $ 95 $ 8,896 $ 53
Liabilities(5)
Investment contractliabilities $ 6 $ – $ – $ – $ – $ – $ – $ – $ – $ 6 $ –
Derivative liabilities 12 (2) – – – – – – – 10 –
Total liabilities
measured at fair value $ 18 $ (2) $ – $ – $ – $ – $ – $ – $ – $ 16 $ –
(1) Included in Net investment income (loss) in our Interim Consolidated Statements of Operations.(2) Transfers into Level 3 occur when the inputs used to price the assets and liabilities lack observable market data and as a result, no longer meet the
Level 1 or 2 definitions at the reporting date. Transfers out of Level 3 occur when the pricing inputs become more transparent and satisfy theLevel 1 or 2 criteria and are primarily the result of observable market data being available at the reporting date, thus removing the requirement torely on inputs that lack observability.
(3) Total gains and losses in net income (loss) and OCI are calculated assuming transfers into or out of Level 3 occur at the beginning of the period.For an asset or liability that transfers into Level 3 during the reporting period, the entire change in fair value for the period is included in the tableabove. For transfers out of Level 3 during the reporting period, the change in fair value for the period is excluded from the table above.
(4) Foreign currency translation relates to the foreign exchange impact of translating from functional currencies of Level 3 assets and liabilities inforeign subsidiaries to Canadian dollars.
(5) For liabilities, gains are indicated by negative numbers.
50 Sun Life Financial Inc. Second Quarter 2014 CONDENSED NOTES TO THE INTERIM CONSOLIDATED FINANCIAL STATEMENTS (UNAUDITED)

8/12/2019 Sun Life: H1/Q2 results
http://slidepdf.com/reader/full/sun-life-h1q2-results 19/27
The following table provides a reconciliation of the beginning and ending balances for assets and liabilities that are categorized inLevel 3 for the six months ended June 30, 2013:
Beginningbalance
Includedin net
income(1)(3)Includedin OCI(3) Purchases Sales Settlements
Transfersinto
Level 3(2)
Transfers(out) of
Level 3(2)
Foreigncurrency
translation(4)Ending
balance
Gains(losses)
included inearnings
relating toinstruments
still held atthe reporting
date(1)
Assets
Debt securities – fair value through profit
or loss $ 1,141 $ (17) $ – $ 351 $ (27) $ (37) $ 74 $ (71) $ 7 $ 1,421 $ (17
Debt securities –
available-for-sale 123 1 (2) 73 (3) (12) – (20) 4 164 (1
Equity securities – fair
value through profit or
loss 110 7 – – – – – – 5 122 11
Derivative assets 7 – – – – – – – – 7 –
Other invested assets 547 20 7 73 (39) – – – 2 610 20
Investment properties 5,942 36 – 152 (93) – – – 81 6,118 63
Total invested assets $ 7,870 $ 47 $ 5 $ 649 $ (162) $ (49) $ 74 $ (91) $ 99 $ 8,442 $ 76
Investments for account of
segregated fund holders 427 13 – 24 (10) (1) 4 (2) (1) 454 13Total assets measured at fair
value $ 8,297 $ 60 $ 5 $ 673 $ (172) $ (50) $ 78 $ (93) $ 98 $ 8,896 $ 89
Liabilities(5)
Investment contract
liabilities $ 7 $ – $ – $ – $ – $ – $ – $ – $ (1) $ 6 $ –
Derivative liabilities 16 (6) – – – – – – – 10 –
Total liabilities measured at fair value $ 23 $ (6) $ – $ – $ – $ – $ – $ – $ (1) $ 16 $ –
(1) Included in Net investment income (loss) in our Interim Consolidated Statements of Operations.(2) Transfers into Level 3 occur when the inputs used to price the assets and liabilities lack observable market data and as a result, no longer meet the
Level 1 or 2 definitions at the reporting date. Transfers out of Level 3 occur when the pricing inputs become more transparent and satisfy theLevel 1 or 2 criteria and are primarily the result of observable market data being available at the reporting date, thus removing the requirement torely on inputs that lack observability.
(3) Total gains and losses in net income (loss) and OCI are calculated assuming transfers into or out of Level 3 occur at the beginning of the period.For an asset or liability that transfers into Level 3 during the reporting period, the entire change in fair value for the period is included in the tableabove. For transfers out of Level 3 during the reporting period, the change in fair value for the period is excluded from the table above.
(4) Foreign currency translation relates to the foreign exchange impact of translating from functional currencies of Level 3 assets and liabilities inforeign subsidiaries to Canadian dollars.
(5) For liabilities, gains are indicated by negative numbers.
6. Financial Instrument and Insurance Risk Management
Our risk management policies and procedures for managing risks related to financial instruments and insurance contracts can befound in Notes 6 and 7, respectively, of our 2013 Annual Consolidated Financial Statements.
Our financial instrument market risk sensitivities are included in our Management’s Discussion and Analysis (“MD&A”) for the threeand six months ended June 30, 2014. The shaded text and tables in the Risk Management section of the MD&A represent our
disclosures on market risk sensitivities in accordance with IFRS 7 Financial Instruments: Disclosures and include discussions onhow we measure our risk and our objectives, policies and methodologies for managing this risk. Therefore, the shaded text andtables in the MD&A represent an integral part of these Interim Consolidated Financial Statements.
CONDENSED NOTES TO THE INTERIM CONSOLIDATED FINANCIAL STATEMENTS (UNAUDITED) Sun Life Financial Inc. Second Quarter 2014
8/12/2019 Sun Life: H1/Q2 results
http://slidepdf.com/reader/full/sun-life-h1q2-results 20/27
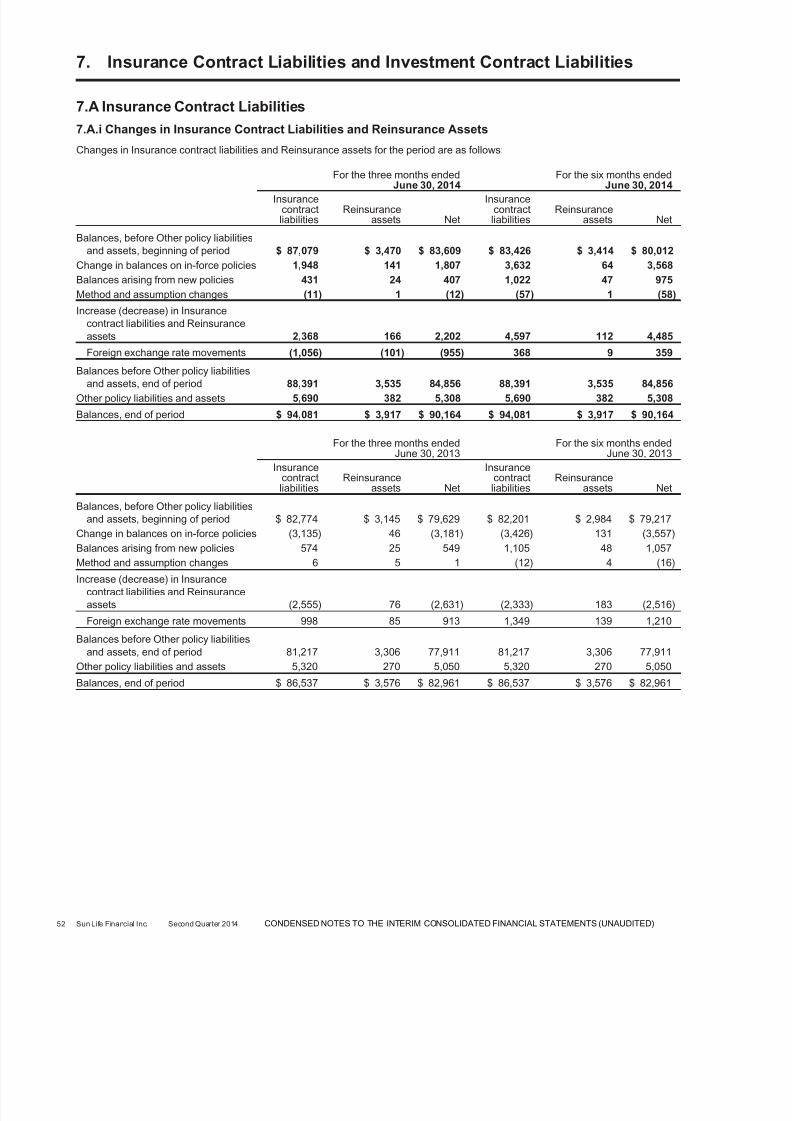
7. Insurance Contract Liabilities and Investment Contract Liabilities
7.A Insurance Contract Liabilities
7.A.i Changes in Insurance Contract Liabilities and Reinsurance Assets
Changes in Insurance contract liabilities and Reinsurance assets for the period are as follows:
For the three months ended
June 30, 2014
For the six months ended
June 30, 2014Insurance
contractliabilities
Reinsuranceassets Net
Insurancecontract
liabilitiesReinsurance
assets Net
Balances, before Other policy liabilitiesand assets, beginning of period $ 87,079 $ 3,470 $ 83,609 $ 83,426 $ 3,414 $ 80,012
Change in balances on in-force policies 1,948 141 1,807 3,632 64 3,568
Balances arising from new policies 431 24 407 1,022 47 975
Method and assumption changes (11) 1 (12) (57) 1 (58)
Increase (decrease) in Insurancecontract liabilities and Reinsuranceassets 2,368 166 2,202 4,597 112 4,485
Foreign exchange rate movements (1,056) (101) (955) 368 9 359
Balances before Other policy liabilitiesand assets, end of period 88,391 3,535 84,856 88,391 3,535 84,856
Other policy liabilities and assets 5,690 382 5,308 5,690 382 5,308
Balances, end of period $ 94,081 $ 3,917 $ 90,164 $ 94,081 $ 3,917 $ 90,164
For the three months endedJune 30, 2013
For the six months endedJune 30, 2013
Insurancecontract
liabilitiesReinsurance
assets Net
Insurancecontract
liabilitiesReinsurance
assets Net
Balances, before Other policy liabilitiesand assets, beginning of period $ 82,774 $ 3,145 $ 79,629 $ 82,201 $ 2,984 $ 79,217
Change in balances on in-force policies (3,135) 46 (3,181) (3,426) 131 (3,557)
Balances arising from new policies 574 25 549 1,105 48 1,057
Method and assumption changes 6 5 1 (12) 4 (16)
Increase (decrease) in Insurancecontract liabilities and Reinsuranceassets (2,555) 76 (2,631) (2,333) 183 (2,516)
Foreign exchange rate movements 998 85 913 1,349 139 1,210
Balances before Other policy liabilitiesand assets, end of period 81,217 3,306 77,911 81,217 3,306 77,911
Other policy liabilities and assets 5,320 270 5,050 5,320 270 5,050
Balances, end of period $ 86,537 $ 3,576 $ 82,961 $ 86,537 $ 3,576 $ 82,961
52 Sun Life Financial Inc. Second Quarter 2014 CONDENSED NOTES TO THE INTERIM CONSOLIDATED FINANCIAL STATEMENTS (UNAUDITED)

8/12/2019 Sun Life: H1/Q2 results
http://slidepdf.com/reader/full/sun-life-h1q2-results 21/27
7.B Investment Contract Liabilities
7.B.i Changes in Investment Contract Liabilities
Changes in investment contract liabilities without discretionary participation features (“DPF”) are as follows:
For the three months endedJune 30, 2014
For the six months endedJune 30, 2014
Measured atfair value
Measured atamortized
costMeasured at
fair value
Measured atamortized
cost
Balances, beginning of period $ 18 $ 2,089 $ 18 $ 2,000
Deposits – 88 – 264
Interest – 11 – 21
Withdrawals – (104) – (208)
Fees – (1) – (2)
Change in fair value 1 – 1 –
Other 1 6 1 12
Foreign exchange rate movements (1) (1) (1) 1
Balances, end of period $ 19 $ 2,088 $ 19 $ 2,088
For the three months endedJune 30, 2013
For the six months endedJune 30, 2013
Measured atfair value
Measured atamortizedcost
Measured atfair value
Measured atamortizedcost
Balances, beginning of period $ 17 $ 1,830 $ 35 $ 1,772
Deposits – 142 – 281
Interest – 10 – 17
Withdrawals – (88) (14) (181)
Fees – (1) – (2)
Other – 5 (4) 10
Foreign exchange rate movements – 1 – 2
Balances, end of period $ 17 $ 1,899 $ 17 $ 1,899
Changes in investment contract liabilities with DPF are as follows:
For the three months ended For the six months endedJune 30,
2014June 30,
2013June 30,
2014June 30,
2013
Balances, beginning of period $ 628 $ 511 $ 584 $ 496
Change in liabilities on in-force policies 10 (21) 13 (29)
Liabilities arising from new policies 3 27 21 44
Increase (decrease) in liabilities 13 6 34 15
Foreign exchange rate movements (19) 20 4 26
Balances, end of period $ 622 $ 537 $ 622 $ 537
7.C Gross Claims and Benefits Paid
Gross claims and benefits paid consist of the following:
For the three months ended For the six months ended
June 30,2014
June 30,2013
June 30,2014
June 30,2013
Maturities and surrenders $ 699 $ 726 $ 1,488 $ 1,422
Annuity payments 320 287 632 569
Death and disability benefits 808 746 1,609 1,482
Health benefits 1,036 960 2,055 1,912
Policyholder dividends and interest on claims anddeposits 273 328 555 573
Total gross claims and benefits paid $ 3,136 $ 3,047 $ 6,339 $ 5,958
CONDENSED NOTES TO THE INTERIM CONSOLIDATED FINANCIAL STATEMENTS (UNAUDITED) Sun Life Financial Inc. Second Quarter 2014

8/12/2019 Sun Life: H1/Q2 results
http://slidepdf.com/reader/full/sun-life-h1q2-results 22/27
8. Reinsurance
Reinsurance (expenses) recoveries are comprised of the following:
For the three months ended For the six months ended
June 30,2014
June 30,2013
June 30,2014
June 30,2013
Recovered claims and benefits $ 1,167 $ 1,179 $ 2,318 $ 2,241
Commissions 14 12 26 24Reserve adjustments 41 (31) 77 32
Operating expenses and other 129 125 255 246
Reinsurance (expenses) recoveries $ 1,351 $ 1,285 $ 2,676 $ 2,543
9. Income Taxes
Our effective income tax rate differs from the combined Canadian federal and provincial statutory income tax rate as follows:
For the three months ended For the six months ended
June 30, 2014 June 30, 2013 June 30, 2014 June 30, 2013
% % % %Total net income (loss) $ 455 $ 420 $ 888 $ 853
Add: Income tax expense (benefit) 134 108 251 193
Total net income (loss) before incometaxes $ 589 $ 528 $ 1,139 $ 1,046
Taxes at the combined Canadian federaland provincial statutory income taxrate $ 156 26.5 $ 140 26.5 $ 302 26.5 $ 277 26.5
Increase (decrease) in rate resultingfrom:
Higher (lower) effective rates onincome subject to taxation inforeign jurisdictions 15 2.5 (14) (2.7) 40 3.5 (28) (2.7)
Tax (benefit) cost of unrecognizedtax losses 1 0.2 1 0.2 2 0.2 1 0.1
Tax-exempt investment income (32) (5.4) (12) (2.3) (77) (6.8) (51) (4.9)
Adjustments in respect of prior periods,including resolution of tax disputes (7) (1.2) (5) (0.9) (17) (1.5) (1) (0.1)
Other 1 0.2 (2) (0.3) 1 0.1 (5) (0.4)
Total tax expense (benefit) and effectiveincome tax rate $ 134 22.8 $ 108 20.5 $ 251 22 $ 193 18.5
Our statutory income tax rate in Canada is 26.5% (26.5% in 2013). Statutory income tax rates in other jurisdictions in which weconduct business range from 0% to 35% which creates a tax rate differential and corresponding tax provision difference comparedto the Canadian federal and provincial statutory rate when applied to foreign income not subject to tax in Canada. These differencesare reported in the line Higher (lower) effective rates on income subject to taxation in foreign jurisdictions.
Higher (lower) effective rates on income subject to taxation in foreign jurisdictions for the three and six months ended June 30, 2014reflects the impact of higher earnings in higher tax rate jurisdictions, predominantly in the U.S. The benefit reported in thecomparative periods in 2013 resulted from higher earnings in lower tax rate jurisdictions.
The benefit of lower taxes on investment income reported for the three and six months ended June 30, 2014 amounted to $32 and$77, respectively ($12 and $51 for the three and six months ended June 30, 2013) and reflects the impact of higher tax-exemptinvestment income in 2014, compared to 2013.
Adjustments in respect of prior periods, including resolution of tax disputes for the three and six months ended June 30, 2014,reflects a number of adjustments in various tax jurisdictions in relation to final settlement and closure of taxation years, finalizationof prior years’ income tax returns and successful resolution of tax audits.
54 Sun Life Financial Inc. Second Quarter 2014 CONDENSED NOTES TO THE INTERIM CONSOLIDATED FINANCIAL STATEMENTS (UNAUDITED)

8/12/2019 Sun Life: H1/Q2 results
http://slidepdf.com/reader/full/sun-life-h1q2-results 23/27
10. Capital Management
10.A CapitalOur capital base is structured to exceed minimum regulatory and internal capital targets and maintain strong credit and financialstrength ratings while maintaining a capital efficient structure. We strive to achieve an optimal capital structure by balancing the useof debt and equity financing. Capital is managed both on a consolidated basis under principles that consider all the risks associatedwith the business as well as at the business group level under the principles appropriate to the jurisdiction in which each operates.We manage the capital for all of our international subsidiaries on a local statutory basis in a manner commensurate with their
individual risk profiles. Further details on our capital and how it is managed are included in Note 22 of our 2013 AnnualConsolidated Financial Statements.
Sun Life Assurance is subject to the Minimum Continuing Capital and Surplus Requirements (“MCCSR”) of the Office of theSuperintendent of Financial Institutions, Canada (“OSFI”). Sun Life Assurance’s MCCSR ratio as at June 30, 2014 was above theminimum levels that would require any regulatory or corrective action. In the U.S., Sun Life Assurance operates through a branchwhich is subject to U.S. regulatory supervision and it exceeded the levels under which regulatory action would be required as atJune 30, 2014. In addition, other subsidiaries of SLF Inc. that must comply with local capital or solvency requirements in the
jurisdiction in which they operate maintained capital levels above minimum local requirements as at June 30, 2014.
As of January 1, 2013, Sun Life Assurance elected the phase-in of the impact on available capital of adopting the revisions toIAS 19 Employee Benefits relating to cumulative changes in liabilities for defined benefit plans, as per OSFI’s 2013 MCCSRGuideline. Sun Life Assurance is phasing in a reduction of approximately $155 to its available capital over eight quarters, ending inthe fourth quarter of 2014.
Our capital base consists mainly of common shareholders’ equity, participating policyholders’ equity, preferred shareholders’ equityand certain other capital securities that qualify as regulatory capital.
10.B Significant Capital Transactions
10.B.i Subordinated Debt
On March 31, 2014, SLF Inc. redeemed all of the outstanding $500 principal amount of Series 2009-1 Subordinated Unsecured7.90% Fixed/Floating Debentures due 2019, at a redemption price equal to the principal amount together with accrued and unpaidinterest.
On May 13, 2014, SLF Inc. issued $250 principal amount of Series 2014-1 Subordinated Unsecured 2.77% Fixed/FloatingDebentures due 2024 (the “Debentures”). The net proceeds of $249 were used for general corporate purposes. The Debenturesbear interest at a fixed rate of 2.77% per annum payable in equal semi-annual instalments to, but excluding May 13, 2019, and,from May 13, 2019 to but excluding the maturity date, May 13, 2024, at a variable rate equal to the Canadian Dealer Offered Rate
plus 0.75% per annum payable in quarterly instalments. At SLF Inc.’s option, and subject to prior approval of OSFI, SLF Inc. mayredeem the Debentures, in whole or in part, on or after May 13, 2019 at a redemption price equal to par, together with accrued andunpaid interest to, but excluding, the date fixed for redemption. The Debentures are direct, unsecured subordinated obligations of SLF Inc. and rank equally and rateably with all other subordinated unsecured indebtedness of SLF Inc. The Debentures qualify ascapital for Canadian regulatory purposes.
10.B.ii Preferred Shares
On June 30, 2014, SLF Inc. redeemed all of its $250 Class A Non-Cumulative 5-Year Rate Reset Preferred Shares Series 6R at aredemption price of $25.00 per share, together with all declared and unpaid dividends. At redemption, we recorded $246 toPreferred shares and $4 to Retained earnings in our Interim Consolidated Statement of Changes in Equity.
10.B.iii Dividend Reinvestment and Share Purchase Plan
In the first two quarters of 2014, under the Dividend Reinvestment and Share Purchase Plan, SLF Inc. issued 1.2 million commonshares from treasury with no discount for dividend reinvestments (4.6 million common shares in the first two quarters of 2013 wereissued at a discount of 2% to the average market price). SLF Inc. also issued an insignificant number of common shares fromtreasury at no discount for optional cash purchases.
CONDENSED NOTES TO THE INTERIM CONSOLIDATED FINANCIAL STATEMENTS (UNAUDITED) Sun Life Financial Inc. Second Quarter 2014

8/12/2019 Sun Life: H1/Q2 results
http://slidepdf.com/reader/full/sun-life-h1q2-results 24/27

8/12/2019 Sun Life: H1/Q2 results
http://slidepdf.com/reader/full/sun-life-h1q2-results 25/27
Insurance contracts Investment contracts
For the six months endedJune 30,
2014June 30,
2013June 30,
2014June 30,
2013
Balances, beginning of period $ 69,088 $ 59,025 $ 7,053 $ 5,962
Additions to segregated funds:
Deposits 5,123 4,262 64 64
Net transfers (to) from general funds (6) (3) – –
Net realized and unrealized gains (losses) 4,563 2,740 (57) 357
Other investment income 419 354 112 100
Total additions $ 10,099 $ 7,353 $ 119 $ 521
Deductions from segregated funds:
Payments to policyholders and their beneficiaries 3,673 3,847 237 254
Management fees 370 338 44 33
Taxes and other expenses 61 58 4 8
Foreign exchange rate movements (249) (85) (242) –
Total deductions $ 3,855 $ 4,158 $ 43 $ 295
Net additions (deductions) $ 6,244 $ 3,195 $ 76 $ 226
Balances, end of period $ 75,332 $ 62,220 $ 7,129 $ 6,188
12. Commitments, Guarantees and Contingencies
Guarantees of Sun Life Assurance Preferred Shares and Subordinated Debentures
SLF Inc. has provided a guarantee on the $150 of 6.30% subordinated debentures due 2028 issued by Sun Life Assurance.Claims under this guarantee will rank equally with all other subordinated indebtedness of SLF Inc. SLF Inc. has also provided asubordinated guarantee of the preferred shares issued by Sun Life Assurance from time to time, other than such preferred shareswhich are held by SLF Inc. and its affiliates. Sun Life Assurance has no outstanding preferred shares subject to the guarantee. Asa result of these guarantees, Sun Life Assurance is entitled to rely on exemptive relief from most continuous disclosure and thecertification requirements of Canadian securities laws.
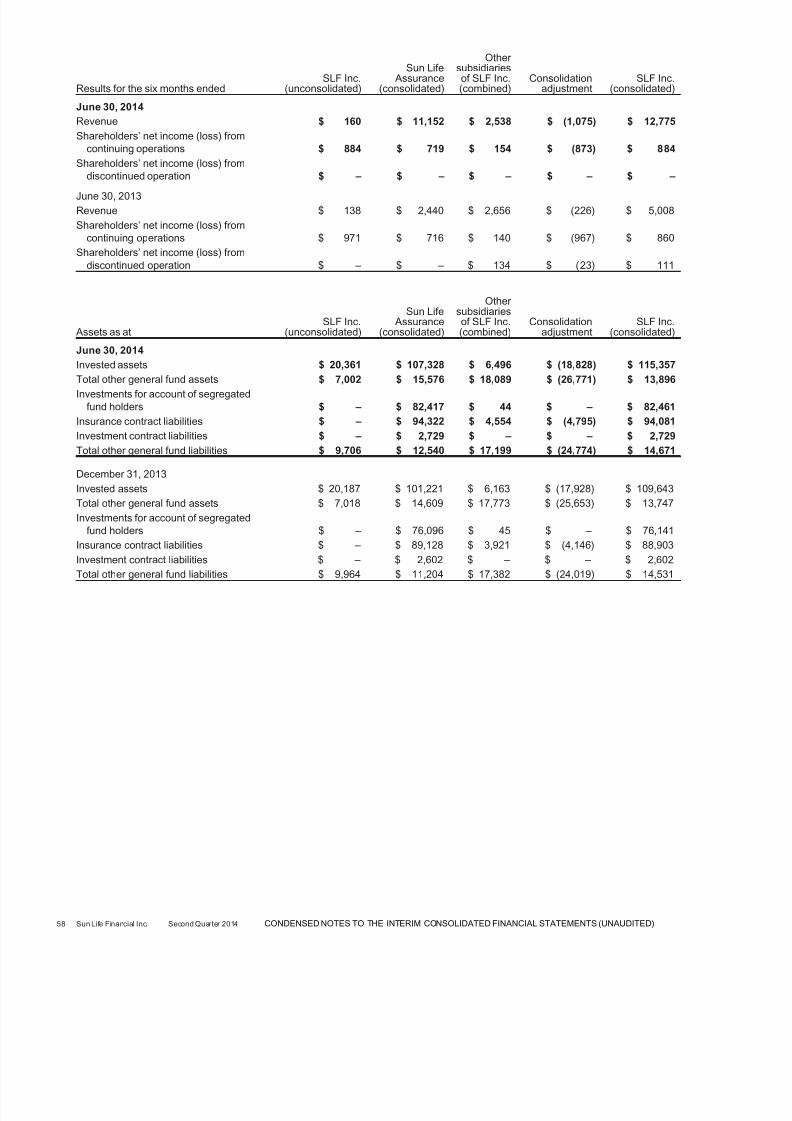
The following tables set forth certain consolidating summary financial information for SLF Inc. and Sun Life Assurance(Consolidated):
Results for the three months endedSLF Inc.
(unconsolidated)
Sun Life Assurance
(consolidated)
Other subsidiaries
of SLF Inc.(combined)
Consolidationadjustment
SLF Inc.(consolidated)
June 30, 2014
Revenue $ 166 $ 5,479 $ 1,255 $ (585) $ 6,315
Shareholders’ net income (loss) fromcontinuing operations $ 455 $ 349 $ 10 $ (359) $ 455
Shareholders’ net income (loss) fromdiscontinued operation $ – $ – $ – $ – $ –
June 30, 2013
Revenue $ 30 $ 586 $ 644 $ (42) $ 1,218
Shareholders’ net income (loss) fromcontinuing operations $ 429 $ 318 $ 149 $ (475) $ 421
Shareholders’ net income (loss) fromdiscontinued operation $ – $ – $ 20 $ (12) $ 8
CONDENSED NOTES TO THE INTERIM CONSOLIDATED FINANCIAL STATEMENTS (UNAUDITED) Sun Life Financial Inc. Second Quarter 2014
8/12/2019 Sun Life: H1/Q2 results
http://slidepdf.com/reader/full/sun-life-h1q2-results 26/27
Results for the six months endedSLF Inc.
(unconsolidated)
Sun Life Assurance
(consolidated)
Other subsidiaries
of SLF Inc.(combined)
Consolidationadjustment
SLF Inc.(consolidated)
June 30, 2014
Revenue $ 160 $ 11,152 $ 2,538 $ (1,075) $ 12,775
Shareholders’ net income (loss) fromcontinuing operations $ 884 $ 719 $ 154 $ (873) $ 884
Shareholders’ net income (loss) fromdiscontinued operation $ – $ – $ – $ – $ –
June 30, 2013
Revenue $ 138 $ 2,440 $ 2,656 $ (226) $ 5,008
Shareholders’ net income (loss) fromcontinuing operations $ 971 $ 716 $ 140 $ (967) $ 860
Shareholders’ net income (loss) fromdiscontinued operation $ – $ – $ 134 $ (23) $ 111
Assets as atSLF Inc.
(unconsolidated)
Sun Life Assurance
(consolidated)
Other subsidiaries
of SLF Inc.(combined)
Consolidationadjustment
SLF Inc.(consolidated)
June 30, 2014
Invested assets $ 20,361 $ 107,328 $ 6,496 $ (18,828) $ 115,357
Total other general fund assets $ 7,002 $ 15,576 $ 18,089 $ (26,771) $ 13,896
Investments for account of segregatedfund holders $ – $ 82,417 $ 44 $ – $ 82,461
Insurance contract liabilities $ – $ 94,322 $ 4,554 $ (4,795) $ 94,081
Investment contract liabilities $ – $ 2,729 $ – $ – $ 2,729
Total other general fund liabilities $ 9,706 $ 12,540 $ 17,199 $ (24,774) $ 14,671
December 31, 2013
Invested assets $ 20,187 $ 101,221 $ 6,163 $ (17,928) $ 109,643
Total other general fund assets $ 7,018 $ 14,609 $ 17,773 $ (25,653) $ 13,747
Investments for account of segregatedfund holders $ – $ 76,096 $ 45 $ – $ 76,141
Insurance contract liabilities $ – $ 89,128 $ 3,921 $ (4,146) $ 88,903
Investment contract liabilities $ – $ 2,602 $ – $ – $ 2,602
Total other general fund liabilities $ 9,964 $ 11,204 $ 17,382 $ (24,019) $ 14,531
58 Sun Life Financial Inc. Second Quarter 2014 CONDENSED NOTES TO THE INTERIM CONSOLIDATED FINANCIAL STATEMENTS (UNAUDITED)

8/12/2019 Sun Life: H1/Q2 results
http://slidepdf.com/reader/full/sun-life-h1q2-results 27/27
13. Earnings (Loss) Per Share
Details of the calculation of the net income (loss) and the weighted average number of shares used in the earnings per share(“EPS”) computations are as follows:
For the three months ended For the six months ended
June 30,2014
June 30,2013
June 30,2014
June 30,2013
Basic EPS:Common shareholders’ net income (loss) from continuing
operations $ 425 $ 391 $ 825 $ 801
Common shareholders’ net income (loss) from discontinuedoperation $ – $ 8 $ – $ 111
Weighted average number of common shares outstanding (inmillions) 611 603 610 602
Basic EPS:
Continuing operations $ 0.70 $ 0.65 $ 1. 35 $ 1.33
Discontinued operation $ – $ 0.01 $ – $ 0.18
Total $ 0.70 $ 0.66 $ 1. 35 $ 1.51
Diluted EPS:
Common shareholders’ net income (loss) from continuing
operations $ 425 $ 391 $ 825 $ 801 Add: increase in income due to convertible instruments(1) $ 2 $ 2 $ 5 $ 5
Common shareholders’ net income (loss) from continuingoperations on a diluted basis $ 427 $ 393 $ 830 $ 806
Common shareholders’ net income (loss) from discontinuedoperation $ – $ 8 $ – $ 111
Weighted average number of common shares outstanding (inmillions) 611 603 610 602
Add: dilutive impact of stock options(2) (in millions) 2 1 2 1
Add: dilutive impact of convertible securities(1) (in millions) 5 8 6 8
Weighted average number of common shares outstanding on adiluted basis (in millions) 618 612 618 611
Diluted EPS:Continuing operations $ 0.69 $ 0.64 $ 1. 34 $ 1.32
Discontinued operation $ – $ 0.01 $ – $ 0.18
Total $ 0.69 $ 0.65 $ 1. 34 $ 1.50
(1) The convertible instruments are the Sun Life ExchangEable Capital Securities (“SLEECS”) – Series B issued by Sun Life Capital Trust.(2) The number of stock options that have not been included in the weighted average number of common shares used in the calculation of diluted EPS
because these stock options were anti-dilutive amounted to 3 million for the three months and six months ended June 30, 2014 (7 million for thethree and six months ended June 30, 2013).