q2 & h1 fy20 earnings presentation - neogenchem.com
TRANSCRIPT
Neogen Chemicals Ltd. Q2 & H1 FY20 Earnings Presentation
November 2019
Safe Harbour
Certain statements in this document may be forward-looking statements. Such forward looking statements are subject to certain
risks and uncertainties like regulatory changes, local political or economic developments, and many other factors that could cause
our actual results to differ materially from those contemplated by the relevant forward-looking statements. Neogen Chemicals
Limited will not be in any way responsible for any action taken based on such statements and undertakes no obligation to publicly
update these forward-looking statements to reflect subsequent events or circumstances.
2
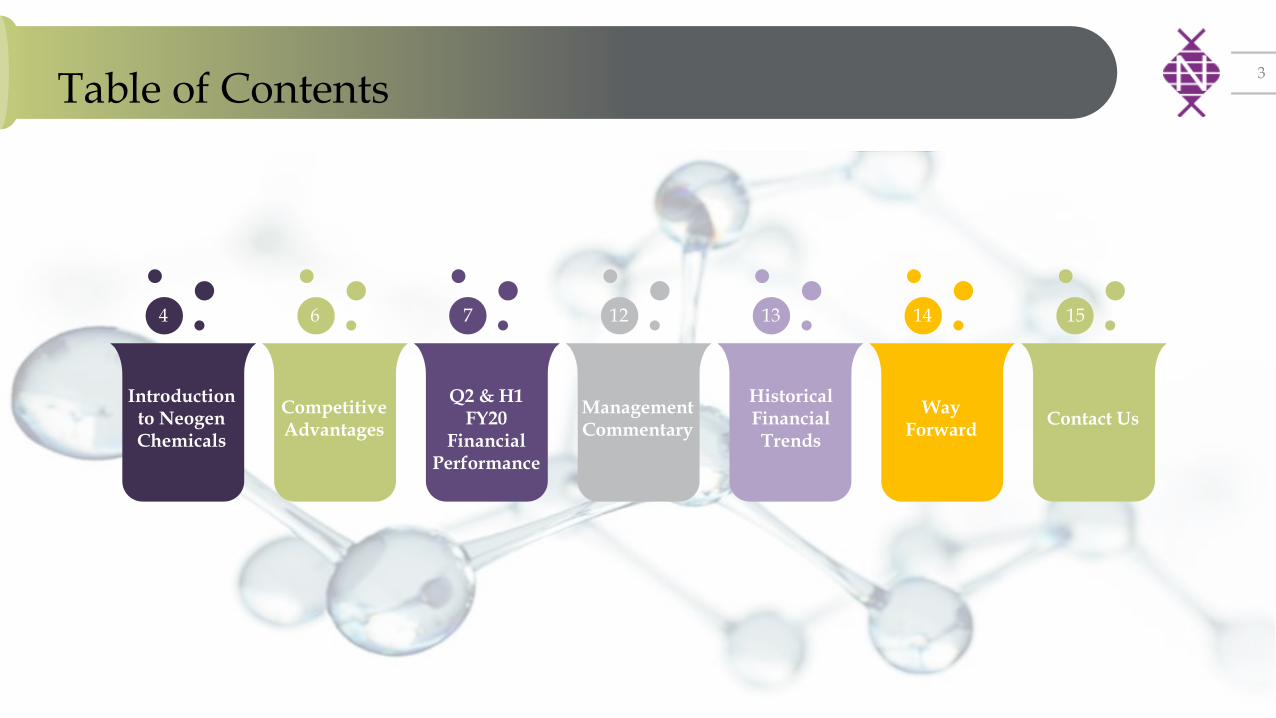
Table of Contents 3
Introduction to Neogen Chemicals
Competitive Advantages
Q2 & H1 FY20
Financial Performance
Management Commentary
Historical Financial
Trends
Way Forward
Contact Us
15 30 14 13 7 12 6 4
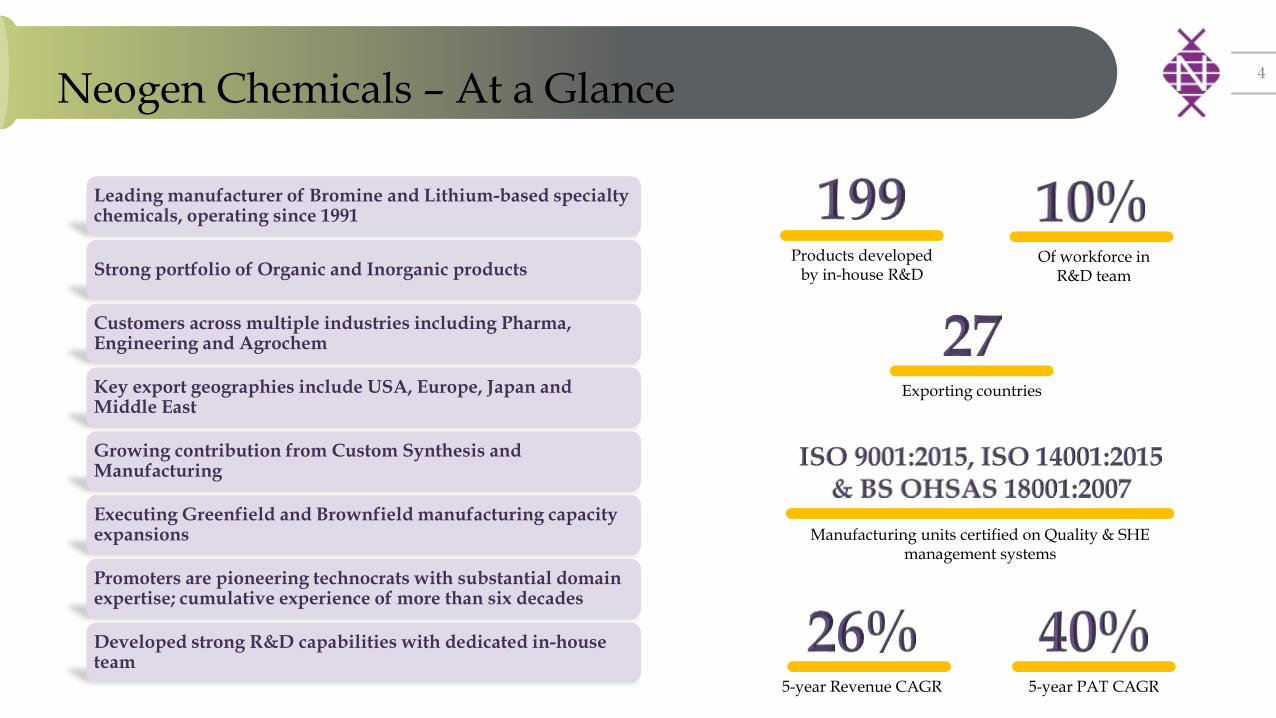
Neogen Chemicals – At a Glance 4
Products developed by in-house R&D
5-year Revenue CAGR 5-year PAT CAGR
Leading manufacturer of Bromine and Lithium-based specialty chemicals, operating since 1991
Strong portfolio of Organic and Inorganic products
Customers across multiple industries including Pharma, Engineering and Agrochem
Key export geographies include USA, Europe, Japan and Middle East
Growing contribution from Custom Synthesis and Manufacturing
Executing Greenfield and Brownfield manufacturing capacity expansions
Promoters are pioneering technocrats with substantial domain expertise; cumulative experience of more than six decades
Developed strong R&D capabilities with dedicated in-house team
Manufacturing units certified on Quality & SHE management systems
Exporting countries
Of workforce in R&D team
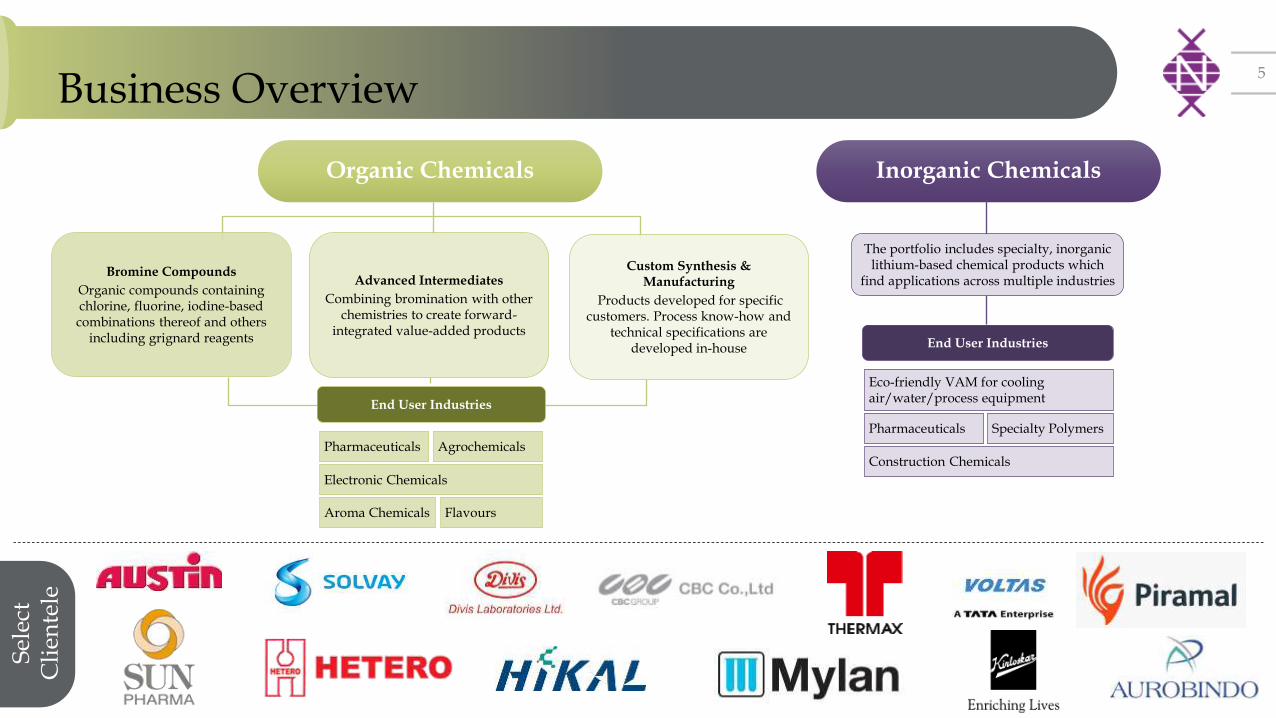
Business Overview 5
Organic Chemicals
Bromine Compounds
Organic compounds containing chlorine, fluorine, iodine-based combinations thereof and others
including grignard reagents
Inorganic Chemicals
Sel
ect
Cli
ente
le
End User Industries
Pharmaceuticals Agrochemicals
Aroma Chemicals
Electronic Chemicals
Eco-friendly VAM for cooling air/water/process equipment
Construction Chemicals
Pharmaceuticals Specialty Polymers
The portfolio includes specialty, inorganic lithium-based chemical products which
find applications across multiple industries
End User Industries
Flavours
Custom Synthesis & Manufacturing
Products developed for specific customers. Process know-how and
technical specifications are developed in-house
Advanced Intermediates
Combining bromination with other chemistries to create forward-
integrated value-added products
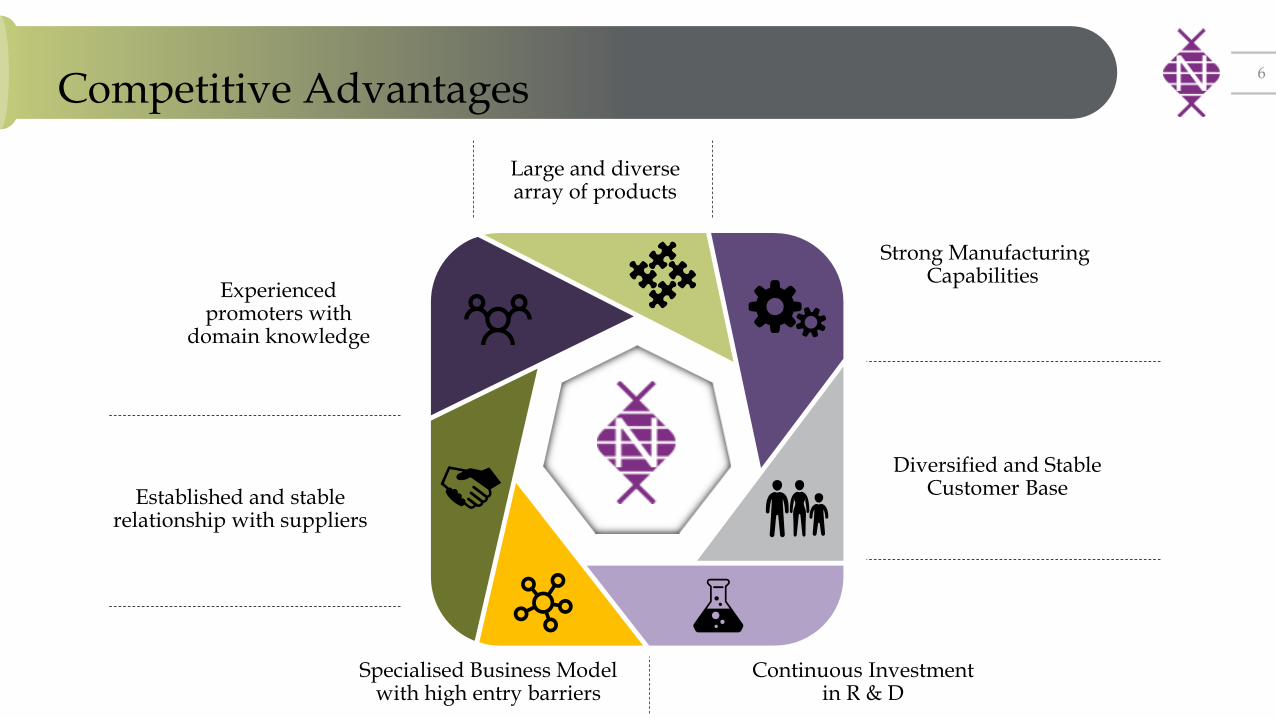
Competitive Advantages
Experienced promoters with
domain knowledge
Large and diverse array of products
Strong Manufacturing Capabilities
Diversified and Stable Customer Base
Continuous Investment in R & D
Specialised Business Model with high entry barriers
Established and stable relationship with suppliers
6

Key Performance Highlights – Q2 FY20 7
Revenues
Rs. 77.09 cr 35%
EBITDA
Rs. 14.75 cr 48%
Profit Before Tax
Rs. 10.93 cr 65%
Profit After Tax
53%
Revenue break-up
Domestic, 75%
*Exports, 25%
*Including deemed exports
Note: Growth for Q2 FY20 is compared to Q2 FY19
Rs. 7.72 cr • Q2 saw slowness in demand from some overseas
customers, seen to be quarter specific • Some revenues have shifted from SEZ/ EOU
units to DTA units of Indian customers
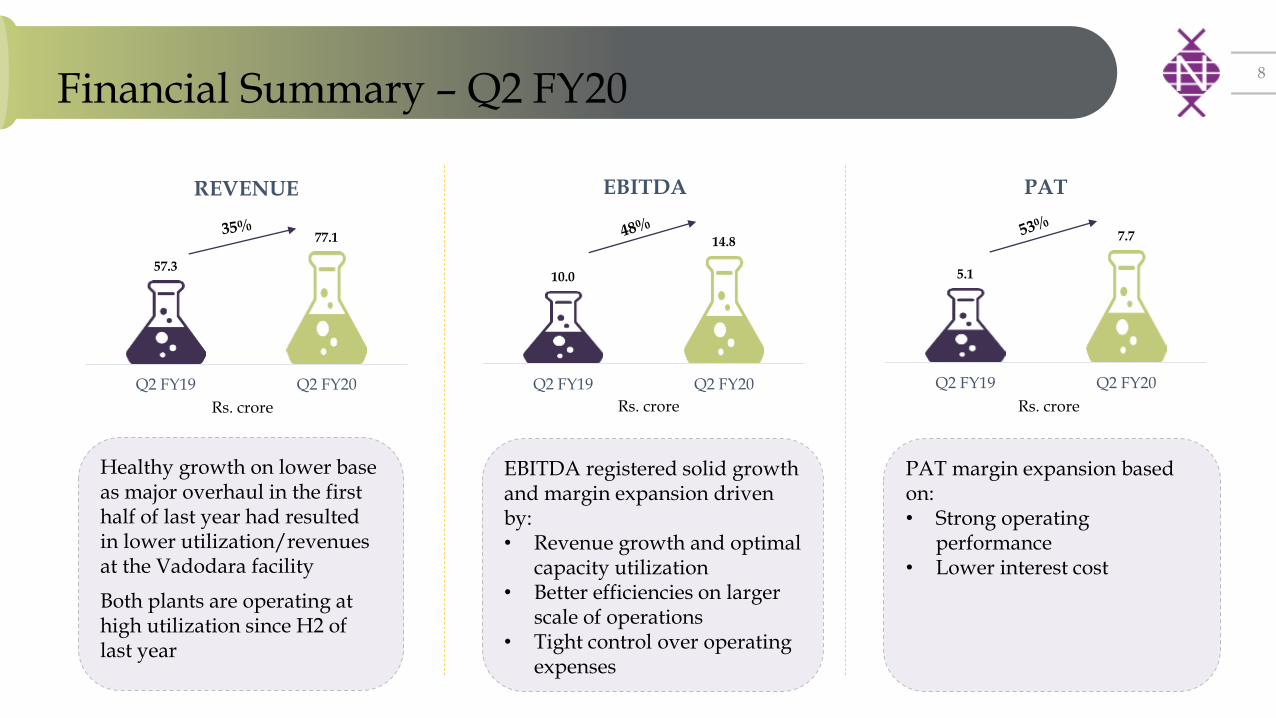
Financial Summary – Q2 FY20 8
57.3
77.1
Q2 FY19 Q2 FY20
REVENUE
10.0
14.8
Q2 FY19 Q2 FY20
EBITDA
5.1
7.7
Q2 FY19 Q2 FY20
PAT
Healthy growth on lower base as major overhaul in the first half of last year had resulted in lower utilization/revenues at the Vadodara facility
Both plants are operating at high utilization since H2 of last year
EBITDA registered solid growth and margin expansion driven by: • Revenue growth and optimal
capacity utilization • Better efficiencies on larger
scale of operations • Tight control over operating
expenses
PAT margin expansion based on: • Strong operating
performance • Lower interest cost
Rs. crore Rs. crore Rs. crore

Revenue break-up 9
Q2 FY20 Q2 FY19
Rs. 63.6 cr. Rs. 41.4 cr.
Rs. 13.5 cr. Rs. 15.9 cr.
53%
Organic Chemicals
Inorganic Chemicals
Performance was impacted due to lower raw material prices
Performance driven by healthy utilisation levels following plant maintenance activity in the same period last year
(15%)
H1 FY20 H1 FY19
Rs. 111.9 cr. Rs. 68.0 cr.
Rs. 29.6 cr. Rs. 28.1 cr.
65%
5%
Seasonal Variance Factors 10
• Neogen’s business has some seasonal drivers, due to which the company tends to deliver stronger financial performance in the second half of the financial year (October to March). Seasonal variance is driven by strong demand from Europe as orders tend to scale up in October-November and further accelerate from January after the holiday season.
• Lithium demand tends to be strong in Q4 as demand from HVAC segment is linked to capital expenditure that enjoys 100% depreciation benefits for air-conditioning/cooling machines.
• Demand from the agrochemicals segment is linked to the crop cycle and is weaker during H1.
• Consequently, investors are urged to compare financial performance of each quarter only with that of the corresponding quarter previous year to evaluate business progress on a like-to-like basis.
• Investors may also note that following the plant maintenance activity in H1 FY19, utilization has scaled up and remains at higher levels starting from H2 FY19. Hence, volume growth seen in the first half of FY20 from a lower base is not expected to continue at the same level in H2 FY20.
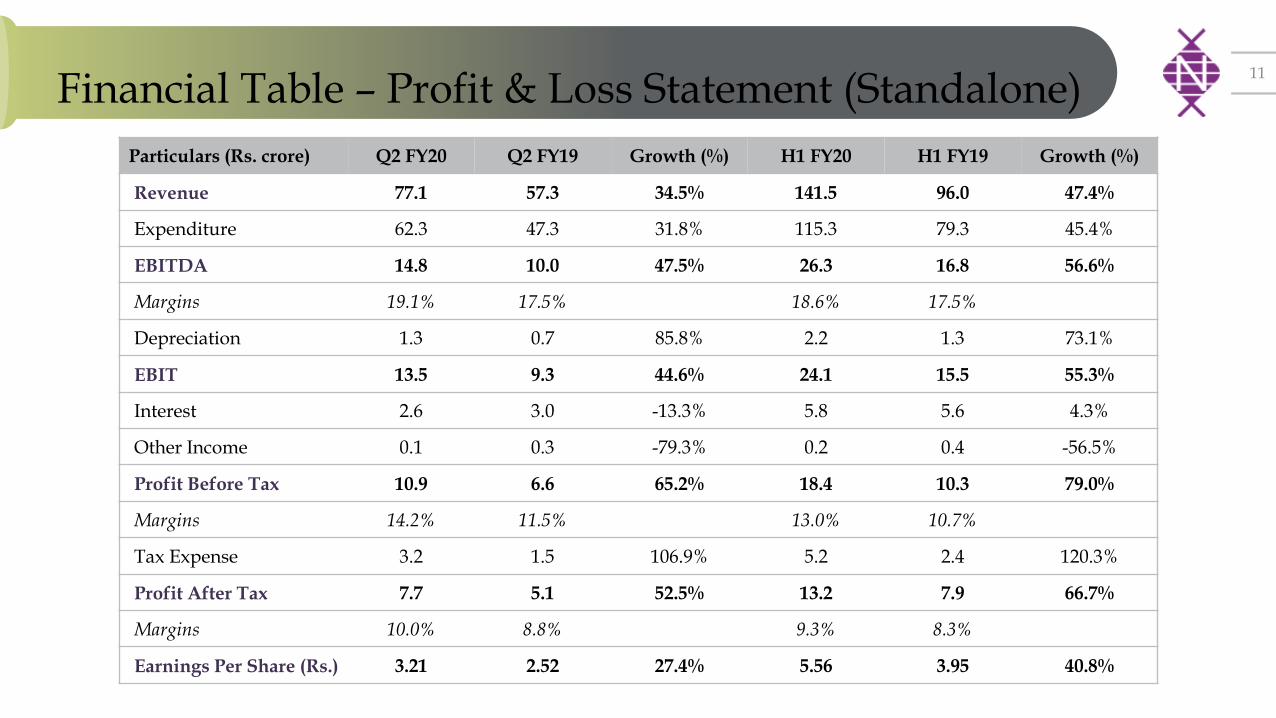
Financial Table – Profit & Loss Statement (Standalone) 11
Particulars (Rs. crore) Q2 FY20 Q2 FY19 Growth (%) H1 FY20 H1 FY19 Growth (%)
Revenue 77.1 57.3 34.5% 141.5 96.0 47.4%
Expenditure 62.3 47.3 31.8% 115.3 79.3 45.4%
EBITDA 14.8 10.0 47.5% 26.3 16.8 56.6%
Margins 19.1% 17.5% 18.6% 17.5%
Depreciation 1.3 0.7 85.8% 2.2 1.3 73.1%
EBIT 13.5 9.3 44.6% 24.1 15.5 55.3%
Interest 2.6 3.0 -13.3% 5.8 5.6 4.3%
Other Income 0.1 0.3 -79.3% 0.2 0.4 -56.5%
Profit Before Tax 10.9 6.6 65.2% 18.4 10.3 79.0%
Margins 14.2% 11.5% 13.0% 10.7%
Tax Expense 3.2 1.5 106.9% 5.2 2.4 120.3%
Profit After Tax 7.7 5.1 52.5% 13.2 7.9 66.7%
Margins 10.0% 8.8% 9.3% 8.3%
Earnings Per Share (Rs.) 3.21 2.52 27.4% 5.56 3.95 40.8%
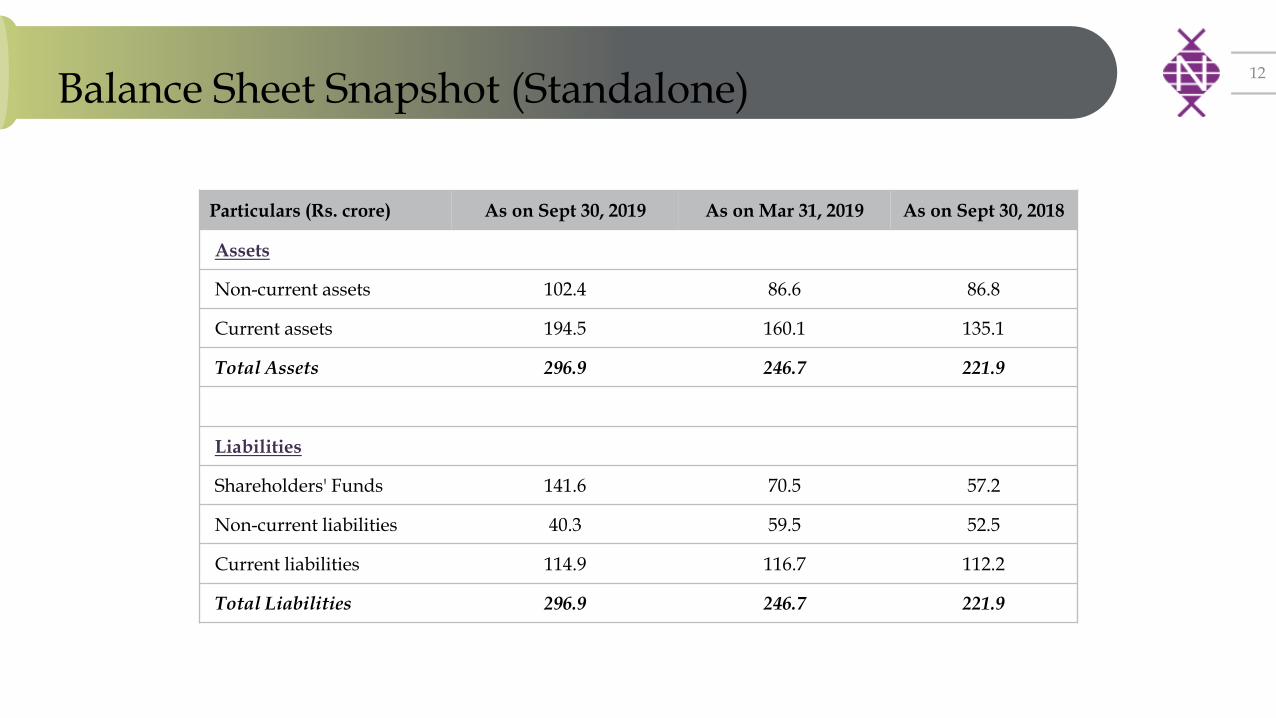
Balance Sheet Snapshot (Standalone) 12
Particulars (Rs. crore) As on Sept 30, 2019 As on Mar 31, 2019 As on Sept 30, 2018
Assets
Non-current assets 102.4 86.6 86.8
Current assets 194.5 160.1 135.1
Total Assets 296.9 246.7 221.9
Liabilities
Shareholders' Funds 141.6 70.5 57.2
Non-current liabilities 40.3 59.5 52.5
Current liabilities 114.9 116.7 112.2
Total Liabilities 296.9 246.7 221.9
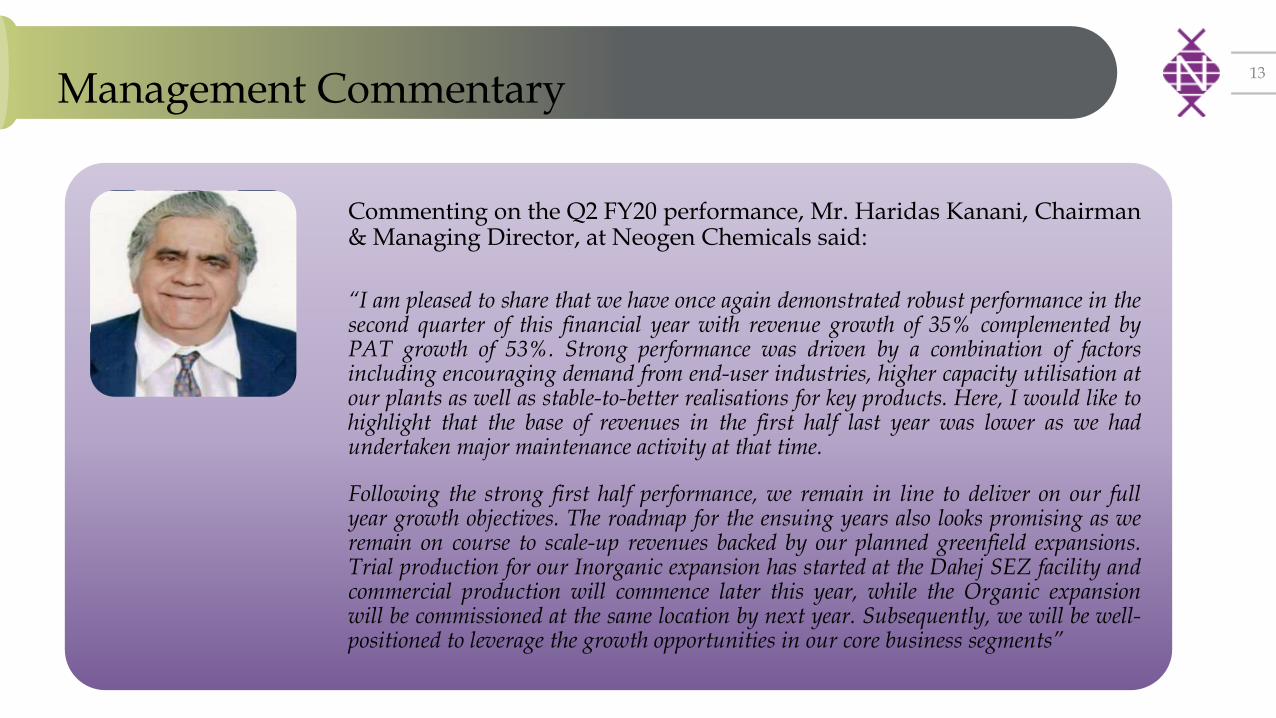
Management Commentary 13
Commenting on the Q2 FY20 performance, Mr. Haridas Kanani, Chairman & Managing Director, at Neogen Chemicals said:
“I am pleased to share that we have once again demonstrated robust performance in the second quarter of this financial year with revenue growth of 35% complemented by PAT growth of 53%. Strong performance was driven by a combination of factors including encouraging demand from end-user industries, higher capacity utilisation at our plants as well as stable-to-better realisations for key products. Here, I would like to highlight that the base of revenues in the first half last year was lower as we had undertaken major maintenance activity at that time.
Following the strong first half performance, we remain in line to deliver on our full year growth objectives. The roadmap for the ensuing years also looks promising as we remain on course to scale-up revenues backed by our planned greenfield expansions. Trial production for our Inorganic expansion has started at the Dahej SEZ facility and commercial production will commence later this year, while the Organic expansion will be commissioned at the same location by next year. Subsequently, we will be well-positioned to leverage the growth opportunities in our core business segments”

Historical Financial Trends 14
74 85 101 111
163
239
FY14 FY15 FY16 FY17 FY18 FY19
Net Revenue from Operations** (INR crore)
4 5 5 8 11 21
4.8% 6.0% 5.2%
7.0%
6.4%
8.8%
FY14 FY15 FY16 FY17 FY18 FY19
PAT (INR crore) Margin (%)
12 13 14 20 29 43
15.4% 15.0% 14.0%
18.1% 17.8% 18.2%
FY14 FY15 FY16 FY17 FY18 FY19
EBITDA (INR crore) Margin (%)
20 24 28 42 50 71 24 22 24 66
80
120
FY14 FY15 FY16 FY17 FY18 FY19
Networth* (INR crore) Net Debt (INR crore)
* Net Debt includes preference share capital
** Revenue is Net of Excise
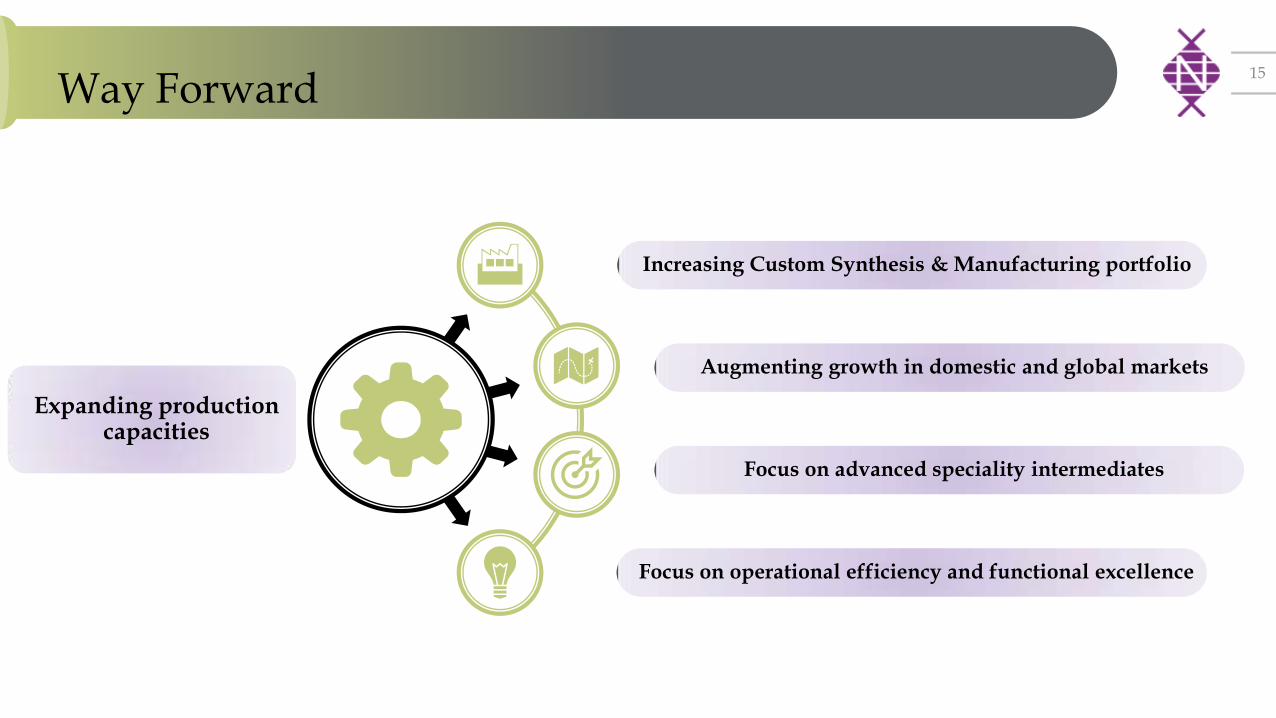
Way Forward 15
Increasing Custom Synthesis & Manufacturing portfolio
Augmenting growth in domestic and global markets
Focus on advanced speciality intermediates
Focus on operational efficiency and functional excellence
Expanding production capacities
Contact Us
About Neogen Chemicals Limited
Incorporated in 1991, Neogen Chemicals Ltd. (NSE Code: NEOGEN; BSE Code: 542665) is one of India’s leading manufacturers of Bromine-based and Lithium-based specialty chemicals. It’s specialty chemicals product offerings comprise of Organic as well as and Inorganic chemicals. Its products are used in pharmaceutical and agrochemical intermediates, engineering fluids, electronic chemicals, polymer additives, water treatment, construction and aroma chemicals, flavours and fragrances, specialty polymers, chemicals and VAM original-equipment manufacturers. Over the years, Neogen has expanded its range of products and, presently, manufactures an extensive range of specialty chemicals which find application across various industries in India and globally. It has a product portfolio of 198 products comprising 181 organic chemicals and 17 inorganic chemicals.
In addition to manufacturing speciality chemicals, Neogen also undertakes custom synthesis and manufacturing where the product is developed and customized primarily for a specific customer, but process know-how and technical specifications are developed in-house.
The Company operates out of its two manufacturing facilities located in Mahape, Navi Mumbai in Maharashtra, and Karakhadi, Vadodara in Gujarat. It is presently, developing a Greenfield manufacturing unit in Dahej SEZ, in Gujarat.
16
Shiv Muttoo / Nishid Solanki
CDR India
Tel: +91 98335 57572 / +91 22 6645 1221
Email: [email protected]
nishid@cdr- india.com
Mahesh Tanna
Neogen Chemicals Ltd.
Tel: +91 22 2549 7365 / 66
E-mail: [email protected]
For further information, please contact:

Thank You