guru baik baseline report - inovasi.or.id · cover photo courtesy by palladium the innovation for...
TRANSCRIPT

Guru BAIK Baseline Report
December 2017
INOVASI - Innovation for Indonesia’s School Children
Ratu Plaza Office Tower 19th Floor,
Jl. Jend. Sudirman Kav 9, Jakarta Pusat, 10270
Indonesia
Tel : (+6221) 720 6616 ext. 304
Fax : (+6221) 720 6616
http://www.inovasi.or.id
Published in December 2017
Cover photo courtesy by Palladium
The Innovation for Indonesia’s School Children (INOVASI) Program is a partnership between the governments of Australia and Indonesia. Working directly with Indonesia’s Ministry of Education and Culture, INOVASI is seeking to understand how student learning outcomes in literacy and numeracy can be improved in diverse primary schools and districts across Indonesia.INOVASI is working in a range of locations across Indonesia, and uses a distinctive locally focused approach to develop pilot activities and find out what does and doesn’t work to improve student learning outcomes.
INOVASI is an Australia Indonesia Government Partnership – Managed by Palladium
[email protected] www.inovasi.or.id www.facebook.com/InovasiPendidikanAIP

Guru Baik Baseline Report

ii
Contents
Acronyms and abbreviations iv
Tables & Figures v
Chapter 1 Introduction 8Purpose 8
Guru BAIK pilot 8
Evaluation of the Guru BAIK pilot 10
Chapter 2 School and community baseline survey Methodology 14Sampling and power calculation 14
Survey instruments 14
Survey implementation 17
Survey testing 17
Training 17
School selection and data collection 17
Data cleaning 18
Final sample size 20
Midline and endline surveys 20
Chapter 3 Students 21Students background 21
Physical and psychological characteristics 21
Family background 25
Student learning outcomes 27
The development of the student learning assessment 27
Student performance in literacy 28
Student performance in numeracy 30
Student learning strategies 32
Student behaviour in the classroom 32
Extra tuition 33
Students’ perceptions 34
Parents’ involvement in and perceptions of student learning 35

iii
Chapter 4 Teachers and teaching practices 38Teachers’ backgrounds: demographics, qualifications and absenteeism 38
Teachers’ subject-matter knowledge 40
Training and professional development 42
Teachers’ perceptions 44
Teaching practices 47
Classroom dynamics and instructional time 47
Inclusive teaching practices 51
Teaching strategies 53
Teaching supervision 56
Chapter 5 Schools 58School conditions 58
Principals and supervisors’ perceptions 59
Chapter 6 Conclusion 63
References 64
Appendix A: Guru BAIK impact evaluation analysis plan and balance text 66
Balance test 70
Students 70Teachers 77Schools 83
Appendix B: Calculating the score of the tests and rating scale 87
iv
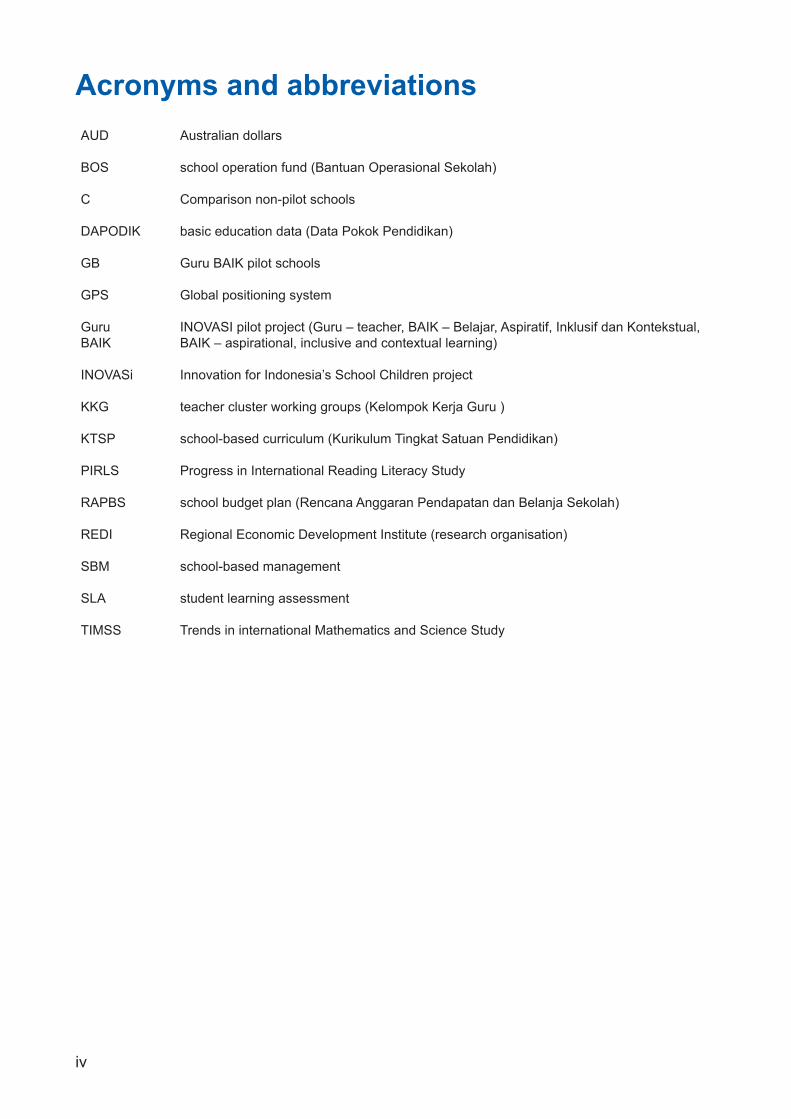
Acronyms and abbreviationsAUD BOS
C
DAPODIK GB
GPS
GuruBAIK
INOVASi
KKG
KTSP
PIRLS
RAPBS
REDI
SBM
SLA
TIMSS
Australian dollars
school operation fund (Bantuan Operasional Sekolah)
Comparison non-pilot schools
basic education data (Data Pokok Pendidikan)
Guru BAIK pilot schools
Global positioning system
INOVASI pilot project (Guru – teacher, BAIK – Belajar, Aspiratif, Inklusif dan Kontekstual, BAIK – aspirational, inclusive and contextual learning)
Innovation for Indonesia’s School Children project
teacher cluster working groups (Kelompok Kerja Guru )
school-based curriculum (Kurikulum Tingkat Satuan Pendidikan)
Progress in International Reading Literacy Study
school budget plan (Rencana Anggaran Pendapatan dan Belanja Sekolah)
Regional Economic Development Institute (research organisation)
school-based management
student learning assessment
Trends in international Mathematics and Science Study
v
Tables & FiguresTables
Table 1.1 Guru BAIK indicator ..............................................................................................................12
Table 2.1 Respondents per school .......................................................................................................15
Table 2.2 Final sample size ..................................................................................................................20
Table 3.1 Proportion of students with well-functioning visual and auditory modalities
(reported by students) ..........................................................................................................70
Table 3.2 Percentage of children with special needs, identified by teachers (%) .................................70
Table 3.3 Snapshot of students’ fluid intelligence .................................................................................71
Table 3.4 Students’ motivation and experience at school .....................................................................71
Table 3.5 Father characteristics............................................................................................................71
Table 3.6 Mothers’ characteristics ........................................................................................................72
Table 3.7 Families’ economic conditions ..............................................................................................72
Table 3.8 Student literacy score ...........................................................................................................73
Table 3.9 Students’ numeracy scores ...................................................................................................73
Table 3.10 Students’ behaviour in classroom .......................................................................................74
Table 3.11 Students’ enrolment in extra tuition and subject taken ........................................................74
Table 3.12 Students’ perceptions of subjects .......................................................................................74
Table 3.13 Teacher–student interactions ..............................................................................................75
Table 3.14 Fathers’ involvement in student learning ............................................................................75
Table 3.15 Mothers’ involvement in student learning ............................................................................76
Table 3.16 Students’ perceptions of parents’ involvement ....................................................................76
Table 3.17 Parent–teacher relationship (PTR) .....................................................................................76
Table 3.18 Parents’ opinion on the most important factor to improve learning quality .........................77
Table 4.1 Teachers’ demographics and qualifications ..........................................................................77
Table 4.2 Teachers’ absenteeism: number of days absent ...................................................................78
Table 4.3 Teachers’ scores on fourth grade literacy and numeracy assessment .................................78
Table 4.4 Teachers’ professional development .....................................................................................78
Table 4.5 Teachers’ perceptions of support from principals and fellow teachers ..................................79
Table 4.6 Teachers’ growth mindset on intelligence .............................................................................79
Table 4.7 Percentage of total class time on instruction (%) ..................................................................80
Table 4.8 Percentage of total class time teachers used learning materials (%) ...................................80
Table 4.9 Percentage of total class time spent with students not engaged (%) ...................................80
Table 4.10 Percentage of total number of classrooms where teacher–student interactions
are gender balanced (%) ....................................................................................................81
Table 4.11 Distribution of teacher–student interactions across a classroom (%) .................................81
Table 4.12 Teachers reports on the most often used teaching technique ............................................81
Table 4.13 Teachers who usually make lesson plans ...........................................................................81
Table 4.14 Teachers’ reported sources of ideas for lesson plans .........................................................81
Table 4.15 Teachers who usually give the following types of assessment ...........................................82

vi
FiguresFigure 1.1 Cycle of Guru BAIK pilot activities .........................................................................................9
Figure 2.1 Data Collection Framework .................................................................................................16
Figure 2.2 Data Cleaning Flowchart .....................................................................................................19
Figure 3.1 Proportion of students with well-functioning visual and auditory modalities ........................21
Figure 3.2 Percentage of students with special needs, identified by teachers .....................................23
Figure 3.3 Snapshot of students’ fluid intelligence ...............................................................................24
Figure 3.4 Proportion of students who reported their perception on school environment ....................25
Figure 3.5 Percentage of parent education attainment by education level ..........................................26
Figure 3.6 Proportion of parents who reported that they were able to do the following tasks ..............27
Figure 3.7 Literacy scores of Grade 1 to 5 students.............................................................................29
Figure 3.8 Literacy score of Grade 1 and 2 students ...........................................................................30
Figure 3.9 Literacy score of Grade 3 to 5 students ..............................................................................30
Figure 3.10 Numeracy score of Grade 1 to 5 students.........................................................................31
Figure 3.11 Numeracy score of Grade 1 and 2 students ......................................................................31
Figure 3.12 Numeracy score Grade 3 to 5 students.............................................................................32
Figure 3.13 Student behaviours in classroom ......................................................................................33
Figure 3.14 Seating arrangement by gender ........................................................................................33
Figure 3.15 Students’ enrolment in extra tuition and the subject taken ................................................34
Figure 3.16 Students’ reason why they like Math and Indonesian language (%) .................................35
Figure 3.17 Proportion of parents who were involved in student learning based on
parent claim and student acknowledgement .....................................................................36
Figure 3.18 Parent perception on the most important factor in improving student learning .................37
Figure 4.1 Average age and length of teaching ....................................................................................38
Figure 4.2 Proportion of teachers who have the following characteristics ...........................................39
Figure 4.3 Teacher absenteeism: number of days absent ....................................................................40
Figure 4.4 Teachers’ scores on fourth-grade literacy assessment .......................................................41
Figure 4.5 Teachers’ scores on fourth grade numeracy assessment ...................................................41
Figure 4.6 Proportion of teachers who attended training and teacher working group meeting ............42
Table 4.16 Teachers who usually assign students the following tasks .................................................82
Table 4.17 Teachers’ opinion of supervision done by principals, supervisors and school committees .82
Table 5.1 School characteristics ...........................................................................................................83
Table 5.2 Classroom facilities ...............................................................................................................83
Table 5.3 School infrastructure facilities (SIF) ......................................................................................83
Table 5.4 Information access at school (IAS) .......................................................................................84
Table 5.5 Principals’ perception of students and teachers’ competence and behaviour ......................84
Table 5.6 Supervisors’ perceptions of teachers’ competence and quality ............................................85
Table 5.7 Supervisors’ perceptions of principals, students and schools ...............................................85

vii
Figure 4.7 Proportion of teachers who attended the following types of training in the last two years ..43
Figure 4.8 Proportion of teachers who did following activities to improve their professional
development in the last two years .......................................................................................43
Figure 4.9 Proportion of teachers who need the following types of training .........................................44
Figure 4.10 Teacher perception of support from fellow teachers ..........................................................45
Figure 4.11. Teachers’ perception of support from their principals .......................................................46
Figure 4.12 Teachers’ mindset on intelligence......................................................................................46
Figure 4.13 Average percentage of total class time on instruction .......................................................48
Figure 4.14 Average percentage of total class time on active and passive instruction ........................49
Figure 4.15 Average percentage of total class time on academic activities instruction ........................49
Figure 4.16 Percentage of total class time with the learning materials used by teachers ....................50
Figure 4.17 Percentage of total class time with students not engaged ................................................51
Figure 4.18 Percentage of classrooms where teachers’ interaction with students
is gender balanced ............................................................................................................52
Figure 4.19 Distribution of teacher and student interactions across the classroom .............................53
Figure 4.20 Proportion of teachers reported the most often used of teaching techniques ...................54
Figure 4.21 Percentage of teachers who used the following sources for lesson plan ideas ................54
Figure 4.22 Percentage of teachers who assessed students using the following assessment ............55
Figure 4.23 Percentage of teachers who often assign the following tasks to students ........................56
Figure 4.24 Proportion of teachers who reported being supervised by principal, supervisor,
and school committee over the last semester ...................................................................56
Figure 4.25 Proportion of teachers who were supervised by principal, supervisor, and
school committee at least twice in the last semester.........................................................57
Figure 5.1 Proportion of schools with the curriculum used at schools..................................................58
Figure 5.2 Criteria of good teacher based on principal perception .......................................................60
Figure 5.3 Proportion of principals and supervisors who are satisfied with teacher competence ........60
Figure 5.4 Proportion of supervisors with their approach in solving problems at schools ....................61
Figure 5.5 Proportion of supervisors who have the following strategies to improve
student learning outcomes ..................................................................................................62
Figure 0.1 Example of pattern of teachers’ response to the rating scales ............................................88

8
Interventions, Practices and Contextual Factors Linked to Indonesian Students’ Literacy and Numeracy Outcomes:
Chapter 1
IntroductionPURPOSE
INOVASI is a AUD49 million education program running from 2016 to 2019, funded by the Australian Government in partnership with the Indonesian Ministry of Education and Culture. INOVASI is working to understand and tackle learning challenges in classrooms and schools, in particular those related to literacy and numeracy. The Program’s three focus areas are:
1. strengthening the quality of teaching and learning in the classroom;
2. improving the support provided to teachers;
3. enabling all children in the classroom to reach their potential in learning.
The first pilot that INOVASI is implementing is called Guru BAIK. Guru means ‘teacher’ in Bahasa and BAIK stands for Belajar, Aspiratif, Inklusif dan Kontekstual, which means ‘aspirational, inclusive and contextual learning’. The pilot aims to build the capacity of teachers, equipping them with the knowledge and skills to integrate action research principles into their teaching and problem-solving methods, in order to tackle immediate issues and challenges with regard to literacy and numeracy in their classrooms.
This report presents the results from the baseline survey for the Guru BAIK pilot project, including the baseline balance test between Guru BAIK schools and comparison schools. The data were collected from a school and community survey designed to evaluate the impact of the Guru BAIK pilot. This report is linked to the Guru BAIK monitoring, evaluation and learning plan.
This chapter describes the Guru BAIK pilot, the planned evaluations and the impact evaluation analysis plan. Chapter 2 presents the methodology used in conducting the school and community baseline survey and the issues arising in its implementation. Chapters 3, 4 and 5 outline the results of the baseline balance tests between Guru BAIK schools and comparison schools, respectively focusing on students, teachers and school supervision. The final chapter summarises the overall results of the baseline balance tests between these two groups of schools.
GURU BAIK PILOT
Guru BAIK is a capacity-building pilot aimed at teachers and by the end of the pilot, INOVASI would expect to see:
a. Participating teachers using action research as a contextual teaching and problem-solving methodology to improve literacy and numeracy in their classrooms;
b. An improvement in the quality of teaching and learning in the classrooms of participating teachers;

9
A Systematic Review
c. An increase in students’ learning outcomes in literacy and numeracy in the classrooms of participating teachers as a result of the actions taken;
d. A bank of locally-relevant promising practices that can be shared (a database);
e. A core group of local facilitators with the capacity to sustain and scale out the Guru BAIK activities;
f. A core group of teachers committed to continuing to use action research methodology to address any future problems and challenges with literacy and numeracy as they emerge.
Guru BAIK is based on the principles of classroom action research and includes a multi-stage, problem-driven, cyclical process of identifying problems, planning action to address the problems, taking action and collecting data, analysing the results of the action, reflecting and re-planning the action. The pilot started in January 2017 and was completed by May 2017, with follow-up activities continuing until October 2017.
Figure 1.1 Cycle of Guru BAIK pilot activities
INOVASI implemented this cycle through a series of four workshops, each with connected and mentored follow-on activities:
• Workshop One (identify problems or questions): During the first workshop, with guidance from the facilitator, teachers identify problems, challenges or research questions they have in relation to literacy and numeracy in their own classrooms. After the workshop, in the follow-up activities, teachers review and confirm the issues they identified.
Identify Problem or Question(s)
Plan Research
Collect Data
Share & Take Action
Analyze and Interpret Data
Reflect

10
Interventions, Practices and Contextual Factors Linked to Indonesian Students’ Literacy and Numeracy Outcomes:
• Workshop Two (plan research): In the second workshop, teachers start to plan out how they could try to solve the problem or challenge they identified or answer their research questions. With guidance, they conduct a literature review, discuss possible solutions with peers and identify existing promising practices. In the activities following the workshop, teachers continue to develop their action plan.
• Workshop Three (collect data): In this workshop teachers are shown how to develop a methodology (and accompanying instruments) to collect and organise the data they need to measure the success of their action plan. As a follow-up to this workshop, teachers carry out their research according to their plan and collect the necessary data.
• Workshop Four (analyse and interpret data, and reflect on findings): The final workshop helps teachers to analyse and interpret the data they have collected to ascertain whether and to what extent their actions have been successful. As follow up to this workshop, all participants are expected to repeat the cycle or start again with new questions or problems found in their research.
• Dissemination (share findings and take action): Participating teachers are asked to document (in their own way) and share their findings and experiences with teachers in their schools, in other schools in their clusters and finally across the district.
Evidence suggests that the action research process works best through collaboration and cooperation so the Guru BAIK pilot was implemented by 50 research teams in 50 primary schools across two districts – North Lombok (Lombok Utara) and Sumbawa – in West Nusa Tenggara (Nusa Tenggara Barat – NTB). Research teams comprised three members:
1. A lead teacher who conducted the research in the classroom;
2. A teacher from the same school who acted as a critical friend;
3. An educationalist from a local higher education institute who provided guidance on research methods.
Each research team was mentored and supported by a group of national facilitators, experienced in conducting an action research approach in the classroom, and a group of local facilitators who were relatively inexperienced in this approach. INOVASI and the national facilitators trained and mentored the local facilitators so they could fully implement the Guru BAIK program and become core resource people in their district. This will enable them to continue to roll out the Guru BAIK program to other teachers and schools after the pilot is completed.
EVALUATION OF THE GURU BAIK PILOT
Guru BAIK is being evaluated through both a process–outcome evaluation and an impact evaluation:
1. The process–outcome evaluation ensures the quick data and feedback loops that support strategic day-to-day management and timely decision making and help to answer the important questions of whether the program is making a difference and achieving intended results or what needs to be done differently to better meet its goals and objectives.
2. The impact evaluation provides the systematised rigorous data, findings and lessons needed to promote partnership building and advocacy and to inform educational policy making.
11
A Systematic Review
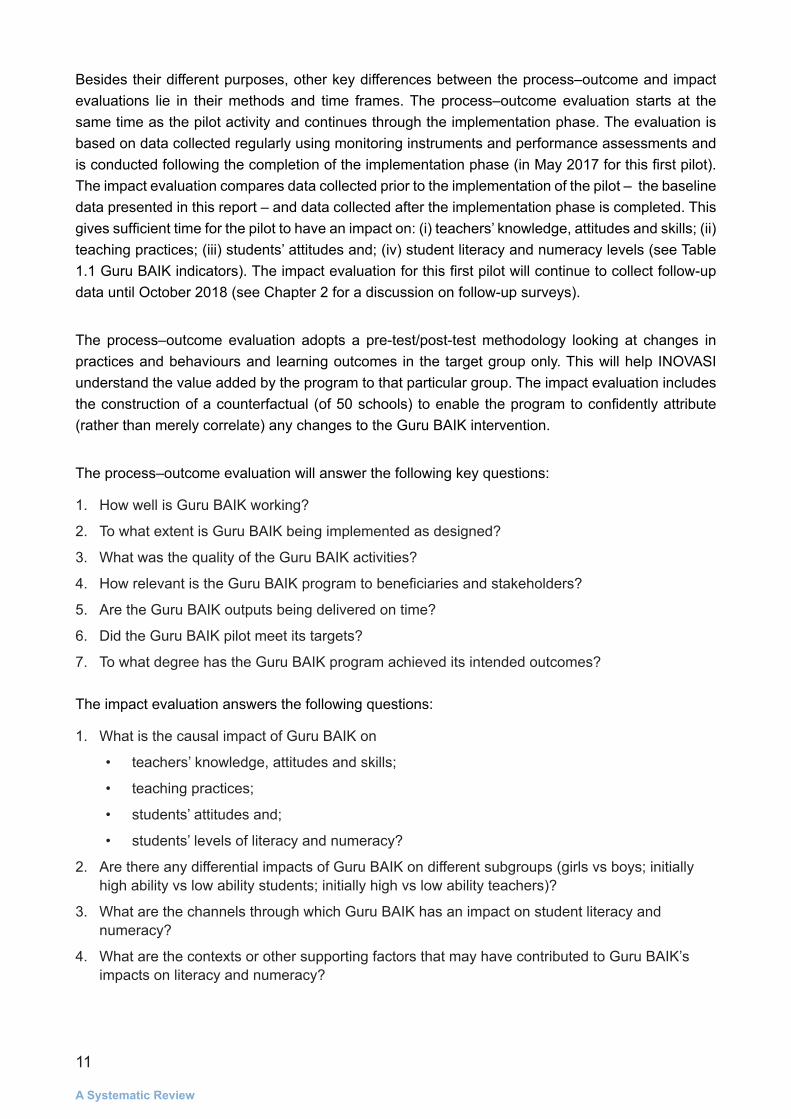
Besides their different purposes, other key differences between the process–outcome and impact evaluations lie in their methods and time frames. The process–outcome evaluation starts at the same time as the pilot activity and continues through the implementation phase. The evaluation is based on data collected regularly using monitoring instruments and performance assessments and is conducted following the completion of the implementation phase (in May 2017 for this first pilot). The impact evaluation compares data collected prior to the implementation of the pilot – the baseline data presented in this report – and data collected after the implementation phase is completed. This gives sufficient time for the pilot to have an impact on: (i) teachers’ knowledge, attitudes and skills; (ii) teaching practices; (iii) students’ attitudes and; (iv) student literacy and numeracy levels (see Table 1.1 Guru BAIK indicators). The impact evaluation for this first pilot will continue to collect follow-up data until October 2018 (see Chapter 2 for a discussion on follow-up surveys).
The process–outcome evaluation adopts a pre-test/post-test methodology looking at changes in practices and behaviours and learning outcomes in the target group only. This will help INOVASI understand the value added by the program to that particular group. The impact evaluation includes the construction of a counterfactual (of 50 schools) to enable the program to confidently attribute (rather than merely correlate) any changes to the Guru BAIK intervention.
The process–outcome evaluation will answer the following key questions:
1. How well is Guru BAIK working?
2. To what extent is Guru BAIK being implemented as designed?
3. What was the quality of the Guru BAIK activities?
4. How relevant is the Guru BAIK program to beneficiaries and stakeholders?
5. Are the Guru BAIK outputs being delivered on time?
6. Did the Guru BAIK pilot meet its targets?
7. To what degree has the Guru BAIK program achieved its intended outcomes?
The impact evaluation answers the following questions:
1. What is the causal impact of Guru BAIK on
• teachers’ knowledge, attitudes and skills;
• teaching practices;
• students’ attitudes and;
• students’ levels of literacy and numeracy?
2. Are there any differential impacts of Guru BAIK on different subgroups (girls vs boys; initially high ability vs low ability students; initially high vs low ability teachers)?
3. What are the channels through which Guru BAIK has an impact on student literacy and numeracy?
4. What are the contexts or other supporting factors that may have contributed to Guru BAIK’s impacts on literacy and numeracy?
12
Interventions, Practices and Contextual Factors Linked to Indonesian Students’ Literacy and Numeracy Outcomes:
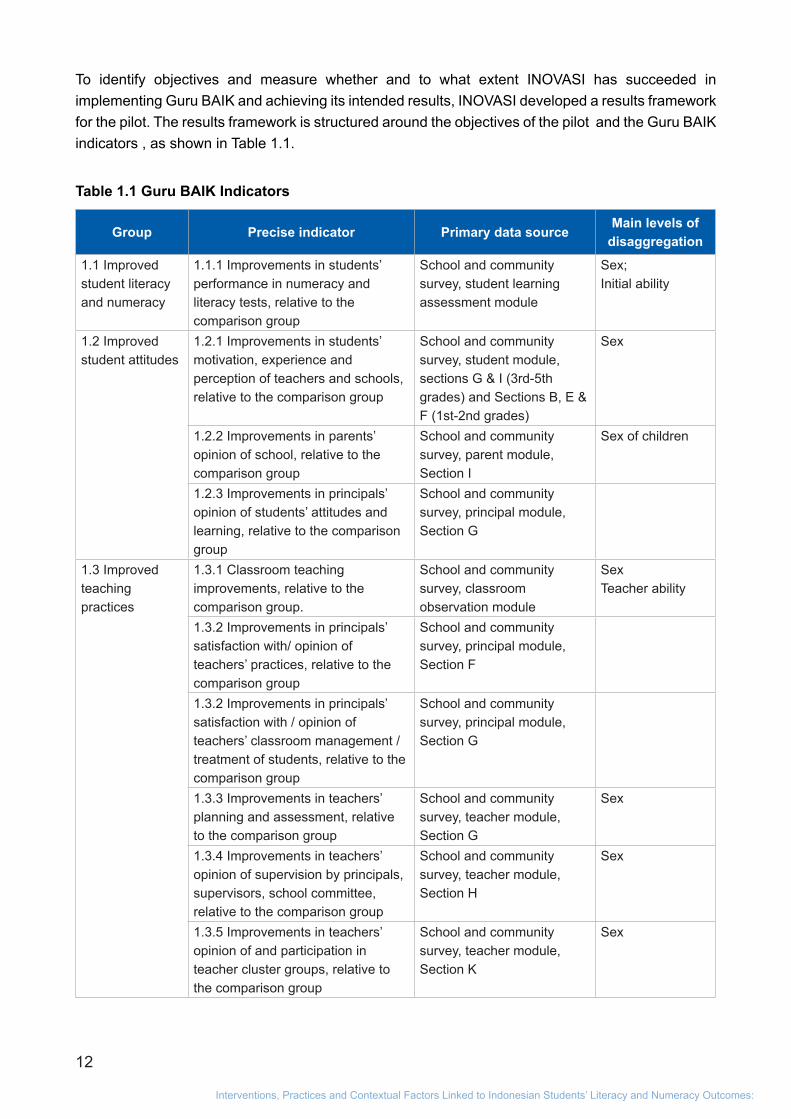
To identify objectives and measure whether and to what extent INOVASI has succeeded in implementing Guru BAIK and achieving its intended results, INOVASI developed a results framework for the pilot. The results framework is structured around the objectives of the pilot and the Guru BAIK indicators , as shown in Table 1.1.
Table 1.1 Guru BAIK Indicators
Group Precise indicator Primary data source Main levels of
disaggregation
1.1 Improved student literacy and numeracy
1.1.1 Improvements in students’ performance in numeracy and literacy tests, relative to the comparison group
School and community survey, student learning assessment module
Sex;Initial ability
1.2 Improved student attitudes
1.2.1 Improvements in students’ motivation, experience and perception of teachers and schools, relative to the comparison group
School and community survey, student module, sections G & I (3rd-5th grades) and Sections B, E & F (1st-2nd grades)
Sex
1.2.2 Improvements in parents’ opinion of school, relative to the comparison group
School and community survey, parent module, Section I
Sex of children
1.2.3 Improvements in principals’ opinion of students’ attitudes and learning, relative to the comparison group
School and community survey, principal module, Section G
1.3 Improved teaching practices
1.3.1 Classroom teaching improvements, relative to the comparison group.
School and community survey, classroom observation module
SexTeacher ability
1.3.2 Improvements in principals’ satisfaction with/ opinion of teachers’ practices, relative to the comparison group
School and community survey, principal module, Section F
1.3.2 Improvements in principals’ satisfaction with / opinion of teachers’ classroom management / treatment of students, relative to the comparison group
School and community survey, principal module, Section G
1.3.3 Improvements in teachers’ planning and assessment, relative to the comparison group
School and community survey, teacher module, Section G
Sex
1.3.4 Improvements in teachers’ opinion of supervision by principals, supervisors, school committee, relative to the comparison group
School and community survey, teacher module, Section H
Sex
1.3.5 Improvements in teachers’ opinion of and participation in teacher cluster groups, relative to the comparison group
School and community survey, teacher module, Section K
Sex
13
A Systematic Review
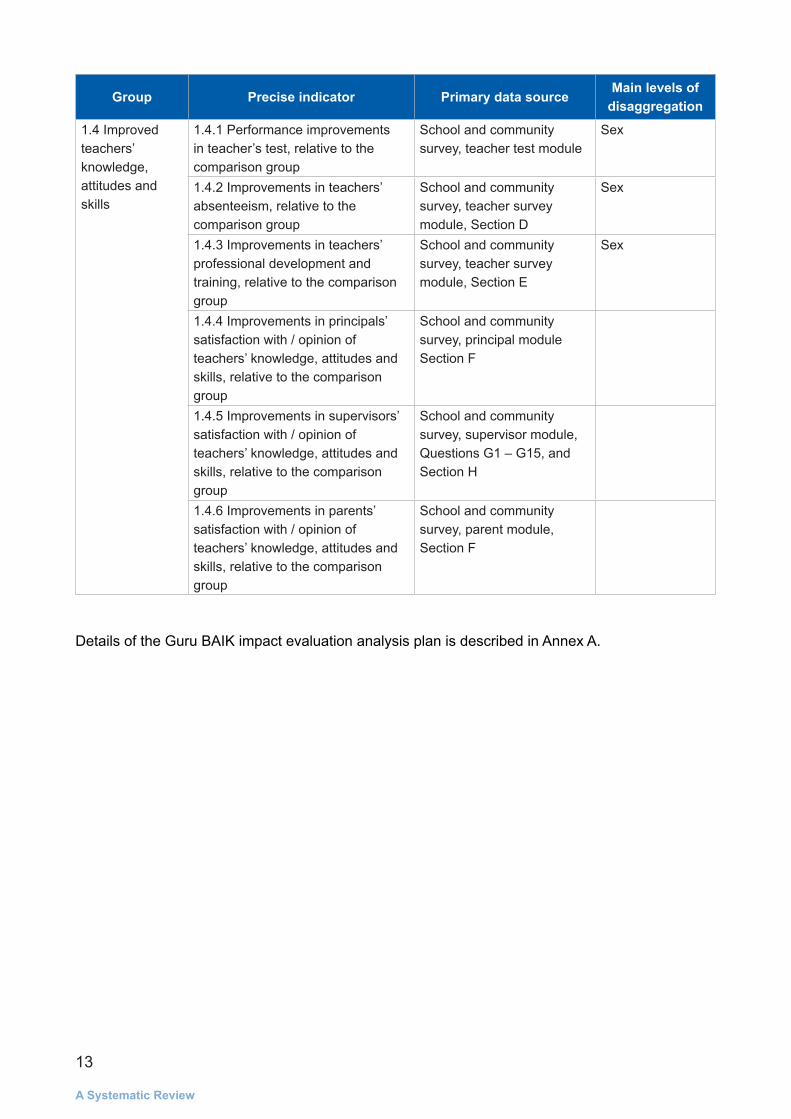
Group Precise indicator Primary data source Main levels of
disaggregation
1.4 Improved teachers’ knowledge, attitudes and skills
1.4.1 Performance improvements in teacher’s test, relative to the comparison group
School and community survey, teacher test module
Sex
1.4.2 Improvements in teachers’ absenteeism, relative to the comparison group
School and community survey, teacher survey module, Section D
Sex
1.4.3 Improvements in teachers’ professional development and training, relative to the comparison group
School and community survey, teacher survey module, Section E
Sex
1.4.4 Improvements in principals’ satisfaction with / opinion of teachers’ knowledge, attitudes and skills, relative to the comparison group
School and community survey, principal module Section F
1.4.5 Improvements in supervisors’ satisfaction with / opinion of teachers’ knowledge, attitudes and skills, relative to the comparison group
School and community survey, supervisor module, Questions G1 – G15, and Section H
1.4.6 Improvements in parents’ satisfaction with / opinion of teachers’ knowledge, attitudes and skills, relative to the comparison group
School and community survey, parent module, Section F
Details of the Guru BAIK impact evaluation analysis plan is described in Annex A.

14
Interventions, Practices and Contextual Factors Linked to Indonesian Students’ Literacy and Numeracy Outcomes:
Chapter 2
School and community baseline survey MethodologySAMPLING AND POWER CALCULATION
To determine the appropriate sample size, we first set the commonly used formula of α = 0.05 and β = 0.8. Setting the minimum detectable effect at 0.3σ, we found that we needed a sample size of 350, equally divided between Guru BAIK and comparison units.
Given that our unit of focus is individuals but our primary unit of survey is schools, we needed to take into account within-school correlation to calculate the number of schools to survey. In addition, we wanted to survey students from grades one to five. Therefore, we set the sample in each school as 25 students, equally divided across the five grades. With a within-school correlation of 0.28 (Pradhan et al.,2014; Suryadarma et al. 2006), we found that we needed to visit a minimum of 109 schools, equally divided between Guru BAIK and comparison schools. We then rounded the sample size down to 100 schools, with Guru BAIK being implemented in 50 schools and the rest serving as comparison schools. This implies that our minimum detectable effect is slightly larger than 0.3σ.
SURVEY INSTRUMENTS
Our survey instruments encompass all the variables in Table 1.1. In addition, we collected rich information from teachers, principals, parents, school supervisors and school committees, in order to have sufficient data to control for potential confounders and to test impact heterogeneity across subgroups. The organising framework of the instruments follows Figure 2.1, with the list of respondents in each school and average completion times for each respondent as shown in Table 2.1.

15
A Systematic Review
Table 2.1 Respondents per school
No. Instrument Respondent per schoolAverage completion times
for each respondent during instrument testing (minutes)
1 School principal questionnaire
1 71
2 Teacher questionnaire 5 (one each from grades 1 – 5) 72
3 Student questionnaire – grades 1 and 2
10 (5 in each grade) 13
4 Student questionnaire – grades 3, 4, and 5
15 (5 in each grade) 19
5 Parent questionnaire 25 (5 in each grades 1 – 5) 71
6 School committee questionnaire
1 54
7 School supervisor questionnaire
1 82
8 Teacher test 5 (one each from grades 1 – 5) 90
9 Student test – grades 1 and 2
10 (5 in each grade) – individually administered
45
10 Student test – grade 3 5 – group administered 100 (for all, as this is group administered)
11 Student test – grades 4 and 5
40 (20 in each grade) – group administered
100 (for each grade, as this is group administered)
12 Classroom teaching observation
5 (one each from grades 1 – 5) 40
13 Classroom facilities observation
5 (one each from grades 1 – 5) 13
14 School facilities observation 1 18

16
Interventions, Practices and Contextual Factors Linked to Indonesian Students’ Literacy and Numeracy Outcomes:
Figure 2.1 Data collection framework
STUDENT LEARNING – Literacy and NumeracyInstrument: Student Learning Assessments
TEACHERContent knowledgePedagogical skills
MotivationPersonal characteristics
Instrument: teacher survey, scenario-based assessment
SCHOOLPrincipal leadership
School size & resourcesSchool policies & practices
Supervisors and school committees
Instrument: school, principal, and supervisor & school committee
COMMUNITYCommunity involvement in
schoolsCommunity leaders
Local policies
Instrument: school, parent and community leader surveys
TEACHINGDiagnosis of student needsInterventions & strategiesAssessment and feedback
Effort
Instrument: classroom observation, teacher survey
CURRICULAContent load
Instructional & preparation time
Assessments
Instrument: teacher survey, school survey
STUDENTGeneral ability
Prior knowledgeMotivation
Individual characteristics
Instrument: student and parent surveys
HOMECulturalresources
Socio-economic conditionsParental education & support
Parental motivationTutoring
Instrument: student and parent surveys
DISTRICT AND CENTRAL GOVERNMENT POLICIES
17
A Systematic Review
SURVEY IMPLEMENTATION
The survey was implemented by the Regional Economic Development Institute (REDI), a research organisation based in Surabaya, Indonesia.
Survey testing
The instruments were tested in six primary schools in West Lombok (Lombok Barat) district in West Nusa Tenggara, from 18 to 27 October 2016. REDI deployed three teams, each consisting of a supervisor, two enumerators and a data editor. The INOVASI team observed the interviews and also participated in conducting some interviews.
The pilot testing led to the decision to increase the number of enumerators from four to five members per team. The testing also showed that two days were needed to survey one school. Finally, some survey instruments were shortened because of time constraints and some repetition.
Training
INOVASI and REDI recruited and trained a total of 97 enumerators to implement the survey. The training took place in Mataram, the capital of West Nusa Tenggara, and lasted six days. Out of those trained, 90 participants were chosen as enumerators and they were divided into 18 survey teams. The large number of teams was needed to meet the tight implementation schedule; the survey had to be completed in three weeks.
The enumerator training used several methods, such as, classical teaching, role play, round robin, paired interviews and live interviews with dummy respondents. Due to the large number of participants, the training was not able to include any field activities. During training, the most difficult material was on classroom observation and on the testing protocol. With hindsight, the training should have been done over two weeks.
School selection and data collection
Data was collected from the 50 Guru BAIK schools and the 50 comparison schools, spread equally over the North Lombok (Lombok Utara – KLU) and Sumbawa districts. To minimise potential spillover of the program, all sampled schools in a sub-district are either Guru BAIK or comparison schools, accommodating the fact that sub-districts have different numbers of primary schools.
The schools were chosen with the help of district officials, in two-hour workshops held in each district. The INOVASI team first created an index of school readiness in the two districts based on administrative data gathered at the school level. This data, provided by the Ministry of Education, and Culture is known as DAPODIK (Data Pokok Pendidikan – core education data). The variables used were: internet access; teacher–student ratio; proportion of civil servant teachers; proportion of good classrooms; availability of a library; water access; whether the school was accredited by the

18
Interventions, Practices and Contextual Factors Linked to Indonesian Students’ Literacy and Numeracy Outcomes:
ministry; and availability of a special needs teacher. The index was then used to stratify the schools into bottom 20 per cent, middle 60 per cent and top 20 per cent. The list of the middle 60 per cent schools was then shared with the district officials and the schools were chosen from the list.
In total, the 25 Guru BAIK schools in North Lombok were spread over two sub-districts: Gangga (14 schools) and Pemenang (11 schools), with all 25 comparison schools located in one sub-district: Tanjung. In Sumbawa, the 25 Guru BAIK schools were spread over three sub-districts: Batulanteh (5 schools), Moyo Hulu (14 schools) and Moyo Utara (6 schools), with the 25 comparison schools located in three sub-districts: Labuhan Badas (8 schools), Lopok (10 schools) and Lape (7 schools). It is important to note that the average school readiness index between Guru BAIK and comparison schools is balanced.
The baseline survey was implemented from 13 November 2016 to 8 December 2016. REDI deployed 18 teams, nine in each district. Each team consisted of a supervisor, three enumerators and a field data editor. Each team was supposed to complete surveys in three schools per week. During implementation, senior REDI researchers and INOVASI staff spent two weeks supervising the survey implementation.
To identify respondent students, the survey team asked for the complete student roster in each classroom. The usual practice in Indonesia is to list students alphabetically. The sampling was then done randomly using an interval of every five students.
Data cleaning
After interviews were completed and questionnaires had been checked by the field supervisors, the data was entered onto laptop computers by the field data editor. The soft copy of the file was then e-mailed to the REDI offices in Surabaya. The hard copies of the questionnaires were sent to the office by courier service. In cases where the schools were in remote locations, the hard copies were held by the team until they had an opportunity to visit the district’s capital town, where courier services were available.
The original schedule was for each team to send the hard copies once a week, when the team moved from one district to the next. However, in practice, teams were unable to send hard copies on schedule and these delays affected the schedule for double data entry and data cleaning at the REDI offices in Surabaya. REDI had to recruit more staff to clean the data and make up for the delays in entering the student roster and the test results from teachers and students.
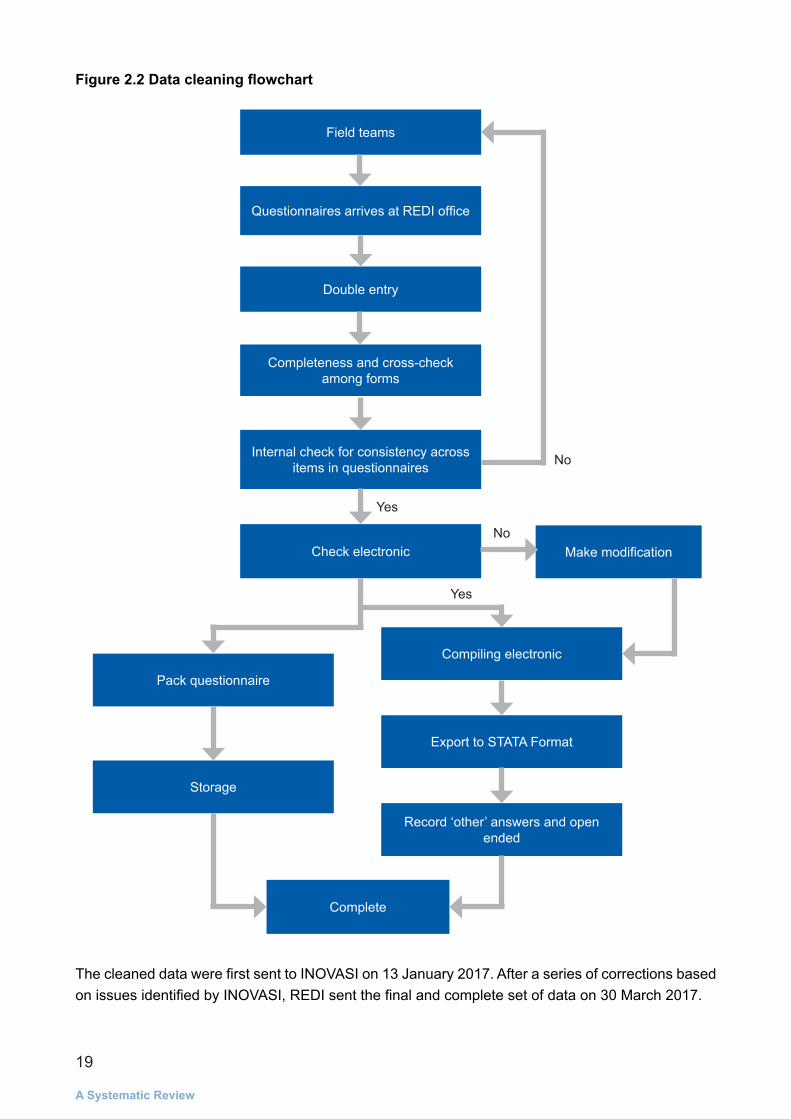
The data cleaning process consists of the steps shown in Figure 2.2.
19
A Systematic Review
Figure 2.2 Data cleaning flowchart
The cleaned data were first sent to INOVASI on 13 January 2017. After a series of corrections based on issues identified by INOVASI, REDI sent the final and complete set of data on 30 March 2017.
Field teams
Questionnaires arrives at REDI office
Double entry
Completeness and cross-check among forms
Internal check for consistency across items in questionnaires
Check electronic
Complete
No
No
Yes
Yes
Make modification
Compiling electronic
Pack questionnaire
Export to STATA Format
Storage
Record ‘other’ answers and open ended
20
Interventions, Practices and Contextual Factors Linked to Indonesian Students’ Literacy and Numeracy Outcomes:
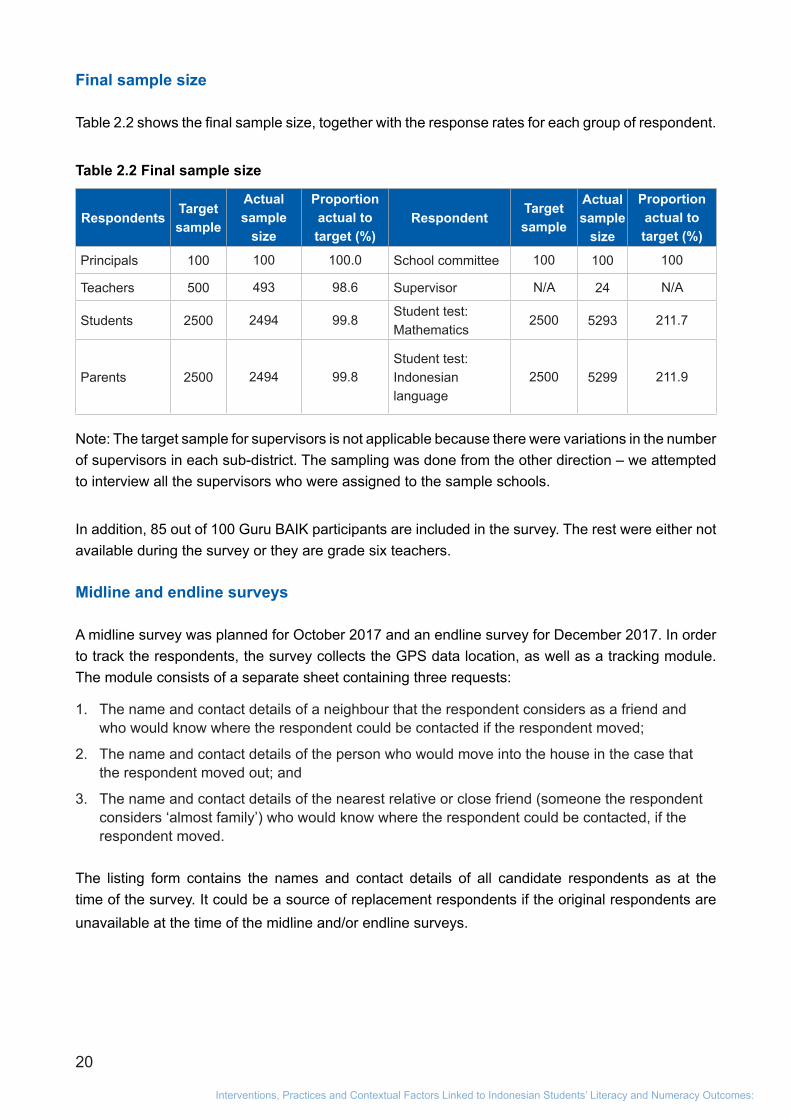
Final sample size
Table 2.2 shows the final sample size, together with the response rates for each group of respondent.
Table 2.2 Final sample size
RespondentsTarget sample
Actual sample
size
Proportion actual to target (%)
RespondentTarget sample
Actual sample
size
Proportion actual to target (%)
Principals 100 100 100.0 School committee 100 100 100
Teachers 500 493 98.6 Supervisor N/A 24 N/A
Students 2500 2494 99.8Student test: Mathematics
2500 5293 211.7
Parents 2500 2494 99.8Student test: Indonesian language
2500 5299 211.9
Note: The target sample for supervisors is not applicable because there were variations in the number of supervisors in each sub-district. The sampling was done from the other direction – we attempted to interview all the supervisors who were assigned to the sample schools.
In addition, 85 out of 100 Guru BAIK participants are included in the survey. The rest were either not available during the survey or they are grade six teachers.
Midline and endline surveys
A midline survey was planned for October 2017 and an endline survey for December 2017. In order to track the respondents, the survey collects the GPS data location, as well as a tracking module. The module consists of a separate sheet containing three requests:
1. The name and contact details of a neighbour that the respondent considers as a friend and who would know where the respondent could be contacted if the respondent moved;
2. The name and contact details of the person who would move into the house in the case that the respondent moved out; and
3. The name and contact details of the nearest relative or close friend (someone the respondent considers ‘almost family’) who would know where the respondent could be contacted, if the respondent moved.
The listing form contains the names and contact details of all candidate respondents as at the time of the survey. It could be a source of replacement respondents if the original respondents are unavailable at the time of the midline and/or endline surveys.
21
A Systematic Review
Chapter 3
Students As discussed in Chapter 1, the impact indicators with regard to students consist of learning outcomes in literacy and numeracy as well as their attitudes towards learning. This chapter discusses descriptive analysis and balance test results on students’ backgrounds, learning outcomes, learning strategies and perceptions. In addition, this chapter provides information on family background or socio-economic status and parents’ perceptions of student learning.
STUDENTS BACKGROUND Physical and psychological characteristics
This section presents the contributions that students bring to their learning process, such as their physical condition, perception, motivation and innate ability that are assumed as variables that link to their learning. Information on these characteristics was captured by interviews with the students and their teachers, and an adapted fluid intelligence test.
a) Physical characteristics and indication of special needs
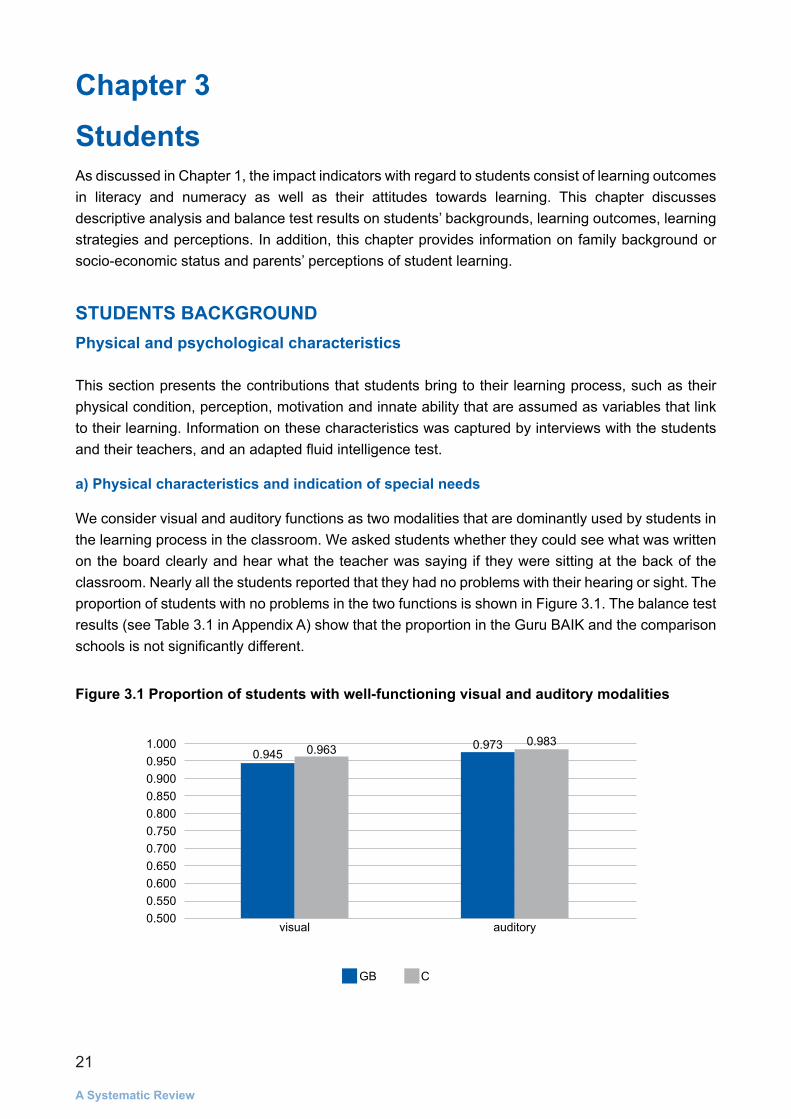
We consider visual and auditory functions as two modalities that are dominantly used by students in the learning process in the classroom. We asked students whether they could see what was written on the board clearly and hear what the teacher was saying if they were sitting at the back of the classroom. Nearly all the students reported that they had no problems with their hearing or sight. The proportion of students with no problems in the two functions is shown in Figure 3.1. The balance test results (see Table 3.1 in Appendix A) show that the proportion in the Guru BAIK and the comparison schools is not significantly different.
Figure 3.1 Proportion of students with well-functioning visual and auditory modalities
1.0000.9500.9000.8500.8000.7500.7000.6500.6000.5500.500
0.945
visual auditory
GB C
0.963 0.973 0.983

22
Interventions, Practices and Contextual Factors Linked to Indonesian Students’ Literacy and Numeracy Outcomes:
Digging deeper into student characteristics that might hinder their learning, we asked the teachers to identify students that have indications of special needs, using a ‘children-with-special-needs roster’. The roster was adapted from a children-with-difficulties identification tool developed in 1977 by the Centre for Curriculum and Book Development, the Indonesian Ministry of Education and Cultures’ research body. The items presented in the roster are as follows:
1. The child cannot sit still or constantly fidgets and squirms (indication of hyperactive disorder);
2. The child has difficulties with communicating verbally (indication of communication difficulties);
3. The child learns and grasps materials slowly (indication of slow learner);
4. The child has a remarkably good memory (indication of gifted);
5. The child easily gets angry and/or sad, or has difficulties in controlling his/her emotions (indication of emotional dysregulation);
6. The child has a physical impairment;
7. The child has difficulty in adjusting to social situations or interacting with others (indication of adjustment problem);
8. The child is unable to respond or react to sounds (indication of hearing impairment);
9. The child is unable to recognise a person who is standing six metres away from her or him (indication of poor vision).
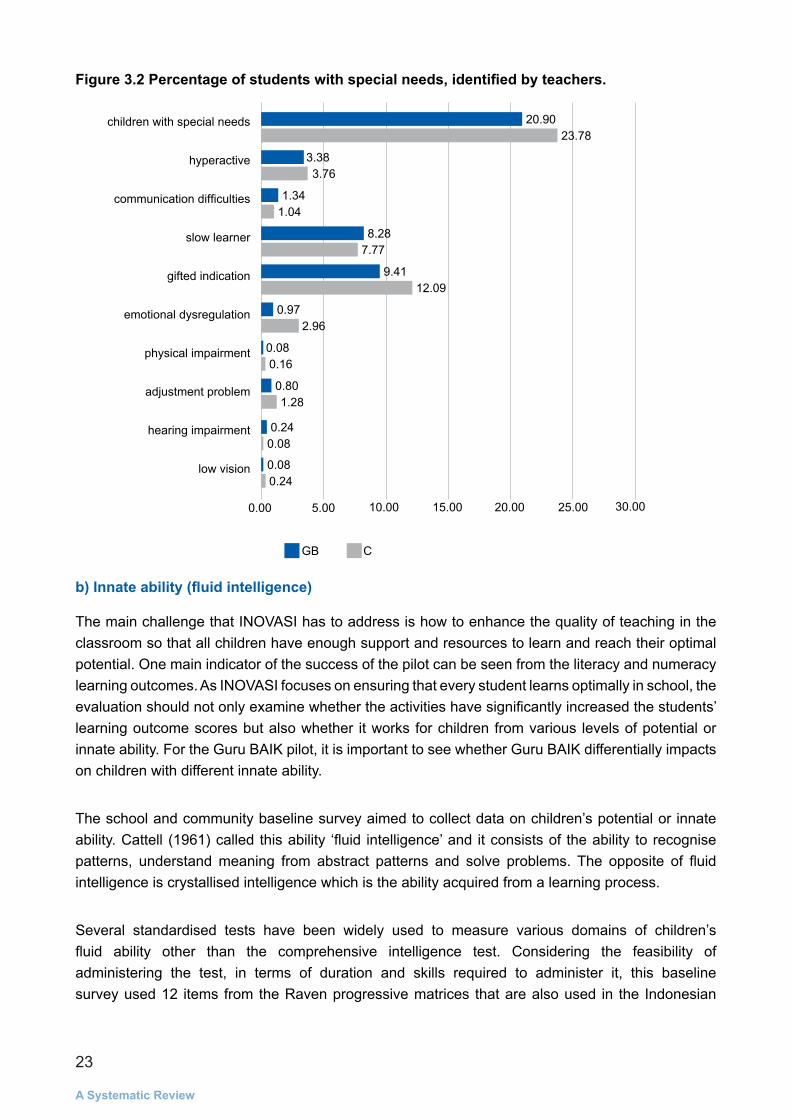
The roster was not designed to be an accurate diagnostic tool that could give reliable information about any disorders or impairments that the sampled students may have. We used this tool to capture students’ condition or behaviour in the classroom that may be due to certain psychological or physical disorders and establish whether the teachers were aware of these problems. Overall, our sampled teachers reported that about 20–24 per cent of students have one or more of these characteristics.
Figure 3.2 shows that teachers in the comparison schools reported a significantly higher proportion of students with indications of emotional dysregulation than teachers in the Guru BAIK schools. However, the proportion of sampled students who have other characteristics from the roster was not significantly different in the two groups. Out of all the characteristics listed in the roster, children with incredibly good memories made up the highest percentage in both groups (9.41 per cent and 12.09 per cent for Guru BAIK and comparison schools, respectively), followed by children with an indication of being slow learners (8.28 per cent and 7.77 per cent for Guru BAIK and comparison schools, respectively). Meanwhile, based on the teachers’ identification, the smallest proportion of students with special needs are related to physical conditions such as poor vision and physical or hearing impairments.
23
A Systematic Review
Figure 3.2 Percentage of students with special needs, identified by teachers.
b) Innate ability (fluid intelligence)
The main challenge that INOVASI has to address is how to enhance the quality of teaching in the classroom so that all children have enough support and resources to learn and reach their optimal potential. One main indicator of the success of the pilot can be seen from the literacy and numeracy learning outcomes. As INOVASI focuses on ensuring that every student learns optimally in school, the evaluation should not only examine whether the activities have significantly increased the students’ learning outcome scores but also whether it works for children from various levels of potential or innate ability. For the Guru BAIK pilot, it is important to see whether Guru BAIK differentially impacts on children with different innate ability.
The school and community baseline survey aimed to collect data on children’s potential or innate ability. Cattell (1961) called this ability ‘fluid intelligence’ and it consists of the ability to recognise patterns, understand meaning from abstract patterns and solve problems. The opposite of fluid intelligence is crystallised intelligence which is the ability acquired from a learning process.
Several standardised tests have been widely used to measure various domains of children’s fluid ability other than the comprehensive intelligence test. Considering the feasibility of administering the test, in terms of duration and skills required to administer it, this baseline survey used 12 items from the Raven progressive matrices that are also used in the Indonesian
children with special needs
hyperactive
communication difficulties
slow learner
gifted indication
emotional dysregulation
physical impairment
adjustment problem
hearing impairment
low vision
GB C
20.90
3.38
1.34
8.28
9.41
0.97
0.08
0.80
0.24
0.08
23.78
3.76
1.04
7.77
12.09
2.96
0.16
1.28
0.08
0.24
0.00 20.0010.00 30.005.00 25.0015.00
24
Interventions, Practices and Contextual Factors Linked to Indonesian Students’ Literacy and Numeracy Outcomes:
Life Family Survey (IFLS). We used a two-parameter logistic item response theory model
to compute students’ scores based on their responses to items with various levels of difficulty and discrimination power. The scores were then standardised based on the control group’s standard deviation.
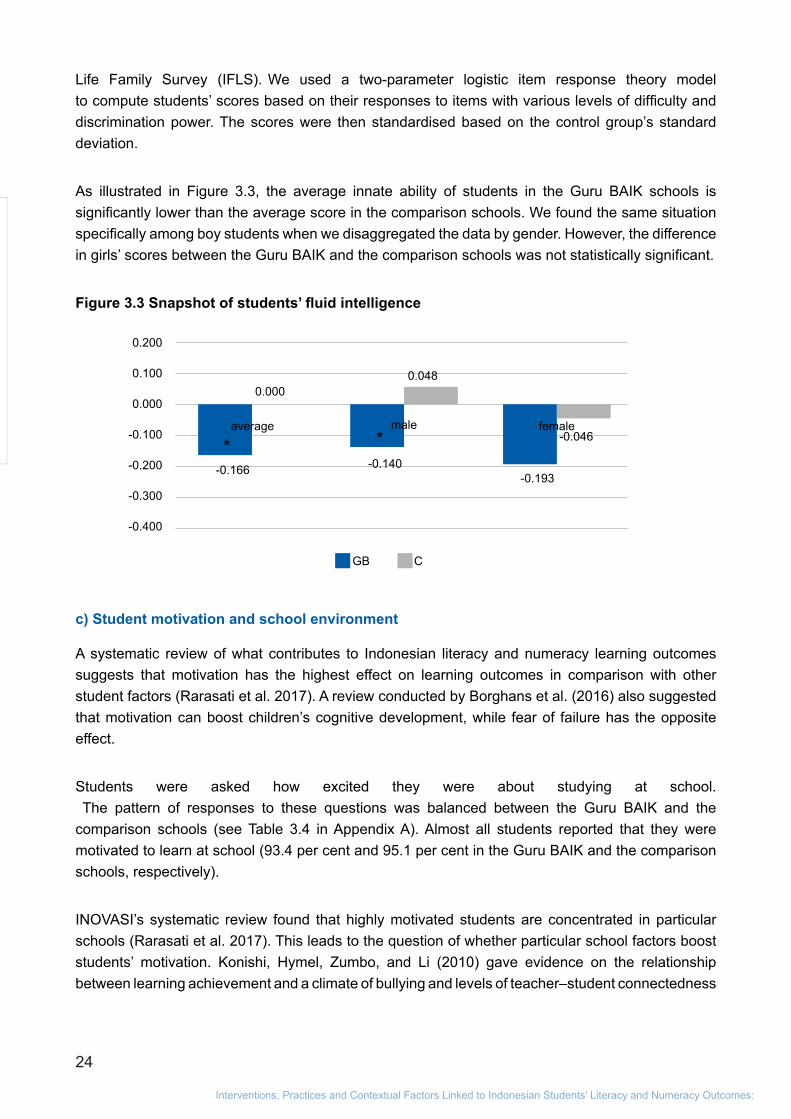
As illustrated in Figure 3.3, the average innate ability of students in the Guru BAIK schools is significantly lower than the average score in the comparison schools. We found the same situation specifically among boy students when we disaggregated the data by gender. However, the difference in girls’ scores between the Guru BAIK and the comparison schools was not statistically significant.
Figure 3.3 Snapshot of students’ fluid intelligence
c) Student motivation and school environment
A systematic review of what contributes to Indonesian literacy and numeracy learning outcomes suggests that motivation has the highest effect on learning outcomes in comparison with other student factors (Rarasati et al. 2017). A review conducted by Borghans et al. (2016) also suggested that motivation can boost children’s cognitive development, while fear of failure has the opposite effect.
Students were asked how excited they were about studying at school.
The pattern of responses to these questions was balanced between the Guru BAIK and the comparison schools (see Table 3.4 in Appendix A). Almost all students reported that they were motivated to learn at school (93.4 per cent and 95.1 per cent in the Guru BAIK and the comparison schools, respectively).
INOVASI’s systematic review found that highly motivated students are concentrated in particular schools (Rarasati et al. 2017). This leads to the question of whether particular school factors boost students’ motivation. Konishi, Hymel, Zumbo, and Li (2010) gave evidence on the relationship between learning achievement and a climate of bullying and levels of teacher–student connectedness
0.200
0.100
0.000
-0.100
-0.200
-0.300
-0.400
average male female
GB C
-0.166
0.000
* *
0.048
-0.046
-0.140-0.193
25
A Systematic Review
in a school. Students studying in schools with negative connectedness with their teacher and high occurance of bullying were likely to have lower mathematics and reading achievements.
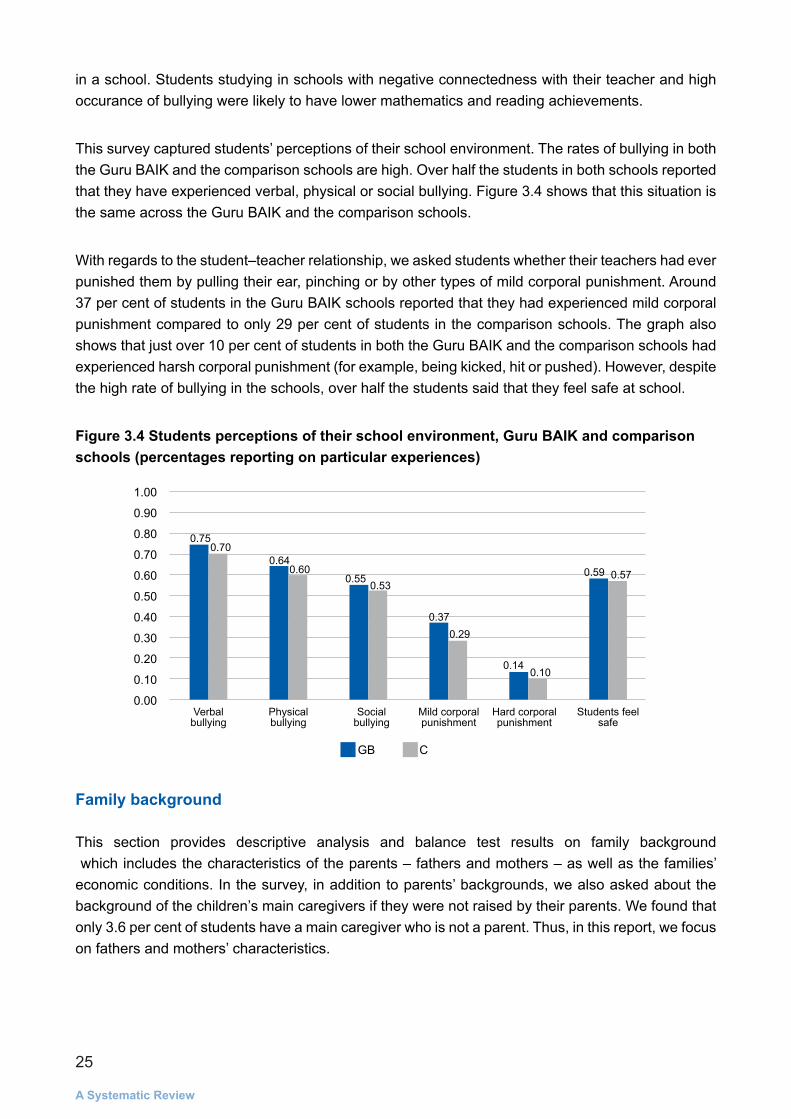
This survey captured students’ perceptions of their school environment. The rates of bullying in both the Guru BAIK and the comparison schools are high. Over half the students in both schools reported that they have experienced verbal, physical or social bullying. Figure 3.4 shows that this situation is the same across the Guru BAIK and the comparison schools.
With regards to the student–teacher relationship, we asked students whether their teachers had ever punished them by pulling their ear, pinching or by other types of mild corporal punishment. Around 37 per cent of students in the Guru BAIK schools reported that they had experienced mild corporal punishment compared to only 29 per cent of students in the comparison schools. The graph also shows that just over 10 per cent of students in both the Guru BAIK and the comparison schools had experienced harsh corporal punishment (for example, being kicked, hit or pushed). However, despite the high rate of bullying in the schools, over half the students said that they feel safe at school.
Figure 3.4 Students perceptions of their school environment, Guru BAIK and comparison schools (percentages reporting on particular experiences)
Family background
This section provides descriptive analysis and balance test results on family background
which includes the characteristics of the parents – fathers and mothers – as well as the families’ economic conditions. In the survey, in addition to parents’ backgrounds, we also asked about the background of the children’s main caregivers if they were not raised by their parents. We found that only 3.6 per cent of students have a main caregiver who is not a parent. Thus, in this report, we focus on fathers and mothers’ characteristics.
1.00
0.90
0.80
0.70
0.60
0.50
0.40
0.30
0.20
0.10
0.00
0.75
0.64
0.55
0.37
0.14
0.59
0.70
0.600.53
0.29
0.10
0.57
Verbal bullying
Physical bullying
Social bullying
Hard corporal punishment
Mild corporal punishment
Students feel safe
GB C
26
Interventions, Practices and Contextual Factors Linked to Indonesian Students’ Literacy and Numeracy Outcomes:
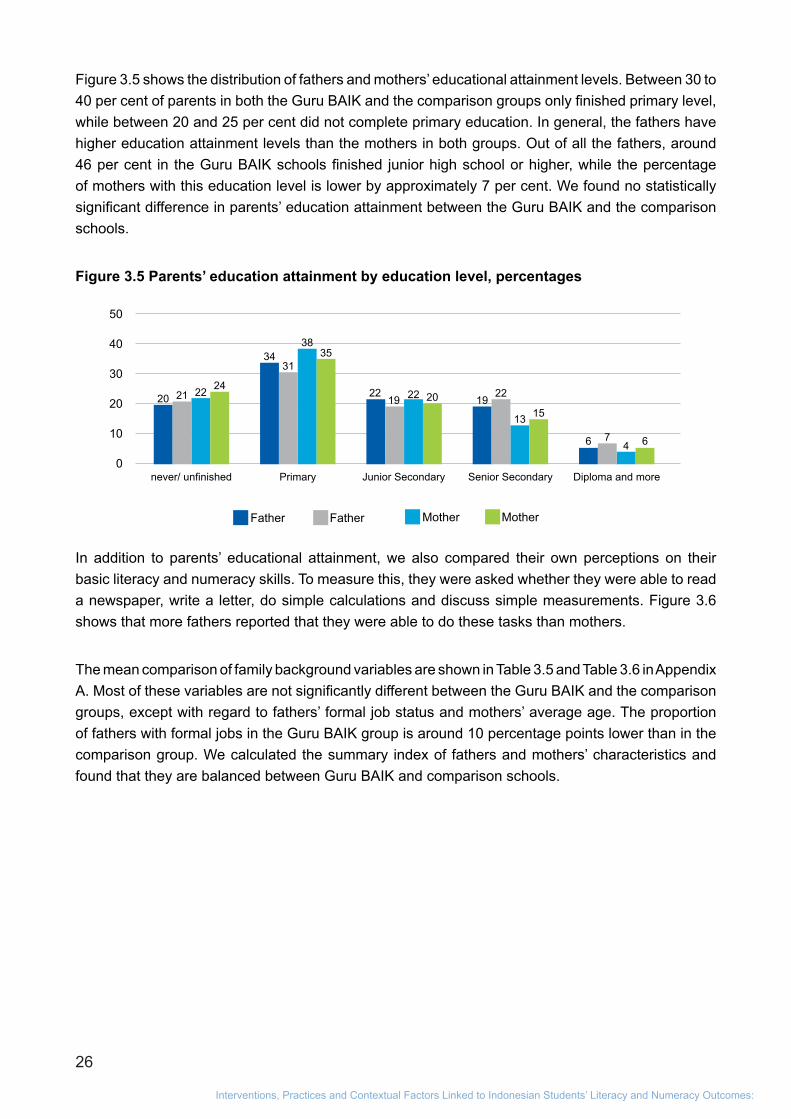
Figure 3.5 shows the distribution of fathers and mothers’ educational attainment levels. Between 30 to 40 per cent of parents in both the Guru BAIK and the comparison groups only finished primary level, while between 20 and 25 per cent did not complete primary education. In general, the fathers have higher education attainment levels than the mothers in both groups. Out of all the fathers, around 46 per cent in the Guru BAIK schools finished junior high school or higher, while the percentage of mothers with this education level is lower by approximately 7 per cent. We found no statistically significant difference in parents’ education attainment between the Guru BAIK and the comparison schools.
Figure 3.5 Parents’ education attainment by education level, percentages
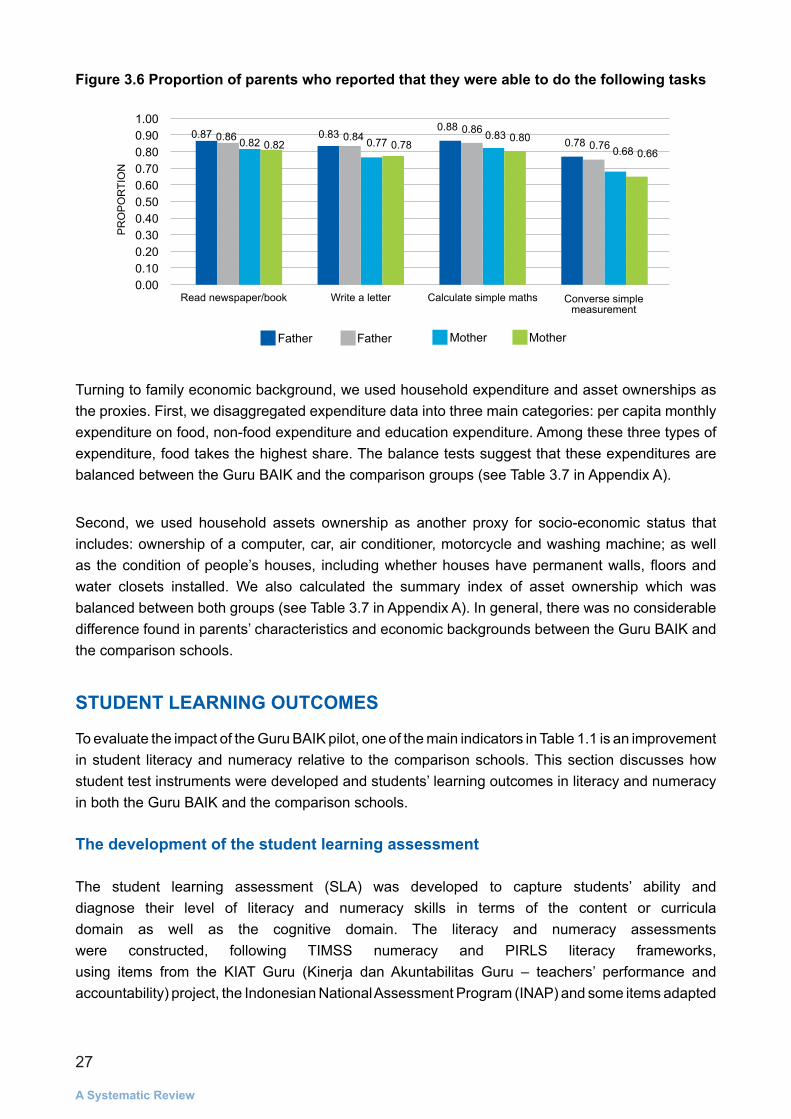
In addition to parents’ educational attainment, we also compared their own perceptions on their basic literacy and numeracy skills. To measure this, they were asked whether they were able to read a newspaper, write a letter, do simple calculations and discuss simple measurements. Figure 3.6 shows that more fathers reported that they were able to do these tasks than mothers.
The mean comparison of family background variables are shown in Table 3.5 and Table 3.6 in Appendix A. Most of these variables are not significantly different between the Guru BAIK and the comparison groups, except with regard to fathers’ formal job status and mothers’ average age. The proportion of fathers with formal jobs in the Guru BAIK group is around 10 percentage points lower than in the comparison group. We calculated the summary index of fathers and mothers’ characteristics and found that they are balanced between Guru BAIK and comparison schools.
50
40
30
20
10
0
20
34
2219
6
21
31
1922
7
22
38
22
13
4
24
35
2015
6
never/ unfinished Primary Junior Secondary Senior Secondary Diploma and more
Father MotherFather Mother
27
A Systematic Review
Figure 3.6 Proportion of parents who reported that they were able to do the following tasks
Turning to family economic background, we used household expenditure and asset ownerships as the proxies. First, we disaggregated expenditure data into three main categories: per capita monthly expenditure on food, non-food expenditure and education expenditure. Among these three types of expenditure, food takes the highest share. The balance tests suggest that these expenditures are balanced between the Guru BAIK and the comparison groups (see Table 3.7 in Appendix A).
Second, we used household assets ownership as another proxy for socio-economic status that includes: ownership of a computer, car, air conditioner, motorcycle and washing machine; as well as the condition of people’s houses, including whether houses have permanent walls, floors and water closets installed. We also calculated the summary index of asset ownership which was balanced between both groups (see Table 3.7 in Appendix A). In general, there was no considerable difference found in parents’ characteristics and economic backgrounds between the Guru BAIK and the comparison schools.
STUDENT LEARNING OUTCOMES
To evaluate the impact of the Guru BAIK pilot, one of the main indicators in Table 1.1 is an improvement in student literacy and numeracy relative to the comparison schools. This section discusses how student test instruments were developed and students’ learning outcomes in literacy and numeracy in both the Guru BAIK and the comparison schools.
The development of the student learning assessment
The student learning assessment (SLA) was developed to capture students’ ability and diagnose their level of literacy and numeracy skills in terms of the content or curricula domain as well as the cognitive domain. The literacy and numeracy assessments were constructed, following TIMSS numeracy and PIRLS literacy frameworks,
using items from the KIAT Guru (Kinerja dan Akuntabilitas Guru – teachers’ performance and accountability) project, the Indonesian National Assessment Program (INAP) and some items adapted
Read newspaper/book Write a letter Calculate simple maths Converse simple measurement
Father MotherFather Mother
1.000.900.800.700.600.500.400.300.200.100.00
PR
OP
OR
TIO
N0.87 0.83
0.880.780.86 0.84
0.860.760.82 0.77
0.830.680.82 0.78
0.800.66
28
Interventions, Practices and Contextual Factors Linked to Indonesian Students’ Literacy and Numeracy Outcomes:
from MoEC’s electronic textbooks. Developing the student learning assessment instrument involved several stages of pilot studies followed by the analysis of content and psychometric properties (item difficulty level, discrimination power and how the items fit the target population’s latent ability) carried out by INOVASI’s researchers with support from subject specialists and psychometricians.
The content domain for the assessment refers to the Indonesian curriculum. For mathematics, the assessment covers whole numbers, fractions and decimals, as well as geometry and measurement. For Indonesian language, it covers three areas: pre-literacy (letter, word, and sentence recognition), writing and reading. All the materials were presented in items with various hierarchies of cognitive domains: knowing, applying, reasoning and creating. To adapt the test to a wide range of students’ ability in each grade and make it comparable across grades, there are several identical questions that serve as the anchor items
between different grades.
In analysing the content and psychometric properties of the student learning assessment instruments, INOVASI collaborated with KIAT Guru since the project had also developed and pre-piloted student tests in mathematics and Indonesian language for grades one to five. During the process, INOVASI also supported KIAT Guru in reviewing the construct of the instruments, collecting further piloting data, running psychometric analyses on the items and increasing their comparability with national (INAP) and international (TIMSS and PIRLS) assessments. The test items were piloted in all ten districts in West Nusa Tenggara, Sumedang in West Java and Banten. Based on the data from the pilots, we reviewed the psychometric properties of the items and tailored the selected items into a test that suited the various levels of abilities of the target population (students in North Lombok and Sumbawa). The psychometric adviser also equated the INOVASI student learning assessment items to the INAP items to make the difficulty level comparable.
Our student learning assessment instruments were designed with no time limit for the test to be completed. Both mathematics and Indonesian language tests for grades one and two were administered individually, while for grade three, they were administered in groups. Unlike the early grades where only sampled students were tested, we tested all students in the sampled classes in grades four and five. For grades three to five, we set a 45-minute time limit. Based on the pilot tests, the time limit was actually longer than the average time needed to finish all the questions.
Student performance in literacy
The literacy assessment tools for the first and second grades consist of 24 and 25 items, respectively, and twelve of these items are the anchor items. The test consists of letter, word and sentence recognition, vocabulary and word usage, as well as explicit information retrieval from short passages. In terms of the cognitive domain, the first and second grade tests only assess students’ lower order thinking skills (knowing).
Each test for grades three to five consisted of 24 to 28 questions and about half of these were the anchor items. The tests cover writing and reading skills, such as: vocabulary and word usage;

29
A Systematic Review
grammar and punctuation; text organisation; focusing on and retrieving explicitly stated information; making straightforward inferences; interpreting and integrating ideas and information; evaluating and critiquing content and textual elements. Unlike the lower grade tests, the test for higher grades also assessed higher order thinking skills (applying, reasoning and creating).
Students’ responses to the questions were analysed using a two-parameter logistic item response theory model, where we can obtain information on students’ ability based on the probability of them giving correct responses to items with different difficulty levels and discrimination power. The scores shown in Figure 3.7 indicate the standardised students’ latent ability. We compared the overall literacy score of first to fifth grade students in the Guru BAIK and the comparison schools. Overall, there is no significant difference between two groups.
Figure 3.7 Literacy scores of grades one to five students
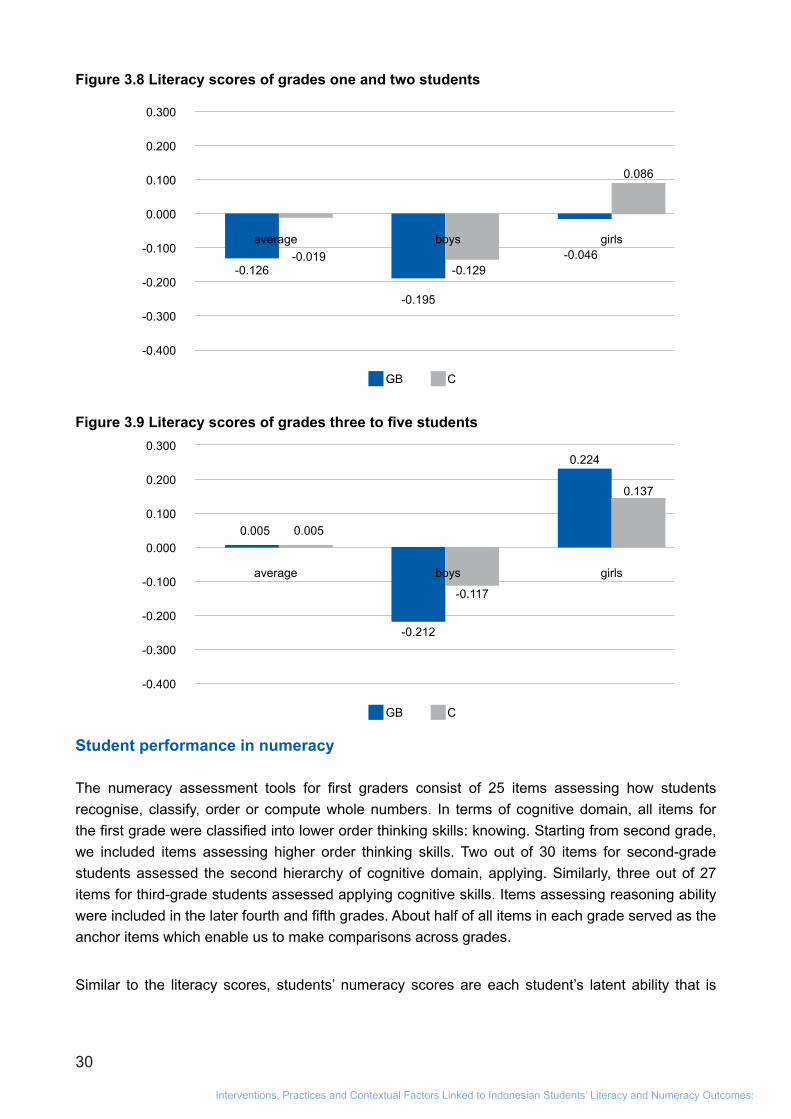
Similar results were also found when we disaggregated the assessment data into early grades (grades one and two) and higher grades (grades three to five) where we found no significant differences in literacy score between students in the Guru BAIK and the comparison schools. Figures 3.8 and 3.9 show the comparison between learning outcomes in both groups which were found to be balanced. What is interesting from these graphs is that girls outperformed boys in literacy and the gender gap in the comparison schools was found to be statistically significant.
0.300
0.200
0.100
0.000
-0.100
-0.200
-0.300
-0.400
average boys girls
GB C
-0.019
0.000
0.1770.127
-0.208
-0.119
30
Interventions, Practices and Contextual Factors Linked to Indonesian Students’ Literacy and Numeracy Outcomes:
Figure 3.8 Literacy scores of grades one and two students
Figure 3.9 Literacy scores of grades three to five students
Student performance in numeracy
The numeracy assessment tools for first graders consist of 25 items assessing how students recognise, classify, order or compute whole numbers. In terms of cognitive domain, all items for the first grade were classified into lower order thinking skills: knowing. Starting from second grade, we included items assessing higher order thinking skills. Two out of 30 items for second-grade students assessed the second hierarchy of cognitive domain, applying. Similarly, three out of 27 items for third-grade students assessed applying cognitive skills. Items assessing reasoning ability were included in the later fourth and fifth grades. About half of all items in each grade served as the anchor items which enable us to make comparisons across grades.
Similar to the literacy scores, students’ numeracy scores are each student’s latent ability that is
0.300
0.200
0.100
0.000
-0.100
-0.200
-0.300
-0.400
average boys girls
GB C
-0.019-0.126
-0.046
0.086
-0.195
-0.129
0.300
0.200
0.100
0.000
-0.100
-0.200
-0.300
-0.400
average boys girls
GB C
0.005 0.005
0.224
0.137
-0.212
-0.117

31
A Systematic Review
obtained from a two-parameter logistic item response theory model. As can be seen in Figure 3.10, there is no significant difference in numeracy performance between the Guru BAIK and the comparison schools. The same results were also found when we disaggregated the scores by gender.
Figure 3.10 Numeracy score of grades one to five students
The pattern of the scores is no longer similar between the Guru BAIK and the comparison schools when we look separately at early grades and higher grades. The boy students in the Guru BAIK schools scored significantly lower than those in the comparison schools. This score dragged down the overall Guru BAIK students score to significantly lower than the comparison schools. Figure 3.11 shows a similar pattern with literacy in which girls scored higher than boys and the gender gap is significant in the comparison group.
Figure 3.11 Numeracy score of grades one and two students
0.300
0.200
0.100
0.000
-0.100
-0.200
-0.300
-0.400
average boys girls
GB C
-0.017
0.0000.068 0.074
-0.099 -0.069
0.300
0.200
0.100
0.000
-0.100
-0.200
-0.300
-0.400
average boys girls
GB C
-0.236
0.116
-0.180
0.155
-0.283
0.075
**
32
Interventions, Practices and Contextual Factors Linked to Indonesian Students’ Literacy and Numeracy Outcomes:
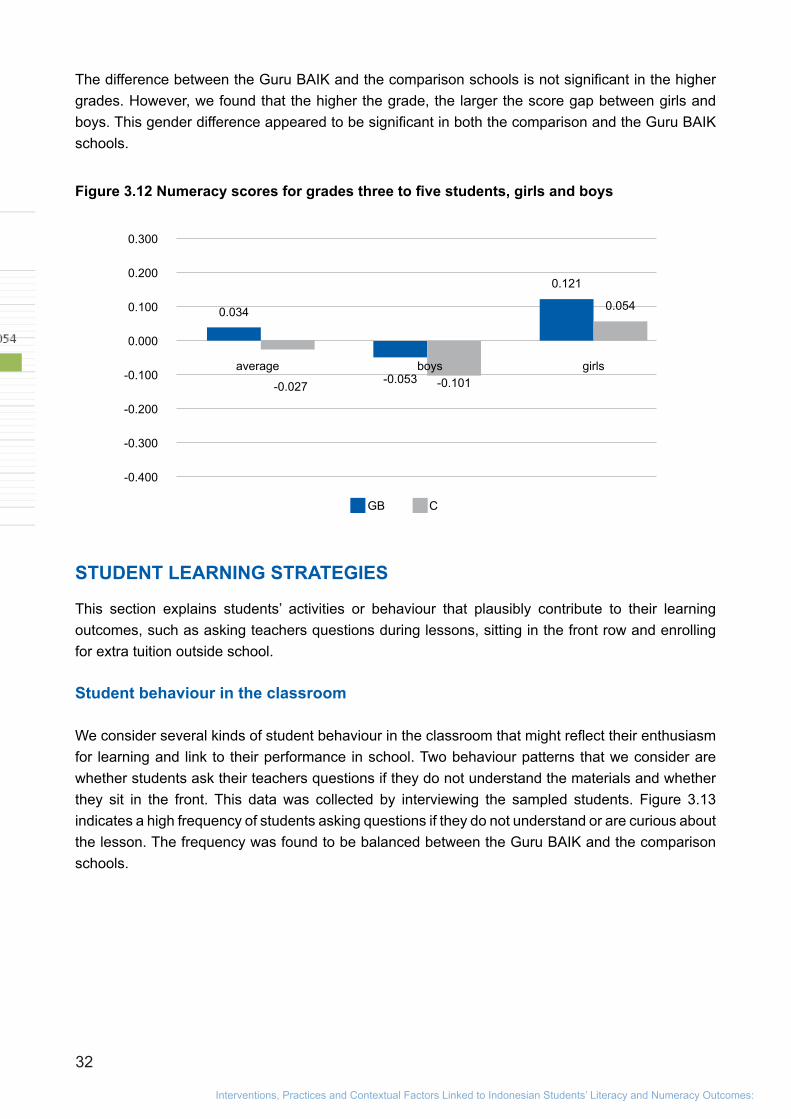
The difference between the Guru BAIK and the comparison schools is not significant in the higher grades. However, we found that the higher the grade, the larger the score gap between girls and boys. This gender difference appeared to be significant in both the comparison and the Guru BAIK schools.
Figure 3.12 Numeracy scores for grades three to five students, girls and boys
STUDENT LEARNING STRATEGIES
This section explains students’ activities or behaviour that plausibly contribute to their learning outcomes, such as asking teachers questions during lessons, sitting in the front row and enrolling for extra tuition outside school.
Student behaviour in the classroom
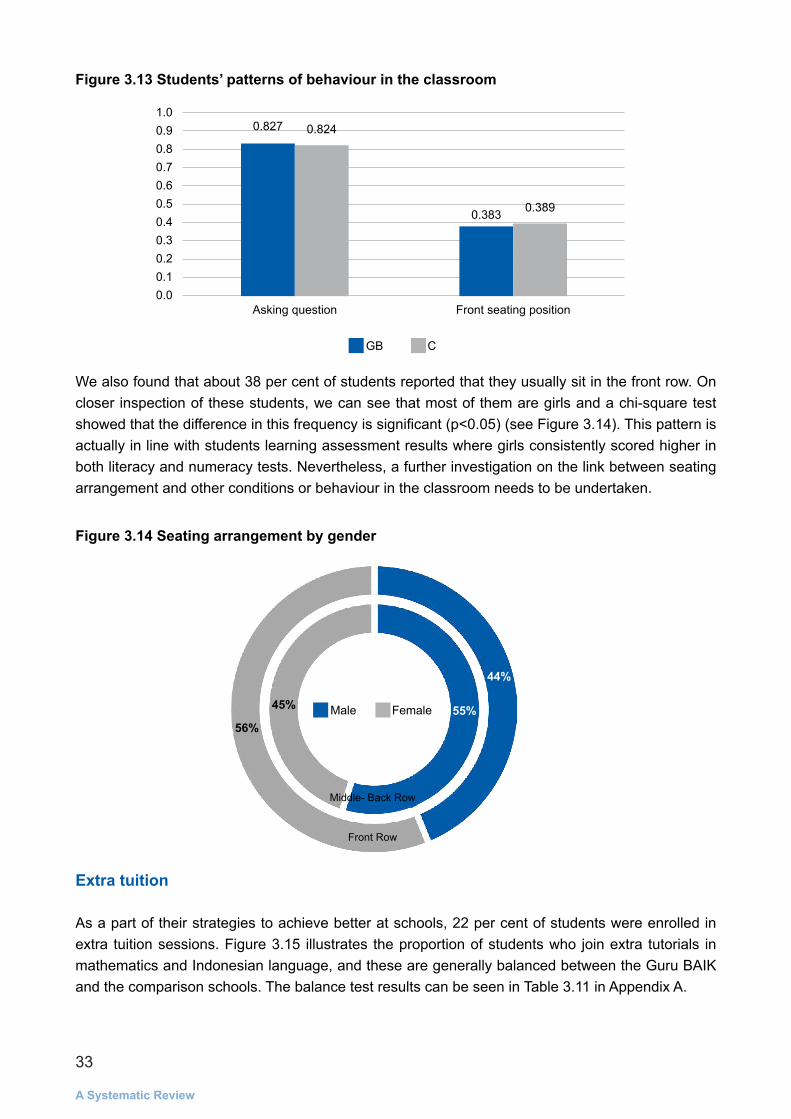
We consider several kinds of student behaviour in the classroom that might reflect their enthusiasm for learning and link to their performance in school. Two behaviour patterns that we consider are whether students ask their teachers questions if they do not understand the materials and whether they sit in the front. This data was collected by interviewing the sampled students. Figure 3.13 indicates a high frequency of students asking questions if they do not understand or are curious about the lesson. The frequency was found to be balanced between the Guru BAIK and the comparison schools.
0.300
0.200
0.100
0.000
-0.100
-0.200
-0.300
-0.400
average boys girls
GB C
0.034
-0.027
0.121
0.054
-0.053 -0.101
33
A Systematic Review
Figure 3.13 Students’ patterns of behaviour in the classroom
We also found that about 38 per cent of students reported that they usually sit in the front row. On closer inspection of these students, we can see that most of them are girls and a chi-square test showed that the difference in this frequency is significant (p<0.05) (see Figure 3.14). This pattern is actually in line with students learning assessment results where girls consistently scored higher in both literacy and numeracy tests. Nevertheless, a further investigation on the link between seating arrangement and other conditions or behaviour in the classroom needs to be undertaken.
Figure 3.14 Seating arrangement by gender
Extra tuition
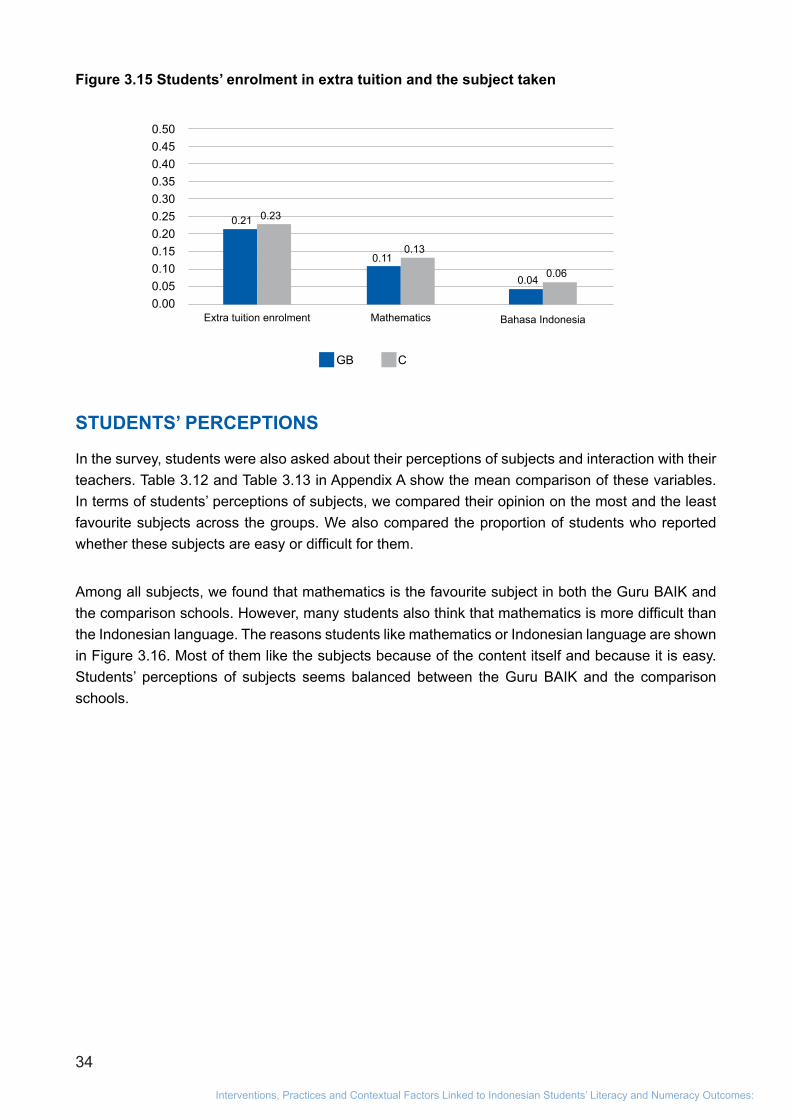
As a part of their strategies to achieve better at schools, 22 per cent of students were enrolled in extra tuition sessions. Figure 3.15 illustrates the proportion of students who join extra tutorials in mathematics and Indonesian language, and these are generally balanced between the Guru BAIK and the comparison schools. The balance test results can be seen in Table 3.11 in Appendix A.
Front Row
45%
44%
56%55%
Middle- Back Row
Male Female
1.00.90.80.70.60.50.40.30.20.10.0
0.827
0.383
Asking question Front seating position
GB C
0.824
0.389
34
Interventions, Practices and Contextual Factors Linked to Indonesian Students’ Literacy and Numeracy Outcomes:
Figure 3.15 Students’ enrolment in extra tuition and the subject taken
STUDENTS’ PERCEPTIONS
In the survey, students were also asked about their perceptions of subjects and interaction with their teachers. Table 3.12 and Table 3.13 in Appendix A show the mean comparison of these variables. In terms of students’ perceptions of subjects, we compared their opinion on the most and the least favourite subjects across the groups. We also compared the proportion of students who reported whether these subjects are easy or difficult for them.
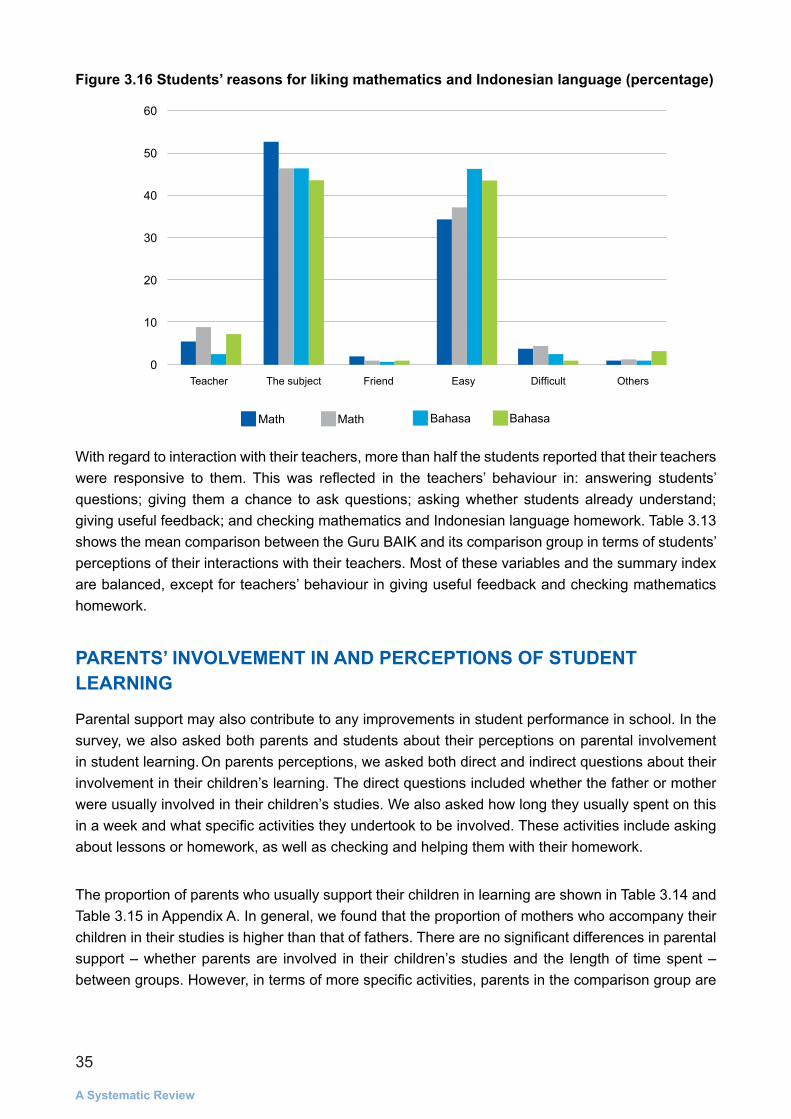
Among all subjects, we found that mathematics is the favourite subject in both the Guru BAIK and the comparison schools. However, many students also think that mathematics is more difficult than the Indonesian language. The reasons students like mathematics or Indonesian language are shown in Figure 3.16. Most of them like the subjects because of the content itself and because it is easy. Students’ perceptions of subjects seems balanced between the Guru BAIK and the comparison schools.
Extra tuition enrolment Mathematics Bahasa Indonesia
0.500.450.400.350.300.250.200.150.100.050.00
0.21
0.11
0.04
0.23
0.13
0.06
GB C
35
A Systematic Review
Figure 3.16 Students’ reasons for liking mathematics and Indonesian language (percentage)
With regard to interaction with their teachers, more than half the students reported that their teachers were responsive to them. This was reflected in the teachers’ behaviour in: answering students’ questions; giving them a chance to ask questions; asking whether students already understand; giving useful feedback; and checking mathematics and Indonesian language homework. Table 3.13 shows the mean comparison between the Guru BAIK and its comparison group in terms of students’ perceptions of their interactions with their teachers. Most of these variables and the summary index are balanced, except for teachers’ behaviour in giving useful feedback and checking mathematics homework.
PARENTS’ INVOLVEMENT IN AND PERCEPTIONS OF STUDENT LEARNING
Parental support may also contribute to any improvements in student performance in school. In the survey, we also asked both parents and students about their perceptions on parental involvement in student learning. On parents perceptions, we asked both direct and indirect questions about their involvement in their children’s learning. The direct questions included whether the father or mother were usually involved in their children’s studies. We also asked how long they usually spent on this in a week and what specific activities they undertook to be involved. These activities include asking about lessons or homework, as well as checking and helping them with their homework.
The proportion of parents who usually support their children in learning are shown in Table 3.14 and Table 3.15 in Appendix A. In general, we found that the proportion of mothers who accompany their children in their studies is higher than that of fathers. There are no significant differences in parental support – whether parents are involved in their children’s studies and the length of time spent – between groups. However, in terms of more specific activities, parents in the comparison group are
Teacher The subject Friend Easy Difficult Others
Math BahasaMath Bahasa
60
50
40
30
20
10
0
36
Interventions, Practices and Contextual Factors Linked to Indonesian Students’ Literacy and Numeracy Outcomes:
significantly more involved in students’ learning, particularly in terms of asking about lessons, and checking and helping them with homework.
The indirect questions that may imply parents’ involvement relate to parent–teacher relationships. For example, we asked whether parents knew the name of their children’s teacher and whether they had ever had a meeting with the teacher or made unannounced visits to the school to discuss their children’s achievement. We also asked whether they were satisfied with the teacher. The mean comparisons of these variables between the two groups are shown in Table 3.17 in Appendix A. Two out of six variables show unbalanced results between the two groups. Parents in the comparison group are significantly more involved in monitoring teachers’ work and more satisfied with the teachers.
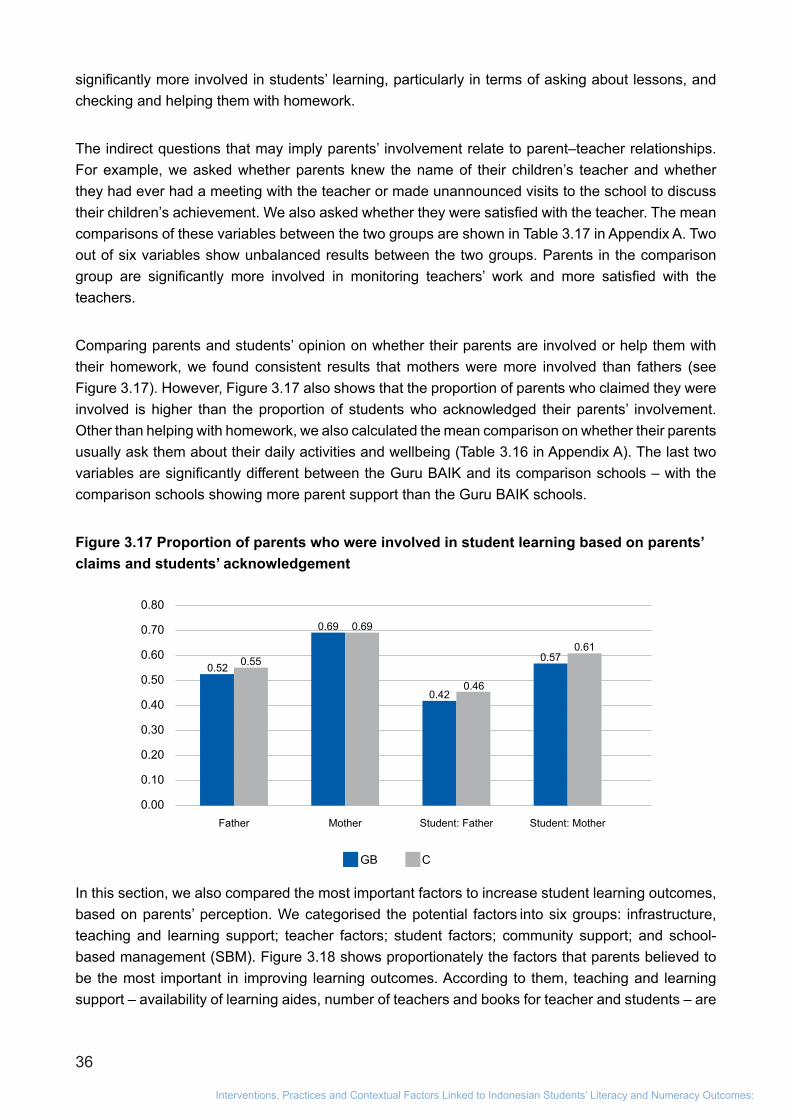
Comparing parents and students’ opinion on whether their parents are involved or help them with their homework, we found consistent results that mothers were more involved than fathers (see Figure 3.17). However, Figure 3.17 also shows that the proportion of parents who claimed they were involved is higher than the proportion of students who acknowledged their parents’ involvement. Other than helping with homework, we also calculated the mean comparison on whether their parents usually ask them about their daily activities and wellbeing (Table 3.16 in Appendix A). The last two variables are significantly different between the Guru BAIK and its comparison schools – with the comparison schools showing more parent support than the Guru BAIK schools.
Figure 3.17 Proportion of parents who were involved in student learning based on parents’ claims and students’ acknowledgement
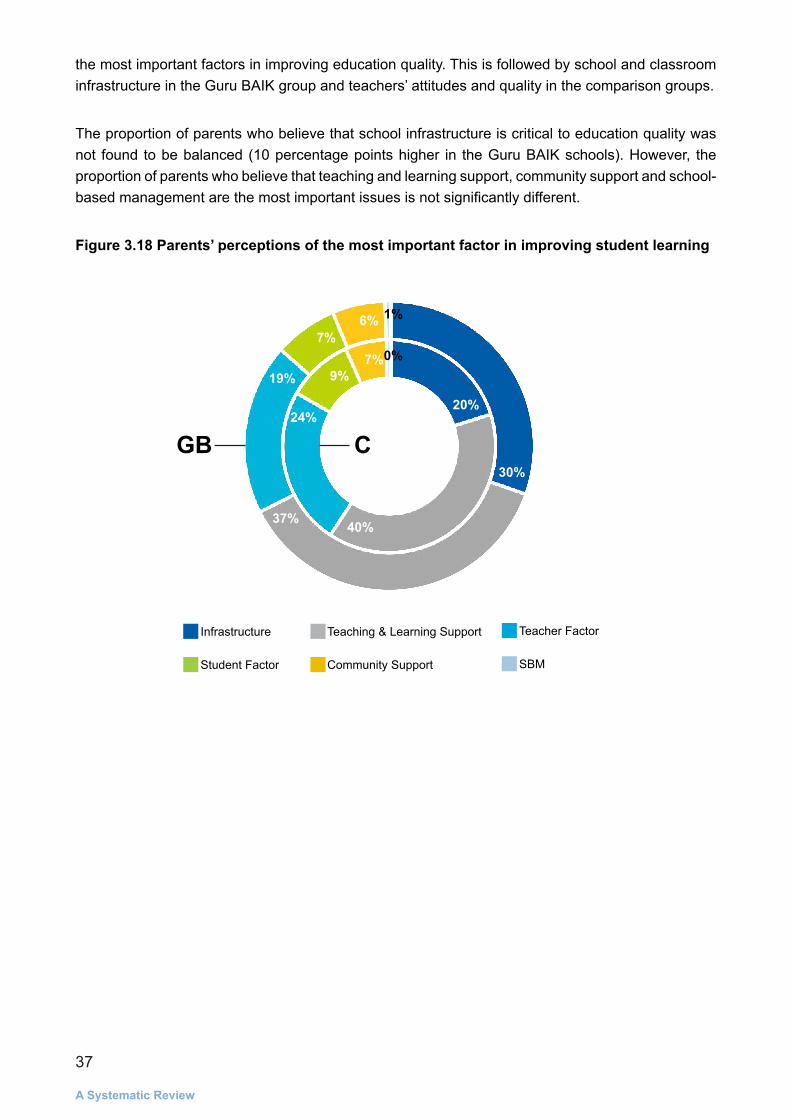
In this section, we also compared the most important factors to increase student learning outcomes, based on parents’ perception. We categorised the potential factors into six groups: infrastructure, teaching and learning support; teacher factors; student factors; community support; and school-based management (SBM). Figure 3.18 shows proportionately the factors that parents believed to be the most important in improving learning outcomes. According to them, teaching and learning support – availability of learning aides, number of teachers and books for teacher and students – are
0.80
0.70
0.60
0.50
0.40
0.30
0.20
0.10
0.00
0.57
0.42
0.52
0.69 0.69
0.61
0.46
0.55
Father Mother Student: Father Student: Mother
GB C
37
A Systematic Review
the most important factors in improving education quality. This is followed by school and classroom infrastructure in the Guru BAIK group and teachers’ attitudes and quality in the comparison groups.
The proportion of parents who believe that school infrastructure is critical to education quality was not found to be balanced (10 percentage points higher in the Guru BAIK schools). However, the proportion of parents who believe that teaching and learning support, community support and school-based management are the most important issues is not significantly different.
Figure 3.18 Parents’ perceptions of the most important factor in improving student learning
Infrastructure
Student Factor
Teacher Factor
SBM
Teaching & Learning Support
Community Support
19%
24%
CGB
40%
20%
30%
37%
7%7%
6% 1%
0%9%
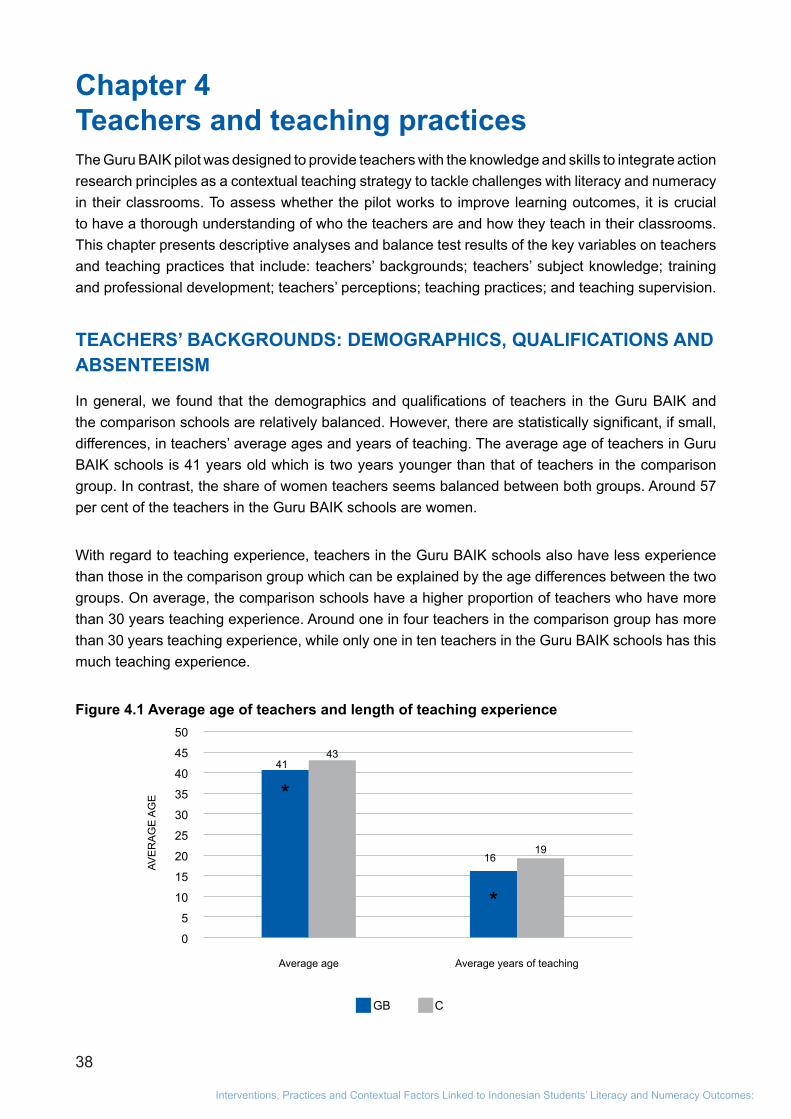
38
Interventions, Practices and Contextual Factors Linked to Indonesian Students’ Literacy and Numeracy Outcomes:
Chapter 4 Teachers and teaching practicesThe Guru BAIK pilot was designed to provide teachers with the knowledge and skills to integrate action research principles as a contextual teaching strategy to tackle challenges with literacy and numeracy in their classrooms. To assess whether the pilot works to improve learning outcomes, it is crucial to have a thorough understanding of who the teachers are and how they teach in their classrooms. This chapter presents descriptive analyses and balance test results of the key variables on teachers and teaching practices that include: teachers’ backgrounds; teachers’ subject knowledge; training and professional development; teachers’ perceptions; teaching practices; and teaching supervision.
TEACHERS’ BACKGROUNDS: DEMOGRAPHICS, QUALIFICATIONS AND ABSENTEEISM
In general, we found that the demographics and qualifications of teachers in the Guru BAIK and the comparison schools are relatively balanced. However, there are statistically significant, if small, differences, in teachers’ average ages and years of teaching. The average age of teachers in Guru BAIK schools is 41 years old which is two years younger than that of teachers in the comparison group. In contrast, the share of women teachers seems balanced between both groups. Around 57 per cent of the teachers in the Guru BAIK schools are women.
With regard to teaching experience, teachers in the Guru BAIK schools also have less experience than those in the comparison group which can be explained by the age differences between the two groups. On average, the comparison schools have a higher proportion of teachers who have more than 30 years teaching experience. Around one in four teachers in the comparison group has more than 30 years teaching experience, while only one in ten teachers in the Guru BAIK schools has this much teaching experience.
Figure 4.1 Average age of teachers and length of teaching experience
50
45
40
35
30
25
20
15
10
5
0
19
41
*
*
16
43
Average age Average years of teaching
GB C
AVE
RA
GE
AG
E
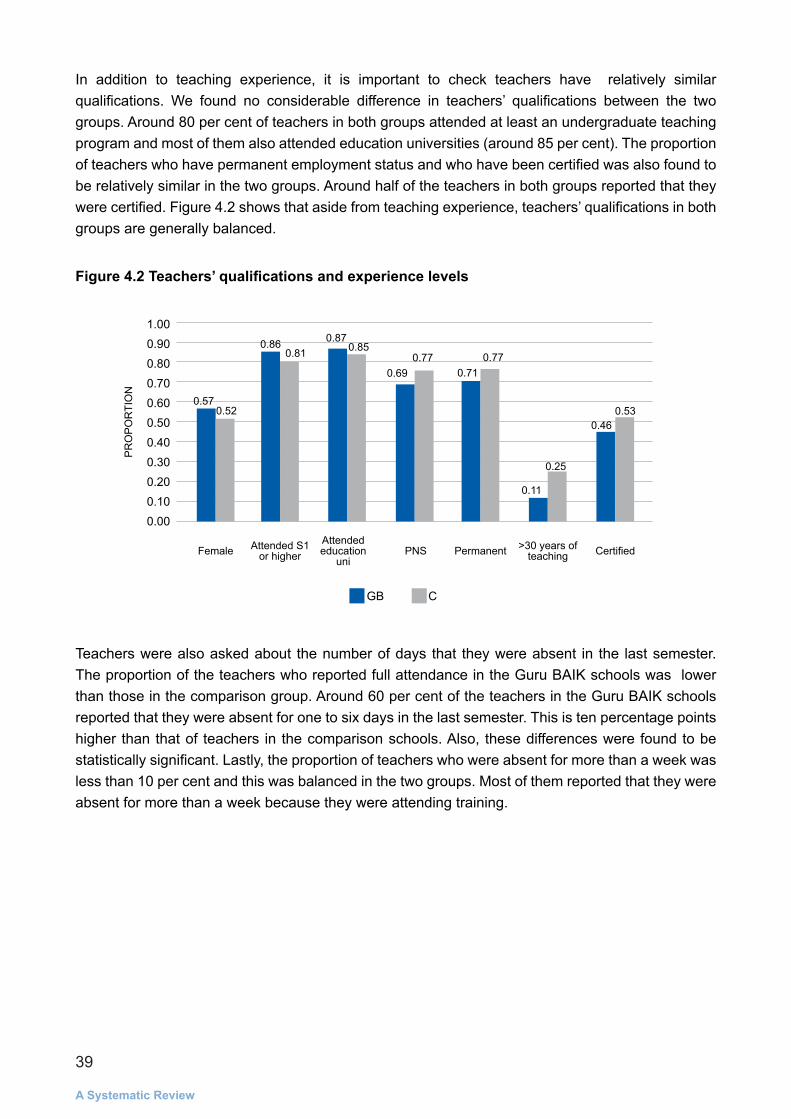
39
A Systematic Review
In addition to teaching experience, it is important to check teachers have relatively similar qualifications. We found no considerable difference in teachers’ qualifications between the two groups. Around 80 per cent of teachers in both groups attended at least an undergraduate teaching program and most of them also attended education universities (around 85 per cent). The proportion of teachers who have permanent employment status and who have been certified was also found to be relatively similar in the two groups. Around half of the teachers in both groups reported that they were certified. Figure 4.2 shows that aside from teaching experience, teachers’ qualifications in both groups are generally balanced.
Figure 4.2 Teachers’ qualifications and experience levels
Teachers were also asked about the number of days that they were absent in the last semester. The proportion of the teachers who reported full attendance in the Guru BAIK schools was lower than those in the comparison group. Around 60 per cent of the teachers in the Guru BAIK schools reported that they were absent for one to six days in the last semester. This is ten percentage points higher than that of teachers in the comparison schools. Also, these differences were found to be statistically significant. Lastly, the proportion of teachers who were absent for more than a week was less than 10 per cent and this was balanced in the two groups. Most of them reported that they were absent for more than a week because they were attending training.
1.000.900.800.700.600.500.400.300.200.100.00
0.86 0.87
0.69 0.71
0.11
0.46
0.81 0.850.77 0.77
0.25
0.53
Female Attended S1 or higher
Attended education
uniPermanent CertifiedPNS >30 years of
teaching
GB C
PR
OP
OR
TIO
N
0.570.52
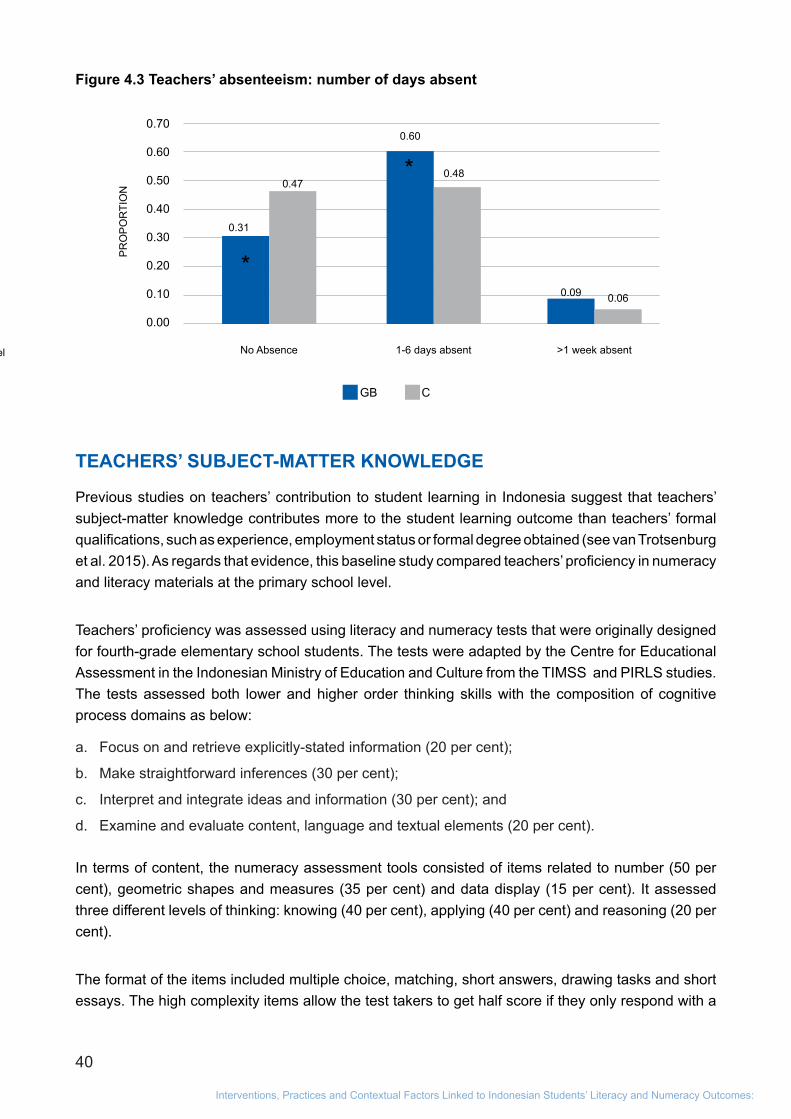
40
Interventions, Practices and Contextual Factors Linked to Indonesian Students’ Literacy and Numeracy Outcomes:
Figure 4.3 Teachers’ absenteeism: number of days absent
TEACHERS’ SUBJECT-MATTER KNOWLEDGE
Previous studies on teachers’ contribution to student learning in Indonesia suggest that teachers’ subject-matter knowledge contributes more to the student learning outcome than teachers’ formal qualifications, such as experience, employment status or formal degree obtained (see van Trotsenburg et al. 2015). As regards that evidence, this baseline study compared teachers’ proficiency in numeracy and literacy materials at the primary school level.
Teachers’ proficiency was assessed using literacy and numeracy tests that were originally designed for fourth-grade elementary school students. The tests were adapted by the Centre for Educational Assessment in the Indonesian Ministry of Education and Culture from the TIMSS and PIRLS studies. The tests assessed both lower and higher order thinking skills with the composition of cognitive process domains as below:
a. Focus on and retrieve explicitly-stated information (20 per cent);
b. Make straightforward inferences (30 per cent);
c. Interpret and integrate ideas and information (30 per cent); and
d. Examine and evaluate content, language and textual elements (20 per cent).
In terms of content, the numeracy assessment tools consisted of items related to number (50 per cent), geometric shapes and measures (35 per cent) and data display (15 per cent). It assessed three different levels of thinking: knowing (40 per cent), applying (40 per cent) and reasoning (20 per cent).
The format of the items included multiple choice, matching, short answers, drawing tasks and short essays. The high complexity items allow the test takers to get half score if they only respond with a
Students feel safe
0.70
0.60
0.50
0.40
0.30
0.20
0.10
0.00
0.31
0.60
0.09
0.470.48
0.06
GB C
PR
OP
OR
TIO
N
*
*
No Absence 1-6 days absent >1 week absent
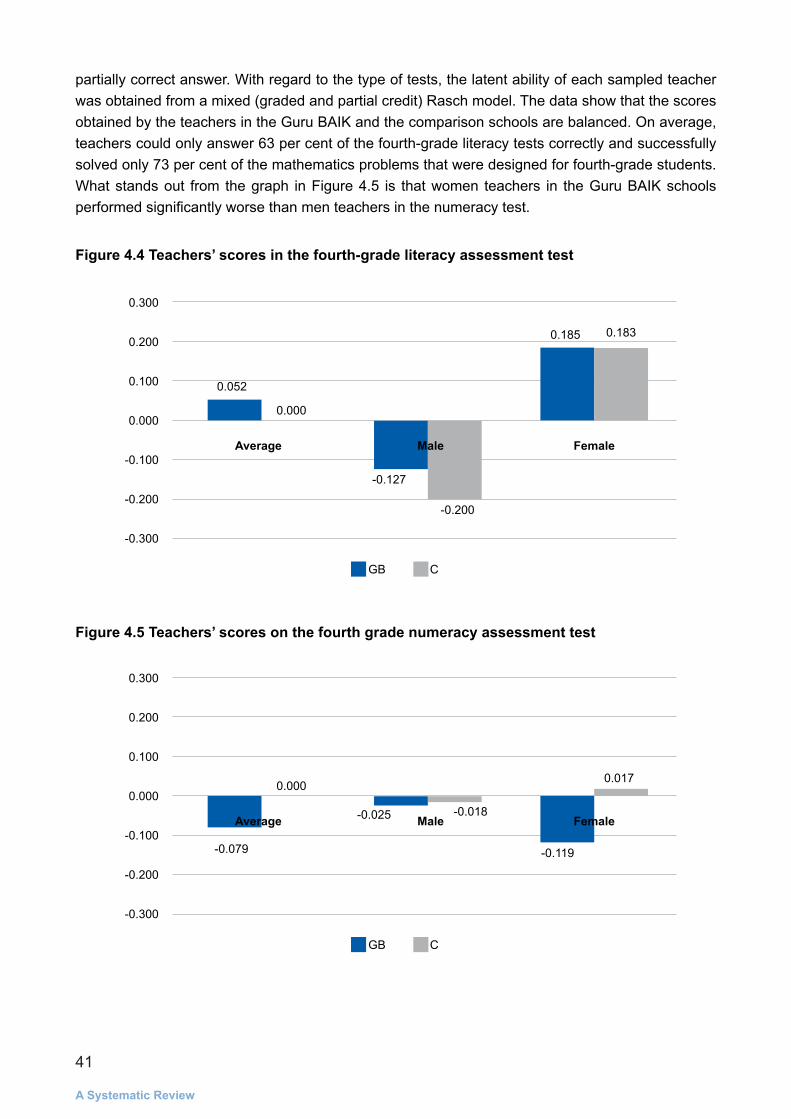
41
A Systematic Review
partially correct answer. With regard to the type of tests, the latent ability of each sampled teacher was obtained from a mixed (graded and partial credit) Rasch model. The data show that the scores obtained by the teachers in the Guru BAIK and the comparison schools are balanced. On average, teachers could only answer 63 per cent of the fourth-grade literacy tests correctly and successfully solved only 73 per cent of the mathematics problems that were designed for fourth-grade students. What stands out from the graph in Figure 4.5 is that women teachers in the Guru BAIK schools performed significantly worse than men teachers in the numeracy test.
Figure 4.4 Teachers’ scores in the fourth-grade literacy assessment test
Figure 4.5 Teachers’ scores on the fourth grade numeracy assessment test
0.300
0.200
0.100
0.000
-0.100
-0.200
-0.300
Average Male Female
GB C
-0.079
0.000
-0.119
0.017
-0.025 -0.018
0.300
0.200
0.100
0.000
-0.100
-0.200
-0.300
Average Male Female
GB C
0.052
0.000
0.185 0.183
-0.127
-0.200
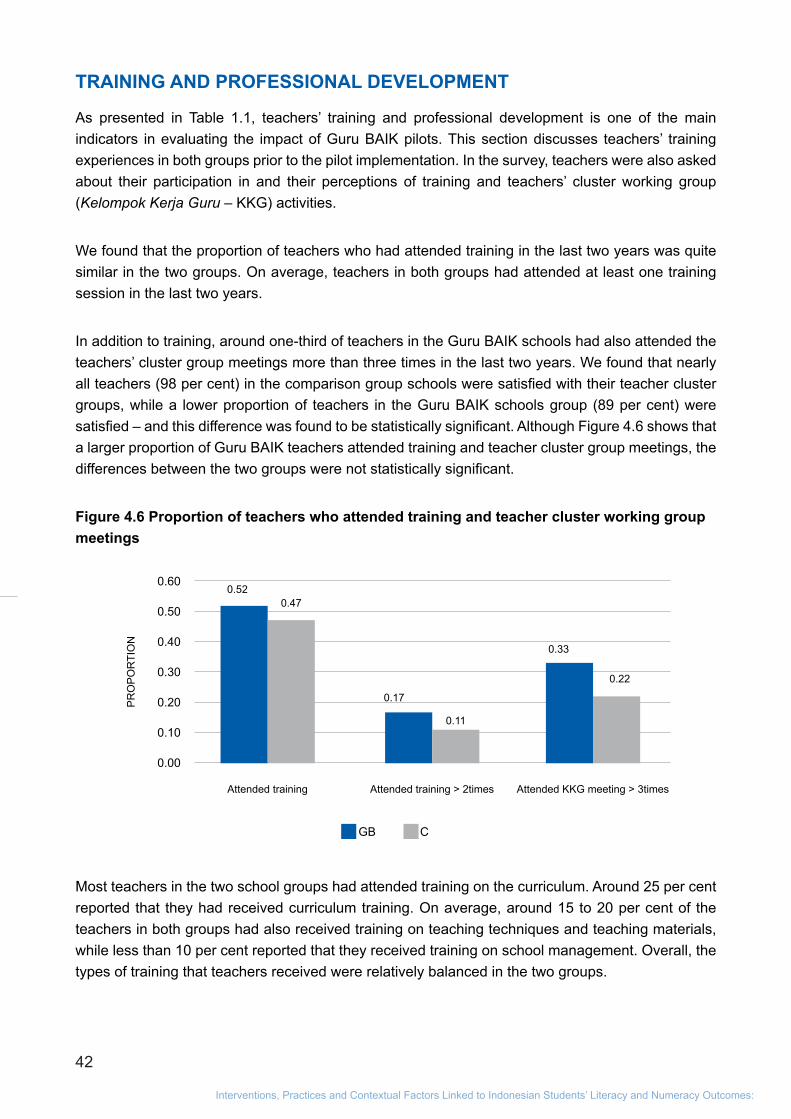
42
Interventions, Practices and Contextual Factors Linked to Indonesian Students’ Literacy and Numeracy Outcomes:
TRAINING AND PROFESSIONAL DEVELOPMENT
As presented in Table 1.1, teachers’ training and professional development is one of the main indicators in evaluating the impact of Guru BAIK pilots. This section discusses teachers’ training experiences in both groups prior to the pilot implementation. In the survey, teachers were also asked about their participation in and their perceptions of training and teachers’ cluster working group (Kelompok Kerja Guru – KKG) activities.
We found that the proportion of teachers who had attended training in the last two years was quite similar in the two groups. On average, teachers in both groups had attended at least one training session in the last two years.
In addition to training, around one-third of teachers in the Guru BAIK schools had also attended the teachers’ cluster group meetings more than three times in the last two years. We found that nearly all teachers (98 per cent) in the comparison group schools were satisfied with their teacher cluster groups, while a lower proportion of teachers in the Guru BAIK schools group (89 per cent) were satisfied – and this difference was found to be statistically significant. Although Figure 4.6 shows that a larger proportion of Guru BAIK teachers attended training and teacher cluster group meetings, the differences between the two groups were not statistically significant.
Figure 4.6 Proportion of teachers who attended training and teacher cluster working group meetings
Most teachers in the two school groups had attended training on the curriculum. Around 25 per cent reported that they had received curriculum training. On average, around 15 to 20 per cent of the teachers in both groups had also received training on teaching techniques and teaching materials, while less than 10 per cent reported that they received training on school management. Overall, the types of training that teachers received were relatively balanced in the two groups.
0.60
0.50
0.40
0.30
0.20
0.10
0.00
0.52
0.17
0.33
0.47
0.11
0.22
GB C
PR
OP
OR
TIO
N
Attended training Attended training > 2times Attended KKG meeting > 3times
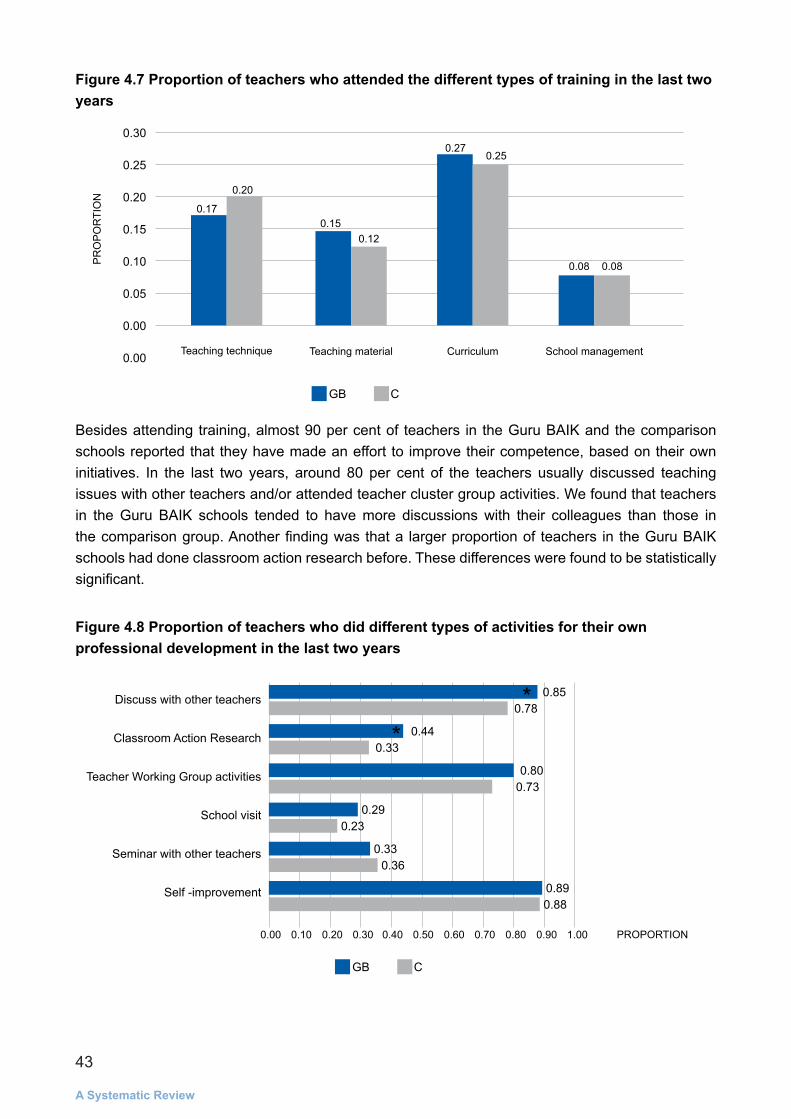
43
A Systematic Review
Figure 4.7 Proportion of teachers who attended the different types of training in the last two years
Besides attending training, almost 90 per cent of teachers in the Guru BAIK and the comparison schools reported that they have made an effort to improve their competence, based on their own initiatives. In the last two years, around 80 per cent of the teachers usually discussed teaching issues with other teachers and/or attended teacher cluster group activities. We found that teachers in the Guru BAIK schools tended to have more discussions with their colleagues than those in the comparison group. Another finding was that a larger proportion of teachers in the Guru BAIK schools had done classroom action research before. These differences were found to be statistically significant.
Figure 4.8 Proportion of teachers who did different types of activities for their own professional development in the last two years
0.30
0.25
0.20
0.15
0.10
0.05
0.00
0.00
0.170.15
0.27
0.08 0.08
0.20
0.12
0.25
GB C
PR
OP
OR
TIO
N
Teaching technique Teaching material Curriculum School management
Discuss with other teachers
Classroom Action Research
Teacher Working Group activities
School visit
Seminar with other teachers
Self -improvement
GB C
0.00 0.400.20 0.60 0.900.10 0.50 0.800.30 0.70 1.00
0.85
0.44
0.80
0.29
0.33
0.89
0.78
0.33
0.73
0.23
0.36
0.88
PROPORTION
**
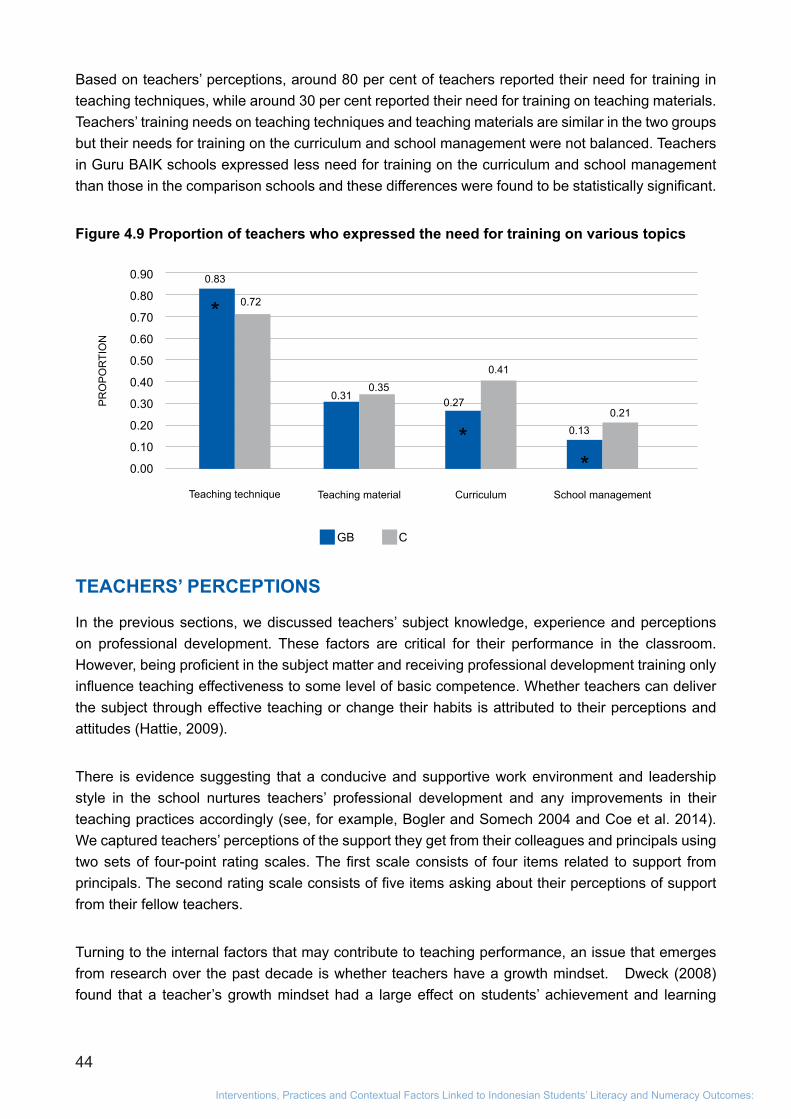
44
Interventions, Practices and Contextual Factors Linked to Indonesian Students’ Literacy and Numeracy Outcomes:
Based on teachers’ perceptions, around 80 per cent of teachers reported their need for training in teaching techniques, while around 30 per cent reported their need for training on teaching materials. Teachers’ training needs on teaching techniques and teaching materials are similar in the two groups but their needs for training on the curriculum and school management were not balanced. Teachers in Guru BAIK schools expressed less need for training on the curriculum and school management than those in the comparison schools and these differences were found to be statistically significant.
Figure 4.9 Proportion of teachers who expressed the need for training on various topics
TEACHERS’ PERCEPTIONS
In the previous sections, we discussed teachers’ subject knowledge, experience and perceptions on professional development. These factors are critical for their performance in the classroom. However, being proficient in the subject matter and receiving professional development training only influence teaching effectiveness to some level of basic competence. Whether teachers can deliver the subject through effective teaching or change their habits is attributed to their perceptions and attitudes (Hattie, 2009).
There is evidence suggesting that a conducive and supportive work environment and leadership style in the school nurtures teachers’ professional development and any improvements in their teaching practices accordingly (see, for example, Bogler and Somech 2004 and Coe et al. 2014). We captured teachers’ perceptions of the support they get from their colleagues and principals using two sets of four-point rating scales. The first scale consists of four items related to support from principals. The second rating scale consists of five items asking about their perceptions of support from their fellow teachers.
Turning to the internal factors that may contribute to teaching performance, an issue that emerges from research over the past decade is whether teachers have a growth mindset. Dweck (2008) found that a teacher’s growth mindset had a large effect on students’ achievement and learning
0.90
0.80
0.70
0.60
0.50
0.40
0.30
0.20
0.10
0.00
0.83
0.31 0.27
0.130.21
0.72
0.35
0.41
GB C
PR
OP
OR
TIO
N
Teaching technique Teaching material Curriculum School management
**
*

45
A Systematic Review
progress. A growth mindset is a belief that intelligence or talent can be developed over time by learning. People with fixed mindsets believe that intelligence is a trait that people are born with and it cannot be changed (Dweck, 1996). Dweck (2008) believes that students are sensitive to how adults value their effort and intelligence and quickly pick up that belief and act accordingly. We assessed our sampled teachers’ mindset towards intelligence using three items that were adapted from Romero et al. (2014). These items were presented in a four-point rating scale.
To obtain information on teachers’ mindsets and perceptions of support from their colleagues, their responses were analysed using a rating-scale model in item–response theory. Figure 4.10 illustrates teachers’ perceptions of support from their colleagues.
Figure 4.10 Teachers’ perceptions of support from fellow teachers
From Figure 4.10 we can see that teachers’ perceptions of how supportive their colleagues are is balanced between the Guru BAIK and the comparison schools. More detailed balance test results are shown in Table 4.5 in Appendix A. We found similar patterns with regard to teachers’ perceptions of support from their principals. Relative to the comparison group, teachers in the Guru BAIK schools reported slightly less support from their principals (see Figure 4.11) although the difference is not significant.
0.300
0.250
0.200
0.150
0.100
0.050
0.000
-0.050
-0.100
GB C
Average Male Female
0.061
0.000
0.132
-0.033-0.034
0.036
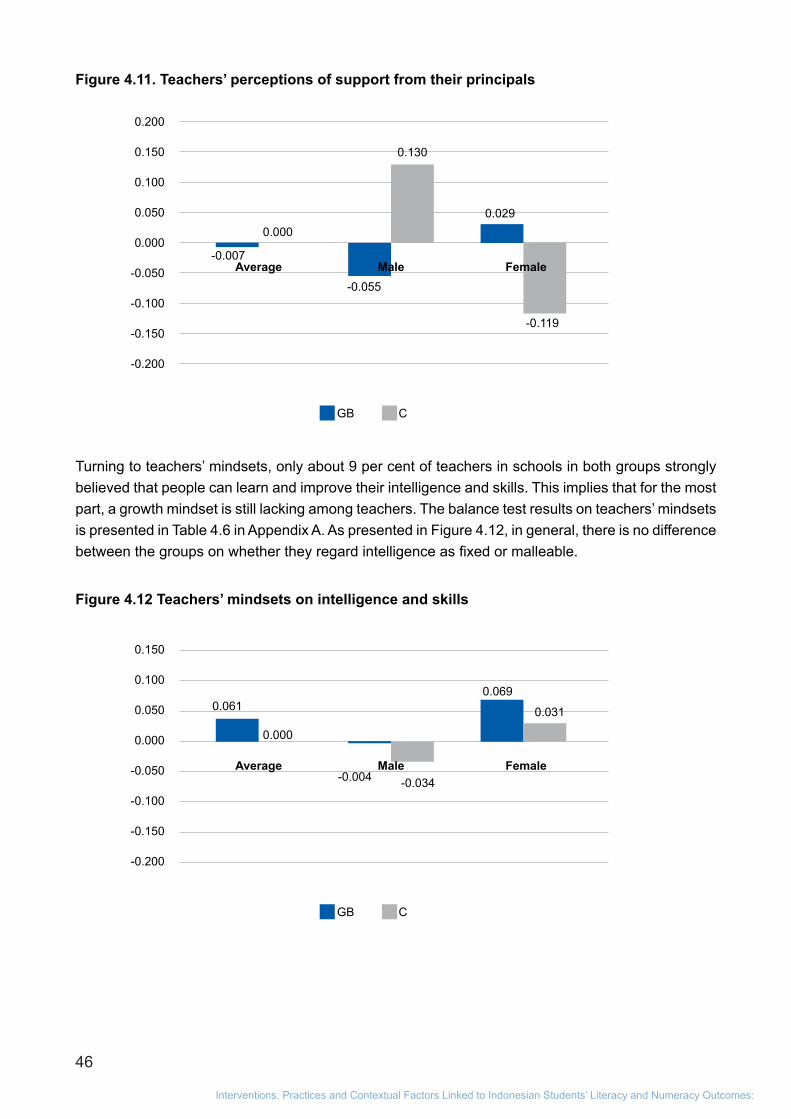
46
Interventions, Practices and Contextual Factors Linked to Indonesian Students’ Literacy and Numeracy Outcomes:
Figure 4.11. Teachers’ perceptions of support from their principals
Turning to teachers’ mindsets, only about 9 per cent of teachers in schools in both groups strongly believed that people can learn and improve their intelligence and skills. This implies that for the most part, a growth mindset is still lacking among teachers. The balance test results on teachers’ mindsets is presented in Table 4.6 in Appendix A. As presented in Figure 4.12, in general, there is no difference between the groups on whether they regard intelligence as fixed or malleable.
Figure 4.12 Teachers’ mindsets on intelligence and skills
0.200
0.150
0.100
0.050
0.000
-0.050
-0.100
-0.150
-0.200
GB C
Average Male Female-0.007
0.0000.029
-0.119
-0.055
0.130
0.150
0.100
0.050
0.000
-0.050
-0.100
-0.150
-0.200
GB C
Average Male Female
0.061
0.000
0.069
0.031
-0.004 -0.034
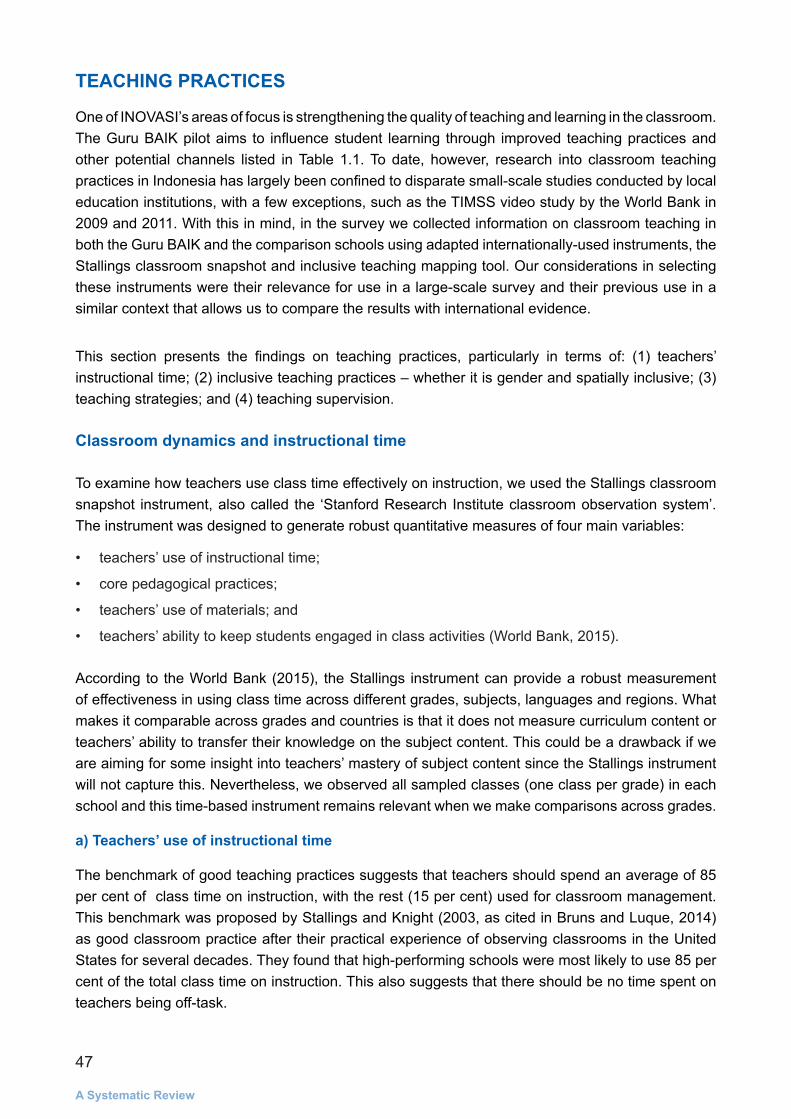
47
A Systematic Review
TEACHING PRACTICES
One of INOVASI’s areas of focus is strengthening the quality of teaching and learning in the classroom. The Guru BAIK pilot aims to influence student learning through improved teaching practices and other potential channels listed in Table 1.1. To date, however, research into classroom teaching practices in Indonesia has largely been confined to disparate small-scale studies conducted by local education institutions, with a few exceptions, such as the TIMSS video study by the World Bank in 2009 and 2011. With this in mind, in the survey we collected information on classroom teaching in both the Guru BAIK and the comparison schools using adapted internationally-used instruments, the Stallings classroom snapshot and inclusive teaching mapping tool. Our considerations in selecting these instruments were their relevance for use in a large-scale survey and their previous use in a similar context that allows us to compare the results with international evidence.
This section presents the findings on teaching practices, particularly in terms of: (1) teachers’ instructional time; (2) inclusive teaching practices – whether it is gender and spatially inclusive; (3) teaching strategies; and (4) teaching supervision.
Classroom dynamics and instructional time
To examine how teachers use class time effectively on instruction, we used the Stallings classroom snapshot instrument, also called the ‘Stanford Research Institute classroom observation system’. The instrument was designed to generate robust quantitative measures of four main variables:
• teachers’ use of instructional time;
• core pedagogical practices;
• teachers’ use of materials; and
• teachers’ ability to keep students engaged in class activities (World Bank, 2015).
According to the World Bank (2015), the Stallings instrument can provide a robust measurement of effectiveness in using class time across different grades, subjects, languages and regions. What makes it comparable across grades and countries is that it does not measure curriculum content or teachers’ ability to transfer their knowledge on the subject content. This could be a drawback if we are aiming for some insight into teachers’ mastery of subject content since the Stallings instrument will not capture this. Nevertheless, we observed all sampled classes (one class per grade) in each school and this time-based instrument remains relevant when we make comparisons across grades.
a) Teachers’ use of instructional time
The benchmark of good teaching practices suggests that teachers should spend an average of 85 per cent of class time on instruction, with the rest (15 per cent) used for classroom management. This benchmark was proposed by Stallings and Knight (2003, as cited in Bruns and Luque, 2014) as good classroom practice after their practical experience of observing classrooms in the United States for several decades. They found that high-performing schools were most likely to use 85 per cent of the total class time on instruction. This also suggests that there should be no time spent on teachers being off-task.
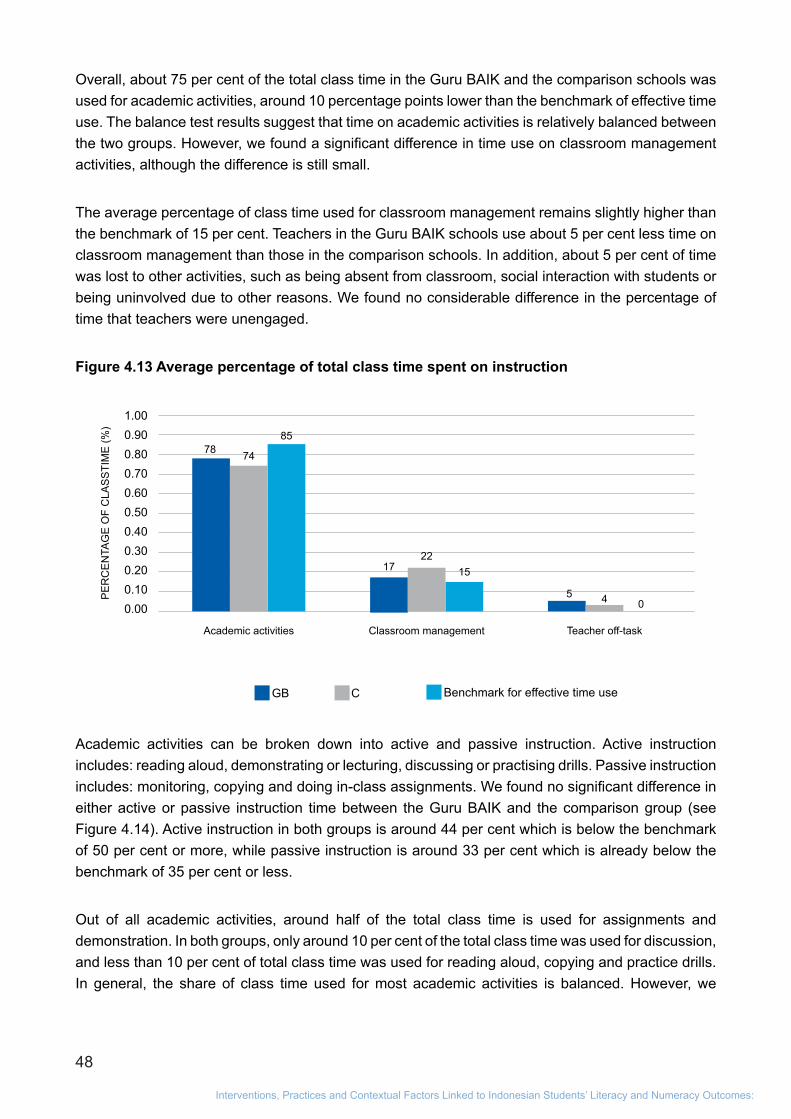
48
Interventions, Practices and Contextual Factors Linked to Indonesian Students’ Literacy and Numeracy Outcomes:
Overall, about 75 per cent of the total class time in the Guru BAIK and the comparison schools was used for academic activities, around 10 percentage points lower than the benchmark of effective time use. The balance test results suggest that time on academic activities is relatively balanced between the two groups. However, we found a significant difference in time use on classroom management activities, although the difference is still small.
The average percentage of class time used for classroom management remains slightly higher than the benchmark of 15 per cent. Teachers in the Guru BAIK schools use about 5 per cent less time on classroom management than those in the comparison schools. In addition, about 5 per cent of time was lost to other activities, such as being absent from classroom, social interaction with students or being uninvolved due to other reasons. We found no considerable difference in the percentage of time that teachers were unengaged.
Figure 4.13 Average percentage of total class time spent on instruction
Academic activities can be broken down into active and passive instruction. Active instruction includes: reading aloud, demonstrating or lecturing, discussing or practising drills. Passive instruction includes: monitoring, copying and doing in-class assignments. We found no significant difference in either active or passive instruction time between the Guru BAIK and the comparison group (see Figure 4.14). Active instruction in both groups is around 44 per cent which is below the benchmark of 50 per cent or more, while passive instruction is around 33 per cent which is already below the benchmark of 35 per cent or less.
Out of all academic activities, around half of the total class time is used for assignments and demonstration. In both groups, only around 10 per cent of the total class time was used for discussion, and less than 10 per cent of total class time was used for reading aloud, copying and practice drills. In general, the share of class time used for most academic activities is balanced. However, we
GB Benchmark for effective time useC
1.000.900.800.700.600.500.400.300.200.100.00
PE
RC
EN
TAG
E O
F C
LAS
STI
ME
(%)
Academic activities Classroom management Teacher off-task
78
17
5
74
22
4
85
15
0
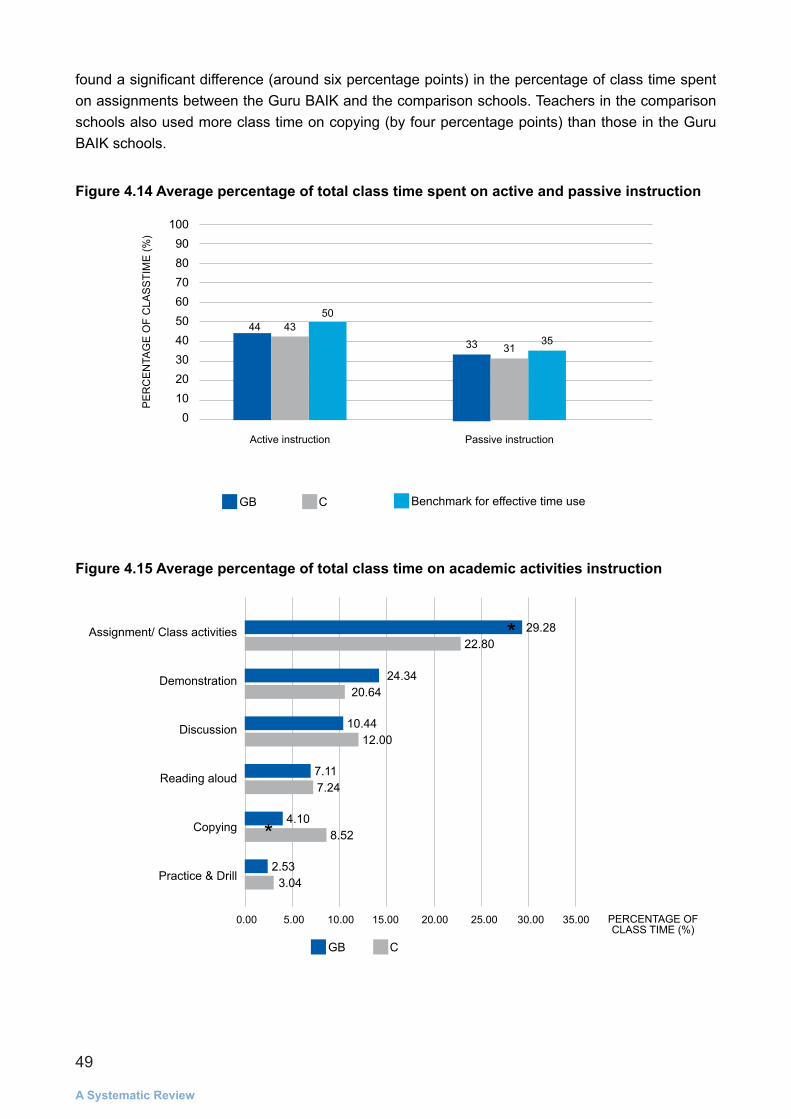
49
A Systematic Review
found a significant difference (around six percentage points) in the percentage of class time spent on assignments between the Guru BAIK and the comparison schools. Teachers in the comparison schools also used more class time on copying (by four percentage points) than those in the Guru BAIK schools.
Figure 4.14 Average percentage of total class time spent on active and passive instruction
Figure 4.15 Average percentage of total class time on academic activities instruction
GB Benchmark for effective time useC
100908070605040302010
0
PE
RC
EN
TAG
E O
F C
LAS
STI
ME
(%)
Active instruction Passive instruction
4433
43
31
50
35
Assignment/ Class activities
Demonstration
Discussion
Reading aloud
Copying
Practice & Drill
GB C
0.00 20.0010.00 30.005.00 25.0015.00 35.00
29.28
24.34
10.44
7.11
4.10
2.53
22.80
20.64
12.00
7.24
8.52
3.04
PERCENTAGE OF CLASS TIME (%)
*
*
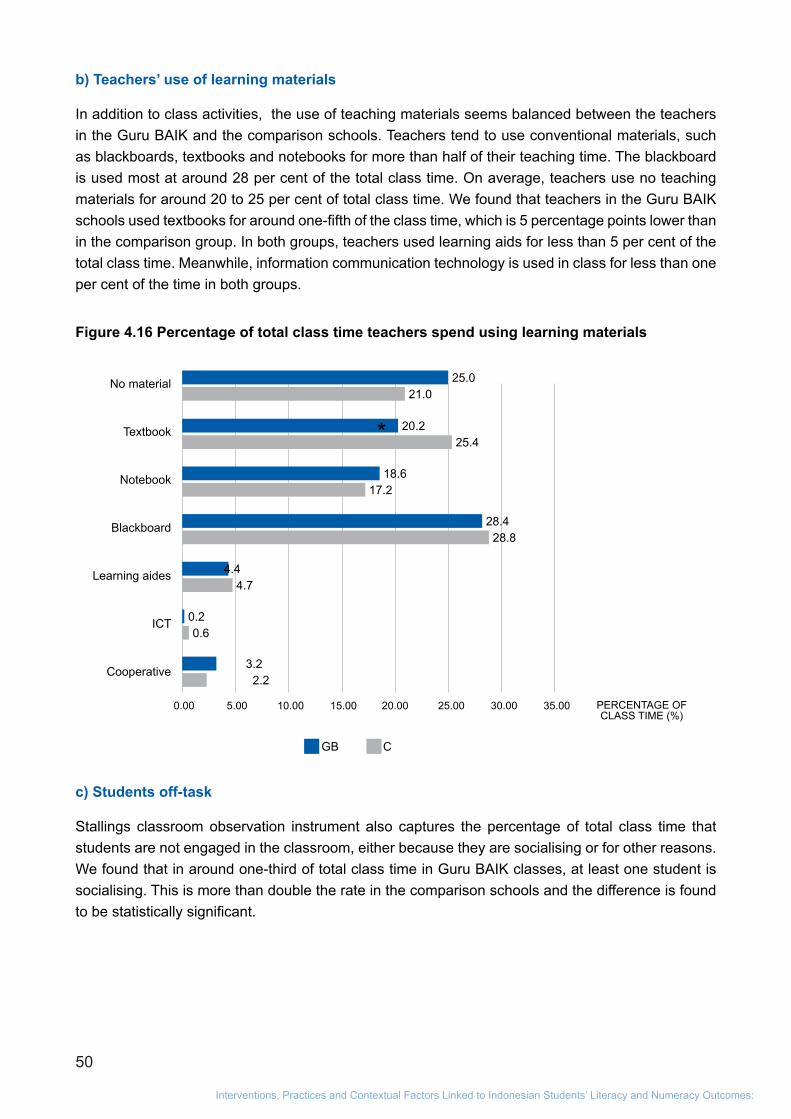
50
Interventions, Practices and Contextual Factors Linked to Indonesian Students’ Literacy and Numeracy Outcomes:
b) Teachers’ use of learning materials
In addition to class activities, the use of teaching materials seems balanced between the teachers in the Guru BAIK and the comparison schools. Teachers tend to use conventional materials, such as blackboards, textbooks and notebooks for more than half of their teaching time. The blackboard is used most at around 28 per cent of the total class time. On average, teachers use no teaching materials for around 20 to 25 per cent of total class time. We found that teachers in the Guru BAIK schools used textbooks for around one-fifth of the class time, which is 5 percentage points lower than in the comparison group. In both groups, teachers used learning aids for less than 5 per cent of the total class time. Meanwhile, information communication technology is used in class for less than one per cent of the time in both groups.
Figure 4.16 Percentage of total class time teachers spend using learning materials
c) Students off-task
Stallings classroom observation instrument also captures the percentage of total class time that students are not engaged in the classroom, either because they are socialising or for other reasons. We found that in around one-third of total class time in Guru BAIK classes, at least one student is socialising. This is more than double the rate in the comparison schools and the difference is found to be statistically significant.
No material
Textbook
Notebook
Blackboard
Learning aides
ICT
Cooperative
GB C
0.00 20.0010.00 30.005.00 25.0015.00 35.00 PERCENTAGE OF CLASS TIME (%)
25.0
20.2
18.6
28.4
4.4
0.2
3.2
21.0
25.4
17.2
28.8
4.7
0.6
2.2
*
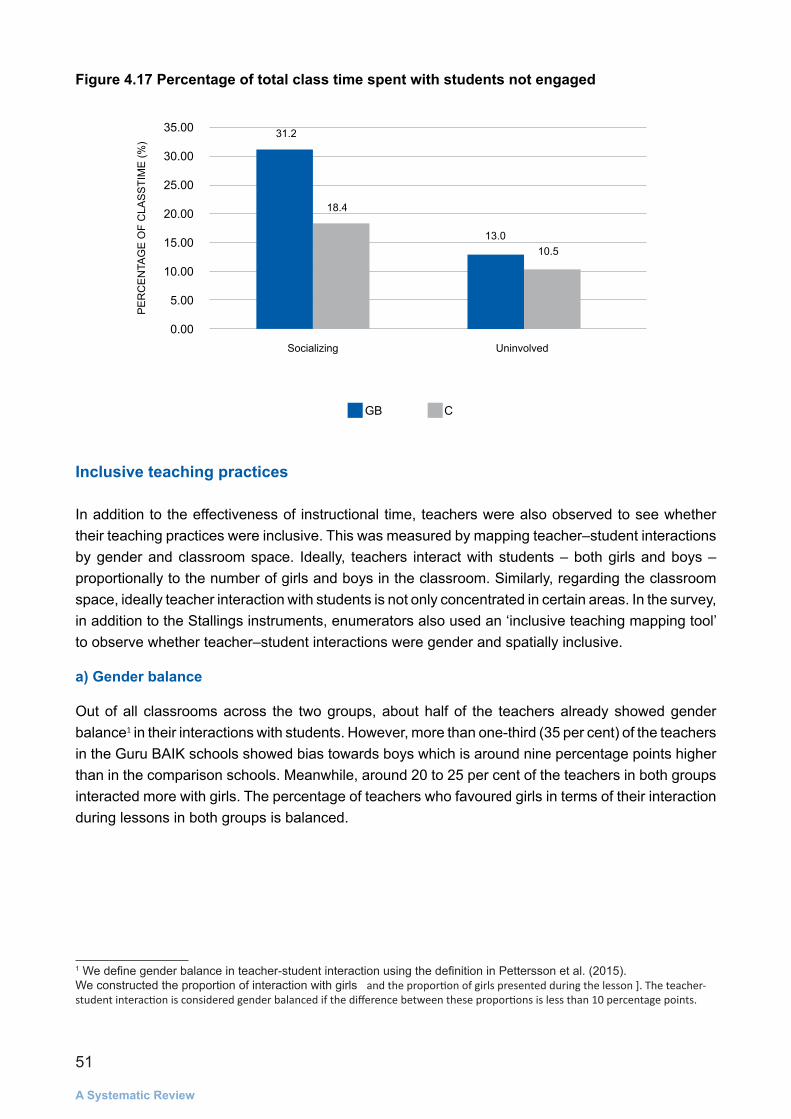
51
A Systematic Review
Figure 4.17 Percentage of total class time spent with students not engaged
Inclusive teaching practices
In addition to the effectiveness of instructional time, teachers were also observed to see whether their teaching practices were inclusive. This was measured by mapping teacher–student interactions by gender and classroom space. Ideally, teachers interact with students – both girls and boys – proportionally to the number of girls and boys in the classroom. Similarly, regarding the classroom space, ideally teacher interaction with students is not only concentrated in certain areas. In the survey, in addition to the Stallings instruments, enumerators also used an ‘inclusive teaching mapping tool’ to observe whether teacher–student interactions were gender and spatially inclusive.
a) Gender balance
Out of all classrooms across the two groups, about half of the teachers already showed gender balance1 in their interactions with students. However, more than one-third (35 per cent) of the teachers in the Guru BAIK schools showed bias towards boys which is around nine percentage points higher than in the comparison schools. Meanwhile, around 20 to 25 per cent of the teachers in both groups interacted more with girls. The percentage of teachers who favoured girls in terms of their interaction during lessons in both groups is balanced.
1 We define gender balance in teacher-student interaction using the definition in Pettersson et al. (2015). We constructed the proportion of interaction with girls and the proportion of girls presented during the lesson ]. The teacher-student interaction is considered gender balanced if the difference between these proportions is less than 10 percentage points.
GB C
35.00
30.00
25.00
20.00
15.00
10.00
5.00
0.00
PE
RC
EN
TAG
E O
F C
LAS
STI
ME
(%)
Socializing Uninvolved
31.2
13.0
18.4
10.5
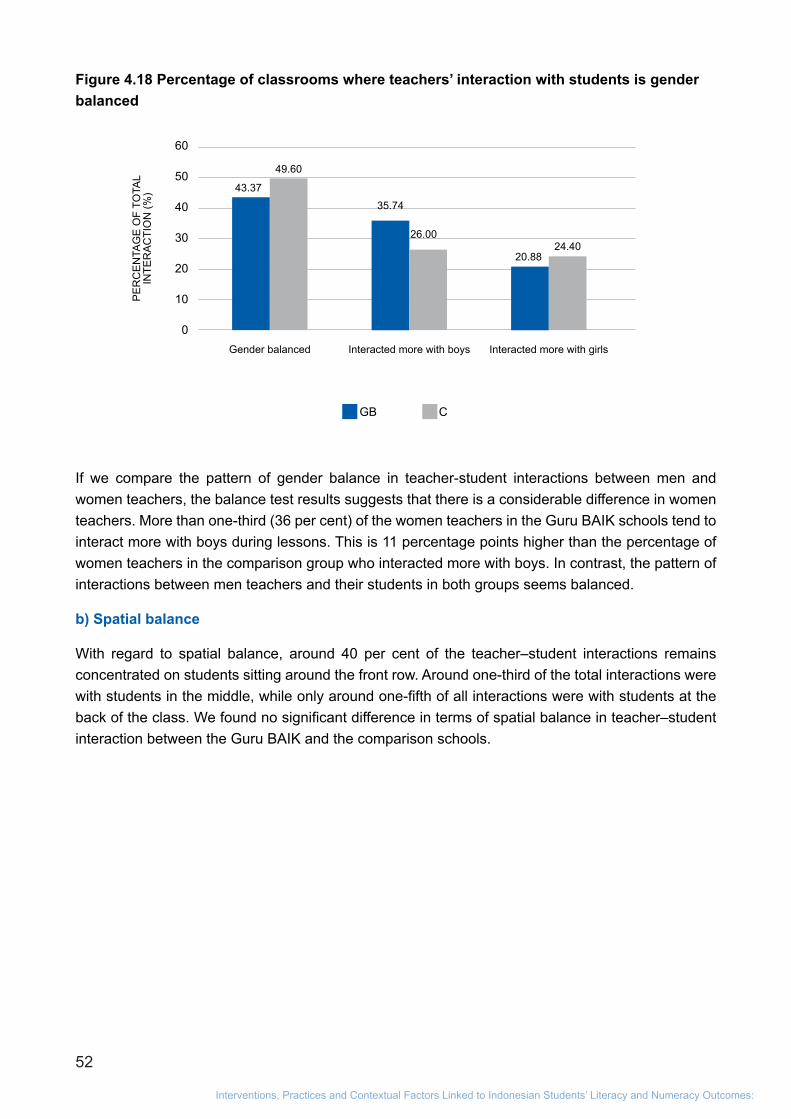
52
Interventions, Practices and Contextual Factors Linked to Indonesian Students’ Literacy and Numeracy Outcomes:
Figure 4.18 Percentage of classrooms where teachers’ interaction with students is gender balanced
If we compare the pattern of gender balance in teacher-student interactions between men and women teachers, the balance test results suggests that there is a considerable difference in women teachers. More than one-third (36 per cent) of the women teachers in the Guru BAIK schools tend to interact more with boys during lessons. This is 11 percentage points higher than the percentage of women teachers in the comparison group who interacted more with boys. In contrast, the pattern of interactions between men teachers and their students in both groups seems balanced.
b) Spatial balance
With regard to spatial balance, around 40 per cent of the teacher–student interactions remains concentrated on students sitting around the front row. Around one-third of the total interactions were with students in the middle, while only around one-fifth of all interactions were with students at the back of the class. We found no significant difference in terms of spatial balance in teacher–student interaction between the Guru BAIK and the comparison schools.
GB C
60
50
40
30
20
10
0
PE
RC
EN
TAG
E O
F TO
TAL
INTE
RA
CTI
ON
(%)
Gender balanced Interacted more with boys Interacted more with girls
43.37
35.74
20.88
49.60
26.0024.40
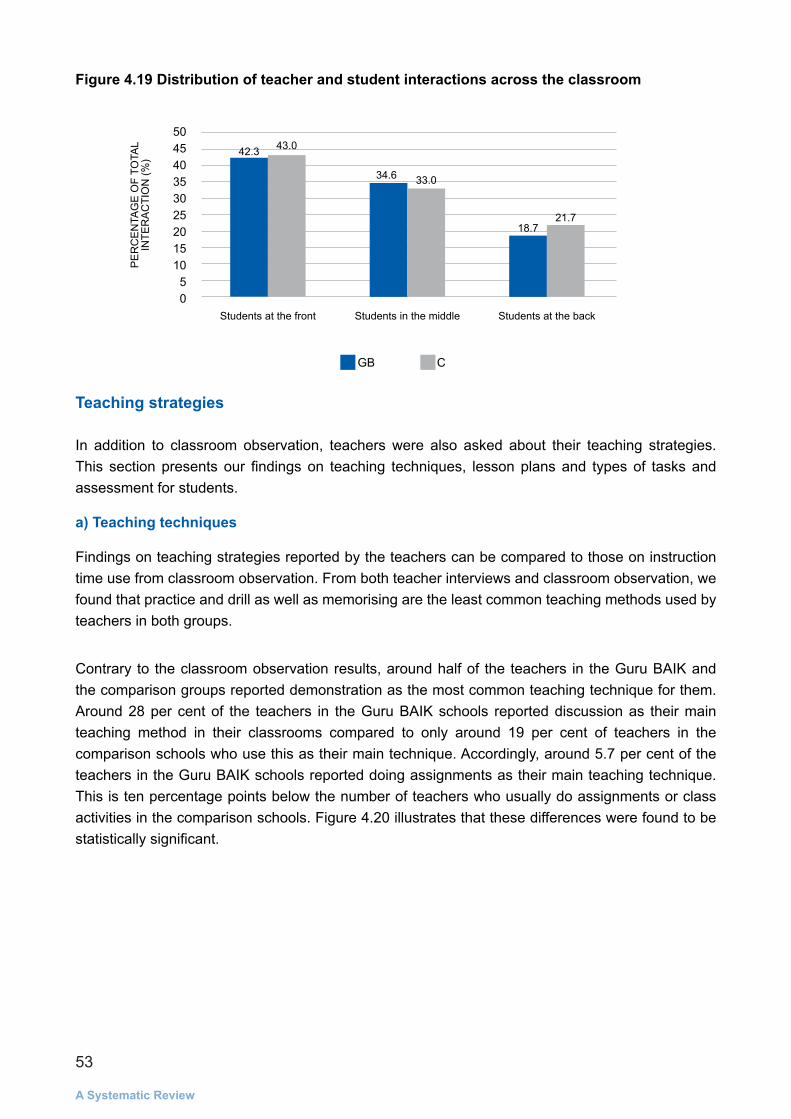
53
A Systematic Review
Figure 4.19 Distribution of teacher and student interactions across the classroom
Teaching strategies
In addition to classroom observation, teachers were also asked about their teaching strategies. This section presents our findings on teaching techniques, lesson plans and types of tasks and assessment for students.
a) Teaching techniques
Findings on teaching strategies reported by the teachers can be compared to those on instruction time use from classroom observation. From both teacher interviews and classroom observation, we found that practice and drill as well as memorising are the least common teaching methods used by teachers in both groups.
Contrary to the classroom observation results, around half of the teachers in the Guru BAIK and the comparison groups reported demonstration as the most common teaching technique for them. Around 28 per cent of the teachers in the Guru BAIK schools reported discussion as their main teaching method in their classrooms compared to only around 19 per cent of teachers in the comparison schools who use this as their main technique. Accordingly, around 5.7 per cent of the teachers in the Guru BAIK schools reported doing assignments as their main teaching technique. This is ten percentage points below the number of teachers who usually do assignments or class activities in the comparison schools. Figure 4.20 illustrates that these differences were found to be statistically significant.
GB C
504540353025201510
50
PE
RC
EN
TAG
E O
F TO
TAL
INTE
RA
CTI
ON
(%)
Students at the front Students in the middle Students at the back
42.3
34.6
18.7
43.0
33.0
21.7
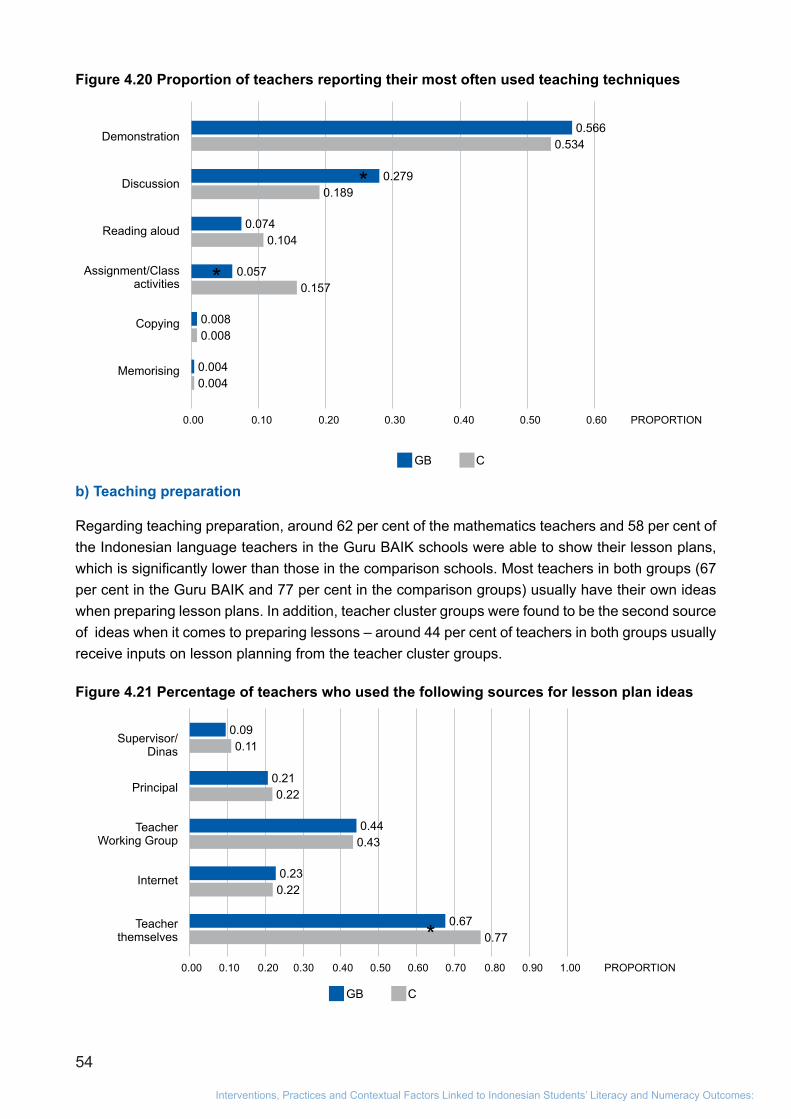
54
Interventions, Practices and Contextual Factors Linked to Indonesian Students’ Literacy and Numeracy Outcomes:
Figure 4.20 Proportion of teachers reporting their most often used teaching techniques
b) Teaching preparation
Regarding teaching preparation, around 62 per cent of the mathematics teachers and 58 per cent of the Indonesian language teachers in the Guru BAIK schools were able to show their lesson plans, which is significantly lower than those in the comparison schools. Most teachers in both groups (67 per cent in the Guru BAIK and 77 per cent in the comparison groups) usually have their own ideas when preparing lesson plans. In addition, teacher cluster groups were found to be the second source of ideas when it comes to preparing lessons – around 44 per cent of teachers in both groups usually receive inputs on lesson planning from the teacher cluster groups.
Figure 4.21 Percentage of teachers who used the following sources for lesson plan ideas
Demonstration
Discussion
Reading aloud
Assignment/Class activities
Copying
Memorising
GB C
0.00 0.400.20 0.600.10 0.500.30
0.566
0.279
0.074
0.057
0.008
0.004
0.534
0.189
0.104
0.157
0.008
0.004
PROPORTION
*
*
Supervisor/ Dinas
Principal
Teacher Working Group
Internet
Teacher themselves
GB C
0.09
0.21
0.44
0.23
0.67*
0.11
0.22
0.43
0.22
0.77
0.00 0.40 0.800.20 0.60 1.000.10 0.50 0.900.30 0.70 PROPORTION
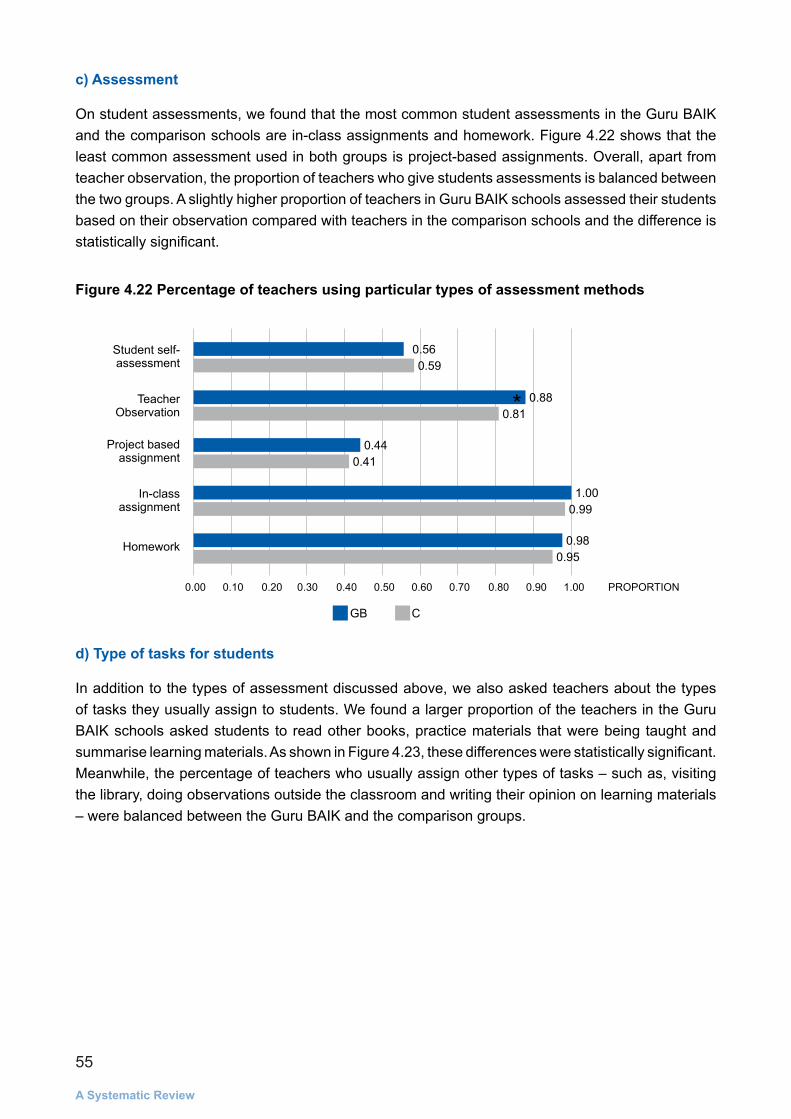
55
A Systematic Review
c) Assessment
On student assessments, we found that the most common student assessments in the Guru BAIK and the comparison schools are in-class assignments and homework. Figure 4.22 shows that the least common assessment used in both groups is project-based assignments. Overall, apart from teacher observation, the proportion of teachers who give students assessments is balanced between the two groups. A slightly higher proportion of teachers in Guru BAIK schools assessed their students based on their observation compared with teachers in the comparison schools and the difference is statistically significant.
Figure 4.22 Percentage of teachers using particular types of assessment methods
d) Type of tasks for students
In addition to the types of assessment discussed above, we also asked teachers about the types of tasks they usually assign to students. We found a larger proportion of the teachers in the Guru BAIK schools asked students to read other books, practice materials that were being taught and summarise learning materials. As shown in Figure 4.23, these differences were statistically significant. Meanwhile, the percentage of teachers who usually assign other types of tasks – such as, visiting the library, doing observations outside the classroom and writing their opinion on learning materials – were balanced between the Guru BAIK and the comparison groups.
Student self-assessment
Teacher Observation
Project based assignment
In-class assignment
Homework
GB C
0.56
0.88
0.44
1.00
0.98
*
0.59
0.81
0.41
0.99
0.95
0.00 0.40 0.800.20 0.60 1.000.10 0.50 0.900.30 0.70 PROPORTION

56
Interventions, Practices and Contextual Factors Linked to Indonesian Students’ Literacy and Numeracy Outcomes:
Figure 4.23 Percentage of teachers assigning students various types of tasks
Teaching supervision
Another Guru BAIK impact indicator is teachers’ opinions on how principals, supervisors and school committees supervise their teaching. We asked teachers whether they had been supervised over the last semester, how often the supervision had happened and whether they had received feedback on their teaching practices.
We found that nearly 90 per cent of the teachers in both groups had been supervised by their principals at least once in the last semester. Around 80 per cent also reported supervision by the school supervisors. Meanwhile, less than one-fifth of teachers reported being supervised by school committees (see Figure 4.24). The data shows that principals are the main supervisors (see Figure 4.25). In general, we found no statistically significant differences in teaching supervision between the Guru BAIK and the comparison schools.
Figure 4.24 Proportion of teachers who reported being supervised by principals, supervisors and school committees over the last semester
Visit library
Summarise material
Observation outside
Write opinion re material
Practice material taught
Read other books
GB C
0.62
0.64
0.39
0.67
0.82
0.70
*
**
0.55
0.55
0.41
0.62
0.71
0.59
0.00 0.40 0.800.20 0.60 1.000.10 0.50 0.900.30 0.70 PROPORTION
GB C
1.00.90.80.70.60.50.40.30.20.10.0
Principal Supervisor School Committee
0.890.84
0.18
0.880.80
0.14
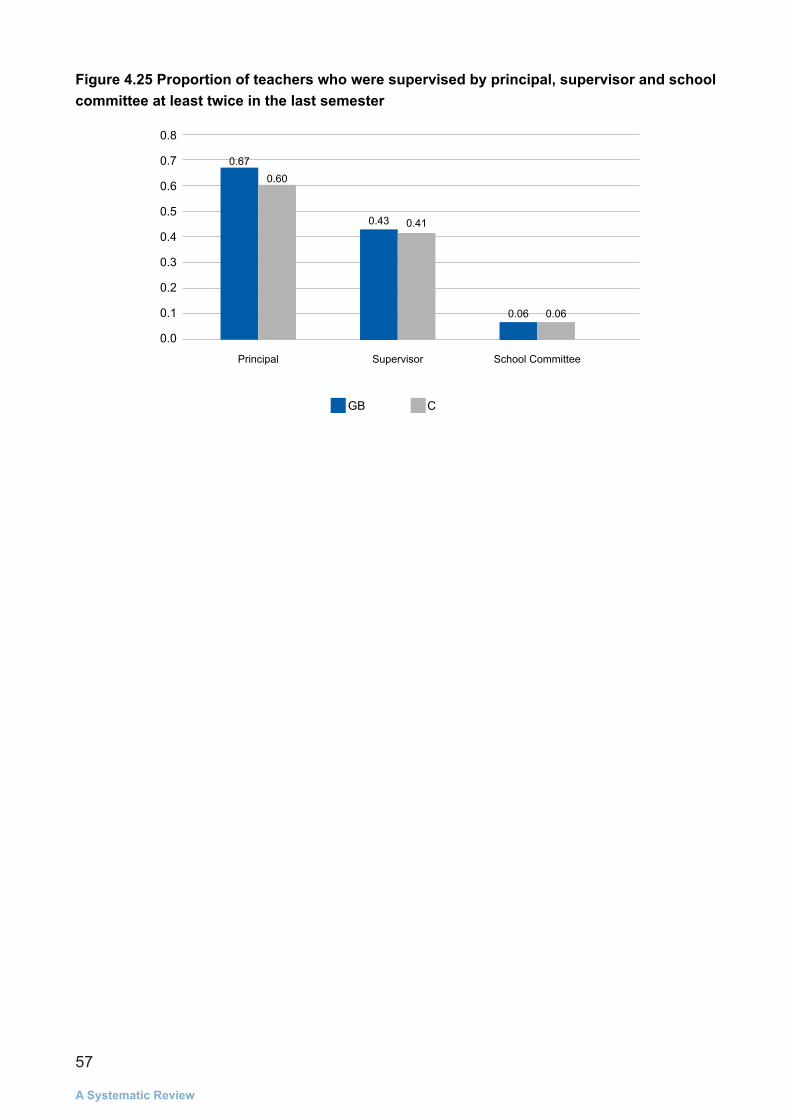
57
A Systematic Review
Figure 4.25 Proportion of teachers who were supervised by principal, supervisor and school committee at least twice in the last semester
GB C
0.8
0.7
0.6
0.5
0.4
0.3
0.2
0.1
0.0
Principal Supervisor School Committee
0.67
0.43
0.06
0.60
0.41
0.06

58
Interventions, Practices and Contextual Factors Linked to Indonesian Students’ Literacy and Numeracy Outcomes:
Chapter 5SchoolsTo complete the picture on the school-level context for student learning, we also surveyed school principals and supervisors, and completed a school observation instrument. This section provides a descriptive analysis and balance test results of the conditions in the schools as well as the perceptions of the principals and supervisors.
SCHOOL CONDITIONS
The school characteristics that we compare between the two school groups include: the total number of students enrolled; the proportion of schools that use the 2006 or school-based (Kurikulum Tingkat Satuan Pendidikan – KTSP) curriculum; and class size. Principals were asked whether their schools were using one of the following curriculums: 2013, 2006, a mixture of 2013 and 2006 or 2004. As shown in Figure 5.1, around 80 per cent of the schools are using the 2006 curriculum. Overall, the mean comparisons on school characteristics are balanced between the Guru BAIK and the comparison groups (see Table 5.1 in Appendix A).
Figure 5.1 Proportion of schools using the different curriculums
We categorised facilities into classroom and school facilities. Regarding classroom facilities, we compared the number of available chairs, the seating arrangement and other types of facilities in sampled classes between the Guru BAIK and the comparison schools. Most classrooms adopted a row seating arrangement with less than 2 per cent of all schools using clusters or u-shaped seating arrangements. We found that the number of chairs available and the types of seating arrangements are balanced between the Guru BAIK and the comparison group (see Table 5.2 in Appendix A).
In terms of other classroom facilities, we compared the chairs available proportionate to the class size, as well as the availability of blackboards, students’ artwork, maps, posters or graphs, lamps
1.000.900.800.700.600.500.400.300.200.100.00
0.02
0.74
0.22
0.02 0.000.06
0.82
0.12
GB C
2013 Curriculum 2006 Curriculum (KTSP) Mixed between 2013 and 2006 2004 Curriculum
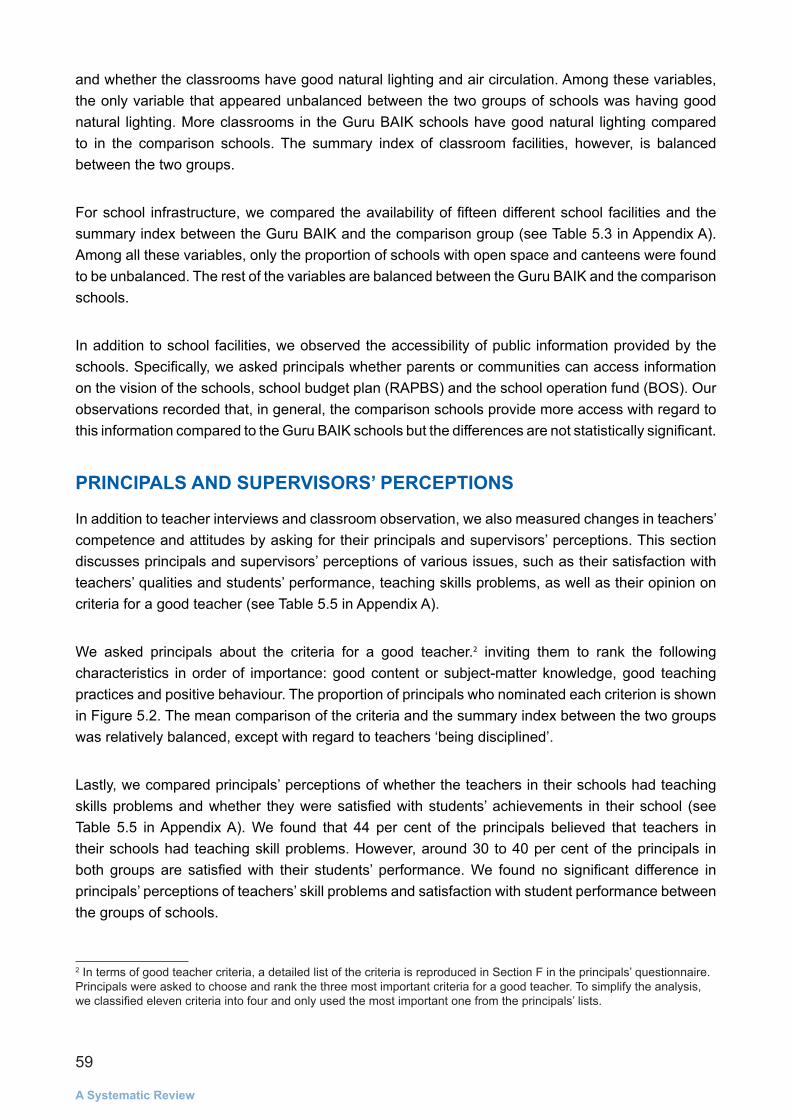
59
A Systematic Review
and whether the classrooms have good natural lighting and air circulation. Among these variables, the only variable that appeared unbalanced between the two groups of schools was having good natural lighting. More classrooms in the Guru BAIK schools have good natural lighting compared to in the comparison schools. The summary index of classroom facilities, however, is balanced between the two groups.
For school infrastructure, we compared the availability of fifteen different school facilities and the summary index between the Guru BAIK and the comparison group (see Table 5.3 in Appendix A). Among all these variables, only the proportion of schools with open space and canteens were found to be unbalanced. The rest of the variables are balanced between the Guru BAIK and the comparison schools.
In addition to school facilities, we observed the accessibility of public information provided by the schools. Specifically, we asked principals whether parents or communities can access information on the vision of the schools, school budget plan (RAPBS) and the school operation fund (BOS). Our observations recorded that, in general, the comparison schools provide more access with regard to this information compared to the Guru BAIK schools but the differences are not statistically significant.
PRINCIPALS AND SUPERVISORS’ PERCEPTIONS
In addition to teacher interviews and classroom observation, we also measured changes in teachers’ competence and attitudes by asking for their principals and supervisors’ perceptions. This section discusses principals and supervisors’ perceptions of various issues, such as their satisfaction with teachers’ qualities and students’ performance, teaching skills problems, as well as their opinion on criteria for a good teacher (see Table 5.5 in Appendix A).
We asked principals about the criteria for a good teacher.2 inviting them to rank the following characteristics in order of importance: good content or subject-matter knowledge, good teaching practices and positive behaviour. The proportion of principals who nominated each criterion is shown in Figure 5.2. The mean comparison of the criteria and the summary index between the two groups was relatively balanced, except with regard to teachers ‘being disciplined’.
Lastly, we compared principals’ perceptions of whether the teachers in their schools had teaching skills problems and whether they were satisfied with students’ achievements in their school (see Table 5.5 in Appendix A). We found that 44 per cent of the principals believed that teachers in their schools had teaching skill problems. However, around 30 to 40 per cent of the principals in both groups are satisfied with their students’ performance. We found no significant difference in principals’ perceptions of teachers’ skill problems and satisfaction with student performance between the groups of schools.
2 In terms of good teacher criteria, a detailed list of the criteria is reproduced in Section F in the principals’ questionnaire. Principals were asked to choose and rank the three most important criteria for a good teacher. To simplify the analysis, we classified eleven criteria into four and only used the most important one from the principals’ lists.
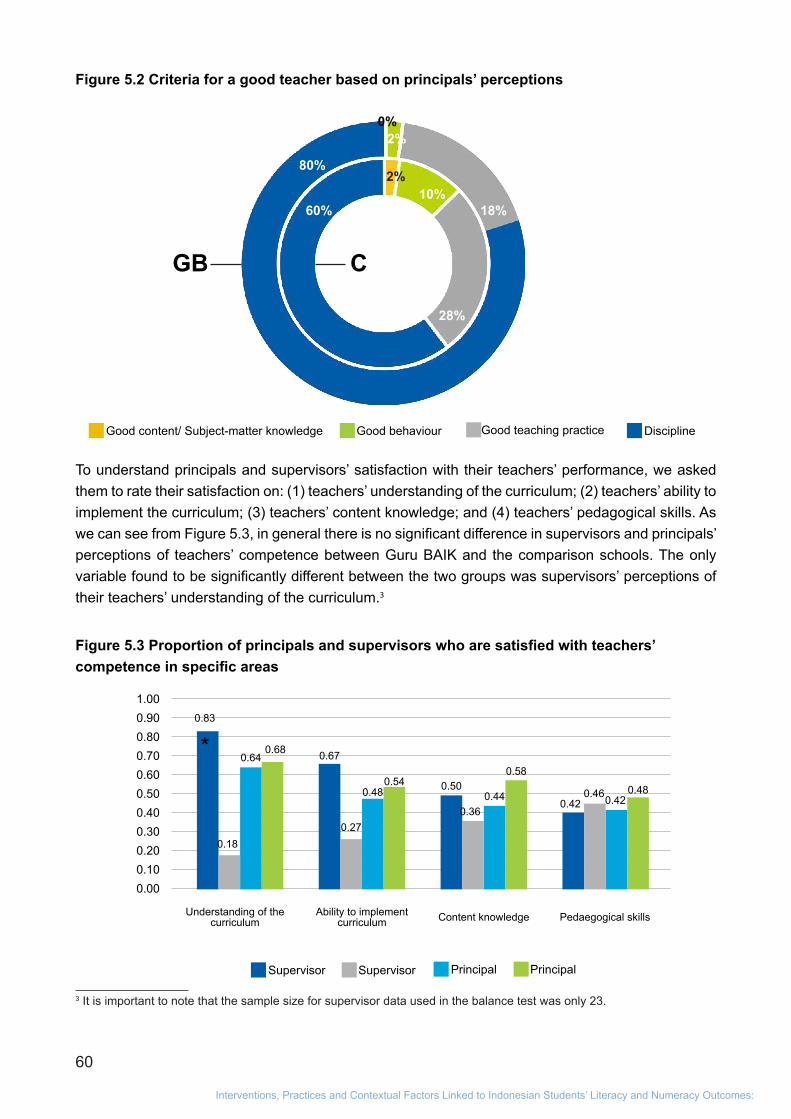
60
Interventions, Practices and Contextual Factors Linked to Indonesian Students’ Literacy and Numeracy Outcomes:
Figure 5.2 Criteria for a good teacher based on principals’ perceptions
To understand principals and supervisors’ satisfaction with their teachers’ performance, we asked them to rate their satisfaction on: (1) teachers’ understanding of the curriculum; (2) teachers’ ability to implement the curriculum; (3) teachers’ content knowledge; and (4) teachers’ pedagogical skills. As we can see from Figure 5.3, in general there is no significant difference in supervisors and principals’ perceptions of teachers’ competence between Guru BAIK and the comparison schools. The only variable found to be significantly different between the two groups was supervisors’ perceptions of their teachers’ understanding of the curriculum.3
Figure 5.3 Proportion of principals and supervisors who are satisfied with teachers’ competence in specific areas
3 It is important to note that the sample size for supervisor data used in the balance test was only 23.
Understanding of the curriculum
Ability to implement curriculum Content knowledge Pedaegogical skills
Supervisor PrincipalSupervisor Principal
1.000.900.800.700.600.500.400.300.200.100.00
0.83
* 0.67
0.50
0.42
0.180.27
0.36
0.46
0.64
0.48 0.44 0.42
0.68
0.540.58
0.48
Good content/ Subject-matter knowledge DisciplineGood teaching practiceGood behaviour
10%
CGB
60%
28%
18%
80%
2%
2%
0%

61
A Systematic Review
In the survey, supervisors were asked about their approach to solving problems at school. The most common approach supervisors in the Guru BAIK schools (50 per cent) use to tackle problems is by having discussions with external stakeholders, such as parents, teachers’ working groups or the community. In contrast, no supervisors in the comparison schools took this approach. Figure 5.4 also illustrates that the supervisors in the comparison schools preferred providing guidance and support in solving problems at their schools. Another interesting finding is that no supervisors in the Guru BAIK schools used a personal approach to tackle problems while 27 per cent of supervisors in the comparison schools used this approach.
Figure 5.4 Proportion of supervisors using the different approaches to solving problems at school
With regard to education quality, we found that only around 17 per cent of the supervisors in both groups of schools perceived students’ learning outcomes as the main problem in their schools (see Table 5.7 in Appendix A). To improve learning outcomes, many supervisors in the Guru BAIK schools (37 per cent) thought that reflective discussion on learning was a strategy that could help school stakeholders. On the other hand, training for teachers and principals was the most common approach reported by the supervisors in the comparison schools (55 per cent).
60
50
40
30
20
10
0
25
0
25
50
0
1827
55
GB C
PE
RC
EN
TAG
E
Internal discussion Personal approach Guidance and support
Discussion with external stakeholder
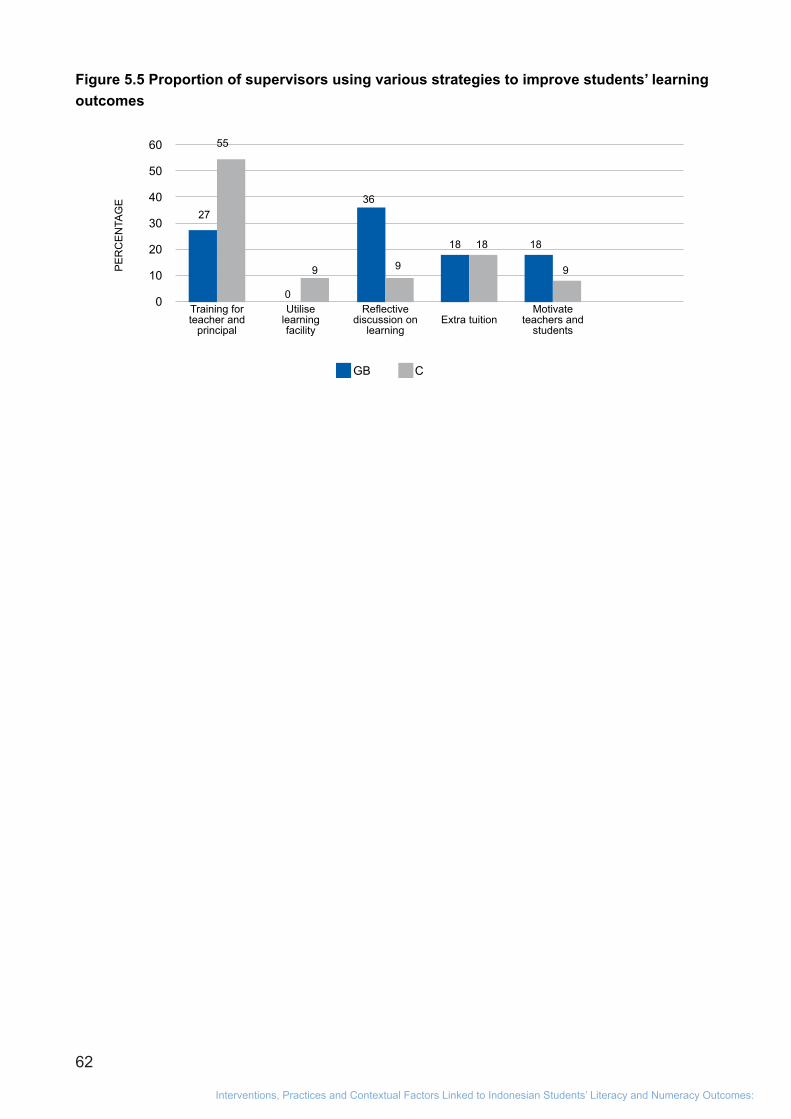
62
Interventions, Practices and Contextual Factors Linked to Indonesian Students’ Literacy and Numeracy Outcomes:
Figure 5.5 Proportion of supervisors using various strategies to improve students’ learning outcomes
60
50
40
30
20
10
0
2736
0
18 18
9
55
99
18
GB C
PE
RC
EN
TAG
E
Training for teacher and
principal
Reflective discussion on
learning
Utilise learning facility
Extra tuitionMotivate
teachers and students
63
A Systematic Review
Chapter 6ConclusionThe main purpose of this report is to present the balance tests between the Guru BAIK and comparison schools. Overall, we conducted balance tests on 305 variables. Out of these variables, 78 per cent are balanced at baseline. We found that the highest imbalance pertains to teachers (Chapter 4) and the lowest pertains to school level information (Chapter 5). These proportions are lower than the 95 per cent benchmark.
On one hand, the lower proportion of balanced variables could be due to the fact that schools were not randomised into Guru BAIK and comparison groups. A fully randomised assignment was not possible because we wanted to involve the local governments. This is a lesson that needs to be considered in future pilots.
On the other hand, our preferred estimation method takes into account these baseline differences. By implementing double-difference, our identification assumption is common trends. Given the relatively short time frame between the baseline survey and the planned endline survey, the common trend assumption could be more defensible. In addition, we could implement a second method, matched double-difference, in order to check for the robustness of the preferred estimation method.
In addition to serving as baseline data, the survey also collected rich individual-level and school-level information. This survey is perhaps the richest that has been done in Indonesia in recent times. Therefore, much research could emerge from these data. Follow-up presentations and consultations with stakeholders would be very useful in order to select the types of research that would be relevant to these stakeholders.
64
Interventions, Practices and Contextual Factors Linked to Indonesian Students’ Literacy and Numeracy Outcomes:
ReferencesBALITBANG-KEMDIKBUD. 1977. Mengidentifikasi Siswa Berkesulitan Belajar. Jakarta: Pusat
Pengembangan Kurikulum dan Sarana Pendidikan.
Banerjee A . R Banerji. E Duflo, R Glennerster and S Khemani. 2010. “Pitfalls of participatory programs: evidence from a randomized evaluation in education in India”. American Economic Journal: Economic policy 2(1):1-30.
Bogler R, A Somech. 2004. “Influence of teacher empowerment on teachers’ organizational commitment, professional commitment and organizational citizenship behavior in schools”. Teaching and Teacher Education 20:277–289. doi:10.1016/j.tate.2004.02.003
Borghans L, BHH Golsteyn, JJ Heckman, JE Humphries,et al. 2016. “What grades and achievement tests measure”. Proceedings of the National Academy of Sciences 113(47): 13354–13359. doi:10.1073/pnas.1601135113
Bruns B, J Luque. 2014. Great teachers: How to raise student learning in Latin America and the Caribbean. Washington DC: World Bank.
Cattell RB. 1961. “Fluid and crystallized intelligence”. In Studies in individual differences: The search for intelligence, edited by JJ Jenkins and DG Paterson. East Norwalk, CT, US: Appleton-Century-Crofts. pages 738–746. Retrieved from http://psycnet.apa.org/index.cfm?fa=buy.optionToBuy&uid=2006-10257-064
Coe R, C Aloisi, S Higgins, LE Major. 2014. What makes great teaching? Review of the underpinning research. Durham: Durham University. Retrieved from http://ecothunk.uk/PDF/What-makes-great-teaching-Sutton Trust 2014.pdf
Dweck CS. 1996. “Implicit theories as organizers of goals and behavior”. In The psychology of action: Linking cognition and motivation to behavior, edited by PM Gollwitzer and JA. Bargh. pages 69-90. New York: Guilford Press.
– 2008. Mindsets and math/science achievement. Princeton: Institute for Advanced Study. Retrieved from http://www.growthmindsetmaths.com/uploads/2/3/7/7/23776169/mindset_and_math_science_achievement_-_nov_2013.pdf
Hambleton RK, RW Jones. 1993. “Comparison of classical test theory and item response theory and their applications to test development”. Educational Measurement: Issues and Practice 12(3):38–47.
65
A Systematic Review
Kling JR, JB Liebman, LF Katz. 2007. “Experimental analysis of neighborhood effects”. Econometrica 75(1):83-119.
Hattie J. 2009. Visible learning. Oxon, Oxforshire: Routledge. Retrieved from https://www.readpbn.com/pdf/Visible-Learning-A-Synthesis-of-Over-800-Meta-Analyses-Relating-to-Achievement-Sample.pdf
Konishi C, S Hymel, BD Zumbo and Z Li. 2010. “Do school bullying and student–teacher relationships matter for academic achievement? A multilevel analysis”. Canadian Journal of School Psychology 25(1):19–39. doi: 10.1177/0829573509357550
Pettersson et al. 2015
Pradhan M, D Suryadarma, A Beatty, M Wong, et al. 2014. “Improving educational quality through enhancing community participation: results from a randomized field experiment in Indonesia”. American Economic Journal: Applied Economics 6(2):105-126.
Rarasati et al. 2017
Romero C, A Master, D Paunesku, CS Dweck, JJ Gross. 2014. “Academic and emotional functioning in middle school: the role of implicit theories”. Emotion 14(2):227–236. doi: 10.1037/a0035490
Stallings J, S Knight. 2003. “Using the Stallings observation system to investigate time on task in four countries”. Unpublished paper for the International Time on Task (ITOT) project. Washington DC: World Bank.
Project, World Bank, Washington, DC.Suryadarma D, A Suryahadi, S Sumarto, FH Rogers. 2006.” Improving student performance in public primary schools in developing countries: evidence from Indonesia”. Education Economics, 14(4): 401-429.
van Trotsenburg A, RA Chaves, C Costin, H Patinos, A Ragatz. 2015. Teacher certification and beyond An empirical evaluation of the teacher certification program and education quality improvements in Indonesia. Jakarta:Education Global Practice, World Bank.
World Bank. 2015. Conducting classroom observations using the Stallings “classroom snapshot” observation system: user guide. Washington DC: World Bank Group.
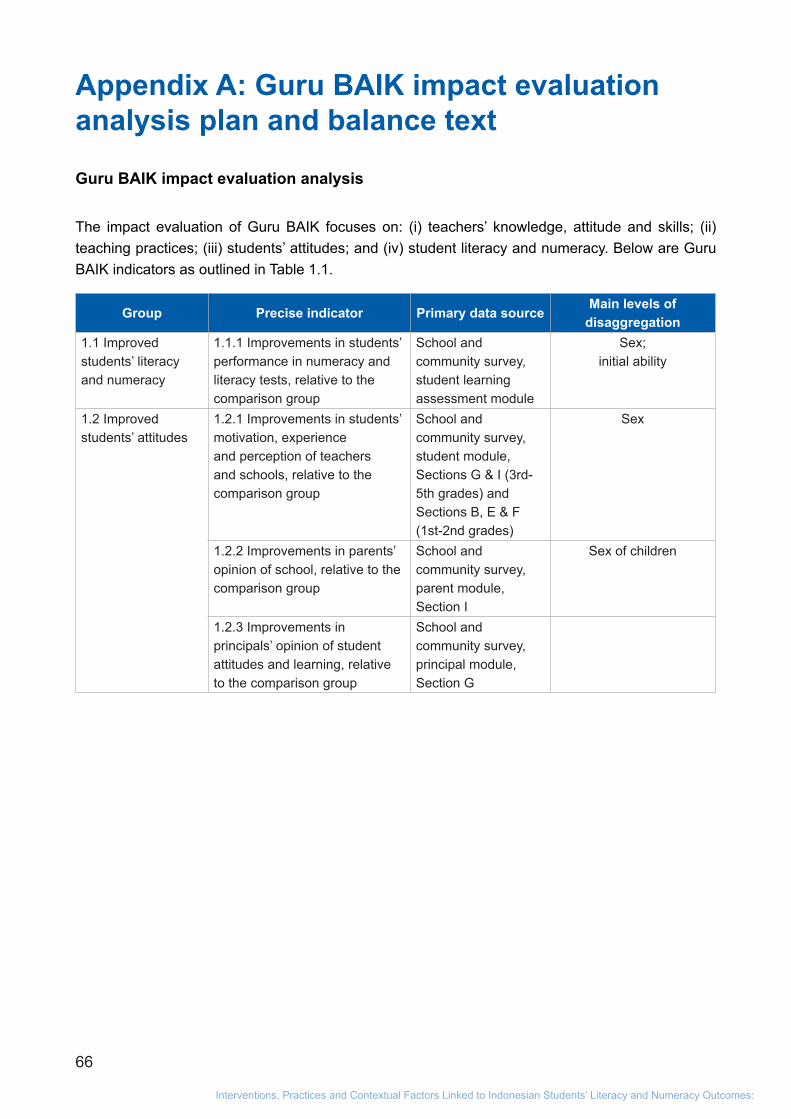
66
Interventions, Practices and Contextual Factors Linked to Indonesian Students’ Literacy and Numeracy Outcomes:
Appendix A: Guru BAIK impact evaluation analysis plan and balance text
Guru BAIK impact evaluation analysis
The impact evaluation of Guru BAIK focuses on: (i) teachers’ knowledge, attitude and skills; (ii) teaching practices; (iii) students’ attitudes; and (iv) student literacy and numeracy. Below are Guru BAIK indicators as outlined in Table 1.1.
Group Precise indicator Primary data source Main levels of
disaggregation 1.1 Improved students’ literacy and numeracy
1.1.1 Improvements in students’ performance in numeracy and literacy tests, relative to the comparison group
School and community survey, student learning assessment module
Sex;initial ability
1.2 Improved students’ attitudes
1.2.1 Improvements in students’ motivation, experience and perception of teachers and schools, relative to the comparison group
School and community survey, student module, Sections G & I (3rd-5th grades) and Sections B, E & F (1st-2nd grades)
Sex
1.2.2 Improvements in parents’ opinion of school, relative to the comparison group
School and community survey, parent module, Section I
Sex of children
1.2.3 Improvements in principals’ opinion of student attitudes and learning, relative to the comparison group
School and community survey, principal module, Section G

67
A Systematic Review
Group Precise indicator Primary data source Main levels of
disaggregation 1.3 Improved teaching practices
1.3.1 Classroom teaching improvements, relative to the comparison group.
School and community survey, classroom observation module
SexTeacher ability
1.3.2 Improvements in principals’ satisfaction with / opinion of teacher practices, relative to the comparison group
School and community survey, principal module, Section F
1.3.2 Improvements in principals’ satisfaction with / opinion of teachers’ classroom management / treatment of students, relative to the comparison group
School and community survey, principal module, Section G
1.3.3 Improvements in teachers’ planning and assessment, relative to the comparison group
School and community survey, teacher module, Section G
Sex
1.3.4 Improvements in teacher opinion on supervision by principal, supervisor, school committee, relative to the comparison group
School and community survey, teacher module, Section H
Sex
1.3.5 Improvements in teachers’ opinion of and participation in teachers’ cluster groups (KKG), relative to the comparison group
School and community survey, teacher module, Section K
Sex
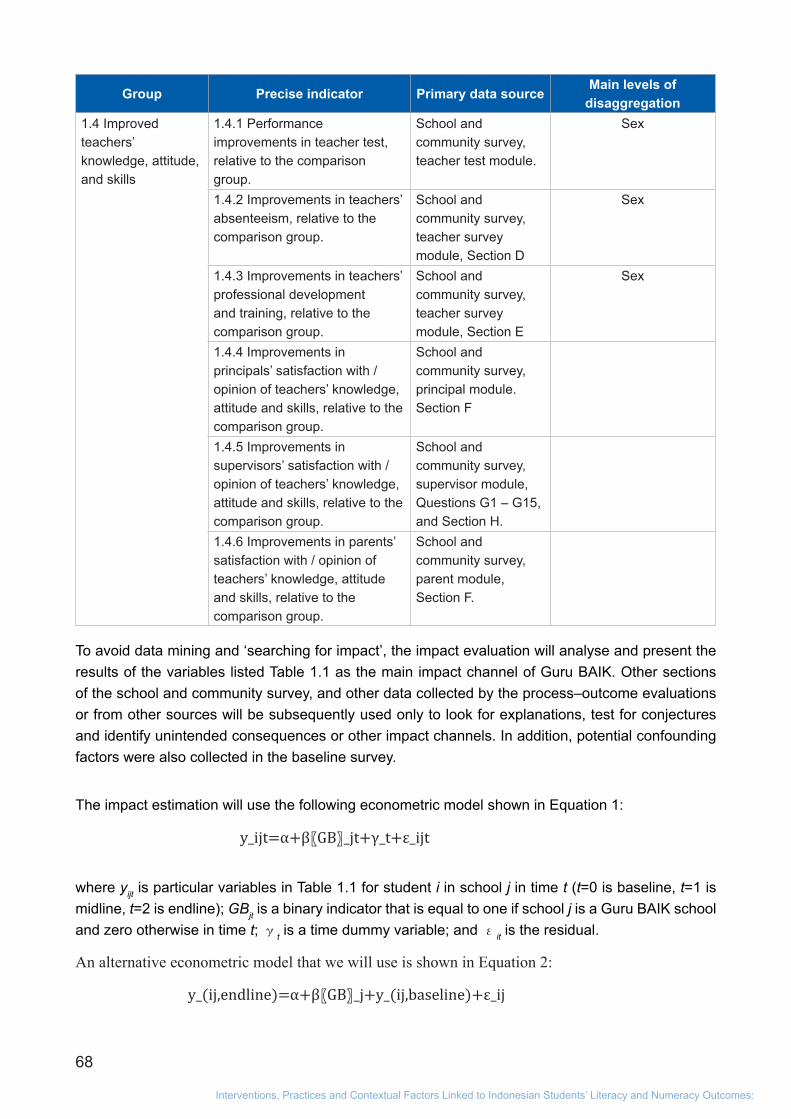
68
Interventions, Practices and Contextual Factors Linked to Indonesian Students’ Literacy and Numeracy Outcomes:
Group Precise indicator Primary data source Main levels of
disaggregation 1.4 Improved teachers’ knowledge, attitude, and skills
1.4.1 Performance improvements in teacher test, relative to the comparison group.
School and community survey, teacher test module.
Sex
1.4.2 Improvements in teachers’ absenteeism, relative to the comparison group.
School and community survey, teacher survey module, Section D
Sex
1.4.3 Improvements in teachers’ professional development and training, relative to the comparison group.
School and community survey, teacher survey module, Section E
Sex
1.4.4 Improvements in principals’ satisfaction with / opinion of teachers’ knowledge, attitude and skills, relative to the comparison group.
School and community survey, principal module. Section F
1.4.5 Improvements in supervisors’ satisfaction with / opinion of teachers’ knowledge, attitude and skills, relative to the comparison group.
School and community survey, supervisor module, Questions G1 – G15, and Section H.
1.4.6 Improvements in parents’ satisfaction with / opinion of teachers’ knowledge, attitude and skills, relative to the comparison group.
School and community survey, parent module, Section F.
To avoid data mining and ‘searching for impact’, the impact evaluation will analyse and present the results of the variables listed Table 1.1 as the main impact channel of Guru BAIK. Other sections of the school and community survey, and other data collected by the process–outcome evaluations or from other sources will be subsequently used only to look for explanations, test for conjectures and identify unintended consequences or other impact channels. In addition, potential confounding factors were also collected in the baseline survey.
The impact estimation will use the following econometric model shown in Equation 1:
where yijt is particular variables in Table 1.1 for student i in school j in time t (t=0 is baseline, t=1 is midline, t=2 is endline); GBjt is a binary indicator that is equal to one if school j is a Guru BAIK school and zero otherwise in time t; γt is a time dummy variable; and εit is the residual.
An alternative econometric model that we will use is shown in Equation 2:
y_ijt=α+β〖GB〗_jt+γ_t+ε_ijt
y_(ij,endline)=α+β〖GB〗_j+y_(ij,baseline)+ε_ij
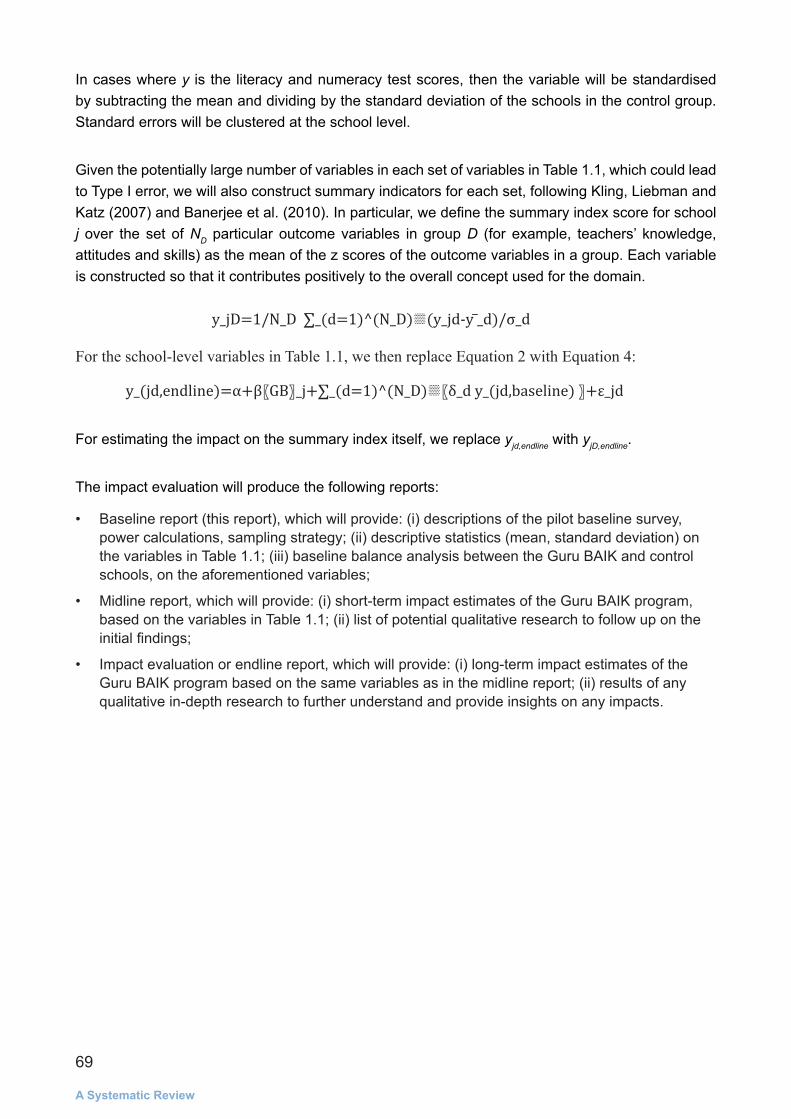
69
A Systematic Review
In cases where y is the literacy and numeracy test scores, then the variable will be standardised by subtracting the mean and dividing by the standard deviation of the schools in the control group. Standard errors will be clustered at the school level.
Given the potentially large number of variables in each set of variables in Table 1.1, which could lead to Type I error, we will also construct summary indicators for each set, following Kling, Liebman and Katz (2007) and Banerjee et al. (2010). In particular, we define the summary index score for school j over the set of ND particular outcome variables in group D (for example, teachers’ knowledge, attitudes and skills) as the mean of the z scores of the outcome variables in a group. Each variable is constructed so that it contributes positively to the overall concept used for the domain.
For the school-level variables in Table 1.1, we then replace Equation 2 with Equation 4:
For estimating the impact on the summary index itself, we replace yjd,endline with yjD,endline.
The impact evaluation will produce the following reports:
• Baseline report (this report), which will provide: (i) descriptions of the pilot baseline survey, power calculations, sampling strategy; (ii) descriptive statistics (mean, standard deviation) on the variables in Table 1.1; (iii) baseline balance analysis between the Guru BAIK and control schools, on the aforementioned variables;
• Midline report, which will provide: (i) short-term impact estimates of the Guru BAIK program, based on the variables in Table 1.1; (ii) list of potential qualitative research to follow up on the initial findings;
• Impact evaluation or endline report, which will provide: (i) long-term impact estimates of the Guru BAIK program based on the same variables as in the midline report; (ii) results of any qualitative in-depth research to further understand and provide insights on any impacts.
y_jD=1/N_D ∑_(d=1)^(N_D)▒(y_jd-y ̅_d)/σ_d
y_(jd,endline)=α+β〖GB〗_j+∑_(d=1)^(N_D)▒〖δ_d y_(jd,baseline) 〗+ε_jd

70
Interventions, Practices and Contextual Factors Linked to Indonesian Students’ Literacy and Numeracy Outcomes:
Balance testSTUDENTS
Table 3.1 Proportion of students with well-functioning visual and auditory modalities (reported by students)
Guru Baik (GB)
SE N (GB)Comparison
(C)SE N (C)
Difference (GB - C)
SE N p-value
Able to see 0.945 0.006 1,244 0.963 0.005 1,249 -0.019 0.011 2,493 0.100
Able to listen 0.973 0.005 1,244 0.983 0.004 1,249 -0.010 0.007 2,493 0.185
Table 3.2 Percentage of children with special needs, identified by teachers (%)
Guru Baik (GB)
SE N (GB) Comparison (C) SE N (C) Difference
(GB - C) SE N p-value
Low vision 0.080 0.080 1,244 0.240 0.139 1,249 -0.002 0.002 2,493 0.311Hearing impairment
0.241 0.139 1,244 0.080 0.080 1,249 0.002 0.002 2,493 0.409
Adjustment problem
0.804 0.253 1,244 1.281 0.318 1,249 -0.005 0.005 2,493 0.368
Physical impairment
0.080 0.080 1,244 0.160 0.113 1,249 -0.001 0.001 2,493 0.563
Emotional dysregulation
0.965 0.277 1,244 2.962 0.480 1,249 -0.020 0.008 2,493 0.009
Gifted indication 9.405 0.828 1,244 12.090 0.923 1,249 -0.027 0.020 2,493 0.176
Slow learner 8.280 0.782 1,244 7.766 0.758 1,249 0.005 0.013 2,493 0.692Communication difficulties
1.367 0.329 1,244 1.041 0.287 1,249 0.003 0.004 2,493 0.438
hyperactive 3.376 0.512 1,244 3.763 0.539 1,249 -0.004 0.009 2,493 0.679Children with special needs
20.900 1.153 1,244 23.779 1.205 1,249 -0.029 0.029 2,493 0.329

71
A Systematic Review
Table 3.3 Snapshot of students’ fluid intelligence
Guru Baik (GB) SE N
(GB)Comparison
(C) SE N (C) Difference (GB - C) SE N p-value
Average -0.166 0.026 1,244 0.000 0.028 1,247 -0.166 0.074 2,491 0.028
Male -0.140 0.037 645 0.048 0.041 624 -0.188 0.084 1,269 0.028
Female -0.193 0.037 599 -0.046 0.040 612 -0.147 0.088 1,211 0.098
Table 3.4 Students’ motivation and experience at school
Guru Baik (GB) SE N (GB) Comparison
(C) SE N (C) Difference (GB - C) SE N p-value
Highly motivated
0.934 0.007 1,244 0.951 0.006 1,249 -0.017 0.011 2,493 0.137
Verbal bullying 0.749 0.012 1,245 0.704 0.013 1,249 0.045 0.029 2,494 0.129Physical bullying
0.644 0.014 1,245 0.602 0.014 1,249 0.042 0.036 2,494 0.248
Social bullying 0.554 0.014 1,245 0.532 0.014 1,249 0.023 0.036 2,494 0.529Mild corporal punishment
0.369 0.014 1,245 0.286 0.013 1,249 0.083 0.029 2,494 0.006
Harsh corporal punishment
0.136 0.010 1,245 0.104 0.009 1,249 0.032 0.023 2,494 0.179
Students feel safe
0.585 0.014 1,245 0.570 0.014 1,249 0.015 0.038 2,494 0.697
Table 3.5 Father characteristics
Guru Baik (GB) SE N (GB) Comparison
(C) SE N (C) Difference (GB - C) SE N p-value
Age 41.595 0.269 1054 33.012 7.077 1120 8.584 7.046 2174 0.226Fathers’ characteristics (FC) Formal working status
0.184 0.012 1133 0.287 0.013 1166 -0.104 0.036 2299 0.005
Finished junior high school
0.464 0.015 1133 0.482 0.015 1166 -0.018 0.038 2299 0.644
Able to read newspapers/ books
0.865 0.010 1133 0.862 0.010 1166 0.003 0.027 2299 0.910
Able to write a letter
0.831 0.011 1133 0.838 0.011 1166 -0.007 0.030 2299 0.806
Able to do simple calculate calculations
0.877 0.010 1133 0.864 0.010 1166 0.014 0.027 2299 0.619
Able to converse measurement
0.782 0.012 1133 0.763 0.012 1166 0.019 0.035 2299 0.590
FC summary index
-0.032 0.021 1133 0.000 0.021 1166 -0.032 0.062 2299 0.609

72
Interventions, Practices and Contextual Factors Linked to Indonesian Students’ Literacy and Numeracy Outcomes:
Table 3.6 Mothers’ characteristics
Guru Baik (GB) SE N
(GB)Comparison
(C) SE N (C) Difference (GB - C) SE N p-value
Age 38.449 0.265 1136 37.222 0.226 1157 1.228 0.436 2293 0.006Mothers’ characteristics (MC)Formal working status
0.071 0.007 1205 0.100 0.009 1204 -0.028 0.017 2409 0.096
Finished junior high school
0.393 0.014 1205 0.410 0.014 1204 -0.018 0.040 2409 0.656
Able to read newspapers/ books
0.822 0.011 1205 0.818 0.011 1204 0.003 0.034 2409 0.919
Able to write a letter
0.770 0.012 1205 0.782 0.012 1204 -0.011 0.037 2409 0.760
Able to do simple calculations
0.827 0.011 1205 0.798 0.012 1204 0.029 0.034 2409 0.398
Able to converse measurement
0.684 0.013 1205 0.658 0.014 1204 0.026 0.043 2409 0.545
MC summary index
-0.032 0.036 1205 0.003 0.036 1204 -0.034 0.123 2409 0.781
Table 3.7 Families’ economic conditions
Guru Baik (GB) SE N
(GB)Comparison
(C) SE N (C) Difference (GB - C) SE N p-value
Education expenditure
34,640 1,270 1245 55,987 4,306 1248 -21,347 11,111 2493 0.058
Per-capita monthly food expenditure
1,146,846 542,162 1245 855,113 260,698 1248 291,732 595,299 2493 0.625
Per-capita monthly non-food expenditure
335,618 80,781 1245 294,777 12,312 1248 40,842 89,297 2493 0.648
Household asset ownership (HAO) Computer 0.105 0.009 1245 0.108 0.009 1249 -0.003 0.024 2494 0.906
Car 0.031 0.005 1245 0.049 0.006 1249 -0.018 0.016 2494 0.248 Air conditioner
0.014 0.003 1245 0.023 0.004 1249 -0.010 0.014 2494 0.487
Motorcycle 0.650 0.014 1245 0.714 0.013 1249 -0.064 0.033 2494 0.051 Washing machine
0.089 0.008 1245 0.098 0.008 1249 -0.009 0.027 2494 0.733
Permanent wall
0.750 0.012 1245 0.804 0.011 1249 -0.054 0.043 2494 0.213

73
A Systematic Review
Guru Baik (GB) SE N
(GB)Comparison
(C) SE N (C) Difference (GB - C) SE N p-value
Permanent floor
0.327 0.013 1245 0.299 0.013 1249 0.027 0.040 2494 0.497
Permanent water closet
0.696 0.013 1245 0.757 0.012 1249 -0.062 0.046 2494 0.182
HAO summary index
-0.069 0.014 1245 0.000 0.017 1249 -0.069 0.059 2494 0.248
Table 3.8 Student literacy score
Guru Baik (GB) SE N
(GB)Comparison
(C) SE N (C) Difference (GB - C) SE N p-value
Grades 1–5
Average -0.019 0.020 2641 0.000 0.019 2658 -0.019 0.083 5299 0.814
Male -0.208 0.026 1345 -0.119 0.025 1373 -0.089 0.082 2718 0.278
Female 0.177 0.029 1296 0.127 0.029 1285 0.050 0.096 2581 0.609
Grades 1–2
Average -0.126 0.042 495 -0.019 0.048 500 -0.107 0.127 995 0.403
Male -0.195 0.056 267 -0.129 0.066 245 -0.065 0.139 512 0.639
Female -0.046 0.063 228 0.086 0.069 255 -0.132 0.155 483 0.397
Grades 3–5
Average 0.005 0.022 2146 0.005 0.021 2158 0.001 0.088 4304 0.994
Male -0.212 0.030 1078 -0.117 0.027 1128 -0.095 0.089 2206 0.290
Female 0.224 0.032 1068 0.137 0.032 1030 0.087 0.101 2098 0.389
Table 3.9 Students’ numeracy scores
Guru Baik (GB) SE N
(GB)Comparison
(C) SE N (C) Difference (GB - C) SE N p-value
Grades 1–5
Average -0.017 0.020 2640 0.000 0.019 2653 -0.017 0.078 5293 0.829
Boys -0.099 0.026 1344 -0.069 0.027 1368 -0.029 0.075 2712 0.699
Girls 0.068 0.029 1296 0.074 0.028 1285 -0.006 0.093 2581 0.951Grades 1–2
Average -0.236 0.045 495 0.116 0.049 500 -0.352 0.139 995 0.013
Boys -0.283 0.059 267 0.075 0.067 245 -0.358 0.138 512 0.011
Girls -0.180 0.068 228 0.155 0.072 255 -0.335 0.177 483 0.061Grades 3–5
Average 0.034 0.022 2145 -0.027 0.021 2153 0.061 0.082 4298 0.459
Boys -0.053 0.029 1077 -0.101 0.029 1123 0.048 0.082 2200 0.561
Girls 0.121 0.032 1068 0.054 0.030 1030 0.067 0.094 2098 0.475
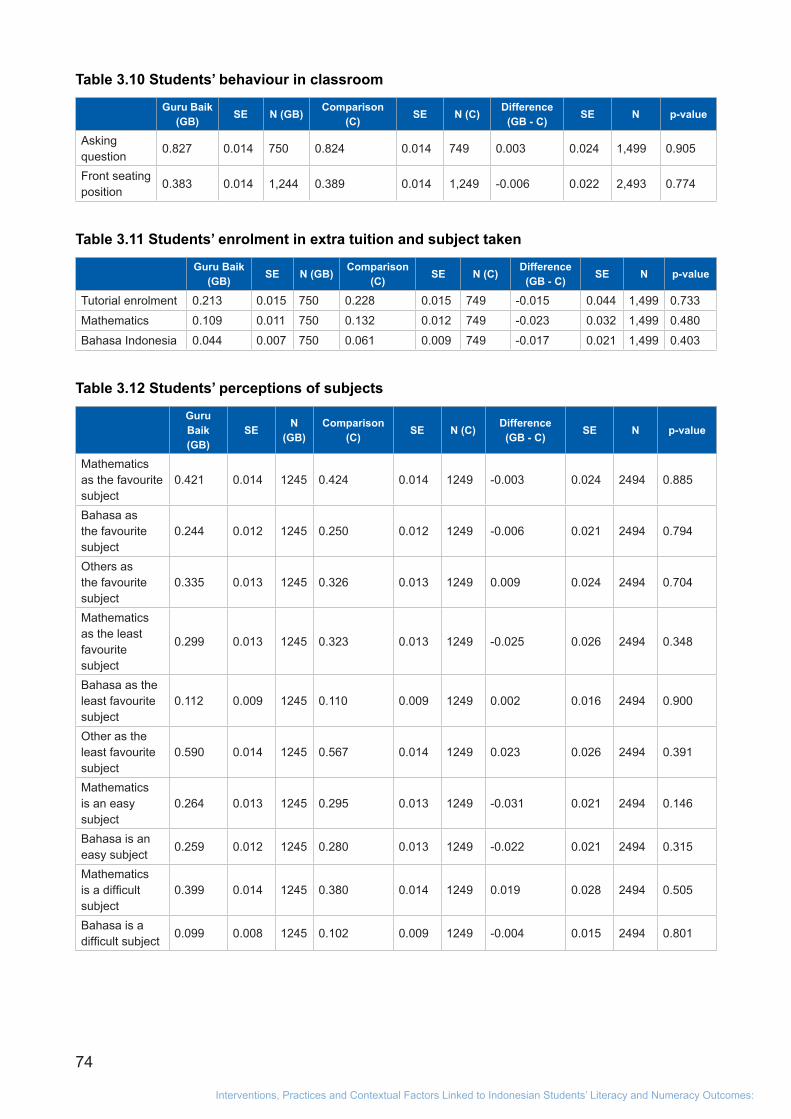
74
Interventions, Practices and Contextual Factors Linked to Indonesian Students’ Literacy and Numeracy Outcomes:
Table 3.10 Students’ behaviour in classroom
Guru Baik (GB) SE N (GB) Comparison
(C) SE N (C) Difference (GB - C) SE N p-value
Asking question
0.827 0.014 750 0.824 0.014 749 0.003 0.024 1,499 0.905
Front seating position
0.383 0.014 1,244 0.389 0.014 1,249 -0.006 0.022 2,493 0.774
Table 3.11 Students’ enrolment in extra tuition and subject taken
Guru Baik (GB) SE N (GB) Comparison
(C) SE N (C) Difference (GB - C) SE N p-value
Tutorial enrolment 0.213 0.015 750 0.228 0.015 749 -0.015 0.044 1,499 0.733
Mathematics 0.109 0.011 750 0.132 0.012 749 -0.023 0.032 1,499 0.480
Bahasa Indonesia 0.044 0.007 750 0.061 0.009 749 -0.017 0.021 1,499 0.403
Table 3.12 Students’ perceptions of subjects
Guru Baik (GB)
SE N (GB)
Comparison (C) SE N (C) Difference
(GB - C) SE N p-value
Mathematics as the favourite subject
0.421 0.014 1245 0.424 0.014 1249 -0.003 0.024 2494 0.885
Bahasa as the favourite subject
0.244 0.012 1245 0.250 0.012 1249 -0.006 0.021 2494 0.794
Others as the favourite subject
0.335 0.013 1245 0.326 0.013 1249 0.009 0.024 2494 0.704
Mathematics as the least favourite subject
0.299 0.013 1245 0.323 0.013 1249 -0.025 0.026 2494 0.348
Bahasa as the least favourite subject
0.112 0.009 1245 0.110 0.009 1249 0.002 0.016 2494 0.900
Other as the least favourite subject
0.590 0.014 1245 0.567 0.014 1249 0.023 0.026 2494 0.391
Mathematics is an easy subject
0.264 0.013 1245 0.295 0.013 1249 -0.031 0.021 2494 0.146
Bahasa is an easy subject
0.259 0.012 1245 0.280 0.013 1249 -0.022 0.021 2494 0.315
Mathematics is a difficult subject
0.399 0.014 1245 0.380 0.014 1249 0.019 0.028 2494 0.505
Bahasa is a difficult subject
0.099 0.008 1245 0.102 0.009 1249 -0.004 0.015 2494 0.801
75
A Systematic Review
Table 3.13 Teacher–student interactions
Guru Baik (GB) SE N
(GB)Comparison
(C) SE N (C) Difference (GB - C) SE N p-value
Teachers answer if students ask
0.976 0.006 620 0.987 0.005 617 -0.011 0.009 1237 0.234
Teacher–student interaction (TSI) Giving chance to ask
0.968 0.006 750 0.949 0.008 749 0.019 0.013 1499 0.143
Checking students’ understanding
0.945 0.008 750 0.957 0.007 749 -0.012 0.013 1499 0.373
Providing useful feedback 0.836 0.014 750 0.911 0.010 749 -0.075 0.032 1499 0.021
Checking mathematics homework
0.731 0.016 750 0.593 0.018 749 0.138 0.050 1499 0.007
Checking Bahasa Indonesia homework
0.680 0.017 750 0.595 0.018 749 0.085 0.051 1499 0.099
TSI summary index 0.044 0.022 750 0.000 0.022 749 0.044 0.058 1499 0.455
Table 3.14 Fathers’ involvement in student learning
Guru Baik (GB) SE N (GB) Comparison
(C) SE N (C) Difference (GB - C) SE N p-value
Accompany study
0.523 0.014 1245 0.551 0.014 1248 -0.028 0.040 2493 0.481
Days accompany study last week
1.998 0.068 1244 2.141 0.069 1248 -0.143 0.225 2492 0.528
Hours accompany study last week
0.645 0.021 1244 0.648 0.020 1248 -0.004 0.055 2492 0.949
Father types of support (FTS) Asking about lessons
0.197 0.011 1245 0.288 0.013 1248 -0.091 0.029 2493 0.003
Asking about homework
0.241 0.012 1245 0.270 0.013 1248 -0.029 0.031 2493 0.345
Checking homework
0.124 0.009 1245 0.202 0.011 1248 -0.077 0.025 2493 0.002
Helping with homework
0.257 0.012 1245 0.322 0.013 1248 -0.065 0.030 2493 0.032
FTS summary index
-0.150 0.017 1,245 0.000 0.021 1,248 -0.150 0.050 2,493 0.003
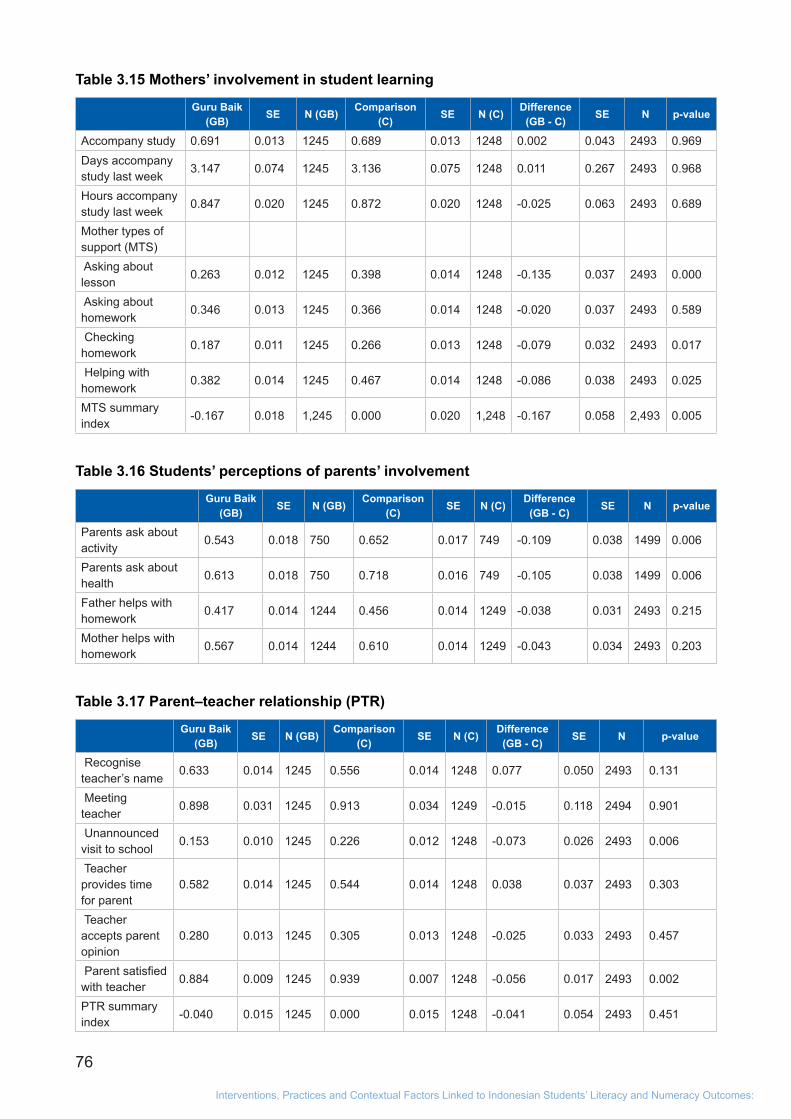
76
Interventions, Practices and Contextual Factors Linked to Indonesian Students’ Literacy and Numeracy Outcomes:
Table 3.15 Mothers’ involvement in student learning
Guru Baik (GB) SE N (GB) Comparison
(C) SE N (C) Difference (GB - C) SE N p-value
Accompany study 0.691 0.013 1245 0.689 0.013 1248 0.002 0.043 2493 0.969Days accompany study last week
3.147 0.074 1245 3.136 0.075 1248 0.011 0.267 2493 0.968
Hours accompany study last week
0.847 0.020 1245 0.872 0.020 1248 -0.025 0.063 2493 0.689
Mother types of support (MTS) Asking about lesson
0.263 0.012 1245 0.398 0.014 1248 -0.135 0.037 2493 0.000
Asking about homework
0.346 0.013 1245 0.366 0.014 1248 -0.020 0.037 2493 0.589
Checking homework
0.187 0.011 1245 0.266 0.013 1248 -0.079 0.032 2493 0.017
Helping with homework
0.382 0.014 1245 0.467 0.014 1248 -0.086 0.038 2493 0.025
MTS summary index
-0.167 0.018 1,245 0.000 0.020 1,248 -0.167 0.058 2,493 0.005
Table 3.16 Students’ perceptions of parents’ involvement
Guru Baik (GB) SE N (GB) Comparison
(C) SE N (C) Difference (GB - C) SE N p-value
Parents ask about activity
0.543 0.018 750 0.652 0.017 749 -0.109 0.038 1499 0.006
Parents ask about health
0.613 0.018 750 0.718 0.016 749 -0.105 0.038 1499 0.006
Father helps with homework
0.417 0.014 1244 0.456 0.014 1249 -0.038 0.031 2493 0.215
Mother helps with homework
0.567 0.014 1244 0.610 0.014 1249 -0.043 0.034 2493 0.203
Table 3.17 Parent–teacher relationship (PTR)
Guru Baik (GB) SE N (GB) Comparison
(C) SE N (C) Difference (GB - C) SE N p-value
Recognise teacher’s name
0.633 0.014 1245 0.556 0.014 1248 0.077 0.050 2493 0.131
Meeting teacher
0.898 0.031 1245 0.913 0.034 1249 -0.015 0.118 2494 0.901
Unannounced visit to school
0.153 0.010 1245 0.226 0.012 1248 -0.073 0.026 2493 0.006
Teacher provides time for parent
0.582 0.014 1245 0.544 0.014 1248 0.038 0.037 2493 0.303
Teacher accepts parent opinion
0.280 0.013 1245 0.305 0.013 1248 -0.025 0.033 2493 0.457
Parent satisfied with teacher
0.884 0.009 1245 0.939 0.007 1248 -0.056 0.017 2493 0.002
PTR summary index
-0.040 0.015 1245 0.000 0.015 1248 -0.041 0.054 2493 0.451
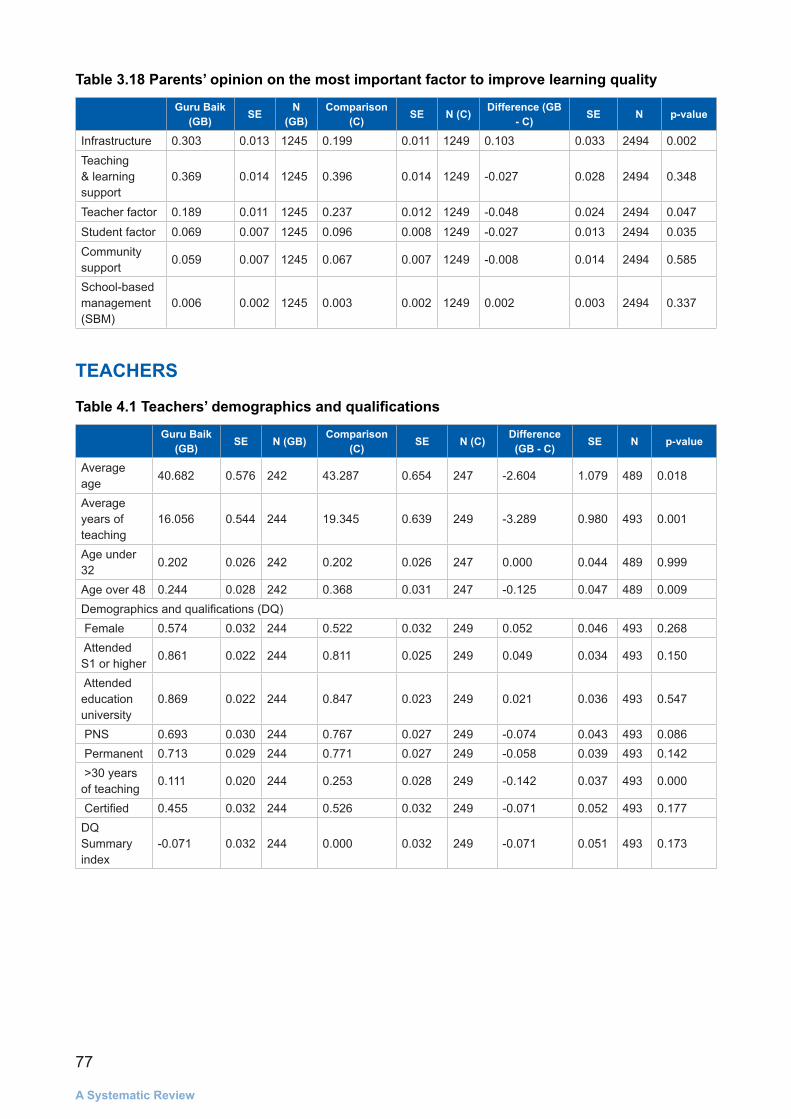
77
A Systematic Review
Table 3.18 Parents’ opinion on the most important factor to improve learning quality
Guru Baik (GB) SE N
(GB)Comparison
(C) SE N (C) Difference (GB - C) SE N p-value
Infrastructure 0.303 0.013 1245 0.199 0.011 1249 0.103 0.033 2494 0.002Teaching & learning support
0.369 0.014 1245 0.396 0.014 1249 -0.027 0.028 2494 0.348
Teacher factor 0.189 0.011 1245 0.237 0.012 1249 -0.048 0.024 2494 0.047
Student factor 0.069 0.007 1245 0.096 0.008 1249 -0.027 0.013 2494 0.035Community support
0.059 0.007 1245 0.067 0.007 1249 -0.008 0.014 2494 0.585
School-based management (SBM)
0.006 0.002 1245 0.003 0.002 1249 0.002 0.003 2494 0.337
TEACHERS
Table 4.1 Teachers’ demographics and qualifications
Guru Baik (GB) SE N (GB) Comparison
(C) SE N (C) Difference (GB - C) SE N p-value
Average age
40.682 0.576 242 43.287 0.654 247 -2.604 1.079 489 0.018
Average years of teaching
16.056 0.544 244 19.345 0.639 249 -3.289 0.980 493 0.001
Age under 32
0.202 0.026 242 0.202 0.026 247 0.000 0.044 489 0.999
Age over 48 0.244 0.028 242 0.368 0.031 247 -0.125 0.047 489 0.009Demographics and qualifications (DQ) Female 0.574 0.032 244 0.522 0.032 249 0.052 0.046 493 0.268 Attended S1 or higher
0.861 0.022 244 0.811 0.025 249 0.049 0.034 493 0.150
Attended education university
0.869 0.022 244 0.847 0.023 249 0.021 0.036 493 0.547
PNS 0.693 0.030 244 0.767 0.027 249 -0.074 0.043 493 0.086 Permanent 0.713 0.029 244 0.771 0.027 249 -0.058 0.039 493 0.142 >30 years of teaching
0.111 0.020 244 0.253 0.028 249 -0.142 0.037 493 0.000
Certified 0.455 0.032 244 0.526 0.032 249 -0.071 0.052 493 0.177DQ Summary index
-0.071 0.032 244 0.000 0.032 249 -0.071 0.051 493 0.173
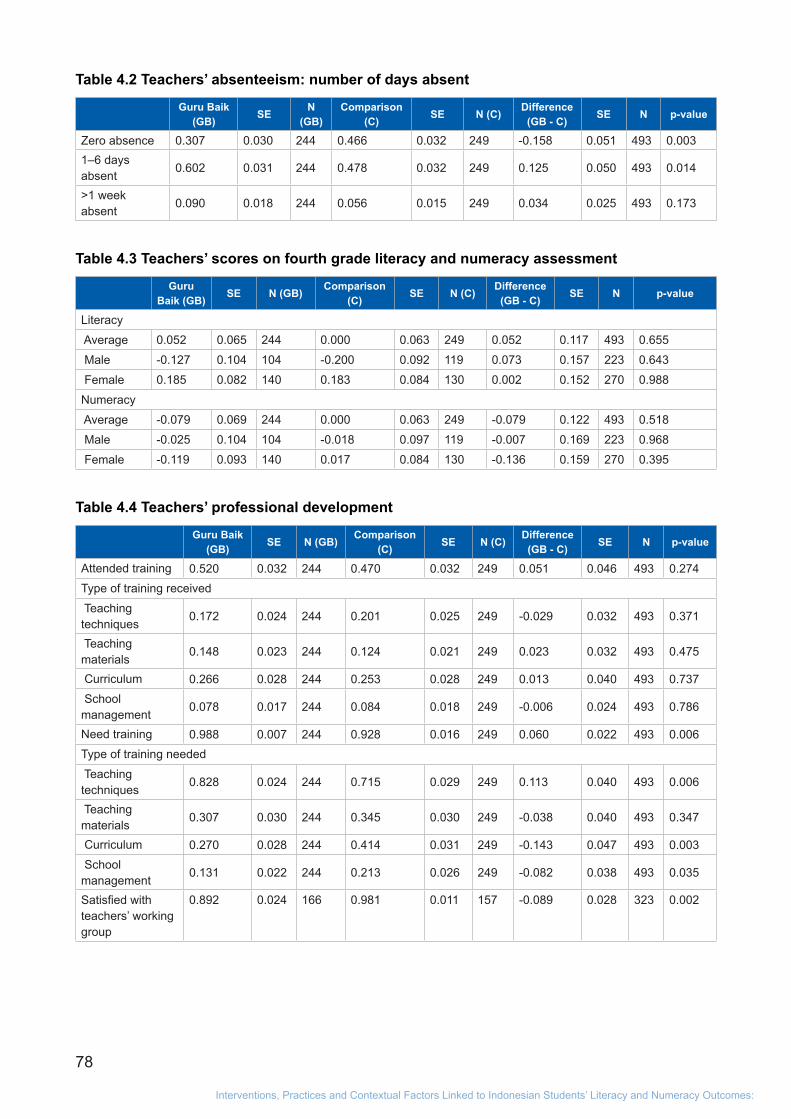
78
Interventions, Practices and Contextual Factors Linked to Indonesian Students’ Literacy and Numeracy Outcomes:
Table 4.2 Teachers’ absenteeism: number of days absent
Guru Baik (GB) SE N
(GB)Comparison
(C) SE N (C) Difference (GB - C) SE N p-value
Zero absence 0.307 0.030 244 0.466 0.032 249 -0.158 0.051 493 0.0031–6 days absent
0.602 0.031 244 0.478 0.032 249 0.125 0.050 493 0.014
>1 week absent
0.090 0.018 244 0.056 0.015 249 0.034 0.025 493 0.173
Table 4.3 Teachers’ scores on fourth grade literacy and numeracy assessment
Guru Baik (GB) SE N (GB) Comparison
(C) SE N (C) Difference (GB - C) SE N p-value
Literacy
Average 0.052 0.065 244 0.000 0.063 249 0.052 0.117 493 0.655
Male -0.127 0.104 104 -0.200 0.092 119 0.073 0.157 223 0.643
Female 0.185 0.082 140 0.183 0.084 130 0.002 0.152 270 0.988
Numeracy
Average -0.079 0.069 244 0.000 0.063 249 -0.079 0.122 493 0.518
Male -0.025 0.104 104 -0.018 0.097 119 -0.007 0.169 223 0.968
Female -0.119 0.093 140 0.017 0.084 130 -0.136 0.159 270 0.395
Table 4.4 Teachers’ professional development
Guru Baik (GB) SE N (GB) Comparison
(C) SE N (C) Difference (GB - C) SE N p-value
Attended training 0.520 0.032 244 0.470 0.032 249 0.051 0.046 493 0.274Type of training received
Teaching techniques
0.172 0.024 244 0.201 0.025 249 -0.029 0.032 493 0.371
Teaching materials
0.148 0.023 244 0.124 0.021 249 0.023 0.032 493 0.475
Curriculum 0.266 0.028 244 0.253 0.028 249 0.013 0.040 493 0.737 School management
0.078 0.017 244 0.084 0.018 249 -0.006 0.024 493 0.786
Need training 0.988 0.007 244 0.928 0.016 249 0.060 0.022 493 0.006Type of training needed
Teaching techniques
0.828 0.024 244 0.715 0.029 249 0.113 0.040 493 0.006
Teaching materials
0.307 0.030 244 0.345 0.030 249 -0.038 0.040 493 0.347
Curriculum 0.270 0.028 244 0.414 0.031 249 -0.143 0.047 493 0.003 School management
0.131 0.022 244 0.213 0.026 249 -0.082 0.038 493 0.035
Satisfied with teachers’ working group
0.892 0.024 166 0.981 0.011 157 -0.089 0.028 323 0.002

79
A Systematic Review
Guru Baik (GB) SE N (GB) Comparison
(C) SE N (C) Difference (GB - C) SE N p-value
Teachers’ professional development (TPD)
>2 times – training
0.168 0.024 244 0.112 0.020 249 0.056 0.031 493 0.076
>3 times – attended KKG
0.328 0.030 244 0.221 0.026 249 0.107 0.061 493 0.083
Self-improvement 0.876 0.021 249 0.893 0.020 244 0.018 0.029 493 0.536 Activities to improve competence
Seminar with other teachers
0.357 0.030 249 0.332 0.030 244 -0.025 0.043 493 0.553
School visit 0.225 0.027 249 0.291 0.029 244 0.066 0.046 493 0.156 Teachers’ working group activities
0.731 0.028 249 0.799 0.026 244 0.068 0.051 493 0.188
Classroom action research
0.329 0.030 249 0.443 0.032 244 0.113 0.055 493 0.041
Discuss with other teachers
0.783 0.026 249 0.881 0.021 244 0.098 0.035 493 0.007
TPD Summary index
0.153 0.033 244 0.000 0.030 249 0.153 0.059 493 0.011
Table 4.5 Teachers’ perceptions of support from principals and fellow teachers
Guru Baik (GB) SE N (GB) Comparison
(C) SE N (C) Difference (GB - C) SE N p-value
Perceptions of support from principals
All teachers -0.007 0.060 244 0.000 0.063 249 -0.007 0.121 493 0.955
Male teachers -0.055 0.082 104 0.130 0.094 119 -0.185 0.134 223 0.171
Female teachers 0.029 0.086 140 -0.119 0.085 130 0.148 0.163 270 0.366
Perceptions of support from fellow teachers
All teachers 0.061 0.065 244 0.000 0.063 249 0.061 0.117 493 0.601
Male teachers -0.034 0.088 104 0.036 0.093 119 -0.070 0.142 223 0.623
Female teachers 0.132 0.091 140 -0.033 0.087 130 0.165 0.158 270 0.300
Table 4.6 Teachers’ growth mindset on intelligence
Guru Baik (GB) SE N
(GB)Comparison
(C) SE N (C) Difference (GB - C) SE N p-value
Average 0.038 0.066 243 0.000 0.063 249 0.038 0.114 492 0.739
Male -0.004 0.097 104 -0.034 0.092 119 0.031 0.148 223 0.837
Female 0.069 0.089 139 0.031 0.088 130 0.038 0.128 269 0.768

80
Interventions, Practices and Contextual Factors Linked to Indonesian Students’ Literacy and Numeracy Outcomes:
Table 4.7 Percentage of total class time on instruction (%)
Guru Baik (GB)
SE N (GB) Comparison (C)
SE N (C) Difference (GB - C)
SE N p-value
Academic activities
77.791 1.097 249 74.240 1.196 250 3.551 2.083 499 0.091
Active instruction
44.418 1.486 249 42.920 1.444 250 1.498 2.181 499 0.494
Reading aloud 7.108 0.798 249 7.240 0.750 250 -0.132 1.121 499 0.907
Demonstration 24.337 1.324 249 20.640 1.148 250 3.697 2.036 499 0.072
Discussion 10.442 0.930 249 12.000 0.974 250 -1.558 1.334 499 0.245
Practice & drill 2.530 0.508 249 3.040 0.508 250 -0.510 0.689 499 0.461
Passive instruction
33.373 1.376 249 31.320 1.241 250 2.053 2.168 499 0.346
Copying 4.096 0.516 249 8.520 0.838 250 -4.424 0.968 499 0.000
Assignment/Class activities
29.277 1.364 249 22.800 1.125 250 6.477 2.014 499 0.002
Classroom management
17.108 0.917 249 22.200 1.114 250 -5.092 1.900 499 0.009
Verbal instruction
11.044 0.763 249 15.200 1.011 250 -4.156 1.741 499 0.019
Managing with students
2.731 0.359 249 3.760 0.394 250 -1.029 0.620 499 0.100
Managing alone 3.012 0.419 249 2.640 0.440 250 0.372 0.761 499 0.626
Disciplining students
0.321 0.126 249 0.600 0.188 250 -0.279 0.225 499 0.219
Teacher off-task 5.100 0.605 249 3.560 0.483 250 1.540 0.908 499 0.093
Socialising 0.723 0.183 249 0.440 0.142 250 0.283 0.235 499 0.232
Uninvolved 2.169 0.387 249 1.120 0.297 250 1.049 0.538 499 0.054
Absent from the room
2.209 0.343 249 2.000 0.300 250 0.209 0.562 499 0.711
Table 4.8 Percentage of total class time teachers used learning materials (%)
Guru Baik (GB) SE N
(GB)Comparison
(C) SE N (C) Difference (GB - C) SE N p-value
No material 24.980 1.290 249 21.000 1.089 250 3.980 2.069 499 0.057
Textbook 20.241 1.533 249 25.400 1.563 250 -5.159 2.467 499 0.039
Notebook 18.594 1.305 249 17.200 1.073 250 1.394 2.232 499 0.534
Blackboard 28.353 1.574 249 28.800 1.462 250 -0.447 2.473 499 0.857Learning aides
4.418 0.687 249 4.720 0.820 250 -0.302 1.077 499 0.780
ICT 0.241 0.179 249 0.640 0.292 250 -0.399 0.333 499 0.233
Cooperative 3.173 0.740 249 2.240 0.555 250 0.933 1.130 499 0.411
Table 4.9 Percentage of total class time spent with students not engaged (%)
Guru Baik (GB) SE N
(GB)Comparison
(C) SE N (C) Difference (GB - C) SE N p-value
Socialising 31.245 1.669 249 18.400 1.112 250 12.845 2.856 499 0.000
Uninvolved 13.012 1.047 249 10.520 0.907 250 2.492 1.622 499 0.128
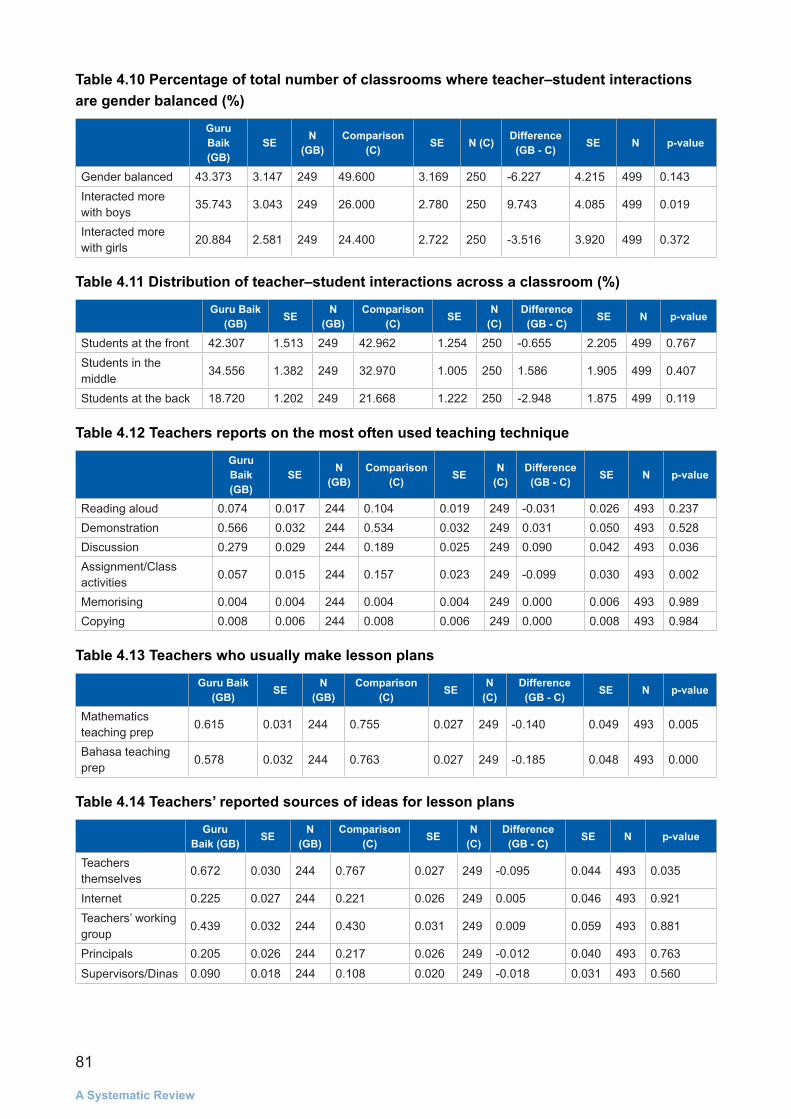
81
A Systematic Review
Table 4.10 Percentage of total number of classrooms where teacher–student interactions are gender balanced (%)
Guru Baik (GB)
SE N (GB)
Comparison (C) SE N (C) Difference
(GB - C) SE N p-value
Gender balanced 43.373 3.147 249 49.600 3.169 250 -6.227 4.215 499 0.143Interacted more with boys
35.743 3.043 249 26.000 2.780 250 9.743 4.085 499 0.019
Interacted more with girls
20.884 2.581 249 24.400 2.722 250 -3.516 3.920 499 0.372
Table 4.11 Distribution of teacher–student interactions across a classroom (%)
Guru Baik (GB) SE N
(GB)Comparison
(C) SE N (C)
Difference (GB - C) SE N p-value
Students at the front 42.307 1.513 249 42.962 1.254 250 -0.655 2.205 499 0.767Students in the middle
34.556 1.382 249 32.970 1.005 250 1.586 1.905 499 0.407
Students at the back 18.720 1.202 249 21.668 1.222 250 -2.948 1.875 499 0.119
Table 4.12 Teachers reports on the most often used teaching technique
Guru Baik (GB)
SE N (GB)
Comparison (C) SE N
(C)Difference
(GB - C) SE N p-value
Reading aloud 0.074 0.017 244 0.104 0.019 249 -0.031 0.026 493 0.237Demonstration 0.566 0.032 244 0.534 0.032 249 0.031 0.050 493 0.528Discussion 0.279 0.029 244 0.189 0.025 249 0.090 0.042 493 0.036Assignment/Class activities
0.057 0.015 244 0.157 0.023 249 -0.099 0.030 493 0.002
Memorising 0.004 0.004 244 0.004 0.004 249 0.000 0.006 493 0.989Copying 0.008 0.006 244 0.008 0.006 249 0.000 0.008 493 0.984
Table 4.13 Teachers who usually make lesson plans
Guru Baik (GB) SE N
(GB)Comparison
(C) SE N (C)
Difference (GB - C) SE N p-value
Mathematics teaching prep
0.615 0.031 244 0.755 0.027 249 -0.140 0.049 493 0.005
Bahasa teaching prep
0.578 0.032 244 0.763 0.027 249 -0.185 0.048 493 0.000
Table 4.14 Teachers’ reported sources of ideas for lesson plans
Guru Baik (GB) SE N
(GB)Comparison
(C) SE N (C)
Difference (GB - C) SE N p-value
Teachers themselves
0.672 0.030 244 0.767 0.027 249 -0.095 0.044 493 0.035
Internet 0.225 0.027 244 0.221 0.026 249 0.005 0.046 493 0.921Teachers’ working group
0.439 0.032 244 0.430 0.031 249 0.009 0.059 493 0.881
Principals 0.205 0.026 244 0.217 0.026 249 -0.012 0.040 493 0.763
Supervisors/Dinas 0.090 0.018 244 0.108 0.020 249 -0.018 0.031 493 0.560
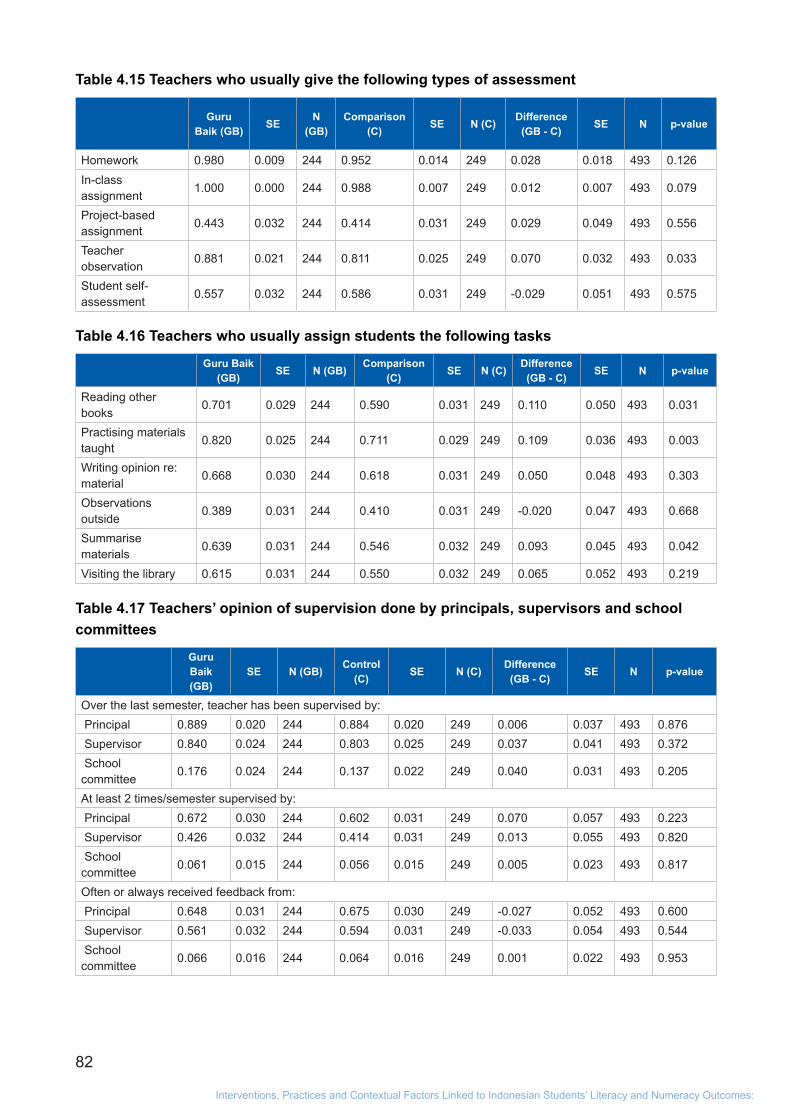
82
Interventions, Practices and Contextual Factors Linked to Indonesian Students’ Literacy and Numeracy Outcomes:
Table 4.15 Teachers who usually give the following types of assessment
Guru Baik (GB) SE N
(GB)Comparison
(C) SE N (C) Difference (GB - C) SE N p-value
Homework 0.980 0.009 244 0.952 0.014 249 0.028 0.018 493 0.126In-class assignment
1.000 0.000 244 0.988 0.007 249 0.012 0.007 493 0.079
Project-based assignment
0.443 0.032 244 0.414 0.031 249 0.029 0.049 493 0.556
Teacher observation
0.881 0.021 244 0.811 0.025 249 0.070 0.032 493 0.033
Student self-assessment
0.557 0.032 244 0.586 0.031 249 -0.029 0.051 493 0.575
Table 4.16 Teachers who usually assign students the following tasks
Guru Baik (GB) SE N (GB) Comparison
(C) SE N (C) Difference (GB - C) SE N p-value
Reading other books
0.701 0.029 244 0.590 0.031 249 0.110 0.050 493 0.031
Practising materials taught
0.820 0.025 244 0.711 0.029 249 0.109 0.036 493 0.003
Writing opinion re: material
0.668 0.030 244 0.618 0.031 249 0.050 0.048 493 0.303
Observations outside
0.389 0.031 244 0.410 0.031 249 -0.020 0.047 493 0.668
Summarise materials
0.639 0.031 244 0.546 0.032 249 0.093 0.045 493 0.042
Visiting the library 0.615 0.031 244 0.550 0.032 249 0.065 0.052 493 0.219
Table 4.17 Teachers’ opinion of supervision done by principals, supervisors and school committees
Guru Baik (GB)
SE N (GB) Control (C) SE N (C) Difference
(GB - C) SE N p-value
Over the last semester, teacher has been supervised by: Principal 0.889 0.020 244 0.884 0.020 249 0.006 0.037 493 0.876 Supervisor 0.840 0.024 244 0.803 0.025 249 0.037 0.041 493 0.372 School committee
0.176 0.024 244 0.137 0.022 249 0.040 0.031 493 0.205
At least 2 times/semester supervised by: Principal 0.672 0.030 244 0.602 0.031 249 0.070 0.057 493 0.223 Supervisor 0.426 0.032 244 0.414 0.031 249 0.013 0.055 493 0.820 School committee
0.061 0.015 244 0.056 0.015 249 0.005 0.023 493 0.817
Often or always received feedback from: Principal 0.648 0.031 244 0.675 0.030 249 -0.027 0.052 493 0.600 Supervisor 0.561 0.032 244 0.594 0.031 249 -0.033 0.054 493 0.544 School committee
0.066 0.016 244 0.064 0.016 249 0.001 0.022 493 0.953

83
A Systematic Review
SCHOOLS
Table 5.1 School characteristics
Guru Baik (GB)
SE N (GB) Control (C) SE N (C) Difference
(GB - C) SE N p-value
Total number of students enrolled
131.760 7.395 50 146.820 12.020 50 -15.060 14.113 100 0.289
KTSP curriculum 0.740 0.063 50 0.820 0.055 50 -0.080 0.083 100 0.339
Class size 20.257 0.513 249 20.764 0.489 250 -0.507 1.343 499 0.707IAS summary index
-0.362 0.098 50 0.000 0.119 50 -0.362 0.154 100 0.021
Table 5.2 Classroom facilities
Guru Baik (GB)
SE N (GB)
Control (C) SE N (C) Difference
(GB - C) SE N p-value
Number of chairs available
22.032 0.550 249 22.076 0.507 250 -0.044 1.363 499 0.974
Seating arrangement: rows
0.867 0.022 249 0.864 0.022 250 0.003 0.039 499 0.929
Seating arrangement: clusters
0.092 0.018 249 0.108 0.020 250 -0.016 0.034 499 0.650
Seating arrangement: U-shaped
0.040 0.012 249 0.028 0.010 250 0.012 0.023 499 0.596
Classroom facilities (CF)
Chairs/class size 1.102 0.012 249 1.087 0.013 250 0.015 0.025 499 0.550
Blackboard 1.000 0.000 249 0.992 0.006 250 0.008 0.006 499 0.155
Students artwork 0.522 0.032 249 0.616 0.031 250 -0.094 0.059 499 0.117
Maps 0.273 0.028 249 0.408 0.031 250 -0.135 0.055 499 0.016
Posters/graphs 0.884 0.020 249 0.884 0.020 250 0.000 0.033 499 0.989
Lamps 0.398 0.031 249 0.480 0.032 250 -0.082 0.068 499 0.229
Good natural lighting 0.984 0.008 249 0.948 0.014 250 0.036 0.017 499 0.034
Good air circulation 0.996 0.004 249 0.984 0.008 250 0.012 0.010 499 0.252
CF summary index -0.027 0.019 249 0.000 0.025 250 -0.027 0.044 499 0.542
Table 5.3 School infrastructure facilities (SIF)
Guru Baik (GB)
SE N (GB)
Control (C) SE N (C) Difference
(GB - C) SE N p-value
Open space 0.980 0.020 50 0.780 0.059 50 0.200 0.062 100 0.002
Sport equipment 0.920 0.039 50 0.940 0.034 50 -0.020 0.052 100 0.699
Health facilities 0.380 0.069 50 0.320 0.067 50 0.060 0.096 100 0.534
Canteen 0.700 0.065 50 0.460 0.071 50 0.240 0.097 100 0.015
Prayer room 0.380 0.069 50 0.280 0.064 50 0.100 0.094 100 0.292
School co-op 0.040 0.028 50 0.040 0.028 50 0.000 0.040 100 1.000
Art room 0.060 0.034 50 0.060 0.034 50 0.000 0.048 100 1.000
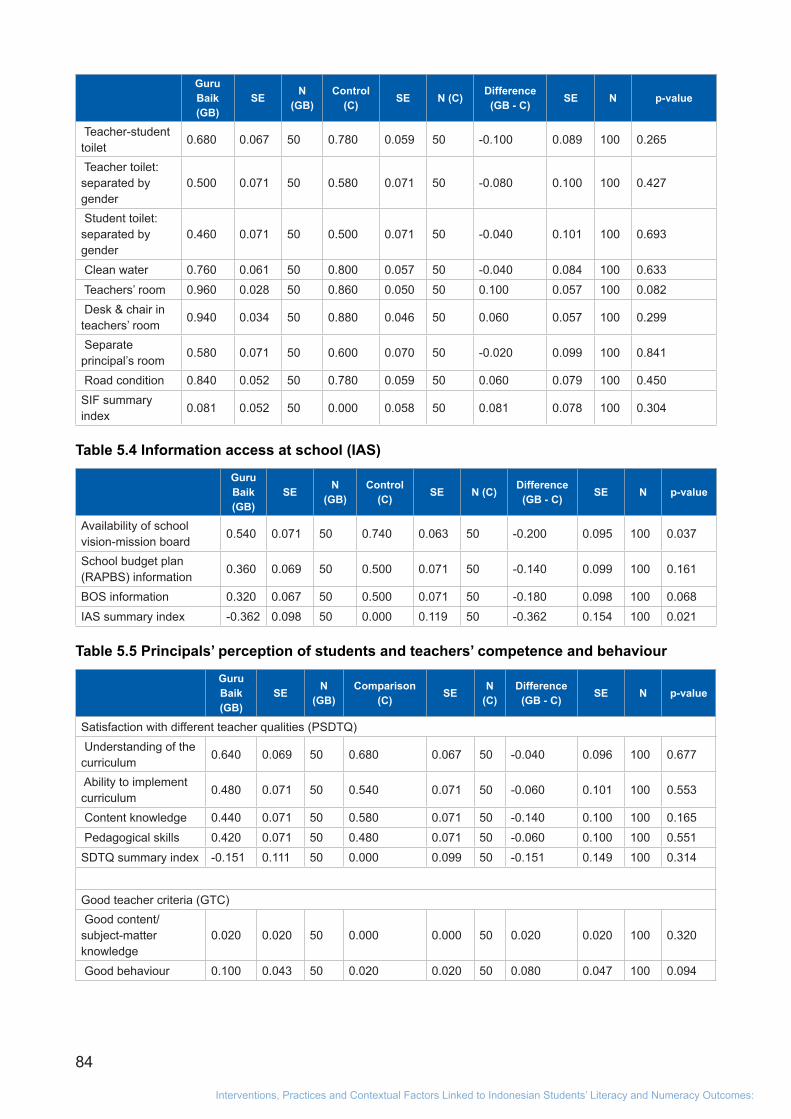
84
Interventions, Practices and Contextual Factors Linked to Indonesian Students’ Literacy and Numeracy Outcomes:
Guru Baik (GB)
SE N (GB)
Control (C) SE N (C) Difference
(GB - C) SE N p-value
Teacher-student toilet
0.680 0.067 50 0.780 0.059 50 -0.100 0.089 100 0.265
Teacher toilet: separated by gender
0.500 0.071 50 0.580 0.071 50 -0.080 0.100 100 0.427
Student toilet: separated by gender
0.460 0.071 50 0.500 0.071 50 -0.040 0.101 100 0.693
Clean water 0.760 0.061 50 0.800 0.057 50 -0.040 0.084 100 0.633
Teachers’ room 0.960 0.028 50 0.860 0.050 50 0.100 0.057 100 0.082 Desk & chair in teachers’ room
0.940 0.034 50 0.880 0.046 50 0.060 0.057 100 0.299
Separate principal’s room
0.580 0.071 50 0.600 0.070 50 -0.020 0.099 100 0.841
Road condition 0.840 0.052 50 0.780 0.059 50 0.060 0.079 100 0.450SIF summary index
0.081 0.052 50 0.000 0.058 50 0.081 0.078 100 0.304
Table 5.4 Information access at school (IAS)
Guru Baik (GB)
SE N (GB)
Control (C) SE N (C) Difference
(GB - C) SE N p-value
Availability of school vision-mission board
0.540 0.071 50 0.740 0.063 50 -0.200 0.095 100 0.037
School budget plan (RAPBS) information
0.360 0.069 50 0.500 0.071 50 -0.140 0.099 100 0.161
BOS information 0.320 0.067 50 0.500 0.071 50 -0.180 0.098 100 0.068
IAS summary index -0.362 0.098 50 0.000 0.119 50 -0.362 0.154 100 0.021
Table 5.5 Principals’ perception of students and teachers’ competence and behaviour
Guru Baik (GB)
SE N (GB)
Comparison (C) SE N
(C)Difference
(GB - C) SE N p-value
Satisfaction with different teacher qualities (PSDTQ) Understanding of the curriculum
0.640 0.069 50 0.680 0.067 50 -0.040 0.096 100 0.677
Ability to implement curriculum
0.480 0.071 50 0.540 0.071 50 -0.060 0.101 100 0.553
Content knowledge 0.440 0.071 50 0.580 0.071 50 -0.140 0.100 100 0.165
Pedagogical skills 0.420 0.071 50 0.480 0.071 50 -0.060 0.100 100 0.551
SDTQ summary index -0.151 0.111 50 0.000 0.099 50 -0.151 0.149 100 0.314
Good teacher criteria (GTC) Good content/subject-matter knowledge
0.020 0.020 50 0.000 0.000 50 0.020 0.020 100 0.320
Good behaviour 0.100 0.043 50 0.020 0.020 50 0.080 0.047 100 0.094
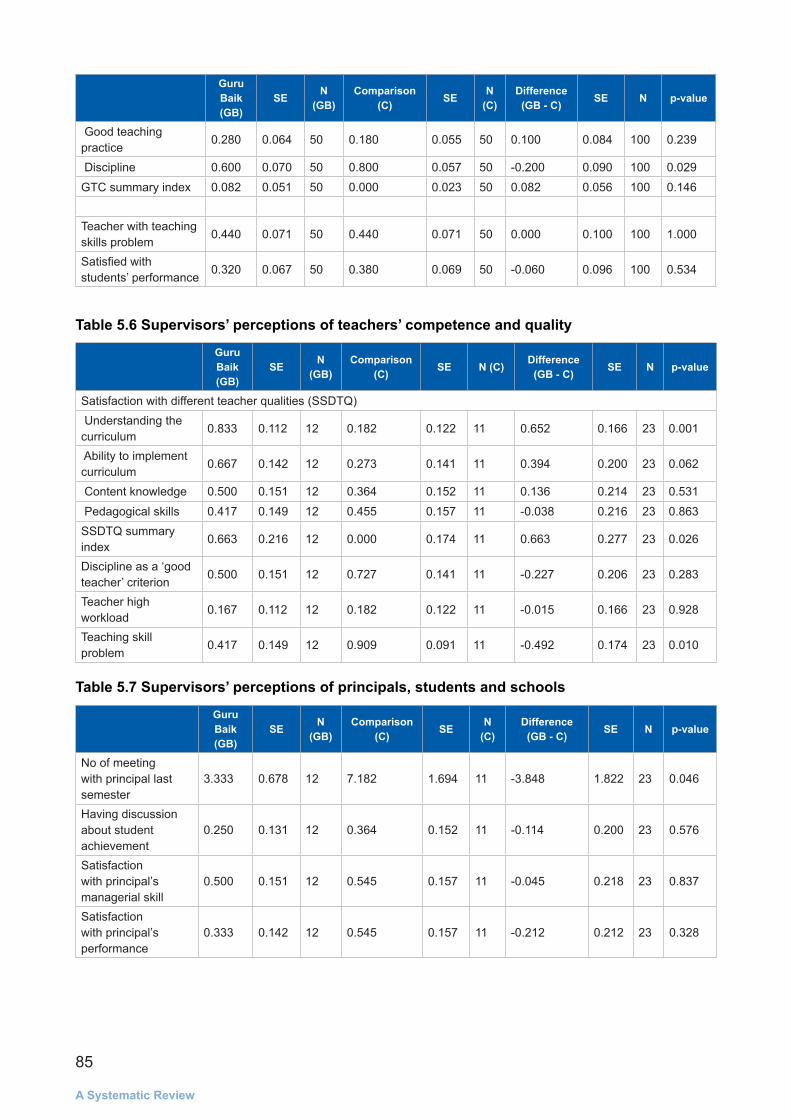
85
A Systematic Review
Guru Baik (GB)
SE N (GB)
Comparison (C) SE N
(C)Difference
(GB - C) SE N p-value
Good teaching practice
0.280 0.064 50 0.180 0.055 50 0.100 0.084 100 0.239
Discipline 0.600 0.070 50 0.800 0.057 50 -0.200 0.090 100 0.029
GTC summary index 0.082 0.051 50 0.000 0.023 50 0.082 0.056 100 0.146
Teacher with teaching skills problem
0.440 0.071 50 0.440 0.071 50 0.000 0.100 100 1.000
Satisfied with students’ performance
0.320 0.067 50 0.380 0.069 50 -0.060 0.096 100 0.534
Table 5.6 Supervisors’ perceptions of teachers’ competence and quality
Guru Baik (GB)
SE N (GB)
Comparison (C) SE N (C) Difference
(GB - C) SE N p-value
Satisfaction with different teacher qualities (SSDTQ) Understanding the curriculum
0.833 0.112 12 0.182 0.122 11 0.652 0.166 23 0.001
Ability to implement curriculum
0.667 0.142 12 0.273 0.141 11 0.394 0.200 23 0.062
Content knowledge 0.500 0.151 12 0.364 0.152 11 0.136 0.214 23 0.531
Pedagogical skills 0.417 0.149 12 0.455 0.157 11 -0.038 0.216 23 0.863SSDTQ summary index
0.663 0.216 12 0.000 0.174 11 0.663 0.277 23 0.026
Discipline as a ‘good teacher’ criterion
0.500 0.151 12 0.727 0.141 11 -0.227 0.206 23 0.283
Teacher high workload
0.167 0.112 12 0.182 0.122 11 -0.015 0.166 23 0.928
Teaching skill problem
0.417 0.149 12 0.909 0.091 11 -0.492 0.174 23 0.010
Table 5.7 Supervisors’ perceptions of principals, students and schools
Guru Baik (GB)
SE N (GB)
Comparison (C) SE N
(C)Difference
(GB - C) SE N p-value
No of meeting with principal last semester
3.333 0.678 12 7.182 1.694 11 -3.848 1.822 23 0.046
Having discussion about student achievement
0.250 0.131 12 0.364 0.152 11 -0.114 0.200 23 0.576
Satisfaction with principal’s managerial skill
0.500 0.151 12 0.545 0.157 11 -0.045 0.218 23 0.837
Satisfaction with principal’s performance
0.333 0.142 12 0.545 0.157 11 -0.212 0.212 23 0.328

86
Interventions, Practices and Contextual Factors Linked to Indonesian Students’ Literacy and Numeracy Outcomes:
Guru Baik (GB)
SE N (GB)
Comparison (C) SE N
(C)Difference
(GB - C) SE N p-value
Satisfaction with students’ achievement
0.167 0.112 12 0.545 0.157 11 -0.379 0.193 23 0.063
Student learning outcome as main school problem
0.167 0.112 12 0.182 0.122 11 -0.015 0.166 23 0.928
Source of school problem information
From discussion 0.250 0.131 12 0.636 0.152 11 -0.386 0.200 23 0.067
From observation 0.500 0.151 12 0.727 0.141 11 -0.227 0.206 23 0.283
From report 0.750 0.131 12 0.455 0.157 11 0.295 0.204 23 0.163
87
A Systematic Review
Appendix B: Calculating the score of the tests and rating scale4
The classic understanding of scores believes that the score obtained by students from a particular test consists of their actual ability (known as true score) and the error. Pertaining to this explanation, the frequency of someone getting a correct answer will not give us information on his or her ability (true score). Instead, it will just report how good this person is at responding to the particular items at that particular time. Item–response theory predicts someone’s ability or trait using the probability of this person get a correct answer on items with various levels of difficulties and discrimination power.5 There are several benefits that we can get from using this model:
• We take into account the difficulty level of every item and score how able the person is to solve that item accordingly.
• This model can predict a student’s probability of getting the correct answer in various characteristics of items by looking at the student’s response pattern to other items with the same trait or content domain. This shows that using the item–response theory, we can estimate the true score of the students that cannot be obtained from a classical test theory calculation.
Student learning assessments and innate ability
Items presented in student learning assessments and innate ability tools are dichotomous, meaning that there are only two types of responses for each item: correct (1) or incorrect (0). We predict the (student’s ability) from his or her response to dichotomous items using a two-parameter logistic model (2-PL). The first parameter is the item difficulty, and the second parameter is the item discrimination power.
Teachers’ test
In the teachers’ test, there are two characteristic items presented in the test booklet: dichotomous and polytomous items. For the polytomous items, fully correct items will be scored as 2, whereas partially correct items will get a partial score or 1. To combine the two different models in one set of questions, we used a combination of a graded response model for the dichotomous items and a partial credit model for the polytomous items. The parameter that we considered in this model is the difficulty level of the items. Meanwhile, this model can only calculate the discrimination power of the overall test, instead of the power of each item.
Teachers’ perceptions of support and growth mindsets
A rating scale model was used to obtain teachers’ latent perception of support and mindset . Using a rating-scale-IRT model, we can see the pattern of the sampled teachers’ responses. The items are presented on a four-point rating scale where 0 is ‘strongly disagree’, 1 is ‘disagree’, 2 is ‘agree’ and 3 is ‘strongly agree’. After running the rating scale IRT model and looking deeper into how different groups of teachers with different (perception or mindset), we found that the degree of agreement between ‘strongly disagree’ and ‘disagree’ were not different (see the figure below). To fit the rating
4 We selected the most appropriate item-response theory models for each test by referring to lecture materials prepared by Peter van Rijn, Educational Testing Service, 2016 and Hambleton and Jones (1993).5 The ability of the item to discriminate low ability and high ability students.
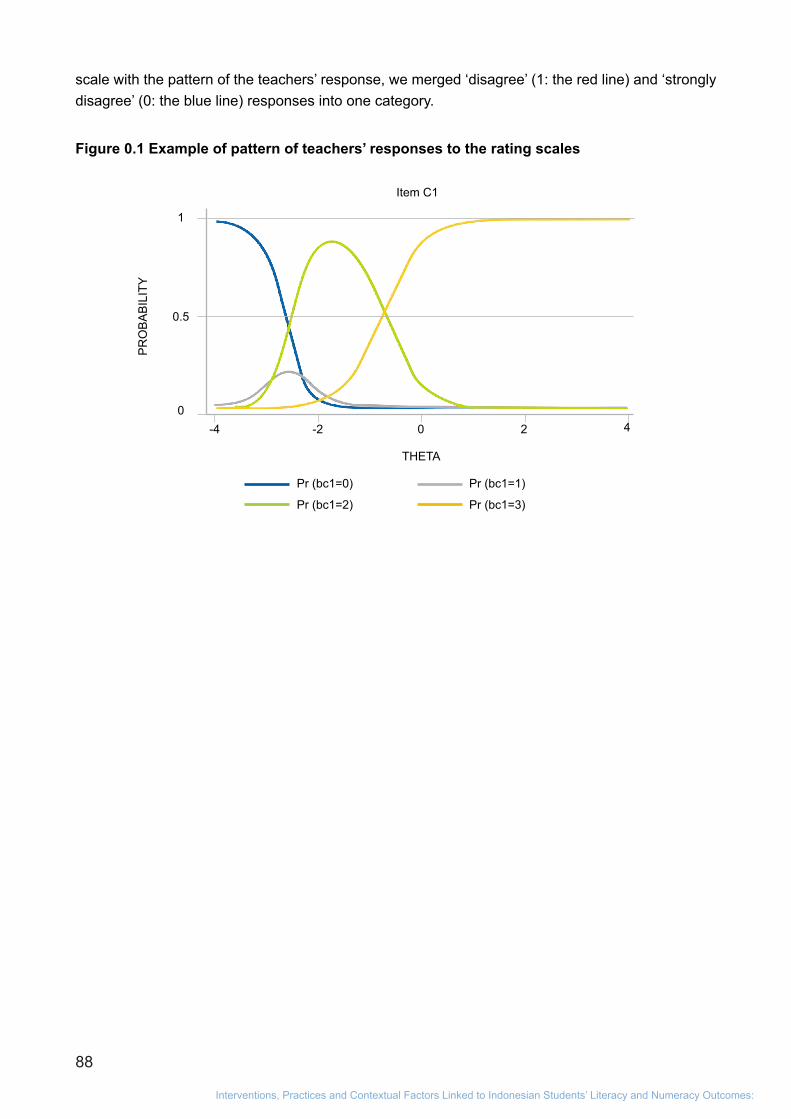
88
Interventions, Practices and Contextual Factors Linked to Indonesian Students’ Literacy and Numeracy Outcomes:
scale with the pattern of the teachers’ response, we merged ‘disagree’ (1: the red line) and ‘strongly disagree’ (0: the blue line) responses into one category.
Figure 0.1 Example of pattern of teachers’ responses to the rating scales
-4
Pr (bc1=0)
Pr (bc1=2)
Pr (bc1=1)
Pr (bc1=3)
0
0.5
1
0 4-2 2
THETA
Item C1
PR
OB
AB
ILIT
Y


Ratu Plaza Office Tower 19th Floor,Jl. Jend. Sudirman Kav 9, Jakarta Pusat, 10270IndonesiaTel : (+6221) 720 6616 ext. 304Fax : (+6221) 720 6616
www.facebook.com/InovasiPendidikanAIP