guidelines for the management of severe traumatic brain … · guidelines for the management of...
TRANSCRIPT

Guidelines for the Management of Severe Traumatic Brain Injury
4th Edition Nancy Carney, PhD Oregon Health & Science University, Portland, OR Annette M. Totten, PhD Oregon Health & Science University, Portland, OR Cindy O'Reilly, BS Oregon Health & Science University, Portland, OR Jamie S. Ullman, MD Hofstra North Shore-LIJ School of Medicine, Hempstead, NY Gregory W. J. Hawryluk, MD, PhD University of Utah, Salt Lake City, UT Michael J. Bell, MD University of Pittsburgh, Pittsburgh, PA Susan L. Bratton, MD University of Utah, Salt Lake City, UT Randall Chesnut, MD University of Washington, Seattle, WA Odette A. Harris, MD, MPH Stanford University, Stanford, CA Niranjan Kissoon, MD University of British Columbia, Vancouver, BC Andres M. Rubiano, MD El Bosque University, Bogota, Colombia; MEDITECH Foundation, Neiva, Colombia Lori Shutter, MD University of Pittsburgh, Pittsburgh, PA Robert C. Tasker, MBBS, MD Harvard Medical School & Boston Children’s Hospital, Boston, MA Monica S. Vavilala, MD University of Washington, Seattle, WA Jack Wilberger, MD Drexel University, Pittsburgh, PA David W. Wright, MD Emory University, Atlanta, GA Jamshid Ghajar, MD, PhD Stanford University, Stanford, CA
Reviewed for evidence-based integrity and endorsed by the American Association of
Neurological Surgeons and the Congress of Neurological Surgeons.
September 2016

2
TABLE OF CONTENTS
PREFACE ...................................................................................................................................... 5
ACKNOWLEDGEMENTS .............................................................................................................................................. 5 FUNDING SOURCE ...................................................................................................................................................... 6 DISCLAIMER OF LIABILITY ........................................................................................................................................ 6 CONFLICT OF INTEREST DISCLOSURE ........................................................................................................................ 7 AUTHORS’ PREFACE .................................................................................................................................................. 7
INTRODUCTION......................................................................................................................... 8
BRAIN TRAUMA RESEARCH: CURRENT CONDITIONS ................................................................................................. 8 THE BRAIN TRAUMA FOUNDATION’S POSITION ........................................................................................................ 9 THE BRAIN TRAUMA EVIDENCE-BASED CONSORTIUM ............................................................................................ 12
METHODS .................................................................................................................................. 14
SYSTEMATIC EVIDENCE REVIEW AND SYNTHESIS ................................................................................................... 14 DEVELOPMENT OF RECOMMENDATIONS .................................................................................................................. 22
EVIDENCE SYNTHESIS AND RECOMMENDATIONS, PART I: TREATMENTS ....... 25
1. DECOMPRESSIVE CRANIECTOMY ................................................................................................................... 26 2. PROPHYLACTIC HYPOTHERMIA ...................................................................................................................... 36 3. HYPEROSMOLAR THERAPY ............................................................................................................................ 49 4. CEREBROSPINAL FLUID DRAINAGE ................................................................................................................ 57 5. VENTILATION THERAPIES .............................................................................................................................. 62 6. ANESTHETICS, ANALGESICS, AND SEDATIVES ............................................................................................... 67 7. STEROIDS ....................................................................................................................................................... 76 8. NUTRITION ..................................................................................................................................................... 84 9. INFECTION PROPHYLAXIS............................................................................................................................... 99 10. DEEP VEIN THROMBOSIS PROPHYLAXIS ...................................................................................................... 111 11. SEIZURE PROPHYLAXIS ................................................................................................................................ 120
EVIDENCE SYNTHESIS AND RECOMMENDATIONS, PART II: MONITORING ... 130
12. INTRACRANIAL PRESSURE MONITORING ...................................................................................................... 132 13. CEREBRAL PERFUSION PRESSURE MONITORING .......................................................................................... 145 14. ADVANCED CEREBRAL MONITORING .......................................................................................................... 151
EVIDENCE SYNTHESIS AND RECOMMENDATIONS, PART III: THRESHOLDS .. 163
15. BLOOD PRESSURE THRESHOLDS .................................................................................................................. 164 16. INTRACRANIAL PRESSURE THRESHOLDS ...................................................................................................... 172 17. CEREBRAL PERFUSION PRESSURE THRESHOLDS .......................................................................................... 181 18. ADVANCED CEREBRAL MONITORING THRESHOLDS..................................................................................... 191
FUTURE RESEARCH ............................................................................................................. 201
TOPIC SELECTION AND REFINEMENT ..................................................................................................................... 201 METHODS—INDIVIDUAL STUDIES ......................................................................................................................... 202 METHODS—SYSTEMATIC REVIEWS AND GUIDELINES DEVELOPMENT .................................................................. 203
CONCLUSION ......................................................................................................................... 205

3
TABLES TABLE 1-1. QUALITY OF THE BODY OF EVIDENCE (DEPRESSIVE CRANIECTOMY) ................................................... 28 TABLE 1-2. SUMMARY OF EVIDENCE – CLASS 1 AND 2 STUDIES (DEPRESSIVE CRANIECTOMY) .............................. 29 TABLE 1-3. SUMMARY OF EVIDENCE – CLASS 3 STUDIES (DEPRESSIVE CRANIECTOMY) ........................................ 31 TABLE 2-1. QUALITY OF THE BODY OF EVIDENCE (PROPHYLACTIC HYPOTHERMIA) .............................................. 37 TABLE 2-2. SUMMARY OF EVIDENCE – CLASS 1 AND 2 STUDIES (PROPHYLACTIC HYPOTHERMIA) ......................... 39 TABLE 2-3. SUMMARY OF EVIDENCE–CLASS 3 STUDIES (PROPHYLACTIC HYPOTHERMIA) ..................................... 44 TABLE 3-1. QUALITY OF THE BODY OF EVIDENCE (HYPEROSMOLAR THERAPY) ..................................................... 51 TABLE 3-2. SUMMARY OF EVIDENCE - CLASS 2 (HYPEROSMOLAR THERAPY) ......................................................... 52 TABLE 3-3. SUMMARY OF EVIDENCE–CLASS 3 STUDIES (HYPEROSMOLAR THERAPY) ........................................... 54 TABLE 4-1. QUALITY OF THE BODY OF EVIDENCE (CEREBROSPINAL FLUID DRAINAGE)......................................... 58 TABLE 4-2. SUMMARY OF EVIDENCE – CLASS 3 STUDIES (CEREBROSPINAL FLUID DRAINAGE) ............................. 59 TABLE 5-1. QUALITY OF THE BODY OF EVIDENCE (VENTILATION THERAPIES) ....................................................... 64 TABLE 5-2. SUMMARY OF EVIDENCE (VENTILATION THERAPIES) ........................................................................... 65 TABLE 6-1. QUALITY OF THE BODY OF EVIDENCE (ANESTHETICS, ANALGESICS, AND SEDATIVES) ........................ 69 TABLE 6-2. SUMMARY OF EVIDENCE: CLASS 2 STUDIES (ANESTHETICS, ANALGESICS, AND SEDATIVES) ............... 70 TABLE 6-3. SUMMARY OF EVIDENCE: CLASS 3 STUDIES (ANESTHETICS, ANALGESICS, AND SEDATIVES) ............... 72 TABLE 7-1. QUALITY OF THE BODY OF EVIDENCE (STEROIDS) ................................................................................ 77 TABLE 7-2. SUMMARY OF EVIDENCE: CLASS 1 AND 2 STUDIES (STEROIDS) ............................................................ 78 TABLE 7-3. SUMMARY OF EVIDENCE: CLASS 3 STUDIES (STEROIDS) ...................................................................... 81 TABLE 8-1. QUALITY OF THE BODY OF EVIDENCE (NUTRITION) ............................................................................. 86 TABLE 8-2. SUMMARY OF EVIDENCE: CLASS 2 STUDIES (NUTRITION) .................................................................... 87 TABLE 8-3. SUMMARY OF EVIDENCE: CLASS 3 STUDIES (NUTRITION) .................................................................... 91 TABLE 9-1. QUALITY OF THE BODY OF EVIDENCE (INFECTION PROPHYLAXIS) ..................................................... 101 TABLE 9-2. SUMMARY OF EVIDENCE: CLASS 2 STUDIES AND META-ANALYSES (INFECTION PROPHYLAXIS) ....... 103 TABLE 9-3. SUMMARY OF EVIDENCE: CLASS 3 STUDIES (INFECTION PROPHYLAXIS) ............................................ 107 TABLE 10-1. QUALITY OF BODY OF EVIDENCE (DEEP VEIN THROMBOSIS PROPHYLAXIS) .................................... 113 TABLE 10-2. SUMMARY OF EVIDENCE – CLASS 3 STUDIES (DEEP VEIN THROMBOSIS PROPHYLAXIS) .................. 114 TABLE 11-1. QUALITY OF BODY OF EVIDENCE (SEIZURE PROPHYLAXIS) .............................................................. 122 TABLE 11-2. SUMMARY OF EVIDENCE – CLASS 2 STUDIES (SEIZURE PROPHYLAXIS) ............................................ 123 TABLE 11-3. SUMMARY OF EVIDENCE – CLASS 3 STUDIES (SEIZURE PROPHYLAXIS) ............................................ 126 TABLE 12-1. QUALITY OF THE BODY OF EVIDENCE (INTRACRANIAL PRESSURE MONITORING) ............................ 134 TABLE 12-2. SUMMARY OF EVIDENCE: CLASS 1 AND 2 STUDIES (INTRACRANIAL PRESSURE MONITORING) ......... 135 TABLE 12-3. SUMMARY OF EVIDENCE – CLASS 3 STUDIES (INTRACRANIAL PRESSURE MONITORING) ................. 140 TABLE 13-1. QUALITY OF THE BODY OF EVIDENCE (CEREBRAL PERFUSION PRESSURE MONITORING) ................. 146 TABLE 13-2. SUMMARY OF EVIDENCE – CLASS 2 STUDY (CEREBRAL PERFUSION PRESSURE MONITORING) ........ 147 TABLE 13-3. SUMMARY OF EVIDENCE – CLASS 3 STUDIES (CEREBRAL PERFUSION PRESSURE MONITORING) ...... 148 TABLE 14-1. QUALITY OF THE BODY OF EVIDENCE (ADVANCED CEREBRAL MONITORING) ................................. 153 TABLE 14-2. SUMMARY OF EVIDENCE: CLASS 2 STUDY (ADVANCED CEREBRAL MONITORING) .......................... 154 TABLE 14-3. SUMMARY OF EVIDENCE – CLASS 3 STUDIES (ADVANCED CEREBRAL MONITORING) ...................... 155 TABLE 15-1. QUALITY OF THE BODY OF EVIDENCE (BLOOD PRESSURE THRESHOLDS) ......................................... 165 TABLE 15-2. SUMMARY OF EVIDENCE – CLASS 2 STUDY (BLOOD PRESSURE THRESHOLDS) ................................ 166 TABLE 15-3. SUMMARY OF EVIDENCE – CLASS 3 STUDIES (BLOOD PRESSURE THRESHOLDS) .............................. 167 TABLE 16-1. QUALITY OF THE BODY OF EVIDENCE (INTRACRANIAL PRESSURE THRESHOLDS) ............................ 174 TABLE 16-2. SUMMARY OF EVIDENCE – CLASS 2 STUDY (INTRACRANIAL PRESSURE THRESHOLDS) .................... 175 TABLE 16-3. SUMMARY OF EVIDENCE – CLASS 3 STUDIES (INTRACRANIAL PRESSURE THRESHOLDS) ................. 176 TABLE 17-1. QUALITY OF THE BODY OF EVIDENCE (CEREBRAL PERFUSION PRESSURE THRESHOLDS) ................. 183 TABLE 17-2. SUMMARY OF EVIDENCE – CLASS 2 STUDIES (CEREBRAL PERFUSION PRESSURE THRESHOLDS) ...... 184 TABLE 17-3. SUMMARY OF EVIDENCE – CLASS 3 STUDIES (CEREBRAL PERFUSION PRESSURE THRESHOLDS) ...... 185 TABLE 18-1. QUALITY OF THE BODY OF EVIDENCE (ADVANCED CEREBRAL MONITORING THRESHOLDS) ........... 192 TABLE 18-2. SUMMARY OF EVIDENCE: CLASS 2 STUDIES (ADVANCED CEREBRAL MONITORING THRESHOLDS) .. 194 TABLE 18-3: SUMMARY OF EVIDENCE: CLASS 3 STUDIES (ADVANCED CEREBRAL MONITORING THRESHOLDS) .. 195
4
APPENDICES APPENDIX A. MAJOR CHANGES FROM 3RD TO 4TH EDITION ...................................................................................... 207
APPENDIX B. RESEARCH TEAM .................................................................................................................................. 210
APPENDIX C. ANALYTIC FRAMEWORKS ..................................................................................................................... 211
APPENDIX D. SEARCH STRATEGIES ............................................................................................................................ 215
APPENDIX E. INCLUSION AND EXCLUSION CRITERIA ................................................................................................. 223
APPENDIX F. EXCLUDED STUDIES .............................................................................................................................. 225
APPENDIX G. CRITERIA FOR QUALITY ASSESSMENT OF INDIVIDUAL STUDIES ........................................................... 240
APPENDIX H. QUALITY OF THE BODY OF EVIDENCE ASSESSMENT ............................................................................. 242
APPENDIX I. HYPOTHERMIA INTERVENTIONS DETAIL ................................................................................................ 244

5
Preface
Acknowledgements
We would like to thank the following people at the Pacific Northwest Evidence-based
Practice Center at Oregon Health & Science University for their invaluable assistance in
producing this document: Molly Stillwell, MA, Ngoc Wasson, MPH, Sandra Assasnik, MA,
Elaine Graham, MLS, Leah Williams, BS, and Roger Chou, MD; we also thank Stephanie A.
Kolakowsky-Hayner, PhD, and Meredith Klein, MS, from the Brain Trauma Foundation for their
review of the document.
Additionally, we would like to thank the following people for serving as peer reviewers and
providing their insights, comments, and suggestions:
Mary Kay Bader, RN, Neuroscience Nurse’s Association; Mission Hospital, Mission Viejo, CA
Ross Bullock, MD, PhD, Medical Advisory Board, Brain Trauma Foundation; University of
Miami, Miami, FL
Jamie Cooper, MD, Australian and New Zealand Intensive Care Research Centre, Monash
University, Melbourne, Victoria, Australia
Chris Cribari, MD, American College of Surgeons Committee on Trauma; University of
Colorado, Boulder, CO
Rachel Groman, MPH, Quality Improvement and Research, American Association of
Neurological Surgeons/Congress of Neurological Surgeons, Washington, DC
Karen Hirsch, MD, Neurology, Stanford School of Medicine, Palo Alto, CA
Stephan Mayer, MD, Neurocritical Care Society; Mount Sinai, New York, NY
Enrique Noé, MD, PhD, Neurology, Hospital NISA, Valecnia al Mar and Sevilla-Aljarafe, Spain
Gustavo Petroni, MD, Hospital de Emergencias Dr. Clemente Alvarez, Rosario, Santa Fe,
Argentina
P.B. Raksin, MD, Neurosurgery, John H. Stroger Jr. Hospital of Cook County, Chicago, IL,
Gerard Ribbers, MD, PhD, Rehabilitation Medicine, Erasmus University of Rotterdam,
Rotterdam, Netherlands

6
Alex Valadka, MD, American Association of Neurological Surgeons; National Trauma Institute;
Seton Brain and Spine Institute, Austin, TX (presently at Virginia Commonwealth University,
Richmond, VA)
Finally, we would like to recognize the American Association of Neurological Surgeons
(AANS) and the Congress of Neurological Surgeons (CNS) Joint Guidelines Committee (JGC)
for providing feedback on the Guidelines for the Management of Severe Traumatic Brain Injury,
4th Edition, and the AANS and CNS leadership for their endorsement, which appears on the title
page.
Funding Source
This material is based in part upon work supported by (1) the U.S. Army Contracting
Command, Aberdeen Proving Ground, Natick Contracting Division, through a contract awarded
to Stanford University (W911 QY-14-C-0086), a subcontract awarded to the Brain Trauma
Foundation, and a second-tier subcontract awarded to Oregon Health & Science University and
(2) the Brain Trauma Foundation, through a contract awarded to Oregon Health & Science
University.
Any opinions, findings and conclusions or recommendations expressed in this material are
those of the authors and do not necessarily reflect the views of the U.S. Army Contracting
Command, Aberdeen Proving Ground, Natick Contracting Division, Stanford University, or the
Brain Trauma Foundation.
Disclaimer of Liability
The information contained in the Guidelines for the Management of Severe Traumatic Brain
Injury reflects the current state of knowledge at the time of publication. The Brain Trauma
Foundation, American Association of Neurological Surgeons, Congress of Neurological
Surgeons, and other collaborating organizations are not engaged in rendering professional
medical services and assume no responsibility for patient outcomes resulting from application of
these general recommendations in specific patient circumstances. Accordingly, the Brain Trauma
Foundation, American Association of Neurological Surgeons, and Congress of Neurological
Surgeons consider adherence to these clinical practice guidelines will not necessarily assure a
7
successful medical outcome. The information contained in these guidelines reflects published
scientific evidence at the time of completion of the guidelines and cannot anticipate subsequent
findings and/or additional evidence, and therefore should not be considered inclusive of all
proper procedures and tests or exclusive of other procedures and tests that are reasonably
directed to obtaining the same result. Medical advice and decisions are appropriately made only
by a competent and licensed physician who must make decisions in light of all the facts and
circumstances in each individual and particular case and on the basis of availability of resources
and expertise. Guidelines are not intended to supplant physician judgment with respect to
particular patients or special clinical situations and are not a substitute for physician-patient
consultation. Accordingly, the Brain Trauma Foundation, American Association of Neurological
Surgeons, and Congress of Neurological Surgeons consider adherence to these guidelines to be
voluntary, with the ultimate determination regarding their application to be made by the
physician in light of each patient’s individual circumstances.
Conflict of Interest Disclosure
There are no conflicts of interest. The authors have no personal, financial, or institutional
interest in any of the drugs, materials, or devices described in this publication.
Authors’ Preface
The scope and purpose of this work is two-fold: to synthesize the available evidence and to
translate it into recommendations. This document provides recommendations only when there is
evidence to support them. As such, they do not constitute a complete protocol for clinical use.
Our intention is that these recommendations be used by others to develop treatment protocols,
which necessarily need to incorporate consensus and clinical judgment in areas where current
evidence is lacking or insufficient. We believe it is important to have evidence-based
recommendations in order to clarify what aspects of practice currently can and cannot be
supported by evidence, to encourage use of evidence-based treatments that exist, and to
encourage creativity in treatment and research in areas where evidence does not exist. The
communities of neurosurgery and neuro-intensive care have been early pioneers and supporters
of evidence-based medicine and plan to continue in this endeavor.
8
Guidelines for the Management of Severe Traumatic Brain Injury
Introduction In this 4th Edition of the Brain Trauma Foundation’s guidelines, there are 189 publications
used for evidence—5 Class 1, 46 Class 2, 136 Class 3 studies, and 2 meta-analyses. Over the
past 20 years, our community has evolved along with the science and application of evidence-
based medicine in general. As a consequence, with each new iteration of the guidelines, we have
applied the most current methodological standards and established more rigorous procedures for
future work. This approach resulted in changes in the evaluation of previous work, an increase in
the quality of the included studies, and essential improvements in the precision of the
recommendations.
The size of the literature base is a reflection of the rate at which new studies are being
conducted that can be used as evidence for guideline recommendations. During the 7 years
between the 3rd1 and 4th Editions of this work, 94 new studies were added to the library of
evidence. Although there have been numerous new publications, many of them repeat the same
methodological flaws found in previous research. The following is an examination of the current
condition of brain trauma clinical research, our view of how this condition is defining and
shaping our future, and a proposed solution in establishing a formal evidence-based consortium.
Brain Trauma Research: Current Conditions
Clinical Trials in TBI. Failure to establish intervention effectiveness for brain trauma in
clinical trials is a primary feature of the current condition of our work. Fourteen years ago, the
Clinical Trials in Head Injury Study Group published a thoughtful summary of recommendations
to improve the design and conduct of clinical trials in TBI.2 They encouraged (in part):
• Identification and testing of specific (appropriate) subgroups of TBI patients
• Standardized clinical management across centers
• Independent monitoring of patient management and data quality
9
• Parsimonious data collection
• Identification of relevant outcome measures and adequate time to follow-up
• Identification of clinically relevant effect size
A useful exercise might be to examine the extent to which our community is adhering to
these recommendations, and to fundamental tenets of evidence-based medicine, in the design and
conduct of our current work.
New Research Approaches. It is reasonable to consider how different research designs
might be used to identify which treatments work best, for whom, and under what circumstances.
This is the possibility of Comparative Effective Research (CER), which is being promoted by
funding agencies and adopted by large consortium efforts in the brain trauma research
community. However, at the operational level, CER is still subject to many of the same
vulnerabilities as traditional research, because it is accomplished using randomized controlled
trials (RCTs) and observational studies. A transition to a new focus on CER must be
accompanied by consistent adherence to evidence-based protocols.
Collaborations. There is a need for investigators to work together, share data, and pool
resources in order to improve our efficiency at finding answers. Currently, funding agencies are
requiring collaborative efforts among their grantees as a prerequisite to funding. In our efforts to
successfully collaborate, we need to account for institutional barriers to financial collaborations,
and for barriers in the mechanics of collaborations. Pooling data into large repositories requires
resources, time, and cooperation across investigators, institutions, and disciplines that often
exceed the scope of the project. Building the platform for the repository becomes the deliverable,
rather than using the platform to enable answering the questions.
The Brain Trauma Foundation’s Position
The Role of the Brain Trauma Foundation. The Brain Trauma Foundation is a service
organization dedicated to improving outcomes from TBI. Our core—our DNA—is evidence-
based guidelines. Our job is to:
• Identify topics requiring evidence-based analysis that are relevant and specific to
populations and subgroups of TBI patients
10
• Access, systematically review, assess, and synthesize the literature
• Make recommendations based on this evidence
• Identify information gaps and priorities for future research
• Promote a new generation of high-quality studies that can contribute to the evidence base
Specialty societies, health care delivery systems, and clinicians that treat TBI patients
generate demand for complete treatment protocols. The mandate is to give clinicians what they
need to be able to make decisions in practice. Development of rigorous and comprehensive
evidence-based protocols is essential to the appropriate utilization of guidelines. Such protocols
merge evidence, consensus, and standards for general good practice in clinical care. The Brain
Trauma Foundation’s role is to provide the evidence and related recommendations; currently,
delineating specific, comprehensive protocols is beyond the scope of these guidelines.
The Scope of the Guidelines. The guidelines address treatment interventions, monitoring,
and treatment thresholds that are particular to TBI or that address a risk that is higher in TBI
patients. The scope of the guidelines is not intended to cover all topics relevant to the care of
patients with severe TBI. Topics related to general good care for all patients, or all trauma
patients, are not included. In the future, new topics will be added only if they are TBI-specific.
Topics included in prior editions that cover general medical care needs by many patients, such as
infection and deep vein thrombosis prophylaxis, have been narrowed to focus on TBI-specific
risks or issues. As stated, the recommendations are limited to those areas for which an evidence
base was identified. Developing protocols that incorporate general best practices for trauma
patients (not TBI-specific) and that provide guidance, suggestions, or options in areas of TBI
management where the evidence is insufficient is outside the scope of this endeavor.
The Future of the Guidelines. We are committed to improving the quality of the guidelines
and the efficiency of their delivery into the community. The following outlines the major
changes we initiated with this update. More detail is provided in the Methods section.
1. Evaluation of the Evidence. We added a summary table of the quality of the body of
evidence and a discussion of applicability to each topic. This provides more transparency
than prior editions about the steps necessary to develop recommendations from a

11
synthesis of individual studies. In this edition of the guidelines, whether the available
evidence was sufficient to merit a recommendation required:
a. An assessment of the quality of the individual studies
b. Consideration of the applicability of the individual studies
c. A synthesis across the studies into an assessment of the quality of the “body of
evidence”
In the quality of the body of evidence tables, we indicated how many studies were
included and how many patients were in those studies; we summarized the quality
across the individual studies, the directness of the included evidence, and the precision
of the estimates of results; and we indicated the level of consistency across studies.
Additionally, in accompanying text we described characteristics that could impact the
applicability of individual studies and how they influence the recommendations.
2. Criteria for Determining Level of Recommendation. Another change is that the level of a
recommendation is constrained, but not wholly determined, by the class of the included
studies. While in past guidelines editions, Class 1 evidence corresponded to a Level I
recommendation, in this edition we focused on the quality of the body of evidence, and
we took into consideration applicability, in deciding whether a recommendation was
warranted, and then what level it should be. Given this approach, a single Class 1 study
would be included in the evidence synthesis, and it could contribute to a Level 1
recommendation; however, it may only contribute to a Level 2 recommendation, or no
recommendation, if the quality of the body of evidence was moderate or if there are
concerns about limited applicability. Once a recommendation was deemed to be
appropriate, the quality of the body of evidence, combined with the class of the studies,
determined the recommendation level. This is described in more detail in the Methods
section.
3. The Living Guidelines. This 4th Edition of the guidelines is transitional. We do not
intend to produce a 5th Edition. Rather, we are moving to a model of continuous
monitoring of the literature, rapid updates to the evidence review, and revisions to the
Recommendations as the evidence warrants. We call this the Living Guidelines model.
This is driven by several trends, including advances in technology, the increasing volume

12
of available information, and the corresponding changes in expectations among clinicians
and other stakeholders. A static document that is updated after several years no longer
responds to the demands of the community we serve.
More details on the changes within each topic from the 3rd to the 4th Edition are in
Appendix A.
The Brain Trauma Evidence-Based Consortium
The Brain Trauma Foundation recognizes that our responsibility extends beyond gathering,
assimilating, and reporting the existing evidence. We also have a responsibility to actively
promote the generation of new, strong evidence that addresses critical questions identified in our
guidelines documents. To that end, we created the Brain Trauma Evidence-Based Consortium
(B-TEC), which is currently supported by the U.S. Army Contracting Command, Aberdeen
Proving Ground, Natick Contracting Division, under Contract No. W911QY-14-C-0086. This is
a multi-center program with a contract to Stanford University in collaboration with the Brain
Trauma Foundation, and with subcontracts to Oregon Health & Science University, Portland
State University, and other institutions. The key core functions are:
• Priority Research Topics. In this function, we bring evidence-based methods to pre-
specified priority research topics. Current topics include:
o Evidence-based guidelines for concussion
o Secondary analysis of existing datasets
o Development of a clinically useful classification system for TBI, using dynamic, non-
linear modeling.
• Living Guidelines. The model of continuous literature review and rapid recommendations
updates will be applied to the Brain Trauma Foundation’s compendium of evidence-
based guidelines, including Prehospital Management, Hospital Management, Pediatric
TBI, and Prognosis.
• Evidence-Based Clinical Research Coordinating and Training Center (CTC). The CTC of
B-TEC will provide an infrastructure for conducting clinical trials that will include
specific research project coordination, investigator training and education, data
management, and data analytics.

13
REFERENCES
1. Brain Trauma Foundation, American Association of Neurological Surgeons, Congress of Neurological Surgeons, Joint Section on Neurotrauma Critical Care--AANS CNS, Bratton SL, Chestnut RM, Ghajar J, McConnell Hammond FF, Harris OA, Hartl R, Manley GT, Nemecek A, Newell DW, Rosenthal G, Schouten J, Shutter L, Timmons SD, Ullman JS, Videtta W, Wilberger J E, Wright DW. Guidelines for the management of severe traumatic brain injury. J Neurotrauma. 2007;24 Suppl 1:S1-106. PMID: 17511554.
2. Narayan RK, Michel ME, Ansell B, et al. Clinical trials in head injury. J Neurotrauma. May 2002;19(5):503-557. PMID: 12042091.

14
Methods
The development of guidelines encompasses two major activities: first, a systematic review
and synthesis of evidence, and second, the derivation of recommendations. These guidelines do
not include earlier steps such as the development of a research agenda or primary research on
specific questions. Nor do they include the subsequent steps of translating recommendations into
comprehensive protocols or algorithms that clinicians can use to guide all steps of treatment or
develop quality measures that can be used to monitor care. A comprehensive protocol must
integrate aspects of good critical care in general with the care that is specific to traumatic brain
injury (TBI). These later steps may be done at the local level by hospitals or nationally by
professional associations or other organizations interested in improving TBI care. The goals of
these guidelines are to identify key questions, review the literature for evidence, assess and
assimilate the evidence, derive recommendations, identify research gaps, and deliver the
information to the brain trauma community for integration into its various activities and
environments.
In the following sections, we describe the methods for the Systematic Evidence Review and
Synthesis, followed by the methods for the Development of the Recommendations. Subgroups of
the Research Team included the Methods Team and the Clinical Investigators (see Appendix B).
Systematic Evidence Review and Synthesis
We describe below our approach to the scope of the review (topic refinement, topics included
in this edition, major changes for this edition, and analytic frameworks) and study selection and
compilation of evidence (literature search strategies, abstract and full-text review, use of indirect
evidence, use of intermediate outcomes, quality assessment of individual studies, data
abstraction, synthesis, identification of subtopics and synthesis, quality of the body of evidence,
and applicability).
Scope of the Review
Topic Refinement
Topics for inclusion in this edition were primarily carried forward from the 3rd Edition. Two
topics were added (Decompressive Craniectomy and Cerebrospinal Fluid Drainage), and the
15
questions within topics were revised based on input from the Clinical Investigators. Topics
related to good clinical care that are not TBI-specific were excluded. For example, general
procedures for reducing hospital-acquired infections are not included. However, measures
designed to prevent ventilator-associated pneumonia (VAP) are included based on data
suggesting the rate of VAP is higher for TBI patients than for other critical care patients.
Topics Included in This Edition
The topics are organized in three categories that are specific to severe TBI in adults:
treatments, monitoring, and thresholds.
Treatments
1. Decompressive Craniectomy
2. Prophylactic Hypothermia
3. Hyperosmolar Therapy
4. Cerebrospinal Fluid Drainage
5. Ventilation Therapies
6. Anesthetics, Analgesics, and Sedatives
7. Steroids
8. Nutrition
9. Infection Prophylaxis
10. Deep Vein Thrombosis Prophylaxis
11. Seizure Prophylaxis
Monitoring
12. Intracranial Pressure
13. Cerebral Perfusion Pressure
14. Advanced Cerebral Monitoring
Thresholds
15. Blood Pressure
16. Intracranial Pressure
17. Cerebral Perfusion Pressure
18. Advanced Cerebral Monitoring

16
Major Changes for This Edition
Major changes for this edition are summarized here, and details are presented in Appendix A.
• Cerebral Fluid Drainage. New topic.
• Decompressive Craniectomy. New topic.
• Deep Vein Thrombosis. For risks that are traumatic brain injury-specific, direct evidence
was not identified. Indirect evidence was identified and included.
• Intracranial Pressure Technology. Technology assessment is outside the scope of
management guidelines and no longer included.
• Hyperventiliation. Renamed Ventilation Therapies.
• Brain Oxygen Monitoring. Renamed Advanced Cerebral Monitoring.
• Infection Prophylaxis. Focus on Ventilator Associated Pneumonia and External
Ventricular Drain infections. Indirect evidence was identified and used.
• Intracranial Pressure Monitoring, Cerebral Perfusion Pressure Monitoring, Advanced
Cerebral Monitoring. Divided into (a) benefits and risks of monitoring (Monitoring) and
(b) values to be targeted or avoided (Thresholds).
Analytic Frameworks
Analytic frameworks are tools developed to help guide systematic reviews. They show the
relationships between the variables specific to each key question within each topic. They identify
the relevant populations, interventions, intermediate outcomes, harms, clinical outcomes, and
other factors, and they help clarify what is and is not outside the scope of the review. Three
analytic frameworks were developed, one each for Treatments, Monitoring, and Thresholds (see
Appendix C). These were used by the Methods Team and the Clinical Investigators to establish
the scope of the literature search and to clarify the distinction between studies of treatments,
monitoring, and thresholds.
Study Selection and Compilation of Evidence
Literature Search Strategies
The research librarian from the 3rd Edition reviewed the search strategies for that edition,
updated them as needed, and executed the searches for this 4th Edition. For all topics continued
from the 3rd Edition, Ovid/MEDLINE was searched from 2006 through July 2013, and an
17
update was performed to include articles published and indexed by the third week of November
2013. For Cerebrospinal Fluid Drainage, the search included literature from 1980 through
November 2013. Decompressive Craniectomy had previously been included in the surgical
guidelines, so the search was conducted as an update from 2001 through November 2013.
Relevant studies referred to us that were published after the November 2013 update were also
included. The search strategies are in Appendix D.
Abstract and Full-Text Review
Studies were reviewed in a two-step process. The titles and abstracts were reviewed
independently by two members of the Methods Team. Articles were retained for full-text review
if at least one person considered them relevant based on the abstract. Two Methods Team
members read each full-text article and determined whether it met the inclusion criteria (see
Appendix E). The included and excluded full-text articles for each topic were also reviewed by
one or more Clinical Investigators who took the lead on each topic, and full-text articles were
available for review by all authors. The key criteria for inclusion were: the study population was
adult patients with severe TBI (defined as Glasgow Coma Scale [GCS] Score of 3 to 8), and the
study assessed an included outcome. Differences were resolved via consensus or by a third
reviewer. A list of studies excluded after full-text review is in Appendix F.
Use of Indirect Evidence
Evidence can be defined as indirect when (1) head-to-head comparisons of treatments are not
made (e.g., A is compared with placebo and B is compared with placebo but A is not compared
with B) or (2) the evidence comes from studies with differences from the pre-specified inclusion
criteria, but may be useful in deriving conclusions (e.g., evidence from a study that includes
mixed severities or mixed pathologies).1 This second type of indirect evidence was used in a
limited way in these guidelines.
When direct evidence was available, indirect evidence was not used. For most topics, direct
evidence was available. However, for some topics in TBI management, no direct evidence was
found. In these situations we searched for indirect evidence.
When indirect evidence was considered, we required the same interventions, outcomes, and
comparators, but relaxed the criteria related to the population. We considered studies that

18
included patients with moderate as well as severe TBI, mixed ages, or mixed pathologies using
the following criteria:
1. How relevant to (or different from) our target population is the population in the indirect
study?
2. To what extent does the relevant physiology of the population in the indirect study
approximate the relevant physiology of the population of interest?
3. To what extent are differences in physiology expected to influence the outcome?
4. In what direction would these differences influence the observed effect?
When indirect evidence was included, it is noted in the table describing the quality of the
body of evidence.
Use of Intermediate Outcomes
Direct health outcomes, specifically mortality and neurologic function, are always the
priority for our recommendation development. If there were no data about direct health outcomes
for a particular topic, we considered use of intermediate outcomes if there was evidence to
suggest an association between improvement in intermediate outcomes and improvement in
direct health outcomes. In this edition, we explicitly indicated when an intermediate outcome
was the target of a recommendation, and in some cases we qualified the recommendation by
stating the treatment was indicated when the overall benefit was felt to outweigh the
complications associated with such treatment. We specified when we included indirect evidence
and intermediate outcomes in the assessment of the quality of the body of evidence. (See Quality
of the Body of Evidence tables in each topic section.)
Quality Assessment of Individual Studies
All included studies were assessed for potential for bias, which is an approach to assessing
the internal validity or quality of the study. This assessment is a core component of systematic
review methods. It is an approach to considering and rating studies in terms of how the study
design and conduct addressed issues such as selection bias, confounding, and attrition. The
criteria used in the 3rd Edition were maintained and applied to the newly identified studies of
monitoring and treatments. The criteria for threshold studies were revised to be specific to the

19
structure of studies of thresholds. (See Appendix G for a complete list of the quality criteria used
for individual studies.)
Two reviewers independently evaluated each study using the criteria appropriate for the
study design (i.e., RCTs, observational studies, studies of thresholds) and rated the study as Class
1, 2, or 3 evidence based on the combination of study design and quality rating. Class 1 is the
highest class and is limited to good-quality randomized trials. Class 2 includes moderate-quality
RCTs and good-quality cohort or case-control studies. Class 3 is the lowest class and is given to
low-quality RCTs, moderate- to low-quality cohort or case control studies, and case series and
other non-comparative designs. Differences in ratings were then reconciled via consensus or the
inclusion of a third reviewer as needed.
Data Abstraction
Data were abstracted from studies by a member of the Methods Team and checked for errors
by a second member. Information was recorded about the study population, design, and results.
For topics on which meta-analysis was considered, the study characteristics and results were
independently abstracted by two people and verified by a third.
Key elements of each included study are presented in the Summary of Evidence tables for
each topic section.
Synthesis
The final phase of the evidence review is the synthesis of individual studies into information
that the Clinical Investigators and the Methods Team use to develop recommendations. This
synthesis is described for each topic in the section titled Evaluation of the Evidence, following
the Recommendations and preceding the Evidence Summary.
Identification of Subtopics and Synthesis
For each treatment, monitoring, or thresholds topic, the Clinical Investigators identified
important subtopics. For example, for Nutrition, there are questions about the route or mode of
feeding, the timing of feeding, glycemic control, and supplements. The studies in each topic were
reviewed to determine if quantitative synthesis—meta-analysis was feasible. This involved
determining if the patient populations, specifics of the intervention, and the outcomes were
similar enough that the study results could be combined. The result of this assessment is included

20
in the Quality of the Body of Evidence table for each subtopic. For this edition, we did not
identify any topics for which quantitative synthesis was appropriate according to current
standards. For this reason, the evidence was synthesized qualitatively.
Quality of the Body of Evidence
Assessing the quality of the body of evidence involves four domains: the aggregate quality of
the studies, the consistency of the results, whether the evidence provided is direct or indirect, and
the precision of the evidence. The criteria and ratings are outlined below, and more detailed
definitions are in Appendix H. In addition, the number of studies and number of included
subjects are considered. Based on these, an overall assessment is made as to whether the quality
of the body of evidence is high, moderate, low, or insufficient. The assessment of the body of
evidence for each subtopic is included in a table in each section.
Criteria
Quality of Individual Studies: This identifies the quality of the individual studies. It details how
many are Class 1, Class 2, and Class 3.
Consistency: Consistency is the extent to which the results and conclusions are similar across
studies. It is rated High (all are similar), Moderate (most are similar), or Low (no one conclusion
is more frequent). It is NA (not applicable) when the body of evidence consists of a single study.
Directness: We define directness as whether the study population is the same as the population of
interest and if the outcomes are clinical rather than intermediate outcomes. Evidence is labelled
as Direct, Indirect, or Mixed.
Precision: Precision is the degree of certainty surrounding the effect estimate for a given
outcome. Precision is rated as High, Moderate, or Low. How this is determined depends on the
type of analysis used in a specific study but may include consideration of the range of confidence
intervals or the significance level of p-values.
Ratings
These criteria are then considered when assigning a rating to the body of evidence.
The ratings are defined as follows:
• High—High confidence that the evidence reflects the true effect. Further research is very
unlikely to change the confidence in the estimate of effect.
21
• Moderate—Moderate confidence that the evidence reflects the true effect. Further
research may change the confidence in the estimate of effect and may change the
estimate.
• Low—Low confidence that the evidence reflects the true effect. Further research is likely
to change the confidence in the estimate of effect and is likely to change the estimate.
• Insufficient— Evidence is unavailable or does not permit a conclusion.
A determination of quality of the body of evidence requires a judgment about the relative
importance of the criteria, and these may vary across topics and subtopics. The following general
examples are provided to illustrate the variations that are possible, but are not intended as
exhaustive decision rules. If two or more Class 1 studies demonstrate contradictory findings for a
particular topic, the overall quality of the body of evidence may be assessed as low because there
is uncertainty about the effect. Similarly, Class 1 or 2 studies that provide indirect evidence may
only constitute low-quality evidence overall. In some cases, the body of evidence may be a
single study, but the rating may vary. A single study may constitute a high-quality body of
evidence if it is a large, multisite, Class 1 RCT; a moderate-quality body of evidence if it is a
single-site Class 2 study with a sizable sample and moderate precision; or insufficient evidence if
the sample is small and the precision of the estimate of effect is low.
Applicability
Applicability is the extent to which research findings are useful for informing
recommendations for a broader population (usually the population that is the target of the
recommendations). What is important to consider when assessing applicability will vary
depending upon the topic, and the assessment is context-specific. Consequently, there is
currently no generally accepted universal rating system for applicability. Common
considerations focus on the characteristics of the patient population (e.g., to which patients are
the results applicable?) and the settings for care delivery (e.g., where could a similar result be
expected?). Even if the patient population meets the inclusion criteria established for the review,
there may be specific characteristics that affect applicability. The characteristics of the setting in
which a study was conducted may also be important to consider. For example, a study conducted
in a Veterans Administration (VA) Medical Center may or may not be applicable to other

22
settings, depending upon how similar the Veterans are to the population of interest, or how
similar the context of the VA is to the care setting of interest. Additional characteristics to be
considered may include the geographic location (e.g., country, state, urban, or rural) and the type
of hospital (e.g., level of trauma center). The geographic area and type of hospital are considered
because it is possible that the patients, practice patterns, and available services are different
across environments. In this edition, we consider the applicability of individual studies in the
Quality of the Body of Evidence and Applicability section immediately following the
recommendations.
Development of Recommendations
Inclusion of Recommendations
Class 1, 2, or 3 studies constitute the evidence on which the recommendations are based.
Under our current methods, identification of evidence is necessary but not sufficient for the
development of recommendations. No recommendations were made without a basis in evidence.
Once evidence was identified, whether it could be used to inform recommendations was
based on the quality of the body of evidence and consideration of applicability. Given this, there
were cases in which evidence was identified, but the quality was low and applicability concerns
restricted our ability to translate the evidence into recommendations. Even if a recommendation
was not made, the evidence was included to serve as a placeholder for future consideration,
because in the future, new studies may be added, resulting in changes in the assessment of the
quality of the body of evidence.
Level of Recommendation
Recommendations in this edition are designated as Level I, Level II A, Level II B, or Level
III. The Level of Recommendation is determined by the assessment of the quality of the body of
evidence, rather than the class of the included studies.
The levels were primarily based on the quality of the body of evidence as follows:
• Level I recommendations were based on a high-quality body of evidence.
• Level II A recommendations were based on a moderate-quality body of evidence.
• Level II B and III recommendations were based on a low-quality body of evidence.

23
The Class of studies in the body of evidence was the basis for making a Level II B or III
recommendation: Level II B recommendations were based on a body of evidence with Class 2
studies, with direct evidence but of overall low quality, and Level III recommendations were
based on Class 3 studies, or on Class 2 studies providing only indirect evidence.
Applicability could result in a Level III recommendation (e.g., a “moderate-quality body of
evidence” with significant applicability concerns). In this edition, applicability alone was not
used to downgrade a recommendation. However, given the lack of standards and developed
methods in this area, we cited applicability issues that were identified and discussed by the
authors.
“Insufficient” was used in cases in which the body of evidence was insufficient either
because there were no studies identified, or because the body of evidence had major quality
limitations. If the evidence was insufficient, no recommendations were made.
Recommendation Review and Revision
Preliminary Topic Reviews
After completion of the literature review, identification of new studies, quality assessment,
and data abstraction, the Methods Team sent drafts for each topic to two Clinical Investigators.
The Clinical Investigators read the included studies and the draft recommendations, provided
input, and suggested additional studies for consideration. Methods Team members incorporated
the input, acquired and reviewed new studies, and provided the Clinical Investigators with new
publications and a revised summary of the evidence for each topic.
Clinical Investigator Review Meeting
In a two-day meeting in 2014, each topic was presented and discussed by the group. Based
on these discussions, the Methods Team revised the searches and recommendations.
Review of Complete Draft
The complete draft of all topics as well as the other sections of the guidelines (e.g., Methods,
Appendices) was sent to all Clinical Investigators for review and comment. Phone conferences
were held to answer questions, discuss the draft, and finalize the document throughout 2015.

24
Peer Review
After revisions were made based on input from the Clinical Investigators, the 4th Edition was
sent out for peer review. The Peer Review Committee was comprised of topic-specific TBI
clinicians, methodologists, representatives of specialty societies, and related stakeholders. Their
input was reviewed and incorporated as appropriate. A comprehensive review was also
conducted by members of the American Association of Neurological Surgeons/Congress of
Neurological Surgeons Joint Guidelines Committee, in collaboration with the Clinical
Investigators and Methods Team.
REFERENCE
1. Guyatt GH, Oxman AD, Vist GE, et al. GRADE: an emerging consensus on rating quality of evidence and strength of recommendations. BMJ. Apr 2008;336(7650):924-926. PMID: 18436948.
25
Evidence Synthesis and Recommendations, Part I: Treatments This section contains the evidence synthesis and recommendations for 11 treatments that are
either specific to the in-hospital management of severe traumatic brain injury (TBI) or are related
to risks experienced by TBI patients. This does not include treatments or procedures that are
considered good hospital and trauma care for all patients.
Topics that are included reflect current practice but are expected to change as new treatments
are developed that may replace or complement existing treatments.

26
1. Decompressive Craniectomy
INTRODUCTION
Cerebral edema can result from a combination of several pathological mechanisms associated
with primary and secondary injury patterns in traumatic brain injury (TBI).1 As pressure within
the skull increases, brain tissue displacement can lead to cerebral herniation, resulting in
disability or death.2-4
Surgical removal of a portion of the skull, known as decompressive craniectomy (DC), has
been performed for the purpose of relieving elevated intracranial pressure with outcome
improvement in specific TBI patients.5,6 Most of the debate surrounding the role of
decompressive craniectomy in the management of severe TBI results from a paucity of data
coming from randomized controlled trials (RCTs) assessing this intervention.7-9
There have been variations in surgical techniques, timing, and patient populations in most of
the observational studies published in the last 2 decades.8-11 A new RCT, pending publication,
will evaluate decompressive craniectomy as a secondary procedure after intracranial pressure
(ICP) targeted medical therapies have failed,12 and will hopefully lend further evidence to
support or not support this intervention.
RECOMMENDATIONS*
Level I
• There was insufficient evidence to support a Level I recommendation for this topic.
Level II A
• Bifrontal DC is not recommended to improve outcomes as measured by the Glasgow
Outcome Scale–Extended (GOS-E) score at 6 months post-injury in severe TBI patients
with diffuse injury (without mass lesions), and with ICP elevation to values >20 mm Hg
for more than 15 minutes within a 1-hour period that are refractory to first-tier therapies.
However, this procedure has been demonstrated to reduce ICP and to minimize days in
the intensive care unit (ICU).

27
• A large frontotemporoparietal DC (not less than 12 x 15 cm or 15 cm diameter) is
recommended over a small frontotemporoparietal DC for reduced mortality and improved
neurologic outcomes in patients with severe TBI.
*The committee is aware that the results of the RESCUEicp trial13 may be released soon after
the publication of these Guidelines. The results of this trial may affect these
recommendations and may need to be considered by treating physicians and other users of
these Guidelines. We intend to update these recommendations after the results are published
if needed. Updates will be available at https://braintrauma.org/coma/guidelines.
Changes from Prior Edition
DC is a new topic for this 4th Edition. DC had been included in the surgical guidelines.
EVALUATION OF THE EVIDENCE
Quality of the Body of Evidence
Studies of DC covered several questions (Table 1-1). The Class 2 studies either (1) compared
DC to medical management or (2) compared DCs of different sizes, in terms of their effect on
patient mortality and functional outcomes. Class 3 studies addressed these questions, and also
(3) comparison of DC to craniotomy and (4) assessment of the use of DC earlier or later in the
course of treatment.
For the first two questions addressed by Class 2 evidence, the quality of the body of evidence
was moderate. The RCT that compared DC to initial medical management was rated Class 1.14
This study was high quality but was a single study, and replication is needed for high confidence
in the results. Both RCTs that compared size of DCs were rated Class 2.15,16 The Class 3 studies
on these two questions were not incorporated into the recommendations and are not included in
Table 2, given there was higher-level evidence available. These Class 3 studies are included in
Table 1-3 and in the text in the Evidence Tables and Summary section below.
For the third and fourth questions for which only Class 3 evidence was identified, the body of
evidence was rated as insufficient, primarily because the results were inconsistent, with different
studies reporting positive, negative, and no effects. As the studies were of poor quality, it was not
possible to reconcile these differing results or to use the studies to support Level III
recommendations.

28
Table 1-1. Quality of the Body of Evidence (Depressive Craniectomy) COMPONENTS OF OVERALL QUALITY – Class 1 and 2
Topic
Number of
Studies Meta-
Analysis
Number of
Subjects
Class of Studies
Consistency (High,
Moderate, Low)
Directness (Direct or indirect)
Precision (High,
Moderate, Low)
Quality of Evidence
(High, Moderate,
Low, or Insufficient)
DC vs. initial medical management14
1 RCT NA 155 1 NA Direct Low Moderate
Larger DC vs. smaller DC15,16
2 RCTs No: Different outcomes
560 2 Moderate Direct Moderate Moderate
COMPONENTS OF OVERALL QUALITY – Class 3 DC vs. craniotomy17,18
2 Obser-vational
No
174 3 Moderate Direct Low Insufficient
Timing of DC19,20
2 Obser-vational
No 160 3 Low Direct Low Insufficient
Abbreviations: DC=decompressive craniectomy, NA=not applicable, RCT=randomized controlled trial.
Applicability
The applicability differs across questions and studies. The Class 1 study comparing DC to
initial medical management was conducted in three countries over an 8-year period, and included
15 centers.14 While this diversity may have limited the ability to detect an effect, it could
increase the applicability of the study. The two studies rated Class 2 that compare size of DCs
were both conducted in one country (China).15, 16 Incomplete reporting about these studies
limited the ability to fully understand key elements such as the standard of care and
characteristics of the populations.
SUMMARY OF THE EVIDENCE
Process
Of the 31 potentially relevant studies reviewed, 21 were excluded because they did not meet
the inclusion criteria. Of the remaining 10 studies, one Class 114 and two Class 215, 16 studies
were included as evidence to support recommendations for this topic. The remaining seven were
rated Class 3.17-23

29
Class 1 and 2 Studies
The evidence from Class 1 and 2 studies of depressive craniectomy is summarized in
Table 1-2.
Table 1-2. Summary of Evidence – Class 1 and 2 Studies (Depressive Craniectomy) Reference,
Study Topic Study Design,
N, and Outcomes Data Class Results
Conclusion DC compared with Medical Management Cooper, 2011*14 Comparison of bifrontotemporoparietal DC treatment vs. initial medical management without DC
RCT N=155 DC=73 No DC=82 Extended GOS at 6 months; favorable outcome
Class 1
Odds ratios for worse outcome in DC group: GOS-E at 6 months 1.84 (95% CI 1.05 to 3.24), p=0.03. Unfavorable outcomes 2.21 (95% CI 1.1.4 to 4.26), p=0.02. Mortality at 6 months DC 19% vs. standard care 18%. Post hoc adjustment for pupil reactivity at baseline resulted in differences that were no longer significant. DC vs. initial medical management Mean ICP after randomization (mm Hg) 14.4 ± 6.8 vs. 19.1 ± 8.9, p<0.001. Fewer ICU Days 13(10-18) vs. 18 (13-24), p<0.001. DC resulted in lower ICP and fewer ICU days, but more unfavorable outcomes.
Size of DC Jiang, 2005*15 Comparison of the influence of standard, larger trauma craniectomy (unilateral frontotemporoparietal bone flap [12x15 cm]) vs. a limited, smaller craniectomy (temporoparietal bone flap [6x8 cm])
RCT N=486 STC=245 LC=241 GOS at 6 months; Complications
Class 2 Concern about baseline differences between eligible/excluded and eligible/included
STC vs. LC GOS 4 or 5: Good recovery or moderate deficit 96 (39.8%) vs. 70 (28.6%), p=0.05. GOS 2 or 3: Severe deficit or vegetative state 82 (34.0%) vs. 89 (36.3%), p=0.05. GOS 1: Death 63 (26.2%) vs. 86 (35.1%), p<0.05. Significantly greater mortality in LC group. Incidence of delayed hematoma and incision CSF fistula significantly lower in STC group, while other complications did not differ.
30
Reference, Study Topic
Study Design, N, and Outcomes Data Class
Results Conclusion
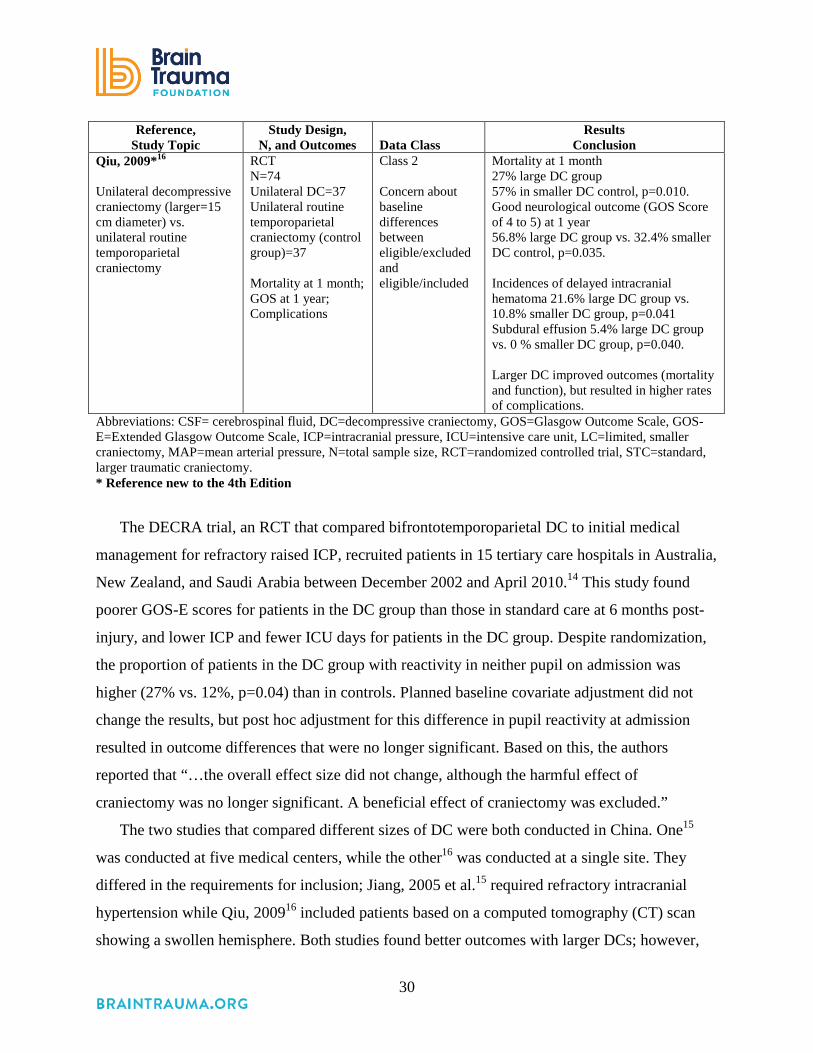
Qiu, 2009*16 Unilateral decompressive craniectomy (larger=15 cm diameter) vs. unilateral routine temporoparietal craniectomy
RCT N=74 Unilateral DC=37 Unilateral routine temporoparietal craniectomy (control group)=37 Mortality at 1 month; GOS at 1 year; Complications
Class 2 Concern about baseline differences between eligible/excluded and eligible/included
Mortality at 1 month 27% large DC group 57% in smaller DC control, p=0.010. Good neurological outcome (GOS Score of 4 to 5) at 1 year 56.8% large DC group vs. 32.4% smaller DC control, p=0.035. Incidences of delayed intracranial hematoma 21.6% large DC group vs. 10.8% smaller DC group, p=0.041 Subdural effusion 5.4% large DC group vs. 0 % smaller DC group, p=0.040. Larger DC improved outcomes (mortality and function), but resulted in higher rates of complications.
Abbreviations: CSF= cerebrospinal fluid, DC=decompressive craniectomy, GOS=Glasgow Outcome Scale, GOS-E=Extended Glasgow Outcome Scale, ICP=intracranial pressure, ICU=intensive care unit, LC=limited, smaller craniectomy, MAP=mean arterial pressure, N=total sample size, RCT=randomized controlled trial, STC=standard, larger traumatic craniectomy. * Reference new to the 4th Edition
The DECRA trial, an RCT that compared bifrontotemporoparietal DC to initial medical
management for refractory raised ICP, recruited patients in 15 tertiary care hospitals in Australia,
New Zealand, and Saudi Arabia between December 2002 and April 2010.14 This study found
poorer GOS-E scores for patients in the DC group than those in standard care at 6 months post-
injury, and lower ICP and fewer ICU days for patients in the DC group. Despite randomization,
the proportion of patients in the DC group with reactivity in neither pupil on admission was
higher (27% vs. 12%, p=0.04) than in controls. Planned baseline covariate adjustment did not
change the results, but post hoc adjustment for this difference in pupil reactivity at admission
resulted in outcome differences that were no longer significant. Based on this, the authors
reported that “…the overall effect size did not change, although the harmful effect of
craniectomy was no longer significant. A beneficial effect of craniectomy was excluded.”
The two studies that compared different sizes of DC were both conducted in China. One15
was conducted at five medical centers, while the other16 was conducted at a single site. They
differed in the requirements for inclusion; Jiang, 2005 et al.15 required refractory intracranial
hypertension while Qiu, 200916 included patients based on a computed tomography (CT) scan
showing a swollen hemisphere. Both studies found better outcomes with larger DCs; however,

31
the differences in patients, procedures, and treatment, as well as the fact that these studies did not
adjust for any covariates, limited the ability of these studies to provide a definitive answer to this
question. Of importance, these studies did not make a comparison of different sizes with no
decompression. Thus, the evidence did not allow an estimate of the effect of decompression
compared with no decompression.
Class 3 Studies
The evidence from Class 3 studies of depressive craniectomy is summarized in Table 1-3.
Table 1-3. Summary of Evidence – Class 3 Studies (Depressive Craniectomy) Reference
Study Topic Study Design, N and Outcomes Data Class
Results Conclusion
New Studies DC compared with Medical Management Olivecrona, 2007*22 Comparison of DC vs. non-craniectomy
Retrospective Cohort N=93 Treatment craniectomy= 21 Control, non-craniectomy=72 Mortality GOS Scores
Class 3 DC vs. no DC Mortality 3 (14.4%) vs. 10 (14.1%) GOS 2 1 (4.8%) vs. 3 (4.2%) GOS 3 2 (9.6%) vs. 15 (21.1%) GOS (GOS 5–4) 15 (71%) vs. 43 (61%), p>0.05. No significant difference in mortality or GOS The reduction of ICP was statistically significant in the Craniectomy group 72 hours post-procedure, p<0.001.
Soustiel, 2010*23 Comparison of DC vs. non-craniectomy (medical management)
Prospective Cohort N=122 DC=36 No DC=86 Mortality GOS ICP CBF
Class 3 Odds Ratio: DC to no DC Mortality: No difference OR: 0.80 (no CI reported), p=0.4185. Good functional outcome at 6 months (GOS): OR; 0.14, p=0.0000. Patients in DC group are more likely to have a poor functional outcome. Both mortality and GOS were adjusted for Age, CT, GCS at admission, ICP, CBF, CMRO2
32
Reference Study Topic Study Design, N and Outcomes
Data Class
Results Conclusion
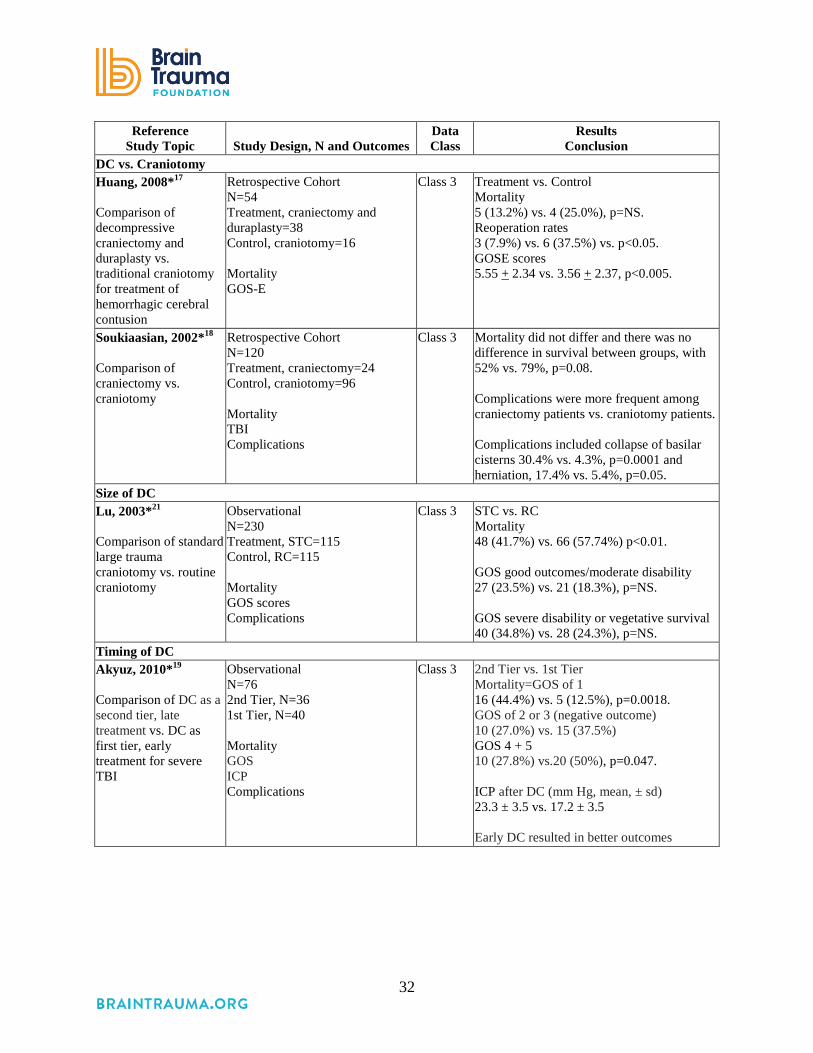
DC vs. Craniotomy Huang, 2008*17 Comparison of decompressive craniectomy and duraplasty vs. traditional craniotomy for treatment of hemorrhagic cerebral contusion
Retrospective Cohort N=54 Treatment, craniectomy and duraplasty=38 Control, craniotomy=16 Mortality GOS-E
Class 3 Treatment vs. Control Mortality 5 (13.2%) vs. 4 (25.0%), p=NS. Reoperation rates 3 (7.9%) vs. 6 (37.5%) vs. p<0.05. GOSE scores 5.55 + 2.34 vs. 3.56 + 2.37, p<0.005.
Soukiaasian, 2002*18 Comparison of craniectomy vs. craniotomy
Retrospective Cohort N=120 Treatment, craniectomy=24 Control, craniotomy=96 Mortality TBI Complications
Class 3 Mortality did not differ and there was no difference in survival between groups, with 52% vs. 79%, p=0.08. Complications were more frequent among craniectomy patients vs. craniotomy patients. Complications included collapse of basilar cisterns 30.4% vs. 4.3%, p=0.0001 and herniation, 17.4% vs. 5.4%, p=0.05.
Size of DC Lu, 2003*21 Comparison of standard large trauma craniotomy vs. routine craniotomy
Observational N=230 Treatment, STC=115 Control, RC=115 Mortality GOS scores Complications
Class 3 STC vs. RC Mortality 48 (41.7%) vs. 66 (57.74%) p<0.01. GOS good outcomes/moderate disability 27 (23.5%) vs. 21 (18.3%), p=NS. GOS severe disability or vegetative survival 40 (34.8%) vs. 28 (24.3%), p=NS.
Timing of DC Akyuz, 2010*19 Comparison of DC as a second tier, late treatment vs. DC as first tier, early treatment for severe TBI
Observational N=76 2nd Tier, N=36 1st Tier, N=40 Mortality GOS ICP Complications
Class 3 2nd Tier vs. 1st Tier Mortality=GOS of 1 16 (44.4%) vs. 5 (12.5%), p=0.0018. GOS of 2 or 3 (negative outcome) 10 (27.0%) vs. 15 (37.5%) GOS 4 + 5 10 (27.8%) vs.20 (50%), p=0.047. ICP after DC (mm Hg, mean, ± sd) 23.3 ± 3.5 vs. 17.2 ± 3.5 Early DC resulted in better outcomes

33
Reference Study Topic Study Design, N and Outcomes
Data Class
Results Conclusion
Wen, 2011*20 Comparison of early DC vs. late DC
Prospective Cohort N=44 Treatment, early DC=25 Matched comparison late DC=19 Mortality GOS score Complications
Class 3 Mortality 1 month post-surgery 4 (16%) vs. 3 (15.8%) p=0.985. 6 months post-surgery 5 (20%) vs. 4(21%), p=0.932. Good outcome (GOS 4 or 5)/poor outcome (GOS 1, 2,3) 1 month 7/18 vs. 7/12, p=0.533 6 months 13/12 vs. 12/7, p=0.459 No difference in outcomes
Abbreviations: CBF=cerebral blood flow, CMRO2=cerebral metabolic rate of oxygen, CT=computed tomography, DC=decompressive craniectomy, GCS=Glasgow Coma Scale, GOS=Glasgow Outcome Scale, GOS-E=Extended Glasgow Outcome Scale, ICP=intracranial pressure, ICU=intensive care unit, LC=limited, smaller craniectomy, MAP=mean arterial pressure, N=total sample size, NR=not reported, NS=not significant, OR=odds ratio, RC=routine craniotomy, RCT=randomized controlled trial, sd=standard deviation, STBI=severe traumatic brain injury, STC=standard, larger trauma craniectomy. *References new to the 4th Edition.
Both of the two Class 3 studies that compared DC to medical management reported no
significant difference in mortality; however, one reported poorer functional outcomes with DC23
while the other found no difference in function.22 The one Class 3 study comparing large and
small DC reported lower mortality with larger DC.21 These results were similar to the Class 2
studies that addressed this question. For these questions, higher quality Class 2 evidence was
available, and the Class 3 evidence was not used to inform the recommendations.
The studies that compared DC to craniotomy reported lower, but not statistically significant,
mortality rates and conflicting findings about function and complications.17,18 Similarly, the
results of two studies of the timing of DC were inconsistent. One reported reduced mortality,19
and one reported no difference.20 Given the quality of the studies and the inconsistency of the
findings, the quality of the body of evidence was rated as insufficient and these studies were not
used as the basis for recommendations.
34
REFERENCES
1. Xi G, Keep RF, Hoff JT. Pathophysiology of brain edema formation. Neurosurg Clin N Am. Jul 2002;13(3):371-383. PMID: 12486926.
2. Dunn LT. Raised intracranial pressure. J Neurol Neurosurg Psychiatry. Sep 2002;73 Suppl 1:i23-27. PMID: 12185258.
3. Farahvar A, Gerber LM, Chiu YL, et al. Response to intracranial hypertension treatment as a predictor of death in patients with severe traumatic brain injury.[Erratum appears in J Neurosurg. 2011 Jul;115(1):191 added Froelich, Matteus]. J Neurosurg. May 2011;114(5):1471-1478. PMID: 21214327.
4. Vik A, Nag T, Fredriksli OA, et al. Relationship of "dose" of intracranial hypertension to outcome in severe traumatic brain injury. J Neurosurg. Oct 2008;109(4):678-684. PMID: 18826355.
5. Bor-Seng-Shu E, Figueiredo EG, Amorim RLO, et al. Decompressive craniectomy: a meta-analysis of influences on intracranial pressure and cerebral perfusion pressure in the treatment of traumatic brain injury. J Neurosurg. Sep 2012;117(3):589-596. PMID: 22794321.
6. Eberle BM, Schnuriger B, Inaba K, Gruen JP, Demetriades D, Belzberg H. Decompressive craniectomy: surgical control of traumatic intracranial hypertension may improve outcome. Injury Sep 2010;41(9):894-898. PMID: 21574279.
7. Sahuquillo J, Arikan F. Decompressive craniectomy for the treatment of refractory high intracranial pressure in traumatic brain injury. Cochrane Database Syst Rev. 2006(1):1-41. PMID: 16437469.
8. Bohman LE, Schuster JM. Decompressive craniectomy for management of traumatic brain injury: an update. Curr Neurol Neurosci Rep. Nov 2013;13(11):392. PMID: 24101348.
9. Huang X, Wen L. Technical considerations in decompressive craniectomy in the treatment of traumatic brain injury. Int J Med Sci. 2010;7(6):385-390. PMID: 21103073.
10. Ragel BT, Klimo P, Jr., Martin JE, Teff RJ, Bakken HE, Armonda RA. Wartime decompressive craniectomy: technique and lessons learned. Neurosurg Focus. May 2010;28(5):E2. PMID: 20568936.
11. Quinn TM, Taylor JJ, Magarik JA, Vought E, Kindy MS, Ellegala DB. Decompressive craniectomy: technical note. Acta Neurol Scand. Apr 2011;123(4):239-244. PMID: 20637010.
12. Hutchinson PJ, Kolias PJ, Timofeev I, et al. Update on the RESCUEicp decompressive craniectomy trial. Crit Care. 2011;15(Suppl 1):P312.
13. Hutchinson P. Randomised Evaluation of Surgery with Craniectomy for Uncontrollable Elevation of intracranial pressure (RESCUEicp). ISRCTN66202560. DOI 10.1186/ISRCTN66202560. ISRCTN Registry 2005; http://www.isrctn.com/ISRCTN66202560.
14. Cooper DJ, Rosenfeld JV, Murray L, et al. Decompressive craniectomy in diffuse traumatic brain injury.[Erratum appears in N Engl J Med. 2011 Nov 24;365(21):2040]. N Engl J Med. 2011;364(16):1493-1502. PMID: 21434843.

35
15. Jiang JY, Xu W, Li WP, et al. Efficacy of standard trauma craniectomy for refractory intracranial hypertension with severe traumatic brain injury: a multicenter, prospective, randomized controlled study. J Neurotrauma. 2005;22(6):623-628. PMID: 15941372.
16. Qiu W, Guo C, Shen H, et al. Effects of unilateral decompressive craniectomy on patients with unilateral acute post-traumatic brain swelling after severe traumatic brain injury. Crit Care. 2009;13(6):R185. PMID: 19930556.
17. Huang AP, Tu YK, Tsai YH, et al. Decompressive craniectomy as the primary surgical intervention for hemorrhagic contusion. J Neurotrauma. Nov 2008;25(11):1347-1354. PMID: 19061378.
18. Soukiasian HJ, Hui T, Avital I, et al. Decompressive craniectomy in trauma patients with severe brain injury. Am Surg. Dec 2002;68(12):1066-1071. PMID: 12516810.
19. Akyuz M, Ucar T, Acikbas C, Kazan S, Yilmaz M, Tuncer R. Effect of early bilateral decompressive craniectomy on outcome for severe traumatic brain injury. Turk Neurosurg. 2010;20(3):382-389. PMID: 20669113.
20. Wen L, Wang H, Wang F, et al. A prospective study of early versus late craniectomy after traumatic brain injury. Brain Inj. 2011;25(13-14):1318-1324. PMID: 21902550.
21. Lu LQ, Jiang JY, Yu MK, et al. Standard large trauma craniotomy for severe traumatic brain injury. Chin J Traumatol. Oct 2003;6(5):302-304. PMID: 14514369.
22. Olivecrona M, Rodling-Wahlstrom M, Naredi S, Koskinen LO. Effective ICP reduction by decompressive craniectomy in patients with severe traumatic brain injury treated by an ICP-targeted therapy. J Neurotrauma. Jun 2007;24(6):927-935. PMID: 17600510.
23. Soustiel JF, Sviri GE, Mahamid E, Shik V, Abeshaus S, Zaaroor M. Cerebral blood flow and metabolism following decompressive craniectomy for control of increased intracranial pressure. Neurosurg. 2010;67(1):65-72. PMID: 20559092.

36
2. Prophylactic Hypothermia
INTRODUCTION
Hypothermia is well recognized to preserve cells and tissue in the face of metabolic
challenge. Evidence supports the administration of hypothermia as standard of care for
neuroprotection after cardiac arrest from acute coronary syndromes.1,2 There has been long-
standing interest in applying hypothermia to reduce the tissue damage associated with central
nervous system trauma; however, benefit cannot be presumed. In addition to suggested
neuroprotective effects, hypothermia is well known for its ability to reduce intracranial pressure.
However, hypothermia bears risks, including coagulopathy and immunosuppression, and
profound hypothermia bears the additional risk of cardiac dysrhythmia and death.3
Hypothermia can be administered either early after injury and prior to intracranial pressure
elevation, in which case it is termed “prophylactic,” or as a treatment for refractory intracranial
pressure elevation, typically referred to as “therapeutic.” Prophylactic hypothermia has been
subject to scrutiny in studies that have reported conflicting results.3 Of uncertain relevance to
adult traumatic brain injury (TBI), two recent high-quality pediatric trials failed to show benefit
and additionally suggested harm related to prophylactic hypothermia for TBI.4,5 Interest has thus
shifted to exploring how specific aspects of induced hypothermia, such as the duration and depth,
relate to clinical effect.3 For instance, it is generally suggested that gradual rewarming can
mitigate the inherent risk of rebound intracranial pressure elevation6 and there has been interest
in localized cerebral cooling in the hopes of obtaining the desired benefits without the systemic
side effects.
RECOMMENDATIONS
Level I and II A
• There was insufficient evidence to support a Level I or II A recommendation for this
topic.
Level II B
• Early (within 2.5 hours), short-term (48 hours post-injury) prophylactic hypothermia is
not recommended to improve outcomes in patients with diffuse injury.

37
Changes from Prior Edition
In the 3rd Edition, the studies that compared hypothermia to normothermia were summarized
in a meta-analysis. For this 4th Edition we re-examined the underlying assumptions of our prior
work in light of the current standards for meta-analysis and decided not to repeat the meta-
analysis because the hypothermia interventions in the higher-quality studies (Class 2 or better)
differed across the studies in clinically important ways. More detail is provided in
Appendix I.
EVALUATION OF THE EVIDENCE
Quality of the Body of Evidence
The research identified for prophylactic hypothermia (Table 2-1) included studies that make
three types of comparisons: (1) hypothermia versus normothermia, (2) shorter versus longer
periods of cooling, and (3) head-only versus systemic cooling.
The quality of the body of evidence for the comparison of hypothermia with normothermia is
low because the findings were inconsistent, with some studies reporting benefits and others
reporting no difference between treatment and control groups. The Class 1 study found no
difference in outcomes between hypothermia and normothermia groups and supported the Level
II B recommendation.7 Of note, the II B recommendation only applies to the early, short-term
protocol used; there is insufficient evidence to make a recommendation outside these conditions.
For the questions addressing length of cooling8 and head-only versus systemic cooling,9 the
evidence was insufficient. In both cases, the evidence consisted of single studies which, although
rated Class 2, had limitations that minimized confidence in the findings.
Table 2-1. Quality of the Body of Evidence (Prophylactic Hypothermia) COMPONENTS OF OVERALL QUALITY – Class 1 and 2
Topic
Number of
Studies Meta-
Analysis
Number
of Subjects
Class of Studies
Consistency (High,
Moderate, Low)
Directness (Direct or indirect)
Precision (High,
Moderate, Low)
Quality of Evidence
(High, Moderate,
Low, or Insufficient)
Hypothermia vs. normo-thermia7, 10-15
7 RCTs No differences in intervention
816 One Class 1, six Class 2
Low Direct Low Low

38
COMPONENTS OF OVERALL QUALITY – Class 1 and 2
Topic
Number of
Studies Meta-
Analysis
Number
of Subjects
Class of Studies
Consistency (High,
Moderate, Low)
Directness (Direct or indirect)
Precision (High,
Moderate, Low)
Quality of Evidence
(High, Moderate,
Low, or Insufficient)
Length of cooling (short term—48 hours or less vs. long term)8
1 RCT NA 215 2 NA Direct Low Insufficient
Head vs. systemic cooling9
1 RCT NA 66 2 NA Direct Low Insufficient
Abbreviation: NA=not applicable, RCT=randomized controlled trial.
Applicability
Potential applicability concerns vary across sub-topics. For the comparison of hypothermia to
normothermia, one Class 1 and three Class 2 studies were conducted in the United States,7,11,12,14
two in China,13,15 and one in Japan.10 While practice patterns, resources, and standards may be
different across these countries, the different locations could also be a strength. However, the
studies conducted in China and Japan reported benefits from hypothermia, while three out of the
four U.S. studies found no difference.7,11,12 This could reflect differences in the tendency not to
publish studies with negative results or that find no benefit. Another difference is that two studies
were conducted at multiple sites7,12 with comparatively large sample sizes while the others were
limited to a single site and fewer patients (sample sizes ranged from 26 to 87). The larger multi-
site studies may be considered more applicable.
Details Related to Assessment for Meta-Analysis
Since the publication of the 3rd Edition there has been a proliferation of meta-analyses in the
neurosurgery literature as well as in the medical literature in general. While meta-analyses are
useful for combining small but similar studies in order to increase precision, issues have been
raised about when meta-analysis is appropriate and about the level of rigor required to establish
confidence in the findings. These issues have complicated the interpretation of the results of the
studies for this topic.16, 17

39
A fundamental requirement for meta-analysis is that the patient populations, interventions,
and outcomes should be similar enough that combining them is logical from a clinical
perspective. We re-evaluated the included studies in the 3rd Edition meta-analysis and found that
they varied in terms of the target temperature, the length of time hypothermia was maintained,
and the rate of rewarming. These differences were used for subgroup analyses in the 3rd Edition
but with the caveat that sample sizes were small. However, if these treatment differences are
clinically important, combining the studies in order to determine an overall impact is not
appropriate. (See Appendix I for detailed information on the differences in hypothermia
treatment across studies.) On review, these differences in treatment were considered important
and for this reason, we did not repeat the meta-analysis.
SUMMARY OF THE EVIDENCE
Process
Of the 14 new, potentially relevant studies reviewed, five were excluded because they did not
meet the inclusion criteria for this topic. One new Class 1 study,7 two new Class 2 studies,8, 9 and
six Class 2 studies10-15 from the 3rd Edition were included as primary evidence for this topic
(Table 2-2). Six new studies were rated Class 3 (Table 2-3).
Class 1 and 2 Studies
The evidence from Class 1 and 2 studies of prophylactic hypothermia is summarized in Table
2-2; results from studies included in the 3rd Edition are replicated in the table for continuity and
new references are noted.
Table 2-2. Summary of Evidence – Class 1 and 2 Studies (Prophylactic Hypothermia) Reference
Study Topic Study Design, N, and
Outcomes Data Class
Results Conclusion
Hypothermia compared with Normothermia Aibiki, 200010
Comparing effect of moderate hypothermia (3-4 days, 32-33º C) vs. normothermia
RCT N=26 Hypothermia=15 Normothermia=11 Mortality GOS at 6 months post-injury Japan
Class 2 Hypothermia vs. normothermia Mortality 1 (6.7%) vs. 3 (27.3%) significance not reported. GOS at 6 months Better outcomes 80% vs. 36.4% Mean GOS 4.2 vs. 2.9, p=0.04.

40
Reference Study Topic
Study Design, N, and Outcomes
Data Class
Results Conclusion
Clifton, 199311
Comparing effect of hypothermia (2 days, 32-33º C) vs. normothermia
RCT N=46 Hypothermia=24 Normothermia=22 Mortality GOS at 3 months Complications United States
Class 2 Hypothermia vs. normothermia Mortality 35% (8) vs. 36% (8) not significant. 3-month GOS Good recovery to moderate disability=52.2% vs. 36.4% not significant Significantly fewer seizures in hypothermia group, p=0.019. No significant differences between groups on other complications.
Clifton, 200112
Comparing the effect of hypothermia (2 days, 33º C) vs. normothermia
RCT N=392 Hypothermia=199 Normothermia=193 GOS at 6 months United States, Multi-center
Class 2 Hypothermia vs. normothermia Mortality 28% vs. 27% p=0.79. 6-month GOS severe disability, vegetative, or dead 57% in both groups. Trend toward poor outcomes for patients hypothermic on arrival and randomized to normothermia.
Clifton, 2011*7 Comparison of 48 hours of early hypothermia (33º C) vs. normothermia
RCT N=97 Hypothermia=52 Normothermia=45 Mortality Neurological Outcome United States, Multi-center
Class 1 Hypothermia vs. normothermia Mortality 12/52 vs. 8/45, RR 1.30, 95% CI 0.58 to 2.52; p=0.52. Poor outcomes (severe disability, vegetative state, or death) 31/52 vs. 25/45, RR 1.08, 95% CI 0.76 to 1.53; p=0.67. No significant difference in complications. Poor outcomes: difference by type of injury Diffuse injury: 70% vs. 50% p=0.09. Surgically evacuated hematomas 33% vs. 69% p=0.02. Fewer poor outcomes when patients with surgically evacuated hematomas are treated with hypothermia.
Jiang, 200013
Comparing of effect of long-term (3-14 days) mild hypothermia (33-35º C) vs. normothermia
RCT N=87 Long-term hypothermia=43 Normothermia=44 Mortality and GOS at 1 year China
Class 2 Hypothermia vs. normothermia Mortality at 1 year 25.6% vs. 45.5% GOS at 1 year significantly better outcomes (good recovery to moderate disability) 46.5% vs. 27.3%, p<0.05. No significant differences in complications.

41
Reference Study Topic
Study Design, N, and Outcomes
Data Class
Results Conclusion
Marion, 199714
Comparing the effect of moderate hypothermia (24 hours, 32-33º C) vs. normothermia
RCT N=82 Hypothermia=40 Normothermia=42 GOS at 3 and 6 months, and 1 year United States
Class 2 Hypothermia vs. normothermia Good outcomes (GOS 4 or 5) 3 months 38%(15) vs. 17% (7) p=0.03. 1 year 62% (24) vs. 38% (16), p=0.05. In subgroup analysis patients with initial GCS of 3 or 4 did not benefit, those with GCS 5 to 7 did benefit from hypothermia
Qiu, 200515
Comparing the effect of mild hypothermia (3-5 days, 33-35º C) vs. normothermia
RCT N=86 Hypothermia=43 Normothermia=43 Mortality and GOS at 2 years China
Class 2 Hypothermia vs. normothermia Mortality 25.6% vs. 51.2%, p<0.05. 2 year GOS Better outcomes (good recovery or moderate disability) 65.1% vs. 37.2%, p<0.05. More pulmonary infection 60.5% vs. 32.6%) and more thrombocytopenia 62.8% vs. 39.5% respectively, p<0.05.
Longer vs. Shorter Hypothermia Jiang, 2006*8 Comparison of long-term hypothermia (4-6 days) vs. short-term hypothermia (1-3 days)
RCT N=215 Long-term group=108 Short-term group=107 GOS 6 months Complications
Class 2 Long-term vs. short-term hypothermia 43.5% vs. 29% favorable outcomes p<0.05. Significantly higher rate of favorable outcomes for long-term group. No difference in complications.
Head vs. Systemic Cooling Liu, 2006*9 Comparison of Selective brain cooling vs. mild systemic cooling (33-35º C ) vs. normothermia
RCT N=66 SBC Group= 22 MSH Group=21 Normothermia(control)=23 GOS at 2 years ICP during treatment
Class 2 SBC vs. MSH vs. control Mortality 27.3% vs. 28.6% vs. 52.2%. Favorable outcome (GOS 4 or 5) 2 years post injury 72.7% vs. 57.1% vs. 34.8%. Outcomes significantly better for SBC than Control group (p<0.05), but no significant difference in outcomes between SBC and MSH groups. Lower ICP for SBC at all measurements vs. controls, p<0.05.
Abbreviations: GCS=Glasgow Coma Scale, GOS=Glasgow Outcome Scale, ICP=intracranial pressure, MSH=mild systemic hypothermia, N=total sample size, RCT=randomized controlled trial, SBC=selective brain cooling *References new to the 4th Edition.

42
Hypothermia versus normothermia. The studies that compare hypothermia to normothermia
represent a body of literature with conflicting results.7,10-15 Despite attempts to improve study
designs and research questions over time, there are important differences in several aspects of the
studies. Clifton et al. conducted three studies over almost 2 decades seeking to evaluate
hypothermia for patients with severe TBI by improving the study design and adapting the study
protocols based on their own findings and those of other researchers.7,11,12
Clifton, 1993 is described as a Phase II study. The authors reported non-significant trends
toward better outcomes and no significant differences in most complications in the hypothermia
patients.11 Marion, 1997 conducted a study that randomized 82 patients and compared GOS
scores at 3, 6, and 12 months.14 They found no difference in mortality, but more patients in the
hypothermia group had better outcomes. However, adjustments for differences in CT evaluations
lowered the precision of the estimate. Analysis by initial severity level revealed that the benefit
occurred in the patients who were less severely injured (with initial Glasgow Coma Scale [GCS]
scores of 5 to 7) while there was no statistically significant benefit in patients who were more
severely injured (those with lower GCS of 3 or 4).
Based on Clifton, 199311 and Marion, 1997,14 larger, Phase III studies were recommended.
Clifton et al., 2001 responded with a second, much larger (N=392) multi-center trial.12 This study
found no difference in mortality or neurological outcome. Authors suggested that hypothermia
was not induced quickly enough to produce a benefit in normothermic patients, and that
rewarming patients who arrived hypothermic was detrimental.
This informed the design of Clifton et al., 2011, in which patients had to be enrolled within
2.5 hours of injury.7 Enrollment in this study was stopped for futility when interim analyses
found no difference in mortality or neurological outcomes and calculated that the hypothesized
difference could not be reached even if full enrollment was completed. Follow-up was completed
for enrolled patients, and exploratory subgroup analyses revealed that in patients with surgically
removed hematomas the hypothermia group had better outcomes, while in patients with diffuse
brain injuries there was no significant difference in outcomes. These findings suggest a potential
underlying reason for the null finding, but would need to be tested in studies designed to
determine if there is a difference in outcome for different types of patients before it could be
used to inform evidence-based recommendations. In 2012, Clifton et al. published the results of a

43
post hoc analysis of the subset of patients who received craniotomies to evacuate hematomas
from the 2001 and 2011 studies.18 While this was stronger than the subgroup analysis from a
single study, there were important differences. For example, patients in the later study reached
target temperatures earlier than those in the first study, in which the time to target temperature
was mixed. For this analysis, the authors compared patients who were cooled more quickly,
within 1.5 hours of surgery, to patients who were cooled later and those in the normothermia
(control) group. Fewer patients who were cooled quickly had negative outcomes (41%), while
more patients who were cooled slowly or treated with normothermia had negative outcomes
(62%, p=0.009).
While other studies also compared hypothermia to normothermia, they differed in important
ways. Aibiki et al., 2000 randomized 26 patients to hypothermia and normothermia primarily to
assess the impact of cooling on prostanoids that affect cerebral blood flow.10 In addition to
finding that hypothermia may reduce prostanoid production after TBI, they also reported that
GOS scores 6 months after injury were significantly higher for the hypothermia group in this
limited number of patients. The study by Qui, 2005 randomized 86 patients. The hypothermia
group was kept cool for 3 to 5 days and had lower mortality rates.15 Although pulmonary
infections were higher in the hypothermia group (60.5% vs. 32.6%), there were no significant
differences in gastrointestinal hemorrhage, electrolyte disorder, or renal malfunction, and there
were no severe complications in heart rate, respiration, blood pressure, or arterial blood gases.
Jiang et al., 2000 compared normothermia to an experimental hypothermia group in which
patients started to be rewarmed when ICP returned to normal, resulting in hypothermia for 3 to
14 days.13 Their findings included significantly lower mortality and better outcomes (GOS score
at 1 year) in the hypothermia group.
Longer versus shorter duration. One study randomized 215 patients at three medical centers
to long-term and short-term hypothermia.8 Their analysis found that patients cooled for 5 days
had significantly better outcomes (GOS score at 6 months) than patients cooled for 2 days.
Head only versus systemic cooling. Lui, 2006 conducted a preliminary study that compared
head only (selective brain cooling) with full body (systemic cooling) and normothermia.9 GOS
scores 2 years after the injury were highest in the selective brain cooling group (GOS 4 or 5,
72.7% vs. 57.1% for systemic cooling, 34.8% normothermia), and rates of pneumonia were the

44
lowest in this group (22.7% vs. 38.1% for systemic cooling and 34.8% for the normothermia
group).
Class 3 Studies
The summary of evidence from Class 3 studies of prophylactic hypothermia is summarized
in Table 2-3.
Table 2-3. Summary of Evidence–Class 3 Studies (Prophylactic Hypothermia) Reference
Study Topic Study Design, N and
Outcomes Data Class
Results Conclusion
Hypothermia compared with Normothermia Harris, 2009*19 Comparison of hypothermia with a cooling cap vs. normothermia
RCT N=25 Treatment=12 Control=13 Mortality Morbidity (GOS & modified FIM scores) Intracranial temperature
Class 3 Mortality: hypothermia vs. control 6/12 (50.0%) vs. 4/13 (30.8%) of 13, p=0.43. GOS: No statistically significant difference Median maximum change in GOS during 28-days=0 for both the treatment and control groups, p=0.50. No significant difference in outcomes.
Lee, 2010*20 Comparison of hypothermia and hypothermia with CPP management vs. normothermia
RCT N=45 A: Normothermia=16 B: Mild hypothermia (33 to 35 degrees C)=15 C: Hypothermia with CPP management=14 Mortality Complications Length of ICU stay ICP PtiO2 GOSc
Class 3 A vs. B vs. C Mortality 2/16 (12.5%) vs. 1/15 (6.7%) vs. 1/14 (8.5%), p=0.89 GOS percentage of favorable neurologic outcomes 50% vs., 60% vs.71.4% p=0.039. ICP Mean: Days 1 and 2: Not statistically significant . Days 3-5: Significantly lower in B and C vs. A High: Days 1 and 2: Not statistically significant. Days 3-5: Significantly lower in B and C vs. A. ICU stay: mean number of days 9.0 days vs.11.3 days vs. 11.6 days, p=0.017. Complications (pulmonary infection, urinary tract infection, and thrombocytopenia) were not significantly different. Mortality did not differ but GOS was better in the hypothermia group and best in the hypothermia plus CPP group.

45
Reference Study Topic
Study Design, N and Outcomes
Data Class
Results Conclusion
Qiu, 2007*21 Comparison of hypothermia vs. normothermia
RCT N=80 Treatment=40 Control=40 Neurological outcomes Complications ICP
Class 3 Treatment vs. control Mortality 22.5% vs. 32.5% (OR 1.66, 95% CI 0.61 to 4.48) Favorable neurologic outcomes at 1 year 70.0% vs. 47.5% for controls, p=0.041. Mean ICP Lower in hypothermia group at 24, 48, and 72 hours after injury, p=0.000, p=0.000, and p=0.003. Complications 57.5% vs. 32.5%; p=0.025. (managed without severe sequelae including pulmonary infections) No difference in mortality, better neurological outcomes, but higher rate of complications though they were managed.
Qiu, 2006*22 Comparison of SBC vs. normothermia
RCT N=90 Treatment=45 Control=45 Neurological outcome (GOS scores) ICP Temperature
Class 3 SBC vs. Control Mortality 20.0% vs. 28.9% (OR 0.615, 95% CI 0.232 to 1.630) Good neurological outcome (GOS score of 4 to 5) 6 months 68.9% vs. 46.7%, p<0.05. Mean ICP values SBC were lower than normothermia at 24, 48, and 72 hours, p<0.001. No complications resulting in severe sequelae. Hypothermia resulted in better GOS at 6 months.
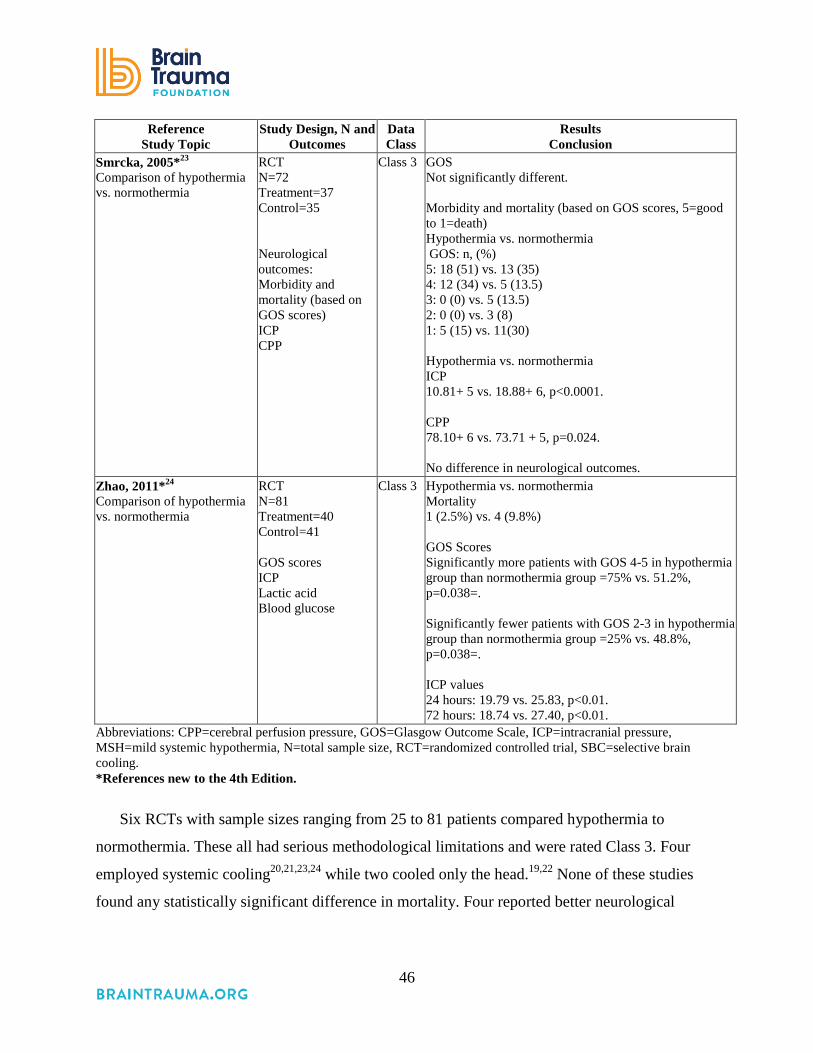
46
Reference Study Topic
Study Design, N and Outcomes
Data Class
Results Conclusion
Smrcka, 2005*23 Comparison of hypothermia vs. normothermia
RCT N=72 Treatment=37 Control=35 Neurological outcomes: Morbidity and mortality (based on GOS scores) ICP CPP
Class 3 GOS Not significantly different. Morbidity and mortality (based on GOS scores, 5=good to 1=death) Hypothermia vs. normothermia GOS: n, (%) 5: 18 (51) vs. 13 (35) 4: 12 (34) vs. 5 (13.5) 3: 0 (0) vs. 5 (13.5) 2: 0 (0) vs. 3 (8) 1: 5 (15) vs. 11(30) Hypothermia vs. normothermia ICP 10.81+ 5 vs. 18.88+ 6, p<0.0001. CPP 78.10+ 6 vs. 73.71 + 5, p=0.024. No difference in neurological outcomes.
Zhao, 2011*24 Comparison of hypothermia vs. normothermia
RCT N=81 Treatment=40 Control=41 GOS scores ICP Lactic acid Blood glucose
Class 3 Hypothermia vs. normothermia Mortality 1 (2.5%) vs. 4 (9.8%) GOS Scores Significantly more patients with GOS 4-5 in hypothermia group than normothermia group =75% vs. 51.2%, p=0.038=. Significantly fewer patients with GOS 2-3 in hypothermia group than normothermia group =25% vs. 48.8%, p=0.038=. ICP values 24 hours: 19.79 vs. 25.83, p<0.01. 72 hours: 18.74 vs. 27.40, p<0.01.
Abbreviations: CPP=cerebral perfusion pressure, GOS=Glasgow Outcome Scale, ICP=intracranial pressure, MSH=mild systemic hypothermia, N=total sample size, RCT=randomized controlled trial, SBC=selective brain cooling. *References new to the 4th Edition.
Six RCTs with sample sizes ranging from 25 to 81 patients compared hypothermia to
normothermia. These all had serious methodological limitations and were rated Class 3. Four
employed systemic cooling20,21,23,24 while two cooled only the head.19,22 None of these studies
found any statistically significant difference in mortality. Four reported better neurological
47
outcomes in patients treated with hypothermia,20-22,24 while two found no difference.19,23 In
combination, this is a very weak body of evidence.
REFERENCES
1. Ibrahim K, Christoph M, Schmeinck S, et al. High rates of prasugrel and ticagrelor non-responder in patients treated with therapeutic hypothermia after cardiac arrest. Resuscitation. May 2014;85(5):649-656. PMID: 24555950.
2. Arrich J, Holzer M, Havel C, Mullner M, Herkner H. Hypothermia for neuroprotection in adults after cardiopulmonary resuscitation. Cochrane Database Syst Rev. 2012(9):1-40. PMID: 22972067.
3. Brain Trauma Foundation, American Association of Neurological Surgeons, Congress of Neurological Surgeons, et al. Guidelines for the management of severe traumatic brain injury. J Neurotrauma. 2007;24 Suppl 1:S1-106. PMID: 17511554.
4. Hutchison JS, Ward RE, Lacroix J, et al. Hypothermia therapy after traumatic brain injury in children. N Engl J Med. Jun 5 2008;358(23):2447-2456. PMID: 18525042.
5. Adelson PD, Wisniewski SR, Beca J, et al. Comparison of hypothermia and normothermia after severe traumatic brain injury in children (Cool Kids): a phase 3, randomised controlled trial. Lancet Neurol. Jun 2013;12(6):546-553. PMID: 23664370.
6. Urbano LA, Oddo M. Therapeutic hypothermia for traumatic brain injury. Curr Neurol Neurosci Rep. Oct 2012;12(5):580-591. PMID: 22836524.
7. Clifton GL, Valadka A, Zygun D, et al. Very early hypothermia induction in patients with severe brain injury (the National Acute Brain Injury Study: Hypothermia II): a randomised trial. Lancet Neurol. Feb 2011;10(2):131-139. PMID: 21169065
8. Jiang JY, Xu W, Li WP, et al. Effect of long-term mild hypothermia or short-term mild hypothermia on outcome of patients with severe traumatic brain injury. J Cereb Blood Flow Metab. Jun 2006;26(6):771-776. PMID: 16306933.
9. Liu WG, Qiu WS, Zhang Y, Wang WM, Lu F, Yang XF. Effects of selective brain cooling in patients with severe traumatic brain injury: a preliminary study. J Int Med Res. Jan-Feb 2006;34(1):58-64. PMID: 16604824.
10. Aibiki M, Maekawa S, Yokono S. Moderate hypothermia improves imbalances of thromboxane A2 and prostaglandin I2 production after traumatic brain injury in humans. Crit Care Med. Dec 2000;28(12):3902-3906. PMID: 11153633.
11. Clifton GL, Allen S, Barrodale P, et al. A phase II study of moderate hypothermia in severe brain injury. J Neurotrauma. Fall 1993;10(3):263-271; discussion 273. PMID: 8258839.
12. Clifton GL, Miller ER, Choi SC, et al. Lack of effect of induction of hypothermia after acute brain injury. N Engl J Med. Feb 22 2001;344(8):556-563. PMID: 11207351.
13. Jiang J, Yu M, Zhu C. Effect of long-term mild hypothermia therapy in patients with severe traumatic brain injury: 1-year follow-up review of 87 cases. J Neurosurg. Oct 2000;93(4):546-549. PMID: 11014530.
14. Marion DW, Penrod LE, Kelsey SF, et al. Treatment of traumatic brain injury with moderate hypothermia. N Engl J Med. Feb 1997;336(8):540-546. PMID: 9023090.
48
15. Qiu WS, Liu WG, Shen H, et al. Therapeutic effect of mild hypothermia on severe traumatic head injury. Chin J Traumatol. Feb 2005;8(1):27-32. PMID: 15676086.
16. Klimo P, Jr., Thompson CJ, Ragel BT, Boop FA. Methodology and reporting of meta-analyses in the neurosurgical literature. J Neurosurg. Apr 2014;120(4):796-810. PMID: 24460488.
17. Sampson JH, Barker FG, 2nd. Methodology and reporting of meta-analyses in the neurosurgical literature. J Neurosurg. Apr 2014;120(4):791-794. PMID: jian.
18. Clifton GL, Coffey CS, Fourwinds S, et al. Early induction of hypothermia for evacuated intracranial hematomas: a post hoc analysis of two clinical trials. J Neurosurg. Oct 2012;117(4):714-720. PMID: 22839656.
19. Harris OA, Muh CR, Surles MC, et al. Discrete cerebral hypothermia in the management of traumatic brain injury: a randomized controlled trial.[Erratum appears in J Neurosurg. 2009 Jun;110(6):1322]. J Neurosurg. Jun 2009;110(6):1256-1264. PMID: 19249933.
20. Lee HC, Chuang HC, Cho DY, Cheng KF, Lin PH, Chen CC. Applying cerebral hypothermia and brain oxygen monitoring in treating severe traumatic brain injury. World Neurosurg. 2010;74(6):654-660. PMID: 21492636.
21. Qiu W, Zhang Y, Sheng H, et al. Effects of therapeutic mild hypothermia on patients with severe traumatic brain injury after craniotomy. J Crit Care. Sep 2007;22(3):229-235. PMID: 17869973.
22. Qiu W, Shen H, Zhang Y, et al. Noninvasive selective brain cooling by head and neck cooling is protective in severe traumatic brain injury. J Clin Neurosci. Dec 2006;13(10):995-1000. PMID: 17113984.
23. Smrcka M, Vidlak M, Maca K, Smrcka V, Gal R. The influence of mild hypothermia on ICP, CPP and outcome in patients with primary and secondary brain injury. Acta Neurochir Suppl. 2005;95:273-275. PMID: 16463864.
24. Zhao QJ, Zhang XG, Wang LX. Mild hypothermia therapy reduces blood glucose and lactate and improves neurologic outcomes in patients with severe traumatic brain injury. J Crit Care. 2011;26(3):311-315. PMID: 20889287.

49
3. Hyperosmolar Therapy
INTRODUCTION
As early as 1783, Monro,1 Kellie,2 and other investigators3 advanced the notion that the
volume of the brain is constant. The landmark work of Weed and McKibben4 disproved this
long-held dogma when they demonstrated dramatic changes in the volume of the brain resulting
from administration of hypertonic or hypotonic intravenous solutions. Since that time,
intravenous administration of hyperosmolar agents has become routine in the management of
intracranial hypertension and herniation syndromes. However, the optimal agent, their optimal
means of administration (i.e., dose and bolus vs. continuous infusion), and their precise
mechanisms of action continue to be investigated.
Mannitol and hypertonic saline are routinely employed hyperosmolar agents in North
America. Specific circumstances may prompt selection of a specific agent. Hypertonic saline
administration may be hazardous for a hyponatremic patient.5 Although mannitol can be used as
a resuscitation fluid, its eventual diuretic effect is undesirable in hypotensive patients and
attention needs to be paid to replacing intravascular volume loss.6 While mannitol was
previously thought to reduce intracranial pressure through simple brain dehydration, both
mannitol and hypertonic saline work to reduce intracranial pressure, at least in part, through
reducing blood viscosity, leading to improved microcirculatory flow of blood constituents and
consequent constriction of the pial arterioles, resulting in decreased cerebral blood volume and
intracranial pressure.5,7,8
RECOMMENDATIONS
Level I, II, and III
• Although hyperosmolar therapy may lower intracranial pressure, there was insufficient
evidence about effects on clinical outcomes to support a specific recommendation, or to
support use of any specific hyperosmolar agent, for patients with severe traumatic brain
injury.
As noted below, the Level II and III recommendations from the 3rd Edition of these
guidelines were not carried forward because they were derived from studies that do not meet

50
Class 3 criteria for this topic. While there is increasing use of hypertonic saline as an alternative
hyperosmotic agent, there is insufficient evidence available from comparative studies to support
a formal recommendation. The Committee thus chose to re-state here the 3rd Edition
recommendations. The rationale for doing so is to maintain sufficient recognition of the potential
need for hyperosmolar therapy to reduce intracranial pressure, while acknowledging that more
research is needed to inform more specific recommendations. (Refer to the 3rd Edition for
summary of supporting studies.)
Recommendations from the Prior (3rd) Edition Not Supported by Evidence Meeting Current
Standards
• Mannitol is effective for control of raised intracranial pressure (ICP) at doses of 0.25 g/kg
to 1 g/kg body weight. Arterial hypotension (systolic blood pressure <90 mm Hg) should
be avoided.
• Restrict mannitol use prior to ICP monitoring to patients with signs of transtentorial
herniation or progressive neurological deterioration not attributable to extracranial
causes.
Changes from Prior Edition
The Committee is universal in its belief that hyperosmolar agents are useful in the care of
patients with severe TBI. However, the literature does not currently support recommendations
that meet the strict criteria for contemporary evidenced-based medicine approaches for guideline
development.
The recommendations in the 3rd Edition of these guidelines about administration of
hyperosmolar agents were based on one Class 2 study and nine Class 3 studies. The study
included as a Class 2 study9 was not a comparative study for this topic (it is a Class 2 trial about
the use of barbiturates), and six of the studies that were rated as Class 3 studies were not
comparative10-15 and therefore did not meet current inclusion criteria.
In this 4th Edition, we focused the search for new evidence explicitly on the comparative
effectiveness of different hyperosmolar agents and means of administration.
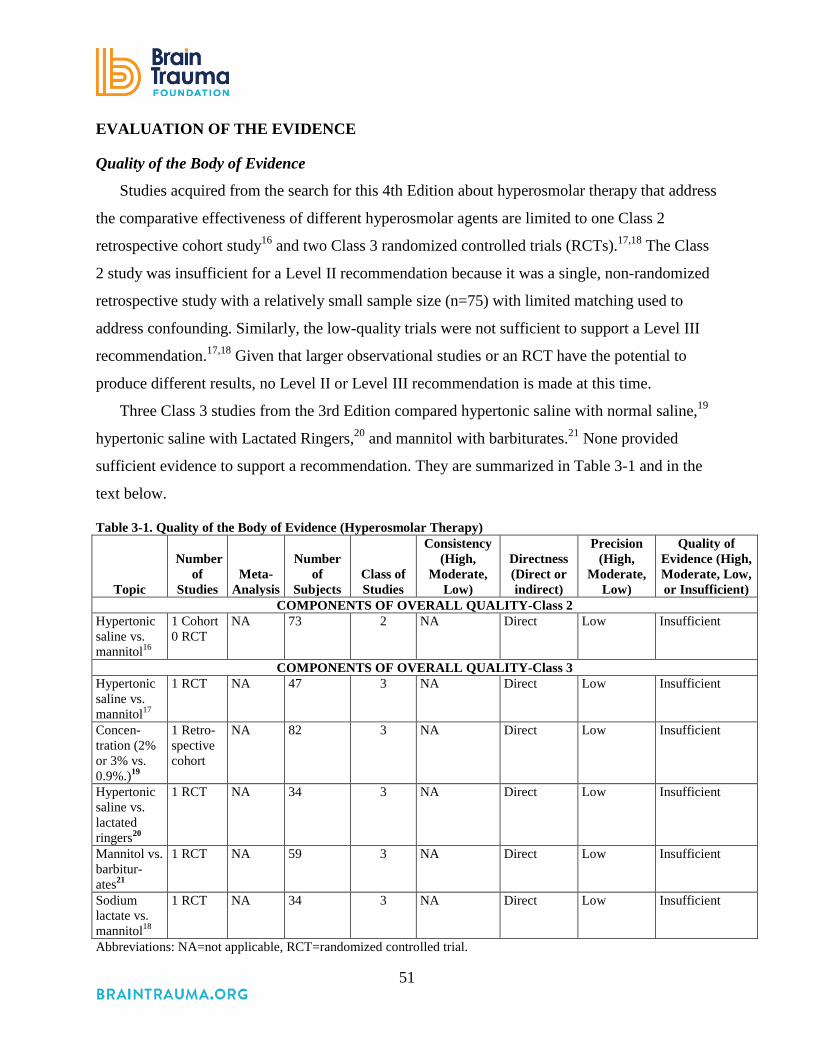
51
EVALUATION OF THE EVIDENCE
Quality of the Body of Evidence
Studies acquired from the search for this 4th Edition about hyperosmolar therapy that address
the comparative effectiveness of different hyperosmolar agents are limited to one Class 2
retrospective cohort study16 and two Class 3 randomized controlled trials (RCTs).17,18 The Class
2 study was insufficient for a Level II recommendation because it was a single, non-randomized
retrospective study with a relatively small sample size (n=75) with limited matching used to
address confounding. Similarly, the low-quality trials were not sufficient to support a Level III
recommendation.17,18 Given that larger observational studies or an RCT have the potential to
produce different results, no Level II or Level III recommendation is made at this time.
Three Class 3 studies from the 3rd Edition compared hypertonic saline with normal saline,19
hypertonic saline with Lactated Ringers,20 and mannitol with barbiturates.21 None provided
sufficient evidence to support a recommendation. They are summarized in Table 3-1 and in the
text below.
Table 3-1. Quality of the Body of Evidence (Hyperosmolar Therapy)
Topic
Number of
Studies Meta-
Analysis
Number
of Subjects
Class of Studies
Consistency (High,
Moderate, Low)
Directness (Direct or indirect)
Precision (High,
Moderate, Low)
Quality of Evidence (High, Moderate, Low, or Insufficient)
COMPONENTS OF OVERALL QUALITY-Class 2 Hypertonic saline vs. mannitol16
1 Cohort 0 RCT
NA 73 2 NA Direct Low Insufficient
COMPONENTS OF OVERALL QUALITY-Class 3 Hypertonic saline vs. mannitol17
1 RCT NA 47 3 NA Direct Low Insufficient
Concen-tration (2% or 3% vs. 0.9%.)19
1 Retro-spective cohort
NA 82 3 NA Direct Low Insufficient
Hypertonic saline vs. lactated ringers20
1 RCT NA 34 3 NA Direct Low Insufficient
Mannitol vs. barbitur-ates21
1 RCT NA 59 3 NA Direct Low Insufficient
Sodium lactate vs. mannitol18
1 RCT NA 34 3 NA Direct Low Insufficient
Abbreviations: NA=not applicable, RCT=randomized controlled trial.
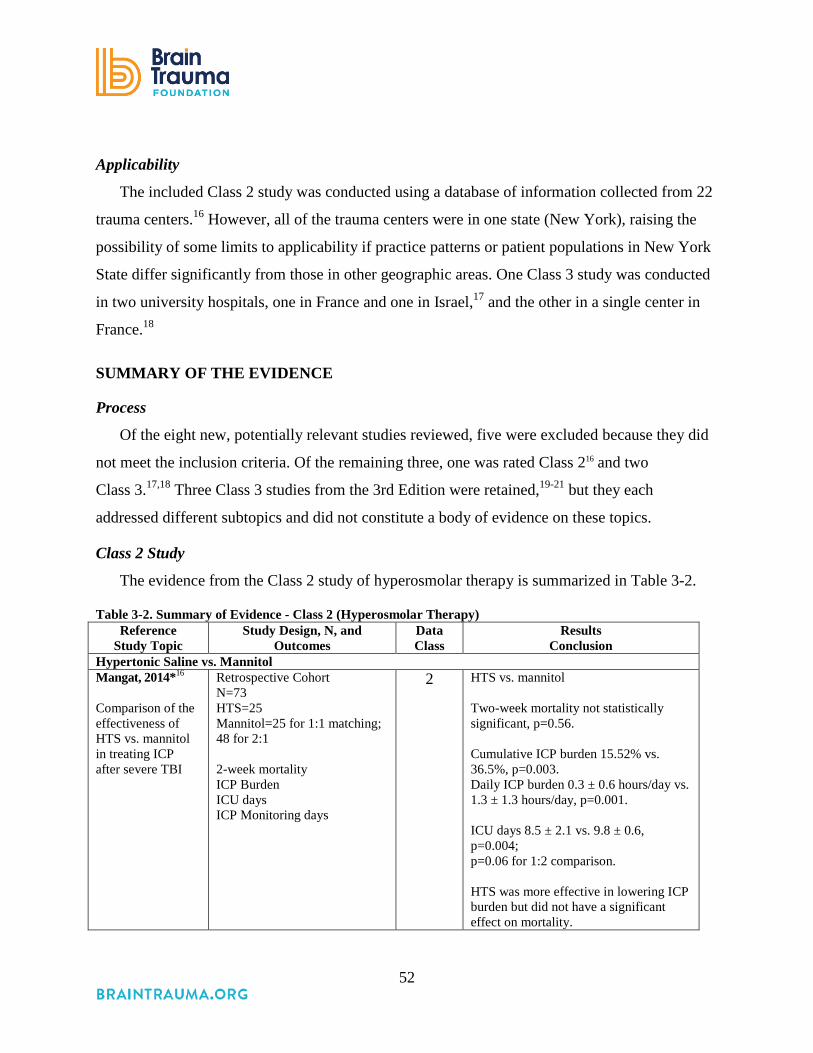
52
Applicability
The included Class 2 study was conducted using a database of information collected from 22
trauma centers.16 However, all of the trauma centers were in one state (New York), raising the
possibility of some limits to applicability if practice patterns or patient populations in New York
State differ significantly from those in other geographic areas. One Class 3 study was conducted
in two university hospitals, one in France and one in Israel,17 and the other in a single center in
France.18
SUMMARY OF THE EVIDENCE
Process
Of the eight new, potentially relevant studies reviewed, five were excluded because they did
not meet the inclusion criteria. Of the remaining three, one was rated Class 216 and two
Class 3.17,18 Three Class 3 studies from the 3rd Edition were retained,19-21 but they each
addressed different subtopics and did not constitute a body of evidence on these topics.
Class 2 Study
The evidence from the Class 2 study of hyperosmolar therapy is summarized in Table 3-2.
Table 3-2. Summary of Evidence - Class 2 (Hyperosmolar Therapy) Reference
Study Topic Study Design, N, and
Outcomes Data Class
Results Conclusion
Hypertonic Saline vs. Mannitol Mangat, 2014*16 Comparison of the effectiveness of HTS vs. mannitol in treating ICP after severe TBI
Retrospective Cohort N=73 HTS=25 Mannitol=25 for 1:1 matching; 48 for 2:1 2-week mortality ICP Burden ICU days ICP Monitoring days
2 HTS vs. mannitol Two-week mortality not statistically significant, p=0.56. Cumulative ICP burden 15.52% vs. 36.5%, p=0.003. Daily ICP burden 0.3 ± 0.6 hours/day vs. 1.3 ± 1.3 hours/day, p=0.001. ICU days 8.5 ± 2.1 vs. 9.8 ± 0.6, p=0.004; p=0.06 for 1:2 comparison. HTS was more effective in lowering ICP burden but did not have a significant effect on mortality.

53
Abbreviations: GOS=Glasgow Outcome Scale, HTS=hypertonic saline, ICP=intracranial pressure, ICU=intensive care unit, N=total sample size, RCT=randomized controlled trial, TBI=traumatic brain injury *Reference new to the 4th Edition.
Mangat et al. used the Brain Trauma Foundation’s TBI-trac® New York State Database to
conduct a retrospective study comparing the effectiveness of mannitol to hypertonic saline.16 The
overall findings are that hypertonic saline may be more effective than mannitol in lowering
intracranial pressure but no difference was found in short-term mortality.
Patients who received both agents were excluded as data were not available about the reason
for the use of the second drug. All patients over 16 years of age admitted between June 6, 2000,
and August 21, 2008, with a severe TBI and who stayed in the hospital for at least 5 days were
included. Patients with missing data were dropped. Exact matching was used to match patients
who received mannitol with those who received hypertonic saline (HTS) in terms of the Glasgow
Coma Scale (GCS), hypotension, and pupil reactivity. Age and CT were not used in the matching
because they were balanced between the groups. One-to-one matching was used for the primary
analysis and 1:2 matching was used for a sensitivity analysis, resulting in the inclusion of 24
patients who were given HTS compared with 48 who were given mannitol.
Mortality at 2 weeks was not significantly different (1:1 match common odds ratio 0.50, 95%
CI 0.05 to 5.51, p=0.56). Intensive care unit (ICU) stays were shorter for the HTS group, but the
difference was not significant in the 2:1 comparison. The number of days intracranial pressure
(ICP) was recorded did not differ between the groups. Cumulative ICP burden, defined as the
number of days with an ICP spike >25 mm Hg as a percentage of the total number of days
monitored, was significantly lower in the HTS group (15.2 ± 19.9% vs. 36.5 ± 30.9%, p=0.003,
HTS vs. mannitol). Daily ICP burden (hours/day of ICP >25 mm Hg) was also significantly
lower in the HTS group (0.3 ± 0.6 vs. 1.3 ± 1.3 hours/day, p=0.001, HTS vs. mannitol). These
results suggest that HTS may have advantages over mannitol, but additional research is needed
to confirm this finding and compare short- and long-term clinical outcomes, including mortality
and neurological function.
Class 3 Studies
The evidence from the Class 3 study of hyperosmolar therapy is summarized in Table 3-3.

54
Table 3-3. Summary of Evidence–Class 3 Studies (Hyperosmolar Therapy) Reference
Study Topic Study Design, N and Outcomes Data Class Results New Studies
Cottenceau 2011*17 HTS vs. MAN
RCT N=47 HTS=22 MAN=25 ICP GOS at 6 months
Class 3 MAN vs. HTS Average time of ICP > 20 (11.1 + 7.9 h) vs. (8.4+ 5.9h) NS GOS at 6 months: no significant difference
Ichai, 2009*18
LAC vs. MAN
RCT N=34 LAC=17 MAN=17 ICP GOS at 1 year post-injury
Class 3 ICP significantly lower in LAC than MAN (p=0.016). Better 1-year GOS scores for LAC, but study not powered to test this question.
Studies from 3rd Edition Qureshi, 199919
2% or 3% solution of saline vs. 0.9%.
Retrospective Cohort N=82 Analysis comparing continuous administration of 2% or 3% sodium chloride/acetate solution at 75-150 ml/hour (N=36 – HTS Group) to 0.9% saline (N=46 – NS Group) in TBI patients with GCS <8.
Class 3 More penetrating TBI and mass lesions in HTS group. HTS group had higher in-hospital mortality. Patients treated with HTS were more likely to receive barbiturate treatment.
Shackford, 199820 HTS vs. lactated Ringers
RCT N=34 Comparing 1.6% saline to lactated Ringer’s for hemodynamic instability in pre and in-hospital phase in patients with TBI and GCS <13.
Class 3 Baseline ICP higher and GCS lower in HS group. Despite this, HTS effectively lowered ICP; ICP course was not different between groups. Cumulative fluid balance greater in LR group. Daily serum sodium, osmolarity and ICP interventions greater in HTS group. GOS was not different between groups.
Schwartz, 198421 MAN vs. barbiturates
RCT N=59 Comparing MAN with barbiturates for ICP control. Crossover permitted. Sequential analysis.
Class 3 Pentobarbital was not significantly better than MAN. The MAN group had lower mortality 41% vs. 77%. CPP much better with MAN than barbiturates (75 mm Hg vs. 45 mm Hg).
Abbreviations: CPP=cerebral perfusion pressure, GCS=Glasgow Coma Scale, GOS=Glasgow Outcome Scale, HTS=hypertonic saline, ICP=intracranial pressure, LAC=sodium lactate, MAN=mannitol, NS= Normal Saline, RCT=randomized controlled trial, TBI=traumatic brain injury.
One new, small Class 3 RCT compared hypertonic saline to mannitol.17 This study reported
no significant differences in either the average time with elevated ICP or GOS at 6 months. A
second small Class 3 RCT compared sodium lactate to mannitol and reported that ICP was
significantly lower for patients who received sodium lactate than for those who received

55
mannitol.18 Of the three Class 3 studies maintained from the 3rd Edition, one compared
hypertonic saline (2% to 3%) to normal saline (0.9%),19 one compared hypertonic saline to
lactated ringers,20 and one compared mannitol to barbiturates.21 Because these are single, Class 3
studies, they were not used to support a recommendation.
The additional studies presented in the 3rd Edition as support for the Level III
recommendations included descriptive, non-comparative studies that constituted a body of
evidence that provided a basic understanding of the mechanisms and effects of mannitol, but did
not provide definitive evidence about its comparative effectiveness or about different regimens
of administration. As these studies were not comparative, they were not included in this edition.
REFERENCES
1. Monro A. Observations on the Structure and Function of the Nervous System 1783. 2. Kellie G. Appearances observed in the dissection of two individuals; death from cold and
congestion of the brain. Trans Med Chir Sci Edinb 1824;1:84-169. 3. Abercrombie J. Pathological and practical researches on diseases of the brain and the
spinal cord. 1828. PMID: 19514525. 4. Weed L, McKibben PS. Experimental alteration of brain bulk. Am J Physiol.
1919;48:531-558. 5. Bratton SL, Chestnut RM, Ghajar J, et al. Guidelines for the management of severe
traumatic brain injury. II. Hyperosmolar therapy. J Neurotrauma. 2007;24 Suppl 1:S14-20. PMID: 17511539.
6. The Brain Trauma Foundation. The American Association of Neurological Surgeons. The Joint Section on Neurotrauma and Critical Care. Use of mannitol. J Neurotrauma. Jun-Jul 2000;17(6-7):521-525. PMID: 10937895.
7. Muizelaar JP, Wei EP, Kontos HA, Becker DP. Mannitol causes compensatory cerebral vasoconstriction and vasodilation in response to blood viscosity changes. J Neurosurg. Nov 1983;59(5):822-828. PMID: 6413661.
8. Muizelaar JP, Wei EP, Kontos HA, Becker DP. Cerebral blood flow is regulated by changes in blood pressure and in blood viscosity alike. Stroke. Jan-Feb 1986;17(1):44-48. PMID: 3080824.
9. Eisenberg HM, Frankowski RF, Contant CF, Marshall LF, Walker MD. High-dose barbiturate control of elevated intracranial pressure in patients with severe head injury. J Neurosurg. Jul 1988;69(1):15-23. PMID: 3288723.
10. Becker DP, Vries JK. The alleviation of increased intracranial pressure by the chronic administration of osmotic agents In: Brock M, Dietz H, eds. Intracranial Pressure. Berlin: Springer Verlag; 1972:309-315.
11. James HE. Methodology for the control of intracranial pressure with hypertonic mannitol. Acta Neurochir (Wien). 1980;51(3-4):161-172. PMID: 6768226.

56
12. Marshall LF, RW SM, Rauscher LA, Shapiro HM. Mannitol dose requirements in brain-injured patients. J Neurosurg. Feb 1978;48(2):169-172. PMID: 624964.
13. Mendelow AD, Teasdale GM, Russell T, Flood J, Patterson J, Murray GD. Effect of mannitol on cerebral blood flow and cerebral perfusion pressure in human head injury. J Neurosurg. 1985;63(1):43-48. PMID: 3925092.
14. Miller JD LP. Effects of mannitol and steroid therapy on intracranial volume/pressure relationships J Neurosurg. 1975;42(3):274-281. PMID: 1117324.
15. Muizelaar JP, Lutz HA, 3rd, Becker DP. Effect of mannitol on ICP and CBF and correlation with pressure autoregulation in severely head-injured patients. J Neurosurg. Oct 1984;61(4):700-706. PMID: 6432972.
16. Mangat HS, Chiu YL, Gerber LM, Alimi M, Ghajar J, Hartl R. Hypertonic saline reduces cumulative and daily intracranial pressure burdens after severe traumatic brain injury. J Neurosurg. Nov 2014;122(1):1-9. PMID: 25380107.
17. Cottenceau V, Masson F, Mahamid E, et al. Comparison of effects of equiosmolar doses of mannitol and hypertonic saline on cerebral blood flow and metabolism in traumatic brain injury. J Neurotrauma. 2011;28(10):2003-2012. PMID: 21787184.
18. Ichai C, Armando G, Orban JC, et al. Sodium lactate versus mannitol in the treatment of intracranial hypertensive episodes in severe traumatic brain-injured patients. Intensive Care Med. Mar 2009;35(3):471-479. PMID: 18807008.
19. Qureshi A, Suarez J, Castro A, Bhardwaj A. Use of hypertonic saline/actate infusion in treatment of cerebral edema in patients with head trauma: experience at a single center J Trauma. 1999;47(4):659-665. PMID: 10528599.
20. Shackford SR, Bourguignon PR, Wald SL, Rogers FB, Osler TM, Clark DE. Hypertonic saline resuscitation of patients with head injury: a prospective, randomized clinical trial. J Trauma. Jan 1998;44(1):50-58. PMID: 9464749.
21. Schwartz ML, Tator CH, Rowed DW, Reid SR, Meguro K, Andrews DF. The University of Toronto head injury treatment study: a prospective, randomized comparison of pentobarbital and mannitol. Can J Neurol Sci. Nov 1984;11(4):434-440. PMID: 6440704.

57
4. Cerebrospinal Fluid Drainage
INTRODUCTION
Management of external ventricular drainage (EVD) systems in patients with severe
traumatic brain injury (TBI) remains a controversial topic. An EVD in a closed position allows
for monitoring of intracranial pressure (ICP), while in an open position drainage of cerebrospinal
fluid (CSF) can occur. Practice patterns regarding whether the EVD should be maintained in a
closed or open position vary widely based on a number of variables, including patient age,
institutional resources, and physician preferences. The goal of this chapter is to present current
EVD management options and review the available evidence that can be used to guide decision-
making on this topic.
A key variable in EVD management appears to be related to patient age. In the pediatric
population continuous CSF drainage is a relatively common practice with evidence to support
improvements in both ICP management and injury biomarkers.1 Practice patterns are more
variable for those patients who are triaged to adult trauma centers. In that setting some
physicians prefer to continuously monitor ICP and only intermittently drain for ICP elevations.
Others prefer continuous drainage of CSF with intermittent ICP measurements. A third option is
to place both an EVD for continuous drainage and an intraparenchymal fiberoptic pressure
monitor for continuous ICP measurements. Specific recommendations regarding this topic have
not been discussed in prior editions of these guidelines, yet it is a key aspect of patient care with
potential to significantly impact patient care and protocol development.
RECOMMENDATIONS
Level I and II
• There was insufficient evidence to support a Level I or II recommendation for this topic.
Level III
• An EVD system zeroed at the midbrain with continuous drainage of CSF may be
considered to lower ICP burden more effectively than intermittent use.
• Use of CSF drainage to lower ICP in patients with an initial Glasgow Coma Scale (GCS)
<6 during the first 12 hours after injury may be considered.
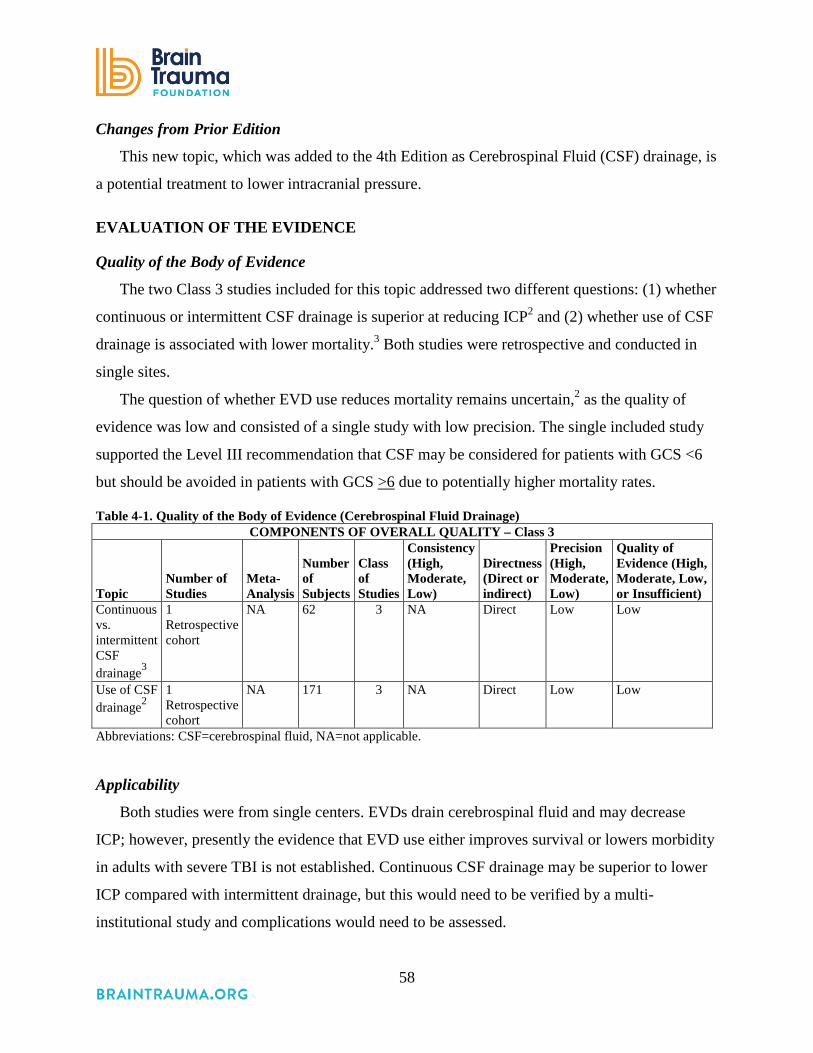
58
Changes from Prior Edition
This new topic, which was added to the 4th Edition as Cerebrospinal Fluid (CSF) drainage, is
a potential treatment to lower intracranial pressure.
EVALUATION OF THE EVIDENCE
Quality of the Body of Evidence
The two Class 3 studies included for this topic addressed two different questions: (1) whether
continuous or intermittent CSF drainage is superior at reducing ICP2 and (2) whether use of CSF
drainage is associated with lower mortality.3 Both studies were retrospective and conducted in
single sites.
The question of whether EVD use reduces mortality remains uncertain,2 as the quality of
evidence was low and consisted of a single study with low precision. The single included study
supported the Level III recommendation that CSF may be considered for patients with GCS <6
but should be avoided in patients with GCS >6 due to potentially higher mortality rates.
Table 4-1. Quality of the Body of Evidence (Cerebrospinal Fluid Drainage) COMPONENTS OF OVERALL QUALITY – Class 3
Topic Number of Studies
Meta-Analysis
Number of Subjects
Class of Studies
Consistency (High, Moderate, Low)
Directness (Direct or indirect)
Precision (High, Moderate, Low)
Quality of Evidence (High, Moderate, Low, or Insufficient)
Continuous vs. intermittent CSF drainage3
1 Retrospective cohort
NA 62 3 NA Direct Low Low
Use of CSF drainage2
1 Retrospective cohort
NA 171 3 NA Direct Low Low
Abbreviations: CSF=cerebrospinal fluid, NA=not applicable.
Applicability
Both studies were from single centers. EVDs drain cerebrospinal fluid and may decrease
ICP; however, presently the evidence that EVD use either improves survival or lowers morbidity
in adults with severe TBI is not established. Continuous CSF drainage may be superior to lower
ICP compared with intermittent drainage, but this would need to be verified by a multi-
institutional study and complications would need to be assessed.

59
SUMMARY OF THE EVIDENCE
Process
Of 12 new, potentially relevant studies reviewed, 10 were excluded because they did not
meet the inclusion criteria for this topic (see Appendix F). No Class 1 or 2 evidence was
identified; two new Class 3 studies were included.2, 3
Class 3 Studies
The evidence from the Class 3 studies of cerebrospinal fluid drainage is summarized in
Table 4-2.
Table 4-2. Summary of Evidence – Class 3 Studies (Cerebrospinal Fluid Drainage) Reference Study Topic* Study Design, N, and Outcomes
Data Class
Results Conclusion
Continuous vs. Intermittent EVD Nwachuka, 2013*3 Assessed continuous vs. intermittent EVD on intracranial pressure
Retrospective Cohort N=62 Continuous=31 Intermittent=31+ (+matched on key characteristics from earlier time period when this was standard of care) 6 month Mortality 6 month GOS ICP
Class 3 Closed vs. Open n (%) p-value 6-month survival 22 (71.0) vs. 24 (77.4), p=0.56. 6-month favorable GOS 13 (42.0) vs. 8 (26.0), p=0.35. Area under ICP curve (overall ICP values) (mean ± SD; median) 962.7 ± 228.7; 979.0 vs. 608.8 ± 277.3; 519.2 p<0.0001. Area under ICP curve (above 20 mm Hg) (mean ± SD; median) 59.7 ± 72.9; 43.3 vs. 17.2 ± 36.8; 0.0 p=0.0002. Patients managed with a closed, intermittently draining EVD had significantly higher ICP burden than the patients treated with an open EVD, continuous CSF drainage approach.
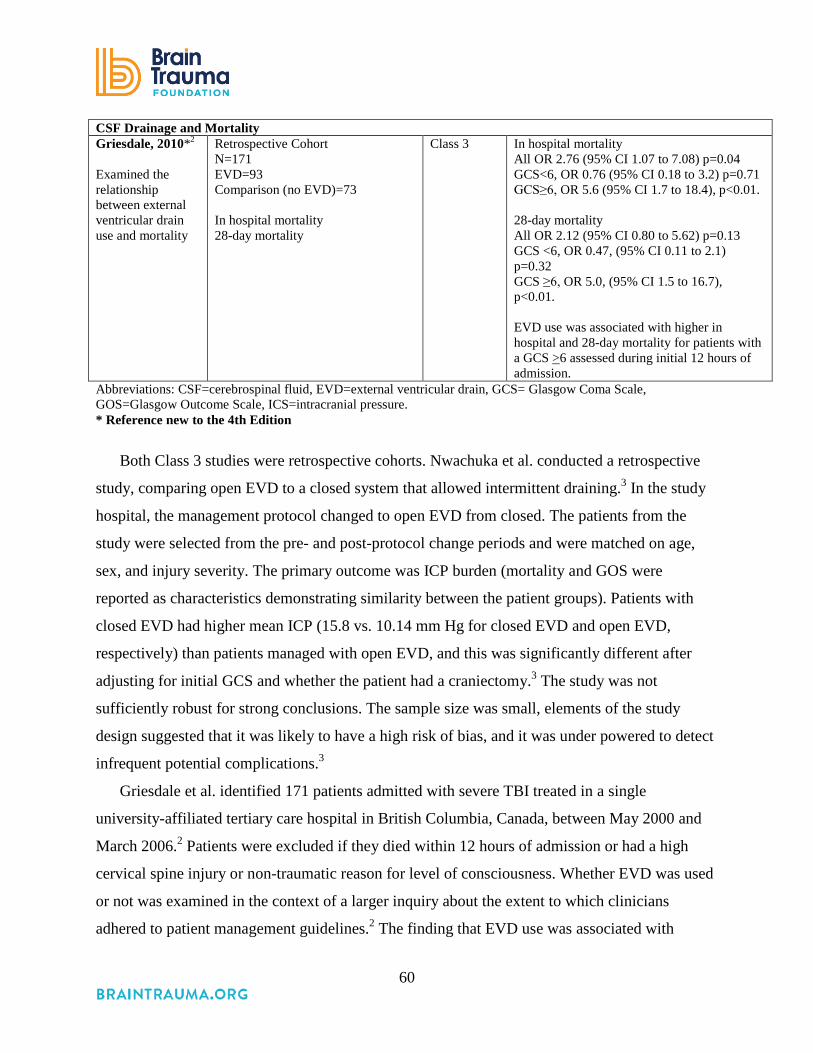
60
CSF Drainage and Mortality Griesdale, 2010*2 Examined the relationship between external ventricular drain use and mortality
Retrospective Cohort N=171 EVD=93 Comparison (no EVD)=73 In hospital mortality 28-day mortality
Class 3 In hospital mortality All OR 2.76 (95% CI 1.07 to 7.08) p=0.04 GCS<6, OR 0.76 (95% CI 0.18 to 3.2) p=0.71 GCS≥6, OR 5.6 (95% CI 1.7 to 18.4), p<0.01. 28-day mortality All OR 2.12 (95% CI 0.80 to 5.62) p=0.13 GCS <6, OR 0.47, (95% CI 0.11 to 2.1) p=0.32 GCS ≥6, OR 5.0, (95% CI 1.5 to 16.7), p<0.01. EVD use was associated with higher in hospital and 28-day mortality for patients with a GCS >6 assessed during initial 12 hours of admission.
Abbreviations: CSF=cerebrospinal fluid, EVD=external ventricular drain, GCS= Glasgow Coma Scale, GOS=Glasgow Outcome Scale, ICS=intracranial pressure. * Reference new to the 4th Edition
Both Class 3 studies were retrospective cohorts. Nwachuka et al. conducted a retrospective
study, comparing open EVD to a closed system that allowed intermittent draining.3 In the study
hospital, the management protocol changed to open EVD from closed. The patients from the
study were selected from the pre- and post-protocol change periods and were matched on age,
sex, and injury severity. The primary outcome was ICP burden (mortality and GOS were
reported as characteristics demonstrating similarity between the patient groups). Patients with
closed EVD had higher mean ICP (15.8 vs. 10.14 mm Hg for closed EVD and open EVD,
respectively) than patients managed with open EVD, and this was significantly different after
adjusting for initial GCS and whether the patient had a craniectomy.3 The study was not
sufficiently robust for strong conclusions. The sample size was small, elements of the study
design suggested that it was likely to have a high risk of bias, and it was under powered to detect
infrequent potential complications.3
Griesdale et al. identified 171 patients admitted with severe TBI treated in a single
university-affiliated tertiary care hospital in British Columbia, Canada, between May 2000 and
March 2006.2 Patients were excluded if they died within 12 hours of admission or had a high
cervical spine injury or non-traumatic reason for level of consciousness. Whether EVD was used
or not was examined in the context of a larger inquiry about the extent to which clinicians
adhered to patient management guidelines.2 The finding that EVD use was associated with
61
higher ICU but not hospital mortality led the researchers to examine subgroups. They found that
mortality was only associated with the EVD use for patients with an initial GCS ≥6, while use in
more severely comatose patients demonstrated a statistically insignificant trend for lower
mortality. Authors state that additional research is needed to confirm this finding, given the
possibility the results are due to unidentified confounding, which is difficult to control for in a
retrospective study.
REFERENCES
1. Shore PM, Thomas NJ, Clark RS, et al. Continuous versus intermittent cerebrospinal fluid drainage after severe traumatic brain injury in children: effect on biochemical markers. J Neurotrauma. Sep 2004;21(9):1113-1122. PMID: 15453982.
2. Griesdale DE, McEwen J, Kurth T, Chittock DR. External ventricular drains and mortality in patients with severe traumatic brain injury. Can J Neurol Sci. 2010;37(1):43-88. PMID: 20169772.
3. Nwachuku EL, Puccio AM, Fetzick A, et al. Intermittent versus continuous cerebrospinal fluid drainage management in adult severe traumatic brain injury: assessment of intracranial pressure burden. Neurocrit Care. Aug 2013;20(1):49-53. PMID: 23943318.

62
5. Ventilation Therapies
INTRODUCTION
Patients with severe traumatic brain injury (TBI) require definitive airway protection because
they are at risk of pulmonary aspiration or compromised respiratory drive and function. They
may also require transient hyperventilation to treat cerebral herniation. Normal ventilation is
currently the goal for severe TBI patients in the absence of cerebral herniation and normal partial
pressure of carbon dioxide in arterial blood (PaCO2) ranges from 35-45 mm Hg. PaCO2 is the
measure of arterial levels of carbon dioxide levels and heavily depends on metabolic rate.
Exhalation of PaCO2 results in removal of metabolic waste, and, during times of high
metabolism, respiratory rate normally increases to lower PaCO2 levels. Under normal conditions,
PaCO2 is the most powerful determinant of cerebral blood flow (CBF) and, between a range of
20 mm Hg and 80 mm Hg, CBF is linearly responsive to PaCO2. Cerebral blood flow is
important in meeting the brain’s metabolic demands. Low PaCO2, therefore, results in low CBF
and may result in cerebral ischemia while high PaCO2 levels can result in cerebral hyperemia
and high intracranial pressure (ICP). Therefore, providing optimal CBF is important under
normal and abnormal conditions.
Severe TBI patients receive mechanical ventilation, which can tightly regulate PaCO2 levels
through rate and tidal volume adjustments. Older studies suggested that cerebral hyperemia was
more common than cerebral ischemia, and hyperventilation was recommended in the care of
patients with TBI.1-3 However, more recent studies have shown that after severe TBI, cerebral
metabolic rate is not always low and can be variable. In fact, cerebral ischemia has been
documented in a number of studies after severe TBI, changing longstanding recommendations
concerning ventilation therapy.4-7 Since cerebral metabolic rate is not universally measured after
TBI, it is not possible to provide point of care CBF therapy to these patients. Therefore, the high
prevalence of cerebral ischemia in this patient population suggests safety in providing normo-
ventilation so as to prevent further cerebral ischemia and cerebral infarction.

63
RECOMMENDATIONS
Level I and II A
• There was insufficient evidence to support a Level I or II A recommendation for this
topic.
Level II B
• Prolonged prophylactic hyperventilation with partial pressure of carbon dioxide in arterial
blood (PaCO2) of 25 mm Hg or less is not recommended.
As noted below, the Level III recommendations from the 3rd Edition of these guidelines
were not carried forward because they were derived from case series studies. While no evidence
is available from comparative studies to support a formal recommendation, the Committee chose
to re-state here the 3rd Edition Level III recommendations. The rationale for doing so is to
maintain sufficient recognition of the potential need for hyperventilation as a temporizing
measure. (Refer to the 3rd Edition for summary of supporting studies.)
Recommendations from the Prior (3rd) Edition Not Supported by Evidence Meeting Current
Standards
• Hyperventilation is recommended as a temporizing measure for the reduction of elevated
intracranial pressure (ICP).
• Hyperventilation should be avoided during the first 24 hours after injury when cerebral
blood flow (CBF) is often critically reduced.
• If hyperventilation is used, jugular venous oxygen saturation (SjO2) or brain tissue O2
partial pressure (BtpO2) measurements are recommended to monitor oxygen delivery.
Changes from Prior Edition
The title of this section was changed from Hyperventilation to Ventilation Therapies for the
4th Edition.
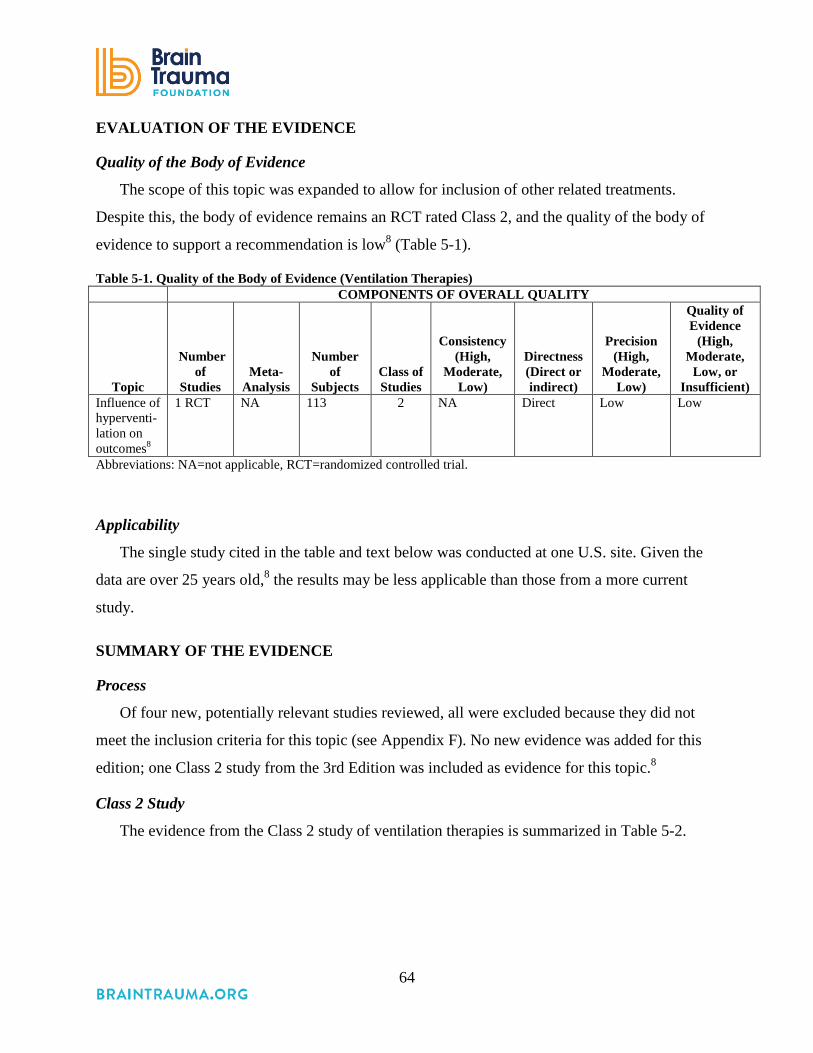
64
EVALUATION OF THE EVIDENCE
Quality of the Body of Evidence
The scope of this topic was expanded to allow for inclusion of other related treatments.
Despite this, the body of evidence remains an RCT rated Class 2, and the quality of the body of
evidence to support a recommendation is low8 (Table 5-1).
Table 5-1. Quality of the Body of Evidence (Ventilation Therapies) COMPONENTS OF OVERALL QUALITY
Topic
Number of
Studies Meta-
Analysis
Number
of Subjects
Class of Studies
Consistency (High,
Moderate, Low)
Directness (Direct or indirect)
Precision (High,
Moderate, Low)
Quality of Evidence
(High, Moderate,
Low, or Insufficient)
Influence of hyperventi-lation on outcomes8
1 RCT NA 113 2 NA Direct Low Low
Abbreviations: NA=not applicable, RCT=randomized controlled trial.
Applicability
The single study cited in the table and text below was conducted at one U.S. site. Given the
data are over 25 years old,8 the results may be less applicable than those from a more current
study.
SUMMARY OF THE EVIDENCE
Process
Of four new, potentially relevant studies reviewed, all were excluded because they did not
meet the inclusion criteria for this topic (see Appendix F). No new evidence was added for this
edition; one Class 2 study from the 3rd Edition was included as evidence for this topic.8
Class 2 Study
The evidence from the Class 2 study of ventilation therapies is summarized in Table 5-2.

65
Table 5-2. Summary of Evidence (Ventilation Therapies) Reference
Study Topic* Study Design, N, and outcomes Data Class
Results Conclusion
Influence of hyperventilation on outcomes Muizelaar, 19918 To compare normal ventilation (control: PaCO2 35 ± 2 mm Hg) to prolonged hyperventilation (HV group: PaCa 25 ± 2 mm Hg with and without tromethamine
RCT N=113 Control=41 HV=36 HV & THAM=36 GOS 3, 6 and 12 months NOTE: The inclusion criteria included children (≥to 3 years old); the exact age distribution was not reported though the median age is 26 years old.
Class 2 HV vs. control 3 months HV worse, p<0.03. 6 months HV worse, p<0.05. 12 months – Not statistically significant. Difference is due to patients with Motor score 4-5; no difference in patients with score 1-3. HV + tromethamine vs. control No significant difference. Patients with an initial GCS motor score of 4-5 that were hyperventilated to a PaCO2 of 25 mm Hg during the first 5 days after injury had significantly worse outcomes.
Abbreviations: GCS=Glasgow Coma Scale, GOS=Glasgow Outcome Scale, HV=hyperventilation, N=total sample size, RCT=randomized controlled trial. *No new studies were added to this edition.
The Level II B recommendation for this topic is based on one Class II RCT of 113 patients.8
The study used a stratified, randomized design to compare outcomes in severe TBI patients
provided normal ventilation (PaCO2 35 ±2 mm Hg; n=41; control group), hyperventilation
(PaCO2 25 ±2 mm Hg; n=36), or hyperventilation with tromethamine (THAM; n=36). One
potential benefit of hyperventilation is considered to be minimization of cerebrospinal fluid
(CSF) acidosis. However, the effect on CSF pH may not be sustained due to a loss of HCO3-
buffer. THAM treatment was introduced to test the hypothesis that it would reverse the effects of
the loss of buffer.
Patients were stratified based on the motor component of the Glasgow Coma Scale (GCS) (1-
3 and 4-5). The GOS was used to assess patient outcomes at 3, 6, and 12 months. For patients
with a motor GCS of 4-5, the 3- and 6-month GOS scores were significantly lower (worse) in the
hyperventilated patients than in the control or THAM groups. However, the effect was not
sustained at 12 months. Also, the effect was not observed in patients with the lower motor GCS,
minimizing the sample size for the control, hyperventilation, and THAM groups to 21, 17, and
21, respectively. The absence of a power analysis resulted in uncertainty about the adequacy of

66
the sample size. For these reasons, the article was rated Class 2 and the recommendation that
hyperventilation be avoided is Level II B.
REFERENCES
1. Bouma GJ, Muizelaar JP. Cerebral blood flow, cerebral blood volume, and cerebrovascular reactivity after severe head injury. J Neurotrauma. Mar 1992;9 Suppl 1:S333-348. PMID: 1588625.
2. Bouma GJ, Muizelaar JP. Cerebral blood flow in severe clinical head injury. New Horiz. Aug 1995;3(3):384-394. PMID: 7496746.
3. Muizelaar JP, Marmarou A, DeSalles AA, et al. Cerebral blood flow and metabolism in severely head-injured children. Part 1: Relationship with GCS score, outcome, ICP, and PVI. J Neurosurg. Jul 1989;71(1):63-71. PMID: 2738643.
4. Liu S, Wan X, Wang S, et al. Posttraumatic cerebral infarction in severe traumatic brain injury: characteristics, risk factors and potential mechanisms. Acta Neurochir (Wien). Aug 2015;157(10):1697-1704. PMID: 26306582.
5. Tawil I, Stein DM, Mirvis SE, Scalea TM. Posttraumatic cerebral infarction: incidence, outcome, and risk factors. J Trauma. Apr 2008;64(4):849-853. PMID: 18404047.
6. Carrera E, Schmidt JM, Fernandez L, et al. Spontaneous hyperventilation and brain tissue hypoxia in patients with severe brain injury. J Neurol Neurosurg Psychiatry. Jul 2010;81(7):793-797. PMID: 19965840.
7. Stein NR, McArthur DL, Etchepare M, Vespa PM. Early cerebral metabolic crisis after TBI influences outcome despite adequate hemodynamic resuscitation. Neurocrit Care. Aug 2012;17(1):49-57. PMID: 22528283.
8. Muizelaar JP, Marmarou A, Ward JD, et al. Adverse effects of prolonged hyperventilation in patients with severe head injury: a randomized clinical trial. J Neurosurg. Nov 1991;75(5):731-739. PMID: 1919695.

67
6. Anesthetics, Analgesics, and Sedatives
INTRODUCTION
Anesthetics, analgesics, and sedatives are important and commonly-used therapies in acute
traumatic brain injury (TBI) for a variety of reasons, including prophylaxis or control of
intracranial hypertension and seizures.1-3 Barbiturates have a long history of being used to
control intracranial pressure (ICP), presumably by preventing unnecessary movement, coughing,
and straining against tubes as well as suppression of metabolism and alteration of cerebral
vascular tone. Depressed cerebral metabolism and oxygen consumption is said to be neuro-
protective in some patients.2,4 Anesthetics and sedatives, such as barbiturates, may also improve
coupling of regional blood flow to metabolic demands resulting in higher brain oxygenation with
lower cerebral blood flow, and decreased ICP from decreased cerebral blood volume. Other
brain protective mechanisms include inhibition of oxygen radical mediated lipid peroxidation.2,5,6
Side effects of anesthetics, analgesics, and sedatives include hypotension and decreased
cardiac output, as well as increased intrapulmonary shunting, which may lead to hypoxia.2 These
may give rise to a paradoxical decrease in cerebral perfusion pressure, which may negate the
benefits of decreased ICP.5 In addition, anesthetics such as propofol have been associated with
hyperkalemia, metabolic acidosis, myocardial failure, rhabdomyolysis, and death.4 The
administration of these medications may preclude the physical examination in following a
patient’s progress and may therefore necessitate more advanced therapeutic modalities such as
continuous electroencephalographic (EEG) monitoring. Because of potential toxic side effects,
duration and dose of administration also means that the monitoring of sedative doses needs to be
diligently observed.
RECOMMENDATIONS
Level I and II A
• There was insufficient evidence to support a Level I or Level IIA recommendation for
this topic.

68
Level II B
• Administration of barbiturates to induce burst suppression measured by EEG as
prophylaxis against the development of intracranial hypertension is not recommended.
• High-dose barbiturate administration is recommended to control elevated ICP refractory
to maximum standard medical and surgical treatment. Hemodynamic stability is essential
before and during barbiturate therapy.
• Although propofol is recommended for the control of ICP, it is not recommended for
improvement in mortality or 6-month outcomes. Caution is required as high-dose
propofol can produce significant morbidity.7,8
Changes from Prior Edition
There are no content changes from the 3rd Edition to the recommendations (although
wording revisions were made). Newly identified Class 3 studies have been added to the evidence
but did not change the recommendations.
EVALUATION OF THE EVIDENCE
Quality of the Body of Evidence
The research on this topic has focused on three questions: (1) Does the prophylactic use of
barbiturates improve outcomes, (2) can barbiturates be used to reduce intracranial hypertension,
and (3) does the use of sedatives improve outcomes? The Class 2 evidence is limited to a single,
comparatively small study for each question. While there was one Class 3 study included in the
3rd Edition and four additional Class 3 studies were identified for this update, they all had
serious flaws or null findings. For this reason, the body of evidence on which the
recommendations are based remains the Class 2 studies. The quality of the body of evidence is
considered low, as a new larger study could change the conclusions (Table 6-1). This evidence
was used as the basis for the recommendations in the 3rd Edition, and these recommendations
were retained in this 4th Edition.
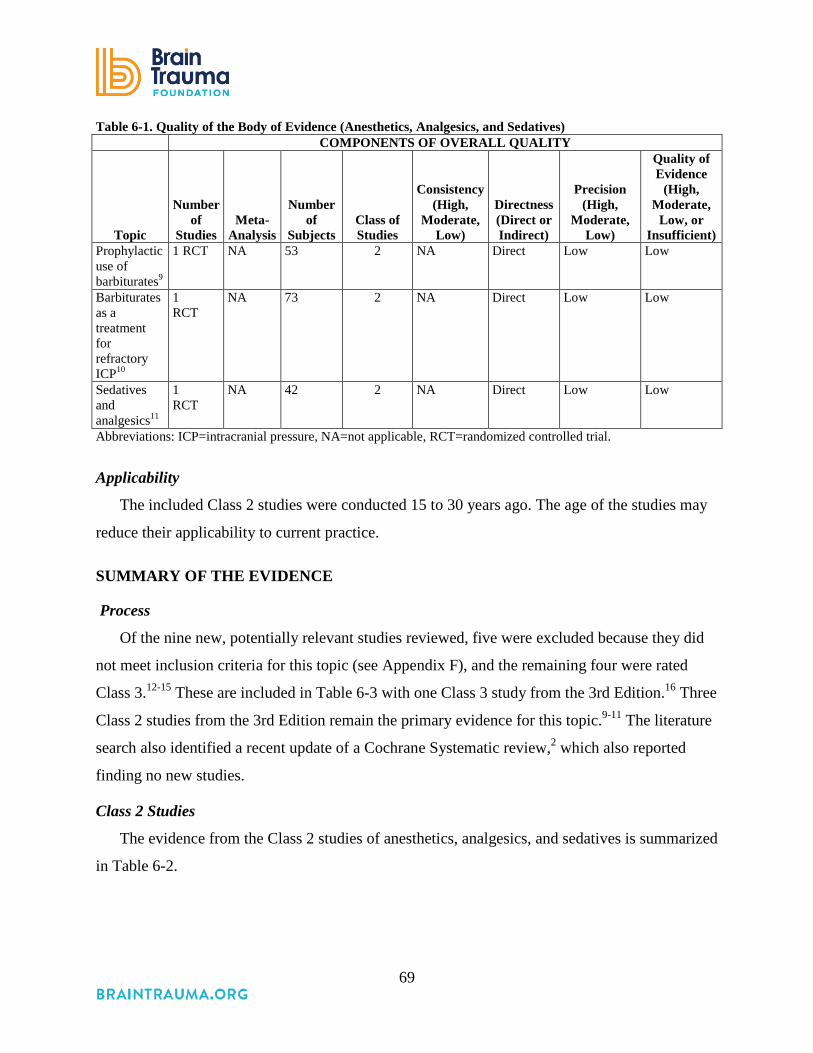
69
Table 6-1. Quality of the Body of Evidence (Anesthetics, Analgesics, and Sedatives) COMPONENTS OF OVERALL QUALITY
Topic
Number
of Studies
Meta-Analysis
Number
of Subjects
Class of Studies
Consistency (High,
Moderate, Low)
Directness (Direct or Indirect)
Precision (High,
Moderate, Low)
Quality of Evidence
(High, Moderate,
Low, or Insufficient)
Prophylactic use of barbiturates9
1 RCT NA 53 2 NA Direct Low Low
Barbiturates as a treatment for refractory ICP10
1 RCT
NA 73 2 NA Direct Low Low
Sedatives and analgesics11
1 RCT
NA 42 2 NA Direct Low Low
Abbreviations: ICP=intracranial pressure, NA=not applicable, RCT=randomized controlled trial.
Applicability
The included Class 2 studies were conducted 15 to 30 years ago. The age of the studies may
reduce their applicability to current practice.
SUMMARY OF THE EVIDENCE
Process
Of the nine new, potentially relevant studies reviewed, five were excluded because they did
not meet inclusion criteria for this topic (see Appendix F), and the remaining four were rated
Class 3.12-15 These are included in Table 6-3 with one Class 3 study from the 3rd Edition.16 Three
Class 2 studies from the 3rd Edition remain the primary evidence for this topic.9-11 The literature
search also identified a recent update of a Cochrane Systematic review,2 which also reported
finding no new studies.
Class 2 Studies
The evidence from the Class 2 studies of anesthetics, analgesics, and sedatives is summarized
in Table 6-2.

70
Table 6-2. Summary of Evidence: Class 2 Studies (Anesthetics, Analgesics, and Sedatives) Reference
Study Topic* Study Design, N, and Outcomes
Data Class
Results Conclusion
Studies from 3rd Edition Prophylactic use of Barbiturates Ward et al., 19859
To compare pentobarbital and standard treatment.
RCT N=53 Pentobarbital=27 Standard=26 Mortality Hypotension
Class 2 No significant difference in mortality or GOS at 1 year between groups. Hypotension (SBP<80 mm Hg) occurred in 54% of pentobarbital-treated patients vs. 7% of controls, p<0.001.
Barbiturates for Refractory ICP Eisenberg et al., 198810 To evaluate the influence of pentobarbital on patients with elevated ICP refractory to other treatment.
RCT N=73 Pentobarbital=37 Control=36 (crossover design allowed 32 of the 36 controls to receive pentobarbital Mortality
Class 2 ICP is more likely to be controlled in treatment arm. Patients who responded to treatment with lower ICP had higher likelihood of survival (92% vs. 17% for non-responders.) In patients with hypotension prior to randomization, barbiturates provided no benefit.
Sedatives and Analgesics Kelly et al., 199911
To compare propofol and morphine sulfate
RCT N=42 Propofol=23 Morphine sulfate=19 Mortality ICP TIL GOS
Class 2 Favorable outcome at 6 months Propofol 52.5% Morphine Sulfate 47.4% ICP and TIL were lower on day 3, p<0.05, in patients receiving propofol. There was no effect on mortality. In a post-hoc analysis of high vs. low-dose propofol patients, GOS favorable outcome was 70% vs. 38.5%, respectively, p<0.05.
Abbreviations: GOS=Glasgow Outcome Scale, ICP=intracranial pressure, N=total sample size, RCT=randomized controlled trial, TIL=therapy intensity level. *No new Class 2 studies were added to this edition.
Barbiturates
In 1985, Ward et al. reported results of a randomized controlled trial (RCT) of pentobarbital
in 53 consecutive TBI patients who had an acute intradural hematoma or whose best motor
response was abnormal flexion or extension.9 There was no significant difference in 1-year GOS
between treated patients and controls, while six in each group died from uncontrollable ICP. The
undesirable side effect of hypotension (SBP<80 mm Hg) occurred in 54% of the barbiturate-
treated patients compared with 7% in the control group (p<0.001).
Eisenberg et al., 1988 conducted a five-center RCT of high-dose barbiturate therapy for
intractable ICP elevation in patients with a Glasgow Coma Scale (GCS) of 4-8.10 ICP control

71
was the primary outcome measure, although mortality was also assessed. The patients were
randomly allocated to barbiturate treatment or control when standard conventional therapy failed.
Patients in the control group were electively crossed over to barbiturate therapy at specific “ICP
treatment failure” levels. There were 36 controls and 32 study patients, although 32 of the
controls ultimately crossed over and received barbiturates. The odds of ICP control were two
times greater with barbiturate treatment. The likelihood of survival for barbiturate responders
was 92% at 1 month compared with 17% for non-responders. Of all deaths, 80% were due to
refractory ICP. At 6 months, 36% of responders and 90% of non-responders were vegetative or
had died. Due to the study design, the effects of barbiturate treatment on any outcome other than
mortality cannot be conclusively determined. Additionally, when comparing the non-crossover
control patients (n=10) with the patients initially randomized to barbiturates, the effect on
mortality was lost (100% vs. 97.7% survival).
In 1999, The Cochrane Injuries Group undertook a systematic review of RCTs of barbiturates
as part of the treatment for acute traumatic brain injury, and has been updating this review
periodically.2 Their update in 2012 (the latest report) did not identify any new studies. The group
concluded that “There is no evidence that barbiturate therapy in patients with acute severe head
injury improves outcome. Barbiturate therapy results in a fall in blood pressure in one of four
patients. The hypotensive effect will offset any ICP lowering effect on cerebral perfusion
pressure.” All studies included in this review were conducted prior to the initial search date for
this edition except Perez-Barcena, 2008, which is included here.
Sedatives and Analgesics
Kelly et al., 1999 examined the use of propofol for treating severe TBI.11 This double-
blinded RCT compared multiple endpoints for patients who received either propofol or morphine
sulfate. Propofol has become a widely used neuro-sedative, as its hypnotic anesthetic agent has a
rapid onset and short duration of action. In addition, propofol has been shown to depress cerebral
metabolism and oxygen consumption and thus has a putative neuroprotective effect. The primary
end-point of the trial was drug safety, but they also evaluated clinically relevant end-points,
including ICP control, cerebral perfusion pressure (CPP), therapeutic intensity level (TIL) for
ICP/CPP control, 6-month neurologic outcome, and treatment-related adverse events. Daily

72
mean ICP and CPP were similar between the two groups; however, on day 3, ICP was lower in
the propofol group (p<0.05) and the TIL overall was higher in the morphine group.
There were no significant differences between groups in mortality or GOS. A favorable
neurologic outcome based on the GOS occurred in 52.5% of patients treated with propofol
compared with 47.4% of those receiving morphine, with mortality rates of 17.4% and 21.1%
respectively. In a post hoc analysis authors compared outcomes for patients receiving “high
dose” (total dose of >100 mg/kg for >48 hours) versus “low dose” propofol. While there were no
significant differences in ICP/CPP between these groups, there was a significant difference in
neurologic outcome: high-dose favorable outcome 70% versus low-dose 38.5% (p<0.05).
Significant concerns have subsequently arisen regarding the safety of high-dose propofol
infusions. Propofol infusion syndrome was first identified in children but can occur in adults as
well. Common clinical features include hyperkalemia, hepatomegaly, lipemia, metabolic
acidosis, myocardial failure, rhabdomyolysis, and renal failure, resulting in death. Thus, extreme
caution must be taken when using doses greater than 5 mg/kg/hour, or when usage of any dose
exceeds 48 hours in critically ill adults.8
Class 3 Studies
The evidence from the Class 3 studies of anesthetics, analgesics, and sedatives is summarized
in Table 6-3.
Table 6-3. Summary of Evidence: Class 3 Studies (Anesthetics, Analgesics, and Sedatives) Reference
Study Topic Study Design, N and Outcomes Data Class
Results Conclusion
New Studies Barbiturates Majdan 2013*12 Barbiturate use and its effects in patients with severe TBI
Observational studies in 13 centers in 5 European countries N=1172 High barbiturates=71 (6%) Low barbiturates=140 (13%) No barbiturate= 961 (81%) ICP
Class 3 Few patients were given barbiturates. High barbiturates decreased ICP in 22 of 32 patients, but caused hemodynamic instability. After adjustment for baseline differences there were no significant differences in outcomes.

73
Reference Study Topic Study Design, N and Outcomes
Data Class
Results Conclusion
Perez-Barcena 2008*13 To assess the effectiveness of pentobarbital and thiopental in controlling refractory ICP
Prospective, randomized, cohort study. N=44 Pentobarbital=22 Thiopental=22 ICP Hypotension Respiratory infection Urinary infection Positive blood culture ICP catheter colonization CNS infection (CSF) SOFA pre and SOFA max
Class 3 Uncontrollable intracranial pressure occurred in 11 patients (50%) in the thiopental treatment group and in 18 patients (82%) in the pentobarbital group, p=0.03. Thiopental was more effective than pentobarbital in terms of controlling intracranial pressure (OR 5.1, 95% CI 1.2 to 21.9), p=0.027, but CT characteristics and dosages were not similar across groups. The incidence of adverse effects was similar in both groups.
Sedatives and Analgesics Chiu 2006*14 Propofol for head-injured patients
Retrospective Cohort N=104 Propofol=44 Non propofol=60 Survival rate Mean ICP Mean CPP Mean GCS Mean PaCO2
Class 3 Propofol vs. Non propofol Survival 81.2% vs. 46.47%, p<0.001. Mean ICP 3 days 17.23 vs. 33.19, p=0.017. Mean CPP 5 days 71.10 vs. 43.20, p<0.001. Mean PaCO2 5 days 23.15 vs. 24.71, p=0.350. No significant adverse drug reactions.
Ghori 2007*15 Propofol vs. midazolam
Prospective, double-blind, randomized trial. N=28 Treatment=15 Control=13 Serum S100B concentrations, concentration of nitric oxide then associated with neurological outcome at 3 months (indirect evidence).
Class 3 Good neurological outcome 8/15 (53%) in the midazolam group and 7/13 (54%) in the propofol group. Patients with a poor outcome had higher serum S100β concentrations on ICU admission and on Days 1–4 in the ICU than those with a good outcome No significant difference on Day 5. Plasma nitric oxide concentrations were not associated with outcome.
Study from 3rd Edition Prophylactic use of Barbiturates Schwartz 198416 Prophylactic pentobarbital vs. mannitol therapy for ICP elevations >25 mm Hg.
RCT of N=59 Prophylactic pentobarbital=28 Mannitol=31 Patients stratified based on presence/absence of intracranial hematoma.
Class 3 Pentobarbital provided no benefits in mortality or ICP control for patients with intracranial mass lesions. In patients with diffuse injury, there was no benefit to ICP control, and significantly higher mortality in the pentobarbital group, p=0.03.
Abbreviations: CT=computed tomography, GCS= Glasgow Coma Scale, ICP=intracranial pressure, ICU=intensive care unit. *References new to the 4th Edition.
74
Barbiturates
The Class 3 studies of barbiturates provided no results that can be used to inform new or
revised recommendations that would differ from those informed by the older Class 2 studies. A
multi-site, multi-country retrospective study found low overall use of barbiturates, no difference
in outcomes after adjustment for baseline differences, and that while ICP decreased, the
treatment caused hemodynamic instability.12 Likewise, the Class 3 study from the prior edition
found no benefit and a higher mortality rate in patients treated with pentobarbital.16 A study that
compared pentobarbital to thiopental reported that thiopental was more effective in controlling
ICP but differences in the patient characteristics and the doses reduced confidence in the
findings.13
Sedatives
The two Class 3 studies of sedatives new to this edition were not incorporated into the
recommendations as higher-quality studies were available. Ghori, 2007 compared propofol and
midazolam and found that the outcomes were similar.15 Chiu, 2006 reported a positive effect of
treatment with sedatives but from a retrospective study that did not control for CT differences or
collect complete data on adverse events.14
REFERENCES
1. Mellion SA, Bennett KS, Ellsworth GL, et al. High-dose barbiturates for refractory intracranial hypertension in children with severe traumatic brain injury. Pediatr Crit Care Med. 2013;14(3):239-247. PMID: 23392360.
2. Roberts I, Sydenham E. Barbiturates for acute traumatic brain injury. Cochrane Database Syst Rev. 2012;12:CD000033. PMID: 23235573.
3. Bar-Joseph G, Guilburd Y, Tamir A, Guilburd JN. Effectiveness of ketamine in decreasing intracranial pressure in children with intracranial hypertension. J Neurosurg Pediatr. Jul 2009;4(1):40-46. PMID: 19569909.
4. Mijzen EJ, Jacobs B, Aslan A, Rodgers MG. Propofol infusion syndrome heralded by ECG changes. Neurocrit Care. Oct 2012;17(2):260-264. PMID: 22847396.
5. Roberts DJ, Hall RI, Kramer AH, Robertson HL, Gallagher CN, Zygun DA. Sedation for critically ill adults with severe traumatic brain injury: a systematic review of randomized controlled trials. Crit Care Med. Dec 2011;39(12):2743-2751. PMID: 22094498.
6. Bilotta F, Gelb AW, Stazi E, Titi L, Paoloni FP, Rosa G. Pharmacological perioperative brain neuroprotection: a qualitative review of randomized clinical trials. Br J Anaesth. Jun 2013;110 Suppl 1:i113-120. PMID: 23562933.

75
7. U.S. Food and Drug Administration. Diprivan (propofol) Injectable Emulsion. 2008; http://www.accessdata.fda.gov/drugsatfda_docs/label/2008/019627s046lbl.pdf. Accessed August 4, 2016.
8. Kang TM. Propofol infusion syndrome in critically ill patients. Ann Pharmacother. Sep 2002;36(9):1453-1456. PMID: 12196066.
9. Ward JD, Becker DP, Miller JD, et al. Failure of prophylactic barbiturate coma in the treatment of severe head injury. J Neurosurg. Mar 1985;62(3):383-388. PMID: 3882899.
10. Eisenberg HM, Frankowski RF, Contant CF, Marshall LF, Walker MD. High-dose barbiturate control of elevated intracranial pressure in patients with severe head injury. J Neurosurg. Jul 1988;69(1):15-23. PMID: 3288723.
11. Kelly DF, Goodale DB, Williams J, et al. Propofol in the treatment of moderate and severe head injury: a randomized, prospective double-blinded pilot trial. J Neurosurg. Jun 1999;90(6):1042-1052. PMID: 10350250.
12. Majdan M, Mauritz W, Wilbacher I, Brazinova A, Rusnak M, Leitgeb J. Barbiturates use and its effects in patients with severe traumatic brain injury in five European countries. J Neurotrauma. Jan 2013;30(1):23-29. PMID: 22950895.
13. Perez-Barcena J, Llompart-Pou JA, Homar J, et al. Pentobarbital versus thiopental in the treatment of refractory intracranial hypertension in patients with traumatic brain injury: a randomized controlled trial. Crit Care. 2008;12(4):R112. PMID: 18759980.
14. Chiu WT, Lin TJ, Lin JW, Huang SJ, Chang CK, Chen HY. Multicenter evaluation of propofol for head-injured patients in Taiwan. Surg Neurol. 2006;66 Suppl 2:S37-42. PMID: 17071254.
15. Ghori KA, Harmon DC, Elashaal A, et al. Effect of midazolam versus propofol sedation on markers of neurological injury and outcome after isolated severe head injury: a pilot study. Crit Care Resus. Jun 2007;9(2):166-171. PMID: 17536986.
16. Schwartz ML, Tator CH, Rowed DW, Reid SR, Meguro K, Andrews DF. The University of Toronto head injury treatment study: a prospective, randomized comparison of pentobarbital and mannitol. Can J Neurol Sci. Nov 1984;11(4):434-440. PMID: 6440704.

76
7. Steroids
INTRODUCTION
Steroids were introduced in the early 1960s as a treatment for brain edema. Experimental
evidence accumulated that steroids were useful in the restoration of altered vascular permeability
in brain edema,1 reduction of cerebrospinal fluid production,2 attenuation of free radical
production, and other beneficial effects in experimental models.1,3-7 Glucocorticoids were found
to be beneficial to patients with brain tumors when administered in the perioperative period.8,9
Based on this experience with patients with brain tumors, glucocorticoids became commonly
administered to patients undergoing a variety of neurosurgical procedures and became
commonplace in the treatment of severe traumatic brain injury (TBI). However, studies of severe
TBI patients failed to find a benefit. After examining the existing evidence and conducting a
systematic review, Alderson et al., 1997 reported that the data available at the time indicated no
evidence for a beneficial effect of steroids to improve outcome in TBI patients.10 Analysis of the
trials with the best blinding of groups revealed the summary odds ratio for death was 1.04 (0.83
to 1.30), and for death and disability was 0.97 (0.77 to 1.23). The authors stated that a lack of
benefit from steroids remained uncertain, and recommended that a larger trial of greater than
20,000 patients be conducted to detect a possible beneficial effect of steroids. The Corticosteroid
Randomization After Significant Head Injury Trial (CRASH) trial was designed to provide high-
quality evidence on the impact of steroids on TBI patients.11,12
RECOMMENDATIONS
Level I
• The use of steroids is not recommended for improving outcome or reducing ICP. In
patients with severe TBI, high-dose methylprednisolone was associated with increased
mortality and is contraindicated.
Changes from Prior Edition
The body of evidence was updated to include the 6-month outcomes of the CRASH trial.14
There were no changes to the recommendations for this topic.
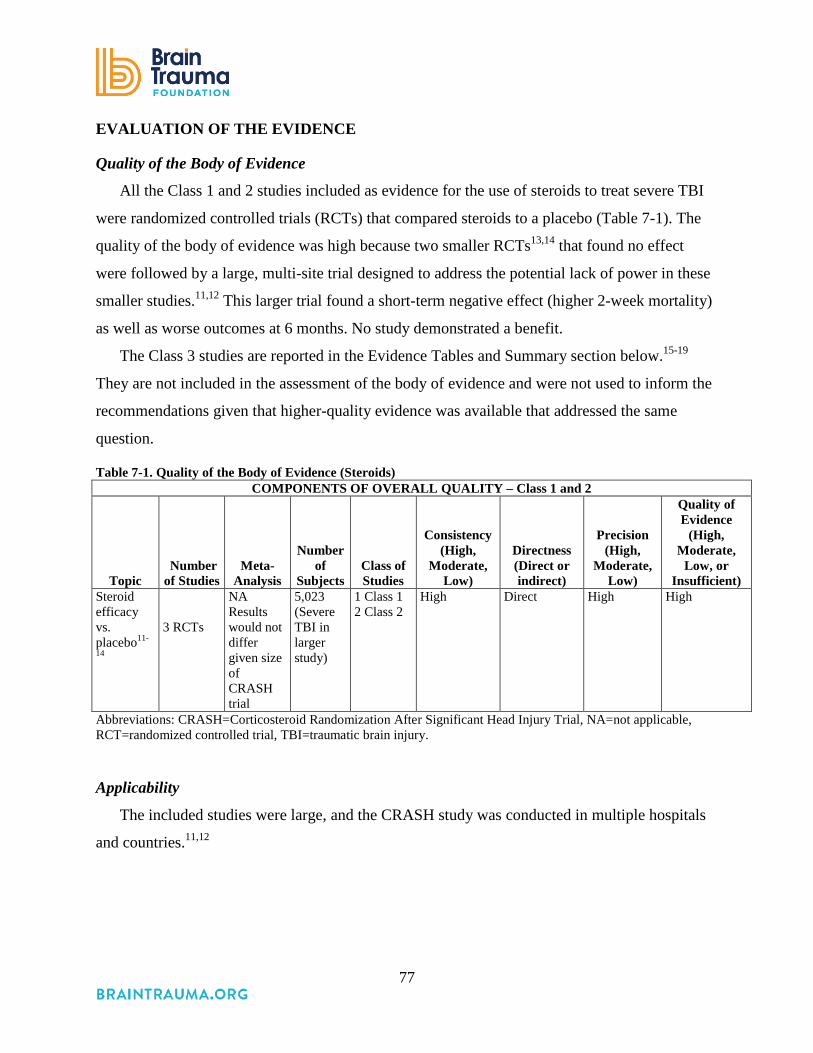
77
EVALUATION OF THE EVIDENCE
Quality of the Body of Evidence
All the Class 1 and 2 studies included as evidence for the use of steroids to treat severe TBI
were randomized controlled trials (RCTs) that compared steroids to a placebo (Table 7-1). The
quality of the body of evidence was high because two smaller RCTs13,14 that found no effect
were followed by a large, multi-site trial designed to address the potential lack of power in these
smaller studies.11,12 This larger trial found a short-term negative effect (higher 2-week mortality)
as well as worse outcomes at 6 months. No study demonstrated a benefit.
The Class 3 studies are reported in the Evidence Tables and Summary section below.15-19
They are not included in the assessment of the body of evidence and were not used to inform the
recommendations given that higher-quality evidence was available that addressed the same
question.
Table 7-1. Quality of the Body of Evidence (Steroids) COMPONENTS OF OVERALL QUALITY – Class 1 and 2
Topic Number of Studies
Meta-Analysis
Number
of Subjects
Class of Studies
Consistency (High,
Moderate, Low)
Directness (Direct or indirect)
Precision (High,
Moderate, Low)
Quality of Evidence
(High, Moderate,
Low, or Insufficient)
Steroid efficacy vs. placebo11-
14
3 RCTs
NA Results would not differ given size of CRASH trial
5,023 (Severe TBI in larger study)
1 Class 1 2 Class 2
High Direct High High
Abbreviations: CRASH=Corticosteroid Randomization After Significant Head Injury Trial, NA=not applicable, RCT=randomized controlled trial, TBI=traumatic brain injury.
Applicability
The included studies were large, and the CRASH study was conducted in multiple hospitals
and countries.11,12
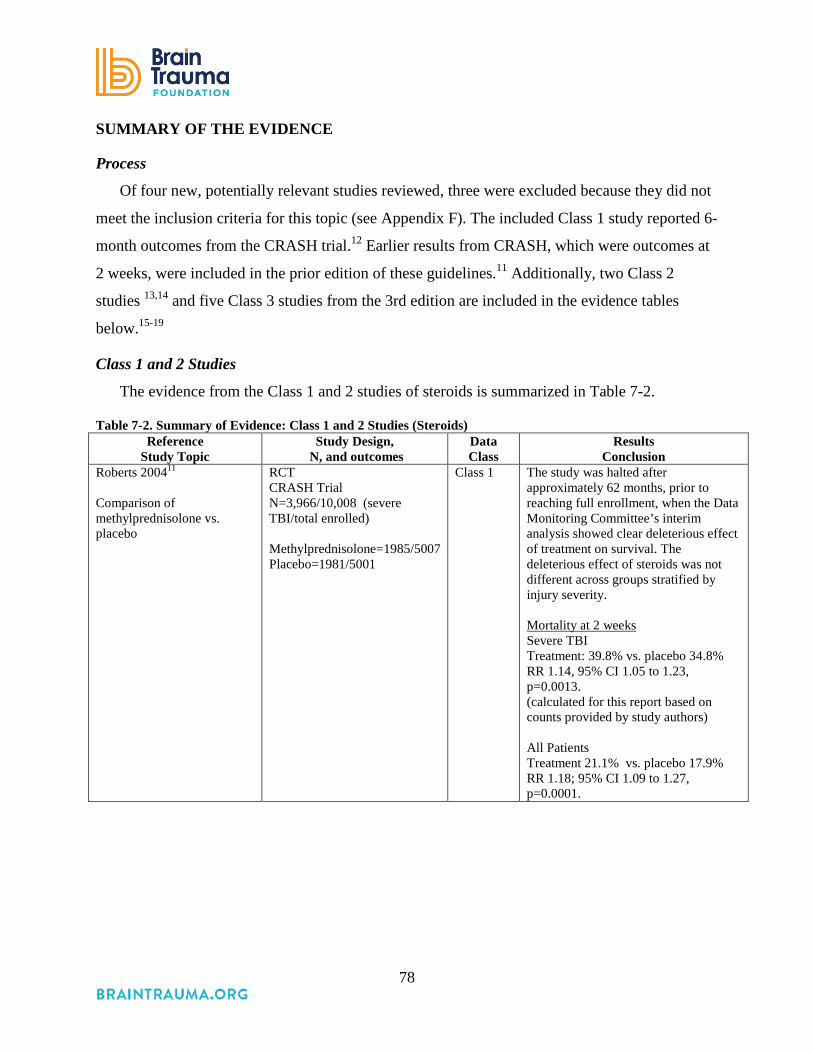
78
SUMMARY OF THE EVIDENCE
Process
Of four new, potentially relevant studies reviewed, three were excluded because they did not
meet the inclusion criteria for this topic (see Appendix F). The included Class 1 study reported 6-
month outcomes from the CRASH trial.12 Earlier results from CRASH, which were outcomes at
2 weeks, were included in the prior edition of these guidelines.11 Additionally, two Class 2
studies 13,14 and five Class 3 studies from the 3rd edition are included in the evidence tables
below.15-19
Class 1 and 2 Studies
The evidence from the Class 1 and 2 studies of steroids is summarized in Table 7-2.
Table 7-2. Summary of Evidence: Class 1 and 2 Studies (Steroids) Reference
Study Topic Study Design,
N, and outcomes Data Class
Results Conclusion
Roberts 200411 Comparison of methylprednisolone vs. placebo
RCT CRASH Trial N=3,966/10,008 (severe TBI/total enrolled) Methylprednisolone=1985/5007 Placebo=1981/5001
Class 1 The study was halted after approximately 62 months, prior to reaching full enrollment, when the Data Monitoring Committee’s interim analysis showed clear deleterious effect of treatment on survival. The deleterious effect of steroids was not different across groups stratified by injury severity. Mortality at 2 weeks Severe TBI Treatment: 39.8% vs. placebo 34.8% RR 1.14, 95% CI 1.05 to 1.23, p=0.0013. (calculated for this report based on counts provided by study authors) All Patients Treatment 21.1% vs. placebo 17.9% RR 1.18; 95% CI 1.09 to 1.27, p=0.0001.
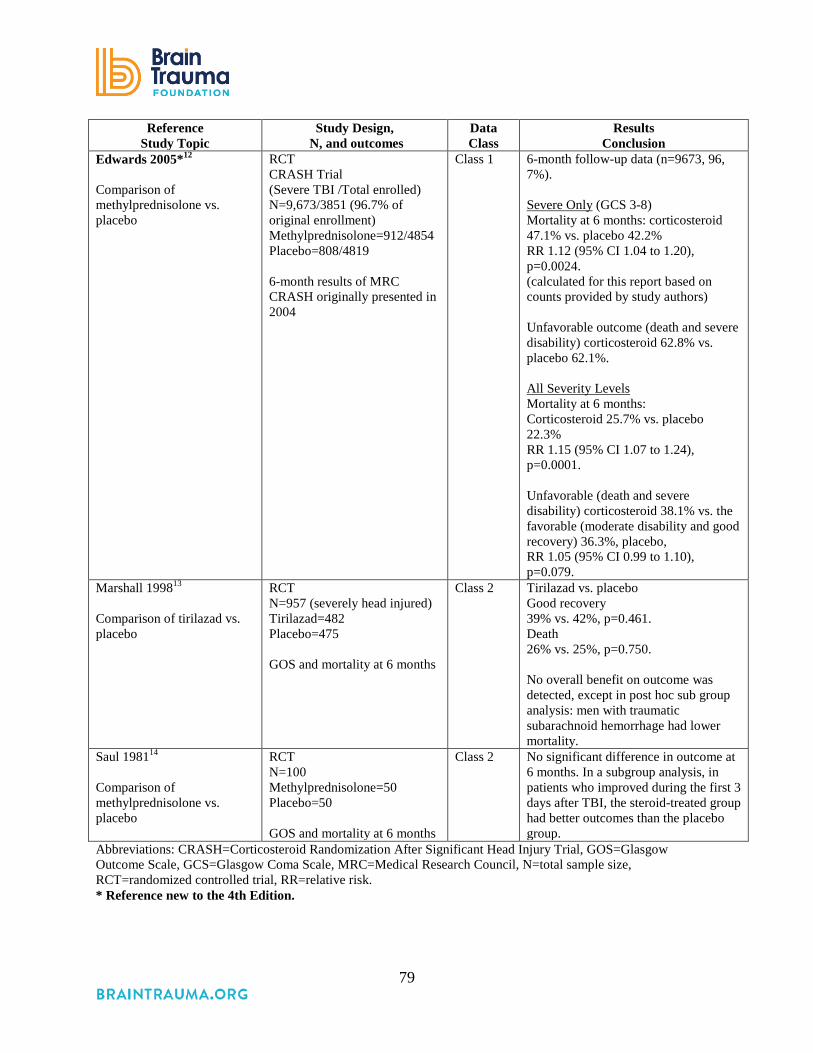
79
Reference Study Topic
Study Design, N, and outcomes
Data Class
Results Conclusion
Edwards 2005*12 Comparison of methylprednisolone vs. placebo
RCT CRASH Trial (Severe TBI /Total enrolled) N=9,673/3851 (96.7% of original enrollment) Methylprednisolone=912/4854 Placebo=808/4819 6-month results of MRC CRASH originally presented in 2004
Class 1 6-month follow-up data (n=9673, 96, 7%). Severe Only (GCS 3-8) Mortality at 6 months: corticosteroid 47.1% vs. placebo 42.2% RR 1.12 (95% CI 1.04 to 1.20), p=0.0024. (calculated for this report based on counts provided by study authors) Unfavorable outcome (death and severe disability) corticosteroid 62.8% vs. placebo 62.1%. All Severity Levels Mortality at 6 months: Corticosteroid 25.7% vs. placebo 22.3% RR 1.15 (95% CI 1.07 to 1.24), p=0.0001. Unfavorable (death and severe disability) corticosteroid 38.1% vs. the favorable (moderate disability and good recovery) 36.3%, placebo, RR 1.05 (95% CI 0.99 to 1.10), p=0.079.
Marshall 199813 Comparison of tirilazad vs. placebo
RCT N=957 (severely head injured) Tirilazad=482 Placebo=475 GOS and mortality at 6 months
Class 2 Tirilazad vs. placebo Good recovery 39% vs. 42%, p=0.461. Death 26% vs. 25%, p=0.750. No overall benefit on outcome was detected, except in post hoc sub group analysis: men with traumatic subarachnoid hemorrhage had lower mortality.
Saul 198114 Comparison of methylprednisolone vs. placebo
RCT N=100 Methylprednisolone=50 Placebo=50 GOS and mortality at 6 months
Class 2 No significant difference in outcome at 6 months. In a subgroup analysis, in patients who improved during the first 3 days after TBI, the steroid-treated group had better outcomes than the placebo group.
Abbreviations: CRASH=Corticosteroid Randomization After Significant Head Injury Trial, GOS=Glasgow Outcome Scale, GCS=Glasgow Coma Scale, MRC=Medical Research Council, N=total sample size, RCT=randomized controlled trial, RR=relative risk. * Reference new to the 4th Edition.

80
The hypothesis that steroids would be beneficial in treating TBI was tested in two Class 2
RCTs conducted in 1981 and 1998. One comparatively small RCT included 100 patients.14 One
group received methylprednisolone 5 mg/kg/day and the control group received no drug. There
was no statistically significant difference in outcomes (mortality and GOS) between the treated
and non-treated groups at 6 months. A subgroup analysis indicated that patients in the treatment
group who improved during the first 3 days after TBI had better outcomes than patients who
improved in the placebo group. In 1998, Marshall et al. conducted a larger RCT of the effect of
the synthetic 21-amino steroid, tirilazad mesylate, on outcomes for patients with severe TBI.13
The trial enrolled 957 patients and found no overall benefit.
In 2004, investigators with the CRASH trial reported the results of an international RCT of
methylprednisolone in patients with TBI that included 10,008 patients from 239 hospitals in 49
countries.11 Participants were randomized to receive either 2 g intravenous methylprednisolone
followed by 0.4 mg/hour for 48 hours, or placebo. Inclusion criteria were age 16 years or greater,
Glasgow Coma Scale (GCS) 14 or less, and hospital admission within 8 hours of injury.
Exclusion criteria included any patient with clear indications or contraindications for
corticosteroids as interpreted by the referring or admitting physicians.
The data monitoring committee halted the study after approximately 5 years and 2 months of
enrollment when interim analysis showed a deleterious effect of methylprednisolone. Two-week
mortality in the steroid group was 21% versus 18% in controls, with a 1.18 relative risk of death
in the steroid group (95% CI 1.09 to 1.27, p=0.0001). This increase persisted even when the
results were adjusted for the presence of extracranial injuries. The authors stated that the cause of
the increase in mortality was unclear, but was not due to infections or gastrointestinal bleeding.
Edwards et al., 2005 reported the 6-month follow-up data (n=9,673, 96.7% of the original
cohort) for the same trial.12 These data also demonstrated a significant increase in mortality in
the corticosteroid group (25.7%) compared with the placebo group (22.3%) (95% CI 1.07 to
1.24; p=0.0001). In addition, there were more corticosteroid-treated subjects in the unfavorable
outcomes group (death and severe disability, 38.1%) compared with the favorable group
(moderate disability and good recovery 36.3%; [RR 1.05; 95% CI 0.99 to 1.10; p=0.079]),
supporting the initial conclusion that corticosteroids were harmful in the setting of severe TBI.

81
Both the 2-week and 6-month mortality results were reported for the subgroup of patients with
severe TBI (GCS 3 to 8) and the results were similar (see Table 7-2).
Class 3 Studies
The evidence from the Class 3 studies of steroids is summarized in Table 7-3.
Table 7-3. Summary of Evidence: Class 3 Studies (Steroids) Reference
Study Topic Study Description Data Class Conclusion Studies from 3rd Edition
Cooper 197915 Comparison of dexamethasone vs. placebo
Prospective, double-blind study of 97 patients with severe TBI, stratified for severity, and treated with placebo 60 mg/day or 96 mg/day of dexamethasone; 76 patients available for follow-up at 6 months.
Class 3 No significant difference was seen in 6-month outcome, serial neurological exams or ICP.
Faupel 197616 Comparison of dexamethasone vs. placebo
Prospective, double-blind trial of dexamethasone vs. placebo in 95 patients with severe TBI.
Class 3 Significant improvement in mortality in steroid-treated group; however, overall outcome was not improved. Of the active treatment groups, 25.4% were vegetative and 11.9% were severely disabled vs. 3.6% and 7.1% in the control group, respectively.
Gaab 199417 Comparison of ultra- high dose dexamethasone vs. placebo
Randomized, double-blind, multicenter trial of ultra-high dose dexamethasone in 300 patients with moderate and severe TBI, randomized to placebo or dexamethasone: 500 mg within 3 hours of injury, followed by 200 mg after 3 hours, then 200 mg every 6 hours for 8 doses for a total dexamethasone dose of 2.3 g, given within 51 hours.
Class 3 No significant difference in 12-month outcome or in time to improvement to GCS score ≤ 8 in treatment group compared with placebo.
Giannotta 198418 Comparison of high-dose methylprednisolone vs. low-dose vs. placebo
Prospective, double-blind study of 88 patients with severe TBI. Patients randomized to placebo, low-dose methylprednisolone (30 mg/kg/day) or high-dose methylprednisolone (100 mg/kg/day).
Class 3 No significant difference in 6-month outcome in treatment groups compared with placebo. Subgroup analysis showed improved survival and speech function in patients under age 40 when high-dose group was compared with low-dose and placebo groups combined.
Watson 200419 Glucocorticoids
Prospective cohort of 404 patients. Baseline differences between groups (more dural penetration by surgery and more nonreactive pupils in treatment group).
Class 3 Patients who received glucocorticoids within 24 hrs had a 74% increase in risk of first late seizures, p=0.04. No difference in 2nd seizures or mortality.
Abbreviations: ICP=intracranial pressure, GCS=Glasgow Coma Scale, TBI=traumatic brain injury.

82
Five studies conducted between 1976 and 2004 were rated Class 3. The earliest by Faupel et
al. in 1976 reported that steroids had a favorable impact on mortality but not on overall outcome,
as patients were surviving severely disabled.16 Similarly, none of the four other studies showed
that patients experienced a substantial benefit from steroid treatment.15,17-19
REFERENCES
1. Maxwell RE, Long DM, French LA. The effects of glucosteroids on experimental cold-induced brain edema. Gross morphological alterations and vascular permeability changes. J Neurosurg. Apr 1971;34(4):477-487. PMID: 5554352.
2. Weiss MH, Nulsen FE. The effect of glucocorticoids on CSF flow in dogs. J Neurosurg. Apr 1970;32(4):452-458. PMID: 5417941.
3. Bracken MB, Shepard MJ, Hellenbrand KG, et al. Methylprednisolone and neurological function 1 year after spinal cord injury. Results of the Second National Acute Spinal Cord Injury Study J Neurosurg. 1985;63(5):704-713. PMID: 3903070.
4. Bracken MB, Shepard MJ, Collins WF, et al. A randomized, controlled trial of methylprednisolone or naloxone in the treatment of acute spinal-cord injury. Results of the Second National Acute Spinal Cord Injury Study. N Engl J Med. May 17 1990;322(20):1405-1411. PMID: 2278545.
5. Hall ED. The neuroprotective pharmacology of methylprednisolone. J Neurosurg. Jan 1992;76(1):13-22. PMID: 1727150.
6. Hall ED, Yonkers PA, McCall JM, Braughler JM. Effects of the 21-aminosteroid U74006F on experimental head injury in mice. J Neurosurg. Mar 1988;68(3):456-461. PMID: 3343616.
7. Pappius HM, McCann WP. Effects of steroids on cerebral edema in cats. Arch Neurol. Feb 1969;20(2):207-216. PMID: 5767019.
8. Renaudin J, Fewer D, Wilson CB, Boldrey EB, Calogero J, Enot KJ. Dose dependency of decadron in patients with partially excised brain tumors. J Neurosurg. Sep 1973;39(3):302-305. PMID: 4733430.
9. French LA, Galicich JH. The Use of Steroids for Control of Cerebral Edema. Clin Neurosurg. 1964;10:212-223. PMID: 14095874.
10. Alderson P, Roberts I. Corticosteroids in acute traumatic brain injury: systematic review of randomised controlled trials. BMJ. Jun 28 1997;314(7098):1855-1859. PMID: 9224126.
11. Roberts I, Yates D, Sandercock P, et al. Effect of intravenous corticosteroids on death within 14 days in 10008 adults with clinically significant head injury (MRC CRASH trial): randomised placebo-controlled trial. Lancet. Oct 9-15 2004;364(9442):1321-1328. PMID: 15474134.
12. Edwards P, Arango M, Balica L, et al. Final results of MRC CRASH, a randomised placebo-controlled trial of intravenous corticosteroid in adults with head injury-outcomes at 6 months. Lancet. Jun 2005;365(9475):1957-1959. PMID: 15936423.
83
13. Marshall LF, Maas AI, Marshall SB, et al. A multicenter trial on the efficacy of using tirilazad mesylate in cases of head injury. J Neurosurg. Oct 1998;89(4):519-525. PMID: 9761043.
14. Saul TG, Ducker TB, Salcman M, Carro E. Steroids in severe head injury: A prospective randomized clinical trial. J Neurosurg. May 1981;54(5):596-600. PMID: 7014790.
15. Cooper PR, Moody S, Clark WK, et al. Dexamethasone and severe head injury. A prospective double-blind study. J Neurosurg. Sep 1979;51(3):307-316. PMID: 381599.
16. Faupel G, Reulen H, Muller D, Schurmann K. Double-blind study on the effects of steroids on severe closed head injury. In: HM P, W F, eds. Dynamics of Brain Edema 1976: pages 337-343.
17. Gaab MR, Trost HA, Alcantara A, et al. "Ultrahigh" dexamethasone in acute brain injury. Results from a prospective randomized double-blind multicenter trial (GUDHIS). German Ultrahigh Dexamethasone Head Injury Study Group. Zentralblatt fur Neurochirurgie. 1994;55(3):135-143. PMID: 7810251.
18. Giannotta SL, Weiss MH, Apuzzo ML, Martin E. High dose glucocorticoids in the management of severe head injury. Neurosurg. Oct 1984;15(4):497-501. PMID: 6333649.
19. Watson NF, Barber JK, Doherty MJ, Miller JW, Temkin NR. Does glucocorticoid administration prevent late seizures after head injury? Epilepsia. 2004;45(6):690-694. PMID: 15144437

84
8. Nutrition
INTRODUCTION
The complex interaction of the body with nutritional support is magnified during illness,
particularly after severe traumatic brain injury (TBI). Seminal work from the 1980s
demonstrated that severe TBI was associated with increased energy expenditure early after
injury.1 The presumption has been that the TBI itself causes an intrinsic increase in metabolism
and requirement for caloric support—likely from a centrally mediated mechanism that is still
unknown. More recent evidence suggests that contemporary neurocritical care may blunt this
response,2,3 but these studies underscore the complex interactions that are in play simply in
determining how many calories should be administered to patients with severe TBI. Similarly, it
has long been known that an increase in serum glucose is observed after severe stress, including
severe TBI.4 Studies from other critical illnesses have demonstrated that controlling this response
with the use of insulin can lead to significant improvements in outcomes of critically ill patients.5
However, a similar approach in a population of adults with severe TBI demonstrated a
worrisome pattern of metabolic responses within the brain interstitial fluid, implying that the
practice of “tight glucose control” could have deleterious effects in patients with severe TBI.6
There are a number of questions that must be addressed for comprehensive guidance on
nutritional support. How many calories are required for optimal recovery? What is the optimal
method of administering these calories (enterally/parenterally/both)? When should this support
start? What should the composition of such support include with regard to carbohydrates,
proteins, and lipids? Are there nutritional supplements that might play a role in improved
recovery? What is the role of insulin in controlling serum glucose concentrations in this
vulnerable patient population? Can specialized diets play a role in the care of the patient with
severe TBI? The literature summarized below does not address all of these questions,
underscoring the need for more research on nutrition and severe TBI.
RECOMMENDATIONS
Level I
• There was insufficient evidence to support a Level I recommendation for this topic.

85
Level II A
• Feeding patients to attain basal caloric replacement at least by the fifth day and, at most,
by the seventh day post-injury is recommended to decrease mortality.
Level II B
• Transgastric jejunal feeding is recommended to reduce the incidence of ventilator-
associated pneumonia.
Changes from Prior Edition
Additional evidence was identified and incorporated into revised recommendations that
emphasize early nutrition and address the method of feeding. The questions considered for
nutrition did not change from the prior edition.
EVALUATION OF THE EVIDENCE
Quality of the Body of Evidence
The studies identified for this topic address four questions: (1) timing of feeding after
injury,7-11 (2) method of feeding,12 (3) glycemic control,13-15 and (4) vitamins and supplements.16
The quality of the body of evidence for the questions of timing and method of feeding was
sufficient to derive recommendations (Table 8-1). For glycemic control, the available evidence
was inconsistent and insufficient to support a recommendation. The evidence for vitamins and
supplements was insufficient, as only one small Class 2 study was identified in addition to the
two Class 3 studies from the 3rd Edition, and these studied different vitamins and supplements.

86
Table 8-1. Quality of the Body of Evidence (Nutrition) COMPONENTS OF OVERALL QUALITY
Topic Number of
Studies Meta-
Analysis
Number
of Subjects
Class of Studies
Consistency (High,
Moderate, Low)
Directness (Direct or Indirect)
Precision (High,
Moderate, Low)
Quality of Evidence
(High, Moderate,
Low, or Insufficient)
Timing of feeding7-11
3 RCTs 2 Retrospective cohort
No: Different Outcomes
1137 2 Moderate Direct Moderate Moderate
Method of feeding12
1 RCT NA 104 2 NA Direct Moderate Low
Glycemic control13-15
3 RCTs NA 425 2 Low Direct Low Insufficient
Vitamins and supplements16
1 RCT NA 38 2 NA Direct Low Insufficient
Abbreviations: NA=not applicable, RCT=randomized controlled trial.
Applicability
The studies of nutrition were predominately single-site studies, but they were conducted in a
variety of locations. One multi-center study was conducted in the United States,8 while two of
the single-site studies were conducted in the United States,10,16 and one each in Greece,7 the
United Kingdom,11 France,9 Spain,12 Italy,13 China,15 and Brazil.14
SUMMARY OF THE EVIDENCE
Process
Of the 21 new, potentially relevant studies reviewed, 11 were excluded because they did not
meet the inclusion criteria for this topic (Appendix F). Of the remaining 10, seven were rated
Class 27-9,12-15 and are included with the three Class 2 studies from the 3rd Edition.10,11,16 Three
were rated Class 3.17-19 These and 10 studies from the 3rd Edition4,20-28 were included as Class 3
evidence for this topic.
Class 2 Studies
The evidence from the Class 2 studies of nutrition is summarized in Table 8-2.

87
Table 8-2. Summary of Evidence: Class 2 Studies (Nutrition) Reference
Study Topic Study Design, N, and Outcomes
Data Class
Results Conclusion
Timing of Feeding Chourdakis, 2012*7 Comparison of early enteral feeding (within 24-48 hours) vs. delayed enteral feeding (>48 hours but no later than 5 days after admission to ICU)
RCT N=59 EEF=34 DEF=25 Complications Hormonal profile
Class 2
DEF vs. EEF N(%) vs. N(%), p-value VAP 12 (48.0) vs. 13 (38.2), p=0.637. Non VAP 8 (32.0) vs. 7(20.5), p=0.495. CNS infections 2 (8) vs. 2 (5.8), p=0.830. Hyperglycemia 4 (16.0) vs. 5 (14.7), p=0.805. Bacteremia, UTIs, diarrhea, constipation, feeding intolerance. All results not significant. There was no difference in infections, hyperglycemia, or other complications. Significant differences were found in intermediate outcomes with the EEF group receiving significantly more kcal/day at every time period and hormonal changes were significantly different suggesting early feeding may reduce inflammatory responses or reduce injury related changes.
Hartl, 2008*8 To determine the effect of nutrition given within 5 or 7 days on 2-week mortality
Retrospective Cohort N=797 Day Nutrition Reached Goal Day 1 to 3=43 Day 4 to 5=147 Day 6 to 7=113 Never reached within first 7 days=494 Mortality at 2 weeks
Class 2
2-week mortality Not fed within 7 days OR 4.10 (95% CI 1.80 to 9.32), p=0.0008. Never max nutrition in first 7 days OR 1.41 (95% CI 1.12 to 1.78), p=0.004. Never fed within 5 days OR 2.06 (95% CI 1.04 to 4.06), p=0.04. Never max nutrition in first 5 days OR 1.30 (95% CI 1.03 to 1.64), p=0.03. Nutritional support within 5 days was associated with a significant reduction in 2-week mortality.
Lepelletier, 2010*9 To determine the effect of early enteral feeding (initiated 24 hours after trauma) on early-onset Ventilator-acquired pneumonia
Retrospective Cohort N=161 EVAP=34 No VAP=96 Late VAP=31 Early onset VAP
Class 2
Early enteral feeding has a protective effect on EVAP in logistic regression controlling for other factors OR 0.33 (95% CI 0.21 to 0.85), p=0.022. Univariate Analysis of Factors Associated with EVAP Early feeding in patients with EVAP 22 out of 34 (64.7%) No EVAP 107 out of 127 (84.3%), p=0.006. Findings suggest early feeding was protective, resulting in lower rates of EVAP.
Rapp, 198310 To compare total parenteral nutrition with standard enteral nutrition
RCT N=38 TPN=20 SEN=18 Mortality
Class 2 There were 8 deaths in the enteral nutrition group and none in the parenteral nutrition group in the first 18 days, p<0.001. Early feeding reduced mortality from TBI.

88
Reference Study Topic
Study Design, N, and Outcomes
Data Class
Results Conclusion
Taylor, 199911 To compare early enhanced enteral feeding (full nutritional requirements from day 1) with standard feeding (gastric based on tolerance)
RCT N=82 Standard EN=41 Enhanced EN=41 GOS (3 months, 6 months) Infections
Class 2 There was a trend toward better GOS at 3 months in the accelerated feeding cohort, but no difference at 6 months. Accelerated feeding met goals faster in the first week and there were fewer infections.
Method of Feeding Acosta-Escribano, 2010*12 Comparison of transpyloric feeding route vs. gastric feeding route
RCT N=104 TPF=50 GF=54 Early pneumonia Late (ventilator-associated) pneumonia
Class 2
TPF=lower incidence of all pneumonia OR 0.3 (95% CI 0.1 to 0.7), p=0.01. Early=no significant difference Late OR 0.2 (95% CI 0.1 to 0.9), p=0.02. Other nosocomial infections, no significant difference TPF enabled greater volume than GF (92% vs. 84%), p<0.01 due to lower rates of gastric residuals, OR 0.2 (95% CI 0.04 to 0.6), p=0.003. TPF results in less pneumonia than GF feeding; primarily due to differences in late pneumonia.
Glycemic Control Bilotta, 2008*13 Comparison of intensive (I) (4.44–6.66 mmol/l) vs. conventional (C) insulin therapy (12.22 mmol/l)
RCT N=97 I=48 C=49 Hypoglycemic episodes Duration of ICU stay Infection rate GOS
Class 2
Conventional vs. Intensive Episodes of hypoglycemia for patients (<80 mg/dl or 4.44 mmol/l) median (min-max) 7 (0-11) vs. 15 (6-33), p<0.0001. At least one episode; N (%) 48 (98.0) vs. 48 (100.0), p=1.0. ICU stay (days, median) 10 vs. 7.7, p=0.05 Mortality at 6 months. (12.2) vs. 5 (10.4) GOS 5: 10 (20.4) vs. 11(22.9) GOS 4: 11 (22.5) vs. 12 (25.0) GOS 3: 12 (24.5) vs. 11(22.9) GOS 2: 10 (20.4) vs. 9 (18.8) No significant difference in morality The number of glycemic measurements below the hypoglycemia threshold was significantly higher in the intensive insulin group. There was no relationship between hypoglycemia and worsened outcome. ICU days were higher in the conventional group.
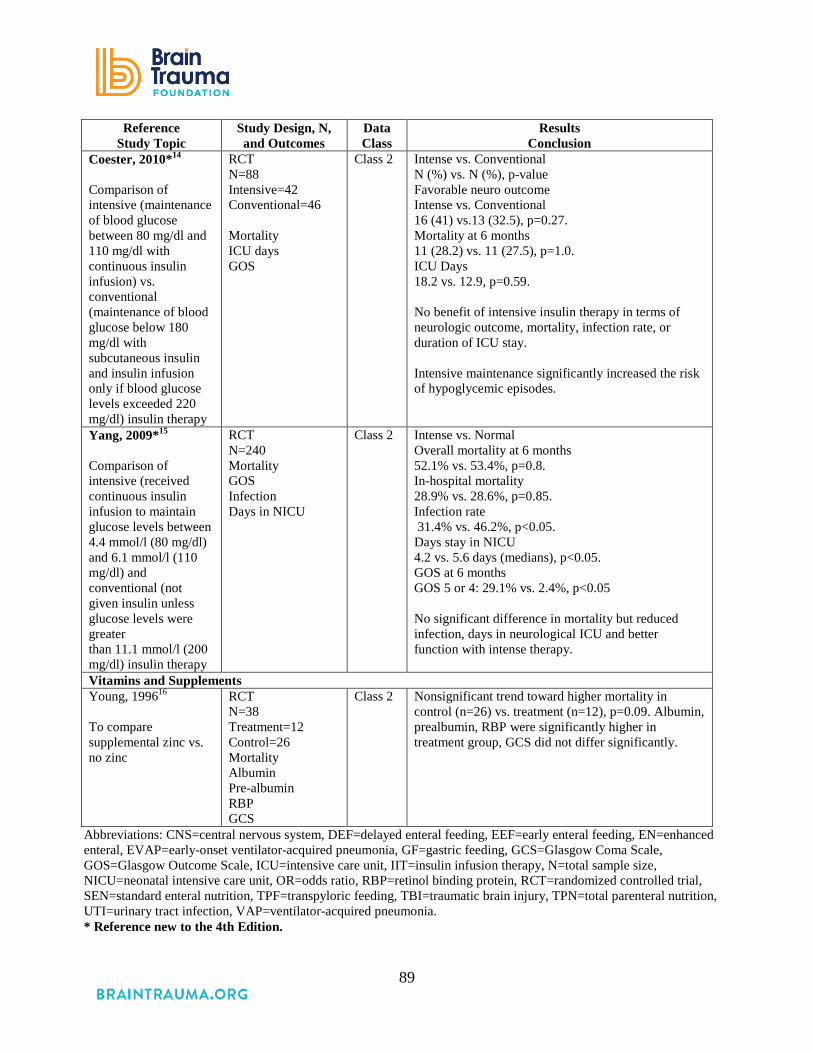
89
Reference Study Topic
Study Design, N, and Outcomes
Data Class
Results Conclusion
Coester, 2010*14 Comparison of intensive (maintenance of blood glucose between 80 mg/dl and 110 mg/dl with continuous insulin infusion) vs. conventional (maintenance of blood glucose below 180 mg/dl with subcutaneous insulin and insulin infusion only if blood glucose levels exceeded 220 mg/dl) insulin therapy
RCT N=88 Intensive=42 Conventional=46 Mortality ICU days GOS
Class 2
Intense vs. Conventional N (%) vs. N (%), p-value Favorable neuro outcome Intense vs. Conventional 16 (41) vs.13 (32.5), p=0.27. Mortality at 6 months 11 (28.2) vs. 11 (27.5), p=1.0. ICU Days 18.2 vs. 12.9, p=0.59. No benefit of intensive insulin therapy in terms of neurologic outcome, mortality, infection rate, or duration of ICU stay. Intensive maintenance significantly increased the risk of hypoglycemic episodes.
Yang, 2009*15 Comparison of intensive (received continuous insulin infusion to maintain glucose levels between 4.4 mmol/l (80 mg/dl) and 6.1 mmol/l (110 mg/dl) and conventional (not given insulin unless glucose levels were greater than 11.1 mmol/l (200 mg/dl) insulin therapy
RCT N=240 Mortality GOS Infection Days in NICU
Class 2
Intense vs. Normal Overall mortality at 6 months 52.1% vs. 53.4%, p=0.8. In-hospital mortality 28.9% vs. 28.6%, p=0.85. Infection rate 31.4% vs. 46.2%, p<0.05. Days stay in NICU 4.2 vs. 5.6 days (medians), p<0.05. GOS at 6 months GOS 5 or 4: 29.1% vs. 2.4%, p<0.05 No significant difference in mortality but reduced infection, days in neurological ICU and better function with intense therapy.
Vitamins and Supplements Young, 199616 To compare supplemental zinc vs. no zinc
RCT N=38 Treatment=12 Control=26 Mortality Albumin Pre-albumin RBP GCS
Class 2 Nonsignificant trend toward higher mortality in control (n=26) vs. treatment (n=12), p=0.09. Albumin, prealbumin, RBP were significantly higher in treatment group, GCS did not differ significantly.
Abbreviations: CNS=central nervous system, DEF=delayed enteral feeding, EEF=early enteral feeding, EN=enhanced enteral, EVAP=early-onset ventilator-acquired pneumonia, GF=gastric feeding, GCS=Glasgow Coma Scale, GOS=Glasgow Outcome Scale, ICU=intensive care unit, IIT=insulin infusion therapy, N=total sample size, NICU=neonatal intensive care unit, OR=odds ratio, RBP=retinol binding protein, RCT=randomized controlled trial, SEN=standard enteral nutrition, TPF=transpyloric feeding, TBI=traumatic brain injury, TPN=total parenteral nutrition, UTI=urinary tract infection, VAP=ventilator-acquired pneumonia. * Reference new to the 4th Edition.

90
Timing of Feeding After Injury
Five studies were included that examined the influence of the timing of feeding on outcomes.
Two Class 2 studies examined the influence of timing on mortality. Härtl et al., 2008 conducted
a retrospective analysis of 797 patients from 22 trauma centers in the United States and found
that early nutrition, defined as within the first 5 to 7 days post-injury, reduced 2-week mortality
in patients with severe TBI, and that the amount of nutrition was inversely correlated with
mortality.8 In a smaller randomized controlled trial (RCT) (n=38) Rapp et al.,1983 found that
early feeding reduced mortality within 18 days after injury.10
Chourdakis et al., 2012 focused on the influence of early compared with delayed feeding by
randomly assigning patients to one group that was fed within 24 to 48 hours (defined as early)
versus 48 hours to 5 days (defined as delayed).7 Their analysis found no significant difference in
rates of infection or complications. They demonstrated that early alimentation may improve
endocrinologic factors after TBI such as thyroid stimulating hormone and thyroid hormone.
Taylor, 1999 conducted an RCT comparing accelerated feeding (full caloric value on day 1) with
standard feeding (nutrition as tolerated) and found a trend toward improvement at 3 months but
no difference in outcome at 6 months as measured by the Glasgow Outcome Scale (GOS).11
One Class 2 cohort study (n=161) concluded that early feeding had a protective effect based
on lower rates of early-onset ventilator associated pneumonia in patients who received early
enteral feeding.9
Method of Feeding
There are three options for the method of early feeding: gastric, jejunal (transpyloric), and
parenteral. Percutaneous endoscopic gastrostomy is well tolerated in TBI patients, but there is
the concern that early intragastric feeding may pose the risk of formation of residual, delayed
gastric emptying, and aspiration pneumonia. Evidence from one Class 2 RCT of 104 severe TBI
patients found that transpyloric feeding is superior to gastric feeding as it reduced gastric residual
and patients had lower rates of ventilator-associated pneumonia.12
Glycemic Control
Three recent studies explored the influence of strict glucose control on neurological outcome,
mortality, and/or hypoglycemia in patients with severe TBI. All three studies failed to
demonstrate an improvement in mortality. Neurologic outcomes were not significantly different

91
in two studies13,14 while one study15 found some improvement in function at 6 months. Similarly,
ICU days were lower for the strict control group in two studies,13,15 while one study found no
significant difference.14 Increased incidence of hypoglycemic episodes occurred in the intensive
management groups in two of the studies.14, 15 Given the lack of consistency in these findings, it
is not clear whether aggressive therapy is better than conventional glucose control. For this
reason, the evidence was rated as insufficient and no recommendation about glucose control can
be made at this time.
Vitamins and Supplements
One pilot RCT16 published in 1996 (38 patients) found no significant effects of supplemental
zinc, although it is likely the study did not have sufficient power to detect changes in mortality or
function. Therefore, there is insufficient evidence about the influence of vitamins and
supplements to inform recommendations.
Class 3 Studies
The evidence from the Class 3 studies of nutrition is summarized in Table 8-3.
Table 8-3. Summary of Evidence: Class 3 Studies (Nutrition) Reference
Study Topic Study Design, N, and
Outcomes Data Class Results
Conclusion New Studies
Timing of Feeding Dhandapani 2012*17 Comparison of timing of feeding
Prospective Observational N=67 Mortality GOS Clinical Features of Malnutrition
Class 3 Mortality Timing of feeding: # (%) ≤3 days: 2/12 (17%) 4-7 days: 8/52 (15%) >7 days: 15/31 (48%). 80% of those fed before 3 days had favorable outcome at 3 months vs. 43% among those fed later. OR 5.29 (95% CI 1.03 to 27.03) p=0.04. The difference at 6 months was not significant. Clinical features of malnutrition: ≤3 days: 4/7 (57%) 4-7 days: 23/34 (68%) >7 days: 24/26 (92%)

92
Reference Study Topic
Study Design, N, and Outcomes Data Class
Results Conclusion
Vitamins and Supplements Razmkon 2011*18 Comparison of vitamin C, vitamin E, or placebo
RCT N=100 Group A Low Dose Vitamin C=26 Group B High Dose Vitamin C=23 Group C Vitamin E=24 Group D Placebo=27 Mortality
Class 3 Mortality at 6 months Group A - 9 (34.6%) Group B - 7 (30.4%) Group C - 6 (25.0%) Placebo - 8 (29.7%) The vitamin E group showed a significantly lower rate of mortality than the control and other treatment groups (p=0.04, Table 2). The GOS scores at discharge and follow-up were also significantly better for the vitamin E group patients, p=0.04.
Stippler 2007*19 Effect of magnesium level and correction of low levels
Retrospective Cohort Analysis Magnesium Replacement N=216 GOS at 6 months
Class 3 Low initial serum magnesium: 56.67% An initial serum magnesium of <1.3 mEq/L was 2.37 times more likely to have a poor outcome (CI 1.18 to 4.78, p=0.016). Depressed serum magnesium remained a predictor of poor outcomes, even in patients whose serum magnesium levels were corrected within 24 h (OR 11.03, CI 1.87 to 68.14), p<0.008. Patients with an initial high CSF magnesium were 7.63 more likely to have a poor outcome, p=0.05. Elevated CSF magnesium correlated with depressed serum magnesium only in patients with poor outcome, p=0.013. Patients with low serum magnesium and high cerebrospinal fluid magnesium are most likely to have poor outcome after severe TBI. Rapid correction of serum magnesium levels does not reverse the prognostic value of these markers.
Studies from 3rd Edition Timing of Feeding Rhoney, 200220
Bolus vs. continuous gastric feeding
Retrospective Cohort of 152 severe TBI subjects comparing bolus vs. continuous gastric feeding.
Class 3 Feeding intolerance was greater in bolus group. Continuous group reached 75% goals earlier, trend towards less infection in continuous feeding. No difference in outcome (hospital/ICU stay, GOS, death)
Method of Feeding Borzotta, 199421
Parenteral vs. jejunal nutrition
Energy expenditure (MREE) and nitrogen excretion (UNN) measured in patients with severe TBI randomized to early parenteral (TPN, n=21) or jejunal (ENT, n=17) feeding with identical formulations.
Class 3 Either TPN or ENT support is equally effective when prescribed according to individual measurements of MREE and nitrogen excretion. MREE rose to 2400 ±531 kcal/day in both groups & remained at 135% to 146% of predicted energy expenditure over 4 weeks. Nitrogen excretion peaked the second week at 33.4 (TPN) and 31.2 (ENT) g N/day. Equal effectiveness in meeting nutritional goals. Infection rates and hospital costs similar.

93
Reference Study Topic
Study Design, N, and Outcomes Data Class
Results Conclusion
Grahm, 198922
Nasojejunal vs. gastric nutrition
Thirty-two TBI patients were randomized to nasojejunal or gastric feeding. Nitrogen balance in the nasojejunal group was -4.3 g/day vs. -11.8 g/day in the gastric feeding group.
Class 3 Nasojejunal feeding permitted increased caloric intake and improved nitrogen balance.
Hadley, 198623
Parenteral vs. enteral nutrition
Forty-five acute TBI patients were randomized into 2 groups comparing the efficacy of TPN and enteral nutrition.
Class 3 TPN patients had significantly higher mean daily N intakes (p<0.01) and mean daily N losses (p<0.001) than nasogastric-fed patients; however, nitrogen balance was not improved. Patients with TBI who are fed larger nitrogen loads have exaggerated nitrogen losses.
Kirby, 199124 Effectiveness of enteral nutrition
Twenty-seven patients with severe TBI underwent feeding with percutaneous endoscopic gastrojejunostomy.
Class 3 Average nitrogen balance was -5.7 g/day. The reduction in N loss by this technique appeared equal or superior to gastric or TPN.
Klodell, 200025
Percutaneous endoscopic gastrostomy vs. intragastric feeding
Prospective observational study of 118 moderate to severe TBI patients provided percutaneous endoscopic gastrostomy and intragastric feeding.
Class 3 Intragastric feeding was tolerated in 111 of 114 patients. Five patients aspirated.
Young, 198726
Total parenteral nutrition vs. enteral nutrition
Fifty-one TBI patients with admission GCS 4-10 were randomized to receive TPN or enteral nutrition. The TPN group received higher cumulative intake of protein than the enteral nutrition group (8.75 vs. 5.7 g/day of N).
Class 3 Nitrogen balance was higher in the TPN group in the first week after injury. Caloric balance was higher in the TPN group (75% vs. 59%). Infections, lymphocyte counts, albumin levels were the same in both groups as was outcome. At 3 months the TPN group had a significantly more favorable outcome but at 6 months and 1 year the differences were not significant.
Young , 198727
Total parenteral nutrition vs. enteral nutrition
Ninety-six patients with severe TBI were randomly assigned to TPN or enteral nutrition. The incidence of increased ICP was measured in both groups for a period of 18 days.
Class 3 There was no difference in peak daily ICP, responses to therapies.
Glycemic Control Lam, 199128
Hyperglycemia and neurological outcome
The clinical course of 169 patients with moderate or severe TBI was retrospectively reviewed and outcome correlated with serum glucose.
Class 3 Among the more severely injured patients (GCS<8), a serum glucose level greater than 200 mg/dl postoperatively was associated with a significantly worse outcome.
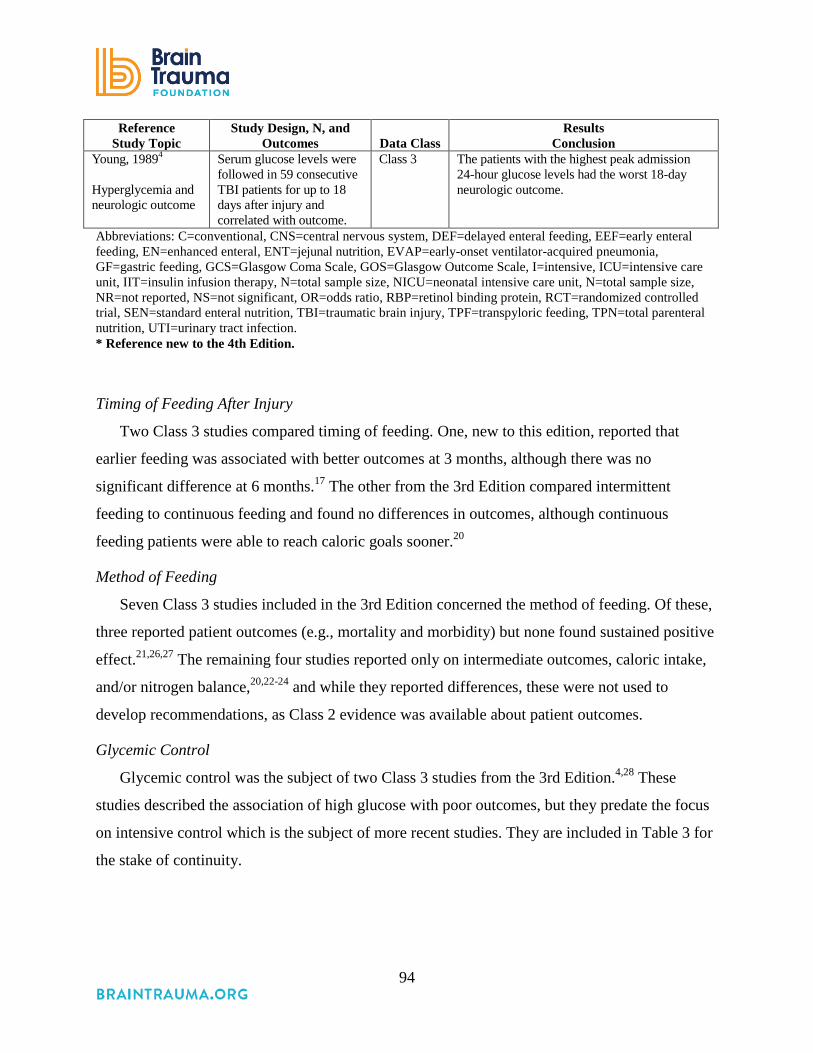
94
Reference Study Topic
Study Design, N, and Outcomes Data Class
Results Conclusion
Young, 19894
Hyperglycemia and neurologic outcome
Serum glucose levels were followed in 59 consecutive TBI patients for up to 18 days after injury and correlated with outcome.
Class 3 The patients with the highest peak admission 24-hour glucose levels had the worst 18-day neurologic outcome.
Abbreviations: C=conventional, CNS=central nervous system, DEF=delayed enteral feeding, EEF=early enteral feeding, EN=enhanced enteral, ENT=jejunal nutrition, EVAP=early-onset ventilator-acquired pneumonia, GF=gastric feeding, GCS=Glasgow Coma Scale, GOS=Glasgow Outcome Scale, I=intensive, ICU=intensive care unit, IIT=insulin infusion therapy, N=total sample size, NICU=neonatal intensive care unit, N=total sample size, NR=not reported, NS=not significant, OR=odds ratio, RBP=retinol binding protein, RCT=randomized controlled trial, SEN=standard enteral nutrition, TBI=traumatic brain injury, TPF=transpyloric feeding, TPN=total parenteral nutrition, UTI=urinary tract infection. * Reference new to the 4th Edition.
Timing of Feeding After Injury
Two Class 3 studies compared timing of feeding. One, new to this edition, reported that
earlier feeding was associated with better outcomes at 3 months, although there was no
significant difference at 6 months.17 The other from the 3rd Edition compared intermittent
feeding to continuous feeding and found no differences in outcomes, although continuous
feeding patients were able to reach caloric goals sooner.20
Method of Feeding
Seven Class 3 studies included in the 3rd Edition concerned the method of feeding. Of these,
three reported patient outcomes (e.g., mortality and morbidity) but none found sustained positive
effect.21,26,27 The remaining four studies reported only on intermediate outcomes, caloric intake,
and/or nitrogen balance,20,22-24 and while they reported differences, these were not used to
develop recommendations, as Class 2 evidence was available about patient outcomes.
Glycemic Control
Glycemic control was the subject of two Class 3 studies from the 3rd Edition.4,28 These
studies described the association of high glucose with poor outcomes, but they predate the focus
on intensive control which is the subject of more recent studies. They are included in Table 3 for
the stake of continuity.

95
Vitamins and Supplements
Two Class 3 studies that evaluated the impact of vitamins and supplements were added to
this edition. In one, patients given Vitamin E had lower mortality rates and better GOS scores,
but the sample size (N=100, 24 patients in the vitamin E group) and methodological concerns
made it insufficient to support a recommendation.18 The other study retrospectively examined
serum and CSF magnesium levels as well as whether low serum levels were corrected.
Correction of serum levels did not change the fact that low serum levels and elevated CSF level
seem to be associated with poor outcomes.19 This finding needs to be confirmed in additional
studies.
Concordance With Other Systematic Reviews
In conducting the literature searches for this section, we identified two systematic reviews of
studies of nutrition and severe TBI. We included some of the studies in these reviews and
excluded others. We also included studies that were not in these reviews. Given this overlap and
the fact that our evidence synthesis and these reviews reached similar conclusions, we decided to
describe the systematic reviews here in the text rather than include their results in the evidence
table.
Perel et al., 2008 conducted a review designed to quantify the effect of nutritional support
strategies on mortality and morbidity. They identified 11 trials: seven are included in our review
above; two were excluded for sample sizes under our requirement; and two did not include any
of our required clinical or intermediate outcomes. This review was limited to RCTs, so they did
not include observational studies that we included. The review authors concluded, as we did, that
early feeding is associated with better outcomes. Additionally, the review authors pooled the trial
results in order to compare parenteral to enteral routes and found no significant difference, with a
slight trend toward better outcomes with parenteral nutrition. However, the precision of the
estimates was low.29
Wang et al., 2013 also conducted a review of the research on the timing and route of feeding.
They included observational studies as well as RCTs and pooled the results of 16 studies (13
RCTs and 3 observational studies). Nine of these are included in our review: one is pediatric
only and is in the pediatric guideline; three had mixed ages, pathologies, or severity; and three
had small sample sizes. Combining the studies to include those we excluded for sample size did

96
not lead to a different conclusion. As such, we did not use the result of the meta-analysis. This
review also found that early feeding was associated with better outcomes, and that parenteral
nutrition is associated with slightly better outcomes than enteral routes, but the difference is not
significant.30
REFERENCES
1. Clifton GL, Robertson CS, Choi SC. Assessment of nutritional requirements of head-injured patients. J Neurosurg. Jun 1986;64(6):895-901. PMID: 3701439.
2. Osuka A, Uno T, Nakanishi J, Hinokiyama H, Takahashi Y, Matsuoka T. Energy expenditure in patients with severe head injury: controlled normothermia with sedation and neuromuscular blockade. J Crit Care. 2013;28(2). PMID: 22835423.
3. Mtaweh H, Smith R, Kochanek PM, et al. Energy expenditure in children after severe traumatic brain injury. Pediatr Crit Care Med. Mar;15(3):242-249. PMID: 24394999.
4. Young B, Ott L, Dempsey R, Haack D, Tibbs P. Relationship between admission hyperglycemia and neurologic outcome of severely brain-injured patients. Ann Surg. Oct 1989;210(4):466-472; discussion 472-463. PMID: 2679455.
5. Van den Berghe G, Wilmer A, Hermans G, et al. Intensive insulin therapy in the medical ICU. N Engl J Med. Feb 2006;354(5):449-461. PMID: 16452557.
6. Vespa P, Boonyaputthikul R, McArthur DL, et al. Intensive insulin therapy reduces microdialysis glucose values without altering glucose utilization or improving the lactate/pyruvate ratio after traumatic brain injury. Crit Care Med. Mar 2006;34(3):850-856. PMID: 16505665.
7. Chourdakis M, Kraus MM, Tzellos T, et al. Effect of early compared with delayed enteral nutrition on endocrine function in patients with traumatic brain injury: an open-labeled randomized trial. J Parenter Enteral Nutr. 2012;36(1):108-116. PMID: 21965459
8. Hartl R, Gerber LM, Ni Q, Ghajar J. Effect of early nutrition on deaths due to severe traumatic brain injury. J Neurosurg. Jul 2008;109(1):50-56. PMID: 18590432.
9. Lepelletier D, Roquilly A, Demeure dit latte D, et al. Retrospective analysis of the risk factors and pathogens associated with early-onset ventilator-associated pneumonia in surgical-ICU head-trauma patients. J Neurosurg Anesthesiol. Jan 2010;22(1):32-37. PMID: 20027012.
10. Rapp RP, Young B, Twyman D, et al. The favorable effect of early parenteral feeding on survival in head-injured patients. J Neurosurg. Jun 1983;58(6):906-912. PMID: 6406649.
11. Taylor SJ, Fettes SB, Jewkes C, Nelson RJ. Prospective, randomized, controlled trial to determine the effect of early enhanced enteral nutrition on clinical outcome in mechanically ventilated patients suffering head injury. Crit Care Med. Nov 1999;27(11):2525-2531. PMID: 10579275.
12. Acosta-Escribano J, Fernandez-Vivas M, Grau Carmona T, et al. Gastric versus transpyloric feeding in severe traumatic brain injury: a prospective, randomized trial. Intensive Care Med. 2010. PMID: 20495781.

97
13. Bilotta F, Caramia R, Cernak I, et al. Intensive insulin therapy after severe traumatic brain injury: a randomized clinical trial. Neurocrit Care. 2008;9(2):159-166. PMID: 18373223.
14. Coester A, Neumann CR, Schmidt MI. Intensive insulin therapy in severe traumatic brain injury: a randomized trial. J Trauma. Apr 2010;68(4):904-911. PMID: 20032790.
15. Yang M, Guo Q, Zhang X, et al. Intensive insulin therapy on infection rate, days in NICU, in-hospital mortality and neurological outcome in severe traumatic brain injury patients: a randomized controlled trial. Int J Nurs Stud. Jun 2009;46(6):753-758. PMID: 19232615.
16. Young B, Ott L, Kasarskis E, et al. Zinc supplementation is associated with improved neurologic recovery rate and visceral protein levels of patients with severe closed head injury. J Neurotrauma. Jan 1996;13(1):25-34. PMID: 8714860.
17. Dhandapani S, Dhandapani M, Agarwal M, et al. The prognostic significance of the timing of total enteral feeding in traumatic brain injury. Surg Neurol Int. 2012;3:31. PMID: 22530166.
18. Razmkon A, Sadidi A, Sherafat-Kazemzadeh E, et al. Administration of vitamin C and vitamin E in severe head injury: a randomized double-blind controlled trial. Clin Neurosurg. 2011;58:133-137. PMID: 21916138.
19. Stippler M, Fischer MR, Puccio AM, et al. Serum and cerebrospinal fluid magnesium in severe traumatic brain injury outcome. J Neurotrauma. Aug 2007;24(8):1347-1354. PMID: 17711396.
20. Rhoney DH, Parker D, Jr., Formea CM, Yap C, Coplin WM. Tolerability of bolus versus continuous gastric feeding in brain-injured patients. Neurol Res. Sep 2002;24(6):613-620. PMID: 12238631.
21. Borzotta AP, Pennings J, Papasadero B, et al. Enteral versus parenteral nutrition after severe closed head injury. J Trauma. Sep 1994;37(3):459-468. PMID: 8083910.
22. Grahm T, Zadrozny D, Harrington T. The benefits of early jejunal hyperalimentation in the head-injured patient. Neurosurg. 1989;25(5):729-735. PMID: 2511499.
23. Hadley MN, Grahm TW, Harrington T, Schiller WR, McDermott MK, Posillico DB. Nutritional support and neurotrauma: a critical review of early nutrition in forty-five acute head injury patients. Neurosurg. Sep 1986;19(3):367-373. PMID: 3093915.
24. Kirby DF, Clifton GL, Turner H, Marion DW, Barrett J, Gruemer HD. Early enteral nutrition after brain injury by percutaneous endoscopic gastrojejunostomy. J Parenter Enteral Nutr. May-Jun 1991;15(3):298-302. PMID: 1907678.
25. Klodell CT, Carroll M, Carrillo EH, Spain DA. Routine intragastric feeding following traumatic brain injury is safe and well tolerated. Am J Surg. Mar 2000;179(3):168-171. PMID: 10827311.
26. Young B, Ott L, Haack D, et al. Effect of total parenteral nutrition upon intracranial pressure in severe head injury. J Neurosurg. Jul 1987;67(1):76-80. PMID: 3110382.
27. Young B, Ott L, Twyman D, et al. The effect of nutritional support on outcome from severe head injury. J Neurosurg. Nov 1987;67(5):668-676. PMID: 3117982.
28. Lam AM, Winn HR, Cullen BF, Sundling N. Hyperglycemia and neurological outcome in patients with head injury. J Neurosurg. Oct 1991;75(4):545-551. PMID: 1885972.
29. Perel P, Yanagawa T, Bunn F, Roberts I, Wentz R, Pierro A. Nutritional support for head-injured patients. Cochrane Database Syst Rev. 2008(4):1-22. PMID: 17054137.

98
30. Wang X, Dong Y, Han X, Qi XQ, Huang CG, Hou LJ. Nutritional support for patients sustaining traumatic brain injury: a systematic review and meta-analysis of prospective studies. PLoS ONE [Electronic Resource]. 2013;8(3). PMID: 23527035.

99
9. Infection Prophylaxis
INTRODUCTION
There has been a strong movement to reduce hospital-acquired infections and minimize their
potentially devastating effects on hospital morbidity, mortality, and length of stay. Severe
traumatic brain injury can increase a patient’s susceptibility to infection because of necessary
mechanical ventilation to prevent airway obstruction, aspiration, and consequential hypoxia, in
addition to invasive monitoring. Infection risks such as ventilator associated pneumonias (VAP)
and central line-associated bacteremias are increased in all critically ill patients. Patients
undergoing intracranial pressure (ICP) monitoring are reported to have related infection rates as
high as 27%.1 For external ventricular drains (EVDs), the historic focus of routine catheter
exchanges has been replaced by attention to proper care during insertion, cerebrospinal fluid
(CSF) sampling techniques, and the question of whether prophylactic intravenous (IV)
antibiotics reduces infection rates or increases the risk for emergence of drug-resistant
organisms.2
While a larger volume of literature across the spectrum of critically ill patients has identified
techniques to reduce VAP, a small number of studies have addressed the severe traumatic brain
injury (TBI) population specifically. Definitions for use in the surveillance and prevention of
VAP were revised in 2011 and updated in 2015.3 In this Centers for Disease Control and
Prevention (CDC) definition, possible VAP requires a positive culture, purulent respiratory
secretions, or positive results on one of several tests. Data prior to the 2011 CDC definitions
show that VAP in patients with TBI may be as high as 40%, and it is strongly associated with
longer exposure to mechanical ventilation.4 The occurrence of VAP represents a significant
morbidity and is associated with factors such as hypoxia, fevers, hypotension, and increased ICP,
known to worsen the TBI patient’s hospital course. Similarly, the risk of infection associated
with EVDs is of particular concern for TBI patients. In this topic we focus on literature about
VAP and EVD infection.

100
RECOMMENDATIONS
Level I
• There was insufficient evidence to support a Level I recommendation for this topic.
Level II A
• Early tracheostomy is recommended to reduce mechanical ventilation days when the
overall benefit is felt to outweigh the complications associated with such a procedure.
However, there is no evidence that early tracheostomy reduces mortality or the rate of
nosocomial pneumonia.
• The use of povidone-iodine (PI) oral care is not recommended to reduce ventilator-
associated pneumonia and may cause an increased risk of acute respiratory distress
syndrome.
Level III
• Antimicrobial-impregnated catheters may be considered to prevent catheter-related
infections during EVD.
Changes from Prior Edition
The Level II recommendation from the 3rd Edition of these guidelines that stated
“Periprocedural antibiotics for intubation should be administered to reduce the incidence of
pneumonia” has not been carried forward. This was based on one Class 2 study (still listed in the
evidence table) that reported reductions in pneumonia but no improvement in mortality or
function. The recommendation was not carried forward, as the evidence of benefit is not strong
and general critical care practice has established protocols to prevent VAP, while infectious
disease policies do not endorse this use of antibiotics.
Two questions are addressed in the 4th Edition of these guidelines for this topic. The
question of prevention of VAP was maintained from the 3rd Edition because the rates of VAP
are higher in TBI patients than non-TBI patients. Also, the question of prevention of infection
associated with EVD was maintained. The recommendations from the 3rd Edition were revised
due to new evidence.

101
EVALUATION OF THE EVIDENCE
Quality of the Body of Evidence
The studies identified for this topic (Table 9-1) address two questions: (1) prevention of VAP
and (2) prevention of infection associated with EVD. For the question about VAP, the available
evidence addressed three approaches to preventing VAP in TBI patients. Three randomized
controlled trials (RCTs) assessed the influence of the timing of tracheostomy on pneumonia and
mortality.5-7 These studies provided moderate-quality evidence that timing does not influence
these outcomes. The second approach is oral care with PI. This was tested in two RCTs.8,9
However, the second, designed to address limitations of the first, failed to replicate the positive
findings, and included non-TBI as well as TBI patients. These factors contribute to the rating of
low quality of the body of evidence. The third approach, prophylactic antibiotics, was the subject
of one RCT that was included in the last edition of these guidelines.10 As a single study in one
site, this was considered insufficient evidence.
For the question about prevention of infection associated with EVD, two systematic
review/meta-analyses11,12 and two Class 3 studies13,14 about the use of antimicrobial-impregnated
catheters were included. These meta-analyses and studies were conducted with samples that
included any pathology requiring EVD. As such, the evidence could only support a Level III
recommendation.
Table 9-1. Quality of the Body of Evidence (Infection Prophylaxis)
Topic
Number of
Studies Meta-
Analysis
Number
of Subjects
Class of Studies
Consistency (High,
Moderate, Low)
Directness (Direct or Indirect)
Precision (High,
Moderate, Low)
Quality of Evidence
(High, Moderate,
Low, or Insufficient)
COMPONENTS OF OVERALL QUALITY Timing of tracheostomy5,6
2 RCTs
No Different definitions of early intervention
129 2 Moderate Direct Low Moderate
Povidone-iodine oral care8,9
2 RCTs
No Differences in study design
277 Class 1: 1 Class 2: 1
Low One Direct, One Indirect
Moderate Moderate
Prophylactic antibiotics10
1 RCT NA 100 2 NA Direct Low Insufficient

102
Topic
Number of
Studies Meta-
Analysis
Number
of Subjects
Class of Studies
Consistency (High,
Moderate, Low)
Directness (Direct or Indirect)
Precision (High,
Moderate, Low)
Quality of Evidence
(High, Moderate,
Low, or Insufficient)
Antimicrobial-impregnated catheters12,15
2 Meta-analyses
Yes 4,722 Moderate Quality Meta-analyses
Moderate Indirect Moderate Low
Abbreviations: NA=not applicable, RCT=randomized controlled trial.
Applicability
For the question about VAP, two of the three studies of timing of tracheostomy were at
single sites, one in Morocco5 and one in the United States.7 The third was conducted in six sites
in the United States.6 The studies of povidone-iodine (PI) oral care included one single-site study
and one study conducted in six sites that were both in France.8, 9 The single study of antibiotics
was conducted in Spain and published in 1997. It may not be relevant to current practice, as
many hospital infection control policies may limit antibiotic use in order to prevent antibiotic-
resistant infections.10
For the question about EVD, two studies were moderate-quality meta-analyses that pooled
data from RCTs and non-randomized prospective studies comparing antimicrobial-impregnated
catheters to standard catheters.12,15 We also included two Class 3 studies.13,14 Because the
samples mixed pathologies, the applicability to TBI patients is uncertain.
SUMMARY OF THE EVIDENCE
Process
Of 18 new, potentially relevant studies reviewed, nine were excluded because they did not
meet the inclusion criteria for this topic (Appendix F). Of the remaining nine, one was rated
Class 1,9 one Class 2,8 five Class 3,7,13,14,16,17 and two were rated moderate-quality meta-
analyses,12,15 which were included as evidence for this topic. Additionally, two Class 2 studies5,6
and two Class 3 studies18,19 from the 3rd Edition were included as evidence.

103
Class 1 and 2 Studies and Meta-Analyses
The evidence from the Class 1 and 2 studies and meta-analyses on infection prophylaxis is
summarized in Table 9-2.
Table 9-2. Summary of Evidence: Class 2 Studies and Meta-Analyses (Infection Prophylaxis) Reference,
Study Topic Study Design, N, and
Outcomes Data Class
Results Conclusion
VAP – Timing of Tracheostomy Bouderka, 20045 Early tracheostomy (5 or 6 days) vs. prolonged endotracheal intubation
RCT N=62 Early tracheostomies=31 Prolonged intubation=31 Pneumonia; mortality; Mechanical ventilation days; ICU days
Class 2 Early vs. Intubation Pneumonia 58% vs. 61.3%, p=0.79. Death 38.7% vs. 22.5%, p=0.27. Recovery 61.3% vs. 74.2%, p=0.41. There was no difference in the rate of mortality or pneumonia between the groups. Early tracheostomy group showed a decrease in the number of overall mechanical ventilation days, and mechanical ventilation days after the diagnosis of pneumonia. ICU days were not reduced.
Sugerman, 19976
Early (3-5 days) vs. late (10-14 days) tracheostomy
RCT N=67 had severe TBI Early tracheostomy=35 Late tracheostomy=25 Continued tracheostomy=7 Pneumonia; mortality; ICU stay
Class 2 There was no significant difference in rate of pneumonia or death in TBI patients undergoing early tracheostomy vs. later tracheostomy.
VAP – Oral Care Seguin, 2006*8 Comparison of PI, saline, and control (standard care)
RCT N=98 PI=36 Saline=31 Control=31 VAP
Class 2 % VAP (p value vs. PI) PI=8% Saline=39% p=0.003. Control 42%, p=0.001. Oral care with PI reduces VAP vs. standard care.

104
Reference, Study Topic
Study Design, N, and Outcomes
Data Class
Results Conclusion
Seguin, 2014*9 Comparison of oral care with PI vs. a placebo
RCT N=179 PI=91 Placebo=88 VAP Tracheobronchitis Acute respiratory distress syndrome ICU and hospital length of stay ICU and 90-day mortality
Class 1 VAP-PI vs. Placebo 31% vs. 28% RR 1.11 (95% CI 0.67 to 1.82), p=0.69. TBI Only 32% vs. 25%, p=0.346. Acute Respiratory Distress Syndrome PI=5, Placebo=0, p=0.06. No significant difference in other outcomes. No evidence to recommend PI oral care (no benefit) and increase risk of acute respiratory distress syndrome.
VAP – Prophylactic Antibiotics Sirvent, 199710 RCT
N=100 (86 with TBI) Antibiotics=50 (43 with TBI) No treatment=50 (43 with TBI) Pneumonia Mortality
Class 2 The overall incidence of pneumonia was 37%, 24% in Group 1, and 50% in the control group. The difference was statistically significant. There was no difference in mortality. A short course of prophylactic cefuroxime was effective in decreasing the incidence of nosocomial pneumonia in mechanically ventilated patients.
Catheter-related Infections During EVD Ratilal 2008*15 Compared AIS to placebo or no antibiotic to prevent shunt infections
Meta-analysis 17 studies included in review 10 RCTs 7 Non-randomized prospective studies N=2,134 15 included in meta-analysis
Moderate Quality
Pooled results showed a significant effect of antibiotics on rate of shunt infections (OR 0.51, 95% CI 0.36 to 0.73). For the included trials that had adequate allocation concealment, there was no significant effect of antibiotics on rate of shunt infections (OR 0.78, 95% CI 0.44 to 1.38). For included trials that did not report allocation conceal or that had inadequate allocation concealment, there was a significant effect of antibiotics on rate of shunt infections (OR 0.40, 95% CI 0.25 to 0.63). For placebo-controlled trials, there was a significant effect of antibiotics on rate of shunt infections (OR 0.46, 95% CI 0.30 to 0.71). For standard care-controlled trials, there was no significant effect of antibiotics on rate of shunt infections (OR 0.66, 95% CI 0.34 to 1.26).

105
Reference, Study Topic
Study Design, N, and Outcomes
Data Class
Results Conclusion
Wang 2013*12 Comparison of AIC to SC to prevent CFI
Meta-analysis 4 RCTs 4 Non-randomized prospective studies N=3,038
Moderate Quality
Overall rate of CFI: AIC group 3.6%, SC group 13.7% (OR, 0.25, 95% CI 0.12 to 0.52, p<0.05). Significant reduction in 20-Day infection rate for AIC group (HR 0.52, 95% CI 0.29 to 0.95, p<0.05). Significant decrease in rate of catheter bacterial colonization for AIC group (OR 0.37, 95% CI 0.21 to 0.64, p<0.05).
Abbreviations: AIC=antimicrobial-impregnated catheters, AIS=antibiotic-impregnated shunts, CFI=cerebrospinal fluid, CI=confidence interval, GOS=Glasgow Outcome Scale, GCS=Glasgow Coma Scale, HR=hazard ratio, ICU=intensive care unit, IIT=insulin infusion therapy, N=total sample size, OR=odds ratio, PI=povidone-iodine, RCT=randomized controlled trial, RR=relative risk, S=saline, SC=standard catheters, TBI=traumatic brain injury, VAP=ventilator-associated pneumonia * Reference new to the 4th Edition.
Ventilator Associated Pneumonia
Included Class 1 and 2 studies addressed three approaches to preventing pneumonia in TBI
patients. Two tested early tracheostomy,5,6 two tested oral care with povidone-iodine,8,9 and one
tested a short course of prophylactic antibiotics.10
Timing of Tracheostomy
Early tracheostomy has been proposed to decrease the incidence of pneumonia in critically ill
patients. Two randomized trials, with small numbers of subjects (n=62 and n=67) and different
definitions of early (3-5 days and 5-6 days), found no differences in pneumonia rates or mortality
in severe TBI patients undergoing early tracheostomy compared with patients with later
tracheostomy.5,6
Oral Care with Povidone-Iodine
Seguin et al. conducted two RCTs of the use of PI as an oral antiseptic.8,9 The first trial,
conducted in 2006, had three arms and compared PI to saline and usual care and found a
significant reduction in VAP with PI compared with standard care. This study was conducted at
one site and was not blinded. To address these limitations, a second study was conducted in 2014
in six ICUs to compare PI to a placebo mixture, and in which VAP assessment was blinded. This
study did not replicate the positive findings of the earlier study; it found no difference in VAP
rates and it reported significantly more cases of respiratory distress syndrome in the treatment
groups.
106
Prophylactic Antibiotics
Sirvent et al. conducted an RCT of 100 critically ill patients, 86% of whom had severe TBI,
evenly divided into a treatment group of cefuroxime 1.5 g for two doses within 6 hours after
intubation and a control group not given antibiotics after endotracheal intubation.10 There was a
statistically significant decrease in the incidence of pneumonia in the treated group but no
difference in mortality. This was the basis for the recommendation included in the 3rd Edition
that has not been carried forward, as the benefits of this use of prophylactic antibiotics may not
outweigh the harms of developing resistant organisms.
External Ventricular Drain
Ratilal et al. conducted a moderate-quality systematic review and meta-analysis comparing
shunt infection rates between patients managed with antibiotic-impregnated shunts (AIS) versus
placebo and standard care.15 Seventeen studies were reviewed (10 RCTs and 7 non-randomized
prospective studies; N=2,134) and 15 were included in the meta-analysis. While the pooled
results indicated a significant decrease in shunt infection for the AIS group, secondary analysis
showed no significant effect for the subset of studies with adequate allocation concealment, and
no significant effect for the subset of studies that compared AIS to standard care (vs. those that
compared AIS to placebo).
Similarly, Wang et al. conducted a moderate-quality systematic review and meta-analysis
comparing cerebrospinal fluid infection (CFI) rates between patients managed with
antimicrobial-impregnated catheters (AICs) versus standard catheters (SCs).12 Four RCTs and
four non-randomized prospective studies were included (total N=3,038). Patients managed with
AICs had significantly lower overall rate of CFIs, 20-day infection rate, and rate of catheter
bacterial colonization.
Because the samples for these studies included multiple pathologies, the evidence is indirect
and was used to support a Level III recommendation.
Class 3 Studies
The evidence from the Class 3 studies of infection prophylaxis is summarized in Table 9-3.

107
Table 9-3. Summary of Evidence: Class 3 Studies (Infection Prophylaxis) Reference
Study Topic Study Design, N and Outcomes Data Class
Results Conclusion
New Studies VAP – Timing of Tracheostomy Ahmed 2007*16 Early vs. late tracheostomy
Retrospective Cohort N=55 Early: 27 Late: 28 Ventilator Days ICU Days Pneumonia Hospital Stay Mortality
Class 3 Early – On or before day 7. Late – After day 7. Average time of the tracheostomy 5.5 + 1.8 days in the early group 11.0 + 4.3 days in the late group. Early group had significantly fewer ICU days than the late group (19.0 + 7.7 vs. 25.8 + 11.8), p=0.000. No decrease in the incidence of pneumonia or ventilator days were observed with early tracheostomy. Overall mortality, total length of stay, discharge or discharge to rehabilitation All no significant difference. Pneumonia Early Tracheostomy 41% Late Tracheostomy 50%, p=0.59.
Dunham 2014*7
Early vs. late tracheostomy
RCT N=24 Early: 15 Late: 9 Pneumonia, Ventilator/ICU Days, Mortality
Class 3 No significant difference in VAP rates, ventilator/ICU days, or hospital mortality.
Wang 2012*17 Early vs. late tracheostomy
Retrospective Cohort N=66 Early: 16 Late: 50 ICU Length of Stay Hospital Length of Stay Pneumonia Mortality
Class 3 Early – On or before day 10. Late – After day 10. ICU LOS was significantly shorter in the ET group, p<0.001. The incidence of nosocomial pneumonia was lower in the ET group (p=0.04) and the duration of antibiotic use was significantly shorter in the ET group (p<0.001). The patients in the ET group had a lower incidence of pneumonia caused by gram-negative microorganisms.
Catheter-related Infections during EVD Muttaiyah 2010*13 AI EVDs vs. control group
Prospective vs. historical controls N=120 AI: 60 Controls: 60 Rate of cerebrospinal fluid infections
Class 3 Significant decrease in rate of infection in AI group than controls, p<0.0001.
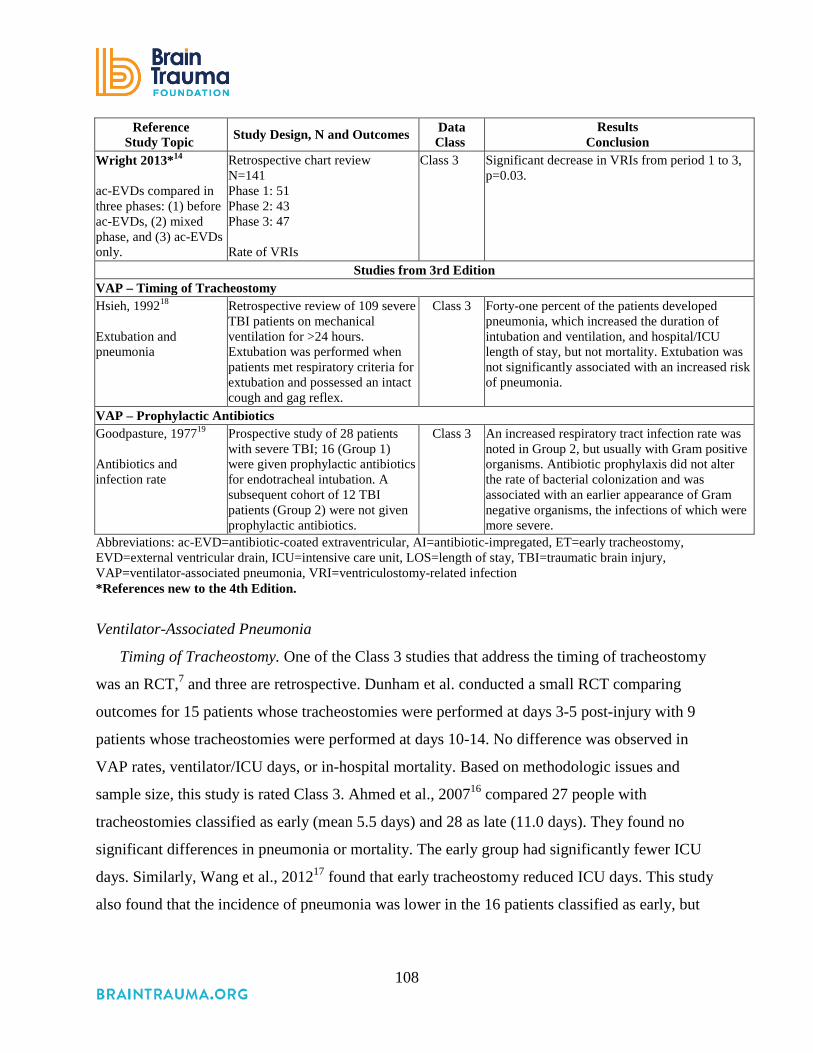
108
Reference Study Topic Study Design, N and Outcomes Data
Class Results
Conclusion Wright 2013*14 ac-EVDs compared in three phases: (1) before ac-EVDs, (2) mixed phase, and (3) ac-EVDs only.
Retrospective chart review N=141 Phase 1: 51 Phase 2: 43 Phase 3: 47 Rate of VRIs
Class 3 Significant decrease in VRIs from period 1 to 3, p=0.03.
Studies from 3rd Edition VAP – Timing of Tracheostomy Hsieh, 199218 Extubation and pneumonia
Retrospective review of 109 severe TBI patients on mechanical ventilation for >24 hours. Extubation was performed when patients met respiratory criteria for extubation and possessed an intact cough and gag reflex.
Class 3 Forty-one percent of the patients developed pneumonia, which increased the duration of intubation and ventilation, and hospital/ICU length of stay, but not mortality. Extubation was not significantly associated with an increased risk of pneumonia.
VAP – Prophylactic Antibiotics Goodpasture, 197719 Antibiotics and infection rate
Prospective study of 28 patients with severe TBI; 16 (Group 1) were given prophylactic antibiotics for endotracheal intubation. A subsequent cohort of 12 TBI patients (Group 2) were not given prophylactic antibiotics.
Class 3 An increased respiratory tract infection rate was noted in Group 2, but usually with Gram positive organisms. Antibiotic prophylaxis did not alter the rate of bacterial colonization and was associated with an earlier appearance of Gram negative organisms, the infections of which were more severe.
Abbreviations: ac-EVD=antibiotic-coated extraventricular, AI=antibiotic-impregated, ET=early tracheostomy, EVD=external ventricular drain, ICU=intensive care unit, LOS=length of stay, TBI=traumatic brain injury, VAP=ventilator-associated pneumonia, VRI=ventriculostomy-related infection *References new to the 4th Edition.
Ventilator-Associated Pneumonia
Timing of Tracheostomy. One of the Class 3 studies that address the timing of tracheostomy
was an RCT,7 and three are retrospective. Dunham et al. conducted a small RCT comparing
outcomes for 15 patients whose tracheostomies were performed at days 3-5 post-injury with 9
patients whose tracheostomies were performed at days 10-14. No difference was observed in
VAP rates, ventilator/ICU days, or in-hospital mortality. Based on methodologic issues and
sample size, this study is rated Class 3. Ahmed et al., 200716 compared 27 people with
tracheostomies classified as early (mean 5.5 days) and 28 as late (11.0 days). They found no
significant differences in pneumonia or mortality. The early group had significantly fewer ICU
days. Similarly, Wang et al., 201217 found that early tracheostomy reduced ICU days. This study
also found that the incidence of pneumonia was lower in the 16 patients classified as early, but

109
the result was not replicated in any other study. Hsieh et al. reported that extubation was not
associated with an increased risk of pneumonia.18
Prophylactic Antibiotics. One Class 3 study addressed this topic in a small prospective study
and found that antibiotics did not reduce bacterial colonization and were associated with more
severe infections.19
External Ventricular Drain
Two Class 3 studies contributed uncontrolled information indicating a positive effect of
antibiotic-impregnated EVDs in minimizing infection.13,14 They are summarized in the table but
not used to support a recommendation.
REFERENCES
1. Lozier AP, Sciacca RR, Romagnoli MF, Connolly ES, Jr. Ventriculostomy-related infections: a critical review of the literature. Neurosurg. Jul 2002;51(1):170-181; discussion 181-172. PMID: 12182415.
2. Kubilay Z, Amini S, Fauerbach LL, Archibald L, Friedman WA, Layon AJ. Decreasing ventricular infections through the use of a ventriculostomy placement bundle: experience at a single institution. J Neurosurg. Mar 2013;118(3):514-520. PMID: 23259820.
3. Centers for Disease Control and Prevention Ventilator-Associated Event (VAE) http://www.cdc.gov/nhsn/pdfs/pscmanual/10-vae_final.pdf. Accessed August 4, 2016.
4. Hui X, Haider AH, Hashmi ZG, et al. Increased risk of pneumonia among ventilated patients with traumatic brain injury: every day counts! J Surg Res. Sep 2013;184(1):438-443. PMID: 23816243.
5. Bouderka MA, Fakhir B, Bouaggad A, Hmamouchi B, Hamoudi D, Harti A. Early tracheostomy versus prolonged endotracheal intubation in severe head injury. J Trauma. Aug 2004;57(2):251-254. PMID: 15345969.
6. Sugerman HJ, Wolfe L, Pasquale MD, et al. Multicenter, randomized, prospective trial of early tracheostomy. J Trauma. Nov 1997;43(5):741-747. PMID: 9390483.
7. Dunham. Early tracheostomy in severe traumatic brain injury: evidence for decreased mechanical ventilation and increased hospital mortality. Int J Burns Trauma. 2014;4(1):14-24. PMID: 24624310.
8. Seguin P, Tanguy M, Laviolle B, Tirel O, Malledant Y. Effect of oropharyngeal decontamination by povidone-iodine on ventilator-associated pneumonia in patients with head trauma. Crit Care Med. May 2006;34(5):1514-1519. PMID: 16540962.
9. Seguin P, Laviolle B, Dahyot-Fizelier C, et al. Effect of oropharyngeal povidone-iodine preventive oral care on ventilator-associated pneumonia in severely brain-injured or cerebral hemorrhage patients: a multicenter, randomized controlled trial. Crit Care Med. Jan 2014;42(1):1-8. PMID: 24105456.

110
10. Sirvent JM, Torres A, El-Ebiary M, Castro P, de Batlle J, Bonet A. Protective effect of intravenously administered cefuroxime against nosocomial pneumonia in patients with structural coma. Am J Respir Crit Care Med. May 1997;155(5):1729-1734. PMID: 9154884.
11. Ratilal B, Costa J, Sampaio C. Antibiotic prophylaxis for surgical introduction of intracranial ventricular shunts: a systematic review. J Neurosurg Pediatr. Jan 2008;1(1):48-56. PMID: 18352803.
12. Wang X, Dong Y, Qi XQ, Li YM, Huang CG, Hou LJ. Clinical review: Efficacy of antimicrobialimpregnated catheters in external ventricular drainage - a systematic review and meta-analysis. Crit Care. 2013;17(234):1-11. PMID: 23890254.
13. Muttaiyah S, Ritchie S, John S, Mee E, Roberts S. Efficacy of antibiotic-impregnated external ventricular drain catheters. J Clin Neurosci. Mar;17(3):296-298. PMID: 20074964.
14. Wright K, Young P, Brickman C, et al. Rates and determinants of ventriculostomy-related infections during a hospital transition to use of antibiotic-coated external ventricular drains. Neurosurg. May 2013;34(5):E12. PMID: 23634916
15. Ratilal BO, Costa J, Sampaio C, Pappamikail L. Antibiotic prophylaxis for preventing meningitis in patients with basilar skull fractures. Cochrane Databse Syst Rev. Aug 2011. PMID: 21833952.
16. Ahmed N, Kuo YH. Early versus late tracheostomy in patients with severe traumatic head injury. Surg Infect Jun 2007;8(3):343-347. PMID: 17635057.
17. Wang HK, Lu K, Liliang PC, et al. The impact of tracheostomy timing in patients with severe head injury: an observational cohort study. Injury. Sep 2012;43(9):1432-1436. PMID: 21536285.
18. Hsieh AH, Bishop MJ, Kubilis PS, Newell DW, Pierson DJ. Pneumonia following closed head injury. Am Rev Respir Dis. Aug 1992;146(2):290-294. PMID: 1489114.
19. Goodpasture HC, Romig DA, Voth DW, Liu C, Brackett CE. A prospective study of tracheobronchial bacterial flora in acutely brain-injured patients with and without antibiotic prophylaxis. J Neurosurg. Aug 1977;47(2):228-235. PMID: 406368.
111
10. Deep Vein Thrombosis Prophylaxis
INTRODUCTION
Patients with traumatic brain injury (TBI) are at significant risk for developing venous
thromboembolism (VTE).1 Knudson et al. found that head injury with an Abbreviated Injury
Score of ≥3, among other factors, was an independent predictor of VTE in trauma patients.2 TBI
has been associated with up to 54% incidence of deep venous thrombosis without prophylactic
treatment3 and a 25% incidence in patients with isolated TBI treated with sequential compression
devices.4 Ekeh found that deep vein thrombosis (DVT) occurred in one-third of moderate and
severe TBI patients with isolated head injuries, having a lower incidence than those patients with
concomitant extracranial injuries. Age, subarachnoid hemorrhage, Injury Severity Score >15, and
extremity injury were predictors of DVT.5 Reiff et al. demonstrated a three-to-four-fold increase
in the DVT risk in TBI despite use of mechanical and chemoprophylaxis.6 VTE risk increases
with TBI severity.7
Severe TBI patients can be at significant risk for VTE due to hypercoagulability resulting
from the primary brain injury, prolonged periods of immobilization, and focal motor deficits. If
untreated, DVT can result in potentially debilitating or fatal pulmonary embolism. Of particular
concern is the initiation of pharmacological VTE prophylaxis, which, in conjunction with
mechanical compression boots, has increased effectiveness over mechanical prophylaxis alone.8
Problematically, such drugs constitute low dose anticoagulation, which has the potential to result
in clinically significant intracranial hemorrhage expansion.
RECOMMENDATIONS
Level I and II
• There was insufficient evidence to support a Level I or II recommendation for treatment
of deep vein thrombosis (DVT) in severe TBI patients.
Level III
• Low molecular weight heparin (LMWH) or low-dose unfractioned heparin may be used
in combination with mechanical prophylaxis. However, there is an increased risk for
expansion of intracranial hemorrhage.

112
In addition to compression stockings, pharmacologic prophylaxis may be considered if the
brain injury is stable and the benefit is considered to outweigh the risk of increased intracranial
hemorrhage. There is insufficient evidence to support recommendations regarding the preferred
agent, dose, or timing of pharmacologic prophylaxis for deep vein thrombosis.
Changes from Prior Edition
The Level 3 recommendation supporting use of compression stockings has been
incorporated in the recommendation about pharmacologic prophylaxis, as mechanical treatments
such as stockings are the general standard of care and there is not a body of evidence or issues
that are TBI-specific. DVT pharmacologic prophylaxis is both a topic in general trauma and ICU
care and a topic with issues specific to TBI, so the issues specific to TBI are the focus of the
recommendations. Five descriptive, non-comparative studies from the 3rd Edition are not
included in the evidence tables for this edition as they do not meet the inclusion criteria.9-12
EVALUATION OF THE EVIDENCE
Quality of the Body of Evidence
The included studies addressed three questions related to VTE prophylaxis (Table 10-1). The
quality of the body of evidence for the first question was low, and it was insufficient for the other
two. Three studies addressed whether outcomes are better with or without prophylaxis and
reported inconsistent findings and imprecise estimates of effect, providing low-quality
evidence.13-15 Two studies16,17 compared outcomes for periods before and after protocols were
implemented for anticoagulation, and the single study from the 3rd Edition compared
prophylactic anticoagulation in the 72 hours post-injury with later administration.18 These three
studies provided insufficient evidence to support recommendations.
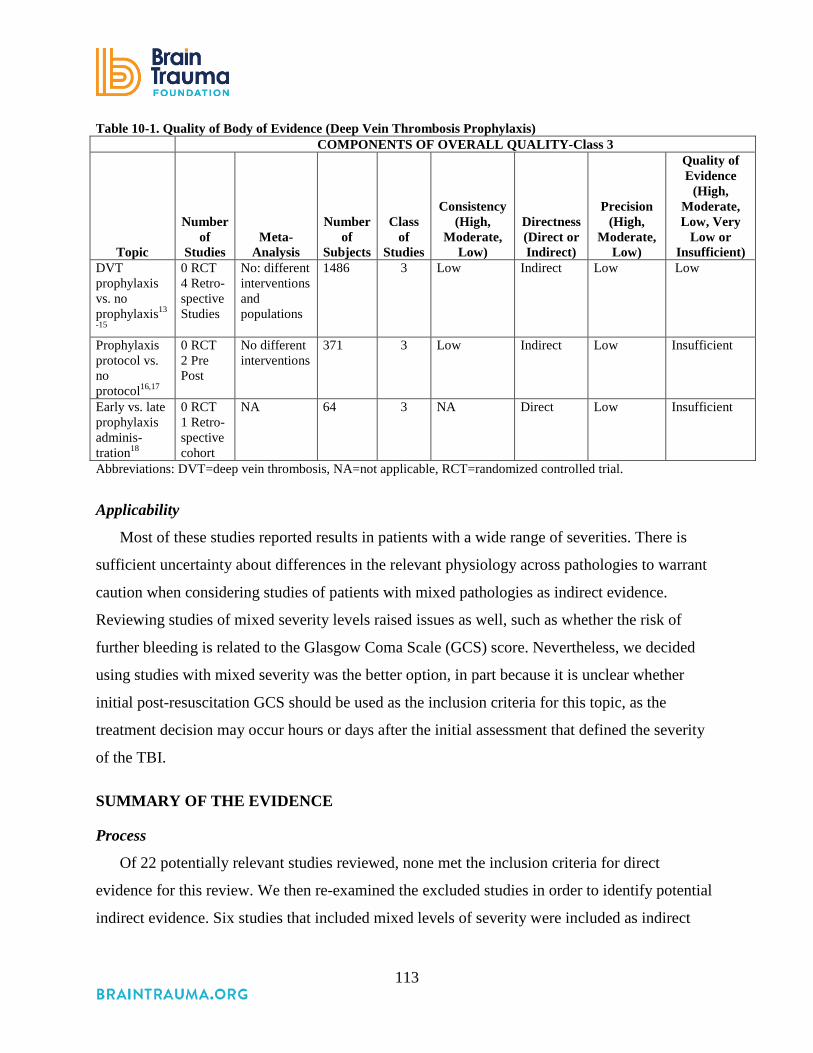
113
Table 10-1. Quality of Body of Evidence (Deep Vein Thrombosis Prophylaxis) COMPONENTS OF OVERALL QUALITY-Class 3
Topic
Number of
Studies Meta-
Analysis
Number
of Subjects
Class of
Studies
Consistency (High,
Moderate, Low)
Directness (Direct or Indirect)
Precision (High,
Moderate, Low)
Quality of Evidence
(High, Moderate, Low, Very
Low or Insufficient)
DVT prophylaxis vs. no prophylaxis13
-15
0 RCT 4 Retro- spective Studies
No: different interventions and populations
1486 3 Low Indirect Low Low
Prophylaxis protocol vs. no protocol16,17
0 RCT 2 Pre Post
No different interventions
371 3 Low Indirect Low Insufficient
Early vs. late prophylaxis adminis-tration18
0 RCT 1 Retro-spective cohort
NA 64 3 NA Direct Low Insufficient
Abbreviations: DVT=deep vein thrombosis, NA=not applicable, RCT=randomized controlled trial.
Applicability
Most of these studies reported results in patients with a wide range of severities. There is
sufficient uncertainty about differences in the relevant physiology across pathologies to warrant
caution when considering studies of patients with mixed pathologies as indirect evidence.
Reviewing studies of mixed severity levels raised issues as well, such as whether the risk of
further bleeding is related to the Glasgow Coma Scale (GCS) score. Nevertheless, we decided
using studies with mixed severity was the better option, in part because it is unclear whether
initial post-resuscitation GCS should be used as the inclusion criteria for this topic, as the
treatment decision may occur hours or days after the initial assessment that defined the severity
of the TBI.
SUMMARY OF THE EVIDENCE
Process
Of 22 potentially relevant studies reviewed, none met the inclusion criteria for direct
evidence for this review. We then re-examined the excluded studies in order to identify potential
indirect evidence. Six studies that included mixed levels of severity were included as indirect

114
evidence. The studies were all rated Class 3.13-17,19 One Class 3 study from the 3rd Edition was
included.18
Class 3 Studies
The evidence from the Class 3 studies of deep vein thrombosis prophylaxis is summarized in
Table 10-2.
Table 10-2. Summary of Evidence – Class 3 Studies (Deep Vein Thrombosis Prophylaxis)
Reference Study Topic Study Design, N and Outcomes Data
Class Results
Conclusion New Studies
Prophylactic Anticoagulation vs. No Anticoagulation Daley 2015*19 Compared VTE rates for enoxaparin vs. no enoxaparin for craniotomy patients.
Retrospective Cohort N=271 Enoxaparin=45 No enoxaparin=226 In-hospital VTE, mechanical ventilation days, ICU and hospital LOS, in-hospital mortality
Class 3 No significant difference in rates of VTE, mechanical ventilation days, or LOS. Significantly higher rate of mortality for no- treatment group.
Kwiatt, 2012*13 Comparison of LMWH for VTE prophylaxis vs. no prophylaxis
Retrospective Cohort N=1,215 LMWH=220 (mean GCS=8) No LMWH=995 (mean GCS=11.4) Hemorrhage progression VTE
Class 3 LMWH vs. No LMWH Progression of bleed 42% (93) vs. 24% (239), p<0.0001. Progression after LMWH 14.5% (32). Neurosurgical intervention for bleed 14.5% (32) vs. 4.9% (49), p<0.001. VTE 9.1% (20) vs. 3.1% (31), p<0.001 Note: More LMWH patients (42% vs. 11%) had lower-extremity duplex ultra sounds. Given higher risk of hemorrhage, risk may exceed benefit.

115
Reference Study Topic Study Design, N and Outcomes Data
Class Results
Conclusion Mohseni, 2012*14 Comparison of patients treated prophylactically with anticoagulants vs. no anticoagulants
Retrospective Case-control N=78 Treatment=41 Control=37 Mortality VTE SICU HLOS, adverse effects of anticoagulation
Class 3 Treatment vs. Control Mortality 5% vs. 19%, p=0.001. Only 1 case due to PE. VTE 11% vs. 30%; OR of VTE in control 3.5, 95% CI 1.0 to 12.1, p=0.002. There was no significant difference in SICU length of stay. No adverse outcomes or complications. Reduced risk of VTE.
Scudday, 2011*15 Early chemical thromboprophylaxis (subcutaneous or intravenous unfractionated heparin or low molecular weight heparin before VTE diagnosis) vs. controls with no thromboprophylaxis
Retrospective Cohort N=812 (300 GCS≤9, GCS not available for all patients.) Treatment: Chemical thromboprophylaxis N=402(49.5%) Within 48 hours=169 Within 72 hours=242 VTE Injury Progression
Class 3 Prophylaxis vs. None VTE 1% (3) vs. 3% (11); p=0.019. Risk ratio of no prophylaxis to treated 0.194 (95% CI 0.049 to 0.760). Injury progression, 6% (25) vs. 3% (11) vs. p=0.055. Risk ratio of no prophylaxis to treated 0.474 (95% CI 0.221 to 1.015). Reduced VTE and no significant increase in bleed.
Protocol for Prophylactic Anticoagulation vs. No Protocol Farooqui, 2013*16 Evaluation of a protocol (30 mg of Lovenox 2 times per day or 5000 U of heparin 3 times a day 24 hours after intracranial hemorrhage was stable on CT)
Retrospective Cohort N=236 Protocol=107 No routine administration=129 (groups are different time periods) DVT PE Increase in ICH
Class 3 Protocol vs. no routine administration DVT 0% vs. 5.6% (6), p=0.0080. PE 0.78% (1) vs. 3.74% (4), p=0.18 NS. ICH 0.7% (1) vs. 2.8% (3), p=0.3 NS.
Nickele, 2013*17 Assess PTP protocol
Retrospective Cohort Quality Improvement Study N=87 patients during 1-year protocol period N=48 patients during 6-month pre-protocol period DVT and PE % receiving prophylaxis
Class 3 Protocol vs. pre protocol DVTs 6.9% (6) vs. 4.2% (2) p=0.20 PE 5.75% (5) vs. 4.2% (2) p=0.45 Received PTP 72.4% (63) vs. 45.8% (22) p<0.00001 Average time from admission to first dose 3.4 days vs. 4.9 days

116
Reference Study Topic Study Design, N and Outcomes Data
Class Results
Conclusion Study from 3rd Edition
Kim, 200218
Early vs. late administration
Retrospective study N=64 patients with severe TBI Level I trauma center. Early: prophylaxis with 5000 units of subcutaneous heparin was begun less than 72 hours Late: 72 hours or more after admission. (late administration group includes those who received no drug).
Class 3 Early vs. Late Mortality (4% vs. 1% p=1.0) Rates of DVT were 4% vs. 6% (Study was underpowered to detect efficacy of intervention) Did not find increase in bleeding complications
Abbreviations: CT=computed tomography, DVT=deep venous thrombosis, HLOS=hospital length of stay, ICH=intracranial hemorrhage, GCS= Glasgow Coma Scale, LMWH=low molecular weight heparin, NS=not significant, PE=pulmonary embolism, PTP=pharmacologic thromboembolism prophylaxis, SICU=surgical intensive care unit, TBI=traumatic brain injury, VTE=Venous thromboembolism. *References new to the 4th Edition.
Prophylactic Anticoagulation Versus No Anticoagulation
The four studies comparing patients who received prophylaxis anticoagulants to those who
did not reported conflicting results and provided a low-quality body of evidence.13-15,19 Kwaitt et
al. conducted a retrospective cohort study using data from seven Level 1 trauma centers in the
United States.13 Adults with intracranial hemorrhage caused by blunt trauma were identified
through each center’s trauma registry and divided into those who received LMWH and those
who did not. Patients who received LMWH were more severely injured on admission (mean
GCS of 8 vs. 11.4, p<0.0001). Based on findings that 14.5% had hemorrhage progression after
receiving LMWH with 4.1% requiring neurosurgical intervention, and that later prophylaxis
(after 48 hours) did not decrease the rate of bleeding, the researchers concluded that they could
not demonstrate the safety of LMWH for TBI patients.13 In a smaller study at one urban trauma
center, researchers used propensity matching to create 34 pairs of patients with similar
demographic and clinical characteristics, except that one received prophylactic anticoagulation
and one did not. Patients in the controls had higher rates of VTE (30% vs. 11%), and there were
no adverse outcomes reported in the treated group, leading these authors to conclude that
prophylactic anticoagulation decreases the risk of VTE.14 A third retrospective cohort study of
812 patients included 300 patients with severe injuries (GCS ≤9); however, they did not report
the results by severity. In all these patients, VTE was significantly lower in the treated group (1%
vs. 3%, p=0.019), and injury progression was not statistically significantly different (6% vs. 3 %,
117
p=0.055).15 Finally, a fourth retrospective cohort study of 271 patients who received
craniotomies compared VTE rates and outcomes for patients who were treated with enoxaparin
(n=45) with those not treated for prevention of VTE (n=226). Identification of patients for VTE
prophylaxis was at the discretion of the treating neurosurgeon. There were no significant
differences between groups in VTE rates, mechanical ventilation days, or LOS. There was
significantly higher in-hospital mortality for the untreated group.
Protocol for Prophylactic Anticoagulation Versus No Protocol
Three additional studies were considered separately, as they addressed different questions
and did not provide sufficient evidence for recommendations. Two of these studies compared
DVT rates in a single institution before and after the initiation of a protocol for the use of
chemoprophylaxis for TBI patients. In one study, the protocol called for administration of either
enoxaparin or heparin 24 hours after an intracranial hemorrhage was demonstrated as stable on
brain CT. DVT rates were significantly lower in the treated group, while PE and the increase in
the size of the hemorrhage were not statistically significantly different.16 Another study
described the results of a quality improvement initiative designed to implement a drug treatment
protocol to prevent VTE. The authors reported that physicians increased the use of
anticoagulants, but that the differences in DVT and PE were not significantly different and
required further study.17 The final included study followed patients who received heparin within
72 hours of injury and those who received heparin after 72 hours. VTE rates were not different
and no patients in the early group experienced an adverse event defined as increased bleeding or
deterioration.18
REFERENCES
1. Kaufman HH, Satterwhite T, McConnell BJ, et al. Deep vein thrombosis and pulmonary embolism in head injured patients. Angiology. Oct 1983;34(10):627-638. PMID: 6226216.
2. Knudson MM, Ikossi DG, Khaw L, Morabito D, Speetzen LS. Thromboembolism after trauma: an analysis of 1602 episodes from the American College of Surgeons National Trauma Data Bank. Ann Surg. Sep 2004;240(3):490-496; discussion 496-498. PMID: 15319720.

118
3. Geerts WH, Code KI, Jay RM, Chen E, Szalai JP. A prospective study of venous thromboembolism after major trauma. N Engl J Med. Dec 1994;331(24):1601-1606. PMID: 7969340.
4. Denson K, Morgan D, Cunningham R, et al. Incidence of venous thromboembolism in patients with traumatic brain injury. Am J Surg. Mar 2007;193(3):380-383; discussion 383-384. PMID: 17320539.
5. Ekeh AP, Dominguez KM, Markert RJ, McCarthy MC. Incidence and risk factors for deep venous thrombosis after moderate and severe brain injury. J Trauma. Apr 2010;68(4):912-915. PMID: 19996795.
6. Reiff DA, Haricharan RN, Bullington NM, Griffin RL, McGwin G, Jr., Rue LW, 3rd. Traumatic brain injury is associated with the development of deep vein thrombosis independent of pharmacological prophylaxis. J Trauma. May 2009;66(5):1436-1440. PMID: 19430251.
7. Van Gent JM, Bandle J, Calvo RY, et al. Isolated traumatic brain injury and venous thromboembolism J Trauma Acute Care Surg. 2014;77(2):238-242. PMID: 25058248
8. Agnelli G, Piovella F, Buoncristiani P, et al. Enoxaparin plus compression stockings compared with compression stockings alone in the prevention of venous thromboembolism after elective neurosurgery. N Engl J Med. 1998;339(2):80-85. PMID: 9654538
9. Black PM, Baker MF, Snook CP. Experience with external pneumatic calf compression in neurology and neurosurgery. Neurosurg. Apr 1986;18(4):440-444. PMID: 3517676.
10. Gerlach R, Scheuer T, Beck J, Woszczyk A, Seifert V, Raabe A. Risk of postoperative hemorrhage after intracranial surgery after early nadroparin administration: results of a prospective study. Neurosurg. Nov 2003;53(5):1028-1034; discussion 1034-1025. PMID: 14580268.
11. Kleindienst A, Harvey HB, Mater E, et al. Early antithrombotic prophylaxis with low molecular weight heparin in neurosurgery. Acta Neurochir (Wien). Dec 2003;145(12):1085-1090; discussion 1090-1081. PMID: 14663565.
12. Norwood SH, McAuley CE, Berne JD, et al. Prospective evaluation of the safety of enoxaparin prophylaxis for venous thromboembolism in patients with intracranial hemorrhagic injuries. Arch Surg. Jun 2002;137(6):696-701; discussion 701-692. PMID: 12049541.
13. Kwiatt ME, Patel MS, Ross SE, et al. Is low-molecular-weight heparin safe for venous thromboembolism prophylaxis in patients with traumatic brain injury? A Western Trauma Association multicenter study. J Trauma Acute Care Surg. Sep 2012;73(3):625-628. PMID: 22929493.
14. Mohseni S, Talving P, Lam L, Chan LS, Ives C, Demetriades D. Venous thromboembolic events in isolated severe traumatic brain injury. J Emerg Trauma Shock. Jan 2012;5(1):11-15. PMID: 22416148.
15. Scudday T, Brasel K, Webb T, et al. Safety and efficacy of prophylactic anticoagulation in patients with traumatic brain injury. J Am Coll Surg. 2011. PMID: 21459632.
16. Farooqui A, Hiser B, Barnes SL, Litofsky NS. Safety and efficacy of early thromboembolism chemoprophylaxis after intracranial hemorrhage from traumatic brain injury. J Neurosurg. Dec 2013;119(6):1576-1582. PMID: 24053504.

119
17. Nickele CM, Kamps TK, Medow JE. Safety of a DVT chemoprophylaxis protocol following traumatic brain injury: a single center quality improvement initiative. Neurocrit Care. Apr 2013;18(2):184-192. PMID: 23099845.
18. Kim J, Gearhart MM, Zurick A, Zuccarello M, James L, Luchette FA. Preliminary report on the safety of heparin for deep venous thrombosis prophylaxis after severe head injury. J Trauma. Jul 2002;53(1):38-42; discussion 43. PMID: 12131387.
19. Daley MJ, Brown CV. Late venous thromboembolism prophylaxis after craniotomy in acute traumatic brain injury Am Surg 2015;81(2):207-211. PMID: 25642886.

120
11. Seizure Prophylaxis
INTRODUCTION
Acute symptomatic seizures may occur as a result of severe traumatic brain injury (TBI).
Such post-traumatic seizures (PTS) are classified as early when they occur within 7 days of
injury or late when they occur after 7 days following injury. Post-traumatic epilepsy (PTE) is
defined as recurrent seizures more than 7 days following injury. In patients with severe TBI, the
rate of clinical PTS may be as high as 12%, while that of subclinical seizures detected on
electroencephalography may be as high as 20% to 25%. The risk factors for early PTS include:
Glasgow Coma Scale (GCS) score of ≤10; immediate seizures; post-traumatic amnesia lasting
longer than 30 minutes; linear or depressed skull fracture; penetrating head injury; subdural,
epidural, or intracerebral hematoma; cortical contusion; age ≤65 years; or chronic alcoholism.1 A
2010 population-based study2 showed that rates of PTE are substantially higher than the risk of
developing epilepsy in the general population.3 Those most at risk for PTE are individuals who
have suffered the following: severe TBI and early PTS prior to discharge; acute intracerebral
hematoma or cortical contusion; posttraumatic amnesia lasting longer than 24 hours; age >65
years; or premorbid history of depression.1
Seizure prophylaxis for PTS refers to the practice of administering anticonvulsants to patients
following TBI in order to prevent the occurrence of seizures. The rationale for routine seizure
prophylaxis is that there is a relatively high incidence of PTS in severe TBI patients, and there
are potential benefits to preventing seizures following TBI (e.g., limiting derangement in acute
physiology, preventing the development of chronic epilepsy, and preventing herniation and
death). However, it is also desirable to avoid the neurobehavioral and other side effects of these
medications, particularly if they are ineffective in preventing seizures. It is, therefore, important
to evaluate the efficacy and overall benefit, as well as potential harms, of anticonvulsants used
for the prevention of PTS.
Levetiracetam (known by the brand name Keppra) appears to be increasing in use for seizure
prophylaxis for various pathologies, including TBI. The available comparative studies are
insufficient to support a recommendation for or against the use of levetiracetam over another

121
agent. Future studies are necessary to better understand the potential benefits or harms of
levetiracetam in treating patients with TBI.
RECOMMENDATIONS
Level I
• There was insufficient evidence to support a Level I recommendation for this topic.
Level II A
• Prophylactic use of phenytoin or valproate is not recommended for preventing late PTS.
• Phenytoin is recommended to decrease the incidence of early PTS (within 7 days of
injury), when the overall benefit is felt to outweigh the complications associated with
such treatment. However, early PTS have not been associated with worse outcomes.
At the present time there is insufficient evidence to recommend levetiracetam over phenytoin
regarding efficacy in preventing early post-traumatic seizures and toxicity.
Changes from Prior Edition
The recommendations have not changed for this update from the 3rd Edition. Two new Class
2 studies and four new Class 3 studies were added as evidence, but these and the Class 3 studies
included from the 3rd Edition did not provide sufficient evidence to inform new
recommendations.
EVALUATION OF THE EVIDENCE
Quality of the Body of Evidence
The 11 studies identified for this topic (1) addressed the effectiveness of seizure prophylaxis
in preventing early and late seizures following TBI, (2) assessed potential adverse effects, and
(3) compared one agent to another or compared an agent to a placebo in seizure prevention and
neuropsychological function (Table 11-1). Two new Class 2 studies4,5 and four new Class 3
studies6-9 were identified. Three Class 2 studies10-12 and two Class 3 studies13,14 from the 3rd
Edition of these guidelines were included.
All studies except one12 reported results for samples with mixed pathologies and/or TBI
severities. Thus, the body of evidence is primarily indirect. As such, the overall quality of the

122
body of evidence that supports the recommendations is moderate despite the consistent results
and high precision.
Table 11-1. Quality of Body of Evidence (Seizure Prophylaxis) COMPONENTS OF OVERALL QUALITY – Class 2
Topic
Number of
Studies Meta-
Analysis
Number
of Subjects
Class of Studies
Consistency (High,
Moderate, Low)
Directness (Direct or Indirect)
Precision (High,
Moderate, Low)
Quality of Evidence
(High, Moderate,
Low, or Insufficient)
Prevention of early PTS10,11
2 RCTs
No different treatments
783 2 High Indirect High Moderate
Prevention of late PTS10,11
2 RCTs
No different treatments
783 2 High Indirect High Moderate
Prevention of harms (negative cognitive effects)12
1 RCT
NA 244 (analysis of same subjects included in above)
2 NA Direct (results are reported by GCS sub groups)
Low Insufficient
Comparative effectiveness of levetiracetam vs. phenytoin for early seizures4
1 Pro-spective obser-vational
NA 813 2 NA Indirect High Insufficient
Comparative effectiveness of valproate vs. phenytoin for neuro-psychological function5
1 RCT NA 279 2 NA Indirect Low Insufficient
Abbreviations: GCS=Glasgow Coma Scale, NA=not applicable, PTS=post-traumatic seizure, RCT=randomized controlled trial.
Applicability
Three of the five Class 2 studies and two of the six Class 3 studies were conducted in the
1980s and 1990s. Two Class 2 and the four Class 3 studies were conducted more recently.

123
SUMMARY OF THE EVIDENCE
Process
Of nine new, potentially relevant studies reviewed, three were excluded because they did not
meet the inclusion criteria for this topic (see Appendix F). Of the remaining six, two were rated
Class 24,5 and four were rated Class 3.6-9 Three Class 2 studies10-12 and two Class 313,14 from the
3rd Edition were included as evidence for this topic.
Class 2 Studies
The evidence from the Class 2 studies of seizure prophylaxis is summarized in Table 11-2.
Table 11-2. Summary of Evidence – Class 2 Studies (Seizure Prophylaxis) Reference
Study Topic Study Design, N, and
Outcomes Data Class Results
Conclusion Prevention of Early and Late PTS
New Studies Inaba 2013*4 LEV vs. PHE
Prospective Observational N=813 LEV=406 PHE=407 18.8% GCS ≤8 Prevention of early PTS
Class 2 No difference in seizure rate (1.5% vs.1.5%, p=0.997), adverse drug reactions (7.9% vs. 10.3%, p=0.227), or mortality (5.4% vs. 3.7%, p=0.236).
Dikmen 2000*5 To compare 1 week of PHT, 1 month of valproate, or 6 months of valproate
RCT N=279** (PHT=94; 1 month valproate=94; 6 months valproate=91) Neuropsychological function at 1, 6, and 12 months post-injury.
Class 2 PHT vs. Valproate Neuropsychological function: No significant beneficial or adverse neuropsychological effects of valproate.

124
Reference Study Topic
Study Design, N, and Outcomes Data Class
Results Conclusion
Studies from 3rd Edition Temkin, 199010
To compare PHT and placebo
RCT N=404 PHT=208 (60% GCS≤10) Placebo=196 (67% GCS≤10) Early and late PTS
Class 2 Phenytoin vs. Placebo Early PTS (first week) Risk Ratio 0.27 (0.12 to 0.62), p<0.001. Cumulative (+-SE) Seizure Rate PHT Group 3.6+-1.3; Placebo 14.2+-2.6. Day 8 to 1 year 21.5% vs. 15.7%, p>0.2. at 2 years 27.5% vs. 21.1%, p>0.2. Early PTS: Significant reduction by phenytoin. Late PTS: no significant effect.
Temkin, 199911 To compare 1 week of PHT, 1 month of valproate, or 6 months of valproate
RCT N=379 (phenytoin: 132; 1 month valproate: 120; 6 months valproate:127) Early and Late PTS Adverse Events
Class 2 PHT vs. Valproate Early PTS: 1.5% vs. 4.5% Late PTS: No significant difference 15% PHT for 1 week 16% valproate 1 month 24% valproate 6 months. Serious adverse events: no difference Non-significant trend toward higher mortality in valproate groups. No benefit suggests valproate should not be routinely used.
Negative Cognitive Effects Dikmen, 199112
To compare PHT and placebo
RCT N=244** PHT=128 Placebo=126 Subgroup GCS≤8 N=71 PHT=37 Placebo=34 Neurobehavioral Measures
Class 2 1 month PHT group performed significantly more poorly 12 months No significant effect More improvement in month 24 in those who stopped taking PHT at month 12 then in placebo group. PHT has negative side effects in people with severe TBI
Abbreviations: GCS=Glasgow Coma Scale, LEV=levetiracetam, N=total sample size, PHT=phenytoin, PTS=post-traumatic seizure, RCT=randomized controlled trial, TBI=traumatic brain injury. *References new to the 4th Edition. **Subgroup of patients included in Temkin, 1990
Temkin et al., 1990 reported the results of a large, randomized, double-blinded, placebo-
controlled trial of 404 patients evaluating the effect of phenytoin on early and late PTS. This trial
was unique in that serum levels were independently monitored and dosages were adjusted so that
therapeutic levels were maintained in at least 70% of the patients. Moreover, three-quarters of
125
the patients who had levels monitored on the day of their first late seizure had therapeutic levels.
There was a significant reduction in the incidence of early PTS in the treated group from 14.2%
to 3.6% (p<0.001) but no significant reduction in the incidence of late PTS. The survival curves
for the placebo and active treatment groups showed no significant difference in mortality.10
A secondary analysis was performed on the data from this trial to determine if treatment for
early PTS was associated with significant drug-related adverse side effects. The occurrence of
adverse drug effects during the first 2 weeks of treatment was low and not significantly different
between the treated and placebo groups. The study conclusion was that incidence of early PTS
can be effectively reduced by prophylactic administration of phenytoin for 1 or 2 weeks without
a significant increase in serious drug-related side effects.
In another secondary analysis of the same trial, Dikmen et al. found significantly impaired
performance on neuropsychological tests at 1 month after injury in severe TBI patients
maintained on phenytoin. However, the difference was not apparent at 1 year following injury.12
A second randomized, double-blinded study was designed to evaluate the effect of valproate
to reduce the incidence of early and late PTS. The trial compared phenytoin to valproate for the
prevention of early PTS, and valproate to placebo for the prevention of late PTS. The incidence
of early PTS was similar in patients treated with either valproate or phenytoin. The incidence of
late PTS was similar in patients treated with phenytoin for 1 week and then placebo, or patients
treated with valproate for either 1 month then placebo, or with valproate for 6 months. There was
a trend toward higher mortality in patients treated with valproate.11 Dikmen conducted a
secondary analysis of 279 patients from this trial and tested them for neuropsychological
function at 1, 6, and 12 months post-injury. No beneficial or adverse effects of valproate were
found compared with phenytoin or placebo.5
Inaba et al., 2013 conducted a prospective, observational study in two Level I trauma centers
comparing levetiracetam (LEV) to phenytoin (PHE) for the prevention of early seizures after
TBI. The selection of medication was made by the medical staff. However, one of the two
institutions preferred LEV, and the other PHE. Patients were included with a GCS ≤8, or >8 with
positive CT findings; only 18.8% had a GCS ≤8, rendering the evidence as indirect for this
study. Groups were comparable on age, gender, Injury Severity Score, intubation rates, GCS of
≤8, Head Abbreviated Injury Score of ≥3, and Marshall scores. No significant differences were

126
found in seizure rates, adverse drug reactions, complications, or mortality. The results of this
study suggest no benefit of one drug over the other, but because it is a single study consisting of
indirect evidence, it cannot be used to support a recommendation.4
Class 3 Studies
The evidence from the Class 3 studies of seizure prophylaxis is summarized in Table 11-3.
Table 11-3. Summary of Evidence – Class 3 Studies (Seizure Prophylaxis) Reference
Study Topic Study Design, N and Outcomes Data Class Results
Conclusion New Studies
Bhullar 2013*8 Compared PHT to no AED for prevention of early seizures
Retrospective Cohort N=93 Treatment=50 Control=43 Seizures within 7 days following TBI.
Class 3 No significant difference in early seizure rates, ICU LOS, ventilator days, or TBI-caused mortality. Treatment group had significantly longer hospital stay and worse functional outcome at discharge (GOS 3.4 +/- 1.1 vs. 2.9 +/- 1.0, p=0.01).
Jones 2008*9 Equivalence study of LEV and PHT for seizure prophylaxis.
Prospective cohort vs. historical controls. N=73 LEV=32 PHT=41 Only patients with EEG included in analysis. N=27 LEV=15 PHT=12 Early seizures and dichotomized GOS at 3 and 6 months post-injury.
Class 3 Seizure activity equivalent between groups. Higher incidence of seizure activity in levetiracetam group (p=0.003). No difference in GOS at 3 and 6 months post-injury.
Ma 2010*6 Assessment of sodium valproate for prevention of early PTS
Retrospective Cohort N=159 Treatment=35 Control=124 Early posttraumatic seizures defined as seizures within the first week following TBI.
Class 3 The incidence of early PTS Sodium valproate treatment vs. control 0 vs. 4.4%, χ2=0.5529, p>0.05. There were fewer early PTS with sodium valproate but the difference between the treatment and control group was not statistically significant.

127
Reference Study Topic Study Design, N and Outcomes Data Class
Results Conclusion
Szaflarski 2010*7 LEV vs. PHT for seizure prophylaxis
Prospective, randomized, single-blinded comparative trial N=52 89% with TBI LEV=34 PHT=18 Clinical adverse events including Seizures, fever, neurological changes, cardiovascular, hematologic and dermatologic abnormalities, liver failure, renal failure, LOS in hospital and death. Secondary endpoints were seizure frequency and long-term outcomes (seizures, GOSE, DRS).
Class 3 LEV vs. PHT Seizure during cEEG:5/34 vs. 3/18, p=1.0 Seizure at 6 months: 1/20 vs. 0/14, p=1.0 Mortality 14/34 vs. 4/18, p=0.227. Average GOS at 6 months 5 vs. 3 p=0.016* (higher score is better functional outcome). *surviving patients only No difference in side effects except Worse neuro status 6/34 vs. 9/18, p=0.024 Gastrointestinal problems: 1/34 vs. 4/18, p=0.043. Patients treated with PHT or LEV have the same outcomes with respect to death or seizures. LEV results in less undesirable side effects and better long-term outcomes for surviving patients.
Studies from 3rd Edition Manaka 199213 Phenobarbital vs. placebo for late PTS
Randomized, double-blind study of 126 patients receiving placebo or phenobarbital for effect on late PTS. Treatment was started 1 month following TBI.
Class 3 No significant effect of phenobarbital on late PTS.
Young 198314 PHT vs. placebo for early and late PTS
Randomized, double-blind study of 244 patients receiving placebo vs. phenytoin for the prevention of early and late PTS.
Class 3 No significant effect of phenytoin on early or late PTS
Abbreviations: AED=anti-epileptic drug, DRS=Disability Rating Scale, EEG=electroencephalography, ICU=intensive care unit, GOSE=Glasgow Outcome Scale Extended, LEV=levetiracetam, LOS=length of stay, PHT=phenytoin, PTS=post-traumatic seizure, TBI=traumatic brain injury. *References new to the 4th Edition.
Of the four Class 3 studies included since the 3rd Edition of these guidelines, two were
retrospective,6,8 one was a prospective cohort compared with historical controls,9 and one was an
RCT.7 Both Class 3 studies maintained from the 3rd Edition were RCTs.13,14
Three of these studies reported no consistent positive impact on primary outcomes such as
seizures, mortality, or neurological function when comparing different anti-seizure medications
and placebos.6,13,14 As seizures are a relatively rare event, these studies may not have been large
enough to detect a difference. Bhullar et al. found no difference between phenytoin and no anti-

128
epileptic drug treatment in early seizure rates, ICU length of stay, ventilator days, or TBI-related
mortality (N=93). However, the treatment group had significantly longer hospital length of stays
and worse functional outcomes at discharge (GOS 3.4 +/- 1.1 vs. 2.9 +/- 1.0, p=0.01).
Szaflarski et al. found that patients who survived had a higher score on the Extended
Glasgow Outcome Scale (GOS-E) at 6 months post-injury if they were treated with levetiracetam
instead of phenytoin.7 This study also reported that some side effects (2 out of 12 studied) were
less frequent with levetiracetam. Although an RCT, issues with random assignment, allocation
concealment, sample size, and maintenance of comparable groups render this a Class 3 study. In
a sample of 73, 27 of which were used in the analysis, Jones et al. found equivalence with
levetiracetam and phenytoin for rate of early seizures, and no difference in the dichotomized
GOS at 3 and 6 months post-trauma. This study was under-powered to determine equivalence or
outcomes.
Additionally, Young et al. reported results suggesting that higher levels of the medications
may be more effective in preventing late PTS.14 No patient with a phenytoin plasma
concentration of 12 mcg/ml or higher had a seizure.
REFERENCES
1. Torbic H, Forni AA, Anger KE, Degrado JR, Greenwood BC. Use of antiepileptics for seizure prophylaxis after traumatic brain injury. Am J Health Syst Pharm. May 2013;70(9):759-766. PMID: 23592358.
2. Ferguson PL, Smith GM, Wannamaker BB, Thurman DJ, Pickelsimer EE, Selassie AW. A population-based study of risk of epilepsy after hospitalization for traumatic brain injury. Epilepsia. May 2010;51(5):891-898. PMID: 19845734.
3. Hirtz D, Thurman DJ, Gwinn-Hardy K, Mohamed M, Chaudhuri AR, Zalutsky R. How common are the "common" neurologic disorders? Neurology. Jan 30 2007;68(5):326-337. PMID: 17261678.
4. Inaba K, Menaker J, Branco BC, et al. A prospective multicenter comparison of levetiracetam versus phenytoin for early posttraumatic seizure prophylaxis. J Trauma Acute Care Surg. Mar 2013;74(3):766-771; discussion 771-763. PMID: 23425733.
5. Dikmen SS, Machamer JE, Winn HR, Anderson GD, Temkin NR. Neuropsychological effects of valproate in traumatic brain injury: a randomized trial. Neurology. Feb 2000;54(4):895-902. PMID: 10690983.
6. Ma CY, Xue YJ, Li M, Zhang Y, Li GZ. Sodium valproate for prevention of early posttraumatic seizures. Chin J Traumatol. 2010;13(5):293-296. PMID: 20880456.
7. Szaflarski JP, Sangha KS, Lindsell CJ, Shutter LA. Prospective, randomized, single-blinded comparative trial of intravenous levetiracetam versus phenytoin for seizure prophylaxis. Neurocrit Care. Apr 2010;12(2):165-172. PMID: 19898966.

129
8. Bhullar IS, Johnson D, Paul JP, Kerwin AJ, Tepas JJ, 3rd, Frykberg ER. More harm than good: antiseizure prophylaxis after traumatic brain injury does not decrease seizure rates but may inhibit functional recovery. J Trauma Acute Care Surg. Jan 2014;76(1):54-60; discussion 60-51. PMID: 24368357.
9. Jones KE, Puccio AM, Harshman KJ, et al. Levetiracetam versus phenytoin for seizure prophylaxis in severe traumatic brain injury Neurosurg Focus. October 2008;25(4):E3. PMID: 18828701.
10. Temkin NR, Dikmen SS, Wilensky AJ, Keihm J, Chabal S, Winn HR. A randomized, double-blind study of phenytoin for the prevention of post-traumatic seizures. N Engl J Med. Aug 1990;323(8):497-502. PMID: 2115976.
11. Temkin NR, Dikmen SS, Anderson GD, et al. Valproate therapy for prevention of posttraumatic seizures: a randomized trial. J Neurosurg. Oct 1999;91(4):593-600. PMID: 10507380.
12. Dikmen SS, Temkin NR, Miller B, Machamer J, Winn HR. Neurobehavioral effects of phenytoin prophylaxis of posttraumatic seizures. J Am Med Assoc. Mar 1991;265(10):1271-1277. PMID: 1995974.
13. Manaka S. Cooperative prospective study on posttraumatic epilepsy: risk factors and the effect of prophylactic anticonvulsant. Jpn J Psychiatry Neurol. Jun 1992;46(2):311-315. PMID: 1434154.
14. Young B, Rapp RP, Norton JA, Haack D, Tibbs PA, Bean JR. Failure of prophylactically administered phenytoin to prevent late posttraumatic seizures J Neurosurg. Feb 1983;58(2):236-241. PMID: 6848681.

130
Evidence Synthesis and Recommendations, Part II: Monitoring It is not monitoring per se that affects outcomes; rather, it is using the information from
monitoring to direct treatment. Treatment informed by data from monitoring may result in better
outcomes than treatment informed solely by data from clinical assessment. This section of the
guidelines includes the evidence and recommendations related to the influence on patient
outcomes of three types of monitoring: intracranial pressure (ICP), cerebral perfusion pressure
monitoring (CPP), and advanced cerebral monitoring (ACM).
While we reviewed and report on these monitoring modalities separately, it is important to
acknowledge that clinical practice in most high-income countries incorporates multiple
monitoring approaches as well as ongoing clinical assessment. As such, treatment decisions are
not made using one source of information in isolation. Conversely, limited resources in low-and-
middle-income countries often do not allow for monitoring, and medical decisions may be driven
by clinical assessment alone. Therefore, the application of these guidelines will vary depending
upon the medical environment in which they are used.
Changes from the 3rd Edition
In the 3rd Edition of the guidelines, there were three sections about ICP monitoring:
Indications, Technology, and Thresholds. Indications for ICP Monitoring was organized around
the sub-questions of who to monitor, the utility of information from the monitor, and the
influence of the information on outcomes for patients. For the first and second sub-questions, the
studies in the 3rd Edition do not meet the inclusion criteria for this update, and therefore have
been dropped. For the third sub-question, four Class 3 studies have been maintained.1-4 Two
studies that had been rated Class 2 in the 3rd Edition have been excluded.5,6 Eisenberg, 1988 was
an RCT of barbiturates.5 It was not designed to test ICP-directed management (it remains in the
section about barbiturates). The second study, Palmer 2001, was a pre/post natural experiment.6
It compared a patient cohort treated before implementation of the guidelines to a different cohort
treated after implementation of the guidelines. All patients had ICP monitors; the study did not
have a non-monitored comparison group, and thus was excluded in this edition as it was not
designed to assess the impact of using a monitor to guide treatment on outcomes.
131
As is indicated below, no new studies were identified to address the sub-questions from the
3rd Edition about who to monitor and about the utility of the ICP monitor. The third sub-
question about the influence of information from the ICP monitor on outcomes was maintained
and addressed in this 4th Edition.
The ICP Monitoring Technology topic in the 3rd Edition included a description and ranking
of the technologies available for ICP. Assessing technology utilizes different methods and
standards than conducting a systematic review of evidence or developing treatment guidelines.
For this reason, the technology topic is no longer included in the guidelines.
The Intracranial Pressure Thresholds topic from the 3rd Edition was expanded for the 4th
Edition and was moved into a section on thresholds that includes thresholds for blood pressure,
CPP, and ACM, as well as ICP.
REFERENCES
1. Cremer OL, van Dijk GW, van Wensen E, et al. Effect of intracranial pressure monitoring and targeted intensive care on functional outcome after severe head injury. Crit Care Med. Oct 2005;33(10):2207-2213. PMID: 16215372.
2. Fakhry SM, Trask AL, Waller MA, Watts DD. Management of brain-injured patients by an evidence-based medicine protocol improves outcomes and decreases hospital charges. J Trauma. Mar 2004;56(3):492-499; discussion 499-500. PMID: 15128118.
3. Lane PL, Skoretz TG, Doig G, Girotti MJ. Intracranial pressure monitoring and outcomes after traumatic brain injury. Can J Surg. Dec 2000;43(6):442-448. PMID: 11129833.
4. Patel HC, Menon DK, Tebbs S, Hawker R, Hutchinson PJ, Kirkpatrick PJ. Specialist neurocritical care and outcome from head injury. Intensive Care Med. May 2002;28(5):547-553. PMID: 12029400.
5. Eisenberg HM, Frankowski RF, Contant CF, Marshall LF, Walker MD. High-dose barbiturate control of elevated intracranial pressure in patients with severe head injury. J Neurosurg. Jul 1988;69(1):15-23. PMID: 3288723.
6. Palmer S, Bader MK, Qureshi A, et al. The impact on outcomes in a community hospital setting of using the AANS traumatic brain injury guidelines. Americans Associations for Neurologic Surgeons. J Trauma. Apr 2001;50(4):657-664. PMID: 11303160.

132
12. Intracranial Pressure Monitoring
INTRODUCTION
A mainstay of the care of the patients with the most severe brain injuries has been the
monitoring of—and treatment of—intracranial pressure (ICP). Decades ago, it was recognized
that cerebral swelling after traumatic injury to the brain can lead to brain herniation syndromes,
with the brain being forced under pressure into abnormal anatomical spaces, which leads first to
death of those areas of the brain and ultimately of the brain itself. At the advent of contemporary
critical care, technological advances to measure intracranial pressure by placement of devices
within the brain became available, which allowed clinicians to titrate therapies based on
objective information from ICP monitors.1
Because of its fundamental place in the care of patients with severe traumatic brain injury
(TBI) and its relationship to overall outcomes, ICP monitoring has been included in every
guideline for severe TBI published by the Brain Trauma Foundation. In the developed world,
ICP monitoring is routinely used, leading to a lack of equipoise for assigning patients to a “non-
monitored” arm of potential interventional trials. Therefore, in many studies, the evidence
supporting the utility of ICP monitoring was observational in nature and largely found that ICP
crises led to poorer outcomes.2-5 A recent study has challenged this paradigm by randomizing
patients to protocols to treat intracranial hypertension therapies based on either an invasive ICP
monitor or a clinical/radiological examination.6 This study, performed in a region of the world
where equipoise existed for a non-monitored group of patients, failed to find differences between
the groups. Summaries of the studies are outlined below. What is clear from the literature is that
intracranial hypertension is an important secondary insult after severe TBI, and its alleviation
plays a pivotal role in providing good patient care to achieve optimal outcomes.
RECOMMENDATIONS
Level I and II A
• There was insufficient evidence to support a Level I or II A recommendation for this
topic.
133
Level II B
• Management of severe TBI patients using information from ICP monitoring is
recommended to reduce in-hospital and 2-week post-injury mortality.
As noted above in the introduction to this “Part II. Monitoring” section, the Level II and III
recommendations from the 3rd Edition of these guidelines were not carried forward because they
were derived from descriptive studies, or from studies that do not meet the current inclusion
criteria for this topic. While no evidence is available from comparative studies to support a
formal recommendation, the Committee chose to re-state here the 3rd Edition recommendations.
The rationale for doing so is to maintain sufficient recognition of the patient characteristics
associated with risk of increased intracranial pressure. (Refer to the 3rd Edition for summary of
supporting studies.)
Recommendations from the Prior (3rd) Edition Not Supported by Evidence Meeting Current
Standards
• Intracranial pressure (ICP) should be monitored in all salvageable patients with a severe
traumatic brain injury (TBI) (GCS 3-8 after resuscitation) and an abnormal computed
tomography (CT) scan. An abnormal CT scan of the head is one that reveals hematomas,
contusions, swelling, herniation, or compressed basal cisterns.
• ICP monitoring is indicated in patients with severe TBI with a normal CT scan if two or
more of the following features are noted at admission: age over 40 years, unilateral or
bilateral motor posturing, or systolic blood pressure (BP) <90 mm Hg.
Changes from Prior Edition
New Class 2 studies provide evidence for recommendations that replace those of the 3rd
Edition of these guidelines. See the introduction to this “Part II. Monitoring” section (above) for
details about changes from the 3rd Edition.
EVALUATION OF THE EVIDENCE
Quality of the Body of Evidence
The five Class 1 and 2 studies included for this topic addressed the question of the influence
on outcomes of information from the ICP monitor to direct management of patients with severe
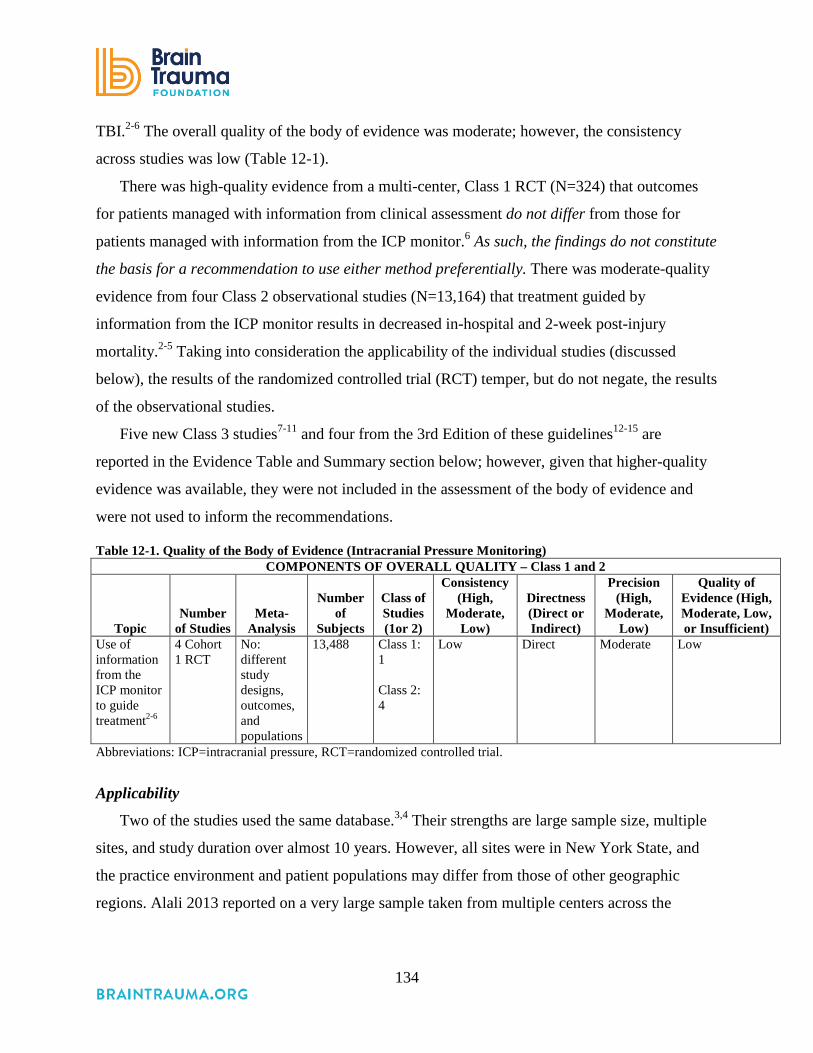
134
TBI.2-6 The overall quality of the body of evidence was moderate; however, the consistency
across studies was low (Table 12-1).
There was high-quality evidence from a multi-center, Class 1 RCT (N=324) that outcomes
for patients managed with information from clinical assessment do not differ from those for
patients managed with information from the ICP monitor.6 As such, the findings do not constitute
the basis for a recommendation to use either method preferentially. There was moderate-quality
evidence from four Class 2 observational studies (N=13,164) that treatment guided by
information from the ICP monitor results in decreased in-hospital and 2-week post-injury
mortality.2-5 Taking into consideration the applicability of the individual studies (discussed
below), the results of the randomized controlled trial (RCT) temper, but do not negate, the results
of the observational studies.
Five new Class 3 studies7-11 and four from the 3rd Edition of these guidelines12-15 are
reported in the Evidence Table and Summary section below; however, given that higher-quality
evidence was available, they were not included in the assessment of the body of evidence and
were not used to inform the recommendations.
Table 12-1. Quality of the Body of Evidence (Intracranial Pressure Monitoring) COMPONENTS OF OVERALL QUALITY – Class 1 and 2
Topic Number
of Studies Meta-
Analysis
Number
of Subjects
Class of Studies (1or 2)
Consistency (High,
Moderate, Low)
Directness (Direct or Indirect)
Precision (High,
Moderate, Low)
Quality of Evidence (High, Moderate, Low, or Insufficient)
Use of information from the ICP monitor to guide treatment2-6
4 Cohort 1 RCT
No: different study designs, outcomes, and populations
13,488 Class 1: 1 Class 2: 4
Low Direct Moderate Low
Abbreviations: ICP=intracranial pressure, RCT=randomized controlled trial.
Applicability
Two of the studies used the same database.3,4 Their strengths are large sample size, multiple
sites, and study duration over almost 10 years. However, all sites were in New York State, and
the practice environment and patient populations may differ from those of other geographic
regions. Alali 2013 reported on a very large sample taken from multiple centers across the

135
United States and Canada,2 while Talving 2013 analyzed data from a single Level I trauma
center in California.5
The Class 1 RCT was conducted in countries with very limited pre-hospital care, and where
monitors are not common. This has raised concerns about applicability for some researchers and
clinicians. Detailed discussions of these concerns are available in publications by the studies’
authors as well as others.16-34
SUMMARY OF THE EVIDENCE
Process
Of 40 new, potentially relevant studies reviewed, 30 were excluded because they did not
meet the inclusion criteria for this topic (see Appendix F). Of the remaining 10, one new Class 1
study,6 four new Class 2 studies,2-5 and five new Class 3 studies were included as evidence,7-11
along with four Class 3 studies from the 3rd Edition.12-15
Class 1 and 2 Studies
The evidence from Class 1 and 2 studies of intracranial pressure monitoring is summarized in
Table 12-2.
Table 12-2. Summary of Evidence: Class 1 and 2 Studies (Intracranial Pressure Monitoring) Reference
Study Topic Study Design, N, Setting and
Outcomes Data Class Results
Conclusion Influence on outcomes of information from ICP monitor to guide treatment Alali, 2013*2 Assessed relationships between ICP monitoring and mortality
Retrospective Cohort N=10,628 patients ICP monitored=1,874 (17.6%) 155 level I and II Trauma Centers in the United States and Canada In-hospital mortality
Class 2 ICP monitoring was associated with significantly lower odds of death (adjusted odds ratio 0.44; 95% CI 0.31 to 0.63, p<0.0001, patient-level analysis). The association between ICP monitoring and lower mortality was more pronounced in patients under 65. At the hospital level, hospitals with higher levels of ICP monitoring had lower mortality. However the variability in ICP monitoring explained only a small portion of the variability in mortality.

136
Reference Study Topic
Study Design, N, Setting and Outcomes Data Class
Results Conclusion
Chesnut, 2012*6 Comparison of outcomes for patients whose treatment was informed by ICP monitoring with those whose treatment was informed by imaging and clinical exam.
RCT N=324 ICP monitored=157 Imaging=167 6 hospitals in Bolivia and Ecuador with ICUs with intensivists, 24-hour CT, neurosurgery, and high volume of trauma. Mortality and GOS-E at 6 months. Composite of 21 measures of function and cognitive status.
Class 1 6-month mortality ICP - 39% Imaging - 41%, p=0.6. GOS- E 6 months Unfavorable Outcome ICP=24 (17%) Imaging=26 (17%) Favorable Outcome ICP=63 (44%) Imaging=60 (39%), p=0.4. Composite of 21 measures ICP=56, Imaging=53, p=0.4. Results did not support the hypothesized superiority of ICP monitoring over clinical assessment in this environment.
Farahvar, 2012*3 Comparison of patients with ICP monitors vs. those who did not receive monitors; all patients received at least 1 of 5 intracranial hypertension-targeting treatments
Retrospective Cohort N=1,307 ICP Monitored=1,084 No Monitor=223 20 New York State Level I and II Trauma Centers Mortality at 2 weeks
Class 2 Adjusted OR for 2-week mortality Adults OR 0.64; 95% CI 0.41-1.00; p=0.05. All ages (N=1446; includes 139 patients under 16 years old) OR 0.63; 95% CI 0.41-0.94; p=0.02.
Gerber, 2013*4 Comparison of trends over time in mortality with guideline adherence
Retrospective Cohort Study N=2,320 ICP Monitored: 1,966 New York State Trauma Centers: Level I (20) and Level II (2) 2-week mortality
Class 2 Age adjusted mortality 2001-2009 Years % 01-03 22.4% 04-06 19.7% 07-09 13.3% Compliance with Guidelines Years ICP Monitor CPP 01-03 55.6% 14.6% 04-06 72.3% 34.2% 07-09 75.2% 48.2% Years Nutrition Steroids 01-03 41.0% 97.7% 04-06 46.4% 96.4% 07-09 50.1% 98.6% Significant decrease in mortality appears to be associated with increase in adherence to guidelines, particularly ICP and CPP management.

137
Reference Study Topic
Study Design, N, Setting and Outcomes Data Class
Results Conclusion
Talving, 2013*5 Comparison of patients with and without ICP monitoring
Prospective Cohort N=216 ICP Monitored=101 No Monitor=115 Single Level I Trauma Center in California In hospital Mortality Mortality due to brain herniation ICU and Hospital LOS
Class 2 Adjusted OR Mortality (no ICP is referenced). OR 0.15; 95% CI -0.03 to 0.74, p=0.019. due to Brain Herniation OR 0.34; 95% CI 0.10 to 0.87, p=0.046. ICU and Hospital LOS Longer in ICP group even before and after excluding deaths.
Abbreviations: CPP=cerebral perfusion pressure, CT=computed tomography, GOS=Glasgow Outcome Scale, ICP=intracranial pressure monitoring, ICU=intensive care units, LOS=length of stay, N=total sample size, OR=odds ratio, RCT=randomized controlled trial. *References new to the 4th Edition.
Chesnut et al., 2012 conducted a multi-center RCT in Bolivia and Ecuador that compared
management guided by ICP monitoring to management guided by imaging and clinical
assessment, and found no difference in 6-month mortality.6 This was a tightly controlled trial in
which patients were successfully randomized, the management for both the ICP group and the
imaging group was standardized, and fidelity to the protocols was tracked. As a result, the
internal validity of this study is high and it was rated as Class 1.
This study also found reduced treatment time in the ICP monitor group and reduced
incidence of pressure ulcers in the clinical assessment group. In addition, it suggested that
titration of treatment to manage ICP could be influenced by CT findings and exam, and that
these two forms of assessment may be able to contribute additional insight into the management
of brain swelling after TBI, even in patients who have ICP monitors. Although the evidence from
this study was not used to contribute to a recommendation in these guidelines (outcomes for
treatment and control groups did not differ, therefore neither approach is recommended over the
other), the study may contribute an empirically-based algorithm—based on its CT and clinical
examination protocol—for the treatment of increased ICP in low technology settings.
The other included studies that address this question used observational study designs and
were rated Class 2, indicating that the internal validity of these studies is not as strong as that of
the RCT.
138
Gerber et al., 2013 conducted a Class 2 retrospective cohort study that analyzed trends in
adherence to specific guideline recommendations and 2-week mortality between 2001 and 2009.4
The analysis documented a significant decrease in mortality at the same time as an increase in
compliance with the selected guideline recommendations. Guideline adherence for ICP
monitoring varied across participating hospitals, and the rate of change in adherence to other
elements of the guidelines (e.g., nutrition and steroids) was less than the rate of changes in ICP
and cerebral perfusion pressure (CPP) monitoring during the study period. However, while the
change in practice and the decrease in mortality occurred at the same time, it is difficult to
establish causality using this study design. These findings suggest the need for future research
about the patterns and determinants of guidelines adherence, and the possible inclusion of such a
topic in future guidelines.
Alali 20132 and Talving 20135 both identified groups of patients who, according to the Brain
Trauma Foundation guidelines should have received ICP monitoring, and they compared
outcomes for patients who were monitored to those who were not. They found that those who
were monitored had lower odds of mortality. The study by Alali retrospectively identified 10,628
patients treated at 155 Level I and II trauma centers in the United States and Canada. Data were
obtained from hospital records about whether or not patients were monitored and patients’ in-
hospital survival status. Treatments were not controlled, and details about treatment were not
reported. The study’s hospital-level analysis suggests that care likely varied across hospitals.
This restricts the ability to attribute the cause of the lower mortality to the ICP monitor-driven
treatment alone. However, the large number of hospitals and their geographic distribution
increases the likelihood, but does not guarantee, that similar results would be obtained in other
time periods or settings.
Talving 2013 prospectively followed a group of 216 patients who met the criteria for
monitoring and who were admitted to a single Level I medical center in California.5 They found
that in-hospital mortality (both all-cause and mortality due to brain herniation) was significantly
lower for monitored patients. The treatments were not controlled or documented, though the
authors speculate that some of the patients who were not monitored may have been treated less
intensely. The prospective design allowed data to be collected from the treating physicians about
why an ICP monitor was not placed. The most common reason was physician discretion. No
139
further detail was provided. The prospective design increases confidence that all eligible patients
were included and minimizes the likelihood of missing data. However, as it was conducted in
one medical center, the applicability may be more limited than studies conducted at multiple
sites.
In another observational study, Farahvar et al. defined the population as patients with severe
TBI who received at least one of five specific ICP-lowering therapies.3 Defining the population
this way limited inclusion to only patients considered at high risk for intracranial hypertension or
who had documented intracranial hypertension, either through monitoring or clinical assessment.
Thus, the population was more specific than those in the Alali or Talving studies.2,5 While the
Brain Trauma Foundation criteria were designed to identify patients at risk for intracranial
hypertension (ICH), there may be patients who meet these criteria for whom monitoring is not
appropriate. Using the subset of the population treated for ICH increases the likelihood that the
patients who were monitored and those who were not monitored were similar, thereby
contributing to the internal validity. Therefore, the interpretation of the results can also be more
specific; the conclusion is that treatment directed by ICP monitoring results in better outcomes
for patients with or at high risk for intracranial hypertension. However, using treatment to
identify the comparison group may make it difficult to replicate the results, as there are no
standards for using ICP-lowering therapy when a patient’s ICP is not monitored. Whether this is
a serious threat to the generalizability of results cannot be known until attempts are made to
replicate the results.
The approach taken by Farahvar et al. is problematic in terms of application to clinical
practice. It is possible to use treatment to identify a population to study retrospectively, but a
clinician needs to decide whether to monitor a patient before and during, not after, treatment.
Thus, while this study offers a stronger conclusion about the benefit of monitoring, it does not
offer a practical application for how to implement more targeted monitoring that could replicate
these gains in patient survival.
Class 3 Studies
The evidence from the Class 3 studies of intracranial pressure monitoring is summarized in
Table 12-3.

140
Table 12-3. Summary of Evidence – Class 3 Studies (Intracranial Pressure Monitoring) Reference
Study Topic Study Description Data Class
Results Conclusion
Influence on outcomes of information from ICP monitor to guide treatment New Studies
Haddad 2011*7 Assessed relationship between ICP monitoring and outcomes
Retrospective Cohort N=477 ICP monitored=52 (10.9%) Single Tertiary Care Teaching Hospital in Riyadh, Saudi Arabia In-hospital Mortality ICU mortality Mechanical Ventilation Days Tracheostomy ICU and Hospital LOS
Class 3
ICP monitoring vs. None Hospital Mortality OR 1.71, 95% CI 0.79 to 3.70, p=0.17. ICU mortality OR 1.01, 95% CI 0.41 to 2.45, p=0.99, (respectively). Need for tracheostomy OR 2.02, 95% CI 1.02 to 4.03, p=0.04. Hospital LOS OR 8.32, 95% CI -82.6 to 99.25, p=0.86. Mechanical ventilation duration OR 5.66, 95% CI 3.45 to 7.88, p<0.0001. ICU LOS OR 5.62, 95% CI 3.27 to 7.98, p<0.0001.
Kostic 2011*8 Compared ICP with no ICP for mortality
RCT N=61 ICP monitored: 32 (52.5%) Single Center in Serbia
Class 3
ICP vs. no ICP Survival rate χ2=2.11; p=0.15; p>0.05. No significant difference.
Liew 2009*9 Compared 3 groups (ICP/CPP monitored, ventilated, or intubated) on mortality and discharge, 3-month, and 6-month GOS
Prospective Cohort N=72 ICP/CPP: 15 Ventilated: 16 Intubated: 41 Single Center in Johor Bahru, Malaysia. Mortality and GOS
Class 3
ICP vs. Ventilation Group Higher risk of mortality (p<0.001), Worse GCS improvement upon discharge (p<0.001) Longer ICU LOS (p=0.016). There were no significant differences in GOS at 3 and 6 months post-injury between across all three groups.
Mauritz 2008*10 Identified reasons why patients did or did not receive ICP monitoring; identify factors influencing hospital mortality
Prospective Cohort N=1,856 ICP monitored=1031 (55.5%) 32 Centers in Austria Mortality
Class 3
ICP vs. No ICP Hospital Mortality 39% vs. 38% p=NS ICU Mortality 35% vs. 34% p=NS Results addressing characteristics associated with whether a patient was monitored or not are reported in the article but not repeated here as the guideline focuses on the impact of monitoring on outcomes.

141
Reference Study Topic Study Description
Data Class
Results Conclusion
Shafi 2008*11
Retrospective Cohort N=1646 ICP monitored: 708 (43%) Centers participating in the National Trauma Data Bank Mortality
Class 3
ICP monitoring was associated with a 45% reduction in survival (OR 0.55; 95% CI 0.39 to 0.76; p<0.001).
Studies from 3rd Edition Cremer 200512 Retrospective study with prospective
outcome data collection comparing mortality and 12-month GOS in severe TBI patients treated in 2 hospitals, one with ICP monitoring (n=211) and the other without (n=122).
Class 3
No significant difference in mortality or GOS at 12 months. Baseline differences between groups in hypotension on admission and number of patients transferred from other hospitals.
Fakhry 200413 Retrospective comparison of mortality and outcomes for severe TBI patients in three groups: 1) before the use of guidelines-based protocol (1991to 1994, n=219) 2) after initiation of the protocol with low compliance (1995 to 1996, n=188 3) after initiation of the protocol with high compliance (1997 to 2000, n=423).
Class 3
Significant decrease in mortality between patients from 1991-1996 and those from 1997-2000 (4.5%, p=0.047). Significantly more patients with GOS scores of 4 or 5 in the 1997-2000 cohort (61.5%) than in the 1995-1996 (50.3%) or 1991-1994 (43.3%) cohorts (p<0.001).
Lane 200014 Retrospective review of the Ontario Trauma Registry evaluating 5,507 severe TBI patients, 541 with ICP monitoring.
Class 3
When severity of injury was controlled for, ICP monitoring was associated with improved survival.
Patel 200215 Comparative retrospective review of severe TBI patients from two time periods, pre (1991 to 1993, n=53) and post (1994 to 1997, n=129) establishment of a dedicated NCCU.
Class 3
Patients treated in the pre-establishment group (n=53) had 59% ICP monitoring. Patients in the post-establishment group (n=129) had 96% ICP monitoring. Significantly better 6-month GOS scores in the post-establishment group.
Abbreviations: CPP=cerebral perfusion pressure, CT=computed tomography, GCS=Glasgow Coma Scale, GOS=Glasgow Outcome Scale, ICP=intracranial pressure monitoring ICU=intensive care unit, LOS=length of stay, N=total sample size, NCCU=Neurosciences Critical Care Unit, NS=not significant, OR=odds ratio, RCT=randomized controlled trial. *References new to the 4th Edition.
Of the five new Class 3 studies included since the 3rd Edition of these guidelines, one was an
RCT in which patients were randomized to ICP monitoring or no ICP monitoring.8 Due to
concerns about randomization, allocation concealment, sample size, and potential selection bias,
the findings from this study cannot be used to support a Level I or II recommendation.
Two retrospective studies7,11 and two prospective cohort studies9,10 compared outcomes for
patients who received ICP monitoring with those who did not. Of 4,112 total patients observed,
142
1,838 were monitored (44.7%). There was no association between monitoring and (a) mortality
in three studies, (b) hospital length of stay (LOS) in one study, and (c) Glasgow Outcome Scale
(GOS) at 3 and 6 months in one study. There was a significant association between monitoring
and (a) increased mechanical ventilation time in one study, (b) need for tracheostomy in one
study, and (c) ICU length of stay in two studies.
The four Class 3 studies maintained from the 3rd Edition were retrospective.12-15 One
compared outcomes for patients from two hospitals (one used ICP monitors and the other did
not); one compared monitored versus non-monitored patients; one compared cohorts of patients
from pre-guidelines protocols versus post-guidelines protocols; and one compared cohorts of
patients from time periods with low ICP monitoring compliance versus high ICP monitoring
compliance. A total of 1,886 patients were observed. Two studies found decreased mortality and
two improved outcomes in the monitored groups; one found no difference in mortality.
Due to the observational nature of these studies, the reasons for selecting patients for
monitoring could be determinants of the observed outcomes, independent of the influence of the
information from ICP monitoring. As such, they were rated Class 3.
REFERENCES
1. Lundberg N, Troupp H, Lorin H. Continuous recording of the ventricular-fluid pressure in patients with severe acute traumatic brain injury. A preliminary report. J Neurosurg. Jun 1965;22(6):581-590. PMID: 5832775.
2. Alali AS, Fowler RA, Mainprize TG, et al. Intracranial pressure monitoring in severe traumatic brain injury: results from the American College of Surgeons Trauma Quality Improvement Program. J Neurotrauma. Oct 15 2013;30(20):1737-1746. PMID: 23731257.
3. Farahvar A, Gerber LM, Chiu YL, Carney N, Hartl R, Ghajar J. Increased mortality in patients with severe traumatic brain injury treated without intracranial pressure monitoring. J Neurosurg. Oct 2012;117(4):729-734. PMID: 22900846.
4. Gerber LM, Chiu YL, Carney N, Hartl R, Ghajar J. Marked reduction in mortality in patients with severe traumatic brain injury. J Neurosurg. Dec 2013;119(6):1583-1590. PMID: 24098983.
5. Talving P, Karamanos E, Teixeira PG, et al. Intracranial pressure monitoring in severe head injury: compliance with Brain Trauma Foundation guidelines and effect on outcomes: a prospective study. J Neurosurg. Nov 2013;119(5):1248-1254. PMID: 23971954.
6. Chesnut RM, Temkin N, Carney N, et al. A trial of intracranial-pressure monitoring in traumatic brain injury. N Engl J Med. Dec 2012;367(26):2471-2481. PMID: 23234472.

143
7. Haddad S, Aldawood AS, Alferayan A, Russell NA, Tamim HM, Arabi YM. Relationship between intracranial pressure monitoring and outcomes in severe traumatic brain injury patients. Anaesth Intensive Care. Nov 2011;39(6):1043-1050. PMID: 22165356.
8. Kostic A, Stefanovic I, Novak V, Veselinovic D, Ivanov G, Veselinovic A. Prognostic significance of intracranial pressure monitoring and intracranial hypertension in severe brain trauma patients. Med Pregl. 2011;64(9-10):461-465. PMID: 22097111.
9. Liew BS, Johari SA, Nasser AW, Abdullah J. Severe traumatic brain injury: outcome in patients with diffuse axonal injury managed conservatively in Hospital Sultanah Aminah, Johor Bahru--an observational study. Med J Malaysia. 2009;64(4):280-288. PMID: 20954551.
10. Mauritz W, Steltzer H, Bauer P, Dolanski-Aghamanoukjan L, Metnitz P. Monitoring of intracranial pressure in patients with severe traumatic brain injury: an Austrian prospective multicenter study. Intensive Care Med. Jul 2008;34(7):1208-1215. PMID: 18365169.
11. Shafi S, Diaz-Arrastia R, Madden C, Gentilello L. Intracranial pressure monitoring in brain-injured patients is associated with worsening of survival. J Trauma. Feb 2008;64(2):335-340. PMID: 18301195.
12. Cremer OL, van Dijk GW, van Wensen E, et al. Effect of intracranial pressure monitoring and targeted intensive care on functional outcome after severe head injury. Crit Care Med. Oct 2005;33(10):2207-2213. PMID: 16215372.
13. Fakhry SM, Trask AL, Waller MA, Watts DD. Management of brain-injured patients by an evidence-based medicine protocol improves outcomes and decreases hospital charges. J Trauma. Mar 2004;56(3):492-499; discussion 499-500. PMID: 15128118.
14. Lane PL, Skoretz TG, Doig G, Girotti MJ. Intracranial pressure monitoring and outcomes after traumatic brain injury. Can J Surg. Dec 2000;43(6):442-448. PMID: 11129833.
15. Patel HC, Menon DK, Tebbs S, Hawker R, Hutchinson PJ, Kirkpatrick PJ. Specialist neurocritical care and outcome from head injury. Intensive Care Med. May 2002;28(5):547-553. PMID: 12029400.
16. Albuquerque FC. Intracranial pressure monitoring after blunt head injuries: conflicting opinions. World Neurosurg. 2013;79(5-6):598. PMID: 23528792.
17. Chesnut RM. Intracranial pressure monitoring: headstone or a new head start. The BEST TRIP trial in perspective. Intensive Care Med. 2013;39(4):771-774. PMID: 23407979.
18. Chesnut RM, Petroni G, Rondina C. Intracranial-pressure monitoring in traumatic brain injury. N Engl J Med. May 2013;368(18):1751-1752. PMID: 23635057.
19. De Bonis P, Mangiola A, Pompucci A, Formisano R, Mattogno P, Anile C. CSF dynamics analysis in patients with post-traumatic ventriculomegaly. Clin Neurol Neurosurg. Jan 2013;115(1):49-53. PMID: 22595485.
20. Dubost C, Pasquier P, Merat S. Intracranial-pressure monitoring in traumatic brain injury. N Engl J Med. May 2013;368(18):1750-1751. PMID: 23635063.
21. Ghajar J, Carney N. Intracranial-pressure monitoring in traumatic brain injury. N Engl J Med. May 2013;368(18):1749. PMID: 23635060.
22. Hartl R, Stieg PE. Intracranial pressure is still number 1 despite BEST:TRIP study. World Neurosurg. May-Jun 2013;79(5-6):599-600. PMID: 23528795.
144
23. Hutchinson PJ, Kolias AG, Czosnyka M, Kirkpatrick PJ, Pickard JD, Menon DK. Intracranial pressure monitoring in severe traumatic brain injury. BMJ. 2013;346:f1000. PMID: 23418278.
24. Kahle KT, Duhaime AC. Intracranial-pressure monitoring in traumatic brain injury. N Engl J Med. May 2013;368(18):1750. PMID: 23635062.
25. Lazaridis C, DeSantis SM, Smielewski P, et al. Patient-specific thresholds of intracranial pressure in severe traumatic brain injury. J Neurosurg. Apr 2014;120(4):893-900. PMID: 24506248.
26. Levitt MR, Osbun JW, Kim LJ. Intracranial pressure monitoring in severe traumatic brain injury. World Neurosurg. 2013;79(5-6):600-601. PMID: 23531729
27. Mattei TA. Intracranial pressure monitoring in severe traumatic brain injury: who is still bold enough to keep sinning against the level I evidence? World Neurosurg. 2013;79(5-6):602-604. PMID: 23531728.
28. Mukherjee D, Sarmiento JM, Patil CG. Intracranial-pressure monitoring in traumatic brain injury. N Engl J Med. May 2013;368(18):1748-1749. PMID: 23635059.
29. Pilge S, Schneider G. [Hot topics in neuroanesthesia : the five most important publications from the previous year]. Der Anaesthesist. Jul 2013;62(7):562-567. PMID: 23812273.
30. Romner B, Grande PO. Traumatic brain injury: Intracranial pressure monitoring in traumatic brain injury. Nat Rev Neurol. 2013;9(4):185-186. PMID: 23478466.
31. Ropper AH. Brain in a box. N Engl J Med. Dec 2012;367(26):2539-2541. PMID: 23234471.
32. Ropper AE, Chi JH. Treatment of traumatic brain injury without direct intracranial pressure monitoring. Neurosurg. Apr 2013;72(4):N19-20. PMID: 23511832.
33. Rubiano AM, Puyana JC. Intracranial-pressure monitoring in traumatic brain injury. N Engl J Med. May 2013;368(18):1748. PMID: 23635058.
34. Sarrafzadeh AS, Smoll NR, Unterberg AW. Lessons from the intracranial pressure-monitoring trial in patients with traumatic brain injury. World Neurosurg. Jul-Aug 2014;82(1-2):e393-395. PMID: 23886816.

145
13. Cerebral Perfusion Pressure Monitoring
INTRODUCTION
Cerebral perfusion pressure (CPP) is defined as the pressure gradient across the cerebral
vascular bed, between blood inflow and outflow. Inflow pressure is taken as mean arterial
pressure (MAP), which by convention is calibrated to the level of the right atrium of the heart. In
normal physiology the outflow or downstream pressure is the jugular venous pressure (JVP),
which is also calibrated to the level of the right atrium. Traumatic brain injury (TBI) is a special
pathological state in which pressure surrounding cerebral vessels—intracranial pressure (ICP)—
is elevated and higher than the JVP. In this circumstance CPP will be proportional to the gradient
between MAP and mean ICP, and changes in CPP can occur with alterations in either MAP or
ICP.1
Cerebral autoregulation is defined as the maintenance of cerebral blood flow (CBF) over a
wide range of CPPs, brought about by homeostatic change in cerebral vascular resistance.2 Thus,
assuming that CPP provides the stimulus for cerebral autoregulation, no change in flow would be
anticipated as long as the CPP remained within the upper and lower limits of autoregulation. TBI
management includes CPP monitoring in the “bundle” of care. However, the question remains as
to whether CPP can, itself, influence outcome, separate from MAP and ICP monitoring.
RECOMMENDATIONS
Level I
• There was insufficient evidence to support a Level I recommendation for this topic.
Level II B
• Management of severe TBI patients using guidelines-based recommendations for CPP
monitoring is recommended to decrease 2-week mortality.
Changes from Prior Edition
In the 3rd Edition of these guidelines, CPP monitoring and thresholds were combined into
one section. In this edition they are reported separately with new evidence added. Of the 11
publications included in the section about CPP in the 3rd Edition, seven provided information
about thresholds and are addressed in that topic, and one was eliminated because it is not

146
comparative and thus does not meet the criteria for this review. Four are summarized in this topic
(one was used for both CPP topics). The recommendations from the 3rd Edition were about
thresholds and are addressed in that topic in this 4th Edition. One study rated Class 2 in the 3rd
Edition3 was reevaluated and rated Class 3.
EVALUATION OF THE EVIDENCE
Quality of the Body of Evidence
The quality of the body of evidence on CPP monitoring appears in Table 13-1. Three new
studies were identified relevant to the use of CPP monitoring to manage hospitalized patients
with severe TBI.4-6 One that was rated Class 24 assessed the influence on outcomes of guidelines-
based protocols (which require ICP and CPP monitoring). This study provided moderate-quality
evidence that management guided by information from CPP monitoring leads to decreased
mortality at 2 weeks post-injury. The new Class 3 studies5,6 and four from the 3rd Edition of
these guidelines3,7-9 are summarized in Table 13-3 and the text below, but are not used for
recommendations and are not included in the overall body of evidence.
Table 13-1. Quality of the Body of Evidence (Cerebral Perfusion Pressure Monitoring)
Topic
Number of
Studies Meta-
Analysis
Number
of Subjects
Class of Studies
Consistency (High,
Moderate, Low)
Directness (Direct or Indirect)
Precision (High,
Moderate, Low)
Quality of Evidence
(High, Moderate,
Low, or Insufficient)
COMPONENTS OF OVERALL QUALITY – Class 2 Use of guidelines based protocols that include CPP monitoring4
1 Cohort 0 RCT
NA 2,320 2 NA Direct Low Low
COMPONENTS OF OVERALL QUALITY – Class 3 Evaluation of CPP-driven management 3, 7-9
1 RCT 4 Pro-spective 1 Retro-spective
NA 944 3 Low Direct Low Insufficient
Abbreviations: CPP=cerebral perfusion pressure, NA=not applicable, RCT=randomized controlled trial.
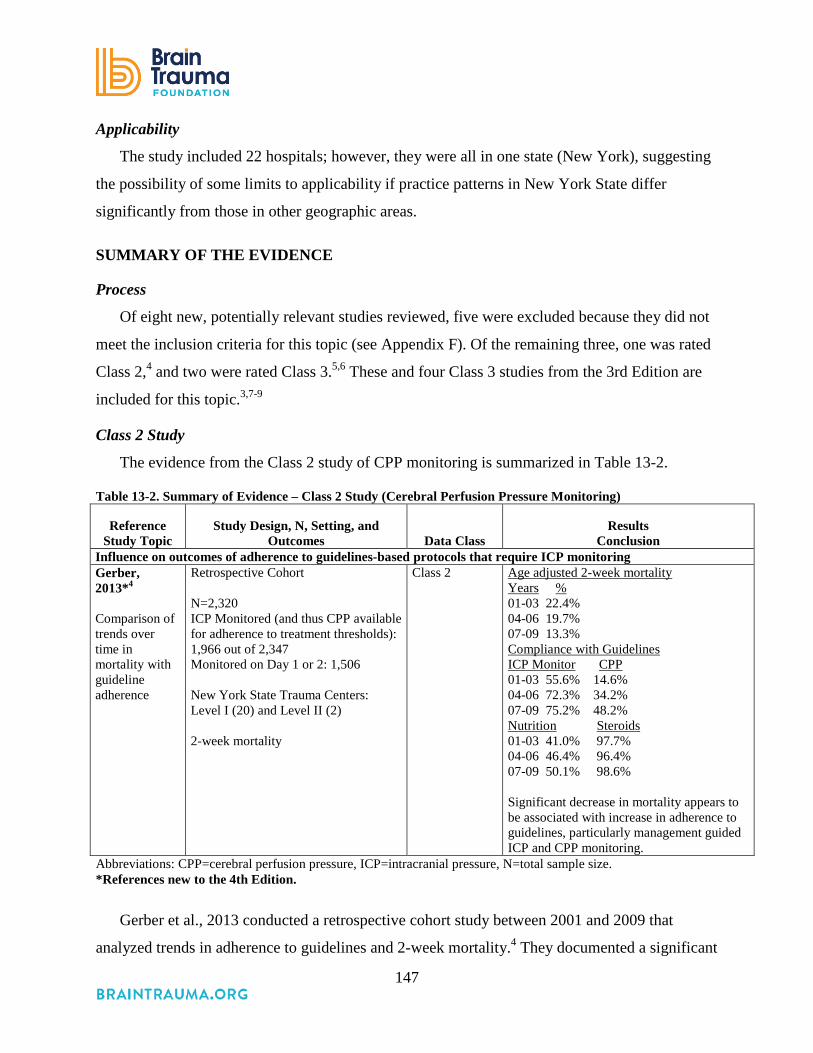
147
Applicability
The study included 22 hospitals; however, they were all in one state (New York), suggesting
the possibility of some limits to applicability if practice patterns in New York State differ
significantly from those in other geographic areas.
SUMMARY OF THE EVIDENCE
Process
Of eight new, potentially relevant studies reviewed, five were excluded because they did not
meet the inclusion criteria for this topic (see Appendix F). Of the remaining three, one was rated
Class 2,4 and two were rated Class 3.5,6 These and four Class 3 studies from the 3rd Edition are
included for this topic.3,7-9
Class 2 Study
The evidence from the Class 2 study of CPP monitoring is summarized in Table 13-2.
Table 13-2. Summary of Evidence – Class 2 Study (Cerebral Perfusion Pressure Monitoring)
Reference Study Topic
Study Design, N, Setting, and Outcomes Data Class
Results Conclusion
Influence on outcomes of adherence to guidelines-based protocols that require ICP monitoring Gerber, 2013*4 Comparison of trends over time in mortality with guideline adherence
Retrospective Cohort N=2,320 ICP Monitored (and thus CPP available for adherence to treatment thresholds): 1,966 out of 2,347 Monitored on Day 1 or 2: 1,506 New York State Trauma Centers: Level I (20) and Level II (2) 2-week mortality
Class 2 Age adjusted 2-week mortality Years % 01-03 22.4% 04-06 19.7% 07-09 13.3% Compliance with Guidelines ICP Monitor CPP 01-03 55.6% 14.6% 04-06 72.3% 34.2% 07-09 75.2% 48.2% Nutrition Steroids 01-03 41.0% 97.7% 04-06 46.4% 96.4% 07-09 50.1% 98.6% Significant decrease in mortality appears to be associated with increase in adherence to guidelines, particularly management guided ICP and CPP monitoring.
Abbreviations: CPP=cerebral perfusion pressure, ICP=intracranial pressure, N=total sample size. *References new to the 4th Edition.
Gerber et al., 2013 conducted a retrospective cohort study between 2001 and 2009 that
analyzed trends in adherence to guidelines and 2-week mortality.4 They documented a significant

148
decrease in mortality at the same time as an increase in guidelines compliance, including CPP
monitoring. The rate of increase in CPP monitoring was the highest of the guidelines
components analyzed in the study. The applicability of this study is moderate. Its strengths are
large sample size, multiple sites, and study duration over almost 10 years. However, all sites
were in New York State, and the practice environment and patient populations may have differed
from those of other geographic regions.
Class 3 Studies
The evidence from the Class 3 studies of CPP monitoring is summarized in Table 13-3.
Table 13-3. Summary of Evidence – Class 3 Studies (Cerebral Perfusion Pressure Monitoring)
Reference Study Topic Study Design, N, Setting, and Outcomes Data Class
Results Conclusion
New Studies Huang 2006*5 Compared ICP-targeted to CPP-targeted therapy
Retrospective Cohort N=213 ICP-targeted: 84 CPP-targeted > 70 mm Hg: 77 mCPP-targeted > 60 mm Hg: 52 University Hospital in Taiwan Mortality Dichotomized GOS at 6 months post-injury
Class 3 Mortality rate in ICP-targeted therapy group was significantly higher than that in the CPP and mCPP groups (p=0.02 and p=0.03, respectively) Favorable outcome in the ICP group was lower than in the CPP and mCPP groups (p=0.04 and p=0.01, respectively). No difference in mortality or outcomes between CPP and mCPP groups.
Johnson 2011*6 Compared outcomes for patients with high/low CPA and high/low CPP
Prospective Cohort N=58 Group 1: Active CPA/low CPP: 10 Group 2: Active CPA/high CPP: 8 Group 3: Passive CPA/low CPP: 15 Group 4: Passive CPA/high CPP: 6 University Hospital in Sweden Dichotomized GOS-E
Class 3 Favorable outcomes significantly higher in Group 3 (passive CPA/low CPP) than Group 4 (passive CPA/high CPP) (p=0.0067). No significant difference in outcomes between Group 2 (active CPA/high CPP) and Group 1 (active CPA/low CPP).
Studies from 3rd Edition Cruz 19987 Prospective observational study of 6-month
outcomes in adults with severe TBI characterized by brain swelling where 178 were treated according to cerebral oxygen extraction and CPP and 175 were treated with management of CPP alone at values >70 mm Hg.
Class 3 Mortality in the cohort managed according to jugular venous saturation was 9% vs. 30% in the CPP group.
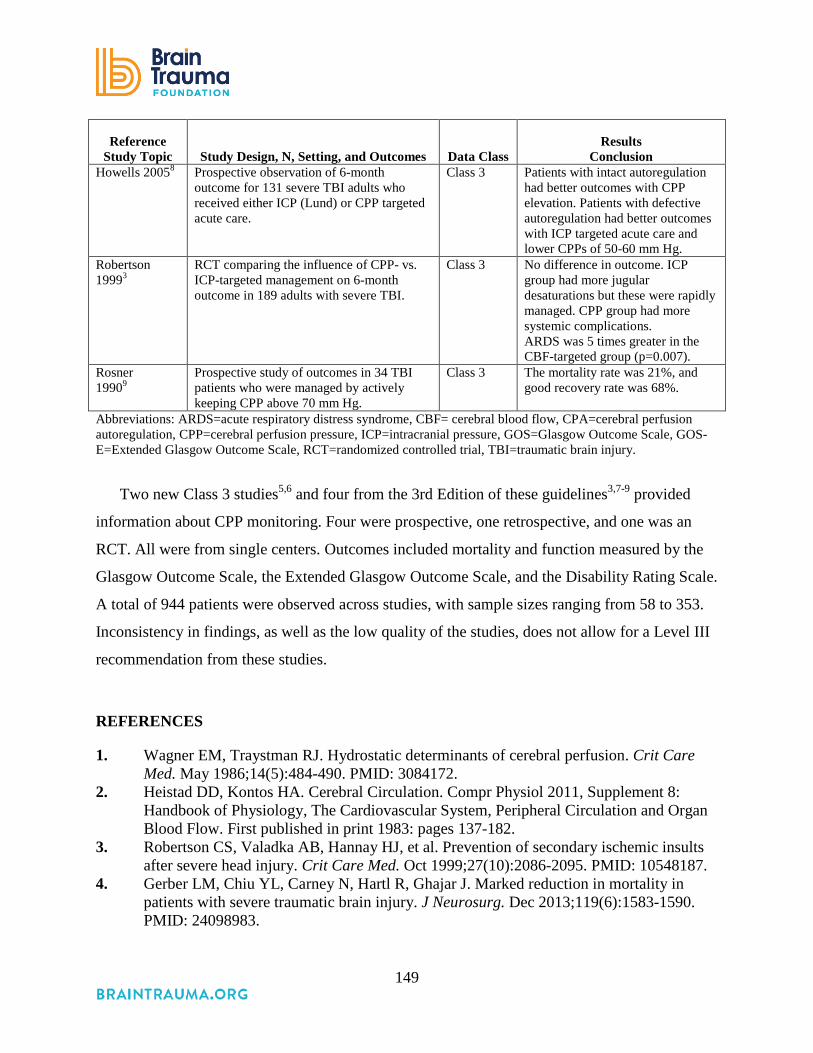
149
Reference Study Topic Study Design, N, Setting, and Outcomes Data Class
Results Conclusion
Howells 20058 Prospective observation of 6-month outcome for 131 severe TBI adults who received either ICP (Lund) or CPP targeted acute care.
Class 3 Patients with intact autoregulation had better outcomes with CPP elevation. Patients with defective autoregulation had better outcomes with ICP targeted acute care and lower CPPs of 50-60 mm Hg.
Robertson 19993
RCT comparing the influence of CPP- vs. ICP-targeted management on 6-month outcome in 189 adults with severe TBI.
Class 3 No difference in outcome. ICP group had more jugular desaturations but these were rapidly managed. CPP group had more systemic complications. ARDS was 5 times greater in the CBF-targeted group (p=0.007).
Rosner 19909
Prospective study of outcomes in 34 TBI patients who were managed by actively keeping CPP above 70 mm Hg.
Class 3 The mortality rate was 21%, and good recovery rate was 68%.
Abbreviations: ARDS=acute respiratory distress syndrome, CBF= cerebral blood flow, CPA=cerebral perfusion autoregulation, CPP=cerebral perfusion pressure, ICP=intracranial pressure, GOS=Glasgow Outcome Scale, GOS-E=Extended Glasgow Outcome Scale, RCT=randomized controlled trial, TBI=traumatic brain injury.
Two new Class 3 studies5,6 and four from the 3rd Edition of these guidelines3,7-9 provided
information about CPP monitoring. Four were prospective, one retrospective, and one was an
RCT. All were from single centers. Outcomes included mortality and function measured by the
Glasgow Outcome Scale, the Extended Glasgow Outcome Scale, and the Disability Rating Scale.
A total of 944 patients were observed across studies, with sample sizes ranging from 58 to 353.
Inconsistency in findings, as well as the low quality of the studies, does not allow for a Level III
recommendation from these studies.
REFERENCES
1. Wagner EM, Traystman RJ. Hydrostatic determinants of cerebral perfusion. Crit Care Med. May 1986;14(5):484-490. PMID: 3084172.
2. Heistad DD, Kontos HA. Cerebral Circulation. Compr Physiol 2011, Supplement 8: Handbook of Physiology, The Cardiovascular System, Peripheral Circulation and Organ Blood Flow. First published in print 1983: pages 137-182.
3. Robertson CS, Valadka AB, Hannay HJ, et al. Prevention of secondary ischemic insults after severe head injury. Crit Care Med. Oct 1999;27(10):2086-2095. PMID: 10548187.
4. Gerber LM, Chiu YL, Carney N, Hartl R, Ghajar J. Marked reduction in mortality in patients with severe traumatic brain injury. J Neurosurg. Dec 2013;119(6):1583-1590. PMID: 24098983.

150
5. Huang SJ, Hong WC, Han YY, et al. Clinical outcome of severe head injury using three different ICP and CPP protocol-driven therapies. J Clin Neurosci. Oct 2006;13(8):818-822. PMID: 16908157.
6. Johnson U, Nilsson P, Ronne-Engstrom E, Howells T, Enblad P. Favorable outcome in traumatic brain injury patients with impaired cerebral pressure autoregulation when treated at low cerebral perfusion pressure levels. Neurosurg. 2011;68(3):714-721; discussion 721-712. PMID: 21311298.
7. Cruz J. The first decade of continuous monitoring of jugular bulb oxyhemoglobin saturation: management strategies and clinical outcome. Crit Care Med. Feb 1998;26(2):344-351. PMID: 9468174.
8. Howells T, Elf K, Jones PA, et al. Pressure reactivity as a guide in the treatment of cerebral perfusion pressure in patients with brain trauma. J Neurosurg. Feb 2005;102(2):311-317. PMID: 15739560.
9. Rosner MJ, Daughton S. Cerebral perfusion pressure management in head injury. J Trauma. Aug 1990;30(8):933-940; discussion 940-931. PMID: 2117669.

151
14. Advanced Cerebral Monitoring
INTRODUCTION
Multiple pathophysiologic pathways that include local and systemic influences contribute to
evolving brain damage after traumatic brain injury (TBI). When oxygen or glucose delivery to
tissue is limited to the point that tissue needs are not met, metabolism fails and cells
die. Advanced cerebral monitoring techniques for blood flow and oxygen include: transcranial
Doppler (TCD)/duplex sonography, differences between arterial and arterio-jugular venous
oxygen (AVDO2), and measurements of local tissue oxygen. Arterio-jugular AVDO2 globally
measures cerebral oxygen extraction. However, the measured AVDO2 can potentially differ from
the other unmeasured hemisphere in TBI patients.1 Tissue monitors are placed in the cerebral
cortex and directly measure tissue oxygen in the immediate area. The relationship between brain
tissue oxygen, oxygen delivery, and diffusion of dissolved oxygen across the blood brain barrier
is not simple, and most studies using tissue oxygen monitors treat initial desaturation episodes
with 100% inspired oxygen rather than a transfusion of red blood cells or vasopressor
administration to improve cerebral perfusion pressure (CPP).2
Additional monitoring methods include microdialysis to measure brain metabolism (glucose,
lactate, pyruvate, and glutamate) and electrocorticography to determine cortical spreading
depression; however, use of these last two monitoring techniques is not common outside of
research settings.
Theoretically, use of advanced monitoring in tandem with intracranial pressure (ICP) and
CPP monitoring adds to the assessment of brain metabolic needs and the effects of therapies to
meet them. However, all techniques have limitations and potential risks. This topic provides a
systematic review of the literature pertaining to such monitoring in severe TBI.
RECOMMENDATIONS
Level I and II
• There was insufficient evidence to support a Level I or II recommendation for this topic.

152
(Although patients with desaturations identified with advanced cerebral monitoring have poorer
outcomes, Level II evidence showed no improvement in outcomes for monitored patients.)
Level III
• Jugular bulb monitoring of arteriovenous oxygen content difference (AVDO2), as a
source of information for management decisions, may be considered to reduce mortality
and improve outcomes at 3 and 6 months post-injury.
Changes from Prior Edition
In the 3rd Edition of these guidelines, monitoring and thresholds were combined into one
section. In this 4th Edition they are reported separately, and this topic has been renamed
Advanced Cerebral Monitoring (ACM). The Level III recommendation about monitoring
AVDO2 from the 3rd Edition was articulated as a statement, not a recommendation, and thus has
been revised. The Level III recommendation about brain tissue oxygen monitoring has been
removed because of higher-quality, contradictory evidence acquired since the 3rd Edition of
these guidelines.
EVALUATION OF THE EVIDENCE
Quality of the Body of Evidence
The literature for this topic addresses four cerebral monitoring approaches: brain tissue
oxygen (PbrO2) monitoring, jugular bulb monitoring of arteriovenous oxygen content difference
(AVDO2), cerebral autoregulation monitoring with TCD, and microdialysis monitoring of
extracellular glutamate.
Brain Tissue Oxygen (PbrO2) Monitoring. One Class 2 study3 (Table 14-2) provided
information showing that hypoxia detected by monitors is associated with worse outcomes but
does not link treatment in response to PbrO2 monitoring to outcomes. This rendered the overall
quality of the body of evidence insufficient to support a Level II recommendation, particularly
given the findings from this study were null. Six Class 3 studies4-9 addressed PbrO2 monitoring,
three of which found an effect, and three of which did not. The inconsistency across this body of
evidence prevents its use to support a Level III recommendation. These studies are included in
Table 14-3 and the summary section below.
153
Arteriovenous Oxygen Content Difference (AVDO2). Four Class 3 studies10-13 constituted a
low quality of the body of evidence about AVDO2 monitoring and support a Level III
recommendation.
Transcranial Doppler and Microdialysis. Two Class 3 studies were found, one each
addressing the two remaining monitoring approaches, TCD14 and microdialysis.15 Given they
were single-center Class III studies, and there was only one study for each of the approaches, the
body of evidence is insufficient to support a Level III recommendation. The studies are included
in Table 14-3 and the summary section below.
Table 14-1. Quality of the Body of Evidence (Advanced Cerebral Monitoring)
Topic Number of
Studies Meta-
Analysis
Number
of Subjects
Class of Studies
Consistency (High,
Moderate, Low)
Directness (Direct or Indirect)
Precision (High,
Moderate, Low)
Quality of Evidence
(High, Moderate,
Low, or Insufficient)
COMPONENTS OF OVERALL QUALITY – Class 2 PbrO2 monitoring3
1 Cohort 0 RCT
NA 629 2 NA Direct Low Insufficient
COMPONENTS OF OVERALL QUALITY – Class 3 AVDO2 monitoring10
-13
4 Prospective cohort
NA 678 3 High Direct Low Low
Abbreviations: NA=not applicable, RCT=randomized controlled trial. Note: Different abbreviations such as pBtO2/PbtO2 and PtiO2 are used to mean brain tissue oxygen monitoring and brain tissue oxygen tension; we use PbrO2 for consistency, which may differ from what the study authors used.
Applicability
All patients in these studies were from single centers, which limited their applicability.
SUMMARY OF THE EVIDENCE
Process
Of 51 new, potentially relevant studies reviewed, 42 were excluded because they did not
meet the inclusion criteria for this topic (Appendix F). Of the remaining nine, one was rated
Class 2 and was included as evidence for this topic.3 The remaining eight were rated Class 3.
These studies, along with five studies from the 3rd Edition, were included as Class 3 evidence
for this topic.4-15

154
Class 2 Study
The evidence from the Class 2 study of advanced cerebral monitoring is summarized in Table
14.2
Table 14-2. Summary of Evidence: Class 2 Study (Advanced Cerebral Monitoring)
Reference Study Topic Study Design, N, and Outcomes
Data Class
Results Conclusion
Brain Tissue Oxygen Monitoring Martini, 2009*3 Comparison of both PbrO2 and ICP monitoring vs. ICP monitoring only
Retrospective Cohort - N=629 PbO2 and ICP=123 ICP only=506 In-hospital mortality FIM LOS Hospital cost Duration of mechanical ventilation
Class 2 Mortality ICP and PbrO2=36 (29.3%) ICP=114 (22.5%), p=0.12. No difference in hospital mortality rate in patients who were managed with ICP and PbrO2 monitoring compared with those who were managed with ICP monitoring only. Mean FIM scores in survivors were significantly lower and hospital costs were higher for the PbrO2 group (p<0.01).
Abbreviations: ACM=advanced cerebral monitoring, ICP=intracranial pressure monitoring, FIM=Functional Independence Measure, LOS=length of stay, N=total sample size, PbrO2=brain tissue oxygen, RCT=randomized controlled trial. Note: Different abbreviations such as pBtO2/PbtO2 and PtiO2 are used to mean brain tissue oxygen monitoring and brain tissue oxygen tension; we use PbrO2 for consistency, which may differ from what the study authors used. *Reference new to the 4th Edition.
Brain Tissue Oxygen (PbrO2) Monitoring. Martini et al., 2009 conducted a retrospective
study of all 629 patients admitted to one Level I trauma center with severe TBI between July 1,
2004, and October 15, 2007.3 All patients had ICP monitors while some were also monitored
using the Licox Brain Tissue Oxygenation Probe. Decision to use the Licox was at the discretion
of the attending neurosurgeon. This observational study was retrospective and had unequal
groups (123 with both brain tissue oxygen monitors and ICP monitors, and 503 with ICP
monitors alone). While the analysis accounted for the potential influence of unequal numbers
across groups, the patients with the additional monitor had more severe injuries and were treated
more intensively. The researchers attempted to control for confounding variables (AIS Score,
admission Glasgow Coma Scale [GCS], and Marshall classification of head CT) but
acknowledged that the groups may have had important differences in prognosis. Given this

155
uncertainty and the null findings, this was considered insufficient evidence to support a
recommendation.
Class 3 Studies
The evidence from the Class 3 studies of advanced cerebral monitoring is summarized in Table 14-3. Table 14-3. Summary of Evidence – Class 3 Studies (Advanced Cerebral Monitoring)
Reference Study Topic Study Description Data Class
Results Conclusion
New Studies Brain Tissue Oxygen Monitoring Green 2013*4 Assessed goal-directed PbrO2 monitoring vs. ICP/CPP monitoring
Retrospective Cohort N=74 Single Level I Trauma Center in the United States Mortality, discharge GCS, GOS, and FIMS
Class 3 No significant difference in mortality, GCS, GOS, or FIMS. PbrO2 group had significantly lower ISS (26 [25–30] vs. 30 [26–36], p=0.03) and AIS Chest (0 [0–0] vs. 2 [0–3], p=0.02).
Lee 2010*5 Assessed PbrO2 monitoring-guided management
RCT N=45 Single University Hospital in Taichung, Taiwan Compared outcomes for Group A (ICP/CPP management) N=16, Group B (ICP/CPP management with hypothermia) N=15, and Group C (brain tissue oxygen monitoring PtiO2 and CPP management with hypothermia) N=14 Mortality and GOS at 6 months post-injury
Class 3 Mortality 12.5% in Group A, 6.7% in Group B 8.5% in Group C (no significant difference). Favorable neurologic outcome 50% in Group A, 60% in Group B, 71.4% in Group C (p=0.0426). Mean GOS Group A 3.3 + 1.3 Group B 3.5 + 1.2 Group C 3.9 + 1.2.

156
Reference Study Topic Study Description Data Class
Results Conclusion
McCarthy 2009*6 Assessed cerebral oxygen monitoring-guided management
Prospective Cohort N=145 Single Level I Trauma Center in the United States Compared outcomes for patients monitored for cerebral oxygen/pressure in addition to ICP and CPP (n=81) vs. ICP and CPP (n=64) Mortality, Hospital LOS, ICU LOS, GOS at 3 and 6-months post-injury
Class 3 PbrO2 with ICP and CPP vs. no PbrO2 Mortality, 31% vs. 36%, p=0.52 Hospital LOS (mean days) 22.7 vs. 21.2, p=0.64 ICU LOS 12.4 vs. 12.8, p=0.79 GOS at 3,6, and 12 months: no difference. GOS 24 months Moderate disability or recovered 2% vs. 13% , p=0.04.
Meixensberger 2003*16 Assessed PbrO2 guided treatment
Prospective Cohort Before/After Single University Hospital in Germany N=93 ICP/CPP Group (1993 to 1996) N=40 PbrO2 Group (1997 to 2000) N=53 Dichotomized GOS at 6 months post-injury
Class 3 PbrO2 vs. CPP/ICP GOS at 6-months post-injury GOS 1-3 35% vs. 46% GOS 4-5 65% vs. 54% p=0.27.
Narotam 2009*7 Assessed brain tissue oxygen monitoring-directed therapy
Prospective Cohort vs. Historical Data Prospective for subgroup analysis of severe TBI=96 Historical controls from Traumatic Coma Data Bank=25 Single University Medical Center in the United States Compared outcomes for patients managed based on information from PbrO2 monitoring with those from a ICP/CPP-managed historical controls Mortality, and GOS at discharge and 6 months post-injury
Class 3 Mean GOS at 6 months post-injury significantly higher in PbrO2 group than historical controls (3.55 +-1.75 vs. 2.71 +- 1.65, p<0.01). OR for good outcome for PbrO2 group 2.09 (95% CI 1.031 to 4.24). RR reduction in mortality of 37% for PbrO2 group (25.9% vs. 41.5%).
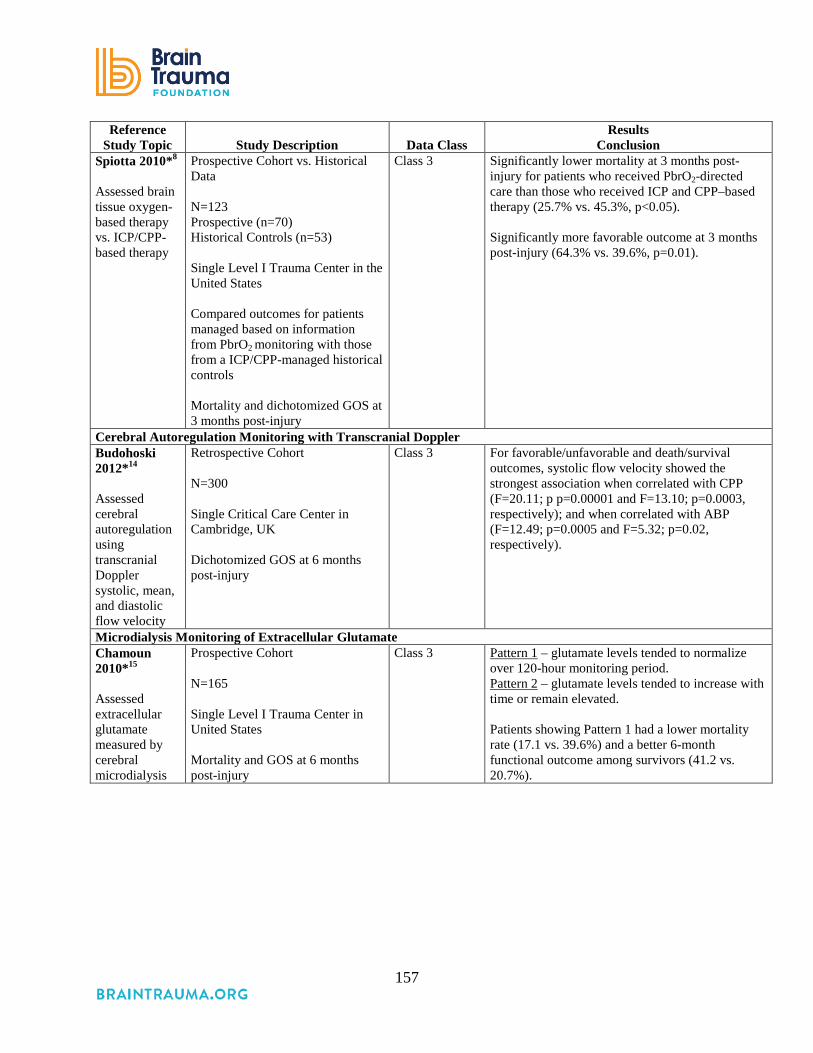
157
Reference Study Topic Study Description Data Class
Results Conclusion
Spiotta 2010*8 Assessed brain tissue oxygen-based therapy vs. ICP/CPP-based therapy
Prospective Cohort vs. Historical Data N=123 Prospective (n=70) Historical Controls (n=53) Single Level I Trauma Center in the United States Compared outcomes for patients managed based on information from PbrO2 monitoring with those from a ICP/CPP-managed historical controls Mortality and dichotomized GOS at 3 months post-injury
Class 3 Significantly lower mortality at 3 months post-injury for patients who received PbrO2-directed care than those who received ICP and CPP–based therapy (25.7% vs. 45.3%, p<0.05). Significantly more favorable outcome at 3 months post-injury (64.3% vs. 39.6%, p=0.01).
Cerebral Autoregulation Monitoring with Transcranial Doppler Budohoski 2012*14 Assessed cerebral autoregulation using transcranial Doppler systolic, mean, and diastolic flow velocity
Retrospective Cohort N=300 Single Critical Care Center in Cambridge, UK Dichotomized GOS at 6 months post-injury
Class 3 For favorable/unfavorable and death/survival outcomes, systolic flow velocity showed the strongest association when correlated with CPP (F=20.11; p p=0.00001 and F=13.10; p=0.0003, respectively); and when correlated with ABP (F=12.49; p=0.0005 and F=5.32; p=0.02, respectively).
Microdialysis Monitoring of Extracellular Glutamate Chamoun 2010*15 Assessed extracellular glutamate measured by cerebral microdialysis
Prospective Cohort N=165 Single Level I Trauma Center in United States Mortality and GOS at 6 months post-injury
Class 3 Pattern 1 – glutamate levels tended to normalize over 120-hour monitoring period. Pattern 2 – glutamate levels tended to increase with time or remain elevated. Patients showing Pattern 1 had a lower mortality rate (17.1 vs. 39.6%) and a better 6-month functional outcome among survivors (41.2 vs. 20.7%).
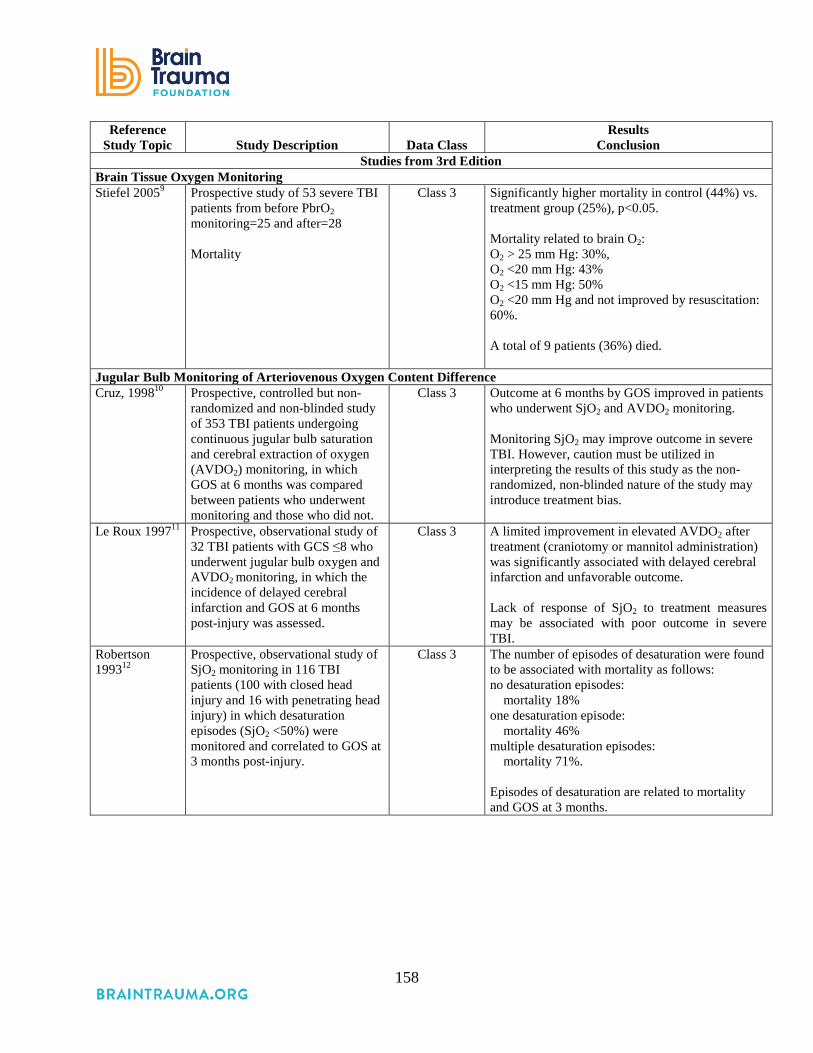
158
Reference Study Topic Study Description Data Class
Results Conclusion
Studies from 3rd Edition Brain Tissue Oxygen Monitoring Stiefel 20059 Prospective study of 53 severe TBI
patients from before PbrO2 monitoring=25 and after=28 Mortality
Class 3 Significantly higher mortality in control (44%) vs. treatment group (25%), p<0.05. Mortality related to brain O2: O2 > 25 mm Hg: 30%, O2 <20 mm Hg: 43% O2 <15 mm Hg: 50% O2 <20 mm Hg and not improved by resuscitation: 60%. A total of 9 patients (36%) died.
Jugular Bulb Monitoring of Arteriovenous Oxygen Content Difference Cruz, 199810 Prospective, controlled but non-
randomized and non-blinded study of 353 TBI patients undergoing continuous jugular bulb saturation and cerebral extraction of oxygen (AVDO2) monitoring, in which GOS at 6 months was compared between patients who underwent monitoring and those who did not.
Class 3 Outcome at 6 months by GOS improved in patients who underwent SjO2 and AVDO2 monitoring. Monitoring SjO2 may improve outcome in severe TBI. However, caution must be utilized in interpreting the results of this study as the non-randomized, non-blinded nature of the study may introduce treatment bias.
Le Roux 199711 Prospective, observational study of 32 TBI patients with GCS ≤8 who underwent jugular bulb oxygen and AVDO2 monitoring, in which the incidence of delayed cerebral infarction and GOS at 6 months post-injury was assessed.
Class 3 A limited improvement in elevated AVDO2 after treatment (craniotomy or mannitol administration) was significantly associated with delayed cerebral infarction and unfavorable outcome. Lack of response of SjO2 to treatment measures may be associated with poor outcome in severe TBI.
Robertson 199312
Prospective, observational study of SjO2 monitoring in 116 TBI patients (100 with closed head injury and 16 with penetrating head injury) in which desaturation episodes (SjO2 <50%) were monitored and correlated to GOS at 3 months post-injury.
Class 3 The number of episodes of desaturation were found to be associated with mortality as follows: no desaturation episodes: mortality 18% one desaturation episode: mortality 46% multiple desaturation episodes: mortality 71%. Episodes of desaturation are related to mortality and GOS at 3 months.
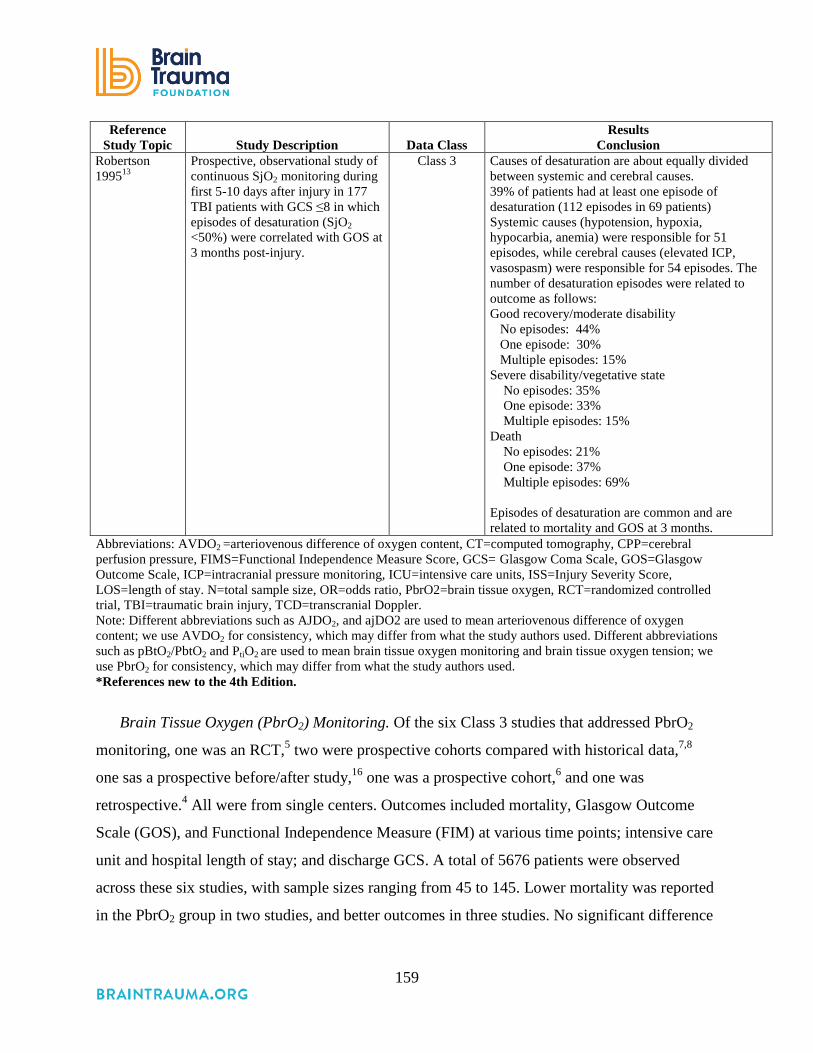
159
Reference Study Topic Study Description Data Class
Results Conclusion
Robertson 199513
Prospective, observational study of continuous SjO2 monitoring during first 5-10 days after injury in 177 TBI patients with GCS ≤8 in which episodes of desaturation (SjO2 <50%) were correlated with GOS at 3 months post-injury.
Class 3 Causes of desaturation are about equally divided between systemic and cerebral causes. 39% of patients had at least one episode of desaturation (112 episodes in 69 patients) Systemic causes (hypotension, hypoxia, hypocarbia, anemia) were responsible for 51 episodes, while cerebral causes (elevated ICP, vasospasm) were responsible for 54 episodes. The number of desaturation episodes were related to outcome as follows: Good recovery/moderate disability No episodes: 44% One episode: 30% Multiple episodes: 15% Severe disability/vegetative state No episodes: 35% One episode: 33% Multiple episodes: 15% Death No episodes: 21% One episode: 37% Multiple episodes: 69% Episodes of desaturation are common and are related to mortality and GOS at 3 months.
Abbreviations: AVDO2 =arteriovenous difference of oxygen content, CT=computed tomography, CPP=cerebral perfusion pressure, FIMS=Functional Independence Measure Score, GCS= Glasgow Coma Scale, GOS=Glasgow Outcome Scale, ICP=intracranial pressure monitoring, ICU=intensive care units, ISS=Injury Severity Score, LOS=length of stay. N=total sample size, OR=odds ratio, PbrO2=brain tissue oxygen, RCT=randomized controlled trial, TBI=traumatic brain injury, TCD=transcranial Doppler. Note: Different abbreviations such as AJDO2, and ajDO2 are used to mean arteriovenous difference of oxygen content; we use AVDO2 for consistency, which may differ from what the study authors used. Different abbreviations such as pBtO2/PbtO2 and PtiO2 are used to mean brain tissue oxygen monitoring and brain tissue oxygen tension; we use PbrO2 for consistency, which may differ from what the study authors used. *References new to the 4th Edition.
Brain Tissue Oxygen (PbrO2) Monitoring. Of the six Class 3 studies that addressed PbrO2
monitoring, one was an RCT,5 two were prospective cohorts compared with historical data,7,8
one sas a prospective before/after study,16 one was a prospective cohort,6 and one was
retrospective.4 All were from single centers. Outcomes included mortality, Glasgow Outcome
Scale (GOS), and Functional Independence Measure (FIM) at various time points; intensive care
unit and hospital length of stay; and discharge GCS. A total of 5676 patients were observed
across these six studies, with sample sizes ranging from 45 to 145. Lower mortality was reported
in the PbrO2 group in two studies, and better outcomes in three studies. No significant difference
160
was found in mortality in two studies, and in outcomes in three studies. The inconsistency across
these Class 3 studies prevents their use for a recommendation.
Nangunoori et al.17 conducted a systematic review that included four of the Class 3 studies
evaluated above.6-8,16 They calculated odds ratios, pooled the data, and reported an overall odds
ratio for favorable outcome of 2.1 (95% CI 1.4 to 3.1) for the PbrO2 group. Authors qualitatively
assessed the studies to determine if the data could be pooled, but they did not conduct a
quantitative test of homogeneity. As with the individual studies, the results of this review cannot
be used to support a recommendation.
Jugular Bulb Monitoring of Arteriovenous Oxygen Content Difference (AVDO2). All of the
four Class 3 studies that addressed AVDO2 monitoring were prospective.10-13 All were from
single centers. A total of 678 patients were observed, with sample sizes ranging from 32 to 353.
Outcomes included mortality and GOS at 3 and 6 months post-injury. All four studies reported
improved outcomes in patients who received AVDO2 monitoring and management of
desaturation episodes. Thus they support the Level III recommendation.
Cerebral Autoregulation Monitoring with TCD. One Class 3 study addressed use of
information from TCD monitoring to manage patients.14 It was a single center retrospective
study (N=300). The study provided information suggesting a strong relationship between the
acute state of autoregulation and outcomes measured by a dichotomized GOS at 6 months post-
injury. This single Class III study is insufficient to support a recommendation.
Microdialysis Monitoring of Extracellular Glutamate. One Class 3 study addressed use of
information from microdialysis monitoring to manage patients.15 It was a single center
prospective study (N=165). Patients whose glutamate levels tended to normalize within 120
hours of monitoring had lower mortality and better outcomes measured by the GOS at 6 months
post-injury. This single Class III study is insufficient to support a recommendation.
REFERENCES
1. Stocchetti N, Barbagallo M, Bellini G, Furlan A, Vezzani A, Nizzoli V. [Arterio-jugular difference of oxygen and intracranial pressure in comatose, head injured patients. II. Clinical correlations]. Minerva Anestesiol. 1991;57(6):319-326. PMID: 1754072.

161
2. Rosenthal G, Hemphill JC, Sorani M, et al. The role of lung function in brain tissue oxygenation following traumatic brain injury. J Neurosurg. Jan 2008;108(1):59-65. PMID: 18173311.
3. Martini RP, Deem S, Yanez ND, et al. Management guided by brain tissue oxygen monitoring and outcome following severe traumatic brain injury. J Neurosurg. Oct 2009;111(4):644-649. PMID: 19392603.
4. Green JA, Pellegrini DC, Vanderkolk WE, Figueroa BE, Eriksson EA. Goal directed brain tissue oxygen monitoring versus conventional management in traumatic brain injury: an analysis of in hospital recovery. Neurocrit Care. 2013;18(1):20-25. PMID: 23138547
5. Lee HC, Chuang HC, Cho DY, Cheng KF, Lin PH, Chen CC. Applying cerebral hypothermia and brain oxygen monitoring in treating severe traumatic brain injury. World Neurosurg. 2010;74(6):654-660. PMID: 21492636.
6. McCarthy MC, Moncrief H, Sands JM, et al. Neurologic outcomes with cerebral oxygen monitoring in traumatic brain injury. Surgery. Oct 2009;146(4):585-590; discussion 590-581. PMID: 19789016.
7. Narotam PK, Morrison JF, Nathoo N. Brain tissue oxygen monitoring in traumatic brain injury and major trauma: outcome analysis of a brain tissue oxygen-directed therapy. J Neurosurg. Oct 2009;111(4):672-682. PMID: 19463048.
8. Spiotta AM, Stiefel MF, Gracias VH, et al. Brain tissue oxygen-directed management and outcome in patients with severe traumatic brain injury. J Neurosurg. Sep 2010;113(3):571-580. PMID: 20415526.
9. Stiefel MF, Spiotta A, Gracias VH, et al. Reduced mortality rate in patients with severe traumatic brain injury treated with brain tissue oxygen monitoring. J Neurosurg. Nov 2005;103(5):805-811. PMID: 16304983.
10. Cruz J. The first decade of continuous monitoring of jugular bulb oxyhemoglobin saturation: management strategies and clinical outcome. Crit Care Med. Feb 1998;26(2):344-351. PMID: 9468174.
11. Le Roux PD, Newell DW, Lam AM, Grady MS, Winn HR. Cerebral arteriovenous oxygen difference: a predictor of cerebral infarction and outcome in patients with severe head injury. J Neurosurg. 1997;87(1):1-8. PMID: 9202258
12. Robertson C. Desaturation episodes after severe head injury: influence on outcome. Acta Neurochir Suppl (Wien). 1993;59:98-101. PMID: 8310869.
13. Robertson CS, Gopinath SP, Goodman JC, Contant CF, Valadka AB, Narayan RK. SjvO2 monitoring in head-injured patients. J Neurotrauma. Oct 1995;12(5):891-896. PMID: 8594216.
14. Budohoski KP, Reinhard M, Aries MJH, et al. Monitoring cerebral autoregulation after head injury. Which component of transcranial Doppler flow velocity is optimal? Neurocrit Care. Oct 2012;17(2):211-218. PMID: 21691895.
15. Chamoun R, Suki D, Gopinath SP, Goodman JC, Robertson C. Role of extracellular glutamate measured by cerebral microdialysis in severe traumatic brain injury. J Neurosurg. Sep 2010;113(3):564-570. PMID: 20113156.
16. Meixensberger J, Vath A, Jaeger M, Kunze E, Dings J, Roosen K. Monitoring of brain tissue oxygenation following severe subarachnoid hemorrhage. Neurol Res. Jul 2003;25(5):445-450. PMID: 12866190.
162
17. Nangunoori R, Maloney-Wilensky E, Stiefel M, et al. Brain tissue oxygen-based therapy and outcome after severe traumatic brain injury: a systematic literature review. Neurocrit Care. Aug 2012;17(1):131-138. PMID: 21845489.
163
Evidence Synthesis and Recommendations, Part III: Thresholds This section of the guidelines includes the evidence and recommendations related to
threshold values for parameters that are monitored during the in-hospital management of patients
with severe traumatic brain injury (TBI). Many physiologic functions may be monitored and
considered during the management of a critically injured patient. This section is limited to those
parameters that are specific to TBI, either because they are only measured in TBI or because the
value may be different in TBI patients than in other trauma patients. We also focus on measures
for which it is assumed or demonstrated that response to treatment improves outcomes.
In this 4th Edition we include thresholds for blood pressure (BP), intracranial pressure (ICP),
cerebral perfusion pressure monitoring (CPP), and advanced cerebral monitoring (ACM). The
threshold can be a value to avoid in order to decrease the probability of negative outcomes or a
value to aim for in order to increase the probability of positive outcomes, and it can be a value
that triggers a change in treatment.

164
15. Blood Pressure Thresholds
INTRODUCTION
The level of systolic blood pressure (SBP) has long been felt to play a critical role in the
secondary injury cascade after severe traumatic brain injury (TBI). As early as 1989, Klauber et
al. reported a mortality of 35% in patients admitted with a SBP <85 mm Hg, compared with only
6% in patients with a higher SBP.1 Additionally, hypotension has been shown to correlate with
diffuse brain swelling.2
There are several underlying pathophysiologic mechanisms. If autoregulation remains intact,
a drop in SBP triggers an autoregulatory vasodilation in an attempt to maintain adequate brain
perfusion. This results in increased cerebral blood volume, which in turn elevates intracranial
pressure. If autoregulation is not intact, there is dependency on SBP to prevent cerebral ischemia,
which has been ascribed to be the single most important secondary insult.3
The traditional definition of hypotension has been a SBP <90 mm Hg, and this was the target
recommended in the first iterations of these guidelines. As will be noted, the literature now
supports a higher level that may vary by age. The interrelationship between SBP, mean arterial
pressure (MAP), and cerebral perfusion pressure (CPP) should be kept in mind as one considers
threshold recommendations in these guidelines.
RECOMMENDATIONS
Level I and II
• There was insufficient evidence to support a Level I or II recommendation for this topic.
Level III
• Maintaining SBP at ≥100 mm Hg for patients 50 to 69 years old or at ≥110 mm Hg or
above for patients 15 to 49 or over 70 years old may be considered to decrease mortality
and improve outcomes.
Changes from Prior Edition
Recommendations from prior editions have been revised due to new evidence. The focus in
this topic has been narrowed to concerns specific and different for TBI patients. Monitoring
blood pressure and avoiding hypotension is considered general good trauma and ICU care and

165
are not included. Brain tissue oxygenation is included in the Advanced Cerebral Monitoring
section.
EVALUATION OF THE EVIDENCE
Quality of the Body of Evidence
This topic addresses the question about what level of SBP should be achieved and maintained
in severe TBI patients in order to improve outcomes. One large, retrospective, Class 2 study4 and
two Class 3 studies are included as evidence5,6 (Table 15-1).
The Class 2 study is being used to support a Level III recommendation because it is a single
study that provides indirect evidence; the study includes patients with both moderate and severe
TBI, and the outcomes are not reported separately by severity levels. The indirect evidence
combined with direct, low-quality evidence from the Class 3 studies support the Level III
recommendation.
Table 15-1. Quality of the Body of Evidence (Blood Pressure Thresholds)
Topic Number
of Studies Meta-
Analysis
Number
of Subjects
Class of Studies (1 or 2)
Consistency (High,
Moderate, Low)
Directness (Direct or Indirect)
Precision (High,
Moderate, Low)
Quality of Evidence
(High, Moderate,
Low, or Insufficient)
COMPONENTS OF OVERALL QUALITY – Class 2 Hypotension: Threshold4
1 Cohort 0 RCT
NA 15,733 (26.9% Severe TBI)
2 NA Indirect High Low
COMPONENTS OF OVERALL QUALITY – Class 3 Hypotension Threshold5,6
1 Cohort 1 Retro-spective
NA 6,861 3 Moderate Direct Moderate Low
Abbreviations: NA=not applicable, RCT=randomized controlled trial, TBI=traumatic brain injury.
Applicability
The indirect evidence is not as directly applicable as it would be if the study had included
only patients with severe TBI or if the results had been separated by severity. Due to study
design concerns, the applicability of the direct evidence from the Class 3 studies is difficult to
assess.

166
SUMMARY OF THE EVIDENCE
Process
Of eight new, potentially relevant studies reviewed, five were excluded because they did not
meet the inclusion criteria for this topic (see Appendix F). One was rated Class 2,4 and two were
rated as Class 3.5,6 These and 16 Class 3 studies from the 3rd Edition were included as evidence
for this topic.
Class 2 Study
The evidence from the Class 2 study of blood pressure thresholds is summarized in
Table 15-2.
Table 15-2. Summary of Evidence – Class 2 Study (Blood Pressure Thresholds) Reference
Study Topic Study Design, N, and
Outcomes Data Class
Results Conclusion
Berry, 2012*4 To determine if a higher hypotension threshold is needed for patients with moderate to severe TBI
Retrospective Cohort N=15,733 (26.9% GCS ≤8)
Mortality
Class 2 Optimal threshold of hypotension (to minimize probability of death). 110 mm Hg for patients 15 to 49 years of age (AOR 1.98, 95% CI 1.65 to 2.39), p<0.0001. 100 mm Hg for patients 50–69 years (AOR 2.20, 95% CI 1.46 to 3.31), p=0.0002. 110 mm Hg for patients70 years and older (AOR 1.92, 95% CI 1.35 to 2.74), p=0.0003.
The results suggest the threshold for hypotension in moderate to severe TBI patients should be systolic blood pressure less than 110 mm Hg.
Abbreviations: AOR=adjusted odds ratio, CI=confidence interval, GCS= Glasgow Coma Scale, N=total sample size, TBI=traumatic brain injury. *Reference new to the 4th Edition.
Berry et al., 2012 analyzed data on all adult trauma patients admitted to any one of 13 trauma
centers in Los Angeles County between January 1998 and December 2005.4 They predefined
three age categories (15 to 49, 50 to 69, and 70 or older), and for each age category estimated the
probability of death using multiple logistic regression for systolic blood pressure cut-offs from
60 to 150 mm Hg in increments of 10. They identified the optimal level for hypotension by
finding the level for which the model balanced the best statistical fit with the best discriminatory
power. They concluded that the current definition of hypotension as systolic blood pressure

167
below 90 mm Hg should be reconsidered based on their identification of 100 mm Hg and 110
mm Hg as the thresholds associated with lower mortality, although they state that more studies
are needed to confirm the optimal BP threshold for TBI patients of different ages.
Class 3 Studies
The evidence from the Class 3 studies of blood pressure thresholds is summarized in Table
15-3.
Table 15-3. Summary of Evidence – Class 3 Studies (Blood Pressure Thresholds) Reference
Study Topic Study Description Data Class Results
Conclusion New Studies
Brenner 2012*5 Correlated SBP thresholds with outcome
Prospective Cohort N=60 Single Level 1 Trauma Center in the United States In-hospital Mortality GOS-E at 12 months post-injury
Class 3 SBP <110 mm Hg and <120 mm Hg within the first 48 hours are thresholds to avoid to minimize mortality and improve outcomes 12 months post-injury.
Butcher 2007*6 Examined relationship of thresholds for SBP and MABP with outcome
Retrospective Cohort N=6,801 SBP N=6,647 MABP IMPACT Database of individual patient data from 3 observational studies and 8 RCTs GOS at 6 months post-injury
Class 3 SBP ranges from 120 mm Hg and 150 mm Hg, and MABP ranges from 85 mm Hg and 110 mm Hg are thresholds to target to improve outcomes.
Studies from 3rd Edition Chesnut 19937
A prospective study of 717 consecutive severe TBI patients admitted to four centers investigated the effect on outcome of hypotension (SBP <90 mm Hg) occurring from injury through resuscitation.
Class 3 Hypotension was a statistically independent predictor of outcome. A single episode of hypotension during this period doubled mortality and also increased morbidity. Patients whose hypotension was not corrected in the field had a worse outcome than those whose hypotension was corrected by time of ED arrival.
Fearnside 19938
A prospective study of prehospital and in-hospital predictors of outcome in 315 consecutive severe TBI patients admitted to a single trauma center.
Class 3 Hypotension (SBP <90 mm Hg) was an independent predictor of increased morbidity and mortality.
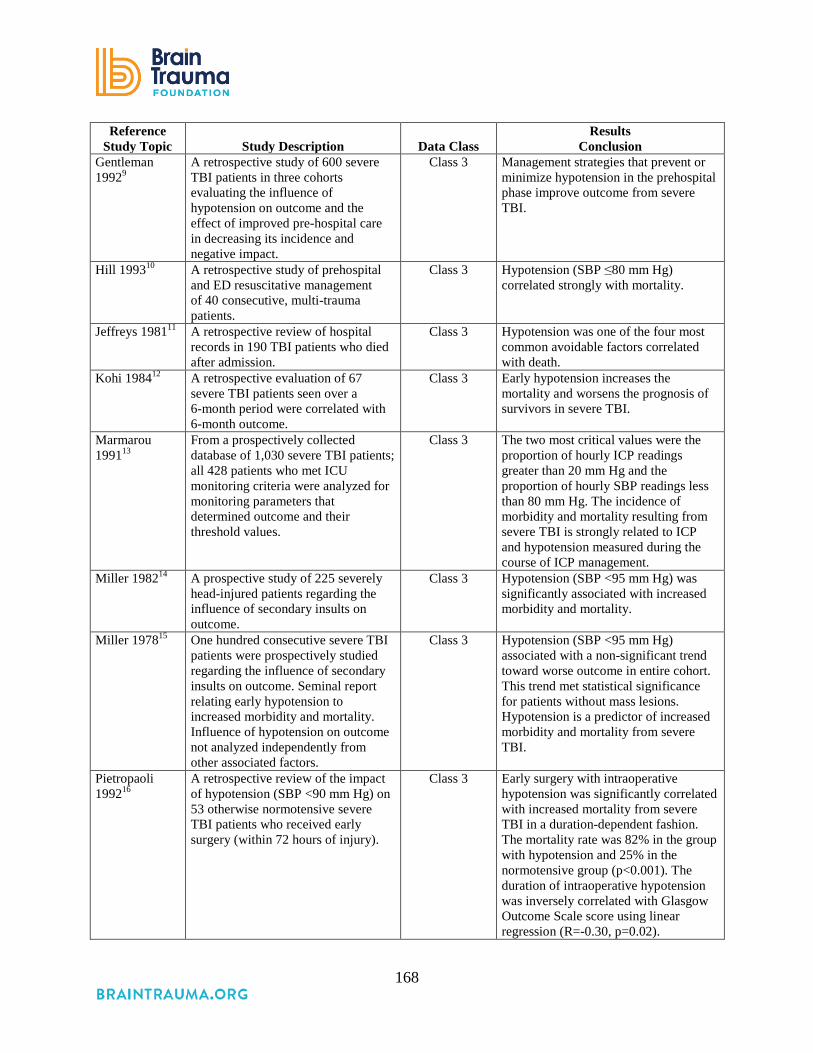
168
Reference Study Topic Study Description Data Class
Results Conclusion
Gentleman 19929
A retrospective study of 600 severe TBI patients in three cohorts evaluating the influence of hypotension on outcome and the effect of improved pre-hospital care in decreasing its incidence and negative impact.
Class 3 Management strategies that prevent or minimize hypotension in the prehospital phase improve outcome from severe TBI.
Hill 199310 A retrospective study of prehospital and ED resuscitative management of 40 consecutive, multi-trauma patients.
Class 3 Hypotension (SBP ≤80 mm Hg) correlated strongly with mortality.
Jeffreys 198111
A retrospective review of hospital records in 190 TBI patients who died after admission.
Class 3 Hypotension was one of the four most common avoidable factors correlated with death.
Kohi 198412 A retrospective evaluation of 67 severe TBI patients seen over a 6-month period were correlated with 6-month outcome.
Class 3 Early hypotension increases the mortality and worsens the prognosis of survivors in severe TBI.
Marmarou 199113
From a prospectively collected database of 1,030 severe TBI patients; all 428 patients who met ICU monitoring criteria were analyzed for monitoring parameters that determined outcome and their threshold values.
Class 3 The two most critical values were the proportion of hourly ICP readings greater than 20 mm Hg and the proportion of hourly SBP readings less than 80 mm Hg. The incidence of morbidity and mortality resulting from severe TBI is strongly related to ICP and hypotension measured during the course of ICP management.
Miller 198214
A prospective study of 225 severely head-injured patients regarding the influence of secondary insults on outcome.
Class 3 Hypotension (SBP <95 mm Hg) was significantly associated with increased morbidity and mortality.
Miller 197815 One hundred consecutive severe TBI patients were prospectively studied regarding the influence of secondary insults on outcome. Seminal report relating early hypotension to increased morbidity and mortality. Influence of hypotension on outcome not analyzed independently from other associated factors.
Class 3 Hypotension (SBP <95 mm Hg) associated with a non-significant trend toward worse outcome in entire cohort. This trend met statistical significance for patients without mass lesions. Hypotension is a predictor of increased morbidity and mortality from severe TBI.
Pietropaoli 199216
A retrospective review of the impact of hypotension (SBP <90 mm Hg) on 53 otherwise normotensive severe TBI patients who received early surgery (within 72 hours of injury).
Class 3 Early surgery with intraoperative hypotension was significantly correlated with increased mortality from severe TBI in a duration-dependent fashion. The mortality rate was 82% in the group with hypotension and 25% in the normotensive group (p<0.001). The duration of intraoperative hypotension was inversely correlated with Glasgow Outcome Scale score using linear regression (R=-0.30, p=0.02).

169
Reference Study Topic Study Description Data Class
Results Conclusion
Rose 197717
A retrospective review of hospital and necropsy records of 116 TBI patients who were known to have talked before dying.
Class 3 Hypotension is a major avoidable cause of increased mortality in patients with moderate TBI.
Seelig 198618 A study of all patients (n=160) with an ICP of 30 mm Hg during the first 72 hours after injury from a prospectively collected database of severe TBI patients (n=348).
Class 3 Early hypotension was significantly correlated with increased incidence and severity of intracranial hypertension and increased mortality.
Stocchetti 199619
A cohort study of 50 trauma patients transported from the scene by helicopter, which evaluated the incidence and effect of hypoxemia and hypotension on outcome.
Class 3 Fifty-five percent of patients were hypoxic (SaO2 <90%) and 24% were hypotensive. Both hypoxemia and hypotension negatively affected outcome, however, the degree to which each independently affected the outcome was not studied.
Jones 199420 Prospective analysis of 124 patients ≥14 years old admitted to single center with a GCS ≤12, or >12 and Injury Severity Score ≥16, with clinical indications for monitoring. Subgroup analysis performed on 71 patients for whom data existed for 8 potential secondary insults (ICP, hypotension, hypertension, CPP, hypoxemia, pyrexia, bradycardia, tachycardia) to identify predictors of morbidity/ mortality.
Class 3 Mortality is best predicted by durations of hypotensive (p=0.0064), hypoxemic (p=0.0244), and pyrexic (p=0.0137) insults. Morbidity (“Good” vs. “Bad” outcome) was predicted by hypotensive insults (p=0.0118), and papillary response on admission (p=0.0226).
Manley 200121 Prospective cohort of 107 patients with GCS <13 admitted to a single center; primarily evaluating impact of hypoxic and hypotensive episodes during initial resuscitation on mortality. Impact of multiple episodes of hypoxia or hypotension analyzed.
Class 3 Early in-hospital hypotension but not hypoxia is associated with increased mortality. Odds ratio for mortality increases from 2.1 to 8.1 with repeated episodes of hypotension.
Struchen 200122
Cohort of 184 patients with severe TBI admitted to a single level I trauma center neurosurgical ICU who received continuous monitoring of ICP, MAP, CPP, and SjO2. Primary outcomes were GOS and DRS. Analysis included multiple regression model evaluating effect of physiologic variables on outcome.
Class 3 Adjusting for age and emergency room GCS, ICP >25 mm Hg, MAP <80 mm Hg, CPP <60 mm Hg, and SjO2 <50% were associated with worse outcomes.
Abbreviations: CPP=cerebral perfusion pressure, DRS=disability rating scale, ED=emergency department, GCS=Glasgow Coma Scale, GOS=Glasgow Outcome Scale, GOS-E=Extended Glasgow Outcome Scale, ICP=intracranial pressure, ICU=intensive care unit, SBP=systolic blood pressure, SjO2= jugular venous oxygen saturation, TBI=traumatic brain injury. *Reference new to the 4th Edition.

170
Two new Class 3 studies were included as evidence for this topic. One (N=60) was a
prospective study conducted in a single Level 1 trauma center in the United States.5 The other
(N=6,801) was a retrospective analysis of individual patient data collected from three
observational studies and eight RCTs (the IMPACT database).6 Findings from both of these
studies suggested that the previously-defined SBP level for hypotension of below 90 mm Hg
should be re-examined, and that maintenance of higher levels might result in better outcomes.
The Class 3 studies from the 3rd Edition of these guidelines are listed in Table 15-3.
REFERENCES
1. Klauber MR, Marshall LF, Luerssen TG, Frankowski R, Tabaddor K, Eisenberg HM. Determinants of head injury mortality: importance of the low risk patient. Neurosurg. Jan 1989;24(1):31-36. PMID: 2927596.
2. Eisenberg HM, Gary HE, Jr., Aldrich EF, et al. Initial CT findings in 753 patients with severe head injury. A report from the NIH Traumatic Coma Data Bank. J Neurosurg. Nov 1990;73(5):688-698. PMID: 2213158.
3. Bouma GJ, Muizelaar JP, Choi SC, Newlon PG, Young HF. Cerebral circulation and metabolism after severe traumatic brain injury: the elusive role of ischemia. J Neurosurg. Nov 1991;75(5):685-693. PMID: 1919689.
4. Berry C, Ley EJ, Bukur M, et al. Redefining hypotension in traumatic brain injury. Injury. Nov 2012;43(11):1833-1837. PMID: 21939970.
5. Brenner M, Stein DM, Hu PF, Aarabi B, Sheth K, Scalea TM. Traditional systolic blood pressure targets underestimate hypotension-induced secondary brain injury. J Trauma Acute Care Surg. May 2012;72(5):1135-1139. PMID: 22673237.
6. Butcher I, Murray GD, McHugh GS, et al. Multivariable prognostic analysis in traumatic brain injury: results from the IMPACT study. J Neurotrauma. Feb 2007;24(2):329-337. PMID: 17375997.
7. Chesnut RM, Marshall LF, Klauber MR, et al. The role of secondary brain injury in determining outcome from severe head injury. J Trauma. Feb 1993;34(2):216-222. PMID: 8459458.
8. Fearnside MR, Cook RJ, McDougall P, McNeil RJ. The Westmead Head Injury Project outcome in severe head injury. A comparative analysis of pre-hospital, clinical and CT variables. Br J Neurosurg. 1993;7(3):267-279. PMID: 8338647.
9. Gentleman D. Causes and effects of systemic complications among severely head injured patients transferred to a neurosurgical unit. Int Surg. Oct-Dec 1992;77(4):297-302. PMID: 1478813.
10. Hill DA, Abraham KJ, West RH. Factors affecting outcome in the resuscitation of severely injured patients. Aust N Z J Surg. Aug 1993;63(8):604-609. PMID: 8338478.
11. Jeffreys RV, Jones JJ. Avoidable factors contributing to the death of head injury patients in general hospitals in Mersey Region. Lancet. Aug 1981;2(8244):459-461. PMID: 6115211.

171
12. Kohi YM, Mendelow AD, Teasdale GM, Allardice GM. Extracranial insults and outcome in patients with acute head injury--relationship to the Glasgow Coma Scale. Injury. Jul 1984;16(1):25-29. PMID: 6469315.
13. Marmarou A, Anderson RL, Ward JD, et al. Impact of ICP instability and hypotension on outcome in patients with severe head trauma J Neurosurgery Nov 1991;75:S59-S66.
14. Miller JD, Becker DP. Secondary insults to the injured brain. J R Coll Surg Edinb. Sep 1982;27(5):292-298. PMID: 7143298.
15. Miller JD, Sweet RC, Narayan R, Becker DP. Early insults to the injured brain. J Am Med Assoc. Aug 1978;240(5):439-442. PMID: 660888.
16. Pietropaoli JA, Rogers FB, Shackford SR, Wald SL, Schmoker JD, Zhuang J. The deleterious effects of intraoperative hypotension on outcome in patients with severe head injuries. J Trauma. Sep 1992;33(3):403-407. PMID: 1404509.
17. Rose J, Valtonen S, Jennett B. Avoidable factors contributing to death after head injury. BMJ. Sep 1977;2(6087):615-618. PMID: 409450.
18. Seelig J, Klauber M, Toole B, Bowers-Marshall S. Increased ICP and systemic hypotension during the first 72 hours following severe head injury In: Miller J, Teasdale G, Rowan J, Galbraith S, Mendelow A, eds. Intracranial Pressure VI 1986: pages 675-679.
19. Stochetti N FA, Volta F. . Hypoxemia and arterial hypotension at the accident scene in head injury J Trauma 1996;40(5):764-767. PMID: 8614077.
20. Jones PA, Andrews PJ, Midgley S, et al. Measuring the burden of secondary insults in head-injured patients during intensive care. J Neurosurg Anesthesiol. Jan 1994;6(1):4-14. PMID: 8298263.
21. Manley G, Knudson MM, Morabito D, Damron S, Erickson V, Pitts L. Hypotension, hypoxia, and head injury: frequency, duration, and consequences. Arch Surg. 2001;136(10):1118-1123. PMID: 11585502.
22. Struchen MA, Hannay HJ, Contant CF, Robertson CS. The relation between acute physiological variables and outcome on the Glasgow Outcome Scale and Disability Rating Scale following severe traumatic brain injury. J Neurotrauma 2001;18(2):115-125. PMID: 11229706.

172
16. Intracranial Pressure Thresholds
INTRODUCTION
Intracranial pressure (ICP) is the pressure inside the cranial vault and is affected by
intracranial contents, primarily brain, blood, and cerebrospinal fluid. The intracranial volume is
constant.1 Since the intracranial vault is a fixed space, ICP increases with an increase in brain
volume and cerebral blood volume, increased cerebrospinal fluid production, and or decreased
cerebrospinal fluid clearance.1-3 Mass lesions such as tumors, hemorrhagic lesions, cerebral
edema, or obstruction of venous and or CSF return can increase ICP. The Monro-Kellie
hypothesis states that under normal conditions, the intracranial compartment space, cerebral
blood volume, and volume inside the cranium are fixed volumes.4 If any of these component
volumes increase, then compensation must occur to maintain ICP within normal range.
Typically, these compensatory measures include displacement of CSF and venous blood
downward into the spinal spaces and decrease in blood volume. These compensatory measures
allow for ICP to be maintained within the normal range of 0-10 mm Hg.4,5
As mass lesions occupy more volume, intracranial compliance (change in cerebral
volume/intracranial pressure) decreases, and elastance (change in cerebral pressure/cerebral
volume) increases.5 A critical threshold is reached when space-occupying lesions can no longer
expand without neuronal injury, herniation, and brain death. It is important to remember that the
idea of ICP, while important in itself, must also be considered in the context of its inverse
relationship with cerebral perfusion pressure, which is discussed elsewhere.
RECOMMENDATIONS*
Level I and II A
• There was insufficient evidence to support a Level I or II A recommendation for this
topic.
Level II B
• Treating ICP above 22 mm Hg is recommended because values above this level are
associated with increased mortality.

173
Level III
• A combination of ICP values and clinical and brain CT findings may be used to make
management decisions.
*The committee is aware that the results of the RESCUEicp trial6 may be released soon after
the publication of these Guidelines. The results of this trial may affect these
recommendations and may need to be considered by treating physicians and other users
of these Guidelines. We intend to update these recommendations after the results are
published if needed. Updates will be available at https://braintrauma.org/coma/.
Changes from Prior Edition
A new Class 2 study provides evidence for the current recommendation, which replaces the
Level II recommendation of the 3rd Edition of these guidelines. The study that supported the 3rd
Edition recommendation7 was found to be Class 3 in relation to the ICP Monitoring topic. (It
remains Class 2 in relation to barbiturates. See Part II. Monitoring for details.)
EVALUATION OF THE EVIDENCE
Quality of the Body of Evidence
The studies identified for this topic (Table 16-1) address two questions: (1) what are the ICP
thresholds to target or avoid? and (2) what key factors need to be considered in addition to ICP
when making management decisions? For the first question, one Class 2 study (Table 16-2) with
a comparatively large sample size (N=459) provides an overall low quality of the body of
evidence about the target values for ICP when treating patients with severe TBI.8 The concern is
that, except in extraordinary cases (e.g., a large multi-site randomized trial with definitive
results), the finding of a single study may be reversed by subsequent research.
Two new studies,9, 10 and nine from the 3rd Edition of these guidelines,7,11-18 provide Class 3
evidence about target values for ICP. Of these, three11,12,14 address the second question on which
key factors need to be considered in addition to ICP when making management decisions. The
included studies provide a low-quality body of evidence for the Level III recommendation.
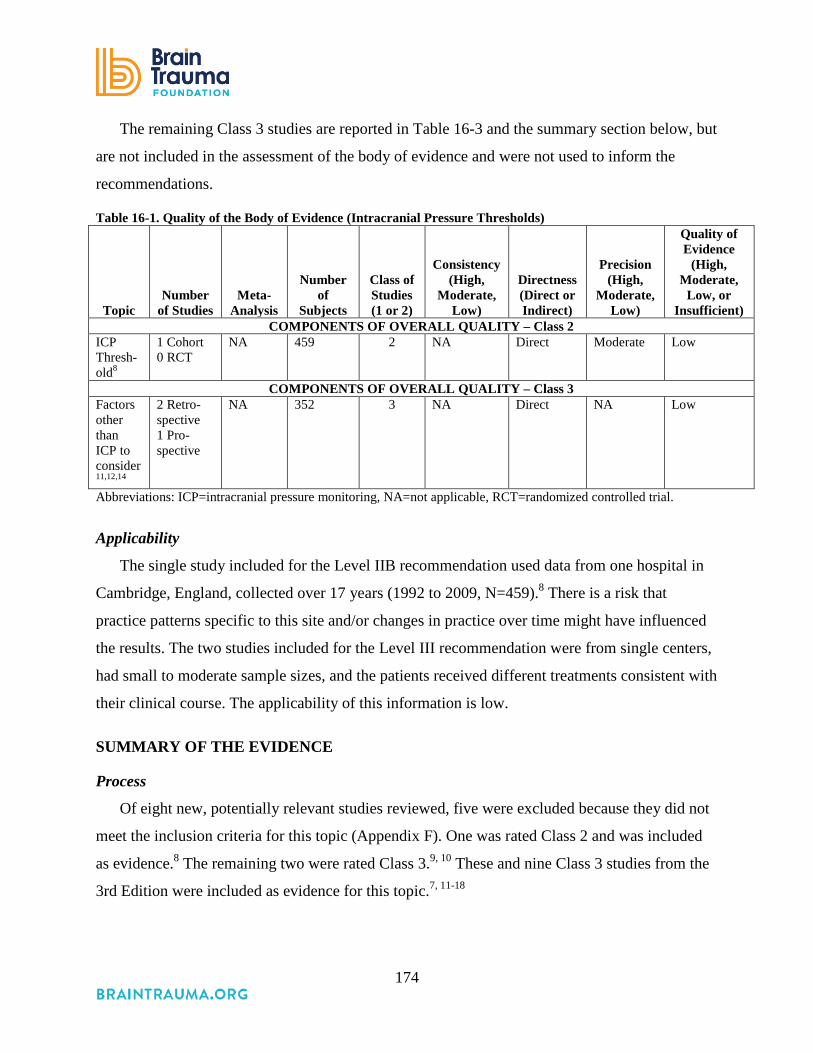
174
The remaining Class 3 studies are reported in Table 16-3 and the summary section below, but
are not included in the assessment of the body of evidence and were not used to inform the
recommendations.
Table 16-1. Quality of the Body of Evidence (Intracranial Pressure Thresholds)
Topic Number
of Studies Meta-
Analysis
Number
of Subjects
Class of Studies (1 or 2)
Consistency (High,
Moderate, Low)
Directness (Direct or Indirect)
Precision (High,
Moderate, Low)
Quality of Evidence
(High, Moderate,
Low, or Insufficient)
COMPONENTS OF OVERALL QUALITY – Class 2 ICP Thresh-old8
1 Cohort 0 RCT
NA 459 2 NA Direct Moderate Low
COMPONENTS OF OVERALL QUALITY – Class 3 Factors other than ICP to consider11,12,14
2 Retro-spective 1 Pro-spective
NA 352 3 NA Direct NA Low
Abbreviations: ICP=intracranial pressure monitoring, NA=not applicable, RCT=randomized controlled trial.
Applicability
The single study included for the Level IIB recommendation used data from one hospital in
Cambridge, England, collected over 17 years (1992 to 2009, N=459).8 There is a risk that
practice patterns specific to this site and/or changes in practice over time might have influenced
the results. The two studies included for the Level III recommendation were from single centers,
had small to moderate sample sizes, and the patients received different treatments consistent with
their clinical course. The applicability of this information is low.
SUMMARY OF THE EVIDENCE
Process
Of eight new, potentially relevant studies reviewed, five were excluded because they did not
meet the inclusion criteria for this topic (Appendix F). One was rated Class 2 and was included
as evidence.8 The remaining two were rated Class 3.9, 10 These and nine Class 3 studies from the
3rd Edition were included as evidence for this topic.7, 11-18
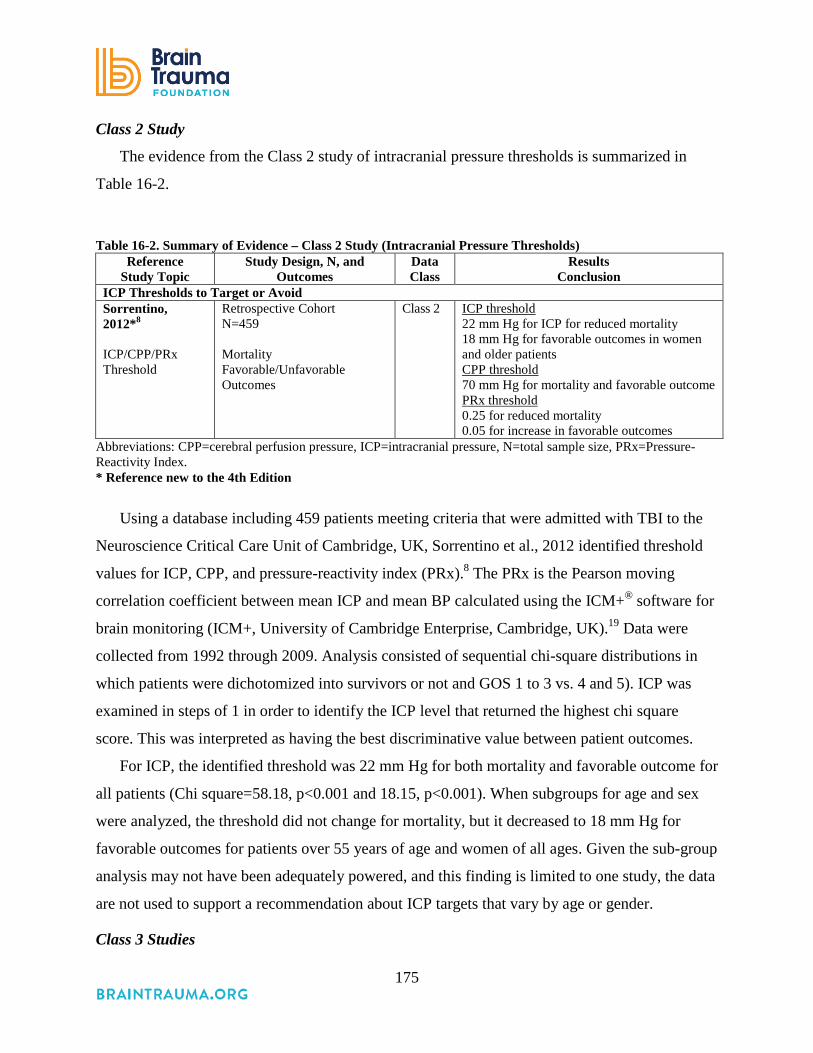
175
Class 2 Study
The evidence from the Class 2 study of intracranial pressure thresholds is summarized in
Table 16-2.
Table 16-2. Summary of Evidence – Class 2 Study (Intracranial Pressure Thresholds) Reference
Study Topic Study Design, N, and
Outcomes Data Class
Results Conclusion
ICP Thresholds to Target or Avoid Sorrentino, 2012*8 ICP/CPP/PRx Threshold
Retrospective Cohort N=459 Mortality Favorable/Unfavorable Outcomes
Class 2 ICP threshold 22 mm Hg for ICP for reduced mortality 18 mm Hg for favorable outcomes in women and older patients CPP threshold 70 mm Hg for mortality and favorable outcome PRx threshold 0.25 for reduced mortality 0.05 for increase in favorable outcomes
Abbreviations: CPP=cerebral perfusion pressure, ICP=intracranial pressure, N=total sample size, PRx=Pressure-Reactivity Index. * Reference new to the 4th Edition
Using a database including 459 patients meeting criteria that were admitted with TBI to the
Neuroscience Critical Care Unit of Cambridge, UK, Sorrentino et al., 2012 identified threshold
values for ICP, CPP, and pressure-reactivity index (PRx).8 The PRx is the Pearson moving
correlation coefficient between mean ICP and mean BP calculated using the ICM+® software for
brain monitoring (ICM+, University of Cambridge Enterprise, Cambridge, UK).19 Data were
collected from 1992 through 2009. Analysis consisted of sequential chi-square distributions in
which patients were dichotomized into survivors or not and GOS 1 to 3 vs. 4 and 5). ICP was
examined in steps of 1 in order to identify the ICP level that returned the highest chi square
score. This was interpreted as having the best discriminative value between patient outcomes.
For ICP, the identified threshold was 22 mm Hg for both mortality and favorable outcome for
all patients (Chi square=58.18, p<0.001 and 18.15, p<0.001). When subgroups for age and sex
were analyzed, the threshold did not change for mortality, but it decreased to 18 mm Hg for
favorable outcomes for patients over 55 years of age and women of all ages. Given the sub-group
analysis may not have been adequately powered, and this finding is limited to one study, the data
are not used to support a recommendation about ICP targets that vary by age or gender.
Class 3 Studies

176
The evidence from the Class 3 studies of intracranial pressure thresholds is summarized in
Table 16-3.
Table 16-3. Summary of Evidence – Class 3 Studies (Intracranial Pressure Thresholds) Reference
Study Topic Study Design, N, and Outcomes Data Class Results
Conclusion New Studies
Kostic 2011*9 Compared ICP vs. no ICP for mortality
RCT N=61 ICP monitored=32 (52.5%) Single Center in Serbia.
Class 3 No significant difference in the survival rate between the two groups (χ2=2.11; p=0.15; p>0.05). Average ICP was 27 mm Hg for patients who died and 18 mm Hg for patients who survived.
Kuo 2006*10 Determine thresholds of ICP and CPP during surgery that were predictive of outcomes.
Prospective Observational N=30 Single Center in Taiwan. GOS at 3 months post-injury
Class 3 Initial ICP for unfavorable outcomes was 47.4 ± 21.4 mm Hg, resulting in a CPP of 22.8 ± 12.83 mm Hg. Initial ICP for favorable outcomes was 26.4 ± 10.1 mm Hg, resulting in a CPP of 48.8 ± 13.4 mm Hg. CPP had the largest area under the ROC curve in all stages of the operation, corresponding to intraoperative CPP thresholds of 37 mm Hg (initial), 51.8 mm Hg (intraoperative) and 52 mm Hg (after scalp closure).
Studies from 3rd Edition Andrews 198811 Determine the effect of hematoma location on outcome.
Retrospective review of the clinical course and CT scans of 45 patients with supratentorial intracerebral hematomas to determine the effect of hematoma location on clinical course and outcome.
Class 3 Signs of herniation were significantly more common with temporal or temporoparietal lesions. Clot size of 30 cc was the threshold value for increased incidence of herniation. Factors other than ICP (such as location of mass lesion) must be considered in guiding treatment.
Chambers 200112 Assess the effect of CT classification on the utility of ICP thresholds
Prospective series of 207 adult patients with ICP and CPP monitoring were analyzed using ROC curves to determine if there were significant thresholds for the determination of outcome.
Class 3 The sensitivity for ICP rose for values >10 mm Hg, but it was only 61% at 30 mm Hg. ICP cut off value for all patients was 35 mm Hg, but ranged from 22 to 36 for different CT classifications. It may be inappropriate to set a single target ICP, as higher values may be tolerated in certain CT classifications.
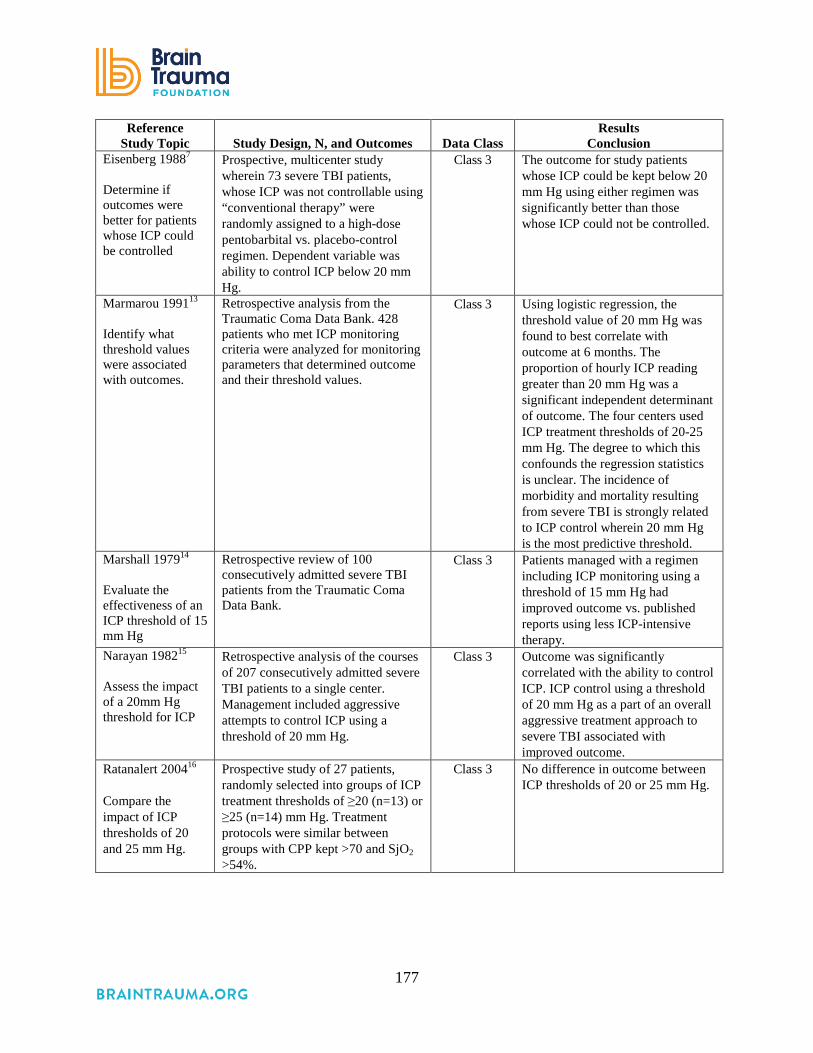
177
Reference Study Topic Study Design, N, and Outcomes Data Class
Results Conclusion
Eisenberg 19887 Determine if outcomes were better for patients whose ICP could be controlled
Prospective, multicenter study wherein 73 severe TBI patients, whose ICP was not controllable using “conventional therapy” were randomly assigned to a high-dose pentobarbital vs. placebo-control regimen. Dependent variable was ability to control ICP below 20 mm Hg.
Class 3 The outcome for study patients whose ICP could be kept below 20 mm Hg using either regimen was significantly better than those whose ICP could not be controlled.
Marmarou 199113 Identify what threshold values were associated with outcomes.
Retrospective analysis from the Traumatic Coma Data Bank. 428 patients who met ICP monitoring criteria were analyzed for monitoring parameters that determined outcome and their threshold values.
Class 3 Using logistic regression, the threshold value of 20 mm Hg was found to best correlate with outcome at 6 months. The proportion of hourly ICP reading greater than 20 mm Hg was a significant independent determinant of outcome. The four centers used ICP treatment thresholds of 20-25 mm Hg. The degree to which this confounds the regression statistics is unclear. The incidence of morbidity and mortality resulting from severe TBI is strongly related to ICP control wherein 20 mm Hg is the most predictive threshold.
Marshall 197914 Evaluate the effectiveness of an ICP threshold of 15 mm Hg
Retrospective review of 100 consecutively admitted severe TBI patients from the Traumatic Coma Data Bank.
Class 3 Patients managed with a regimen including ICP monitoring using a threshold of 15 mm Hg had improved outcome vs. published reports using less ICP-intensive therapy.
Narayan 198215 Assess the impact of a 20mm Hg threshold for ICP
Retrospective analysis of the courses of 207 consecutively admitted severe TBI patients to a single center. Management included aggressive attempts to control ICP using a threshold of 20 mm Hg.
Class 3 Outcome was significantly correlated with the ability to control ICP. ICP control using a threshold of 20 mm Hg as a part of an overall aggressive treatment approach to severe TBI associated with improved outcome.
Ratanalert 200416 Compare the impact of ICP thresholds of 20 and 25 mm Hg.
Prospective study of 27 patients, randomly selected into groups of ICP treatment thresholds of ≥20 (n=13) or ≥25 (n=14) mm Hg. Treatment protocols were similar between groups with CPP kept >70 and SjO2 >54%.
Class 3
No difference in outcome between ICP thresholds of 20 or 25 mm Hg.

178
Reference Study Topic Study Design, N, and Outcomes Data Class
Results Conclusion
Saul 198217 Compare mortality for patients treated using or not using a strict protocol
A single center series of 127 severe TBI patients whose ICP treatment was initiated at 20-25 mm Hg, not using a strict treatment protocol, was compared with a subsequent group of 106 patients with similar injury characteristics who received treatment under a strict protocol at an ICP threshold of 15 mm Hg.
Class 3 The 46% mortality in the first group was significantly greater than the 28% mortality in the second group. Suggests an increase in mortality if ICP maintained above a threshold between 15 and 25 mm Hg.
Schreiber 200218 Identify the ICP level that is associated with higher mortality
233 patients with ICP monitoring were analyzed from a prospectively collected database of 368 patients from a single center. Potentially predictive parameters were analyzed to determine their impact on survival.
Class 3 An opening ICP of >15 mm Hg was identified as one of five risk factors associated with higher mortality.
Abbreviations: CPP=cerebral perfusion pressure, CT=computed tomography, ICP=intracranial pressure, N=total sample size, PRx=pressure-reactivity index, SjO2= jugular venous oxygen saturation. * References new to the 4th Edition
Class 3 studies also provided evidence on ICP thresholds to target or avoid. Of the two Class
3 studies included since the 3rd Edition of these guidelines, one was an RCT in which patients
were randomized to ICP monitoring or no ICP monitoring (N=61).9 Authors reported average
ICP for survivors and non-survivors to be 18 mm Hg and 27 mm Hg, respectively. Due to
inadequate randomization and allocation concealment and lack of blinding, this RCT was rated
Class 3. The second study reported initial ICP thresholds during surgery predictive of favorable
outcomes versus unfavorable outcomes (GOS at 3 months post-injury were 26.4 ± 10.1 mm Hg
and 47.4 ± 21.4 mm Hg, respectively; N=30).10
Of the nine Class 3 studies maintained from the 3rd Edition, four were retrospective,11,13-15
four were prospective,7,12,16,18 and one was a prospective before/after study.17 A total of 1,447
patients were observed. Seven provided information about the association between ICP
thresholds and outcomes but were not used to support a recommendation due to the availability
of higher quality information.
Three Class 3 studies that provide information about the utility of information from CT scans
to augment decisions about target ICP threshold in some patients are used to support the Level
III recommendation in these guidelines.11,12,14 Patients can herniate at intracranial pressures less
than 20-25 mm Hg. The likelihood of herniation depends on the location of an intracranial mass
lesion. In the report by Marshall et al., 1979 pupillary abnormalities occurred with ICP values as

179
low as 18 mm Hg.14 Therefore, at all points, any chosen threshold must be closely and repeatedly
corroborated with the clinical exam and CT imaging in an individual patient.
REFERENCES
1. Mokri B. The Monro-Kellie hypothesis: applications in CSF volume depletion. Neurology. Jun 26 2001;56(12):1746-1748. PMID: 11425944.
2. Steiner LA, Andrews PJ. Monitoring the injured brain: ICP and CBF. Br J Anaesth. Jul 2006;97(1):26-38. PMID: 16698860.
3. Ghajar J. Traumatic brain injury. Lancet. Sep 2000;356(9233):923-929. PMID: 11036909.
4. Monro A. Observations on the Structure and Function of the Nervous System 1783. 5. Kellie G. Appearances observed in the dissection of two individuals; death from cold and
congestion of the brain. Trans Med Chir Sci Edinb 1824;1:84-169. 6. Hutchinson P. Randomised Evaluation of Surgery with Craniectomy for Uncontrollable
Elevation of intracranial pressure (RESCUEicp). ISRCTN66202560. DOI 10.1186/ISRCTN66202560. ISRCTN Registry 2005; http://www.isrctn.com/ISRCTN66202560.
7. Eisenberg HM, Frankowski RF, Contant CF, Marshall LF, Walker MD. High-dose barbiturate control of elevated intracranial pressure in patients with severe head injury. J Neurosurg. Jul 1988;69(1):15-23. PMID: 3288723.
8. Sorrentino E, Diedler J, Kasprowicz M, et al. Critical thresholds for cerebrovascular reactivity after traumatic brain injury. Neurocrit Care. 2012;16(2):258-266. PMID: 21964774
9. Kostic A, Stefanovic I, Novak V, Veselinovic D, Ivanov G, Veselinovic A. Prognostic significance of intracranial pressure monitoring and intracranial hypertension in severe brain trauma patients. Med Pregl. 2011;64(9-10):461-465. PMID: 22097111.
10. Kuo JR, Yeh TC, Sung KC, Wang CC, Chen CW, Chio CC. Intraoperative applications of intracranial pressure monitoring in patients with severe head injury. J Clin Neurosci. Feb 2006;13(2):218-223. PMID: 16459087.
11. Andrews BT, Chiles BW, 3rd, Olsen WL, Pitts LH. The effect of intracerebral hematoma location on the risk of brain-stem compression and on clinical outcome. J Neurosurg. Oct 1988;69(4):518-522. PMID: 3418383.
12. Chambers IR, Treadwell L, Mendelow AD. Determination of threshold levels of cerebral perfusion pressure and intracranial pressure in severe head injury by using receiver-operating characteristic curves: an observational study in 291 patients. J Neurosurg. Mar 2001;94(3):412-416. PMID: 11235944.
13. Marmarou A, Anderson RL, Ward JD, et al. Impact of ICP instability and hypotension on outcome in patients with severe head trauma J Neurosurgery Nov 1991;75:S59-S66.
14. Marshall LF, Smith RW, Shapiro HM. The outcome with aggressive treatment in severe head injuries. Part II: acute and chronic barbiturate administration in the management of head injury. J Neurosurg. Jan 1979;50(1):26-30. PMID: 758375.

180
15. Narayan RK, Kishore PR, Becker DP, et al. Intracranial pressure: to monitor or not to monitor? A review of our experience with severe head injury. J Neurosurg. May 1982;56(5):650-659. PMID: 7069477.
16. Ratanalert S, Phuenpathom N, Saeheng S, Oearsakul T, Sripairojkul B, Hirunpat S. ICP threshold in CPP management of severe head injury patients. Surg Neurol. May 2004;61(5):429-434; discussion 434-425. PMID: 15120212.
17. Saul TG, TB. D. Effects of intracranial pressure monitoring and aggressive treatment on mortality in servere head injury J Neurosurg. Apr 1982;56(4):498-503.
18. Schreiber MA, Aoki N, Scott BG, Beck JR. Determinants of mortality in patients with severe blunt head injury Arch Surg. 2002;137(3):285-290. PMID: 11888450
19. University of Cambridge Neurosurgery Unit (Department of Clinical Neurosciences). About ICM+. http://www.neurosurg.cam.ac.uk/pages/ICM/about.php. Accessed January 7, 2015.

181
17. Cerebral Perfusion Pressure Thresholds
INTRODUCTION
Cerebral perfusion pressure (CPP) is the difference between the mean arterial blood pressure
and intracranial pressure (ICP). CPP can only be calculated when the ICP is known, and this
should be factored into the decision about whether to place an ICP monitor. CPP has long been
considered a valuable measure in attempting to optimize the care of the traumatically brain
injured, as it is, at least to some degree, a surrogate measure for the delivery of nutrients to the
brain. Moreover, it is believed that CPP is the blood pressure metric to which brain
autoregulatory mechanisms respond.1 To this point, some literature has suggested that ICP
elevation can be tolerated as long as acceptable CPP values are maintained.
Views on the optimal CPP have evolved over the years. Rosner1 argued for very high CPP
values, the rationale being that it would help to restore the injured brain’s autoregulatory
capacity.1 However, Robertson et al. found that CPP values higher than 70 mm Hg were
associated with elevated risk for respiratory complications and poorer outcome.2 Recent years
have seen increased attention to patients’ pressure autoregulatory status with the view that
patients with intact autoregulation are best served by higher CPP values while pressure-passive
patients with dysfunctional pressure autoregulation do better with lower CPP values. It has also
been suggested that an optimal CPP value may need to be tailored to individual patients, and that
achieving this level throughout the course of a patient’s care could be associated with better
outcomes,3 although further confirmatory research is needed.
RECOMMENDATIONS
Level I and II A
• There was insufficient evidence to support a Level I or II A recommendation for this
topic.
Level II B
• The recommended target cerebral perfusion pressure (CPP) value for survival and
favorable outcomes is between 60 and 70 mm Hg. Whether 60 or 70 mm Hg is the

182
minimum optimal CPP threshold is unclear and may depend upon the patient’s
autoregulatory status.
Level III
• Avoiding aggressive attempts to maintain CPP above 70 mm Hg with fluids and pressors
may be considered because of the risk of adult respiratory failure.
Changes from Prior Edition
In the 3rd Edition of these guidelines, CPP monitoring and thresholds were combined into
one section. In this edition, they are reported separately with new evidence added. Of the 11
publications included in the section about CPP in the 3rd Edition, four provided information
about monitoring and are addressed in that topic, and one was eliminated because it is not
comparative and thus does not meet the criteria for this review. Seven are summarized in this
topic (one was used for both CPP topics). Seven new Class 3 studies were also included. Two
new Class 2 studies were added to the body of evidence for the 4th Edition, and the
recommendations were revised to incorporate the results of these studies. One study rated Class
2 in the 3rd Edition2 was reevaluated and rated Class 3.
EVALUATION OF THE EVIDENCE
Quality of the Body of Evidence
The body of evidence consisted of two Class 2 cohort studies, one Class 3 RCT, and 13 Class
3 cohort studies (Table 17-1). The major weakness in the body of evidence was the lack of
consistency in what the studies tested, as well as in the results. The smaller, older RCT did not
find a difference in neurological outcomes between treatment protocols with two different CPP
thresholds (50 mm Hg vs. 70 mm Hg).2 The two Class 2 cohort studies both reported better
outcomes with higher CPP, but they identified different thresholds (60 mm Hg and 70 mm
Hg).4,5 For this reason, the quality of evidence is considered low and the Level II B
recommendation of a target CPP is not precise.
A re-analysis of the RCT2 data identified an association between the negative effects also
seen in the trial with the use of pressors.6 The other 12 Class 3 studies3,7-17 were variable in their
designs and inconsistent in their results. For this reason, the quality of the body of evidence is
low and the Level III recommendation is limited to stating that CPP below 50 should be avoided.

183
Table 17-1. Quality of the Body of Evidence (Cerebral Perfusion Pressure Thresholds)
Topic Number of
Studies Meta-
Analysis
Number
of Subjects
Class of Studies
Consistency (High,
Moderate, Low)
Directness (Direct or Indirect)
Precision (High,
Moderate, Low)
Quality of Evidence
(High, Moderate,
Low, or Insufficient)
COMPONENTS OF OVERALL QUALITY – Class 2 and 3 CPP target for positive outcomes2,
4,5
2 Cohort 1 RCT
Different designs and comparisons
2,405 Cohort studies: Class 2 RCT: Class 3
Low Direct Moderate Low
CPP threshold3,
7-17
12 Cohort Different designs and comparisons
2,024 3 Low Direct Low Low
Negative impact of elevating CPP with pressors and fluids2,6
1 Re-analysis of RCT
NA 189 3 NA Direct Moderate Low
Abbreviations: CPP=cerebral perfusion pressure, NA=not applicable, RCT=randomized controlled trial.
Applicability
The Class 3 RCT and one Class 2 observational study were conducted at single sites,2, 4 while
the other Class 2 study included multiple hospitals in New York State.5 The two Class 2
retrospective studies4,5 have large sample sizes. They were conducted over several years;
however, because patients in the group above the target threshold as well as those in the group
below the target threshold would be subjected to the same changes in practice over these periods,
this may not be an issue in terms of applicability.
SUMMARY OF THE EVIDENCE
Process
Of the 14 new, potentially relevant studies reviewed, five were excluded because they did not
meet the inclusion criteria for this topic (see Appendix F). Of the remaining nine, two were rated
Class 24,5 and seven were rated Class 3.7-13 These and seven additional studies from the 3rd
Edition2,3,6,14-17 were included as evidence for this topic.

184
Class 2 Studies
The evidence from the Class 2 studies of CPP thresholds is summarized in Table 17-2.
Table 17-2. Summary of Evidence – Class 2 Studies (Cerebral Perfusion Pressure Thresholds) Reference,
Study Topic Study Design, N, and Outcomes Data Class Results
Conclusion New Studies
Allen et al., 2014*5 Identification of age-specific CPP thresholds related to short-term survival
Retrospective cohort N=1,757 (18 years old and older) Mortality 14 days post-injury
Class 2 Survivors/Non-survivors # (%) CPP high (>60) 701(84.0%)/134 (16.1%) CPP 50-60 562 (83.6%)/110 (16.4%) CPP low (<50) 147 (62.3%)/89 (37.7%). RR: low to high 2.35 (1.88, 2.95), p<0.0001. Survival is better for adults with high CPP vs. adults with low CPP.
Sorrentino et al., 2012*4 ICP/CPP/PRx thresholds
Retrospective cohort N=459
Class 2 CPP 70 mm Hg for mortality and favorable outcome ICP thresholds 22 mm Hg for ICP for reduced mortality, 18 mm Hg for favorable outcomes in women and older patients. PRx 0.25 for mortality, 0.05 for favorable outcome.
Abbreviations: CPP=cerebral perfusion pressure, ICP=intracranial pressure, N=total sample size, PRx=Pressure-reactivity Index, RCT=randomized controlled trial, RR=relative risk. * References new to the 4th Edition.
Allen et al. analyzed data on all patients with severe TBI (Glasgow Coma Scale [GCS] 3-8
following resuscitation) included in the New York State TBI-trac© database. The objectives
were to determine if CPP thresholds should be age-specific, and which thresholds are best for
children and adolescents. In addition, they analyzed the data for adults. Patients who had no time
periods with CPP below 60 mm Hg had higher survival rates than patients who had any time
periods below 50 mm Hg. Patients with CPP between 50 and 60 mm Hg were not significantly
different from the >60 group in terms of survival. The researchers acknowledge that higher CPP
may increase the risk of acute respiratory distress syndrome (ARDS) based on other research, but
they do not report information on this risk based on their data and analysis.5

185
Sorrentino et al., 2012 identified threshold values for ICP, CPP, and pressure-reactivity index
(PRx) using a database of 763 patients admitted with TBI to the Neuroscience Critical Care
Unity of Cambridge, UK. Data was collected from 1992 through 2009; the analysis consisted of
sequential chi-square distributions in which patients were dichotomized into survivors or not,
Glasgow Outcome Scale (GOS) of 1 to 3 versus 4 to 5, and CPP in steps of 5 mm Hg. For both
mortality and neurological outcomes, 70 mm Hg was the optimal threshold for adults; however,
in the subgroup of patients >55 years old, the identified threshold was 75 mm Hg. In addition,
the study found no difference in outcomes for patients with CPP >70 compared with those <70
for the subset with preserved auto regulation (PRx <0.05); but for the subset with impaired
regulation (PRx ≥0.05), those with CPP <70 had significantly poorer outcomes.4
Class 3 Studies
The evidence from the Class 3 studies of CPP thresholds is summarized in Table 9-2.
Table 17-3. Summary of Evidence – Class 3 Studies (Cerebral Perfusion Pressure Thresholds) Reference,
Study Topic Study Design, N, and Outcomes Data Class Results
Conclusion New Studies
Chang 2009*7 Brain tissue hypoxia PbrO2 CPP
Retrospective Cohort N=27 Single Level 1 Trauma Center in the United States Dichotomized GOS-E and FSE at 6-9 months post-injury
Class 3 RR of poor outcome for subjects having at least 20% of hourly PbrO2 values below 20 from 2.8 to 4.6. CPP below 60 mm Hg was associated with a significant risk of hypoxia RR 3.01 (95% CI 2.51 to 3.61), p<0.0001.
Elf 2005*8 CPP
Prospective Cohort N=81 Severe=72 Single University Hospital in Sweden Mailed questionnaire at 6 months post-injury based on GOS (with telephone follow-up) - dichotomized
Class 3 OR of favorable outcome CPP <60 mm Hg= OR 1.55 (95% CI 1.10 to 2.19), p<0.05 CPP >70 mm Hg= OR 0.71 (95% CI 0.51 to 0.99), p<0.05 CPP >80 mm Hg= OR 0.69 (95% CI 0.49 to 0.98), p<0.05.
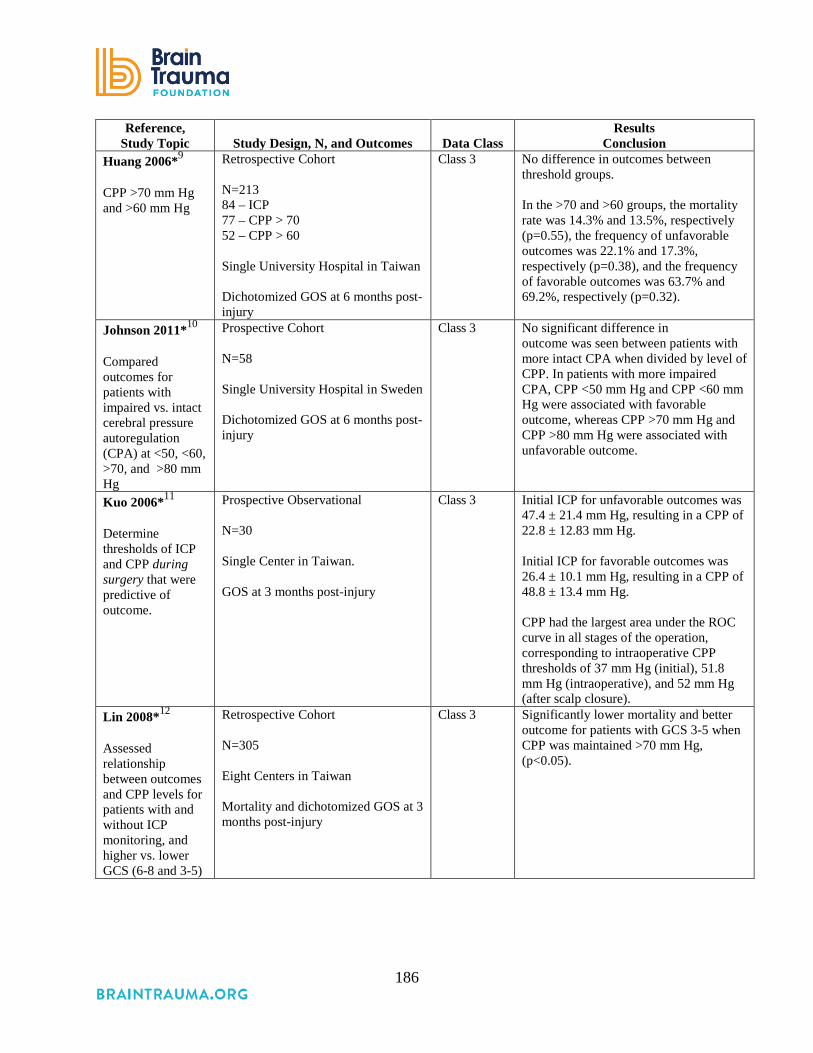
186
Reference, Study Topic Study Design, N, and Outcomes Data Class
Results Conclusion
Huang 2006*9 CPP >70 mm Hg and >60 mm Hg
Retrospective Cohort N=213 84 – ICP 77 – CPP > 70 52 – CPP > 60 Single University Hospital in Taiwan Dichotomized GOS at 6 months post-injury
Class 3 No difference in outcomes between threshold groups. In the >70 and >60 groups, the mortality rate was 14.3% and 13.5%, respectively (p=0.55), the frequency of unfavorable outcomes was 22.1% and 17.3%, respectively (p=0.38), and the frequency of favorable outcomes was 63.7% and 69.2%, respectively (p=0.32).
Johnson 2011*10 Compared outcomes for patients with impaired vs. intact cerebral pressure autoregulation (CPA) at <50, <60, >70, and >80 mm Hg
Prospective Cohort N=58 Single University Hospital in Sweden Dichotomized GOS at 6 months post-injury
Class 3 No significant difference in outcome was seen between patients with more intact CPA when divided by level of CPP. In patients with more impaired CPA, CPP <50 mm Hg and CPP <60 mm Hg were associated with favorable outcome, whereas CPP >70 mm Hg and CPP >80 mm Hg were associated with unfavorable outcome.
Kuo 2006*11 Determine thresholds of ICP and CPP during surgery that were predictive of outcome.
Prospective Observational N=30 Single Center in Taiwan. GOS at 3 months post-injury
Class 3 Initial ICP for unfavorable outcomes was 47.4 ± 21.4 mm Hg, resulting in a CPP of 22.8 ± 12.83 mm Hg. Initial ICP for favorable outcomes was 26.4 ± 10.1 mm Hg, resulting in a CPP of 48.8 ± 13.4 mm Hg. CPP had the largest area under the ROC curve in all stages of the operation, corresponding to intraoperative CPP thresholds of 37 mm Hg (initial), 51.8 mm Hg (intraoperative), and 52 mm Hg (after scalp closure).
Lin 2008*12 Assessed relationship between outcomes and CPP levels for patients with and without ICP monitoring, and higher vs. lower GCS (6-8 and 3-5)
Retrospective Cohort N=305 Eight Centers in Taiwan Mortality and dichotomized GOS at 3 months post-injury
Class 3 Significantly lower mortality and better outcome for patients with GCS 3-5 when CPP was maintained >70 mm Hg, (p<0.05).

187
Reference, Study Topic Study Design, N, and Outcomes Data Class
Results Conclusion
Zweifel 2008*13 Assessed pressure reactivity (PRx) and outcomes
Retrospective Cohort N=398 Single Center in Cambridge, U.K. Mortality and GOS at 6 months post-injury
Class 3 Optimal CPP for each patient was calculated based on the pressure reactivity index. Patients whose mean CPP varied above or below the optimal CPP were less likely to have a favorable outcome. 69% mortality in patients with PRx >0.25; <20% in patients with PRx <0.25 (p<0.0001).
Studies from 3rd Edition Changaris 198714 Retrospective analysis of the
relationship between 1 year outcomes and initial CPP in 136 patients with severe TBI
Class 3 All patients with CPP <60 mm Hg on the second post-injury day died; more patients had a good outcome than died when CPP was >80 mm Hg.
Clifton 200215 Retrospective review of 393 patients from the multicenter randomized hypothermia trial, comparing 6-month outcome with ICP, MAP, CPP, and fluid balance.
Class 3 Poor outcome was associated with CPP <60 mm Hg. No benefit to maintaining CPP >70 mm Hg.
Contant 20016 Retrospective analysis of the factors related to the occurrence of ARDS in the 189 adults with severe TBI from the RCT comparing CPP- with ICP-targeted.
Class 3 5-fold increase in risk of ARDS in CPP group strongly related to use of pressors.
Juul 200016 Retrospective review of the 427 adult patients in the Selfotel RCT of the influence of ICP and CPP on neurological deterioration and 6-month outcome.
Class 3 CPPs greater than 60 mm Hg had no significant influence on outcome.
McGraw 198917 Retrospective analysis of the relationship between 1-year outcomes and initial CPP in 221 patients with severe TBI
Class 3 The likelihood of good outcomes was significantly higher and of death significantly lower if CPP was >80 mm Hg
Robertson 19992 Comparison of CBF protocol (CPP kept at >70 mm Hg and PaCO2 was kept at approximately 35 torr [4.67 kPa]) vs. ICP management protocol (CPP was kept at >50 mm Hg and hyperventilation to a PaCO2 of 25-30 torr [3.33-4.00 kPa])
RCT (2-month time blocks randomized) N=189 CBF=100 ICP=89 Neurologic outcome at 6 months
Class 3 No difference in neurologic outcome. CBF (higher CPP) had few jugular desaturations. ICP group had more jugular desaturations but these were rapidly managed. CBF group had more systemic complications: Adult respiratory distress syndrome was 5 times greater in the CBF-targeted group, p=0.007.

188
Reference, Study Topic Study Design, N, and Outcomes Data Class
Results Conclusion
Steiner 20023 Prospective observation of CPP and outcome at 6 months for 114 adults with moderate or severe TBI.
Class 3 Optimal CPP for each patient was calculated based on the pressure reactivity index. Patients whose mean CPP varied above or below the optimal CPP were less likely to have a favorable outcome.
Abbreviations: ARDS=acute respiratory distress syndrome, CBF=cerebral blood flow, CPP=cerebral perfusion pressure, FSE=Functional Status Examination, GCS=Glasgow Coma Scale, GOS-E=Extended Glasgow Outcome Scale, ICP=intracranial pressure, PaCO2=partial pressure of arterial carbon dioxide; RCT=randomized controlled trial, TBI=traumatic brain injury. Note: Different abbreviations such as pBtO2/PbtO2 and PtiO2 are used to mean brain tissue oxygen monitoring and brain tissue oxygen tension; we use PbrO2 for consistency which may differ from what the study authors used.
One Class 3 study from the 3rd Edition of these guidelines contributes evidence for the
recommendations for this topic. In order to randomize treatment in one hospital ICU, Robertson
et al. randomly assigned 2 different protocols to 2-month time blocks. In the cerebral blood flow
(CBF) protocol, CPP was maintained above 70 mm Hg. In the ICP-targeted protocol, CPP was
maintained above 50 mm Hg. The proportion of patients with good recovery or moderate
disability was not significantly different at 3 or 6 months (3 months: CPP 31.9%, ICP 37.0%,
p=0.554; 6 months: CPP 39.8%, ICP 49.3%, p=0.49), but 15% of the CPP group developed
ARDS compared with 3.3% of the ICP group (p=0.007). The primary outcome was jugular
venous desaturation, which was more frequent in the ICP protocol group (OR 2.367, SE 0.8106,
p=0.012).2 Although the evidence is insufficient to contribute to a recommendation, avoiding
CPP <50 mm Hg may be considered. (Ancillary monitoring of cerebral blood flow, oxygenation,
or metabolism may facilitate CPP management.) Of the 14 Class 3 studies included for this topic,
one was an RCT, one reanalyzed the RCT data, four were prospective, and eight were
retrospective. Sample sizes ranged from 27 to 427; a total of 2,592 patients were observed.
Outcomes included mortality; the GOS, Extended GOS, Functional Status Examination, and
neurological outcomes spanning 3, 6, 9, and 12 months; and rates of ARDS. Findings were
inconsistent (Table 17-3) and cannot be used to support a more detailed Level III
recommendation.
REFERENCES
1. Rosner MJ, Rosner SD, Johnson AH. Cerebral perfusion pressure: management protocol and clinical results. J Neurosurg. Dec 1995;83(6):949-962. PMID: 7490638.
189
2. Robertson CS, Valadka AB, Hannay HJ, et al. Prevention of secondary ischemic insults after severe head injury. Crit Care Med. Oct 1999;27(10):2086-2095. PMID: 10548187.
3. Steiner LA, Czosnyka M, Piechnik SK, et al. Continuous monitoring of cerebrovascular pressure reactivity allows determination of optimal cerebral perfusion pressure in patients with traumatic brain injury. Crit Care Med. Apr 2002;30(4):733-738. PMID: 11940737.
4. Sorrentino E, Diedler J, Kasprowicz M, et al. Critical thresholds for cerebrovascular reactivity after traumatic brain injury. Neurocrit Care. 2012;16(2):258-266. PMID: 21964774
5. Allen BB, Chiu YL, Gerber LM, Ghajar J, Greenfield JP. Age-specific cerebral perfusion pressure thresholds and survival in children and adolescents with severe traumatic brain injury. Pediatr Crit Care Med. Jan 2014;15(1):62-70. PMID: 24196011.
6. Contant CF, Valadka AB, Gopinath SP, Hannay HJ, Robertson CS. Adult respiratory distress syndrome: a complication of induced hypertension after severe head injury. J Neurosurg. Oct 2001;95(4):560-568. PMID: 11596949.
7. Chang JJ, Youn TS, Benson D, et al. Physiologic and functional outcome correlates of brain tissue hypoxia in traumatic brain injury. Crit Care Med. Jan 2009;37(1):283-290. PMID: 19050612.
8. Elf K, Nilsson P, Ronne-Engstrom E, Howells T, Enblad P. Cerebral perfusion pressure between 50 and 60 mm Hg may be beneficial in head-injured patients: a computerized secondary insult monitoring study. Neurosurg. May 2005;56(5):962-971; discussion 962-971. PMID: 15854244.
9. Huang SJ, Chen YS, Hong WC, et al. Clinical experience of hydroxyethyl starch (10% HES 200/0.5) in cerebral perfusion pressure protocol for severe head injury. Surg Neurol. 2006;66 Suppl 2:S26-31. PMID: 17071251.
10. Johnson U, Nilsson P, Ronne-Engstrom E, Howells T, Enblad P. Favorable outcome in traumatic brain injury patients with impaired cerebral pressure autoregulation when treated at low cerebral perfusion pressure levels. Neurosurg. Mar 2011;68(3):714-721, discussion 721-712. PMID: 21311298.
11. Kuo JR, Yeh TC, Sung KC, Wang CC, Chen CW, Chio CC. Intraoperative applications of intracranial pressure monitoring in patients with severe head injury. J Clin Neurosci. Feb 2006;13(2):218-223. PMID: 16459087.
12. Lin JW, Tsai JT, Lin CM, et al. Evaluation of optimal cerebral perfusion pressure in severe traumatic brain injury. Acta Neurochirg Suppl. 2008;101:131-136. PMID: 18642647.
13. Zweifel C, Lavinio A, Steiner LA, et al. Continuous monitoring of cerebrovascular pressure reactivity in patients with head injury. Neurosurg. Oct 2008;25(4):E2. PMID: 18828700.
14. Changaris DG, McGraw CP, Richardson JD, Garretson HD, Arpin EJ, Shields CB. Correlation of cerebral perfusion pressure and Glasgow Coma Scale to outcome. J Trauma. Sep 1987;27(9):1007-1013. PMID: 3656462.
15. Clifton GL, Miller ER, Choi SC, Levin HS. Fluid thresholds and outcome from severe brain injury. Crit Care Med. Apr 2002;30(4):739-745. PMID: 11940738.
16. Juul N, Morris GF, Marshall SB, Marshall LF. Intracranial hypertension and cerebral perfusion pressure: influence on neurological deterioration and outcome in severe head

190
injury. The Executive Committee of the International Selfotel Trial. J Neurosurg. Jan 2000;92(1):1-6. PMID: 10616075.
17. McGraw CP. A cerebral profusion pressure greater than 80 mm Hg is more beneficial In: Hoff J, Betz A, eds. ICP VII 1989: pages 839-841.

191
18. Advanced Cerebral Monitoring Thresholds
INTRODUCTION
The goal of the medical management of severe traumatic brain injury (TBI) is to ensure that
nutrient delivery to the brain is optimized through the period of abnormal physiology and brain
swelling that follows the injury. The only way to be assured that this is being achieved to the
greatest extent possible is to measure brain metabolites which provide reassurance that the needs
of oxidative metabolism are being met.
Historical means of examining brain health, such as the Kety-Schmidt method, which
remains a gold standard assay for cerebral blood flow and metabolism,1 as well as xenon-CT,
which informs the former, were cumbersome.2 Both provide information about large brain
regions, as does jugular venous O2 monitoring (SjO2). In recent decades, invasive monitors have
been developed that monitor brain pressure, oxygenation (PbrO2), and blood flow on a
continuous or nearly continuous basis.3 Microdialysis techniques allow measurement of
metabolites in the brain’s extracellular fluid. Intracranial pressure is a clinically important
surrogate measure of brain health discussed elsewhere in these guidelines.
Substantial gaps in our knowledge currently exist regarding how the data provided by
advanced cerebral monitors should be used. These gaps are substantially greater for some such
technologies than others. Studies published to date have attempted to explore putative thresholds
of prognostic significance; however, uncertainty remains as to the precise thresholds that should
be employed, and if the notion of a threshold best characterizes the relationship with outcome.
For regional monitors, there is insufficient understanding of how specific brain regions and
distance from focal lesions affect measurements.4 Moreover, placement of these monitors with
stereotactic precision is not currently feasible for these devices. It is critical to consider these
limitations and knowledge gaps when examining the literature supporting use of these
technologies for patient care.
RECOMMENDATIONS
Level I and II
• There was insufficient evidence to support Level I or II recommendation for this topic.

192
Level III
• Jugular venous saturation of <50% may be a threshold to avoid in order to reduce
mortality and improve outcomes.
Changes from Prior Edition
In the 3rd Edition of these guidelines, monitoring and thresholds were combined into one
section. In this 4th Edition, they are reported separately, and this topic has been renamed
Advanced Cerebral Monitoring (ACM) Thresholds. The Level III recommendation from the 3rd
Edition about jugular venous saturation has been maintained. The Level III recommendation
from the 3rd Edition about brain tissue oxygen monitoring has been revised based on
reconsideration of the body of evidence.
EVALUATION OF THE EVIDENCE
Quality of the Body of Evidence
While there has been an increase in the number of studies published about ACM, there is not
yet sufficient evidence about threshold values to target or avoid specific to the individual
subtypes of ACM to inform Level I or II recommendations (Table 18-1).
Table 18-1. Quality of the Body of Evidence (Advanced Cerebral Monitoring Thresholds)
Topic Number
of Studies Meta-
Analysis
Number
of Subjects
Quality of Studies (Class 1
or 2)
Consistency (High,
Moderate, Low)
Directness (Direct or Indirect)
Precision (High,
Moderate, Low)
Quality of Evidence
(High, Moderate,
Low, or Insufficient)
COMPONENTS OF OVERALL QUALITY – Class 2 PbrO2 monitoring5
1 Retro-spective, 0 RCT
NA 32 2 NA Direct Low Insufficient
AVDO2 monitoring6
1 Retro-spective 0 RCT
NA 55 2 NA Direct Low Insufficient

193
Topic Number
of Studies Meta-
Analysis
Number
of Subjects
Quality of Studies (Class 1
or 2)
Consistency (High,
Moderate, Low)
Directness (Direct or Indirect)
Precision (High,
Moderate, Low)
Quality of Evidence
(High, Moderate,
Low, or Insufficient)
COMPONENTS OF OVERALL QUALITY – Class 3 PbrO2 monitoring7-11
4 Pro-spective, 1 Retro-spective, 0 RCT
NA 222 3 Moderate Direct Low Insufficient
AVDO2 monitoring12-15
3 Pro-spective, 1 Retro-spective, 0 RCT
NA 972 3 Low Direct Low Low
Cerebral autoregula-tion16,17
1 Pro-spective, 1 Retro-spective
NA 84 3 Moderate Direct Low Insufficient
Abbreviations: NA=not applicable, RCT=randomized controlled trial. Note: Different abbreviations such as pBtO2/PbtO2 and PtiO2 are used to mean brain tissue oxygen monitoring and brain tissue oxygen tension; we use PbrO2 for consistency, which may differ from what the study authors used.
Applicability
The included Class 2 studies5,6 were conducted at single sites and have small sample sizes,
which could limit their applicability. The Class 3 studies are larger and more varied, but the four
new studies added to this edition are all single-center studies conducted in the United States,
Germany, and Israel. Given that their overall quality is low, applicability is less of a concern.
SUMMARY OF THE EVIDENCE
Process
Of the 48 new, potentially relevant studies reviewed, 42 were excluded because they did not
meet the inclusion criteria for this topic (see Appendix F). Of the remaining six, two Class 2
studies5,6 and four Class 3 studies7,8,16,17 were included as evidence for this topic. Seven Class 3
studies from the 3rd Edition were also included for this topic.9-15
Class 2 Studies
The evidence from the Class 2 studies of advanced cerebral monitoring thresholds is
summarized in Table 18-2.

194
Table 18-2. Summary of Evidence: Class 2 Studies (Advanced Cerebral Monitoring Thresholds) Reference,
Study Topic Study Design, N, and Outcomes Data Class Results
Conclusion Brain Tissue Oxygen Monitoring Eriksson, 2012*5 To determine the value of brain tissue oxygenation (PbrO2) most predictive of survival
Retrospective Cohort N=32 Survived=22 Died=10 Survival in 72 hours
Class 2 Mortality is higher when PbrO2 remains below 29 mm Hg in the 1st 72 hours. (F=12.898), p<0.001.
Jugular Bulb Monitoring of Arteriovenous Oxygen Content Difference Chieregato, 2007*6 Determine values of measures available from a jugular bulb monitoring associated with early death
Retrospective Cohort N=55 Survived=43 Early death=12 Brain death within 48 hours
Class 2 AVD pPO2 and eRQ ranges were wider in patients who died in univariate analysis but did not predict outcome in multivariate model. Lactate variables were better predictors of death than AVDO2 and CO2 related indexes.
Abbreviations: AVDO2=arteriovenous oxygen content difference, PbrO2=brain tissue oxygenation. Note: Different abbreviations such as pBtO2/PbtO2 and PtiO2 are used to mean brain tissue oxygen monitoring and brain tissue oxygen tension; we use PbrO2 for consistency, which may differ from what the study authors used. * References new to the 4th Edition.
Brain Tissue Oxygen Monitoring (PbrO2)
Eriksson et al., 20125 collected data hourly from both ICP and PbrO2 monitors for the first 72
hours of monitoring in 32 patients and compared values for those who survived with those who
died. The PbrO2 values were significantly higher in survivors at 8, 12, 20-44, 52-60, and 72
hours (p<0.05), while ICP and CPP were not significantly different. The threshold most
predictive of mortality was 29 mm Hg, with survivors having a longer period of time with PbrO2
≥29 during the first 72 hours of monitoring (hours, 52.2 ± 20.1 vs. 26.8 ± 16.1, p=0.001).
Jugular Bulb Monitoring of Arteriovenous Oxygen Content Difference (AVDO2)
Chieregato et al., 20076 analyzed data from blood samples of 55 patients taken with a
retrograde jugular catheter during the 48 hours post-injury. Patients who died within the 48 hours
(21.8%) due to TBI were compared with those who survived (78.2%). These samples were used
to measure arteriovenous pCO2 difference (AVDpCO2), estimated respiratory quotient (eRQ),
arteriovenous lactate difference (AVDL), and lactate oxygen index (LOI). The lactate variables
were more clearly related to early death than isolated AVDpCO2 widening and increases in eRQ.

195
Over time, the AVDpCO2 normalized in the patients who survived, suggesting that isolated
measures of arteriovenous pCO2 are not specific for global cerebral ischemia, but that
monitoring over time could predict outcomes.
Class 3 Studies
The evidence from the Class 3 studies of advanced cerebral monitoring thresholds is
summarized in Table 18-3.
Table 18-3: Summary of Evidence: Class 3 Studies (Advanced Cerebral Monitoring Thresholds) Reference
Study Topic Study Design, N, and Outcomes Data Class Results
Conclusion New Studies
Brain Tissue Oxygen Monitoring Chang 2009*7 Assessed thresholds for PbrO2 and CPP
Retrospective Cohort N=27 Single Level 1 Trauma Center in the United States Dichotomized GOS-E and FSE (Functional Status Examination) at 6-9 months post-injury
Class 3 RR of poor outcome for subjects having at least 20% of hourly PbrO2 values below 20 mm Hg from 2.8 to 4.6. CPP below 60 mm Hg was associated with a significant risk of hypoxia RR 3.01 (95% CI 2.51 to 3.61), p<0.0001.
Stiefel 2006*8 Assessed PbrO2 levels and mortality
Prospective Cohort N=25 Single Level I Trauma Center in the United States Mortality
Class 3 Mortality was 30% when brain O2 was greater than 25 mm Hg; 43% if the O2 level was less than 20 mm Hg; and 50% when it was less than 15 mm Hg. When the brain tissue O2 level was less than 20 mm Hg and did not improve during resuscitation, the mortality rate was 60%.
Cerebral Autoregulation Monitoring Sanchez-Porras 2012*16 Assessed relationship between low-frequency pressure reactivity (L-PRx) values and outcomes
Retrospective Cohort N=29 Single University Hospital in Germany Mortality and GOS at 6 months post-injury
Class 3 Critical value to avoid for averaged (for each patient) L-PRx is >0.2. 83.3% fatality for patients >0.2. Patients with fatal outcome had an averaged L-PRx of 0.4 while survivors had an averaged L-PRx of 0.03. Significant correlation between L-PRx and GOS at 6 months (r=−0.556, p=0.002). Significant difference in L-PRx values between survivors and non-survivors (p=0.001).

196
Reference Study Topic Study Design, N, and Outcomes Data Class
Results Conclusion
Soustiel 2005*17 Assessed CBF measurements with TCD
Prospective Cohort N=55 Single Hospital in Israel Dichotomized GOS at 3 months post-injury
Class 3 71.4% of patients with poor outcome had CBF levels below 35 mL/100g-1 /min-1 on admission in comparison with patients of favorable outcome in whom only 16.7% had such low CBF values (p=0.0007).
Studies from 3rd Edition Brain Tissue Oxygen Monitoring Bardt 19989 Prospective, observational study of
35 severe TBI (GCS ≤8) patients who underwent monitoring of brain tissue oxygen. Outcome was assessed by GOS at 6 months post-injury.
Class 3 Time spent with a PbrO2 <10 was related to outcome as follows: Patients (n=12) with PbrO2 <10 mm Hg for <30 minutes had rates of: Favorable outcome: 73% Unfavorable outcome: 18% Death: 9% Patients (n=23) with PbrO2 <10 mm Hg for >30 minutes had rates of: Favorable outcome: 22% Unfavorable outcome: 22% Death: 56%. Low PbrO2 values and the duration of time spent with low PbrO2 are associated with mortality.
Valadka 199810 Prospective, observational study of 34 TBI patients who underwent monitoring of brain tissue oxygen. Outcome was assessed by GOS at 3 months post-injury.
Class 3 The likelihood of death increased with increasing duration of time below PbrO2 of 15 mm Hg or with occurrence of any value below 6 mm Hg. Low PbrO2 values and the duration of time spent with low PbrO2 are associated with mortality.

197
Reference Study Topic Study Design, N, and Outcomes Data Class
Results Conclusion
Van den Brink 200011
Prospective, observational study of 101 severe TBI (GCS ≤8) who underwent monitoring of brain tissue oxygen. Outcome was assessed by GOS at 6 months post-injury.
Class 3 Patients with initially low values (<10 mm Hg) of PbrO2 for more than 30 minutes had higher rates of mortality and worse outcomes than those whose PbrO2 values were low for less than 30 minutes. Time spent with a low PbrO2 was related to outcome as follows: PbrO2 <5 mm Hg of 30 minutes duration was associated with a 50% risk of death. PbrO2 <10 mm Hg of 1 hour 45 minutes duration was associated with a 50% risk of death. PbrO2 <15 mm Hg of 4 hours duration was associated with a 50% risk of death. Low PbrO2 values and the duration of time spent with low PbrO2 are associated with mortality. A 50% risk of death was associated with a PbrO2 less than 15 mm Hg lasting longer than 4 hours.
Jugular Bulb Monitoring of Arteriovenous Oxygen Content Difference Cormio 199912 Retrospective analysis of 450 TBI
patients who underwent jugular venous saturation monitoring in which the relationship of elevated SjO2 to GOS at 3 or 6 months was studied. The relationship of SjO2 to CBF measured by Kety-Schmidt method was also studied.
Class 3 Patients in group with mean SjO2 >75% had significantly higher CBF. Patients in group with mean SjO2 >75% had significantly worse outcomes (death or vegetative state in 49% and severe disability in 26%) compared with those with mean SjO2 between 74 to 56%. High SjO2 values may be associated with poor outcomes.
Robertson, 199313
Prospective, observational study of SjO2 monitoring in 116 TBI patients (100 with closed head injury and 16 with penetrating head injury) in which desaturation episodes (SjO2 <50%) were monitored and correlated to GOS at 3 months post-injury.
Class 3 The number of episodes of desaturation were found to be associated with mortality as follows: no desaturation episodes: mortality 18% one desaturation episode: mortality 46% multiple desaturation episodes: mortality 71%. Episodes of desaturation are related to mortality and GOS at 3 months.
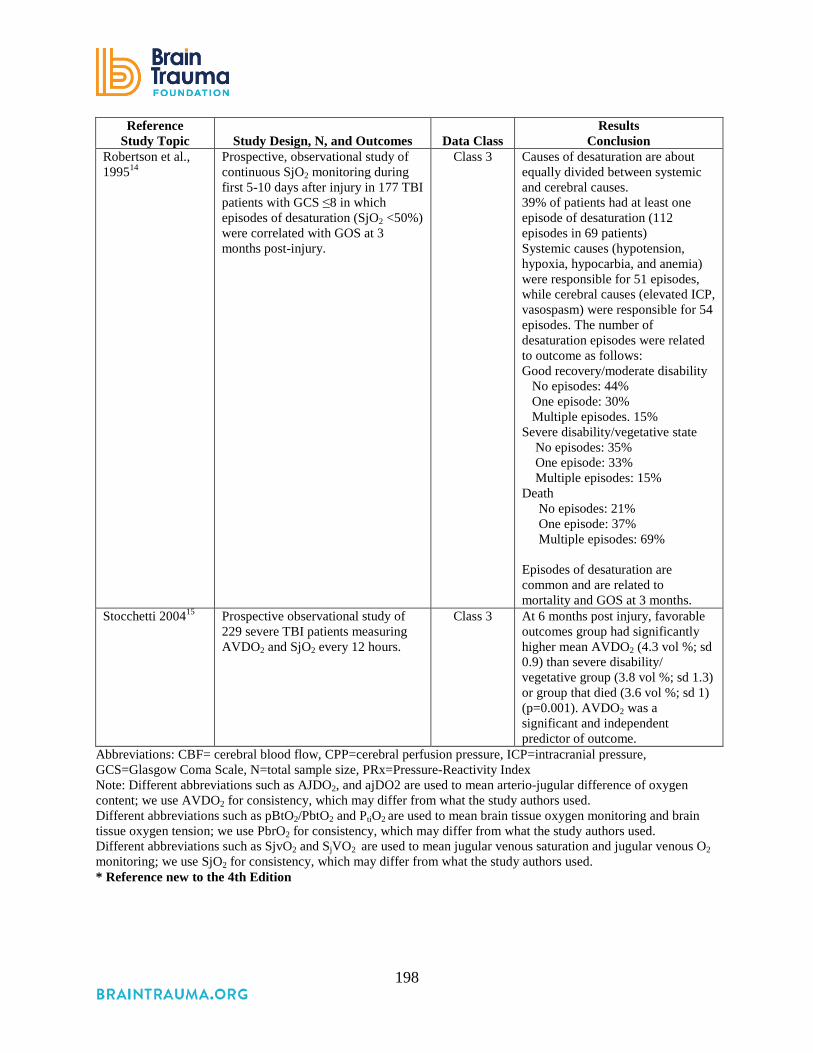
198
Reference Study Topic Study Design, N, and Outcomes Data Class
Results Conclusion
Robertson et al., 199514
Prospective, observational study of continuous SjO2 monitoring during first 5-10 days after injury in 177 TBI patients with GCS ≤8 in which episodes of desaturation (SjO2 <50%) were correlated with GOS at 3 months post-injury.
Class 3 Causes of desaturation are about equally divided between systemic and cerebral causes. 39% of patients had at least one episode of desaturation (112 episodes in 69 patients) Systemic causes (hypotension, hypoxia, hypocarbia, and anemia) were responsible for 51 episodes, while cerebral causes (elevated ICP, vasospasm) were responsible for 54 episodes. The number of desaturation episodes were related to outcome as follows: Good recovery/moderate disability No episodes: 44% One episode: 30% Multiple episodes. 15% Severe disability/vegetative state No episodes: 35% One episode: 33% Multiple episodes: 15% Death No episodes: 21% One episode: 37% Multiple episodes: 69% Episodes of desaturation are common and are related to mortality and GOS at 3 months.
Stocchetti 200415 Prospective observational study of 229 severe TBI patients measuring AVDO2 and SjO2 every 12 hours.
Class 3 At 6 months post injury, favorable outcomes group had significantly higher mean AVDO2 (4.3 vol %; sd 0.9) than severe disability/ vegetative group (3.8 vol %; sd 1.3) or group that died (3.6 vol %; sd 1) (p=0.001). AVDO2 was a significant and independent predictor of outcome.
Abbreviations: CBF= cerebral blood flow, CPP=cerebral perfusion pressure, ICP=intracranial pressure, GCS=Glasgow Coma Scale, N=total sample size, PRx=Pressure-Reactivity Index Note: Different abbreviations such as AJDO2, and ajDO2 are used to mean arterio-jugular difference of oxygen content; we use AVDO2 for consistency, which may differ from what the study authors used. Different abbreviations such as pBtO2/PbtO2 and PtiO2 are used to mean brain tissue oxygen monitoring and brain tissue oxygen tension; we use PbrO2 for consistency, which may differ from what the study authors used. Different abbreviations such as SjvO2 and SjVO2 are used to mean jugular venous saturation and jugular venous O2 monitoring; we use SjO2 for consistency, which may differ from what the study authors used. * Reference new to the 4th Edition

199
Brain Tissue Oxygen Monitoring (PbrO2)
Of the five Class 3 studies that addressed thresholds for PbrO2 monitoring, four were
prospective8-11 and one was retrospective.7 All were from single centers. Outcomes included
mortality, GOS-E and FSE measured between 6 and 9 months post-injury, and GOS measured at
3 and 6 months. A total of 222 patients were observed across studies, with sample sizes ranging
from 25 to 101. One7 identified a PbrO2 value of <20 mm Hg as a threshold to avoid. One8
showed increasingly poor outcomes as thresholds moved from <25 to <20 and <15 mm Hg.
Three9-11 suggested that longer duration of time at thresholds <10 and 15 mm Hg is associated
with poorer outcomes.
Jugular Bulb Monitoring of Arteriovenous Oxygen Content Difference (AVDO2)
Of the four Class 3 studies that addressed thresholds for AVDO2 monitoring, three were
prospective13-15 and one was retrospective.12 Three were conducted in single centers,12-14 while
one collected data in two hospitals.15 Outcomes included mortality and GOS measured at 3 and 6
months. A total of 972 patients were observed, with sample sizes ranging from 116 to 450.
Cormio12 found increased mortality and poor outcomes to be associated with a mean SjO2 >75%.
Stocchetti15 found a decreased mortality and better outcomes to be associated with higher mean
AVDO2 values. The two Robertson studies13,14 suggest that a SjO2 value of ≤50% is a critical
threshold to avoid.
Cerebral Autoregulation Monitoring
Both of the two Class 3 studies that addressed thresholds for cerebral autoregulation
monitoring were from single centers. One retrospective study16 (N=29) found an association
between mortality and L-PRx >0.2. The other prospective study17 (N=55) found an association
between poor outcomes at 3 months post-injury and cerebral blood flow (CBF) levels below 35
mL/100g-1/min-1 on admission.
REFERENCES
1. Kety SS SC. The nitrous oxide method for the quantitative determination of cerebral blood flow in man: theory, procedure and normal values. J Clin Invest. 1948;27:476-483. PMID: 16695568.

200
2. Yonas H, Pindzola RP, Johnson DW. Xenon/computed tomography cerebral blood flow and its use in clinical management Neurosurg Clin North Am. 1996;7:605-616 PMID: 8905775
3. Feyen BF, Sener S, Jorens PG, Menovsky T, Maas AI. Neuromonitoring in traumatic brain injury. Minerva Anestesiol. 2012;78(8):949-958. PMID: 22643541.
4. Hawryluk GW, Phan N, Ferguson AR, et al. Brain tissue oxygen tension and its response to physiological manipulations is dependent on distance from injury site in a swine model of traumatic brain injury. Neurosurg. 2015;62 (Suppl 1):225.
5. Eriksson EA, Barletta JF, Figueroa BE, et al. The first 72 hours of brain tissue oxygenation predicts patient survival with traumatic brain injury. J Trauma Acute Care Surg. May 2012;72(5):1345-1349. PMID: 22673264.
6. Chieregato A, Marchi M, Fainardi E, Targa L. Cerebral arterio-venous pCO2 difference, estimated respiratory quotient, and early posttraumatic outcome: comparison with arterio-venous lactate and oxygen differences. J Neurosurg Anesthesiol. Oct 2007;19(4):222-228. PMID: 17893572.
7. Chang JJ, Youn TS, Benson D, et al. Physiologic and functional outcome correlates of brain tissue hypoxia in traumatic brain injury. Crit Care Med. Jan 2009;37(1):283-290. PMID: 19050612.
8. Stiefel MF, Udoetuk JD, Spiotta AM, et al. Conventional neurocritical care and cerebral oxygenation after traumatic brain injury. J Neurosurg. Oct 2006;105(4):568-575. PMID: 17044560.
9. Bardt TF, Unterberg AW, Hartl R, Kiening KL, Schneider GH, Lanksch WR. Monitoring of brain tissue PO2 in traumatic brain injury: effect of cerebral hypoxia on outcome. Acta Neurochir Suppl. 1998;71:153-156. PMID: 9779171.
10. Valadka AB, Gopinath SP, Contant CF, Uzura M, Robertson CS. Relationship of brain tissue PO2 to outcome after severe head injury. Crit Care Med. Sep 1998;26(9):1576-1581. PMID: 9751596.
11. van den Brink WA, van Santbrink H, Steyerberg EW, et al. Brain oxygen tension in severe head injury Neurosurg. 2000;46(4):868-878 discussion 876-868. PMID: 10764260
12. Cormio M, Valadka AB, Robertson CS. Elevated jugular venous oxygen saturation after severe head injury. J Neurosurg. Jan 1999;90(1):9-15. PMID: 10413150.
13. Robertson C. Desaturation episodes after severe head injury: influence on outcome. Acta Neurochir Suppl (Wien). 1993;59:98-101. PMID: 8310869.
14. Robertson CS, Gopinath SP, Goodman JC, Contant CF, Valadka AB, Narayan RK. SjvO2 monitoring in head-injured patients. J Neurotrauma. Oct 1995;12(5):891-896. PMID: 8594216.
15. Stocchetti N, Canavesi K, Magnoni S, et al. Arterio-jugular difference of oxygen content and outcome after head injury. Anesth Analg. Jul 2004;99(1):230-234. PMID: 15281535.
16. Sanchez-Porras R, Santos E, Czosnyka M, Zheng Z, Unterberg AW, Sakowitz OW. 'Long' pressure reactivity index (L-PRx) as a measure of autoregulation correlates with outcome in traumatic brain injury patients. Acta Neurochir (Wien). Sep 2012;154(9):1575-1581. PMID: 22743796.
17. Soustiel JF, Glenn TC, Shik V, Boscardin J, Mahamid E, Zaaroor M. Monitoring of cerebral blood flow and metabolism in traumatic brain injury. J Neurotrauma. Sep 2005;22(9):955-965. PMID: 16156711.

201
Future Research Management of patients with traumatic brain injury (TBI) is not a function of the application
of individual treatments. No treatment or management approach exists independent of other
treatments and approaches, or independent of the ecology. The design of meaningful and
effective future research needs to be consistent with this clinical reality. The brain trauma
community needs to design and engage in a systematic process for developing a research agenda
that begins with thoughtful conversations about scope, topics, management environments, and
research methods. The Living Guidelines Methods Team has proposed the development of a
process to accomplish this goal. The process should include (1) identification and refinement of
topics for individual studies that could serve to fill critical gaps in the guidelines, (2)
improvement of individual study designs, and (3) incorporation of state-of-the-art methods for
synthesizing literature, assessing bodies of evidence, and generating guidelines.
Topic Selection and Refinement
Topics addressed in this edition—in particular those for which no recommendation was
made—provide a place to begin. However, listing all the unanswered questions and stating that
more research is needed is a passive approach that will not advance the field or improve patient
outcomes. For this reason, rather than repeat what is missing for each topic, the Methods Team
plans to supplement the guidelines with an integrated Topic Refinement and Future Research
process as part of the transition to Living Guidelines, which will result in a proposed research
agenda.
To accomplish this, we need to monitor the field and add new topics as they become relevant.
Additionally, for each existing topic we need to reexamine both the questions and the
unexamined assumptions that have become established parameters in our process. For example,
we currently limit studies for our guidelines to those with patient populations with an initial
Glasgow Coma Scale (GCS) of 3 to 8. As we saw in assessing Deep Vein Thrombosis
Prophylaxis for this edition, the decision to administer chemoprophylaxis is not always related to
the patient’s initial GCS. Consequently, that inclusion criterion might be inappropriate for this
topic and may result in exclusion of studies with relevant data.

202
We need to approach topics systematically and with an open mind. We need to look back
into the past and identify the unexamined assumptions that have driven the articulation of our
key questions to date. Then we need to look at present and promising future developments,
expanding to include other disciplines, to redefine the territory for key research questions.
Concurrently, we should access any new information that may become available from the large
comparative effectiveness research projects being conducted in both adult and pediatric
populations. Findings from these studies could help us move from the current focus on individual
treatments to a more ecologically valid model for generating guidelines.
Methods—Individual Studies
As stated in the Introduction section, we could begin the critical self-examination of our
research methods by returning to the recommendations of the Clinical Trials in Head Injury
Study Group.1 That will only be useful if done inside a full recognition of the current paradigm
for conducting clinical research. Unfortunately, the realities of conducting clinical research
sometimes compromise sound scientific methods. Moving from a pilot to a full scale study may
include:
• Revision of and heterogeneity in inclusion criteria, to increase sample size
• Revision of the protocol for delivering the intervention
• An increase in number of centers—to increase sample size and to speed recruitment in
order to decrease study duration—resulting in a lack of standardized management across
multiple centers
• Expanded data collection to meet multiple agency requirements
• Outcome measures that may not be clinically relevant
• Shortened time to complete follow-up
• Effect size requirements that may be statistically, but not clinically, relevant
• Budget constraints
The rationale for subjecting an effective single-center trial to the variability encountered in a
large multi-center trial is valid. Ideally, a treatment should be effective across various clinical
environments. However, failure at the multi-center level could be the result of factors other than,
203
or in addition to, lack of a robust treatment effect. Variability in research protocols, patient
assessments, and data collection and management could be washing out the potential effects of
the interventions we are studying.
Also in the spirit of critical self-examination is this question: What does our community need
to do to produce a substantial and permanent shift in the quality of the studies we are generating?
The direct approach of wagging the evidence-based finger is not changing research practice.
What is in the background of our world view and frame of reference for research that is
influencing our selection of research models and designs? How does the current paradigm for
brain trauma allow for the persistence of studies that employ designs and protocols we know in
advance will not produce strong evidence? Discovery at this contextual level will be necessary,
but not sufficient, for the generation of strong evidence.
Methods—Systematic Reviews and Guidelines Development
In addition to a systematic and integrated approach to topic refinement and future research
needs, we will continue to develop and use the most advanced methods available for our
evidence reviews and generation of guidelines recommendations. Thus, there will be changes
over time. In this edition, we improved our fidelity to the pre-specified inclusion criteria. We
added an assessment of the quality of the body of available evidence to address specific
questions, and used the overall quality and applicability to support recommendations. In the
future, we will be examining our criteria for inclusion as well the criteria used to rate the quality
of individual studies, the quality of the body of evidence, and applicability. As we continue this
work, we will consider new methods as they become available and incorporate those that help us
advance our mission to strengthen the evidence base related to TBI.
To do this, we will be reaching out to various stakeholders. We will draw on the collective
expertise of multiple communities to develop a framework for guideline development that
explicitly incorporates all steps from topic identification, through topic refinement, evidence
synthesis, development of recommendations, and dissemination, to the prioritization of future
research.

204
REFERENCE
1. Narayan RK, Michel ME, Ansell B, et al. Clinical trials in head injury. J Neurotrauma. May 2002;19(5):503-557. PMID: 12042091.

205
Conclusion Often, the available evidence is not sufficient to generate guidelines addressing the most
critical questions faced by clinicians and patients. While there have been some major
developments in severe traumatic brain injury (TBI) management, for some topics in this edition
it was not possible to make new evidence-based recommendations. The options are to wait for
better evidence to be produced, or to situate our reviews and guidelines in a larger enterprise.
Our vision is a recursive structure for the reviews and guidelines to contribute to the
development and execution of a research agenda that can provide the evidence base for better
guidelines. We anticipate that this agenda will also promote the development and use of
increasingly rigorous research methods in individual studies as well as reviews.
As outlined in the Introduction section, this edition differs from prior editions in several
ways. First, we are moving from a static document to a “living guideline” model that will better
meet the needs of the brain trauma community. Second, the Brain Trauma Foundation guidelines
have been integrated into the Brain Trauma Evidence-based Consortium (B-TEC). In that
context, the guidelines will contribute to, and benefit from, the realization of the mission of
B-TEC to cause a paradigm shift in the assessment, diagnosis, treatment, and prognosis of brain
trauma.

206
Appendices

207
Appendix A. Major Changes from 3rd to 4th Edition Changes in the approach and methodology from the 3rd to this current 4th Edition are outlined in the Introduction and Methods sections. Within each topic, text describing the changes is included immediately following the Recommendations. The table below lists the major changes for each topic. Topic Change Explanation
Treatments Decompressive Craniectomy
New topic for 4th Edition. This topic was part of the surgical guidelines. It has been added as it is an increasingly common treatment in the management of severe TBI.
Prophylactic Hypothermia
Meta-analysis was not repeated and the current evidence synthesis is now qualitative.
When reviewed according to current standards, treatments in studies were considered clinically different and not appropriate for meta-analysis.
Hyperosmolar Therapy
This topic focused on the comparative effectiveness of different hyperosmolar agents.
- - - - - - - - Eisenberg, 1988 is no longer included in this topic.
This is currently a routine therapy and the more urgent, clinically relevant question is which hyperosmolar agent to use.
- - - - - - - - This study is a Class 2 study of barbiturates. It is not Class 2 for this topic.
Cerebrospinal Fluid Drainage
New topic for 4th Edition. This topic has been added as it is used in current practice to reduce ICP. It is anticipated that the evidence base will grow as the use and study of CSF drainage increases in TBI.
Ventilation Therapies This title was changed from Hyperventilation.
This reflects the expansion of the search and will allow the inclusion of related therapies in the future.
Anesthetics, Analgesics, and Sedatives
No major change. NA
Steroids No major change. Six-month outcomes from the CRASH trial were added to the evidence table and text.
Nutrition New recommendations and addition of new studies.
Additions to recommendations were based on new evidence identified for this update.
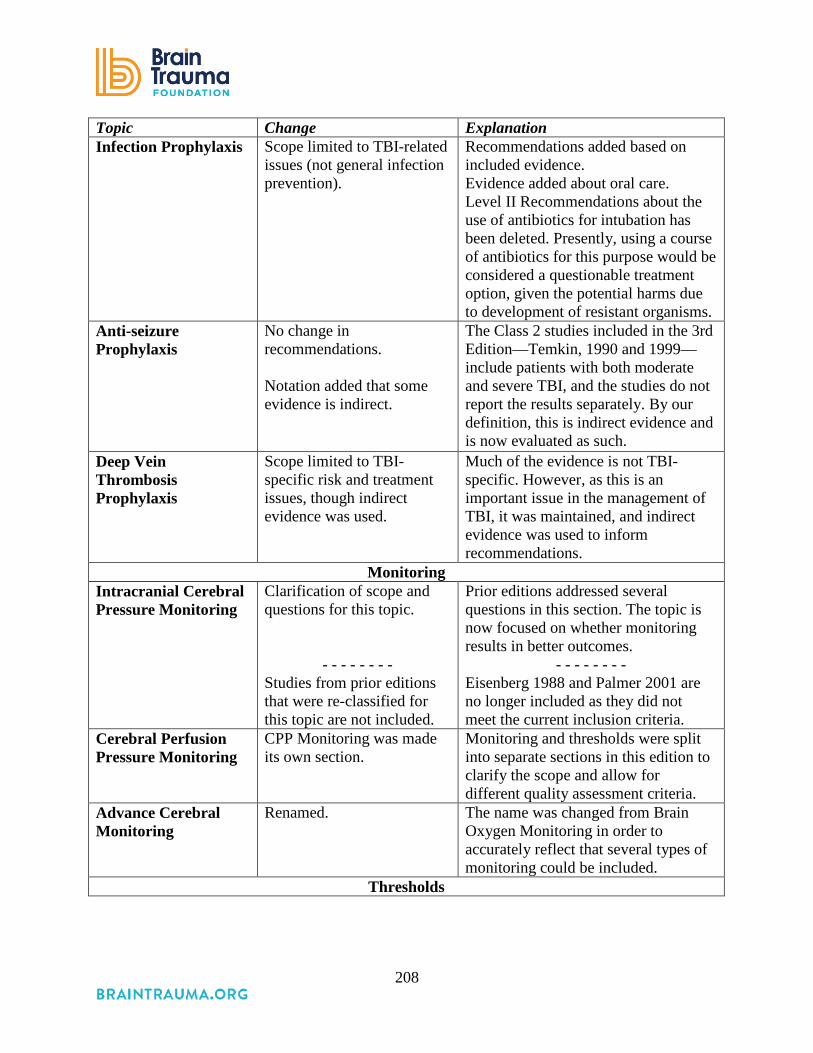
208
Topic Change Explanation Infection Prophylaxis Scope limited to TBI-related
issues (not general infection prevention).
Recommendations added based on included evidence. Evidence added about oral care. Level II Recommendations about the use of antibiotics for intubation has been deleted. Presently, using a course of antibiotics for this purpose would be considered a questionable treatment option, given the potential harms due to development of resistant organisms.
Anti-seizure Prophylaxis
No change in recommendations. Notation added that some evidence is indirect.
The Class 2 studies included in the 3rd Edition—Temkin, 1990 and 1999—include patients with both moderate and severe TBI, and the studies do not report the results separately. By our definition, this is indirect evidence and is now evaluated as such.
Deep Vein Thrombosis Prophylaxis
Scope limited to TBI-specific risk and treatment issues, though indirect evidence was used.
Much of the evidence is not TBI-specific. However, as this is an important issue in the management of TBI, it was maintained, and indirect evidence was used to inform recommendations.
Monitoring Intracranial Cerebral Pressure Monitoring
Clarification of scope and questions for this topic.
- - - - - - - - Studies from prior editions that were re-classified for this topic are not included.
Prior editions addressed several questions in this section. The topic is now focused on whether monitoring results in better outcomes.
- - - - - - - - Eisenberg 1988 and Palmer 2001 are no longer included as they did not meet the current inclusion criteria.
Cerebral Perfusion Pressure Monitoring
CPP Monitoring was made its own section.
Monitoring and thresholds were split into separate sections in this edition to clarify the scope and allow for different quality assessment criteria.
Advance Cerebral Monitoring
Renamed. The name was changed from Brain Oxygen Monitoring in order to accurately reflect that several types of monitoring could be included.
Thresholds

209
Topic Change Explanation Blood Pressure Thresholds
Blood Pressure Thresholds was made its own section. Studies from pre-hospital care are no longer included.
Vasser 1990, 1991, and 1993 are studies of pre-hospital care and are no longer included.
ICP Thresholds Eisenberg, 1988 is no longer included in this topic.
Eisenberg, 1988 is not included for this topic. This study is a Class 2 study of barbiturates.
Cerebral Perfusion Thresholds
CPP Thresholds was made its own section.
We split monitoring and thresholds into separate sections to clarify the scope and allow for different quality assessment criteria.
Advanced Cerebral Monitoring Thresholds
Name changed and scope clarified.
The name was changed from Brain Oxygen Monitoring in order to accurately reflect that several types of monitoring could be included.
Abbreviations: CPP=cerebral perfusion pressure, CRASH=Corticosteroid Randomization After Significant Head Injury Trial, CSF=cerebrospinal fluid, ICP=intracranial pressure, NA=not applicable, TBI=traumatic brain injury.

210
Appendix B. Research Team
Methods Team Nancy Carney, PhD Oregon Health & Science University, Portland, OR Annette Totten, PhD Oregon Health & Science University, Portland, OR Cindy O'Reilly, BS Oregon Health & Science University, Portland, OR Roger Chou, MD Oregon Health & Science University, Portland, OR Molly Stillwell, MA Oregon Health & Science University, Portland, OR Ngoc Wasson, MPH Oregon Health & Science University, Portland, OR Sandra Assasnik, MA Oregon Health & Science University, Portland, OR
Clinical Investigators Mike Bell, MD University of Pittsburg Medical Center, Pittsburg, PA Susan Bratton, MD University of Utah, Salt Lake City, UT Randy Chesnut, MD University of Washington, Seattle, WA Odette Harris, MD, MPH Stanford University, Stanford, CA Gregory W. J. Hawryluk, University of Utah, Salt Lake City, UT MD, PhD Tex Kissoon, MD University of British Columbia, Vancouver, BC Andres Rubiano, MD El Bosque University, Bogota, Colombia MEDITECH Foundation, Neiva, Colombia Lori Shutter, MD University of Pittsburgh, Pittsburgh, PA Robert Tasker, MBBS, MD Children’s Hospital Boston, Boston, MA Jamie Ullman, MD Hofstra North Shore-LIJ School of Medicine, Hempstead, NY Monica Vavilala, MD University of Washington, Seattle, WA Jack Wilberger, MD Drexel University, Pittsburgh, PA David Wright, MD Emory University, Atlanta, GA Jamshid Ghajar, MD, PhD Stanford University, Stanford, CA

211
Appendix C. Analytic Frameworks Treatments The analytic framework for treatments is presented in Figure 1. The general population is Adults with traumatic brain injury (TBI). For each treatment, the questions are: Q1: Does the treatment affect clinical outcomes, defined as mortality and neurological function? Q2: Does the treatment cause harms? Q3: Does the treatment affect intermediate outcomes? Figure 1.
For Decompressive Craniectomy (DC) as a treatment, the questions are: Q1: Does DC reduce mortality or improve neurological outcomes? Q2: Does DC cause harms? Q3: Does DC lower ICP (an intermediate outcome)? For each question, there may be more specific sub-questions. For DC there is research about the best size of the DC. Similarly, appropriate intermediate outcomes vary according to the treatment and are specified in the text of each treatment section.

212
Monitoring Monitoring provides information that is used to make treatment decisions. As such, monitoring per se does not influence outcomes. Some studies follow the path from monitoring to changes in treatment, then from changes in treatment to outcomes (represented by the line for Q1, analytic framework for monitoring, Figure 2.). This could include instances in which the treatment is controlled as part of the study or in which treatment variables are used to either define the study population or as controls for confounding. Other studies do not examine changes in treatment as a result of monitoring, but go directly from monitoring to outcome. This is depicted as Q4. The “black box” in Q4 indicates that some treatment happened, but the study does not track or consider what treatment was provided or how the ICP information affected treatment. To summarize the questions are: Q1: Does the monitoring affect treatment and ultimately impact clinical outcomes, defined as mortality and neurological function? Q2: Does monitoring lead to treatment that causes harms? Q3: Does monitoring affect the treatment that then affects intermediate outcomes? Q4: Is monitoring associated with changes in outcomes? In this case the impact on treatment is not measured, hence the “black box.” Q5: Does monitoring cause harms?

213
Figure 2.

214
Thresholds Threshold questions ask what values should be targeted or avoided when managing severe TBI. For example, when is intracranial pressure (ICP) high? Or what blood pressure (BP) and cerebral perfusion pressure (CPP) levels are ideal? The studies may be exploratory, in that they strive to identify a value, or they may be confirmatory, striving instead to confirm a previously identified value. While the types of studies used to identify or confirm threshold values differ from studies of interventions, the questions are similar. This is represented in Figure 3. In threshold studies the population is patients with TBI who are monitored. The questions are: Q1: What value is associated with better clinical outcomes? Q2: What value is associated with worse outcomes or harm? Q3: What value is associated with intermediate outcomes? Figure 3.
I O
TBI Guidelines Analytic Framework: Thresholds
Q2
Q3
Q1
Patients with TBI who are monitored
Harms
Intermediate
Outcomes
Value from
Monitoring
Clinical
Outcomes

215
Appendix D. Search Strategies Decompressive Craniotomy
1 exp Craniocerebral Trauma/ 2 ((head or brain$) adj injur$).mp. [mp=title, abstract, original title, name of substance
word, subject heading word, keyword heading word, protocol supplementary concept, unique identifier]
3 1 or 2 4 intracranial hypertension.mp. or exp Intracranial Hypertension/ 5 3 and 4 6 limit 5 to “all adult (19 plus years)” 7 limit 6 to english language 8 su.fs. 9 drain$.mp. 10 cerebrospinal fluid shunts.mp. or exp Cerebrospinal Fluid Shunts/ 11 neurosurgery.mp. or exp Neurosurgery/ 12 shunt$.mp. 13 exp Neurosurgical Procedures/ 14 (craniot$ or craniectom$).mp. [mp=title, abstract, original title, name of substance word,
subject heading word, keyword heading word, protocol supplementary concept, rare disease supplementary concept, unique identifier]
15 8 or 9 or 10 or 11 or 12 or 13 or 14 16 7 and 15 17 limit 16 to yr=”2001 – 2013”
Prophylactic Hypothermia
1 exp Brain Injuries/ 2 hypertherm$.mp. 3 hypotherm$.mp. 4 ((brain or cerebr$) adj3 temperature$).mp. [mp=title, original title, abstract, name of
substance word, subject heading word, unique identifier] 5 2 or 3 or 4 6 1 and 5 7 limit 6 to humans 8 limit 7 to English language 9 7 not 8 10 limit 9 to abstracts 11 8 or 10 12 exp “Outcome and Process Assessment (Health Care)”/ 13 11 and 12 14 limit 11 to clinical trial 15 13 or 14 16 (2006$ or 2007$ or 2008$ or 2009$ or 2010$ or 2011$ or 2012$ or 2013$).ed. 17 15 and 16
216
Hyperosmolar Therapy
1 exp Brain Injuries/ 2 ((brain$ or cerebr$) adj3 (trauma$ or injur$)).mp. 3 1 or 2 4 hyperosmol$.mp. 5 “Osmolar Concentration” 6 saline.mp. or exp Sodium Chloride 7 (hyperton$ adj3 saline).mp. 8 5 and 6 9 4 or 7 or 8 10 3 and 9 11 (2006$ or 2007$ or 2008$ or 2009$ or 2010$ or 2011$ or 2012$ or 2013$).ed. 12 10 and 11
CSF Drainage
1 exp Craniocerebral Trauma/ 2 head injur$.mp. [mp=title, abstract, original title, name of substance word, subject
heading word, keyword heading word, protocol supplementary concept, rare disease supplementary concept, unique identifier]
3 brain injur$.mp. [mp=title, abstract, original title, name of substance word, subject heading word, keyword heading word, protocol supplementary concept, rare disease supplementary concept, unique identifier]
4 1 or 2 or 3 5 lumbar drain$.mp. 6 lumbar shunt$.mp. 7 exp Cerebrospinal Fluid Shunts/ 8 *Drainage/ 9 5 or 6 or 7 or 8 10 4 and 9 11 limit 10 to “all adult (19 plus years)” 12 limit 11 to yr=”1980 –2013”
Hyperventilation
1 exp Craniocerebral Trauma/ 2 exp ISCHEMIA/ 3 exp Jugular Veins/ 4 exp Regional Blood Flow/ 5 exp PERFUSION/ 6 exp HYPERVENTILATION/ 7 2 or 3 or 4 or 5 or 6 8 1 and 7 9 (2006$ or 2007$ or 2008$ or 2009$ or2010$ or 2011$ or 2012$ or 2013$).ed. 10 8 and 9
217
Anesthetics
1 exp Brain Injuries/ 2 cerebral perfusion pressure.mp. [mp=title, original title, abstract, name of substance
word, subject heading word, unique identifier] 3 1 and 2 4 (2006$ or 2007$ or 2008$ or 2009$ or 2010$ or 2011$ or 2012$ or 2013$).ed. 5 3 and 4 6 exp Craniocerebral Trauma/ 7 exp Intracranial Pressure/ 8 exp Intracranial Hypertension/ 9 exp Intracranial Hypotension/ 10 7 or 8 or 9 11 exp ANESTHETICS/ 12 exp BARBITURATES/ 13 exp PROPOFOL/ 14 exp ETOMIDATE/ 15 thiopentol.mp. 16 exp PENTOBARBITAL/ 17 11 or 12 or 13 or 14 or 15 or 16 18 exp ANESTHESIA/ 19 17 or 18 20 6 and 10 and 19 21 propofol infusion syndrome.mp. 22 20 or 21 23 limit 22 to human 24 limit 23 to english language 25 limit 23 to abstracts 26 24 or 25 27 (2006$ or 2007$ or 2008$ or 2009$ or 2010$ or 2011$ or 2012$ or 2013$).ed. 28 26 and 27
Analgesics
1 exp ANALGESICS/ 2 exp “Hypnotics and Sedatives”/ 3 propofol.mp. [mp=title, original title, abstract, name of substance word, subject heading
word, unique identifier] 4 exp phenothiazines/ 5 exp central nervous system depressants/ 6 1 or 2 or 3 or 4 or 5 7 exp Craniocerebral Trauma/ 8 exp “SEVERITY OF ILLNESS INDEX”/ or exp INJURY SEVERITY SCORE/ or exp
TRAUMA SEVERITY INDICES/
218
9 (severe or severity).mp. [mp=title, original title, abstract, name of substance word, subject heading word, unique identifier]
10 exp Intensive Care Unites/ or exp Critical Care/ 11 8 or 9 or 10 12 6 and 7 and 11 13 limit 12 to (english language and humans) 14 (2006$ or 2007$ or 2008$ or 2009$ or 2010$ or 2011$ or 2012$ or 2013$).ed. 15 13 and 14
Barbiturates
1 exp Craniocerebral Trauma/ 2 exp BARBITURATES/ 3 etomidate.mp. 4 pentobarbital.mp. 5 thiopental.mp. 6 2 or 3 or 4 or 5 7 1 and 6 8 exp Intracranial Hypertension/dt [Drug Therapy] 9 6 and 8 10 7 or 9 11 (2006$ or 2007$ or 2008$ or 2009$ or 2010$ or 2011$ or 2012$ or 2013$).ed. 12 10 and 11
Steroids
1 exp Craniocerebral Trauma/ 2 exp STEROIDS/ 3 1 and 2 4 (2006$ or 2007$ or $2008$ or 2009$ or 2010$ or 2011$ or 2012$ or 2013$ ).ed. 5 3 and 4
Nutrition
1 exp Craniocerebral Trauma/ 2 exp nutrition/ 3 1 and 2 4 exp Nutrition Therapy/ 5 1 and 4 6 exp Energy Metabolism/ 7 1 and 6 8 nutritional requirements/ 9 1 and 8 10 exp nutrition assessment/ 11 1 and 10
219
12 exp Craniocerebral Trauma/dh [Diet Therapy] 13 exp Dietary Supplements/ 14 1 and 13 15 exp Craniocerebral Trauma/me [Metabolism] 16 (diet$ or nutrit$).mp. [mp=title, abstract, original title, name of substance word, subject
heading wod, protocol supplementary concept, rare disease supplementary concept, unique identifier]
17 15 and 16 18 7 and 16 19 exp feeding methods/ 20 1 and 19 21 exp vitamins/ 22 1 and 21 23 3 or 5 or 9 or 11 or 12 or 14 or 17 or 18 or 20 or 22 24 limit 23 to human 25 limit 24 to english language 26 24 not 25 27 limit 26 to abstracts 28 25 or 27 29 (2006$ or 2007$ or 2008$ or 2009$ or 2010$ or 2011$ or 2012$ or 2013$).ed. 30 28 or 29
Infection Prophylaxis
1 exp Craniocerebral Trauma/ 2 exp Central Nervous System Infections/ 3 exp Craniocerebral Trauma/co [Complications] 4 exp Central Nervous System Infections/pc [Prevention & Control] 5 2 and 3 6 1 and 4 7 5 or 6 8 1 and 2 9 exp Anti-Infective Agents/ 10 exp Antibiotic Prophylaxis/ 11 9 or 10 12 8 and 11 13 exp Catheterization/ 14 exp Catheters, Indwelling/ 15 exp Ventriculostomy/ 16 exp Cerebrospinal Fluid Shunts/ 17 exp monitoring, physiologic/ and exp intracranial pressure/ 18 13 or 14 or 15 or 16 or 17 19 8 and 18 20 2 and 11 and 18 21 7 or 12 or 19 or 20
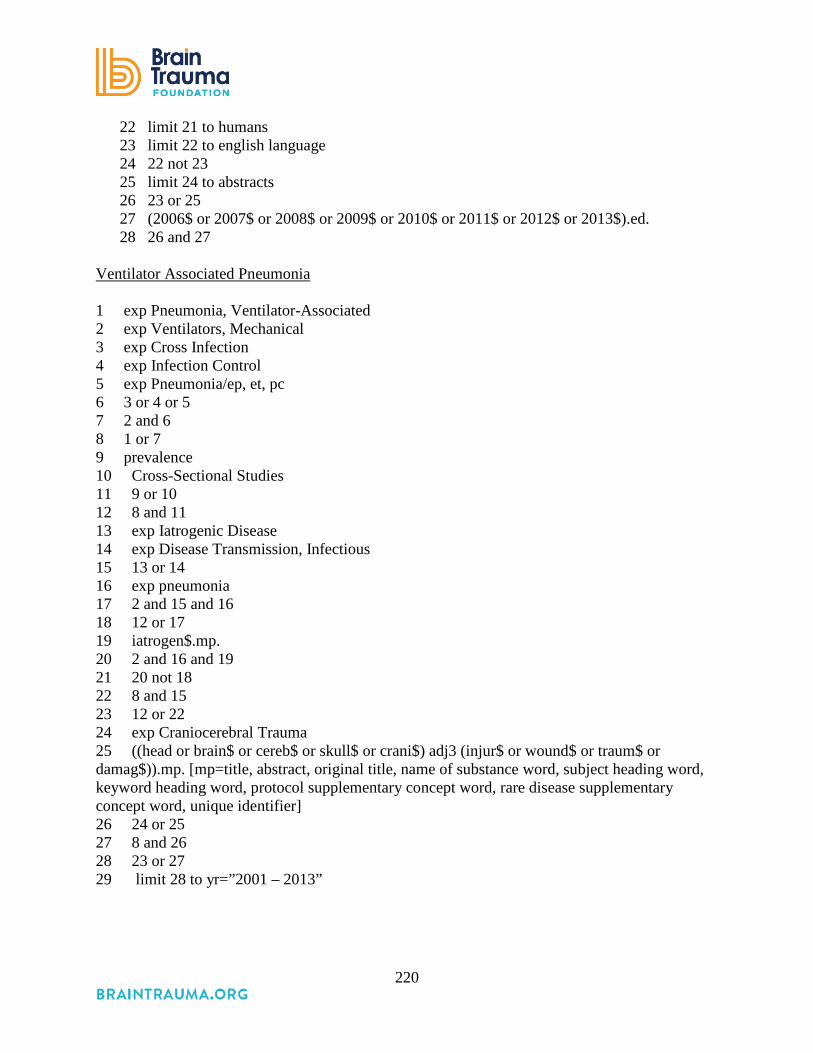
220
22 limit 21 to humans 23 limit 22 to english language 24 22 not 23 25 limit 24 to abstracts 26 23 or 25 27 (2006$ or 2007$ or 2008$ or 2009$ or 2010$ or 2011$ or 2012$ or 2013$).ed. 28 26 and 27
Ventilator Associated Pneumonia 1 exp Pneumonia, Ventilator-Associated 2 exp Ventilators, Mechanical 3 exp Cross Infection 4 exp Infection Control 5 exp Pneumonia/ep, et, pc 6 3 or 4 or 5 7 2 and 6 8 1 or 7 9 prevalence 10 Cross-Sectional Studies 11 9 or 10 12 8 and 11 13 exp Iatrogenic Disease 14 exp Disease Transmission, Infectious 15 13 or 14 16 exp pneumonia 17 2 and 15 and 16 18 12 or 17 19 iatrogen$.mp. 20 2 and 16 and 19 21 20 not 18 22 8 and 15 23 12 or 22 24 exp Craniocerebral Trauma 25 ((head or brain$ or cereb$ or skull$ or crani$) adj3 (injur$ or wound$ or traum$ or damag$)).mp. [mp=title, abstract, original title, name of substance word, subject heading word, keyword heading word, protocol supplementary concept word, rare disease supplementary concept word, unique identifier] 26 24 or 25 27 8 and 26 28 23 or 27 29 limit 28 to yr=”2001 – 2013”

221
Anti-seizure Prophylaxis
1 seizure$.mp. 2 head injur$.mp. 3 1 and 2 4 (2006$ or 2007$ or 2008$ or 2009$ or 2010$ or 2011$ or 2012$ or 2013$).ed. 5 3 and 4
ICP Monitoring
1 exp Craniocerebral Trauma/ 2 exp Intracranial Pressure/ 3 exp Intracranial Hypertension/ 4 1 and 2 5 1 and 3 6 exp Intracranial Pressure/ and exp Monitoring, Physiologic/ 7 1 and 6 8 (2006$ or 2007$ or 2008$ or 2009$ or 2010$ or 2011$ or 2012$ or 2013$).ed. 9 7 and 8
ICP Thresholds
1 (intracranial hypertension or icp or intracranial pressure).mp. 2 head injur$.mp. 3 (treatment or management or resuscitation).mp. 4 (threshold or level).mp. 5 1 and 2 and 3 and 4 6 limit 5 to humans 7 (2006$ or 2007$ or 2008$ or 2009$ or 2010$ or 2011$ or 2012$ or 2013$).ed. 8 6 and 7
Cerebral Perfusion Monitoring and Thresholds
1 exp Brain Injuries/ 2 cerebral perfusion pressure.mp. [mp=title, original title, abstract, name of substance
word, subject heading word, unique identifier] 3 1 and 2 4 (2006$ or 2007$ or 2008$ or 2009$ or 2010$ or 2011$ or 2012$ or 2013$).ed. 5 3 and 4
Brain Oxygen Monitoring and Thresholds
1 exp Craniocerebral Trauma/ 2 exp Craniocerebral Trauma/bl, cf, pa, pp, ra, ri, en, us, ur, me, mi [Blood, Cerebrospinal
Fluid, Pathology, Physiopathology, Radiography, Radionuclide Imaging, Enzymology, Ultrasonography, Urine, Metabolism, Microbiology]

222
3 exp Monitoring, Physiologic/ 4 1 and 3 5 exp Oxygen/ 6 1 and 5 7 limit 6 to humans 8 3 and 7 9 2 and 5 10 9 not 8 11 limit 10 to humans 12 Microdialysis/ 13 1 and 12 14 monitor$.mp. 15 1 and 5 and 14 16 4 or 13 or 15 17 limit 16 to humans 18 17 or 7 19 exp Oxygen Consumption/ 20 1 and 19 21 limit 20 to humans 22 18 or 21 23 limit 22 to “all adult (19 plus years)” 24 limit 23 to (case reports or letter) 25 23 not 24 26 (2006$ or 2007$ or 2008$ or 2009$ or 2010$ or 2011$ or 2012$ or 2013$).ed. 27 25 and 26
Blood Pressure and Oxygenation
1 exp Craniocerebral Trauma/ 2 hypoxia.mp. 3 hypotension.mp. 4 2 or 3 5 1 and 2 6 limit 5 to human 7 (field or pre-hospital).mp. [mp=title, original title, abstract, name of substance word,
subject heading word, unique identifier] 8 (treatment or management or resuscitation).mp. [mp=title, original title, abstract, name
of substance word, subject heading word, unique identifier] 9 1 and 7 and 8 10 6 or 9 11 (2006$ or 2007$ or 2008$ or 2009$ or 2010$ or 2011$ or 2012$ or 2013$).ed. 12 10 and 11

223
Appendix E. Inclusion and Exclusion Criteria
Inclusion Criteria Exclusion Criteria Population (note: population criteria may be relaxed and studies used as indirect evidence if no direct evidence is available. Human subjects Animal or mechanical simulations; not
human subjects 85% of population must be: if more than 15% are: Adults Children Traumatic brain injury, non-penetrating Brain injury not from trauma (e.g., stroke)
or penetrating injury (gun shot, foreign object) or mixed pathology without separation of outcomes
In-hospital Prehospital or outpatient treatment GCS 3-8; or results presented for subgroup with this GCS
GCS>9 with no results presented by GCS subgroups
N≥25 N<25 Interventions Decompressive Craniectomy Studies of type of bone flap replacement Prophylactic Hypothermia Hyperosmolar Therapy Cerebrospinal Fluid Drainage Ventilation Therapy Hyperbaric O2 Anesthetics, Analgesics and Sedatives Steroids Nutrition Infection Prophylaxis Deep Vein Thrombosis Anti-Seizure Prophylaxis ICP Monitoring CPP Monitoring Advanced Cerebral Monitoring Blood Pressure Thresholds ICP Thresholds CPP Thresholds Advanced Cerebral Monitoring Thresholds Comparator/Study Designs Two or more groups defined by differences in intervention (or monitoring or thresholds) and compared on an included outcome
Purely prognostic studies (non-treatment factors that affect outcome) that are not thresholds
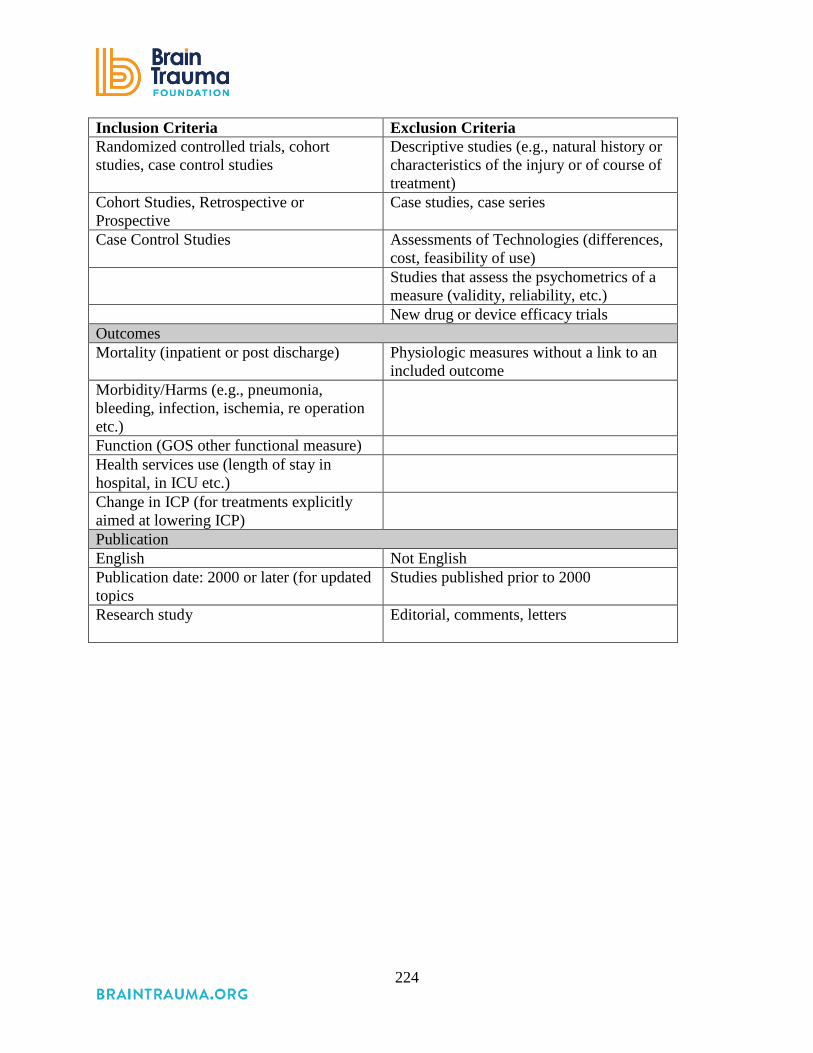
224
Inclusion Criteria Exclusion Criteria Randomized controlled trials, cohort studies, case control studies
Descriptive studies (e.g., natural history or characteristics of the injury or of course of treatment)
Cohort Studies, Retrospective or Prospective
Case studies, case series
Case Control Studies Assessments of Technologies (differences, cost, feasibility of use)
Studies that assess the psychometrics of a measure (validity, reliability, etc.)
New drug or device efficacy trials Outcomes Mortality (inpatient or post discharge) Physiologic measures without a link to an
included outcome Morbidity/Harms (e.g., pneumonia, bleeding, infection, ischemia, re operation etc.)
Function (GOS other functional measure) Health services use (length of stay in hospital, in ICU etc.)
Change in ICP (for treatments explicitly aimed at lowering ICP)
Publication English Not English Publication date: 2000 or later (for updated topics
Studies published prior to 2000
Research study Editorial, comments, letters

225
Appendix F. Excluded Studies
Decompressive Craniotomy 1. Al-Jishi A, Saluja RS, Al-Jehani H, Lamoureux J, Maleki M, Marcoux J. Primary or
secondary decompressive craniectomy: different indication and outcome. Can J Neurol Sci 2011;38(4):612-20.
2. Albanese J, Leone M, Alliez JR, et al. Decompressive craniectomy for severe traumatic brain injury: Evaluation of the effects at one year. Crit Care Med. 2003;31:2535-2538.
3. Aarabi B, Hesdorffer DC, Ahn ES, Aresco C, Scalea TM, Eisenberg HM. Outcome following decompressive craniectomy for malignant swelling due to severe head injury. J Neurosurg. Apr 2006;104:469-479.
4. Bao YH, Liang YM, Gao GY, Pan YH, Luo QZ, Jiang JY. "Bilateral decompressive craniectomy for patients with malignant diffuse brain swelling after severe traumatic brain injury: a 37-case study." J Neurotrauma 2010;27(2):341-347.
5. Chibbaro S, Tacconi L. Role of decompressive craniectomy in the management of severe head injury with refractory cerebral edema and intractable intracranial pressure. Our experience with 48 cases. Surg Neurol 2007;68(6):632-8
6. Daboussi A, Minville V, Leclerc-Foucras S, Geeraerts T, Esquerre JP, Payoux P, Fourcade O. "Cerebral hemodynamic changes in severe head injury patients undergoing decompressive craniectomy. [Erratum appears in J Neurosurg Anesthesiol. 2010 Apr;22(2):157]." J Neurosurg Anesthesiol 2009;21(4):339-45.
7. De Bonis P, Pompucci A, Mangiola A, Paternoster G, Festa R, Nucci CG, et al. Decompressive craniectomy for elderly patients with traumatic brain injury: it's probably not worth the while. J Neurotrauma 2011;28(10):2043-8.
8. Eberle BM, Schnuriger B, Inaba K, Gruen JP, Demetriades D, Belzberg H. Decompressive craniectomy: surgical control of traumatic intracranial hypertension may improve outcome. Injury 2010;41(9):894-8.
9. Faleiro RM, Faleiro LC, Caetano E, et al. "Decompressive craniotomy: prognostic factors and complications in 89 patients." Arq Neuropsiquiatr 2008;66(2B):369-373.
10. Howard JL, Cipolle MD, Anderson M, et al. "Outcome after decompressive craniectomy for the treatment of severe traumatic brain injury." J Trauma 2008;65(2):380-385; discussion 385-386.
11. Kim KT, Park JK, Kang SG, et al. Comparison of the effect of decompressive craniectomy on different neurosurgical diseases. Acta Neurochir 2009;151(1):21-30.
12. Leitgeb J, Erb K, Mauritz W, et al. Severe traumatic brain injury in Austria V: CT findings and surgical management. Wiener Klinische Wochenschrift 2007;119:56-63.
13. Liu B, Tian Y, Zhang Y, Zhang W. Therapeutic effect analysis of acute traumatic brain injuries. Neurological Research 2008;30(6):594-7.
14. Meier U, Lemcke J, Reyer T, Grawe A. "Decompressive craniectomy for severe head injury in patients with major extracranial injuries." Acta Neurochir 2006;Suppl 96:373-376.
15. Morgalla MH, Will BE, Roser F, Tatagiba M. "Do long-term results justify decompressive craniectomy after severe traumatic brain injury?" J Neurosurg 2008;109(4):685-690.
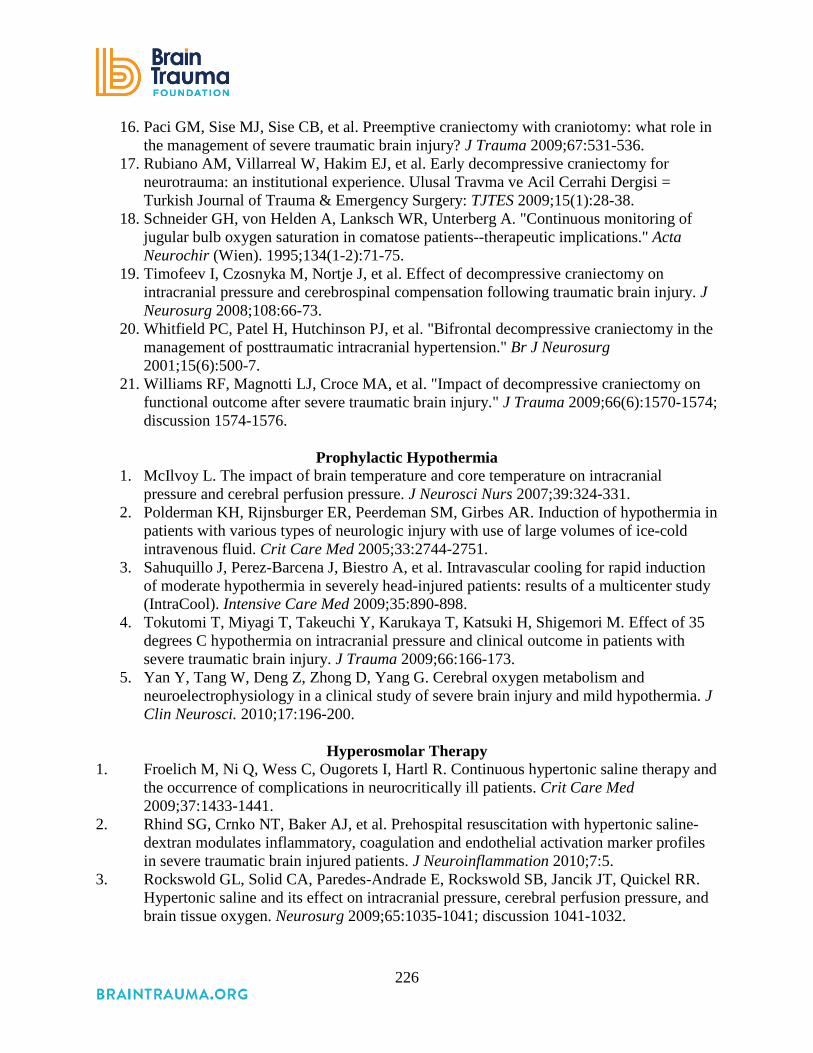
226
16. Paci GM, Sise MJ, Sise CB, et al. Preemptive craniectomy with craniotomy: what role in the management of severe traumatic brain injury? J Trauma 2009;67:531-536.
17. Rubiano AM, Villarreal W, Hakim EJ, et al. Early decompressive craniectomy for neurotrauma: an institutional experience. Ulusal Travma ve Acil Cerrahi Dergisi = Turkish Journal of Trauma & Emergency Surgery: TJTES 2009;15(1):28-38.
18. Schneider GH, von Helden A, Lanksch WR, Unterberg A. "Continuous monitoring of jugular bulb oxygen saturation in comatose patients--therapeutic implications." Acta Neurochir (Wien). 1995;134(1-2):71-75.
19. Timofeev I, Czosnyka M, Nortje J, et al. Effect of decompressive craniectomy on intracranial pressure and cerebrospinal compensation following traumatic brain injury. J Neurosurg 2008;108:66-73.
20. Whitfield PC, Patel H, Hutchinson PJ, et al. "Bifrontal decompressive craniectomy in the management of posttraumatic intracranial hypertension." Br J Neurosurg 2001;15(6):500-7.
21. Williams RF, Magnotti LJ, Croce MA, et al. "Impact of decompressive craniectomy on functional outcome after severe traumatic brain injury." J Trauma 2009;66(6):1570-1574; discussion 1574-1576.
Prophylactic Hypothermia
1. McIlvoy L. The impact of brain temperature and core temperature on intracranial pressure and cerebral perfusion pressure. J Neurosci Nurs 2007;39:324-331.
2. Polderman KH, Rijnsburger ER, Peerdeman SM, Girbes AR. Induction of hypothermia in patients with various types of neurologic injury with use of large volumes of ice-cold intravenous fluid. Crit Care Med 2005;33:2744-2751.
3. Sahuquillo J, Perez-Barcena J, Biestro A, et al. Intravascular cooling for rapid induction of moderate hypothermia in severely head-injured patients: results of a multicenter study (IntraCool). Intensive Care Med 2009;35:890-898.
4. Tokutomi T, Miyagi T, Takeuchi Y, Karukaya T, Katsuki H, Shigemori M. Effect of 35 degrees C hypothermia on intracranial pressure and clinical outcome in patients with severe traumatic brain injury. J Trauma 2009;66:166-173.
5. Yan Y, Tang W, Deng Z, Zhong D, Yang G. Cerebral oxygen metabolism and neuroelectrophysiology in a clinical study of severe brain injury and mild hypothermia. J Clin Neurosci. 2010;17:196-200.
Hyperosmolar Therapy
1. Froelich M, Ni Q, Wess C, Ougorets I, Hartl R. Continuous hypertonic saline therapy and the occurrence of complications in neurocritically ill patients. Crit Care Med 2009;37:1433-1441.
2. Rhind SG, Crnko NT, Baker AJ, et al. Prehospital resuscitation with hypertonic saline-dextran modulates inflammatory, coagulation and endothelial activation marker profiles in severe traumatic brain injured patients. J Neuroinflammation 2010;7:5.
3. Rockswold GL, Solid CA, Paredes-Andrade E, Rockswold SB, Jancik JT, Quickel RR. Hypertonic saline and its effect on intracranial pressure, cerebral perfusion pressure, and brain tissue oxygen. Neurosurg 2009;65:1035-1041; discussion 1041-1032.

227
4. Seo W, Oh H. Alterations in serum osmolality, sodium, and potassium levels after repeated mannitol administration. J Neurosci Nurs 2010;42:201-207.
5. Soustiel JF, Mahamid E, Chistyakov A, Shik V, Benenson R, Zaaroor M. Comparison of moderate hyperventilation and mannitol for control of intracranial pressure control in patients with severe traumatic brain injury--a study of cerebral blood flow and metabolism. Acta Neurochir (Wien). 2006;148:845-851; discussion 851.
Cerebrospinal Fluid Drainage
1. Andrade AF, Paiva WS, Amorim RL, et al. "Continuous ventricular cerebrospinal fluid drainage with intracranial pressure monitoring for management of posttraumatic diffuse brain swelling." Arquivos de Neuro-Psiquiatria 2011;69(1):79-84.
2. Hedges JR, Newgard CD, Veum-Stone J, et al. Early neurosurgical procedures enhance survival in blunt head injury: propensity score analysis. J Emerg Med 2009;37:115-123.
3. Jiao QF, Liu Z, Li S, et al. Influencing factors for posttraumatic hydrocephalus in patients suffering from severe traumatic brain injuries. Chinese J Traumatology 2007;10(3):159-62.
4. Kerr ME, Weber BB, Sereika SM, Wilberger J, Marion DW. Dose response to cerebrospinal fluid drainage on cerebral perfusion in traumatic brain-injured adults. Neurosurg Focus 2001;11(4):E1.
5. Kinoshita K, Sakurai A, Utagawa A, et al. Importance of cerebral perfusion pressure management using cerebrospinal drainage in severe traumatic brain injury. Acta Neurochirurgica - Supplement 2006;96:37-39.
6. Licata C, Cristofori L, Gambin R, Vivenza C, Turazzi S. Post-traumatic hydrocephalus. J Neurosurg Sci 2001;45(3):141-9.
7. Miller MT, Pasquale M, Kurek S, et al. Initial head computed tomographic scan characteristics have a linear relationship with initial intracranial pressure after trauma. J Trauma 2004;56(5):967-72; discussion 972-3.
8. Murad A, Ghostine S, Colohan AR. A case for further investigating the use of controlled lumbar cerebrospinal fluid drainage for the control of intracranial pressure. World Neurosurg 2012;77(1):160-5.
9. Tuettenberg J, Czabanka M, Horn P, et al. Clinical evaluation of the safety and efficacy of lumbar cerebrospinal fluid drainage for the treatment of refractory increased intracranial pressure. J Neurosurg 2009;110(6):1200-8.
10. Yanagawa Y, Sakamoto T. Results of single burr hole drainage for acute subdural hematoma with non-reactive pupil. Turkish Neurosurg 2012;22(2):196-9.
Ventilation Therapies
1. Coles JP, Fryer TD, Coleman MR, et al. Hyperventilation following head injury: effect on ischemic burden and cerebral oxidative metabolism. Crit Care Med 2007;35:568-578.
2. Holloway KL, Barnes T, Choi S, et al. Ventriculostomy infections: the effect of monitoring duration and catheter exchange in 584 patients. J Neurosurg. 1996;85:419-424.
3. Lee SW, Hong YS, Han C, et al. Concordance of end-tidal carbon dioxide and arterial carbon dioxide in severe traumatic brain injury. J Trauma 2009;67:526-530.

228
4. Zhang XY, Yang ZJ, Wang QX, Fan HR. Impact of positive end-expiratory pressure on cerebral injury patients with hypoxemia. Am J Emerg Med 2011;29(7):699-703.
Anesthetics, Analgesics, and Sedatives 1. Cordato DJ, Herkes GK, Mather LE, Morgan MK. Barbiturates for acute neurological and
neurosurgical emergencies--do they still have a role? J Clin Neurosci 2003;10:283-288. 2. Grathwohl KW, Black IH, Spinella PC, et al. Total intravenous anesthesia including
ketamine versus volatile gas anesthesia for combat-related operative traumatic brain injury. ANES 2008;109:44-53.
3. James ML, Olson DM, Graffagnino C. A pilot study of cerebral and haemodynamic physiological changes during sedation with dexmedetomidine or propofol in patients with acute brain injury. Anaesth Intensive Care. 2012;40:949-957.
4. Marshall GT, James RF, Landman MP, et al. Pentobarbital coma for refractory intra-cranial hypertension after severe traumatic brain injury: mortality predictions and one-year outcomes in 55 patients. J Trauma 2010;69:275-283.
5. Smith H, Sinson G, Varelas P. Vasopressors and propofol infusion syndrome in severe head trauma. Neurocrit Care 2009;10:166-172.
Steroids 1. Asehnoune K, Roquilly A, Sebille V, Corti TCtg. Corticotherapy for traumatic brain-
injured patients--the Corti-TC trial: study protocol for a randomized controlled trial. Trials [Electronic Resource] 2011;12:228.
2. Bernard F, Outtrim J, Lynch AG, Menon DK, Matta BF. Hemodynamic steroid responsiveness is predictive of neurological outcome after traumatic brain injury. Neurocrit Care 2006;5:176-179.
3. Czekajlo MS, Milbrandt EB. Corticosteroids increased short and long-term mortality in adults with traumatic head injury. Crit Care (London, England) 2005;9:E21.
Nutrition
1. Bochicchio GV, Bochicchio K, Nehman S, Casey C, Andrews P, Scalea TM. Tolerance and efficacy of enteral nutrition in traumatic brain-injured patients induced into barbiturate coma. Jpen 2006;30:503-506.
2. Chiang YH, Chao DP, Chu SF, et al. Early enteral nutrition and clinical outcomes of severe traumatic brain injury patients in acute stage: a multi-center cohort study. J Neurotrauma 2012;29(1):75-80.
3. Dickerson RN, Mitchell JN, Morgan LM, et al. Disparate response to metoclopramide therapy for gastric feeding intolerance in trauma patients with and without traumatic brain injury. Jpen 2009;33:646-655.
4. Kanji S, Jones E, Goddard R, Meggison HE, Neilipovitz D. Efficiency and safety of a standardized protocol for intravenous insulin therapy in ICU patients with neurovascular or head injury. Neurocrit Care 2010;12:43-49.
5. Khorana J, Rerkasem K, Apichartpiyakul C, et al. Immunonutrition and cytokine response in patients with head injury. J Med Assoc Thai 2009;92:188-194.

229
6. Krakau K, Hansson A, Karlsson T, de Boussard CN, Tengvar C, Borg J. Nutritional treatment of patients with severe traumatic brain injury during the first six months after injury. Nutrition 2007;23:308-317.
7. Liu-DeRyke X, Collingridge DS, Orme J, Roller D, Zurasky J, Rhoney DH. Clinical impact of early hyperglycemia during acute phase of traumatic brain injury. Neurocrit Care 2009;11:151-157.
8. McEvoy CT, Cran GW, Cooke SR, Young IS. Resting energy expenditure in non-ventilated, non-sedated patients recovering from serious traumatic brain injury: comparison of prediction equations with indirect calorimetry values. Clin Nutr 2009;28:526-532.
9. Meier R, Bechir M, Ludwig S, et al. Differential temporal profile of lowered blood glucose levels (3.5 to 6.5 mmol/l versus 5 to 8 mmol/l) in patients with severe traumatic brain injury. Crit Care (London, England) 2008;12:R98.
10. Pinto TF, Rocha R, Paula CA, de Jesus RP. Tolerance to enteral nutrition therapy in traumatic brain injury patients. Brain Injury 2012;26(9):1113-7.
11. Zarbock SD, Steinke D, Hatton J, Magnuson B, Smith KM, Cook AM. Successful enteral nutritional support in the neurocritical care unit. Neurocrit Care 2008;9:210-216.
Infection Prophylaxis
1. Flibotte JJ, Lee KE, Koroshetz WJ, Rosand J, McDonald CT. Continuous antibiotic prophylaxis and cerebral spinal fluid infection in patients with intracranial pressure monitors. Neurocrit Care 2004;1:61-68.
2. Friedman JA, Ebersold MJ, Quast LM. Persistent posttraumatic cerebrospinal fluid leakage. Neurosurg Focus 2000;9:e1.
3. Holeckova K, Kolenova A, Lesnakova A, et al: Bacterial meningitis after craniocerebral trauma in the community. Neuro Endocrinol Lett 2007;28 Suppl 3:2-13.
4. Hui X, Haider AH, Hashmi ZG, et al: Increased risk of pneumonia among ventilated patients with traumatic brain injury: every day counts! J Surg Res 2013;184:438-443.
5. Leung GK, Ng KB, Taw BB, Fan YW. Extended subcutaneous tunnelling technique for external ventricular drainage. Br J Neurosurg 2007;21:359-364.
6. May AK, Fleming SB, Carpenter RO, et al. Influence of broad-spectrum antibiotic prophylaxis on intracranial pressure monitor infections and subsequent infectious complications in head-injured patients. Surg Infect 2006;7:409-417.
7. McCarthy PJ, Patil S, Conrad SA, Scott LK. International and specialty trends in the use of prophylactic antibiotics to prevent infectious complications after insertion of external ventricular drainage devices. Neurocrit Care 2010;12:220-224.
Deep Vein Thrombosis
1. Arnold JD, Dart BW, Barker DE, et al. Gold Medal Forum Winner. Unfractionated heparin three times a day versus enoxaparin in the prevention of deep vein thrombosis in trauma patients. American Surgeon. 2010;76:563-570.
2. Carlile MC, Yablon SA, Mysiw WJ, Frol AB, Lo D, Diaz-Arrastia R. Deep venous thrombosis management following traumatic brain injury: a practice survey of the traumatic brain injury model systems. J Head Trauma Rehab. 2006;21:483-490.

230
3. Denson K, Morgan D, Cunningham R, et al. Incidence of venous thromboembolism in patients with traumatic brain injury. Am J Surg. 2007;193:380-383; discussion 383-384.
4. Depew AJ, Hu CK, Nguyen AC, Driessen N. Thromboembolic prophylaxis in blunt traumatic intracranial hemorrhage: a retrospective review. Am Surg. 2008;74:906-911.
5. Dudley RR, Aziz I, Bonnici A, et al. Early venous thromboembolic event prophylaxis in traumatic brain injury with low-molecular-weight heparin: risks and benefits. J Neurotrauma. 2010;27:2165-2172.
6. Ekeh AP, Dominguez KM, Markert RJ, McCarthy MC. Incidence and risk factors for deep venous thrombosis after moderate and severe brain injury. J Trauma 2010;68:912-915.
7. Foreman PM, Schmalz PG, Griessenauer CJ. Chemoprophylaxis for venous thromboembolism in traumatic brain injury: a review and evidence-based protocol. Clin Neurol Neurosurg. 2014;123:109-116.
8. Gearhart MM, Luchette FA, Proctor MC, et al. The risk assessment profile score identifies trauma patients at risk for deep vein thrombosis. Surgery. 2000;128:631-640.
9. Knudson MM, Ikossi DG, Khaw L, Morabito D, Speetzen LS. Thromboembolism after trauma: an analysis of 1602 episodes from the American College of Surgeons National Trauma Data Bank. Ann Surg. 2004;240:490-496; discussion 496-498.
10. Koehler DM, Shipman J, Davidson MA, Guillamondegui O. Is early venous thromboembolism prophylaxis safe in trauma patients with intracranial hemorrhage. J Trauma 2011;70(2):324-9.
11. Kurtoglu M, Yanar H, Bilsel Y, et al. Venous thromboembolism prophylaxis after head and spinal trauma: intermittent pneumatic compression devices versus low molecular weight heparin. World J Surg. 2004;28:807-811.
12. Latronico N, Berardino M. Thromboembolic prophylaxis in head trauma and multiple-trauma patients. Minerva Anestesiol. 2008;74:543-548.
13. Minshall CT, Eriksson EA, Leon SM, Doben AR, McKinzie BP, Fakhry SM. Safety and efficacy of heparin or enoxaparin prophylaxis in blunt trauma patients with a head abbreviated injury severity score >2. J Trauma 2011;71(2):396-9; discussion 399-400.
14. Norwood SH, Berne JD, Rowe SA, Villarreal DH, Ledlie JT. Early venous thromboembolism prophylaxis with enoxaparin in patients with blunt traumatic brain injury. J Trauma. 2008;65:1021-1026; discussion 1026-1027.
15. Reiff DA, Haricharan RN, Bullington NM, Griffin RL, McGwin G, Jr., Rue LW, 3rd. Traumatic brain injury is associated with the development of deep vein thrombosis independent of pharmacological prophylaxis. J Trauma 2009;66:1436-1440.
16. Saadeh Y, Gohil K, Bill C, et al. Chemical venous thromboembolic prophylaxis is safe and effective for patients with traumatic brain injury when started 24 hours after the absence of hemorrhage progression on head CT. J Trauma Acute Care Surg 2012;73(2):426-30.
Anti-seizure Prophylaxis
1. Anderson GD, Temkin NR, Awan AB, Winn HR. Effect of time, injury, age and ethanol on interpatient variability in valproic acid pharmacokinetics after traumatic brain injury.[Erratum appears in Clin Pharmacokinet. 2007;46(5):447 Note: Winn, Richard H [corrected to Winn, H Richard]]. Clinical Pharmacokinetics 2007;46:307-318.
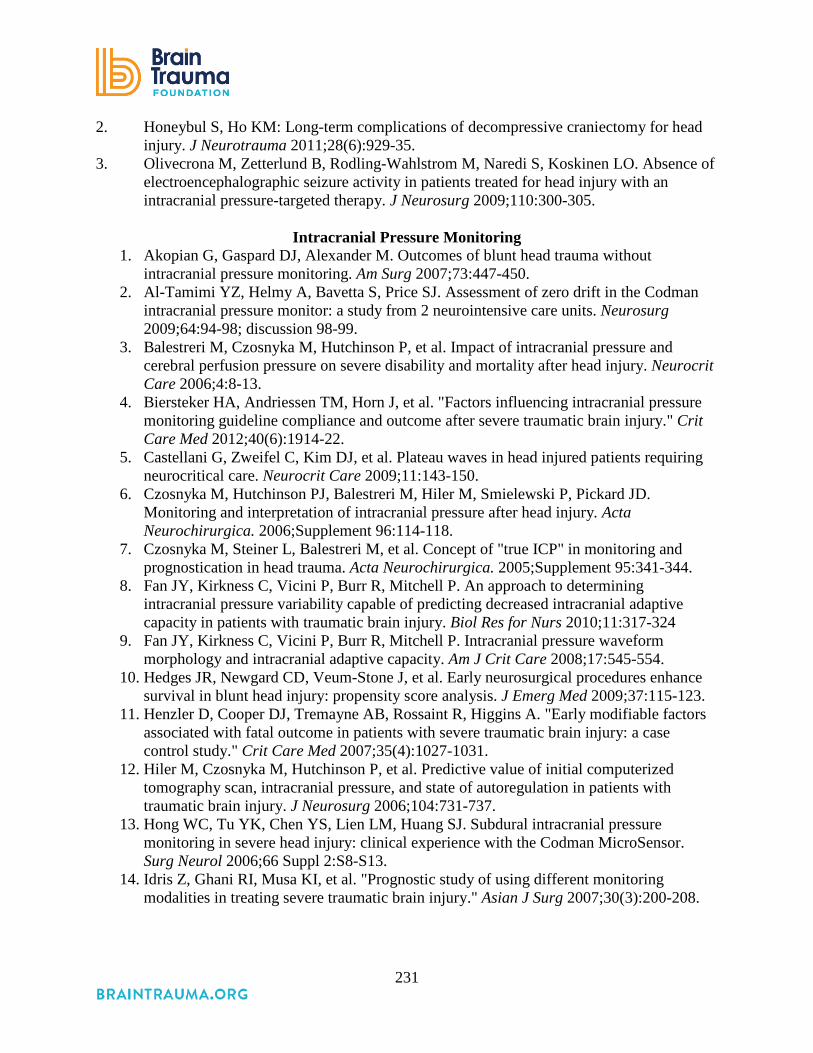
231
2. Honeybul S, Ho KM: Long-term complications of decompressive craniectomy for head injury. J Neurotrauma 2011;28(6):929-35.
3. Olivecrona M, Zetterlund B, Rodling-Wahlstrom M, Naredi S, Koskinen LO. Absence of electroencephalographic seizure activity in patients treated for head injury with an intracranial pressure-targeted therapy. J Neurosurg 2009;110:300-305.
Intracranial Pressure Monitoring
1. Akopian G, Gaspard DJ, Alexander M. Outcomes of blunt head trauma without intracranial pressure monitoring. Am Surg 2007;73:447-450.
2. Al-Tamimi YZ, Helmy A, Bavetta S, Price SJ. Assessment of zero drift in the Codman intracranial pressure monitor: a study from 2 neurointensive care units. Neurosurg 2009;64:94-98; discussion 98-99.
3. Balestreri M, Czosnyka M, Hutchinson P, et al. Impact of intracranial pressure and cerebral perfusion pressure on severe disability and mortality after head injury. Neurocrit Care 2006;4:8-13.
4. Biersteker HA, Andriessen TM, Horn J, et al. "Factors influencing intracranial pressure monitoring guideline compliance and outcome after severe traumatic brain injury." Crit Care Med 2012;40(6):1914-22.
5. Castellani G, Zweifel C, Kim DJ, et al. Plateau waves in head injured patients requiring neurocritical care. Neurocrit Care 2009;11:143-150.
6. Czosnyka M, Hutchinson PJ, Balestreri M, Hiler M, Smielewski P, Pickard JD. Monitoring and interpretation of intracranial pressure after head injury. Acta Neurochirurgica. 2006;Supplement 96:114-118.
7. Czosnyka M, Steiner L, Balestreri M, et al. Concept of "true ICP" in monitoring and prognostication in head trauma. Acta Neurochirurgica. 2005;Supplement 95:341-344.
8. Fan JY, Kirkness C, Vicini P, Burr R, Mitchell P. An approach to determining intracranial pressure variability capable of predicting decreased intracranial adaptive capacity in patients with traumatic brain injury. Biol Res for Nurs 2010;11:317-324
9. Fan JY, Kirkness C, Vicini P, Burr R, Mitchell P. Intracranial pressure waveform morphology and intracranial adaptive capacity. Am J Crit Care 2008;17:545-554.
10. Hedges JR, Newgard CD, Veum-Stone J, et al. Early neurosurgical procedures enhance survival in blunt head injury: propensity score analysis. J Emerg Med 2009;37:115-123.
11. Henzler D, Cooper DJ, Tremayne AB, Rossaint R, Higgins A. "Early modifiable factors associated with fatal outcome in patients with severe traumatic brain injury: a case control study." Crit Care Med 2007;35(4):1027-1031.
12. Hiler M, Czosnyka M, Hutchinson P, et al. Predictive value of initial computerized tomography scan, intracranial pressure, and state of autoregulation in patients with traumatic brain injury. J Neurosurg 2006;104:731-737.
13. Hong WC, Tu YK, Chen YS, Lien LM, Huang SJ. Subdural intracranial pressure monitoring in severe head injury: clinical experience with the Codman MicroSensor. Surg Neurol 2006;66 Suppl 2:S8-S13.
14. Idris Z, Ghani RI, Musa KI, et al. "Prognostic study of using different monitoring modalities in treating severe traumatic brain injury." Asian J Surg 2007;30(3):200-208.

232
15. Imperiale C, Magni G, Favaro R, Rosa G. Intracranial pressure monitoring during percutaneous tracheostomy "percutwist" in critically ill neurosurgery patients. Anesth Analg 2009;108:588-592.
16. Kahraman S, Dutton RP, Hu P, et al. Heart rate and pulse pressure variability are associated with intractable intracranial hypertension after severe traumatic brain injury. J Neurosurg Anesthesiol 2010;22:296-302.
17. Kahraman S, Dutton RP, Hu P, et al. Automated measurement of "pressure times time dose" of intracranial hypertension best predicts outcome after severe traumatic brain injury. J Trauma 2010;69:110-118.
18. Kasotakis G, Michailidou M, Bramos A, et al. "Intraparenchymal vs extracranial ventricular drain intracranial pressure monitors in traumatic brain injury: less is more?" JACS 2012;214(6):950-7.
19. Kirkness CJ, Burr RL, Mitchell PH. Intracranial pressure variability and long-term outcome following traumatic brain injury. Acta Neurochirurgica. 2008;Supplement 102:105-108.
20. Leitgeb J, Erb K, Mauritz W, et al. Severe traumatic brain injury in Austria V: CT findings and surgical management. Wiener Klinische Wochenschrift 2007;119:56-63.
21. Mauritz W, Janciak I, Wilbacher I, Rusnak M, T.B.I.S.I. Australian Severe. "Severe traumatic brain injury in Austria IV: intensive care management." Wiener Klinische Wochenschrift 2007;119(1-2):46-55.
22. Mowery NT, Norris PR, Riordan W, Jenkins JM, Williams AE, Morris JA, Jr. Cardiac uncoupling and heart rate variability are associated with intracranial hypertension and mortality: a study of 145 trauma patients with continuous monitoring. J Trauma 2008;65:621-627.
23. Olivecrona M, Rodling-Wahlstrom M, Naredi S, Koskinen LO. "Prostacyclin treatment and clinical outcome in severe traumatic brain injury patients managed with an ICP-targeted therapy: a prospective study." Brain Inj. 2012;26(1):67-75.
24. Olson DM, Bader MK, Dennis C, Mahanes D, Riemen K. Multicenter pilot study: safety of automated chest percussion in patients at risk for intracranial hypertension. J Neurosci Nurs 2010;42:119-127
25. Roustan JP, Neveu D, Falquet Y, Barral L, Chardon P, Capdevila X. A new index derived from the cerebrovascular pressure transmission and correlated with consciousness recovery in severely head-injured intensive care patients. Anesth Analg 2009;109:1883-1891.
26. Santhanam R, Pillai SV, Kolluri SV, Rao UM. Intensive care management of head injury patients without routine intracranial pressure monitoring. Neurol India 2007;55:349-354.
27. Thompson HJ, Rivara FP, Jurkovich GH, Wang J, Nathens AB, MacKenzie EJ. "Evaluation of the effect of intensity of care on mortality after traumatic brain injury." Crit Care Med 2008;36(1):282-290.
28. Vik A, Nag T, Fredriksli OA, et al. Relationship of "dose" of intracranial hypertension to outcome in severe traumatic brain injury. J Neurosurg 2008;109:678-684.
29. Zanier ER, Ortolano F, Ghisoni L, Colombo A, Losappio S, Stocchetti N. "Intracranial pressure monitoring in intensive care: clinical advantages of a computerized system over manual recording." Crit Care (London, England) 2007;11(1):R7.

233
30. Zeng T, Gao L. Management of patients with severe traumatic brain injury guided by intraventricular intracranial pressure monitoring: a report of 136 cases. Chin J Traumatol 2010;13(3):146-51.
Cerebral Perfusion Pressure Monitoring & Thresholds
1. Aries MJ, Czosnyka M, Budohoski KP, et al. Continuous determination of optimal cerebral perfusion pressure in traumatic brain injury. Crit Care Med 2012;40(8):2456-63.
2. Jaeger M, Dengl M, Meixensberger J, Schuhmann MU. Effects of cerebrovascular pressure reactivity-guided optimization of cerebral perfusion pressure on brain tissue oxygenation after traumatic brain injury. Crit Care Medicine 2010;38:1343-1347.
3. Kirkness CJ, Burr RL, Cain KC, Newell DW, Mitchell PH. Effect of continuous display of cerebral perfusion pressure on outcomes in patients with traumatic brain injury. Am J Crit Care 2006;15:600-609; quiz 610.
4. Kirkness CJ, Burr RL, Cain KC, Newell DW, Mitchell PH. Relationship of cerebral perfusion pressure levels to outcome in traumatic brain injury. Acta Neurochirurgica. 2005;Supplement 95:13-16.
5. Marmarou A, Saad A, Aygok G, Rigsbee M. Contribution of raised ICP and hypotension to CPP reduction in severe brain injury: correlation to outcome. Acta Neurochirurgica. 2005;Supplement 95:277-280.
Advanced Cerebral Monitoring & Thresholds
1. Adamides AA, Cooper DJ, Rosenfeldt FL, et al. Focal cerebral oxygenation and neurological outcome with or without brain tissue oxygen-guided therapy in patients with traumatic brain injury. Acta Neurochirurgica 2009;151:1399-1409.
2. Adamides AA, Rosenfeldt FL, Winter CD, et al. Brain tissue lactate elevations predict episodes of intracranial hypertension in patients with traumatic brain injury. JACS 2009;209:531-539.
3. Amantini A, Fossi S, Grippo A, et al. Continuous EEG-SEP monitoring in severe brain injury. Neurophysiol Clin. 2009;39:85-93.
4. Ang BT, Wong J, Lee KK, Wang E, Ng I. Temporal changes in cerebral tissue oxygenation with cerebrovascular pressure reactivity in severe traumatic brain injury. J Neurol Neurosurg Psychiatry 2007;78:298-302.
5. Asher SR, Curry P, Sharma D, et al. "Survival advantage and PaO2 threshold in severe traumatic brain injury." J Neurosurg Anesth 2013;25(2):168-173.
6. Bekar A, Taskapilioglu O, Yilmazlar S, Ender K, Aksoy K. Is supratentorial pressure difference clinically relevant? Analysis of 55 consecutive cases by bilateral intracranial pressure monitoring. Neurol Res 2008;30:465-470.
7. Belli A, Sen J, Petzold A, Russo S, Kitchen N, Smith M. Metabolic failure precedes intracranial pressure rises in traumatic brain injury: a microdialysis study. Acta Neurochirurgica 2008;150:461-469; discussion 470.
8. Chan MT, Ng SC, Lam JM, Poon WS, Gin T. Re-defining the ischemic threshold for jugular venous oxygen saturation--a microdialysis study in patients with severe head injury. Acta Neurochirurgica. 2005;Supplement 95:63-66.

234
9. Chan TV, Ng SC, Lam JM, Poon WS, Gin T. Monitoring of autoregulation using intracerebral microdialysis in patients with severe head injury. Acta Neurochirurgica. 2005;Supplement 95:113-116.
10. Chiang MF, Chiu WT, Lin FJ, Thajeb P, Huang CJ, Tsai SH. Multiparametric analysis of cerebral substrates and nitric oxide delivery in cerebrospinal fluid in patients with intracerebral haemorrhage: correlation with hemodynamics and outcome. Acta Neurochirurgica 2006;148(6):615-21; dicussion 621.
11. Czosnyka M, Smielewski P, Lavinio A, Pickard JD, Panerai R. An assessment of dynamic autoregulation from spontaneous fluctuations of cerebral blood flow velocity: a comparison of two models, index of autoregulation and mean flow index. Anesth Analg 2008;106:234-239.
12. Gallagher CN, Carpenter KL, Grice P, et al. The human brain utilizes lactate via the tricarboxylic acid cycle: a 13C-labelled microdialysis and high-resolution nuclear magnetic resonance study. Brain 2009;132:2839-2849.
13. Hartings JA, Strong AJ, Fabricius M, et al. Spreading depolarizations and late secondary insults after traumatic brain injury. J Neurotrauma 2009;26:1857-1866.
14. Hlatky R, Valadka AB, Gopinath SP, Robertson CS. Brain tissue oxygen tension response to induced hyperoxia reduced in hypoperfused brain. J Neurosurg 2008;108:53-58.
15. Holbein M, Bechir M, Ludwig S, et al. Differential influence of arterial blood glucose on cerebral metabolism following severe traumatic brain injury. Crit Care (London, England) 2009;13:R13.
16. Idris Z, Ghani RI, Musa KI, et al. "Prognostic study of using different monitoring modalities in treating severe traumatic brain injury." Asian J Surg 2007;30(3):200-208.
17. Jaeger M, Schuhmann MU, Soehle M, Meixensberger J. Continuous assessment of cerebrovascular autoregulation after traumatic brain injury using brain tissue oxygen pressure reactivity. Crit Care Med 2006;34:1783-1788.
18. Jaeger M, Dengl M, Meixensberger J, Schuhmann MU. Effects of cerebrovascular pressure reactivity-guided optimization of cerebral perfusion pressure on brain tissue oxygenation after traumatic brain injury. Crit Care Med. 2010;38:1343-1347.
19. Lewis PM, Smielewski P, Pickard JD, Czosnyka M. Dynamic cerebral autoregulation: should intracranial pressure be taken into account? Acta Neurochirurgica 2007;149:549-555; discussion 555.
20. Li AL, Zhi DS, Wang Q, Huang HL. Extracellular glycerol in patients with severe traumatic brain injury. Chin J Traumatol 2008;11:84-88.
21. Longhi L, Pagan F, Valeriani V, et al. Monitoring brain tissue oxygen tension in brain-injured patients reveals hypoxic episodes in normal-appearing and in peri-focal tissue. Intensive Care Med 2007;33:2136-2142.
22. Low D, Kuralmani V, Ng SK, Lee KK, Ng I, Ang BT. Prediction of outcome utilizing both physiological and biochemical parameters in severe head injury. J Neurotrauma 2009;26:1177-1182.
23. Oddo M, Nduom E, Frangos S, et al. Acute lung injury is an independent risk factor for brain hypoxia after severe traumatic brain injury. Neurosurg 2010;67(2):338-44.

235
24. Oddo M, Levine JM, Mackenzie L, et al. Brain hypoxia is associated with short-term outcome after severe traumatic brain injury independently of intracranial hypertension and low cerebral perfusion pressure. Neurosurg 2011;69(5):1037-45; discussion 1045.
25. Poca MA, Sahuquillo J, Vilalta A, Garnacho A. Lack of utility of arteriojugular venous differences of lactate as a reliable indicator of increased brain anaerobic metabolism in traumatic brain injury. J Neurosurg 2007;106:530-537.
26. Ponce LL, Pillai S, Cruz J, et al. "Position of probe determines prognostic information of brain tissue PO2 in severe traumatic brain injury." Neurosurg. 2012;70(6):1492-502; discussion 1502-3.
27. Poon WS, Ng SC, Chan MT, Lam JM, Lam WW. Cerebral blood flow (CBF)-directed management of ventilated head-injured patients. Acta Neurochirurgica. 2005;Supplement 95:9-11.
28. Radolovich DK, Czosnyka M, Timofeev I, et al. Reactivity of brain tissue oxygen to change in cerebral perfusion pressure in head injured patients. Neurocrit Care 2009;10:274-279.
29. Rangel-Castilla L, Lara LR, Gopinath S, Swank PR, Valadka A, Robertson C. Cerebral hemodynamic effects of acute hyperoxia and hyperventilation after severe traumatic brain injury. J Neurotrauma 2010;27(10):1853-63.
30. Reinert M, Andres RH, Fuhrer M, Muller A, Schaller B, Widmer H. Online correlation of spontaneous arterial and intracranial pressure fluctuations in patients with diffuse severe head injury. Neurol Res 2007;29:455-462.
31. Rosenthal G, Hemphill JC, Sorani M, et al. The role of lung function in brain tissue oxygenation following traumatic brain injury. J Neurosurg 2008;108:59-65.
32. Schlosser HG, Lindemann JN, Vajkoczy P, Clarke AH. Vestibulo-ocular monitoring as a predictor of outcome after severe traumatic brain injury. Crit Care (London, England) 2009;13:R192.
33. Schmidt B, Bocklisch SF, Passler M, Czosnyka M, Schwarze JJ, Klingelhofer J. Fuzzy pattern classification of hemodynamic data can be used to determine noninvasive intracranial pressure. Acta Neurochirurgica. 2005;Supplement 95:345-349.
34. Schneider GH, von Helden A, Lanksch WR, Unterberg A. Continuous monitoring of jugular bulb oxygen saturation in comatose patients--therapeutic implications. Acta Neurochir (Wien). 1995;134:71-75.
35. Smielewski P, Lavinio A, Timofeev I, et al. ICM+, a flexible platform for investigations of cerebrospinal dynamics in clinical practice. Acta Neurochirurgica. 2008;Supplement 102:145-151.
36. Smith ML, Counelis GJ, Maloney-Wilensky E, Stiefel MF, Donley K, LeRoux PD. Brain tissue oxygen tension in clinical brain death: a case series. Neurol Res 2007;29:755-759.
37. Sorani MD, Morabito D, Rosenthal G, Giacomini KM, Manley GT. Characterizing the dose-response relationship between mannitol and intracranial pressure in traumatic brain injury patients using a high-frequency physiological data collection system. J Neurotrauma 2008;25:291-298.
38. Soustiel JF, Sviri GE. Monitoring of cerebral metabolism: non-ischemic impairment of oxidative metabolism following severe traumatic brain injury. Neurol Res 2007;29:654-660.

236
39. Stein DM, Hu PF, Brenner M, et al. Brief episodes of intracranial hypertension and cerebral hypoperfusion are associated with poor functional outcome after severe traumatic brain injury. J Trauma 2011;71(2):364-73; discussion 373-4.
40. Stuart RM, Schmidt M, Kurtz P, et al. Intracranial multimodal monitoring for acute brain injury: a single institution review of current practices. Neurocrit Care 2010;12:188-198.
41. Tolias CM, Reinert M, Seiler R, Gilman C, Scharf A, Bullock MR. Normobaric hyperoxia--induced improvement in cerebral metabolism and reduction in intracranial pressure in patients with severe head injury: a prospective historical cohort-matched study. J Neurosurg. 2004;101:435-444.
42. Zanier ER, Ortolano F, Ghisoni L, Colombo A, Losappio S, Stocchetti N. Intracranial pressure monitoring in intensive care: clinical advantages of a computerized system over manual recording. Crit Care (London, England). 2007;11:R7.
Blood Pressure Thresholds
1. Davis DP, Meade W, Sise MJ, et al. Both hypoxemia and extreme hyperoxemia may be detrimental in patients with severe traumatic brain injury. J Neurotrauma 2009;26:2217-2223.
2. Kanji S, Jones E, Goddard R, Meggison HE, Neilipovitz D. Efficiency and safety of a standardized protocol for intravenous insulin therapy in ICU patients with neurovascular or head injury. Neurocrit Care 2010;12:43-49.
3. Lenartova L, Janciak I, Wilbacher I, Rusnak M, Mauritz W, Austrian Severe TBISI. Severe traumatic brain injury in Austria III: prehospital status and treatment. Wiener Klinische Wochenschrift 2007;119:35-45.
4. Nicholls TP, Shoemaker WC, Wo CC, Gruen JP, Amar A, Dang AB. Survival, hemodynamics, and tissue oxygenation after head trauma. JACS 2006;202:120-130.
5. Warner KJ, Cuschieri J, Copass MK, Jurkovich GJ, Bulger EM. The impact of prehospital ventilation on outcome after severe traumatic brain injury. J Trauma 2007;62:1330-1336; discussion 1336-1338.
Intracranial Pressure Thresholds
1. Badri S, Chen J, Barber J, et al. Mortality and long-term functional outcome associated with intracranial pressure after traumatic brain injury. Intensive Care Med 2012;38:1800-1809.
2. Egea-Guerrero JJ, Gordillo-Escobar E, Revuelto-Rey J, et al. Clinical variables and neuromonitoring information (intracranial pressure and brain tissue oxygenation) as predictors of brain-death development after severe traumatic brain injury. Transplantation Proceedings 2012;44:2050-2052.
3. Hamilton R, Xu P, Asgari S, et al. Forecasting intracranial pressure elevation using pulse waveform morphology. Conference Proceedings: Annual International Conference of the IEEE Engineering in Medicine & Biology Society 2009:4331-4334.
4. Marmarou A, Saad A, Aygok G, Rigsbee M. Contribution of raised ICP and hypotension to CPP reduction in severe brain injury: correlation to outcome. Acta Neurochirurgica. 2005;Supplement 95:277-280.

237
5. Stein DM, Hu PF, Brenner M, et al. Brief episodes of intracranial hypertension and cerebral hypoperfusion are associated with poor functional outcome after severe traumatic brain injury. J Trauma 2011;71(2):364-73; discussion 373-4.
3rd Edition Class 3 Excluded Studies
Topic Study Reason
Hyperosmolar Becker and Vries 1972 Descriptive
Hyperosmolar James 1980 Descriptive
Hyperosmolar Marshall 1978 Descriptive
Hyperosmolar Mendelow 1985 Descriptive
Hyperosmolar Miller 1975 Descriptive
Hyperosmolar Muizelaar 1984 Descriptive
Ventilation Bouma 1992 Case Series
Ventilation Marion 1991 Case Series
Ventilation Sioutos 1995 Case Series
Ventilation Sheinberg 1992 Case Series
Ventilation Imberti 2002 Case Series
Ventilation Oertel 2002 Case Series
Nutrition Clifton 1986 Study measured energy expenditure.
VAP Holloway 1996 Per clinical investigators – not current practice
VAP Sundbarg 1996 Per clinical investigators – not current practice
DVT Black 1986 Descriptive
DVT Gerlach 2003 Descriptive
DVT Kleindienst 2003 Descriptive
DVT Norwood 2002 Descriptive

238
Topic Study Reason
ICP Howells 2005 Not comparison of ICP –compares ICP oriented protocol with CPP-oriented protocol.
ICP Saul 1982 Not comparison of ICP reports on Thresholds.
ICP Timofeev 2006 Not comparison of ICP – reports on pre/postsurgical ICP.
ICP Eisenberg 1988 Included in Barbiturates; removed from other topics.
ICP Palmer 2001 No comparison group
ICP Eisenberg 1990 Not topic specific
ICP Lobato 1986 Not topic specific
ICP Marmarou 1991 Not topic specific
ICP Miller 1981 Not topic specific
ICP Narayan 1982 Not topic specific
ICP Lee 1998 Not topic specific
ICP Miller 2004 Not topic specific
ICP Poca 1998 Not topic specific
ICP Narayan 1981 Prognosis
ICP Servadei 2002 Prognosis
ACM Schneider 1995
Case series
ACM Tolias 2004 Not topic specific
BP Thresholds Cooke 1995 Data not related to outcomes.
BP Thresholds Narayan 1982 About ICP

239
Topic Study Reason
BP Thresholds Vasser 1990 Pre-hospital
BP Thresholds Vasser 1991 Pre-hospital
BP Thresholds Vasser 1993 Pre-hospital
ACM Thresholds Schneider 1995 Case Series, does not report thresholds
ACM Thresholds Cruz 1998 No threshold data
ACM Thresholds LeRoux 1997 No threshold data Abbreviations: ACM=advanced cerebral monitoring, BP=blood pressure, DVT = deep vein thrombosis, ICP = intracranial pressure, VAP = ventilator-associated pneumonia.
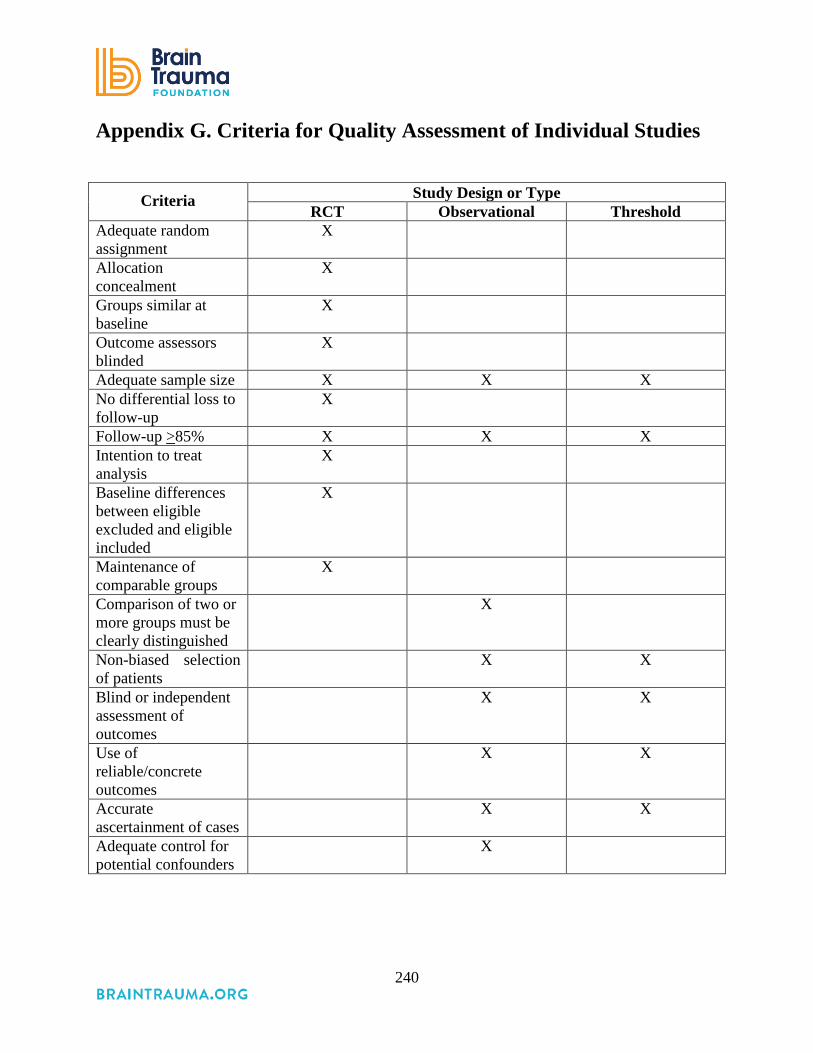
240
Appendix G. Criteria for Quality Assessment of Individual Studies
Criteria Study Design or Type
RCT Observational Threshold Adequate random assignment
X
Allocation concealment
X
Groups similar at baseline
X
Outcome assessors blinded
X
Adequate sample size X X X No differential loss to follow-up
X
Follow-up >85% X X X Intention to treat analysis
X
Baseline differences between eligible excluded and eligible included
X
Maintenance of comparable groups
X
Comparison of two or more groups must be clearly distinguished
X
Non-biased selection of patients
X X
Blind or independent assessment of outcomes
X X
Use of reliable/concrete outcomes
X X
Accurate ascertainment of cases
X X
Adequate control for potential confounders
X
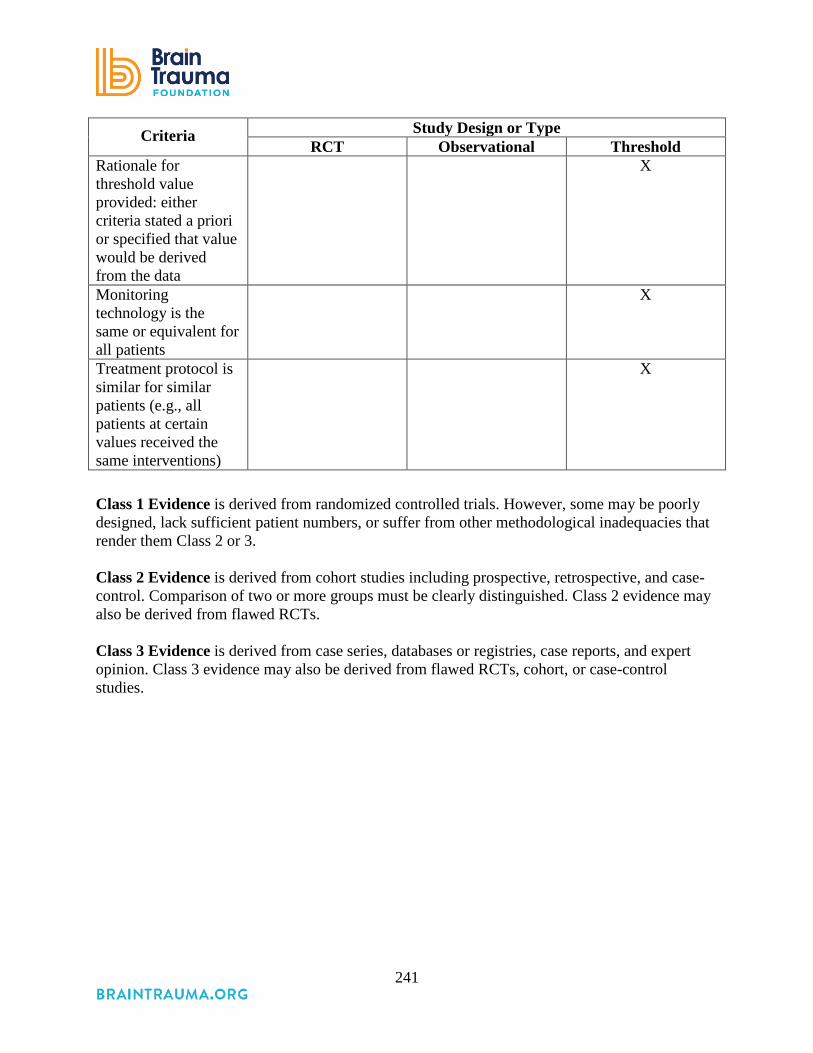
241
Criteria Study Design or Type RCT Observational Threshold
Rationale for threshold value provided: either criteria stated a priori or specified that value would be derived from the data
X
Monitoring technology is the same or equivalent for all patients
X
Treatment protocol is similar for similar patients (e.g., all patients at certain values received the same interventions)
X
Class 1 Evidence is derived from randomized controlled trials. However, some may be poorly designed, lack sufficient patient numbers, or suffer from other methodological inadequacies that render them Class 2 or 3. Class 2 Evidence is derived from cohort studies including prospective, retrospective, and case-control. Comparison of two or more groups must be clearly distinguished. Class 2 evidence may also be derived from flawed RCTs. Class 3 Evidence is derived from case series, databases or registries, case reports, and expert opinion. Class 3 evidence may also be derived from flawed RCTs, cohort, or case-control studies.

242
Appendix H. Quality of the Body of Evidence Assessment
Quality of the Body of Evidence Ratings and Criteria
Ratings The overall assessment is whether the quality of the body of evidence is high, moderate, low, or insufficient. The definitions for these are:
• High—High confidence that the evidence reflects the true effect. Further research is very unlikely to change the confidence in the estimate of effect.
This requires either multiple high-quality studies with consistent findings and precise estimates of effect or a single, multi-site RCT with definitive results. • Moderate—Moderate confidence that the evidence reflects the true effect. Further
research may change our confidence in the estimate of effect and may change the estimate.
This requires at least one high-quality study or moderate-quality with a precise estimate of effect. It may include several moderate quality studies that are generally consistent but with wide confidence intervals (low precision) or a group of studies with some inconsistent findings, but with a majority of studies with similar findings. • Low—Low confidence that the evidence reflects the true effect. Further research is likely
to change the confidence in the estimate of effect and is likely to change the estimate. A low-quality body of evidence may be a single moderate-quality study or multiple studies with inconsistent findings or lack of precision. • Insufficient— Evidence either is unavailable or does not permit a conclusion.
Insufficient is most common when no evidence was identified. However, it can occur when there is no consistency across studies and precision is low or varies widely.
Criteria: Assessing the quality of the body of evidence involves four domains: the aggregate quality of the studies, the consistency of the results, whether the evidence provided is direct or indirect, and the precision of the evidence. These are defined below: Quality of Individual Studies: This considers the quality of the individual studies. It details how many are Class 1, Class 2, and Class 3.
243
Consistency: Consistency is the extent to which the results and conclusions are similar across studies. It is rated High (all are similar), Moderate (most are similar), Low (no one conclusion is more frequent). It is NA (not applicable) when the body of evidence consists of a single study. Directness: Directness can have different definitions. We define it as whether the study population is the same as the population of interest and whether the study includes clinical rather than intermediate outcomes. Indirect is noted if the population differs; for example if the study includes both moderate and severe TBI or patients with stroke or TBI and does not separate the results by these population characteristics, or if the outcomes are not mortality or neurological function. As outlined in Methods, indirect evidence was only included if no direct evidence was found. Precision: Precision is the degree of certainty surrounding the effect estimate for a given outcome. Precision is rated as High, Moderate, and Low. How this is determined depends on the type of analysis used in a specific study but may include consideration of the range of confidence intervals or the significance level of p-values.

244
Appendix I. Hypothermia Interventions Detail
Included in the table below are details about the hypothermia intervention in the studies considered for Meta-analysis. Based on this information it was determined that the interventions differed in clinically important ways.
Characteristics of the Hypothermia Intervention
Aibiki, 2000
Clifton, 1993
Clifton, 2001
Clifton, 2011
Jiang, 2000
Liu, 2006
Marion, 1997 Qiu, 2005
Cooling duration 3-4 days
48 hours 48 hours 48 hours 3-14 days
3 days 24 hours 4.3 days (average)
Target cooling temperature (degrees C)
32-33 32-33 Bladder temp of 33 then 32.5 to 34.0
33 33-35 33-35 32-33 33-35
Rate of rewarming
1°C per day
1°C per 4 hours
no faster than 0.5°C per 2-hour period
0.5°C every 2 hours
No greater than 1°C per hour
Allowed to return spontan-eously
No greater than 1°C per hour
Natural rewarming