guide to drifting data buoys - unesdoc...
TRANSCRIPT
Intergovernmental Oceanographic Commission
World Meteorological Organization Manuals and Guides 20
GUIDE TO DRIFTING DATA BUOYS
1988 Unesco
TABLE OF CONTENTS
INTRODUCTION 1.
2.
1
BACKGROUND
1 2.1 History of Drifting-Buoy Deployment 2.2 International and Member Country Experiments
2.3 Responsibilities of International Bodies and Operations 2
3
3. DRIFTING-BUOY HARDWARE
3.1 Hulls 3.2 Sensors 3.3 Electronics 3.4 Drogues
4 5 9 10
DRIFTING-BUOY OPERATIONS 4
11 11
4.1 Logistics 4.2 Deployment Techniques
5. DATA TELEMETRY, PROCESSING AND DISSEMINATION
18 21 21 22 26
5 . 1 CLS/Service Argos 5.2 Local User Terminals 5.3 Real-Time Data Availability 5.4 Data Quality 5.5 Data Archival
6. SYSTEM COSTS
28 29 30
6.1 Hardware 6.2 Logistics and Deployment 6.3 Data Processing
ANNEXES
I References
Descriptions of Member Countries' Buoy Programmes I1
I11 National Focal Points Designated By Members for Drifting-Buoy Programmes
List of Acronyms/Abbreviations IV
FOREWORD
At its fourth session (Geneva, 11-20 November 1985), the Joint IOC-WMO Working Committee for the Integrated Global Ocean Services System (IGOSS), when examining the need for further IGOSS-related publications, agreed that a Guide to operational procedures for the collection and exchange of oceanographic data by means of drifting buoys should be prepared; it should be similar to the Guide to operational procedures for the collection and exchange of oceanographic data (BATHY and TESAC) (IOC Manuals and Guides No.3, revised version, jointly prepared by IOC and WMO); it should assimilate the information already provided in the Guide to data collection and location services using Service Argos ( W O Marine Meteorology and Related Oceanographic Activities series No.10). Its scope would be wider in order to incorporate all details pertaining to the transmission, circulation onto the GTS and archiving of drifting-buoy data. This task should be jointly undertaken by IGOSS, IODE and the newly-created Drifting- Buoy Co-operation Panel (DBCP).
Dr. G. Hamilton, Head of the Data Systems Division of the US National Data Buoy Centre, was appointed as Rapporteur to prepare the Guide and kindly agreed to undertake this important task.
The Guide to Drifting Data Buoys is aimed at providing the meteorological and oceanographic communities of the world with up-to-date information regarding the hardware, operations and data telemetry, processing and dissemination of drifting buoys. It is expected that the Guide would be of assistance to countries which are not yet involved in the use of drifting buoys to collect ocean observations and which wonder whether this technology can meet their requirements.
We would like to take this opportunity to express our gratitude, on behalf of IOC and WMO, to Dr. Hamilton for the efforts and time he devoted to prepare the Guide.
T.D. Potter for the Secretary-General of WMO
M. Ruivo Secretary IOC
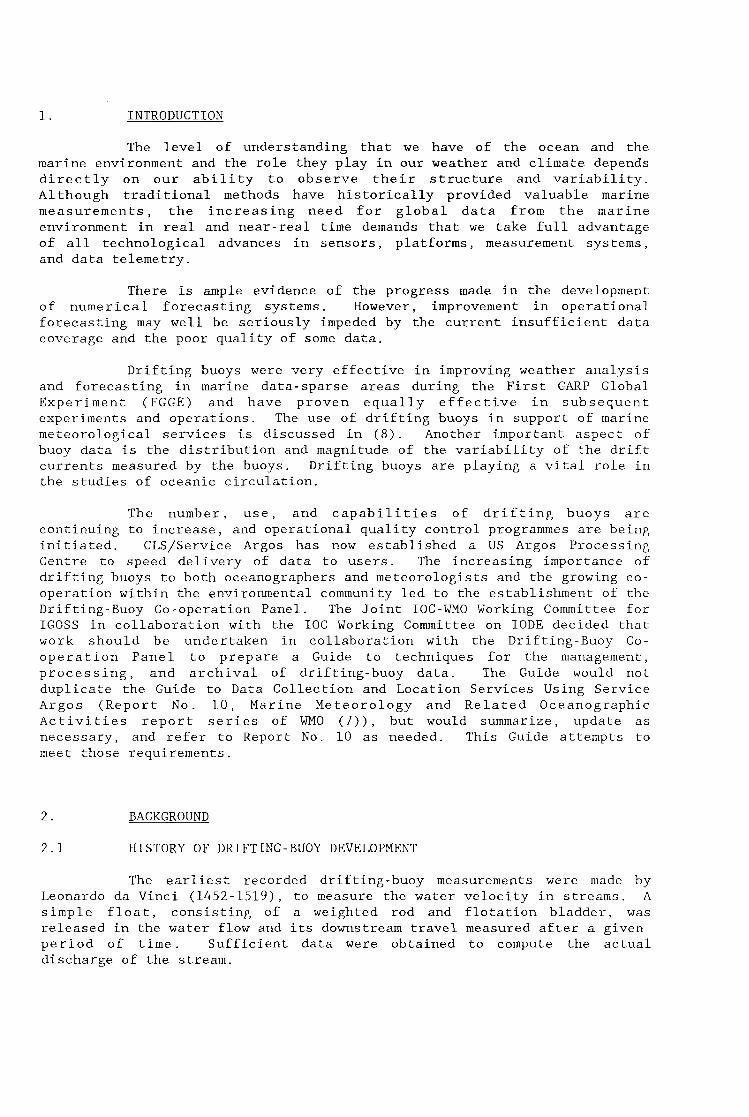
1 INTRODUCTION
The level of understanding that we have of the ocean and the marine environment and the role they play in our weather and climate depends directly on our ability to observe their structure and variability. A1 though traditional methods have historically provided valuable marine measurements, the increasing need for global data from the marine environment in real and near-real time demands that we take full advantage of all technological advances in sensors, platforms, measurement systems, and data telemetry.
There is ample evidence of the progress made in the development of numerical forecasting systems. However, improvement in operational forecasting may well be seriously impeded by the current insufficient data coverage and the poor quality of some data.
Drifting buoys were very effective in improving weather analysis and forecasting in marine data-sparse areas during the First GARP Global Experiment (FGGE) and have proven equally effective in subsequent experiments and operations. The use of drifting buoys in support of marine meteorological services is discussed in (8). Another important aspect of buoy data is the distribution and magnitude of the variability of the drift currents measured by the buoys. Drifting buoys are playing a vital role in the studies of oceanic circulation.
The number, use, and capabilities of drifting buoys are continuing to increase, and operational quality control programmes are being initiated. CLS/Service Argos has now established a US Argos Processing Centre to speed delivery of data to users. The increasing importance of drifting buoys to both oceanographers and meteorologists and the growing co- operation within the environmental community led to the establishment of the Drifting-Buoy Co-operation Panel. The Joint IOC-WMO Working Committee for IGOSS in collaboration with the IOC Working Committee on IODE decided that work should be undertaken in collaboration with the Drifting-Buoy Co- operation Panel to prepare a Guide to techniques for the management, processing, and archival of drifting-buoy data. The Guide would not duplicate the Guide to Data Collection and Location Services Using Service Argos (Report No. 10, Marine Meteorology and Related Oceanographic Activities report series of WMO (7)), but would summarize, update as necessary, and refer to Report No. 10 as needed. This Guide attempts to meet those requirements.
2.
2.1
BACKGROUND
HISTORY OF DRIFTING-BUOY DEVELOPMENT
The earliest recorded drifting-buoy measurements were made by Leonard0 da Vinci (1452-1519), to measure the water velocity in streams. A simple float, consisting of a weighted rod and flotation bladder, was released in the water flow and its downstream travel measured after a given period of time. Sufficient data were obtained to compute the actual discharge of the stream.
2
Drifting buoys have continued their long history of use in oceanography, principally for the measurement of currents ; however, the techniques have suffered from difficulties related to tracking of the buoys.
The development of reliable satellite systems such as NIMBUS and EOLE, capable of tracking surface platforms on a global basis, ushered in an unparalleled capability for deep-ocean current and environmental measurements. In the last decade, satellite technology has evolved to the point where platforms with relatively low-cost electronics can provide data in real time on a continuing basis.
When the TIROS-N satellite was launched in late 1978, the possibility to operationally deploy large drifting-buoy arrays reporting through the Argos system was realized. At present, such arrays as deployed for the Tropical Ocean and Global Atmosphere (TOGA) programme in the southern hemisphere continue to use the Argos system and provide data to operational and scientific users. Drifting buoys for TOGA are substantially more reliable than the FGGE drifters.
2.2 INTERNATIONAL AND MEMBER COUNTRY EXPERIMENTS AND OPERATIONS
The Tropical Ocean and Global Atmosphere programme and the World Ocean Circulation Experiment (WOCE) are part of the World Climate Research Programme (WCRP). The WCRP has been established by the World Meteorological Organization (WMO) and the International Council of Scientific Unions (ICSU) with the objectives being to determine to what extent the climate can be predicted and to what extent man influences the climate. In view of the role of the ocean in climate variations, the programme is also supported by the Intergovernmental Oceanographic Commission (IOC) of Unesco and the Scientific Committee on Oceanic Research (SCOR) of ICSU.
2.2.1 Tropical Ocean and Global Atmosphere Programme -
The TOGA programme has three scientific objectives: (a) to gain a description of the tropical oceans and the global atmosphere as a time- dependent system in order to determine the extent the system is predictable on time scales of months to years, and to understand the mechanisms and processes underlying its predictability; (b) to study the feasibility of modelling the coupled ocean-atmosphere system for the purpose of predicting its variations; and (c) to provide the scientific background for designing an observing and data transmission system for operational prediction if this capability is demonstrated by models.
The main reasons for employing drifters are to obtain data from remote places where frequent routing of ships is unlikely, and to obtain deep circulation data. Drifting-buoy systems are vital to help meet TOGA requirements for surface pressure, surface air temperature, sea-surface temperature (SST), and near-surface current data.
2.2.2 World Ocean Circulation Experiment
WOCE is being planned to survey the global distribution of ocean variables with a view to greatly improving estimates of the circulation around the world's oceans. The aim of WOCE is to collect a data set that will do for oceanic circulation what FGGE did for weather forecasting. The
3
data set will be used to stimulate the development of models needed for predicting climate change.
The data needed to run ocean circulation models include: (i) the topography of the sea floor as lower boundary condition; (ii) the distribution of velocity, temperature, salinity, and selected chemicals as initial conditions; and (iii) global patterns of seasonally varying fluxes of momentum, energy, moisture and gases at the ocean surface interface as upper boundary conditions.
Drifting buoys will provide important data for WOCE. These buoys will include deep drifters tracked acoustically, neutrally buoyant drifting buoys that pop up to the surface to be interrogated by satellites, and buoys drifting on the surface.
2.2.3 National Activities
For a description of Member Country programmes, refer to Annex TI.
2.3 RESPONSIBILITIES OF INTERNATIONAL BODIES
In view of the proven success of the drifting-buoy programme during the FGGE Operational Year, the thirty-second session of the WMO Executive Committee in 1980 requested the Secretary-General to carry out studies necessary for the short- and longer-term incorporation of drifting buoys in the Global Observing System of the World Weather Watch (b7). The Executive Committee was unanimous in agreeing that the momentum and enthusiasm gained during FGGE with respect to drifting buoys should be maintained and promoted further. It also noted that the eleventh session of the IOC Executive Council had acknowledged the great importance of drifting- buoy technology to oceanographic services and research programmes.
International co-ordination and co-operation have subsequently been promoted in such areas as:
(i) Exchange of information on drifti-ng-buoy developments and applications ;
(ii) Exchange of data on an operational basis;
(iii) An international dialogue between oceanographers and meteorologists, on buoy operations for both research and operational purposes, taking into account the interests of both small and large users;
(iv) Co-ordination and study of matters of legal implications such as buoy recovery, buoy markings, customs clearances, etc.;
(v) The design of a practical composite meteorological observing system based on operational experience during FGGE;
(vi) Co-ordination of data processing contracts (especially with CLS/Service Argos).
Since 1981, WMO has hosted the Meeting on Argos Joint Tariff
4
Agreement, in conjunction with IOC since 1984. Both organizations have provided all the necessary administrative and other required support. Greatly reduced tariffs have been a consequence of this agreement and have undoubtedly been a contributing factor in the rapidly expanding deployment of drifting buoys in support of WMO and IOC programmes.
Finally, the concern was expressed that some overall planning and co-ordination mechanism devoted to drifting-buoy activities would be necessary. Consequently, a Joint WMO-IOC Preparatory Meeting was held in 1985 to prepare an international cooperative action for the implementation of meteorological and oceanographic drifting-buoy programmes. At its thirty-seventh session in June 1985, the W O Executive Council endorsed the recommendation of the Preparatory Meeting to establish a Drifting-Buoy Co- operation Panel (DBCP). The Executive Council agreed that the implementation of drifting-buoy arrays for WWW and WCRP should be taken in a timely fashion and to this end that the DBCP should be activated. IOC has long agreed that drifting buoys are a very important instrument in achieving the goals of IGOSS and ocean-monitoring programmes, and the Nineteenth Session of the IOC Executive Council (March 1986) agreed to co-sponsor the DBCP jointly with WMO.
The DBCP meets yearly in conjunction with the Meeting on Argos Joint Tariff Agreement, usually during the last half of October.
3. DRIFTING-BUOY HARDWARE
Stringent hardware quality control is essential. This pertains to all components of working equipment of the buoys (sensors, processors, transmitters, etc.). It can be quite costly and time-consuming to discover a major fault just before deployment, and all faults should be classified as major in this case. Failures just after deployment are still more costly, because retrievals are usually either impossible (transmitter failures) or are impractical because retrieval costs are much greater than the cost of the buoys.
3.1 HULLS
The design of the drifting-buoy hull is primarily determined by the purpose for which it is to be used. For real-time marine meteorological data acquisition it is important that the antenna be maintained above the water for optimum telemetry to the satellite. For this reason, most FGGE buoy hulls were of a simple spar and flotation collar configuration. Other design criteria to be considered include a low profile to minimize wind drag and low hull surface drag so the buoy can be used in a drogued configuration with minimal surface current effects, Buoy hulls are commonly constructed of a fiberglass or aluminum shell with a polyurethane filler. Power supplies have traditionally been provided by alkaline, manganese or lithium batteries. Descriptions of various countries’ buoys can be found in the proceedings of the WMO Technical Conference on Automation of Marine Observations and Data Collection (6).
Aircraft launching of drifting buoys is a flexible and rapid means of deployment. However, normal-sized drifters present problems with this type of deployment. Normally, a cargo hatch has to be opened in flight
5
l and this can be hazardous in severe weather. Technology is moving in the direction of a sonobuoy-size buoy that may be able to perform many of the missions of the larger buoys. A sonobuoy is a buoy equipped for detecting underwater sounds and transmitting them by radio. By developing a buoy of the exact shape and size of a standard sonobuoy (normally, a 15 cm by 91 cm cylinder that is deployable from aircraft equipped to drop sonobuoys), the deployment of drifting buoys could become a low-cost supplement to other operations.
The accuracy of current measurements from drifting buoys has been the subject of considerable speculation since their first deployment. To address this question, SCOR recently established Working Group (WG) 88, which has the following Terms of Reference:
(a> To design procedures for determining the current-following effec- tiveness of various drifting-buoy systems;
(h) To analyze and report on the results of applying such procedures by investigators world wide;
(c> To identify recent scientific and technological advances with drifting buoys.
An important outcome of drifting-buoy technology programmes has been the development of computer time domain models to aid in the design of drifting-buoy systems. With the model, the motions of a buoy hull can be simulated, and the critical engineering parameters needed for design synthesis can be determined. The model can also be used to predict motions of buoys and forces within the buoy-tether-line-drogue system.
A time domain numerical model can simulate an environment consisting of only a two-dimensional, single, regular wave train; a uniform and steady wind; and a steady current. Since the model runs a continuous train of constant height waves past the buoy system - a phenomenon which will almost never occur at sea - the corresponding buoy motions and forces are believed to be conservative. Successfully deployed and operating buoy systems suggest that this assumption is appropriate.
The SCOR WG 88 has discussed the numerical modelling of drifter performance. The WG felt that, although quite elaborate models have been constructed, they have not yet found general acceptance of their ability to simulate drifting-buoy response to the great variety of environmental forces acting on the buoys ' system. Well-documented measurements of drifter performance in actual ocean conditions can be used to test models, as well as develop empirical design guidelines.
3.2 SENSORS
The sensors that have been used most often on drifting buoys have measured SST and barometric pressure. Although experience with such sensors goes back for several years and includes FGGE, where more than 300 buoys with these sensors were used, much care is still required by the manufacturer and buoy user to ensure accurate and reliable measurements. In order to obtairi barometric pressure measurements to an accuracy useful for
6
the computation of geostrophic winds, careful attention must be given to the choice of pressure sensor and to the design of the pressure inlet, or port. An accuracy of 1 hPa over the life of the buoy is still difficult to achieve, and even more difficult to verify.
Measurement of the water temperature at a shallow depth on the buoy hull is fairly straightforward, and standard techniques will yield an accuracy of +O.l"C. One manufacturer encountered reliability problems because the housing for the temperature sensor was made of a material which was electrochemically active with the buoy hull, and consequently corroded, reducing the sensor life. Others have avoided such problems by placing the temperature sensor inside the buoy, in thermal contact with the metal hull. The true accuracy of buoy temperature observations at sea has been difficult to assess due to the buoy sensors having different time constants and being at different depths from other conventional sensors.
Air temperature sensors also are now operational and are used in buoys deployed in the southern hemisphere TOGA array. They have been found to be reliable and accurate.
Much work has been done on developing systems for obtaining water temperature measurements below the surface, with the result that such systems can now be expected to have a reliable life of several months. The main problem is maintaining watertight integrity of the pressure and temperature modules along the line. In addition, fish bite on the thermistor line can cause loss of measurement capability. Nevertheless, accurate observations to a depth of 600 m have been made.
The measurement of wind speed from drifting buoys is now operational, although sensors are reliable for only a few months. Wind speed systems have been verified alongside moored buoys and in operational experiments. Wind speeds on drifters near a hurricane were compared to aircraft winds and were found to be in reasonable agreement (2). The measurement of wind direction by various techniques is now operational. This is an important requirement for drifting buoys used for weather forecasting in the tropics.
Developmental Test and Evaluation results of wave measurements from drifting buoys have been very successful and show promise of soon being operational. In view of the similarity in size and heave response between typical drifting buoys and commercially available wave measuring buoys such as the Waverider, these operationally proven systems can be readily adapted for use with multipurpose drifters. Also, commercially available wave- measuring buoys equipped with appropriate satellite transmitters can be used in a free-drifting mode, if desired.
One of the major problems with drifting-buoy sensors is that of determining their accuracy under operational conditions. They are normally deployed in remote areas, where there are very few sources of more conventional data for use in comparisons. The sampling characteristics of the buoy sensors may be so different from sensors carried aboard the ship launching the buoys that comparisons are difficult, even when special procedures are followed. A sensor that was operating perfectly at the time of launch may drift or fail in some subtle way in the months following. In planning drifting-buoy programmes in remote areas, no opportunity should be

7
neglected to obtain data that could verify buoy sensor performance.
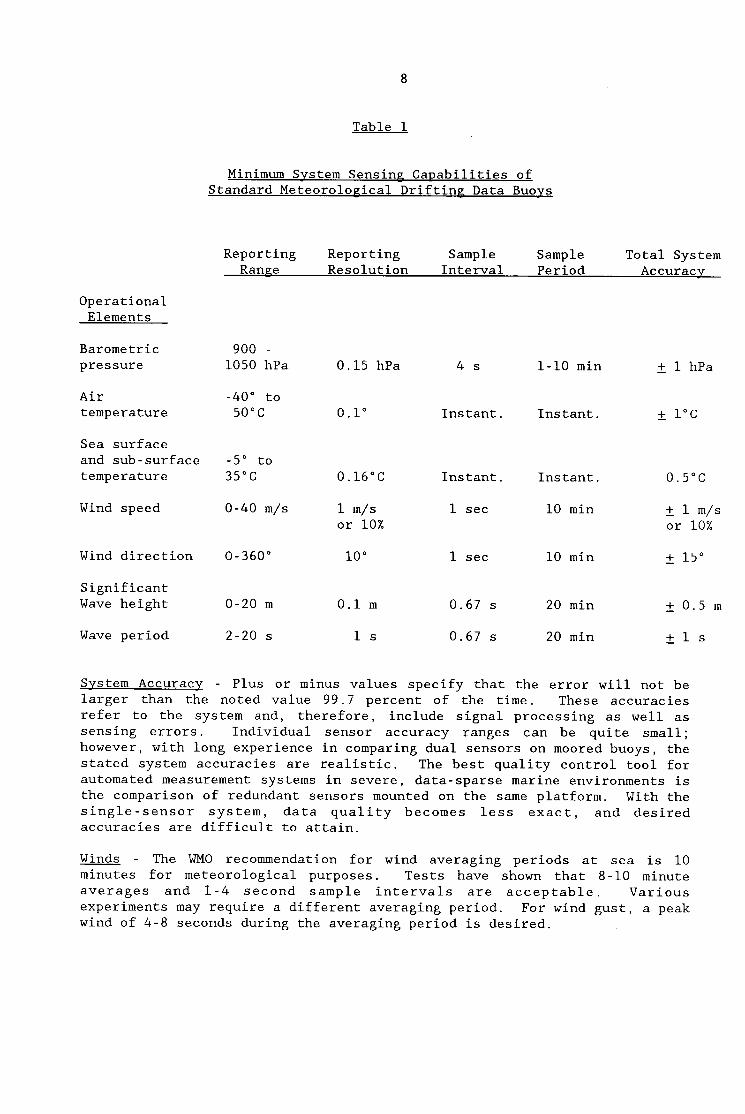
Table 1 was derived partly from (5) and expanded by the rapporteur. It can be used as a guide for sensing requirements. The total system accuracy is that which can reasonably be maintained after deployment by an operational data quality control programme. These capabil.ities were derived from many national and international requirements and modified with experience in quality controlling buoy data.
Appendix D to the Final Report of the First Session of the Working Group on Surface Measurements of the WMO Commission for Instruments and Methods of Observation (CIMO), Munich, 13-16 April 1987, provides accuracy requirements for meteorological surface measurements and suggests related sensor performance characteristics for automatic weather stations. The accuracy values are slightly more stringent than in the following table and may be optimistic for drifting buoys that have been afloat for many months.
8
Table 1
Minimum Svstem Sensing Capabilities of Standard Meteorological - Drifting - Data Buoys
Reporting Reporting Sample Sample Total System Ranne Resolution Interval Period Accuracy
Operational El emen t s
Barometric 900 - pressure 1050 hPa 0.15 hPa 4 s 1-10 min - + 1 hPa Air -40" to temperature 50°C 0.1" Instant. Instant . - + 1°C Sea surface and sub-surface -5" to temperature 35°C 0.16"C Instant. Instant. 0.5"C
10 min - + 1 m/s Wind speed 0-40 m/s 1 m/s 1 sec or 10% or 10%
Wind direction 0-360" 10" 1 sec 10 min - + 15" Significant Wave height 0-20 m 0.1 m 0.67 s 20 min - + 0.5 m Wave period 2-20 s I s 0.67 s 20 min - + I s
System Accuracv - Plus or minus values specify that the error will not be larger than the noted value 99.7 percent of the time. These accuracies refer to the system and, therefore, include signal processing as well as sensing errors. Individual sensor accuracy ranges can be quite small; however, with long experience in comparing dual sensors on moored buoys, the stated system accuracies are realistic. The best quality control tool for automated measurement systems in severe, data-sparse marine environments is the comparison of redundant sensors mounted on the same platform. With the single-sensor system, data quality becomes less exact, and desired accuracies are difficult to attain.
Winds - The WMO recommendation for wind averaging periods at sea is 10 minutes for meteorological purposes. Tests have shown that 8-10 minute averages and 1-4 second sample intervals are acceptable. Various experiments may require a different averaging period. For wind gust, a peak wind of 4-8 seconds during the averaging period is desired.
9
TOGA drifting-buoy accuracy specifications are as follows:
Barometric pressure 1 hPa SST and sub-surface temperature & 0.1"C
+ 1 m/s or 10% Wind speed - 3.3 ELECTRONICS
The following is a description of a typical drifting-buoy electronics payload built by Polar Research Laboratory (PRL) of Carpinteria, California. There were 64 PRL buoys deployed during FGGE and there are routinely 40 drifters maintained at present in the TOGA array. Buoys built by other manufacturers will, of course, vary, but this illustration is used as an example. In the PRL drifting buoys, each of the sensors is sampled once every transmit cycle or nominally every minute. The barometric pressure sample duration is nominally 60 seconds, and air and water temperatures are sampled for 160 milliseconds. Wind speed can be averaged for any duration desired; the WMO recommended interval is 10 minutes.
The payload consists of a microprocessor for system control, data acquisition and processing, a regulated power system, sensors systems, and a UHF transmitter. CMOS circuitry is used throughout for low power consumption. The microprocessor acquires the data via an A to D convertor analog sub-system or a digital interface, processes, averages, and formats the data as required. The microprocessor features menu driven software which allows the selection of various sensors which are standard options and multiple processing modes. A high precision voltage reference is incorporated in the system.
The microprocessor controller provides the basic sequencing of the data samples and transmit cycles. The basic timing for all sequences is derived from a crystal oscillator with a stability of not worse than lo-' over the required temperature range. Although this stability is not required for the transmit cycle at the data bit rate, it is necessary to maintain barometric pressure accuracy over the sample period of 60 seconds.
The UHF transmitter generates a stable 401.65 MHz signal. The transmitter is driven by a temperature-compensated crystal oscillator (TCXO) that maintains the transmit frequency within 2 1.2 kHz over the required temperature range. The TCXO is thermally isolated within the buoy to maintain the rate of change of frequency with temperature to less than Hz over 20 minutes.
The TOGA buoy power system consists of five, 18-volt, lead- alkaline battery packs providing 25% reserve power and a voltage regulated power supply.
The quiescent power consumption of the buoy is 2.5 milliamperes (mA) and the peak power consumption during transmit is typically less than 530 mA. The power system is designed to maintain buoy operation for one year. The standard buoy power supply of five battery packs can be expanded to eleven packs for additional service life or additional sensor requirements.
10
Producers of certified Platform Transmitter Terminals (PTTs) are regularly listed in the CLS/Service Argos newsletters.
3.4 DROGUES
Confidence in the ability of drifting buoys to represent ocean currents is greatly enhanced by the addition of a sea anchor, or drogue, to increase the cross-sectional area of the buoy system at the depth at which the currents are to be measured. The most widely used forms of drogues have been parachutes and window-blind drogues.
The drift of the buoy comes about as a result of the combined forces of wind drag and drag due to the motion of the buoy, drogue, and drogue line with respect to the water. In cases where the drogue is at a depth where the current is significantly different from that in the upper- mixed layer, the situation becomes much more complex. Differences in direction between the currents in the surface layer and those at the drogue depth may also lead to large errors in the apparent current at drogue depth.
The parachute is attractive for use as a drogue because of its relatively low cost and weight and the large surface area that can be obtained with a compact predeployment package. Also, because of the length of the shroud lines, the buoy may move relatively freely in the vertical direction in response to waves. On the other hand, a parachute is difficult to deploy, requires a certain minimum drift through the water to remain open and there is always concern that, once collapsed, it will remain closed due to tangling of the shroud lines. In most cases, where parachutes have been used, they have been deployed at depths of greater than 30 m.
Window-blind drogues resemble a rectangular sail suspended by a line attached to its upper yard. This has the advantage of the drogue remaining deployed even when it has no motion relative to the water. It is also relatively compact and is easily packaged with the buoy when the spars of the drogue are shorter than the buoy hull. Its main disadvantage is its resistance to vertical motion, which, in the presence of waves, results in high loads on the buoy, the drogue support line, and the drogue itself. To reduce this, it is necessary to allow sufficient stretch or compliance in the drogue support line. This problem is probably more severe with parachute drogues.
Many other types of drogues are possible. These include the sock (a vertical cylinder made of fabric with open hoops at the ends), various shapes made of rigid material, and long lengths of rope weighted at the free end. Thermistor lines used to measure sub-surface temperature tend to act as drogues.
The most critical problem with drogues is their failure before the end of the operational life of the buoy. In many cases it is not possible to unambiguously detect in the buoy trajectory the point at which the drogue has been lost. Several different principles have been used in attempting to design a sensor that will indicate whether the drogue is still attached, but the results have not proved to be universally acceptable.
11
I 4.
4.1
DRIFTING-BUOY OPERATIONS
LOG I ST IC S
Regardless of the efficiency of the data telemetry system used to acquire, process and analyze environmental data from remote areas, platforms capable of sensing the environment must be procured, calibrated, and delivered to regions of the globe that are not easily accessible. Co- ordination through a single operational organization is an important factor in minimizing difficulties. The primary benefit is the most effective and efficient use of resources. In more cases than not, opportune delivery can be worked out. To effect the co-ordination, an organization must be assigned tasking authority, be cognizant of deployment resources, have contacts within participating agencies, and know sensor system delivery schedules as well as when and where the systems are to be deployed.
In addition to the factors involved in just sending a sensor package to a site, there is the mechanism of deployment or setting up the observation station. Again, co-ordination in design and deployment technique pays off since a dedicated group can be trained for this task and can, in time, train other individuals. As an example, drifting buoys utilize the same basic packaging assembly, system checkout, and deployment hardware for both ships and aircraft. The major difference is the parachute hardware required for an aerial deployment. An automated common delivery system greatly simplifies field work and ensures successful deployments. Ships are actually a more difficult resource to work with, since every ship has different arrangements of deck space, priorities, and equipment. This is true even for vessels of a common class. Aircraft, on the other hand, are more standardized. Delivery from C130 and C141 aircraft is basically the same. Restrictions on these resources are primarily load capacity, range and cost. In the Arctic region, most areas can be covered by C130 or C141 aircraft. Also, in many Arctic areas other aircraft can be effectively used for smaller payloads.
In all cases, in order to obtain the most effective use of the available deployment resources, rigid co-ordination of activities and close command and control of the logistical operation from a single source is required. For instance, this type of mechanism has been set into motion by the US National Data Buoy Centre (NDBC) to effect deployment of a large number of drifting buoys throughout the southern hemisphere for TOGA. All of the buoys were deployed on an opportune basis utilizing ships from several countries. Prior to initiating the deployments, memoranda of agreement were negotiated with the participating countries. Forward staging areas for the buoys were established in Australia, New Zealand, South Africa, the United Kingdom, and South America. Buoys are delivered to staging areas by commercial surface transport, the Military Sealift Command and the Military Airlift Command, In essence, the entire operation is carried out at minimal cost, simply as a result of co-ordination.
4.2 DEPLOYMENT TECHNIQUES
Two methods, ships and aircraft, are proven and are cost-effective for transporting platforms to remote staging areas and for deployments on scene. Examples of instructions for deployments from ships and aircraft are contained in (4).
12
4.2.1 Ship Deplovment
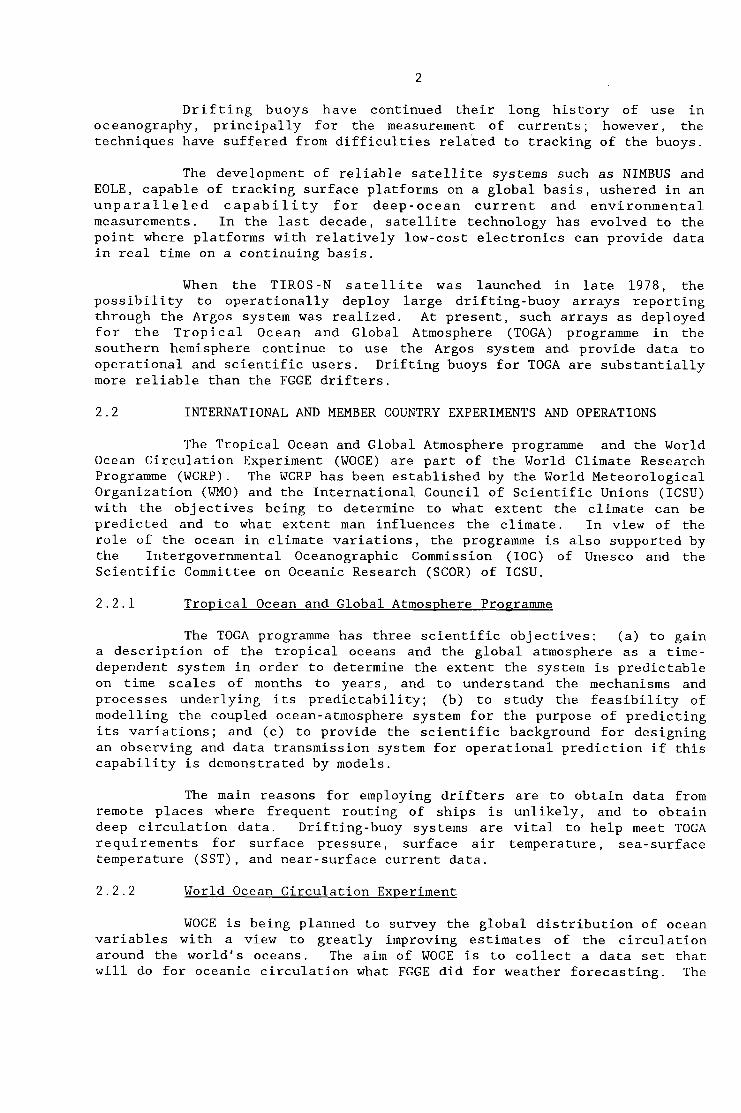
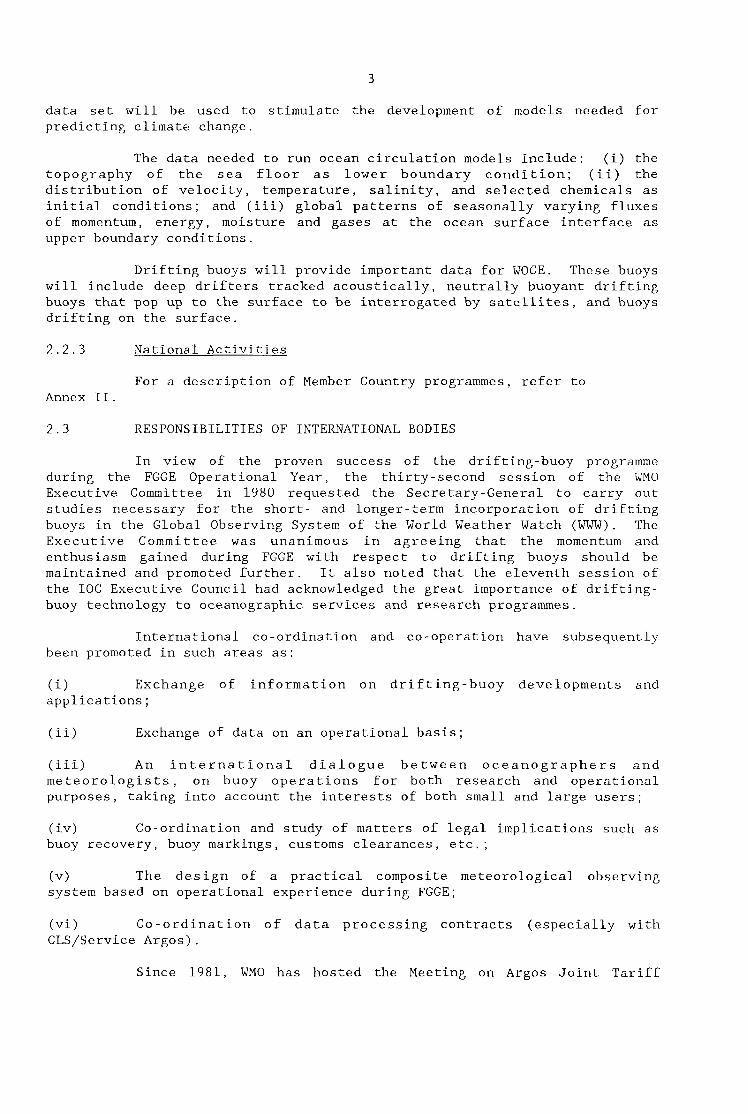
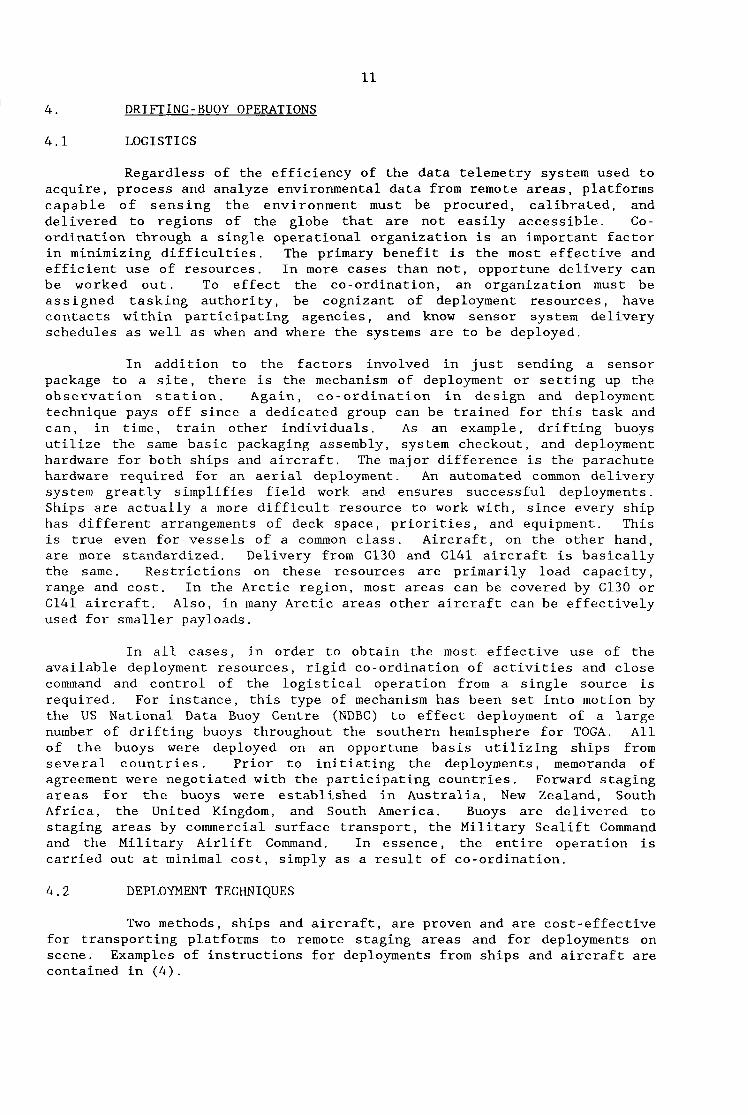
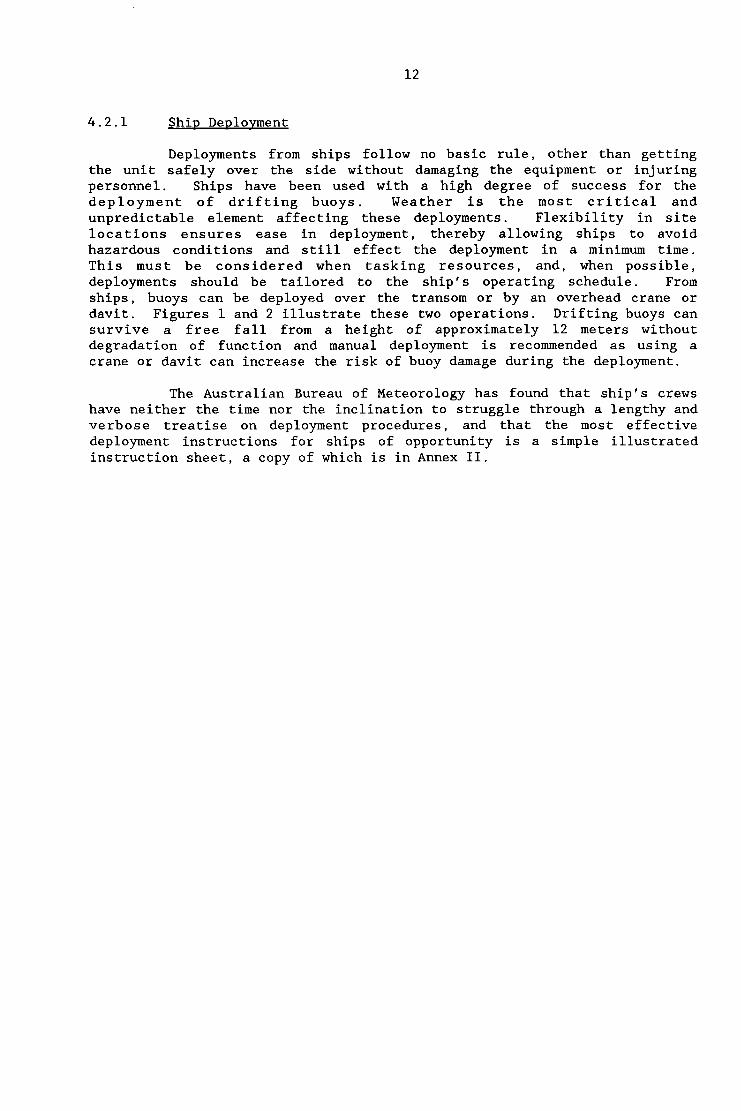
Deployments from ships follow no basic rule, other than getting the unit safely over the side without damaging the equipment or injuring personnel. Ships have been used with a high degree of success for the deployment of drifting buoys. Weather is the most critical and unpredictable element affecting these deployments. Flexibility in site locations ensures ease in deployment, thereby allowing ships to avoid hazardous conditions and still effect the deployment in a minimum time. This must be considered when tasking resources, and, when possible, deployments should be tailored to the ship's operating schedule. From ships, buoys can be deployed over the transom or by an overhead crane or davit. Figures 1 and 2 illustrate these two operations. Drifting buoys can survive a free fall from a height of approximately 12 meters without degradation of function and manual deployment is recommended as using a crane or davit can increase the risk of buoy damage during the deployment.
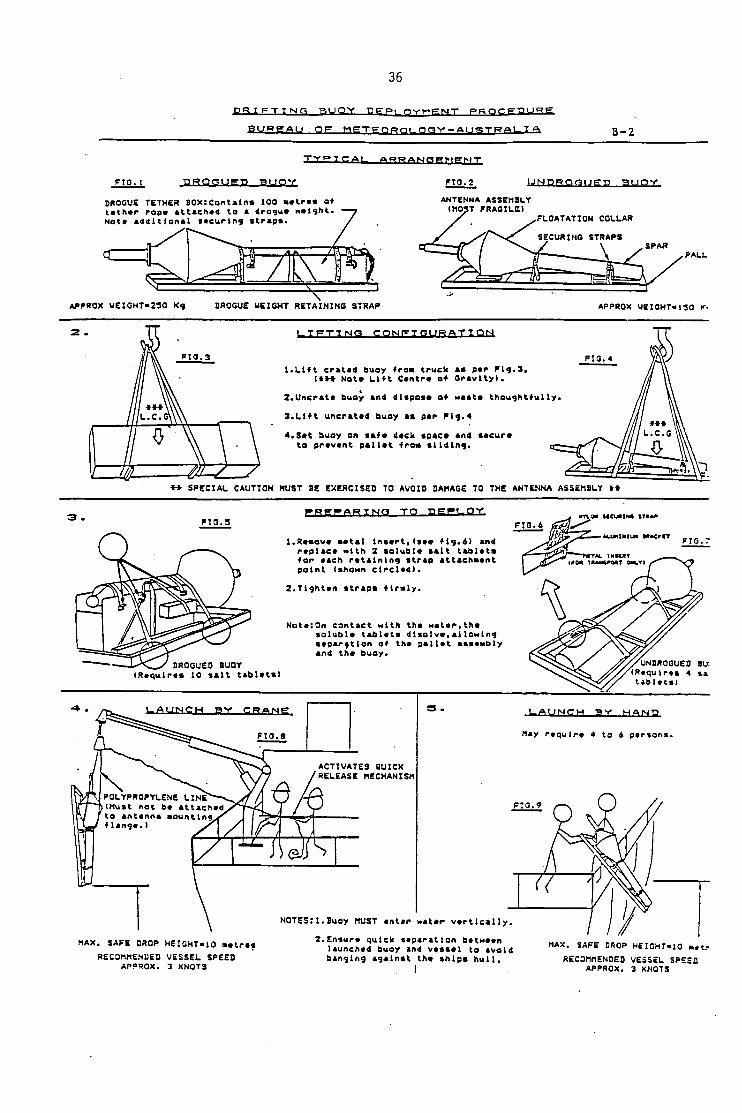
The Australian Bureau of Meteorology has found that ship's crews have neither the time nor the inclination to struggle through a lengthy and verbose treatise on deployment procedures, and that the most effective deployment instructions for ships of opportunity is a simple illustrated instruction sheet, a copy of which is in Annex 11.
13
Figure 1. Buoy being
deployed over the
ship's transom.
14
Figure 2. Buoy being deployed by overhead crane or davit
15
4.2.2 Aircraft Deployment
Aircraft play an important role in environmental reconnaissance. A variety of aircraft types and classes have been used over the years for oceanographic and geophysical surveys, weather reconnaissance, and logis- tics. Aircraft have played a large role in the deployment of drifting data buoys, beginning with deployments from C141s during FGGE in 1978 and 1979. Recent developments have been in the form of operational experiments to deploy drifting-buoy systems in advance of mature hurricanes (2).
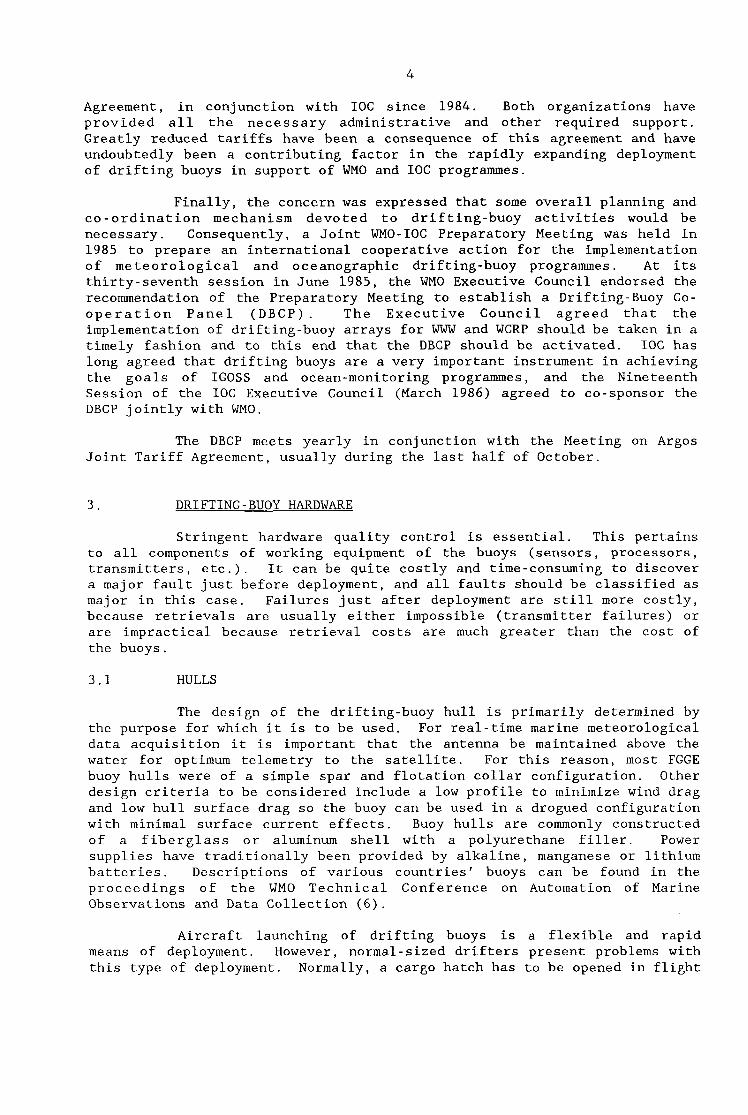
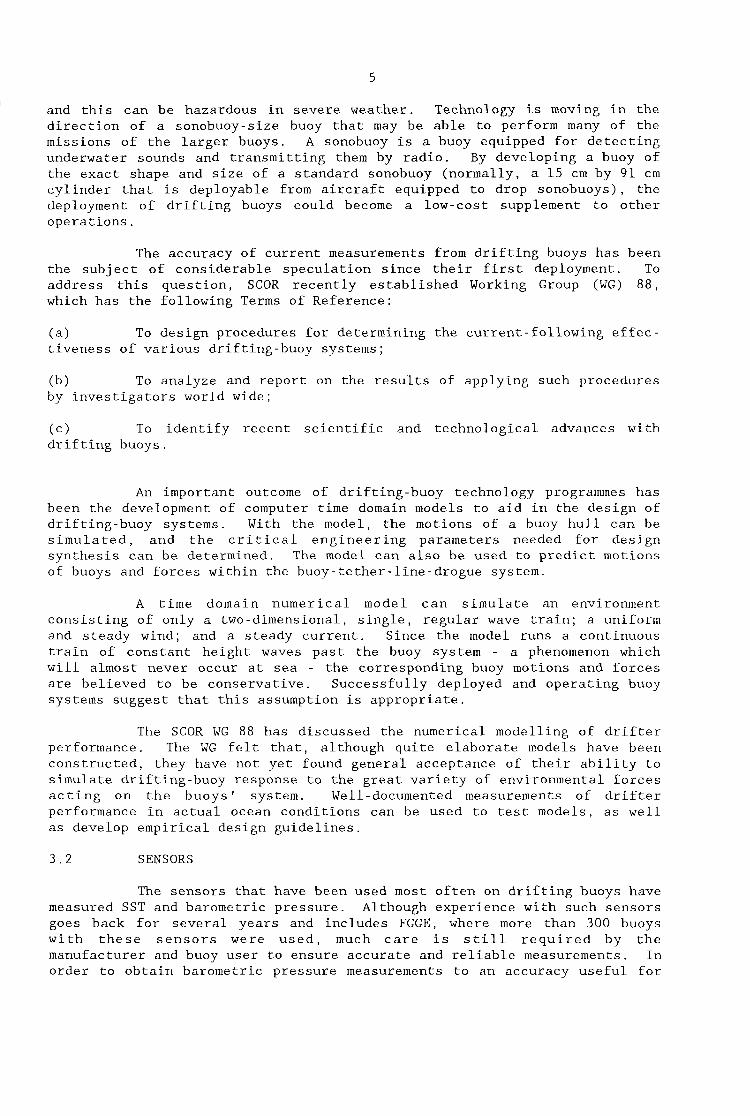
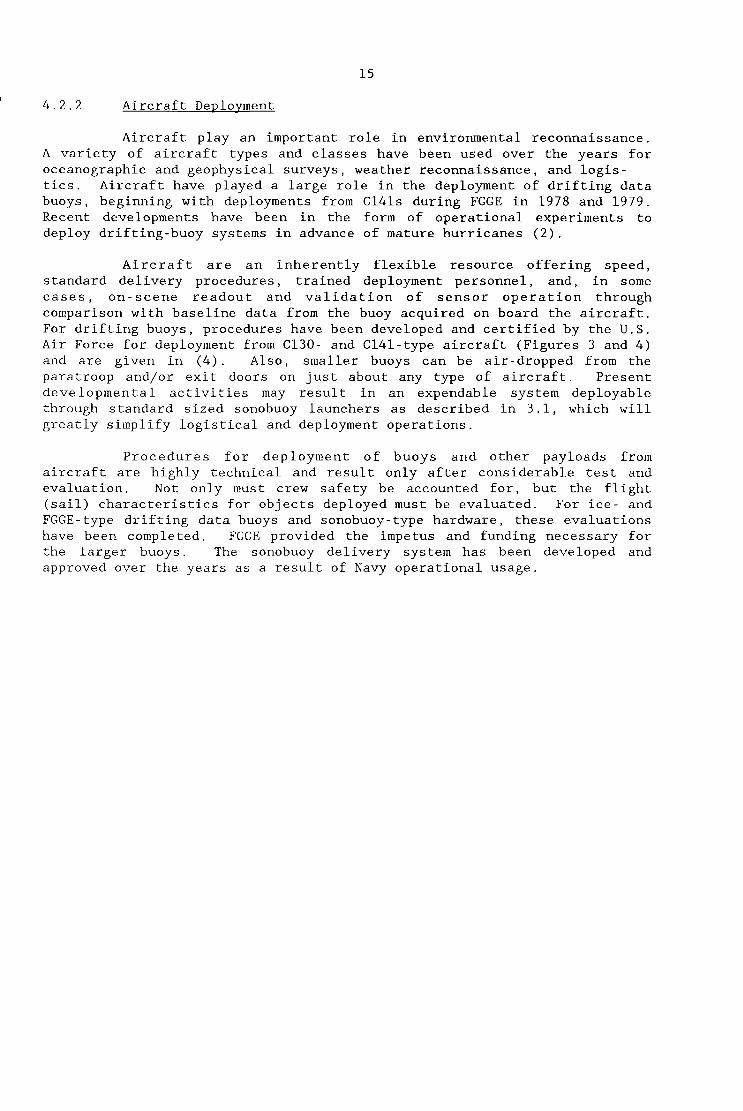
Aircraft are an inherently flexible resource offering speed, standard delivery procedures, trained deployment personnel, and, in some cases, on-scene readout and validation of sensor operation through comparison with baseline data from the buoy acquired on board the aircraft. For drifting buoys, procedures have been developed and certified by the U.S. Air Force for deployment from C130- and C141-type aircraft (Figures 3 and 4) and are given in (4). Also, smaller buoys can be air-dropped from the paratroop and/or exit doors on just about any type of aircraft. Present developmental activities may result in an expendable system deployable through standard sized sonobuoy launchers as described in 3.1, which will greatly simplify logistical and deployment operations.
Procedures for deployment of buoys and other payloads from aircraft are highly technical and result only after considerable test and evaluation. Not only must crew safety be accounted for, but the flight (sail) characteristics for objects deployed must be evaluated. For ice- and FGGE-type drifting data buoys and sonobuoy-type hardware, these evaluations have been completed. FGGE provided the impetus and funding necessary for the larger buoys. The sonobuoy delivery system has been developed and approved over the years as a result of Navy operational usage.
16
c
Figure 3. C-130 aircraft.

17
Figure 4. Buoy ready
for airdrop.
18
5. DATA TELEMETRY, PROCESSING, AND DISSEMINATION
5.1 CLS/SERVICE ARGOS
5.1.1 Purpose of Argos -
The Argos system was primarily designed to locate fixed or mobile platforms and to collect environmental data from these platforms. The system is a co-operative undertaking of the Centre National d’Etudes Spatiales (CNES, France) and the National Oceanic and Atmospheric Administration (NOAA, USA). The purpose is to provide an operational service for the entire duration of the TIROS/NOM satellite programme, that is, at least until 1996.
System management is the responsibility of CLS, established in early 1986 as a subsidiary of the French Space Agency CNES and the French oceanographic institute IFREMER. CLS operates the French Global Processing Centre (FRGPC) in Toulouse and handles all user relations outside North America. The American subsidiary of CLS, Service Argos Inc., operates the US Global Processing Centre (USGPC) in Landover, Maryland, and interfaces with all United States and Canadian users. Every new programme using the Argos system must be formally approved by the joint CNES-NOM Argos Operations Committee.
The Argos system is comprised of:
(i) A set of user platforms, fixed or mobile, deployed at sea, on land, or in the air and transmitting independently. The platform consists of its sensors, processing electronics and Argos PTT;
(ii) Two NOAA spacecraft in simultaneous orbit, each with an on board Data Collection and Location System (DCLS), that receive PTT messages on a random access basis, then separate, time-code, format, and retransmit the data to ground .stations;
(iii) The ground stations and two Global Processing Centres in Toulouse, France, and Landover, Maryland, USA, where data are retrieved, processed, and distributed to users. Each centre can take on the full operational workload if the other goes down.
A complete description of the use of the Argos system can be found in (7).
5.1.2 Platform Transmitter Terminal (PTT)
A PTT always includes an antenna, a radio frequency (RF) modulator and power amplifier, message generation logic, a sensor interface unit, an ultra-stable oscillator and a power supply.
Radio frequency specifications are as follows:
(i) Transmission Frequency: all PTTs transmit on the same frequency band--401.650 MHz & 3.2 kHz;
19
(ii) Transmission Sequence: each PTT transmits at regular intervals. The repetition rate currently ranges from 60 to 120 seconds in the case of drifting buoys. The duration of a single transmission burst depends on the data message length, but is always less than one second (360 to 920 milliseconds);
(iii) Radiated Power: the peak radiated power is less than 2 W, which allows the use of low-power electrical sources like batteries and even solar cells ;
(iv) Modulation Technique: the carrier is split-phase-L-PSK-modulated by a 400-Hz PCM signal.
PTT oscillator stability can be defined in terms of short-term, medium-term and long-term stability. The stability of the oscillator is extremely important for location accuracy, and standards must be met before using the Argos system.
5.1.3 The ArRos - Data Collection and Location System (DCLS)
The Argos DCLS on board the satellites is equipped with receivers which pick up the messages transmitted by platforms within the satellite coverage. Message separation in time is cbtained through the asynchronization of transmissions and the use of different repetition periods. Message separation in frequency is achieved as a result of the different Doppler shifts in the carrier frequency received from the v-arious PTTs. Up to four (eight after NOAA K) simultaneous messages can be acquired by the Argos DCLS, provided they are separated in frequency.
In order to be compatible with the Argos onboard equipment, and not to interfere with the rest of the PTTs, each PTT design must be approved by CLS/Service Argos. For a newly-designed PTT the approval is based both on design analysis and type certification tests. The type certification is requested by the PTT manufacturer. The certification tests are performed by CLS/Service Argos in Toulouse. The manufacturer receives a type-certificate once his PTT has successfully passed the certification test.
At any given moment the area on the globe instantaneously seen by one satellite is about 5,200 km in diameter, assuming that the line of sight to the satellite is 5 degrees above the horizon. As the satellite orbits, the ground track of this circle produces a swath 5,200 km in width encompassing the earth. At each orbit this swath covers both the North and South Poles.
5.1.4 Ground Stations
The National Environmental Satellite, Data, and Information Service (NESDIS, USA) is currently operating two Command and Data Acquisition (CDA) stations; one in Wallops Island, Virginia, USA, and one in Gilmore Creek, Alaska, USA. Through a co-operative agreement between NESDIS and the "Centre de Meteorologie Spatiale" (France), stored data are received in Lannion, France.
The CDA and Lannion stations relay the received data to the NESDIS data processing service in Suitland, Maryland, USA, via geostationary
20
satellites. With these three telemetry stations the satellites are out of contact with the ground for no more than one orbital period per day.
In Suitland, Argos data are separated from those from other satellite equipment and transmitted to the Argos GPCs in Toulouse and Landover via a permanent data links.
5.1.5 Argos Data Processing System
The following processing tasks are performed at the GPCs:
(i) Decoding of the PTT messages and processing of the sensor data;
(ii) Computation of PTT locations from Doppler shifts and orbital data;
(iii) Storage of all these processing outputs on computer files
The sensor data processing by the Argos GPCs is subdivided into three steps:
(i) Sensor data preprocessing that consists essentially of the compression of identical messages followed by the time coding of messages in Universal Time Co-ordinated (UTC);
(ii) Standard processing of sensor data consisting of the conversion of the binary digits into user-defined units, each sensor's data being processed independently of others;
(iii) Special processing of PTT messages that cannot be converted into user-defined units by the standard processing: each special processing procedure is completely defined by the user and concerns the sensor data field as a whole.
In order to be compatible with the Argos GPCs sensor data processing software, the sensor data must satisfy the following rules:
(i) The sensor data part of a PTT message can contain from 1 to 8 blocks of 32 bits each;
(ii) A PTT can have from 1 to 32 sensors;
(iii) Each sensor can generate between 1 and 32 bits inclusive, provided the above-mentioned conditions are met;
(iv) If the data are to be distributed over the GTS their format must comply with the Argos GPCs meteorological coding software.
The meteorological coding software output, in WMO code form FM 14- VI11 DRIBU, is not stored but transmitted directly to the French Meteorological Service (Direction de la Meteorologie Nationale, Paris) and to the US National Weather Service, which are responsible for its dissemination over the GTS.
21
5.2 LOCAL USER TERMINALS (LUTs)
The LUT is a satellite-data receiving system that allows a local user to acquire real-time data from platforms equipped with sensors and a PTT transmitting through the Argos DCLS on board NOAA satellites.
The length of the platform data message varies as a function of the number of sensor groups. Location information is computed from inverse Doppler shifts of the platform carrier frequency obtained by the satellite. The satellite receives and manipulates the platform data, combines them with other instrument data and Doppler information, and immediately retransmits them on one of two VHF downlink frequencies.
The LUT performs four major functions that include data acquisition, storage, processing, and distribution. It can acquire data from any PTT that is simultaneously in view of both the satellite and the LUT .
The LUT can acquire and process data from up to 200 PTTs per satell-ite pass. PTT position fixes can be accurate to within 1-2 km, and up to 256 sensor data bits can be transmitted.
Currently, global data recovery and processing are provided by CLS/Service Argos. The function of the LUT is to receive, decommutate, process, and distribute the DCLS data in real time for platforms located within range of the LUT.
The original LUTs were developed during the late 1970s. These systems employed minicomputers that performed data processing and collection, as well as directional control of the large, tracking antennas.
Many technological improvements in antenna design, preamplifiers, receivers, microprocessors, and data communications have reduced the size and improved the performance of these systems. Systems are currently available that employ fixed antennas and modular assemblies that can be set up and placed in operation by one technician in less than two hours. The cost of an LUT is approximately $35k (US) per unit.
5.3 REAL-TIME DATA AVAILABILITY
The concept of "real-time" is frequently misinterpreted (depending whether the reader/author is a researcher or an operational forecaster; whether the reader/author is a meteorologist or an oceanographer), and a strict definition at least valid in the present context may be appropriate.
DEFINITION: Real-time availability requires timely data accessibility for use in numerical modeling and high seas weather forecasting. For the open ocean (drifting buoy) area, this usually means data availability within about 3 hours of the observation time, but this may vary in different forecasting centres.
Drifting-buoy data processed by CLS/Service Argos are entered on the Global Telecommunication System (GTS) through telecommunication hubs in Paris and Washington. To be disseminated over the GTS, the Argos data must satisfy the following conditions:
22
(i) Entry of the data into GTS must have had prior Argos formal agreement and the sensor data must be of environmental interest;
(ii) The data must be transmitted in the appropriate WMO code form: FM 14-VI11 DRIBU, FM 13-VI11 Ext. SHIP, or FM 63-VI11 Ext. BATHY;
(iii) PTT sensor data must be encoded in the sequence specified by CLS/Service Argos;
( iv> The PTT operator shall inform CLS/Service Argos when the PTT becomes operational;
(VI The Meteorological Service requiring the transmission on the GTS should notify the French or US Meteorological Services.
It has been shown in various studies that timeliness of receipt of drifting-buoy data on the GTS is not fully satisfactory for synoptic weather analyses. In Annex 11, Australia and New Zealand report that the DRIBU messages are received up to six hours after observation time.
To improve the timeliness of data, the Argos French Global Processing Centre at Toulouse (FRGPC) has been upgraded and a new US Global Processing Centre (USGPC) has been established at Landover, Maryland, near Washington, DC. These facilities will reduce the time required to put the data on the GTS. In addition, for North American users the data received by the Gilmore Creek, Alaska, and Wallops Island, Virginia, direct readout stations are processed by the USGPC immediately. The FRGPC also processes the VHF direct readout data received at Toulouse. Therefore, a large part of the data received from the northern hemisphere is now available for insertion on the GTS within 20 minutes of observation time. Plans are underway to increase the amount of direct readout data to be processed through the Argos system.
5.4 DATA QUALITY
5.4.1 Background
There is ample evidence of the progress made in the development of numerical forecasting techniques. However, improvement in operational fore- casting may well be seriously impeded by the current, insufficient data coverage and the poor quality of some data. Drifting-buoy reports on the GTS have not been subjected to formal quality control (QC) prior to transmission on the GTS or ingestion by numerical models. The result is that data of questionable quality are being distributed internationally and are negatively affecting operational numerical analysis schemes and archival files used for research purposes.
At the second session of the Drifting-Buoy Co-operation Panel in October 1986, the Panel agreed very strongly on the need for real-time quality control procedures for drifting buoys to be implemented globally.
5.4.2 Present Status
The FRGPC and the USGPC perform gross range checks on drifting-
23
I buoy data prior to dissemination. ranges :
The data must fall within the following
(i) Pressure 850 to 1060 hPa;
(ii) Air temperature -80°C to +40"C;
(iii) Water temperature -2°C to +45"C;
(iv) Windspeed 0 to 120 kts;
(v) Wind direction 0" to 360";
(vi) Pressure tendency 0 to 99.9 hPa
In addition, data that are more than 12 hours old are not transmitted.
The USGPC is processing data from drifting buoys which have been sponsored by North American countries, and is transmitting these data to the National Meteorological Centre (NMC) for insertion on the GTS and ingestion by the NMC data assimilation scheme.
The drifting-buoy data are subjected to automated real- time range and time-continuity checks at NMC. These checks are performed within 20 minutes of data receipt from the USGPC. Data passing these checks are disseminated on the GTS and, in parallel, are transmitted to NDBC along with error flags from the automated checks.
At NDBC, meteorological analysts, using a man-machine mix, review all flagged data that failed the automated checks to determine the source of the error, as well as conduct more stringent QC checks to detect errors too subtle to be identified by the automated range and time-continuity checks (see paragraphs 5.4.4 and 5.4.5). Once an error and its cause have been identified, the NDBC meteorologist updates a buoy status file at NMC. This status file operates simultaneously with the range and time-continuity checks to eliminate or adjust all subsequent data for the platform found to be in error, prior to the data being transmitted on the GTS. NDBC also prepares quality controlled drifting-buoy data for archival in the form of magnetic tapes. These tapes are forwarded to the National Oceanographic Data Centre (NODC) and National Climatic Data Centre (NCDC) every month. Details of US drifting-buoy quality control can be found in (1) and (3).
5.4.3 Real-time Automated QC Checks at NMC/NDBC
Real- time automated QC checks consist of range and time-continuity checks for environmental measurements and an acceleration check to validate the position. The environmental measurements consist of sea level pressure, air temperature, water temperature, and wind speed and direction. No time- continuity checks are performed for wind direction. The capability to QC wave height and period is under development.
The limits and standard deviations (used for the time-continuity check) are data base entries for each station that can be quickly changed from NDBC. Drifters located outside tropical cyclone belts in the tropics
24
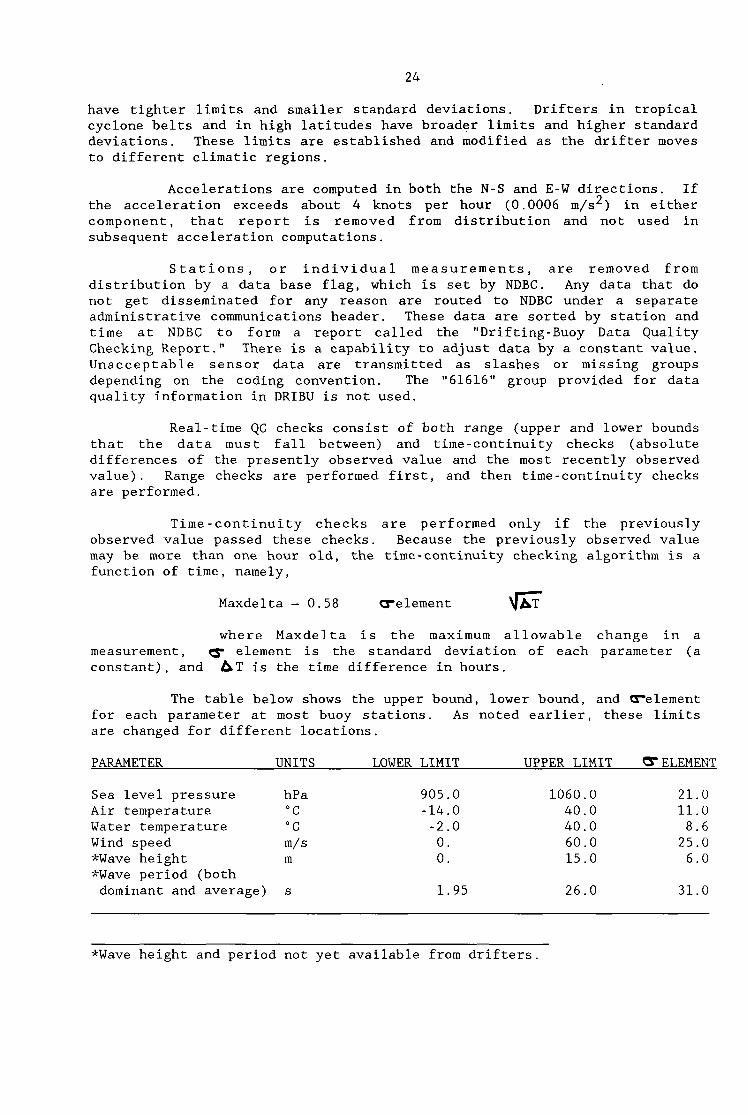
have tighter limits and smaller standard deviations. Drifters in tropical cyclone belts and in high latitudes have broader limits and higher standard deviations. These limits are established and modified as the drifter moves to different climatic regions.
Accelerations are computed in both the N-S and E-W directions. If the acceleration exceeds about 4 knots per hour (0.0006 m/s2) in either component, that report is removed from distribution and not used in subsequent acceleration computations.
Stations, or individual measurements, are removed from distribution by a data base flag, which is set by NDBC. Any data that do not get disseminated for any reason are routed to NDBC under a separate administrative communications header. These data are sorted by station and time at NDBC to form a report called the "Drifting-Buoy Data Quality Checking Report." There is a capability to adjust data by a constant value. Unacceptable sensor data are transmitted as slashes or missing groups depending on the coding convention. The "61616" group provided for data quality information in DRIBU is not used.
Real-time QC checks consist of both range (upper and lower bounds that the data must fall between) and time-continuity checks (absolute differences of the presently observed value and the most recently observed value). Range checks are performed first, and then time-continuity checks are performed.
Time-continuity checks are performed only if the previously observed value passed these checks. Because the previously observed value may be more than one hour old, the time-continuity checking algorithm is a function of time, namely,
Maxdelta = 0.58 =element \laT where Maxdelta is the maximum allowable change in a
measurement, e element is the standard deviation of each parameter (a constant), and hT is the time difference in hours.
The table below shows the upper bound, lower bound, and relement for each parameter at most buoy stations. As noted earlier, these limits are changed for different locations.
PARAMETER UNITS LOWER LIMIT UPPER LIMIT 6 ELEMENT
Sea level pressure hPa Air temperature "C Water temperature "C Wind speed m/s *Wave height m *Wave period (both dominant and average) s
905.0 1060.0 21.0 -14.0 40.0 11.0 -2.0 40.0 8.6 0. 60.0 25.0 0. 15.0 6.0
1.95 26.0 31.0
*Wave height and period not yet available from drifters.
25
5.4.4 Further Developments (real-time QC at OPC/NMCZ
In 1988, the N O M Ocean Products Centre (OPC), co-located with NMC, will establish a real-time QC programme for surface ship and drifting- buoy data. Observations will undergo automated routines to validate character format and platform call sign, test reports for valid ranges and internal consistency, provide time continuity checks, make comparisons with numerical forecast fields, and test for duplicate reports.
Observations which pass these automated tests will be routed to the GTS and numerical assimilation files without additional delay. Observations which fail the automated tests will be reviewed and subjected to more rigorous interactive tests by OPC meteorologists prior to GTS transmission or model assimilation.
The interactive procedures will be prioritized to maximize the utility of observations in data sparse areas first (typical regions where drifting buoys are deployed), and data rich areas (shipping lanes) last. Additional tests will be performed to ensure internal and time continuity, to compare observations with numerical forecast fields and neighbouring observations (buddy check), and to ensure platform location/track consistency.
Final flags and any corrections will be applied by meteorologists. These flags/changes will be used in numerical data assimilation, for archiving at the appropriate data archive centres, and for platform management at NDBC. As BUFR becomes available for GTS use, "changes" and "flags" to observations will be encoded such that the original observation will be retrievable; in the mean time, only the corrected observation or the original observation with deleted elements will be available via GTS.
NDBC will continue to perform the stringent, near-real-time QC checks as discussed earlier. In this regard, NDBC will review all drifting- buoy data, as well as the error information provided by the OPC. NDBC meteorologists will coordinate with the OPC on the final determination of validity of the data. Also, NDBC will determine the cause of all erroneous data and will take corrective actions, if appropriate.
5.4.5 Near-real-time QC at NDBC
Basic two-dimensional color graphics, such as line plots, scatter- plots, and contour maps, are used in QC at NDBC. These graphics are produced on demand by the data quality analysts in response to a list of data flagged as suspicious by data validation algorithms. These algorithms include the range and continuity checks at NMC and NDBC and also comparisons with gridded numerical analysis and "first guess" fields from NMC and comparisons with climatological fields. Similar comparisons with "first guess" fields are also performed at the European Centre for Medi-um-range Weather Forecasting (ECMWF) and results are forwarded to NDBC.
Time-series plots and spectral wave curves help analysts distinguish between true sensor or system failures and legitimate data. On moored buoys and at coastal sites, failures are often easy to detect because of the presence of duplicate sensors. With drifting buoys, these failures are more difficult to identify because of single sensors and because
26
drifters tend to be deployed in areas that are more data sparse than those where moored buoys are located.
If a legitimate failure has occurred, the data base at NMC is modified to withhold the affected measurement from distribution. If sensor drift is detected, the data being disseminated are rescaled to the proper value.
If further information is desired on drifting-buoy QC, the Data Systems Division of NDBC can be contacted at the following address:
National Data Buoy Centre Data Systems Division NSTL, MS 39529
Telephone 601-688-2836 Telex 5101012406(NSTLBSTL)
5.5 DATA ARCHIVAL
The Marine Environmental Data Service (MEDS) of Canada has been accredited by IOC to act as a Responsible National Oceanographic Data Centre (RNODC) for drifting-buoy data within the International Oceanographic Data and Information Exchange (IODE) system of IOC.
There are three paths by which drifting-buoy data can reach the RNODC. The traditional path for data entering the archive is by submission from the principal investigator to the national centre. Copies can then be forwarded to the RNODC. These data are presumably of the highest quality since they have been subjected to the most discriminating quality control procedures. However, it is typical that long delays occur between data collection and submission to an archive. Also, non-uniformity of processing techniques employed by different investigators may pose problems for secondary data users who wish to combine data sets.
The second way by which data can reach the RNODC is on magnetic tape from CLS/Service Argos, with the written permission from the principal investigator. An advantage of this option is that the data would contain a complete set of parameters at the full precision provided by the Argos system. A disadvantage is that data formats are likely to vary among projects. Each principal investigator would have to provide the RNODC with a description of his format and, in some cases, decoding algorithms.
The third path for data flow to the archive is via the GTS. CLS/Service Argos will place any drifting-buoy data onto the GTS so long as the data reporting from the buoy comes in a certain format. An advantage of this path is that data are available in real time to operational users, such as forecasters and researchers, as well as other interested parties, such as an archive centre. A second advantage is that the RNODC currently has a well-developed processing system for the GTS data.
There are disadvantages for a data centre receiving .data along this path. One is the requirement that data be transmitted from the buoy in a format specified by CLS/Service Argos. Then the data must be converted to a second format, the DRIBU code, specified by WMO, before it can be entered
27 I onto the GTS. Once data are in the proper format and administrative
procedures to initiate data flow have been completed, data can be injected into the GTS at no charge to the originator. The result of this is that somewhere around half of the operating drifting buoys do not report their data over the GTS.
However, even with full participation, there is another disadvantage to the GTS pathway. Some observed parameters cannot be accommodated within, or must be reduced in precision to fit into, the DRIBU code. Also, supporting documentation such as buoy hull type, sensor calibration information, project, principal investigator, etc. , is not transmitted over the GTS and, if it is to be preserved, must be forwarded to the archive by the principal investigator. Finally, and of direct concern to all secondary users, the data have not been checked for reliability.
Data centres have a fundamental responsibility to preserve the integrity of original data while striving to improve the quality of data in the archive. To ensure high quality, it has been argued that only data of known and acceptable accuracies be admitted. By implementing this, an archive would exclude data that others consider of value even with their acknowledged deficiencies. An archive must attempt to satisfy both interests. To this end, data centres carry out checks to identify "impossible" values in data they receive. These are then either deleted or corrected. Other data are deemed "questionable," that is, having values within established limits but suspect within the context of other data.
At MEDS, there is a suite of quality control procedures that are applied to drifting-buoy data. The drifting-buoy messages are captured by a computer connected into the GTS system. The messages are routed to the RNODC through Washington and Toronto. Data are collected on a disk for anywhere from 1 to 4 days and then transferred to the main computer. At this time, the first software examines the structure of the drifting-buoy messages to ensure that they conform to the international standard. If there are any problems of this kind in a message, it is written to an error file for manual scrutiny. In the same process, range checks are also conducted on the contents of various fields in the message. So, for example, date, time, and position fields are checked for valid values. Again, any message that contains a value that fails a check is output to an error file for manual handling. One of the MEDS staff checks the list of messages that have been written to the error log to try to determine the error. If it is possible, the error is corrected.
The next test occurs once each month on however much data have arrived from each buoy. The buoy tracks, inferred drift speed, sea level pressure, and sea surface temperatures are displayed on a terminal. One month is used because this gives a convenient time series for these parameters and fairly readily shows up anomalous values. The drift speed is calculated from pairs of positions and times. It is not uncommon for these to be unrealistically high due, probably, to inexactness of position or time. The sea surface temperatures are compared visually against a climatol.ogy file (obtained from the NCDC files in Asheville, North Carolina) to indicate when observed values are more than three standard deviations from the climatology. Both the sea surface temperature and sea level pressure series are examined for spikes. The operator can make use of the interactive software to carry out a number of procedures on the data. He
28
can isolate messages received from one or another Local User Terminal, he can identify messages that are responsible for unrealistically large drift speeds, or he can find data values responsible for spikes in either temperature or pressure. By isolating these data values, he sets quality flags attached to the message that declare what part of the message is considered suspect. The data are not changed at all at this stage. These quality flags are carried through subsequent processing and stored with the data in the MEDS archives.
Monthly maps of global buoy tracks are in the process of being published. These are intended to be used as an indication of where drifting buoys are currently operating. They will be issued along with MEDS monthly summary of real-time data received. This is sent out free of charge to any interested party. Simply write to MEDS' to get on the mailing list for this publication. Corresponding maps for the Antarctic and Pacific oceans will also be created.
The current plans for the future call for the inventory data base to be able to distinguish data received by the GTS and through submissions from principal investigators or other archive centres. It is likely that these data will not be in standard formats. This is not a new problem for an archive centre and will probably be handled as is the case for other data types. The data received from sources other than the GTS, will not be merged into that received by the GTS. Instead, separate files will be kept with a common index being supplied by the Inventory data base. The exact structure of the archive for these data is still not determined. It may be, because of the flexibility of the GF3 format, that it, or some compacted form, may be used. The design of this structure will hopefully be flexible enough to accommodate data from sensors that are planned to go on new buoys and new forms of buoys, such as those called pop-up drifters.
6. SYSTEM COSTS
6.1 HARDWARE
Information on manufacturers of buoy systems in various countries can be obtained from the National Focal Points designated by Members for drifting-buoy programmes. A list of National Focal Points with their addresses is given in Annex 111.
Procurement of hardware is best realized through planned buys of large numbers of standardized buoys. This allows manufacturers to bid competively on contracts for a significant volume of standard products. This provides cost reduction in the long term through the establishment of assembly line construction and subcontracts for premanufactured components. The problem that arises is when the research community uses non-standard, highly specialized platforms for data acquisition. However, for the core of
'Marine Environmental Data Service Department of Fisheries and Oceans 200 Kent Street, Ottawa, Ontario KIA OE6, Canada Tel.: 613-990-0264 Tlx : 534228
29
basic measurements required to support both operations and post-operational research, the planned procurement of standard platforms is highly desirable. Sharing on deployments by several scientific investigators or organizations greatly reduces the cost per unit.
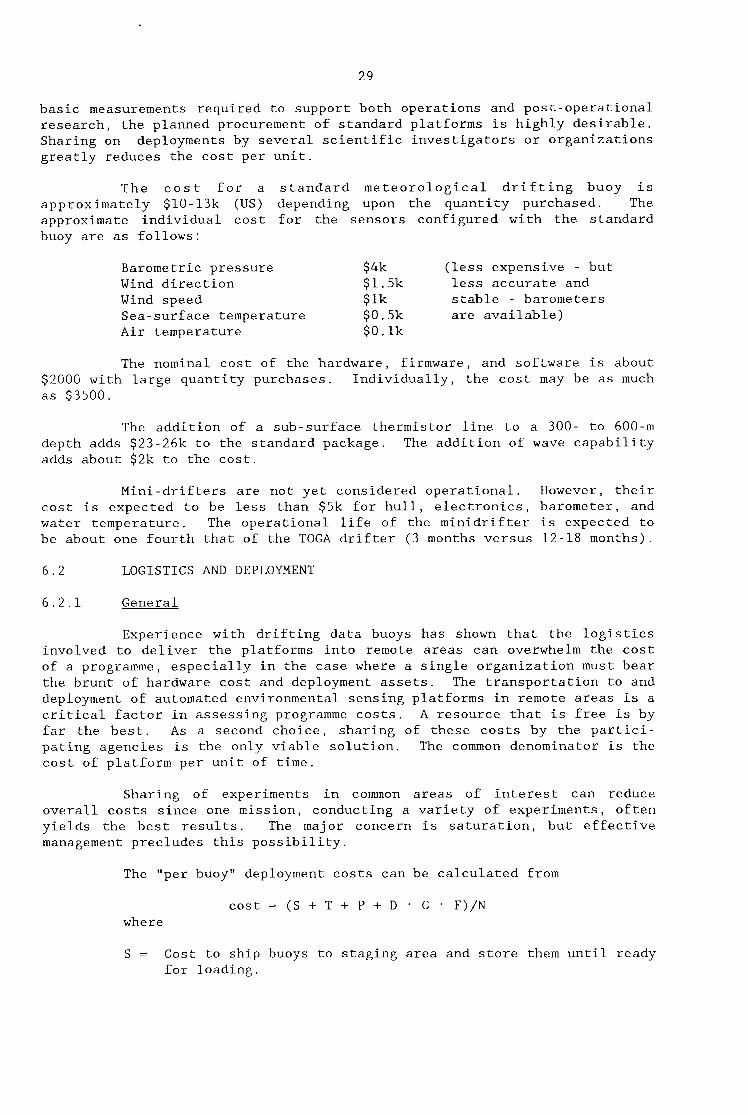
The cost for a standard meteorological drifting buoy is approximately $10-13k (US) depending upon the quantity purchased. The approximate individual cost for the sensors configured with the standard buoy are as follows:
Barometric pressure $4k (less expensive - but Wind direction $1.5k less accurate and Wind speed $ Ik stable - barometers Sea-surface temperature $0. Sk are available) Air temperature $0. lk
The nominal cost of the hardware, firmware, and software is about $?_GOO with large quantity purchases. Individually, the cost may be as much as $3.500.
The addition of a sub-surface thermistor line to a 300- to 600-m The addition of wave capability depth adds $23-26k to the standard package.
adds about $2k to the cost.
Mini-drifters are not yet considered operational. However, their cost is expected to be less than $Sk for hull, electronics, barometer, and water temperature, The operational life of the minidrifter is expected to be about one fourth that of the TOGA drifter (3 months versus 12-18 months).
6.2 LOGISTICS AND DEPLOYMENT
6.2.1 Genera 1
Experience with drifting data buoys has shown that the logistics involved to deliver the platforms into remote areas can overwhelm the cost of a programme, especially in the case where a single organization must bear the brunt of hardware cost and deployment assets. The transportation to and deployment of automated environmental sensing platforms in remote areas is a critical factor in assessing programme costs. A resource that is free is by far the best. As a second choice, sharing of these costs by the partici- pating agencies is the only viable solution. The common denominator is the cost of platform per unit of time.
Sharing of experiments in common areas of interest can reduce overall costs since one mission, conducting a variety of experiments, often yields the best results. The major concern is saturation, but effective management precludes this possibility.
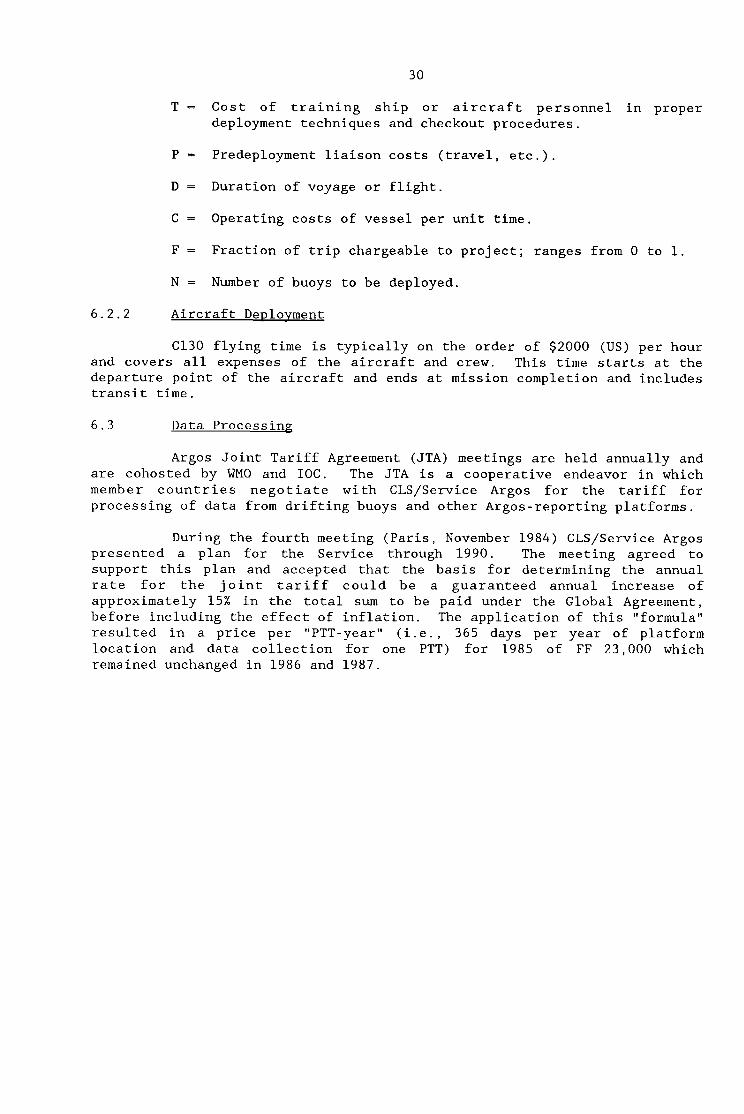
The "per buoy" deployment costs can be calculated from
cost = (S + T + P + D . C . F)/N where
S = Cost to ship buoys to staging area and store them until ready for loading.
30
T = Cost of training ship or aircraft personnel in proper deployment techniques and checkout procedures.
P = Predeployment liaison costs (travel, etc.).
D = Duration of voyage or flight.
C = Operating costs of vessel per unit time.
F = Fraction of trip chargeable to project; ranges from 0 to 1.
N = Number of buoys to be deployed.
6.2.2 Aircraft DeDlovment
C130 flying time is typically on the order of $2000 (US) per hour and covers all expenses of the aircraft and crew. This time starts at the departure point of the aircraft and ends at mission completion and includes transit time.
6.3 Data Processing
Argos Joint Tariff Agreement (JTA) meetings are held annually and are cohosted by WMO and IOC. The JTA is a cooperative endeavor in which member countries negotiate with CLS/Service Argos for the tariff for processing of data from drifting buoys and other Argos-reporting platforms.
During the fourth meeting (Paris, November 1984) CLS/Service Argos presented a plan for the Service through 1990. The meeting agreed to support this plan and accepted that the basis for determining the annual rate for the joint tariff could be a guaranteed annual increase of approximately 15% in the total sum to be paid under the Global Agreement, before including the effect of inflation. The application of this "formula" resulted in a price per "PTT-year" (i.e., 365 days per year of platform location and data collection for one PTT) for 1985 of FF 23,000 which remained unchanged in 1986 and 1987.
31
ANNEX I
REFERENCES
3.
4
5
6.
7.
8.
Barazotto, R.M., 1987: "Real-time Quality Control of Drifting- Buoy Data at the NOAA Ocean Products Centre," Proceedings, 13th Argos Users Conference.
Black, P.G., Elsberry, R.L., Shay, L.K., Partridge, R.P., and Hawkins, J . D. : "Atmospheric Boundary Layer and Oceanic Mixed Layer Observations in Hurricane Josephine Obtained from Air- Deployed Drifting Buoys and Research Aircraft," Submitted to Journal of Atmospheric and Oceanic Technology.
Gilhousen, D.B., 1988: "Quality Control of Meteorological Data from Automated Marine Stations," Preprints, Fourth AMS International Conference, Interactive Information and Processing Systems for Meteorology, Oceanography, and Hydrology.
U. S. Department of Commerce/National Oceanic and Atmospheric Administration/National Data Buoy Centre, 1988: U.S. TOGA Drifting-Buoy Logistics Plan.
U.S. Department of Commerce/National Oceanic and Atmospheric Administration, Federal Coordinator for Meteorological Services and Supporting Research, 1986: National Operations Plan for Drifting Data Buoys.
World Meteorological Organization, 1981, Proceedings, WMO Technical Conference on Automation of Marine Observations and Data Collection, Report No. 7 , Marine Meteorology and Related Oceanographic Activities.
World Meteorological Organization, 1988: Guide to Data Collection and Location Services Using Service Argos, Report No. 10, Marine Meteorology and Related Oceanographic Activities.
World Meteorological Organization, 1983: "Drifting Buoys in Support of Marine Meteorological Services" Report No. 11, Marine Meteorology and Related Oceanographic Activities.
33
ANNEX I1
DESCRIPTION OF MEMBER COUNTRIES' BUOY PROGRAMMES
To assist in the preparation of this Guide, the Joint IOC-WMO Circular Letter IGOSS Sp. No.87-45 of 22 April 1987 requested National Representatives for IGOSS to provide the Rapporteur with information relevant to the topics addressed in this Guide.
This annex contains descriptions of buoy programmes that were forwarded to the Rapporteur. The information is arranged in the same order as the contents of the Guide, where possible.
List of countries havinE submitted a report:
Australia
Canada
France
Greece
Iceland
Japan
Nether lands
New Zealand
Norway
Pakistan
Saudi Arabia
Union of Soviet Socialist Republics
United Kingdom
United States of America
Page
34
41
42
49
50
51
53
54
56
57
58
59
60
61
34
AUSTRALIA
Antarctic Division Drifting-Buov Programme
2.1 HISTORY OF BUOY DEVELOPMENT
The buoys used in the Antarctic Division programme are deployed in open water in the Antarctic summer and subsequently freeze into the pack ice, and the hulls must, hence, be capable of surviving collisions between ice floes. Buoys with a previous successful history of operation in Arctic pack ice, the ICEX series designed and built by the Chr. Michelsen Institute, Bergen, Norway, were used for this programme rather than developing a new buoy in Australia. Modifications were made to the ICEX buoy design in 1984 to incorporate a 100-m thermistor string for the Antarctic Division programme.
2.2 EXPERIMENTS AND OPERATIONS
Experimental investigations of sea ice drift and of conditions within the Antarctic seasonal sea ice zone between 40"E and 120"E longitude have been performed. Pilot programmes with buoy deployment in the Prydz Bay region (65-68"S, 70-80"E) were conducted in 1985 (3 buoys) and 1987 (6 buoys).
3.1 HULL
Fiberglass reinforced polyester sphere of 0.8-m diameter filled with polyurethane (40 kg) with a 15-kg counterweight on the bottom.
3.2 SENSORS
Anderaa barometer (0.15 hPa resolution).
Anderaa thermistor chain of 11 sensors at 1, 2, 3, 5, 10, 20, 30, 40, 50, 75 and 100 m depths (0.05"C resolution).
UUA 3253 thermistor for air temperature (0.2"C resolution) and sea-surface temperature (0.05"C resolution).
3.3 ELECTRONICS
CEIS Espace 82N PTT.
Processing unit with 32 analog or digital inputs, 10 programmable user pulses, processing programme, 32 K memory.
Temperature interface card.
3.4 DROGUES
Either the 100-m weighted thermistor chain or a weighted 100-m rope serve as a drogue.
35
4.1 LOG I ST I C S
Buoys are deployed from MV NELLA DAN during marine science research cruises in February/March.
4.2 DEVELOPMENT TECHNIQUE
Buoys are lowered to the water by a small crane on the ship’s hydrographic deck (see figure at end of this section).
5.1 SERVICE ARGOS
All buoys use Service Argos, are DRIBU coded, and on the GTS.
5.2 LOCAL USEK TERMINALS
None specifically for this programme. Data from the more easterly buoys can be received by the Bureau of Meteorology LUT in Melbourne.
5.3 REAL-TIME DATA AVAILABILITY
Via GTS or via the Bureau of Meteorology LUT for some buoys only.
5.4 DATA QUALITY
Generally high, although some barometers and thermistors in the chain have had calibration shifts after manufacture.
5.5 DATA ARCHIVAL
Processed and edited data are stored on magnetic tape within the Antarctic Division (Department of Arts, Sport, Tourism, and Environment).
6.1 HARDWARE
Purchase of 3 buoys with thermistor chains, 1984: $A 54,000
Purchase of 6 buoys with thermistor chains, 1986: $A 130,000.
6.2
6.3
LOG I STI CS
Within ongoing programmes. No separable cost.
DATA PROCESSING
System Argos charges (global tariff), 9 buoy years.
Inhouse software development and processing
$A 20,000 (1985), $A 25,000 (1987) (estimated).
36
ANTENNA ASSERSLY
,FLOATATION COLLAR
PALL
I.LIft crated buoy from truck as por fIg.3, It++ Noto Lift Contro at Gravltyl.
111 \\ ZUncrato buo; and dIspOse 04 wasto thoughtfully. **
L.C. 3.LI+t uncratod buoy as por CIg.4
4.9.t 3UOY an safe dock space and socur. to provont pallot from slldlnq.
* SPECIAL CAUTION WRIST BE M E R C I S E D TO AVOID DAHAGE TO THE ANTENNA ASSEnBLY E l
- F1O.S 3. - FTG.7 U.UII*IU m.cvII
I.Ro~ave metal Insort,Iaoo (19.6) and roplac. WIth 2 solubl. salt trb1.t. for oach rotrlnlnq strap attachment polnt (shown ~ l r ~ l o d l .
2.TIghtmn straps fIrnly.
Noto:On contact wlth tho wator,the soluble trblots dIsoIvo,allowIng sopar)tIon ot tho pallot assorbly and tho buoy.
S.
(Must not bo at to antonna roun
\U I
- Hay roqulro 4 to 6 persons.
I MAX. S A F E m o p HEIGHT.10 I.tr
2.Enruro qulck soparation 3otwoon launchod 3uOY and VO*UOl to avold 3anglng aga1n.t tho shlps hull. RECOHMENDED VESSEL SPEED
MAX. SAFE DROP HEIGHT-IO metros RECOntIENOED VESSEL SPEED
APPROX. 3 KNOTS I APPROX. 3 KNOTS
37
Commonwealth Scientific and Industrial Research Organization - (CSIRO) Marine Laboratories
Division of Oceanography
2.1 HISTORY OF BUOY DEVELOPMENT
The Division of Oceanography uses buoys tracked by satellite to reveal ocean current patterns and to relay environmental information. The programme began in 1972 when a CSIRO spar buoy carrying a transponder was tracked by the French ‘EOLE’ satellite. From 1975 the tracking was done by NASA and from 1980 to the present, by the French Service Argos.
The buoys have been employed with notable success to reveal, among other things, the dynamics of the Leeuwin Current and the eddies of the East Ails tralian Current Sys tem.
The electronics packages for the early buoys were quite large and awkward, being 3 meters long and 0.1 meter in diameter. To accommodate them, the hulls took the form of vertically floating 5 meter long spars fabricated from PVC sheet and reinforced with fiberglass.
In 1975 the hulls were decreased in size as a result of the decrease in the size of the electronics. In addition, they were changed to resemble short torpedoes, 1.6 meters long by 0.4 meter diameter. The torpedoes float horizontally, which reduces their drag to wind, wave and currents. The buoys are locked to the ocean currents by parachute sea anchors at the end of 50-meter-long tether lines. If the tether line parts, the buoy tilts and a mercury switch sends a signal. This has proven to be a useful diagnostic.
The transmitters for the buoys are purchased from France and the circuits for solar charging the batteries and for temperature measurement are designed and built in Hobart.
The Division plans to add an atmospheric pressure sensor as a module to the present buoy. In addition, a prototype profiler is being built to log temperature and depth on a probe that is lowered by a small solar-powered winch twice per day to a depth of 100 meters. This would make it suitable for work in the tropical Indian Ocean. The probe, on its return to the surface, is to transfer data via an inductive link. It is to be charged in the same way. This inductive link was developed for a submersible data logger designed by the Division.
Thirty-five torpedo buoys have been used from the tropics to the Southern Ocean, where one became dormant as it wintered over in the sea ice. With the return of the sun in September, the buoy began transmitting again.
Thirty buoys are being used in a joint CSIRO/RAN study of the East Australian Currenc from 1985-87.
The buoys have been released from research, merchant, and naval vessels as well as naval helicopters.
38
5.1 SERVICE ARGOS
Data dissemination by Service Argos.
5.2 LOCAL USER TERMINALS
No LUT per se, but data only (e.g., sea surface temperature) can be received at the CSIRO Hobart satellite reception station.
5.3 REAL-TIME DATA AVAILABILITY
The data from the present series of buoys are not formatted for GTS. The format will be modified for future buoys.
5.4 DATA QUALITY
Data are checked by trained personnel
5.5 DATA ARCHIVAL
Data are archived at CSIRO Division of Oceanography, Hobart.
6.1 HARDWARE
The parts cost is around $5k Australian.
6.2 LOGISTICS AND DEPLOYMENT
Freighting cost to port of call for deployment vessel. No deployment cost.
6 . 3 DATA PROCESSING
Argos tracking and tape charges.
39
Bureau of Meteorology
4.1 LOG1 STI C S
4.1.1 Deployment F'eriod
The main period of deployment of buoys by the Bureau of Meteorology in southern latitudes (40"s - 60"s) is the period September to March, using Antarctic resupply vessels.
Buoys are deployed in the remaining areas after the requirements of the higher latitudes have been satisfied. Commercial vessels are generally used.
4.1.2 Selection of DeDloyment Areas
The Bureau's National Meteorological Centre and Regional Offices are canvassed in May each year for their preferred deployment areas.
The Networks and Traffic Section select the deployment areas after considering these suggestions and:
(a) The number of buoys available;
(b) Whether they are drogued or undrogued;
(c) Existing and expected gaps in the network;
(d) Shipping routes and frequency of vessels; and
(e) Vessel suitability.
4.1.3 Liaison with Deployers
Once deployment areas and suitable vessels have been found, permission is sought from the vessels' owners, agents, and Masters. Liaison between the Bureau's Port Meteorological Agencs and the Networks and Engineering Sections and with the vessels' Masters ensure loading and deployment proceed smoothly.
4.1.4 Post-deployment
The Master notifies the Bureau of deployment details (location, time, buoy identification, and current pressure, air and sea temperatures) within one hour of deployment.
For Australian buoys, a WMO identification number is assigned and Service Argos and WMO are advised.
For TOGA buoys, these details are telexed to NDBC in Mississippi along with a request for a WMO identification number.
5.2 Local User Terminals
Bureau of Meteorology LUTs are located near Melbourne and Perth.
40
S-Band receivers were installed in July 1987. The data from the Argos transmitters on buoys are acquired from the TIROS Information Processor on the N O M satellites, and data from both readout centres are transmitted directly to FACOM computers in Melbourne for centralized processing.
The local reception allows for drifting-buoy data collection and location determination as far south as 55 to 60 degrees latitude and between longitudes 90 and 180 degrees east. Data collection can be achieved up to 20 degrees beyond these limits without location determination.
Location accuracy is approximately 0.1 to 0.3 degrees (11-33 km) at close range and 0.5 to 1.0 degree (55-110 km) at the extremes. This is nowhere near the accuracy of the location data provided by the Argos Processing Centre but is sufficient for most meteorological applications.
5.3 Real-time Data Availability
The Australian Bureau of Meteorology uses atmospheric pressure, air temperature, and SST data from all drifting buoys over the southern hemisphere. These data are received at the Bureau’s National Meteorological Centre from the Argos Processing Centre via the GTS and also (for coverage in the Australian region) from the LUTs in Melbourne and Perth. The data are processed in the NMC and sent by landline to forecasting centres.
The data received over the GTS are typically available within about 3 hours after data acquisition but can occasionally be received up to 6 hours after satellite observation time. The advantage of the LUT is that data for the local area of coverage are available much sooner than that received via the GTS. The LUT data are available consistently within 1 to 2 hours of observation time and there is potential for further reduction of this delay by refinement of processing procedures.
5.4 Data Quality
Bureau of Meteorology experience with drifting-buoy data indicates that the general level of quality is high. Data that are faulty are usually easily detected by routine monitoring procedures, as it has been found that individual buoys either provide consistently good readings or else show continuing large and obvious errors. Cases of marginal performance are rare.
It is estimated that at any given time only about 5 to 10% of buoys in the southern hemisphere network would be giving faulty data, and the remainder would be providing accurate readings. Usually, a faulty buoy shows large errors in all parameters simultaneously, but, occasionally, the pressure readings can be satisfactory and the SST in error, or vice versa.
41
Drifting-buoy programmes in Canada are undertaken principally by the Department of Fisheries and Oceans and by the Atmospheric Environment Service (AES) of the Department of Environment with assistance from the Departments of Transport, National Defence, and, occasionally, from private oil exploration companies.
The Atmospheric Environment Service (AES)
AES interest in drifting buoys arises out of its responsibility for weather, sea state, and ice forecasting for Canadian waters. The Service operates two Local User Terminals; one in Edmonton, Alberta, and the second in Downsview (Toronto), Ontario. In addition, AES deploys and maintains drifting buoys in the Pacific and Arctic Oceans as outlined below.
(a) Pacific Ocean
All six drifting buoys normally report barometric pressure and water temperature, and some have additional wind speed and air temperature sensors.
Pacific Region has eight drifting buoys on hold for deployment. To maintain a spatial network in the northeast Pacific, it is proposed to air deploy three MetOcean mini-drifters. These will report barometric pressure and air and water temperature.
(b) Arctic Basin
Air-dropped buoys generally measure only pressure and internal temperature, which is considered representative of the air temperature. Surface-deployed buoys are set out on the ice on an opportunistic basis as CO -operation is secured from exploration interests or research groups. These buoys usually have wind and relative humidity sensors in addition to pressure and temperature. Upon successful deployment, buoys generally transmit for one to two years until the batteries fail or ice damages them.
Real-time transmissions from the buoys are received at the AES satellite reception facility in Edmonton. Information is decoded and data are reformatted for transmission on the GTS. Data from the buoys are plotted for analysis of mean sea level pressure charts, to study ice motion, and are used for various scientific studies and research.
42
FRANCE
2. BACKGROUND
The SOBA programme, which is conducted under the COST-43 agreement, has been located in the Irminger Sea. France contributes to this programme and also undertakes the technical co-ordination. The data from these buoys are collected by the Argos system (full earth segment or LUT) then inserted onto the GTS. The parameters measured must include atmospheric pressure and sea surface temperature.
The SCOS programme, which is based on principles very similar to those of SOBA, began at the end of 1986. France will provide four buoys per year and will again undertake the technical co-ordination.
In addition, the installation and evaluation of new sensors is continuing (for wind, for which the measurement is not yet fully viable, and for ocean surface layer temperatures). Buoys, specially equipped for such temperature measurements, are now being tested at Brest or deployed in other areas (SCOS, Ocean Storms,...).
Up to four Ecomar drifting buoys are being operated as the French contribution to TOGA.
Ecomar Buoy
3.1
3.2
3.3
HULL
Shape : Weight: 26 kg Ballast Weight: 11 kg Length : 1.20 m Diameter: 0.20 m Material : fiberglass
cy 1 inde r
SENSORS
No sensor
Buoy location only to describe ocean currents.
ELECTRONICS
Argos PTT 60 seconds between transmissions
Primary batteries Life: 12 months with alkaline batteries
Argos message: 32 bits (all "0")
3.4 DROGUES
Window-shade type
4 3
The drogue can be attached directly under the buoy (maximum wet weight 11 Kg); a surface floating line may also be used to support the drogue so that the buoy is not influenced by drogue motions.
Ecolap Buoy
Same as Ecomar, but a temperature sensor measures the temperature of the hull which is supposed to be the sea surface temperature.
Focal Buoy
3.1
3.2
3.3
3 . 4
HULL
Shape : cylinder and conical parts Weight: 135 kg Length : 2.70 m Max diameter: 0.80 m Min diameter: 0.20 m
SENSORS
Thermistor chain with a maximum of 15 thermistors.
Hydrostatic pressure: at the end of the thermistor chain.
Other hydrostatic pressure can be added, but, in that case, the number of thermistors has to be reduced.
Housekeeping parameters such as battery voltage.
ELECTRONICS
Argos PTT 60 seconds between transmissions
Acquisition and processing sub-system connected to the sensors and to the PTT.
Primary batteries Life: 12 months
Argos message 5 x 32 bits
DROGUES
Window-shade type
The drogue is attached to a surface floating line. The depth can be changed according to the user’s specifications.
44
"Marisonde BT" Buov
3.1 HULL
3.2
3.3
Shape : cylinder and conical parts Weight without ballast or chain: 85 kg Weight of thermistor chain (100 m): 50 kg Length : 2.8 m Maximum diameter: 0.9 m Material: fiberglass and polyester
SENSORS
Barometric pressure:
Sub-surface temperature:
Battery voltage:
ELECTRONICS
pres sure tendency calculated for 3 hours.
10 levels down to 100-m depth and hydrostatic pressure at end of chain. The chain can be replaced by a single sensor for SST
Argos PTT: 60 seconds between each message.
Acquisition and processing sub-system connected to sensors and PTT .
Delay between two collections of measurements may be programmed to 15 minutes, 1 or 3 hours.
Primary batteries: 12 months
Argos messages of 8x32 bits compatible DRIBU.
Manufacturers: CEIS ESPACE Z. I. THIBAULT Rue des Freres BOUDES F-31084 Toulouse CEDEX
Operator: DIRECTION DE LA METEOROLOGIE CENTRE DE METEOROLOGIE MARINE
29273 Brest CEDEX - Contact P. Blouch IFREMER - BP 337
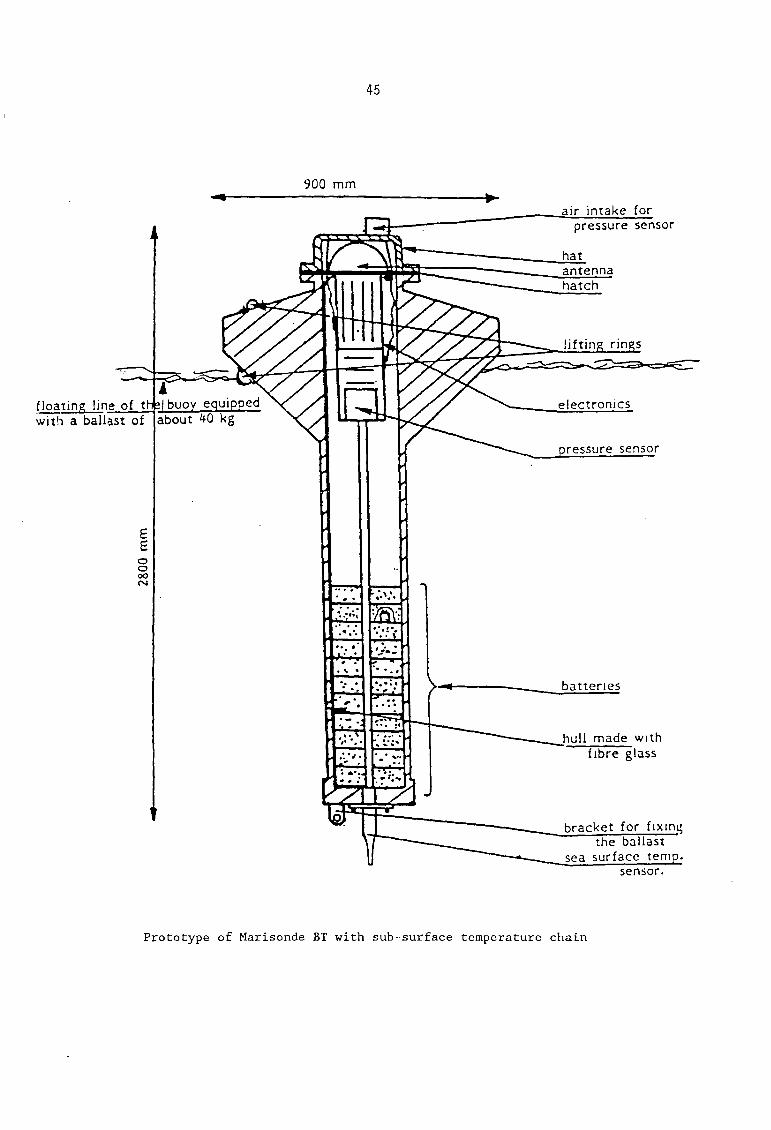
45
floaring line of t with a ballast of
900 m m t
- bracket for fixing sea surface temp.
the ballast
sensor.
ull made with
Prototype of Marisonde BT with sub-surface temperature chain
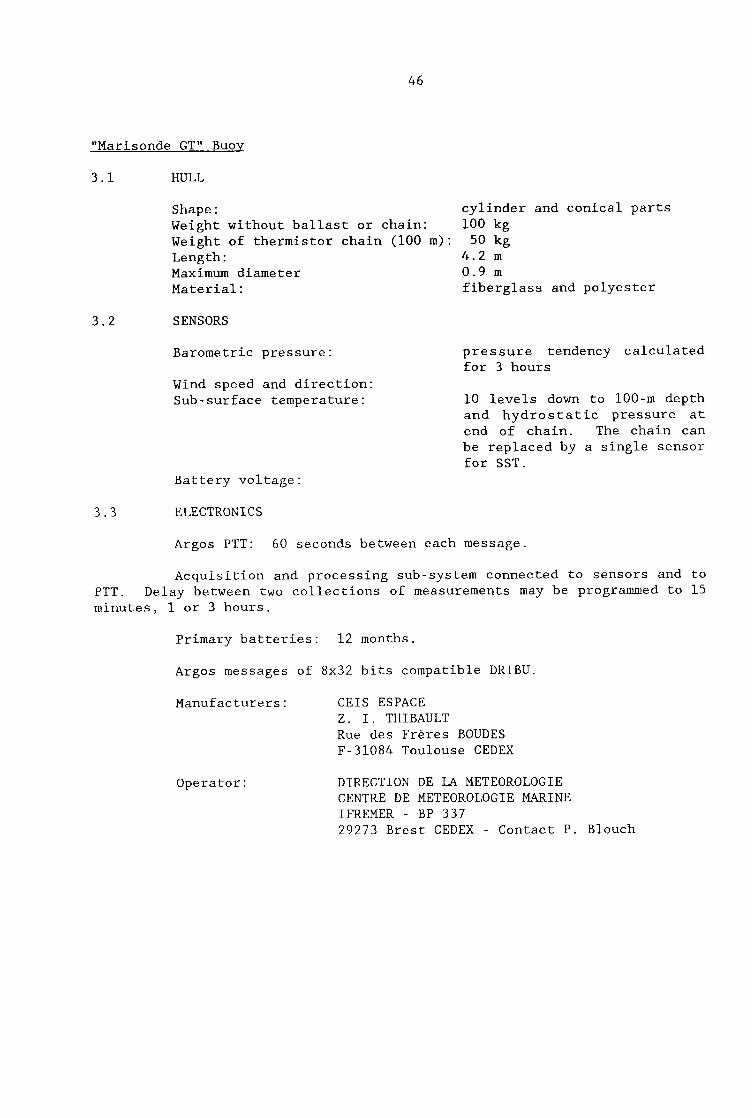
46
"Marisonde GT" Buoy
3.1 HULL
3.2
3.3
Shape : Weight without ballast or chain: Weight of thermistor chain (100 m): Length : 4.2 m Maximum diameter 0.9 m Material : fiberglass and polyester
cylinder and conical parts 100 kg 50 kg
SENSORS
Barometric pressure:
Wind speed and direction: Sub-surface temperature:
Battery voltage
ELECTRON1 C S
pressure tendency calculated for 3 hours
10 levels down to 100-m depth and hydrostatic pressure at end of chain. The chain can be replaced by a single sensor for SST.
Argos PTT: 60 seconds between each message.
Acquisition and processing sub-system connected to sensors and to Delay between two collections of measurements may be programmed to 15 PTT.
minutes, 1 or 3 hours.
Primary batteries: 12 months
Argos messages of 8x32 bits compatible DRIBU.
Manufacturers: CEIS ESPACE Z. I. THIBAULT Rue des Freres BOUDES F-31084 Toulouse CEDEX
Operator: DIRECTION DE LA METEOROLOGIE CENTRE DE METEOROLOGIE MARINE
29273 Brest CEDEX - Contact P. Blouch IFREMER - BP 337
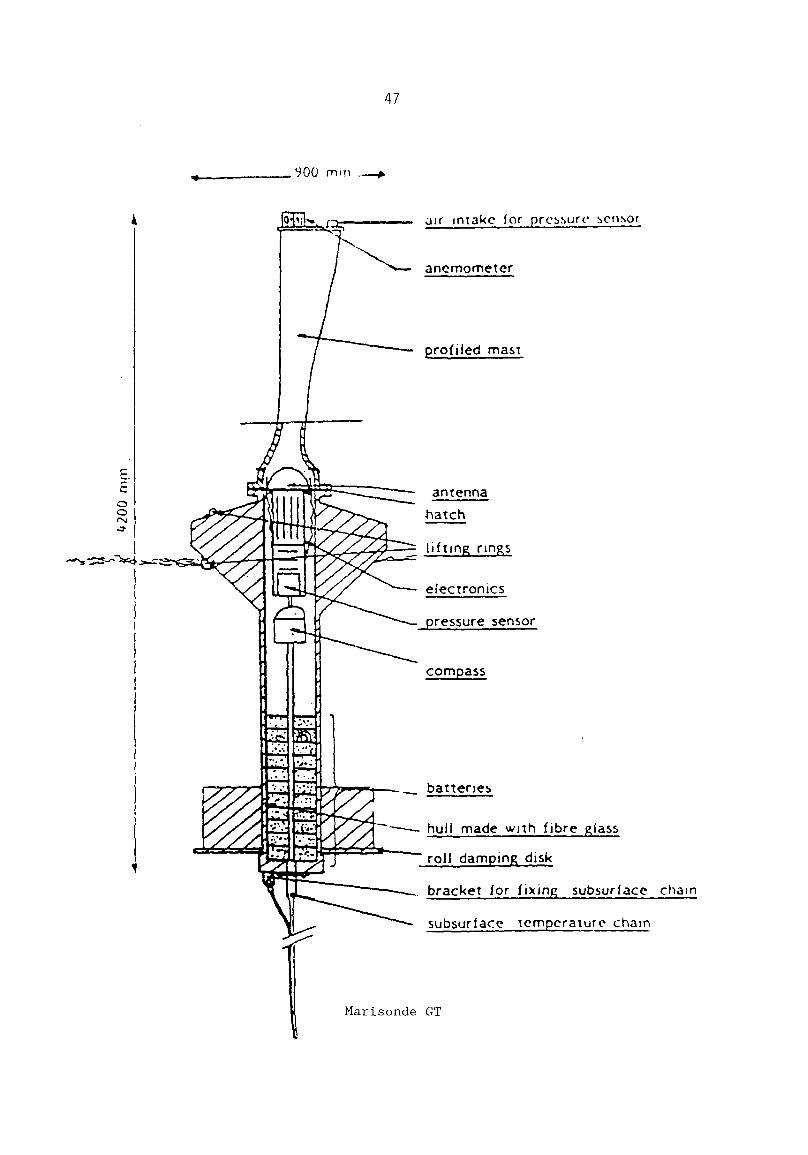
47
E E 0 0 ry s
ancmornetcr
profiled mas1
anrenna hatch
lifting rings
electronics
compass
- hull made with fibre glass bracket for fixing subsurface
1 subsurface tcrnwralurc chain
chatn
Marisonde GT
48
5.4 DATA QUALITY
At the Meteorological Office, data quality is assessed for DRIBU data after their insertion onto the GTS in three steps:
(a) Message decoding and first automatic form controls (digits groups, beginning and end signs...); if difficult, possibility of manual supervision which can allow the correction of evident errors and the rerunning of automatic procedures;
(b) Automatic range checks against succinct (not changing versus the season for instance) climatology, which give a quality flag for each observation;
(c> More sophisticated controls only for data collected at synoptic (or almost) hours on the coverage area of the models during the objective analysis used as input for numerical prediction; comparison with the first- guess field, namely 6-hour forecast, and removal of observation if departure exceeds a threshold depending on both observation and guess-field error variances; comparison with the result of an analysis determined from the neighboring data except the considered observation itself. The residue must be lower than a value, function of mean quality of the analysis. Additional quality flags are attributed after these last controls.
Steps (a) and (b) are called pre-processing, while (c) is the data processing itself.
5.5 DATA ARCHIVAL
Only DRIBU data collected from the GTS are archived. This archival has global coverage and doesn't take into account the analysis flags at the present. In order to avoid the dangerous effects of redundancies in analysis, some information compression is performed: in an area of 0.5- in latitude and longitude and a 10-minute duration, only the first message received (generally through a LUT if it exists) is retained for a given platform. No further quality control of data is performed. Monthly charts plotting the positions of observations and giving spatial density for each Marsden square are produced and internationally disseminated in the frame of IGOSS (Specialized Oceanographic Centre for drifting-buoy data, Paris, France).

49
GREECE
Greece has not had any experience with drifting buoys or any other sort of buoy for meteorological/oceanographic services. To operate drifting buoys in the eastern Mediterranean may not be very successful considering the many islands, close sea areas, and short distances between coasts. In any case, Greece plans to deploy, for the first stage, one or two moored wave buoys.
50
ICELAND
The contribution of Iceland is small, but significant. It is concerned primarily with managing the deployment by merchantmen of drifting buoys owned by other countries. See comments under 3 "DRIFTING-BUOY HARDWARE" for Iceland's view on hardware quality control.
51
JAPAN
2. BACKGROUND
Drifting buoys are utilized to detect the path and velocity of the Kuroshio Current by the Maritime Safety Agency, and they are also utilized to investigate the effect of ocean current on fisheries by the Tokai Regional Fisheries Laboratory of the Fisheries Agency. The buoy data, however, are not furnished for the routine operation of ocean analysis and forecasting, yet. Ocean current information is distributed Erom che Japan Meteorological Agency and the Maritime Safe ty Agency by radio facsimile and by publications.
Since two major currents, Kuroshio and Oyashio, play a very important role in determining ocean conditions in waters adjacent to Japan, it is expected that, in the future, driEting-buoy systems will be utilized in Japan more effectively.
Maritime Safetv Agency -
3. HARDWARE
Shape : spindle type Dimension: 1.72 m high, 0.7 m maximum diameter Weight : 65 kg Observation: SST at 1-m depth (accuracy 0.l"C) Drogue : 1.5 m x 4.0 m made of sailcloth at 20-rn depth
4 OPERATIONS
1984: 4 buoys 1985: 5 buoys 1986: 3 buoys 1987 : 6 buoys (as oE July) Area of deployment: In areas of the North Pacific and Kuroshio
Currents
5. DATA
Location-calculated data received on magnetic tape from Argos. Archiving on floppy disk.
Tokai Regional Fisheries Laboratory
3. HARDWARE
Shape : spindle type Dimension: 2.1 III high, 0.7 m maximum diameter Weight: about 50 kg Observation : SST at 1-m depth (accuracy 0.L"C) Drogue : 1.5 m s 4.0 m made O E sailcloth at 5- to 8-m
depth
52
4. OPERAT IONS
1984:
1987 : 1985:
5 .
1 buoy in area of cold current Oyashio 1 buoy in warm water area near Oyashio 1 buoy in area of cold current Oyashio
Location-calculated data received on magnetic tape from Argos. Archiving on magnetic tape.

53
NETHERLANDS
The Netherlands supports the COST-43/SOBA programme. In addition to this programme, the Netherlands will start its contribution to the SCOS programme. The contribution to each programme will probably be one drifting buoy, since two drifting buoys (supplied by Bergen Ocean Data) have already been appointed for use within COST-43. In 1988, the contribution to the COST-43 programme will also be a total of two buoys.
54
NEW ZEALAND
2. BACKGROUND
The New Zealand Meteorological Service first became involved with drifting buoys during FGGE, when New Zealand purchased several buoys and arranged for the deployment of these and other buoys owned by participating countries.
In 1984 the Meteorological Service again became actively involved with drifting-buoy programmes, assisting with the deployment of buoys in support of TOGA and purchasing the buoys necessary to maintain an effective array in the oceans around New Zealand.
3.1 HULL
The New Zealand Meteorological Service has used standard FGGE type buoys as supplied by the major drifting-buoy suppliers.
3.2 SENSORS
The first batch of five buoys purchased were equipped with barometric pressure, air temperature, and sea surface temperature sensors. However, we have since taken delivery of five buoys with wind speed and direction sensors, in addition to the above standard sensors, and, if these prove successful, expect to continue using them.
3.' ELECTRON1 C S
The standard electronics systems offered by the major drifting- buoy suppliers have been used exclusively.
Each year POI- tlie past three years the Meteorological Service has pui-rhasrd i i7.7e buoys arid arraiiged for their deployment, plus an average of SC'~"CII liur,y~ p ~ i * year 011 beliali oi: the US National Data Buoy Centre.
'I!)(-- majority of the buoys have been launched from ships of G ~ ; ~ I c I ~ I : ~ ~ I ~ ~ t.7 cil~ei-at in,.; 11et:wc.en New Zealand and South America or the Pacific I cl ;inc!s 61?d f ]-om a KC?L Zeal and government research vessel.
ili : Iiougli clie buoys used have been suitable for manual de1:loyment i ? ; , e , ~ sjirl';'~ being pushed over the side of the ship), in most cases tlie ilJ,zsl-cr o € i l i t : vessel has elected to use a crane or derrick to launch the 11 11 0 y .
?lie Royal New Zealand Air Force has been approached regarding the possible deployment of buoys from its C130 Hercules aircraft, and we are hopeful that this will facilitate the launching of buoys in the Tasman Sea.
55
5.1 SERVICE ARGOS
All buoys are registered with Service Argos and their reports inserted onto the GTS.
5.2 LOCAL USER TERMINALS
The New Zealand Meteorological Service operates a satellite terminal and processes buoy reports for local use. This enables reports to be available to forecasters considerably faster than via the GTS.
5.3 REAL TIME DATA-AVAILABILITY
The LUT provides near-real.-time data (within half an hour of the satellite pass). GTS data are normally received within six hours of observation.
5.4 DATA QUALITY
Buoy data quality is closely monitored during manual and machine analysis.
Generally, the data quality is very good, although at times it is necessary to apply corrections to allow for sensor driPt. Most buoys have been found to give meaningful readings for at least 12 months.
5.5 DATA ARCHIVAL
Processed drifting-buoy reports are arcliived both el ecl ~roiiical ly and as hard copy. Weather charts including p1 ctted liuoy reports are a1 so archived.
56
NORWAY
Norway is cooperating with the United States and Canada as part of the Arctic Basin Programme in deploying ice-drift based automatic stations in the Arctic. The contribution of Norway will continue to be 2-4 stations per year. Parameters obtained are barometric pressure, pressure tendency, and air temperature. The institutions in Norway taking part in the project are the Norwegian Research Institute and the Norwegian Meteorological Institute. The Norwegian Polar Institute will also deploy annually three ice-drift based automatic stations in the northern parts of the Barents Sea.
A winter Marginal Ice Zone Experiment took place in 1986-87. During this experiment, a number of stations were deployed on ice and in the water in the Fram Strait. The leading institution for this experiment is the Geophysical Institute, University of Bergen, in co-operation with other institutions and research groups in Norway and other countries.
(b) Norwegian Sea and Barents Sea
The Institute for Marine Research will continue to deploy drifting buoys in the North Sea, the Norwegian Sea, and the Barents Sea for studies of eggs and larvae, and in the coastal current to study vortices and small scale features on the coastal-current-front.
The Norwegian Meteorological Institute will continue to deploy drifting and small moored buoys in the Norwegian Sea and Barents Sea during 1987.
57
PAKISTAN
The Pakistan Space and Upper Atmosphere Research Commission is planning to deploy a few drifting buoys in the Arabian Sea near the Pakistani coast. The buoys will be used to transmit meteorological as well as oceanographic data to a station located at Karachi. The use of the Argos system is under consideration for this purpose. The deployment of such buoys will help in weather forecasting, oceanographic studies, and marine studies being carried out in the country.

58
SAUDI ARABIA
Drifting buoys have been used to provide real-time observational data for oil pollution forecasts in the Arabian Gulf. Several deployment methods were used. Initially, buoys were hung under Civil Defense helicopters, transported to the launch site, lowered into the sea and released. Oil company workboats and Coast Guard vessels were also used for deployments using the more usual method oE lowering over the side and releasing with pelican hook devices. After the initial deployments, recovery and subsequent re-use were made prior to land-fall by using workboats and small craft. On several occasions, when recovery plans failed, the buoys were beached in neighboring countries. This delayed the recovery and redeployment of the buoys. Some buoys were never recovered because they were damaged upon beaching causing a loss of signal. In several cases, the oil companies in the region cooperated very effectively to return the buoys for re-use.
In the follow-on drifting-buoy programme, an additional ten buoys were ordered and were received from France. Two short experiments have been conducted off Jeddah in the central Red Sea in an attempt to gain understanding of the currents near the Jeddah Islamic Port and the desalination plant to the north of the city. Similar experiments are scheduled for the sea area west of Yanbu in the northeast Red Sea.
The experience gained by Saudi Arabia's drifting-buoy technologies and systems will be beneficial toward participation as an even stronger member of regional organizations. The drifting-buoy programme, as a part of the national marine programme, will move toward meeting programme objectives and may well serve as an example for other organizations and institutions in this part of the world. The activities to date are limited to the enclosed areas of the Gulf and Red Sea. Future developments through regional organizations may well lead to additional areas.

59
UNION OF SOVIET SOCIALIST REPUBLICS
The Soviet Union recognizes the value of drifting-buoy programmes and fully supports the WWW and WCRP in their efforts. The Soviet Union offers to assist in the deployment of drifting buoys from oceanographic research vessels as well as from Antarctic supply and other vessels reaching high southern latitudes. In addition, research vessels, equipped with reference instruments, could be supplied for buoy data comparison and calibration purposes.
60
UNITED KINGDOM
The United Kingdom Meteorological Office continues to support the COST-43 drifting-buoy programmes. At least ten more buoys will be deployed for SOBA (SE of Iceland) and two for SCOS (Azores region) over the next two years. Discussions are taking place to continue this operational activity after the present COST-43 agreement expires in 1988.
During 1986, the British Antarctic Survey deployed two buoys in the Antarctic sea ice as a contribution to the Winter Weddell Sea Project. It is hoped to retrieve these buoys, which have operated successfully, re- furbish and re-deploy them, together with a previously recovered wavebuoy, towards the end of 1987.
Other United Kingdom programmes for oceanographic research purposes in the Continental Shelf region involving the use of drifting buoys during 1987 are planned by the Institute of Oceanographic Sciences, the Scottish Marine Biological Association, and the Sea Mammal Research Unit.
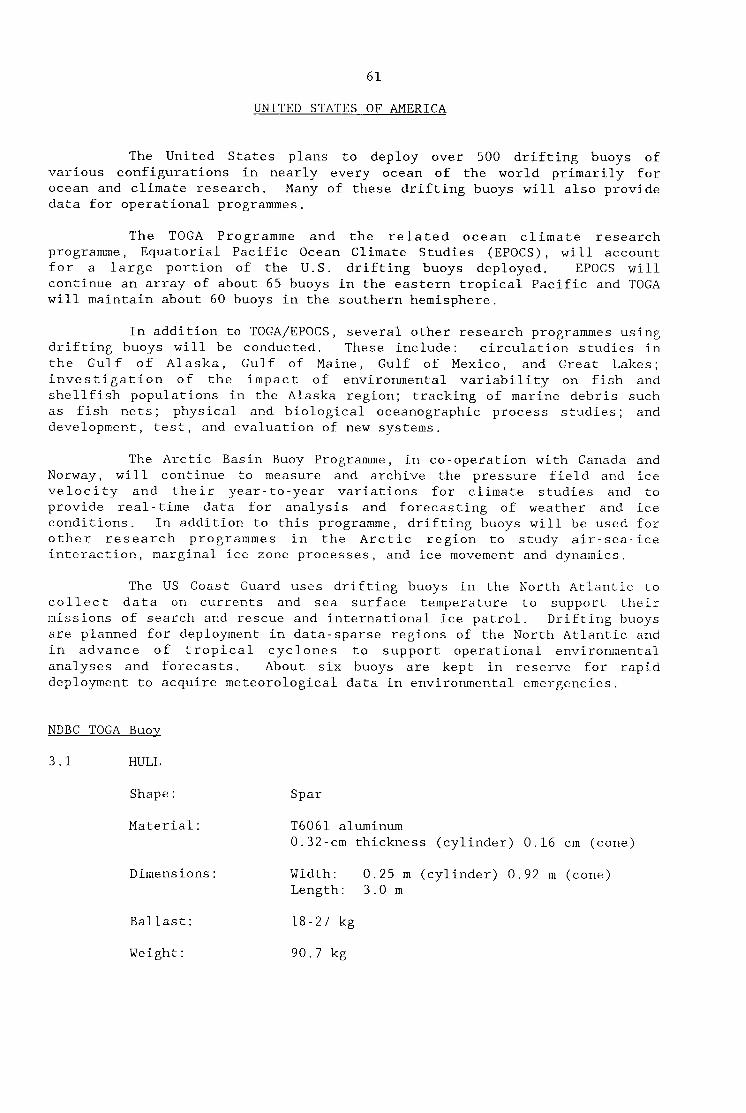
61
UNITED STATES OF AMERICA
The United States plans to deploy over 500 drifting buoys of various configurations in nearly every ocean of the world primarily for ocean and climate research. Many of these drifting buoys will also provide data for operational programmes.
The TOGA Programme and the related ocean climate research programme, Equatorial Pacific Ocean Climate Studies (EPOCS), will account for a large portion of the U.S. drifting buoys deployed. EPOCS will continue an array of about 65 buoys in the eastern tropical Pacific and TOGA will maintain about 60 buoys in the southern hemisphere.
In addition to TOGA/EPOCS, several other research programmes using drifting buoys will be conducted. These include: circulation studies in the Gulf of Alaska, Gulf of Maine, Gulf of Mexico, and Great Lakes; investigation of the impact of environmental variability on fish and shellfish populations in the Alaska region; tracking of marine debris such as fish nets; physical and biological oceanographic process studies; and development, test, and evaluation of new systems.
The Arctic Basin Buoy Programme, in co-operation with Canada and Norway, will continue to measure and archive the pressure field and ice velocity and their year-to-year variations for climate studies and to provide real-time data for analysis and forecasting of weather and ice conditions. In addition to this programme, drifting buoys will be used for other research programmes in the Arctic region to study air-sea-ice interaction, marginal ice zone processes, and ice movement and dynamics.
The US Coast Guard uses drifting buoys in the North Atlantic to collect data on currents and sea surface temperature to support their missions of search and rescue and international ice patrol. Drifting buoys are planned for deployment in data-sparse regions of the North Atlantic and in advance of tropical cyclones to support operational environmental analyses and forecasts. About six buoys are kept in reserve for rapid deployment to acquire meteorological data in environmental emergencies.
NDBC TOGA Buoy
3.1 HULL
Shape :
Material :
Dimensions:
Ballast :
Weight
Spar
T6061 aluminum 0.32-cm thickness (cylinder) 0.16 cm (cone)
Width: 0.25 m (cylinder) 0.92 m (cone) Length: 3.0 m
18 - 27 kg
90.7 kg
62
3.2 SENSORS
Barometric pressure
SST
Air temperature
The following sensors are still considered to be under development:
Wind speed
Wind direction
Sub-surface temperature to 600 m
Significant wave height, period, wave spectra
3.3
3 . 4
4 . 2
ELECTRONICS
Argos PTT: repetition rate 40-60 sec
Argos message: 32 to 256 bits
Battery life: 1 2 - 1 8 months
DROGUE
Normally not used.
DEPLOYMENT
Ship
Aircraft ( C 1 3 0 , C 1 4 1 )
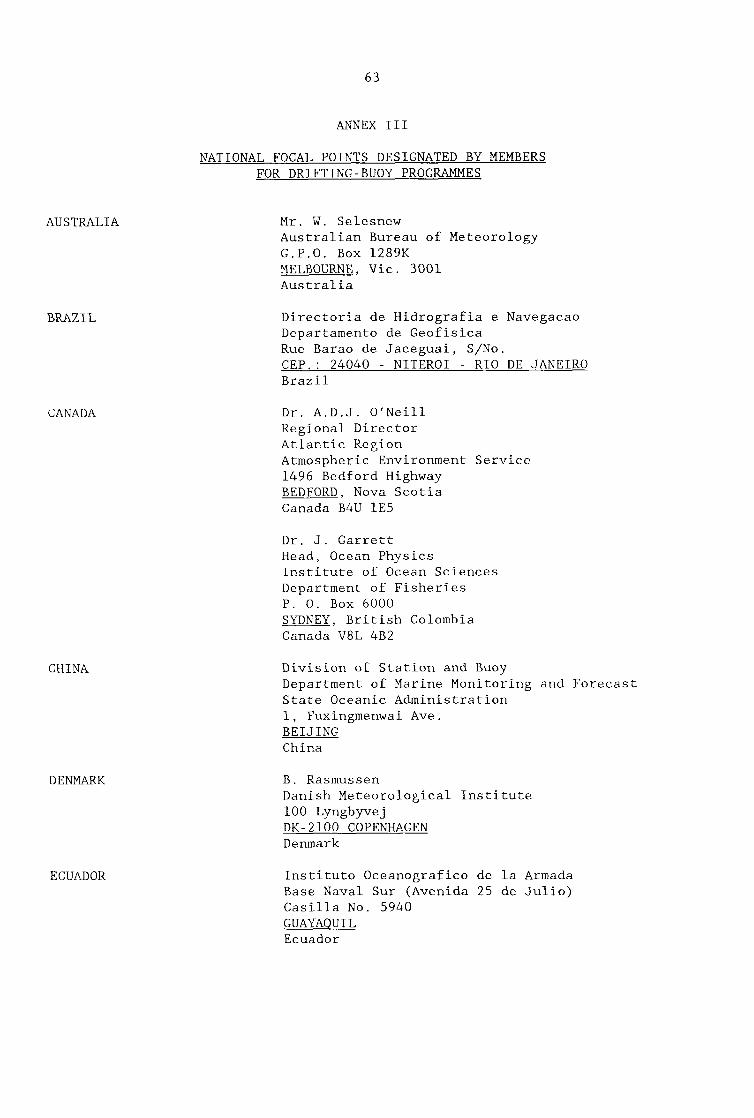
63
ANNEX I11
AUSTRALIA
BRAZIL
CANADA
CHINA
DENMARK
ECUADOR
NATIONAL FOCAL POINTS DESIGNATED BY MEMBERS FOR DRIFTING-BUOY PROGRAMMES
Mr. W. Selesnew Australian Bureau of Meteorology G.P.O. Box 1289K MELBOURNE, Vic. 3001 Aus t r a1 i a
Directorla de Hidrografia e Navegacao Departamento de Geofisica Rue Barao de Jaceguai, S/No.
Brazil CEP.: 24040 - NITER01 - RIO DE JANEIRO
Dr. A.D.J. O’Neill Regional Director Atlantic Region Atmospheric Environment Service 1496 Bedford Highway BEDFORD, Nova Scotia Canada B4U 1E5
Dr. J. Garrett Head, Ocean Physics Institute of Ocean Sciences Department of Fisheries P. 0. Box 6000 SYDNEY, British Colombia Canada V8L 4B2
Division of Station and Buoy Department of Marine Monitoring and Forecast State Oceanic Administration 1, Fuxingmenwai Ave. BEIJING China
B. Rasmussen Danish Meteorological Institute 100 Lyngbyvej
Denmark DK-2100 COPENHAGEN
Instituto Oceanografico de la Armada Base Naval Sur (Avenida 25 de Julio) Casilla No. 5940 GUAYAQUI L Ecuador
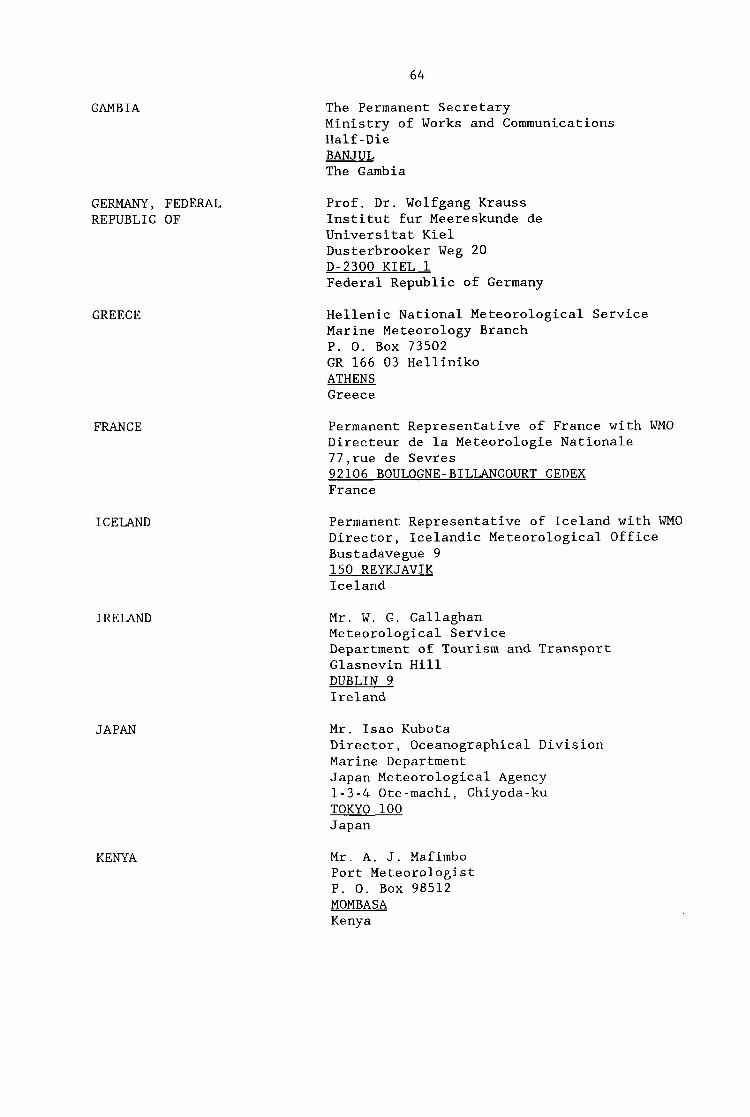
64
GAMBIA
GERMANY, FEDERAL REPUBLIC OF
GREECE
FRANCE
ICELAND
IRELAND
JAPAN
KENYA
The Permanent Secretary Ministry of Works and Communications Half -Die BANJUL The Gambia
Prof. Dr. Wolfgang Krauss Institut fur Meereskunde de Universitat Kiel Dusterbrooker Weg 20
Federal Republic of Germany D-2300 KIEL 1
Hellenic National Meteorological Service Marine Meteorology Branch P. 0. Box 73502 GR 166 03 Helliniko ATHENS Greece
Permanent Representative of France with WMO Directeur de la Meteorologie Nationale 77,rue de Sevres
France 92106 BOULOGNE-BILLANCOURT CEDEX
Permanent Representative of Iceland with WMO Director, Icelandic Meteorological Office Bustadavegue 9 150 REYKJAVIK Ice land
Mr. W. G. Callaghan Meteorological Service Department of Tourism and Transport Glasnevin Hill DUBLIN 9 Ire land
Mr. Isao Kubota Director, Oceanographical Division Marine Department Japan Meteorological Agency 1-3-4 Ote-machi, Chiyoda-ku TOKYO 100 Japan
Mr. A. J. Mafimbo Port Meteorologist P. 0. Box 98512 MOMBASA Kenya
65
MAURITIUS
MEXICO
NETHERLANDS
NEW ZEALAND
NORWAY
PAKISTAN
PERU
A. W. Oodally Meteorological Service VACOAS Mauritius
Gilbert0 Lopez Lira Director General de Oceanografia Naval, Secretaria de Marina Direcciopn General de Estudios, Informacion y Estadistica Sectorial Secretaria e Agricultura y Recursos Hidraulicos Avenida del Observatorio 192 Col. Observatorio 11860 MEXICO, D. F. Mexico
A.T.F. Grooters Royal Netherlands Meteorological Institute Postbus 201 3730 AE DE BILT Netherlands
Permanent Representative of New Zealand with WMO Director, New Zealand Meteorological Service P. 0. Box 722 WELLINGTON New Zealand
Permanent Representative of Norway with WMO Director, Det Norske Meteorologiske Institutt P. 0. Box 320, Blindern
Norway 0314-OSLO 3
Director, Centre of Excellence in Marine Biology University of Karachi c/o Pakistan National Commission for Unesco Block VI11 Civic Centre G-6 ISLAMABAD Pakistan
Capitan de Corbeta Hector Soldi Soldi Servicio Nacional de Meteorologia e Hidrologia Avenida Republica de Chile 295, Apartados 1308 4862 LIMA Peru
66
SAUDI ARABIA
USSR
Abdul Karim M. Henaidi Director of Observations and System P. 0. Box 1358, MEPA JEDDAH Saudi Arabia
Co-ordinator on Drifting-Buoy Programme USSR State Committee for Hydrometeorology and Control of Natural Environment Marine Department, 12 Pavlik Morozov Street
USSR 123376 MOSCOW D-376
UNITED ARAB EMIRATES H. E. Mohamed Yahya Al-Suweidi Permanent Representative of the UAE with WMO Assistant Undersecretary for Civil Aviation Ministry of Communications P. 0. Box 900 ABU DHABI United Arab Emirates
UNITED KINGDOM
UNITED STATES OF AMERICA
URUGUAY
P. G. Collar Institute of Oceanographic Sciences Brook Road, Wormley GODALMING, Surrey GU8 5UB United Kingdom
Glenn D. Hamilton National Data Buoy Centre, N O M NSTL, Mississippi 39529 USA
Capitan de Corbeta (C/G) Ricardo Dupont Servicio de Oceanografia, Hidrologia Y Meteorologia de la Armade Departamento de Ayuda a la Navegacion Capurro 980 Casilla de Correo 1381 MONTEVIDEO Uruguay
67
ANNEX IV
LIST OF ACRONYMS/ABBREVIATIONS
AE S Atmospheric Environment Service (Canada)
BUFR Binary Universal Form for Representation of meteorological data
CDA Command and Data Acquisition
C IMO Commission for Instruments and Methods of Observation (WMO)
CLS Collecte-Localisation-Satellites
CMOS Complementary Metal Oxide Semiconductor
CNES Centre National d'Etudes Spatiales (France)
COST 43 European Co-operation in the field of Scientific and Technical Research - Project 43: Setting up of an experimental network of Ocean Stations in European Waters
CSIRO Commonwealth Scientific and Indus trial Research Organization (Australia)
DBCP Drifting-Buoy Co-operation Panel (IOC-WMO)
DCLS Data Collection and Location System (Argos)
DRIBU WMO Code form FM 14-VI11
ECWMF European Centre for Medium-range Weather Forecasting
EPOCS Equatorial Pacific Ocean Climate Studies (USA)
FGGE First GARP Global Experiment
FRGPC French Global Processing Centre (Argos)
GARP Global Atmospheric Research Programme (WMO-ICSU)
GF3 General Format No.3 (IODE) (for international exchange of oceanographic data in delayed mode)
GPC Global Processing Centre (Argos)
GTS Global Telecommunication System (WO)
ICSU International Council of Scientific Unions
IFREMER Institut FranGais de Recherche pour 1'Exploration de la Mer (France)
IGOSS Integrated Global Ocean Services System (IOC-WMO)
68
IOC Intergovernmental Oceanographic Commission
IODE
J TA
LUT
MEDS
NCDC
NDBC
NESDIS
NMC
NOAA
OPC
PCM
PRL
PSK
PTT
QC
RF
scos
S COR
SOBA
S ST
TCXO
TIROS
TOGA
UHF
USGPC
UTC
VHF
International Oceanographic Data and Information Exchange (IOC)
Joint Tariff Agreement (Argos)
Local User Terminal
Marine Environmental Data Service (Canada)
National Climate Data Centre (USA)
National Data Buoy Centre (USA)
National Environmental Satellite, Data, and Information Service (USA)
National Meteorological Centre
National Oceanic and Atmospheric Administration (USA)
Ocean Products Centre (USA)
Pulse Code Modulation
Polar Research Laboratory (USA)
Biphase (or split phase) Phase Shift Keying
Platform Transmitter Terminal
Quality Control
Radio Frequency
Southern COST 43 Operational (Drifting Buoy) System (COST 43)
Scientific Committee on Oceanic Research (ICSU)
System of Operational Buoys in the (North) Atlantic (COST 43)
Sea Surface Temperature
Temperature-Compensated Crystal Oscillator
Television and Infra-Red Observing Satellite (NOAA)
Tropical Ocean and Global Atmosphere (WCRP)
U1 tr ahi gh Frequency
US Global Processing Centre (Argos)
Universal Time Co-ordinated
Very High Frequency

WCRP
WG
WMO
WOCE
www
69
World Climate Research Programme (WMO-ICSU)
Working Group (SCOR)
World Meteorological Organization
World Ocean Circulation Experiment (WCRP)
World Weather Watch (WO)