grupo cementos de chihuahua, s.a.b. de c.v. … · grupo cementos de chihuahua, s.a ... • fitch...
TRANSCRIPT
GRUPO CEMENTOS DE CHIHUAHUA, S.A.B. DE C.V.
(BMV: GCC *) Fourth quarter 2016 earnings results
1
4Q2016 Earnings
GCC REPORTS FOURTH QUARTER 2016 RESULTS
Chihuahua, Chihuahua, Mexico, April 27, 2017 – Grupo Cementos de Chihuahua, S.A.B. de C.V. (“GCC” or the “Company”) (BMV: GCC*), a leading producer of cement and ready mix in markets in the United States and Mexico, today announced its results for the fourth quarter of 2016.
HIGHLIGHTS
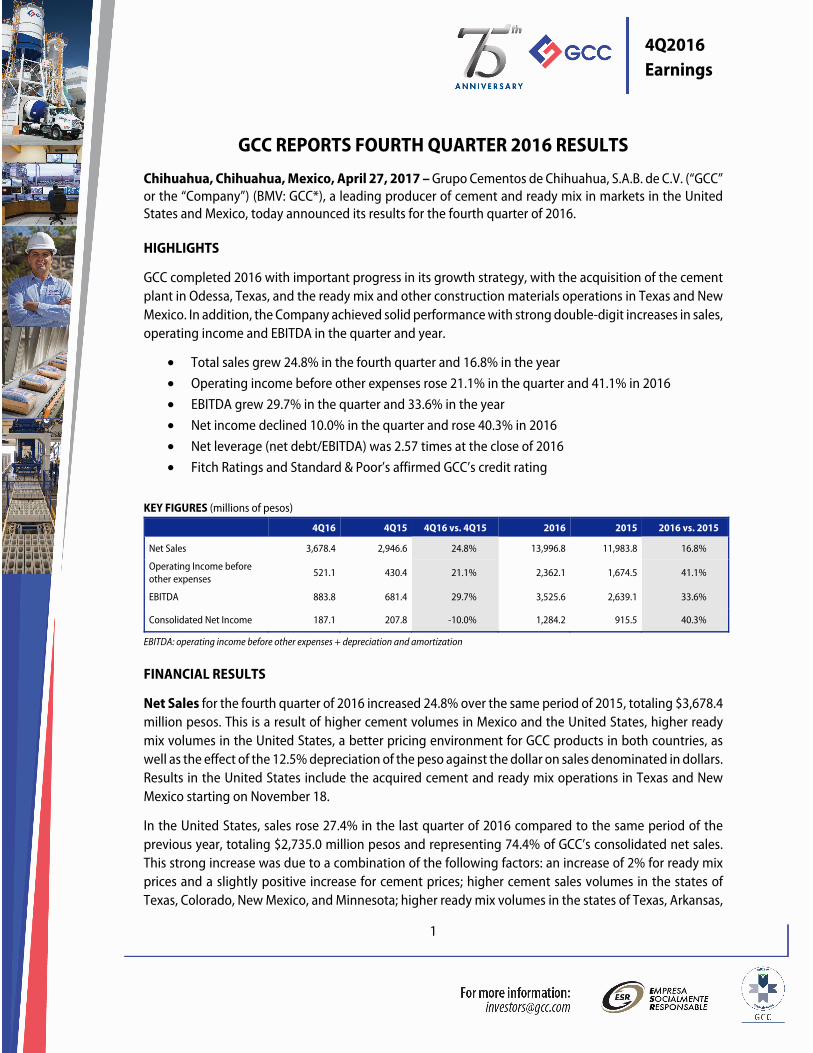
GCC completed 2016 with important progress in its growth strategy, with the acquisition of the cement plant in Odessa, Texas, and the ready mix and other construction materials operations in Texas and New Mexico. In addition, the Company achieved solid performance with strong double-digit increases in sales, operating income and EBITDA in the quarter and year.
• Total sales grew 24.8% in the fourth quarter and 16.8% in the year • Operating income before other expenses rose 21.1% in the quarter and 41.1% in 2016 • EBITDA grew 29.7% in the quarter and 33.6% in the year • Net income declined 10.0% in the quarter and rose 40.3% in 2016 • Net leverage (net debt/EBITDA) was 2.57 times at the close of 2016 • Fitch Ratings and Standard & Poor’s affirmed GCC’s credit rating
KEY FIGURES (millions of pesos)
4Q16 4Q15 4Q16 vs. 4Q15 2016 2015 2016 vs. 2015
Net Sales 3,678.4 2,946.6 24.8% 13,996.8 11,983.8 16.8%
Operating Income before other expenses
521.1 430.4 21.1% 2,362.1 1,674.5 41.1%
EBITDA 883.8 681.4 29.7% 3,525.6 2,639.1 33.6%
Consolidated Net Income 187.1 207.8 -10.0% 1,284.2 915.5 40.3%
EBITDA: operating income before other expenses + depreciation and amortization
FINANCIAL RESULTS
Net Sales for the fourth quarter of 2016 increased 24.8% over the same period of 2015, totaling $3,678.4 million pesos. This is a result of higher cement volumes in Mexico and the United States, higher ready mix volumes in the United States, a better pricing environment for GCC products in both countries, as well as the effect of the 12.5% depreciation of the peso against the dollar on sales denominated in dollars. Results in the United States include the acquired cement and ready mix operations in Texas and New Mexico starting on November 18.
In the United States, sales rose 27.4% in the last quarter of 2016 compared to the same period of the previous year, totaling $2,735.0 million pesos and representing 74.4% of GCC’s consolidated net sales. This strong increase was due to a combination of the following factors: an increase of 2% for ready mix prices and a slightly positive increase for cement prices; higher cement sales volumes in the states of Texas, Colorado, New Mexico, and Minnesota; higher ready mix volumes in the states of Texas, Arkansas,
2
4Q2016 Earnings
Oklahoma, and Iowa; and the positive impact on sales from the effect of the peso depreciation against the US dollar.
The segments with the highest investment in construction in the regions where GCC operates were public services, manufacturing, commercial, construction of schools, hotels and office buildings, as well as the public sector with urban paving and highway projects, while the residential sector was less active. Sales in the United States expressed in dollar terms rose 7.6% in the fourth quarter compared to the same period of 2015.
In Mexico, sales for the fourth quarter of 2016 rose 17.9% over the fourth quarter of 2015, totaling $943.4 million pesos and representing 25.6% of consolidated net sales. This was a result of a 4% increase in cement sales volumes, reflecting higher retail sales and development in the commercial and industrial sectors, which offset the decline in public sector construction. This also had an effect on the sales mix, which, combined with the effect of the depreciation of the peso against the dollar on the prices of exported cement, generated price increases of 19% for cement and 18% for ready mix.
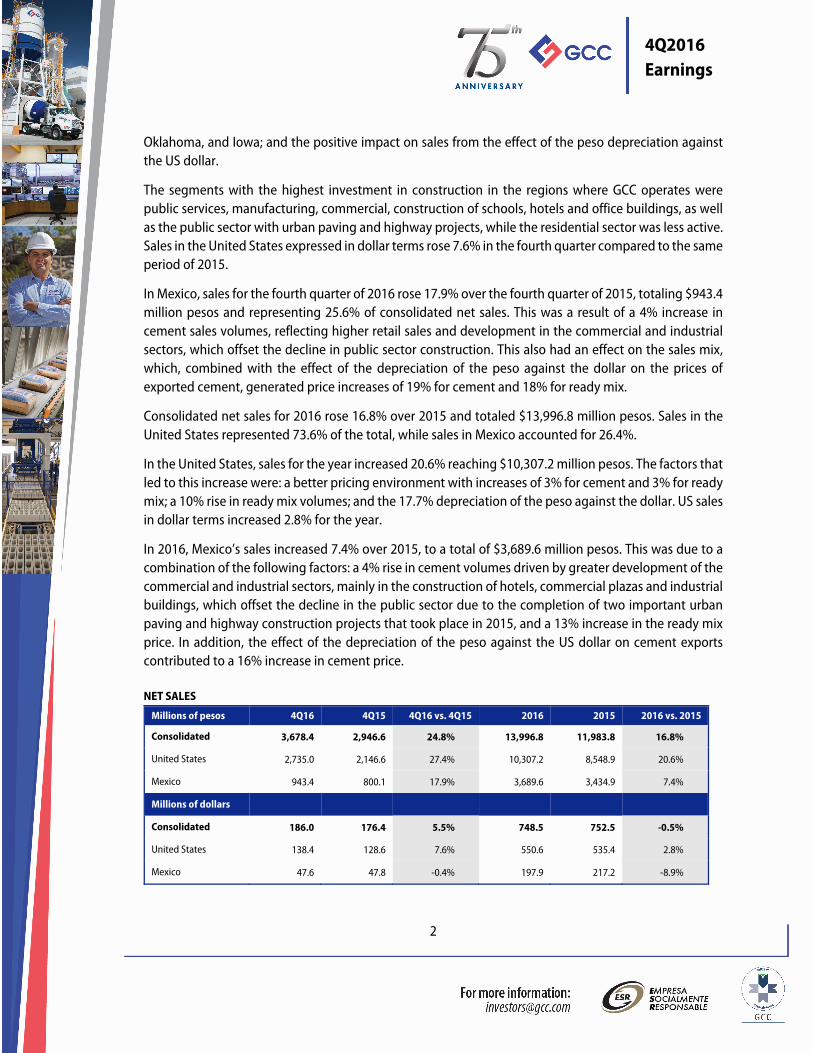
Consolidated net sales for 2016 rose 16.8% over 2015 and totaled $13,996.8 million pesos. Sales in the United States represented 73.6% of the total, while sales in Mexico accounted for 26.4%.
In the United States, sales for the year increased 20.6% reaching $10,307.2 million pesos. The factors that led to this increase were: a better pricing environment with increases of 3% for cement and 3% for ready mix; a 10% rise in ready mix volumes; and the 17.7% depreciation of the peso against the dollar. US sales in dollar terms increased 2.8% for the year.
In 2016, Mexico’s sales increased 7.4% over 2015, to a total of $3,689.6 million pesos. This was due to a combination of the following factors: a 4% rise in cement volumes driven by greater development of the commercial and industrial sectors, mainly in the construction of hotels, commercial plazas and industrial buildings, which offset the decline in the public sector due to the completion of two important urban paving and highway construction projects that took place in 2015, and a 13% increase in the ready mix price. In addition, the effect of the depreciation of the peso against the US dollar on cement exports contributed to a 16% increase in cement price.
NET SALES
Millions of pesos 4Q16 4Q15 4Q16 vs. 4Q15 2016 2015 2016 vs. 2015
Consolidated 3,678.4 2,946.6 24.8% 13,996.8 11,983.8 16.8%
United States 2,735.0 2,146.6 27.4% 10,307.2 8,548.9 20.6%
Mexico 943.4 800.1 17.9% 3,689.6 3,434.9 7.4%
Millions of dollars
Consolidated 186.0 176.4 5.5% 748.5 752.5 -0.5%
United States 138.4 128.6 7.6% 550.6 535.4 2.8%
Mexico 47.6 47.8 -0.4% 197.9 217.2 -8.9%
3
4Q2016 Earnings
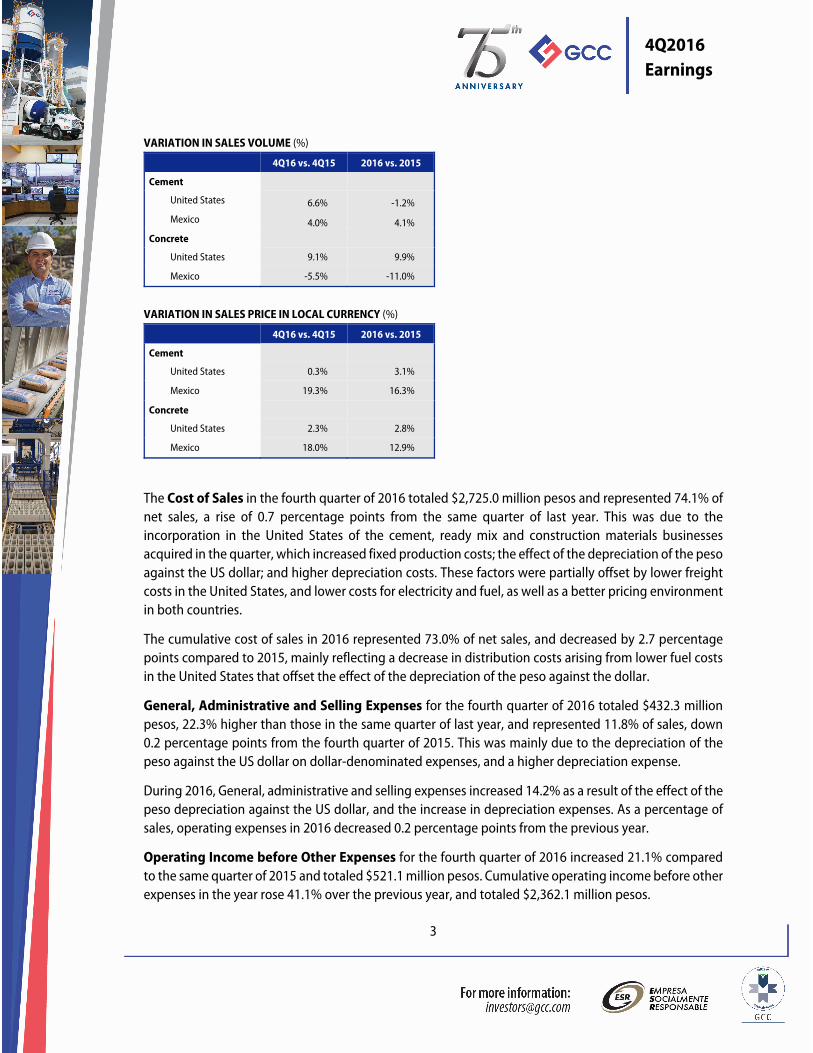
VARIATION IN SALES VOLUME (%)
4Q16 vs. 4Q15 2016 vs. 2015
Cement
United States 6.6% -1.2%
Mexico 4.0% 4.1% Concrete
United States 9.1% 9.9%
Mexico -5.5% -11.0%
VARIATION IN SALES PRICE IN LOCAL CURRENCY (%)
4Q16 vs. 4Q15 2016 vs. 2015
Cement
United States 0.3% 3.1%
Mexico 19.3% 16.3%
Concrete
United States 2.3% 2.8%
Mexico 18.0% 12.9%
The Cost of Sales in the fourth quarter of 2016 totaled $2,725.0 million pesos and represented 74.1% of net sales, a rise of 0.7 percentage points from the same quarter of last year. This was due to the incorporation in the United States of the cement, ready mix and construction materials businesses acquired in the quarter, which increased fixed production costs; the effect of the depreciation of the peso against the US dollar; and higher depreciation costs. These factors were partially offset by lower freight costs in the United States, and lower costs for electricity and fuel, as well as a better pricing environment in both countries.
The cumulative cost of sales in 2016 represented 73.0% of net sales, and decreased by 2.7 percentage points compared to 2015, mainly reflecting a decrease in distribution costs arising from lower fuel costs in the United States that offset the effect of the depreciation of the peso against the dollar.
General, Administrative and Selling Expenses for the fourth quarter of 2016 totaled $432.3 million pesos, 22.3% higher than those in the same quarter of last year, and represented 11.8% of sales, down 0.2 percentage points from the fourth quarter of 2015. This was mainly due to the depreciation of the peso against the US dollar on dollar-denominated expenses, and a higher depreciation expense.
During 2016, General, administrative and selling expenses increased 14.2% as a result of the effect of the peso depreciation against the US dollar, and the increase in depreciation expenses. As a percentage of sales, operating expenses in 2016 decreased 0.2 percentage points from the previous year.
Operating Income before Other Expenses for the fourth quarter of 2016 increased 21.1% compared to the same quarter of 2015 and totaled $521.1 million pesos. Cumulative operating income before other expenses in the year rose 41.1% over the previous year, and totaled $2,362.1 million pesos.
4
4Q2016 Earnings
On the Other Expenses line, $61.7 million pesos were registered in the fourth quarter of the year, compared to $19.5 million pesos recorded in the same quarter of 2015. This increase was generated by extraordinary expenses incurred in connection with the acquisition of the cement and ready mix operations in Texas and New Mexico. For the same reason, $118.8 million pesos in other expenses were recorded in 2016, compared to $25.3 million pesos in the previous year.
Operating Income for the fourth quarter of 2016 totaled $459.4 million pesos, an increase of 11.8% compared to the last quarter of 2015. Operating income for 2016 increased 36.0% compared to the prior year, and totaled $2,243.3 million pesos.
EBITDA for the fourth quarter of 2016 was $883.8 million pesos, 29.7% more than in the fourth quarter of 2015. The margin increased by 0.9 percentage points and represented 24.0% of sales. EBITDA for 2016 increased 33.6% over the previous year and totaled $3,525.6 million pesos, with a margin of 25.2% of sales, 3.2 percentage points higher than in 2015.
In 2016, EBITDA generated by the operations in the United States represented 66.5% of the total, while 33.5% was generated by the operations in Mexico.
Net Financial Expenses in the fourth quarter of 2016 totaled $255.7 million pesos, rising 71.1% over the same quarter of the previous year. This was due to the following factors: a higher debt balance arising from the US$253.5 million dollar financing for the acquisition of assets in the US; a charge of $24.1 million pesos for an exchange rate fluctuation which unfavorably compares to the $6.3 million peso gain in the fourth quarter of 2015; and the effect of the depreciation of the peso against the US dollar.
The cumulative net financial expenses in 2016 totaled $670.9 million pesos, rising 16.3% over 2015 as a result of the effect of the depreciation of the peso against the dollar on the conversion of financial expenses to pesos, and a higher debt balance, which were partially offset by a lower interest rate and a rise in financial income.
In the fourth quarter of 2016, Income Taxes totaled $21.8 million pesos, a figure that is $56.2 million pesos lower than in the same period of last year as a result of a lower taxable base. Income tax in 2016 totaled $308.2 million pesos, compared to $169.7 million in 2015, reflecting the rise in pre-tax profit.
Consolidated Net Income in the fourth quarter of 2016 totaled $187.1 million pesos, a 10.0% decrease from the fourth quarter of 2015. In 2016, consolidated net income totaled $1,284.2 million pesos, a figure 40.3% higher than the $915.5 million pesos recorded in 2015.
Free Cash Flow in the fourth quarter of the year was $1,094.6 million pesos, 15.1% higher than the $950.6 million pesos of cash flow in the last quarter of 2015. This variation is mainly due to the combination of the following factors: a 29.7% increase in EBITDA, a 50% decrease in capital expenditures (excluding investments in growth capex), a lower reduction in working capital, an increase in financial expenses, and a decrease in other accounts payable.
5
4Q2016 Earnings
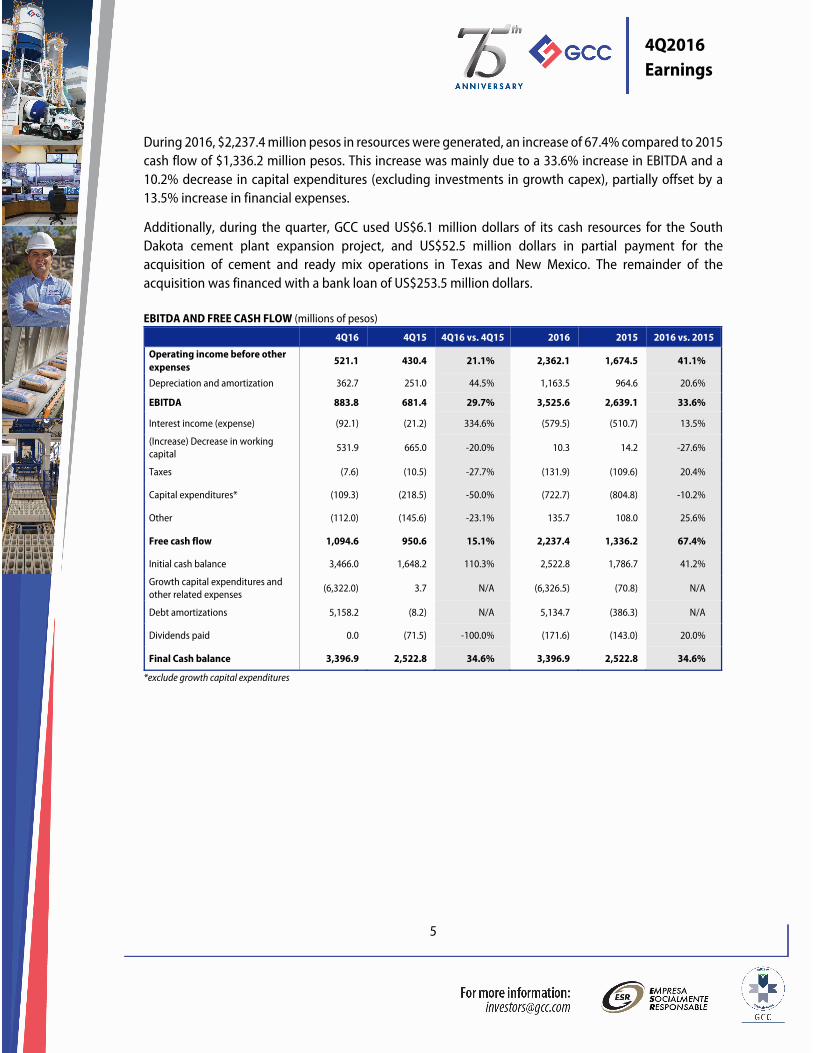
During 2016, $2,237.4 million pesos in resources were generated, an increase of 67.4% compared to 2015 cash flow of $1,336.2 million pesos. This increase was mainly due to a 33.6% increase in EBITDA and a 10.2% decrease in capital expenditures (excluding investments in growth capex), partially offset by a 13.5% increase in financial expenses.
Additionally, during the quarter, GCC used US$6.1 million dollars of its cash resources for the South Dakota cement plant expansion project, and US$52.5 million dollars in partial payment for the acquisition of cement and ready mix operations in Texas and New Mexico. The remainder of the acquisition was financed with a bank loan of US$253.5 million dollars.
EBITDA AND FREE CASH FLOW (millions of pesos)
4Q16 4Q15 4Q16 vs. 4Q15 2016 2015 2016 vs. 2015
Operating income before other expenses
521.1 430.4 21.1% 2,362.1 1,674.5 41.1%
Depreciation and amortization 362.7 251.0 44.5% 1,163.5 964.6 20.6%
EBITDA 883.8 681.4 29.7% 3,525.6 2,639.1 33.6%
Interest income (expense) (92.1) (21.2) 334.6% (579.5) (510.7) 13.5%
(Increase) Decrease in working capital
531.9 665.0 -20.0% 10.3 14.2 -27.6%
Taxes (7.6) (10.5) -27.7% (131.9) (109.6) 20.4%
Capital expenditures* (109.3) (218.5) -50.0% (722.7) (804.8) -10.2%
Other (112.0) (145.6) -23.1% 135.7 108.0 25.6%
Free cash flow 1,094.6 950.6 15.1% 2,237.4 1,336.2 67.4%
Initial cash balance 3,466.0 1,648.2 110.3% 2,522.8 1,786.7 41.2%
Growth capital expenditures and other related expenses
(6,322.0) 3.7 N/A (6,326.5) (70.8) N/A
Debt amortizations 5,158.2 (8.2) N/A 5,134.7 (386.3) N/A
Dividends paid 0.0 (71.5) -100.0% (171.6) (143.0) 20.0%
Final Cash balance 3,396.9 2,522.8 34.6% 3,396.9 2,522.8 34.6%
*exclude growth capital expenditures
6
4Q2016 Earnings
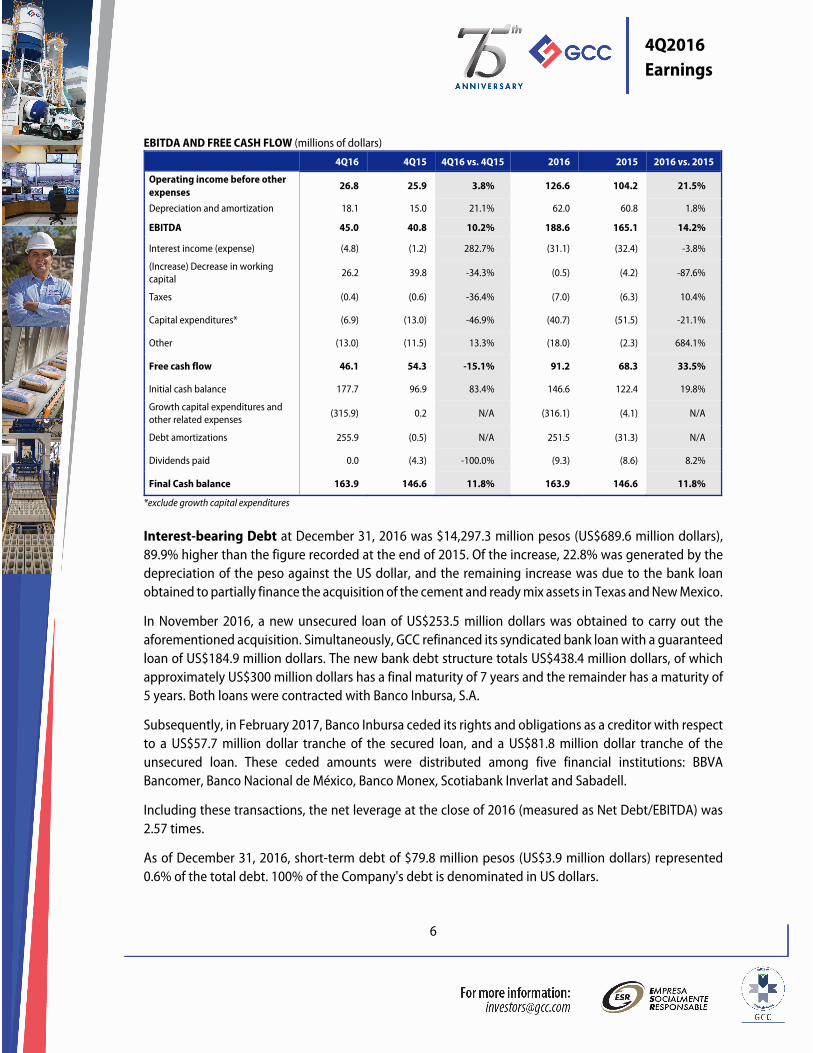
EBITDA AND FREE CASH FLOW (millions of dollars)
4Q16 4Q15 4Q16 vs. 4Q15 2016 2015 2016 vs. 2015
Operating income before other expenses
26.8 25.9 3.8% 126.6 104.2 21.5%
Depreciation and amortization 18.1 15.0 21.1% 62.0 60.8 1.8%
EBITDA 45.0 40.8 10.2% 188.6 165.1 14.2%
Interest income (expense) (4.8) (1.2) 282.7% (31.1) (32.4) -3.8%
(Increase) Decrease in working capital 26.2 39.8 -34.3% (0.5) (4.2) -87.6%
Taxes (0.4) (0.6) -36.4% (7.0) (6.3) 10.4%
Capital expenditures* (6.9) (13.0) -46.9% (40.7) (51.5) -21.1%
Other (13.0) (11.5) 13.3% (18.0) (2.3) 684.1%
Free cash flow 46.1 54.3 -15.1% 91.2 68.3 33.5%
Initial cash balance 177.7 96.9 83.4% 146.6 122.4 19.8%
Growth capital expenditures and other related expenses
(315.9) 0.2 N/A (316.1) (4.1) N/A
Debt amortizations 255.9 (0.5) N/A 251.5 (31.3) N/A
Dividends paid 0.0 (4.3) -100.0% (9.3) (8.6) 8.2%
Final Cash balance 163.9 146.6 11.8% 163.9 146.6 11.8%
*exclude growth capital expenditures
Interest-bearing Debt at December 31, 2016 was $14,297.3 million pesos (US$689.6 million dollars), 89.9% higher than the figure recorded at the end of 2015. Of the increase, 22.8% was generated by the depreciation of the peso against the US dollar, and the remaining increase was due to the bank loan obtained to partially finance the acquisition of the cement and ready mix assets in Texas and New Mexico.
In November 2016, a new unsecured loan of US$253.5 million dollars was obtained to carry out the aforementioned acquisition. Simultaneously, GCC refinanced its syndicated bank loan with a guaranteed loan of US$184.9 million dollars. The new bank debt structure totals US$438.4 million dollars, of which approximately US$300 million dollars has a final maturity of 7 years and the remainder has a maturity of 5 years. Both loans were contracted with Banco Inbursa, S.A.
Subsequently, in February 2017, Banco Inbursa ceded its rights and obligations as a creditor with respect to a US$57.7 million dollar tranche of the secured loan, and a US$81.8 million dollar tranche of the unsecured loan. These ceded amounts were distributed among five financial institutions: BBVA Bancomer, Banco Nacional de México, Banco Monex, Scotiabank Inverlat and Sabadell.
Including these transactions, the net leverage at the close of 2016 (measured as Net Debt/EBITDA) was 2.57 times.
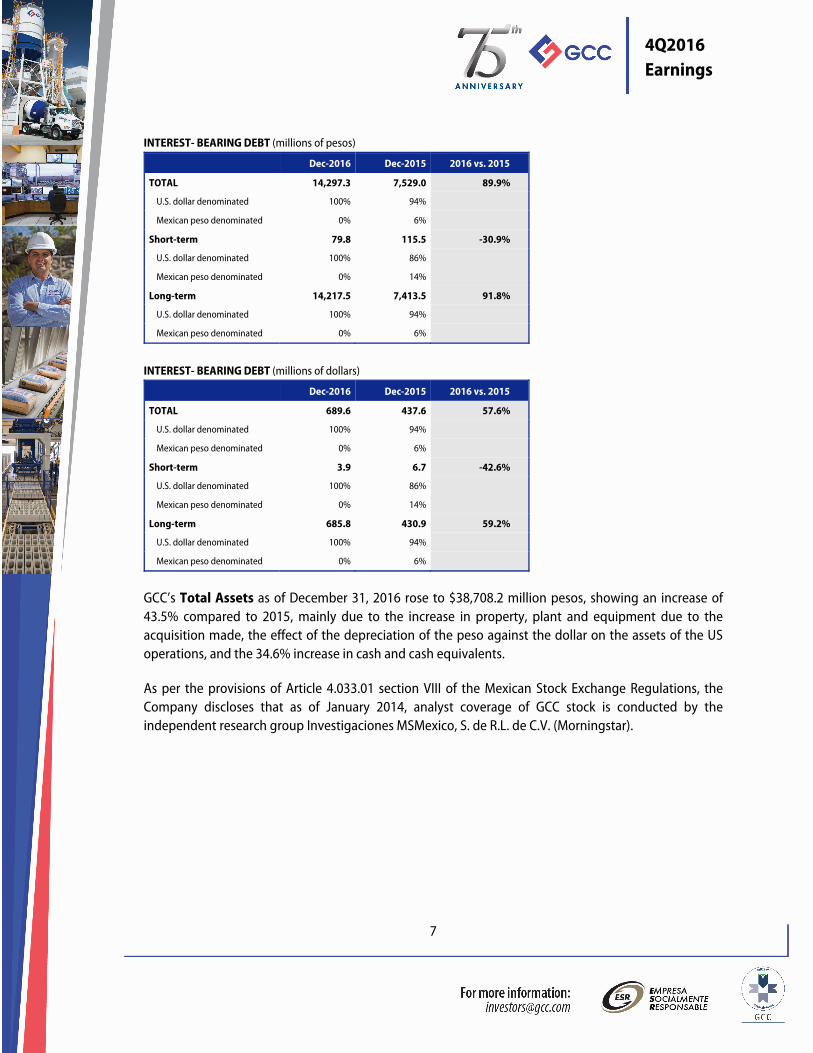
As of December 31, 2016, short-term debt of $79.8 million pesos (US$3.9 million dollars) represented 0.6% of the total debt. 100% of the Company's debt is denominated in US dollars.
7
4Q2016 Earnings
INTEREST- BEARING DEBT (millions of pesos)
Dec-2016 Dec-2015 2016 vs. 2015
TOTAL 14,297.3 7,529.0 89.9%
U.S. dollar denominated 100% 94%
Mexican peso denominated 0% 6%
Short-term 79.8 115.5 -30.9%
U.S. dollar denominated 100% 86%
Mexican peso denominated 0% 14%
Long-term 14,217.5 7,413.5 91.8%
U.S. dollar denominated 100% 94%
Mexican peso denominated 0% 6%
INTEREST- BEARING DEBT (millions of dollars)
Dec-2016 Dec-2015 2016 vs. 2015
TOTAL 689.6 437.6 57.6%
U.S. dollar denominated 100% 94%
Mexican peso denominated 0% 6%
Short-term 3.9 6.7 -42.6%
U.S. dollar denominated 100% 86%
Mexican peso denominated 0% 14%
Long-term 685.8 430.9 59.2%
U.S. dollar denominated 100% 94%
Mexican peso denominated 0% 6%
GCC’s Total Assets as of December 31, 2016 rose to $38,708.2 million pesos, showing an increase of 43.5% compared to 2015, mainly due to the increase in property, plant and equipment due to the acquisition made, the effect of the depreciation of the peso against the dollar on the assets of the US operations, and the 34.6% increase in cash and cash equivalents.
As per the provisions of Article 4.033.01 section VIII of the Mexican Stock Exchange Regulations, the Company discloses that as of January 2014, analyst coverage of GCC stock is conducted by the independent research group Investigaciones MSMexico, S. de R.L. de C.V. (Morningstar).
8
4Q2016 Earnings
GCC has a positive outlook on 2017 performance
• In the United States, we expect volumes of cement and concrete to rise by double-digit considering the addition of the new operations, and on a like to like basis we expect cement volumes to increase by a mid-single digit and concrete volumes to remain flat
• In Mexico, we expect a mid-single digit increase in cement and concrete volumes • Prices in the US and in Mexico are expected to increase by a mid-single digit • A double-digit increase is expected in consolidated EBITDA • Investment in working capital will rise slightly mainly due to the recent assets acquisition • Total capex is budgeted at about $136.0 million dollars: around $50.0 million in maintenance capex,
$53.0 million for the expansion of the South Dakota plant, and a 2016 carryover of around $33.0 million dollars
9
4Q2016 Earnings
OTHER EVENTS
GCC concludes the acquisition of CEMEX assets in the United States
On November 18, 2016, GCC announced that it completed the acquisition of certain assets located in the United States that were owned by CEMEX, S.A.B. de C.V. (“CEMEX”) for an amount of US$306 million.
The assets consist of a cement plant located in Odessa, Texas; two cement distribution terminals in Amarillo and El Paso, Texas; and the ready mix, aggregates, asphalt and building materials businesses in El Paso, Texas and Las Cruces, New Mexico. The acquisition comprises all facilities, equipment and inventories.
Enrique Escalante, CEO of GCC, noted: “This acquisition represents a significant advance in our strategy of sustainable cement growth in the United States, in markets contiguous to those of GCC´s geographic footprint. With these assets and colleagues joining the Company, we will enhance the competitive advantage of our logistics system, expand our product portfolio and optimize our operations by sharing best practices.”
This transaction was financed with internal funds and an unsecured loan of US$253.5 million dollars. Concurrently, GCC refinanced its syndicated bank loan with a US$184.9 million dollar secured loan. The new bank debt structure totals US$438.4 million dollars, of which approximately US$300 million dollars has a 7-year maturity and the remainder will mature in 5 years. Both loans were contracted with Banco Inbursa, S.A.
This new financial structure gives GCC greater flexibility with improved contractual terms and maturity profile, which, in conjunction with the acquisition, supports GCC´s ongoing effort to significantly enhance its operating and financial results.
Fitch Ratings affirmed GCC’s rating at BB on a global scale, and removed the Rating Watch negative rating, with a stable perspective
On November 23, 2016, GCC announced that the credit rating agency Fitch Ratings affirmed GCC’s corporate credit and debt ratings at BB with a stable outlook, and removed the Rating Watch negative.
Fitch Ratings said in its announcement that the removal of the Rating Watch negative and the affirmation of the rating was in response to the GCC’s announcement that it successfully concluded the acquisition of assets previously owned by CEMEX, S.A.B. de C.V., for US$306 million dollars.
Fitch Ratings also highlighted that GCC’s ratings reflect the Company’s solid business position in the cement, ready mix and aggregates segments in the regions where it has a presence; diversified operations in Mexico and the United States in the residential and non-residential sectors; as well as positive free cash flow generation through the recent industry cycle.
10
4Q2016 Earnings
According to Fitch Ratings, the key factors for the rating include its contiguous presence from Chihuahua in northern Mexico, to North Dakota in the northern United States, with a leading position in the regions where it participates grounded on an efficient distribution and logistics network, among others.
Standard & Poor’s affirms GCC’s rating at BB- on a global scale and removed the Credit Watch negative
On September 7, 2016, GCC announced that Standard & Poor’s, the credit rating agency, affirmed GCC’s corporate credit and debt ratings at BB- with a stable outlook, and removed the Company from Credit Watch negative.
In its announcement, Standard & Poor’s removed GCC from Credit Watch negative, where the Company was placed after its original announcement on May 2, 2016 to acquire several assets in the United States, once the Company’s announced a reduction in the value of the transaction on August 27, from $400 to $306 million U.S. dollars.
S&P further indicated that GCC's credit quality would not be affected by the acquisition, because the reduction of the transaction value implied that its credit metrics would remain in line with the current rating level, once the acquisition is completed and taking into account that GCC would incur additional debt to do so.
S&P stated that their analysis incorporated their positive view of the Company's strategic geographic footprint, which allows for efficient distribution across the central states of the United States and the state of Chihuahua in Mexico. They also considered the Company's ability to improve its operating efficiency thanks to an extensive and sophisticated distribution network, state-of-the-art plants operating at full capacity in the United States, and it strategy to mitigate its exposure to energy and fuel costs through the use of alternative fuels in its cement plants.
GCC and CEMEX set the price and closed the offering of the 15.6% stake in Grupo Cementos de Chihuahua
On February 10, 2017, GCC and CEMEX, S.A.B. de C.V. (“CEMEX”) announced that on February 9, 2017 they priced their previously announced secondary offerings of 51,750,000 shares of common stock (the “Shares”) of GCC, owned by CEMEX, at a price of 95 Mexican pesos per share, including 6,750,000 shares available to the underwriters of the offerings for overallotment and that may be purchased pursuant to a 30-day option granted to the underwriters by CEMEX.
The offerings were comprised of Shares offered (a) in a public offering to investors in Mexico, authorized by the Comisión Nacional Bancaria y de Valores (Mexican National Banking and Securities Commission, or the “CNBV”), conducted through the Bolsa Mexicana de Valores, S.A.B. de C.V. (Mexican Stock
11
4Q2016 Earnings
Exchange, or the “BMV”), and (b), in a concurrent private placement, to eligible investors outside of Mexico.
On February 15, 2017, bids were closed, with CEMEX selling 15.6% of its 23% direct interest in GCC. Following the offers, CEMEX maintains a direct stake in GCC of 7.4% and also retains its minority stake in CAMCEM, an entity that has a majority stake in GCC. CEMEX sold the Shares in the context of an asset sales plan previously announced by CEMEX.
BASIS OF PREPARATION FOR FINANCIAL STATEMENTS
All figures herein were prepared in accordance with International Financial Reporting Standards, and are expressed in Mexican pesos. Unless otherwise stated, all percentage changes refer to the 2016 figures compared to those of 2015.
About GCC
GCC is a leading supplier of cement, aggregates, concrete and construction‐related services in the United States and Mexico. The Company has annual cement production capacity of 5.0 million tons.
Founded in 1941, the Company’s shares trade on the Mexican Stock Exchange under the ticker symbol GCC*.
This document contains forward-looking statements relating to Grupo Cementos de Chihuahua S.A.B. de C.V. and subsidiaries (GCC) based upon management projections. These projections reflect GCC’s opinion on future events that may be subject to a number of risks and uncertainties. Various factors may cause actual results to differ from those expressed herein, including, among others, changes in macroeconomic, political, governmental or business conditions in the markets where GCC operates; changes in interest rates, inflation rates and currency exchange rates; construction industry performance; pricing, business strategy and other factors. Should one or more of these risks or uncertainties materialize, or should underlying assumptions prove incorrect, actual results may vary materially from those described herein. GCC assumes no obligation to update or correct the information contained in this press release.
12
4Q2016 Earnings
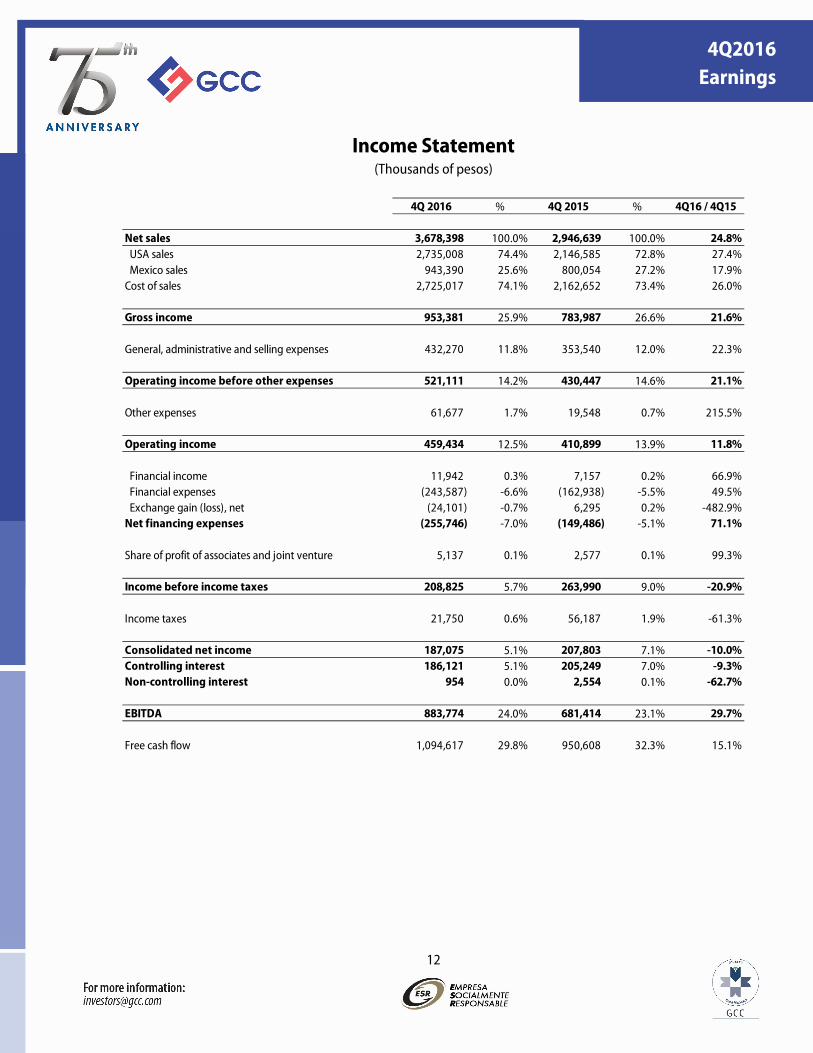
Income Statement (Thousands of pesos)
4Q 2016 % 4Q 2015 % 4Q16 / 4Q15
Net sales 3,678,398 100.0% 2,946,639 100.0% 24.8% USA sales 2,735,008 74.4% 2,146,585 72.8% 27.4% Mexico sales 943,390 25.6% 800,054 27.2% 17.9%Cost of sales 2,725,017 74.1% 2,162,652 73.4% 26.0%
Gross income 953,381 25.9% 783,987 26.6% 21.6%
General, administrative and selling expenses 432,270 11.8% 353,540 12.0% 22.3%
Operating income before other expenses 521,111 14.2% 430,447 14.6% 21.1%
Other expenses 61,677 1.7% 19,548 0.7% 215.5%
Operating income 459,434 12.5% 410,899 13.9% 11.8%
Financial income 11,942 0.3% 7,157 0.2% 66.9% Financial expenses (243,587) -6.6% (162,938) -5.5% 49.5% Exchange gain (loss), net (24,101) -0.7% 6,295 0.2% -482.9%Net financing expenses (255,746) -7.0% (149,486) -5.1% 71.1%
Share of profit of associates and joint venture 5,137 0.1% 2,577 0.1% 99.3%
Income before income taxes 208,825 5.7% 263,990 9.0% -20.9%
Income taxes 21,750 0.6% 56,187 1.9% -61.3%
Consolidated net income 187,075 5.1% 207,803 7.1% -10.0%Controlling interest 186,121 5.1% 205,249 7.0% -9.3%Non-controlling interest 954 0.0% 2,554 0.1% -62.7%
EBITDA 883,774 24.0% 681,414 23.1% 29.7%
Free cash flow 1,094,617 29.8% 950,608 32.3% 15.1%
13
4Q2016 Earnings
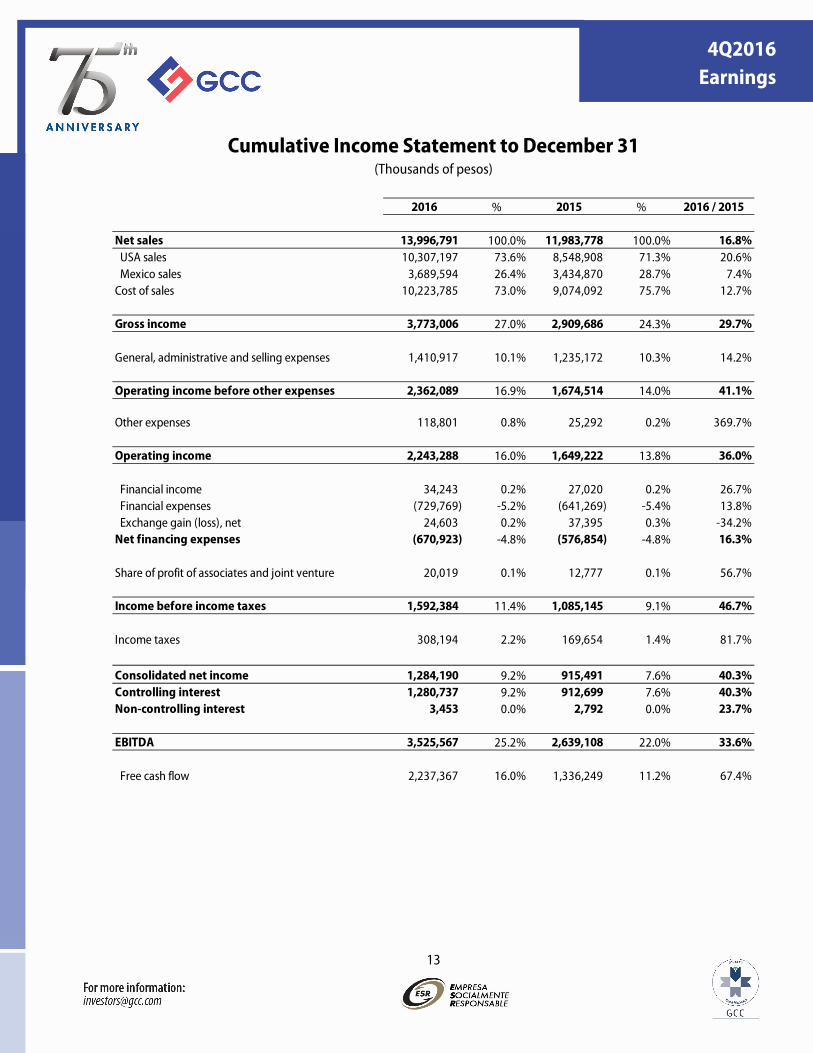
Cumulative Income Statement to December 31 (Thousands of pesos)
2016 % 2015 % 2016 / 2015
Net sales 13,996,791 100.0% 11,983,778 100.0% 16.8% USA sales 10,307,197 73.6% 8,548,908 71.3% 20.6% Mexico sales 3,689,594 26.4% 3,434,870 28.7% 7.4%Cost of sales 10,223,785 73.0% 9,074,092 75.7% 12.7%
Gross income 3,773,006 27.0% 2,909,686 24.3% 29.7%
General, administrative and selling expenses 1,410,917 10.1% 1,235,172 10.3% 14.2%
Operating income before other expenses 2,362,089 16.9% 1,674,514 14.0% 41.1%
Other expenses 118,801 0.8% 25,292 0.2% 369.7%
Operating income 2,243,288 16.0% 1,649,222 13.8% 36.0%
Financial income 34,243 0.2% 27,020 0.2% 26.7% Financial expenses (729,769) -5.2% (641,269) -5.4% 13.8% Exchange gain (loss), net 24,603 0.2% 37,395 0.3% -34.2%Net financing expenses (670,923) -4.8% (576,854) -4.8% 16.3%
Share of profit of associates and joint venture 20,019 0.1% 12,777 0.1% 56.7%
Income before income taxes 1,592,384 11.4% 1,085,145 9.1% 46.7%
Income taxes 308,194 2.2% 169,654 1.4% 81.7%
Consolidated net income 1,284,190 9.2% 915,491 7.6% 40.3%Controlling interest 1,280,737 9.2% 912,699 7.6% 40.3%Non-controlling interest 3,453 0.0% 2,792 0.0% 23.7%
EBITDA 3,525,567 25.2% 2,639,108 22.0% 33.6%
Free cash flow 2,237,367 16.0% 1,336,249 11.2% 67.4%

14
4Q2016 Earnings
2016 Income Statement (Thousands of pesos)
1Q 2016 % 2Q 2016 % 3Q 2016 % 4Q 2016 % 2016
Net sales 2,361,500 100.0% 3,669,206 100.0% 4,287,687 100.0% 3,678,398 100.0% 13,996,791 USA sales 1,581,718 67.0% 2,681,377 73.1% 3,309,094 77.2% 2,735,008 74.4% 10,307,197 Mexico sales 779,782 33.0% 987,829 26.9% 978,593 22.8% 943,390 25.6% 3,689,594 Cost of sales 1,866,416 79.0% 2,654,882 72.4% 2,977,470 69.4% 2,725,017 74.1% 10,223,785
Gross income 495,084 21.0% 1,014,324 27.6% 1,310,217 30.6% 953,381 25.9% 3,773,006
General, administrative and selling expenses 318,246 13.5% 323,059 8.8% 337,342 7.9% 432,270 11.8% 1,410,917
Operating income before other expenses 176,838 7.5% 691,265 18.8% 972,875 22.7% 521,111 14.2% 2,362,089
Other expenses 30,443 1.3% 4,098 0.1% 22,583 0.5% 61,677 1.7% 118,801
Operating income 146,395 6.2% 687,167 18.7% 950,292 22.2% 459,434 12.5% 2,243,288
Financial income 8,435 0.4% 5,556 0.2% 8,310 0.2% 11,942 0.3% 34,243 Financial expenses (157,697) -6.7% (162,827) -4.4% (165,658) -3.9% (243,587) -6.6% (729,769) Exchange gain (loss), net (5,800) -0.2% 40,279 1.1% 14,225 0.3% (24,101) -0.7% 24,603 Net financing expenses (155,062) -6.6% (116,992) -3.2% (143,123) -3.3% (255,746) -7.0% (670,923)
Share of profit of associates and joint venture 5,590 0.2% 7,069 0.2% 2,223 0.1% 5,137 0.1% 20,019
Income (Loss) before income taxes (3,077) -0.1% 577,244 15.7% 809,392 18.9% 208,825 5.7% 1,592,384
Income taxes (61,910) -2.6% 139,968 3.8% 208,386 4.9% 21,750 0.6% 308,194
Consolidated net income 58,833 2.5% 437,276 11.9% 601,006 14.0% 187,075 5.1% 1,284,190 Controlling interest 58,424 2.5% 436,245 11.9% 599,947 14.0% 186,121 5.1% 1,280,737 Non-controlling interest 409 0.0% 1,031 0.0% 1,059 0.0% 954 0.0% 3,453
EBITDA 439,468 18.6% 957,783 26.1% 1,244,542 29.0% 883,774 24.0% 3,525,567
15
4Q2016 Earnings
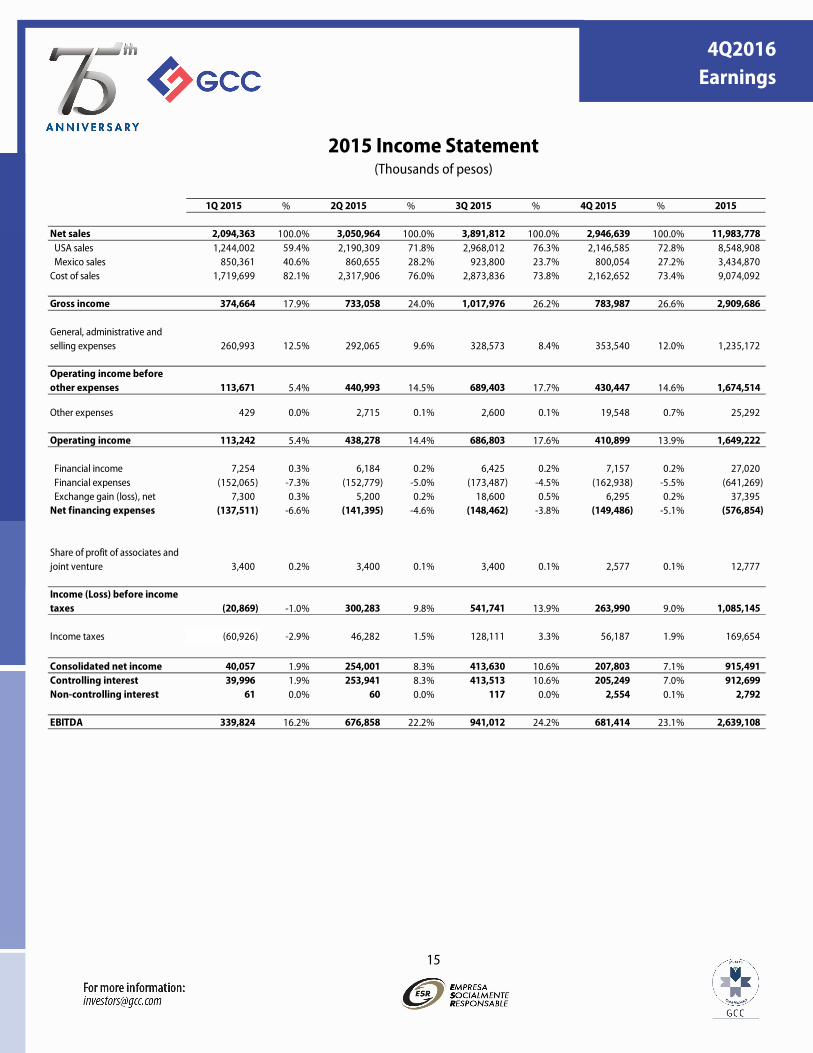
2015 Income Statement (Thousands of pesos)
1Q 2015 % 2Q 2015 % 3Q 2015 % 4Q 2015 % 2015
Net sales 2,094,363 100.0% 3,050,964 100.0% 3,891,812 100.0% 2,946,639 100.0% 11,983,778 USA sales 1,244,002 59.4% 2,190,309 71.8% 2,968,012 76.3% 2,146,585 72.8% 8,548,908 Mexico sales 850,361 40.6% 860,655 28.2% 923,800 23.7% 800,054 27.2% 3,434,870 Cost of sales 1,719,699 82.1% 2,317,906 76.0% 2,873,836 73.8% 2,162,652 73.4% 9,074,092
Gross income 374,664 17.9% 733,058 24.0% 1,017,976 26.2% 783,987 26.6% 2,909,686
General, administrative and selling expenses 260,993 12.5% 292,065 9.6% 328,573 8.4% 353,540 12.0% 1,235,172
Operating income before other expenses 113,671 5.4% 440,993 14.5% 689,403 17.7% 430,447 14.6% 1,674,514
Other expenses 429 0.0% 2,715 0.1% 2,600 0.1% 19,548 0.7% 25,292
Operating income 113,242 5.4% 438,278 14.4% 686,803 17.6% 410,899 13.9% 1,649,222
Financial income 7,254 0.3% 6,184 0.2% 6,425 0.2% 7,157 0.2% 27,020 Financial expenses (152,065) -7.3% (152,779) -5.0% (173,487) -4.5% (162,938) -5.5% (641,269) Exchange gain (loss), net 7,300 0.3% 5,200 0.2% 18,600 0.5% 6,295 0.2% 37,395 Net financing expenses (137,511) -6.6% (141,395) -4.6% (148,462) -3.8% (149,486) -5.1% (576,854)
Share of profit of associates and joint venture 3,400 0.2% 3,400 0.1% 3,400 0.1% 2,577 0.1% 12,777
Income (Loss) before income taxes (20,869) -1.0% 300,283 9.8% 541,741 13.9% 263,990 9.0% 1,085,145
Income taxes (60,926) -2.9% 46,282 1.5% 128,111 3.3% 56,187 1.9% 169,654
Consolidated net income 40,057 1.9% 254,001 8.3% 413,630 10.6% 207,803 7.1% 915,491 Controlling interest 39,996 1.9% 253,941 8.3% 413,513 10.6% 205,249 7.0% 912,699 Non-controlling interest 61 0.0% 60 0.0% 117 0.0% 2,554 0.1% 2,792
EBITDA 339,824 16.2% 676,858 22.2% 941,012 24.2% 681,414 23.1% 2,639,108
16
4Q2016 Earnings
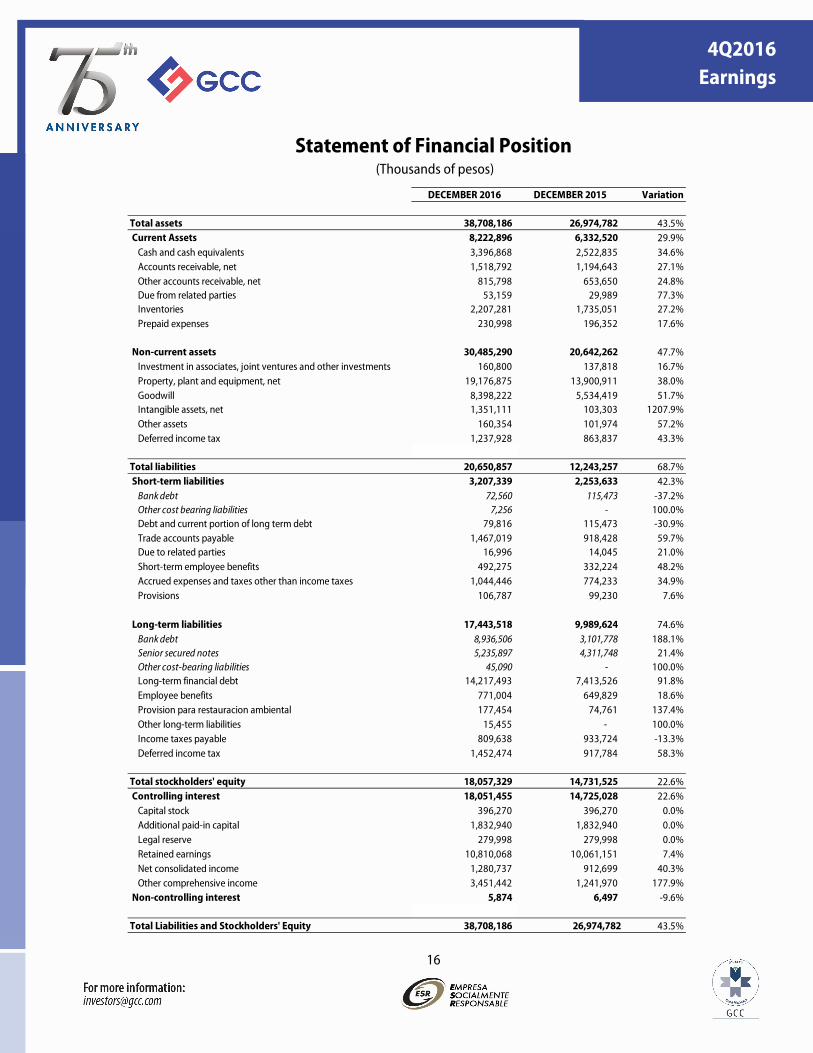
Statement of Financial Position (Thousands of pesos)
DECEMBER 2016 DECEMBER 2015 Variation
Total assets 38,708,186 26,974,782 43.5% Current Assets 8,222,896 6,332,520 29.9%
Cash and cash equivalents 3,396,868 2,522,835 34.6%Accounts receivable, net 1,518,792 1,194,643 27.1%Other accounts receivable, net 815,798 653,650 24.8%Due from related parties 53,159 29,989 77.3%Inventories 2,207,281 1,735,051 27.2%Prepaid expenses 230,998 196,352 17.6%
Non-current assets 30,485,290 20,642,262 47.7%Investment in associates, joint ventures and other investments 160,800 137,818 16.7%Property, plant and equipment, net 19,176,875 13,900,911 38.0%Goodwill 8,398,222 5,534,419 51.7%Intangible assets, net 1,351,111 103,303 1207.9%Other assets 160,354 101,974 57.2%Deferred income tax 1,237,928 863,837 43.3%
Total liabilities 20,650,857 12,243,257 68.7% Short-term liabilities 3,207,339 2,253,633 42.3%
Bank debt 72,560 115,473 -37.2%Other cost bearing liabilities 7,256 - 100.0%Debt and current portion of long term debt 79,816 115,473 -30.9%Trade accounts payable 1,467,019 918,428 59.7%Due to related parties 16,996 14,045 21.0%Short-term employee benefits 492,275 332,224 48.2%Accrued expenses and taxes other than income taxes 1,044,446 774,233 34.9%Provisions 106,787 99,230 7.6%
Long-term liabilities 17,443,518 9,989,624 74.6%Bank debt 8,936,506 3,101,778 188.1%Senior secured notes 5,235,897 4,311,748 21.4%Other cost-bearing liabilities 45,090 - 100.0%Long-term financial debt 14,217,493 7,413,526 91.8%Employee benefits 771,004 649,829 18.6%Provision para restauracion ambiental 177,454 74,761 137.4%Other long-term liabilities 15,455 - 100.0%Income taxes payable 809,638 933,724 -13.3%Deferred income tax 1,452,474 917,784 58.3%
Total stockholders' equity 18,057,329 14,731,525 22.6% Controlling interest 18,051,455 14,725,028 22.6%
Capital stock 396,270 396,270 0.0%Additional paid-in capital 1,832,940 1,832,940 0.0%Legal reserve 279,998 279,998 0.0%Retained earnings 10,810,068 10,061,151 7.4%Net consolidated income 1,280,737 912,699 40.3%Other comprehensive income 3,451,442 1,241,970 177.9%
Non-controlling interest 5,874 6,497 -9.6%
Total Liabilities and Stockholders' Equity 38,708,186 26,974,782 43.5%

17
4Q2016 Earnings
Income Statement (Thousands of dollars)
4Q 2016 % 4Q 2015 % 4Q16 / 4Q15
Net sales 186,049 100.0% 176,427 100.0% 5.5% USA sales 138,415 74.4% 128,583 72.9% 7.6% Mexico sales 47,634 25.6% 47,844 27.1% -0.4%Cost of sales 137,489 73.9% 129,465 73.4% 6.2%
Gross income 48,560 26.1% 46,962 26.6% 3.4%
General, administrative and selling expenses 21,714 11.7% 21,103 12.0% 2.9%
Operating income before other expenses 26,846 14.4% 25,859 14.7% 3.8%
Other expenses 3,126 1.7% 1,160 0.7% 169.5%
Operating income 23,720 12.7% 24,699 14.0% -4.0%
Financial income 602 0.3% 424 0.2% 42.0% Financial expenses (12,234) -6.6% (9,740) -5.5% 25.6% Exchange gain (loss), net (1,249) -0.7% 362 0.2% -445.0%Net financing expenses (12,881) -6.9% (8,954) -5.1% 43.9%
Share of profit of associates and joint venture 259 0.1% 155 0.1% 67.1%
Income before income taxes 11,098 6.0% 15,900 9.0% -30.2%
Income taxes 1,337 0.7% 3,427 1.9% -61.0%
Consolidated net income 9,761 5.2% 12,473 7.1% -21.7%Controlling interest 9,713 5.2% 12,308 7.0% -21.1%Non-controlling interest 48 0.0% 165 0.1% -70.8%
EBITDA 44,992 24.2% 40,843 23.2% 10.2%
18
4Q2016 Earnings
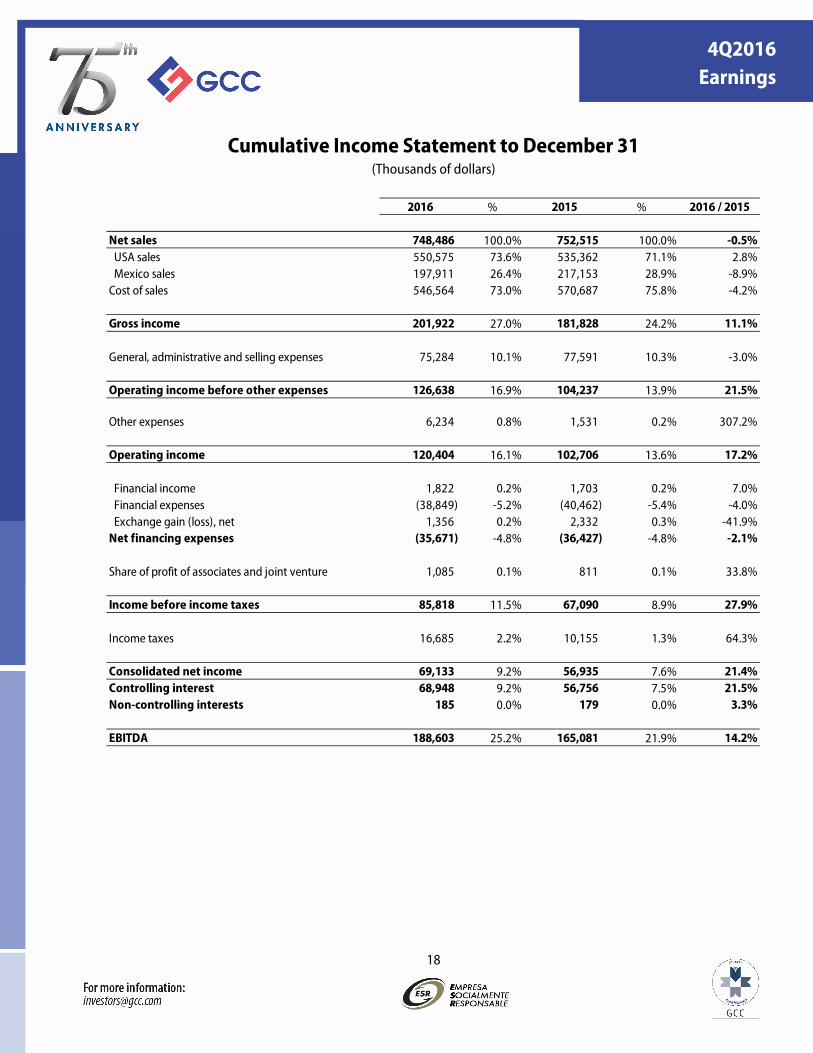
Cumulative Income Statement to December 31 (Thousands of dollars)
2016 % 2015 % 2016 / 2015
Net sales 748,486 100.0% 752,515 100.0% -0.5% USA sales 550,575 73.6% 535,362 71.1% 2.8% Mexico sales 197,911 26.4% 217,153 28.9% -8.9%Cost of sales 546,564 73.0% 570,687 75.8% -4.2%
Gross income 201,922 27.0% 181,828 24.2% 11.1%
General, administrative and selling expenses 75,284 10.1% 77,591 10.3% -3.0%
Operating income before other expenses 126,638 16.9% 104,237 13.9% 21.5%
Other expenses 6,234 0.8% 1,531 0.2% 307.2%
Operating income 120,404 16.1% 102,706 13.6% 17.2%
Financial income 1,822 0.2% 1,703 0.2% 7.0% Financial expenses (38,849) -5.2% (40,462) -5.4% -4.0% Exchange gain (loss), net 1,356 0.2% 2,332 0.3% -41.9%Net financing expenses (35,671) -4.8% (36,427) -4.8% -2.1%
Share of profit of associates and joint venture 1,085 0.1% 811 0.1% 33.8%
Income before income taxes 85,818 11.5% 67,090 8.9% 27.9%
Income taxes 16,685 2.2% 10,155 1.3% 64.3%
Consolidated net income 69,133 9.2% 56,935 7.6% 21.4%Controlling interest 68,948 9.2% 56,756 7.5% 21.5%Non-controlling interests 185 0.0% 179 0.0% 3.3%
EBITDA 188,603 25.2% 165,081 21.9% 14.2%
19
4Q2016 Earnings
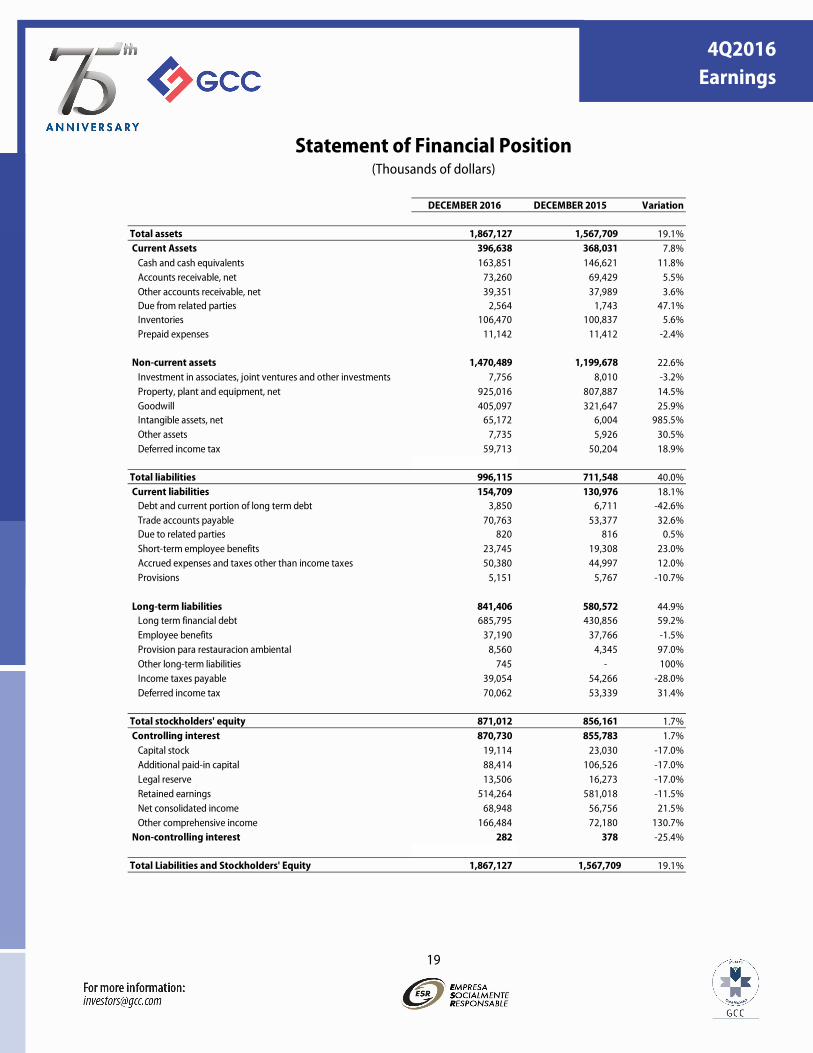
Statement of Financial Position (Thousands of dollars)
DECEMBER 2016 DECEMBER 2015 Variation
Total assets 1,867,127 1,567,709 19.1% Current Assets 396,638 368,031 7.8%
Cash and cash equivalents 163,851 146,621 11.8%Accounts receivable, net 73,260 69,429 5.5%Other accounts receivable, net 39,351 37,989 3.6%Due from related parties 2,564 1,743 47.1%Inventories 106,470 100,837 5.6%Prepaid expenses 11,142 11,412 -2.4%
Non-current assets 1,470,489 1,199,678 22.6%Investment in associates, joint ventures and other investments 7,756 8,010 -3.2%Property, plant and equipment, net 925,016 807,887 14.5%Goodwill 405,097 321,647 25.9%Intangible assets, net 65,172 6,004 985.5%Other assets 7,735 5,926 30.5%Deferred income tax 59,713 50,204 18.9%
Total liabilities 996,115 711,548 40.0% Current liabilities 154,709 130,976 18.1%
Debt and current portion of long term debt 3,850 6,711 -42.6%Trade accounts payable 70,763 53,377 32.6%Due to related parties 820 816 0.5%Short-term employee benefits 23,745 19,308 23.0%Accrued expenses and taxes other than income taxes 50,380 44,997 12.0%Provisions 5,151 5,767 -10.7%
Long-term liabilities 841,406 580,572 44.9%Long term financial debt 685,795 430,856 59.2%Employee benefits 37,190 37,766 -1.5%Provision para restauracion ambiental 8,560 4,345 97.0%Other long-term liabilities 745 - 100%Income taxes payable 39,054 54,266 -28.0%Deferred income tax 70,062 53,339 31.4%
Total stockholders' equity 871,012 856,161 1.7% Controlling interest 870,730 855,783 1.7%
Capital stock 19,114 23,030 -17.0%Additional paid-in capital 88,414 106,526 -17.0%Legal reserve 13,506 16,273 -17.0%Retained earnings 514,264 581,018 -11.5%Net consolidated income 68,948 56,756 21.5%Other comprehensive income 166,484 72,180 130.7%
Non-controlling interest 282 378 -25.4%
Total Liabilities and Stockholders' Equity 1,867,127 1,567,709 19.1%