growth of myxococcus xanthus in continuous-flow-cell...
TRANSCRIPT
Growth of Myxococcus xanthus in Continuous-Flow-Cell Bioreactorsas a Method for Studying Development
Gregory T. Smaldone,a Yujie Jin,b Damion L. Whitfield,a Andrew Y. Mu,a Edward C. Wong,c Stefan Wuertz,b,d Mitchell Singera
Department of Microbiology and Molecular Genetics, University of California—Davis, Davis, California, USAa; Department of Civil and Environmental Engineering,University of California—Davis, Davis, California, USAb; Department of Mechanical and Aerospace Engineering, University of California—Davis, Davis, California, USAc;Singapore Centre on Environmental Life Sciences Engineering and School of Civil and Environmental Engineering, Nanyang Technological University, Singapore,Republic of Singapored
Nutrient sensors and developmental timers are two classes of genes vital to the establishment of early development in the socialsoil bacterium Myxococcus xanthus. The products of these genes trigger and regulate the earliest events that drive the colonyfrom a vegetative state to aggregates, which ultimately leads to the formation of fruiting bodies and the cellular differentiation ofthe individual cells. In order to more accurately identify the genes and pathways involved in the initiation of this multicellulardevelopmental program in M. xanthus, we adapted a method of growing vegetative populations within a constant controllableenvironment by using flow cell bioreactors, or flow cells. By establishing an M. xanthus community within a flow cell, we areable to test developmental responses to changes in the environment with fewer concerns for effects due to nutrient depletion orbacterial waste production. This approach allows for greater sensitivity in investigating communal environmental responses,such as nutrient sensing. To demonstrate the versatility of our growth environment, we carried out time-lapse confocal laserscanning microscopy to visualize M. xanthus biofilm growth and fruiting body development, as well as fluorescence staining ofexopolysaccharides deposited by biofilms. We also employed the flow cells in a nutrient titration to determine the minimumconcentration required to sustain vegetative growth. Our data show that by using a flow cell, M. xanthus can be held in a vegeta-tive growth state at low nutrient concentrations for long periods, and then, by slightly decreasing the nutrient concentration,cells can be allowed to initiate the developmental program.
In response to limiting nutrient availability, the ubiquitousGram-negative soil bacterium Myxococcus xanthus undergoes a
well-characterized developmental program resulting in the differ-entiation of vegetatively growing cells into one of three cellularfates (1, 2). These cells aggregate to form a macroscopic, multicel-lular, and rounded fruiting body containing metabolically inac-tive, stress-resistant myxospores (3, 4). Surrounding the fruitingbodies are peripheral, rod-shaped cells hypothesized to be impor-tant in environmental sensing. Lastly, a subpopulation of cellsmay undergo autolysis, a process suggested to provide nutrientsfor the other two viable cell fates during differentiation (5, 6).
Expanding our understanding of the complex regulatory net-works controlling development has been a major aim since thevery first studies of M. xanthus. While much progress has beenmade, much remains unknown, especially those transcriptionalchanges occurring within the very early stages of nutrient limita-tion, when the community must make a decision to flip an energy-intensive switch, initiating development. To better understandhow and why this occurs, as well as how M. xanthus senses nutri-ent concentrations within the environment, we propose the use ofcontinuous-flow-cell bioreactors, or flow cells, to culture vegeta-tive biofilms.
Growth in an environment that allows for the finite control ofinputs and the monitoring of bacterial outputs, such as secondarymetabolites and extracellular signals (both small molecules andproteins), is key to understanding how M. xanthus senses its sur-roundings and integrates cues to control growth and develop-ment. Due to the tendency of M. xanthus to flocculate and stick tosurfaces, the use of a chemostat is not practical. However, growingM. xanthus as a biofilm adhering to a solid surface under contin-uous-medium-flow conditions allows for stricter control of con-
stant environmental parameters. Biofilms have been studied ex-tensively in numerous bacterial systems, including Pseudomonasaeruginosa, Bacillus subtilis, and Staphylococcus aureus, amongothers (7–12). While biofilms of M. xanthus are less well studied,recent work has begun to expand our knowledge of biofilm for-mation and how it relates to nutrient sensing and development(13–15).
In the work presented here, we demonstrate for the first timethe use of flow cells as a method for controlling the growth anddevelopment of M. xanthus. Our aim is to establish the study of M.xanthus within flow cells as an attractive alternative to currentlyfavored growth environments. To do so, we present data that il-lustrate the versatility of this growth method for many standardassays used in the study of M. xanthus. Specifically, we performedtime-lapse confocal laser scanning microscopy (CLSM) in con-junction with green fluorescent protein (GFP)-tagged markers tovisualize biofilm growth and fruiting body development. Simi-larly, we employed fluorescence cell staining to visualize the de-position of exopolysaccharide by M. xanthus biofilms. Lastly, wecarried out a nutrient titration to identify at what concentration
Received 10 October 2013 Accepted 3 February 2014
Published ahead of print 7 February 2014
Editor: A. M. Spormann
Address correspondence to Mitchell Singer, [email protected].
Supplemental material for this article may be found at http://dx.doi.org/10.1128/AEM.03369-13.
Copyright © 2014, American Society for Microbiology. All Rights Reserved.
doi:10.1128/AEM.03369-13
April 2014 Volume 80 Number 8 Applied and Environmental Microbiology p. 2461–2467 aem.asm.org 2461
the developmental program is triggered, ultimately leading theestablished biofilm to fruiting body formation.
MATERIALS AND METHODSStrains and growth conditions. M. xanthus strain DK1622 was used as thewild-type and parental strain for all subsequent strains (16). DK10547 andDK11239, harboring a gfp transcriptional fusion cloned under the controlof the pilA promoter and a gfp transcriptional fusion cloned at the end ofthe devR open reading frame, respectively, were used for the fluorescencemicroscopy studies as indicated (17, 18). Strain DK4521, harboring aTn5lac fusion expressed in development but without any identified phe-notype, was used in the mixing experiment as a nonfluorescent kanamy-cin-resistant strain (19). M. xanthus strains were grown in CTTYE (1%Casitone [Difco, Franklin Lakes, NJ], 0.2% yeast extract [BD, Sparks,MD], 10 mM Tris-HCl [pH 7.6], 1 mM KH2PO4, 8 mM MgSO4]) broth oron CTTYE plates containing 1% agar for general cultivation. For the pur-poses of the nutrient titration experiment, a morpholinepropanesulfonicacid (MOPS)-buffered nutrient medium was adapted from the work ofBerleman et al. (20) and renamed CTM for this article, to avoid confusionwith CTTYE. M. xanthus strains were grown in single-chamber flow cellswith 1% CTM (1% Casitone, 10 mM MOPS [pH 7.0], 1 mM KH2PO4, 8mM MgSO4, 1 mM CaCl2) unless otherwise stated.
Flow cell assemblies. Biofilms were grown in stainless steel four-chamber flow cells under continuous-flow conditions (21). A single flowchamber was 4 by 4 by 40 mm and had an internal volume of about 1 ml(including the input and effluent ports). Each continuous-flow systemconsisted of a growth medium reservoir, peristaltic pump, flow cell, andwaste reservoir connected by Tygon tubing (Saint-Gobain S.A., Courbe-voie, France). For a diagram of the flow cell setup with exact tube sizing,see Fig. S1A in the supplemental material. The entire system, excludingthe peristaltic pump, was autoclaved prior to experimentation. Flow cellswere then sealed with UV- and 70% ethanol-sterilized Rinzel plastic mi-croscope coverslips (Electron Microscopy Sciences, Hatfield, PA) by useof Devcon home silicone adhesive (Illinois Tool Works Inc., RivieraBeach, FL).
Preparative single-chamber flow cells were designed in order to obtainsufficient biomass to perform a variety of qualitative and quantitativeassays, such as protein and RNA analyses (data not shown). The dimen-sions of these preparative cells were 60 by 23 by 10.5 cm in order to fit oneor two 24- by 60-mm Rinzel plastic microscope coverslips. The internalvolume of each sealed single-chamber flow cell was approximately 7.5 ml.Design files were generated using the computer-aided design programAutoCAD (Autodesk Inc., San Rafael, CA) and are available at http://microbiology.ucdavis.edu/singer/ for immediate download and print-ing on compatible three-dimensional printers. The flow cells were printedon an Objet Eden260V three-dimensional printer using VeroBlackPlusresin, a proprietary acrylic-based polymer (Objet Ltd., Minneapolis, MN;UC Davis Prototype Lab, Biomedical Engineering). For a diagram of asingle-coverslip flow cell, see Fig. S2 in the supplemental material.
The single-chamber continuous-flow-cell system consisted of agrowth medium reservoir, peristaltic pump, single-chamber flow cell, andwaste reservoir connected by Tygon tubing. Flow cells were sealed withRinzel plastic microscope coverslips by use of Devcon home silicone ad-hesive and were sterilized by exposure to chlorine gas for at least 3 h.Briefly, the assembled flow cells were placed into a vacuum chamber witha beaker containing 100 ml 6.0% sodium hypochlorite (NaClO), to which3 ml concentrated HCl was added. The chamber was immediately sealedand exposed for 3 h. The chamber was vented for 1 h in a fume hood, andthe sterilized flow cells were stored in sterile plastic petri plates until theywere attached to the sterilized input and effluent tubing. The system,excluding the peristaltic pump and single-chamber flow cell, was auto-claved prior to experimentation. For a diagram of the flow cell setup withexact tube sizing, see Fig. S1B in the supplemental material.
Biofilm growth for developmental assays and observation. Startercultures were grown with a large inoculating loopful of the indicated M.
xanthus strain taken from a fresh 1% CTTYE plate with appropriate anti-biotic and inoculated into 25 ml 1% CTTYE broth plus appropriate anti-biotic in a 250-ml flask. The culture flask was shaken overnight at 32°Cand grown to a Klett measurement of approximately 80 to 100. The cul-ture was pelleted and washed with MC7 buffer (10 mM MOPS [pH 7.0], 1mM KH2PO4, 8 mM MgSO4, and 1 mM CaCl2), and approximately 107
cells were inoculated into the flow cell chambers in a volume of 0.25 ml,using a 1-ml syringe with a 25-gauge by 5/8-in. hypodermic needle. Acontinuous flow of 1% CTTYE medium plus appropriate antibiotic wasturned on, at a rate of 2 ml/h, after inoculated cells were allowed to stati-cally adhere to the coverslips for 2 h. Dense microbial mats were allowedto form for 4 to 5 days. The M. xanthus developmental program wasinitiated by rapid buffer exchange with the nutrient-deficient buffer MC7plus appropriate antibiotic. Images of the developmental program weretaken at the indicated time points via CLSM as described below.
Nutrient titration of established biofilms. Starter cultures weregrown with a large loopful of either M. xanthus wild-type DK1622 orDK11239 taken from a fresh 1% CTTYE plate and inoculated into 25 ml1% CTTYE in a 250-ml flask. The culture flask was shaken overnight at32°C and grown to a Klett measurement of approximately 80 to 100. Theculture was pelleted and washed with MC7 buffer, and approximately 107
cells were inoculated into the flow cell chambers in a volume of 0.75 ml,using a 1-ml syringe with a 25-gauge by 5/8-in. hypodermic needle. Con-tinuous 1% CTM medium flow was turned on, at a rate of 3 ml/h, afterinoculated cells were allowed to statically adhere to the coverslips for 2 h.Dense microbial mats were allowed to form for 2 or 3 days. The titrationwas initiated by a rapid exchange to CTM with the indicated Casitoneconcentration. Continuous medium flow was carried out for 4 days post-nutritional shift, at 3 ml/h. Cultures were imaged with both a Leica DMI6000 wide-field inverted fluorescence microscope with a PlanApo 100�(total magnification) objective and a Nikon SMZ800 microscope with atotal magnification of �30.
Biofilm and fruiting body staining. Biofilms were stained under con-tinuous flow for 1 h and then washed with 10 mM MgSO4 for 30 min. Cellswere then stained with 5 �M Syto60 (Molecular Probes, Eugene, OR)suspended in 10 mM MgSO4. Extracellular polysaccharide (EPS) wasstained with 0.05% (by weight) Solophenyl flavine (SPF; Huntsman Int.LLC, High Point, NC) suspended in 10 mM MgSO4 and filtered using a0.2-�m sterilization filter (Pall Life Sciences, Port Washington, NY). Im-ages were taken via CLSM as described below.
Development strain mixing assay. Starter cultures were grown with alarge loopful of either M. xanthus DK10547 or DK4521 taken from a fresh1% CTTYE plate and inoculated into 25 ml 1% CTTYE in a 250-ml flask.Each culture flask was shaken overnight at 32°C and grown to a Klettmeasurement of approximately 100 to 200. Both strains were spun downand resuspended in MC7 buffer to a common concentration of 100 Klettunits. The strains were then mixed at either a 1:1 or 1:5 ratio of DK10547to DK4521. Approximately 107 cells from the mixtures were inoculatedinto the flow cell chambers in a volume of 0.75 ml by using a 1-ml syringewith a 25-gauge by 5/8-in. hypodermic needle. Continuous 1% CTMmedium flow was turned on, at a rate of 3 ml/h, after inoculated cells wereallowed to statically adhere to the coverslips for 2 h. Dense microbial matswere allowed to form for 3 days. The M. xanthus developmental programwas initiated by a rapid exchange to the nutrient-deficient buffer MC7.Continuous buffer flow was carried out for 3 days post-nutritional shift, at3 ml/h. Cultures were imaged at that time, using a Leica DMI 6000 wide-field inverted fluorescence microscope with a PlanApo 100� (total mag-nification) objective. GFP intensity was determined by ImageJ (22), usingthree independent measurements of fruiting body fore- and backgroundintensities for both ratios tested.
CLSM observation. Stainless steel four-chamber flow cells weremounted on a Zeiss 510 Meta CLSM (Carl Zeiss, Jena, Germany) motor-ized stage and visualized using a 20� objective lens. The biofilm wasscanned using a 488-nm argon laser with a 505-nm-band-pass filter. z-stacks scanned from a single biofilm contained the same number of im-
Smaldone et al.
2462 aem.asm.org Applied and Environmental Microbiology
ages. The number of images was set to capture the thickest part of thebiofilm. The z step for images in a z-stack was 1 �m. Images were acquiredby utilizing a pinhole setting of 1 airy unit and a scan average of 2. Detectorgain (500 to 550 arbitrary units), amplifier offset (0 to 0.05 arbitrary unit),and laser intensity (10% to 25%) were all set to obtain adequately con-trasted grayscale images based on the brightest region of the biofilm thatwas scanned.
Image analysis. Semiautomated image analysis was performed utiliz-ing the programs Auto PHLIP-ML and PHLIP. Auto PHLIP-ML (http://sourceforge.net/projects/auto-phlip-ml/) calculates an Otsu thresholdfor image stacks not biased by extraneous images (images not containingpixels of biological significance). Extraneous images are identified andremoved based on their area coverage of biomass, as described by Merodet al. (23). The percent area coverage value used for extraneous imageremoval (PACVEIR) identifying the substratum was set at 1%. The bulk-medium interface was defined by the limit of EPS and iteratively deter-mined to be a PACVEIR of either 0% or 0.005%. PHLIP, version 0.7, aMatLab-based image analysis toolbox (http://sourceforge.net/projects/phlip/), was used to quantify architectural metrics for each z-stack. Asecond method, bioView3D, was also employed to qualitatively visualizeand present the architectural structure of each z-stack (24).
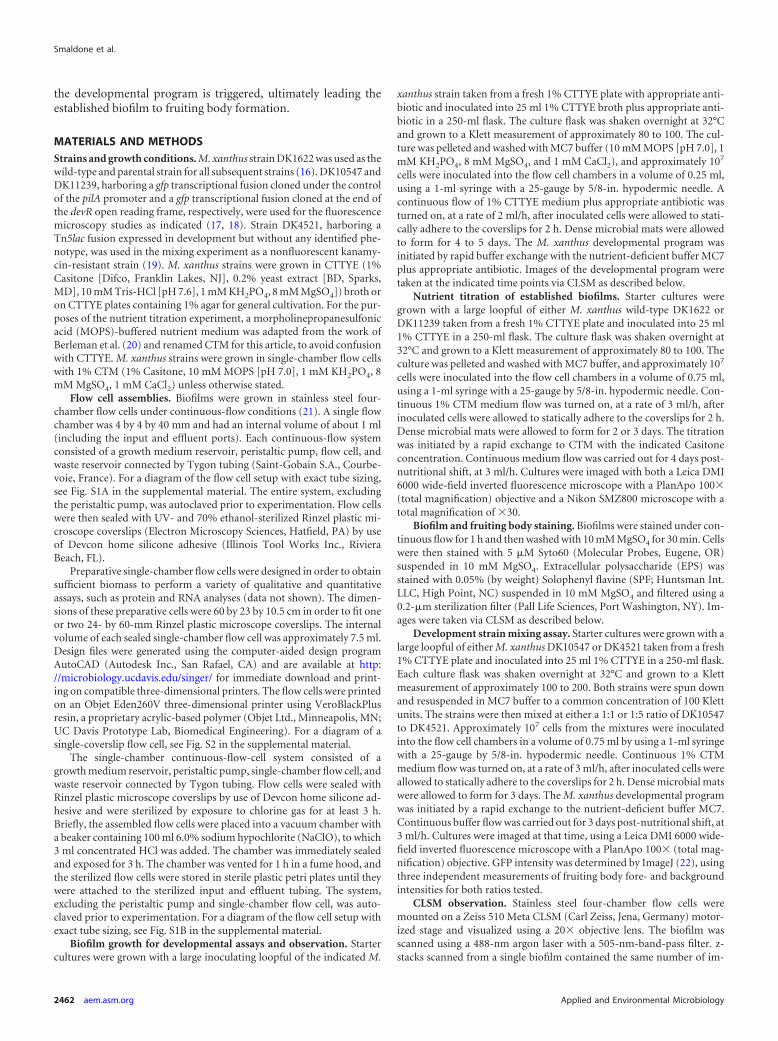
RESULTSBiofilm growth and developmental shifts within flow cells. Wemonitored the growth and development of M. xanthus commu-nities established in continuous-flow cells. Investigations withPseudomonas species have recognized this culturing method as anexcellent way to observe vegetative growth and the establishmentof higher-order structures within a microbial community (25, 26).Our initial trials were carried out to monitor homogeneousgrowth on a solid surface. Standard 1% CTTYE broth was used tobathe M. xanthus cells statically inoculated into the flow cell ontoa plastic coverslip. After attachment, medium flow was turnedon, and growth of DK10547 was monitored by CLSM. Vegetativegrowth was maintained with a high nutrient content for the dura-tion of our observation, i.e., 3 days, producing a dense homoge-nous biofilm that was readily observable and consistent withpreviously published studies obtained using a similarly labeledpilA-gfp transcriptional fusion strain (Fig. 1A) (27). z-stacks im-aged during vegetative growth were analyzed and allowed us tocalculate the cell depth in several locations within the biofilm.Using an estimate of 1 �m as the cell diameter, we calculated amaximal cell depth of 50 cells. More importantly, the z-stack im-ages could be used to generate three-dimensional (3D) images ofthe biofilm to examine biofilm architecture in more detail, usingan open-software package called Bisque (24). Using these 3D bio-film images, we observed a dense microbial mat but also the es-tablishment of higher-order structures, such as cell aggregates orpossible transient swarms (Fig. 1B). These aggregates can be ob-served as bright fluorescent patches (Fig. 1A) and as “pebble-like”speckling under a light microscope (see Fig. 4, top row).
After 4 to 5 days of vegetative growth under nutrient-repleteconditions, the M. xanthus developmental program was initiatedby the rapid exchange of nutrient-replete 1% CTTYE with nutri-ent-depleted MC7 buffer. Development was monitored over thefollowing 4 days, and fruiting body formation was readily observ-able by both eye and CLSM (Fig. 1C). CLSM images of an M.xanthus pilA-gfp fruiting body showed the characteristic halo ef-fect observed by Lux et al., due to the loss of pilA expression withinthe myxospore (28). This can be seen in more detail in the z-stack3D image depicted in Fig. 1D. The 3D rendering of the fruitingbody z-stack compared to the biofilm rendering illustrates a
marked loss of the thick microbial mat, leaving behind a fewperipheral rod cells surrounding the 4-day-old fruiting bodystructure (Fig. 1D). The concave appearance of the 3D renderingof the fruiting body is due to the loss of fluorescence recorded byCLSM in the interior of the structure due to loss of expression ofpilA-gfp and the degradation of GFP in late fruiting body develop-ment (24, 28).
To demonstrate that the mature 4-day-old fruiting bodies werestructurally similar to those previously observed, we stained thefruiting bodies with the fluorophore SPF, an alternative stain tocalcofluor white (29), which has been used to visualize EPS (30).Observation of EPS deposition within the fruiting body by the useof SPF revealed uniform staining throughout the structure (seeFig. S3A and C in the supplemental material). This result pairedwith the results of differential interference contrast (DIC) micros-copy (see Fig. S3B and D) demonstrates the presence of internalcellular structures and validates that fruiting bodies formed underthese conditions are equivalent to those previously observed usingstandard conditions.
Time course studies of biofilm growth and developmentalshifts. One of the advantages of culturing biofilms within flowcells and observing them under CLSM is the ability to image M.xanthus strains in real time over a period of days or even weeks.This allows for the monitoring of dynamic changes to the samestructure under constant environmental conditions without dis-rupting or consuming the sample. It also allows for the monitor-ing of how the biofilm is established from inoculation to the es-tablishment of a dense biofilm. We imaged M. xanthus pilA-gfp
Biofilm Fruiting Body
CLS
M3D
A.
B.
C.
D.50μm
FIG 1 Fluorescence microscopy of M. xanthus flow cell growth and develop-ment. (A) Representative CLSM images of a 3-day-old pilA-gfp-labeled M.xanthus biofilm grown under vegetative conditions. Each image shows an or-thogonal section of one layer of a z-stack collected for the representative struc-ture by CLSM with a 20� objective, as described in the text. (B) Three-dimen-sional isometric images (3D) of architecture were generated from the samez-stack as the CLSM biofilm images in panel A, using Bisque (24). CLSM (C)and three-dimensional isometric (D) images for a 4-day-old M. xanthus fruit-ing body were produced similarly.
M. xanthus Growth and Development in Flow Cells
April 2014 Volume 80 Number 8 aem.asm.org 2463
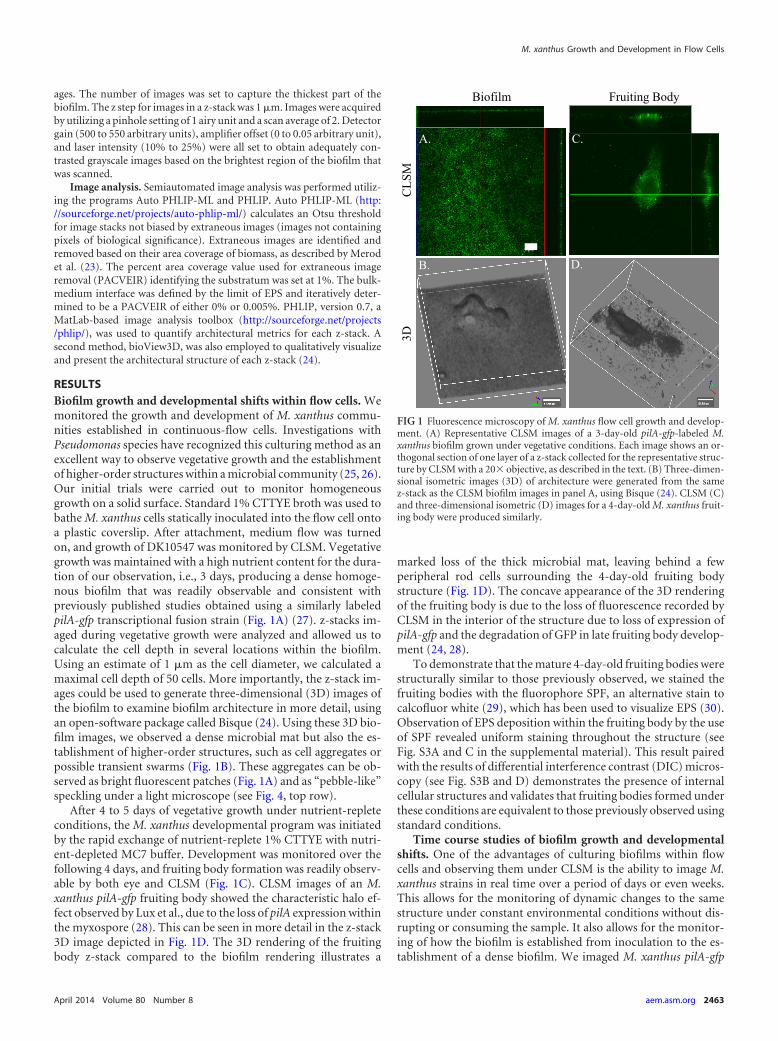
biofilm growth and development after sudden nutrient depriva-tion over a period of 1 week (Fig. 2A). The initial inoculum wasallowed to adhere to the growth surface for 2 h, and then thevegetative time zero was imaged as the flow was turned on (Fig.2A, Veg 0 panel). Biofilm growth was monitored until a stableconfluent culture was reached, at 60 h (Fig. 2A, Veg 60 panel). Atthat point, the MC7 buffer was rapidly exchanged to trigger thedevelopmental life cycle. Aggregates and mounds were observed24 h after buffer exchange, and at 48 h, a single mature fruitingbody was imaged every day for two more days (Fig. 2A, panels Dev24 to Dev 96). Similarly, wild-type M. xanthus was monitoredthroughout the same time course by light microscopy (see Fig. S4in the supplemental material) and was found to be roughly con-sistent in developmental timing to cells grown under submergedculture (31) and agar plate assay (28) conditions.
Architectural metrics were observed and recorded for maturefruiting bodies over a 3-day period (Fig. 2B). Briefly, GFP expres-sion intensity was positionally determined for each image withinthe z-stack. These data were then averaged with the intensities forthose images above and below to generate a quantitative represen-tation of the fruiting body architecture. The fruiting body archi-tecture detected in the flow cells was consistent with previouslyreported fruiting body structures grown under a variety of condi-tions, including submerged culture (31) and agar plate assay (28)conditions.
Fruiting body formation was also monitored to determine thatthe composition was in agreement with the hypothesis that devel-opment requires the interaction of tens of thousands of estab-lished cells to form complex aggregates (32). This was accom-plished within the flow cell by observing the growth anddevelopment of biofilms comprising the mixed populations oftwo differentially marked M. xanthus strains. By mixing the PpilA-gfp transcriptional fusion strain with a nonfluorescent strain har-boring the same antibiotic selection marker, we observed an evendistribution of gfp expression within all observed fruiting bodies(see Fig. S5 in the supplemental material), which is indicative ofM. xanthus’s multicellular behavior (32). Using two different ra-tios of cells, 1:1 and 1:5 (see Fig. S5), the fluorescence ratios for thefruiting bodies paralleled the ratios for input cells. Comparing the1:1 and 1:5 ratios of gfp to non-gfp cells, we observed a GFP inten-sity difference of 6.39 � 3.87 when fluorescence was measureddirectly, demonstrating that cells behaved as expected within theflow cell apparatus.
Differential cell staining of EPS. The ability to visualize cellu-lar architecture via CLSM extends not only to fluorescent epitope-tagged strains but also to the use of cellular stains and markers.Much like the use of fluorescent tags, this can be done in real time,without fixation. This facilitates the use of multiple stains in orderto discern colocalization. To examine this in M. xanthus, we es-tablished a confluent vegetative biofilm within the flow chamber,
A.
B.
Veg 0
Dev 24
Veg 24
Dev 48
Veg 48
Dev 72
Veg 60
Dev 96
Dev 48 Dev 72 Dev 96
50μm
FIG 2 M. xanthus growth, development, and architecture in a flow cell over time. (A) Representative CLSM images of pilA-gfp-labeled M. xanthus grown undervegetative (Veg) conditions followed by a developmental switch (Dev). Time points are numbered relative to the end of the allowed attachment period (Veg 0)and were reset after the initiation of the developmental program (Dev 0). (B) Each image shows an orthogonal section of one layer of a representative z-stack ofa second mature pilA-gfp-labeled M. xanthus fruiting body collected by CLSM with a 20� objective, as described in the text. Time points are numbered relativeto the initiation of the developmental program. Architectural intensity representations generated from the z-stacks are reported below the corresponding images,where the x and y axes are arbitrary coordinates relative to the imaged fruiting body and the z axis is the relative intensity.
Smaldone et al.
2464 aem.asm.org Applied and Environmental Microbiology
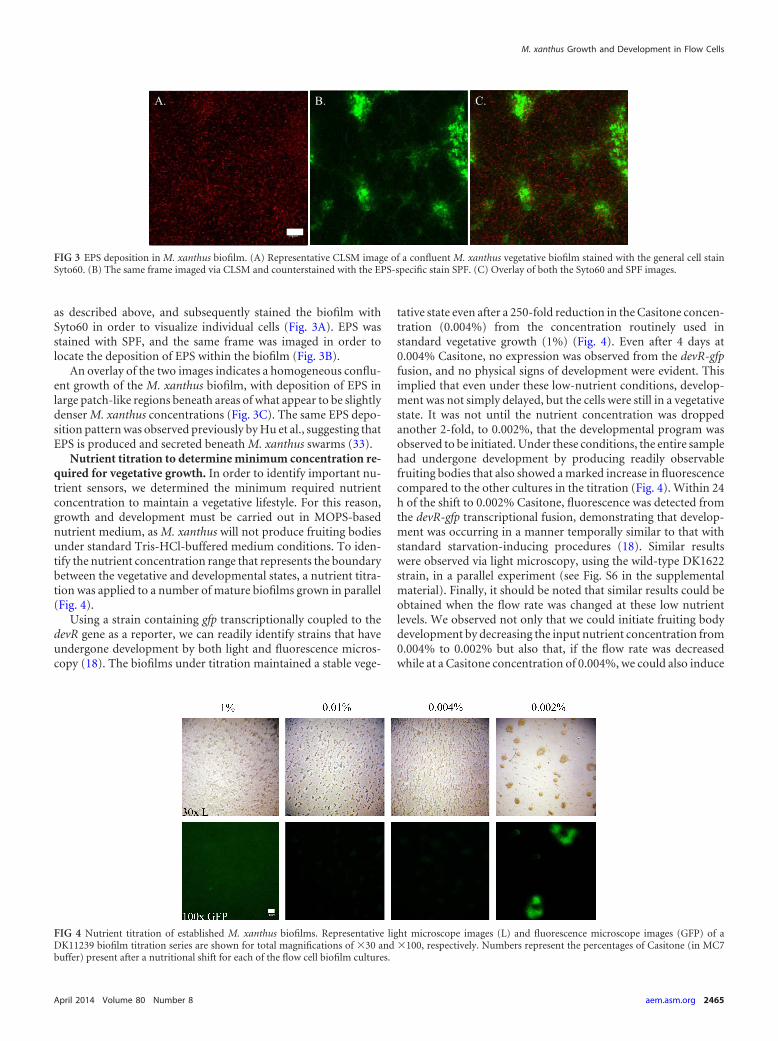
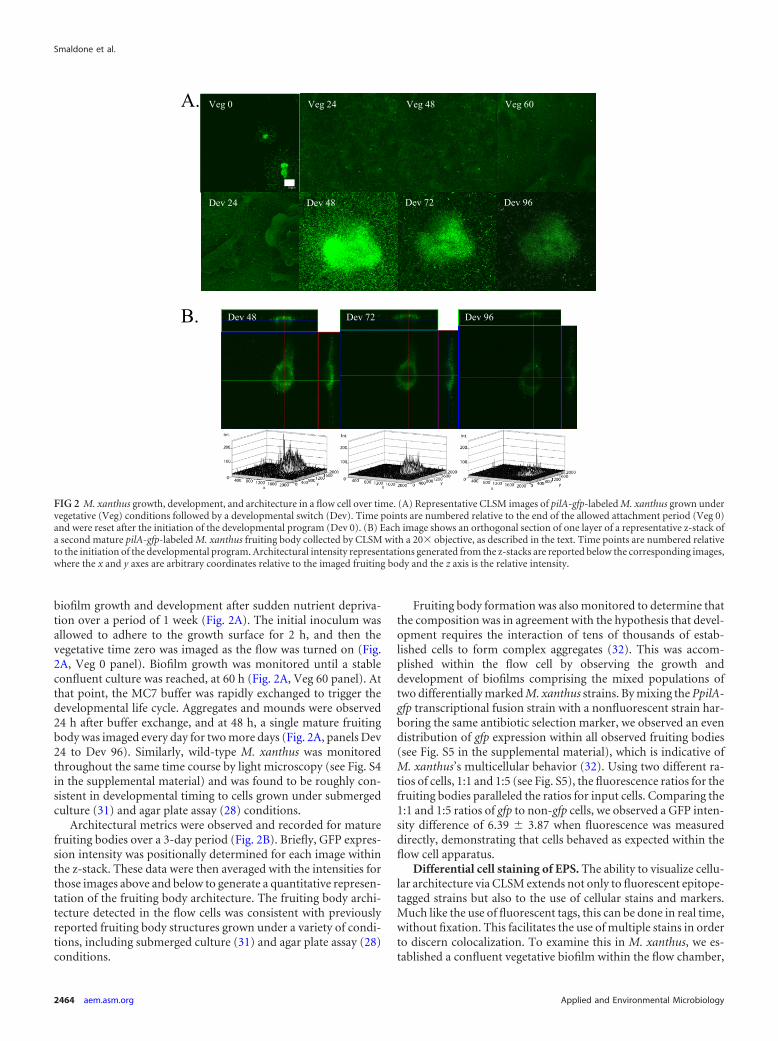
as described above, and subsequently stained the biofilm withSyto60 in order to visualize individual cells (Fig. 3A). EPS wasstained with SPF, and the same frame was imaged in order tolocate the deposition of EPS within the biofilm (Fig. 3B).
An overlay of the two images indicates a homogeneous conflu-ent growth of the M. xanthus biofilm, with deposition of EPS inlarge patch-like regions beneath areas of what appear to be slightlydenser M. xanthus concentrations (Fig. 3C). The same EPS depo-sition pattern was observed previously by Hu et al., suggesting thatEPS is produced and secreted beneath M. xanthus swarms (33).
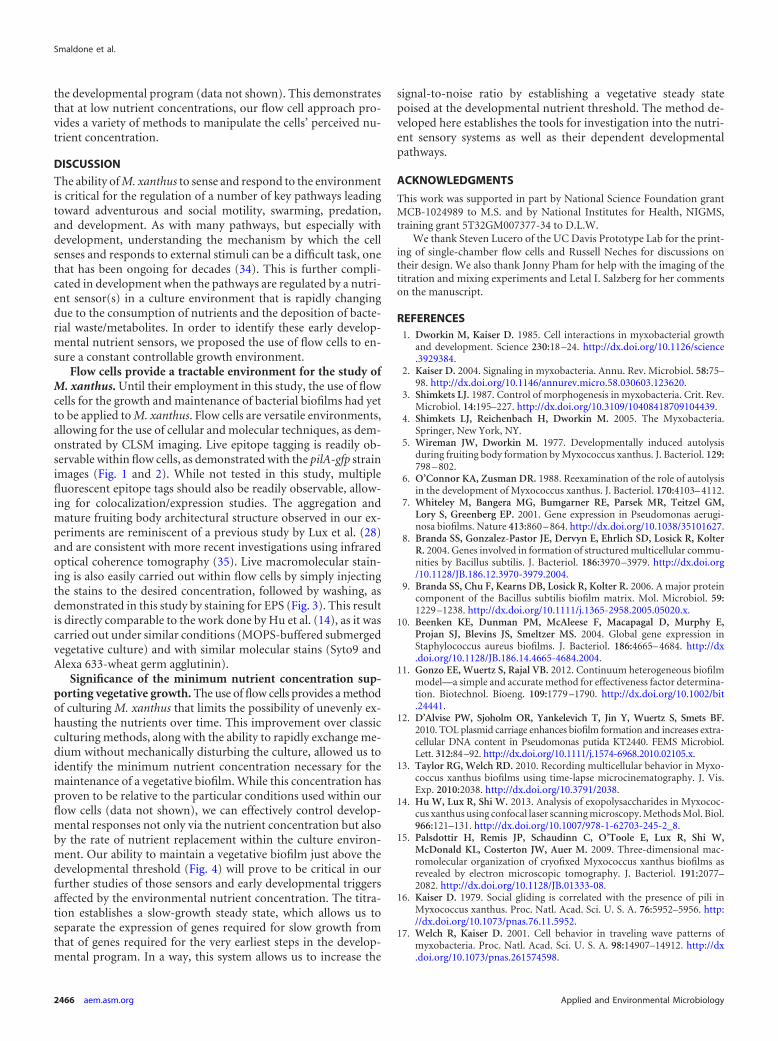
Nutrient titration to determine minimum concentration re-quired for vegetative growth. In order to identify important nu-trient sensors, we determined the minimum required nutrientconcentration to maintain a vegetative lifestyle. For this reason,growth and development must be carried out in MOPS-basednutrient medium, as M. xanthus will not produce fruiting bodiesunder standard Tris-HCl-buffered medium conditions. To iden-tify the nutrient concentration range that represents the boundarybetween the vegetative and developmental states, a nutrient titra-tion was applied to a number of mature biofilms grown in parallel(Fig. 4).
Using a strain containing gfp transcriptionally coupled to thedevR gene as a reporter, we can readily identify strains that haveundergone development by both light and fluorescence micros-copy (18). The biofilms under titration maintained a stable vege-
tative state even after a 250-fold reduction in the Casitone concen-tration (0.004%) from the concentration routinely used instandard vegetative growth (1%) (Fig. 4). Even after 4 days at0.004% Casitone, no expression was observed from the devR-gfpfusion, and no physical signs of development were evident. Thisimplied that even under these low-nutrient conditions, develop-ment was not simply delayed, but the cells were still in a vegetativestate. It was not until the nutrient concentration was droppedanother 2-fold, to 0.002%, that the developmental program wasobserved to be initiated. Under these conditions, the entire samplehad undergone development by producing readily observablefruiting bodies that also showed a marked increase in fluorescencecompared to the other cultures in the titration (Fig. 4). Within 24h of the shift to 0.002% Casitone, fluorescence was detected fromthe devR-gfp transcriptional fusion, demonstrating that develop-ment was occurring in a manner temporally similar to that withstandard starvation-inducing procedures (18). Similar resultswere observed via light microscopy, using the wild-type DK1622strain, in a parallel experiment (see Fig. S6 in the supplementalmaterial). Finally, it should be noted that similar results could beobtained when the flow rate was changed at these low nutrientlevels. We observed not only that we could initiate fruiting bodydevelopment by decreasing the input nutrient concentration from0.004% to 0.002% but also that, if the flow rate was decreasedwhile at a Casitone concentration of 0.004%, we could also induce
A. B. C.
50μm
FIG 3 EPS deposition in M. xanthus biofilm. (A) Representative CLSM image of a confluent M. xanthus vegetative biofilm stained with the general cell stainSyto60. (B) The same frame imaged via CLSM and counterstained with the EPS-specific stain SPF. (C) Overlay of both the Syto60 and SPF images.
FIG 4 Nutrient titration of established M. xanthus biofilms. Representative light microscope images (L) and fluorescence microscope images (GFP) of aDK11239 biofilm titration series are shown for total magnifications of �30 and �100, respectively. Numbers represent the percentages of Casitone (in MC7buffer) present after a nutritional shift for each of the flow cell biofilm cultures.
M. xanthus Growth and Development in Flow Cells
April 2014 Volume 80 Number 8 aem.asm.org 2465
the developmental program (data not shown). This demonstratesthat at low nutrient concentrations, our flow cell approach pro-vides a variety of methods to manipulate the cells’ perceived nu-trient concentration.
DISCUSSION
The ability of M. xanthus to sense and respond to the environmentis critical for the regulation of a number of key pathways leadingtoward adventurous and social motility, swarming, predation,and development. As with many pathways, but especially withdevelopment, understanding the mechanism by which the cellsenses and responds to external stimuli can be a difficult task, onethat has been ongoing for decades (34). This is further compli-cated in development when the pathways are regulated by a nutri-ent sensor(s) in a culture environment that is rapidly changingdue to the consumption of nutrients and the deposition of bacte-rial waste/metabolites. In order to identify these early develop-mental nutrient sensors, we proposed the use of flow cells to en-sure a constant controllable growth environment.
Flow cells provide a tractable environment for the study ofM. xanthus. Until their employment in this study, the use of flowcells for the growth and maintenance of bacterial biofilms had yetto be applied to M. xanthus. Flow cells are versatile environments,allowing for the use of cellular and molecular techniques, as dem-onstrated by CLSM imaging. Live epitope tagging is readily ob-servable within flow cells, as demonstrated with the pilA-gfp strainimages (Fig. 1 and 2). While not tested in this study, multiplefluorescent epitope tags should also be readily observable, allow-ing for colocalization/expression studies. The aggregation andmature fruiting body architectural structure observed in our ex-periments are reminiscent of a previous study by Lux et al. (28)and are consistent with more recent investigations using infraredoptical coherence tomography (35). Live macromolecular stain-ing is also easily carried out within flow cells by simply injectingthe stains to the desired concentration, followed by washing, asdemonstrated in this study by staining for EPS (Fig. 3). This resultis directly comparable to the work done by Hu et al. (14), as it wascarried out under similar conditions (MOPS-buffered submergedvegetative culture) and with similar molecular stains (Syto9 andAlexa 633-wheat germ agglutinin).
Significance of the minimum nutrient concentration sup-porting vegetative growth. The use of flow cells provides a methodof culturing M. xanthus that limits the possibility of unevenly ex-hausting the nutrients over time. This improvement over classicculturing methods, along with the ability to rapidly exchange me-dium without mechanically disturbing the culture, allowed us toidentify the minimum nutrient concentration necessary for themaintenance of a vegetative biofilm. While this concentration hasproven to be relative to the particular conditions used within ourflow cells (data not shown), we can effectively control develop-mental responses not only via the nutrient concentration but alsoby the rate of nutrient replacement within the culture environ-ment. Our ability to maintain a vegetative biofilm just above thedevelopmental threshold (Fig. 4) will prove to be critical in ourfurther studies of those sensors and early developmental triggersaffected by the environmental nutrient concentration. The titra-tion establishes a slow-growth steady state, which allows us toseparate the expression of genes required for slow growth fromthat of genes required for the very earliest steps in the develop-mental program. In a way, this system allows us to increase the
signal-to-noise ratio by establishing a vegetative steady statepoised at the developmental nutrient threshold. The method de-veloped here establishes the tools for investigation into the nutri-ent sensory systems as well as their dependent developmentalpathways.
ACKNOWLEDGMENTS
This work was supported in part by National Science Foundation grantMCB-1024989 to M.S. and by National Institutes for Health, NIGMS,training grant 5T32GM007377-34 to D.L.W.
We thank Steven Lucero of the UC Davis Prototype Lab for the print-ing of single-chamber flow cells and Russell Neches for discussions ontheir design. We also thank Jonny Pham for help with the imaging of thetitration and mixing experiments and Letal I. Salzberg for her commentson the manuscript.
REFERENCES1. Dworkin M, Kaiser D. 1985. Cell interactions in myxobacterial growth
and development. Science 230:18 –24. http://dx.doi.org/10.1126/science.3929384.
2. Kaiser D. 2004. Signaling in myxobacteria. Annu. Rev. Microbiol. 58:75–98. http://dx.doi.org/10.1146/annurev.micro.58.030603.123620.
3. Shimkets LJ. 1987. Control of morphogenesis in myxobacteria. Crit. Rev.Microbiol. 14:195–227. http://dx.doi.org/10.3109/10408418709104439.
4. Shimkets LJ, Reichenbach H, Dworkin M. 2005. The Myxobacteria.Springer, New York, NY.
5. Wireman JW, Dworkin M. 1977. Developmentally induced autolysisduring fruiting body formation by Myxococcus xanthus. J. Bacteriol. 129:798 – 802.
6. O’Connor KA, Zusman DR. 1988. Reexamination of the role of autolysisin the development of Myxococcus xanthus. J. Bacteriol. 170:4103– 4112.
7. Whiteley M, Bangera MG, Bumgarner RE, Parsek MR, Teitzel GM,Lory S, Greenberg EP. 2001. Gene expression in Pseudomonas aerugi-nosa biofilms. Nature 413:860 – 864. http://dx.doi.org/10.1038/35101627.
8. Branda SS, Gonzalez-Pastor JE, Dervyn E, Ehrlich SD, Losick R, KolterR. 2004. Genes involved in formation of structured multicellular commu-nities by Bacillus subtilis. J. Bacteriol. 186:3970 –3979. http://dx.doi.org/10.1128/JB.186.12.3970-3979.2004.
9. Branda SS, Chu F, Kearns DB, Losick R, Kolter R. 2006. A major proteincomponent of the Bacillus subtilis biofilm matrix. Mol. Microbiol. 59:1229 –1238. http://dx.doi.org/10.1111/j.1365-2958.2005.05020.x.
10. Beenken KE, Dunman PM, McAleese F, Macapagal D, Murphy E,Projan SJ, Blevins JS, Smeltzer MS. 2004. Global gene expression inStaphylococcus aureus biofilms. J. Bacteriol. 186:4665– 4684. http://dx.doi.org/10.1128/JB.186.14.4665-4684.2004.
11. Gonzo EE, Wuertz S, Rajal VB. 2012. Continuum heterogeneous biofilmmodel—a simple and accurate method for effectiveness factor determina-tion. Biotechnol. Bioeng. 109:1779 –1790. http://dx.doi.org/10.1002/bit.24441.
12. D’Alvise PW, Sjoholm OR, Yankelevich T, Jin Y, Wuertz S, Smets BF.2010. TOL plasmid carriage enhances biofilm formation and increases extra-cellular DNA content in Pseudomonas putida KT2440. FEMS Microbiol.Lett. 312:84–92. http://dx.doi.org/10.1111/j.1574-6968.2010.02105.x.
13. Taylor RG, Welch RD. 2010. Recording multicellular behavior in Myxo-coccus xanthus biofilms using time-lapse microcinematography. J. Vis.Exp. 2010:2038. http://dx.doi.org/10.3791/2038.
14. Hu W, Lux R, Shi W. 2013. Analysis of exopolysaccharides in Myxococ-cus xanthus using confocal laser scanning microscopy. Methods Mol. Biol.966:121–131. http://dx.doi.org/10.1007/978-1-62703-245-2_8.
15. Palsdottir H, Remis JP, Schaudinn C, O’Toole E, Lux R, Shi W,McDonald KL, Costerton JW, Auer M. 2009. Three-dimensional mac-romolecular organization of cryofixed Myxococcus xanthus biofilms asrevealed by electron microscopic tomography. J. Bacteriol. 191:2077–2082. http://dx.doi.org/10.1128/JB.01333-08.
16. Kaiser D. 1979. Social gliding is correlated with the presence of pili inMyxococcus xanthus. Proc. Natl. Acad. Sci. U. S. A. 76:5952–5956. http://dx.doi.org/10.1073/pnas.76.11.5952.
17. Welch R, Kaiser D. 2001. Cell behavior in traveling wave patterns ofmyxobacteria. Proc. Natl. Acad. Sci. U. S. A. 98:14907–14912. http://dx.doi.org/10.1073/pnas.261574598.
Smaldone et al.
2466 aem.asm.org Applied and Environmental Microbiology
18. Kaiser D. 1999. Cell fate and organogenesis in bacteria. Trends Genet.15:273–277. http://dx.doi.org/10.1016/S0168-9525(99)01740-0.
19. Kroos L, Kuspa A, Kaiser D. 1986. A global analysis of developmentallyregulated genes in Myxococcus xanthus. Dev. Biol. 117:252–266. http://dx.doi.org/10.1016/0012-1606(86)90368-4.
20. Berleman JE, Chumley T, Cheung P, Kirby JR. 2006. Rippling is apredatory behavior in Myxococcus xanthus. J. Bacteriol. 188:5888 –5895.http://dx.doi.org/10.1128/JB.00559-06.
21. Kuehn M, Hausner M, Bungartz HJ, Wagner M, Wilderer PA, WuertzS. 1998. Automated confocal laser scanning microscopy and semiauto-mated image processing for analysis of biofilms. Appl. Environ. Microbiol.64:4115– 4127.
22. Schneider CA, Rasband WS, Eliceiri KW. 2012. NIH Image to ImageJ: 25years of image analysis. Nat. Methods 9:671– 675. http://dx.doi.org/10.1038/nmeth.2089.
23. Merod RT, Warren JE, McCaslin H, Wuertz S. 2007. Toward automatedanalysis of biofilm architecture: bias caused by extraneous confocal laserscanning microscopy images. Appl. Environ. Microbiol. 73:4922– 4930.http://dx.doi.org/10.1128/AEM.00023-07.
24. Kvilekval K, Fedorov D, Obara B, Singh A, Manjunath BS. 2010. Bisque:a platform for bioimage analysis and management. Bioinformatics 26:544 –552. http://dx.doi.org/10.1093/bioinformatics/btp699.
25. Klausen M, Heydorn A, Ragas P, Lambertsen L, Aaes-Jorgensen A,Molin S, Tolker-Nielsen T. 2003. Biofilm formation by Pseudomonasaeruginosa wild type, flagella and type IV pili mutants. Mol. Microbiol.48:1511–1524. http://dx.doi.org/10.1046/j.1365-2958.2003.03525.x.
26. Moller S, Sternberg C, Andersen JB, Christensen BB, Ramos JL, Givs-kov M, Molin S. 1998. In situ gene expression in mixed-culture biofilms:
evidence of metabolic interactions between community members. Appl.Environ. Microbiol. 64:721–732.
27. Jelsbak L, Sogaard-Andersen L. 2003. Cell behavior and cell-cell communi-cation during fruiting body morphogenesis in Myxococcus xanthus. J. Micro-biol. Methods 55:829–839. http://dx.doi.org/10.1016/j.mimet.2003.08.007.
28. Lux R, Li A, Shi W. 2004. Detailed three-dimensional analysis of struc-tural features of Myxococcus xanthus fruiting bodies using confocallaser scanning microscopy. Biofilms 1:293–303. http://dx.doi.org/10.1017/S1479050505001559.
29. Hoch HC, Galvani CD, Szarowski DH, Turner JN. 2005. Two newfluorescent dyes applicable for visualization of fungal cell walls. Mycologia97:580 –588. http://dx.doi.org/10.3852/mycologia.97.3.580.
30. Cowan SE, Gilbert E, Liepmann D, Keasling JD. 2000. Commensalinteractions in a dual-species biofilm exposed to mixed organic com-pounds. Appl. Environ. Microbiol. 66:4481– 4485. http://dx.doi.org/10.1128/AEM.66.10.4481-4485.2000.
31. Kuner JM, Kaiser D. 1982. Fruiting body morphogenesis in submergedcultures of Myxococcus xanthus. J. Bacteriol. 151:458 – 461.
32. Ward MJ, Zusman DR. 1999. Motility in Myxococcus xanthus and itsrole in developmental aggregation. Curr. Opin. Microbiol. 2:624 – 629.http://dx.doi.org/10.1016/S1369-5274(99)00032-6.
33. Hu W, Hossain M, Lux R, Wang J, Yang Z, Li Y, Shi W. 2011.Exopolysaccharide-independent social motility of Myxococcus xanthus.PLoS One 6:e16102. http://dx.doi.org/10.1371/journal.pone.0016102.
34. Bretscher AP, Kaiser D. 1978. Nutrition of Myxococcus xanthus, a fruit-ing myxobacterium. J. Bacteriol. 133:763–768.
35. Harvey CW, Du H, Xu Z, Kaiser D, Aranson I, Alber M. 2012. Intercon-nected cavernous structure of bacterial fruiting bodies. PLoS Comput. Biol.8:e1002850. http://dx.doi.org/10.1371/journal.pcbi.1002850.
M. xanthus Growth and Development in Flow Cells
April 2014 Volume 80 Number 8 aem.asm.org 2467