growth and stagnation in the world...
TRANSCRIPT

www.conferenceboard.org© 2014 The Conference Board, Inc. |1
Third World KLEMS ConferenceMay 19-20, 2014, Tokyo
Time to Realize the Opportunities for Growth?Growth and Stagnation in the World Economy

www.conferenceboard.org© 2014 The Conference Board, Inc. |2
Optimism seems to be in the air …

www.conferenceboard.org© 2014 The Conference Board, Inc. |3
Consumer confidence in the U.S. remained near its post-crisis high with expectations maintaining its momentum
Note: Shaded area represents a recession.Sources: Nielsen, TNS, The Conference Board
0
20
40
60
80
100
120
140
2005 2006 2007 2008 2009 2010 2011 2012 2013 2014
E xp e c ta t io n s In d e xP re s e n t S itu a t io n In d e x
Index, 1985=100
Apr '14
C o n s u m e r C o n fid e n c e In d e x®
www.conferenceboard.org© 2014 The Conference Board, Inc. |4
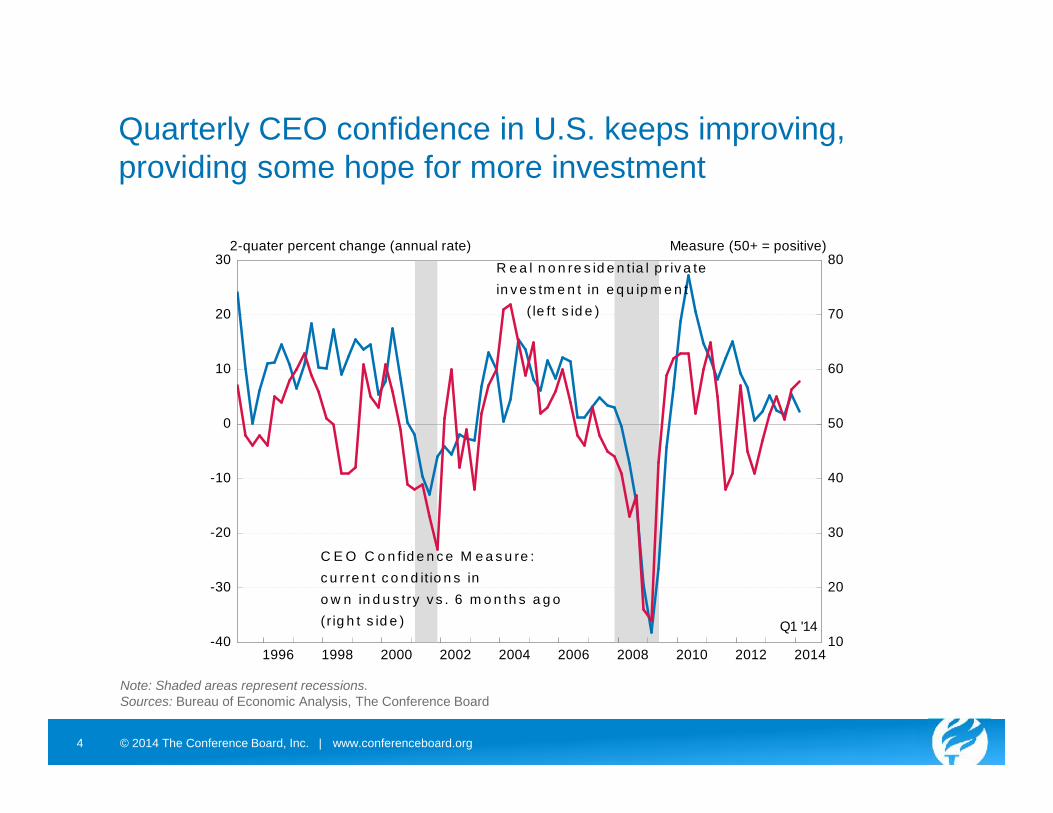
Quarterly CEO confidence in U.S. keeps improving,providing some hope for more investment
Note: Shaded areas represent recessions.Sources: Bureau of Economic Analysis, The Conference Board
-40
-30
-20
-10
0
10
20
30
10
20
30
40
50
60
70
80
1996 1998 2000 2002 2004 2006 2008 2010 2012 2014
Measure (50+ = positive)2-quater percent change (annual rate)
C E O C o n fid e n c e M e a s u re :c u rre n t c o n d it io n s ino w n in d u s try v s . 6 m o n th s a g o(r ig h t s id e )
R e a l n o n re s id e n tia l p r iv a tein v e s tm e n t in e q u ip m e n t
( le ft s id e )
Q1 '14
www.conferenceboard.org© 2014 The Conference Board, Inc. |5
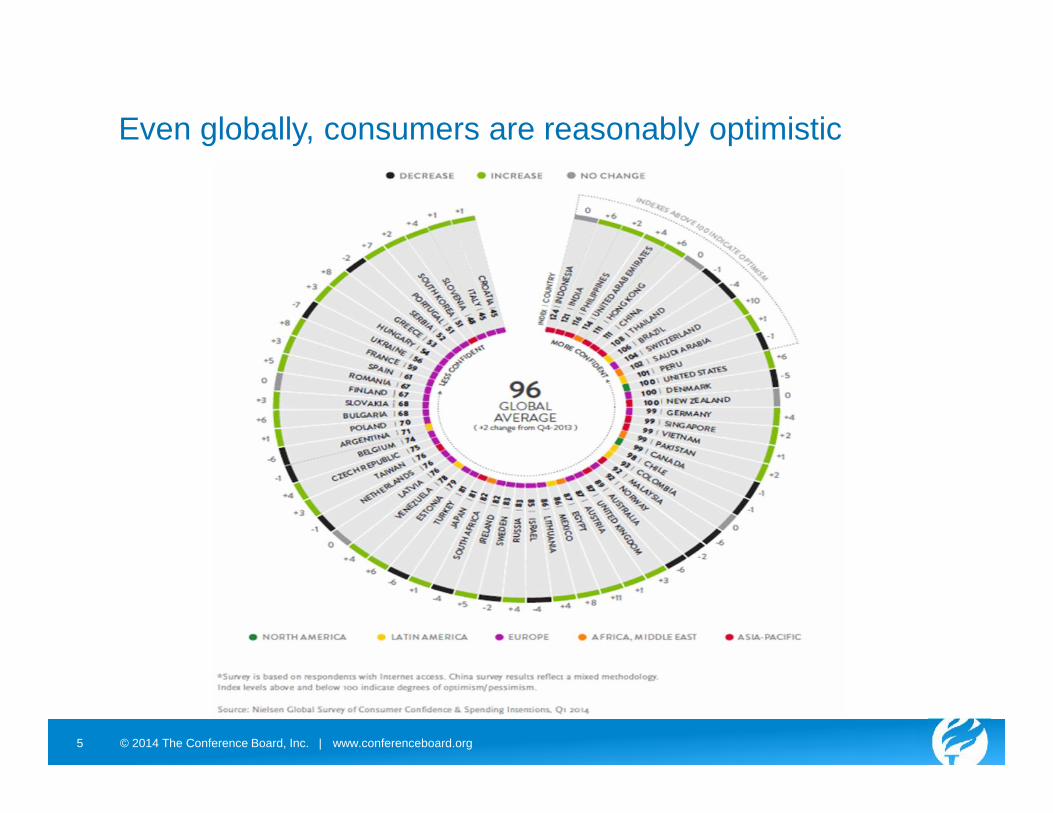
Even globally, consumers are reasonably optimistic

www.conferenceboard.org© 2014 The Conference Board, Inc. |6
Time to realize the opportunities for growth ?

www.conferenceboard.org© 2014 The Conference Board, Inc. |7
Is the optimism confirmed by the facts?
www.conferenceboard.org© 2014 The Conference Board, Inc. |8
Five short-term trends do not give much hope for majoracceleration of global growth in 2014 and 2015
1. Among mature economies only United States shows mostpotential for continued faster growth beyond 2014
2. Europe and Japan are struggling to remain competitive in globaleconomy while fighting off deflation
3. Gradually slowing economic growth in China, India and SouthAmerica – Southeast Asia and Africa create a small positive
4. Elevated risk of financial crisis in China—freeze of capitalmarkets, drastic cuts in investments
5. Russia (and Ukraine), Western Asia and the Middle East onthe borderline of free market economies and autocratic commandeconomies

www.conferenceboard.org© 2014 The Conference Board, Inc. |9
Source: Haver Analytics
Quarterly growth rates remain volatile reflecting matureeconomies’ struggle to get on a sustainable growth path
-0.4
-0.2
0.0
0.2
0.4
0.6
0.8
1.0
1.2
1.4
1.6
Q1 2013 Q2 2013 Q3 2013 Q4 2013 Q1 2014
US EA JapanQuarterly GDP growth
Percent Change from previous quarter
www.conferenceboard.org© 2014 The Conference Board, Inc. |10
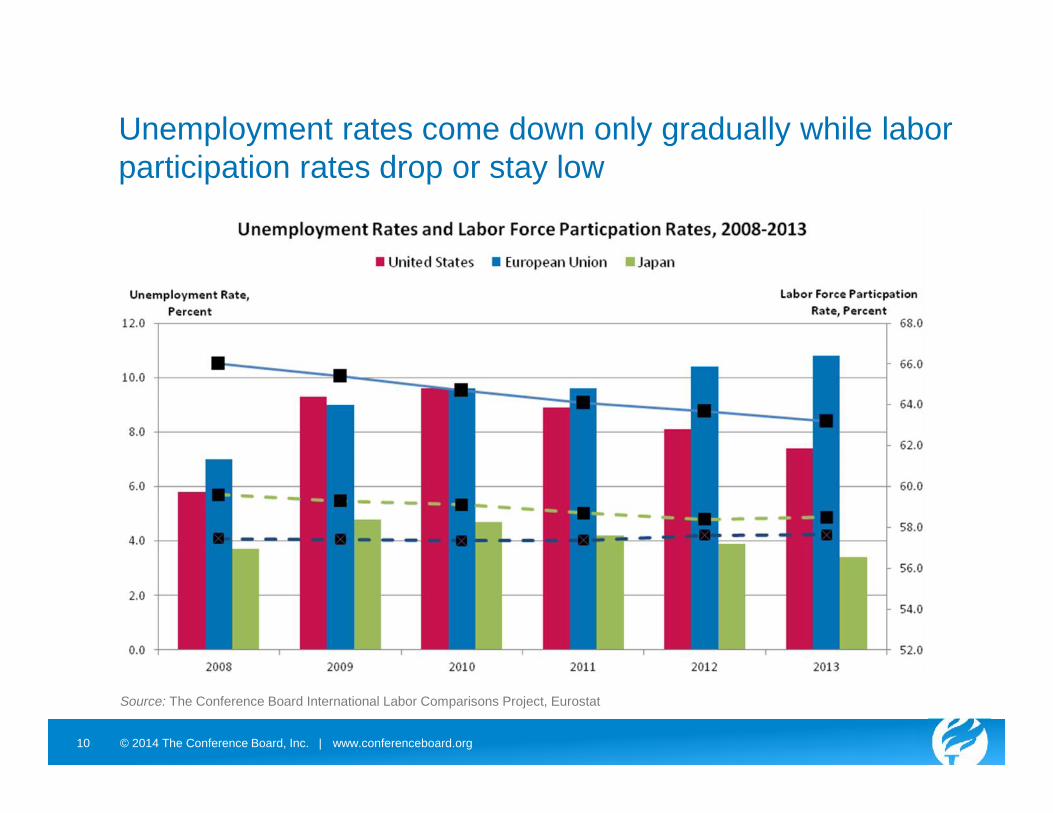
Unemployment rates come down only gradually while laborparticipation rates drop or stay low
Source: The Conference Board International Labor Comparisons Project, Eurostat

www.conferenceboard.org© 2014 The Conference Board, Inc. |11
-30
-25
-20
-15
-10
-5
0
5
10
15
20
25
-60
-50
-40
-30
-20
-10
0
10
20
30
40
50
2006 2007 2008 2009 2010 2011 2012 2013 2014
U.S . (Mar '14)E uro A rea (Mar '14)UK (Feb '14)J apan (Feb '14)
6-month percent change (annual rate)
The Conference BoardLeading Economic Indexes®
6-month percent change (annual rate)
Japan(right side)
Source: The Conference Board
Leading Economic Indicators suggest some levelling offin the expansionary phase of the business cycle - Japanportrays more weakness

www.conferenceboard.org© 2014 The Conference Board, Inc. |12
Source: The Conference Board
Emerging markets remain at lower end of growth cycle, butdivergence between Asia and South America apparent
-30
-20
-10
0
10
20
30
2006 2007 2008 2009 2010 2011 2012 2013 2014
C h in a (M a r '1 4 )In d ia (M a r '1 4 )T C B /F G V B ra zil (M a r '1 4 )M e xic o (F e b '1 4 )
6-month percent change (annual rate)
The Conference B oardLeading Economic Indexes®
www.conferenceboard.org© 2014 The Conference Board, Inc. |13
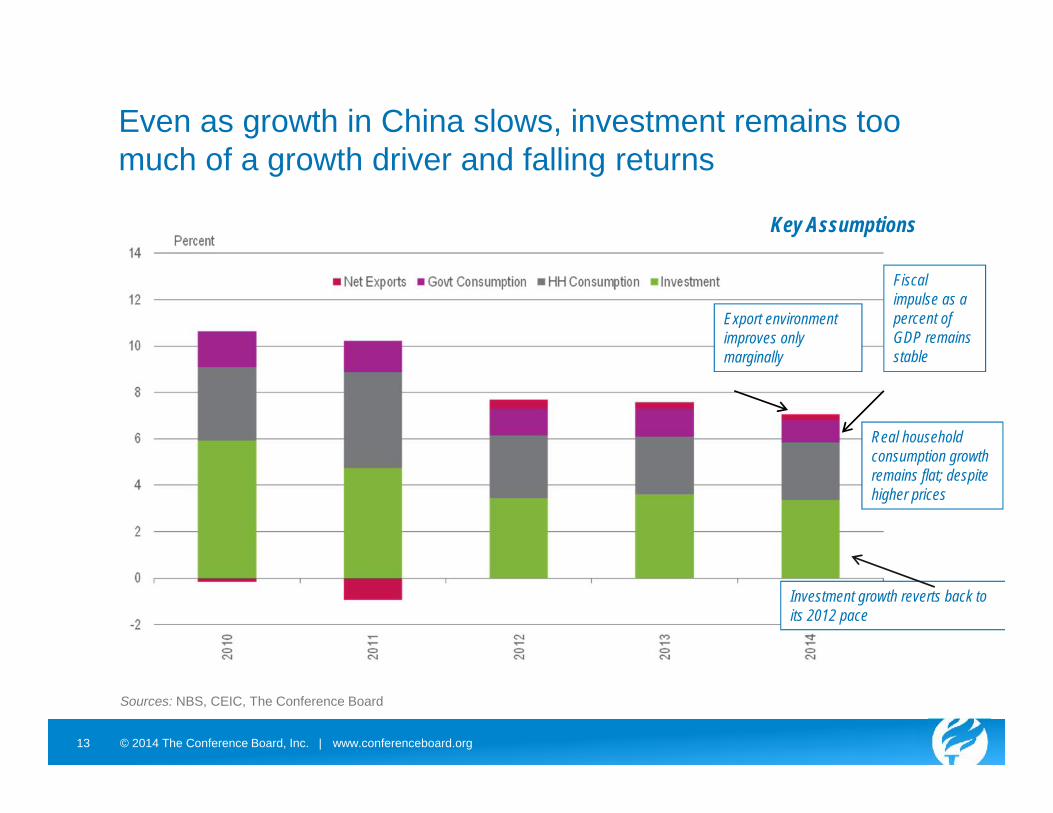
Even as growth in China slows, investment remains toomuch of a growth driver and falling returns
Key Assumptions
Export environmentimproves onlymarginally
Fiscalimpulse as apercent ofGDP remainsstable
Real householdconsumption growthremains flat; despitehigher prices
Investment growth reverts back toits 2012 pace
Sources: NBS, CEIC, The Conference Boardzz

www.conferenceboard.org© 2014 The Conference Board, Inc. |14
Low labor compensation in manufacturing industries hasbeen key to competitive advantage for emergingeconomies, but costs have been rapidly rising
Note: Data for China refer to 2002–2009. Data for India refer to 2000–2010 and correspond to the organized (or formal) manufacturing sector only. Due to limitations with officialChinese and Indian data sources, compensation estimates for China and India are not directly comparable to compensation estimates for other countries. The Euro Areaincludes EU member states that have adopted the Euro as of January 1, 2011, except Cyprus, Luxembourg, Malta, and Slovenia. Eastern Europe includes the Czech Republic,Estonia, Hungary, Poland, and Slovakia. East Asia ex-Japan includes the Philippines, Singapore, South Korea, and Taiwan.Source: The Conference Board, International Labor Comparisons program
0
20
40
60
80
100
120
140
Euro Area United States Japan Brazil Mexico China India
Hourly compensation costs in manufacturing, selected economies and regions, as a percentageof costs in the United States, 2000–2012
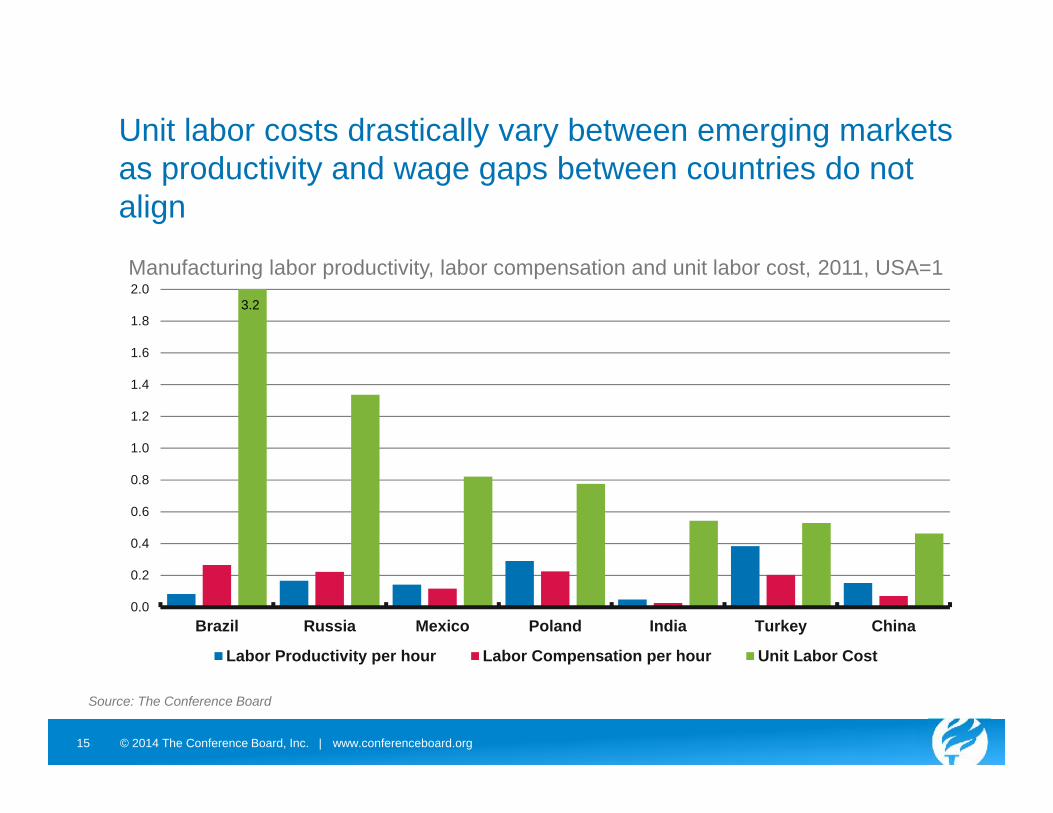
www.conferenceboard.org© 2014 The Conference Board, Inc. |15
0.0
0.2
0.4
0.6
0.8
1.0
1.2
1.4
1.6
1.8
2.0
Brazil Russia Mexico Poland India Turkey China
Labor Productivity per hour Labor Compensation per hour Unit Labor Cost
3.2
Unit labor costs drastically vary between emerging marketsas productivity and wage gaps between countries do notalign
Manufacturing labor productivity, labor compensation and unit labor cost, 2011, USA=1
Source: The Conference Board

www.conferenceboard.org© 2014 The Conference Board, Inc. |16
Update of global outlook suggests slight downward trendin near-term projections
**Europe includes 27 members of the European Union (excluding Croatia) as well as Switzerland and Norway.**Other mature economies are Australia, Canada, Iceland, Israel, Hong Kong, South Korea, New Zealand, Singapore, and Taiwan Province of China.***Southeast Europe includes Albania, Bosnia and Herzegovina, Croatia, Macedonia, Serbia and Montenegro, and Turkey.Source: The Conference Board Global Economic Outlook 2014, update February 2014
US: down from 3.0 to 2.3%
Brazil: down from 2.3 to 1.8%
Latin America: down from 2.8 to 2.6%
World: down from 3.5 to 3.3%
Japan: down from 2.0 to 1.8%
India: up from 4.4 to 5.0%
Russia CEE&SE: down from 2.7 to 2.0%

www.conferenceboard.org© 2014 The Conference Board, Inc. |17
In medium term slowing sources of growth dominate –hence looking for growth opportunities is crucial

www.conferenceboard.org© 2014 The Conference Board, Inc. |18
Long term global trend will be slowing in mature economies,but much more dramatically in emerging markets
GDP Growth (projected and trend growth), year over year % change
*Europe includes all 27 members of the European Union (excl. Croatia), as well as Switzerland and Norway.**Other advanced economies are Australia; Canada; Iceland; Israel; Hong Kong; Korea; New Zealand; Singapore; and Taiwan Province of China*** Southeast Europe includes Albania, Bosnia & Herzegovina, Croatia, Macedonia, Serbia & Montenegro, and Turkey.Source: The Conference Board Global Economic Outlook 2014, November 2013 (https://www.conference-board.org/data/globaloutlook.cfm)
www.conferenceboard.org© 2014 The Conference Board, Inc. |19
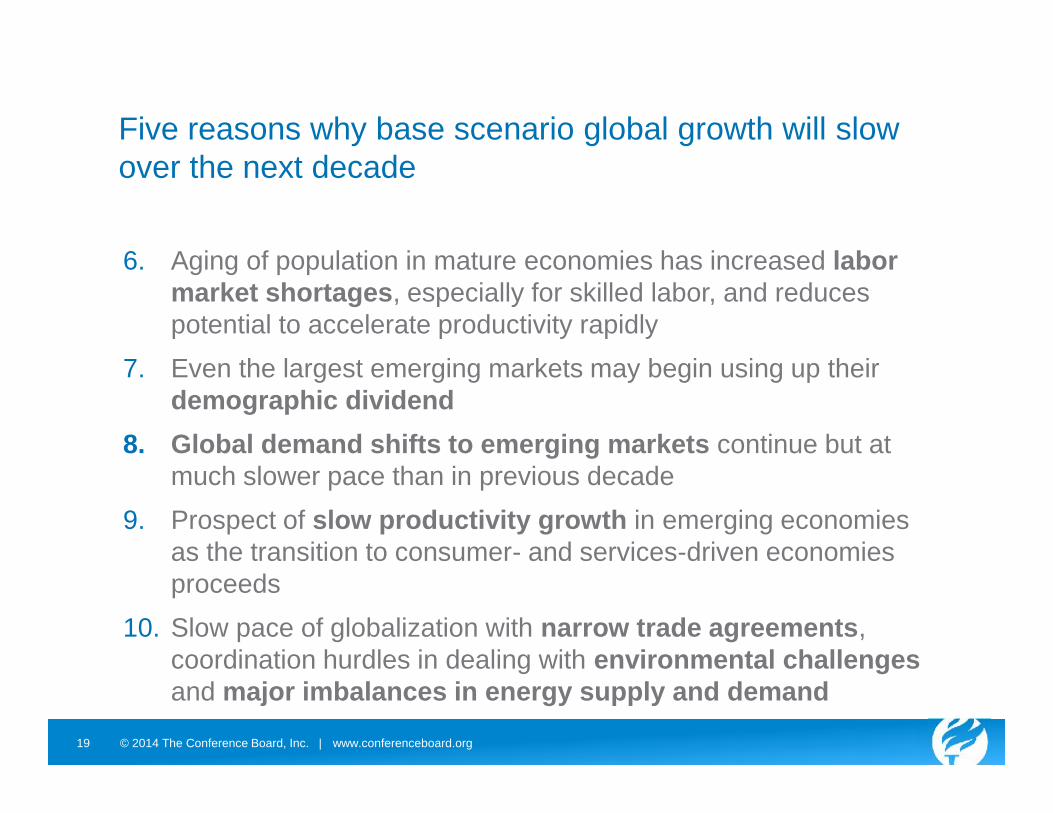
Five reasons why base scenario global growth will slowover the next decade
6. Aging of population in mature economies has increased labormarket shortages, especially for skilled labor, and reducespotential to accelerate productivity rapidly
7. Even the largest emerging markets may begin using up theirdemographic dividend
8. Global demand shifts to emerging markets continue but atmuch slower pace than in previous decade
9. Prospect of slow productivity growth in emerging economiesas the transition to consumer- and services-driven economiesproceeds
10. Slow pace of globalization with narrow trade agreements,coordination hurdles in dealing with environmental challengesand major imbalances in energy supply and demand
www.conferenceboard.org© 2014 The Conference Board, Inc. |20 20
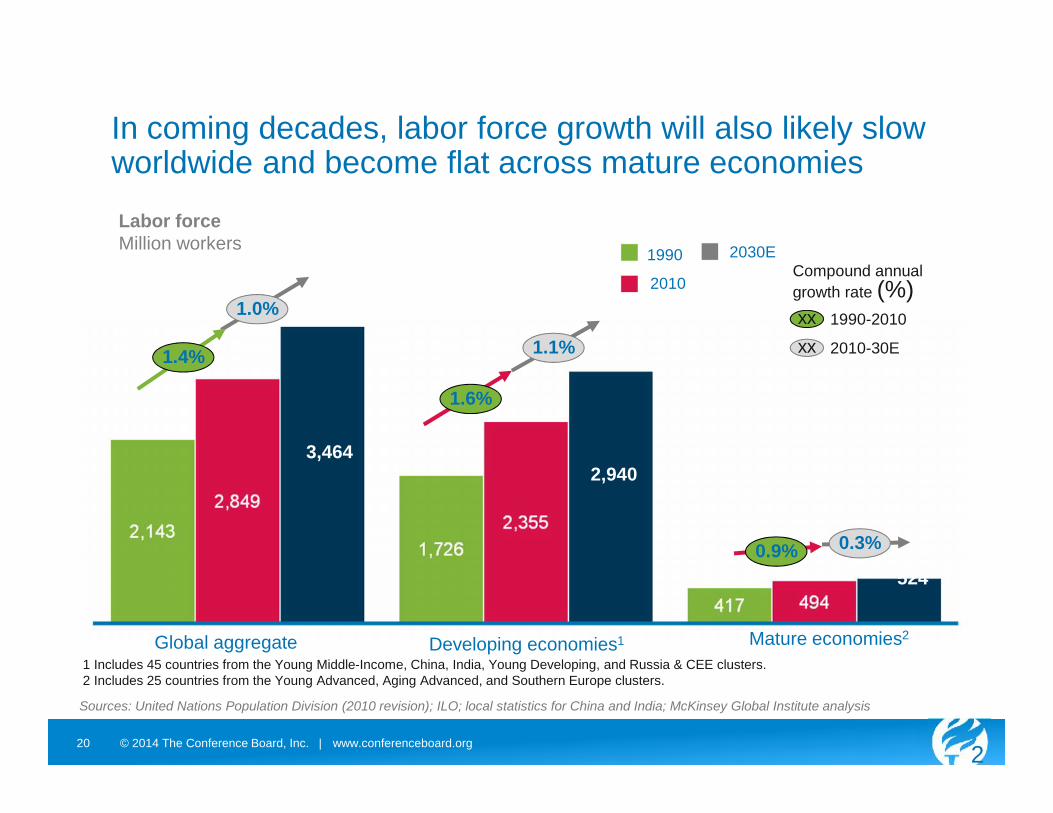
In coming decades, labor force growth will also likely slowworldwide and become flat across mature economies
1 Includes 45 countries from the Young Middle-Income, China, India, Young Developing, and Russia & CEE clusters.2 Includes 25 countries from the Young Advanced, Aging Advanced, and Southern Europe clusters.
Sources: United Nations Population Division (2010 revision); ILO; local statistics for China and India; McKinsey Global Institute analysis
0.3%0.9%
1.1%
1.6%
1.0%
1.4%
Mature economies2
524
Developing economies1
2,940
Global aggregate
3,464
2030E
2010
1990
1990-2010xx2010-30Exx
Compound annualgrowth rate (%)
Labor forceMillion workers

www.conferenceboard.org© 2014 The Conference Board, Inc. |21
The shift of economic activity from mature to emergingmarkets will continue, creating increased purchasingpower, but at slower pace
Region Shares in Global Output(PPP-converted levels of GDP)
*Europe includes all 27 members of the European Union (excl. Croatia), as well as Switzerland and Norway.**Other advanced economies are Australia; Canada; Iceland; Israel; Hong Kong; Korea; New Zealand; Singapore; and Taiwan Province of China*** Southeast Europe includes Albania, Bosnia & Herzegovina, Croatia, Macedonia, Serbia & Montenegro, and Turkey.Source: The Conference Board Global Economic Outlook 2014, November 2013 (https://www.conference-board.org/data/globaloutlook.cfm)

www.conferenceboard.org© 2014 The Conference Board, Inc. |22
The change towards a larger middle class in emergingmarkets is even bigger than the shift in GDP
Note: Global Rich and Middle Class are all individuals with a per capita income above $4,000Source: Uri Dadush and William Shaw, Juggernaut. How Emerging Markets are Reshaping Globalization, Carnegie Endowment forInternational Peace
Distribution of Population in Global Rich and Middle Class*, %
www.conferenceboard.org© 2014 The Conference Board, Inc. |23
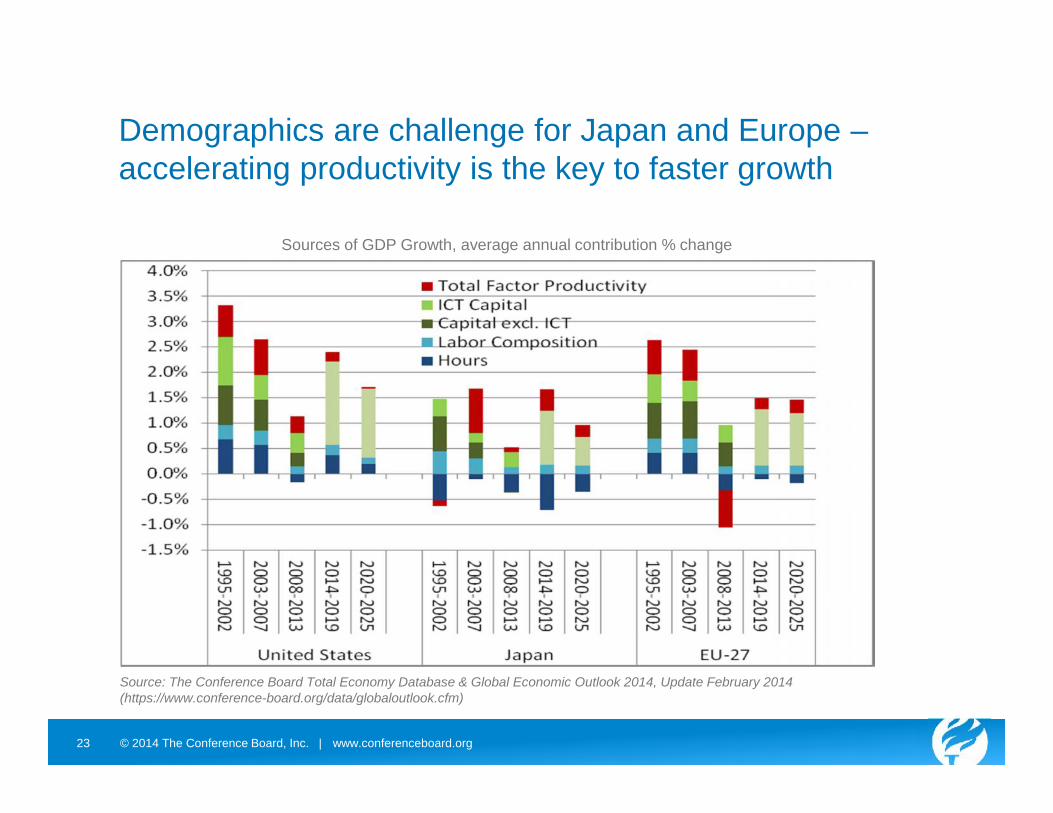
Demographics are challenge for Japan and Europe –accelerating productivity is the key to faster growth
Source: The Conference Board Total Economy Database & Global Economic Outlook 2014, Update February 2014(https://www.conference-board.org/data/globaloutlook.cfm)
Sources of GDP Growth, average annual contribution % change

www.conferenceboard.org© 2014 The Conference Board, Inc. |24
Rebalancing investment and productivity is mainchallenge for the largest emerging markets
Source: The Conference Board Total Economy Database & Global Economic Outlook 2014, Update February 2014(https://www.conference-board.org/data/globaloutlook.cfm)
Sources of GDP Growth, average annual contribution % change
www.conferenceboard.org© 2014 The Conference Board, Inc. |25
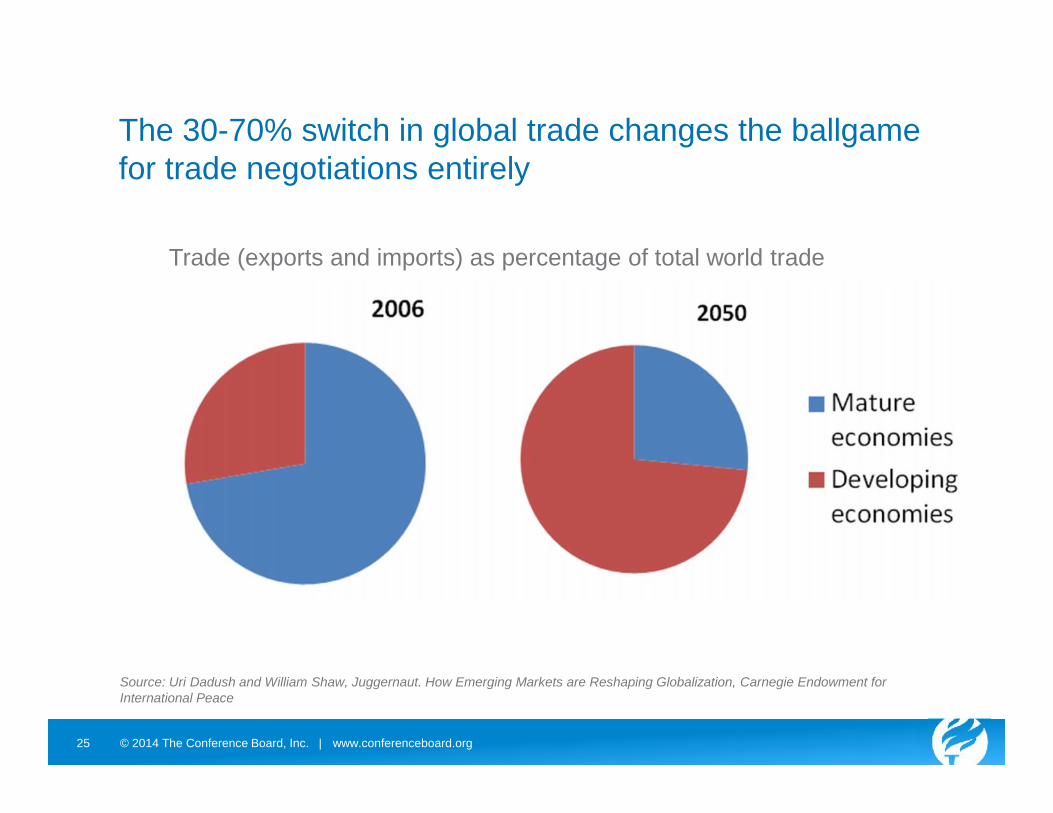
The 30-70% switch in global trade changes the ballgamefor trade negotiations entirely
Source: Uri Dadush and William Shaw, Juggernaut. How Emerging Markets are Reshaping Globalization, Carnegie Endowment forInternational Peace
Trade (exports and imports) as percentage of total world trade

www.conferenceboard.org© 2014 The Conference Board, Inc. |26
0%
10%
20%
30%
40%
50%
60%
70%
UnitedStates
EU Japan OtherAdvanced
China India Brazil Russia OtherEmerging
United States China
Trade Relations Will beComprehensively Reoriented
Source: Uri Dadush and William Shaw, Juggernaut. How Emerging Markets are Reshaping Globalization, Carnegie Endowment forInternational Peace
U.S. and China’s Share of Trade (Exports & Imports) by Country, 2050
Trade relations will shift rapidly to emerging markets,especially China

www.conferenceboard.org© 2014 The Conference Board, Inc. |27
Emerging markets are rapidly gaining share in globalmanufacturing value added
6% 7%8%
9% 10% 11%
21% 16%13%
14%12%
15%
16%21% 23%
0%
10%
20%
30%
40%
50%
60%
70%
80%
90%
100%
1995
2002
2011
Electrical Products &ElectronicsMetal Products
Textile Products
Chemicals
Machinery
Rubber & Plastics
Food Products
TransportationEquipmentOther Products
Paper Products
Cement, Clay, Stone,& Glass ProductsPetroleum Products
Leather Products
Wood Products
Breakdown of China’s GVC income inmanufacturing by sector
0%
5%
10%
15%
20%
25%
30%
35%
1995
1996
1997
1998
1999
2000
2001
2002
2003
2004
2005
2006
2007
2008
2009
2010
2011
EU27 NAFTA East AsiaChina BRIIAT* ROW
Share of GVC income in global manufacturing
Sources: WIOD, The Conference BoardNote: * BRIIAT includes Brazil, Russia, India, Indonesia, Australia, and Turkey.
www.conferenceboard.org© 2014 The Conference Board, Inc. |28
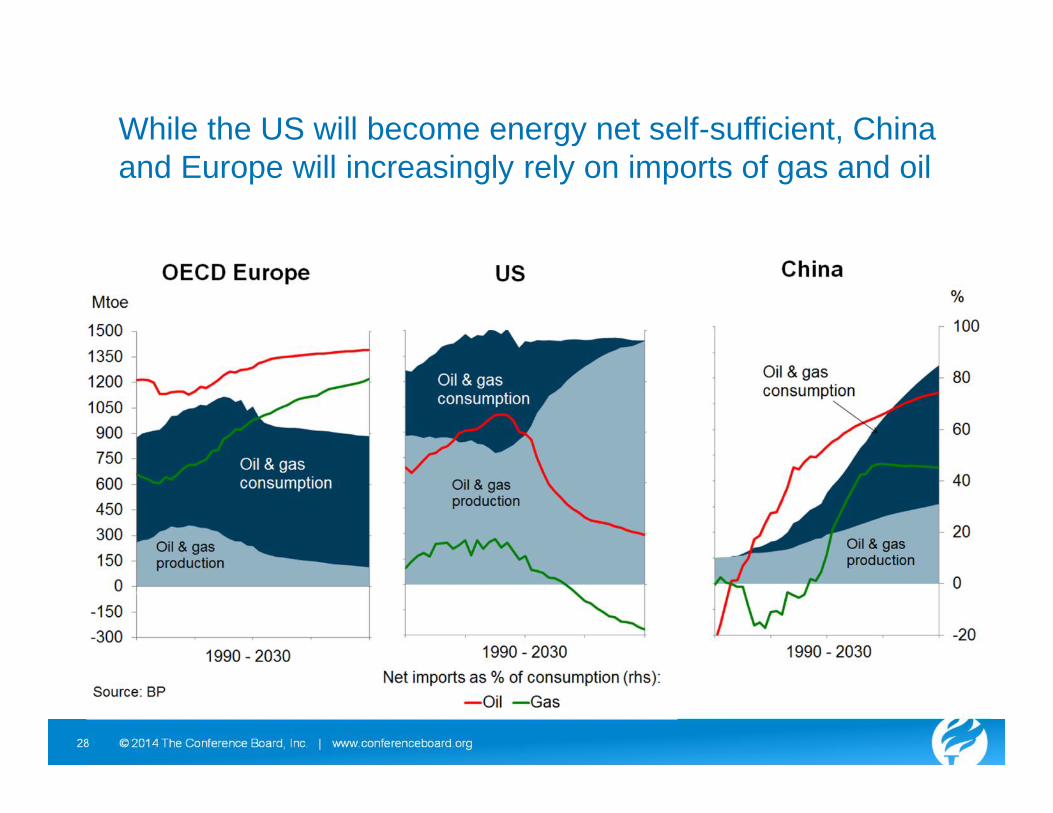
While the US will become energy net self-sufficient, Chinaand Europe will increasingly rely on imports of gas and oil

www.conferenceboard.org© 2014 The Conference Board, Inc. |29
Time to realize the opportunities for growth?
In the short-term, growth will depend on: Orderly adjustments to monetary and fiscal stances around the world Bring down unemployment, grow wages and restore purchasing power Return to investment in growth in mature markets Commitment to labor, capital and product market reforms, especially in
emerging markets
In the medium-term, growth will depend on: Tackle long-term demographic challenges through entitlement and
educational reforms Conclude comprehensive trade and other multilateral agreements Manage a transition to a more sustainable path to tackle environmental
challenges in climate change and shifts in the global energy market Focus investment agendas on innovation to drive productivity