al szymanski - productivity growth and capitalist stagnation
TRANSCRIPT
PRODUCTIVITY GROWTH AND CAPITALIST STAGNATION
AL SZYMANSKI
RECENT YEARS IT HAS BECOME common for both the right (Reagan, Thatcher, and the economists associated with them) as well as much of the left (the rising share of
labor/profit squeeze theorists currently popular in some Western European and U.S. academic circles, e.g., Bowles, Gordon and Weisskopf1) to emphasize that a primary cause of the relative economic stagnation of the 1970s and the economic crisis of the 1980s has been the decline in the rate of increase in labor pro- ductivity. Both tend to attribute the decline in productivity pri- marily to the loss of work incentives - a loss of worker motiva- tion as a result of increased job security, and/or the increased political power of the working class manifested in a rising level of social benefits that have significantly decreased the fear of re- duced living standards encumbent on unemployment.
There is also another important contemporary current which emphasizes productivity as the essential cause of the growing economic stagnation of the 1970s and 1980s. This tend- ency, whose Congressional advocates have been labeled "Atari Democrats," emphasizes the failure of the state to devote suffi- cient resources to research, development and technical/scientific education, along with the failure of private industry to invest heavily in high technology "sunrise" industries. This approach tends to look to Japan as its model, and to emphasize state sup- port of "^industrialization" policies (including state planning and subsidized loan participation in "high-tech" export-oriented industries).
This paper argues against both positions. Instead it main-
1 Samuel Bowles, David Gordon and Thomas Weisskopf, Beyond the Wasteland: A Demo- cratic Alternative to Economic Decline (New York, 1983).
295
296 SCIENCE & SOCIETY
tains that the cause of the (exaggerated) decline in productivity since the mid-1960s in both the U.S. and other advanced capital- ist countries is to be found primarily in the failure of effective demand (a result largely of stagnation in the level of state ex- penditures and real wages). Lastly, it is argued that attempts to increase productivity without dealing with the basic causes of its decline can, to the extent they are successful, only aggravate the fundamental economic problem of the 1980s - the tendency for the value of output to outrun purchasing power.
The Trends in Output Per Worker
The claim that there has been a radical decline in productiv- ity growth over the course of the 1970s has been exaggerated. Victor Perlo has done a thorough critique of the U.S. Bureau of Labor Statistics (BLS) measures of productivity, showing that their procedures have downwardly biased their principal index over the course of the 1960-1980 period.2 Harry Magdoff has made a similar argument.3 The most important of these down- ward biases are the BLS use of money value, rather than phys- ical volume, as their measure of output, and the use of all em- ployees instead of just those engaged in actual production as the measure of worker-hours (see Table One). Most of the decline in the overall non-farm output per employee in the U.S. is due to the shift to service and white-collar work (where the possibility of productivity increases are less than in manufacturing), the tend- ency to retain white-collar workers while laying off production workers in times of economic downturn, and the increasing im- portance of the factors left out of calculations of the value of output, e.g., capital gains, capital consumption and inventory ad- justment allowances, and unreported profits.
Nevertheless, the decline in physical output pçr production worker, while much less than the proponents of the failure of worker incentive argument maintain, has been significant, and thus must be explained. Perlo's conclusion - that there has in fact been no problem with declining productivity; that the ap- parent decline is a result of statistical artifacts and trends outside of production; and that the rate of productivity increase has 2 Victor Perlo, "The False Claim of Declining Productivity and Its Political Use," Science
fc? Society (Summer, 1982). 3 Harry Magdoff, "A Statistical Fiction," The Nation (July 10-17, 1982).
PRODUCTIVITY AND STAGNATION 297
Table One Trends in the Rate of Increase in Productivity in the US, 1960-1980
(Increase Over Previous Year)
1950-59 1960-69 1970-79 1980
Nonfarm Business Value of output per
hour of all employees 2.5% 2.5% 1.7% .8% Manufacturing Only
Value of output per hour of persons en- gaged in production 2.4 2.9 2.6 1.7
Quantity of output per hour of production workers 4.3 3.9 3.3 2.8
Unemployment Rate (all civilian workers) 4.5 4.8 6.2 6.8
Sources: Economic Report of the President, 1983, Tables B-33 and B-41 for rows one and four. Victor Perlo, 1982, Table II for rows two and three.
merely been restored to its long-term average, after an excep- tional boom caused by historically specific factors associated with the aftermath of World War II - is not valid. Something funda- mental happened to the rate of productivity increase in the 1960s and the 1970s. And this must be explained.
The tendency for productivity in manufacturing to decline has been the general trend in the major advanced capitalist countries (see Table Two). In fact, the decline in output per em- ployee in manufacturing between the 1960s and the 1970s was more pronounced in almost all the other major industrial capi- talist countries than in the U.S. These declines, although exag- gerated in the way Perlo discusses, are real. Further, the general decline in manufacturing productivity is closely related to the general economic slowdown of the 1970s as indicated by the trends in the quantity measures of physical production as well as by the measures of gross national product measured in prices and the unemployment figures (see OECD, Main Economic Indi- cators: Historical Statistics 1960-1979, 1980).
298 SCIENCE & SOCIETY
Table Two Annual Rates of Growth in Value of Output Per Employee
in Manufacturing, 1960-1978
1960-1969 1970-1978
USA 3.2 2.8 France 7.6 6.1 West Germany 7.1 6.4 Italy 9.9 5.2 Japan 7.9 5.7 Netherlands 9.9 7.8 Sweden 9.3 3.8 United Kingdom 4.3 2.3
Source: U.S. Department of Labor, Handbook of Labor Statistics, 1981: Table 179.
The Lazy Worker and Productivity Those who emphasize the lack of worker incentive in the
U.S. usually focus on the importance of the "partial socialization of the wage" and the increased proportion of workers' living standards that are funded by the state. This "social wage" is said to be independent of performance on the job (and thus allegedly undermines work discipline and produces lower productivity, lower profits, lower investment and lower economic growth).4 The argument developed by Bowles, Gordon and Weisskopf, in fact, explicitly maintains that the primary cause of the productiv- ity decline has been the "cost of losing your job": as the gap be- tween one's standard of living while working and that obtainable without working has decreased over time, both the incentive to
4 See for example Samuel Bowles and Herbert Gintis, "The Crisis of Liberal Democrat- ic Capitalism: The Case of the United States," Politics and Society, Vol. 11, No. 1 (1982); Frances Piven and Richard Cloward, The New Class War (New York, 1982); Thomas Weisskopf, "Marxist Perspectives on Cyclical Crisis," in U.S. Capitalism in Cri- sis, published by the Union for Radical Political Economics (New York; 1978); "Marx- ian Crisis Theory and the Rate of Profit in the Postwar U.S. Economy," Cambndge Journal of Economics, 3 (1979), and "The Current Economic Crisis in Historical Per- spective," Socialist Review, Vol. 11, No. 3 (May-June, 1981); and Bowles, Gordon and Weisskopf, op. cit.
PRODUCTIVITY AND STAGNATION 299
Table Three Trends in Social Expenditures in the US, 1960-1979
I960 1970 1975 1979
As a percentage of total social welfare expenditures
Social Security and Medicare 21.1% 25.3% 27.0% 30.8%
Public assistance (includes food stamps) 7.8 11.3 14.2 15.1
Medicaid .9 3.6 4.7 5.5 Food stamps 0 .4 1.6 1.5 Education 33.7 34.9 27.9 25.3 Unemployment benefits 5.4 2.6 4.8 2.6
Social welfare expenditures as a percentage of Personal Income 13.0 18.0 22.9 22.0
Unemployment payments as % weekly wage 35.2 35.6 37.2 35.9
Source: U.S. Department of Commerce, Statistical Abstract of the U.S. for 1981, 1982: 320, 321, 340. Economic Report of the President, 1983: Table B-20
work and productivity have been seriously undermined.5 Total government funded social expenditures (all levels)
rose from 13.0% of personal income in 1960 to 22.9% in 1979, leveling off since the mid-1970s (see Table Three). The bulk of this expansion occurred in the 1966 to 1972 period (see sources for Table Three). The 75% increase in the ratio of social ex- penditures to personal income which occurred over the 15-year period is, of course, in line with what Bowles, et al., claim. How- ever, it is most unlikely that a social wage supplement of slightly over 20% (in contrast with about 13%) could make much differ- ence in work motivation. The great bulk of the working-class liv- 5 These authors actually argue that it was only in the 1966-1973 period (a time, they
maintain, which saw the genesis of the more serious economic crisis that was to fol- low) that the primary immediate cause of declining productivity was the declining cost of losing one's job (ch. 5). They argue that the post- 1973 problem was primarily one of overproduction caused by the reaction of the corporations and state to the earlier productivity slowdown (ch. 6).
300 SCIENCE & SOCIETY
ing standard in the U.S. continues to be from wages, and it is to what cash income can buy that the worker remains primarily ori- ented.
The most important component of the social wage in terms of effect on work motivation is the level of unemployment bene- fits. Its ratio to the regular wage indicates the bulk of the de- crease in one's income when one loses one's job. The least im- portant parts of the "social wage" for the employed are disability and retirement benefits, as well as the major public assistance and welfare programs, the level of which (at least for the bulk of the working class who are not near retirement age, suffering from chronic illness, or marginal participants in the labor force) is usually considered rather remote to their daily lives. The edu- cation subsidy, it should be noted, is allocated mostly to the mid- dle class (and skilled workers), whose children attend college and disproportionately benefit from other programs. Education ex- penditures could also be regarded as a subsidy to the corpora- tions, i.e., "socialization" of their training expenses.6 Further it should be noted that social security benefits are similarly dispro- portionately enjoyed by the middle class and skilled workers, not by the unemployment-prone, low-income workers. In fact as much as half of all social expenditures should probably be con- sidered supplements to middle class and semi-professional in- come.
In 1960 unemployment benefits in the U.S. averaged 35.2% of the weekly wage, in 1979, 35.9% (see Table Three). Although there was a slight increase in the early 1970s the average then slipped back to the level typical of the 1960s. There has not, in fact, been any decrease in the cash loss from losing one's job. The average monthly value of food stamps per recipient in 1962 was $7.66; in 1970 $10.58; in 1975, $21.42; and in 1980, $34.34. In January 1982 the rules of eligibility allowed a family of four with no income $233 in stamps. Families with income were eligi- ble for the difference between this amount and 30% of their to- tal income (less déductibles). A family with a sole breadwinner who had been earning the median wage in the U.S. in 1981 was eligible for $124 worth of food stamps (assuming only the standard deduction) when he went on unemployment. Thus,
6 See James O'Connor, The Fiscal Crisis of the State (New York, 1973).
PRODUCTIVITY AND STAGNATION 301
food stamps together with unemployment amounted to 45% of the average worker's income before loss of job (the value of food stamps amounted to about 9% of a worker's former income). There was no significant change in the importance of food stamps over the period of the 1970s. Food stamps plus unemployment benefits together averaged about 43-45% of workers' job earnings throughout this period. In the 1960s, of course, before the expansion of the food stamp program, the sum of food supplements and unemployment benefits was closer to the level of unemployment benefits. Given the relatively mea- ger non-cash supplements available to the unemployed in the U.S. (mostly food stamps and medicaid available to supplement unemployment payments), it can not realistically be argued that a significant decrease in the felt costs of unemployment occurred over the 1960-1980 period. There is no direct evi- dence that the increase in non-cash benefits over this time was large enough to affect workers' motivation.
It should also be remembered that unemployment benefits are not, and are not felt as, permanent supplements. One must actively seek and soon find another job - and the chances are that the new job will be less desirable and lower paying than the previous one (the length of time workers received unemploy- ment benefits averaged around 14 weeks over the 1960-1980 period). This factor must be considered together with a variety of non-economic motivations to keep one's job (friends, pride, ridicule about being fired, etc.).
In sum, it is simply not credible that workers with families would slacken their output to the point of risking being laid off, just because their cash plus food stamps income would be 45% of their wage for the short period when they were on unemployment. It would seem that the rather radical reduction in living standards incumbent on a lowering of one's income by half, plus the insecurity associated with looking for work, per- haps in a different town, would be sufficient motivation to work hard, even if this were the workers' only incentive to work.
The great bulk of the increase in social expenditures over the 1960-1979 period occurred in programs of marginal signifi- cance for the unemployed. Social Security and medicare were up 10.9 times, education 5.1 times, and public assistance (including medicaid and foodstamps) 14.8 times. Social Security and medi-
302 SCIENCE & SOCIETY
care together rose from 21.1% to 30.8% of total social expendi- tures, while public assistance grew from 5.4% to 15.1% of the to- tal. Meanwhile unemployment benefits grew by only 3 times, shrinking from 5.4% to 2.6% of all state social expenditures (even while the unemployment rate rose). Medicaid and similar med- ical programs available to the unemployed, as well as to long- term, low-income people (who undoubtedly utilize the bulk of this as well as foodstamp programs), increased from .9% to 5.5% of total social expenditures while foodstamps increased from zero to 1.5% (see Table Three).
About 2% of personal income in 1979 actually represented resources utilized by the unemployed to sustain themselves (unemployment benefits, medicaid, foodstamps), while the great bulk of social expenditures were allocated to the retired (dispro- portionately to the higher income groups), permanently disa- bled, long-term poor, and to education (which largely benefits the middle class). Those who receive the great proportion of state social expenditures are not workers in the labor force. And they especially are not lower-skilled, high unemployment-prone workers. It is deceptive to assume that state expenditures on so- cial programs actually available to those who lose their jobs rep- resent a comfortable enough alternative to working to signifi- cantly reduce the fear of losing one's job (and hence undermine work incentives).
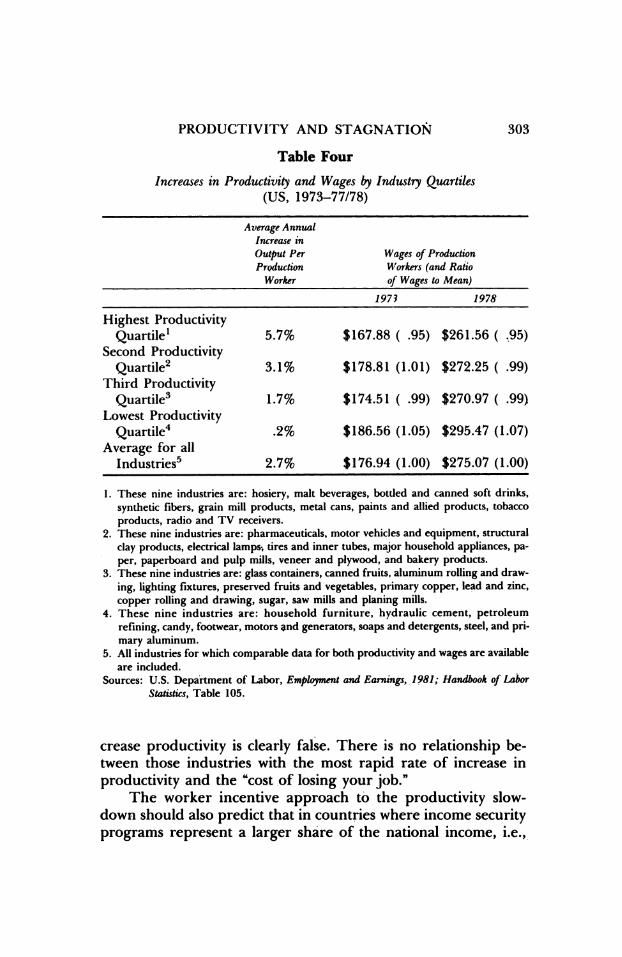
If the "cost of losing one's job" was the major determinant of the rate of increase in productivity, then it is to be expected that workers who had "the most to lose" would have the most rapid rates of increase in productivity, and workers with the least to lose would have the lowest rates of productivity increase. It would appear that workers in industries with the highest wages should have the highest rate of increase in productivity. Table Four displays data for 36 basic manufacturing industries, ranked by the rate of increase in value of output per hour of production workers in the 1973-1977/1978 period.
The quartile of manufacturing industries with the highest rate of increase in productivity over the 1973-1977/1978 period (5.7% per year) had somewhat lower wages in both 1973 and 1978 than the quartile with the lowest rate of growth in produc- tivity (10% and 12% lower, respectively). The prediction that the more a worker has to lose, the more rapidly will he or she in-
PRODUCTIVITY AND STAGNATION 303
Table Four Increases in Productivity and Wages by Industry Quartiles
(US, 1973-77/78)
Average Annual Increase in Output Per Wages of Production Production Workers (and Ratio
Worker of Wages to Mean)
197^ 1978
Highest Productivity Quartile1 5.7% $167.88 ( .95) $261.56 ( ,95)
Second Productivity Quartile2 3.1% $178.81 (1.01) $272.25 ( .99)
Third Productivity Quartile3 1.7% $174.51 ( .99) $270.97 ( .99)
Lowest Productivity Quartile4 .2% $186.56 (1.05) $295.47 (1.07)
Average for all Industries5 2.7% $176.94 (1.00) $275.07 (1.00)
1. These nine industries are: hosiery, malt beverages, bottled and canned soft drinks, synthetic fibers, grain mill products, metal cans, paints and allied products, tobacco
products, radio and TV receivers. 2. These nine industries are: pharmaceuticals, motor vehicles and equipment, structural
clay products, electrical lamps·, tires and inner tubes, major household appliances, pa- per, paperboard and pulp mills, veneer and plywood, and bakery products.
3. These nine industries are: glass containers, canned fruits, aluminum rolling and draw-
ing, lighting fixtures, preserved fruits and vegetables, primary copper, lead and zinc, copper rolling and drawing, sugar, saw mills and planing mills.
4. These nine industries are: household furniture, hydraulic cement, petroleum refining, candy, footwear, motors and generators, soaps and detergents, steel, and pri- mary aluminum.
5. All industries for which comparable data for both productivity and wages are available are included.
Sources: U.S. Department of Labor, Employment and Earnings, 1981; Handbook of Labor Statistics, Table 105.
crease productivity is clearly false. There is no relationship be- tween those industries with the most rapid rate of increase in productivity and the "cost of losing your job."
The worker incentive approach to the productivity slow- down should also predict that in countries where income security programs represent a larger share of the national income, i.e.,
304 SCIENCE & SOCIETY
00 t^ on
á »- «
!1 11 ► cl - s ► cl i.s -
1 H *~ H -S .S 3 S Si J
■S w
"S ο
&·δ ^ ^ 7 <μ(Μιο^·»λ ι> m ο ο *λ _ £ o" c I^^ggi - _
.S3 ·§ 13 g
Λ 2 c w Λ Λ Λ «Λ Sm
"2 ι S tub ΙΑ (Η ΙΑ (/) g <[) ι g g t>^i>w (Η
Ιδίιΐ ~ -s i'sfi a. ».fi ?| 21*J
Ils f s.l IIP 5 •δ δ 7 il coco^in > ^^h^^csi -«g ΛΛζΛ-ë S III ? "" - ----- |- á|rf| - ^ ·^ w
8 δ ο - & .
'Ρ iäfl 1 * * 8 S g I «
^•δ ο^£^? μ ^ odifi (j( i>^oiiOo6 S Λ "ο ο bo «s ^
·|| ί δ ^ ε .·§ |
ΐ S>- 'S ·| 5 1 Ι « s i á
ϊ!|ί "'"- " ^^ " ΪΪΙ3 ίϊίΙΙϊ ^ ίϊ|ϊ ilîil!
I S =? ? "S.-S 2 J S t-
.r ! .ijSHdlïiSl J Ö S £* fi O33O .»s g*i?.s
lilii t lil I ilii«
PRODUCTIVITY AND STAGNATION 305
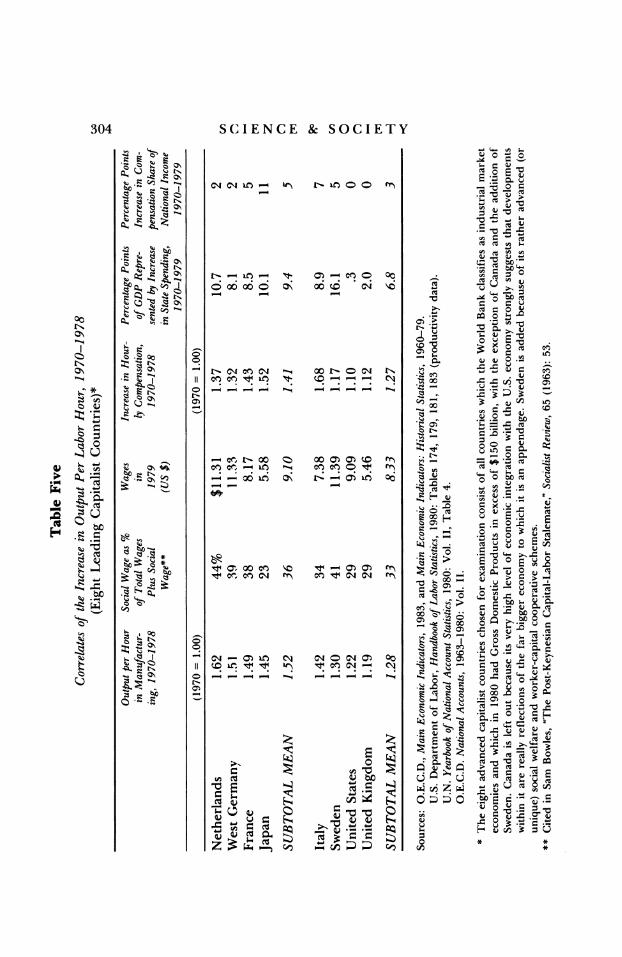
where wage labor is the most socialized, labor discipline should be most relaxed, and hence productivity most stagnant. In fact, comparisons among the advanced countries indicate that there is no such relation. Of the eight major advanced capitalist coun- tries, the four with the most rapid rates of increase in productiv- ity in the 1970-1978 period had a somewhat higher proportion of their workers' living standards funded through state pro- grams than did those with the least rapid rates of growth (36% versus 33%) (see Table Five). It should be noted that the ad- vanced capitalist countries with the slowest increases in produc- tivity, the U.S. and the U.K., had two of the lowest levels of state social expenditures of all advanced capitalist countries, while the country with the highest level of the social wage, the Netherlands (44%), had the most rapid rate of increase in pro- ductivity (62%). The correlation between the increase in output per worker over the 1970-1978 period and the ratio of all gov- ernment spending to GNP for the 17 major O.E.C.D. countries was +.29 in both 1970 and 1979.
It should also be noted that, contrary to what is often sug- gested by those who blame high wages for economic problems, a comparison of the advanced capitalist countries finds no rela- tionship of the kind predicted between productivity increase and either wages or increases in hourly compensation over the 1970-1978 period (see Table Five).
Table Five also demonstrates that, for the most part, those countries with the most rapidly increasing share of government spending in GDP had .the fastest rate of increase in productivity. The contrast between the Netherlands and Japan on the one hand, where government spending increased by over ten per- centage points of GDP over the 1970-1978 period, and the U.S. and the U.K. on the other, where it hardly grew at all, is ex- treme.
Bowles, Gordon and Weisskopf in fact recognize that the countries with the highest level of social welfare expenditures (and also, it should be noted, the highest degree of job security) have had the most rapid increases in productivity. They argue, however, that this is the case because U.S. capitalism, alone among the advanced capitalist countries, has been unable to hu- manize the work process so as to substitute the positive work in- centives used in Europe and Japan for the negative incentives
306 SCIENCE & SOCIETY
which are allegedly dominant in the U.S.7 While there are differences in U.S. and Western European
and Japanese management techniques, these are not qualitative as suggested by Bowles, et al And they certainly have not been the cause of the disparate productivity patterns in the U.S. and Europe and Japan. Workers in the basic unionized industries have generally had a high degree of job security and benefits as well as fairly progressive management that understands the role of positive work incentives. In these basic U.S. industries nega- tive incentives - the threat of being fired or docked in pay - have not been primary for some time.8
The worker incentive approach ignores the development of modern managerial theory on how to increase workers' output. In fact, few contemporary mainstream scholarly analyses of the U.S. productivity slowdown of the 1970s mention loosening of labor discipline or failure of work incentives due to either strong unions, substantial welfare benefits or increased job security as an important factor. A comprehensive survey of U.S. managers found that 55% disagreed that "the best way to increase output is by performance incentives," and 77% disagreed that "the average unskilled worker is interested in doing as little as possible." Only 10% of managers thought that more worker incentive programs would be "very important" in "improving productivity in their organizations," and only 25% thought that "harder work" by em- ployees would be "very useful."9
7 They argue as follows: "We do not believe that a decline in work intensity was the only possible outcome of the erosion of the post-war corporate system. Had the de- cline in the cost of job loss, for example, been accompanied by the emergence of forms of work place organization less reliant on the stick of economic insecurity and more effective in profernng the carrot of workplace commitment, no decline in work intensity need have occurred. Indeed, output per work hour might well have in- creased. Sweden and other Northern European countries have experienced rapid productivity growth with systems of labor coordination and allocation which rely very little on unemployment and other market-induced economic anxieties. The productivity- retarding effects of the decline in the cost of job loss thus do not reflect human nature, or even capitalism in general. Rather, the relationship between output per work hour and the cost of job loss is an aspect of the particular system of domina- tion which characterized the U.S. economy in the postwar era." {Op. cit., p. 435.)
8 See Michael Burawoy, Manufactunng Consent (Berkeley, 1979); Richard Edwards, Mi- chael Reich and David Gordon, Labor Market Segmentation (Lexington, Mass., 1975); Richard Edwards. Contested Terrain fNew York. 1979V
9 Raymond Katzell and Daniel Yankelovich, Work, Productivity and Job Satisfaction (New York, 1975).
PRODUCTIVITY AND STAGNATION 307
Research on U.S. managerial attitudes towards increasing productivity points to job enrichment, workers' participation, job satisfaction and job security as more promising ways to raise pro- ductivity, than increasing material incentives or decreasing job security. For example, one survey of managerial attitudes found that 87% of U.S. managers agreed that job satisfaction leads to greater productivity. About 82% also felt that management con- cern for the welfare of employees improves productivity. Seventy-five percent of managers agreed that job enrichment is a promising strategy for improving productivity.10
The incentive theorists attribute low productivity to the in- creased job security of workers (who are thus less afraid of being fired). If this is true we would expect that long-term trends in productivity should be positively associated with the unemploy- ment rate and negatively with the percentage of the labor force in unions. However, we find quite the opposite. Increases in productivity in the U.S. were greatest in the 1950s and 1960s, when unemployment was low. The decline in productivity over the 1970s was associated with a rise in unemployment. For ex- ample, during the 1960s, when the unemployment rate averaged 4.8%, the annual rate of growth of nonfarm productivity per employee was 2.5%. During the 1970s, when the unemployment rate averaged 6.2%, the productivity growth rate was 1.7%. In fact, since the mid-1960s, as the job security of workers has steadily declined as measured by the unemployment rate, the rate of increase in productivity has also just as steadily declined.
It should be noted that the U.S., along with the U.K., the two major capitalist countries with the slowest increase in pro- ductivity over most of the post World War II period, had a sig- nificantly higher rate of unemployment than almost all other ad- vanced capitalist countries. Over the 1960s, when nonfarm pro- ductivity per employee increased on average 2.5% a year, the proportion of the labor force in unions averaged 29%. By con- trast, in the 1970s, with productivity averaging an increase of 1.7% a year, the percentage of the nonagricultural labor force in unions averaged 25% (see Tables One and Eight). Moreover, the U.S. has one of the weakest union movements of any advanced capitalist country, as well as the fewest guaranteed rights to a
10 Ibid., pp. 114-115.
308 SCIENCE & SOCIETY
job. It is clear that security of job tenure can not be the primary factor operating to produce the decline in productivity.
Bowles, Gordon and Weisskopf attribute almost two-thirds (63%) of the productivity slowdown between 1948 and 1966 and 1966-1973 (when productivity declined from an average of 2.9% to an average of 2.2% a year) to the decline in intensity of work, while attributing 19% to business failures, 18% to rising costs of raw materials, and 16% to the trend in capacity utilization (and minus 15% to the trends in capital intensity). It should be noted that they do not claim that a decline in work intensity played a primary role in the far more significant productivity decline in 1948-1966 and 1973-1977 - here they attribute only 18% of the total productivity decline (of 2.0 percentage points) to the decline in work intensity. To quote them:
The "puzzle" of the productivity slowdown has been solved. . . . During the first phase of the crisis, from 1966 to 1973, the decline in the rate of productivity growth was due to the erosion of corporate power -
particularly the weakening of corporate control over the intensity of work. From 1973 to 1979, the further decline in productivity growth was the result both of the continuing erosion of the postwar corporate system and the counterproductive attempt to restore that system by means of the Great Repression.11
It would seem that the relatively minor decline in the rate of productivity increase from 2.9% to 2.2% a year would be un- likely to cause the kind of "Great Repression" and "cold bath" over the course of the 1970s they attribute to it. Indeed, they seem to greatly exaggerate the extent of "repression" as indica- ted by more restrictive monetary and fiscal policies, the leveling off of state social expenditures and an increased hostility to un- ions among employers. The 1970s hardly deserve the descrip- tion "repressive." Yet such an exaggerated characterization is crucial for their argument about the 1970s and 1980s.
The most important dynamic element in the authors' "work intensity" variable is "the cost of losing your job." It would seem that, rather than the highly tenuous micromodel of workers mo- tivated by the extent of concern about losses in living standards incident on being fired, a far more tenable explanation of the correlation between "the cost of losing your job" and productiv- 11 Bowles, et ai, op. cit., pp. 143ff. The quoted passage is on p. 148.
PRODUCTIVITY AND STAGNATION 309
ity growth is that both are affected by the level of stagnation. The most dynamic component of the "cost of losing your
job" variable is the average duration of unemployment. In fact the correlation between the "cost of losing your job" and the "du- ration of unemployment" was .95 over the 1948-1973 period and .88 over the 1948-1979 period. The correlations between the increase in nonfarm productivity and the duration of unemployment were .39 and .32 respectively.
The other component of the "cost of losing your job* is the ratio of the wage less unemployment benefits, to the wage plus social wage supplements. This variable, it should be noted, has a much smaller correlation with changes in productivity in the 1948-1973 period than does "the cost of losing your job," as well as a much smaller correlation with this latter variable. This indi- cates that rising social expenditure and the alleged decreasing incentive to work were not, as Bowles et al. claim, a primary cause of productivity decline. The correlation between this com- ponent and the "cost of losing your job" was .38 over the 1948-1973 period and .36 over the 1948-1973 period and .34 for the 1948-1979 period.
There were strong correlations between the annual in- creases in both real wages and business sales and the increase in nonfarm productivity. In the 1948-1973 period these were .45 and .62 respectively; and in the 1948-1979 period .64 and .65. The association between "the cost of losing your job" and the rate of productivity increase must be attributed to the relation between these two variables and economic stagnation (as indica- ted by the unemployment rate, capacity utilization or the dura- tion of unemployment), not to any micromodel of declining work incentives.
Faced with the many difficulties and contradictions in their argument, Bowles et al. go so far as to renounce the claim they initially made in chapters 4-6 about the cause of the productivity slowdown (and to which they attribute all other aspects of the economic "crisis.") When discussing the "cost of capitalism" to- wards the end of their book they argue that the problem is not one of low-productivity workers after all, i.e., it is not the lack of incentives that is the root cause of the productivity slowdown. They now argue: Our basic point is very simple: The problem in the U.S. economy to-
310 SCIENCE & SOCIETY
day is not low-productivity workers but low-productivity jobs. Low- productivity jobs exist (and proliferate) because low-wage workers are abundant and make low-productivity jobs profitable for employers. The solution is to shift workers from low-productivity to high- productivity jobs. 12
In fact throughout the last part of their book, Bowles et al. maintain that productivity is primarily a function of the failure of capital to modernize (and not a question of worker motiva- tion) (see ch. 12). They conclude with an argument calling for active state support of "high tech" (and high productivity) indus- tries without necessarily an increase in state spending. The last half of their book is essentially a radical version of the same posi- tion advocated by Felix Rohatyn and Robert Reich, the AFL- CIO, Timothy Wirth, et al. This position is taken up in the next section.
Atari Democrats and Productivity The factors which are most often mentioned in the manage-
rial and economic literature as affecting the rate of increase in productivity are: "quality of labor," especially its educational and skill level; the development and application of advanced technol- ogy; and the degree of utilization of machinery and equipment (capital intensity). For example, the U.S. Bureau of Labor's 1974 comparison of productivity growth among the advanced capital- ist countries concluded that "improvements in the quality of la- bor, increased availability of capital, and advances in technology constitute the basic sources of growth in output per unit of labor input."13 These are the factors to which the "Atari Democrats" and others who emphasize the need for an industrial policy at- tribute the decline in U.S. productivity in the 1970s (usually in the context of some degree of national planning and state financing of "high tech" industries, as well as of education, re- search and development).
Total non-military research and development expenditures in the U.S. increased slightly between the mid-1960s and late 1970s (it was 1.20% of GNP in 1961 and 1.54% in 1978). The ra- 12 Ibid., p. 279. ιό V.o. Department ot Labor, Productivity: An International Comparison (Washing-
ton, D.C., 1974).
PRODUCTIVITY AND STAGNATION 311
tio rose significantly in the three major capitalist competitors of the U.S. In Japan it rose from 1.37% in 1961 to 1.87% in 1977; in France from .97% in 1961 to 1.35% in 1978; and in West Germany from 1.14% in 1962 to 2.19% in 1978. In the U.K., however, it stayed more or less constant between the 1960s and 1970s.14 Thus, declining research and development expendi- tures could not have been the cause of the productivity slow- down of the 1970s.
The proportion of the U.S. GNP spent on education aver- aged 4.3% in the 1950s, increased from 5.6% in 1961 to 7.5% in 1969, and averaged 6.6% for a decade. Over the first two-thirds of the 1970s, however, it pretty much held constant at about 7.6% of GNP, declining to 7.0% in 1979.15 Moreover, in the ma- jor capitalist countries general skill and educational levels in- creased significantly, while in all except the U.K. educational ex- penditures also increased as a proportion of GNP.16 Thus, it is clear that deficiencies in increasing the educational and skill level of their populations could not have been the cause of the decline in productivity over the 1970s.
It does not appear that reduction in the ratio of investment to GNP (which in turn would result in less rapid rates of growth of the average efficiency of capital equipment) was the principal cause of the decline in the rate of growth in productivity be- tween the 1960s and 1970s. Over the 1960-1969 period in the U.S. the ratio of nonresidential fixed investment to GNP was 9.9%. Over the 1970-1979 period it was 10.5%. In Japan the rate of private domestic nonresidential fixed investment to GNP was 15.7% between 1960 and 1969, and 18.3% between 1970 and 1979. In West Germany the equivalent figures were 8.5% and 9.5%; and for the U.K. they were 8.8% and 9.5%.17
In summary, the factors emphasized by the advocates of in- dustrial policy have not, in fact, been the cause of the decline in productivity in the advanced capitalist countries. It is probably true, however, that to the extent some countries might out- perform others in plowing money into research and develop-
14 See U.S. National Science Foundation, Science Indicators, 1981: Appendix, Table 1.4. 15 Digest of Educational Statistics, 1982. 16 See O.E.C.D., National Accounts 1963-80, Vol. II, Annex I. 17 Economic Report of the President, 1983, Table B-2; O.E.C.D., Main Economic Indicators:
Historical Statistics, 1960-1979, 1980.
312 SCIENCE & SOCIETY
ment, in upgrading the skills of their labor force, in increasing investment in "high tech" industries, and in developing a coordinated industrial policy, they will have somewhat higher rates of increase in productivity relative to others. However, it can not be expected that the general (world level) of declining productivity could be reversed by such efforts (at least not if undertaken without a significant expansion of total state spend- ing)·
Effective Demand and Productivity
Contrary to both the incentive theorists and the Atari demo- crats, the principal cause of the decline in productivity has been the growing difficulty of realization, i.e., the secular stagnation of effective demand. As the rate of growth of demand declines and as capacity utilization shrinks and unemployment grows (be- cause the entire output can not be profitably sold), workers are not laid off as rapidly as output declines. Businesses tend to hold on to their workers in expectation of a business upturn, assign workers to less productive uses, and relax managerial pressure on production. Further, as real wages stagnate or decline be- cause of rising unemployment, capital loses its incentive to intro- duce labor-saving machinery in order to dispense with expensive labor-power. On the other hand, during periods of strong de- mand, "speed up" occurs, as well as pressure to assign workers to the most productive uses so as to fulfill the rush of orders. Moreover, as the reserve army of the unemployed is exhausted, real wages rise, and capital acquires a strong incentive to intro- duce labor-saving technology.
Both the periods of downturn and upturn have reinforcing feedback mechanisms. As businesses lay off workers in an at- tempt to produce the same output with a lower wage bill (i.e., at- tempt to increase productivity), they shrink total demand (by the amount of the wages of the laid-off workers). Smaller demand leads to lower sales and cutting back of output and thus to an unanticipated further decline in productivity. On an upswing in the economy the rehiring of workers, in anticipation of a future increase in demand and sales, can produce a symmetrical posi- tive feedback, actually increasing demand and hence increasing productivity.
Those who argue that the economic problems of the capital-
PRODUCTIVITY AND STAGNATION 313
ist world are at base due to the failure of productivity are wrong. Such theorists have the direction of causation backwards. In fact, the problem is fundamentally one of insufficient demand, an in- sufficiency of demand which causes (rather than is an effect of) a productivity slowdown. The problem then shifts from examining work incentives (as do supply-side conservatives like Thatcher and Reagan, as well as supply-side radicals like Bowles, Gordon and Weisskopf) or failure of state-supported research and devel- opment, education, capital spending and industrial policy (as do supply-side liberals), to the causes of the long-term slowdown in the rate of growth of effective demand.
While comparison of the trends in productivity over the 1973-1977/1978 period in the various industrial sectors of the U.S. shows a relation in the opposite direction from that predict- ed by the decreasing "cost of losing your job" position, it also shows a very strong positive relationship between the increase in productivity and the increase in output over the same period (a good indicator of the trend in effective demand over longer time periods) (see Table Four). The quartile of industries with the most rapidly increasing rate of increase in productivity had an average annual rate of increase in output of 3.2% over the 1973-1977/1978 period. Meanwhile, the quartile of industries with the slowest rate of increase in productivity had a negative (-.5%) rate of increase in output, i.e., they apparently faced a declining demand for their product (see Table Four). This is strong evidence that the primary determinant of productivity is the movement in effective demand.
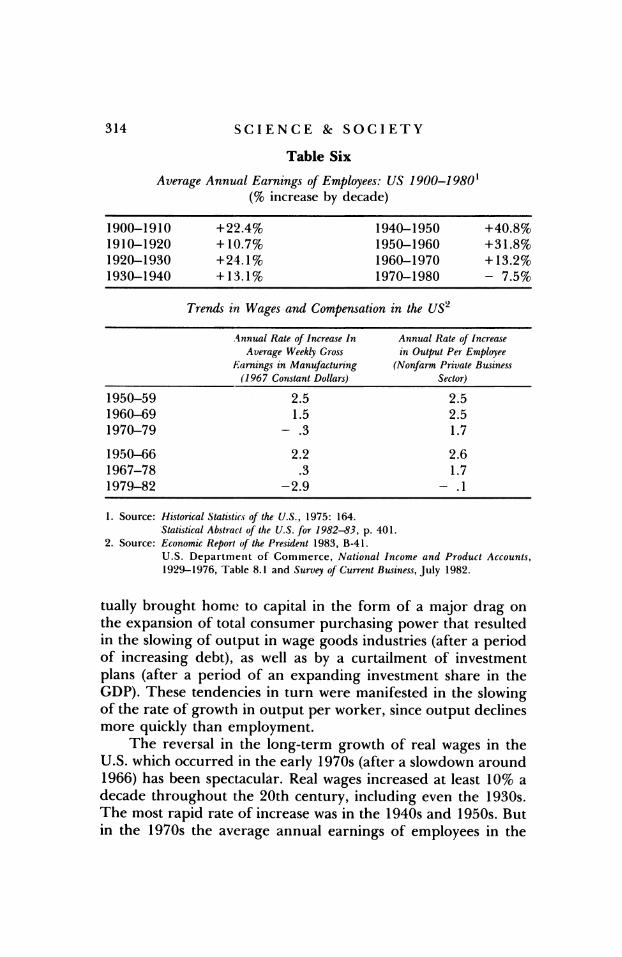
During the 1950-1966 period, when the average annual in- crease in overall productivity in the U.S. was 2.6% a year, real wages (weekly private gross earnings in manufacturing) grew by an average of 2.2% a year (see Table Six). In the 1967-1978 pe- riod, when nonfarm private productivity increased by only 1.7% a year, real wages increased at an annual rate of only .3%. Fur- ther, the decline in real wages led the decline in productivity. Real wages peaked in 1972 at $198 a week (in 1967 dollars), declining to $170 by 1981, while the rate of overall productivity increase collapsed in 1977-1978 (although it slowed before this time). This is strong evidence that the decline in working-class purchasing power, by significantly constraining the growth of ef- fective demand, negatively affected productivity. This was even-
314 SCIENCE & SOCIETY
Table Six
Average Annual Earnings of Employees: US 1 900-1 9801 (% increase by decade)
1900-1910 +22.4% 1940-1950 +40.8% 1910-1920 +10.7% 1950-1960 +31.8% 1920-1930 +24.1% 1960-1970 +13.2% 1930-1940 +13.1% 1970-1980 - 7.5%
Trends in Wages and Compensation in the US2
Annual Rate of Increase In Annual Rate of Increase Average Weekly Gross in Output Per Employee
Earnings in Manufacturing (Nonfarm Private Business (1967 Constant Dollars) Sector)
1950-59 2.5 2.5 1960-69 1.5 2.5 1970-79 - .3 1.7 1950-66 2.2 2.6 1967-78 .3 1.7 1979-82 -2.9 - .1
1. Source: Historical Statistics of the U.S., 1975: 164. Statistical Abstract of the U.S. for 1982-83, p. 401.
2. Source: Economic Report of the President 1983, B-41. U.S. Department of Commerce, National Income and Product Accounts, 1929-1976, Table 8.1 and Survey of Current Business, July 1982.
tually brought home to capital in the form of a major drag on the expansion of total consumer purchasing power that resulted in the slowing of output in wage goods industries (after a period of increasing debt), as well as by a curtailment of investment plans (after a period of an expanding investment share in the GDP). These tendencies in turn were manifested in the slowing of the rate of growth in output per worker, since output declines more quickly than employment.
The reversal in the long-term growth of real wages in the U.S. which occurred in the early 1970s (after a slowdown around 1966) has been spectacular. Real wages increased at least 10% a decade throughout the 20th century, including even the 1930s. The most rapid rate of increase was in the 1940s and 1950s. But in the 1970s the average annual earnings of employees in the
PRODUCTIVITY AND STAGNATION 315
U.S. actually decreased by 7.5%. This radical reversal of the long-term trend could hardly help having a major impact on the rate of growth in output per worker. The more business has tried to improve its position by laying off workers, increasing output per worker or reducing wages, the more it has collective- ly aggravated the problem of effective demand, thereby aggra- vating the "productivity problem" as well as putting further pres- sure on wages to decline.
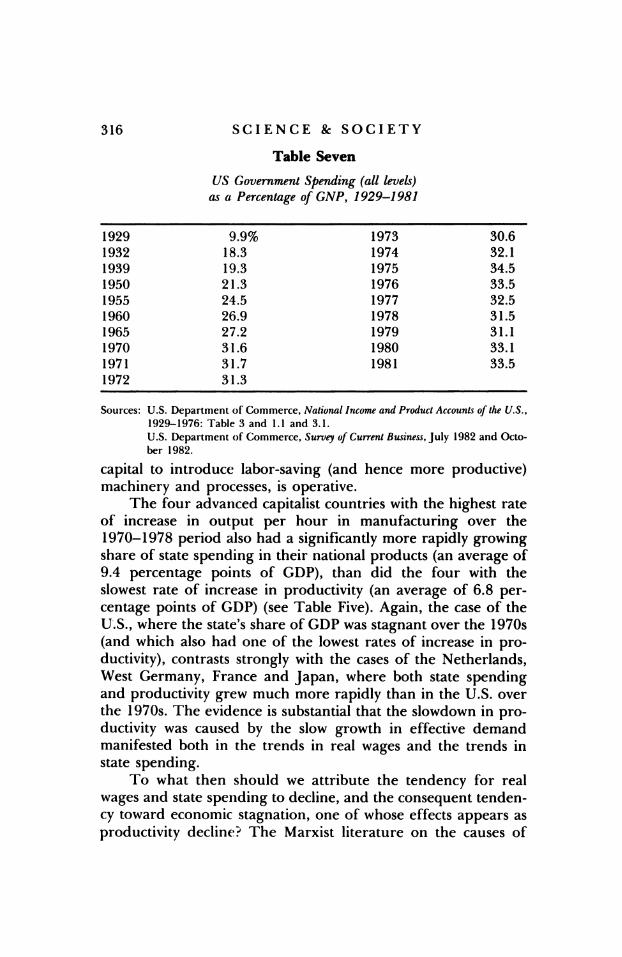
Along with the growth in aggregate real wages, the most im- portant factor in producing growth in long-run demand within modern advanced capitalist economies has been the growth of state expenditures. From the turn of the century through 1975 the share of state spending in the U.S. economy increased, and along with it effective demand for the expanding output of pri- vate capital. In the 1960s state spending grew from 26.9% to 30.4% of the GNP; it peaked at 34.5% in 1975, declining to 31.1% in 1979. The turnaround in the long-term tendency for the state to increase its share of total spending occurred in 1975, two to three years before the precipitous decline in the overall growth rate of productivity. Again it would appear that the slackening of effective demand, because of the cutbacks in gov- ernment spending, could well have been manifested in industry lowering its output to correspond to its declining sales, thus producing a declining rate of growth in productivity (for the reasons outlined at the beginning of this section).
The comparative evidence from eight leading capitalist countries on the association of the rates of productivity growth and the measures of trends in effective demand generally lends support to the above conclusion. The four advanced capitalist countries with the most rapid rates of increase in productivity in the 1970-1978 period averaged an increase in real hourly com- pensation of 41% over the same period. In contrast, the four countries with the slowest rate of growth in productivity in the 1970-1978 period averaged a 27% rate of growth in real wages (see Table Five). It should be noted that the U.S., one of the two countries with the slowest rate of growth in productivity, had the slowest rate of growth in real compensation in the period (10%). It appears that the double positive effect of rapidly rising real wages on productivity, operating both through expanding de- mand (and hence sales) and in providing a strong incentive for
316 SCIENCE & SOCIETY
Table Seven US Government Spending (all leveh) as a Percentage of GNP, 1929-1981
1929 9.9% 1973 30.6 1932 18.3 1974 32.1 1939 19.3 1975 34.5 1950 21.3 1976 33.5 1955 24.5 1977 32.5 1960 26.9 1978 31.5 1965 27.2 1979 31.1 1970 31.6 1980 33.1 1971 31.7 1981 33.5 1972 31.3
Sources: U.S. Department of Commerce, National Income and Product Accounts of the U.S., 1929-1976: Table 3 and 1.1 and 3.1. U.S. Department of Commerce, Survey of Current Business, July 1982 and Octo- ber 1982.
capital to introduce labor-saving (and hence more productive) machinery and processes, is operative.
The four advanced capitalist countries with the highest rate of increase in output per hour in manufacturing over the 1970-1978 period also had a significantly more rapidly growing share of state spending in their national products (an average of 9.4 percentage points of GDP), than did the four with the slowest rate of increase in productivity (an average of 6.8 per- centage points of GDP) (see Table Five). Again, the case of the U.S., where the state's share of GDP was stagnant over the 1970s (and which also had one of the lowest rates of increase in pro- ductivity), contrasts strongly with the cases of the Netherlands, West Germany, France and Japan, where both state spending and productivity grew much more rapidly than in the U.S. over the 1970s. The evidence is substantial that the slowdown in pro- ductivity was caused by the slow growth in effective demand manifested both in the trends in real wages and the trends in state spending.
To what then should we attribute the tendency for real wages and state spending to decline, and the consequent tenden- cy toward economic stagnation, one of whose effects appears as productivity decline? The Marxist literature on the causes of
PRODUCTIVITY AND STAGNATION 317
Table Eight The Increase in Monopoly Power and Its Correlates in the U.S.
1960 1970 1980
The Fortune top 100 industrials as a percentage of GDP of non- financial corporate business 48.2 51.3 72.5
Percentage in unions (nonagricultural labor force) 31.4 27.3 24.8 l
Rate of unemployment (five year moving average) 6.0 4.7 7.2 1 1977. Sources: U.S. Department of Commerce, 1977 Census of Manufactures , Vol. 1, Subject Statistics,
Table 4. U.S. Department of Commerce, Statistical Abstract of the U.S., for 1981, p. 544, 553; 1974, p. 485; 1982-1983, p. 376. U.S. Department of Labor, Handbook of Labor Statistics, 1980, Table 1 and Table 165. U.S. Department of Commerce, National Income and Product Accounts 1929-1976, Table 1-13. Economic Report of the President, 1983, Table B-45.
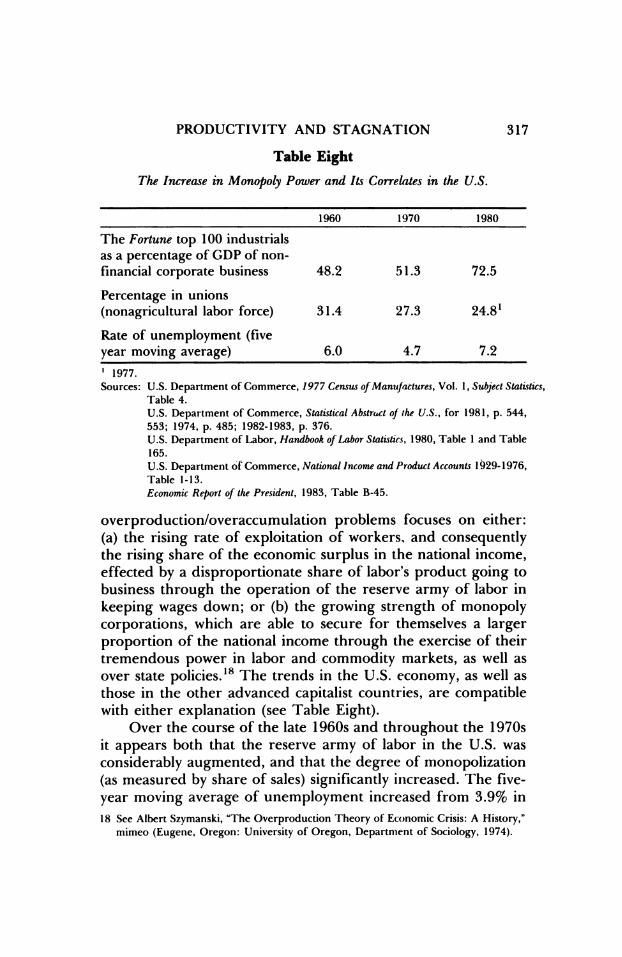
overproduction/overaccumulation problems focuses on either: (a) the rising rate of exploitation of workers, and consequently the rising share of the economic surplus in the national income, effected by a disproportionate share of labor's product going to business through the operation of the reserve army of labor in keeping wages down; or (b) the growing strength of monopoly corporations, which are able to secure for themselves a larger proportion of the national income through the exercise of their tremendous power in labor and commodity markets, as well as over state policies.18 The trends in the U.S. economy, as well as those in the other advanced capitalist countries, are compatible with either explanation (see Table Eight).
Over the course of the late 1960s and throughout the 1970s it appears both that the reserve army of labor in the U.S. was considerably augmented, and that the degree of monopolization (as measured by share of sales) significantly increased. The five- year moving average of unemployment increased from 3.9% in 18 See Albert Szymanski, "The Overproduction Theory of Economic Crisis: A History,"
mimeo (Eugene, Oregon: University of Oregon, Department of Sociology, 1974).
318 SCIENCE & SOCIETY
1967 to 7.2% in 1980, while the ratio of the sales of the top 100 Fortune industrials to the GDP of nonfinancial corporate busi- ness increased even more dramatically (see Table Eight). Which- ever tendency might have been primary in inducing stagnation, it seems its immediate effect has been to increase the share of the national income accruing to capital at the expense of labor.
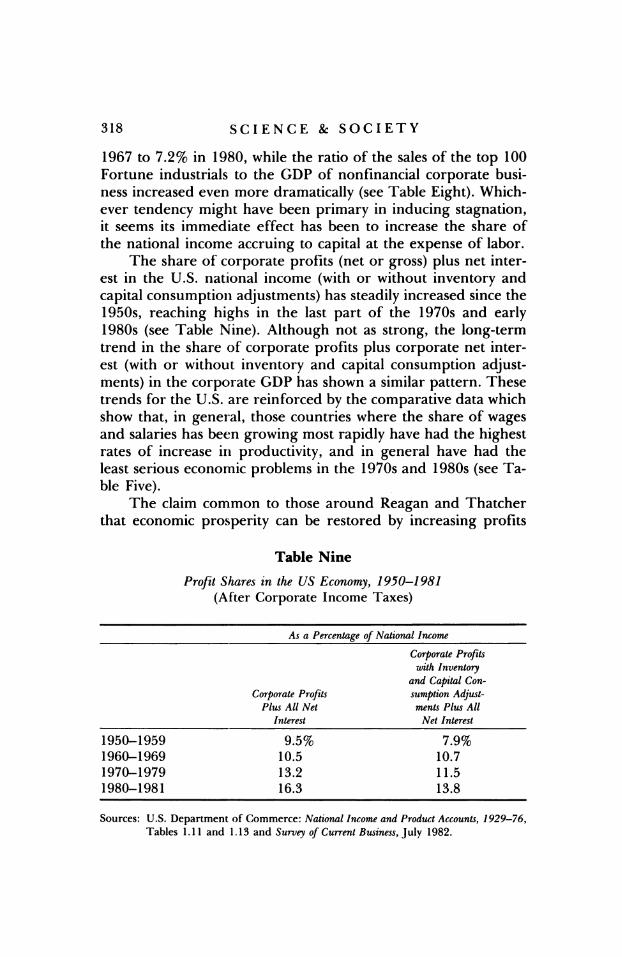
The share of corporate profits (net or gross) plus net inter- est in the U.S. national income (with or without inventory and capital consumption adjustments) has steadily increased since the 1950s, reaching highs in the last part of the 1970s and early 1980s (see Table Nine). Although not as strong, the long-term trend in the share of corporate profits plus corporate net inter- est (with or without inventory and capital consumption adjust- ments) in the corporate GDP has shown a similar pattern. These trends for the U.S. are reinforced by the comparative data which show that, in general, those countries where the share of wages and salaries has been growing most rapidly have had the highest rates of increase in productivity, and in general have had the least serious economic problems in the 1970s and 1980s (see Ta- ble Five).
The claim common to those around Reagan and Thatcher that economic prosperity can be restored by increasing profits
Table Nine
Profit Shares in the US Economy, 1950-1981 (After Corporate Income Taxes)
As a Percentage of National Income
Corporate Profits with Inventory
and Capital Con- Corporate Profits sumption Adjust-
Plus All Net ments Plus All Interest Net Interest
1950-1959 9.5% 7.9% 1960-1969 10.5 10.7 1970-1979 13.2 11.5 1980-1981 16.3 13.8
Sources: U.S. Department of Commerce: National Income and Product Accounts, 1929-76, Tables 1.11 and 1.13 and Survey of Current Business, July 1982.
PRODUCTIVITY AND STAGNATION 319
through getting more work out of the working class for less wages (through increasing the costs of being fired, decreasing job security, and a general cut-back in the state's role in the economy) is faulty. Likewise, the liberal corporatist and social- democratic solutions of austerity with job security, workers' par- ticipation, and corporate-union-government coordinated nation- al planning are not viable.19 Moreover, the proposals of those who hope to restore economic prosperity through increased R&D spending, heavy subsidies to education and job retraining programs, and state supported investment in high technology in- dustries (probably with a high level of state-labor-corporation coordination) are not likely to succeed.
The hope that the U.S. can be pulled out of its economic re- cession by stressing the development of high-tech export- oriented industries will only be frustrated by parallel develop- ments in the other advanced capitalist economies. There is room for only so many Japans in a world choking for lack of purchasing power. The effort to permanently enhance demand through improving the balance of merchandise trade by ex- porting high technology products can be expected to be neutral- ized by: (1) the similar efforts of the other advanced capitalist countries (which will either flood U.S. markets or be kept out through restrictive trade policies whose counterparts in the oth- er advanced capitalist countries will frustrate U.S. export ef- forts); and (2) the lack of purchasing power in the less devel- oped capitalist countries, whose export markets can be expected to continue to be depressed by the stagnation of effective de- mand in the advanced countries and by the necessity to repay their debt to the transnational banks.
Since the decline in productivity over the decade of the 1970s was, in good measure, an effect of the failure of effective 19 Samuel Bowles, "The Post- Key nesian Capital-Labor Stalemate," Socialist Review 65
(September-October, 1982), for example, making a case for a social-democratic (or Eurocommunist) solution, argues: "With the accumulation process now constrained primarily by conditions of exploitation, immediate material interests of particular groups of workers are now often in conflict, and consumption restraint (not the more rapid expansion of working-class consumption) appears to be a necessary part of any growth strategy. The kinds of organization and the forms of ideological intervention required under these new conditions to secure the unity of workers, their coalition with nonworkers, and the compatibility of their immediate interests with the expan- sion of material output, have challenged the existing political capacities of the labor movement and its associated political parties. Despite considerable attention to these
320 SCIENCE & SOCIETY
demand, attempts to increase productivity without increasing ef- fective demand, while they might possibly be successful in slight- ly increasing the value of output per employed worker, are not likely to produce economic prosperity. In fact, the more success- ful such measures of increasing output per worker are, the more the fundamental economic problem is likely to be aggravated. Greater output per worker almost certainly means a greater mass of goods seeking buyers without a comparable increase in workers' purchasing power. Thus, increasing productivity - by increasing worker participation, job enrichment, or job security, by increasing research and development, or by expanding subsi- dized education - is very likely to aggravate rather than alleviate the crisis of effective demand, just as would measures which in- crease output by increasing the "cost of losing your job" and de- creasing job security.
Attempts to increase productivity by subsidizing private in- vestment and developing high technology industries, however, could be expected to have a positive effect on alleviating eco- nomic stagnation in the advanced capitalist countries to the ex- tent that state funding of high technology investment involves a significant increase in total capital spending, and hence provides a net economic stimulus. Increased investment both increases employment (and hence workers' purchasing power) in high technology industries, and increases demand for the products of capital goods industries.
However, the more effective such investment is in increasing productivity (and it would not be carried out in a mas- sive and protracted manner unless it were effective), the more goods will be seeking buyers and hence the more serious the fu- ture gap between supply and effective demand, and thus the greater the problem for the capitalist state to overcome. It would appear that eventually the Kaleckian failure of business confi- dence would again become operative to limit ever-expanding state expenditures.20
issues in the Communist Party of Italy and in other left organizations, politically via- ble mechanisms for organizing a rational structure of consumption among workers and nonworkers (including the difficult choices posed by the reality of the 'less now, more later' tradeoff) have proved difficult to create, or even to propose" (p. 82).
20 See Michael Kalecki, Selected Essays in the Dynamics of the Capitalist Economy (Cambridge, 1971).
PRODUCTIVITY AND STAGNATION 321
Conclusion
Concentrating on productivity as a cause of economic stag- nation is misdirected. Either the capitalist state must take meas- ures to significantly increase effective demand (which in addition to restoring prosperity, would increase the rate of increase in productivity), or a new organization of the economy and/or po- litical process must supersede the existing one. And there would undoubtedly be increasing difficulties in a capitalist state which continues to expand its share of the national product, not the least of which is the growing (perceived and perhaps eventually real) threat to the system of private property in a society in which the state both controls most of the national product and also maintains democratic forms.
If the capitalist state resumes the post-World War II com- mitment to maintain prosperity (which centered on expanding state spending and facilitating fairly rapid increases in real wages), then the resultant encouragement of expanded output and continually increasing productivity would require an ever higher percentage of the GNP to be spent by the state. Contin- ued expansion of state spending is likely to result in an eventual popular challenge to the basic principles of private capitalism.21 Such a condition may have already been reached in the social- democratic countries of Northern Europe, where over half of the GDP is now being spent by the state. Indeed it appears that the potential of social-democracy may well have been exhausted in Scandinavia and the Low Countries. The social-democratic option may, however, possibly still be exercised in such still low- state-spending countries as the U.S. and Japan - although not without great political struggle in the U.S.
The rising proportion of the national product that passes through the state (the condition of maintaining prosperity) means that an ever larger proportion of all spending becomes potentially subject to democratic intervention by the electorate, and hence increasingly threatens the profit principle. If effective anti-tax movements and the power of big business continue to block the ever increasing state spending needed to maintain prosperity, stagnation will become a permanent part of ad- vanced capitalist economies, at least until either the establishment
21 Ibid.
322 SCIENCE & SOCIETY
of an authoritarian (in the U.S. perhaps social-democratic) state or socialist revolution intervenes. In general the compatibility of parliamentary forms and monopoly capital can be expected to become ever more tenuous.
It is increasingly likely that maintenance of monopoly capi- talism will require the transcendence of formal democracy in fa- vor of the authoritarian state forms now typical of the less devel- oped capitalist societies (and most of Central and Southern Europe before World War II). Such regimes would institute con- servative pro-business state planning, in which the banks and corporations are closely integrated, thus guaranteeing that the spending necessary to restore profitability would be actively sup- ported by business (as in Nazi Germany after 1933). To quote Kalecki:
The dislike of Government spending policy as such is overcome under fascism by the fact that the State machinery is under the direct control of a partnership of big business with fascist upstarts. The necessity for the myth of "sound finance" which served to prevent the Government from offsetting a confidence crisis by spending, is removed.
The dislike of Government spending, whether on public invest- ment or consumption, is overcome by concentrating Government ex- penditure on armaments. Finally, "discipline in the factories" and "po- litical stability" under full employment are maintained by the "new or- der," which ranges from the suppression of the trade unions to the concentration camps. Political pressure replaces the economic pressure of unemployment.
One of the important functions of fascism, as typified by the Nazi system, was to remove the capitalist objections to full employment.22
The real alternative to such a business-based authoritarian and interventionist state would be a new economic structure which would guarantee through democratic planning that all output finds uses in either expanding production or consump- tion. If capitalism can not (humanly) organize the distribution of the tremendous wealth its physical plant can produce, then so- cialism will arise out of its contradictions.
Department of Sociology University of Oregon
22 Ibid., p. 141.