group abridged annual results
TRANSCRIPT

Telkom SA SOC Limited
Group Abridged Annual Resultsfor the year ended31 March 2021
Telkom SA SOC Ltd(Incorporated in the Republic of South Africa)Registration number 1991/005476/30JSE share code: TKG
JSE bond code: BITELISIN: ZAE000044897(Telkom, the Company or the Group)
Telkom SA SOC Ltd is listed on the JSE Ltd. Information may be accessed on Reuters under the symbol TKGJ.J and on Bloomberg under the symbol TKG.SJ. Information contained on Reuters and Bloomberg is provided by a third party and is not incorporated by reference herein. Telkom has not approved or verified such information and does not accept any liability for the accuracy of such information.
Special note regarding forward-looking statements
Many statements in this document, and verbal statements that may be made by Telkom or by officers, directors or employees acting on Telkom’s behalf, constitute or are based on forward-looking statements.
All statements, other than statements of historical facts, including, among others, statements regarding our strategy; future financial position and plans; objectives; capital expenditure; projected costs and anticipated cost savings and financing plans; as well as projected levels of growth in the communications market, are forward-looking statements. Forward-looking statements can generally be identified by terminology such as “may”, “will”, “should”, “expect”, “envisage”, “intend”, “plan”, “project”, “estimate”, “anticipate”, “believe”, “hope”, “can”, “is designed to” or similar phrases. However, the absence of such words does not necessarily mean a statement is not forward looking. Forward-looking statements involve several known and unknown risks, uncertainties and other factors that could cause our actual results and outcomes to be materially different from historical results or from any future results expressed or implied by such forward-looking statements. Factors that could cause our actual results or outcomes to differ materially from our expectations include, but are not limited to, those risks identified in Telkom’s most recent integrated report which is available at www.telkom.co.za/ir.
Telkom cautions readers not to place undue reliance on these forward-looking statements. All written and verbal forward-looking statements attributable to Telkom, or persons acting on Telkom’s behalf, are qualified in their entirety by these cautionary statements. Moreover, unless we are required by law to update these statements, we will not necessarily update any of these statements after the date of this document, so that they conform either to the actual results or to changes in our expectations.
Any forward-looking financial information disclosed in these Group annual results for the year ended 31 March 2021 (“results announcement”) has not been reviewed or audited or otherwise reported on by our external joint auditors.
Pro forma information
Certain financial information presented in this results announcement constitutes pro forma financial information in terms of the JSE Listings Requirements. This is presented for illustrative purposes only and may not fairly present Telkom's results of operations.
The pro forma financial information contained in this results announcement was reported on by the Group’s joint independent external auditors. Their unmodified limited assurance report was prepared in terms of ISAE 3420 and is available on www.telkom.co.za/ir.
All financial information presented in the results announcement was prepared excluding the impact of voluntary severance package (VSP), voluntary early retirement package (VERP) costs and S189 costs in the current year and VSP and VERP costs in the comparative year and the related tax impact on results (the “pro forma adjustments”). This constitutes pro forma financial information to the extent that it is not extracted from the segment disclosure included in the audited consolidated abridged financial statements for the year ended 31 March 2021. This pro forma financial information was presented to eliminate the impact of the pro forma adjustments from the audited consolidated abridged financial statements for the years ended 31 March 2020 and 2021 to achieve a comparable year-on-year analysis and show the underlying performance of the business. The pro forma adjustments were determined in terms of the Group accounting policies disclosed in the audited consolidated abridged financial statements for the year ended 31 March 2021. The pro forma financial information for the year ended 31 March 2020 has been restated and presented on a consistent basis with the pro forma financial information for the year ended 31 March 2021.
The joint independent external auditors’ audit report by PricewaterhouseCoopers Inc. and SizweNtsalubaGobodo Grant Thornton Inc. does not report on all the information contained in this results announcement. Shareholders are therefore advised that to obtain a full understanding of the nature of the joint independent external auditors' engagement they should obtain a copy of the joint independent auditors’ audit report together with the accompanying financial information from Telkom’s registered office.
The board of directors takes full responsibility for the preparation of this results announcement (including the pro forma financial information) that has been correctly extracted from the underlying audited financial statements. The information contained in this document is also available on Telkom’s investor relations website www.telkom.co.za/ir.
1 Overview of our business
Index
6
2 Operational data
27
3 Financial performance
30
4 Audited consolidated abridged financial statements
40
www.telkom.co.za
The United Nations Sustainable Development Goals To formalise Telkom’s commitment to the Sustainable Development Goals (SDGs), we conducted an internal survey and a formal workshop in March 2019. The aim was to identify, evaluate and prioritise SDGs which Telkom can materially impact. The SDGs were approved by the Group executive committee and noted by the social and ethics committee. The four priority SDGs align with Telkom’s business approach to sustainability issues and opportunity realisation.
The following four SDGs, with selected SDG targets, were identified as presenting the most material opportunities for Telkom to enhance its positive impact and minimise its negative impact:
Throughout this report, the relevant SDG icon indicates where related information is discussed. More detail is set out in the SDG appendix in the FY2021 integrated report.
Quality education Decent work and economic growth
Industry, innovation and infrastructure
Responsible consumption and production
SDG 4
SDG 8
SDG 9
SDG 12
1Telkom Group Abridged Annual Results 2021
FY2021 FY2020
11.7%
FY2021 FY2020
RevenueR million
Fixed servicerevenueR million
InformationtechnologyrevenueR million
7 7
55
8 4
48
FY2021 FY2020
EBITDA1, 2
R millionCapital expenditureR million
Free cash flowR million
FY2021 FY2020
27
9.0
FY2021 FY2020
4 72
6
5 0
02
FY2021 FY2020
Cash at the end of the yearR million
Net debt to EBITDA X times
FY2021 FY2020 FY2021 FY2020 FY2021 FY2020
Mobile service revenueR million
FY2021 FY2020
15 1
16
18 1
24
BEPS1, 2
Cents per shareHEPS1, 2
Cents per share
12.7%
16.6%
10
72
0
11
97
3
15.8%
5.8% 89.6%
52
9.1
0.4%
43 0
43
43 2
22
34.5%
12 5
93
16 9
38
5 98
6
6 85
58.9%
2 0
63
FY2021 FY2020
36
6.0
53.4%
56
1.5
0.9 1
.31
78
2
0.4
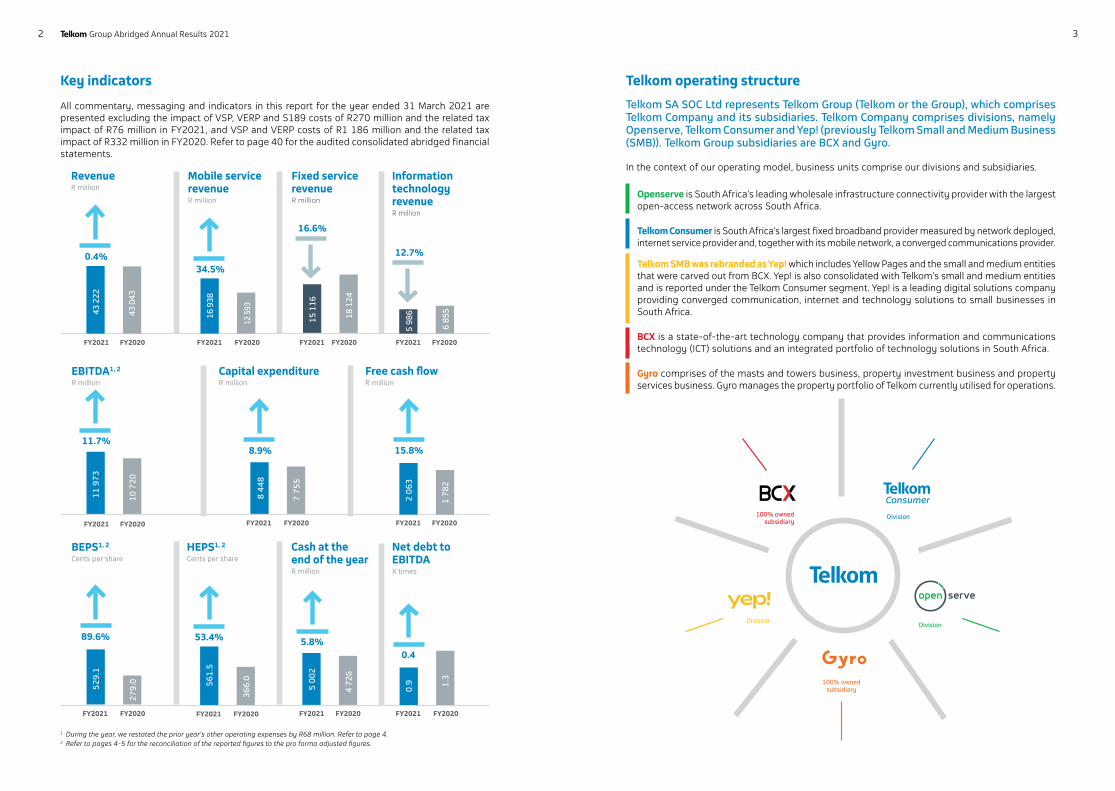
Telkom SA SOC Ltd represents Telkom Group (Telkom or the Group), which comprises Telkom Company and its subsidiaries. Telkom Company comprises divisions, namely Openserve, Telkom Consumer and Yep! (previously Telkom Small and Medium Business (SMB)). Telkom Group subsidiaries are BCX and Gyro.
In the context of our operating model, business units comprise our divisions and subsidiaries.
Telkom operating structure
Division
Division
100% owned subsidiary
Division
100% owned subsidiary
Key indicators
All commentary, messaging and indicators in this report for the year ended 31 March 2021 are presented excluding the impact of VSP, VERP and S189 costs of R270 million and the related tax impact of R76 million in FY2021, and VSP and VERP costs of R1 186 million and the related tax impact of R332 million in FY2020. Refer to page 40 for the audited consolidated abridged financial statements.
1 During the year, we restated the prior year’s other operating expenses by R68 million. Refer to page 4.2 Refer to pages 4-5 for the reconciliation of the reported figures to the pro forma adjusted figures.
Openserve is South Africa’s leading wholesale infrastructure connectivity provider with the largest open-access network across South Africa.
Telkom Consumer is South Africa’s largest fixed broadband provider measured by network deployed, internet service provider and, together with its mobile network, a converged communications provider.
Telkom SMB was rebranded as Yep! which includes Yellow Pages and the small and medium entities that were carved out from BCX. Yep! is also consolidated with Telkom’s small and medium entities and is reported under the Telkom Consumer segment. Yep! is a leading digital solutions company providing converged communication, internet and technology solutions to small businesses in South Africa.
BCX is a state-of-the-art technology company that provides information and communications technology (ICT) solutions and an integrated portfolio of technology solutions in South Africa.
Gyro comprises of the masts and towers business, property investment business and property services business. Gyro manages the property portfolio of Telkom currently utilised for operations.
32 Telkom Group Abridged Annual Results 2021
March 2020 The pro forma adjustments for FY2020 include the impact of the VSP, VERP and S189 costs of R1 186 million and related tax impact of R332 million.
In the published results for the year ended 31 March 2020, pro forma financial information excluded the impact of VSP and VERP costs as well as an additional impairment provision of receivables of R626 million relating to COVID-19. The pro forma results were also presented on IAS 17 basis to achieve comparison with prior year. The pro forma financial information for the year ended 31 March 2020 has been restated to include the additional impairment of receivables provision of R626 million recognised in the prior year as the COVID-19 impact has become a norm. In addition the financial information is reported on an IFRS 16 pro forma basis.
Segment reporting
Segment reporting is provided on page 58 as part of the notes to the financial statements.
Results from operations
Group profit after tax increased 88.1%** to R2 622** million (FY2020: R1 394** million). This is mainly attributable to higher earnings before interest, taxation, depreciation and amortisation (EBITDA) due to resilient Group revenue as well as our continued efforts in containing costs. Our total expenses declined by 3.5% mainly driven by lower cost of handset, equipment and directories expenses and employee expenses, as we realise benefits from our restructuring programme. This was partially offset by an increase in the tax expense, mainly as a result of higher taxable income. Headline earnings per share (HEPS) increased 53.4%** to 561.5** cents per share.
The pro forma financial information for the year ended 31 March 2020 has been restated and presented on a consistent basis with the pro forma financial information for the year ended 31 March 2020.
** Refer to pages 4-5 for the reconciliation of the reported figures to the pro forma adjusted figures.
Restatements and adjustments
Restatements
In FY2021, BCX identified that certain costs of third party service expenses incurred on a customer contract had been incorrectly accounted for over the term of the customer contract since 2018.
The restatement impacted the Group income statement and resulted in other operating expenses being understated for the year ended 31 March 2020.
The 31 March 2020 comparative financial information was restated.
Pro forma financial information
Certain financial information presented in this results announcement constitutes pro forma financial information in terms of the JSE Listings Requirements. The pro forma financial information is presented to assist the reader to analyse the underlying performance of Telkom.
The pro forma adjustments include the impact of VSP, VERP and S189 costs of R270 million and the related tax impact of R76 million in FY2021, and R1 186 million and the related tax impact of R332 million in FY2020. Unless otherwise stated, the pro forma consolidated income statement and all related key performance indicators and messages in this results announcement are based on this adjusted base.
The applicable criteria on which this pro forma financial information is reported and prepared for the year ended 31 March 2021 are set out below.
Pro forma adjustments
VSP, VERP and S189
The pro forma adjustments for the current financial year include the impact of the VSP, VERP and S189 costs of R270 million and related tax impact of R76 million.
Extract of the audited consolidated abridged statement of profit and loss
RestatedMarch 2020
Rm
Pro forma adjustment
Rm
Pro forma March 2020*
Rm
Operating expenses 22 912 (1 186) 21 726 Employee expenses 10 713 (1 186) 9 527 EBITDA 9 534 1 186 10 720 Operating profit 2 619 1 186 3 805 Taxation 366 332 698
Profit for the year 540 854 1 394
BEPS (cents) 107.5 279.0 HEPS (cents) 194.4 366.0
ReportedMarch 2020
RmRestatement
Rm
Restated March 2020
Rm
Other operating expenses 2 688 68 2 756
EBITDA 9 602 (68) 9 534
Profit after tax 608 (68) 540
BEPS 121.1 (13.6) 107.5
HEPS 208.1 (13.6) 194.4
Extract of the audited consolidated abridged statement of profit and loss
ReportedMarch 2021
Rm
Pro forma adjustment
Rm
Pro forma March 2021
Rm
Operating expenses 21 069 (270) 20 799 Employee expenses 9 312 (270) 9 042 EBITDA 11 703 270 11 973 Operating profit 4 833 270 5 103 Taxation 1 067 76 1 143
Profit for the year 2 428 194 2 622
BEPS (cents) 489.9 529.1 HEPS (cents) 522.2 561.5
* The pro forma financial information for the year ended 31 March 2020 has been restated and presented on a consistent basis with the pro forma financial information for the year ended 31 March 2021.
54 Telkom Group Abridged Annual Results 2021
1
Overview of our business
Telkom announced its Group annual results for the year ended 31 March 2021 on 24 May 2021 in Centurion, South Africa.
7Overview of our business
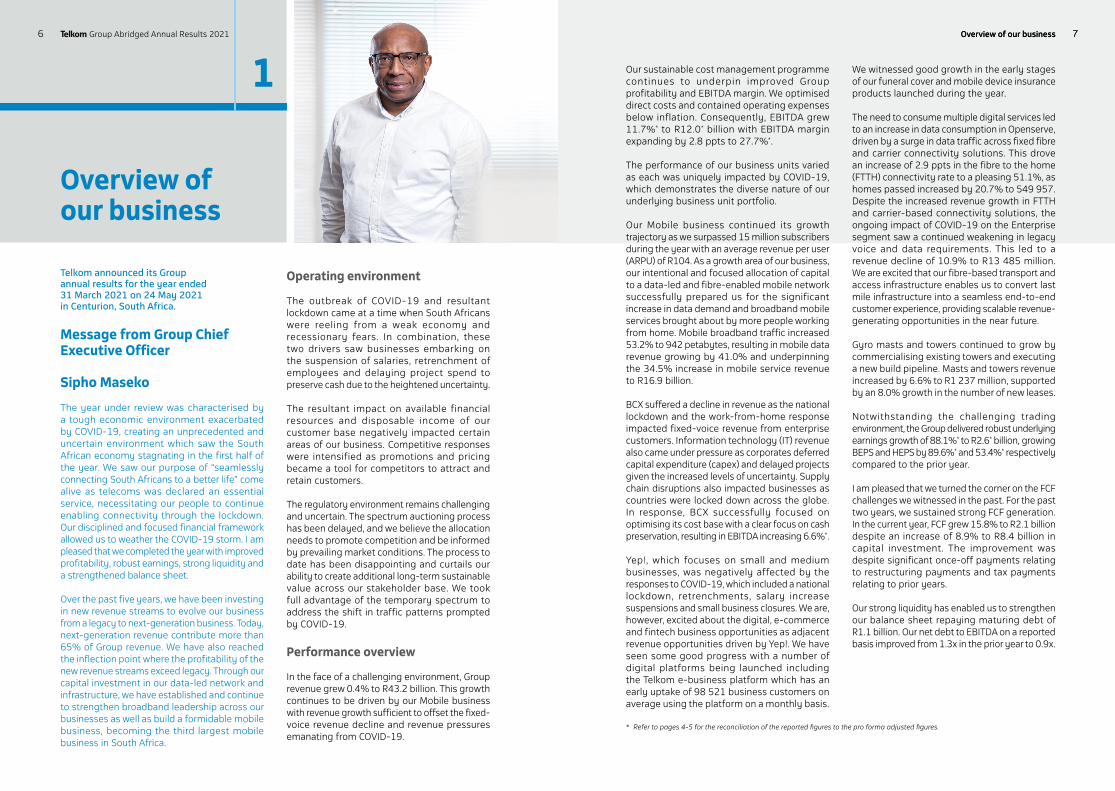
Message from Group Chief Executive Officer
Sipho Maseko
The year under review was characterised by a tough economic environment exacerbated by COVID-19, creating an unprecedented and uncertain environment which saw the South African economy stagnating in the first half of the year. We saw our purpose of “seamlessly connecting South Africans to a better life” come alive as telecoms was declared an essential service, necessitating our people to continue enabling connectivity through the lockdown. Our disciplined and focused financial framework allowed us to weather the COVID-19 storm. I am pleased that we completed the year with improved profitability, robust earnings, strong liquidity and a strengthened balance sheet.
Over the past five years, we have been investing in new revenue streams to evolve our business from a legacy to next-generation business. Today, next-generation revenue contribute more than 65% of Group revenue. We have also reached the inflection point where the profitability of the new revenue streams exceed legacy. Through our capital investment in our data-led network and infrastructure, we have established and continue to strengthen broadband leadership across our businesses as well as build a formidable mobile business, becoming the third largest mobile business in South Africa.
Operating environment
The outbreak of COVID-19 and resultant lockdown came at a time when South Africans were reeling from a weak economy and recessionary fears. In combination, these two drivers saw businesses embarking on the suspension of salaries, retrenchment of employees and delaying project spend to preserve cash due to the heightened uncertainty.
The resultant impact on available financial resources and disposable income of our customer base negatively impacted certain areas of our business. Competitive responses were intensified as promotions and pricing became a tool for competitors to attract and retain customers. The regulatory environment remains challenging and uncertain. The spectrum auctioning process has been delayed, and we believe the allocation needs to promote competition and be informed by prevailing market conditions. The process to date has been disappointing and curtails our ability to create additional long-term sustainable value across our stakeholder base. We took full advantage of the temporary spectrum to address the shift in traffic patterns prompted by COVID-19.
Performance overview
In the face of a challenging environment, Group revenue grew 0.4% to R43.2 billion. This growth continues to be driven by our Mobile business with revenue growth sufficient to offset the fixed-voice revenue decline and revenue pressures emanating from COVID-19.
Our sustainable cost management programme continues to underpin improved Group profitability and EBITDA margin. We optimised direct costs and contained operating expenses below inflation. Consequently, EBITDA grew 11.7%* to R12.0* billion with EBITDA margin expanding by 2.8 ppts to 27.7%*.
The performance of our business units varied as each was uniquely impacted by COVID-19, which demonstrates the diverse nature of our underlying business unit portfolio.
Our Mobile business continued its growth trajectory as we surpassed 15 million subscribers during the year with an average revenue per user (ARPU) of R104. As a growth area of our business, our intentional and focused allocation of capital to a data-led and fibre-enabled mobile network successfully prepared us for the significant increase in data demand and broadband mobile services brought about by more people working from home. Mobile broadband traffic increased 53.2% to 942 petabytes, resulting in mobile data revenue growing by 41.0% and underpinning the 34.5% increase in mobile service revenue to R16.9 billion.
BCX suffered a decline in revenue as the national lockdown and the work-from-home response impacted fixed-voice revenue from enterprise customers. Information technology (IT) revenue also came under pressure as corporates deferred capital expenditure (capex) and delayed projects given the increased levels of uncertainty. Supply chain disruptions also impacted businesses as countries were locked down across the globe. In response, BCX successfully focused on optimising its cost base with a clear focus on cash preservation, resulting in EBITDA increasing 6.6%*.
Yep!, which focuses on small and medium businesses, was negatively affected by the responses to COVID-19, which included a national lockdown, retrenchments, salary increase suspensions and small business closures. We are, however, excited about the digital, e-commerce and fintech business opportunities as adjacent revenue opportunities driven by Yep!. We have seen some good progress with a number of digital platforms being launched including the Telkom e-business platform which has an early uptake of 98 521 business customers on average using the platform on a monthly basis.
We witnessed good growth in the early stages of our funeral cover and mobile device insurance products launched during the year.
The need to consume multiple digital services led to an increase in data consumption in Openserve, driven by a surge in data traffic across fixed fibre and carrier connectivity solutions. This drove an increase of 2.9 ppts in the fibre to the home (FTTH) connectivity rate to a pleasing 51.1%, as homes passed increased by 20.7% to 549 957. Despite the increased revenue growth in FTTH and carrier-based connectivity solutions, the ongoing impact of COVID-19 on the Enterprise segment saw a continued weakening in legacy voice and data requirements. This led to a revenue decline of 10.9% to R13 485 million. We are excited that our fibre-based transport and access infrastructure enables us to convert last mile infrastructure into a seamless end-to-end customer experience, providing scalable revenue-generating opportunities in the near future.
Gyro masts and towers continued to grow by commercialising existing towers and executing a new build pipeline. Masts and towers revenue increased by 6.6% to R1 237 million, supported by an 8.0% growth in the number of new leases.
Notwithstanding the challenging trading environment, the Group delivered robust underlying earnings growth of 88.1%* to R2.6* billion, growing BEPS and HEPS by 89.6%* and 53.4%* respectively compared to the prior year.
I am pleased that we turned the corner on the FCF challenges we witnessed in the past. For the past two years, we sustained strong FCF generation. In the current year, FCF grew 15.8% to R2.1 billion despite an increase of 8.9% to R8.4 billion in capital investment. The improvement was despite significant once-off payments relating to restructuring payments and tax payments relating to prior years.
Our strong liquidity has enabled us to strengthen our balance sheet repaying maturing debt of R1.1 billion. Our net debt to EBITDA on a reported basis improved from 1.3x in the prior year to 0.9x.
* Refer to pages 4-5 for the reconciliation of the reported figures to the pro forma adjusted figures.
76 Telkom Group Abridged Annual Results 2021 Overview of our business
Reported March 2021
Rm
Reported March 2020
RmVariance
%
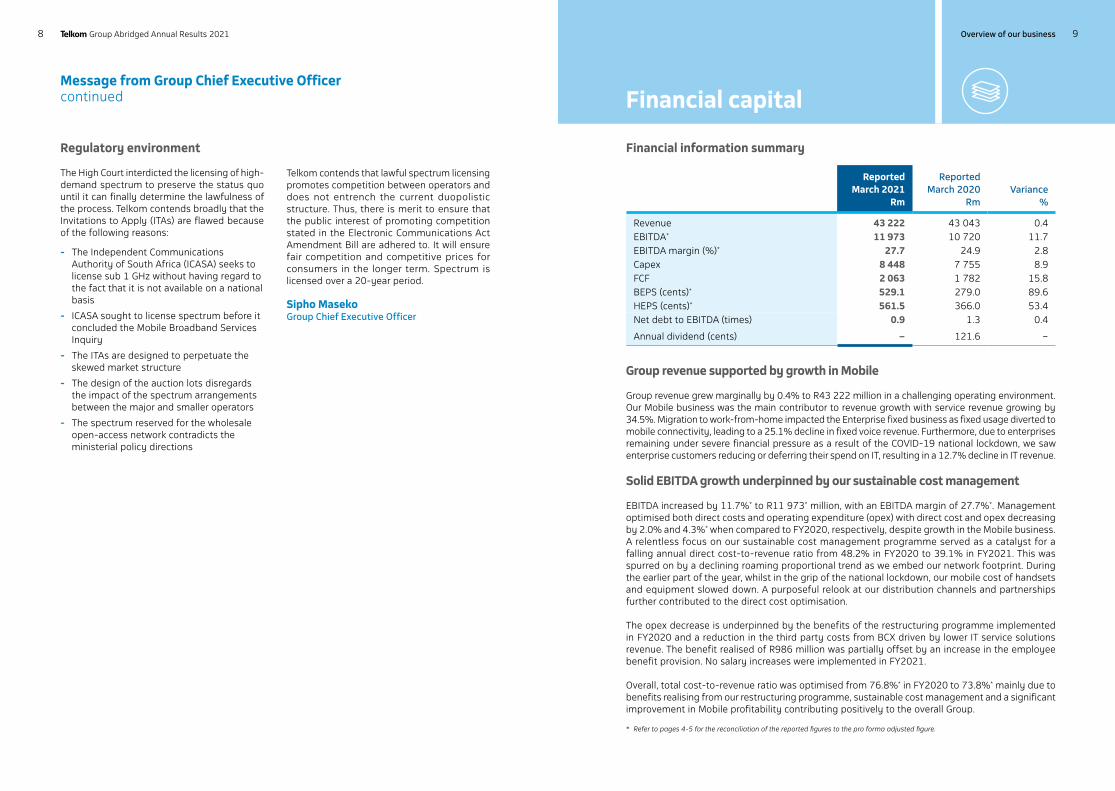
Revenue 43 222 43 043 0.4 EBITDA* 11 973 10 720 11.7 EBITDA margin (%)* 27.7 24.9 2.8 Capex 8 448 7 755 8.9FCF 2 063 1 782 15.8 BEPS (cents)* 529.1 279.0 89.6 HEPS (cents)* 561.5 366.0 53.4 Net debt to EBITDA (times) 0.9 1.3 0.4
Annual dividend (cents) – 121.6 –
Financial information summary
Financial capital
Group revenue supported by growth in Mobile
Group revenue grew marginally by 0.4% to R43 222 million in a challenging operating environment. Our Mobile business was the main contributor to revenue growth with service revenue growing by 34.5%. Migration to work-from-home impacted the Enterprise fixed business as fixed usage diverted to mobile connectivity, leading to a 25.1% decline in fixed voice revenue. Furthermore, due to enterprises remaining under severe financial pressure as a result of the COVID-19 national lockdown, we saw enterprise customers reducing or deferring their spend on IT, resulting in a 12.7% decline in IT revenue.
Solid EBITDA growth underpinned by our sustainable cost management
EBITDA increased by 11.7%* to R11 973* million, with an EBITDA margin of 27.7%*. Management optimised both direct costs and operating expenditure (opex) with direct cost and opex decreasing by 2.0% and 4.3%* when compared to FY2020, respectively, despite growth in the Mobile business.A relentless focus on our sustainable cost management programme served as a catalyst for a falling annual direct cost-to-revenue ratio from 48.2% in FY2020 to 39.1% in FY2021. This was spurred on by a declining roaming proportional trend as we embed our network footprint. During the earlier part of the year, whilst in the grip of the national lockdown, our mobile cost of handsets and equipment slowed down. A purposeful relook at our distribution channels and partnerships further contributed to the direct cost optimisation.
The opex decrease is underpinned by the benefits of the restructuring programme implemented in FY2020 and a reduction in the third party costs from BCX driven by lower IT service solutions revenue. The benefit realised of R986 million was partially offset by an increase in the employee benefit provision. No salary increases were implemented in FY2021.
Overall, total cost-to-revenue ratio was optimised from 76.8%* in FY2020 to 73.8%* mainly due to benefits realising from our restructuring programme, sustainable cost management and a significant improvement in Mobile profitability contributing positively to the overall Group.
Message from Group Chief Executive Officer continued
* Refer to pages 4-5 for the reconciliation of the reported figures to the pro forma adjusted figure.
Regulatory environment
The High Court interdicted the licensing of high-demand spectrum to preserve the status quo until it can finally determine the lawfulness of the process. Telkom contends broadly that the Invitations to Apply (ITAs) are flawed because of the following reasons:
- The Independent Communications Authority of South Africa (ICASA) seeks to license sub 1 GHz without having regard to the fact that it is not available on a national basis
- ICASA sought to license spectrum before it concluded the Mobile Broadband Services Inquiry
- The ITAs are designed to perpetuate the skewed market structure
- The design of the auction lots disregards the impact of the spectrum arrangements between the major and smaller operators
- The spectrum reserved for the wholesale open-access network contradicts the ministerial policy directions
Telkom contends that lawful spectrum licensing promotes competition between operators and does not entrench the current duopolistic structure. Thus, there is merit to ensure that the public interest of promoting competition stated in the Electronic Communications Act Amendment Bill are adhered to. It will ensure fair competition and competitive prices for consumers in the longer term. Spectrum is licensed over a 20-year period.
Sipho MasekoGroup Chief Executive Officer
98 Telkom Group Abridged Annual Results 2021 Overview of our business
FCF
Reported March 2021
Rm
Reported March2020
RmVariance
%
Cash generated from operations excluding VSP, VERP and S189 costs paid** 15 592 12 931 20.6 Less: VSP, VERP and S189 costs paid (1 348) (175) (670.3)
Cash generated from operations 14 244 12 756 11.7Less: Repayment of lease liability (856) (780) (9.7)Interest received 332 212 56.6 Finance charges paid (1 291) (1 374) 6.0 Taxation paid (2 194) (1 320) (66.2)
Cash generated from operations before dividend paid 10 235 9 494 7.8Cash paid for capital expenditure (8 172) (7 712) (6.0)
Total 2 063 1 782 15.8
** Excludes the impact of VSP, VERP and S189 costs paid in FY2021 of R1 348 million and R175 million in FY2020.
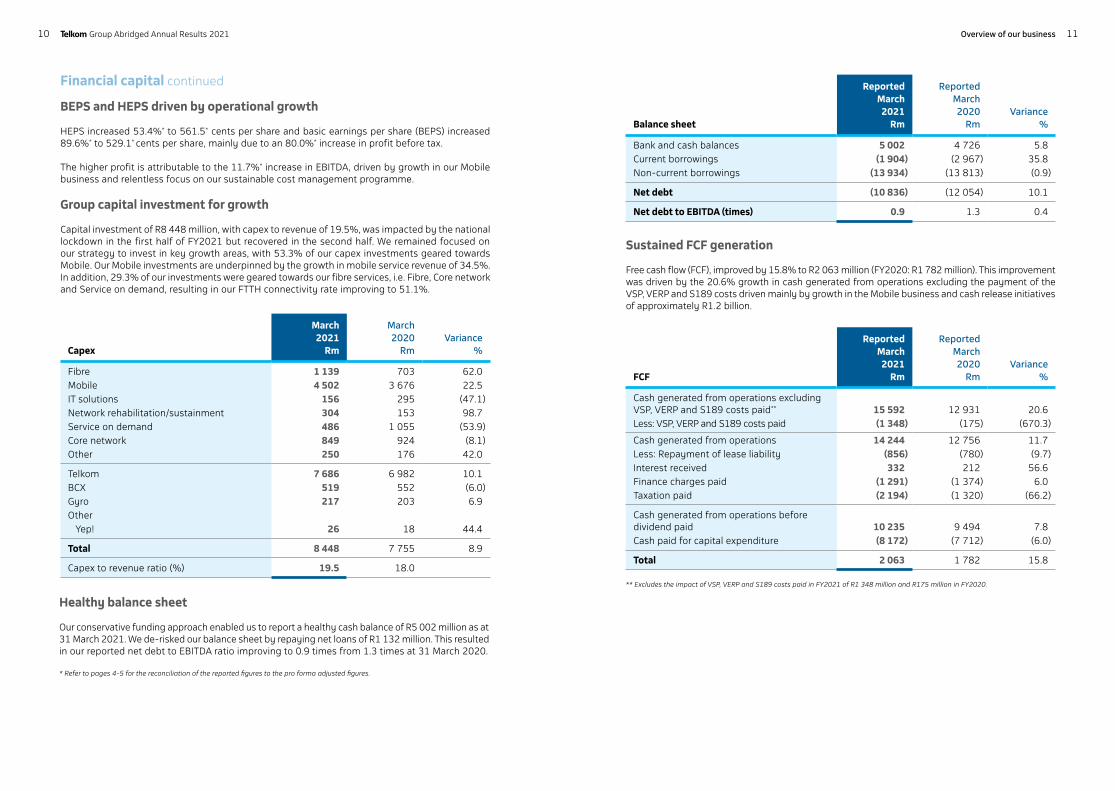
Balance sheet
Reported March
2021Rm
Reported March 2020
RmVariance
%
Bank and cash balances 5 002 4 726 5.8 Current borrowings (1 904) (2 967) 35.8 Non-current borrowings (13 934) (13 813) (0.9)
Net debt (10 836) (12 054) 10.1
Net debt to EBITDA (times) 0.9 1.3 0.4
Capex
March 2021
Rm
March 2020
RmVariance
%
Fibre 1 139 703 62.0 Mobile 4 502 3 676 22.5 IT solutions 156 295 (47.1)Network rehabilitation/sustainment 304 153 98.7 Service on demand 486 1 055 (53.9)Core network 849 924 (8.1)Other 250 176 42.0
Telkom 7 686 6 982 10.1BCX 519 552 (6.0)Gyro 217 203 6.9Other
Yep! 26 18 44.4
Total 8 448 7 755 8.9
Capex to revenue ratio (%) 19.5 18.0
BEPS and HEPS driven by operational growth
HEPS increased 53.4%* to 561.5* cents per share and basic earnings per share (BEPS) increased 89.6%* to 529.1* cents per share, mainly due to an 80.0%* increase in profit before tax.
The higher profit is attributable to the 11.7%* increase in EBITDA, driven by growth in our Mobile business and relentless focus on our sustainable cost management programme.
Group capital investment for growth
Capital investment of R8 448 million, with capex to revenue of 19.5%, was impacted by the national lockdown in the first half of FY2021 but recovered in the second half. We remained focused on our strategy to invest in key growth areas, with 53.3% of our capex investments geared towards Mobile. Our Mobile investments are underpinned by the growth in mobile service revenue of 34.5%.In addition, 29.3% of our investments were geared towards our fibre services, i.e. Fibre, Core network and Service on demand, resulting in our FTTH connectivity rate improving to 51.1%.
Financial capital continued
Healthy balance sheet
Our conservative funding approach enabled us to report a healthy cash balance of R5 002 million as at 31 March 2021. We de-risked our balance sheet by repaying net loans of R1 132 million. This resulted in our reported net debt to EBITDA ratio improving to 0.9 times from 1.3 times at 31 March 2020.
* Refer to pages 4-5 for the reconciliation of the reported figures to the pro forma adjusted figures.
Sustained FCF generation
Free cash flow (FCF), improved by 15.8% to R2 063 million (FY2020: R1 782 million). This improvement was driven by the 20.6% growth in cash generated from operations excluding the payment of the VSP, VERP and S189 costs driven mainly by growth in the Mobile business and cash release initiatives of approximately R1.2 billion.
1110 Telkom Group Abridged Annual Results 2021 Overview of our business
Achievements
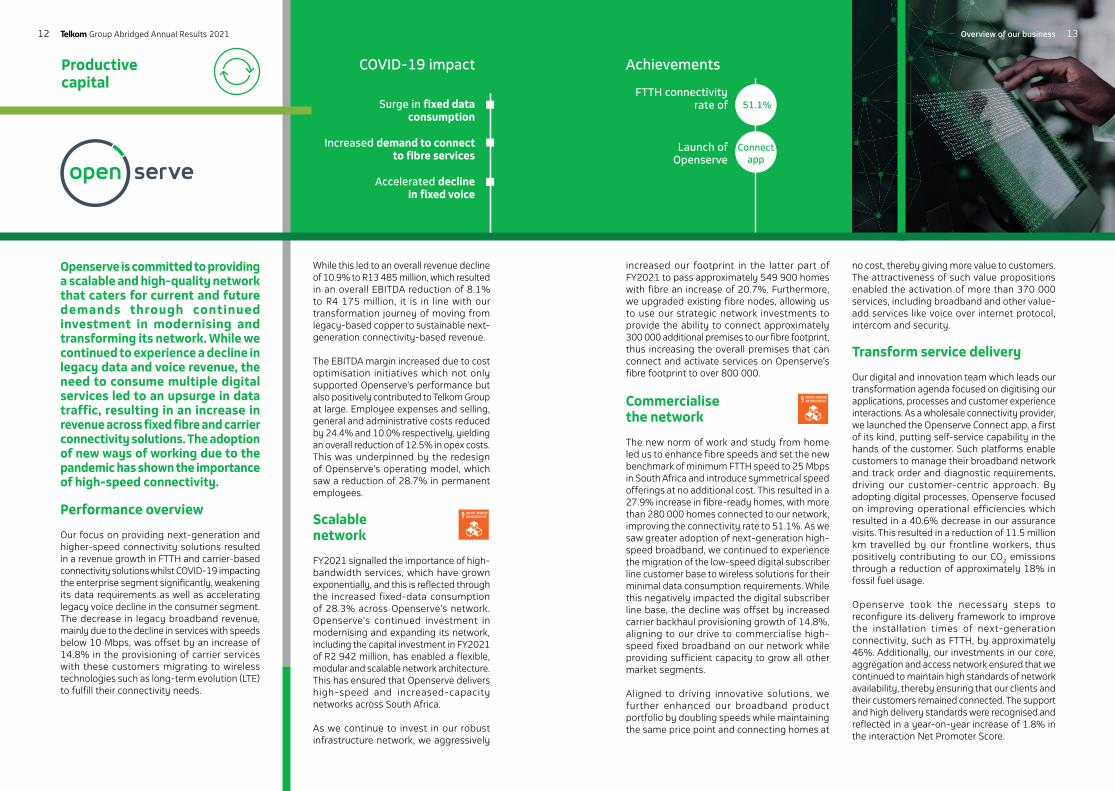
FTTH connectivity rate of
Launch of Openserve
51.1%
Connect app
COVID-19 impact
Surge in fixed data consumption
Increased demand to connect to fibre services
Accelerated decline in fixed voice
Openserve is committed to providing a scalable and high-quality network that caters for current and future demands through continued investment in modernising and transforming its network. While we continued to experience a decline in legacy data and voice revenue, the need to consume multiple digital services led to an upsurge in data traffic, resulting in an increase in revenue across fixed fibre and carrier connectivity solutions. The adoption of new ways of working due to the pandemic has shown the importance of high-speed connectivity.
Performance overview
Our focus on providing next-generation and higher-speed connectivity solutions resulted in a revenue growth in FTTH and carrier-based connectivity solutions whilst COVID-19 impacting the enterprise segment significantly, weakening its data requirements as well as accelerating legacy voice decline in the consumer segment. The decrease in legacy broadband revenue, mainly due to the decline in services with speeds below 10 Mbps, was offset by an increase of 14.8% in the provisioning of carrier services with these customers migrating to wireless technologies such as long-term evolution (LTE) to fulfill their connectivity needs.
While this led to an overall revenue decline of 10.9% to R13 485 million, which resulted in an overall EBITDA reduction of 8.1% to R4 175 million, it is in line with our transformation journey of moving from legacy-based copper to sustainable next-generation connectivity-based revenue.
The EBITDA margin increased due to cost optimisation initiatives which not only supported Openserve’s performance but also positively contributed to Telkom Group at large. Employee expenses and selling, general and administrative costs reduced by 24.4% and 10.0% respectively, yielding an overall reduction of 12.5% in opex costs. This was underpinned by the redesign of Openserve’s operating model, which saw a reduction of 28.7% in permanent employees.
Scalable network
FY2021 signalled the importance of high-bandwidth services, which have grown exponentially, and this is reflected through the increased fixed-data consumption of 28.3% across Openserve’s network. Openserve’s continued investment in modernising and expanding its network, including the capital investment in FY2021 of R2 942 million, has enabled a flexible, modular and scalable network architecture. This has ensured that Openserve delivers high-speed and increased-capacity networks across South Africa.
As we continue to invest in our robust infrastructure network, we aggressively
Productive capital
increased our footprint in the latter part of FY2021 to pass approximately 549 900 homes with fibre an increase of 20.7%. Furthermore, we upgraded existing fibre nodes, allowing us to use our strategic network investments to provide the ability to connect approximately 300 000 additional premises to our fibre footprint, thus increasing the overall premises that can connect and activate services on Openserve’s fibre footprint to over 800 000.
Commercialise the network
The new norm of work and study from home led us to enhance fibre speeds and set the new benchmark of minimum FTTH speed to 25 Mbps in South Africa and introduce symmetrical speed offerings at no additional cost. This resulted in a 27.9% increase in fibre-ready homes, with more than 280 000 homes connected to our network, improving the connectivity rate to 51.1%. As we saw greater adoption of next-generation high-speed broadband, we continued to experience the migration of the low-speed digital subscriber line customer base to wireless solutions for their minimal data consumption requirements. While this negatively impacted the digital subscriber line base, the decline was offset by increased carrier backhaul provisioning growth of 14.8%, aligning to our drive to commercialise high-speed fixed broadband on our network while providing sufficient capacity to grow all other market segments.
Aligned to driving innovative solutions, we further enhanced our broadband product portfolio by doubling speeds while maintaining the same price point and connecting homes at
no cost, thereby giving more value to customers. The attractiveness of such value propositions enabled the activation of more than 370 000 services, including broadband and other value-add services like voice over internet protocol, intercom and security.
Transform service delivery
Our digital and innovation team which leads our transformation agenda focused on digitising our applications, processes and customer experience interactions. As a wholesale connectivity provider, we launched the Openserve Connect app, a first of its kind, putting self-service capability in the hands of the customer. Such platforms enable customers to manage their broadband network and track order and diagnostic requirements, driving our customer-centric approach. By adopting digital processes, Openserve focused on improving operational efficiencies which resulted in a 40.6% decrease in our assurance visits. This resulted in a reduction of 11.5 million km travelled by our frontline workers, thus positively contributing to our CO2 emissions through a reduction of approximately 18% in fossil fuel usage.
Openserve took the necessary steps to reconfigure its delivery framework to improve the installation times of next-generation connectivity, such as FTTH, by approximately 46%. Additionally, our investments in our core, aggregation and access network ensured that we continued to maintain high standards of network availability, thereby ensuring that our clients and their customers remained connected. The support and high delivery standards were recognised and reflected in a year-on-year increase of 1.8% in the interaction Net Promoter Score.
1312 Telkom Group Abridged Annual Results 2021 Overview of our business
The past year was characterised by an ever- increasing demand for connectivity by consumers for whom working and learning from home has become the new norm. Our innovative high-speed broadband-led propositions at attractive price points were the catalyst for our strong results. The Mobile business, now in its 11th year, continued growing, leading with data and disrupting with voice. Telkom Mobile has now become the third largest operator in South Africa, based on service revenue.
Performance overview
The Consumer segment delivered a 10.1% increase in operating revenue to R25 815 million. This was stimulated by the Mobile business’s strong data demand, with service revenue increasing 34.5% to R16 938 million. This includes applications services revenue of R528 million. Fixed-line copper revenue continues to decline due to continued migration to next-generation technologies such as LTE and fibre; however, the rate of decline slowed as the demand for home connectivity increased. To meet this demand, compelling new value offers were created to enable working and learning from home. A strong broadband demand and a prudent cost containment strategy led to an impressive 90.1% EBITDA improvement to R5 007 million, translating into an EBITDA margin of 19.4%.
The SMB component that is under Yep! continues to improve operationally, with measures being implemented to control churn given the challenging economic landscape. Although small and medium enterprises (SMEs) have been significantly impacted by lockdown measures, there are some positive results with new customer acquisitions growing. Mobile service revenue to businesses and public sector entities increased by 31.1% mainly due
to work and learn from home. An online marketplace platform was launched and digital services revenue grew by 20%. The platform attracts an average of 337 000 unique visitors per month.
Telkom was named one of the official service providers by National Treasury following a competitive tender process. This contract is awarded for 1 April 2021 to 31 March 2026, and provides the opportunity to service the South African Government with all of its telephone communications needs, including hardware, software and accessories.
Accelerated mobile growth
In an increasingly competitive market, Telkom’s Mobile customer base increased by 27.8% to 15.3 million customers. The overall blended ARPU increased by 15.1% to R104, spurred by an atypical COVID-19 surge. The pre-paid customer base continued its strong growth, expanding by 35.1% to 12.7 million and pre-paid ARPU increased by 17.5% to R77. The challenging economy had an impact on the overall post-paid base, but it remained relatively stable, growing by 0.7% to 2.6 million with an ARPU increase of 12.2% to R211, pointing to a distressed post-paid segment.
As part of Telkom’s COVID-19 commitment, we have undertaken to provide customers with free access to educational content and key information on government websites. More than 185 government websites and educational institutions, as well as COVID-19 -specific websites, have been zero rated, removing barriers to access these sites.
Productive capital
Drive high-speed broadband
Our innovative broadband-led offerings catered for the heightened need for data connectivity. The high-speed mobile broadband products available to the pre-paid and post-paid base at significantly lower entry-level bundles and pricing, made access to home and personal broadband a reality. We saw 41.0% growth in mobile data revenue to R12 211 million, supported by 25.6% growth in mobile broadband subscribers to over 10 million.
Our focus on increasing value-added services to our mobile base was realised through the launch of Telkom’s own video-on-demand platform, TelkomONE, in November 2020. It is a mobile-first proposition, aimed primarily at the underserviced youth market, and is gaining traction. We partnered with the SABC to become the first official streaming video-on-demand service to host SABC TV and radio channels.
Our strategy is to lead on value-based pricing and to grow customer ARPUs through experiential value-rich offerings. Leveraging entertainment streaming applications flanked by SmartHome/Internet of Things will result in a more competitive positioning in the market. These value-rich offerings are also the ideal platform to enable work-from-home and e-learning applications. Our fixed-line customers benefited from our high-speed broadband unlimited services, which have provided positive traction for new acquisitions and retaining our existing base through attractive price points. Strategic COVID-19 support to the above initiatives was introduced through the launch of the DSL Pure Connect uncapped bundles at promotional pricing, with an entry speed of 5 Mbps at R199 per month. This was coupled with a refreshed FTTH portfolio that
features an entry speed starting at 25 Mbps at affordable prices. This addresses the need for fast, reliable high-speed and uncapped fixed-line broadband in the home.
Expand the mobile network
During the lockdown, we saw a surge in mobile network traffic due to more people working from home and students studying online. Our mobile traffic grew 53.2% to 942 petabytes. A capital investment of R4 502 million enabled us to carry this significant increase in mobile traffic.
We increased our mobile footprint, increasing our site roll out 9.7% to 6 430. Capacity upgrades, underpinned by the deployment of additional carriers and temporary spectrum, as well as ongoing spectrum refarming, resulted in the upgrade of 2 096 sites with temporary spectrum, 1 971 sites with additional carriers, 1 309 refarmed sites and 804 sites where LTE capability was improved. Our mobile network expansion programme continues, emphasising 4G and deploying temporary spectrum in support of the COVID-19 response.
Telkom has faced major challenges with ongoing high levels of theft and vandalism of equipment. This problem is relevant to all operators and infrastructure providers in the country. Batteries are being targeted due to the ongoing power challenges in the country. Battery theft impacts the networks’ uptime during load reduction/load shedding and requires ongoing operational management. For the year under review, Telkom managed 2 170 incidents, where 1 351 non-service affecting sites were repaired, 359 service affecting sites were repaired and restored, as well as 129 still partially service affecting sites that were repaired.
Achievements
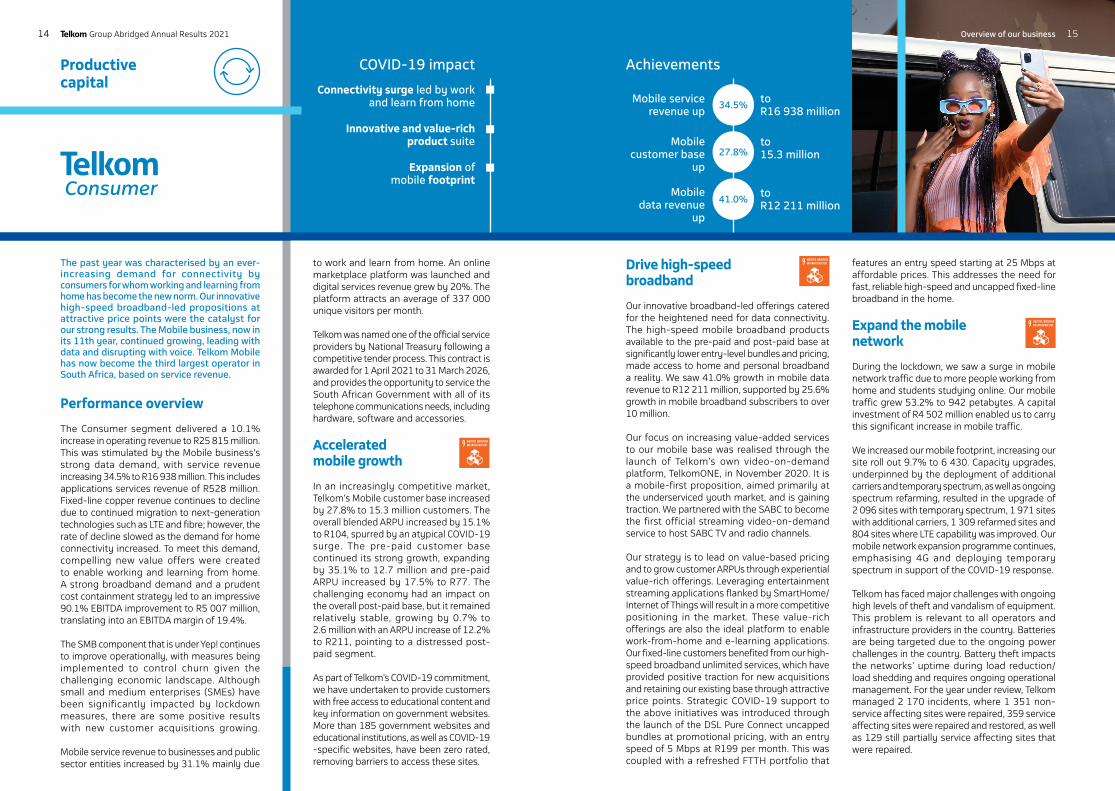
Mobile service revenue up
to R16 938 million
to 15.3 million
to R12 211 million
Mobile customer base
up
Mobile data revenue
up
34.5%
27.8%
41.0%
COVID-19 impact
Connectivity surge led by work and learn from home
Innovative and value-rich product suite
Expansion of mobile footprint
1514 Telkom Group Abridged Annual Results 2021 Overview of our business
Achievements
Total expenses down
EBITDA margin up
to R13 354 million
12.6%
15.7%
COVID-19 impact
Clients under severe financial pressure
Robust COVID-19 response plan yielding results
- Cost efficiencies - Cash preservation
- New operating model
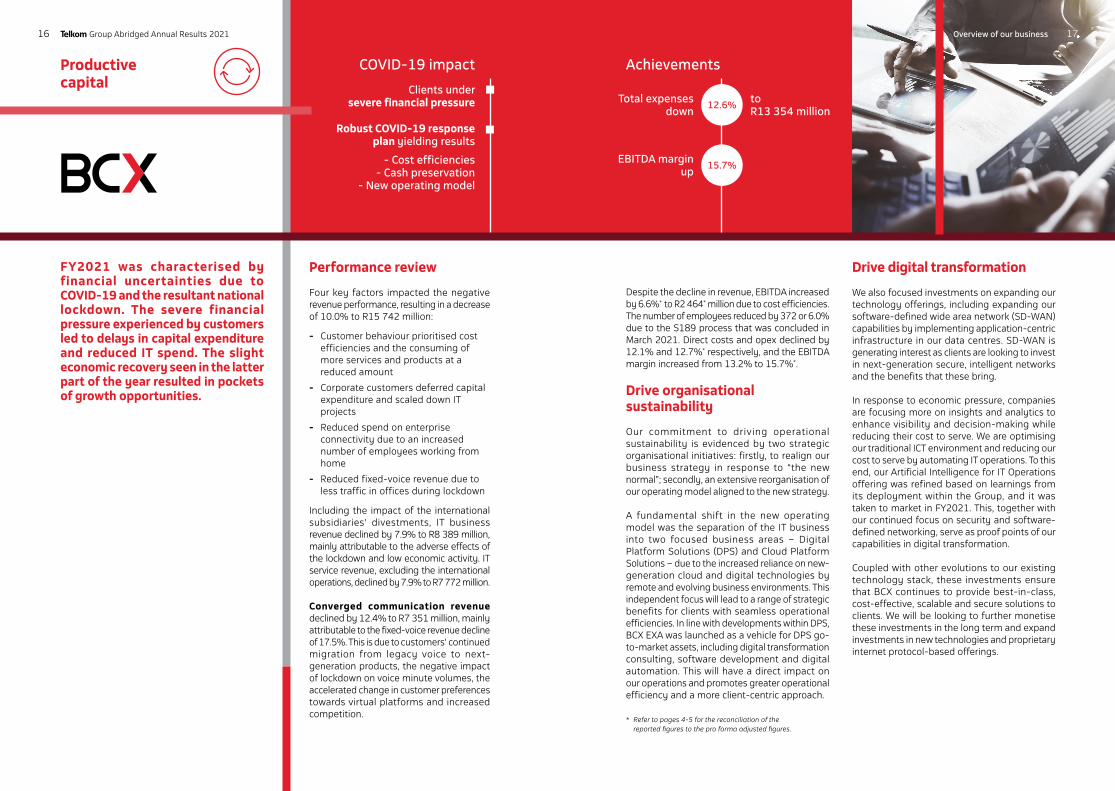
FY2021 was characterised by financial uncertainties due to COVID-19 and the resultant national lockdown. The severe financial pressure experienced by customers led to delays in capital expenditure and reduced IT spend. The slight economic recovery seen in the latter part of the year resulted in pockets of growth opportunities.
Productive capital
* Refer to pages 4-5 for the reconciliation of the reported figures to the pro forma adjusted figures.
Drive digital transformation
We also focused investments on expanding our technology offerings, including expanding our software-defined wide area network (SD-WAN) capabilities by implementing application-centric infrastructure in our data centres. SD-WAN is generating interest as clients are looking to invest in next-generation secure, intelligent networks and the benefits that these bring.
In response to economic pressure, companies are focusing more on insights and analytics to enhance visibility and decision-making while reducing their cost to serve. We are optimising our traditional ICT environment and reducing our cost to serve by automating IT operations. To this end, our Artificial Intelligence for IT Operations offering was refined based on learnings from its deployment within the Group, and it was taken to market in FY2021. This, together with our continued focus on security and software-defined networking, serve as proof points of our capabilities in digital transformation.
Coupled with other evolutions to our existing technology stack, these investments ensure that BCX continues to provide best-in-class, cost-effective, scalable and secure solutions to clients. We will be looking to further monetise these investments in the long term and expand investments in new technologies and proprietary internet protocol-based offerings.
Performance review
Four key factors impacted the negative revenue performance, resulting in a decrease of 10.0% to R15 742 million:
- Customer behaviour prioritised cost efficiencies and the consuming of more services and products at a reduced amount
- Corporate customers deferred capital expenditure and scaled down IT projects
- Reduced spend on enterprise connectivity due to an increased number of employees working from home
- Reduced fixed-voice revenue due to less traffic in offices during lockdown
Including the impact of the international subsidiaries' divestments, IT business revenue declined by 7.9% to R8 389 million, mainly attributable to the adverse effects of the lockdown and low economic activity. IT service revenue, excluding the international operations, declined by 7.9% to R7 772 million.
Converged communication revenue declined by 12.4% to R7 351 million, mainly attributable to the fixed-voice revenue decline of 17.5%. This is due to customers' continued migration from legacy voice to next-generation products, the negative impact of lockdown on voice minute volumes, the accelerated change in customer preferences towards virtual platforms and increased competition.
Despite the decline in revenue, EBITDA increased by 6.6%* to R2 464* million due to cost efficiencies. The number of employees reduced by 372 or 6.0% due to the S189 process that was concluded in March 2021. Direct costs and opex declined by 12.1% and 12.7%* respectively, and the EBITDA margin increased from 13.2% to 15.7%*.
Drive organisational sustainability
Our commitment to driving operational sustainability is evidenced by two strategic organisational initiatives: firstly, to realign our business strategy in response to “the new normal”; secondly, an extensive reorganisation of our operating model aligned to the new strategy.
A fundamental shift in the new operating model was the separation of the IT business into two focused business areas – Digital Platform Solutions (DPS) and Cloud Platform Solutions – due to the increased reliance on new-generation cloud and digital technologies by remote and evolving business environments. This independent focus will lead to a range of strategic benefits for clients with seamless operational efficiencies. In line with developments within DPS, BCX EXA was launched as a vehicle for DPS go-to-market assets, including digital transformation consulting, software development and digital automation. This will have a direct impact on our operations and promotes greater operational efficiency and a more client-centric approach.
16 Telkom Group Abridged Annual Results 2021 Overview of our business 17
Achievements
M&T revenue up
to R1 237 million
to R994 million
M&T EBITDA up
6.6%
23.2%
COVID-19 impact
Tower build programme gained momentum
Small cells and in-building solutions deployment process
Concluded new leases, growing the masts and
towers portfolio
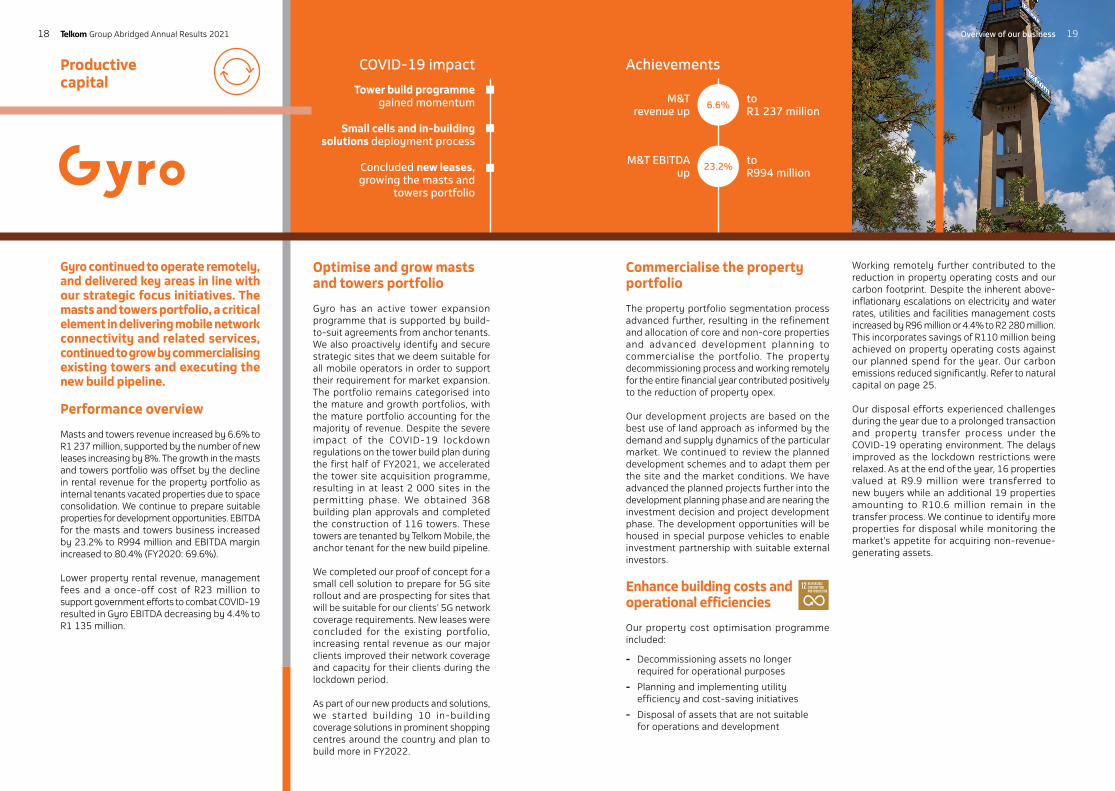
Gyro continued to operate remotely, and delivered key areas in line with our strategic focus initiatives. The masts and towers portfolio, a critical element in delivering mobile network connectivity and related services, continued to grow by commercialising existing towers and executing the new build pipeline.
Performance overview
Masts and towers revenue increased by 6.6% to R1 237 million, supported by the number of new leases increasing by 8%. The growth in the masts and towers portfolio was offset by the decline in rental revenue for the property portfolio as internal tenants vacated properties due to space consolidation. We continue to prepare suitable properties for development opportunities. EBITDA for the masts and towers business increased by 23.2% to R994 million and EBITDA margin increased to 80.4% (FY2020: 69.6%).
Lower property rental revenue, management fees and a once-off cost of R23 million to support government efforts to combat COVID-19 resulted in Gyro EBITDA decreasing by 4.4% to R1 135 million.
Optimise and grow masts and towers portfolio
Gyro has an active tower expansion programme that is supported by build-to-suit agreements from anchor tenants. We also proactively identify and secure strategic sites that we deem suitable for all mobile operators in order to support their requirement for market expansion. The portfolio remains categorised into the mature and growth portfolios, with the mature portfolio accounting for the majority of revenue. Despite the severe impact of the COVID-19 lockdown regulations on the tower build plan during the first half of FY2021, we accelerated the tower site acquisition programme, resulting in at least 2 000 sites in the permitting phase. We obtained 368 building plan approvals and completed the construction of 116 towers. These towers are tenanted by Telkom Mobile, the anchor tenant for the new build pipeline.
We completed our proof of concept for a small cell solution to prepare for 5G site rollout and are prospecting for sites that will be suitable for our clients’ 5G network coverage requirements. New leases were concluded for the existing portfolio, increasing rental revenue as our major clients improved their network coverage and capacity for their clients during the lockdown period.
As part of our new products and solutions, we started building 10 in-building coverage solutions in prominent shopping centres around the country and plan to build more in FY2022.
Productive capital
Commercialise the property portfolio
The property portfolio segmentation process advanced further, resulting in the refinement and allocation of core and non-core properties and advanced development planning to commercialise the portfolio. The property decommissioning process and working remotely for the entire financial year contributed positively to the reduction of property opex. Our development projects are based on the best use of land approach as informed by the demand and supply dynamics of the particular market. We continued to review the planned development schemes and to adapt them per the site and the market conditions. We have advanced the planned projects further into the development planning phase and are nearing the investment decision and project development phase. The development opportunities will be housed in special purpose vehicles to enable investment partnership with suitable external investors.
Enhance building costs and operational efficiencies
Our property cost optimisation programme included:
- Decommissioning assets no longer required for operational purposes
- Planning and implementing utility efficiency and cost-saving initiatives
- Disposal of assets that are not suitable for operations and development
Working remotely further contributed to the reduction in property operating costs and our carbon footprint. Despite the inherent above-inflationary escalations on electricity and water rates, utilities and facilities management costs increased by R96 million or 4.4% to R2 280 million. This incorporates savings of R110 million being achieved on property operating costs against our planned spend for the year. Our carbon emissions reduced significantly. Refer to natural capital on page 25.
Our disposal efforts experienced challenges during the year due to a prolonged transaction and property transfer process under the COVID-19 operating environment. The delays improved as the lockdown restrictions were relaxed. As at the end of the year, 16 properties valued at R9.9 million were transferred to new buyers while an additional 19 properties amounting to R10.6 million remain in the transfer process. We continue to identify more properties for disposal while monitoring the market’s appetite for acquiring non-revenue-generating assets.
18 Telkom Group Abridged Annual Results 2021 19Overview of our business
Achievements
Launch of new Yep! app
New Digital platforms and Fintech products launched
COVID-19 impact
SMEs strained by COVID-19
Resilience in connectivity business
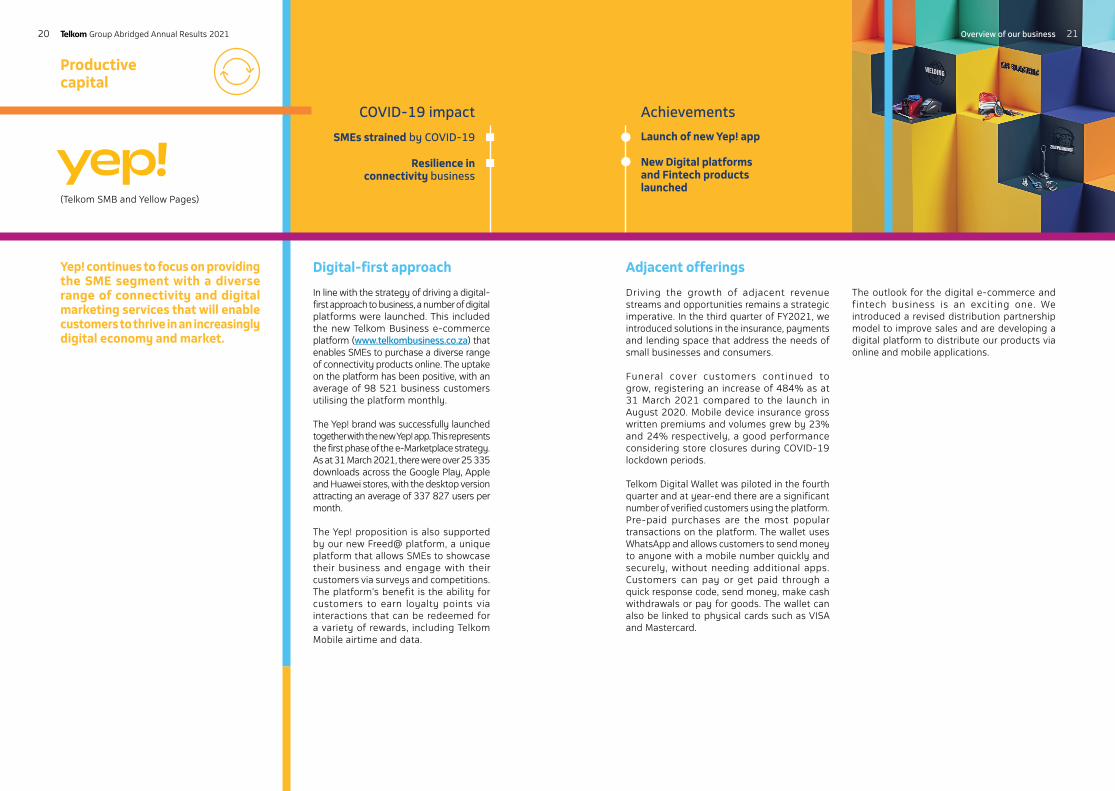
Yep! continues to focus on providing the SME segment with a diverse range of connectivity and digital marketing services that will enable customers to thrive in an increasingly digital economy and market.
Digital-first approach
In line with the strategy of driving a digital-first approach to business, a number of digital platforms were launched. This included the new Telkom Business e-commerce platform (www.telkombusiness.co.za) that enables SMEs to purchase a diverse range of connectivity products online. The uptake on the platform has been positive, with an average of 98 521 business customers utilising the platform monthly.
The Yep! brand was successfully launched together with the new Yep! app. This represents the first phase of the e-Marketplace strategy. As at 31 March 2021, there were over 25 335 downloads across the Google Play, Apple and Huawei stores, with the desktop version attracting an average of 337 827 users per month.
The Yep! proposition is also supported by our new Freed@ platform, a unique platform that allows SMEs to showcase their business and engage with their customers via surveys and competitions. The platform’s benefit is the ability for customers to earn loyalty points via interactions that can be redeemed for a variety of rewards, including Telkom Mobile airtime and data.
Productive capital
Adjacent offerings
Driving the growth of adjacent revenue streams and opportunities remains a strategic imperative. In the third quarter of FY2021, we introduced solutions in the insurance, payments and lending space that address the needs of small businesses and consumers.
Funeral cover customers continued to grow, registering an increase of 484% as at 31 March 2021 compared to the launch in August 2020. Mobile device insurance gross written premiums and volumes grew by 23% and 24% respectively, a good performance considering store closures during COVID-19 lockdown periods.
Telkom Digital Wallet was piloted in the fourth quarter and at year-end there are a significant number of verified customers using the platform. Pre-paid purchases are the most popular transactions on the platform. The wallet uses WhatsApp and allows customers to send money to anyone with a mobile number quickly and securely, without needing additional apps. Customers can pay or get paid through a quick response code, send money, make cash withdrawals or pay for goods. The wallet can also be linked to physical cards such as VISA and Mastercard.
(Telkom SMB and Yellow Pages)
The outlook for the digital e-commerce and fintech business is an exciting one. We introduced a revised distribution partnership model to improve sales and are developing a digital platform to distribute our products via online and mobile applications.
20 Telkom Group Abridged Annual Results 2021 21Overview of our business
With COVID-19 becoming a reality at the start of FY2021, a swift repositioning of key priorities within the human capital space was required.
Human capital Intellectual capital
Although the Group had been on a journey to remote work, this was propelled forward, requiring immediate intervention to support and enable employees to work-from-home. Employee wellbeing became a central focus area due to increased stress and anxiety experienced by employees. People interventions ensuring a holistic focus (physical, financial, mental and psychosocial) were deployed across the Group to safeguard employees’ health and safety while ensuring business and employee productivity.
Telkom’s priority is and will always be the wellbeing of our employees, with approximately 90% being empowered to productively work-from-home. We not only provided safety gear for essential employees, but also increased education and awareness for those working from home. Telkom has an internal dashboard to track all internal positive cases. Employees have access to a dedicated COVID-19 portal which keeps all employees up to date with COVID-19 developments. Additionally, employees have access to a dedicated COVID-19 helpline to report any possible infection. Employees and their families get free testing and counselling through our wellness partner ICAS. A free mental wellness programme was launched to help employees cope with changes and loss. Partnering with our employee wellness provider to service employees and their families contributes to a healthier and more vital society. The mental health programme and additional investment in employee health and wellbeing aim to improve employee motivation and productivity.
Sadly, Telkom lost 29 employees to COVID-19 since the start of the pandemic, and we extend our deepest condolences to their families, colleagues and friends.
The Group spent R145 million on employee and non-employee training compared to R199 million in FY2020.
By investing in employee development, we ensure an enabled and empowered workforce that engages at the maximum level of its capabilities. This is evidenced in the variety of diverse yet inclusive development programmes for employed and unemployed individuals. By investing in the employability of individuals, we help them to manage their own careers and support a more robust economy, particularly as “jobs for life” can no longer be considered. The development programmes identified are aligned to the sector skills plan. The decrease in spend was primarily due to the impact of COVID-19. Most programmes are delivered physically in classrooms and could not take place due to the limitation of gatherings and lockdown regulations. The impact of VSPs, VERPs and retrenchments further decreased the number of employees requiring training.
BCX issued a section 189 notice in October 2020 regarding the contemplated retrenchments of about 284 employees. BCX proposed VSPs and VERPs to all permanent employees as an alternative to retrenchment and 270 employees accepted the VSPs and VERPs. A total of 101 employees were retrenched and exited BCX on 31 March 2021.
The Company and the alliance met and concluded the substantive wage negotiations for FY2022. More details are in the FY2021 integrated report.
In a rapidly evolving telecommunications industry, technological transformation is required to continue providing value to customers. Telkom is focused on enabling multiple digital channels leading to new value propositions and revenue streams.
Our governance of technology and information is based on the King Report on Corporate GovernanceTM for South Africa, 2016 (King IV)1, Control Objectives for Information and Related Technology 2019 and ISO/IEC 385002. In complying with these, the board of directors assumes ultimate responsibility for policy and direction over matters pertaining to technology and information. The IT governance structures are integrated with corporate governance to align IT governance objectives with corporate governance ambitions.
The IT policies, standards and risks were revised to align with the changing business and threat landscape as a result of accelerated digital transformation due to remote work.
Telkom seeks to maintain a cybersecurity standard suited to an operation of its scale. The digital enterprise of the future, enabled by a remote workforce, interconnected devices and rapid cloud adoption, presents an evolved and increased cyberattack surface. Attacks are becoming more organised and employ increasingly sophisticated methods that are designed to evade detection for long periods and disable security controls.
In response to the ever-changing threat and technology landscapes, Telkom pursues a risk-based approach to cybersecurity. We continue to improve the maturity of our security programme, in line with regulatory requirements, best practice guidelines and industry benchmarks. Telkom has improved its security posture.
Telkom was awarded ISO/IEC 27001:2013 certification for information security management for the effectiveness and adequacy of our comprehensive information security management system.
COVID-19 triggered the need for a fully digitised workplace within a short space of time. In enabling remote work, our business applications and collaboration platforms were extensively used to migrate interactions to digital channels for customers and employees. Analytics and business intelligence capabilities were enhanced to drive actionable insights. To drive the omni-channel experience we have launched and improved numerous customer-focused initiatives such as mobile apps and digital platforms. These include the e-commerce enablement framework and digital interaction platform, driving the fixed customer experience forward.
The unprecedented need for orchestration, communication and flexible configuration has been the key driver underpinning our efforts to constantly engage, enable and support customers and employees. This was supported by accelerated digitisation and anchored by simplifying business value chains across the complete ecosystem.
1 Copyright and trademarks are owned by the Institute of Directors in South Africa NPC and all of its rights are reserved.2 International Organization for Standardization and International Electrotechnical Commission.
22 Telkom Group Abridged Annual Results 2021 23Overview of our business
These sites had high energy and water consumption in FY2020. The key technical and innovation areas for improved energy savings and sustainability focus were tariff and power optimisation, site heat, ventilation and air conditioning efficiencies, load optimisation, the continuation of solar photovoltaic projects, and water and sanitation reduction.
With reduced travel and approximately 90% of employees working from home during COVID-19, we saw a
decrease in our emissions and energy and water consumption. Our carbon emissions reduced significantly. Our total carbon footprint for the Group will be disclosed in the FY2021 integrated report.
There were no environmental notices of violation or directives issued against Telkom in FY2021. No compliance inspections were conducted by environmental regulators. Compliance with environmental statutes and by-laws is monitored through site inspections, audits and regular reviews of our procedures and operations.
COVID-19 spurred fresh thinking and innovative approaches to respond to the immense pressure it imposed on learners, communities and entrepreneurs.
Telkom’s main focus is on minimising our energy intensity and carbon footprint by improving the energy efficiency of our activities.
By focusing on social and relationship capital, we contribute to national and global development goals, comply with legislation, drive our business strategy, create shared value, promote transformation and maintain our social licence to operate.
FutureMakers is Telkom’s enterprise and supplier development unit, supporting 2 522 enterprises since its launch in 2015. Its purpose is to sustainably contribute to the growth of small, micro and medium enterprises (SMMEs) in the technology sector while contributing towards Telkom’s own innovation and diverse value chain mandate. Diverse supply chain and value chain programmes and innovation are key focus areas.
FutureMakers directly supported 248 enterprises which collectively had just over 5 160 direct and indirect jobs. It
spent R31 million on incubation, connectivity and business support to SMMEs.
FutureMakers launched the Township Inno-vation Incubator in December 2020. 11 social entrepreneurs will be working through a structured innovation methodology to develop solutions to the social challenges they have identified.
We aim to enable a talent pipeline of young people with future skills to fuel Telkom’s business agenda and support
digitalisation of the South African economy.
The total investment into this was R37 million (FY2020: R37 million) and our key programmes are the Explore Data Science Academy and WeThinkCode partnership.
The Telkom Foundation supports young people in performing well in science, technology, English and mathematics (STEM) to enable them to access post-schooling and future economic opportunities.
The Foundation invested R49.8 million, including administration costs, with R29.5 million in education, R10.7 million in digital skills and R4.8 million in social development programmes (FY2020: R75 million).
COVID-19 resulted in a number of learners not being able to continue with learning due to school closures. We migrated the STEM Supplementary Tuition programme online, enabling learners to continue learning.
Over 7 910 learners across the country signed up to our new Lightbulb online education platform. A total of 3 687 learners of the Foundation’s supplementary STEM programme received learning devices and mobile connectivity, making it easier for them to connect and learn remotely. Learners participated in live sessions which were recorded and uploaded on the platform to enable wider access.
Social and relationship capital
Climate change was added as a new material theme in FY2021. The impact of climate change can have a bearing on our direct operations (operational impacts), negatively influencing customer service stemming from acute and chronic weather conditions.
Telkom continues to respond to the CDP (formerly the Carbon Disclosure Project) annually. This participation provides feedback on how well the Group is managing its energy and greenhouse gas emissions inventory to reduce Telkom’s environmental impact within its operational boundary.
Telkom’s score improved from C to B in FY2020, after improving from D to C in FY2019. The B score is higher than the African regional average and the media, telecommunications and data centre services sector average, which have both scored a C. We are busy with the FY2021 submission which we will report on in FY2022. Telkom aims to set science-based emission targets for the first time in FY2022.
To improve energy efficiency, an external energy expert conducted site surveys at selected Telkom office buildings, retail sites, data centres and access network sites.
Natural capital
24 Telkom Group Abridged Annual Results 2021 25Overview of our business
Outlook
Our capital investment over the past five years, has enabled us to successfully evolve the business. With next-generation revenue streams contributing more than 65% of Group revenue and driving growth, we have derisked the business.
2
Operational data
27Operational data
FY2022 - FY2024 guidance*
Revenue (CAGR) Mid to high single digitEBITDA (CAGR) Mid to high single digit Capex per annum R8.0 billion to R8.5 billionNet debt to EBITDA Less or equal to 1.0x
The guidance provided has not been reviewed or reported on by Telkom's auditors.* Excludes corporate actions and spectrum
Medium term guidance
A large portion of our growth is driven by the mobile business which has consistently outperformed expectations in the last five years. We expect the mobile business to continue with its growth trajectory in absolute service revenue terms continuing to be the driver of growth, offsetting the decline in fixed voice which now contributes only 15% of the business. Based on this change in revenue mix, we believe that our Group revenue will grow mid to high single digit over the medium-term guidance period. In the first year of this guidance period we expect to be at the lower end of the range due to the impact of a possible third wave of COVID-19. Our focus on sustainable cost management enabled an improvement in EBITDA while the group transitioned from high margin legacy business to a lower margin next-generation business. Following the structural changes in our cost base in the current year, we expect
our continued focus on a sustainable cost base to drive efficiencies within the business. With the expected revenue growth and further optimisation of certain identified buckets of costs, we believe that Group EBITDA will grow mid to high single digit over the medium-term guidance period. We will continue to invest in our growth areas and expect to spend between R8.0 billion to R8.5 billion a year while continuing to grow our revenue. Discipline in capital allocation will be exercised as we seek to improve returns on capital investment. We will continue to focus on FCF generation and maintain the momentum demonstrated in the past two years. Net debt to EBITDA will be maintained below 1.0x. The board remains committed to the value unlock strategy. Unlocking value from our portfolio of businesses is a key component of our capital allocation framework.
Dividend policy
Following the suspension of the dividend policy for three years from FY2021, management has reviewed its capital allocation framework which seeks to maximise returns on capital investments, maintain a healthy balance sheet and generate strong free cash flow thus growing shareholder value over the long term.
After two years of strong free cash flow generation, management believes that Telkom
is generating sustainable free cash flow and has sufficiently de-risked the balance sheet with adequate capacity to fund its strategic capital investment programme.
Notwithstanding the uncertainty regarding spectrum auction, management believes that Telkom is in a position to reconsider the suspension of the dividend policy. Therefore, the dividend policy will be reviewed, and a new dividend policy will be communicated on release of the FY2022 interim results in November 2021.
26 Telkom Group Abridged Annual Results 2021 27
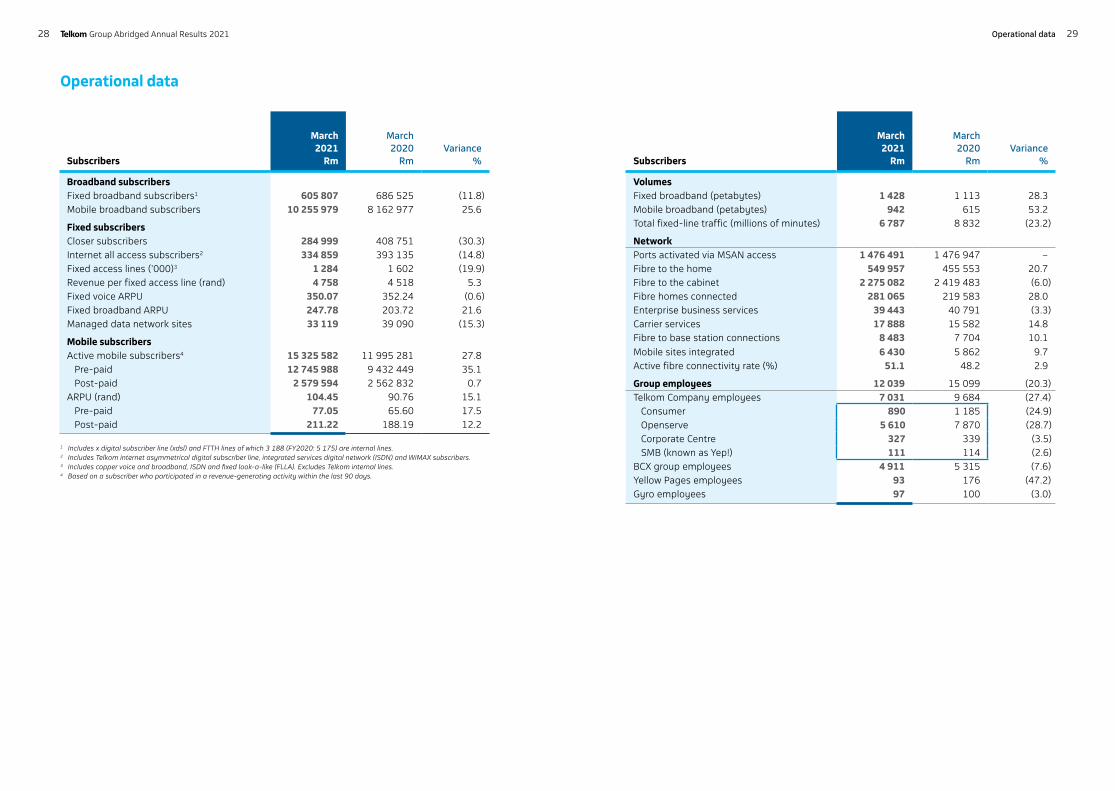
Subscribers
March 2021
Rm
March 2020
Rm
Variance
%
VolumesFixed broadband (petabytes) 1 428 1 113 28.3 Mobile broadband (petabytes) 942 615 53.2 Total fixed-line traffic (millions of minutes) 6 787 8 832 (23.2)
NetworkPorts activated via MSAN access 1 476 491 1 476 947 –Fibre to the home 549 957 455 553 20.7 Fibre to the cabinet 2 275 082 2 419 483 (6.0)Fibre homes connected 281 065 219 583 28.0Enterprise business services 39 443 40 791 (3.3)Carrier services 17 888 15 582 14.8 Fibre to base station connections 8 483 7 704 10.1Mobile sites integrated 6 430 5 862 9.7 Active fibre connectivity rate (%) 51.1 48.2 2.9
Group employees 12 039 15 099 (20.3)Telkom Company employees 7 031 9 684 (27.4)
Consumer 890 1 185 (24.9)Openserve 5 610 7 870 (28.7)Corporate Centre 327 339 (3.5)SMB (known as Yep!) 111 114 (2.6)
BCX group employees 4 911 5 315 (7.6)Yellow Pages employees 93 176 (47.2)Gyro employees 97 100 (3.0)
Subscribers
March 2021
Rm
March 2020
RmVariance
%
Broadband subscribersFixed broadband subscribers1 605 807 686 525 (11.8)Mobile broadband subscribers 10 255 979 8 162 977 25.6
Fixed subscribersCloser subscribers 284 999 408 751 (30.3)Internet all access subscribers2 334 859 393 135 (14.8)Fixed access lines (’000)3 1 284 1 602 (19.9)Revenue per fixed access line (rand) 4 758 4 518 5.3 Fixed voice ARPU 350.07 352.24 (0.6)Fixed broadband ARPU 247.78 203.72 21.6 Managed data network sites 33 119 39 090 (15.3)
Mobile subscribers Active mobile subscribers4 15 325 582 11 995 281 27.8
Pre-paid 12 745 988 9 432 449 35.1 Post-paid 2 579 594 2 562 832 0.7
ARPU (rand) 104.45 90.76 15.1 Pre-paid 77.05 65.60 17.5 Post-paid 211.22 188.19 12.2
Operational data
1 Includes x digital subscriber line (xdsl) and FTTH lines of which 3 188 (FY2020: 5 175) are internal lines.2 Includes Telkom internet asymmetrical digital subscriber line, integrated services digital network (ISDN) and WiMAX subscribers. 3 Includes copper voice and broadband, ISDN and fixed look-a-like (FLLA). Excludes Telkom internal lines.4 Based on a subscriber who participated in a revenue-generating activity within the last 90 days.
28 29Telkom Group Abridged Annual Results 2021 Operational data

3
Financialperformance
30 Telkom Group Abridged Annual Results 2021 31Financial performance
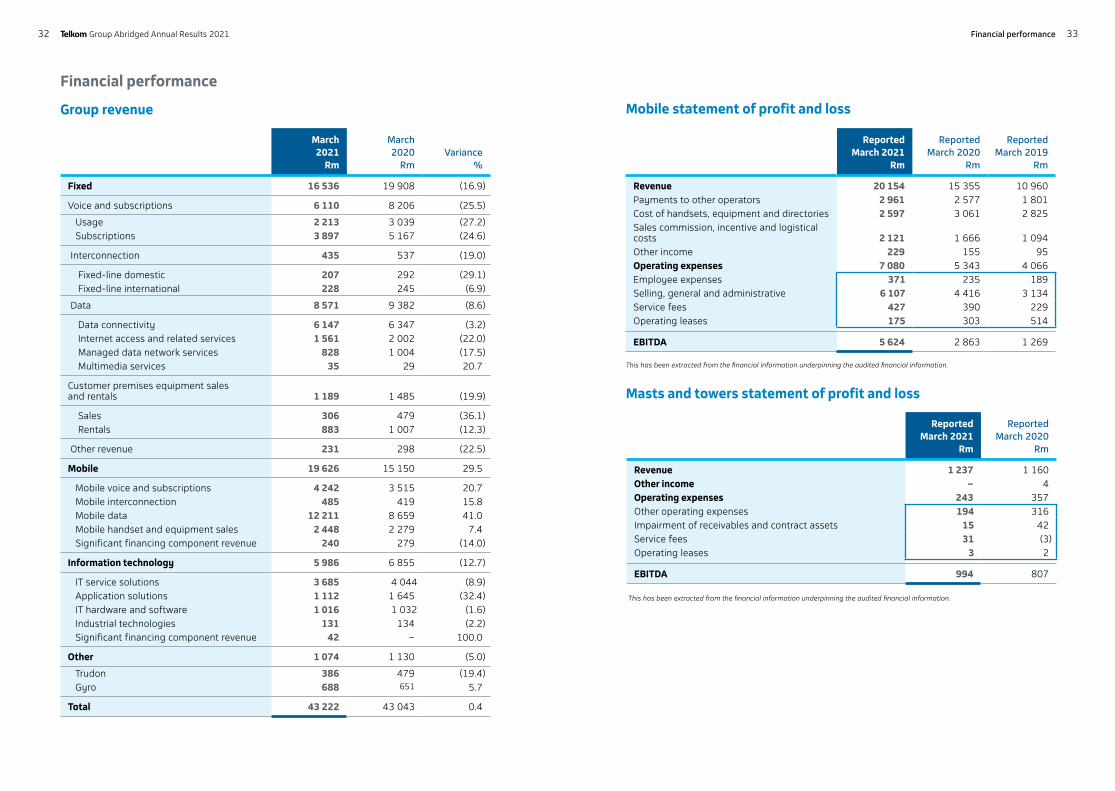
ReportedMarch 2021
Rm
ReportedMarch 2020
Rm
Revenue 1 237 1 160 Other income – 4 Operating expenses 243 357 Other operating expenses 194 316 Impairment of receivables and contract assets 15 42 Service fees 31 (3) Operating leases 3 2
EBITDA 994 807
This has been extracted from the financial information underpinning the audited financial information.
Reported March 2021
Rm
ReportedMarch 2020
Rm
ReportedMarch 2019
Rm
Revenue 20 154 15 355 10 960 Payments to other operators 2 961 2 577 1 801 Cost of handsets, equipment and directories 2 597 3 061 2 825 Sales commission, incentive and logistical costs 2 121 1 666 1 094 Other income 229 155 95 Operating expenses 7 080 5 343 4 066 Employee expenses 371 235 189 Selling, general and administrative 6 107 4 416 3 134 Service fees 427 390 229 Operating leases 175 303 514
EBITDA 5 624 2 863 1 269
This has been extracted from the financial information underpinning the audited financial information.
March 2021
Rm
March2020
RmVariance
%
Fixed 16 536 19 908 (16.9)
Voice and subscriptions 6 110 8 206 (25.5)
Usage 2 213 3 039 (27.2)Subscriptions 3 897 5 167 (24.6)
Interconnection 435 537 (19.0)
Fixed-line domestic 207 292 (29.1) Fixed-line international 228 245 (6.9)
Data 8 571 9 382 (8.6)
Data connectivity 6 147 6 347 (3.2) Internet access and related services 1 561 2 002 (22.0) Managed data network services 828 1 004 (17.5) Multimedia services 35 29 20.7
Customer premises equipment sales and rentals 1 189 1 485 (19.9)
Sales 306 479 (36.1) Rentals 883 1 007 (12.3)
Other revenue 231 298 (22.5)
Mobile 19 626 15 150 29.5
Mobile voice and subscriptions 4 242 3 515 20.7 Mobile interconnection 485 419 15.8Mobile data 12 211 8 659 41.0 Mobile handset and equipment sales 2 448 2 279 7.4 Significant financing component revenue 240 279 (14.0)
Information technology 5 986 6 855 (12.7)
IT service solutions 3 685 4 044 (8.9)Application solutions 1 112 1 645 (32.4)IT hardware and software 1 016 1 032 (1.6)Industrial technologies 131 134 (2.2)Significant financing component revenue 42 – 100.0
Other 1 074 1 130 (5.0)
Trudon 386 479 (19.4)Gyro 688 651 5.7
Total 43 222 43 043 0.4
Financial performance
Group revenue Mobile statement of profit and loss
Masts and towers statement of profit and loss
32 33Financial performanceTelkom Group Abridged Annual Results 2021
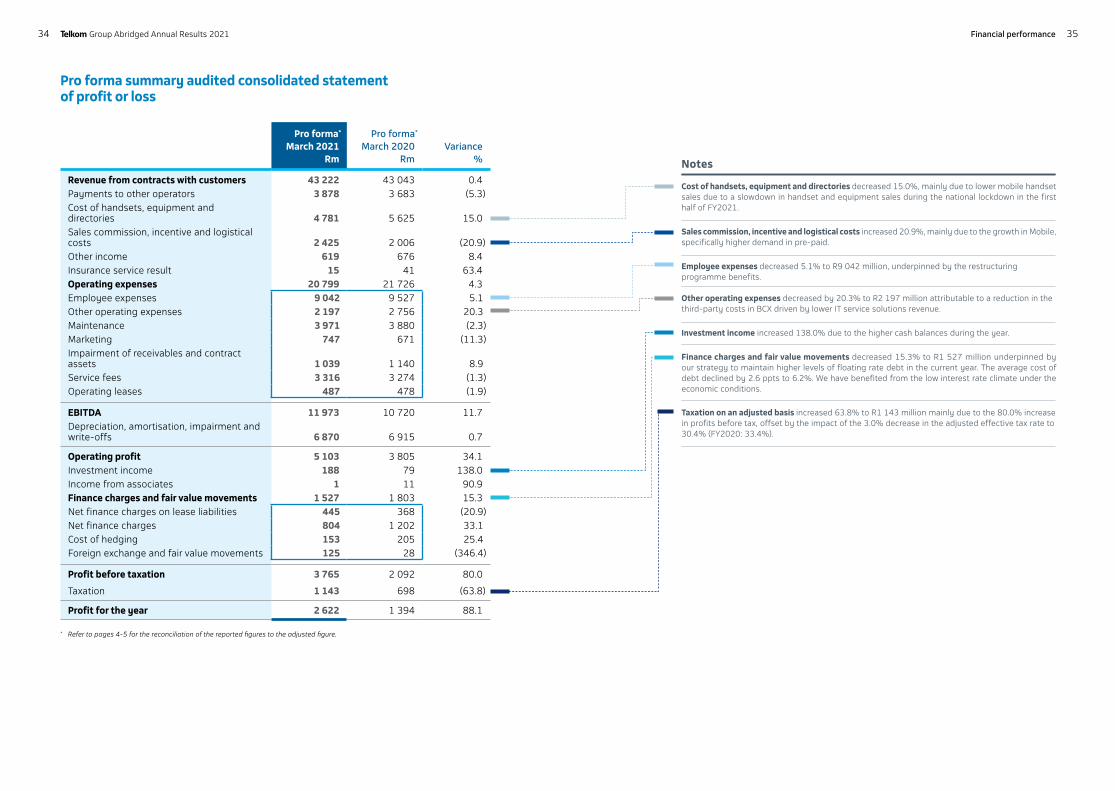
Pro forma summary audited consolidated statement of profit or loss
Pro forma*
March 2021Rm
Pro forma*
March 2020Rm
Variance%
Revenue from contracts with customers 43 222 43 043 0.4 Payments to other operators 3 878 3 683 (5.3)Cost of handsets, equipment and directories 4 781 5 625 15.0 Sales commission, incentive and logistical costs 2 425 2 006 (20.9)Other income 619 676 8.4 Insurance service result 15 41 63.4 Operating expenses 20 799 21 726 4.3 Employee expenses 9 042 9 527 5.1 Other operating expenses 2 197 2 756 20.3 Maintenance 3 971 3 880 (2.3)Marketing 747 671 (11.3)Impairment of receivables and contract assets 1 039 1 140 8.9 Service fees 3 316 3 274 (1.3)Operating leases 487 478 (1.9)
EBITDA 11 973 10 720 11.7Depreciation, amortisation, impairment and write-offs 6 870 6 915 0.7
Operating profit 5 103 3 805 34.1Investment income 188 79 138.0Income from associates 1 11 90.9 Finance charges and fair value movements 1 527 1 803 15.3 Net finance charges on lease liabilities 445 368 (20.9)Net finance charges 804 1 202 33.1Cost of hedging 153 205 25.4Foreign exchange and fair value movements 125 28 (346.4)
Profit before taxation 3 765 2 092 80.0
Taxation 1 143 698 (63.8)
Profit for the year 2 622 1 394 88.1
Cost of handsets, equipment and directories decreased 15.0%, mainly due to lower mobile handset sales due to a slowdown in handset and equipment sales during the national lockdown in the first half of FY2021.
Sales commission, incentive and logistical costs increased 20.9%, mainly due to the growth in Mobile, specifically higher demand in pre-paid.
Employee expenses decreased 5.1% to R9 042 million, underpinned by the restructuring programme benefits.
Other operating expenses decreased by 20.3% to R2 197 million attributable to a reduction in the third-party costs in BCX driven by lower IT service solutions revenue.
Investment income increased 138.0% due to the higher cash balances during the year.
Finance charges and fair value movements decreased 15.3% to R1 527 million underpinned by our strategy to maintain higher levels of floating rate debt in the current year. The average cost of debt declined by 2.6 ppts to 6.2%. We have benefited from the low interest rate climate under the economic conditions.
Taxation on an adjusted basis increased 63.8% to R1 143 million mainly due to the 80.0% increase in profits before tax, offset by the impact of the 3.0% decrease in the adjusted effective tax rate to 30.4% (FY2020: 33.4%).
Notes
* Refer to pages 4-5 for the reconciliation of the reported figures to the adjusted figure.
34 35Financial performanceTelkom Group Abridged Annual Results 2021
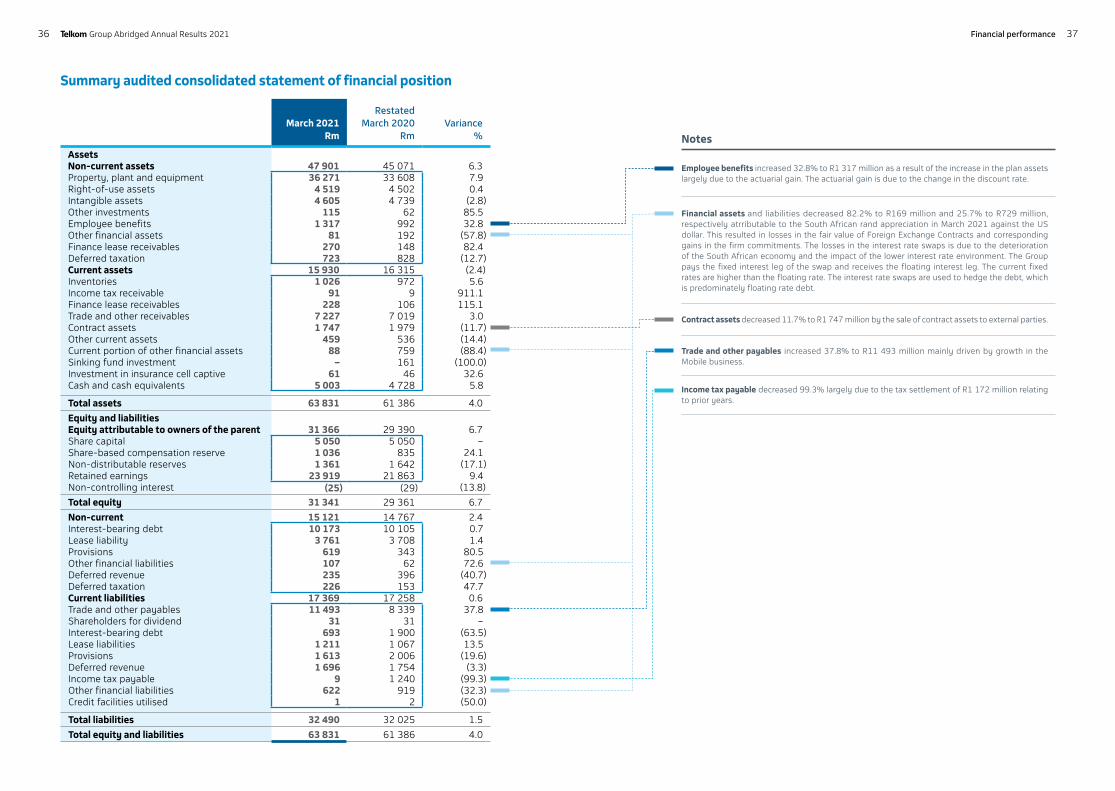
March 2021Rm
Restated March 2020
RmVariance
%
Assets Non-current assets 47 901 45 071 6.3 Property, plant and equipment 36 271 33 608 7.9 Right-of-use assets 4 519 4 502 0.4 Intangible assets 4 605 4 739 (2.8)Other investments 115 62 85.5 Employee benefits 1 317 992 32.8 Other financial assets 81 192 (57.8)Finance lease receivables 270 148 82.4 Deferred taxation 723 828 (12.7)Current assets 15 930 16 315 (2.4)Inventories 1 026 972 5.6 Income tax receivable 91 9 911.1 Finance lease receivables 228 106 115.1 Trade and other receivables 7 227 7 019 3.0Contract assets 1 747 1 979 (11.7)Other current assets 459 536 (14.4)Current portion of other financial assets 88 759 (88.4)Sinking fund investment – 161 (100.0)Investment in insurance cell captive 61 46 32.6Cash and cash equivalents 5 003 4 728 5.8
Total assets 63 831 61 386 4.0
Equity and liabilities Equity attributable to owners of the parent 31 366 29 390 6.7 Share capital 5 050 5 050 – Share-based compensation reserve 1 036 835 24.1 Non-distributable reserves 1 361 1 642 (17.1)Retained earnings 23 919 21 863 9.4 Non-controlling interest (25) (29) (13.8)
Total equity 31 341 29 361 6.7
Non-current 15 121 14 767 2.4 Interest-bearing debt 10 173 10 105 0.7 Lease liability 3 761 3 708 1.4 Provisions 619 343 80.5 Other financial liabilities 107 62 72.6 Deferred revenue 235 396 (40.7)Deferred taxation 226 153 47.7 Current liabilities 17 369 17 258 0.6Trade and other payables 11 493 8 339 37.8 Shareholders for dividend 31 31 – Interest-bearing debt 693 1 900 (63.5)Lease liabilities 1 211 1 067 13.5 Provisions 1 613 2 006 (19.6)Deferred revenue 1 696 1 754 (3.3)Income tax payable 9 1 240 (99.3)Other financial liabilities 622 919 (32.3)Credit facilities utilised 1 2 (50.0)
Total liabilities 32 490 32 025 1.5
Total equity and liabilities 63 831 61 386 4.0
Employee benefits increased 32.8% to R1 317 million as a result of the increase in the plan assets largely due to the actuarial gain. The actuarial gain is due to the change in the discount rate.
Financial assets and liabilities decreased 82.2% to R169 million and 25.7% to R729 million, respectively atrributable to the South African rand appreciation in March 2021 against the US dollar. This resulted in losses in the fair value of Foreign Exchange Contracts and corresponding gains in the firm commitments. The losses in the interest rate swaps is due to the deterioration of the South African economy and the impact of the lower interest rate environment. The Group pays the fixed interest leg of the swap and receives the floating interest leg. The current fixed rates are higher than the floating rate. The interest rate swaps are used to hedge the debt, which is predominately floating rate debt.
Contract assets decreased 11.7% to R1 747 million by the sale of contract assets to external parties.
Trade and other payables increased 37.8% to R11 493 million mainly driven by growth in the Mobile business.
Income tax payable decreased 99.3% largely due to the tax settlement of R1 172 million relating to prior years.
Notes
Summary audited consolidated statement of financial position
36 37Financial performanceTelkom Group Abridged Annual Results 2021
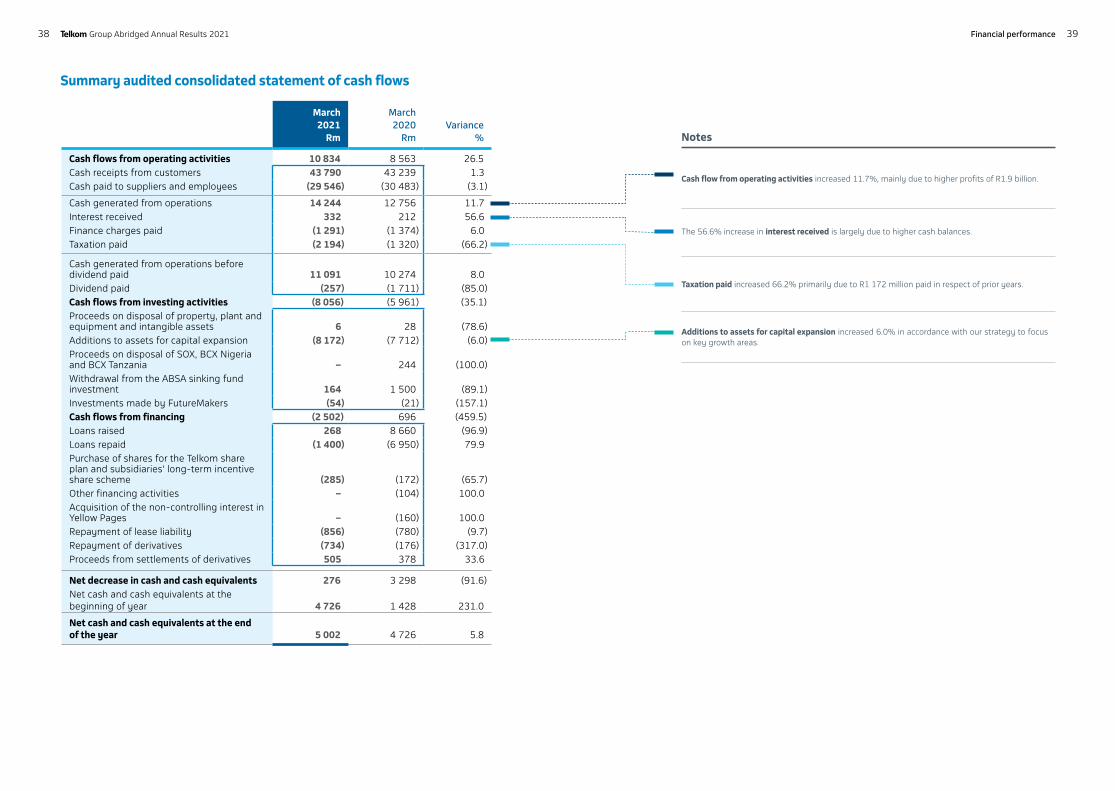
Cash flow from operating activities increased 11.7%, mainly due to higher profits of R1.9 billion.
The 56.6% increase in interest received is largely due to higher cash balances.
Taxation paid increased 66.2% primarily due to R1 172 million paid in respect of prior years.
Additions to assets for capital expansion increased 6.0% in accordance with our strategy to focus on key growth areas.
Notes
March2021
Rm
March 2020
RmVariance
%
Cash flows from operating activities 10 834 8 563 26.5Cash receipts from customers 43 790 43 239 1.3 Cash paid to suppliers and employees (29 546) (30 483) (3.1)
Cash generated from operations 14 244 12 756 11.7Interest received 332 212 56.6 Finance charges paid (1 291) (1 374) 6.0 Taxation paid (2 194) (1 320) (66.2)
Cash generated from operations before dividend paid 11 091 10 274 8.0Dividend paid (257) (1 711) (85.0)Cash flows from investing activities (8 056) (5 961) (35.1)Proceeds on disposal of property, plant and equipment and intangible assets 6 28 (78.6) Additions to assets for capital expansion (8 172) (7 712) (6.0)Proceeds on disposal of SOX, BCX Nigeria and BCX Tanzania – 244 (100.0)Withdrawal from the ABSA sinking fund investment 164 1 500 (89.1)Investments made by FutureMakers (54) (21) (157.1)Cash flows from financing (2 502) 696 (459.5)Loans raised 268 8 660 (96.9)Loans repaid (1 400) (6 950) 79.9 Purchase of shares for the Telkom share plan and subsidiaries' long-term incentive share scheme (285) (172) (65.7)Other financing activities – (104) 100.0Acquisition of the non-controlling interest in Yellow Pages – (160) 100.0Repayment of lease liability (856) (780) (9.7)Repayment of derivatives (734) (176) (317.0)Proceeds from settlements of derivatives 505 378 33.6
Net decrease in cash and cash equivalents 276 3 298 (91.6)Net cash and cash equivalents at the beginning of year 4 726 1 428 231.0
Net cash and cash equivalents at the end of the year 5 002 4 726 5.8
Summary audited consolidated statement of cash flows
38 39Financial performanceTelkom Group Abridged Annual Results 2021
Board approval
These consolidated abridged financial statements for the year ended 31 March 2021 were authorised for issue on 21 May 2021 by the Telkom SA SOC Ltd board of directors and published on 24 May 2021.
Directors’ responsibility and audit report
The directors of the Company take full responsibility for the preparation of the consolidated abridged financial statements for the year ended 31 March 2021. The consolidated abridged financial statements for the year ended 31 March 2021 have been audited by our independent joint auditors PricewaterhouseCoopers Inc. and SizweNtsalubaGobodo Grant Thornton Inc.
Preparer and supervisor of the consolidated abridged financial statements
These consolidated abridged financial statements for the year ended 31 March 2021 were prepared by the Telkom finance staff under the supervision of the Group Chief Financial Officer, Dirk Reyneke CA(SA).
Independent auditors' report on the summary consolidated financial statements 42
Consolidated summary statement of profit or loss and other comprehensive income 44
Consolidated summary statement of financial position 46
Consolidated summary statement of changes in equity 48
Consolidated summary statement of cash flows 49
Notes to the consolidated summary financial statements 50
1. Independent audit 50
2. Corporate information 50
3. Basis of preparation, significant accounting judgements, estimates, assumptions and significant accounting policies
50
4. Segment information 58
5. Expenses 65
6. Earnings and dividend per share 66
7. Capital additions and disposals 68
8. Right-of-use assets and lease liabilities 68
9. Other financial assets and liabilities 70
10. Employee benefits 71
11. Inventories 72
12. Net cash and cash equivalents 72
13. Taxation and deferred taxation 72
14. Fair value measurement 74
15. Interest-bearing debt 76
16. Provisions 77
17. Commitments 78
18. Trade and other receivables and contract assets 78
19. Other current assets 81
20. Contingencies 81
21. Impairment of goodwill 82
22. Related parties 85
23. Reconciliation of profit before tax to cash generated from operations 87
24. Net debt reconciliation 88
25. Significant events and transactions 88
26. Events after the reporting date 89
4
Telkom audited consolidated abridgedfinancial statementsfor the year ended 31 March 2021
4140 Telkom Group Abridged Annual Results 2021 Consolidated abridged annual financial statements
To the Shareholders of Telkom SA SOC Limited
Opinion
The summary consolidated financial statements of Telkom SA SOC Limited, contained in the accompanying abridged report, which comprise the summary consolidated statement of financial position as at 31 March 2021, the summary consolidated statements of profit or loss and other comprehensive income, changes in equity and cash flows for the year then ended, and related notes, are derived from the audited consolidated financial statements of Telkom SA SOC Limited, for the year ended 31 March 2021.
In our opinion, the accompanying summary consolidated financial statements are consistent, in all material respects, with the audited consolidated financial statements, in accordance with the requirements of the JSE Limited Listings Requirements for abridged reports, as set out in note 3.1 to the summary consolidated financial statements, and the requirements of the Companies Act of South Africa as applicable to summary financial statements.
Director’s Responsibility for the Summary Consolidated Financial Statements
The directors are responsible for the preparation of the summary consolidated financial statements in accordance with the requirements of the JSE Limited Listings Requirements for abridged reports, set out in note 3.1 to the summary consolidated financial statements, and the requirements of the Companies Act of South Africa as applicable to summary financial statements.
SizweNtsalubaGobodo Grant Thornton Inc.Director: GM HafizRegistered Auditor Johannesburg
21 May 2021
Independent auditors’ report on the summary consolidated financial statements
Auditor’s Responsibility
Our responsibility is to express an opinion on whether the summary consolidated financial statements are consistent, in all material respects, with the audited consolidated financial statements based on our procedures, which were conducted in accordance with International Standard on Auditing (ISA) 810 (Revised), Engagements to Report on Summary Financial Statements.
PricewaterhouseCoopers Inc. Director: KJ DikanaRegistered AuditorJohannesburg
21 May 2021
PricewaterhouseCoopers Inc., 4 Lisbon Lane, Waterfall City, Jukskei View, 2090 Private Bag X36, Sunninghill, 2157, South Africa
T: +27 (0) 11 797 4000, F: +27 (0) 11 209 5800, www.pwc.co.za
Chief Executive Officer: L S Machaba
The Company’s principal place of business is at 4 Lisbon Lane, Waterfall City, Jukskei View, where a list of directors’ names is available for inspection.
Reg. no. 1998/012055/21 VAT reg.no. 4950174682
SizweNtsalubaGobodo Grant Thornton Inc, 20 Morris Street East, Woodmead, 2191 P.O. Box 2939, Saxonwold, 2132,
T: +27 (0) 11 231 0600
SizweNtsalubaGobodo Grant Thornton Inc are a member firm of Grant Thornton International Ltd (GTIL). GTIL and the member firms are not a worldwide partnership. Services are delivered independently by the member firms. GTIL and its member firms are not agents of, and do not obligate, one another and are not liable for one another’s acts or omissions.
SizweNtsalubaGobodo Grant Thornton Incorporated Registration Number: 2005/034639/21
Victor Sekese [Chief Executive]
A comprehensive list of all Directors is available at the company offices or registered office.
Summary Consolidated Financial Statements
The summary consolidated financial statements do not contain all the disclosures required by International Financial Reporting Standards and the requirements of the Companies Act of South Africa as applicable to annual financial statements. Reading the summary consolidated financial statements and the auditor’s report thereon, therefore, is not a substitute for reading the audited consolidated financial statements and the auditor’s report thereon.
The Audited Consolidated Financial Statements and Our Report Thereon
We expressed an unmodified audit opinion on the audited consolidated financial statements in our report dated 21 May 2021. That report also includes communication of key audit matters. Key audit matters are those matters that, in our professional judgement, were of most significance in our audit of the consolidated financial statements of the current period.
The examination of controls over the maintenance and integrity of the Group's website is beyond the scope of the audit of the financial statements. Accordingly, we accept no responsibility for any changes that may have occurred to the financial statements since they were initially presented on the website.
4342 Telkom Group Abridged Annual Results 2021 Consolidated abridged annual financial statements
Consolidated summary statement of profit or loss and other comprehensive incomefor the year ended 31 March 2021
Notes
31 March2021
Rm
Restated 31 March1
2020Rm
Revenue 4 43 222 43 043 Operating revenue 42 939 42 764 Interest revenue 283 279
Other income 619 676 Insurance service result 15 41 Payments to other operators 5.1 (3 878) (3 683)Cost of handsets, equipment, software and directories 5.2 (4 781) (5 625)Sales commission, incentives and logistical costs 5.3 (2 425) (2 006)Employee expenses 5.4 (9 312) (10 713)Other expenses 5.5 (2 197) (2 756)Maintenance 5.6 (3 971) (3 880)Marketing (747) (671)Impairment of receivables and contract assets 18 (1 039) (1 140)Service fees 5.7 (3 316) (3 274)Lease-related expenses (487) (478)
EBITDA 11 703 9 534 Depreciation of property, plant and equipment (4 918) (4 868)Depreciation of right-of-use assets (947) (954)Amortisation of intangible assets (805) (679)Write-offs, impairments and losses of property, plant and equipment and intangible assets (200) (414)
Operating profit 4 833 2 619 Investment income 188 79 Income from associates 1 11 Net finance charges, hedging costs and fair value movements (1 527) (1 803)
Finance charges on lease liabilities (445) (368)Net finance charges – other (804) (1 202)Cost of hedging (153) (205)Foreign exchange and fair value movements (125) (28)
Profit before taxation 3 495 906 Taxation 13.1 (1 067) (366)
Profit for the year 2 428 540
Notes
31 March2021
Rm
Restated 31 March1
2020Rm
Other comprehensive incomeItems that will be reclassified subsequently to profit or lossExchange (losses)/gains on translating foreign operations2 (25) 65 Items that will not be reclassified to profit or lossDefined benefit plan actuarial (losses)/gains 10 (69) 1 080 Income tax relating to other comprehensive income 13.2 19 (302)
Other comprehensive income for the year, net of taxation (75) 843
Total comprehensive income for the year 2 353 1 383
Profit attributable to:Owners of Telkom 2 422 535 Non-controlling interests 6 5
Profit for the year 2 428 540
Total comprehensive income attributable to:Owners of Telkom 2 347 1 378 Non-controlling interests 6 5
Total comprehensive income for the year 2 353 1 383
Basic earnings per share (cents) 6 489.9 107.5 Diluted earnings per share (cents) 6 484.0 106.0
1 Restated. Refer to notes 3.3.1.1 and 3.5.2 This component of other comprehensive income does not attract any tax.
4544 Telkom Group Abridged Annual Results 2021 Consolidated abridged annual financial statements
Consolidated summary statement of financial positionat 31 March 2021
Notes
31 March 2021
Rm
Restated 31 March1
2020 Rm
Restated 1 April1
2019 Rm
AssetsNon-current assets 47 901 45 071 37 961 Property, plant and equipment 36 271 33 608 32 035 Right-of-use assets 8 4 519 4 502 – Intangible assets 4 605 4 739 4 521 Other investments 115 62 78 Employee benefits 10 1 317 992 729 Other financial assets 9 81 192 133 Finance lease receivables 270 148 210 Deferred taxation 13.2 723 828 255 Current assets 15 930 16 315 14 783 Inventories 11 1 026 972 1 267 Income tax receivable 91 9 76 Finance lease receivables 228 106 108 Trade and other receivables 18.1 7 227 7 019 7 425 Contract assets 18.2 1 747 1 979 2 161 Other current assets 19 459 536 357 Other financial assets 9 88 759 388 Absa sinking fund investment 14.2 – 161 1 573 Investment in insurance cell captive 61 46 – Cash and cash equivalents 12 5 003 4 728 1 428 Assets classified as held for sale – – 200
Total assets 63 831 61 386 52 944
Notes
31 March 2021
Rm
Restated 31 March1
2020 Rm
Restated 1 April1
2019 Rm
Equity and liabilitiesEquity attributable to owners of the parent 31 366 29 390 29 527 Share capital 5 050 5 050 5 050 Share-based compensation reserve 1 036 835 512 Non-distributable reserves 1 361 1 642 1 621 Retained earnings 23 919 21 863 22 344 Non-controlling interests (25) (29) 195
Total equity 31 341 29 361 29 722
Non-current liabilities 15 121 14 767 6 740 Interest-bearing debt 15 10 173 10 105 4 840 Lease liabilities 8 3 761 3 708 – Provisions 16 619 343 1 193 Other financial liabilities 9 107 62 79 Deferred revenue 235 396 466 Deferred taxation 13.2 226 153 162 Current liabilities 17 369 17 258 16 482 Trade and other payables2 11 493 8 339 6 536 Shareholders for dividend 31 31 29 Interest-bearing debt 15 693 1 900 5 401 Lease liabilities 8 1 211 1 067 – Provisions 16 1 613 2 006 1 362 Deferred revenue 1 696 1 754 1 396 Income tax payable 13.3 9 1 240 1 335 Other financial liabilities 9 622 919 423 Credit facilities utilised 12 1 2 –
Total liabilities 32 490 32 025 23 222
Total equity and liabilities 63 831 61 386 52 944
1 Restated. Refer to notes 3.3.1.1 and 3.6.2 Trade and other payables increased mainly driven by the growth in the Mobile business.
4746 Telkom Group Abridged Annual Results 2021 Consolidated abridged annual financial statements
31 March2021
Rm
Restated31 March*
2020Rm
Balance at 1 April (as previously reported) 29 475 29 768 Attributable to owners of Telkom 29 504 29 573 Non-controlling interests (29) 195 Restatement of third party service costs* (114) (46)
Restated balance at 1 April 29 361 29 722 Correction of prior period error in the current year* (44) –Total comprehensive income for the year 2 353 1 383 Profit for the year 2 428 540 Other comprehensive income (75) 843 Exchange (losses)/gains on translating foreign operations (25) 65 Net defined benefit plan remeasurements (50) 778 Dividend declared (256) (1 713)Disposal of subsidiary – (9)Acquisition of non-controlling interest – (160)Increase in share-based compensation reserve 203 323 Escrow shares realised for settlement to employees 12 (14)Increase in treasury shares (288) (159)Increase in treasury shares from Yellow Pages – (12)
Balance at the end of the year 31 341 29 361 Attributable to owners of Telkom 31 366 29 390 Non-controlling interests (25) (29)
* Refer to note 3.3.1.1.
Consolidated summary statement of changes in equityfor the year ended 31 March 2021
Consolidated summary statement of cash flowsfor the year ended 31 March 2021
Notes
31 March2021
Rm
31 March2020
Rm
Cash flows from operating activities 10 834 8 563 Cash receipts from customers 43 790 43 239 Cash paid to suppliers and employees (29 546) (30 483)Cash generated from operations 23 14 244 12 756 Interest received 332 212 Finance charges paid (1 291) (1 374)Taxation paid (2 194) (1 320)Cash generated from operations before dividend paid 11 091 10 274 Dividend paid (257) (1 711)
Cash flows utilised for investing activities (8 056) (5 961)Proceeds on disposal of property, plant and equipment and intangible assets 6 28 Additions to assets for capital expansion (8 172) (7 712)Proceeds on disposal of SOX, BCX Nigeria and BCX Tanzania – 244 Investments made by FutureMakers (54) (21)Withdrawal from the Absa sinking fund investment 164 1 500
Cash flows from financing activities (2 502) 696 Loans raised 15 268 8 660 Loans repaid 15 (1 400) (6 950)Other financing activities – (104)Purchase of shares for the Telkom and subsidiaries long-term incentive share scheme (285) (172)Acquisition of non-controlling interest in Yellow Pages – (160)Repayment of lease liability (856) (780)Repayment of derivatives (734) (176)Proceeds from derivatives 505 378
Net increase in cash and cash equivalents 276 3 298 Net cash and cash equivalents at 1 April 4 726 1 428
Net cash and cash equivalents at the end of the year 12 5 002 4 726
4948 Telkom Group Abridged Annual Results 2021 Consolidated abridged annual financial statements
Notes to the consolidated summary financial statements for the year ended 31 March 2021
1. Independent audit
The consolidated summary financial statements have been derived from the audited Group financial statements. The directors of the Company take full responsibility for the preparation of the summary consolidated financial statements and that the financial information has been correctly derived and is consistent in all material respects with the underlying audited Group financial statements. The consolidated summary financial statements for the year ended 31 March 2021 have been audited by our joint auditors PricewaterhouseCoopers Inc. and SizweNtsalubaGobodo Grant Thornton Inc., who have expressed an unmodified opinion thereon. The auditors also expressed an unmodified opinion on the Group financial statements from which the consolidated summary financial statements were derived. A copy of the auditors’ report on the Group financial statements is available for inspection on the Telkom website, together with the financial statements identified in the auditors’ report.
2. Corporate information
Telkom SA SOC Ltd (Telkom), the ultimate parent of the Group, is a company incorporated and domiciled in the Republic of South Africa (South Africa) whose shares are publicly traded on the Johannesburg Stock Exchange (JSE). The main objective of the Group is to supply telecommunication, multimedia, technology, information, mobile communication services and other related information technology services to the Group's customers in Africa. Turnkey property and tower management solutions are also provided through the Gyro Group, which is a wholly owned subsidiary of the Group.
3. Basis of preparation, significant accounting judgements, estimates, assumptions and significant accounting policies
3.1 Basis of preparation
The consolidated summary financial statements have been prepared in accordance with International Financial Reporting Standards (IFRS), IAS 34 (Interim Financial Reporting) and in compliance with the JSE Listings Requirements, the Companies Act, 71 of 2008 (the Companies Act), the SAICA Financial Reporting Guide as issued by the Accounting Practices Committee and the Financial Pronouncements as issued by the Financial Reporting Standards Council. The consolidated summary financial statements have been prepared on the going concern basis. The consolidated summary financial statements are prepared in South African rand, which is also the parent company’s presentation and functional currency. Unless stated otherwise, all financial information presented in rand has been rounded off to the nearest million. The consolidated summary financial statements are prepared on the historical cost basis, with the exception of certain financial instruments subsequently measured at fair value. Details of the Group's significant accounting policies are consistent with those applied in the previous financial year except for those listed below.
3.2 Significant accounting judgements, estimates and assumptions
In preparing these consolidated summary financial statements, the significant judgements made by management in applying the Group's accounting policies and the key sources of estimation uncertainty were consistent with those applied to the consolidated annual financial statements for the year ended 31 March 2020, with the exception of the judgements and estimates related to the assessment of COVID-19 (refer to note 3.2.1) and useful lives of property, plant and equipment (refer to note 3.2.2).
3.2.1 The assessment of COVID-19 as part of accounting judgements and sources of estimation uncertainty
COVID-19, the global pandemic which started in FY 2020, has continued to dramatically increase the risks collectively faced as a global community and has materially damaged the global and local economic prospects. While Telkom continues to drive the execution of its strategic objectives, the Group considers the impact of the situation as it unfolds and prudently manages its human capital and operational and financial risks.
Management has considered the impact on the Group by taking a variety of risk elements into account, which include considering macro-economic factors, contractual obligations and supply chain impacts.
Management has considered all the possible financial effects the virus could have on the measurement, presentation and disclosure in the annual financial statements. Key areas are considered in the table on the following pages:
5150 Telkom Group Abridged Annual Results 2021 Consolidated abridged annual financial statements
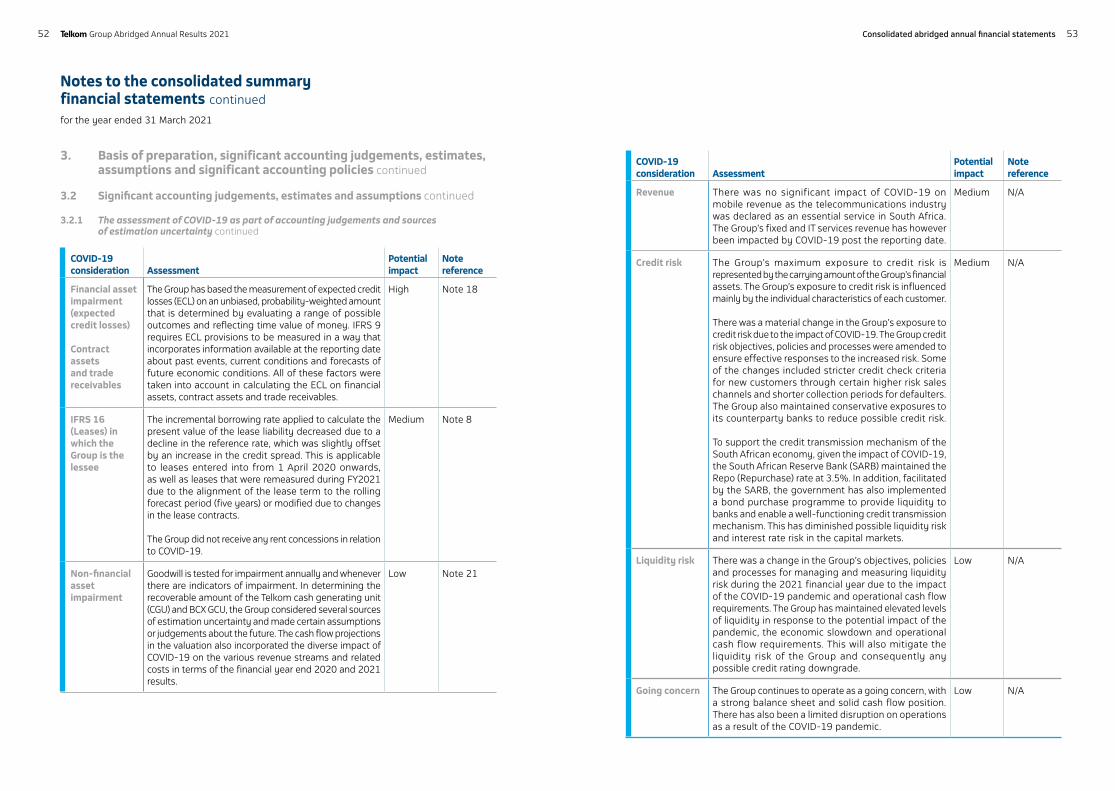
3. Basis of preparation, significant accounting judgements, estimates, assumptions and significant accounting policies continued
3.2 Significant accounting judgements, estimates and assumptions continued
3.2.1 The assessment of COVID-19 as part of accounting judgements and sources of estimation uncertainty continued
Notes to the consolidated summary financial statements continued
for the year ended 31 March 2021
COVID-19 consideration Assessment
Potential impact
Note reference
Financial asset impairment (expected credit losses)
Contract assets and trade receivables
The Group has based the measurement of expected credit losses (ECL) on an unbiased, probability-weighted amount that is determined by evaluating a range of possible outcomes and reflecting time value of money. IFRS 9 requires ECL provisions to be measured in a way that incorporates information available at the reporting date about past events, current conditions and forecasts of future economic conditions. All of these factors were taken into account in calculating the ECL on financial assets, contract assets and trade receivables.
High Note 18
IFRS 16 (Leases) in which the Group is the lessee
The incremental borrowing rate applied to calculate the present value of the lease liability decreased due to a decline in the reference rate, which was slightly offset by an increase in the credit spread. This is applicable to leases entered into from 1 April 2020 onwards, as well as leases that were remeasured during FY2021 due to the alignment of the lease term to the rolling forecast period (five years) or modified due to changes in the lease contracts.
The Group did not receive any rent concessions in relation to COVID-19.
Medium Note 8
Non-financial asset impairment
Goodwill is tested for impairment annually and whenever there are indicators of impairment. In determining the recoverable amount of the Telkom cash generating unit (CGU) and BCX GCU, the Group considered several sources of estimation uncertainty and made certain assumptions or judgements about the future. The cash flow projections in the valuation also incorporated the diverse impact of COVID-19 on the various revenue streams and related costs in terms of the financial year end 2020 and 2021 results.
Low Note 21
COVID-19 consideration Assessment
Potential impact
Note reference
Revenue There was no significant impact of COVID-19 on mobile revenue as the telecommunications industry was declared as an essential service in South Africa. The Group’s fixed and IT services revenue has however been impacted by COVID-19 post the reporting date.
Medium N/A
Credit risk The Group’s maximum exposure to credit risk is represented by the carrying amount of the Group’s financial assets. The Group’s exposure to credit risk is influenced mainly by the individual characteristics of each customer.
There was a material change in the Group’s exposure to credit risk due to the impact of COVID-19. The Group credit risk objectives, policies and processes were amended to ensure effective responses to the increased risk. Some of the changes included stricter credit check criteria for new customers through certain higher risk sales channels and shorter collection periods for defaulters. The Group also maintained conservative exposures to its counterparty banks to reduce possible credit risk.
To support the credit transmission mechanism of the South African economy, given the impact of COVID-19, the South African Reserve Bank (SARB) maintained the Repo (Repurchase) rate at 3.5%. In addition, facilitated by the SARB, the government has also implemented a bond purchase programme to provide liquidity to banks and enable a well-functioning credit transmission mechanism. This has diminished possible liquidity risk and interest rate risk in the capital markets.
Medium N/A
Liquidity risk There was a change in the Group’s objectives, policies and processes for managing and measuring liquidity risk during the 2021 financial year due to the impact of the COVID-19 pandemic and operational cash flow requirements. The Group has maintained elevated levels of liquidity in response to the potential impact of the pandemic, the economic slowdown and operational cash flow requirements. This will also mitigate the liquidity risk of the Group and consequently any possible credit rating downgrade.
Low N/A
Going concern The Group continues to operate as a going concern, with a strong balance sheet and solid cash flow position. There has also been a limited disruption on operationsas a result of the COVID-19 pandemic.
Low N/A
5352 Telkom Group Abridged Annual Results 2021 Consolidated abridged annual financial statements
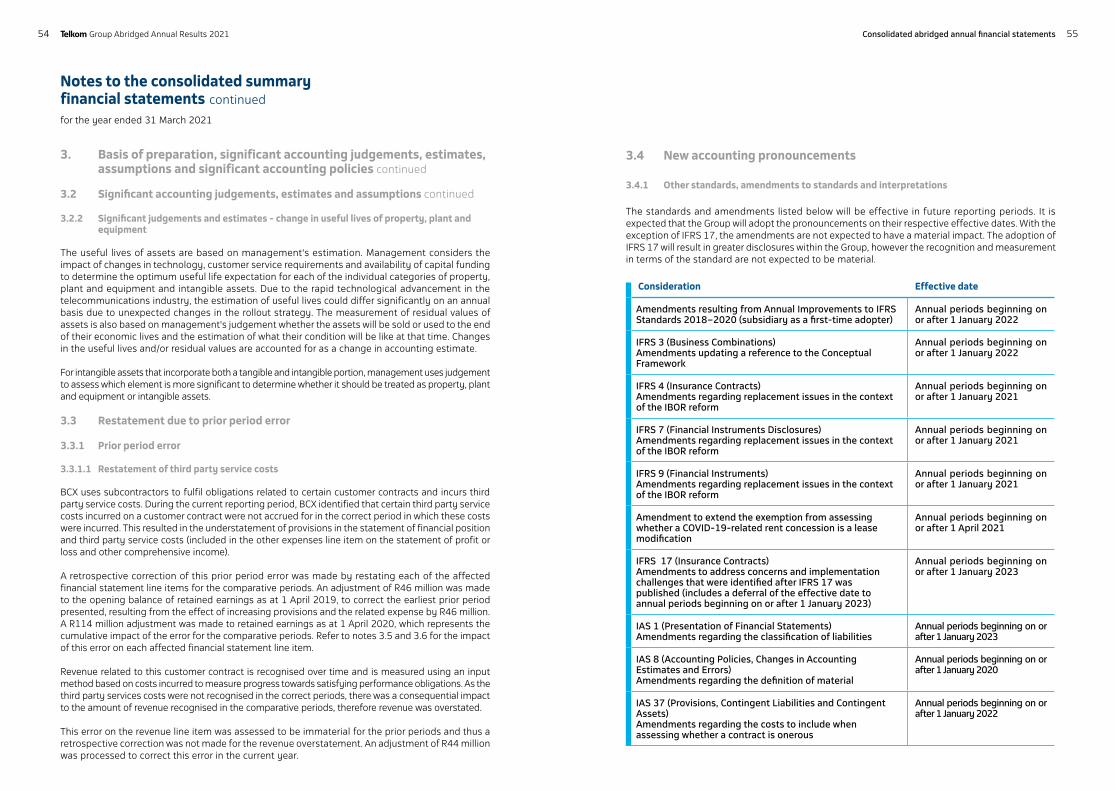
Notes to the consolidated summary financial statements continued
for the year ended 31 March 2021
3. Basis of preparation, significant accounting judgements, estimates, assumptions and significant accounting policies continued
3.2 Significant accounting judgements, estimates and assumptions continued
3.2.2 Significant judgements and estimates - change in useful lives of property, plant and equipment
The useful lives of assets are based on management's estimation. Management considers the impact of changes in technology, customer service requirements and availability of capital funding to determine the optimum useful life expectation for each of the individual categories of property, plant and equipment and intangible assets. Due to the rapid technological advancement in the telecommunications industry, the estimation of useful lives could differ significantly on an annual basis due to unexpected changes in the rollout strategy. The measurement of residual values of assets is also based on management's judgement whether the assets will be sold or used to the end of their economic lives and the estimation of what their condition will be like at that time. Changes in the useful lives and/or residual values are accounted for as a change in accounting estimate.
For intangible assets that incorporate both a tangible and intangible portion, management uses judgement to assess which element is more significant to determine whether it should be treated as property, plant and equipment or intangible assets.
3.3 Restatement due to prior period error 3.3.1 Prior period error 3.3.1.1 Restatement of third party service costs BCX uses subcontractors to fulfil obligations related to certain customer contracts and incurs third party service costs. During the current reporting period, BCX identified that certain third party service costs incurred on a customer contract were not accrued for in the correct period in which these costs were incurred. This resulted in the understatement of provisions in the statement of financial position and third party service costs (included in the other expenses line item on the statement of profit or loss and other comprehensive income). A retrospective correction of this prior period error was made by restating each of the affected financial statement line items for the comparative periods. An adjustment of R46 million was made to the opening balance of retained earnings as at 1 April 2019, to correct the earliest prior period presented, resulting from the effect of increasing provisions and the related expense by R46 million. A R114 million adjustment was made to retained earnings as at 1 April 2020, which represents the cumulative impact of the error for the comparative periods. Refer to notes 3.5 and 3.6 for the impact of this error on each affected financial statement line item. Revenue related to this customer contract is recognised over time and is measured using an input method based on costs incurred to measure progress towards satisfying performance obligations. As the third party services costs were not recognised in the correct periods, there was a consequential impact to the amount of revenue recognised in the comparative periods, therefore revenue was overstated.
This error on the revenue line item was assessed to be immaterial for the prior periods and thus a retrospective correction was not made for the revenue overstatement. An adjustment of R44 million was processed to correct this error in the current year.
3.4 New accounting pronouncements
3.4.1 Other standards, amendments to standards and interpretations
The standards and amendments listed below will be effective in future reporting periods. It is expected that the Group will adopt the pronouncements on their respective effective dates. With the exception of IFRS 17, the amendments are not expected to have a material impact. The adoption of IFRS 17 will result in greater disclosures within the Group, however the recognition and measurement in terms of the standard are not expected to be material.
Consideration Effective date
Amendments resulting from Annual Improvements to IFRS Standards 2018–2020 (subsidiary as a first-time adopter)
Annual periods beginning on or after 1 January 2022
IFRS 3 (Business Combinations) Amendments updating a reference to the Conceptual Framework
Annual periods beginning on or after 1 January 2022
IFRS 4 (Insurance Contracts) Amendments regarding replacement issues in the context of the IBOR reform
Annual periods beginning on or after 1 January 2021
IFRS 7 (Financial Instruments Disclosures) Amendments regarding replacement issues in the context of the IBOR reform
Annual periods beginning on or after 1 January 2021
IFRS 9 (Financial Instruments) Amendments regarding replacement issues in the context of the IBOR reform
Annual periods beginning on or after 1 January 2021
Amendment to extend the exemption from assessing whether a COVID-19-related rent concession is a lease modification
Annual periods beginning on or after 1 April 2021
IFRS 17 (Insurance Contracts) Amendments to address concerns and implementation challenges that were identified after IFRS 17 was published (includes a deferral of the effective date to annual periods beginning on or after 1 January 2023)
Annual periods beginning on or after 1 January 2023
IAS 1 (Presentation of Financial Statements) Amendments regarding the classification of liabilities
Annual periods beginning on or after 1 January 2023
IAS 8 (Accounting Policies, Changes in Accounting Estimates and Errors) Amendments regarding the definition of material
Annual periods beginning on or after 1 January 2020
IAS 37 (Provisions, Contingent Liabilities and Contingent Assets) Amendments regarding the costs to include when assessing whether a contract is onerous
Annual periods beginning on or after 1 January 2022
5554 Telkom Group Abridged Annual Results 2021 Consolidated abridged annual financial statements
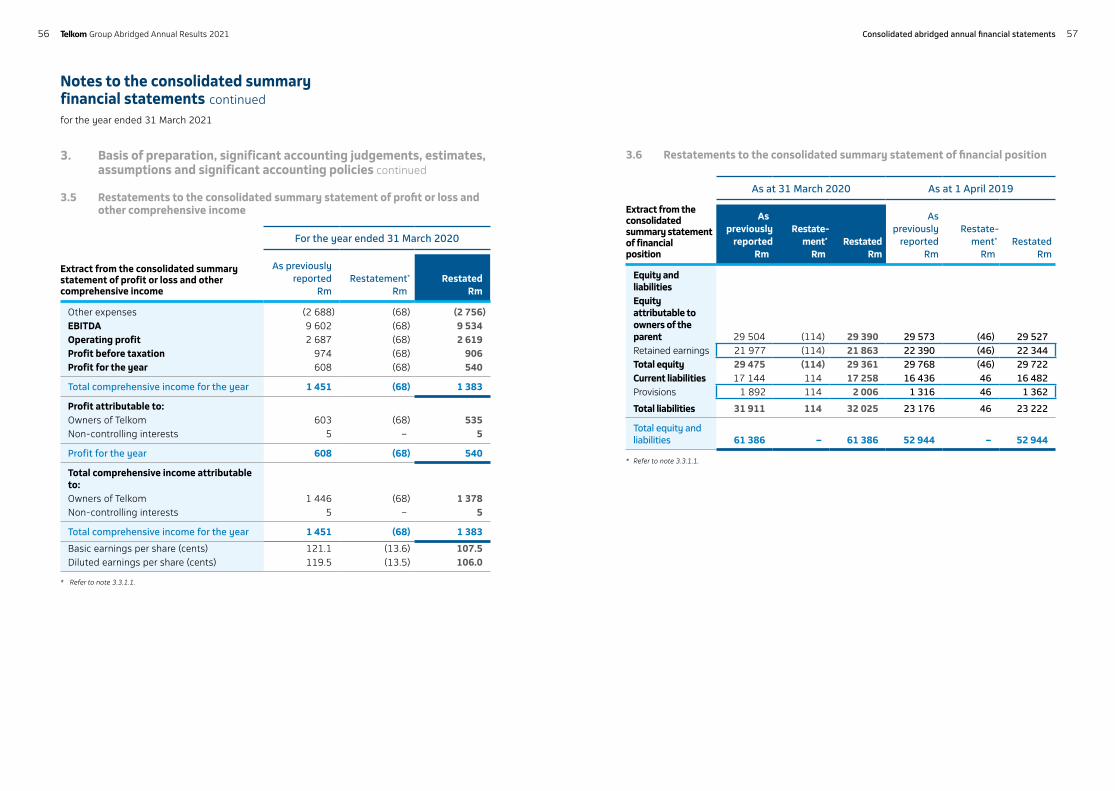
3. Basis of preparation, significant accounting judgements, estimates, assumptions and significant accounting policies continued
3.5 Restatements to the consolidated summary statement of profit or loss and other comprehensive income
For the year ended 31 March 2020
Extract from the consolidated summary statement of profit or loss and other comprehensive income
As previously reported
RmRestatement*
RmRestated
Rm
Other expenses (2 688) (68) (2 756)EBITDA 9 602 (68) 9 534 Operating profit 2 687 (68) 2 619 Profit before taxation 974 (68) 906 Profit for the year 608 (68) 540
Total comprehensive income for the year 1 451 (68) 1 383
Profit attributable to:Owners of Telkom 603 (68) 535 Non-controlling interests 5 – 5
Profit for the year 608 (68) 540
Total comprehensive income attributable to:Owners of Telkom 1 446 (68) 1 378 Non-controlling interests 5 – 5
Total comprehensive income for the year 1 451 (68) 1 383
Basic earnings per share (cents) 121.1 (13.6) 107.5 Diluted earnings per share (cents) 119.5 (13.5) 106.0
* Refer to note 3.3.1.1.
3.6 Restatements to the consolidated summary statement of financial position
Extract from the consolidated summary statement of financial position
As at 31 March 2020 As at 1 April 2019
As previously
reported Rm
Restate-ment*
RmRestated
Rm
As previously
reported Rm
Restate-ment*
RmRestated
Rm
Equity and liabilitiesEquity attributable to owners of the parent 29 504 (114) 29 390 29 573 (46) 29 527Retained earnings 21 977 (114) 21 863 22 390 (46) 22 344Total equity 29 475 (114) 29 361 29 768 (46) 29 722Current liabilities 17 144 114 17 258 16 436 46 16 482Provisions 1 892 114 2 006 1 316 46 1 362
Total liabilities 31 911 114 32 025 23 176 46 23 222
Total equity and liabilities 61 386 – 61 386 52 944 – 52 944
* Refer to note 3.3.1.1.
Notes to the consolidated summary financial statements continued
for the year ended 31 March 2021
5756 Telkom Group Abridged Annual Results 2021 Consolidated abridged annual financial statements
Notes to the consolidated summary financial statements continued
for the year ended 31 March 2021
4. Segment information The executive committee (exco) is the Group's chief operating decision maker (CODM). Management has determined the operating segments based on the reports reviewed by exco that are used to make strategic decisions, allocate resources and assess performance of each reportable segment. The operating segments classification is based on the business units through which Telkom provides communications products and services via its customer-facing units: Consumer, Openserve and Telkom Small and Medium Business (SMB), as well as its subsidiaries, Gyro and BCX. The customer-facing units are supported by the Corporate Centre. For the 2021 financial year, reports submitted to exco separately reported SMB’s financial performance (statement of profit or loss and other comprehensive income). SMB consists of small and medium businesses that were previously managed as part of BCX, Consumer and Yellow Pages (previously included in “Other”). The reportable segments have been determined as Openserve, Consumer, BCX, Gyro and “Other”. The SMB segment has been aggregated into the Consumer segment. The aggregation is based on the similarity in the nature of products and services. SMB customers include primarily sole proprietors and such customers who typically consume simplex products, which are similar in nature to those consumed within the Consumer segment and the profile of the customers are similar by nature. A large portion of the SMB customer base makes use of the Telkom Direct Stores channels which is the same channel as that of the Consumer customers. The CODM reviews the performance of the operating segments on an EBITDA basis. EBITDA is adjusted for significant non-recurring items such as restructurings and adoption of new accounting standards, when applicable. The current year EBITDA has been normalised for voluntary severance, retirement and retrenchment package expenses of R270 million. EBITDA in the published FY2020 financial statements was adjusted to include expected credit losses of R626 million on trade receivables and contract assets, arising from the expected impact of COVID-19. In the current year, management revised the assessment of whether the expected impact of COVID-19 is a significant non-recurring item, and taking into account actual experience, it has been assessed that the impact of COVID-19 on expected credit losses is a recurring item that should be taken into account in the ordinary course of business. As such, management has made a decision not to adjust EBITDA for the expected credit losses arising from the impact of COVID-19. The comparative year has therefore been restated and normalised only for voluntary severance and retirement expenses of R1 186 million. EBITDA is defined as earnings before finance income and finance cost (which includes gains and losses on foreign exchange transactions), tax, depreciation and amortisation, and is alsopresented inclusive of the following items:
- Interest revenue; and
- Interest on overdue accounts
The interest revenue is included in operating revenue as a separate component of revenue.
5958 Telkom Group Abridged Annual Results 2021 Consolidated abridged annual financial statements
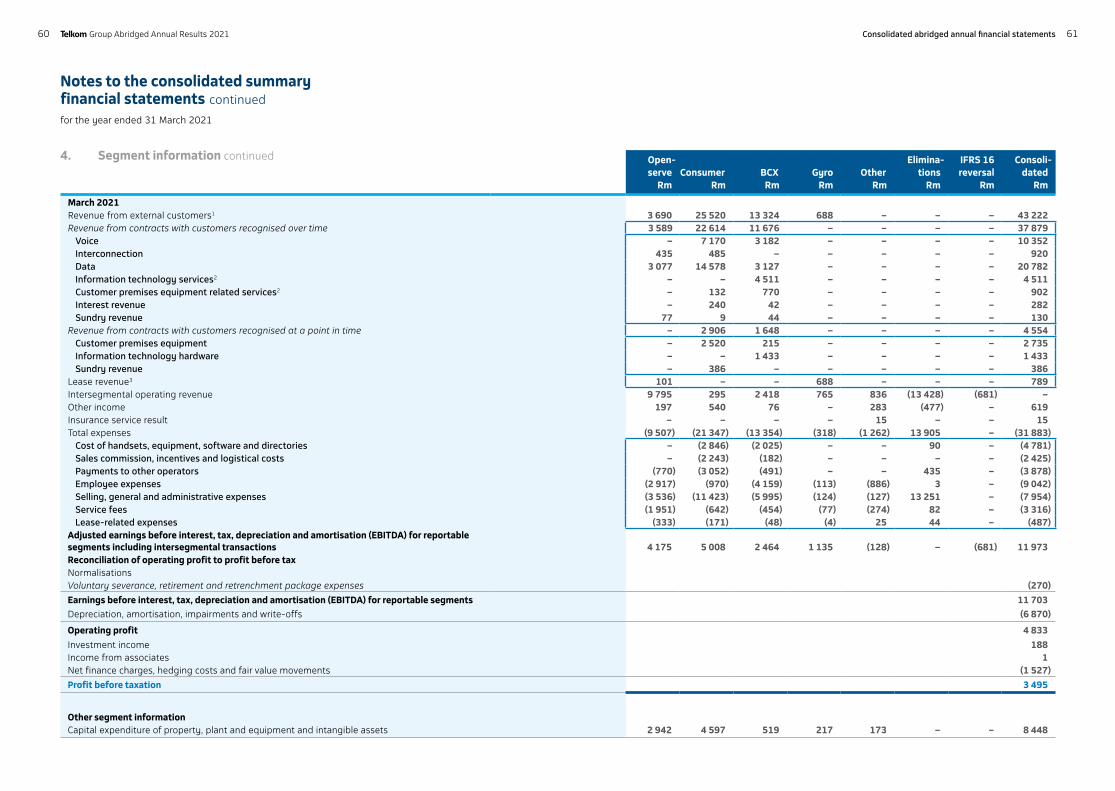
4. Segment information continued Open-serve
RmConsumer
RmBCX
RmGyro
RmOther
Rm
Elimina-tions
Rm
IFRS 16 reversal
Rm
Consoli-dated
Rm
March 2021Revenue from external customers1 3 690 25 520 13 324 688 – – – 43 222 Revenue from contracts with customers recognised over time 3 589 22 614 11 676 – – – – 37 879
Voice – 7 170 3 182 – – – – 10 352 Interconnection 435 485 – – – – – 920 Data 3 077 14 578 3 127 – – – – 20 782Information technology services2 – – 4 511 – – – – 4 511 Customer premises equipment related services2 – 132 770 – – – – 902Interest revenue – 240 42 – – – – 282 Sundry revenue 77 9 44 – – – – 130
Revenue from contracts with customers recognised at a point in time – 2 906 1 648 – – – – 4 554Customer premises equipment – 2 520 215 – – – – 2 735Information technology hardware – – 1 433 – – – – 1 433Sundry revenue – 386 – – – – – 386
Lease revenue3 101 – – 688 – – – 789Intersegmental operating revenue 9 795 295 2 418 765 836 (13 428) (681) – Other income 197 540 76 – 283 (477) – 619 Insurance service result – – – – 15 – – 15 Total expenses (9 507) (21 347) (13 354) (318) (1 262) 13 905 – (31 883)
Cost of handsets, equipment, software and directories – (2 846) (2 025) – – 90 – (4 781)Sales commission, incentives and logistical costs – (2 243) (182) – – – – (2 425)Payments to other operators (770) (3 052) (491) – – 435 – (3 878)Employee expenses (2 917) (970) (4 159) (113) (886) 3 – (9 042)Selling, general and administrative expenses (3 536) (11 423) (5 995) (124) (127) 13 251 – (7 954)Service fees (1 951) (642) (454) (77) (274) 82 – (3 316)Lease-related expenses (333) (171) (48) (4) 25 44 – (487)
Adjusted earnings before interest, tax, depreciation and amortisation (EBITDA) for reportable segments including intersegmental transactions 4 175 5 008 2 464 1 135 (128) – (681) 11 973 Reconciliation of operating profit to profit before taxNormalisationsVoluntary severance, retirement and retrenchment package expenses (270)
Earnings before interest, tax, depreciation and amortisation (EBITDA) for reportable segments 11 703 Depreciation, amortisation, impairments and write-offs (6 870)
Operating profit 4 833
Investment income 188 Income from associates 1 Net finance charges, hedging costs and fair value movements (1 527)
Profit before taxation 3 495
Other segment informationCapital expenditure of property, plant and equipment and intangible assets 2 942 4 597 519 217 173 – – 8 448
Notes to the consolidated summary financial statements continued
for the year ended 31 March 2021
6160 Telkom Group Abridged Annual Results 2021 Consolidated abridged annual financial statements
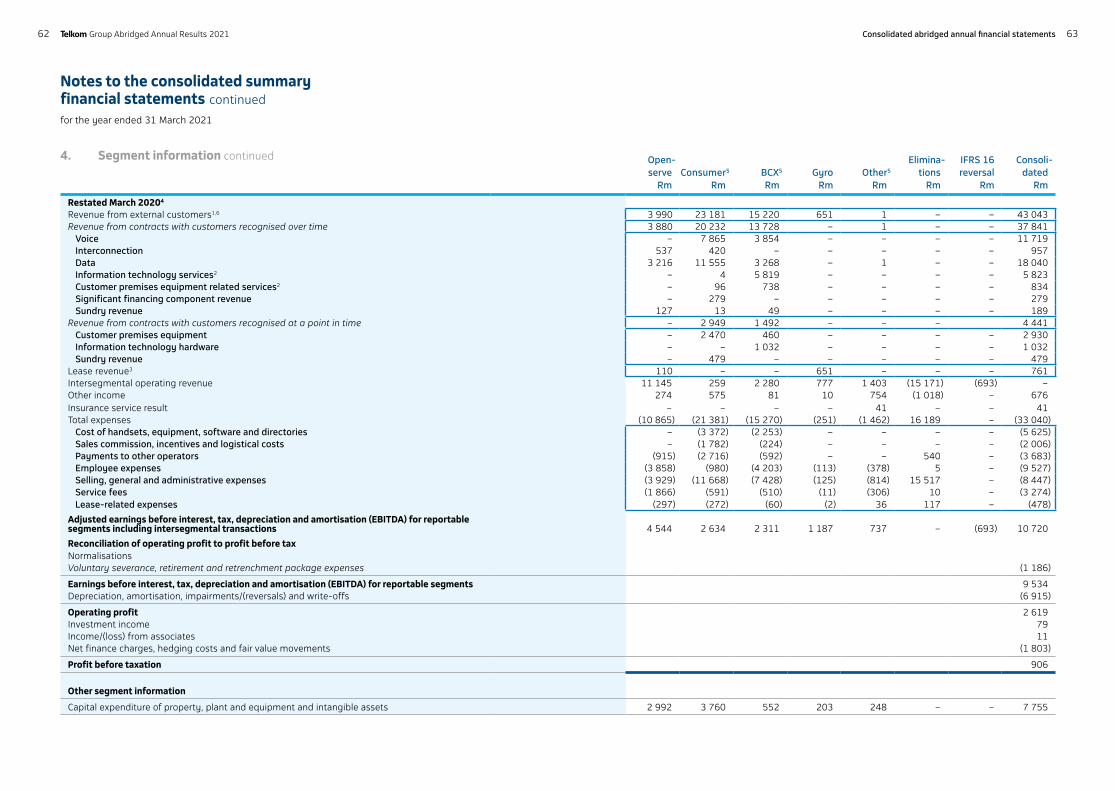
4. Segment information continued Open-serve
RmConsumer5
RmBCX5
RmGyro
RmOther5
Rm
Elimina-tions
Rm
IFRS 16 reversal
Rm
Consoli-dated
Rm
Restated March 20204
Revenue from external customers1,6 3 990 23 181 15 220 651 1 – – 43 043 Revenue from contracts with customers recognised over time 3 880 20 232 13 728 – 1 – – 37 841
Voice – 7 865 3 854 – – – – 11 719 Interconnection 537 420 – – – – – 957 Data 3 216 11 555 3 268 – 1 – – 18 040 Information technology services2 – 4 5 819 – – – – 5 823 Customer premises equipment related services2 – 96 738 – – – – 834 Significant financing component revenue – 279 – – – – – 279 Sundry revenue 127 13 49 – – – – 189
Revenue from contracts with customers recognised at a point in time – 2 949 1 492 – – – 4 441 Customer premises equipment – 2 470 460 – – – – 2 930 Information technology hardware – – 1 032 – – – – 1 032 Sundry revenue – 479 – – – – – 479
Lease revenue3 110 – – 651 – – – 761 Intersegmental operating revenue 11 145 259 2 280 777 1 403 (15 171) (693) – Other income 274 575 81 10 754 (1 018) – 676 Insurance service result – – – – 41 – – 41 Total expenses (10 865) (21 381) (15 270) (251) (1 462) 16 189 – (33 040)
Cost of handsets, equipment, software and directories – (3 372) (2 253) – – – – (5 625)Sales commission, incentives and logistical costs – (1 782) (224) – – – – (2 006)Payments to other operators (915) (2 716) (592) – – 540 – (3 683)Employee expenses (3 858) (980) (4 203) (113) (378) 5 – (9 527)Selling, general and administrative expenses (3 929) (11 668) (7 428) (125) (814) 15 517 – (8 447)Service fees (1 866) (591) (510) (11) (306) 10 – (3 274)Lease-related expenses (297) (272) (60) (2) 36 117 – (478)
Adjusted earnings before interest, tax, depreciation and amortisation (EBITDA) for reportable segments including intersegmental transactions 4 544 2 634 2 311 1 187 737 – (693) 10 720
Reconciliation of operating profit to profit before taxNormalisationsVoluntary severance, retirement and retrenchment package expenses (1 186)
Earnings before interest, tax, depreciation and amortisation (EBITDA) for reportable segments 9 534 Depreciation, amortisation, impairments/(reversals) and write-offs (6 915)
Operating profit 2 619 Investment income 79 Income/(loss) from associates 11 Net finance charges, hedging costs and fair value movements (1 803)
Profit before taxation 906
Other segment information
Capital expenditure of property, plant and equipment and intangible assets 2 992 3 760 552 203 248 – – 7 755
Notes to the consolidated summary financial statements continued
for the year ended 31 March 2021
6362 Telkom Group Abridged Annual Results 2021 Consolidated abridged annual financial statements
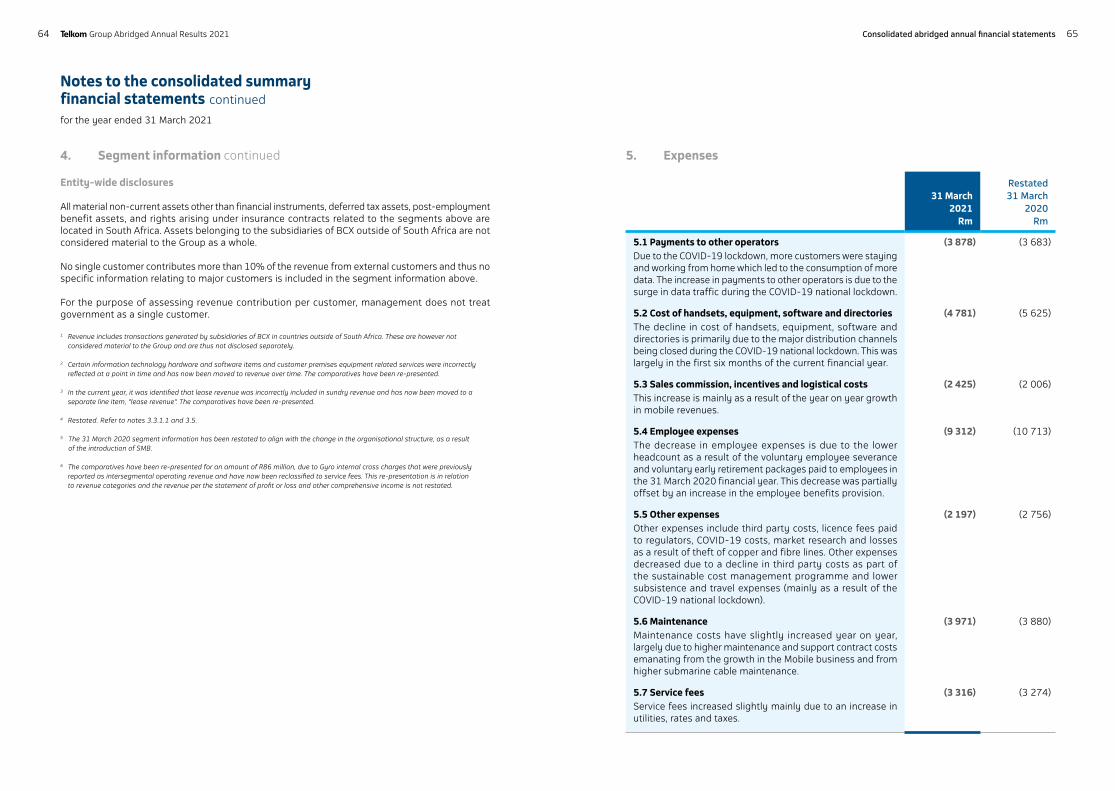
Notes to the consolidated summary financial statements continued
for the year ended 31 March 2021
4. Segment information continued
Entity-wide disclosures All material non-current assets other than financial instruments, deferred tax assets, post-employment benefit assets, and rights arising under insurance contracts related to the segments above are located in South Africa. Assets belonging to the subsidiaries of BCX outside of South Africa are not considered material to the Group as a whole. No single customer contributes more than 10% of the revenue from external customers and thus no specific information relating to major customers is included in the segment information above. For the purpose of assessing revenue contribution per customer, management does not treat government as a single customer. 1 Revenue includes transactions generated by subsidiaries of BCX in countries outside of South Africa. These are however not
considered material to the Group and are thus not disclosed separately.
2 Certain information technology hardware and software items and customer premises equipment related services were incorrectly reflected at a point in time and has now been moved to revenue over time. The comparatives have been re-presented. 3 In the current year, it was identified that lease revenue was incorrectly included in sundry revenue and has now been moved to a separate line item, "lease revenue". The comparatives have been re-presented. 4 Restated. Refer to notes 3.3.1.1 and 3.5. 5 The 31 March 2020 segment information has been restated to align with the change in the organisational structure, as a result of the introduction of SMB. 6 The comparatives have been re-presented for an amount of R86 million, due to Gyro internal cross charges that were previously reported as intersegmental operating revenue and have now been reclassified to service fees. This re-presentation is in relation to revenue categories and the revenue per the statement of profit or loss and other comprehensive income is not restated.
5. Expenses
31 March2021
Rm
Restated 31 March
2020Rm
5.1 Payments to other operators (3 878) (3 683) Due to the COVID-19 lockdown, more customers were staying and working from home which led to the consumption of more data. The increase in payments to other operators is due to the surge in data traffic during the COVID-19 national lockdown.
5.2 Cost of handsets, equipment, software and directories (4 781) (5 625) The decline in cost of handsets, equipment, software and directories is primarily due to the major distribution channels being closed during the COVID-19 national lockdown. This was largely in the first six months of the current financial year.
5.3 Sales commission, incentives and logistical costs (2 425) (2 006) This increase is mainly as a result of the year on year growth in mobile revenues.
5.4 Employee expenses (9 312) (10 713) The decrease in employee expenses is due to the lower headcount as a result of the voluntary employee severance and voluntary early retirement packages paid to employees in the 31 March 2020 financial year. This decrease was partially offset by an increase in the employee benefits provision.
5.5 Other expenses (2 197) (2 756) Other expenses include third party costs, licence fees paid to regulators, COVID-19 costs, market research and losses as a result of theft of copper and fibre lines. Other expenses decreased due to a decline in third party costs as part of the sustainable cost management programme and lower subsistence and travel expenses (mainly as a result of the COVID-19 national lockdown).
5.6 Maintenance (3 971) (3 880) Maintenance costs have slightly increased year on year, largely due to higher maintenance and support contract costs emanating from the growth in the Mobile business and from higher submarine cable maintenance.
5.7 Service fees (3 316) (3 274) Service fees increased slightly mainly due to an increase in utilities, rates and taxes.
6564 Telkom Group Abridged Annual Results 2021 Consolidated abridged annual financial statements
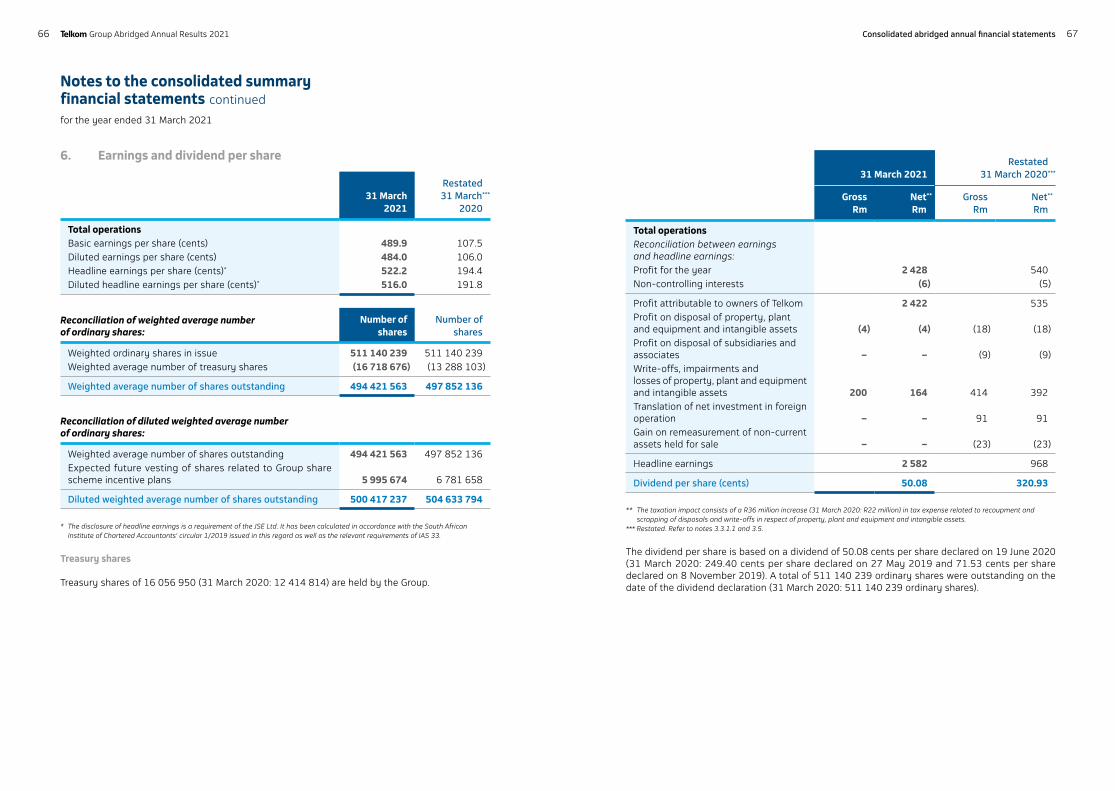
Notes to the consolidated summary financial statements continued
for the year ended 31 March 2021
6. Earnings and dividend per share
31 March2021
Restated 31 March***
2020
Total operationsBasic earnings per share (cents) 489.9 107.5 Diluted earnings per share (cents) 484.0 106.0 Headline earnings per share (cents)* 522.2 194.4 Diluted headline earnings per share (cents)* 516.0 191.8
Reconciliation of weighted average number of ordinary shares:
Number of shares
Number of shares
Weighted ordinary shares in issue 511 140 239 511 140 239 Weighted average number of treasury shares (16 718 676) (13 288 103)
Weighted average number of shares outstanding 494 421 563 497 852 136
Reconciliation of diluted weighted average number of ordinary shares:
Weighted average number of shares outstanding 494 421 563 497 852 136 Expected future vesting of shares related to Group share scheme incentive plans 5 995 674 6 781 658
Diluted weighted average number of shares outstanding 500 417 237 504 633 794
* The disclosure of headline earnings is a requirement of the JSE Ltd. It has been calculated in accordance with the South African Institute of Chartered Accountants' circular 1/2019 issued in this regard as well as the relevant requirements of IAS 33.
Treasury shares
Treasury shares of 16 056 950 (31 March 2020: 12 414 814) are held by the Group.
31 March 2021Restated
31 March 2020***
GrossRm
Net**
RmGross
RmNet**
Rm
Total operationsReconciliation between earnings and headline earnings:Profit for the year 2 428 540Non-controlling interests (6) (5)
Profit attributable to owners of Telkom 2 422 535Profit on disposal of property, plant and equipment and intangible assets (4) (4) (18) (18)Profit on disposal of subsidiaries and associates – – (9) (9)Write-offs, impairments and losses of property, plant and equipment and intangible assets 200 164 414 392Translation of net investment in foreign operation – – 91 91Gain on remeasurement of non-current assets held for sale – – (23) (23)
Headline earnings 2 582 968
Dividend per share (cents) 50.08 320.93
** The taxation impact consists of a R36 million increase (31 March 2020: R22 million) in tax expense related to recoupment and scrapping of disposals and write-offs in respect of property, plant and equipment and intangible assets.
*** Restated. Refer to notes 3.3.1.1 and 3.5.
The dividend per share is based on a dividend of 50.08 cents per share declared on 19 June 2020 (31 March 2020: 249.40 cents per share declared on 27 May 2019 and 71.53 cents per share declared on 8 November 2019). A total of 511 140 239 ordinary shares were outstanding on the date of the dividend declaration (31 March 2020: 511 140 239 ordinary shares).
6766 Telkom Group Abridged Annual Results 2021 Consolidated abridged annual financial statements
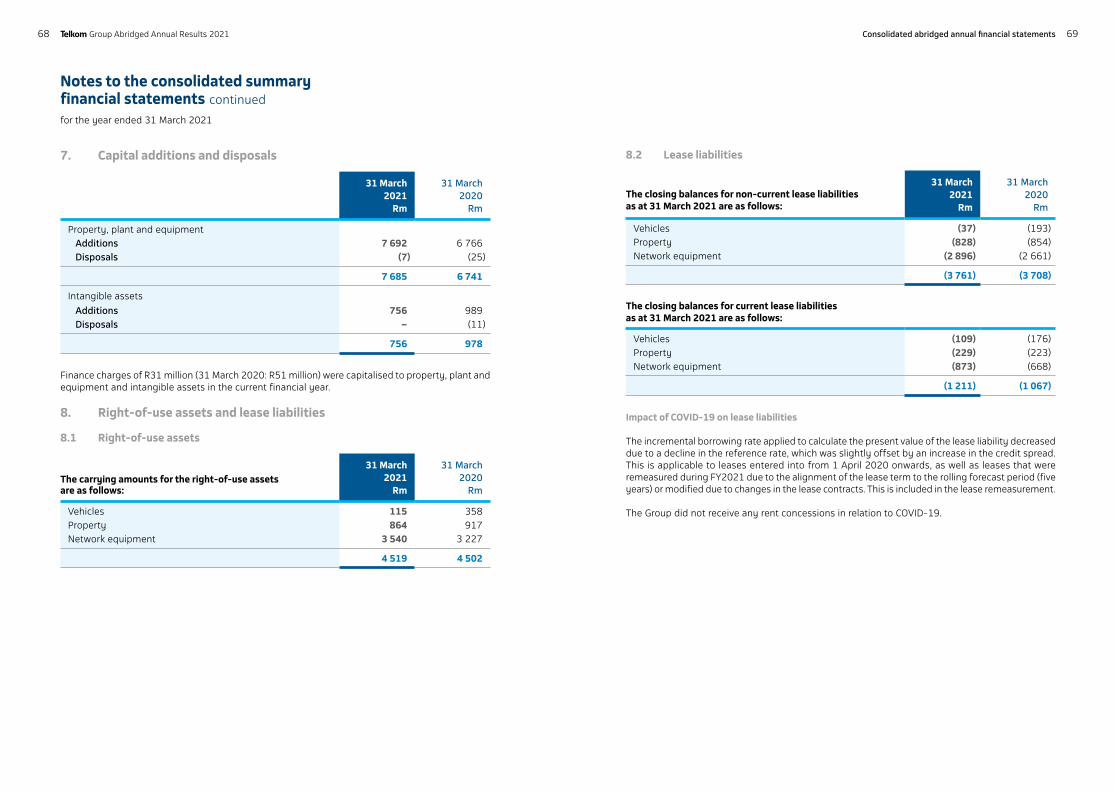
Notes to the consolidated summary financial statements continued
for the year ended 31 March 2021
7. Capital additions and disposals
31 March2021
Rm
31 March2020
Rm
Property, plant and equipment Additions 7 692 6 766 Disposals (7) (25)
7 685 6 741
Intangible assets
Additions 756 989 Disposals – (11)
756 978
Finance charges of R31 million (31 March 2020: R51 million) were capitalised to property, plant and equipment and intangible assets in the current financial year.
8. Right-of-use assets and lease liabilities 8.1 Right-of-use assets
The carrying amounts for the right-of-use assets are as follows:
31 March2021
Rm
31 March2020
Rm
Vehicles 115 358 Property 864 917 Network equipment 3 540 3 227
4 519 4 502
8.2 Lease liabilities
The closing balances for non-current lease liabilities as at 31 March 2021 are as follows:
31 March2021
Rm
31 March2020
Rm
Vehicles (37) (193)Property (828) (854)Network equipment (2 896) (2 661)
(3 761) (3 708)
The closing balances for current lease liabilities as at 31 March 2021 are as follows:
Vehicles (109) (176)Property (229) (223)Network equipment (873) (668)
(1 211) (1 067)
Impact of COVID-19 on lease liabilities
The incremental borrowing rate applied to calculate the present value of the lease liability decreased due to a decline in the reference rate, which was slightly offset by an increase in the credit spread. This is applicable to leases entered into from 1 April 2020 onwards, as well as leases that were remeasured during FY2021 due to the alignment of the lease term to the rolling forecast period (five years) or modified due to changes in the lease contracts. This is included in the lease remeasurement. The Group did not receive any rent concessions in relation to COVID-19.
6968 Telkom Group Abridged Annual Results 2021 Consolidated abridged annual financial statements
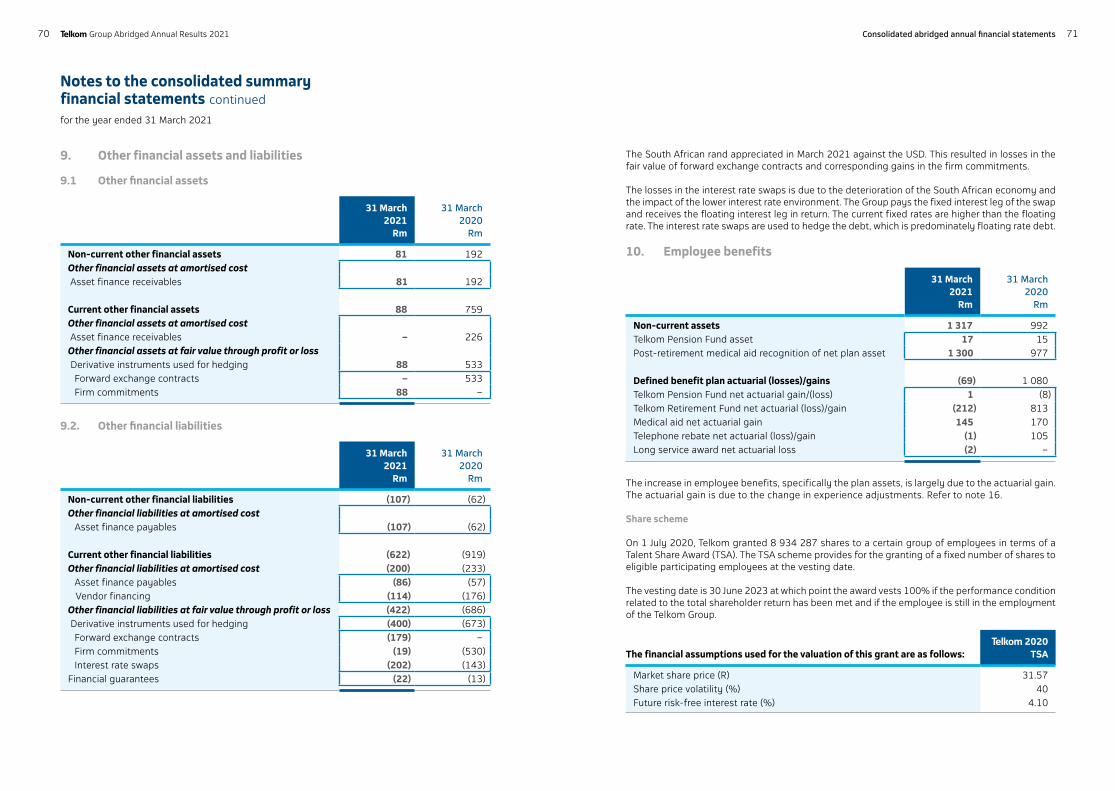
9. Other financial assets and liabilities
9.1 Other financial assets
31 March2021
Rm
31 March2020
Rm
Non-current other financial assets 81 192Other financial assets at amortised cost Asset finance receivables 81 192
Current other financial assets 88 759 Other financial assets at amortised cost Asset finance receivables – 226Other financial assets at fair value through profit or loss Derivative instruments used for hedging 88 533 Forward exchange contracts – 533 Firm commitments 88 –
9.2. Other financial liabilities
31 March2021
Rm
31 March2020
Rm
Non-current other financial liabilities (107) (62)Other financial liabilities at amortised cost
Asset finance payables (107) (62)
Current other financial liabilities (622) (919)Other financial liabilities at amortised cost (200) (233)
Asset finance payables (86) (57) Vendor financing (114) (176)Other financial liabilities at fair value through profit or loss (422) (686) Derivative instruments used for hedging (400) (673)
Forward exchange contracts (179) –Firm commitments (19) (530)Interest rate swaps (202) (143)
Financial guarantees (22) (13)
Notes to the consolidated summary financial statements continued
for the year ended 31 March 2021
The South African rand appreciated in March 2021 against the USD. This resulted in losses in the fair value of forward exchange contracts and corresponding gains in the firm commitments.
The losses in the interest rate swaps is due to the deterioration of the South African economy and the impact of the lower interest rate environment. The Group pays the fixed interest leg of the swap and receives the floating interest leg in return. The current fixed rates are higher than the floating rate. The interest rate swaps are used to hedge the debt, which is predominately floating rate debt.
10. Employee benefits
31 March2021
Rm
31 March2020
Rm
Non-current assets 1 317 992Telkom Pension Fund asset 17 15 Post-retirement medical aid recognition of net plan asset 1 300 977
Defined benefit plan actuarial (losses)/gains (69) 1 080 Telkom Pension Fund net actuarial gain/(loss) 1 (8)Telkom Retirement Fund net actuarial (loss)/gain (212) 813 Medical aid net actuarial gain 145 170 Telephone rebate net actuarial (loss)/gain (1) 105 Long service award net actuarial loss (2) –
The increase in employee benefits, specifically the plan assets, is largely due to the actuarial gain. The actuarial gain is due to the change in experience adjustments. Refer to note 16.
Share scheme On 1 July 2020, Telkom granted 8 934 287 shares to a certain group of employees in terms of a Talent Share Award (TSA). The TSA scheme provides for the granting of a fixed number of shares to eligible participating employees at the vesting date.
The vesting date is 30 June 2023 at which point the award vests 100% if the performance condition related to the total shareholder return has been met and if the employee is still in the employment of the Telkom Group.
The financial assumptions used for the valuation of this grant are as follows:Telkom 2020
TSA
Market share price (R) 31.57 Share price volatility (%) 40 Future risk-free interest rate (%) 4.10
7170 Telkom Group Abridged Annual Results 2021 Consolidated abridged annual financial statements
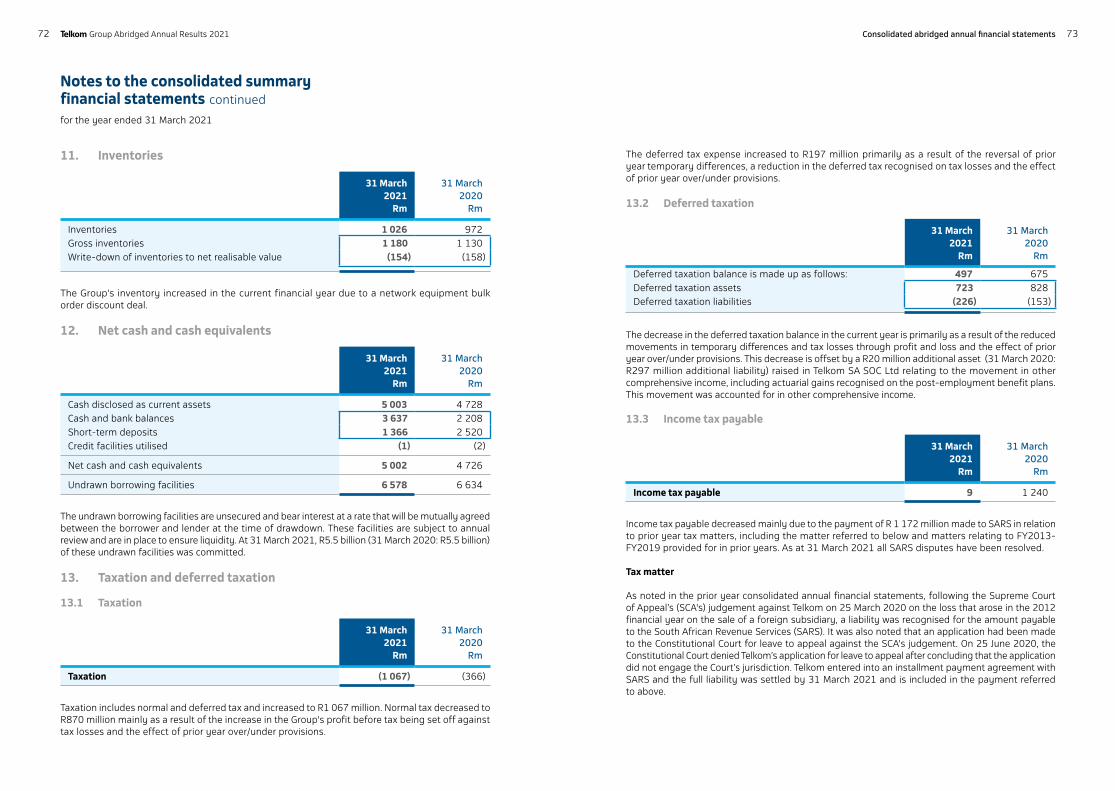
Notes to the consolidated summary financial statements continued
for the year ended 31 March 2021
11. Inventories
31 March2021
Rm
31 March2020
Rm
Inventories 1 026 972Gross inventories 1 180 1 130 Write-down of inventories to net realisable value (154) (158)
The Group's inventory increased in the current financial year due to a network equipment bulk order discount deal.
12. Net cash and cash equivalents
31 March2021
Rm
31 March2020
Rm
Cash disclosed as current assets 5 003 4 728 Cash and bank balances 3 637 2 208 Short-term deposits 1 366 2 520 Credit facilities utilised (1) (2)
Net cash and cash equivalents 5 002 4 726
Undrawn borrowing facilities 6 578 6 634
The undrawn borrowing facilities are unsecured and bear interest at a rate that will be mutually agreed between the borrower and lender at the time of drawdown. These facilities are subject to annual review and are in place to ensure liquidity. At 31 March 2021, R5.5 billion (31 March 2020: R5.5 billion) of these undrawn facilities was committed.
13. Taxation and deferred taxation
13.1 Taxation
31 March2021
Rm
31 March2020
Rm
Taxation (1 067) (366)
Taxation includes normal and deferred tax and increased to R1 067 million. Normal tax decreased to R870 million mainly as a result of the increase in the Group's profit before tax being set off against tax losses and the effect of prior year over/under provisions.
The deferred tax expense increased to R197 million primarily as a result of the reversal of prior year temporary differences, a reduction in the deferred tax recognised on tax losses and the effect of prior year over/under provisions.
13.2 Deferred taxation
31 March2021
Rm
31 March2020
Rm
Deferred taxation balance is made up as follows: 497 675Deferred taxation assets 723 828 Deferred taxation liabilities (226) (153)
The decrease in the deferred taxation balance in the current year is primarily as a result of the reduced movements in temporary differences and tax losses through profit and loss and the effect of prior year over/under provisions. This decrease is offset by a R20 million additional asset (31 March 2020: R297 million additional liability) raised in Telkom SA SOC Ltd relating to the movement in other comprehensive income, including actuarial gains recognised on the post-employment benefit plans. This movement was accounted for in other comprehensive income.
13.3 Income tax payable
31 March2021
Rm
31 March2020
Rm
Income tax payable 9 1 240
Income tax payable decreased mainly due to the payment of R 1 172 million made to SARS in relation to prior year tax matters, including the matter referred to below and matters relating to FY2013-FY2019 provided for in prior years. As at 31 March 2021 all SARS disputes have been resolved.
Tax matter
As noted in the prior year consolidated annual financial statements, following the Supreme Court of Appeal’s (SCA's) judgement against Telkom on 25 March 2020 on the loss that arose in the 2012 financial year on the sale of a foreign subsidiary, a liability was recognised for the amount payable to the South African Revenue Services (SARS). It was also noted that an application had been made to the Constitutional Court for leave to appeal against the SCA's judgement. On 25 June 2020, the Constitutional Court denied Telkom’s application for leave to appeal after concluding that the application did not engage the Court’s jurisdiction. Telkom entered into an installment payment agreement with SARS and the full liability was settled by 31 March 2021 and is included in the payment referred to above.
7372 Telkom Group Abridged Annual Results 2021 Consolidated abridged annual financial statements
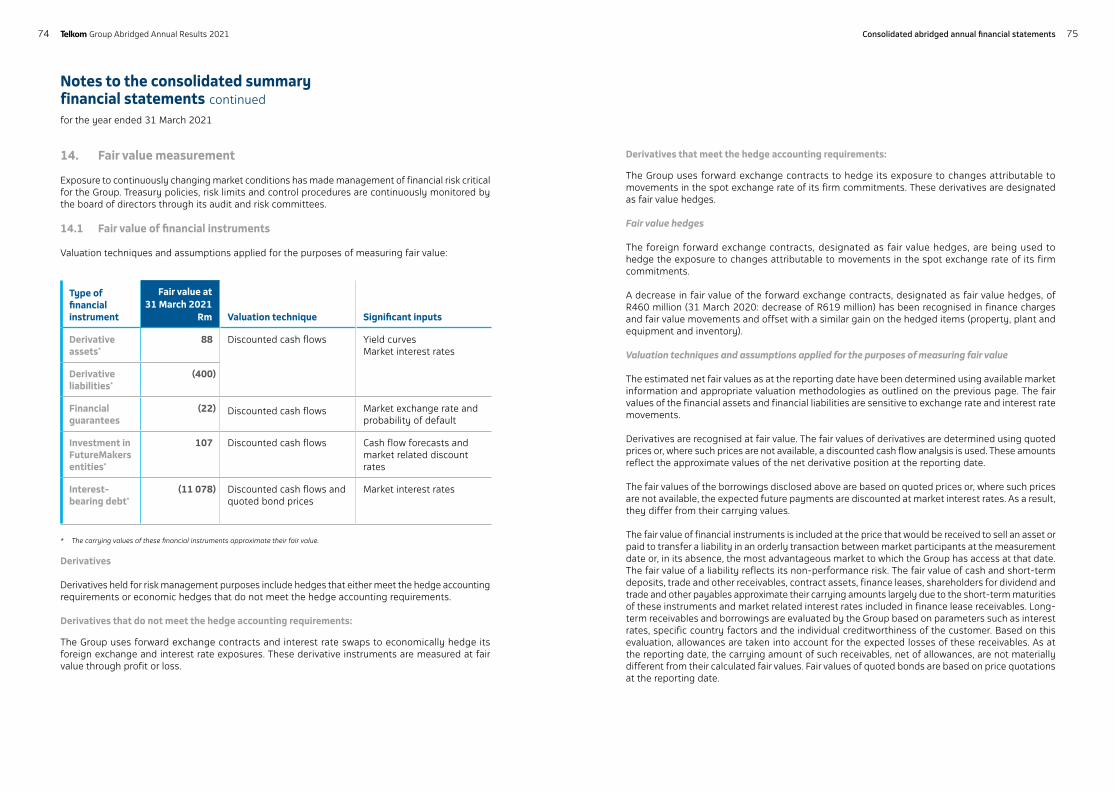
Notes to the consolidated summary financial statements continued
for the year ended 31 March 2021
14. Fair value measurement
Exposure to continuously changing market conditions has made management of financial risk critical for the Group. Treasury policies, risk limits and control procedures are continuously monitored by the board of directors through its audit and risk committees. 14.1 Fair value of financial instruments
Valuation techniques and assumptions applied for the purposes of measuring fair value:
Type of financial instrument
Fair value at 31 March 2021
Rm Valuation technique Significant inputs
Derivative assets*
88 Discounted cash flows Yield curves Market interest rates
Derivative liabilities*
(400)
Financial guarantees
(22) Discounted cash flows Market exchange rate and probability of default
Investment in FutureMakers entities*
107 Discounted cash flows Cash flow forecasts and market related discount rates
Interest-bearing debt*
(11 078) Discounted cash flows and quoted bond prices
Market interest rates
* The carrying values of these financial instruments approximate their fair value.
Derivatives
Derivatives held for risk management purposes include hedges that either meet the hedge accounting requirements or economic hedges that do not meet the hedge accounting requirements.
Derivatives that do not meet the hedge accounting requirements:
The Group uses forward exchange contracts and interest rate swaps to economically hedge its foreign exchange and interest rate exposures. These derivative instruments are measured at fair value through profit or loss.
Derivatives that meet the hedge accounting requirements:
The Group uses forward exchange contracts to hedge its exposure to changes attributable to movements in the spot exchange rate of its firm commitments. These derivatives are designated as fair value hedges.
Fair value hedges
The foreign forward exchange contracts, designated as fair value hedges, are being used to hedge the exposure to changes attributable to movements in the spot exchange rate of its firm commitments.
A decrease in fair value of the forward exchange contracts, designated as fair value hedges, of R460 million (31 March 2020: decrease of R619 million) has been recognised in finance charges and fair value movements and offset with a similar gain on the hedged items (property, plant and equipment and inventory). Valuation techniques and assumptions applied for the purposes of measuring fair value
The estimated net fair values as at the reporting date have been determined using available market information and appropriate valuation methodologies as outlined on the previous page. The fair values of the financial assets and financial liabilities are sensitive to exchange rate and interest rate movements.
Derivatives are recognised at fair value. The fair values of derivatives are determined using quoted prices or, where such prices are not available, a discounted cash flow analysis is used. These amounts reflect the approximate values of the net derivative position at the reporting date. The fair values of the borrowings disclosed above are based on quoted prices or, where such prices are not available, the expected future payments are discounted at market interest rates. As a result, they differ from their carrying values.
The fair value of financial instruments is included at the price that would be received to sell an asset or paid to transfer a liability in an orderly transaction between market participants at the measurement date or, in its absence, the most advantageous market to which the Group has access at that date. The fair value of a liability reflects its non-performance risk. The fair value of cash and short-term deposits, trade and other receivables, contract assets, finance leases, shareholders for dividend and trade and other payables approximate their carrying amounts largely due to the short-term maturities of these instruments and market related interest rates included in finance lease receivables. Long-term receivables and borrowings are evaluated by the Group based on parameters such as interest rates, specific country factors and the individual creditworthiness of the customer. Based on this evaluation, allowances are taken into account for the expected losses of these receivables. As at the reporting date, the carrying amount of such receivables, net of allowances, are not materially different from their calculated fair values. Fair values of quoted bonds are based on price quotations at the reporting date.
7574 Telkom Group Abridged Annual Results 2021 Consolidated abridged annual financial statements
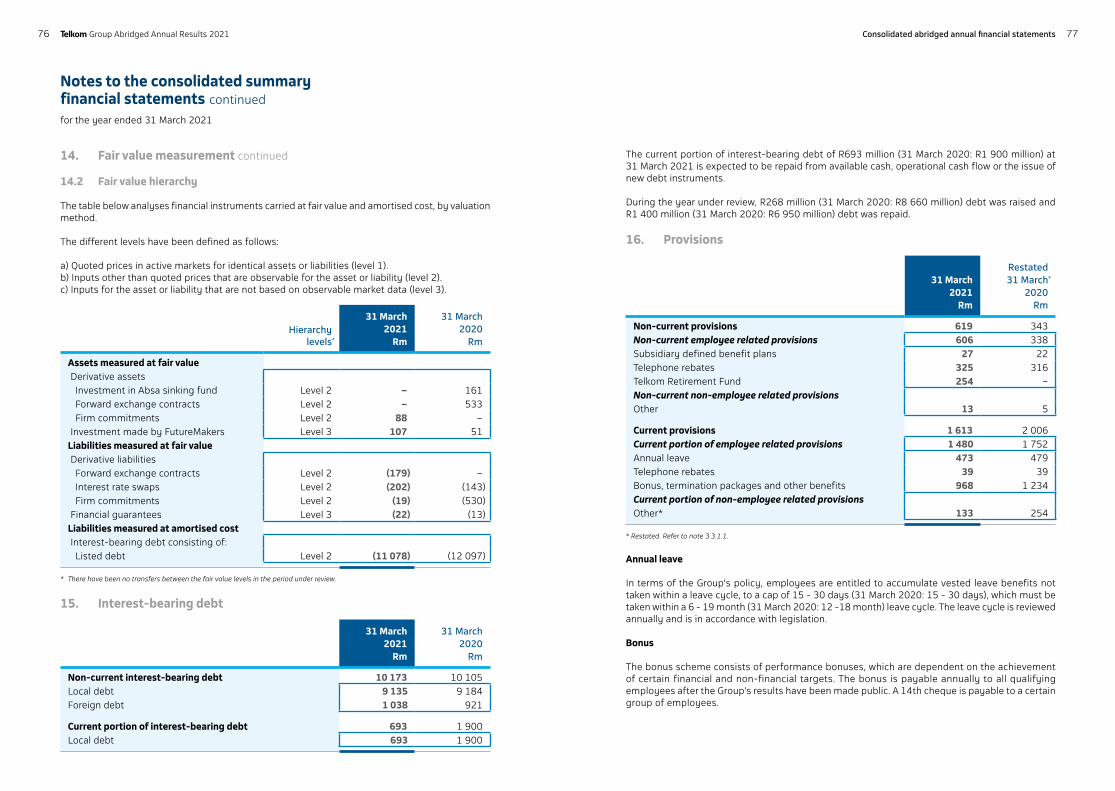
14. Fair value measurement continued
14.2 Fair value hierarchy
The table below analyses financial instruments carried at fair value and amortised cost, by valuation method.
The different levels have been defined as follows:
a) Quoted prices in active markets for identical assets or liabilities (level 1). b) Inputs other than quoted prices that are observable for the asset or liability (level 2). c) Inputs for the asset or liability that are not based on observable market data (level 3).
Hierarchylevels*
31 March2021
Rm
31 March 2020
Rm
Assets measured at fair valueDerivative assetsInvestment in Absa sinking fund Level 2 – 161Forward exchange contracts Level 2 – 533Firm commitments Level 2 88 –
Investment made by FutureMakers Level 3 107 51Liabilities measured at fair valueDerivative liabilitiesForward exchange contracts Level 2 (179) –Interest rate swaps Level 2 (202) (143)Firm commitments Level 2 (19) (530)
Financial guarantees Level 3 (22) (13)Liabilities measured at amortised costInterest-bearing debt consisting of:Listed debt Level 2 (11 078) (12 097)
* There have been no transfers between the fair value levels in the period under review.
15. Interest-bearing debt
31 March2021
Rm
31 March2020
Rm
Non-current interest-bearing debt 10 173 10 105 Local debt 9 135 9 184 Foreign debt 1 038 921
Current portion of interest-bearing debt 693 1 900 Local debt 693 1 900
Notes to the consolidated summary financial statements continued
for the year ended 31 March 2021
The current portion of interest-bearing debt of R693 million (31 March 2020: R1 900 million) at 31 March 2021 is expected to be repaid from available cash, operational cash flow or the issue of new debt instruments. During the year under review, R268 million (31 March 2020: R8 660 million) debt was raised and R1 400 million (31 March 2020: R6 950 million) debt was repaid.
16. Provisions
31 March2021
Rm
Restated 31 March*
2020Rm
Non-current provisions 619 343 Non-current employee related provisions 606 338 Subsidiary defined benefit plans 27 22 Telephone rebates 325 316 Telkom Retirement Fund 254 – Non-current non-employee related provisionsOther 13 5
Current provisions 1 613 2 006 Current portion of employee related provisions 1 480 1 752 Annual leave 473 479 Telephone rebates 39 39 Bonus, termination packages and other benefits 968 1 234 Current portion of non-employee related provisionsOther* 133 254
* Restated. Refer to note 3.3.1.1.
Annual leave
In terms of the Group's policy, employees are entitled to accumulate vested leave benefits not taken within a leave cycle, to a cap of 15 - 30 days (31 March 2020: 15 - 30 days), which must be taken within a 6 - 19 month (31 March 2020: 12 -18 month) leave cycle. The leave cycle is reviewed annually and is in accordance with legislation.
Bonus
The bonus scheme consists of performance bonuses, which are dependent on the achievement of certain financial and non-financial targets. The bonus is payable annually to all qualifying employees after the Group's results have been made public. A 14th cheque is payable to a certain group of employees.
7776 Telkom Group Abridged Annual Results 2021 Consolidated abridged annual financial statements
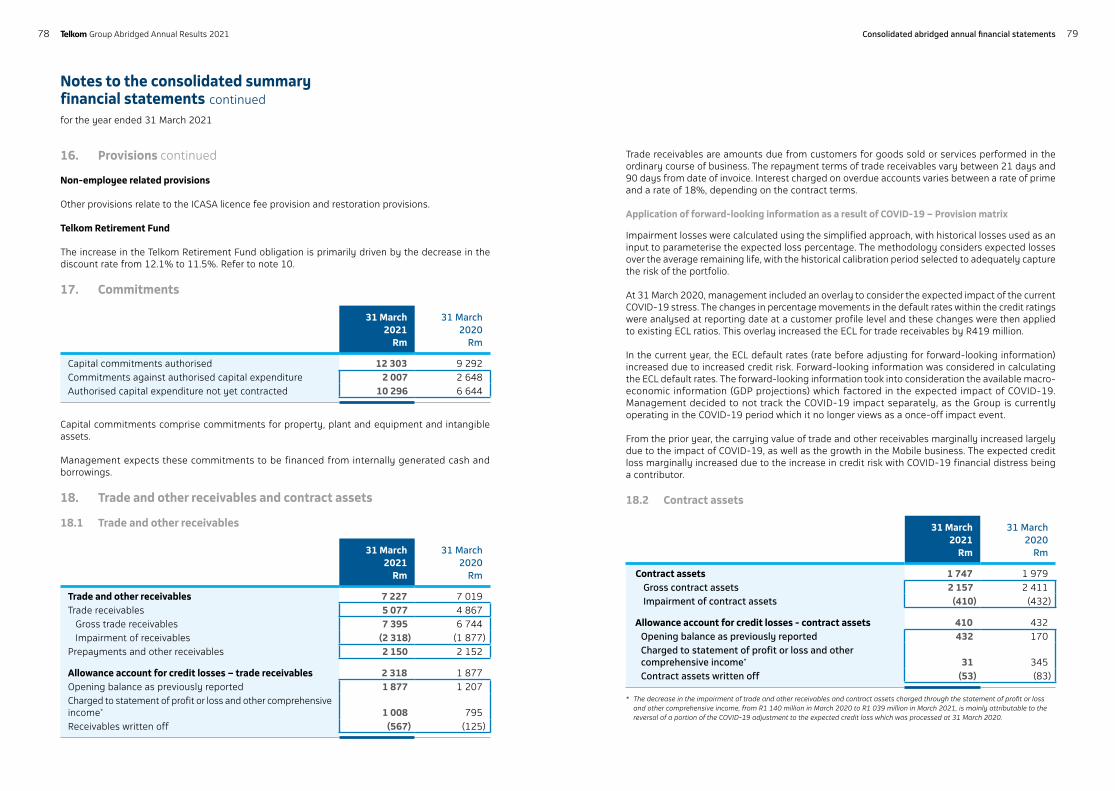
Notes to the consolidated summary financial statements continued
for the year ended 31 March 2021
16. Provisions continued
Non-employee related provisions
Other provisions relate to the ICASA licence fee provision and restoration provisions.
Telkom Retirement Fund
The increase in the Telkom Retirement Fund obligation is primarily driven by the decrease in the discount rate from 12.1% to 11.5%. Refer to note 10.
17. Commitments
31 March2021
Rm
31 March2020
Rm
Capital commitments authorised 12 303 9 292 Commitments against authorised capital expenditure 2 007 2 648 Authorised capital expenditure not yet contracted 10 296 6 644
Capital commitments comprise commitments for property, plant and equipment and intangible assets.
Management expects these commitments to be financed from internally generated cash and borrowings.
18. Trade and other receivables and contract assets
18.1 Trade and other receivables
31 March2021
Rm
31 March2020
Rm
Trade and other receivables 7 227 7 019 Trade receivables 5 077 4 867
Gross trade receivables 7 395 6 744 Impairment of receivables (2 318) (1 877)
Prepayments and other receivables 2 150 2 152
Allowance account for credit losses – trade receivables 2 318 1 877 Opening balance as previously reported 1 877 1 207 Charged to statement of profit or loss and other comprehensive income* 1 008 795 Receivables written off (567) (125)
Trade receivables are amounts due from customers for goods sold or services performed in the ordinary course of business. The repayment terms of trade receivables vary between 21 days and 90 days from date of invoice. Interest charged on overdue accounts varies between a rate of prime and a rate of 18%, depending on the contract terms.
Application of forward-looking information as a result of COVID-19 – Provision matrix
Impairment losses were calculated using the simplified approach, with historical losses used as an input to parameterise the expected loss percentage. The methodology considers expected losses over the average remaining life, with the historical calibration period selected to adequately capture the risk of the portfolio.
At 31 March 2020, management included an overlay to consider the expected impact of the current COVID-19 stress. The changes in percentage movements in the default rates within the credit ratings were analysed at reporting date at a customer profile level and these changes were then applied to existing ECL ratios. This overlay increased the ECL for trade receivables by R419 million. In the current year, the ECL default rates (rate before adjusting for forward-looking information) increased due to increased credit risk. Forward-looking information was considered in calculating the ECL default rates. The forward-looking information took into consideration the available macro-economic information (GDP projections) which factored in the expected impact of COVID-19. Management decided to not track the COVID-19 impact separately, as the Group is currently operating in the COVID-19 period which it no longer views as a once-off impact event.
From the prior year, the carrying value of trade and other receivables marginally increased largely due to the impact of COVID-19, as well as the growth in the Mobile business. The expected credit loss marginally increased due to the increase in credit risk with COVID-19 financial distress being a contributor.
18.2 Contract assets
31 March 2021
Rm
31 March 2020
Rm
Contract assets 1 747 1 979 Gross contract assets 2 157 2 411 Impairment of contract assets (410) (432)
Allowance account for credit losses - contract assets 410 432 Opening balance as previously reported 432 170 Charged to statement of profit or loss and other comprehensive income* 31 345 Contract assets written off (53) (83)
* The decrease in the impairment of trade and other receivables and contract assets charged through the statement of profit or loss and other comprehensive income, from R1 140 million in March 2020 to R1 039 million in March 2021, is mainly attributable to the reversal of a portion of the COVID-19 adjustment to the expected credit loss which was processed at 31 March 2020.
7978 Telkom Group Abridged Annual Results 2021 Consolidated abridged annual financial statements
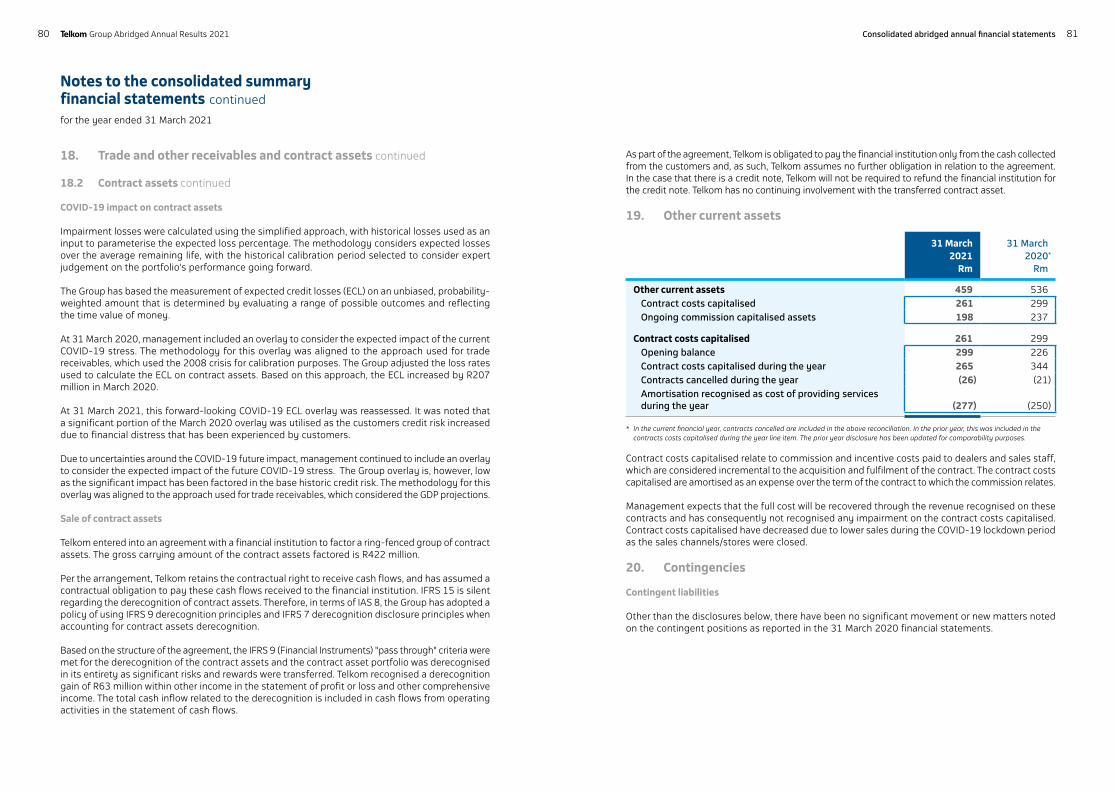
Notes to the consolidated summary financial statements continued
for the year ended 31 March 2021
18. Trade and other receivables and contract assets continued
18.2 Contract assets continued
COVID-19 impact on contract assets
Impairment losses were calculated using the simplified approach, with historical losses used as an input to parameterise the expected loss percentage. The methodology considers expected losses over the average remaining life, with the historical calibration period selected to consider expert judgement on the portfolio's performance going forward.
The Group has based the measurement of expected credit losses (ECL) on an unbiased, probability-weighted amount that is determined by evaluating a range of possible outcomes and reflecting the time value of money.
At 31 March 2020, management included an overlay to consider the expected impact of the current COVID-19 stress. The methodology for this overlay was aligned to the approach used for trade receivables, which used the 2008 crisis for calibration purposes. The Group adjusted the loss rates used to calculate the ECL on contract assets. Based on this approach, the ECL increased by R207 million in March 2020.
At 31 March 2021, this forward-looking COVID-19 ECL overlay was reassessed. It was noted that a significant portion of the March 2020 overlay was utilised as the customers credit risk increased due to financial distress that has been experienced by customers.
Due to uncertainties around the COVID-19 future impact, management continued to include an overlay to consider the expected impact of the future COVID-19 stress. The Group overlay is, however, low as the significant impact has been factored in the base historic credit risk. The methodology for this overlay was aligned to the approach used for trade receivables, which considered the GDP projections.
Sale of contract assets
Telkom entered into an agreement with a financial institution to factor a ring-fenced group of contract assets. The gross carrying amount of the contract assets factored is R422 million.
Per the arrangement, Telkom retains the contractual right to receive cash flows, and has assumed a contractual obligation to pay these cash flows received to the financial institution. IFRS 15 is silent regarding the derecognition of contract assets. Therefore, in terms of IAS 8, the Group has adopted a policy of using IFRS 9 derecognition principles and IFRS 7 derecognition disclosure principles when accounting for contract assets derecognition.
Based on the structure of the agreement, the IFRS 9 (Financial Instruments) "pass through" criteria were met for the derecognition of the contract assets and the contract asset portfolio was derecognised in its entirety as significant risks and rewards were transferred. Telkom recognised a derecognition gain of R63 million within other income in the statement of profit or loss and other comprehensive income. The total cash inflow related to the derecognition is included in cash flows from operating activities in the statement of cash flows.
As part of the agreement, Telkom is obligated to pay the financial institution only from the cash collected from the customers and, as such, Telkom assumes no further obligation in relation to the agreement. In the case that there is a credit note, Telkom will not be required to refund the financial institution for the credit note. Telkom has no continuing involvement with the transferred contract asset. 19. Other current assets
31 March2021
Rm
31 March2020*
Rm
Other current assets 459 536Contract costs capitalised 261 299Ongoing commission capitalised assets 198 237
Contract costs capitalised 261 299 Opening balance 299 226 Contract costs capitalised during the year 265 344Contracts cancelled during the year (26) (21)Amortisation recognised as cost of providing services during the year (277) (250)
* In the current financial year, contracts cancelled are included in the above reconciliation. In the prior year, this was included in the contracts costs capitalised during the year line item. The prior year disclosure has been updated for comparability purposes.
Contract costs capitalised relate to commission and incentive costs paid to dealers and sales staff, which are considered incremental to the acquisition and fulfilment of the contract. The contract costs capitalised are amortised as an expense over the term of the contract to which the commission relates.
Management expects that the full cost will be recovered through the revenue recognised on these contracts and has consequently not recognised any impairment on the contract costs capitalised. Contract costs capitalised have decreased due to lower sales during the COVID-19 lockdown period as the sales channels/stores were closed.
20. Contingencies
Contingent liabilities
Other than the disclosures below, there have been no significant movement or new matters noted on the contingent positions as reported in the 31 March 2020 financial statements.
8180 Telkom Group Abridged Annual Results 2021 Consolidated abridged annual financial statements
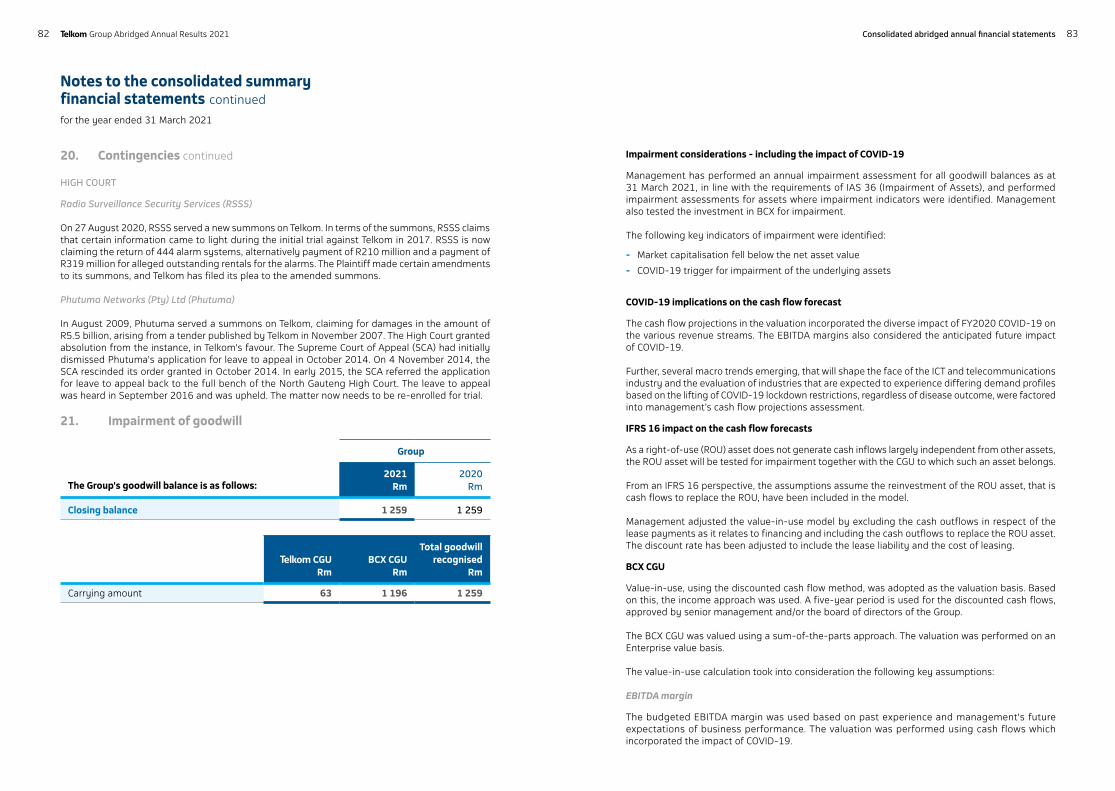
Notes to the consolidated summary financial statements continued
for the year ended 31 March 2021
20. Contingencies continued
HIGH COURT
Radio Surveillance Security Services (RSSS)
On 27 August 2020, RSSS served a new summons on Telkom. In terms of the summons, RSSS claims that certain information came to light during the initial trial against Telkom in 2017. RSSS is now claiming the return of 444 alarm systems, alternatively payment of R210 million and a payment of R319 million for alleged outstanding rentals for the alarms. The Plaintiff made certain amendments to its summons, and Telkom has filed its plea to the amended summons. Phutuma Networks (Pty) Ltd (Phutuma)
In August 2009, Phutuma served a summons on Telkom, claiming for damages in the amount of R5.5 billion, arising from a tender published by Telkom in November 2007. The High Court granted absolution from the instance, in Telkom's favour. The Supreme Court of Appeal (SCA) had initially dismissed Phutuma's application for leave to appeal in October 2014. On 4 November 2014, the SCA rescinded its order granted in October 2014. In early 2015, the SCA referred the application for leave to appeal back to the full bench of the North Gauteng High Court. The leave to appeal was heard in September 2016 and was upheld. The matter now needs to be re-enrolled for trial.
21. Impairment of goodwill
Group
The Group's goodwill balance is as follows:2021
Rm2020
Rm
Closing balance 1 259 1 259
Telkom CGURm
BCX CGURm
Total goodwill recognised
Rm
Carrying amount 63 1 196 1 259
Impairment considerations - including the impact of COVID-19
Management has performed an annual impairment assessment for all goodwill balances as at 31 March 2021, in line with the requirements of IAS 36 (Impairment of Assets), and performed impairment assessments for assets where impairment indicators were identified. Management also tested the investment in BCX for impairment. The following key indicators of impairment were identified:
- Market capitalisation fell below the net asset value
- COVID-19 trigger for impairment of the underlying assets
COVID-19 implications on the cash flow forecast
The cash flow projections in the valuation incorporated the diverse impact of FY2020 COVID-19 on the various revenue streams. The EBITDA margins also considered the anticipated future impact of COVID-19.
Further, several macro trends emerging, that will shape the face of the ICT and telecommunications industry and the evaluation of industries that are expected to experience differing demand profiles based on the lifting of COVID-19 lockdown restrictions, regardless of disease outcome, were factored into management’s cash flow projections assessment.
IFRS 16 impact on the cash flow forecasts
As a right-of-use (ROU) asset does not generate cash inflows largely independent from other assets, the ROU asset will be tested for impairment together with the CGU to which such an asset belongs.
From an IFRS 16 perspective, the assumptions assume the reinvestment of the ROU asset, that is cash flows to replace the ROU, have been included in the model.
Management adjusted the value-in-use model by excluding the cash outflows in respect of the lease payments as it relates to financing and including the cash outflows to replace the ROU asset. The discount rate has been adjusted to include the lease liability and the cost of leasing.
BCX CGU
Value-in-use, using the discounted cash flow method, was adopted as the valuation basis. Based on this, the income approach was used. A five-year period is used for the discounted cash flows, approved by senior management and/or the board of directors of the Group. The BCX CGU was valued using a sum-of-the-parts approach. The valuation was performed on an Enterprise value basis. The value-in-use calculation took into consideration the following key assumptions: EBITDA margin
The budgeted EBITDA margin was used based on past experience and management's future expectations of business performance. The valuation was performed using cash flows which incorporated the impact of COVID-19.
8382 Telkom Group Abridged Annual Results 2021 Consolidated abridged annual financial statements
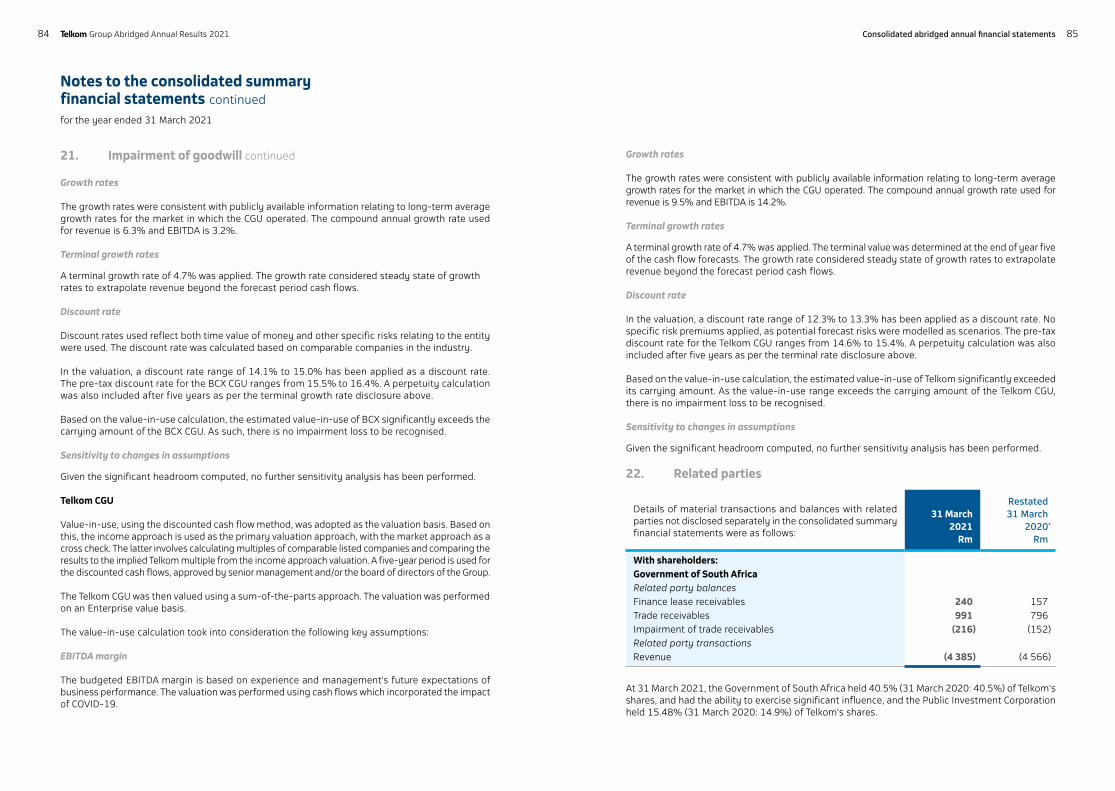
Notes to the consolidated summary financial statements continued
for the year ended 31 March 2021
21. Impairment of goodwill continued
Growth rates
The growth rates were consistent with publicly available information relating to long-term average growth rates for the market in which the CGU operated. The compound annual growth rate used for revenue is 6.3% and EBITDA is 3.2%.
Terminal growth rates
A terminal growth rate of 4.7% was applied. The growth rate considered steady state of growth rates to extrapolate revenue beyond the forecast period cash flows. Discount rate
Discount rates used reflect both time value of money and other specific risks relating to the entity were used. The discount rate was calculated based on comparable companies in the industry.
In the valuation, a discount rate range of 14.1% to 15.0% has been applied as a discount rate. The pre-tax discount rate for the BCX CGU ranges from 15.5% to 16.4%. A perpetuity calculation was also included after five years as per the terminal growth rate disclosure above. Based on the value-in-use calculation, the estimated value-in-use of BCX significantly exceeds the carrying amount of the BCX CGU. As such, there is no impairment loss to be recognised. Sensitivity to changes in assumptions
Given the significant headroom computed, no further sensitivity analysis has been performed.
Telkom CGU
Value-in-use, using the discounted cash flow method, was adopted as the valuation basis. Based on this, the income approach is used as the primary valuation approach, with the market approach as a cross check. The latter involves calculating multiples of comparable listed companies and comparing the results to the implied Telkom multiple from the income approach valuation. A five-year period is used for the discounted cash flows, approved by senior management and/or the board of directors of the Group. The Telkom CGU was then valued using a sum-of-the-parts approach. The valuation was performed on an Enterprise value basis. The value-in-use calculation took into consideration the following key assumptions: EBITDA margin
The budgeted EBITDA margin is based on experience and management’s future expectations of business performance. The valuation was performed using cash flows which incorporated the impact of COVID-19.
Growth rates
The growth rates were consistent with publicly available information relating to long-term average growth rates for the market in which the CGU operated. The compound annual growth rate used for revenue is 9.5% and EBITDA is 14.2%. Terminal growth rates
A terminal growth rate of 4.7% was applied. The terminal value was determined at the end of year five of the cash flow forecasts. The growth rate considered steady state of growth rates to extrapolate revenue beyond the forecast period cash flows. Discount rate
In the valuation, a discount rate range of 12.3% to 13.3% has been applied as a discount rate. No specific risk premiums applied, as potential forecast risks were modelled as scenarios. The pre-tax discount rate for the Telkom CGU ranges from 14.6% to 15.4%. A perpetuity calculation was also included after five years as per the terminal rate disclosure above. Based on the value-in-use calculation, the estimated value-in-use of Telkom significantly exceeded its carrying amount. As the value-in-use range exceeds the carrying amount of the Telkom CGU, there is no impairment loss to be recognised. Sensitivity to changes in assumptions
Given the significant headroom computed, no further sensitivity analysis has been performed.
22. Related parties
Details of material transactions and balances with related parties not disclosed separately in the consolidated summary financial statements were as follows:
31 March2021
Rm
Restated 31 March
2020*
Rm
With shareholders:Government of South AfricaRelated party balancesFinance lease receivables 240 157Trade receivables 991 796Impairment of trade receivables (216) (152)Related party transactionsRevenue (4 385) (4 566)
At 31 March 2021, the Government of South Africa held 40.5% (31 March 2020: 40.5%) of Telkom's shares, and had the ability to exercise significant influence, and the Public Investment Corporation held 15.48% (31 March 2020: 14.9%) of Telkom's shares.
8584 Telkom Group Abridged Annual Results 2021 Consolidated abridged annual financial statements
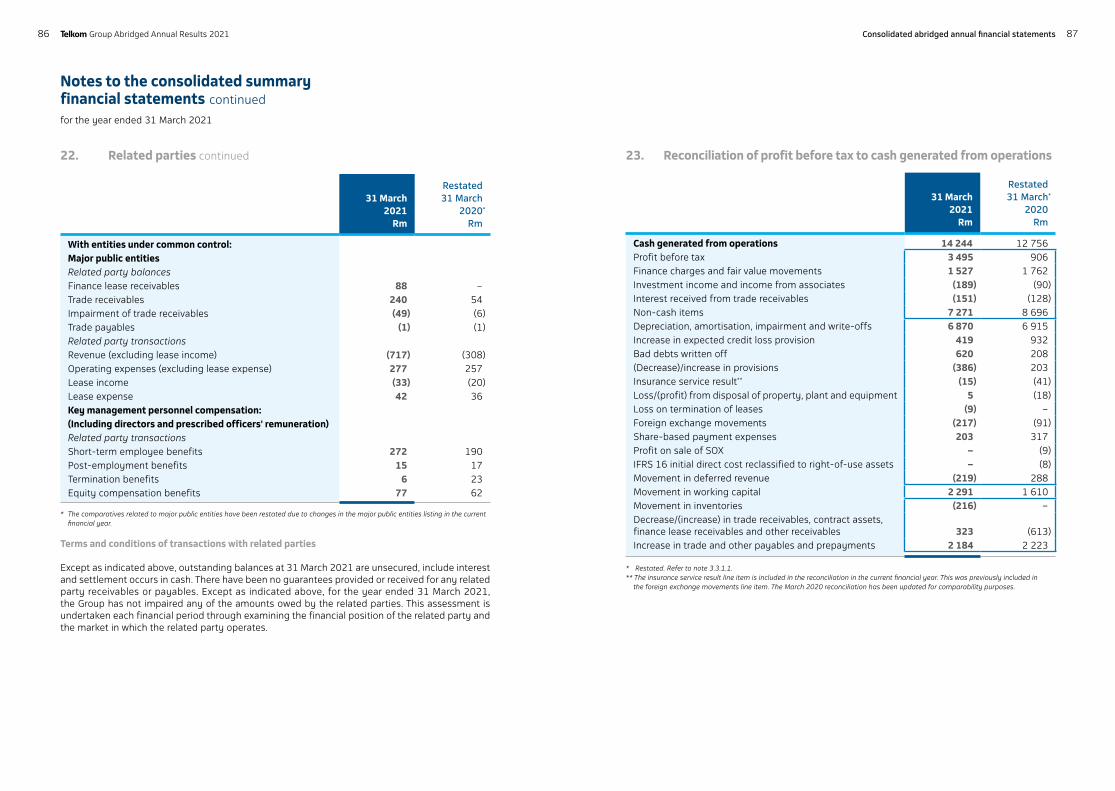
Notes to the consolidated summary financial statements continued
for the year ended 31 March 2021
22. Related parties continued
31 March2021
Rm
Restated 31 March
2020*
Rm
With entities under common control:Major public entitiesRelated party balancesFinance lease receivables 88 – Trade receivables 240 54Impairment of trade receivables (49) (6)Trade payables (1) (1)Related party transactionsRevenue (excluding lease income) (717) (308)Operating expenses (excluding lease expense) 277 257 Lease income (33) (20)Lease expense 42 36Key management personnel compensation:(Including directors and prescribed officers' remuneration)Related party transactionsShort-term employee benefits 272 190 Post-employment benefits 15 17 Termination benefits 6 23 Equity compensation benefits 77 62
* The comparatives related to major public entities have been restated due to changes in the major public entities listing in the current financial year.
Terms and conditions of transactions with related parties
Except as indicated above, outstanding balances at 31 March 2021 are unsecured, include interest and settlement occurs in cash. There have been no guarantees provided or received for any related party receivables or payables. Except as indicated above, for the year ended 31 March 2021, the Group has not impaired any of the amounts owed by the related parties. This assessment is undertaken each financial period through examining the financial position of the related party and the market in which the related party operates.
23. Reconciliation of profit before tax to cash generated from operations
31 March2021
Rm
Restated 31 March*
2020Rm
Cash generated from operations 14 244 12 756Profit before tax 3 495 906 Finance charges and fair value movements 1 527 1 762 Investment income and income from associates (189) (90) Interest received from trade receivables (151) (128) Non-cash items 7 271 8 696Depreciation, amortisation, impairment and write-offs 6 870 6 915 Increase in expected credit loss provision 419 932 Bad debts written off 620 208 (Decrease)/increase in provisions (386) 203Insurance service result** (15) (41) Loss/(profit) from disposal of property, plant and equipment 5 (18) Loss on termination of leases (9) –Foreign exchange movements (217) (91)Share-based payment expenses 203 317 Profit on sale of SOX – (9) IFRS 16 initial direct cost reclassified to right-of-use assets – (8) Movement in deferred revenue (219) 288 Movement in working capital 2 291 1 610 Movement in inventories (216) – Decrease/(increase) in trade receivables, contract assets, finance lease receivables and other receivables 323 (613) Increase in trade and other payables and prepayments 2 184 2 223
* Restated. Refer to note 3.3.1.1.** The insurance service result line item is included in the reconciliation in the current financial year. This was previously included in the foreign exchange movements line item. The March 2020 reconciliation has been updated for comparability purposes.
8786 Telkom Group Abridged Annual Results 2021 Consolidated abridged annual financial statements
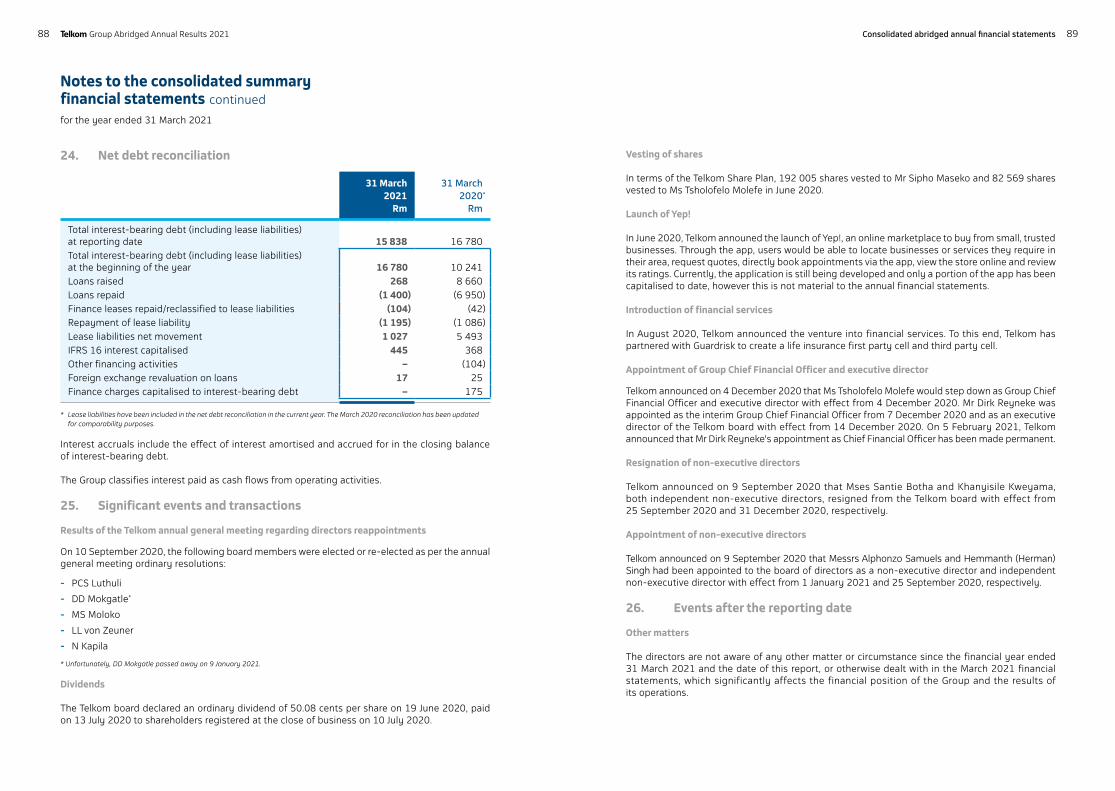
Notes to the consolidated summary financial statements continued
for the year ended 31 March 2021
24. Net debt reconciliation
31 March2021
Rm
31 March2020*
Rm
Total interest-bearing debt (including lease liabilities) at reporting date 15 838 16 780 Total interest-bearing debt (including lease liabilities) at the beginning of the year 16 780 10 241 Loans raised 268 8 660 Loans repaid (1 400) (6 950) Finance leases repaid/reclassified to lease liabilities (104) (42) Repayment of lease liability (1 195) (1 086) Lease liabilities net movement 1 027 5 493 IFRS 16 interest capitalised 445 368 Other financing activities – (104) Foreign exchange revaluation on loans 17 25 Finance charges capitalised to interest-bearing debt – 175
* Lease liabilities have been included in the net debt reconciliation in the current year. The March 2020 reconciliation has been updated for comparability purposes.
Interest accruals include the effect of interest amortised and accrued for in the closing balance of interest-bearing debt.
The Group classifies interest paid as cash flows from operating activities.
25. Significant events and transactions
Results of the Telkom annual general meeting regarding directors reappointments
On 10 September 2020, the following board members were elected or re-elected as per the annual general meeting ordinary resolutions:
- PCS Luthuli
- DD Mokgatle*
- MS Moloko
- LL von Zeuner
- N Kapila
* Unfortunately, DD Mokgatle passed away on 9 January 2021.
Dividends
The Telkom board declared an ordinary dividend of 50.08 cents per share on 19 June 2020, paid on 13 July 2020 to shareholders registered at the close of business on 10 July 2020.
Vesting of shares
In terms of the Telkom Share Plan, 192 005 shares vested to Mr Sipho Maseko and 82 569 shares vested to Ms Tsholofelo Molefe in June 2020.
Launch of Yep!
In June 2020, Telkom announed the launch of Yep!, an online marketplace to buy from small, trusted businesses. Through the app, users would be able to locate businesses or services they require in their area, request quotes, directly book appointments via the app, view the store online and review its ratings. Currently, the application is still being developed and only a portion of the app has been capitalised to date, however this is not material to the annual financial statements. Introduction of financial services
In August 2020, Telkom announced the venture into financial services. To this end, Telkom has partnered with Guardrisk to create a life insurance first party cell and third party cell. Appointment of Group Chief Financial Officer and executive director
Telkom announced on 4 December 2020 that Ms Tsholofelo Molefe would step down as Group Chief Financial Officer and executive director with effect from 4 December 2020. Mr Dirk Reyneke was appointed as the interim Group Chief Financial Officer from 7 December 2020 and as an executive director of the Telkom board with effect from 14 December 2020. On 5 February 2021, Telkom announced that Mr Dirk Reyneke's appointment as Chief Financial Officer has been made permanent.
Resignation of non-executive directors
Telkom announced on 9 September 2020 that Mses Santie Botha and Khanyisile Kweyama, both independent non-executive directors, resigned from the Telkom board with effect from 25 September 2020 and 31 December 2020, respectively.
Appointment of non-executive directors
Telkom announced on 9 September 2020 that Messrs Alphonzo Samuels and Hemmanth (Herman) Singh had been appointed to the board of directors as a non-executive director and independent non-executive director with effect from 1 January 2021 and 25 September 2020, respectively. 26. Events after the reporting date
Other matters
The directors are not aware of any other matter or circumstance since the financial year ended 31 March 2021 and the date of this report, or otherwise dealt with in the March 2021 financial statements, which significantly affects the financial position of the Group and the results of its operations.
8988 Telkom Group Abridged Annual Results 2021 Consolidated abridged annual financial statements