abridged annual report 2020 - 2021
TRANSCRIPT

Abridged Annual Report 2020 - 2021

HSBC Large Cap Equity FundLarge Cap Fund – An open ended equity Scheme predominantly investing in large cap stocks
Abridged Annual Report 2020 - 2021

1
HSBC Large Cap Equity Fund
Dear Investor,
The beginning of the last financial year now almost seems like a distant memory. COVID-19 was still a relatively unknown enemy and governments across the world were grappling with ways to control and mitigate the risks associated with it. Nationwide lockdowns were the norm and our markets both equity and fixed income reacted negatively leading to significant erosion of wealth. Within a short period of time markets bounced back. This confounded even the most astute market pundits. How is it possible that when GDP growth had slowed down, unemployment had risen, inflation was high could there be such sharp up move in equity indices. Whilst the reasons are well known about easy global liquidity, demand resurgence, cost cutting by corporates etc. perhaps its most important to remember that the markets are not a reflector but a predictor of economic activity.
At all times particularly during such volatile times it is important to go back to the basics. Why do you save, why do you invest, what goals would you like to achieve, how old are you, what is your risk appetite? The replies to these simple questions will help you determine your asset allocation. As an example when equity markets corrected sharply last year, investors who reviewed their asset allocation, stayed invested during the lows of the past year and were able to capture the rebound and have seen prime returns since then. The current market movement in all likelihood would have also led to some imbalances in your asset allocation. Do not ignore that and I strongly recommend that you do review this with your advisor to check whether re-balancing is required.
During this financial year we had three very successful new fund launches. The pandemic showed us a clear trend of dominant players becoming stronger and profit pool getting consolidated within a few companies. To capture this opportunity, we launched the HSBC Focused Equity Fund which garnered close to Rs. 520 crores. During the second half of 2020, in the fixed income space, 3 - 5 year duration range had a favourable investment scenario as RBI’s accommodative policy and surplus liquidity had reduced the returns at the very short end of the yield curve. There was a demand for an actively managed moderate duration strategy with better credit quality which we fulfilled by launching HSBC Corporate Bond Fund. It garnered over 700 crores. Our latest and first of its kind offering, HSBC Global Equity Climate Change Fund of Fund saw a stupendous response with over 8000 investors investing over Rs. 616 crores. This is an investment opportunity which goes beyond the rationale of simply generating investment returns and is the future of responsible investing.
We worked towards augmenting our digital capabilities by launching a few key enhancements to our online transaction platform. Being mindful of the movement restrictions in place, this year we focused on digitizing offline processes so that an investor need not need step out of her home for investing or availing any key services. While our interactive chatbot AskMe, eased service queries, our end-to-end digital KYC module enabled a first time Mutual Fund investor to invest in our funds without any paperwork. We listened to your feedback and digitized consolidation of folios and change of tax status which eliminated the need for you to physically visit our branches.
I am a strong believer in the India story and this story has just begun. The opportunity to invest in this high growth market is a very exciting opportunity. I do hope you share my enthusiasm and I ask that you continue to invest whilst reviewing your asset allocation at all times. As always thank you for your business. Stay safe.
Warm regards,
Ravi MenonChief Executive Officer,
HSBC Asset Management India

2
Abridged Annual Report 2020 - 2021
SPONSOR
HSBC Securities and Capital Markets (India) Private LimitedRegd. Office: 52/60, Mahatma Gandhi Road, Fort, Mumbai - 400 001.
TRUSTEE
Board of TrusteesOffice: 16, Veer Nariman Road, Fort, Mumbai 400 001.
ASSET MANAGEMENT COMPANY
HSBC Asset Management (India) Private LimitedCorp. & Regd. Office: 16, Veer Nariman Road, Fort, Mumbai 400 001.
CUSTODIAN
Standard Chartered Bank (SCB)Corp. & Regd. Office: Crescenzo, Securities Services, 3rd Floor, C-38/39, G-Block,Bandra Kurla Complex, Bandra East, Mumbai – 400051.
AUDITORS TO THE SCHEME
BSR & Co. LLPChartered Accountants
5th Floor, Lodha Excelus, Apollo Mills Compound, N. M. Joshi Marg, Mahalaxmi, Mumbai 400 011.
REGISTRAR & TRANSFER AGENTS
Computer Age Management Services Limited (CAMS)Unit: HSBC Mutual Fund ’C’ Block, 2nd Floor, Hanudev Info Park P. Ltd., SF No. 558/2, Udayampalayam Road, Nava India, Coimbatore - 641 028.
BOARD OF TRUSTEES
Ms. Jasmine Batliwalla - Chairperson
Mr. Nani Javeri - Trustee
Dr. T. C. Nair - Trustee
Mr. Pedro Bastos - Trustee
BOARD OF DIRECTORS
Mr. Dinesh Mittal - Director
Dr. Indu Shahani - Director
Mr. Ravi Menon - Director & Chief Executive Officer

3
HSBC Large Cap Equity Fund
The Trustees of HSBC Mutual Fund (“Fund”) present the Nineteenth Annual Report and the audited abridged financial statements of the schemes of the Fund for the year ended March 31, 2021.
As at March 31, 2021, the Fund offered 37 schemes across asset classes to meet the varying investment needs of the investors. During FY 2020-2021, the Fund has launched various new products namely HSBC Corporate Bond Fund, HSBC Focused Equity Fund and HSBC Global Equity Climate Change Fund of Fund to fill the gaps in our product offering.
The Fund continues its focus on delivering consistent long term returns. The comments on the performance of the Scheme(s) is provided hereinafter. Dividends were declared under various schemes as per the provisions contained in the respective Scheme Information Documents after considering the distributable surplus available under the respective Schemes. Details of dividends declared can be viewed on our website at www.assetmanagement.hsbc.co.in.
1. Scheme Performance, future outlook and oPerationS of the SchemeS
a. operations and Performance of the Schemes
hSBc large cap equity fund (hlef) (large cap fund – an open ended equity scheme predominantly investing in large cap stocks)
HLEF seeks to generate long-term capital growth from an actively managed portfolio of equity and equity related securities of predominantly large cap companies. However, there can be no assurance or guarantee that the investment objective of the scheme would be achieved.
The net assets of HLEF amounted to Rs. 700.54 crores as at March 31, 2021 as against Rs. 504.87 crores as at March 31, 2020. Around 99.17% of the net assets were invested in equities, 0.90% of the net assets were invested in reverse repos / TREPS and (-0.07%) in net current assets as at March 31, 2021.
HLEF is a large cap fund and it remained invested in a diversified portfolio across large capitalization stocks. The scheme has outperformed its benchmark since inception however underperformed over a 1, 3 & 5 year periods. The one-year performance compared to the benchmark was adversely impacted due to both stock selection and sector allocation factors. Stock selection in Materials and Consumer Discretionary dragged the performance. From a sectoral perspective, higher weight in Consumer Staples (vs. benchmark) adversely impacted the performance.
Looking ahead, the AMC believes that the trend of profit pool consolidating with the dominant players in respective sectors / industries, is likely to continue and disruptions such as COVID, could accelerate that shift. The Fund Manager is positive on the theme of profit pool migration and consolidation visible across and within sectors. So as a result, the AMC would be focusing on market leaders or dominant companies within each sectors that are available at reasonable valuations. The AMC’s bottom up stock selection also focuses on earnings growth and within that there is an emphasis on stocks that are likely to deliver positive earnings surprises.
The AMC is of the view that the impact of the second wave would be short term in nature followed by a quick rebound. As a result, the Fund Manager is maintaining a pro-cyclical bias in the portfolio. Earnings growth is expected to rebound sharply in FY22 (post the short disruption period in 1Q). Earnings growth momentum is expected to sustain in high-teens beyond FY22 on the back of economy witnessing a cyclical recovery due to revival in capex cycle over the next 2-3 years (first by the government followed by private capex). Benign cost of capital and reasonable valuations (in the context of multi-year earnings outlook), should act as additional support to the equity performance, in the medium term. From a sectoral perspective the order of preference is rate sensitives followed by domestic cyclicals, exporters and domestic consumption. Predominantly regulated businesses come last in the pecking order. This preference is dictated by AMC’s assessment of sectors / segments leading contribution to the market earnings growth over the next 2-3 years. In line with this thought process, the Fund Manager is running an overweight position in Financials (within that lenders), Healthcare, Industrials and Real Estate sectors. Within sub-sectors, the fund is overweight on Cement, Chemicals & Auto (CVs) sectors. Technology is a neutral weighted sector. Consumer Staples, Energy, Utilities and Communication Services are the underweight sectors.
Trustees’ ReportFor the year ended March 31, 2021
4
Abridged Annual Report 2020 - 2021
Trustees’ ReportFor the year ended March 31, 2021 (Contd...)
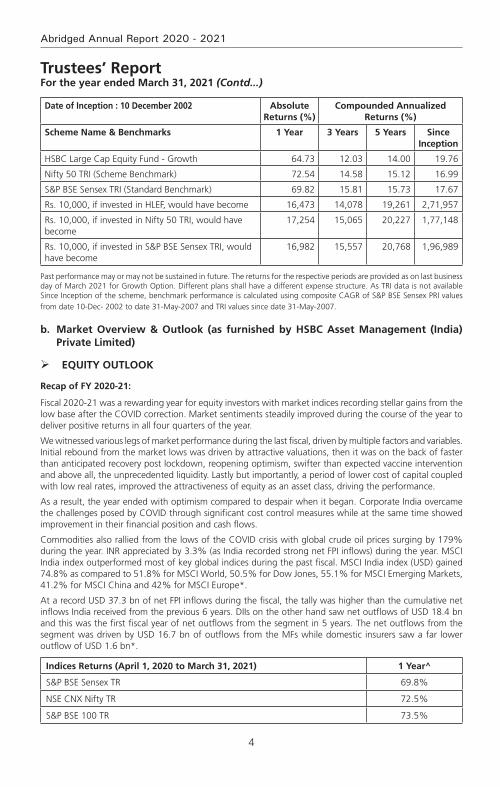
date of inception : 10 december 2002 absolute returns (%)
compounded annualized returns (%)
Scheme name & Benchmarks 1 Year 3 Years 5 Years Since inception
HSBC Large Cap Equity Fund - Growth 64.73 12.03 14.00 19.76
Nifty 50 TRI (Scheme Benchmark) 72.54 14.58 15.12 16.99
S&P BSE Sensex TRI (Standard Benchmark) 69.82 15.81 15.73 17.67
Rs. 10,000, if invested in HLEF, would have become 16,473 14,078 19,261 2,71,957
Rs. 10,000, if invested in Nifty 50 TRI, would have become
17,254 15,065 20,227 1,77,148
Rs. 10,000, if invested in S&P BSE Sensex TRI, would have become
16,982 15,557 20,768 1,96,989
Past performance may or may not be sustained in future. The returns for the respective periods are provided as on last business day of March 2021 for Growth Option. Different plans shall have a different expense structure. As TRI data is not available Since Inception of the scheme, benchmark performance is calculated using composite CAGR of S&P BSE Sensex PRI values from date 10-Dec- 2002 to date 31-May-2007 and TRI values since date 31-May-2007.
b. market overview & outlook (as furnished by hSBc asset management (india) Private limited)
equitY outlook
recap of fY 2020-21:
Fiscal 2020-21 was a rewarding year for equity investors with market indices recording stellar gains from the low base after the COVID correction. Market sentiments steadily improved during the course of the year to deliver positive returns in all four quarters of the year.
We witnessed various legs of market performance during the last fiscal, driven by multiple factors and variables. Initial rebound from the market lows was driven by attractive valuations, then it was on the back of faster than anticipated recovery post lockdown, reopening optimism, swifter than expected vaccine intervention and above all, the unprecedented liquidity. Lastly but importantly, a period of lower cost of capital coupled with low real rates, improved the attractiveness of equity as an asset class, driving the performance.
As a result, the year ended with optimism compared to despair when it began. Corporate India overcame the challenges posed by COVID through significant cost control measures while at the same time showed improvement in their financial position and cash flows.
Commodities also rallied from the lows of the COVID crisis with global crude oil prices surging by 179% during the year. INR appreciated by 3.3% (as India recorded strong net FPI inflows) during the year. MSCI India index outperformed most of key global indices during the past fiscal. MSCI India index (USD) gained 74.8% as compared to 51.8% for MSCI World, 50.5% for Dow Jones, 55.1% for MSCI Emerging Markets, 41.2% for MSCI China and 42% for MSCI Europe*.
At a record USD 37.3 bn of net FPI inflows during the fiscal, the tally was higher than the cumulative net inflows India received from the previous 6 years. DIIs on the other hand saw net outflows of USD 18.4 bn and this was the first fiscal year of net outflows from the segment in 5 years. The net outflows from the segment was driven by USD 16.7 bn of outflows from the MFs while domestic insurers saw a far lower outflow of USD 1.6 bn*.
indices returns (april 1, 2020 to march 31, 2021) 1 Year^
S&P BSE Sensex TR 69.8%
NSE CNX Nifty TR 72.5%
S&P BSE 100 TR 73.5%

5
HSBC Large Cap Equity Fund
Trustees’ ReportFor the year ended March 31, 2021 (Contd...)
indices returns (april 1, 2020 to march 31, 2021) 1 Year^
S&P BSE 200 TR 76.3%
S&P BSE 500 TR 78.6%
S&P BSE Midcap TR 93.0%
S&P BSE 250 Small-cap TR 117.5%
^Source: Bloomberg (Above table values are for total return indices)
Way forward:
Beginning of the new fiscal, India had to contend with the risk of the second COVID wave, which was more ferocious than the first wave on the human impact. However, as we write this, the second wave has already peaked and there have been a significant fall in number of active cases, case-positivity rate, daily new caseload and deaths. Vaccination drive also has seen acceleration with and is now closer to 6 mn doses per day mark. Also, the impact of the lockdown on economic activity has been significantly lower during the second wave, compared to last year. In most of the states, the unlocking process has already begun in a phased manner and this is leading to improvement in various activity indicators. Mobility indicators are recovering faster while economic indicators (freight, credit off-take, E-way bill generation, power demand etc.) are also witnessing a gradual recovery. The recently concluded earnings season has turned out to be in-line with expectations and despite the concerns of around the second wave, the earnings (Nifty) have seen upgrades for FY22. Market is looking beyond the current quarter (i.e. 1QFY22), which would witness an impact due to the second wave. Our baseline assumption is that of a temporary impact from the second wave and the set-back to the recovery process limited to a few months, after which we should see the economic rebound. So far, this is tracking in-line with assumptions.
From a macro perspective, the current estimates for GDP growth in FY22 stand at 9.2%* (after seeing downgrades to factor in the impact of second wave). The downgrade in estimates are pertaining to the first quarter and hence the trajectory of growth from hereon should pick up. The tax collections data for the first two months of FY22 has remained strong, implying that the drawdown of the second wave on the fiscal position is not alarming. Additionally, the impact of fiscal stimulus package announced in FY22 so far is manageable (about 60 bps of GDP) and hence would not lead to any fiscal strain.
After the spectacular rally, market valuations at an overall level are now trending above historical averages on traditional valuation metrics (P/E, P/B). This is true for all market capitalization categories (viz large, mid and small). Typically, the broader market (i.e. mid and small cap segments), trade at a discount to large caps, however this scenario has now reversed after the outperformance from the broader market segments. However, the earnings momentum continues to remain strong (witnessing upgrades so far) and except for a short period due to second wave, the earnings momentum should hold up.
We believe that the risk-reward is balanced for the equity markets in the near term. Higher or sticky inflation expectations globally, higher than historical market valuations on some parameters (i.e. P/E, P/B) and adverse demand impact from the second wave are risk factors to contend with in the near term. However, these are counter balanced by positive commentary from companies, significant decline in COVID cases and acceleration in the vaccination programme. As a result, in the near term markets may see a consolidation phase and could take cues from the upcoming earnings season with more focus on the corporate commentary and the outlook. From a medium to long term perspective, the outlook for equity markets remains positive. The expectation of cyclical revival in the economy brings in a multi-year earnings visibility. This along with a benign cost of capital environment, should support equity performance. However, equity returns are likely to moderate on the back of the relatively high valuations and the strong recovery we have already witnessed from the COVID lows. Equity performance is likely to mirror the earnings growth trends over the medium to long term.
Pace of vaccination, concerns about a third wave, corporate earnings trajectory, inflation trends (both global & domestic), monsoon trends and commodity prices (especially crude oil) are some of the key factors which could influence market performance in the short term.
From a portfolio perspective, we are maintaining a pro-cyclical bias. We expect earnings growth to rebound sharply post the current COVID phase. Earnings growth are expected to sustain in high-teens beyond FY22

6
Abridged Annual Report 2020 - 2021
Trustees’ ReportFor the year ended March 31, 2021 (Contd...)
on the back of economy witnessing a cyclical recovery due to revival in capex cycle over the next 2-3 years (first by the government followed by private capex). From a sectoral perspective our order of preference is rate sensitives followed by domestic cyclicals, exporters and domestic consumption. Predominantly regulated businesses come last in our pecking order. This preference is dictated by our assessment of sectors / segments leading contribution to the market earnings growth over the next 2-3 years. Our portfolio construction is driven by a bottom up approach to stock selection with a focus on names that can deliver positive earnings surprises. We continue to focus on this theme to identify likely outperformers.
*Source: Bloomberg
deBt outlook
market drivers during the course of the year fY21
The Fixed Income markets started the year with a bout of nervousness that was triggered by the pandemic. While RBI had calmed the markets with its large rate cut action of 75bp cut followed by liquidity supportive measures, the volatility continued until mid-May when government announced its relief package. While it was not fiscally expansive, it touched the right cords in terms of credit flow to desired sectors. This was followed up with RBI’s credit relief measures in terms of moratorium and restructuring of assets that were stressed due to the pandemic. Throughout the course of the year, RBI maintained its accommodative stance along with significant amount of surplus liquidity that was supportive and helped in maintaining stability in the market. However, as the year progressed and pressure on fiscal began to mount yields started seeing a spike towards the last quarter of the fiscal. While borrowing was stepped up to INR 12 trillion from previously budgeted INR 7.8 trillion in May 2020, it was further enhanced by and additional INR 1.1 trillion in October 2020. Overall GOI ended up borrowing a record amount of INR 13.9 trillion. The budget proved to be a shocker with GOI using the pandemic as an opportunity for setting the finances in order. GOI showed a record deficit of 9.5% for FY21 and projected a 6.8% for FY22 with estimated central government gross borrowing of INR 12 trillion. This seemed to reverse the support RBI had provided throughout the year with benchmark 10-year bond peaking to 6.23% in mid –Feb 2021. RBI’s statements to remain supportive were left in the sidelines. Overall it seemed that the 115bp of rate cut, along with significant liquidity infusion (OMO + Twist operations of ~INR 3 trillion, infusion via dollar purchases) seemed only a little to help in applying a brake to the one-way spike in yields. The year closed ~6.16% with absence of concrete action by RBI.
rBi Policy: Through the course of the year, RBI has maintained an accommodative stance, with an aggregate 115bp of rate cut done in March and May 2020 taking the repo rate from 5.15% to 4%. Subsequently while inflation pressures prevented RBI from taking any direct actions, RBI has used a combination of creative tools to keep the rates contained primarily via liquidity supportive tools such as OMOs, Twist Operations, Repo linked Term loans to needy sectors (LTROs, TLTROs), CRR cuts. While inflation was a worry for most part of the year, RBI kept it aside admitting that growth was a priority and inflation effects are more supply side rather than demand side. Prospectively into FY22, with the onset of the second wave, RBI continues to maintain the stance to prioritize growth.
inflation: Inflation for most part of the year stayed above 6% primarily driven by supply side pressures and some intermittent spike from food inflation as well. While it has been coming off since December with cooling off of food inflation and positive base effects, it has been between 4- 5.5%. Structurally however inflation risks continue to remain as oil prices have increased and base effects will not remain supportive for long. Core inflation continues to remain sticky.
liquidity: During the year, system liquidity has remained at significant surplus facilitated largely by RBI action such as OMOs, foreign exchange operations and government spending.
Budget: The FY2022 union budget focuses on growth and has accordingly, presented a 9.5% fiscal deficit for FY21 and 6.8% for FY22. On the revenue side, the assumptions are largely realistic, with FY22 (E) Nominal GDP growth at 14.4% and tax revenue growth at 17% considering the pandemic impact in FY 21. Compared to FY20, tax revenue growth is ~10%. While non-tax revenues are ambitious pegging the divestment at INR 1.75 trillion, with robust pipeline of assets including monetization of road and transmission assets, execution remains the key as in the past. On the expenditure side, better quality capex spending with focusing on rail, road, defense, urban infra is positive for long term structural growth. The revenue side expenditure adjusting
7
HSBC Large Cap Equity Fund
Trustees’ ReportFor the year ended March 31, 2021 (Contd...)
for clearance of past subsidy arrears will be similar to budgetary estimates. Government using this opportunity to bring back off-balance sheet spending to on-balance sheet was a welcome move towards transparency and showing realistic projections. Alongside, states have also been given leeway to borrow upto 4% of their GDP with an additional 0.5% subject to conditions. Given that states are an important vehicle for capex investment, this move is welcome although it may entail additional state borrowing. The fiscal glide path is shifted to FY26 at below 4.5% for center and 3% for states suggesting that spending will continue and borrowing will come down gradually. In summary, from survival to revival, FY22 budget aims for structural growth leaving fiscal concerns sideways in the interim. Government’s intent seems clear on bringing back growth on the table, in a transparent manner.
While the second wave of the pandemic has once again derailed the revenue story, government will still have some cushion from its conservative estimates.
currency and fii flows: INR has been on an appreciation trajectory for most part of the year, aided by dollar underperformance supported by positive FII and FDI flows along with reduced imports on the domestic front as well. RBI has used most of the flows to accumulate reserves which has prevented any strong appreciation. Pandemic shock and global risk off led rupee over 75 in the beginning of the year only to close below 72 at the end of the fiscal year. While the second wave led to another spike in INR in April, it has since then cooled once again driven by dollar underperformance and pandemic recovery on the domestic front. Net FII flows was ~$30 bn with positive equity flows of~$37 bn while debt was negative ~$7bn and overall RBI’s forex reserves rose by a ~$100 bn to close ~$537 bn.
credit growth: Credit growth for the entire year has been tepid as previous year’s credit events were followed by nervousness relating to the pandemic. Despite RBI opening up several windows to finance the non-AAA segment, there was very little fresh credit flowing that segment. Overall banking credit grew by only 6.5%. Risk appetite has however been improving from a complete risk aversion to opening up towards a calculated risk. Prospectively it is expected that once the pandemic risk abates, credit growth will resume primarily driven by government capex spending and demand recovery.
market outlook
The pandemic once again brought the country to a situation similar to last year and debt markets perhaps interpreted the same as a structural rise in rates. In the initial day’s post budget in Feb of 2021, market was expecting a concrete set of actions such as an OMO calendar from RBI, and RBI’s words alone failed to calm the market. The first auction of the fiscal year also saw a devolvement. However, RBI acted in the first policy of the year announcing a bond buyback program akin to QE (quantitative easing) and its subsequent cancellation of auctions wherein yields were perhaps quoted higher than RBI’s comfort levels brought back confidence into the market. Since then we have seen a strong rally with 10-year benchmark trending below 6% and the curve moving alongside. RBI reiteration of priority of growth and also supporting with higher than expected dividend payment stand out as a testimony of its support. While we do not expect RBI to act in terms of rate cuts, we believe that measures such as G-SAP, OMOs will continue until there is visibility of a structural growth. Therefore, the large borrowing program should go without any hiccups.
Furthermore, with the evidence of strong GST numbers until April 2021 (before the 2nd wave), it is expected that growth and therefore fiscal revenues will come back. Government’s conservative budget estimates are supportive. Also, given the fact that compared to last year there has not been a complete shutdown of activity (lockdowns being distributed), the impact on growth will not be similar to last year. Pent up demand will come back to support revenue collection. However, on the flipside, once growth resumes RBI will be forced to withdraw liquidity in a phased manner to prevent asset bubbles. Nevertheless, RBI need not act in terms of rate actions and we believe that a prolonged pause in terms of RBI rates is in the offing.
Net-net therefore while growth is wanting no matter what, it may come at a small price of rise in yields with liquidity withdrawal. That is however expected more in the 2nd half of the year. Lower than expected borrowing numbers, later this year or if not in next year could be a surprise. We may therefore see a range bound rate action in the near term with a rising bias over time. Global rate environment, oil and currency risks are to be watched out for.
8
Abridged Annual Report 2020 - 2021
Trustees’ ReportFor the year ended March 31, 2021 (Contd...)
2. Brief Background of SPonSorS, Board of truSteeS and aSSet management comPanY
a. Sponsor
HSBC Mutual Fund is sponsored by HSBC Securities and Capital Markets (India) Private Limited (HSCI). The Sponsor is the Settler of the Mutual Fund Trust. The Sponsor has entrusted a sum of Rs. 1,00,000/- (Rupees One Lakh only) to the Trustee as the initial contribution towards the corpus of the Mutual Fund.
HSCI offers integrated investment banking services, securities and corporate finance & advisory. HSCI is a member of the Bombay Stock Exchange Limited and National Stock Exchange (capital and derivative market segments). HSCI holds 100% of the paid up equity share capital of HSBC Asset Management (India) Private Limited.
b. hSBc mutual fund
HSBC Mutual Fund (“the Mutual Fund” or “the Fund”) has been constituted as a Trust in accordance with the provisions of the Indian Trusts Act, 1882 (2 of 1882) vide a Trust Deed dated February 7, 2002 with HSBC Securities and Capital Markets (India) Private Limited, as the Sponsor and the Board of Individual Trustees. The Trustee has entered into an Investment Management Agreement dated February 7, 2002 with HSBC Asset Management (India) Private Limited (AMC) to function as the Investment Manager for all the schemes of the Fund. The Fund was registered with SEBI vide registration number MF/046/02/5 dated May 27, 2002.
The Trust has been formed for the purpose of pooling of capital from the public for collective investment in securities for the purpose of providing facilities for participation by persons as beneficiaries in such investments and in the profits/income arising therefrom.
c. Board of trustees (the trustees)
The Board of Trustees is the exclusive owner of the Trust Fund and holds the same in trust for the benefit of the unit holders. The Trustees have been discharging their duties and carrying out the responsibilities as provided in the SEBI (Mutual Funds) Regulations, 1996 and the Trust Deed. The Trustees seek to ensure that the Fund and the schemes floated there under are managed by the AMC in accordance with the Trust Deed, the said Regulations, directions and guidelines issued by the SEBI, the Stock Exchanges, the Association of Mutual Funds in India and other regulatory agencies.
d. asset management company (the amc)
HSBC Asset Management (India) Private Limited (the Investment Manager or the AMC) is a private limited company incorporated under the Companies Act, 1956 on December 12, 2001 having its Registered Office at 16, V. N. Road, Fort, Mumbai 400 001. HSBC Asset Management (India) Private Limited has been appointed as the Asset Management Company of HSBC Mutual Fund by the Trustee vide Investment Management Agreement (IMA) dated February 7, 2002 and executed between the Trustees and the AMC. SEBI approved the AMC to act as the Investment Manager of the Fund vide its letter No. MFD/BC/163/2002 dated May 27, 2002. The paid-up equity share capital of the AMC is Rs. 61.59 crores. The AMC is registered as a Portfolio Manager under the SEBI (Portfolio Managers) Regulations, 1993 vide registration no. INP000001322. The AMC also offers non-binding Advisory services to offshore funds under the mutual fund license.
HSBC Securities and Capital Markets (India) Private Limited holds 100% of the paid up equity share capital of the AMC.
3. inveStment oBjective of the SchemeSThe investment objective of the respective schemes has been provided above under the heading “Scheme Performance, Future Outlook and Operation of the Scheme” (Refer Section 1).
4. Significant accounting PolicieS The Significant Accounting Policies form part of the Notes to the Accounts annexed to the Balance Sheet of the Schemes in the Full Annual Report. The accounting policies are in accordance with Securities Exchange Board of India (Mutual Funds) Regulations 1996.
9
HSBC Large Cap Equity Fund
Trustees’ ReportFor the year ended March 31, 2021 (Contd...)
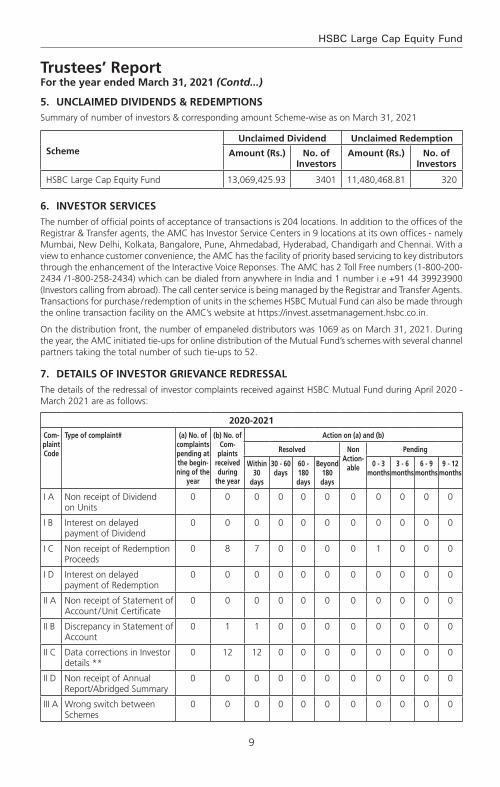
5. unclaimed dividendS & redemPtionSSummary of number of investors & corresponding amount Scheme-wise as on March 31, 2021
Schemeunclaimed dividend unclaimed redemption
amount (rs.) no. of investors
amount (rs.) no. of investors
HSBC Large Cap Equity Fund 13,069,425.93 3401 11,480,468.81 320
6. inveStor ServiceSThe number of official points of acceptance of transactions is 204 locations. In addition to the offices of the Registrar & Transfer agents, the AMC has Investor Service Centers in 9 locations at its own offices - namely Mumbai, New Delhi, Kolkata, Bangalore, Pune, Ahmedabad, Hyderabad, Chandigarh and Chennai. With a view to enhance customer convenience, the AMC has the facility of priority based servicing to key distributors through the enhancement of the Interactive Voice Reponses. The AMC has 2 Toll Free numbers (1-800-200-2434 /1-800-258-2434) which can be dialed from anywhere in India and 1 number i.e +91 44 39923900 (Investors calling from abroad). The call center service is being managed by the Registrar and Transfer Agents. Transactions for purchase / redemption of units in the schemes HSBC Mutual Fund can also be made through the online transaction facility on the AMC’s website at https://invest.assetmanagement.hsbc.co.in.
On the distribution front, the number of empaneled distributors was 1069 as on March 31, 2021. During the year, the AMC initiated tie-ups for online distribution of the Mutual Fund’s schemes with several channel partners taking the total number of such tie-ups to 52.
7. detailS of inveStor grievance redreSSalThe details of the redressal of investor complaints received against HSBC Mutual Fund during April 2020 - March 2021 are as follows:
2020-2021
com-plaint code
type of complaint# (a) no. of complaints pending at the begin-ning of the
year
(b) no. of com-
plaints received during
the year
action on (a) and (b)
resolved non action-
able
Pending
Within 30
days
30 - 60 days
60 - 180 days
Beyond 180 days
0 - 3 months
3 - 6 months
6 - 9 months
9 - 12 months
I A Non receipt of Dividend on Units
0 0 0 0 0 0 0 0 0 0 0
I B Interest on delayed payment of Dividend
0 0 0 0 0 0 0 0 0 0 0
I C Non receipt of Redemption Proceeds
0 8 7 0 0 0 0 1 0 0 0
I D Interest on delayed payment of Redemption
0 0 0 0 0 0 0 0 0 0 0
II A Non receipt of Statement of Account / Unit Certificate
0 0 0 0 0 0 0 0 0 0 0
II B Discrepancy in Statement of Account
0 1 1 0 0 0 0 0 0 0 0
II C Data corrections in Investor details **
0 12 12 0 0 0 0 0 0 0 0
II D Non receipt of Annual Report/Abridged Summary
0 0 0 0 0 0 0 0 0 0 0
III A Wrong switch between Schemes
0 0 0 0 0 0 0 0 0 0 0
10
Abridged Annual Report 2020 - 2021
Trustees’ ReportFor the year ended March 31, 2021 (Contd...)
2020-2021
com-plaint code
type of complaint# (a) no. of complaints pending at the begin-ning of the
year
(b) no. of com-
plaints received during
the year
action on (a) and (b)
resolved non action-
able
Pending
Within 30
days
30 - 60 days
60 - 180 days
Beyond 180 days
0 - 3 months
3 - 6 months
6 - 9 months
9 - 12 months
III B Unauthorized switch between Schemes
0 0 0 0 0 0 0 0 0 0 0
III C Deviation from Scheme attributes
0 0 0 0 0 0 0 0 0 0 0
III D Wrong or excess charges/load
0 0 0 0 0 0 0 0 0 0 0
III E Non updation of changes viz. address, PAN, bank details, nomination, etc
0 6 6 0 0 0 0 0 0 0 0
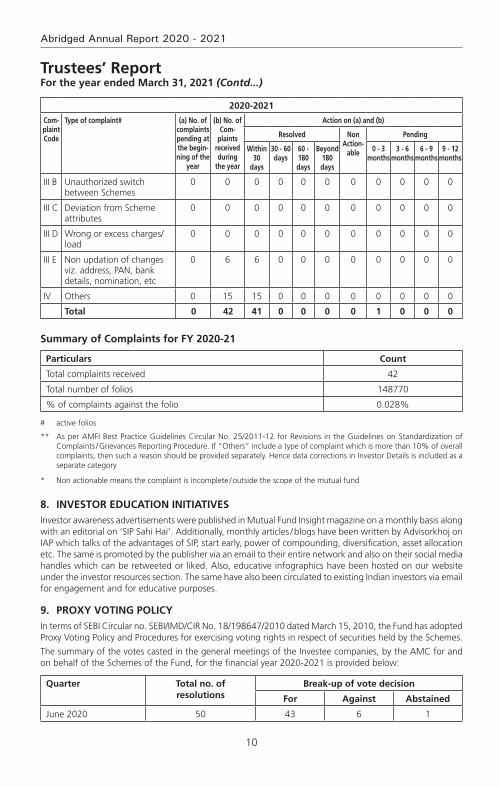
IV Others 0 15 15 0 0 0 0 0 0 0 0
total 0 42 41 0 0 0 0 1 0 0 0
Summary of complaints for fY 2020-21
Particulars count
Total complaints received 42
Total number of folios 148770
% of complaints against the folio 0.028%
# active folios
** As per AMFI Best Practice Guidelines Circular No. 25/2011-12 for Revisions in the Guidelines on Standardization of Complaints / Grievances Reporting Procedure. If “Others” include a type of complaint which is more than 10% of overall complaints, then such a reason should be provided separately. Hence data corrections in Investor Details is included as a separate category
* Non actionable means the complaint is incomplete / outside the scope of the mutual fund
8. inveStor education initiativeS Investor awareness advertisements were published in Mutual Fund Insight magazine on a monthly basis along with an editorial on ‘SIP Sahi Hai’. Additionally, monthly articles / blogs have been written by Advisorkhoj on IAP which talks of the advantages of SIP, start early, power of compounding, diversification, asset allocation etc. The same is promoted by the publisher via an email to their entire network and also on their social media handles which can be retweeted or liked. Also, educative infographics have been hosted on our website under the investor resources section. The same have also been circulated to existing Indian investors via email for engagement and for educative purposes.
9. ProxY voting PolicYIn terms of SEBI Circular no. SEBI/IMD/CIR No. 18/198647/2010 dated March 15, 2010, the Fund has adopted Proxy Voting Policy and Procedures for exercising voting rights in respect of securities held by the Schemes.
The summary of the votes casted in the general meetings of the Investee companies, by the AMC for and on behalf of the Schemes of the Fund, for the financial year 2020-2021 is provided below:
quarter total no. of resolutions
Break-up of vote decision
for against abstained
June 2020 50 43 6 1
11
HSBC Large Cap Equity Fund
Trustees’ ReportFor the year ended March 31, 2021 (Contd...)
quarter total no. of resolutions
Break-up of vote decision
for against abstained
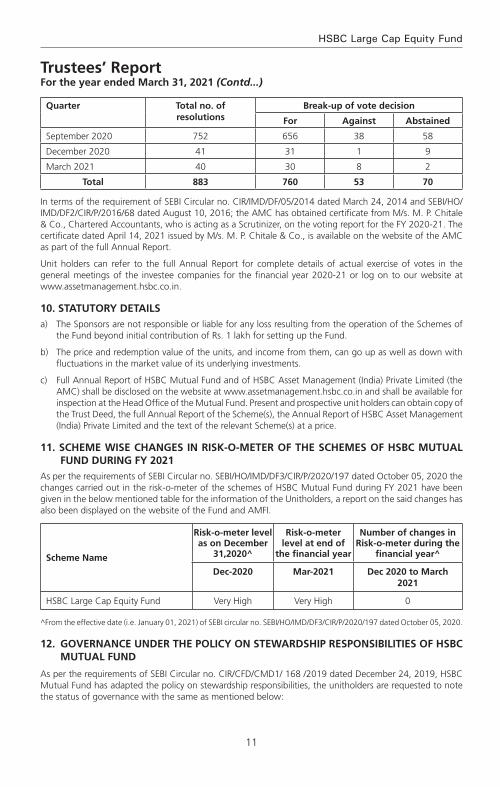
September 2020 752 656 38 58
December 2020 41 31 1 9
March 2021 40 30 8 2
total 883 760 53 70
In terms of the requirement of SEBI Circular no. CIR/IMD/DF/05/2014 dated March 24, 2014 and SEBI/HO/IMD/DF2/CIR/P/2016/68 dated August 10, 2016; the AMC has obtained certificate from M/s. M. P. Chitale & Co., Chartered Accountants, who is acting as a Scrutinizer, on the voting report for the FY 2020-21. The certificate dated April 14, 2021 issued by M/s. M. P. Chitale & Co., is available on the website of the AMC as part of the full Annual Report.
Unit holders can refer to the full Annual Report for complete details of actual exercise of votes in the general meetings of the investee companies for the financial year 2020-21 or log on to our website at www.assetmanagement.hsbc.co.in.
10. StatutorY detailSa) The Sponsors are not responsible or liable for any loss resulting from the operation of the Schemes of
the Fund beyond initial contribution of Rs. 1 lakh for setting up the Fund.
b) The price and redemption value of the units, and income from them, can go up as well as down with fluctuations in the market value of its underlying investments.
c) Full Annual Report of HSBC Mutual Fund and of HSBC Asset Management (India) Private Limited (the AMC) shall be disclosed on the website at www.assetmanagement.hsbc.co.in and shall be available for inspection at the Head Office of the Mutual Fund. Present and prospective unit holders can obtain copy of the Trust Deed, the full Annual Report of the Scheme(s), the Annual Report of HSBC Asset Management (India) Private Limited and the text of the relevant Scheme(s) at a price.
11. Scheme WiSe changeS in riSk-o-meter of the SchemeS of hSBc mutual fund during fY 2021
As per the requirements of SEBI Circular no. SEBI/HO/IMD/DF3/CIR/P/2020/197 dated October 05, 2020 the changes carried out in the risk-o-meter of the schemes of HSBC Mutual Fund during FY 2021 have been given in the below mentioned table for the information of the Unitholders, a report on the said changes has also been displayed on the website of the Fund and AMFI.
Scheme name
risk-o-meter level as on december
31,2020^
risk-o-meter level at end of
the financial year
number of changes in risk-o-meter during the
financial year^
dec-2020 mar-2021 dec 2020 to march 2021
HSBC Large Cap Equity Fund Very High Very High 0
^From the effective date (i.e. January 01, 2021) of SEBI circular no. SEBI/HO/IMD/DF3/CIR/P/2020/197 dated October 05, 2020.
12. governance under the PolicY on SteWardShiP reSPonSiBilitieS of hSBc mutual fund
As per the requirements of SEBI Circular no. CIR/CFD/CMD1/ 168 /2019 dated December 24, 2019, HSBC Mutual Fund has adapted the policy on stewardship responsibilities, the unitholders are requested to note the status of governance with the same as mentioned below:

12
Abridged Annual Report 2020 - 2021
Trustees’ ReportFor the year ended March 31, 2021 (Contd...)
S. no.
Particulars of Principles of Stewardship code
Status of compliance (complied/
not complied)
description remarks/reasons for
deviation/non - compliance,
if any
1 Principle 1:
Institutional Investors should formulate a comprehensive policy on the discharge of their stewardship responsibilities, publicly disclose it, review and update it periodically.
Complied HSBC Asset Management (India) Private Limited's (AMIN) 'Policy on Stewardship responsibilities' (Stewardship Code / Policy) was formulated and implemented on 01 July, 2020. This is a comprehensive document which has been publicly disclosed on the website of AMIN. The same shall follow a periodic review.
N.A.
2 Principle 2:
Inst i tut ional investors should have a clear policy on how they manage conflicts of interest in fulfilling their stewardship responsibilities and publicly disclose it.
Complied Defining and managing Conflict of Interest in fulfilling stewardship responsibilities are detailed in the Stewardship Policy document. The policy document is publicly disclosed.
N.A.
3 Principle 3:
Institutional investors should monitor their investee companies.
Complied AMIN monitors all investee companies through its investment process. This includes assessment of companies’ own and market data, consideration of research from brokers and other independent research providers – including ESG & voting research, attending individual & group meetings with company management and directors, visiting production sites (wherever necessary), engaging with key stakeholders including competitors and customers, and financial modelling. More details enumerated in the policy document
N.A.
4 Principle 4:
Inst i tut ional investors should have a clear policy on intervention in their investee companies. Institutional investors should also have a clear policy for collaboration with other institutional investors where required, to preserve the interests of the ultimate investors, which should be disclosed.
Complied Details of undertaking active engagement with investee companies and the policy for collaboration with other institutional holders are detailed in the policy document. The policy document is publicly disclosed.
N.A.

13
HSBC Large Cap Equity Fund
Trustees’ ReportFor the year ended March 31, 2021 (Contd...)
S. no.
Particulars of Principles of Stewardship code
Status of compliance (complied/
not complied)
description remarks/reasons for
deviation/non - compliance,
if any
5 Principle 5:
Inst i tut ional investors should have a clear policy on voting and disclosure of voting activity.
Complied AMIN has a clear and detailed voting policy which provides the framework for the voting decisions. All voting decisions shall be in accordance with AMIN’s Voting Policy and Procedures, which is disclosed on the website. AMIN discloses the details of the voting on its website on a quarterly basis within 10 working days from the end of the quarter. Additionally, AMIN also discloses the details of the votes cast, in the annual report of the schemes of HSBC Mutual Fund.
N.A.
6 Principle 6:
Institutional investors should report periodically on their stewardship activities.
Complied The annual status report of the stewardship code and quarterly report on proxy voting are publicly disclosed on the website as required under SEBI Regulations.
N.A.
13. Significant event after the end of the financial Year
HSBC Global Consumer Opportunities Fund (HGCOF) has been merged with HSBC Asia Pacific (Ex Japan) Dividend Yield Fund with effect from May 13, 2021. Therefore, HGCOF has been ceased to exist from the aforesaid date.
14. acknoWledgementS
The Trustees wish to thank the Unit holders of the Schemes for their support throughout the year and also thank the Government of India, the Securities and Exchange Board of India (SEBI), the Reserve Bank of India (RBI) and the Association of Mutual Funds in India (AMFI) for the guidance provided by them. The Trustees also appreciate the services provided by the Registrar and Transfer Agent, Fund Accountant, Custodian, Bankers, Distributors and Brokers. The guidance and services provided by the Auditors and advocates and the ebullience, sincerity and dedication of the employees of HSBC Asset Management (India) Private Limited is also appreciated.
The Trustees look forward to the continued support of everyone.
For and on behalf of the Board of Trustees of HSBC Mutual Fund
Sd/-
Trustee
Mumbai
July 20, 2021.
14
Abridged Annual Report 2020 - 2021
To the Trustees of HSBC Mutual Fund
hSBc large cap equity fund
Report on the Audit of the Financial Statements
opinionWe have audited the financial statements of hSBc large cap equity fund (the ‘Scheme’) of HSBC Mutual Fund, which comprise the balance sheet as at 31 March 2021 and the revenue account and cash flow statement for the year then ended, and notes to the financial statements, including a summary of the significant accounting policies.
In our opinion and to the best of our information and according to the explanations given to us, the aforesaid financial statements give a true and fair view in conformity with the accounting principles generally accepted in India, of the state of affairs of the Scheme as at 31 March 2021, its net surplus and cash flows for the year ended on that date.
Basis for opinionWe conducted our audit in accordance with the Standards on Auditing (‘SAs’) issued by the Institute of Chartered Accountants of India (the ‘ICAI’). Our responsibilities under those SAs are further described in the Auditor’s Responsibilities for the Audit of the Financial Statements section of our report. We are independent of the Scheme in accordance with the Code of Ethics issued by the ICAI, and we have fulfilled our other ethical responsibilities in accordance with the Code of Ethics. We believe that the audit evidence we have obtained is sufficient and appropriate to provide a basis for our opinion.
responsibilities of management and those charged with governance for the financial StatementsThe Scheme’s management, the Board of Directors of HSBC Mutual Fund (the ‘Trustees’) and the Board of Directors of HSBC Asset Management (India) Private Limited (the ‘AMC’) (collectively referred to as ‘Management’) are responsible for the preparation of these financial statements that give a true and fair view of the state of affairs, results of operations and cash flows of the Scheme in accordance with the accounting policies and standards specified in the Ninth Schedule of the Securities and Exchange Board of India (Mutual Funds) Regulations, 1996, as amended (the ‘Regulations’) and the accounting principles generally accepted in India. This responsibility includes design, implementation and maintenance of internal control relevant to the preparation and presentation of the financial statements that give a true and fair view and are free from material misstatement, whether due to fraud or error.
In preparing the financial statements, management is responsible for assessing the Scheme’s ability to continue as a going concern, disclosing, as applicable, matters related to going concern and using the going concern basis of accounting unless management either intends to liquidate the Scheme or to cease operations, or has no realistic alternative but to do so.
The management is responsible for overseeing the Scheme’s financial reporting process.
auditor’s responsibilities for the audit of the financial StatementsOur objectives are to obtain reasonable assurance about whether the financial statements as a whole are free from material misstatement, whether due to fraud or error, and to issue an auditor’s report that includes our opinion. Reasonable assurance is a high level of assurance, but is not a guarantee that an audit conducted in accordance with SAs will always detect a material misstatement when it exists. Misstatements can arise from fraud or error and are considered material if, individually or in the aggregate, they could reasonably be expected to influence the economic decisions of users taken on the basis of these financial statements.
As part of an audit in accordance with SAs, we exercise professional judgment and maintain professional skepticism throughout the audit. We also:
• Identifyandassesstherisksofmaterialmisstatementofthefinancialstatements,whetherduetofraudor error, design and perform audit procedures responsive to those risks, and obtain audit evidence that is sufficient and appropriate to provide a basis for our opinion. The risk of not detecting a material
Independent Auditors’ Report

15
HSBC Large Cap Equity Fund
Independent Auditors’ Report (Contd...)
misstatement resulting from fraud is higher than for one resulting from error, as fraud may involve collusion, forgery, intentional omissions, misrepresentations, or the override of internal control;
• Obtainanunderstandingofinternalcontrolrelevanttotheauditinordertodesignauditproceduresthat are appropriate in the circumstances, but not for the purpose of expressing an opinion on the effectiveness of the Scheme’s internal controls;
• Evaluatetheappropriatenessofaccountingpoliciesusedandthereasonablenessofaccountingestimatesand related disclosures made by Management;
• ConcludeontheappropriatenessofManagement’suseofthegoingconcernbasisofaccountingand,based on the audit evidence obtained, whether a material uncertainty exists related to events or conditions that may cast significant doubt on the Scheme’s ability to continue as a going concern. If we conclude that a material uncertainty exists, we are required to draw attention in our auditor’s report to the related disclosures in the financial statements or, if such disclosures are inadequate, to modify our opinion. Our conclusions are based on the audit evidence obtained up to the date of our auditor’s report. However, future events or conditions may cause the Scheme to cease to continue as a going concern;
• Evaluate the overall presentation, structure and content of the financial statements, including thedisclosures and whether the financial statements represent the underlying transactions and events in a manner that achieves fair presentation.
We communicate with those charged with governance regarding, among other matters, the planned scope and timing of the audit and significant audit findings, including any significant deficiencies in internal control that we identify during our audit.
We also provide those charged with governance with a statement that we have complied with relevant ethical requirements regarding independence, and to communicate with them all relationships and other matters that may reasonably be thought to bear on our independence, and where applicable, related safeguards.
report on other legal and regulatory requirements 1 As required by Regulation 55 (4) of the Regulations, we report that:
(a) We have obtained all information and explanations which, to the best of our knowledge and belief, were necessary for the purposes of the audit; and
(b) The balance sheet and the revenue account have been prepared in accordance with the accounting policies and standards as specified in the Ninth Schedule of the Regulations.
2 As required by Clause 5 (ii) (2) of the Eleventh Schedule of the Regulations, we report that the balance sheet and the revenue account are in agreement with the books of account of the Scheme.
For B S R & Co. LLP Chartered Accountants Firm’s Registration No: 101248W/W-100022
Sd/-
Ajit Viswanath PartnerMembership No: 067114UDIN : 21067114AAAADK5658
Place : Mumbai Date : July 20, 2021.
16
Abridged Annual Report 2020 - 2021
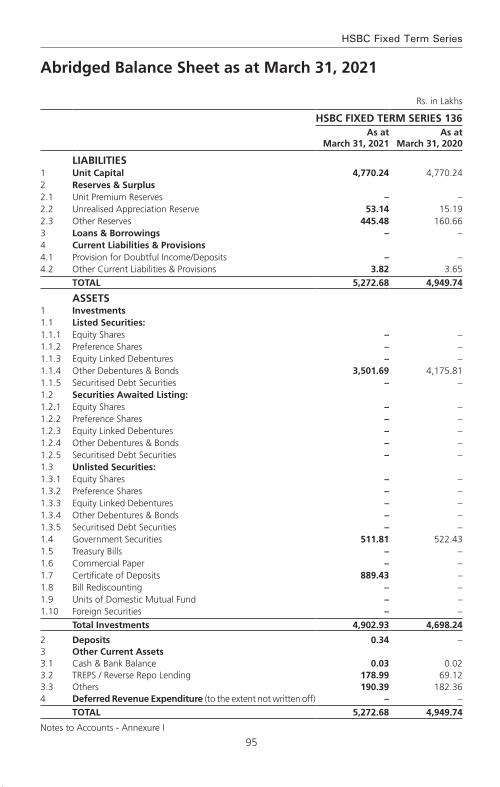
Rs. in Lakhs
As at March 31, 2021
As at March 31, 2020
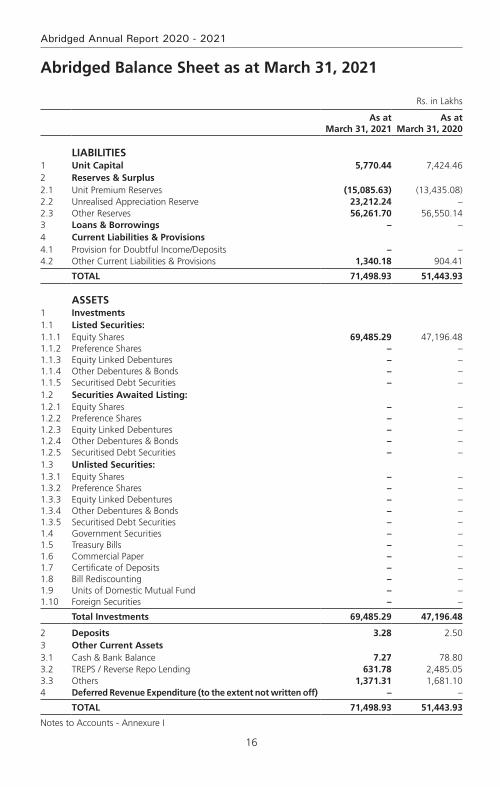
LIABILITIES1 Unit Capital 5,770.44 7,424.462 Reserves & Surplus2.1 Unit Premium Reserves (15,085.63) (13,435.08)2.2 Unrealised Appreciation Reserve 23,212.24 –2.3 Other Reserves 56,261.70 56,550.143 Loans & Borrowings – –4 Current Liabilities & Provisions4.1 Provision for Doubtful Income/Deposits – –4.2 Other Current Liabilities & Provisions 1,340.18 904.41
TOTAL 71,498.93 51,443.93
ASSETS1 Investments1.1 Listed Securities:1.1.1 Equity Shares 69,485.29 47,196.481.1.2 Preference Shares – –1.1.3 Equity Linked Debentures – –1.1.4 Other Debentures & Bonds – –1.1.5 Securitised Debt Securities – –1.2 Securities Awaited Listing:1.2.1 Equity Shares – –1.2.2 Preference Shares – –1.2.3 Equity Linked Debentures – –1.2.4 Other Debentures & Bonds – –1.2.5 Securitised Debt Securities – –1.3 Unlisted Securities:1.3.1 Equity Shares – –1.3.2 Preference Shares – –1.3.3 Equity Linked Debentures – –1.3.4 Other Debentures & Bonds – –1.3.5 Securitised Debt Securities – –1.4 Government Securities – –1.5 Treasury Bills – –1.6 Commercial Paper – –1.7 Certificate of Deposits – –1.8 Bill Rediscounting – –1.9 Units of Domestic Mutual Fund – –1.10 Foreign Securities – –
Total Investments 69,485.29 47,196.48
2 Deposits 3.28 2.503 Other Current Assets3.1 Cash & Bank Balance 7.27 78.803.2 TREPS / Reverse Repo Lending 631.78 2,485.053.3 Others 1,371.31 1,681.104 Deferred Revenue Expenditure (to the extent not written off) – –
TOTAL 71,498.93 51,443.93
Notes to Accounts - Annexure I
Abridged Balance Sheet as at March 31, 2021

17
HSBC Large Cap Equity Fund
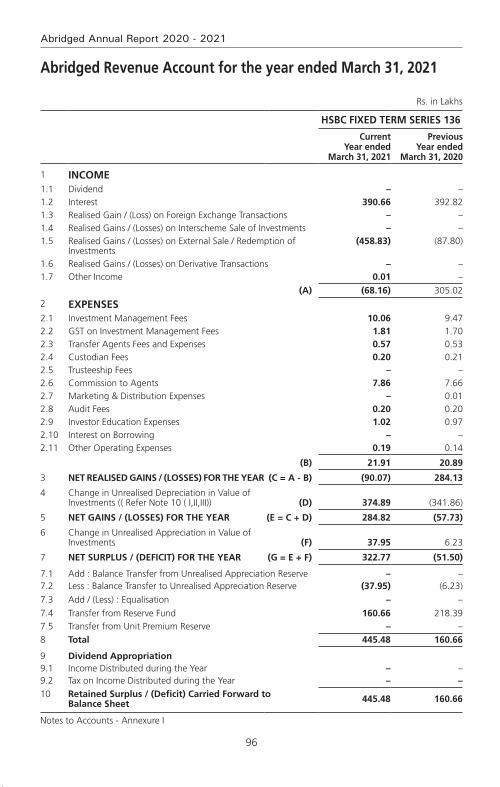
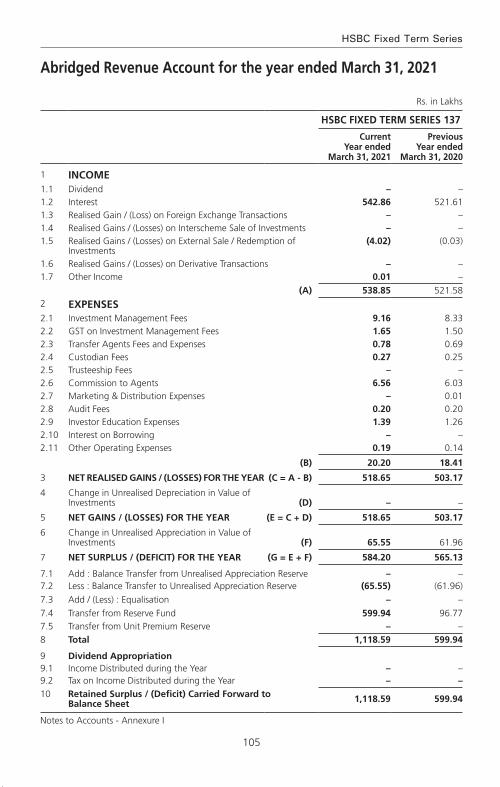
Abridged Revenue Account for the Year ended March 31, 2021
Rs. in Lakhs
Current Year ended
March 31, 2021
Previous Year ended
March 31, 2020
1 INCOME1.1 Dividend 452.99 673.041.2 Interest 38.68 103.141.3 Realised Gain / (Loss) on Foreign Exchange Transactions – –1.4 Realised Gains / (Losses) on Interscheme Sale of Investments – –1.5 Realised Gains / (Losses) on External Sale / Redemption of
Investments6,070.55 4,036.45
1.6 Realised Gains / (Losses) on Derivative Transactions – –1.7 Other Income 23.21 6.97
(A) 6,585.43 4,819.60
2 EXPENSES2.1 Investment Management Fees 791.02 830.062.2 GST on Investment Management Fees 142.38 149.412.3 Transfer Agents Fees and Expenses 69.79 81.162.4 Custodian Fees 7.64 7.942.5 Trusteeship Fees 1.98 1.912.6 Commission to Agents 430.41 381.392.7 Marketing & Distribution Expenses 1.17 0.652.8 Audit Fees 3.48 3.942.9 Investor Education Expenses 12.55 13.192.10 Interest on Borrowing – –2.11 Other Operating Expenses 14.77 17.30
(B) 1,475.19 1,486.95
3 NET REALISED GAINS / (LOSSES) FOR THE YEAR (C = A - B) 5,110.24 3,332.65
4 Change in Unrealised Depreciation in Value of Investments (D) 2,266.63 (2,266.63)
5 NET GAINS / (LOSSES) FOR THE YEAR (E = C + D) 7,376.87 1,066.02
6 Change in Unrealised Appreciation in Value of Investments (F) 23,212.24 (13,893.60)
7 NET SURPLUS / (DEFICIT) FOR THE YEAR (G = E + F) 30,589.11 (12,827.58)
7.1 Add : Balance Transfer from Unrealised Appreciation Reserve – 13,893.60
7.2 Less : Balance Transfer to Unrealised Appreciation Reserve (23,212.24) –7.3 Add / (Less) : Equalisation (7,646.08) (2,279.41)7.4 Transfer from Reserve Fund 56,550.14 58,937.077.5 Transfer from Unit Premium Reserve – –
8 Total 56,280.93 57,723.68
9 Dividend Appropriation9.1 Income Distributed during the Year (19.23) (1,039.06)9.2 Tax on Income Distributed during the Year – (134.48)10 Retained Surplus / (Deficit) Carried Forward to
Balance Sheet 56,261.70 56,550.14
Notes to Accounts - Annexure I

18
Abridged Annual Report 2020 - 2021
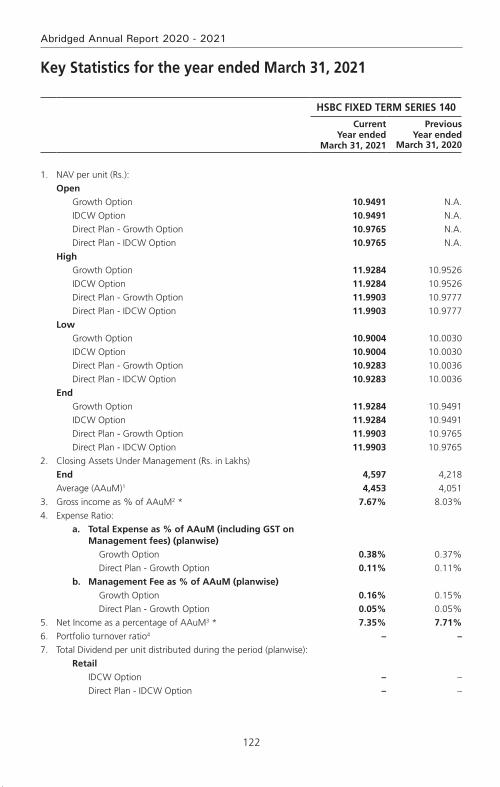
Key Statistics for the year ended March 31, 2021
Current Year ended
March 31, 2021
Previous Year ended
March 31, 2020
1. NAV per unit (Rs.):
Open
Regular Plan Growth Option 165.1620 209.7952
Regular Plan IDCW Option 20.9928 28.7446
Direct Plan - Growth Option 174.5429 219.6543
Direct Plan - IDCW Option 22.2974 30.3524
High
Regular Plan Growth Option 288.6384 230.9875
Regular Plan IDCW Option 36.6871 31.3391
Direct Plan - Growth Option 307.5676 243.6349
Direct Plan - IDCW Option 36.5097 33.3121
Low
Regular Plan Growth Option 155.9940 147.4700
Regular Plan IDCW Option 19.8275 18.7441
Direct Plan - Growth Option 164.8671 155.8125
Direct Plan - IDCW Option 21.0614 19.9047
End
Regular Plan Growth Option 272.0638 165.1620
Regular Plan IDCW Option 34.5804 20.9928
Direct Plan - Growth Option 290.2409 174.5429
Direct Plan - IDCW Option 34.4522 22.2974
2. Closing Assets Under Management (Rs. in Lakhs)
End 70,054 50,487
Average (AAuM)1 62,754 65,926
3. Gross income as % of AAuM2 10.49% 7.31%
4. Expense Ratio:
a. total expense as % of aaum (including gSt on management fees) (planwise)
Regular Plan (Continue) 2.49% 2.47%
Direct Plan 1.55% 1.54%
b. management fee as % of aaum (planwise)
Regular Plan (Continue) 1.28% 1.30%
Direct Plan 1.16% 1.14%
5. Net Income as a percentage of AAuM3 8.14% 5.06%
6. Portfolio turnover ratio4 0.62 1.03
7. Total Dividend per unit distributed during the year (planwise)
Retail
Regular Plan IDCW Option – 1.99
Direct Plan - IDCW Option 2.50 2.21
19
HSBC Large Cap Equity Fund
Current Year ended
March 31, 2021
Previous Year ended
March 31, 2020
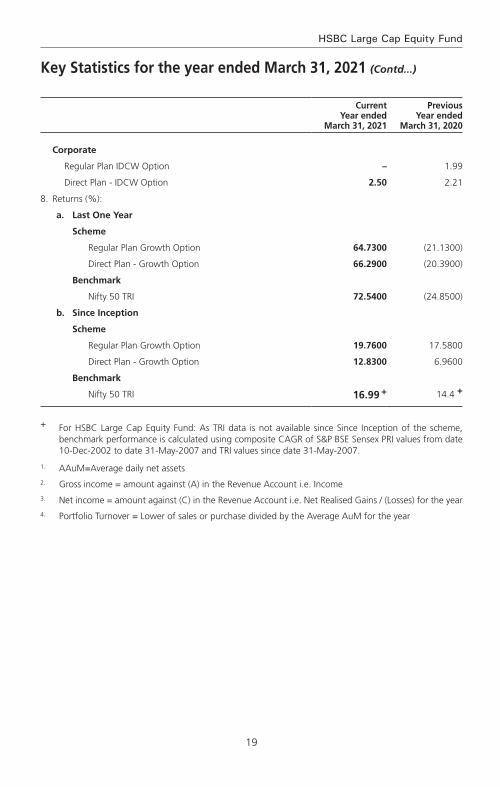
Corporate
Regular Plan IDCW Option – 1.99
Direct Plan - IDCW Option 2.50 2.21
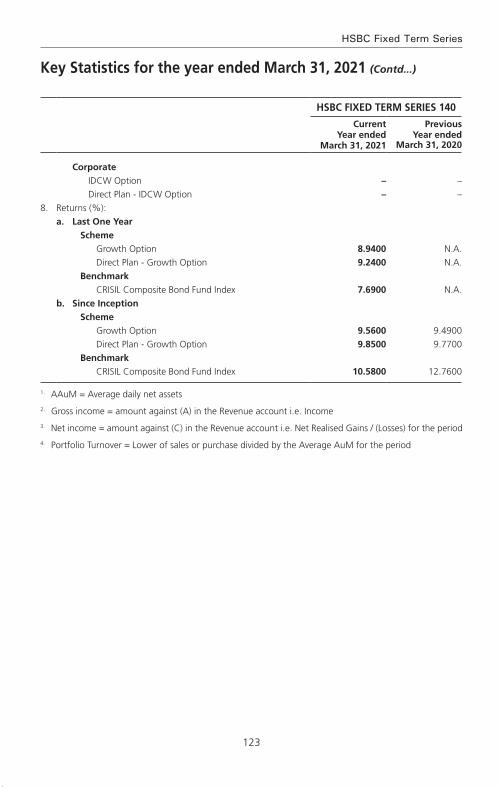
8. Returns (%):
a. Last One Year
Scheme
Regular Plan Growth Option 64.7300 (21.1300)
Direct Plan - Growth Option 66.2900 (20.3900)
Benchmark
Nifty 50 TRI 72.5400 (24.8500)
b. Since Inception
Scheme
Regular Plan Growth Option 19.7600 17.5800
Direct Plan - Growth Option 12.8300 6.9600
Benchmark
Nifty 50 TRI 16.99 + 14.4 +
+ For HSBC Large Cap Equity Fund: As TRI data is not available since Since Inception of the scheme, benchmark performance is calculated using composite CAGR of S&P BSE Sensex PRI values from date 10-Dec-2002 to date 31-May-2007 and TRI values since date 31-May-2007.
1. AAuM=Average daily net assets2. Gross income = amount against (A) in the Revenue Account i.e. Income3. Net income = amount against (C) in the Revenue Account i.e. Net Realised Gains / (Losses) for the year4. Portfolio Turnover = Lower of sales or purchase divided by the Average AuM for the year
Key Statistics for the year ended March 31, 2021 (Contd...)

20
Abridged Annual Report 2020 - 2021
Notes to Accounts – Annexure ITo the Abridged Balance Sheet and Revenue Account for the Year ended March 31, 2021
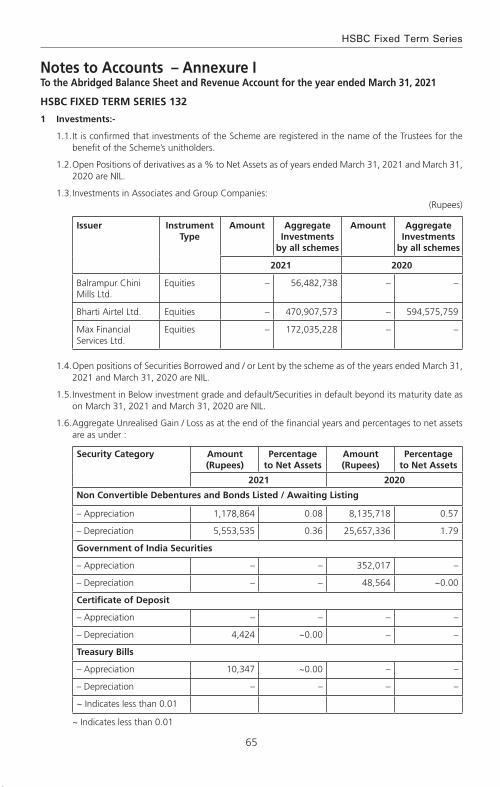
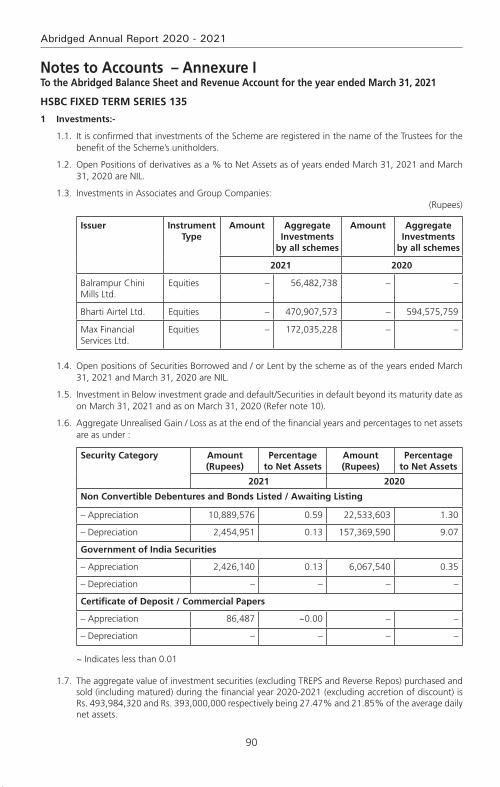
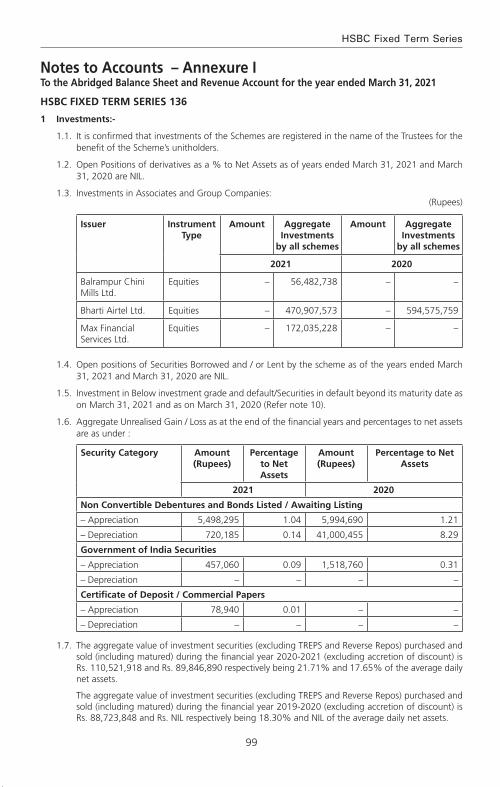
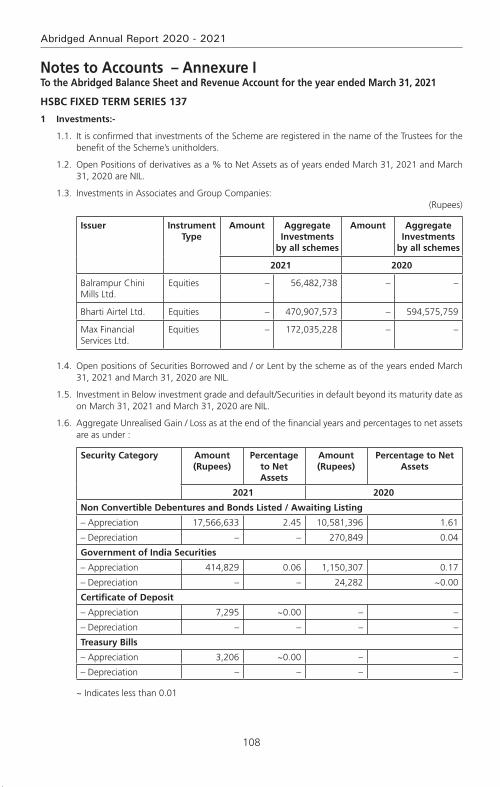
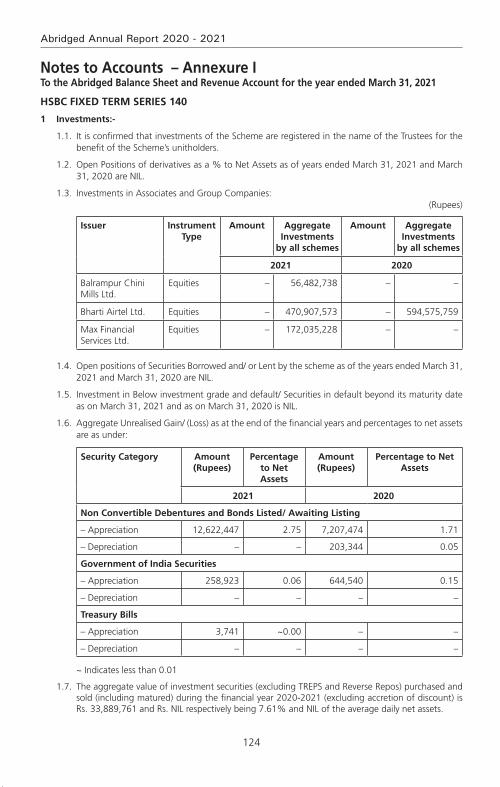
1 Investments:
1.1. It is confirmed that investments of the Schemes are registered in the name of the Trustees for the benefit of the Scheme’s unitholders.
1.2. Open Positions of derivatives as of years ended March 31, 2021 and March 31, 2020 are NIL
1.3. Investments in Associates and Group Companies:(Rupees)
Issuer Instrument Type
Amount Aggregate Investments
by all schemes
Amount Aggregate Investments
by all schemes
2021 2020
Balrampur Chini Mills Ltd.
Equities – 56,482,738 – –
Bharti Airtel Ltd. Equities 63,024,830 470,907,573 250,225,236 594,575,759
Max Financial Services Ltd.
Equities – 172,035,228 – –
1.4. Open positions of Securities Borrowed and / or Lent by the scheme as of the years ended March 31, 2021 and March 31, 2020 is NIL.
1.5. Investment in Below investment grade and default/Securities in default beyond its maturity date as on March 31, 2021 and March 31, 2020 are NIL.
1.6. Aggregate Unrealised Gain / Loss as at the end of the Financial Years March 31, 2021 and March 31, 2020 and percentage to net assets are as under:
Company Name Amount (Rs.)
Percentage to Net Assets
Amount (Rs.)
Percentage to Net Assets
2021 2020
Equity Shares
– Appreciation 2,356,235,298 33.63 416,065,389 8.24
– Depreciation 35,010,841 0.50 642,728,324 12.73
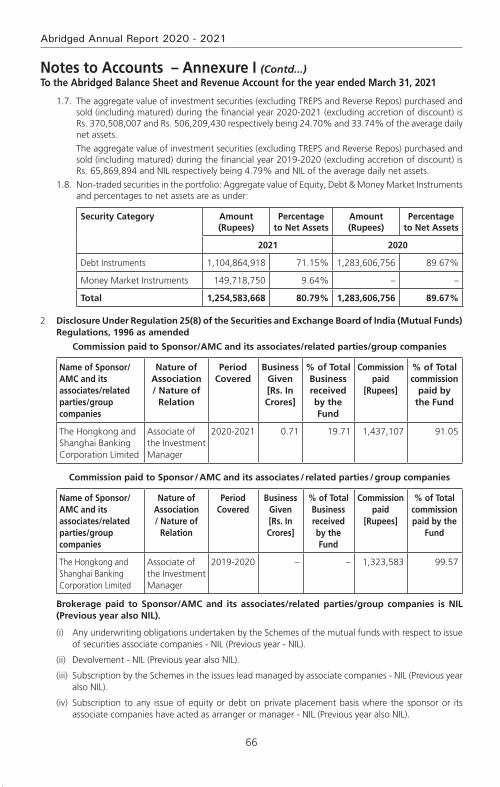
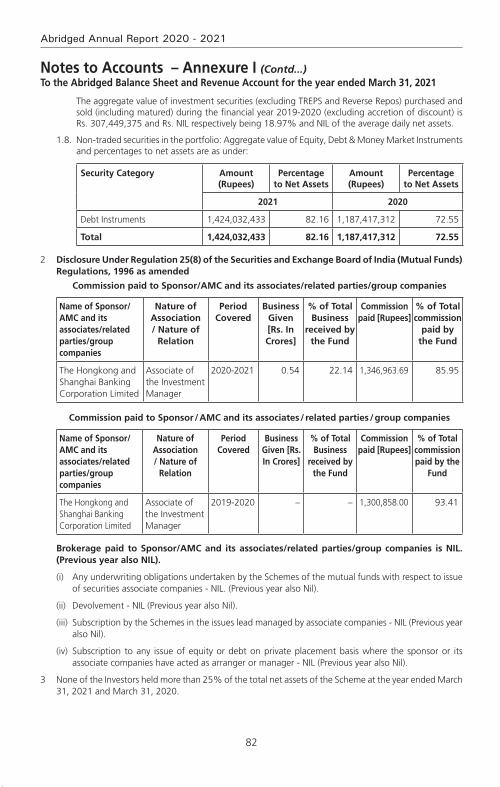
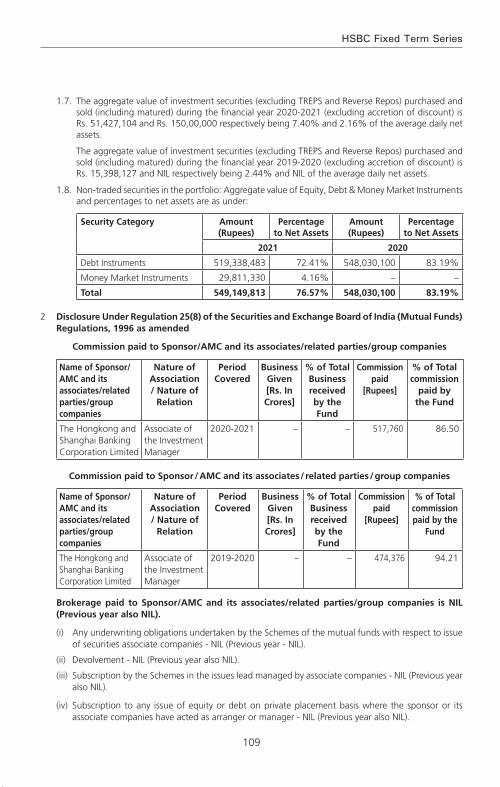
1.7. The aggregate value of investment securities (excluding TREPS and Reverse Repos) purchased and sold (including matured) during the financial year 2020-2021 (excluding accretion of discount) is Rs. 3,885,222,277 and Rs. 4,811,317,514 respectively being 61.91% and 76.67% of the average daily net assets.
The aggregate value of investment securities (excluding TREPS and Reverse Repos) purchased and sold (including matured) during the financial year 2019-2020 (excluding accretion of discount) is Rs. 6,769,255,995 and Rs. 7,630,611,614 respectively being 102.68% and 115.75% of the average daily net assets.
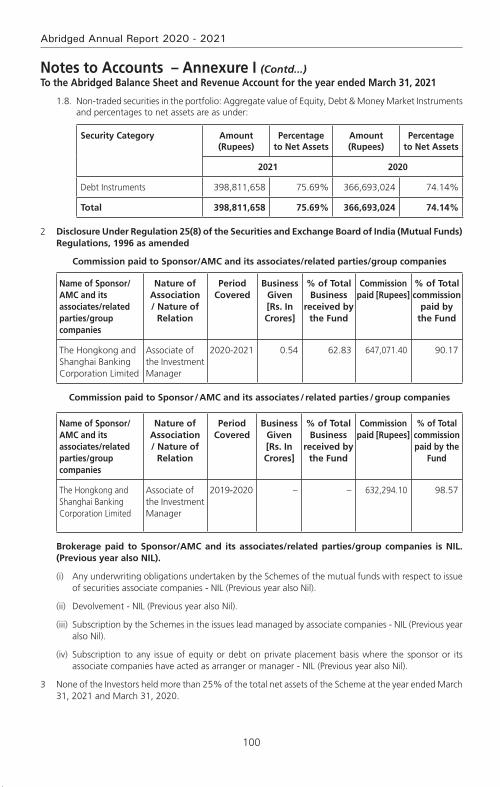
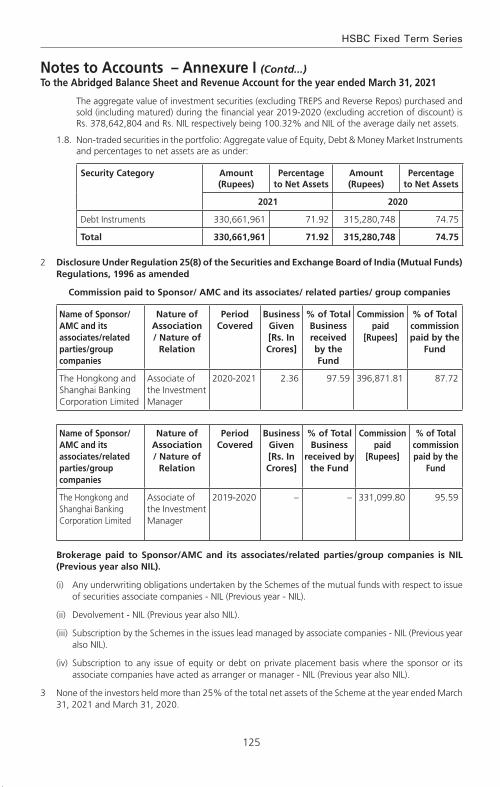
1.8. Non-Traded securities in the portfolio of the scheme as of the Years ended March 31, 2021 and March 31, 2020 are NIL.
2 Disclosure Under Regulation 25(8) of the Securities and Exchange Board of India (Mutual Funds) Regulations, 1996 as amended.
During the year 2020-21, The Hongkong and Shanghai Banking Corporation Limited, an associate entity of HSBC Asset Management (India) Private Limited was paid collection/bank charges amounting to Rs. Nil and clearing member charges on derivative transactions amounting to Rs. Nil.
21
HSBC Large Cap Equity Fund
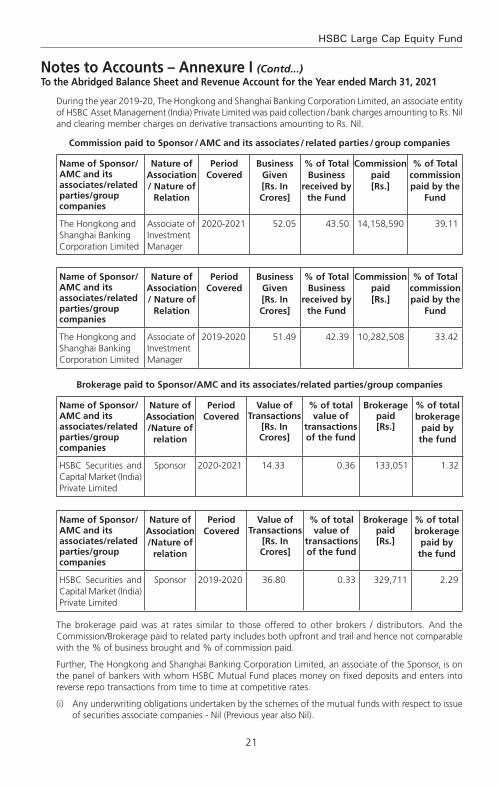
During the year 2019-20, The Hongkong and Shanghai Banking Corporation Limited, an associate entity of HSBC Asset Management (India) Private Limited was paid collection / bank charges amounting to Rs. Nil and clearing member charges on derivative transactions amounting to Rs. Nil.
Commission paid to Sponsor / AMC and its associates / related parties / group companies
Name of Sponsor/AMC and its associates/related parties/group companies
Nature of Association / Nature of
Relation
Period Covered
Business Given [Rs. In Crores]
% of Total Business
received by the Fund
Commission paid [Rs.]
% of Total commission paid by the
Fund
The Hongkong and Shanghai Banking Corporation Limited
Associate of Investment Manager
2020-2021 52.05 43.50 14,158,590 39.11
Name of Sponsor/AMC and its associates/related parties/group companies
Nature of Association / Nature of
Relation
Period Covered
Business Given [Rs. In Crores]
% of Total Business
received by the Fund
Commission paid [Rs.]
% of Total commission paid by the
Fund
The Hongkong and Shanghai Banking Corporation Limited
Associate of Investment Manager
2019-2020 51.49 42.39 10,282,508 33.42
Brokerage paid to Sponsor/AMC and its associates/related parties/group companies
Name of Sponsor/AMC and its associates/related parties/group companies
Nature of Association /Nature of
relation
Period Covered
Value of Transactions
[Rs. In Crores]
% of total value of
transactions of the fund
Brokerage paid [Rs.]
% of total brokerage
paid by the fund
HSBC Securities and Capital Market (India) Private Limited
Sponsor 2020-2021 14.33 0.36 133,051 1.32
Name of Sponsor/AMC and its associates/related parties/group companies
Nature of Association /Nature of
relation
Period Covered
Value of Transactions
[Rs. In Crores]
% of total value of
transactions of the fund
Brokerage paid [Rs.]
% of total brokerage
paid by the fund
HSBC Securities and Capital Market (India) Private Limited
Sponsor 2019-2020 36.80 0.33 329,711 2.29
The brokerage paid was at rates similar to those offered to other brokers / distributors. And the Commission/Brokerage paid to related party includes both upfront and trail and hence not comparable with the % of business brought and % of commission paid.
Further, The Hongkong and Shanghai Banking Corporation Limited, an associate of the Sponsor, is on the panel of bankers with whom HSBC Mutual Fund places money on fixed deposits and enters into reverse repo transactions from time to time at competitive rates.
(i) Any underwriting obligations undertaken by the schemes of the mutual funds with respect to issue of securities associate companies - Nil (Previous year also Nil).
Notes to Accounts – Annexure I (Contd...)To the Abridged Balance Sheet and Revenue Account for the Year ended March 31, 2021
22
Abridged Annual Report 2020 - 2021
(ii) Devolvement - Nil (Previous year also Nil).
(iii) Subscription by the schemes in the issues lead managed by associate companies - Nil (Previous year also Nil).
(iv) Subscription to any issue of equity or debt on private placement basis where the sponsor or its associate companies have acted as arranger or manager - Nil (Previous year also Nil).
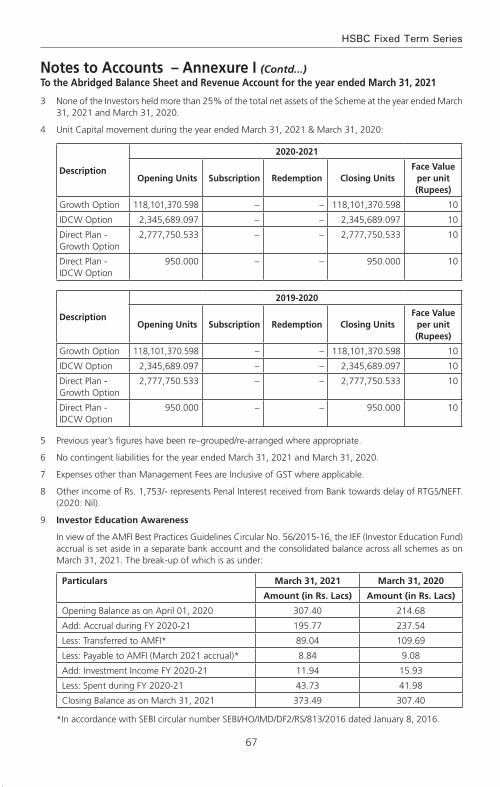
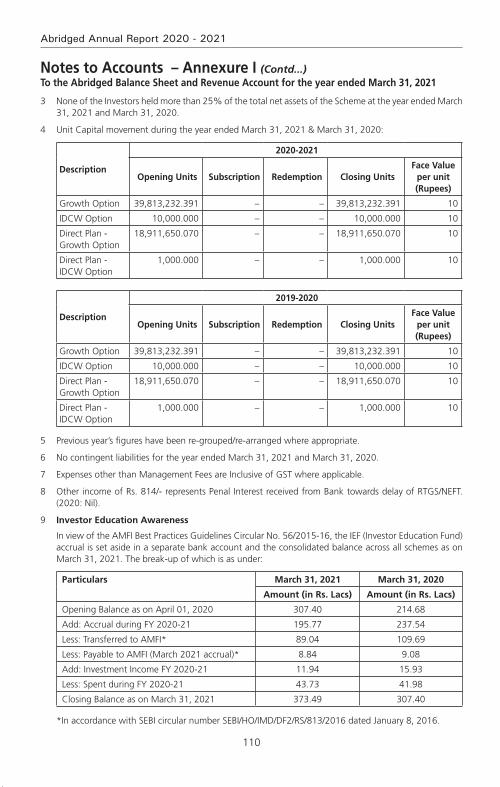
3 None of the Investors held more than 25% of the total net assets of the scheme at the years ended March 31, 2021 and March 31, 2020.
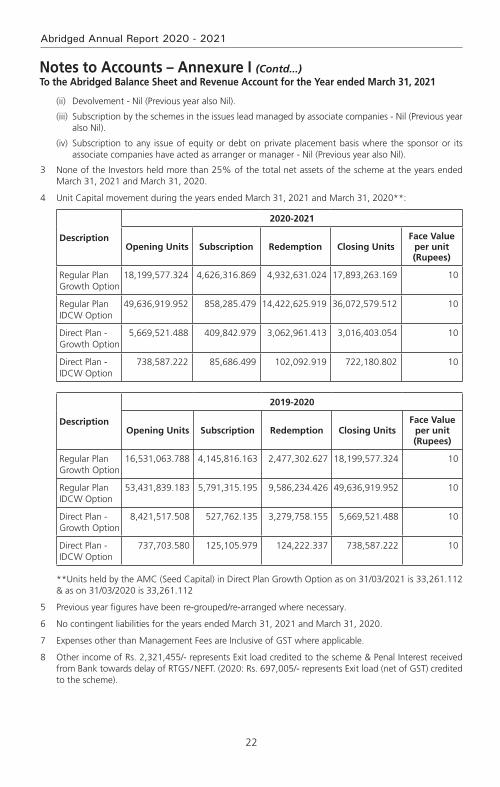
4 Unit Capital movement during the years ended March 31, 2021 and March 31, 2020**:
Description
2020-2021
Opening Units Subscription Redemption Closing UnitsFace Value
per unit (Rupees)
Regular Plan Growth Option
18,199,577.324 4,626,316.869 4,932,631.024 17,893,263.169 10
Regular Plan IDCW Option
49,636,919.952 858,285.479 14,422,625.919 36,072,579.512 10
Direct Plan - Growth Option
5,669,521.488 409,842.979 3,062,961.413 3,016,403.054 10
Direct Plan - IDCW Option
738,587.222 85,686.499 102,092.919 722,180.802 10
Description
2019-2020
Opening Units Subscription Redemption Closing UnitsFace Value
per unit (Rupees)
Regular Plan Growth Option
16,531,063.788 4,145,816.163 2,477,302.627 18,199,577.324 10
Regular Plan IDCW Option
53,431,839.183 5,791,315.195 9,586,234.426 49,636,919.952 10
Direct Plan - Growth Option
8,421,517.508 527,762.135 3,279,758.155 5,669,521.488 10
Direct Plan - IDCW Option
737,703.580 125,105.979 124,222.337 738,587.222 10
**Units held by the AMC (Seed Capital) in Direct Plan Growth Option as on 31/03/2021 is 33,261.112 & as on 31/03/2020 is 33,261.112
5 Previous year figures have been re-grouped/re-arranged where necessary.
6 No contingent liabilities for the years ended March 31, 2021 and March 31, 2020.
7 Expenses other than Management Fees are Inclusive of GST where applicable.
8 Other income of Rs. 2,321,455/- represents Exit load credited to the scheme & Penal Interest received from Bank towards delay of RTGS / NEFT. (2020: Rs. 697,005/- represents Exit load (net of GST) credited to the scheme).
Notes to Accounts – Annexure I (Contd...)To the Abridged Balance Sheet and Revenue Account for the Year ended March 31, 2021
23
HSBC Large Cap Equity Fund
Notes to Accounts – Annexure I (Contd...)To the Abridged Balance Sheet and Revenue Account for the Year ended March 31, 2021
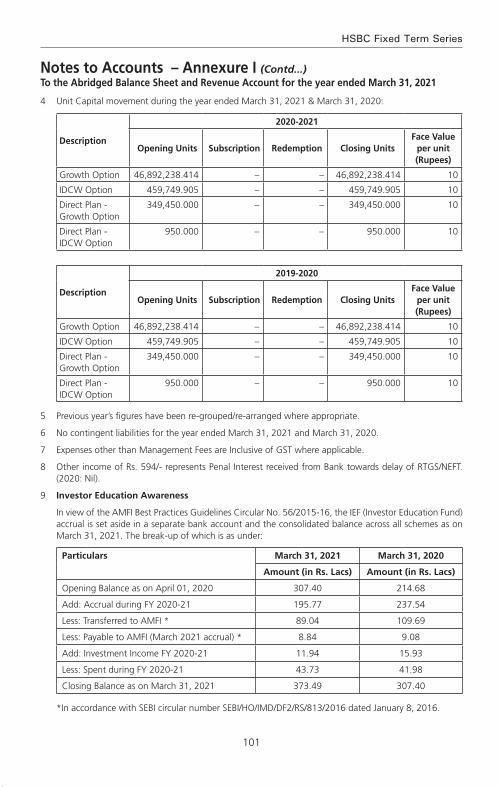
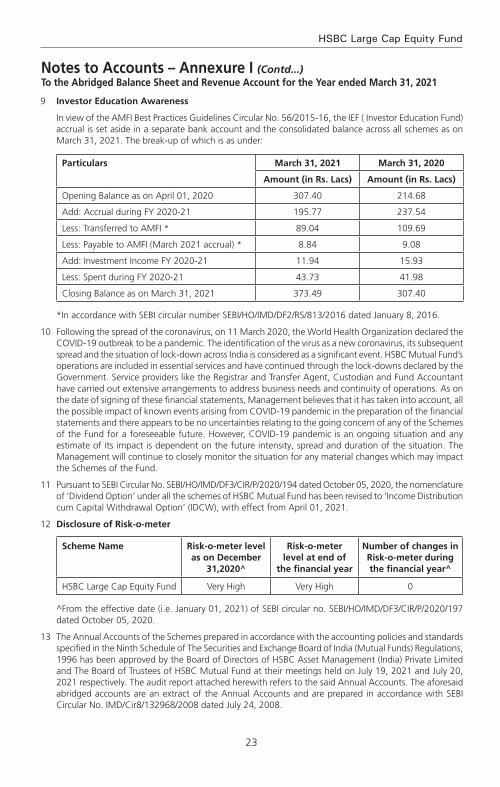
9 Investor Education Awareness
In view of the AMFI Best Practices Guidelines Circular No. 56/2015-16, the IEF ( Investor Education Fund) accrual is set aside in a separate bank account and the consolidated balance across all schemes as on March 31, 2021. The break-up of which is as under:
Particulars March 31, 2021 March 31, 2020
Amount (in Rs. Lacs) Amount (in Rs. Lacs)
Opening Balance as on April 01, 2020 307.40 214.68
Add: Accrual during FY 2020-21 195.77 237.54
Less: Transferred to AMFI * 89.04 109.69
Less: Payable to AMFI (March 2021 accrual) * 8.84 9.08
Add: Investment Income FY 2020-21 11.94 15.93
Less: Spent during FY 2020-21 43.73 41.98
Closing Balance as on March 31, 2021 373.49 307.40
*In accordance with SEBI circular number SEBI/HO/IMD/DF2/RS/813/2016 dated January 8, 2016.
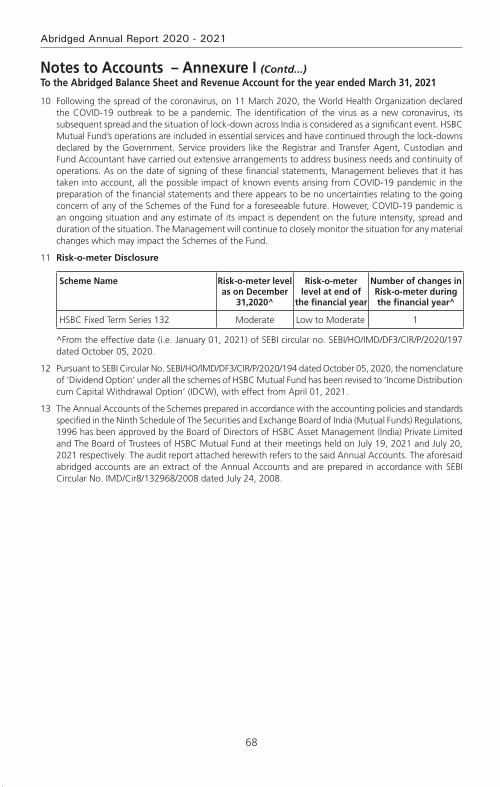
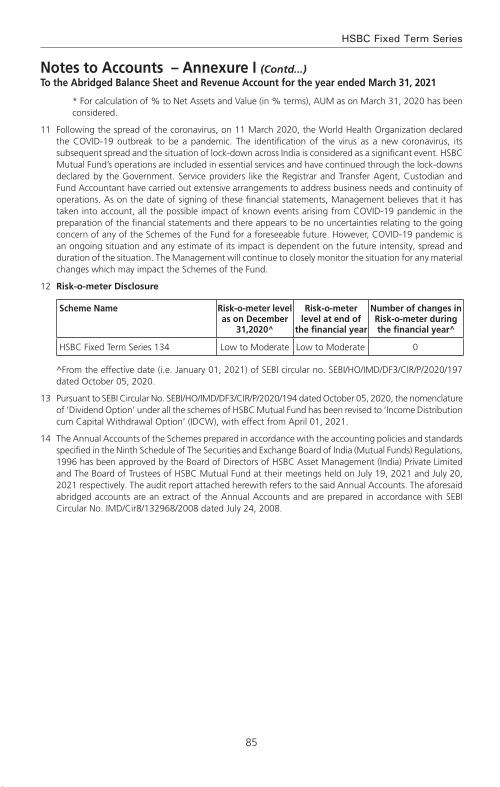
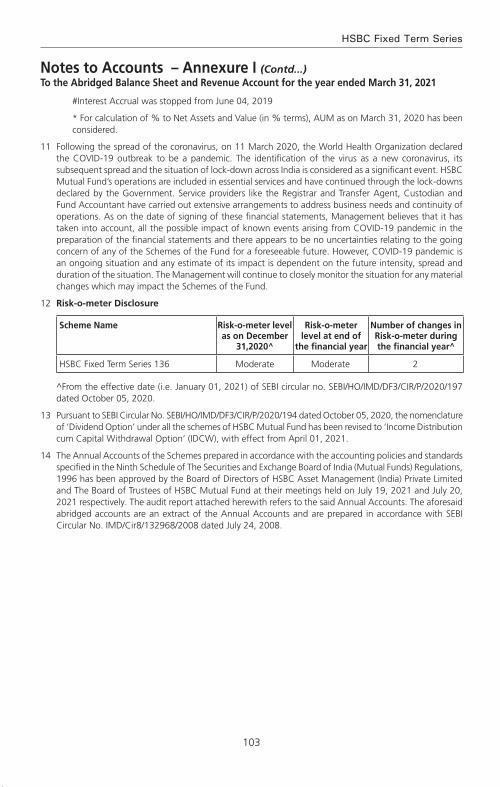
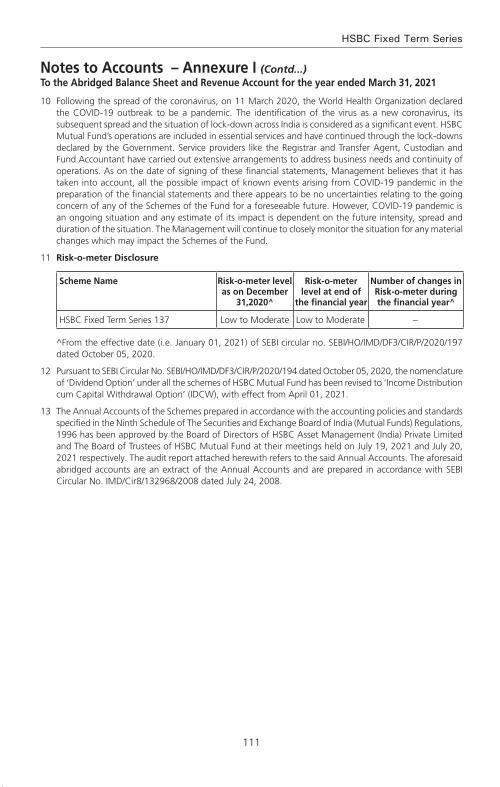
10 Following the spread of the coronavirus, on 11 March 2020, the World Health Organization declared the COVID-19 outbreak to be a pandemic. The identification of the virus as a new coronavirus, its subsequent spread and the situation of lock-down across India is considered as a significant event. HSBC Mutual Fund’s operations are included in essential services and have continued through the lock-downs declared by the Government. Service providers like the Registrar and Transfer Agent, Custodian and Fund Accountant have carried out extensive arrangements to address business needs and continuity of operations. As on the date of signing of these financial statements, Management believes that it has taken into account, all the possible impact of known events arising from COVID-19 pandemic in the preparation of the financial statements and there appears to be no uncertainties relating to the going concern of any of the Schemes of the Fund for a foreseeable future. However, COVID-19 pandemic is an ongoing situation and any estimate of its impact is dependent on the future intensity, spread and duration of the situation. The Management will continue to closely monitor the situation for any material changes which may impact the Schemes of the Fund.
11 Pursuant to SEBI Circular No. SEBI/HO/IMD/DF3/CIR/P/2020/194 dated October 05, 2020, the nomenclature of ‘Dividend Option’ under all the schemes of HSBC Mutual Fund has been revised to ‘Income Distribution cum Capital Withdrawal Option’ (IDCW), with effect from April 01, 2021.
12 Disclosure of Risk-o-meter
Scheme Name Risk-o-meter level as on December
31,2020^
Risk-o-meter level at end of
the financial year
Number of changes in Risk-o-meter during the financial year^
HSBC Large Cap Equity Fund Very High Very High 0
^From the effective date (i.e. January 01, 2021) of SEBI circular no. SEBI/HO/IMD/DF3/CIR/P/2020/197 dated October 05, 2020.
13 The Annual Accounts of the Schemes prepared in accordance with the accounting policies and standards specified in the Ninth Schedule of The Securities and Exchange Board of India (Mutual Funds) Regulations, 1996 has been approved by the Board of Directors of HSBC Asset Management (India) Private Limited and The Board of Trustees of HSBC Mutual Fund at their meetings held on July 19, 2021 and July 20, 2021 respectively. The audit report attached herewith refers to the said Annual Accounts. The aforesaid abridged accounts are an extract of the Annual Accounts and are prepared in accordance with SEBI Circular No. IMD/Cir8/132968/2008 dated July 24, 2008.

24
Abridged Annual Report 2020 - 2021
Voting Policy and Procedures
In view of SEBI guidelines related to “Role of Mutual Funds in Corporate Governance of Public Listed Companies”, HSBC AMC has formulated its “Policy for Proxy Voting in Public Listed Companies”. The said policy is available on our website and the details of actual exercise of proxy votes, the summary of votes casted and the auditor’s certificate for the Financial Year 2020 – 21 is forming part of our full Annual Report for the Financial Year 2020 – 21 which is uploaded on our website at http://www.assetmanagement.hsbc.co.in
25
HSBC Large Cap Equity Fund
Statutory Details & Disclaimers
All the returns have been sourced from Mutual Funds India Explorer software. The performance of the schemes and the benchmark is calculated on a total return basis. This document has been prepared by HSBC Asset Management (India) Private Ltd (HSBC) for information purposes only and should not be construed as i) an offer or recommendation to buy or sell securities, commodities, currencies or other investments referred to herein; or ii) an offer to sell or a solicitation or an offer for purchase of any of the funds of HSBC Mutual Fund; or iii) an investment research or investment advice. All information contained in this document (including that sourced from third parties), is obtained from sources HSBC and the third party which HSBC believes to be reliable however, has not independently verified the same. The information and opinions contained within the document are based upon publicly available information and rates of taxation applicable (if any) at the time of publication, which are subject to change from time to time.
Expressions of opinion are those of HSBC only and are subject to change without notice. It does not have regard to specific investment objectives, financial situation and the particular needs of any specific person who may receive this document. Investors should seek personal and independent advice regarding the appropriateness of investing in any of the funds, securities, other investment or investment strategies that may have been discussed or referred herein and should understand that the views regarding future prospects may or may not be realized. In no event shall HSBC Mutual Fund / HSBC Asset management (India) Private Limited and / or its affiliates or any of their directors, trustees, officers and employees be liable for any direct, indirect, special, incidental or consequential damages arising out of the use of information / opinion herein. Neither this document nor the units of HSBC Mutual Fund have been registered in any jurisdiction. The distribution of this document in certain jurisdictions may be restricted or totally prohibited and accordingly, persons who come into possession of this document are required to inform themselves about, and to observe, any such restrictions.
mutual fund investments are subject to market risks, read all scheme related documents carefully.
HSBC Flexi Cap FundFlexi Cap Fund. An open ended equity Scheme investing across large cap, mid cap, small cap stocks
Abridged Annual Report 2020 - 2021

1
HSBC Flexi Cap Fund
Dear Investor,
The beginning of the last financial year now almost seems like a distant memory. COVID-19 was still a relatively unknown enemy and governments across the world were grappling with ways to control and mitigate the risks associated with it. Nationwide lockdowns were the norm and our markets both equity and fixed income reacted negatively leading to significant erosion of wealth. Within a short period of time markets bounced back. This confounded even the most astute market pundits. How is it possible that when GDP growth had slowed down, unemployment had risen, inflation was high could there be such sharp up move in equity indices. Whilst the reasons are well known about easy global liquidity, demand resurgence, cost cutting by corporates etc. perhaps its most important to remember that the markets are not a reflector but a predictor of economic activity.
At all times particularly during such volatile times it is important to go back to the basics. Why do you save, why do you invest, what goals would you like to achieve, how old are you, what is your risk appetite? The replies to these simple questions will help you determine your asset allocation. As an example when equity markets corrected sharply last year, investors who reviewed their asset allocation, stayed invested during the lows of the past year and were able to capture the rebound and have seen prime returns since then. The current market movement in all likelihood would have also led to some imbalances in your asset allocation. Do not ignore that and I strongly recommend that you do review this with your advisor to check whether re-balancing is required.
During this financial year we had three very successful new fund launches. The pandemic showed us a clear trend of dominant players becoming stronger and profit pool getting consolidated within a few companies. To capture this opportunity, we launched the HSBC Focused Equity Fund which garnered close to Rs. 520 crores. During the second half of 2020, in the fixed income space, 3 - 5 year duration range had a favourable investment scenario as RBI’s accommodative policy and surplus liquidity had reduced the returns at the very short end of the yield curve. There was a demand for an actively managed moderate duration strategy with better credit quality which we fulfilled by launching HSBC Corporate Bond Fund. It garnered over 700 crores. Our latest and first of its kind offering, HSBC Global Equity Climate Change Fund of Fund saw a stupendous response with over 8000 investors investing over Rs. 616 crores. This is an investment opportunity which goes beyond the rationale of simply generating investment returns and is the future of responsible investing.
We worked towards augmenting our digital capabilities by launching a few key enhancements to our online transaction platform. Being mindful of the movement restrictions in place, this year we focused on digitizing offline processes so that an investor need not need step out of her home for investing or availing any key services. While our interactive chatbot AskMe, eased service queries, our end-to-end digital KYC module enabled a first time Mutual Fund investor to invest in our funds without any paperwork. We listened to your feedback and digitized consolidation of folios and change of tax status which eliminated the need for you to physically visit our branches.
I am a strong believer in the India story and this story has just begun. The opportunity to invest in this high growth market is a very exciting opportunity. I do hope you share my enthusiasm and I ask that you continue to invest whilst reviewing your asset allocation at all times. As always thank you for your business. Stay safe.
Warm regards,
Ravi MenonChief Executive Officer,
HSBC Asset Management India

2
Abridged Annual Report 2020 - 2021
SPONSOR
HSBC Securities and Capital Markets (India) Private LimitedRegd. Office: 52/60, Mahatma Gandhi Road, Fort, Mumbai - 400 001.
TRUSTEE
Board of TrusteesOffice: 16, Veer Nariman Road, Fort, Mumbai 400 001.
ASSET MANAGEMENT COMPANY
HSBC Asset Management (India) Private LimitedCorp. & Regd. Office: 16, Veer Nariman Road, Fort, Mumbai 400 001.
CUSTODIAN
Standard Chartered Bank (SCB)Corp. & Regd. Office: Crescenzo, Securities Services, 3rd Floor, C-38/39, G-Block,Bandra Kurla Complex, Bandra East, Mumbai – 400051.
AUDITORS TO THE SCHEME
BSR & Co. LLPChartered Accountants
5th Floor, Lodha Excelus, Apollo Mills Compound, N. M. Joshi Marg, Mahalaxmi, Mumbai 400 011.
REGISTRAR & TRANSFER AGENTS
Computer Age Management Services Limited (CAMS)Unit: HSBC Mutual Fund ’C’ Block, 2nd Floor, Hanudev Info Park P. Ltd., SF No. 558/2, Udayampalayam Road, Nava India, Coimbatore - 641 028.
BOARD OF TRUSTEES
Ms. Jasmine Batliwalla - Chairperson
Mr. Nani Javeri - Trustee
Dr. T. C. Nair - Trustee
Mr. Pedro Bastos - Trustee
BOARD OF DIRECTORS
Mr. Dinesh Mittal - Director
Dr. Indu Shahani - Director
Mr. Ravi Menon - Director & Chief Executive Officer

3
HSBC Flexi Cap Fund
The Trustees of HSBC Mutual Fund (“Fund”) present the Nineteenth Annual Report and the audited abridged financial statements of the schemes of the Fund for the year ended March 31, 2021.
As at March 31, 2021, the Fund offered 37 schemes across asset classes to meet the varying investment needs of the investors. During FY 2020-2021, the Fund has launched various new products namely HSBC Corporate Bond Fund, HSBC Focused Equity Fund and HSBC Global Equity Climate Change Fund of Fund to fill the gaps in our product offering.
The Fund continues its focus on delivering consistent long term returns. The comments on the performance of the Scheme(s) is provided hereinafter. Dividends were declared under various schemes as per the provisions contained in the respective Scheme Information Documents after considering the distributable surplus available under the respective Schemes. Details of dividends declared can be viewed on our website at www.assetmanagement.hsbc.co.in.
1. Scheme Performance, future outlook and oPerationS of the SchemeS
a. operations and Performance of the Schemes
hSBc flexi cap fund*(flexi cap fund - an open ended dynamic equity scheme investing across large cap, mid cap, small cap stocks)
HFCF seeks long term capital growth through investments made dynamically across market capitalization (i.e. Large, Mid, and Small Caps). The investment could be in any one, two or all three types of market capitalization. The Scheme aims to predominantly invest in equity and equity related securities. However, in line with the asset allocation pattern of the Scheme, it could move its assets between equity and fixed income securities depending on its view on these markets. However, there can be no assurance or guarantee that the investment objective of the scheme would be achieved.
The net assets of HFCF amounted to Rs. 362.33 crores as at March 31, 2021 as compared to Rs 275.84 crores as at March 31, 2020. Around 98.97% of the net assets were invested in equities, 0.43% of the net assets were invested in reverse repos / TREPS and 0.60% in net current assets as at March 31, 2021.
HFCF is a flexi-cap fund (change in category during the year) and we remained invested in a diversified portfolio across all capitalization stocks. HFCF has underperformed over 1 year, 3 year, 5 year periods but it has outperformed its benchmark since inception. Fund’s one-year underperformance compared to the benchmark was largely due to adverse sector allocation factor. Being overweight Healthcare and underweight Utilities hurt the performance. Stock selection within Consumer Discretionary & Communication Services also impacted the performance. However, stock selection within Healthcare, Financials and Energy positively contributed to the performance.
Looking ahead, the AMC believes that the trend of profit pool consolidating with the dominant players in respective sectors / industries, is likely to continue and disruptions such as COVID, could accelerate that shift. The Fund Manager is positive on the theme of profit pool migration and consolidation visible across and within sectors as well as market capitalization segments. So as a result, the AMC would be focusing on market leaders or dominant companies within each sectors that are available at reasonable valuations. The AMC’s bottom up stock selection also focuses on earnings growth and within that there is an emphasis on stocks that are likely to deliver positive earnings surprises.
The AMC is of the view that the impact of the second wave would be short term in nature followed by a quick rebound. As a result, the Fund Manager is maintaining a pro-cyclical bias in the portfolio. Earnings growth is expected to rebound sharply in FY22 (post the short disruption period in 1Q). Earnings growth momentum is expected to sustain in high-teens beyond FY22 on the back of economy witnessing a cyclical recovery due to revival in capex cycle over the next 2-3 years (first by the government followed by private capex). Benign cost of capital and reasonable valuations (in the context of multi-year earnings outlook), should act as additional support to the equity performance, in the medium term. From a sectoral perspective the order of preference is rate sensitives followed by domestic cyclicals, exporters and domestic consumption. Predominantly regulated businesses come last in the pecking order. This preference is dictated by AMC’s assessment of sectors / segments leading contribution to the market earnings growth over the next 2-3 years.
Trustees’ ReportFor the year ended March 31, 2021

4
Abridged Annual Report 2020 - 2021
In line with this thought process, the fund is overweight on Financials, Industrials, Healthcare, Materials and Real Estate sectors. The fund is underweight on Consumer Staples, Energy, Communication Services and Utilities. Technology is a neutral weighted sector.
date of inception : 24 february 2004 absolute returns
(%)
compounded annualized returns (%)
Scheme name & Benchmarks 1 Year 3 Years 5 Years Since inception
HSBC Flexi Cap Fund - Growth 70.02 8.02 11.86 14.85
Nifty 500 TRI (Scheme Benchmark) 77.58 12.61 15.15 14.76
Nifty 50 TRI (Standard Benchmark) 72.54 14.58 15.12 14.45
Rs. 10,000, if invested in HMEF, would have become 17,002 12,615 17,519 1,06,860
Rs. 10,000, if invested in Nifty 500 TRI, would have become
17,758 14,299 20,253 1,05,437
Rs. 10,000, if invested in Nifty 50 TRI, would have become 17,254 15,065 20,227 1,00,668
Past performance may or may not be sustained in future. The returns for the respective periods are provided as on last business day of March 2021 for Growth Option. Different plans shall have a different expense structure. Performance of the respective benchmark is calculated as per the Total Return Index (TRI).
*The fundamental attributes of the scheme and name of the scheme has been changed from HSBC Multi Cap Equity Fund to
HSBC Flexi Cap Fund w.e.f. January 28, 2021.
b. market overview & outlook (as furnished by hSBc asset management (india) Private limited)
equitY outlook
recap of fY 2020-21:
Fiscal 2020-21 was a rewarding year for equity investors with market indices recording stellar gains from the low base after the COVID correction. Market sentiments steadily improved during the course of the year to deliver positive returns in all four quarters of the year.
We witnessed various legs of market performance during the last fiscal, driven by multiple factors and variables. Initial rebound from the market lows was driven by attractive valuations, then it was on the back of faster than anticipated recovery post lockdown, reopening optimism, swifter than expected vaccine intervention and above all, the unprecedented liquidity. Lastly but importantly, a period of lower cost of capital coupled with low real rates, improved the attractiveness of equity as an asset class, driving the performance.
As a result, the year ended with optimism compared to despair when it began. Corporate India overcame the challenges posed by COVID through significant cost control measures while at the same time showed improvement in their financial position and cash flows.
Commodities also rallied from the lows of the COVID crisis with global crude oil prices surging by 179% during the year. INR appreciated by 3.3% (as India recorded strong net FPI inflows) during the year. MSCI India index outperformed most of key global indices during the past fiscal. MSCI India index (USD) gained 74.8% as compared to 51.8% for MSCI World, 50.5% for Dow Jones, 55.1% for MSCI Emerging Markets, 41.2% for MSCI China and 42% for MSCI Europe*.
At a record USD 37.3 bn of net FPI inflows during the fiscal, the tally was higher than the cumulative net inflows India received from the previous 6 years. DIIs on the other hand saw net outflows of USD 18.4 bn and this was the first fiscal year of net outflows from the segment in 5 years. The net outflows from the segment was driven by USD 16.7 bn of outflows from the MFs while domestic insurers saw a far lower outflow of USD 1.6 bn*.
Trustees’ ReportFor the year ended March 31, 2021 (Contd...)
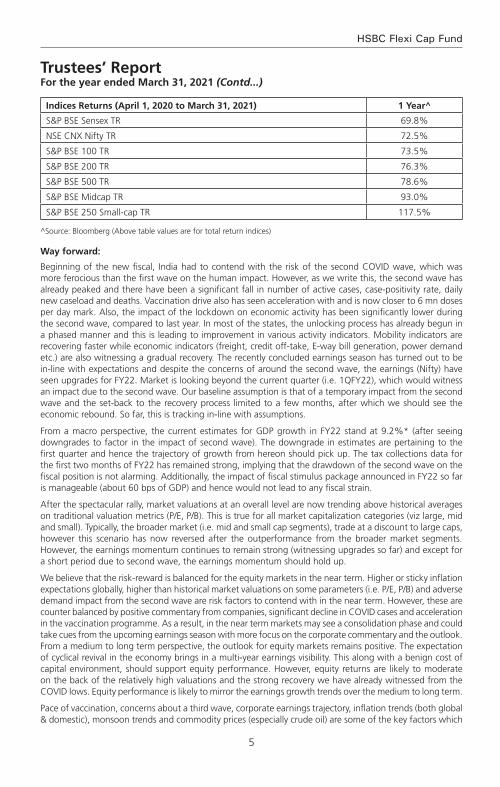
5
HSBC Flexi Cap Fund
indices returns (april 1, 2020 to march 31, 2021) 1 Year^
S&P BSE Sensex TR 69.8%
NSE CNX Nifty TR 72.5%
S&P BSE 100 TR 73.5%
S&P BSE 200 TR 76.3%
S&P BSE 500 TR 78.6%
S&P BSE Midcap TR 93.0%
S&P BSE 250 Small-cap TR 117.5%
^Source: Bloomberg (Above table values are for total return indices)
Way forward:
Beginning of the new fiscal, India had to contend with the risk of the second COVID wave, which was more ferocious than the first wave on the human impact. However, as we write this, the second wave has already peaked and there have been a significant fall in number of active cases, case-positivity rate, daily new caseload and deaths. Vaccination drive also has seen acceleration with and is now closer to 6 mn doses per day mark. Also, the impact of the lockdown on economic activity has been significantly lower during the second wave, compared to last year. In most of the states, the unlocking process has already begun in a phased manner and this is leading to improvement in various activity indicators. Mobility indicators are recovering faster while economic indicators (freight, credit off-take, E-way bill generation, power demand etc.) are also witnessing a gradual recovery. The recently concluded earnings season has turned out to be in-line with expectations and despite the concerns of around the second wave, the earnings (Nifty) have seen upgrades for FY22. Market is looking beyond the current quarter (i.e. 1QFY22), which would witness an impact due to the second wave. Our baseline assumption is that of a temporary impact from the second wave and the set-back to the recovery process limited to a few months, after which we should see the economic rebound. So far, this is tracking in-line with assumptions.
From a macro perspective, the current estimates for GDP growth in FY22 stand at 9.2%* (after seeing downgrades to factor in the impact of second wave). The downgrade in estimates are pertaining to the first quarter and hence the trajectory of growth from hereon should pick up. The tax collections data for the first two months of FY22 has remained strong, implying that the drawdown of the second wave on the fiscal position is not alarming. Additionally, the impact of fiscal stimulus package announced in FY22 so far is manageable (about 60 bps of GDP) and hence would not lead to any fiscal strain.
After the spectacular rally, market valuations at an overall level are now trending above historical averages on traditional valuation metrics (P/E, P/B). This is true for all market capitalization categories (viz large, mid and small). Typically, the broader market (i.e. mid and small cap segments), trade at a discount to large caps, however this scenario has now reversed after the outperformance from the broader market segments. However, the earnings momentum continues to remain strong (witnessing upgrades so far) and except for a short period due to second wave, the earnings momentum should hold up.
We believe that the risk-reward is balanced for the equity markets in the near term. Higher or sticky inflation expectations globally, higher than historical market valuations on some parameters (i.e. P/E, P/B) and adverse demand impact from the second wave are risk factors to contend with in the near term. However, these are counter balanced by positive commentary from companies, significant decline in COVID cases and acceleration in the vaccination programme. As a result, in the near term markets may see a consolidation phase and could take cues from the upcoming earnings season with more focus on the corporate commentary and the outlook. From a medium to long term perspective, the outlook for equity markets remains positive. The expectation of cyclical revival in the economy brings in a multi-year earnings visibility. This along with a benign cost of capital environment, should support equity performance. However, equity returns are likely to moderate on the back of the relatively high valuations and the strong recovery we have already witnessed from the COVID lows. Equity performance is likely to mirror the earnings growth trends over the medium to long term.
Pace of vaccination, concerns about a third wave, corporate earnings trajectory, inflation trends (both global & domestic), monsoon trends and commodity prices (especially crude oil) are some of the key factors which
Trustees’ ReportFor the year ended March 31, 2021 (Contd...)

6
Abridged Annual Report 2020 - 2021
could influence market performance in the short term.
From a portfolio perspective, we are maintaining a pro-cyclical bias. We expect earnings growth to rebound sharply post the current COVID phase. Earnings growth are expected to sustain in high-teens beyond FY22 on the back of economy witnessing a cyclical recovery due to revival in capex cycle over the next 2-3 years (first by the government followed by private capex). From a sectoral perspective our order of preference is rate sensitives followed by domestic cyclicals, exporters and domestic consumption. Predominantly regulated businesses come last in our pecking order. This preference is dictated by our assessment of sectors / segments leading contribution to the market earnings growth over the next 2-3 years. Our portfolio construction is driven by a bottom up approach to stock selection with a focus on names that can deliver positive earnings surprises. We continue to focus on this theme to identify likely outperformers.
*Source: Bloomberg
deBt outlook
market drivers during the course of the year fY21
The Fixed Income markets started the year with a bout of nervousness that was triggered by the pandemic. While RBI had calmed the markets with its large rate cut action of 75bp cut followed by liquidity supportive measures, the volatility continued until mid-May when government announced its relief package. While it was not fiscally expansive, it touched the right cords in terms of credit flow to desired sectors. This was followed up with RBI’s credit relief measures in terms of moratorium and restructuring of assets that were stressed due to the pandemic. Throughout the course of the year, RBI maintained its accommodative stance along with significant amount of surplus liquidity that was supportive and helped in maintaining stability in the market. However, as the year progressed and pressure on fiscal began to mount yields started seeing a spike towards the last quarter of the fiscal. While borrowing was stepped up to INR 12 trillion from previously budgeted INR 7.8 trillion in May 2020, it was further enhanced by and additional INR 1.1 trillion in October 2020. Overall GOI ended up borrowing a record amount of INR 13.9 trillion. The budget proved to be a shocker with GOI using the pandemic as an opportunity for setting the finances in order. GOI showed a record deficit of 9.5% for FY21 and projected a 6.8% for FY22 with estimated central government gross borrowing of INR 12 trillion. This seemed to reverse the support RBI had provided throughout the year with benchmark 10-year bond peaking to 6.23% in mid –Feb 2021. RBI’s statements to remain supportive were left in the sidelines. Overall it seemed that the 115bp of rate cut, along with significant liquidity infusion (OMO + Twist operations of ~INR 3 trillion, infusion via dollar purchases) seemed only a little to help in applying a brake to the one-way spike in yields. The year closed ~6.16% with absence of concrete action by RBI.
rBi Policy: Through the course of the year, RBI has maintained an accommodative stance, with an aggregate 115bp of rate cut done in March and May 2020 taking the repo rate from 5.15% to 4%. Subsequently while inflation pressures prevented RBI from taking any direct actions, RBI has used a combination of creative tools to keep the rates contained primarily via liquidity supportive tools such as OMOs, Twist Operations, Repo linked Term loans to needy sectors (LTROs, TLTROs), CRR cuts. While inflation was a worry for most part of the year, RBI kept it aside admitting that growth was a priority and inflation effects are more supply side rather than demand side. Prospectively into FY22, with the onset of the second wave, RBI continues to maintain the stance to prioritize growth.
inflation: Inflation for most part of the year stayed above 6% primarily driven by supply side pressures and some intermittent spike from food inflation as well. While it has been coming off since December with cooling off of food inflation and positive base effects, it has been between 4- 5.5%. Structurally however inflation risks continue to remain as oil prices have increased and base effects will not remain supportive for long. Core inflation continues to remain sticky.
liquidity: During the year, system liquidity has remained at significant surplus facilitated largely by RBI action such as OMOs, foreign exchange operations and government spending.
Budget: The FY2022 union budget focuses on growth and has accordingly, presented a 9.5% fiscal deficit for FY21 and 6.8% for FY22. On the revenue side, the assumptions are largely realistic, with FY22 (E) Nominal GDP growth at 14.4% and tax revenue growth at 17% considering the pandemic impact in FY 21. Compared to FY20, tax revenue growth is ~10%. While non-tax revenues are ambitious pegging the divestment at INR 1.75 trillion, with robust pipeline of assets including monetization of road and transmission assets, execution
Trustees’ ReportFor the year ended March 31, 2021 (Contd...)
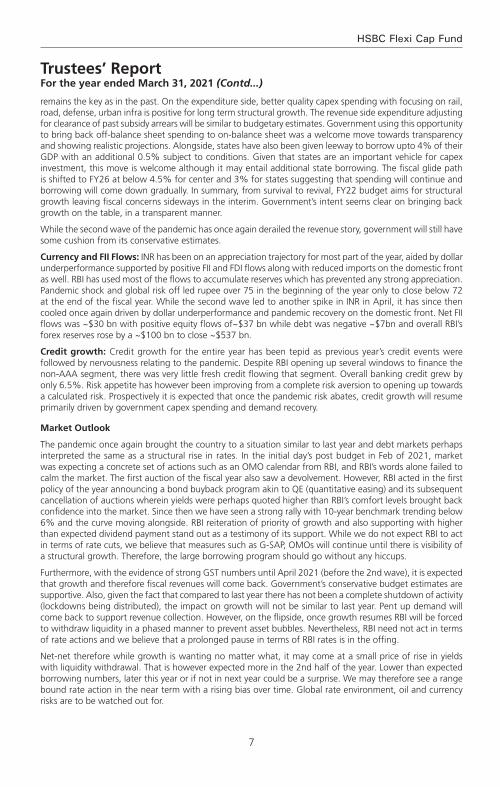
7
HSBC Flexi Cap Fund
remains the key as in the past. On the expenditure side, better quality capex spending with focusing on rail, road, defense, urban infra is positive for long term structural growth. The revenue side expenditure adjusting for clearance of past subsidy arrears will be similar to budgetary estimates. Government using this opportunity to bring back off-balance sheet spending to on-balance sheet was a welcome move towards transparency and showing realistic projections. Alongside, states have also been given leeway to borrow upto 4% of their GDP with an additional 0.5% subject to conditions. Given that states are an important vehicle for capex investment, this move is welcome although it may entail additional state borrowing. The fiscal glide path is shifted to FY26 at below 4.5% for center and 3% for states suggesting that spending will continue and borrowing will come down gradually. In summary, from survival to revival, FY22 budget aims for structural growth leaving fiscal concerns sideways in the interim. Government’s intent seems clear on bringing back growth on the table, in a transparent manner.
While the second wave of the pandemic has once again derailed the revenue story, government will still have some cushion from its conservative estimates.
currency and fii flows: INR has been on an appreciation trajectory for most part of the year, aided by dollar underperformance supported by positive FII and FDI flows along with reduced imports on the domestic front as well. RBI has used most of the flows to accumulate reserves which has prevented any strong appreciation. Pandemic shock and global risk off led rupee over 75 in the beginning of the year only to close below 72 at the end of the fiscal year. While the second wave led to another spike in INR in April, it has since then cooled once again driven by dollar underperformance and pandemic recovery on the domestic front. Net FII flows was ~$30 bn with positive equity flows of~$37 bn while debt was negative ~$7bn and overall RBI’s forex reserves rose by a ~$100 bn to close ~$537 bn.
credit growth: Credit growth for the entire year has been tepid as previous year’s credit events were followed by nervousness relating to the pandemic. Despite RBI opening up several windows to finance the non-AAA segment, there was very little fresh credit flowing that segment. Overall banking credit grew by only 6.5%. Risk appetite has however been improving from a complete risk aversion to opening up towards a calculated risk. Prospectively it is expected that once the pandemic risk abates, credit growth will resume primarily driven by government capex spending and demand recovery.
market outlook
The pandemic once again brought the country to a situation similar to last year and debt markets perhaps interpreted the same as a structural rise in rates. In the initial day’s post budget in Feb of 2021, market was expecting a concrete set of actions such as an OMO calendar from RBI, and RBI’s words alone failed to calm the market. The first auction of the fiscal year also saw a devolvement. However, RBI acted in the first policy of the year announcing a bond buyback program akin to QE (quantitative easing) and its subsequent cancellation of auctions wherein yields were perhaps quoted higher than RBI’s comfort levels brought back confidence into the market. Since then we have seen a strong rally with 10-year benchmark trending below 6% and the curve moving alongside. RBI reiteration of priority of growth and also supporting with higher than expected dividend payment stand out as a testimony of its support. While we do not expect RBI to act in terms of rate cuts, we believe that measures such as G-SAP, OMOs will continue until there is visibility of a structural growth. Therefore, the large borrowing program should go without any hiccups.
Furthermore, with the evidence of strong GST numbers until April 2021 (before the 2nd wave), it is expected that growth and therefore fiscal revenues will come back. Government’s conservative budget estimates are supportive. Also, given the fact that compared to last year there has not been a complete shutdown of activity (lockdowns being distributed), the impact on growth will not be similar to last year. Pent up demand will come back to support revenue collection. However, on the flipside, once growth resumes RBI will be forced to withdraw liquidity in a phased manner to prevent asset bubbles. Nevertheless, RBI need not act in terms of rate actions and we believe that a prolonged pause in terms of RBI rates is in the offing.
Net-net therefore while growth is wanting no matter what, it may come at a small price of rise in yields with liquidity withdrawal. That is however expected more in the 2nd half of the year. Lower than expected borrowing numbers, later this year or if not in next year could be a surprise. We may therefore see a range bound rate action in the near term with a rising bias over time. Global rate environment, oil and currency risks are to be watched out for.
Trustees’ ReportFor the year ended March 31, 2021 (Contd...)
8
Abridged Annual Report 2020 - 2021
2. Brief Background of SPonSorS, Board of truSteeS and aSSet management comPanY
a. Sponsor
HSBC Mutual Fund is sponsored by HSBC Securities and Capital Markets (India) Private Limited (HSCI). The Sponsor is the Settler of the Mutual Fund Trust. The Sponsor has entrusted a sum of Rs. 1,00,000/- (Rupees One Lakh only) to the Trustee as the initial contribution towards the corpus of the Mutual Fund.
HSCI offers integrated investment banking services, securities and corporate finance & advisory. HSCI is a member of the Bombay Stock Exchange Limited and National Stock Exchange (capital and derivative market segments). HSCI holds 100% of the paid up equity share capital of HSBC Asset Management (India) Private Limited.
b. hSBc mutual fund
HSBC Mutual Fund (“the Mutual Fund” or “the Fund”) has been constituted as a Trust in accordance with the provisions of the Indian Trusts Act, 1882 (2 of 1882) vide a Trust Deed dated February 7, 2002 with HSBC Securities and Capital Markets (India) Private Limited, as the Sponsor and the Board of Individual Trustees. The Trustee has entered into an Investment Management Agreement dated February 7, 2002 with HSBC Asset Management (India) Private Limited (AMC) to function as the Investment Manager for all the schemes of the Fund. The Fund was registered with SEBI vide registration number MF/046/02/5 dated May 27, 2002.
The Trust has been formed for the purpose of pooling of capital from the public for collective investment in securities for the purpose of providing facilities for participation by persons as beneficiaries in such investments and in the profits/income arising therefrom.
c. Board of trustees (the trustees)
The Board of Trustees is the exclusive owner of the Trust Fund and holds the same in trust for the benefit of the unit holders. The Trustees have been discharging their duties and carrying out the responsibilities as provided in the SEBI (Mutual Funds) Regulations, 1996 and the Trust Deed. The Trustees seek to ensure that the Fund and the schemes floated there under are managed by the AMC in accordance with the Trust Deed, the said Regulations, directions and guidelines issued by the SEBI, the Stock Exchanges, the Association of Mutual Funds in India and other regulatory agencies.
d. asset management company (the amc)
HSBC Asset Management (India) Private Limited (the Investment Manager or the AMC) is a private limited company incorporated under the Companies Act, 1956 on December 12, 2001 having its Registered Office at 16, V. N. Road, Fort, Mumbai 400 001. HSBC Asset Management (India) Private Limited has been appointed as the Asset Management Company of HSBC Mutual Fund by the Trustee vide Investment Management Agreement (IMA) dated February 7, 2002 and executed between the Trustees and the AMC. SEBI approved the AMC to act as the Investment Manager of the Fund vide its letter No. MFD/BC/163/2002 dated May 27, 2002. The paid-up equity share capital of the AMC is Rs. 61.59 crores. The AMC is registered as a Portfolio Manager under the SEBI (Portfolio Managers) Regulations, 1993 vide registration no. INP000001322. The AMC also offers non-binding Advisory services to offshore funds under the mutual fund license.
HSBC Securities and Capital Markets (India) Private Limited holds 100% of the paid up equity share capital of the AMC.
3. inveStment oBjective of the SchemeSThe investment objective of the respective schemes has been provided above under the heading “Scheme Performance, Future Outlook and Operation of the Scheme” (Refer Section 1).
4. Significant accounting PolicieS The Significant Accounting Policies form part of the Notes to the Accounts annexed to the Balance Sheet of the Schemes in the Full Annual Report. The accounting policies are in accordance with Securities Exchange Board of India (Mutual Funds) Regulations 1996.
Trustees’ ReportFor the year ended March 31, 2021 (Contd...)
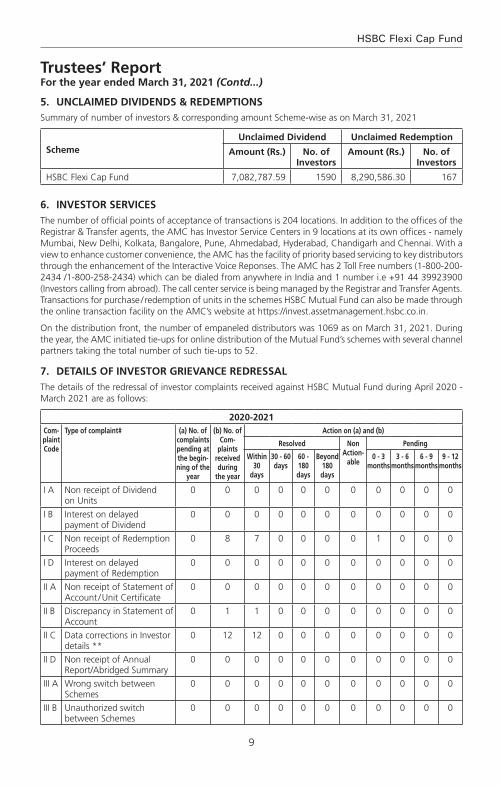
9
HSBC Flexi Cap Fund
Trustees’ ReportFor the year ended March 31, 2021 (Contd...)
5. unclaimed dividendS & redemPtionSSummary of number of investors & corresponding amount Scheme-wise as on March 31, 2021
Schemeunclaimed dividend unclaimed redemption
amount (rs.) no. of investors
amount (rs.) no. of investors
HSBC Flexi Cap Fund 7,082,787.59 1590 8,290,586.30 167
6. inveStor ServiceSThe number of official points of acceptance of transactions is 204 locations. In addition to the offices of the Registrar & Transfer agents, the AMC has Investor Service Centers in 9 locations at its own offices - namely Mumbai, New Delhi, Kolkata, Bangalore, Pune, Ahmedabad, Hyderabad, Chandigarh and Chennai. With a view to enhance customer convenience, the AMC has the facility of priority based servicing to key distributors through the enhancement of the Interactive Voice Reponses. The AMC has 2 Toll Free numbers (1-800-200-2434 /1-800-258-2434) which can be dialed from anywhere in India and 1 number i.e +91 44 39923900 (Investors calling from abroad). The call center service is being managed by the Registrar and Transfer Agents. Transactions for purchase / redemption of units in the schemes HSBC Mutual Fund can also be made through the online transaction facility on the AMC’s website at https://invest.assetmanagement.hsbc.co.in.
On the distribution front, the number of empaneled distributors was 1069 as on March 31, 2021. During the year, the AMC initiated tie-ups for online distribution of the Mutual Fund’s schemes with several channel partners taking the total number of such tie-ups to 52.
7. detailS of inveStor grievance redreSSalThe details of the redressal of investor complaints received against HSBC Mutual Fund during April 2020 - March 2021 are as follows:
2020-2021com-plaint code
type of complaint# (a) no. of complaints pending at the begin-ning of the
year
(b) no. of com-
plaints received during
the year
action on (a) and (b)
resolved non action-
able
Pending
Within 30
days
30 - 60 days
60 - 180 days
Beyond 180 days
0 - 3 months
3 - 6 months
6 - 9 months
9 - 12 months
I A Non receipt of Dividend on Units
0 0 0 0 0 0 0 0 0 0 0
I B Interest on delayed payment of Dividend
0 0 0 0 0 0 0 0 0 0 0
I C Non receipt of Redemption Proceeds
0 8 7 0 0 0 0 1 0 0 0
I D Interest on delayed payment of Redemption
0 0 0 0 0 0 0 0 0 0 0
II A Non receipt of Statement of Account / Unit Certificate
0 0 0 0 0 0 0 0 0 0 0
II B Discrepancy in Statement of Account
0 1 1 0 0 0 0 0 0 0 0
II C Data corrections in Investor details **
0 12 12 0 0 0 0 0 0 0 0
II D Non receipt of Annual Report/Abridged Summary
0 0 0 0 0 0 0 0 0 0 0
III A Wrong switch between Schemes
0 0 0 0 0 0 0 0 0 0 0
III B Unauthorized switch between Schemes
0 0 0 0 0 0 0 0 0 0 0

10
Abridged Annual Report 2020 - 2021
Trustees’ ReportFor the year ended March 31, 2021 (Contd...)
2020-2021com-plaint code
type of complaint# (a) no. of complaints pending at the begin-ning of the
year
(b) no. of com-
plaints received during
the year
action on (a) and (b)
resolved non action-
able
Pending
Within 30
days
30 - 60 days
60 - 180 days
Beyond 180 days
0 - 3 months
3 - 6 months
6 - 9 months
9 - 12 months
III C Deviation from Scheme attributes
0 0 0 0 0 0 0 0 0 0 0
III D Wrong or excess charges/load
0 0 0 0 0 0 0 0 0 0 0
III E Non updation of changes viz. address, PAN, bank details, nomination, etc
0 6 6 0 0 0 0 0 0 0 0
IV Others 0 15 15 0 0 0 0 0 0 0 0
total 0 42 41 0 0 0 0 1 0 0 0
Summary of complaints for fY 2020-21
Particulars count
Total complaints received 42
Total number of folios 148770
% of complaints against the folio 0.028%
# active folios
** As per AMFI Best Practice Guidelines Circular No. 25/2011-12 for Revisions in the Guidelines on Standardization of Complaints / Grievances Reporting Procedure. If “Others” include a type of complaint which is more than 10% of overall complaints, then such a reason should be provided separately. Hence data corrections in Investor Details is included as a separate category
* Non actionable means the complaint is incomplete / outside the scope of the mutual fund
8. inveStor education initiativeS Investor awareness advertisements were published in Mutual Fund Insight magazine on a monthly basis along with an editorial on ‘SIP Sahi Hai’. Additionally, monthly articles / blogs have been written by Advisorkhoj on IAP which talks of the advantages of SIP, start early, power of compounding, diversification, asset allocation etc. The same is promoted by the publisher via an email to their entire network and also on their social media handles which can be retweeted or liked. Also, educative infographics have been hosted on our website under the investor resources section. The same have also been circulated to existing Indian investors via email for engagement and for educative purposes.
9. ProxY voting PolicYIn terms of SEBI Circular no. SEBI/IMD/CIR No. 18/198647/2010 dated March 15, 2010, the Fund has adopted Proxy Voting Policy and Procedures for exercising voting rights in respect of securities held by the Schemes.
The summary of the votes casted in the general meetings of the Investee companies, by the AMC for and on behalf of the Schemes of the Fund, for the financial year 2020-2021 is provided below:
quarter total no. of resolutions
Break-up of vote decision
for against abstained
June 2020 50 43 6 1
September 2020 752 656 38 58
December 2020 41 31 1 9
March 2021 40 30 8 2
total 883 760 53 70
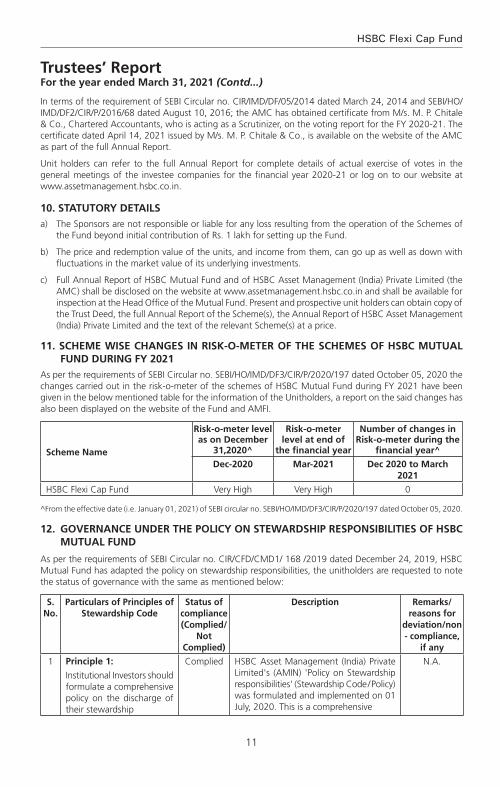
11
HSBC Flexi Cap Fund
Trustees’ ReportFor the year ended March 31, 2021 (Contd...)
In terms of the requirement of SEBI Circular no. CIR/IMD/DF/05/2014 dated March 24, 2014 and SEBI/HO/IMD/DF2/CIR/P/2016/68 dated August 10, 2016; the AMC has obtained certificate from M/s. M. P. Chitale & Co., Chartered Accountants, who is acting as a Scrutinizer, on the voting report for the FY 2020-21. The certificate dated April 14, 2021 issued by M/s. M. P. Chitale & Co., is available on the website of the AMC as part of the full Annual Report.
Unit holders can refer to the full Annual Report for complete details of actual exercise of votes in the general meetings of the investee companies for the financial year 2020-21 or log on to our website at www.assetmanagement.hsbc.co.in.
10. StatutorY detailSa) The Sponsors are not responsible or liable for any loss resulting from the operation of the Schemes of
the Fund beyond initial contribution of Rs. 1 lakh for setting up the Fund.
b) The price and redemption value of the units, and income from them, can go up as well as down with fluctuations in the market value of its underlying investments.
c) Full Annual Report of HSBC Mutual Fund and of HSBC Asset Management (India) Private Limited (the AMC) shall be disclosed on the website at www.assetmanagement.hsbc.co.in and shall be available for inspection at the Head Office of the Mutual Fund. Present and prospective unit holders can obtain copy of the Trust Deed, the full Annual Report of the Scheme(s), the Annual Report of HSBC Asset Management (India) Private Limited and the text of the relevant Scheme(s) at a price.
11. Scheme WiSe changeS in riSk-o-meter of the SchemeS of hSBc mutual fund during fY 2021
As per the requirements of SEBI Circular no. SEBI/HO/IMD/DF3/CIR/P/2020/197 dated October 05, 2020 the changes carried out in the risk-o-meter of the schemes of HSBC Mutual Fund during FY 2021 have been given in the below mentioned table for the information of the Unitholders, a report on the said changes has also been displayed on the website of the Fund and AMFI.
Scheme name
risk-o-meter level as on december
31,2020^
risk-o-meter level at end of
the financial year
number of changes in risk-o-meter during the
financial year^
dec-2020 mar-2021 dec 2020 to march 2021
HSBC Flexi Cap Fund Very High Very High 0
^From the effective date (i.e. January 01, 2021) of SEBI circular no. SEBI/HO/IMD/DF3/CIR/P/2020/197 dated October 05, 2020.
12. governance under the PolicY on SteWardShiP reSPonSiBilitieS of hSBc mutual fund
As per the requirements of SEBI Circular no. CIR/CFD/CMD1/ 168 /2019 dated December 24, 2019, HSBC Mutual Fund has adapted the policy on stewardship responsibilities, the unitholders are requested to note the status of governance with the same as mentioned below:
S. no.
Particulars of Principles of Stewardship code
Status of compliance (complied/
not complied)
description remarks/reasons for
deviation/non - compliance,
if any
1 Principle 1:
Institutional Investors should formulate a comprehensive policy on the discharge of their stewardship
Complied HSBC Asset Management (India) Private Limited's (AMIN) 'Policy on Stewardship responsibilities' (Stewardship Code / Policy) was formulated and implemented on 01 July, 2020. This is a comprehensive
N.A.

12
Abridged Annual Report 2020 - 2021
Trustees’ ReportFor the year ended March 31, 2021 (Contd...)
S. no.
Particulars of Principles of Stewardship code
Status of compliance (complied/
not complied)
description remarks/reasons for
deviation/non - compliance,
if any
responsibilities, publicly disclose it, review and update it periodically.
document which has been publicly disclosed on the website of AMIN. The same shall follow a periodic review.
2 Principle 2:
Inst i tut ional investors should have a clear policy on how they manage conflicts of interest in fulfilling their stewardship responsibilities and publicly disclose it.
Complied Defining and managing Conflict of Interest in fulfilling stewardship responsibilities are detailed in the Stewardship Policy document. The policy document is publicly disclosed.
N.A.
3 Principle 3:
Institutional investors should monitor their investee companies.
Complied AMIN monitors all investee companies through its investment process. This includes assessment of companies’ own and market data, consideration of research from brokers and other independent research providers – including ESG & voting research, attending individual & group meetings with company management and directors, visiting production sites (wherever necessary), engaging with key stakeholders including competitors and customers, and financial modelling. More details enumerated in the policy document
N.A.
4 Principle 4:
Inst i tut ional investors should have a clear policy on intervention in their investee companies. Institutional investors should also have a clear policy for collaboration with other institutional investors where required, to preserve the interests of the ultimate investors, which should be disclosed.
Complied Details of undertaking active engagement with investee companies and the policy for collaboration with other institutional holders are detailed in the policy document. The policy document is publicly disclosed.
N.A.
5 Principle 5:
Inst i tut ional investors should have a clear policy on voting and disclosure of voting activity.
Complied AMIN has a clear and detailed voting policy which provides the framework for the voting decisions. All voting decisions shall be in accordance with AMIN’s Voting Policy and Procedures, which is disclosed on the website. AMIN discloses the details of the voting on its website on a quarterly basis within 10 working days from the end of the quarter. Additionally, AMIN also discloses the details of the votes cast, in the annual report of the schemes of HSBC Mutual Fund.
N.A.
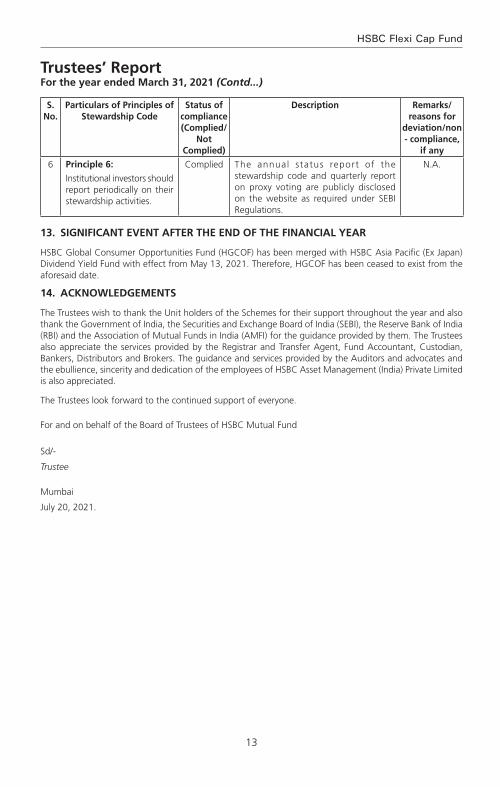
13
HSBC Flexi Cap Fund
Trustees’ ReportFor the year ended March 31, 2021 (Contd...)
S. no.
Particulars of Principles of Stewardship code
Status of compliance (complied/
not complied)
description remarks/reasons for
deviation/non - compliance,
if any
6 Principle 6:
Institutional investors should report periodically on their stewardship activities.
Complied The annual status report of the stewardship code and quarterly report on proxy voting are publicly disclosed on the website as required under SEBI Regulations.
N.A.
13. Significant event after the end of the financial Year
HSBC Global Consumer Opportunities Fund (HGCOF) has been merged with HSBC Asia Pacific (Ex Japan) Dividend Yield Fund with effect from May 13, 2021. Therefore, HGCOF has been ceased to exist from the aforesaid date.
14. acknoWledgementS
The Trustees wish to thank the Unit holders of the Schemes for their support throughout the year and also thank the Government of India, the Securities and Exchange Board of India (SEBI), the Reserve Bank of India (RBI) and the Association of Mutual Funds in India (AMFI) for the guidance provided by them. The Trustees also appreciate the services provided by the Registrar and Transfer Agent, Fund Accountant, Custodian, Bankers, Distributors and Brokers. The guidance and services provided by the Auditors and advocates and the ebullience, sincerity and dedication of the employees of HSBC Asset Management (India) Private Limited is also appreciated.
The Trustees look forward to the continued support of everyone.
For and on behalf of the Board of Trustees of HSBC Mutual Fund
Sd/-
Trustee
Mumbai
July 20, 2021.
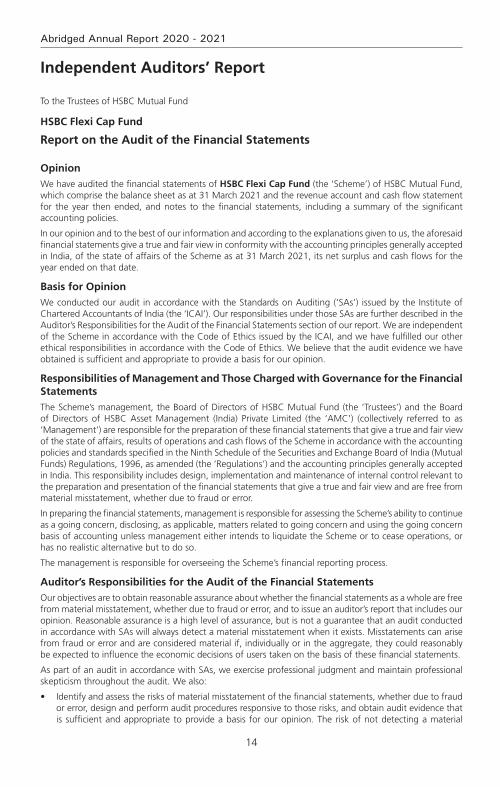
14
Abridged Annual Report 2020 - 2021
To the Trustees of HSBC Mutual Fund
hSBc flexi cap fund
Report on the Audit of the Financial Statements
opinionWe have audited the financial statements of hSBc flexi cap fund (the ‘Scheme’) of HSBC Mutual Fund, which comprise the balance sheet as at 31 March 2021 and the revenue account and cash flow statement for the year then ended, and notes to the financial statements, including a summary of the significant accounting policies.
In our opinion and to the best of our information and according to the explanations given to us, the aforesaid financial statements give a true and fair view in conformity with the accounting principles generally accepted in India, of the state of affairs of the Scheme as at 31 March 2021, its net surplus and cash flows for the year ended on that date.
Basis for opinionWe conducted our audit in accordance with the Standards on Auditing (‘SAs’) issued by the Institute of Chartered Accountants of India (the ‘ICAI’). Our responsibilities under those SAs are further described in the Auditor’s Responsibilities for the Audit of the Financial Statements section of our report. We are independent of the Scheme in accordance with the Code of Ethics issued by the ICAI, and we have fulfilled our other ethical responsibilities in accordance with the Code of Ethics. We believe that the audit evidence we have obtained is sufficient and appropriate to provide a basis for our opinion.
responsibilities of management and those charged with governance for the financial StatementsThe Scheme’s management, the Board of Directors of HSBC Mutual Fund (the ‘Trustees’) and the Board of Directors of HSBC Asset Management (India) Private Limited (the ‘AMC’) (collectively referred to as ‘Management’) are responsible for the preparation of these financial statements that give a true and fair view of the state of affairs, results of operations and cash flows of the Scheme in accordance with the accounting policies and standards specified in the Ninth Schedule of the Securities and Exchange Board of India (Mutual Funds) Regulations, 1996, as amended (the ‘Regulations’) and the accounting principles generally accepted in India. This responsibility includes design, implementation and maintenance of internal control relevant to the preparation and presentation of the financial statements that give a true and fair view and are free from material misstatement, whether due to fraud or error.
In preparing the financial statements, management is responsible for assessing the Scheme’s ability to continue as a going concern, disclosing, as applicable, matters related to going concern and using the going concern basis of accounting unless management either intends to liquidate the Scheme or to cease operations, or has no realistic alternative but to do so.
The management is responsible for overseeing the Scheme’s financial reporting process.
auditor’s responsibilities for the audit of the financial StatementsOur objectives are to obtain reasonable assurance about whether the financial statements as a whole are free from material misstatement, whether due to fraud or error, and to issue an auditor’s report that includes our opinion. Reasonable assurance is a high level of assurance, but is not a guarantee that an audit conducted in accordance with SAs will always detect a material misstatement when it exists. Misstatements can arise from fraud or error and are considered material if, individually or in the aggregate, they could reasonably be expected to influence the economic decisions of users taken on the basis of these financial statements.
As part of an audit in accordance with SAs, we exercise professional judgment and maintain professional skepticism throughout the audit. We also:
• Identifyandassesstherisksofmaterialmisstatementofthefinancialstatements,whetherduetofraudor error, design and perform audit procedures responsive to those risks, and obtain audit evidence that is sufficient and appropriate to provide a basis for our opinion. The risk of not detecting a material
Independent Auditors’ Report
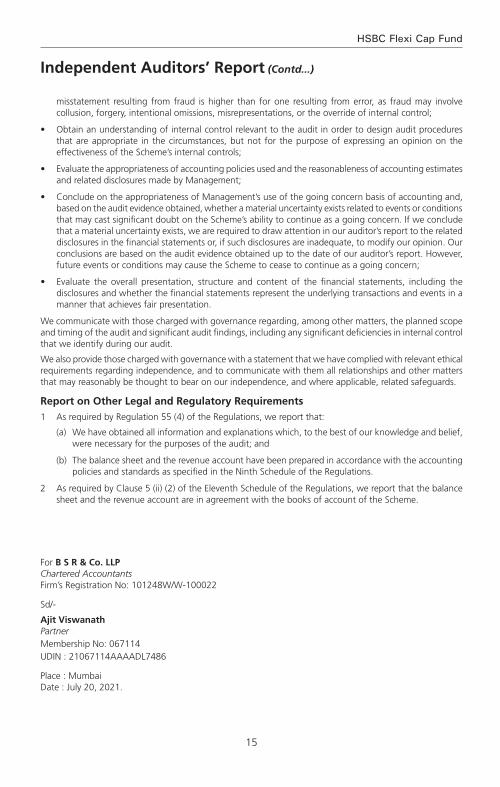
15
HSBC Flexi Cap Fund
Independent Auditors’ Report (Contd...)
misstatement resulting from fraud is higher than for one resulting from error, as fraud may involve collusion, forgery, intentional omissions, misrepresentations, or the override of internal control;
• Obtainanunderstandingofinternalcontrolrelevanttotheauditinordertodesignauditproceduresthat are appropriate in the circumstances, but not for the purpose of expressing an opinion on the effectiveness of the Scheme’s internal controls;
• Evaluatetheappropriatenessofaccountingpoliciesusedandthereasonablenessofaccountingestimatesand related disclosures made by Management;
• ConcludeontheappropriatenessofManagement’suseofthegoingconcernbasisofaccountingand,based on the audit evidence obtained, whether a material uncertainty exists related to events or conditions that may cast significant doubt on the Scheme’s ability to continue as a going concern. If we conclude that a material uncertainty exists, we are required to draw attention in our auditor’s report to the related disclosures in the financial statements or, if such disclosures are inadequate, to modify our opinion. Our conclusions are based on the audit evidence obtained up to the date of our auditor’s report. However, future events or conditions may cause the Scheme to cease to continue as a going concern;
• Evaluate the overall presentation, structure and content of the financial statements, including thedisclosures and whether the financial statements represent the underlying transactions and events in a manner that achieves fair presentation.
We communicate with those charged with governance regarding, among other matters, the planned scope and timing of the audit and significant audit findings, including any significant deficiencies in internal control that we identify during our audit.
We also provide those charged with governance with a statement that we have complied with relevant ethical requirements regarding independence, and to communicate with them all relationships and other matters that may reasonably be thought to bear on our independence, and where applicable, related safeguards.
report on other legal and regulatory requirements 1 As required by Regulation 55 (4) of the Regulations, we report that:
(a) We have obtained all information and explanations which, to the best of our knowledge and belief, were necessary for the purposes of the audit; and
(b) The balance sheet and the revenue account have been prepared in accordance with the accounting policies and standards as specified in the Ninth Schedule of the Regulations.
2 As required by Clause 5 (ii) (2) of the Eleventh Schedule of the Regulations, we report that the balance sheet and the revenue account are in agreement with the books of account of the Scheme.
For B S R & Co. LLP Chartered Accountants Firm’s Registration No: 101248W/W-100022
Sd/-
Ajit Viswanath PartnerMembership No: 067114UDIN : 21067114AAAADL7486
Place : Mumbai Date : July 20, 2021.
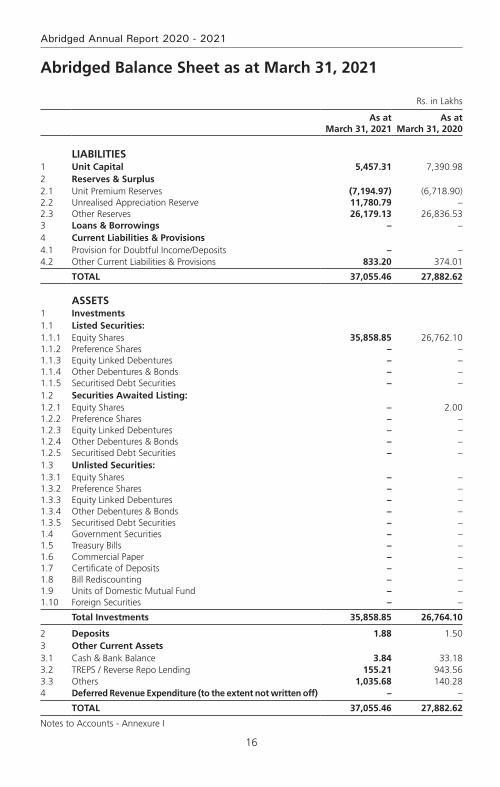
16
Abridged Annual Report 2020 - 2021
Rs. in Lakhs
As at March 31, 2021
As at March 31, 2020
LIABILITIES1 Unit Capital 5,457.31 7,390.982 Reserves & Surplus2.1 Unit Premium Reserves (7,194.97) (6,718.90)2.2 Unrealised Appreciation Reserve 11,780.79 –2.3 Other Reserves 26,179.13 26,836.533 Loans & Borrowings – –4 Current Liabilities & Provisions4.1 Provision for Doubtful Income/Deposits – –4.2 Other Current Liabilities & Provisions 833.20 374.01
TOTAL 37,055.46 27,882.62
ASSETS1 Investments1.1 Listed Securities:1.1.1 Equity Shares 35,858.85 26,762.101.1.2 Preference Shares – –1.1.3 Equity Linked Debentures – –1.1.4 Other Debentures & Bonds – –1.1.5 Securitised Debt Securities – –1.2 Securities Awaited Listing:1.2.1 Equity Shares – 2.001.2.2 Preference Shares – –1.2.3 Equity Linked Debentures – –1.2.4 Other Debentures & Bonds – –1.2.5 Securitised Debt Securities – –1.3 Unlisted Securities:1.3.1 Equity Shares – –1.3.2 Preference Shares – –1.3.3 Equity Linked Debentures – –1.3.4 Other Debentures & Bonds – –1.3.5 Securitised Debt Securities – –1.4 Government Securities – –1.5 Treasury Bills – –1.6 Commercial Paper – –1.7 Certificate of Deposits – –1.8 Bill Rediscounting – –1.9 Units of Domestic Mutual Fund – –1.10 Foreign Securities – –
Total Investments 35,858.85 26,764.10
2 Deposits 1.88 1.503 Other Current Assets3.1 Cash & Bank Balance 3.84 33.183.2 TREPS / Reverse Repo Lending 155.21 943.563.3 Others 1,035.68 140.284 Deferred Revenue Expenditure (to the extent not written off) – –
TOTAL 37,055.46 27,882.62
Notes to Accounts - Annexure I
Abridged Balance Sheet as at March 31, 2021
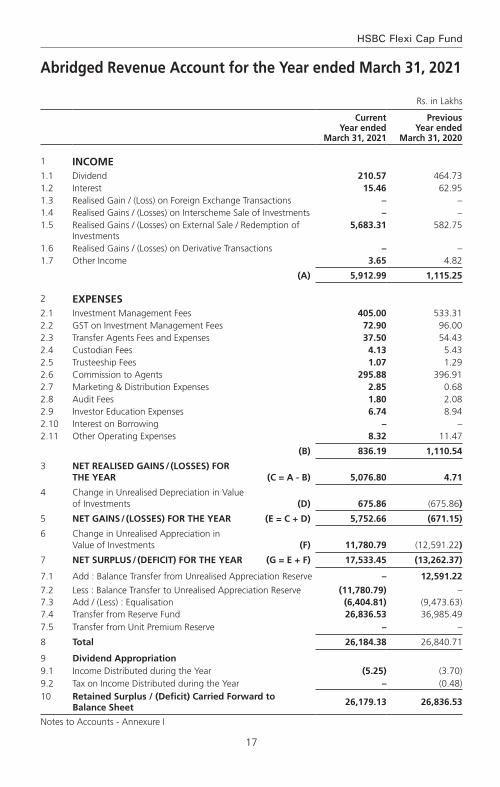
17
HSBC Flexi Cap Fund
Abridged Revenue Account for the Year ended March 31, 2021
Rs. in Lakhs
Current Year ended
March 31, 2021
Previous Year ended
March 31, 2020
1 INCOME1.1 Dividend 210.57 464.731.2 Interest 15.46 62.951.3 Realised Gain / (Loss) on Foreign Exchange Transactions – –1.4 Realised Gains / (Losses) on Interscheme Sale of Investments – –1.5 Realised Gains / (Losses) on External Sale / Redemption of
Investments5,683.31 582.75
1.6 Realised Gains / (Losses) on Derivative Transactions – –1.7 Other Income 3.65 4.82
(A) 5,912.99 1,115.25
2 EXPENSES2.1 Investment Management Fees 405.00 533.312.2 GST on Investment Management Fees 72.90 96.002.3 Transfer Agents Fees and Expenses 37.50 54.432.4 Custodian Fees 4.13 5.432.5 Trusteeship Fees 1.07 1.292.6 Commission to Agents 295.88 396.912.7 Marketing & Distribution Expenses 2.85 0.682.8 Audit Fees 1.80 2.082.9 Investor Education Expenses 6.74 8.942.10 Interest on Borrowing – –2.11 Other Operating Expenses 8.32 11.47
(B) 836.19 1,110.54
3 NET REALISED GAINS / (LOSSES) FOR THE YEAR (C = A - B) 5,076.80 4.71
4 Change in Unrealised Depreciation in Value of Investments (D) 675.86 (675.86)
5 NET GAINS / (LOSSES) FOR THE YEAR (E = C + D) 5,752.66 (671.15)
6 Change in Unrealised Appreciation in Value of Investments (F) 11,780.79 (12,591.22)
7 NET SURPLUS / (DEFICIT) FOR THE YEAR (G = E + F) 17,533.45 (13,262.37)
7.1 Add : Balance Transfer from Unrealised Appreciation Reserve – 12,591.22
7.2 Less : Balance Transfer to Unrealised Appreciation Reserve (11,780.79) –7.3 Add / (Less) : Equalisation (6,404.81) (9,473.63)7.4 Transfer from Reserve Fund 26,836.53 36,985.497.5 Transfer from Unit Premium Reserve – –
8 Total 26,184.38 26,840.71
9 Dividend Appropriation9.1 Income Distributed during the Year (5.25) (3.70)9.2 Tax on Income Distributed during the Year – (0.48)10 Retained Surplus / (Deficit) Carried Forward to
Balance Sheet 26,179.13 26,836.53
Notes to Accounts - Annexure I
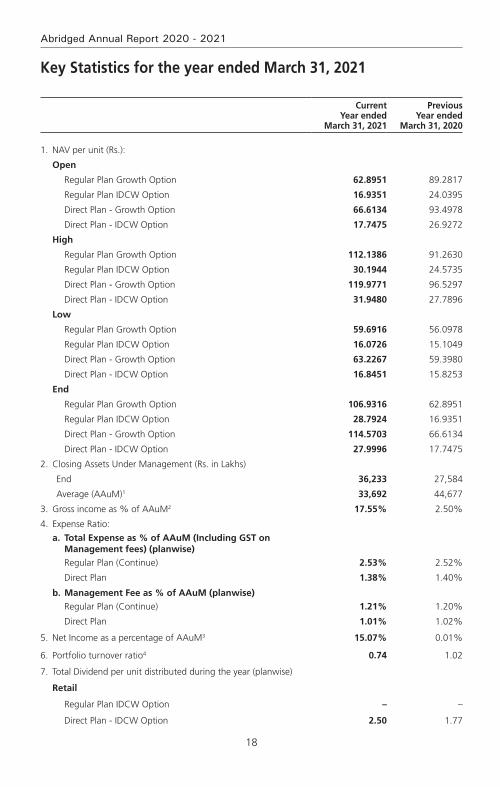
18
Abridged Annual Report 2020 - 2021
Key Statistics for the year ended March 31, 2021
Current Year ended
March 31, 2021
Previous Year ended
March 31, 2020
1. NAV per unit (Rs.):
Open
Regular Plan Growth Option 62.8951 89.2817
Regular Plan IDCW Option 16.9351 24.0395
Direct Plan - Growth Option 66.6134 93.4978
Direct Plan - IDCW Option 17.7475 26.9272
High
Regular Plan Growth Option 112.1386 91.2630
Regular Plan IDCW Option 30.1944 24.5735
Direct Plan - Growth Option 119.9771 96.5297
Direct Plan - IDCW Option 31.9480 27.7896
Low
Regular Plan Growth Option 59.6916 56.0978
Regular Plan IDCW Option 16.0726 15.1049
Direct Plan - Growth Option 63.2267 59.3980
Direct Plan - IDCW Option 16.8451 15.8253
End
Regular Plan Growth Option 106.9316 62.8951
Regular Plan IDCW Option 28.7924 16.9351
Direct Plan - Growth Option 114.5703 66.6134
Direct Plan - IDCW Option 27.9996 17.7475
2. Closing Assets Under Management (Rs. in Lakhs)
End 36,233 27,584
Average (AAuM)1 33,692 44,677
3. Gross income as % of AAuM2 17.55% 2.50%
4. Expense Ratio:
a. total expense as % of aaum (including gSt on management fees) (planwise)
Regular Plan (Continue) 2.53% 2.52%
Direct Plan 1.38% 1.40%
b. management fee as % of aaum (planwise)
Regular Plan (Continue) 1.21% 1.20%
Direct Plan 1.01% 1.02%
5. Net Income as a percentage of AAuM3 15.07% 0.01%
6. Portfolio turnover ratio4 0.74 1.02
7. Total Dividend per unit distributed during the year (planwise)
Retail
Regular Plan IDCW Option – –
Direct Plan - IDCW Option 2.50 1.77
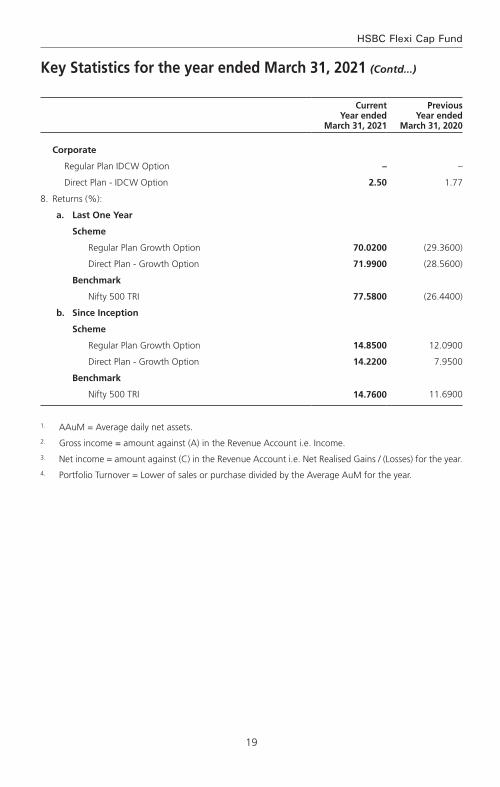
19
HSBC Flexi Cap Fund
Current Year ended
March 31, 2021
Previous Year ended
March 31, 2020
Corporate
Regular Plan IDCW Option – –
Direct Plan - IDCW Option 2.50 1.77
8. Returns (%):
a. Last One Year
Scheme
Regular Plan Growth Option 70.0200 (29.3600)
Direct Plan - Growth Option 71.9900 (28.5600)
Benchmark
Nifty 500 TRI 77.5800 (26.4400)
b. Since Inception
Scheme
Regular Plan Growth Option 14.8500 12.0900
Direct Plan - Growth Option 14.2200 7.9500
Benchmark
Nifty 500 TRI 14.7600 11.6900
1. AAuM = Average daily net assets.2. Gross income = amount against (A) in the Revenue Account i.e. Income.3. Net income = amount against (C) in the Revenue Account i.e. Net Realised Gains / (Losses) for the year.4. Portfolio Turnover = Lower of sales or purchase divided by the Average AuM for the year.
Key Statistics for the year ended March 31, 2021 (Contd...)

20
Abridged Annual Report 2020 - 2021
Notes to Accounts – Annexure ITo the Abridged Balance Sheet and Revenue Account for the Year ended March 31, 2021
1 Investments:
1.1. It is confirmed that investments of the Schemes are registered in the name of the Trustees for the benefit of the Scheme’s unitholders.
1.2. Open Positions of derivatives as of years ended March 31, 2021 and March 31, 2020 are NIL
1.3. Investments in Associates and Group Companies:(Rupees)
Issuer Instrument Type
Amount Aggregate Investments
by all schemes
Amount Aggregate Investments
by all schemes
2021 2020
Balrampur Chini Mills Ltd.
Equities 26,785,828 56,482,738 – –
Bharti Airtel Ltd. Equities 14,038,890 470,907,573 105,109,392 594,575,759
Max Financial Services Ltd.
Equities 43,457,402 172,035,228 – –
1.4. Open positions of Securities Borrowed and / or Lent by the scheme as of the years ended March 31, 2021 and March 31, 2020 are NIL.
1.5. Investment in Below investment grade and default/Securities in default beyond its maturity date as on March 31, 2021 and March 31, 2020 are NIL.
1.6. Aggregate Unrealised Gain / Loss as at the end of the Financial Years March 31, 2021 and March 31, 2020 and percentage to net assets are as under:
Company Name Amount (Rs.)
Percentage to Net Assets
Amount (Rs.)
Percentage to Net Assets
2021 2020
Equity Shares
– Appreciation 1,291,178,273 35.63 356,903,477 12.94
– Depreciation 113,098,889 3.12 424,489,001 15.39
1.7. The aggregate value of investment securities (excluding TREPS and Reverse Repos) purchased and sold (including matured) during the financial year 2020-21 (excluding accretion of discount) is Rs.2,486,138,976 and Rs.3,390,673,491 respectively being 73.79% and 100.64% of the average daily net assets.
The aggregate value of investment securities (excluding TREPS and Reverse Repos) purchased and sold (including matured) during the financial year 2019-20 (excluding accretion of discount) is Rs. 4,567,346,225 and Rs. 5,923,517,692 respectively being 102.23% and 132.58% of the average daily net assets.
1.8. Non-Traded securities in the portfolio of the scheme as of the Years ended March 31, 2021 and March 31, 2020 are NIL.
2 Disclosure Under Regulation 25(8) of the Securities and Exchange Board of India (Mutual Funds) Regulations, 1996 as amended
During the year 2020-21, The Hongkong and Shanghai Banking Corporation Limited, an associate entity of HSBC Asset Management (India) Private Limited was paid collection/bank charges amounting to Rs. Nil and clearing member charges on derivative transactions amounting to Rs. Nil.
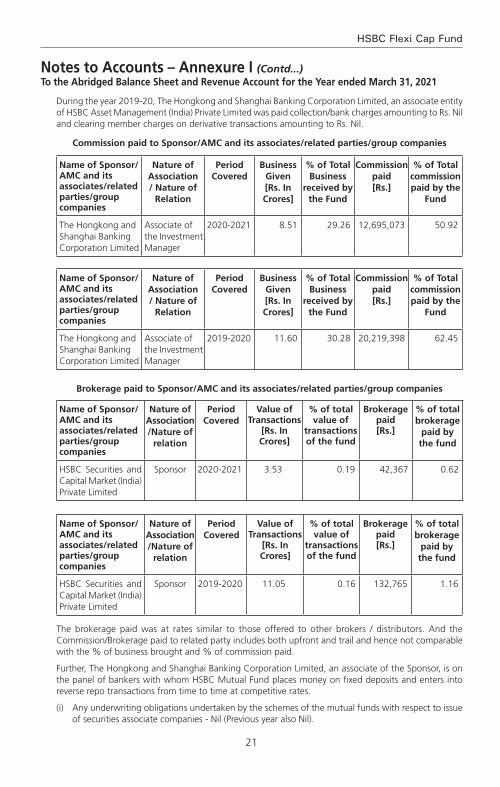
21
HSBC Flexi Cap Fund
During the year 2019-20, The Hongkong and Shanghai Banking Corporation Limited, an associate entity of HSBC Asset Management (India) Private Limited was paid collection/bank charges amounting to Rs. Nil and clearing member charges on derivative transactions amounting to Rs. Nil.
Commission paid to Sponsor/AMC and its associates/related parties/group companies
Name of Sponsor/AMC and its associates/related parties/group companies
Nature of Association / Nature of
Relation
Period Covered
Business Given [Rs. In Crores]
% of Total Business
received by the Fund
Commission paid [Rs.]
% of Total commission paid by the
Fund
The Hongkong and Shanghai Banking Corporation Limited
Associate of the Investment Manager
2020-2021 8.51 29.26 12,695,073 50.92
Name of Sponsor/AMC and its associates/related parties/group companies
Nature of Association / Nature of
Relation
Period Covered
Business Given [Rs. In Crores]
% of Total Business
received by the Fund
Commission paid [Rs.]
% of Total commission paid by the
Fund
The Hongkong and Shanghai Banking Corporation Limited
Associate of the Investment Manager
2019-2020 11.60 30.28 20,219,398 62.45
Brokerage paid to Sponsor/AMC and its associates/related parties/group companies
Name of Sponsor/AMC and its associates/related parties/group companies
Nature of Association /Nature of
relation
Period Covered
Value of Transactions
[Rs. In Crores]
% of total value of
transactions of the fund
Brokerage paid [Rs.]
% of total brokerage
paid by the fund
HSBC Securities and Capital Market (India) Private Limited
Sponsor 2020-2021 3.53 0.19 42,367 0.62
Name of Sponsor/AMC and its associates/related parties/group companies
Nature of Association /Nature of
relation
Period Covered
Value of Transactions
[Rs. In Crores]
% of total value of
transactions of the fund
Brokerage paid [Rs.]
% of total brokerage
paid by the fund
HSBC Securities and Capital Market (India) Private Limited
Sponsor 2019-2020 11.05 0.16 132,765 1.16
The brokerage paid was at rates similar to those offered to other brokers / distributors. And the Commission/Brokerage paid to related party includes both upfront and trail and hence not comparable with the % of business brought and % of commission paid.
Further, The Hongkong and Shanghai Banking Corporation Limited, an associate of the Sponsor, is on the panel of bankers with whom HSBC Mutual Fund places money on fixed deposits and enters into reverse repo transactions from time to time at competitive rates.
(i) Any underwriting obligations undertaken by the schemes of the mutual funds with respect to issue of securities associate companies - Nil (Previous year also Nil).
Notes to Accounts – Annexure I (Contd...)To the Abridged Balance Sheet and Revenue Account for the Year ended March 31, 2021

22
Abridged Annual Report 2020 - 2021
(ii) Devolvement - Nil (Previous year also Nil).
(iii) Subscription by the schemes in the issues lead managed by associate companies - Nil (Previous year also Nil).
(iv) Subscription to any issue of equity or debt on private placement basis where the sponsor or its associate companies have acted as arranger or manager - Nil (Previous year also Nil).
3 None of the Investors held more than 25% of the total net assets of the scheme at the years ended March 31, 2021 and March 31, 2020.
4 Unit Capital movement during the years ended March 31, 2021 and March 31, 2020**:
Description
2020-2021
Opening Units Subscription Redemption Closing UnitsFace Value
per unit (Rupees)
Regular Plan Growth Option
30,776,301.465 2,812,798.598 8,710,560.421 24,878,539.642 10
Regular Plan IDCW Option
41,231,153.056 409,597.558 13,411,381.645 28,229,368.969 10
Direct Plan - Growth Option
1,701,936.019 111,554.764 564,424.039 1,249,066.744 10
Direct Plan - IDCW Option
200,381.870 33,666.242 17,874.450 216,173.662 10
Description
2019-2020
Opening Units Subscription Redemption Closing UnitsFace Value
per unit (Rupees)
Regular Plan Growth Option
39,475,317.333 3,087,448.424 11,786,464.292 30,776,301.465 10
Regular Plan IDCW Option
67,450,311.942 628,382.900 26,847,541.786 41,231,153.056 10
Direct Plan - Growth Option
1,726,722.003 134,354.579 159,140.563 1,701,936.019 10
Direct Plan - IDCW Option
204,761.205 24,638.011 29,017.346 200,381.870 10
** Units held by the AMC (Seed Capital) in Direct Plan Growth Option as on 31/03/2021 is 76942.845 & as on 31/03/2020 is 76942.845
5 Previous years figures have been re-grouped/re-arranged where appropriate.
6 No contingent liabilities for the years ended March 31, 2021 and March 31, 2020.
7 Expenses other than Management Fees are Inclusive of GST where applicable.
8 Other income of Rs.364,984/- represents Exit load credited to the scheme & Penal Interest received from Bank towards delay of RTGS/NEFT. (2020: Rs. 482,463/- represents Exit load (net of GST ) credited to the scheme).
9 Investor Education Awareness
In view of the AMFI Best Practices Guidelines Circular No. 56/2015-16, the IEF ( Investor Education Fund) accrual is set aside in a separate bank account and the consolidated balance across all schemes as on March 31, 2021. The break-up of which is as under:
Notes to Accounts – Annexure I (Contd...)To the Abridged Balance Sheet and Revenue Account for the Year ended March 31, 2021
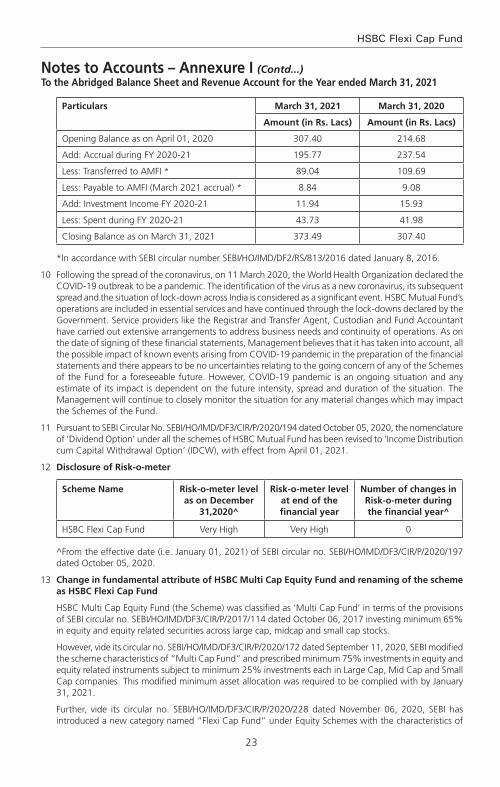
23
HSBC Flexi Cap Fund
Notes to Accounts – Annexure I (Contd...)To the Abridged Balance Sheet and Revenue Account for the Year ended March 31, 2021
Particulars March 31, 2021 March 31, 2020
Amount (in Rs. Lacs) Amount (in Rs. Lacs)
Opening Balance as on April 01, 2020 307.40 214.68
Add: Accrual during FY 2020-21 195.77 237.54
Less: Transferred to AMFI * 89.04 109.69
Less: Payable to AMFI (March 2021 accrual) * 8.84 9.08
Add: Investment Income FY 2020-21 11.94 15.93
Less: Spent during FY 2020-21 43.73 41.98
Closing Balance as on March 31, 2021 373.49 307.40
*In accordance with SEBI circular number SEBI/HO/IMD/DF2/RS/813/2016 dated January 8, 2016.
10 Following the spread of the coronavirus, on 11 March 2020, the World Health Organization declared the COVID-19 outbreak to be a pandemic. The identification of the virus as a new coronavirus, its subsequent spread and the situation of lock-down across India is considered as a significant event. HSBC Mutual Fund’s operations are included in essential services and have continued through the lock-downs declared by the Government. Service providers like the Registrar and Transfer Agent, Custodian and Fund Accountant have carried out extensive arrangements to address business needs and continuity of operations. As on the date of signing of these financial statements, Management believes that it has taken into account, all the possible impact of known events arising from COVID-19 pandemic in the preparation of the financial statements and there appears to be no uncertainties relating to the going concern of any of the Schemes of the Fund for a foreseeable future. However, COVID-19 pandemic is an ongoing situation and any estimate of its impact is dependent on the future intensity, spread and duration of the situation. The Management will continue to closely monitor the situation for any material changes which may impact the Schemes of the Fund.
11 Pursuant to SEBI Circular No. SEBI/HO/IMD/DF3/CIR/P/2020/194 dated October 05, 2020, the nomenclature of ‘Dividend Option’ under all the schemes of HSBC Mutual Fund has been revised to ‘Income Distribution cum Capital Withdrawal Option’ (IDCW), with effect from April 01, 2021.
12 Disclosure of Risk-o-meter
Scheme Name Risk-o-meter level as on December
31,2020^
Risk-o-meter level at end of the financial year
Number of changes in Risk-o-meter during the financial year^
HSBC Flexi Cap Fund Very High Very High 0
^From the effective date (i.e. January 01, 2021) of SEBI circular no. SEBI/HO/IMD/DF3/CIR/P/2020/197 dated October 05, 2020.
13 change in fundamental attribute of hSBc multi cap equity fund and renaming of the scheme as hSBc flexi cap fund
HSBC Multi Cap Equity Fund (the Scheme) was classified as ‘Multi Cap Fund’ in terms of the provisions of SEBI circular no. SEBI/HO/IMD/DF3/CIR/P/2017/114 dated October 06, 2017 investing minimum 65% in equity and equity related securities across large cap, midcap and small cap stocks.
However, vide its circular no. SEBI/HO/IMD/DF3/CIR/P/2020/172 dated September 11, 2020, SEBI modified the scheme characteristics of “Multi Cap Fund” and prescribed minimum 75% investments in equity and equity related instruments subject to minimum 25% investments each in Large Cap, Mid Cap and Small Cap companies. This modified minimum asset allocation was required to be complied with by January 31, 2021.
Further, vide its circular no. SEBI/HO/IMD/DF3/CIR/P/2020/228 dated November 06, 2020, SEBI has introduced a new category named “Flexi Cap Fund” under Equity Schemes with the characteristics of
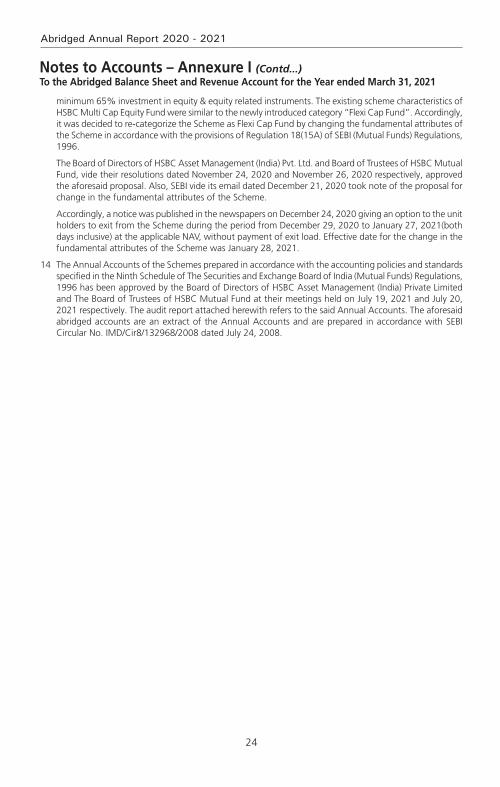
24
Abridged Annual Report 2020 - 2021
minimum 65% investment in equity & equity related instruments. The existing scheme characteristics of HSBC Multi Cap Equity Fund were similar to the newly introduced category “Flexi Cap Fund”. Accordingly, it was decided to re-categorize the Scheme as Flexi Cap Fund by changing the fundamental attributes of the Scheme in accordance with the provisions of Regulation 18(15A) of SEBI (Mutual Funds) Regulations, 1996.
The Board of Directors of HSBC Asset Management (India) Pvt. Ltd. and Board of Trustees of HSBC Mutual Fund, vide their resolutions dated November 24, 2020 and November 26, 2020 respectively, approved the aforesaid proposal. Also, SEBI vide its email dated December 21, 2020 took note of the proposal for change in the fundamental attributes of the Scheme.
Accordingly, a notice was published in the newspapers on December 24, 2020 giving an option to the unit holders to exit from the Scheme during the period from December 29, 2020 to January 27, 2021(both days inclusive) at the applicable NAV, without payment of exit load. Effective date for the change in the fundamental attributes of the Scheme was January 28, 2021.
14 The Annual Accounts of the Schemes prepared in accordance with the accounting policies and standards specified in the Ninth Schedule of The Securities and Exchange Board of India (Mutual Funds) Regulations, 1996 has been approved by the Board of Directors of HSBC Asset Management (India) Private Limited and The Board of Trustees of HSBC Mutual Fund at their meetings held on July 19, 2021 and July 20, 2021 respectively. The audit report attached herewith refers to the said Annual Accounts. The aforesaid abridged accounts are an extract of the Annual Accounts and are prepared in accordance with SEBI Circular No. IMD/Cir8/132968/2008 dated July 24, 2008.
Notes to Accounts – Annexure I (Contd...)To the Abridged Balance Sheet and Revenue Account for the Year ended March 31, 2021

25
HSBC Flexi Cap Fund
Voting Policy and Procedures
In view of SEBI guidelines related to “Role of Mutual Funds in Corporate Governance of Public Listed Companies”, HSBC AMC has formulated its “Policy for Proxy Voting in Public Listed Companies”. The said policy is available on our website and the details of actual exercise of proxy votes, the summary of votes casted and the auditor’s certificate for the Financial Year 2020 – 21 is forming part of our full Annual Report for the Financial Year 2020 – 21 which is uploaded on our website at http://www.assetmanagement.hsbc.co.in

26
Abridged Annual Report 2020 - 2021
Statutory Details & Disclaimers
All the returns have been sourced from Mutual Funds India Explorer software. The performance of the schemes and the benchmark is calculated on a total return basis. This document has been prepared by HSBC Asset Management (India) Private Ltd (HSBC) for information purposes only and should not be construed as i) an offer or recommendation to buy or sell securities, commodities, currencies or other investments referred to herein; or ii) an offer to sell or a solicitation or an offer for purchase of any of the funds of HSBC Mutual Fund; or iii) an investment research or investment advice. All information contained in this document (including that sourced from third parties), is obtained from sources HSBC and the third party which HSBC believes to be reliable however, has not independently verified the same. The information and opinions contained within the document are based upon publicly available information and rates of taxation applicable (if any) at the time of publication, which are subject to change from time to time.
Expressions of opinion are those of HSBC only and are subject to change without notice. It does not have regard to specific investment objectives, financial situation and the particular needs of any specific person who may receive this document. Investors should seek personal and independent advice regarding the appropriateness of investing in any of the funds, securities, other investment or investment strategies that may have been discussed or referred herein and should understand that the views regarding future prospects may or may not be realized. In no event shall HSBC Mutual Fund / HSBC Asset management (India) Private Limited and / or its affiliates or any of their directors, trustees, officers and employees be liable for any direct, indirect, special, incidental or consequential damages arising out of the use of information / opinion herein. Neither this document nor the units of HSBC Mutual Fund have been registered in any jurisdiction. The distribution of this document in certain jurisdictions may be restricted or totally prohibited and accordingly, persons who come into possession of this document are required to inform themselves about, and to observe, any such restrictions.
mutual fund investments are subject to market risks, read all scheme related documents carefully.

HSBC Tax Saver Equity FundAn open ended Equity Linked Saving Scheme with a statutory lock-in of 3 years and tax benefit
Abridged Annual Report 2020 - 2021

1
HSBC Tax Saver Equity Fund
Dear Investor,
The beginning of the last financial year now almost seems like a distant memory. COVID-19 was still a relatively unknown enemy and governments across the world were grappling with ways to control and mitigate the risks associated with it. Nationwide lockdowns were the norm and our markets both equity and fixed income reacted negatively leading to significant erosion of wealth. Within a short period of time markets bounced back. This confounded even the most astute market pundits. How is it possible that when GDP growth had slowed down, unemployment had risen, inflation was high could there be such sharp up move in equity indices. Whilst the reasons are well known about easy global liquidity, demand resurgence, cost cutting by corporates etc. perhaps its most important to remember that the markets are not a reflector but a predictor of economic activity.
At all times particularly during such volatile times it is important to go back to the basics. Why do you save, why do you invest, what goals would you like to achieve, how old are you, what is your risk appetite? The replies to these simple questions will help you determine your asset allocation. As an example when equity markets corrected sharply last year, investors who reviewed their asset allocation, stayed invested during the lows of the past year and were able to capture the rebound and have seen prime returns since then. The current market movement in all likelihood would have also led to some imbalances in your asset allocation. Do not ignore that and I strongly recommend that you do review this with your advisor to check whether re-balancing is required.
During this financial year we had three very successful new fund launches. The pandemic showed us a clear trend of dominant players becoming stronger and profit pool getting consolidated within a few companies. To capture this opportunity, we launched the HSBC Focused Equity Fund which garnered close to Rs. 520 crores. During the second half of 2020, in the fixed income space, 3 - 5 year duration range had a favourable investment scenario as RBI’s accommodative policy and surplus liquidity had reduced the returns at the very short end of the yield curve. There was a demand for an actively managed moderate duration strategy with better credit quality which we fulfilled by launching HSBC Corporate Bond Fund. It garnered over 700 crores. Our latest and first of its kind offering, HSBC Global Equity Climate Change Fund of Fund saw a stupendous response with over 8000 investors investing over Rs. 616 crores. This is an investment opportunity which goes beyond the rationale of simply generating investment returns and is the future of responsible investing.
We worked towards augmenting our digital capabilities by launching a few key enhancements to our online transaction platform. Being mindful of the movement restrictions in place, this year we focused on digitizing offline processes so that an investor need not need step out of her home for investing or availing any key services. While our interactive chatbot AskMe, eased service queries, our end-to-end digital KYC module enabled a first time Mutual Fund investor to invest in our funds without any paperwork. We listened to your feedback and digitized consolidation of folios and change of tax status which eliminated the need for you to physically visit our branches.
I am a strong believer in the India story and this story has just begun. The opportunity to invest in this high growth market is a very exciting opportunity. I do hope you share my enthusiasm and I ask that you continue to invest whilst reviewing your asset allocation at all times. As always thank you for your business. Stay safe.
Warm regards,
Ravi MenonChief Executive Officer,
HSBC Asset Management India

2
Abridged Annual Report 2020 - 2021
SPONSOR
HSBC Securities and Capital Markets (India) Private LimitedRegd. Office: 52/60, Mahatma Gandhi Road, Fort, Mumbai - 400 001.
TRUSTEE
Board of TrusteesOffice: 16, Veer Nariman Road, Fort, Mumbai 400 001.
ASSET MANAGEMENT COMPANY
HSBC Asset Management (India) Private LimitedCorp. & Regd. Office: 16, Veer Nariman Road, Fort, Mumbai 400 001.
CUSTODIAN
Standard Chartered Bank (SCB)Corp. & Regd. Office: Crescenzo, Securities Services, 3rd Floor, C-38/39, G-Block,Bandra Kurla Complex, Bandra East, Mumbai – 400051.
AUDITORS TO THE SCHEME
BSR & Co. LLPChartered Accountants
5th Floor, Lodha Excelus, Apollo Mills Compound, N. M. Joshi Marg, Mahalaxmi, Mumbai 400 011.
REGISTRAR & TRANSFER AGENTS
Computer Age Management Services Limited (CAMS)Unit: HSBC Mutual Fund ’C’ Block, 2nd Floor, Hanudev Info Park P. Ltd., SF No. 558/2, Udayampalayam Road, Nava India, Coimbatore - 641 028.
BOARD OF TRUSTEES
Ms. Jasmine Batliwalla - Chairperson
Mr. Nani Javeri - Trustee
Dr. T. C. Nair - Trustee
Mr. Pedro Bastos - Trustee
BOARD OF DIRECTORS
Mr. Dinesh Mittal - Director
Dr. Indu Shahani - Director
Mr. Ravi Menon - Director & Chief Executive Officer
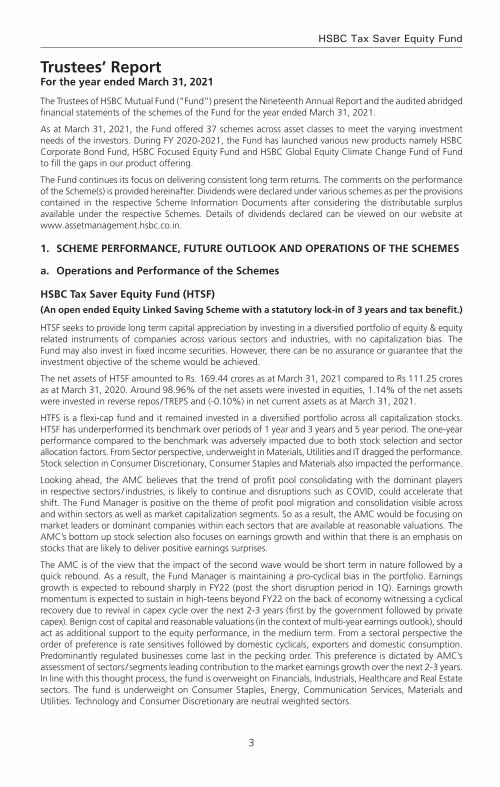
3
HSBC Tax Saver Equity Fund
The Trustees of HSBC Mutual Fund (“Fund”) present the Nineteenth Annual Report and the audited abridged financial statements of the schemes of the Fund for the year ended March 31, 2021.
As at March 31, 2021, the Fund offered 37 schemes across asset classes to meet the varying investment needs of the investors. During FY 2020-2021, the Fund has launched various new products namely HSBC Corporate Bond Fund, HSBC Focused Equity Fund and HSBC Global Equity Climate Change Fund of Fund to fill the gaps in our product offering.
The Fund continues its focus on delivering consistent long term returns. The comments on the performance of the Scheme(s) is provided hereinafter. Dividends were declared under various schemes as per the provisions contained in the respective Scheme Information Documents after considering the distributable surplus available under the respective Schemes. Details of dividends declared can be viewed on our website at www.assetmanagement.hsbc.co.in.
1. SCHeMe PeRfoRMANCe, fuTuRe ouTLook AND oPeRATIoNS of THe SCHeMeS
a. operations and Performance of the Schemes
HSBC Tax Saver equity fund (HTSf)(An open ended equity Linked Saving Scheme with a statutory lock-in of 3 years and tax benefit.)
HTSF seeks to provide long term capital appreciation by investing in a diversified portfolio of equity & equity related instruments of companies across various sectors and industries, with no capitalization bias. The Fund may also invest in fixed income securities. However, there can be no assurance or guarantee that the investment objective of the scheme would be achieved.
The net assets of HTSF amounted to Rs. 169.44 crores as at March 31, 2021 compared to Rs 111.25 crores as at March 31, 2020. Around 98.96% of the net assets were invested in equities, 1.14% of the net assets were invested in reverse repos / TREPS and (-0.10%) in net current assets as at March 31, 2021.
HTFS is a flexi-cap fund and it remained invested in a diversified portfolio across all capitalization stocks. HTSF has underperformed its benchmark over periods of 1 year and 3 years and 5 year period. The one-year performance compared to the benchmark was adversely impacted due to both stock selection and sector allocation factors. From Sector perspective, underweight in Materials, Utilities and IT dragged the performance. Stock selection in Consumer Discretionary, Consumer Staples and Materials also impacted the performance.
Looking ahead, the AMC believes that the trend of profit pool consolidating with the dominant players in respective sectors / industries, is likely to continue and disruptions such as COVID, could accelerate that shift. The Fund Manager is positive on the theme of profit pool migration and consolidation visible across and within sectors as well as market capitalization segments. So as a result, the AMC would be focusing on market leaders or dominant companies within each sectors that are available at reasonable valuations. The AMC’s bottom up stock selection also focuses on earnings growth and within that there is an emphasis on stocks that are likely to deliver positive earnings surprises.
The AMC is of the view that the impact of the second wave would be short term in nature followed by a quick rebound. As a result, the Fund Manager is maintaining a pro-cyclical bias in the portfolio. Earnings growth is expected to rebound sharply in FY22 (post the short disruption period in 1Q). Earnings growth momentum is expected to sustain in high-teens beyond FY22 on the back of economy witnessing a cyclical recovery due to revival in capex cycle over the next 2-3 years (first by the government followed by private capex). Benign cost of capital and reasonable valuations (in the context of multi-year earnings outlook), should act as additional support to the equity performance, in the medium term. From a sectoral perspective the order of preference is rate sensitives followed by domestic cyclicals, exporters and domestic consumption. Predominantly regulated businesses come last in the pecking order. This preference is dictated by AMC’s assessment of sectors / segments leading contribution to the market earnings growth over the next 2-3 years. In line with this thought process, the fund is overweight on Financials, Industrials, Healthcare and Real Estate sectors. The fund is underweight on Consumer Staples, Energy, Communication Services, Materials and Utilities. Technology and Consumer Discretionary are neutral weighted sectors.
Trustees’ Reportfor the year ended March 31, 2021
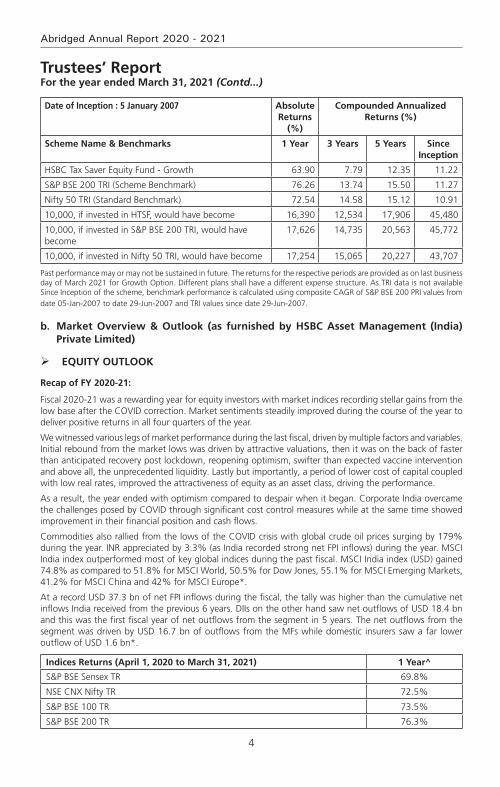
4
Abridged Annual Report 2020 - 2021
Date of Inception : 5 January 2007 Absolute Returns
(%)
Compounded Annualized Returns (%)
Scheme Name & Benchmarks 1 Year 3 Years 5 Years Since Inception
HSBC Tax Saver Equity Fund - Growth 63.90 7.79 12.35 11.22
S&P BSE 200 TRI (Scheme Benchmark) 76.26 13.74 15.50 11.27
Nifty 50 TRI (Standard Benchmark) 72.54 14.58 15.12 10.91
10,000, if invested in HTSF, would have become 16,390 12,534 17,906 45,480
10,000, if invested in S&P BSE 200 TRI, would have become
17,626 14,735 20,563 45,772
10,000, if invested in Nifty 50 TRI, would have become 17,254 15,065 20,227 43,707
Past performance may or may not be sustained in future. The returns for the respective periods are provided as on last business day of March 2021 for Growth Option. Different plans shall have a different expense structure. As TRI data is not available Since Inception of the scheme, benchmark performance is calculated using composite CAGR of S&P BSE 200 PRI values from date 05-Jan-2007 to date 29-Jun-2007 and TRI values since date 29-Jun-2007.
b. Market overview & outlook (as furnished by HSBC Asset Management (India) Private Limited)
equITy ouTLook
Recap of fy 2020-21:
Fiscal 2020-21 was a rewarding year for equity investors with market indices recording stellar gains from the low base after the COVID correction. Market sentiments steadily improved during the course of the year to deliver positive returns in all four quarters of the year.
We witnessed various legs of market performance during the last fiscal, driven by multiple factors and variables. Initial rebound from the market lows was driven by attractive valuations, then it was on the back of faster than anticipated recovery post lockdown, reopening optimism, swifter than expected vaccine intervention and above all, the unprecedented liquidity. Lastly but importantly, a period of lower cost of capital coupled with low real rates, improved the attractiveness of equity as an asset class, driving the performance.
As a result, the year ended with optimism compared to despair when it began. Corporate India overcame the challenges posed by COVID through significant cost control measures while at the same time showed improvement in their financial position and cash flows.
Commodities also rallied from the lows of the COVID crisis with global crude oil prices surging by 179% during the year. INR appreciated by 3.3% (as India recorded strong net FPI inflows) during the year. MSCI India index outperformed most of key global indices during the past fiscal. MSCI India index (USD) gained 74.8% as compared to 51.8% for MSCI World, 50.5% for Dow Jones, 55.1% for MSCI Emerging Markets, 41.2% for MSCI China and 42% for MSCI Europe*.
At a record USD 37.3 bn of net FPI inflows during the fiscal, the tally was higher than the cumulative net inflows India received from the previous 6 years. DIIs on the other hand saw net outflows of USD 18.4 bn and this was the first fiscal year of net outflows from the segment in 5 years. The net outflows from the segment was driven by USD 16.7 bn of outflows from the MFs while domestic insurers saw a far lower outflow of USD 1.6 bn*.
Indices Returns (April 1, 2020 to March 31, 2021) 1 Year^
S&P BSE Sensex TR 69.8%
NSE CNX Nifty TR 72.5%
S&P BSE 100 TR 73.5%
S&P BSE 200 TR 76.3%
Trustees’ Reportfor the year ended March 31, 2021 (Contd...)

5
HSBC Tax Saver Equity Fund
Indices Returns (April 1, 2020 to March 31, 2021) 1 Year^
S&P BSE 500 TR 78.6%
S&P BSE Midcap TR 93.0%
S&P BSE 250 Small-cap TR 117.5%
^Source: Bloomberg (Above table values are for total return indices)
Way forward:
Beginning of the new fiscal, India had to contend with the risk of the second COVID wave, which was more ferocious than the first wave on the human impact. However, as we write this, the second wave has already peaked and there have been a significant fall in number of active cases, case-positivity rate, daily new caseload and deaths. Vaccination drive also has seen acceleration with and is now closer to 6 mn doses per day mark. Also, the impact of the lockdown on economic activity has been significantly lower during the second wave, compared to last year. In most of the states, the unlocking process has already begun in a phased manner and this is leading to improvement in various activity indicators. Mobility indicators are recovering faster while economic indicators (freight, credit off-take, E-way bill generation, power demand etc.) are also witnessing a gradual recovery. The recently concluded earnings season has turned out to be in-line with expectations and despite the concerns of around the second wave, the earnings (Nifty) have seen upgrades for FY22. Market is looking beyond the current quarter (i.e. 1QFY22), which would witness an impact due to the second wave. Our baseline assumption is that of a temporary impact from the second wave and the set-back to the recovery process limited to a few months, after which we should see the economic rebound. So far, this is tracking in-line with assumptions.
From a macro perspective, the current estimates for GDP growth in FY22 stand at 9.2%* (after seeing downgrades to factor in the impact of second wave). The downgrade in estimates are pertaining to the first quarter and hence the trajectory of growth from hereon should pick up. The tax collections data for the first two months of FY22 has remained strong, implying that the drawdown of the second wave on the fiscal position is not alarming. Additionally, the impact of fiscal stimulus package announced in FY22 so far is manageable (about 60 bps of GDP) and hence would not lead to any fiscal strain.
After the spectacular rally, market valuations at an overall level are now trending above historical averages on traditional valuation metrics (P/E, P/B). This is true for all market capitalization categories (viz large, mid and small). Typically, the broader market (i.e. mid and small cap segments), trade at a discount to large caps, however this scenario has now reversed after the outperformance from the broader market segments. However, the earnings momentum continues to remain strong (witnessing upgrades so far) and except for a short period due to second wave, the earnings momentum should hold up.
We believe that the risk-reward is balanced for the equity markets in the near term. Higher or sticky inflation expectations globally, higher than historical market valuations on some parameters (i.e. P/E, P/B) and adverse demand impact from the second wave are risk factors to contend with in the near term. However, these are counter balanced by positive commentary from companies, significant decline in COVID cases and acceleration in the vaccination programme. As a result, in the near term markets may see a consolidation phase and could take cues from the upcoming earnings season with more focus on the corporate commentary and the outlook. From a medium to long term perspective, the outlook for equity markets remains positive. The expectation of cyclical revival in the economy brings in a multi-year earnings visibility. This along with a benign cost of capital environment, should support equity performance. However, equity returns are likely to moderate on the back of the relatively high valuations and the strong recovery we have already witnessed from the COVID lows. Equity performance is likely to mirror the earnings growth trends over the medium to long term.
Pace of vaccination, concerns about a third wave, corporate earnings trajectory, inflation trends (both global & domestic), monsoon trends and commodity prices (especially crude oil) are some of the key factors which could influence market performance in the short term.
From a portfolio perspective, we are maintaining a pro-cyclical bias. We expect earnings growth to rebound sharply post the current COVID phase. Earnings growth are expected to sustain in high-teens beyond FY22 on the back of economy witnessing a cyclical recovery due to revival in capex cycle over the next 2-3 years (first by the government followed by private capex). From a sectoral perspective our order of preference is
Trustees’ Reportfor the year ended March 31, 2021 (Contd...)

6
Abridged Annual Report 2020 - 2021
rate sensitives followed by domestic cyclicals, exporters and domestic consumption. Predominantly regulated businesses come last in our pecking order. This preference is dictated by our assessment of sectors / segments leading contribution to the market earnings growth over the next 2-3 years. Our portfolio construction is driven by a bottom up approach to stock selection with a focus on names that can deliver positive earnings surprises. We continue to focus on this theme to identify likely outperformers.
*Source: Bloomberg
DeBT ouTLook
Market drivers during the course of the year fy21
The Fixed Income markets started the year with a bout of nervousness that was triggered by the pandemic. While RBI had calmed the markets with its large rate cut action of 75bp cut followed by liquidity supportive measures, the volatility continued until mid-May when government announced its relief package. While it was not fiscally expansive, it touched the right cords in terms of credit flow to desired sectors. This was followed up with RBI’s credit relief measures in terms of moratorium and restructuring of assets that were stressed due to the pandemic. Throughout the course of the year, RBI maintained its accommodative stance along with significant amount of surplus liquidity that was supportive and helped in maintaining stability in the market. However, as the year progressed and pressure on fiscal began to mount yields started seeing a spike towards the last quarter of the fiscal. While borrowing was stepped up to INR 12 trillion from previously budgeted INR 7.8 trillion in May 2020, it was further enhanced by and additional INR 1.1 trillion in October 2020. Overall GOI ended up borrowing a record amount of INR 13.9 trillion. The budget proved to be a shocker with GOI using the pandemic as an opportunity for setting the finances in order. GOI showed a record deficit of 9.5% for FY21 and projected a 6.8% for FY22 with estimated central government gross borrowing of INR 12 trillion. This seemed to reverse the support RBI had provided throughout the year with benchmark 10-year bond peaking to 6.23% in mid –Feb 2021. RBI’s statements to remain supportive were left in the sidelines. Overall it seemed that the 115bp of rate cut, along with significant liquidity infusion (OMO + Twist operations of ~INR 3 trillion, infusion via dollar purchases) seemed only a little to help in applying a brake to the one-way spike in yields. The year closed ~6.16% with absence of concrete action by RBI.
RBI Policy: Through the course of the year, RBI has maintained an accommodative stance, with an aggregate 115bp of rate cut done in March and May 2020 taking the repo rate from 5.15% to 4%. Subsequently while inflation pressures prevented RBI from taking any direct actions, RBI has used a combination of creative tools to keep the rates contained primarily via liquidity supportive tools such as OMOs, Twist Operations, Repo linked Term loans to needy sectors (LTROs, TLTROs), CRR cuts. While inflation was a worry for most part of the year, RBI kept it aside admitting that growth was a priority and inflation effects are more supply side rather than demand side. Prospectively into FY22, with the onset of the second wave, RBI continues to maintain the stance to prioritize growth.
Inflation: Inflation for most part of the year stayed above 6% primarily driven by supply side pressures and some intermittent spike from food inflation as well. While it has been coming off since December with cooling off of food inflation and positive base effects, it has been between 4- 5.5%. Structurally however inflation risks continue to remain as oil prices have increased and base effects will not remain supportive for long. Core inflation continues to remain sticky.
Liquidity: During the year, system liquidity has remained at significant surplus facilitated largely by RBI action such as OMOs, foreign exchange operations and government spending.
Budget: The FY2022 union budget focuses on growth and has accordingly, presented a 9.5% fiscal deficit for FY21 and 6.8% for FY22. On the revenue side, the assumptions are largely realistic, with FY22 (E) Nominal GDP growth at 14.4% and tax revenue growth at 17% considering the pandemic impact in FY 21. Compared to FY20, tax revenue growth is ~10%. While non-tax revenues are ambitious pegging the divestment at INR 1.75 trillion, with robust pipeline of assets including monetization of road and transmission assets, execution remains the key as in the past. On the expenditure side, better quality capex spending with focusing on rail, road, defense, urban infra is positive for long term structural growth. The revenue side expenditure adjusting for clearance of past subsidy arrears will be similar to budgetary estimates. Government using this opportunity to bring back off-balance sheet spending to on-balance sheet was a welcome move towards transparency and showing realistic projections. Alongside, states have also been given leeway to borrow upto 4% of their GDP with an additional 0.5% subject to conditions. Given that states are an important vehicle for capex
Trustees’ Reportfor the year ended March 31, 2021 (Contd...)
7
HSBC Tax Saver Equity Fund
investment, this move is welcome although it may entail additional state borrowing. The fiscal glide path is shifted to FY26 at below 4.5% for center and 3% for states suggesting that spending will continue and borrowing will come down gradually. In summary, from survival to revival, FY22 budget aims for structural growth leaving fiscal concerns sideways in the interim. Government’s intent seems clear on bringing back growth on the table, in a transparent manner.
While the second wave of the pandemic has once again derailed the revenue story, government will still have some cushion from its conservative estimates.
Currency and fII flows: INR has been on an appreciation trajectory for most part of the year, aided by dollar underperformance supported by positive FII and FDI flows along with reduced imports on the domestic front as well. RBI has used most of the flows to accumulate reserves which has prevented any strong appreciation. Pandemic shock and global risk off led rupee over 75 in the beginning of the year only to close below 72 at the end of the fiscal year. While the second wave led to another spike in INR in April, it has since then cooled once again driven by dollar underperformance and pandemic recovery on the domestic front. Net FII flows was ~$30 bn with positive equity flows of~$37 bn while debt was negative ~$7bn and overall RBI’s forex reserves rose by a ~$100 bn to close ~$537 bn.
Credit growth: Credit growth for the entire year has been tepid as previous year’s credit events were followed by nervousness relating to the pandemic. Despite RBI opening up several windows to finance the non-AAA segment, there was very little fresh credit flowing that segment. Overall banking credit grew by only 6.5%. Risk appetite has however been improving from a complete risk aversion to opening up towards a calculated risk. Prospectively it is expected that once the pandemic risk abates, credit growth will resume primarily driven by government capex spending and demand recovery.
Market outlook
The pandemic once again brought the country to a situation similar to last year and debt markets perhaps interpreted the same as a structural rise in rates. In the initial day’s post budget in Feb of 2021, market was expecting a concrete set of actions such as an OMO calendar from RBI, and RBI’s words alone failed to calm the market. The first auction of the fiscal year also saw a devolvement. However, RBI acted in the first policy of the year announcing a bond buyback program akin to QE (quantitative easing) and its subsequent cancellation of auctions wherein yields were perhaps quoted higher than RBI’s comfort levels brought back confidence into the market. Since then we have seen a strong rally with 10-year benchmark trending below 6% and the curve moving alongside. RBI reiteration of priority of growth and also supporting with higher than expected dividend payment stand out as a testimony of its support. While we do not expect RBI to act in terms of rate cuts, we believe that measures such as G-SAP, OMOs will continue until there is visibility of a structural growth. Therefore, the large borrowing program should go without any hiccups.
Furthermore, with the evidence of strong GST numbers until April 2021 (before the 2nd wave), it is expected that growth and therefore fiscal revenues will come back. Government’s conservative budget estimates are supportive. Also, given the fact that compared to last year there has not been a complete shutdown of activity (lockdowns being distributed), the impact on growth will not be similar to last year. Pent up demand will come back to support revenue collection. However, on the flipside, once growth resumes RBI will be forced to withdraw liquidity in a phased manner to prevent asset bubbles. Nevertheless, RBI need not act in terms of rate actions and we believe that a prolonged pause in terms of RBI rates is in the offing.
Net-net therefore while growth is wanting no matter what, it may come at a small price of rise in yields with liquidity withdrawal. That is however expected more in the 2nd half of the year. Lower than expected borrowing numbers, later this year or if not in next year could be a surprise. We may therefore see a range bound rate action in the near term with a rising bias over time. Global rate environment, oil and currency risks are to be watched out for.
2. BRIef BACkgRouND of SPoNSoRS, BoARD of TRuSTeeS AND ASSeT MANAgeMeNT CoMPANy
a. Sponsor
HSBC Mutual Fund is sponsored by HSBC Securities and Capital Markets (India) Private Limited (HSCI). The Sponsor is the Settler of the Mutual Fund Trust. The Sponsor has entrusted a sum of Rs. 1,00,000/- (Rupees One Lakh only) to the Trustee as the initial contribution towards the corpus of the Mutual Fund.
Trustees’ Reportfor the year ended March 31, 2021 (Contd...)
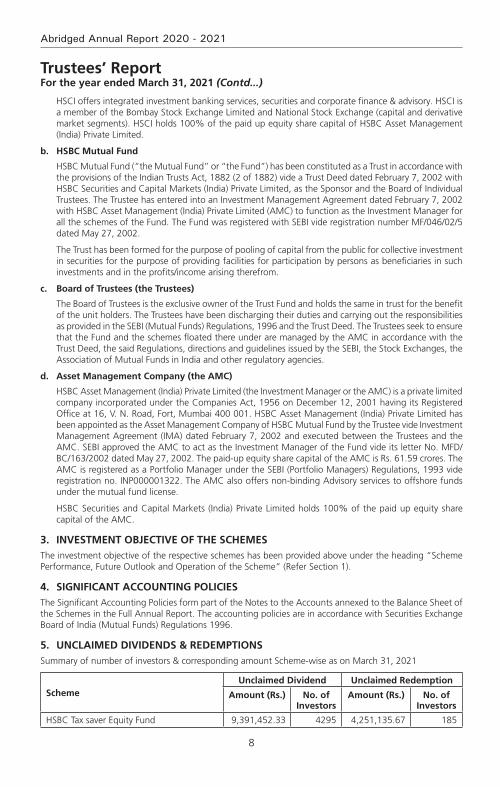
8
Abridged Annual Report 2020 - 2021
HSCI offers integrated investment banking services, securities and corporate finance & advisory. HSCI is a member of the Bombay Stock Exchange Limited and National Stock Exchange (capital and derivative market segments). HSCI holds 100% of the paid up equity share capital of HSBC Asset Management (India) Private Limited.
b. HSBC Mutual Fund
HSBC Mutual Fund (“the Mutual Fund” or “the Fund”) has been constituted as a Trust in accordance with the provisions of the Indian Trusts Act, 1882 (2 of 1882) vide a Trust Deed dated February 7, 2002 with HSBC Securities and Capital Markets (India) Private Limited, as the Sponsor and the Board of Individual Trustees. The Trustee has entered into an Investment Management Agreement dated February 7, 2002 with HSBC Asset Management (India) Private Limited (AMC) to function as the Investment Manager for all the schemes of the Fund. The Fund was registered with SEBI vide registration number MF/046/02/5 dated May 27, 2002.
The Trust has been formed for the purpose of pooling of capital from the public for collective investment in securities for the purpose of providing facilities for participation by persons as beneficiaries in such investments and in the profits/income arising therefrom.
c. Board of Trustees (the Trustees)
The Board of Trustees is the exclusive owner of the Trust Fund and holds the same in trust for the benefit of the unit holders. The Trustees have been discharging their duties and carrying out the responsibilities as provided in the SEBI (Mutual Funds) Regulations, 1996 and the Trust Deed. The Trustees seek to ensure that the Fund and the schemes floated there under are managed by the AMC in accordance with the Trust Deed, the said Regulations, directions and guidelines issued by the SEBI, the Stock Exchanges, the Association of Mutual Funds in India and other regulatory agencies.
d. Asset Management Company (the AMC)
HSBC Asset Management (India) Private Limited (the Investment Manager or the AMC) is a private limited company incorporated under the Companies Act, 1956 on December 12, 2001 having its Registered Office at 16, V. N. Road, Fort, Mumbai 400 001. HSBC Asset Management (India) Private Limited has been appointed as the Asset Management Company of HSBC Mutual Fund by the Trustee vide Investment Management Agreement (IMA) dated February 7, 2002 and executed between the Trustees and the AMC. SEBI approved the AMC to act as the Investment Manager of the Fund vide its letter No. MFD/BC/163/2002 dated May 27, 2002. The paid-up equity share capital of the AMC is Rs. 61.59 crores. The AMC is registered as a Portfolio Manager under the SEBI (Portfolio Managers) Regulations, 1993 vide registration no. INP000001322. The AMC also offers non-binding Advisory services to offshore funds under the mutual fund license.
HSBC Securities and Capital Markets (India) Private Limited holds 100% of the paid up equity share capital of the AMC.
3. INveSTMeNT oBJeCTIve of THe SCHeMeSThe investment objective of the respective schemes has been provided above under the heading “Scheme Performance, Future Outlook and Operation of the Scheme” (Refer Section 1).
4. SIgNIfICANT ACCouNTINg PoLICIeS The Significant Accounting Policies form part of the Notes to the Accounts annexed to the Balance Sheet of the Schemes in the Full Annual Report. The accounting policies are in accordance with Securities Exchange Board of India (Mutual Funds) Regulations 1996.
5. uNCLAIMeD DIvIDeNDS & ReDeMPTIoNSSummary of number of investors & corresponding amount Scheme-wise as on March 31, 2021
SchemeUnclaimed Dividend Unclaimed Redemption
Amount (Rs.) No. of Investors
Amount (Rs.) No. of Investors
HSBC Tax saver Equity Fund 9,391,452.33 4295 4,251,135.67 185
Trustees’ Reportfor the year ended March 31, 2021 (Contd...)
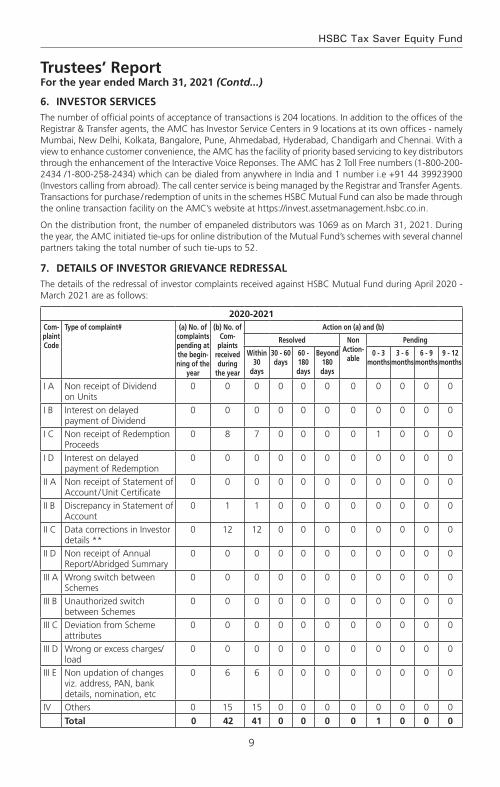
9
HSBC Tax Saver Equity Fund
Trustees’ Reportfor the year ended March 31, 2021 (Contd...)
6. INveSToR SeRvICeSThe number of official points of acceptance of transactions is 204 locations. In addition to the offices of the Registrar & Transfer agents, the AMC has Investor Service Centers in 9 locations at its own offices - namely Mumbai, New Delhi, Kolkata, Bangalore, Pune, Ahmedabad, Hyderabad, Chandigarh and Chennai. With a view to enhance customer convenience, the AMC has the facility of priority based servicing to key distributors through the enhancement of the Interactive Voice Reponses. The AMC has 2 Toll Free numbers (1-800-200-2434 /1-800-258-2434) which can be dialed from anywhere in India and 1 number i.e +91 44 39923900 (Investors calling from abroad). The call center service is being managed by the Registrar and Transfer Agents. Transactions for purchase / redemption of units in the schemes HSBC Mutual Fund can also be made through the online transaction facility on the AMC’s website at https://invest.assetmanagement.hsbc.co.in.
On the distribution front, the number of empaneled distributors was 1069 as on March 31, 2021. During the year, the AMC initiated tie-ups for online distribution of the Mutual Fund’s schemes with several channel partners taking the total number of such tie-ups to 52.
7. DeTAILS of INveSToR gRIevANCe ReDReSSALThe details of the redressal of investor complaints received against HSBC Mutual Fund during April 2020 - March 2021 are as follows:
2020-2021Com-plaint Code
Type of complaint# (a) No. of complaints pending at the begin-ning of the
year
(b) No. of Com-
plaints received during
the year
Action on (a) and (b)
Resolved Non Action-
able
Pending
Within 30
days
30 - 60 days
60 - 180 days
Beyond 180 days
0 - 3 months
3 - 6 months
6 - 9 months
9 - 12 months
I A Non receipt of Dividend on Units
0 0 0 0 0 0 0 0 0 0 0
I B Interest on delayed payment of Dividend
0 0 0 0 0 0 0 0 0 0 0
I C Non receipt of Redemption Proceeds
0 8 7 0 0 0 0 1 0 0 0
I D Interest on delayed payment of Redemption
0 0 0 0 0 0 0 0 0 0 0
II A Non receipt of Statement of Account / Unit Certificate
0 0 0 0 0 0 0 0 0 0 0
II B Discrepancy in Statement of Account
0 1 1 0 0 0 0 0 0 0 0
II C Data corrections in Investor details **
0 12 12 0 0 0 0 0 0 0 0
II D Non receipt of Annual Report/Abridged Summary
0 0 0 0 0 0 0 0 0 0 0
III A Wrong switch between Schemes
0 0 0 0 0 0 0 0 0 0 0
III B Unauthorized switch between Schemes
0 0 0 0 0 0 0 0 0 0 0
III C Deviation from Scheme attributes
0 0 0 0 0 0 0 0 0 0 0
III D Wrong or excess charges/load
0 0 0 0 0 0 0 0 0 0 0
III E Non updation of changes viz. address, PAN, bank details, nomination, etc
0 6 6 0 0 0 0 0 0 0 0
IV Others 0 15 15 0 0 0 0 0 0 0 0
Total 0 42 41 0 0 0 0 1 0 0 0

10
Abridged Annual Report 2020 - 2021
Summary of Complaints for FY 2020-21
Particulars Count
Total complaints received 42
Total number of folios 148770
% of complaints against the folio 0.028%
# active folios
** As per AMFI Best Practice Guidelines Circular No. 25/2011-12 for Revisions in the Guidelines on Standardization of Complaints / Grievances Reporting Procedure. If “Others” include a type of complaint which is more than 10% of overall complaints, then such a reason should be provided separately. Hence data corrections in Investor Details is included as a separate category
* Non actionable means the complaint is incomplete / outside the scope of the mutual fund
8. INveSToR eDuCATIoN INITIATIveS Investor awareness advertisements were published in Mutual Fund Insight magazine on a monthly basis along with an editorial on ‘SIP Sahi Hai’. Additionally, monthly articles / blogs have been written by Advisorkhoj on IAP which talks of the advantages of SIP, start early, power of compounding, diversification, asset allocation etc. The same is promoted by the publisher via an email to their entire network and also on their social media handles which can be retweeted or liked. Also, educative infographics have been hosted on our website under the investor resources section. The same have also been circulated to existing Indian investors via email for engagement and for educative purposes.
9. PRoxy voTINg PoLICyIn terms of SEBI Circular no. SEBI/IMD/CIR No. 18/198647/2010 dated March 15, 2010, the Fund has adopted Proxy Voting Policy and Procedures for exercising voting rights in respect of securities held by the Schemes.
The summary of the votes casted in the general meetings of the Investee companies, by the AMC for and on behalf of the Schemes of the Fund, for the financial year 2020-2021 is provided below:
quarter Total no. of resolutions
Break-up of vote decision
for Against Abstained
June 2020 50 43 6 1
September 2020 752 656 38 58
December 2020 41 31 1 9
March 2021 40 30 8 2
Total 883 760 53 70
In terms of the requirement of SEBI Circular no. CIR/IMD/DF/05/2014 dated March 24, 2014 and SEBI/HO/IMD/DF2/CIR/P/2016/68 dated August 10, 2016; the AMC has obtained certificate from M/s. M. P. Chitale & Co., Chartered Accountants, who is acting as a Scrutinizer, on the voting report for the FY 2020-21. The certificate dated April 14, 2021 issued by M/s. M. P. Chitale & Co., is available on the website of the AMC as part of the full Annual Report.
Unit holders can refer to the full Annual Report for complete details of actual exercise of votes in the general meetings of the investee companies for the financial year 2020-21 or log on to our website at www.assetmanagement.hsbc.co.in.
10. STATuToRy DeTAILSa) The Sponsors are not responsible or liable for any loss resulting from the operation of the Schemes of
the Fund beyond initial contribution of Rs. 1 lakh for setting up the Fund.
b) The price and redemption value of the units, and income from them, can go up as well as down with fluctuations in the market value of its underlying investments.
Trustees’ Reportfor the year ended March 31, 2021 (Contd...)
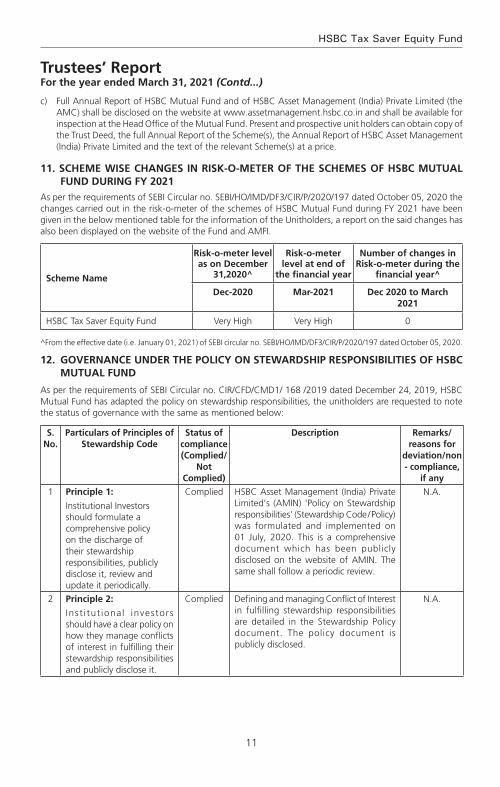
11
HSBC Tax Saver Equity Fund
Trustees’ Reportfor the year ended March 31, 2021 (Contd...)
c) Full Annual Report of HSBC Mutual Fund and of HSBC Asset Management (India) Private Limited (the AMC) shall be disclosed on the website at www.assetmanagement.hsbc.co.in and shall be available for inspection at the Head Office of the Mutual Fund. Present and prospective unit holders can obtain copy of the Trust Deed, the full Annual Report of the Scheme(s), the Annual Report of HSBC Asset Management (India) Private Limited and the text of the relevant Scheme(s) at a price.
11. SCHeMe WISe CHANgeS IN RISk-o-MeTeR of THe SCHeMeS of HSBC MuTuAL fuND DuRINg fy 2021
As per the requirements of SEBI Circular no. SEBI/HO/IMD/DF3/CIR/P/2020/197 dated October 05, 2020 the changes carried out in the risk-o-meter of the schemes of HSBC Mutual Fund during FY 2021 have been given in the below mentioned table for the information of the Unitholders, a report on the said changes has also been displayed on the website of the Fund and AMFI.
Scheme Name
Risk-o-meter level as on December
31,2020^
Risk-o-meter level at end of
the financial year
Number of changes in Risk-o-meter during the
financial year^
Dec-2020 Mar-2021 Dec 2020 to March 2021
HSBC Tax Saver Equity Fund Very High Very High 0
^From the effective date (i.e. January 01, 2021) of SEBI circular no. SEBI/HO/IMD/DF3/CIR/P/2020/197 dated October 05, 2020.
12. goveRNANCe uNDeR THe PoLICy oN STeWARDSHIP ReSPoNSIBILITIeS of HSBC MuTuAL fuND
As per the requirements of SEBI Circular no. CIR/CFD/CMD1/ 168 /2019 dated December 24, 2019, HSBC Mutual Fund has adapted the policy on stewardship responsibilities, the unitholders are requested to note the status of governance with the same as mentioned below:
S. No.
Particulars of Principles of Stewardship Code
Status of compliance (Complied/
Not Complied)
Description Remarks/reasons for
deviation/non - compliance,
if any1 Principle 1:
Institutional Investors should formulate a comprehensive policy on the discharge of their stewardship responsibilities, publicly disclose it, review and update it periodically.
Complied HSBC Asset Management (India) Private Limited's (AMIN) 'Policy on Stewardship responsibilities' (Stewardship Code / Policy) was formulated and implemented on 01 July, 2020. This is a comprehensive document which has been publicly disclosed on the website of AMIN. The same shall follow a periodic review.
N.A.
2 Principle 2:
Inst i tut ional investors should have a clear policy on how they manage conflicts of interest in fulfilling their stewardship responsibilities and publicly disclose it.
Complied Defining and managing Conflict of Interest in fulfilling stewardship responsibilities are detailed in the Stewardship Policy document. The policy document is publicly disclosed.
N.A.

12
Abridged Annual Report 2020 - 2021
S. No.
Particulars of Principles of Stewardship Code
Status of compliance (Complied/
Not Complied)
Description Remarks/reasons for
deviation/non - compliance,
if any3 Principle 3:
Institutional investors should monitor their investee companies.
Complied AMIN monitors all investee companies through its investment process. This includes assessment of companies’ own and market data, consideration of research from brokers and other independent research providers – including ESG & voting research, attending individual & group meetings with company management and directors, visiting production sites (wherever necessary), engaging with key stakeholders including competitors and customers, and financial modelling. More details enumerated in the policy document
N.A.
4 Principle 4:
Inst i tut ional investors should have a clear policy on intervention in their investee companies. Institutional investors should also have a clear policy for collaboration with other institutional investors where required, to preserve the interests of the ultimate investors, which should be disclosed.
Complied Details of undertaking active engagement with investee companies and the policy for collaboration with other institutional holders are detailed in the policy document. The policy document is publicly disclosed.
N.A.
5 Principle 5:
Inst i tut ional investors should have a clear policy on voting and disclosure of voting activity.
Complied AMIN has a clear and detailed voting policy which provides the framework for the voting decisions. All voting decisions shall be in accordance with AMIN’s Voting Policy and Procedures, which is disclosed on the website. AMIN discloses the details of the voting on its website on a quarterly basis within 10 working days from the end of the quarter. Additionally, AMIN also discloses the details of the votes cast, in the annual report of the schemes of HSBC Mutual Fund.
N.A.
6 Principle 6:
Institutional investors should report periodically on their stewardship activities.
Complied The annual status report of the stewardship code and quarterly report on proxy voting are publicly disclosed on the website as required under SEBI Regulations.
N.A.
13. SIgNIfICANT eveNT AfTeR THe eND of THe fINANCIAL yeAR
HSBC Global Consumer Opportunities Fund (HGCOF) has been merged with HSBC Asia Pacific (Ex Japan) Dividend Yield Fund with effect from May 13, 2021. Therefore, HGCOF has been ceased to exist from the aforesaid date.
Trustees’ Reportfor the year ended March 31, 2021 (Contd...)
13
HSBC Tax Saver Equity Fund
14. ACkNoWLeDgeMeNTS
The Trustees wish to thank the Unit holders of the Schemes for their support throughout the year and also thank the Government of India, the Securities and Exchange Board of India (SEBI), the Reserve Bank of India (RBI) and the Association of Mutual Funds in India (AMFI) for the guidance provided by them. The Trustees also appreciate the services provided by the Registrar and Transfer Agent, Fund Accountant, Custodian, Bankers, Distributors and Brokers. The guidance and services provided by the Auditors and advocates and the ebullience, sincerity and dedication of the employees of HSBC Asset Management (India) Private Limited is also appreciated.
The Trustees look forward to the continued support of everyone.
For and on behalf of the Board of Trustees of HSBC Mutual Fund
Sd/-
Trustee
Mumbai
July 20, 2021.
Trustees’ Reportfor the year ended March 31, 2021 (Contd...)
14
Abridged Annual Report 2020 - 2021
To the Trustees of HSBC Mutual Fund
HSBC Tax Saver equity fund
Report on the Audit of the financial Statements
opinionWe have audited the financial statements of HSBC Tax Saver equity fund (the ‘Scheme’) of HSBC Mutual Fund, which comprise the balance sheet as at 31 March 2021 and the revenue account or the year then ended, and notes to the financial statements, including a summary of the significant accounting policies.
In our opinion and to the best of our information and according to the explanations given to us, the aforesaid financial statements give a true and fair view in conformity with the accounting principles generally accepted in India, of the state of affairs of the Scheme as at 31 March 2021, its net surplus for the year ended on that date.
Basis for opinionWe conducted our audit in accordance with the Standards on Auditing (‘SAs’) issued by the Institute of Chartered Accountants of India (the ‘ICAI’). Our responsibilities under those SAs are further described in the Auditor’s Responsibilities for the Audit of the Financial Statements section of our report. We are independent of the Scheme in accordance with the Code of Ethics issued by the ICAI, and we have fulfilled our other ethical responsibilities in accordance with the Code of Ethics. We believe that the audit evidence we have obtained is sufficient and appropriate to provide a basis for our opinion.
Responsibilities of Management and Those Charged with governance for the financial StatementsThe Scheme’s management, the Board of Directors of HSBC Mutual Fund (the ‘Trustees’) and the Board of Directors of HSBC Asset Management (India) Private Limited (the ‘AMC’) (collectively referred to as ‘Management’) are responsible for the preparation of these financial statements that give a true and fair view of the state of affairs, results of operations of the Scheme in accordance with the accounting policies and standards specified in the Ninth Schedule of the Securities and Exchange Board of India (Mutual Funds) Regulations, 1996, as amended (the ‘Regulations’) and the accounting principles generally accepted in India. This responsibility includes design, implementation and maintenance of internal control relevant to the preparation and presentation of the financial statements that give a true and fair view and are free from material misstatement, whether due to fraud or error.
In preparing the financial statements, management is responsible for assessing the Scheme’s ability to continue as a going concern, disclosing, as applicable, matters related to going concern and using the going concern basis of accounting unless management either intends to liquidate the Scheme or to cease operations, or has no realistic alternative but to do so.
The management is responsible for overseeing the Scheme’s financial reporting process.
Auditor’s Responsibilities for the Audit of the financial StatementsOur objectives are to obtain reasonable assurance about whether the financial statements as a whole are free from material misstatement, whether due to fraud or error, and to issue an auditor’s report that includes our opinion. Reasonable assurance is a high level of assurance, but is not a guarantee that an audit conducted in accordance with SAs will always detect a material misstatement when it exists. Misstatements can arise from fraud or error and are considered material if, individually or in the aggregate, they could reasonably be expected to influence the economic decisions of users taken on the basis of these financial statements.
As part of an audit in accordance with SAs, we exercise professional judgment and maintain professional skepticism throughout the audit. We also:
• Identifyandassesstherisksofmaterialmisstatementofthefinancialstatements,whetherduetofraudor error, design and perform audit procedures responsive to those risks, and obtain audit evidence that is sufficient and appropriate to provide a basis for our opinion. The risk of not detecting a material misstatement resulting from fraud is higher than for one resulting from error, as fraud may involve collusion, forgery, intentional omissions, misrepresentations, or the override of internal control;
Independent Auditors’ Report
15
HSBC Tax Saver Equity Fund
Independent Auditors’ Report (Contd...)
• Obtainanunderstandingofinternalcontrolrelevanttotheauditinordertodesignauditproceduresthat are appropriate in the circumstances, but not for the purpose of expressing an opinion on the effectiveness of the Scheme’s internal controls;
• Evaluatetheappropriatenessofaccountingpoliciesusedandthereasonablenessofaccountingestimatesand related disclosures made by Management;
• ConcludeontheappropriatenessofManagement’suseofthegoingconcernbasisofaccountingand,based on the audit evidence obtained, whether a material uncertainty exists related to events or conditions that may cast significant doubt on the Scheme’s ability to continue as a going concern. If we conclude that a material uncertainty exists, we are required to draw attention in our auditor’s report to the related disclosures in the financial statements or, if such disclosures are inadequate, to modify our opinion. Our conclusions are based on the audit evidence obtained up to the date of our auditor’s report. However, future events or conditions may cause the Scheme to cease to continue as a going concern;
• Evaluate the overall presentation, structure and content of the financial statements, including thedisclosures and whether the financial statements represent the underlying transactions and events in a manner that achieves fair presentation.
We communicate with those charged with governance regarding, among other matters, the planned scope and timing of the audit and significant audit findings, including any significant deficiencies in internal control that we identify during our audit.
We also provide those charged with governance with a statement that we have complied with relevant ethical requirements regarding independence, and to communicate with them all relationships and other matters that may reasonably be thought to bear on our independence, and where applicable, related safeguards.
Report on other Legal and Regulatory Requirements 1 As required by Regulation 55 (4) of the Regulations, we report that:
(a) We have obtained all information and explanations which, to the best of our knowledge and belief, were necessary for the purposes of the audit; and
(b) The balance sheet and the revenue account have been prepared in accordance with the accounting policies and standards as specified in the Ninth Schedule of the Regulations.
2 As required by Clause 5 (ii) (2) of the Eleventh Schedule of the Regulations, we report that the balance sheet and the revenue account are in agreement with the books of account of the Scheme.
For B S R & Co. LLP Chartered Accountants Firm’s Registration No: 101248W/W-100022
Sd/-
Ajit viswanath PartnerMembership No: 067114UDIN : 21067114AAAADM6597
Place : Mumbai Date : July 20, 2021.

16
Abridged Annual Report 2020 - 2021
Rs. in Lakhs
As at March 31, 2021
As at March 31, 2020
LIABILITIES1 Unit Capital 4,542.69 4,875.22 2 Reserves & Surplus2.1 Unit Premium Reserves (3,326.36) (3,269.53)2.2 Unrealised Appreciation Reserve 5,499.62 – 2.3 Other Reserves 10,234.04 9,521.73 3 Loans & Borrowings – – 4 Current Liabilities & Provisions4.1 Provision for Doubtful Income/Deposits – – 4.2 Other Current Liabilities & Provisions 229.52 157.20
TOTAL 17,179.51 11,284.62
ASSeTS1 Investments1.1 Listed Securities:1.1.1 Equity Shares 16,769.53 10,775.66 1.1.2 Preference Shares – – 1.1.3 Equity Linked Debentures – – 1.1.4 Other Debentures & Bonds – – 1.1.5 Securitised Debt Securities – – 1.2 Securities Awaited Listing:1.2.1 Equity Shares – – 1.2.2 Preference Shares – – 1.2.3 Equity Linked Debentures – – 1.2.4 Other Debentures & Bonds – – 1.2.5 Securitised Debt Securities – – 1.3 Unlisted Securities:1.3.1 Equity Shares – – 1.3.2 Preference Shares – – 1.3.3 Equity Linked Debentures – – 1.3.4 Other Debentures & Bonds – – 1.3.5 Securitised Debt Securities – – 1.4 Government Securities – – 1.5 Treasury Bills – – 1.6 Commercial Paper – – 1.7 Certificate of Deposits – – 1.8 Bill Rediscounting – – 1.9 Units of Domestic Mutual Fund – – 1.10 Foreign Securities – –
Total Investments 16,769.53 10,775.66
2 Deposits 1.65 1.50 3 Other Current Assets3.1 Cash & Bank Balance 16.90 4.30 3.2 TREPS / Reverse Repo Lending 193.84 343.66 3.3 Others 197.59 159.50 4 Deferred Revenue Expenditure (to the extent not written off) – –
ToTAL 17,179.51 11,284.62
Notes to Accounts - Annexure I
Abridged Balance Sheet as at March 31, 2021
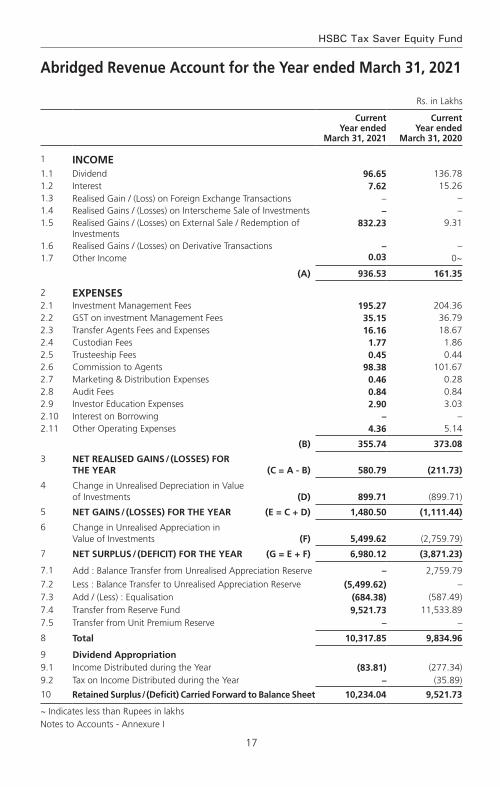
17
HSBC Tax Saver Equity Fund
Abridged Revenue Account for the year ended March 31, 2021
Rs. in Lakhs
Current Year ended
March 31, 2021
Current Year ended
March 31, 2020
1 INCOME1.1 Dividend 96.65 136.78 1.2 Interest 7.62 15.26 1.3 Realised Gain / (Loss) on Foreign Exchange Transactions – – 1.4 Realised Gains / (Losses) on Interscheme Sale of Investments – – 1.5 Realised Gains / (Losses) on External Sale / Redemption of
Investments 832.23 9.31
1.6 Realised Gains / (Losses) on Derivative Transactions – – 1.7 Other Income 0.03 0~
(A) 936.53 161.35
2 exPeNSeS2.1 Investment Management Fees 195.27 204.36 2.2 GST on investment Management Fees 35.15 36.79 2.3 Transfer Agents Fees and Expenses 16.16 18.67 2.4 Custodian Fees 1.77 1.86 2.5 Trusteeship Fees 0.45 0.44 2.6 Commission to Agents 98.38 101.67 2.7 Marketing & Distribution Expenses 0.46 0.28 2.8 Audit Fees 0.84 0.84 2.9 Investor Education Expenses 2.90 3.03 2.10 Interest on Borrowing – – 2.11 Other Operating Expenses 4.36 5.14
(B) 355.74 373.08
3 NeT ReALISeD gAINS / (LoSSeS) foR THe yeAR (C = A - B) 580.79 (211.73)
4 Change in Unrealised Depreciation in Value of Investments (D) 899.71 (899.71)
5 NET GAINS / (LOSSES) FOR THE YEAR (E = C + D) 1,480.50 (1,111.44)
6 Change in Unrealised Appreciation in Value of Investments (F) 5,499.62 (2,759.79)
7 NET SURPLUS / (DEFICIT) FOR THE YEAR (G = E + F) 6,980.12 (3,871.23)
7.1 Add : Balance Transfer from Unrealised Appreciation Reserve – 2,759.79
7.2 Less : Balance Transfer to Unrealised Appreciation Reserve (5,499.62) – 7.3 Add / (Less) : Equalisation (684.38) (587.49)7.4 Transfer from Reserve Fund 9,521.73 11,533.89 7.5 Transfer from Unit Premium Reserve – –
8 Total 10,317.85 9,834.96
9 Dividend Appropriation9.1 Income Distributed during the Year (83.81) (277.34)9.2 Tax on Income Distributed during the Year – (35.89)
10 Retained Surplus / (Deficit) Carried Forward to Balance Sheet 10,234.04 9,521.73
~ Indicates less than Rupees in lakhsNotes to Accounts - Annexure I
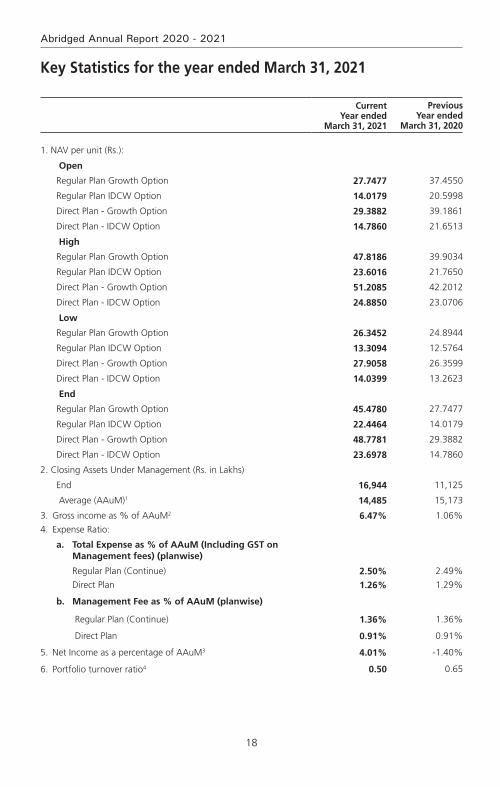
18
Abridged Annual Report 2020 - 2021
key Statistics for the year ended March 31, 2021
Current Year ended
March 31, 2021
Previous year ended
March 31, 2020
1. NAV per unit (Rs.):
Open
Regular Plan Growth Option 27.7477 37.4550
Regular Plan IDCW Option 14.0179 20.5998
Direct Plan - Growth Option 29.3882 39.1861
Direct Plan - IDCW Option 14.7860 21.6513
High
Regular Plan Growth Option 47.8186 39.9034
Regular Plan IDCW Option 23.6016 21.7650
Direct Plan - Growth Option 51.2085 42.2012
Direct Plan - IDCW Option 24.8850 23.0706
Low
Regular Plan Growth Option 26.3452 24.8944
Regular Plan IDCW Option 13.3094 12.5764
Direct Plan - Growth Option 27.9058 26.3599
Direct Plan - IDCW Option 14.0399 13.2623
End
Regular Plan Growth Option 45.4780 27.7477
Regular Plan IDCW Option 22.4464 14.0179
Direct Plan - Growth Option 48.7781 29.3882
Direct Plan - IDCW Option 23.6978 14.7860
2. Closing Assets Under Management (Rs. in Lakhs)
End 16,944 11,125
Average (AAuM)1 14,485 15,173
3. Gross income as % of AAuM2 6.47% 1.06%
4. Expense Ratio:
a. Total expense as % of AAuM (Including gST on Management fees) (planwise)
Regular Plan (Continue) 2.50% 2.49%
Direct Plan 1.26% 1.29%
b. Management fee as % of AAuM (planwise)
Regular Plan (Continue) 1.36% 1.36%
Direct Plan 0.91% 0.91%
5. Net Income as a percentage of AAuM3 4.01% -1.40%
6. Portfolio turnover ratio4 0.50 0.65
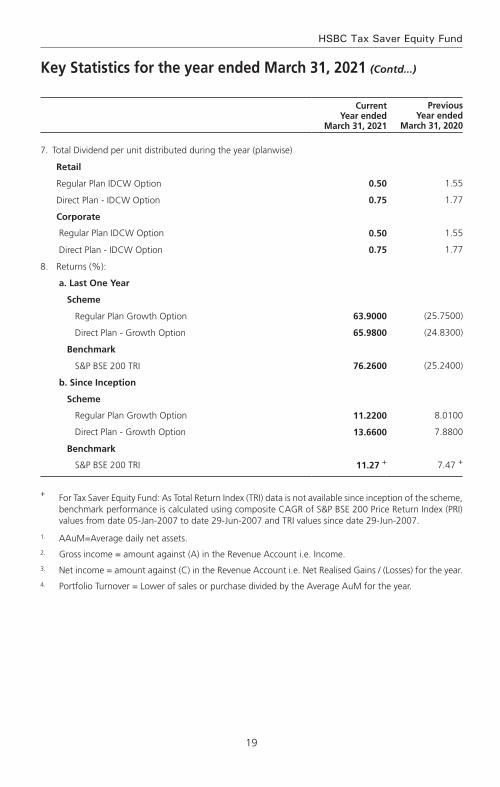
19
HSBC Tax Saver Equity Fund
Current Year ended
March 31, 2021
Previous year ended
March 31, 2020
7. Total Dividend per unit distributed during the year (planwise)
Retail
Regular Plan IDCW Option 0.50 1.55
Direct Plan - IDCW Option 0.75 1.77
Corporate
Regular Plan IDCW Option 0.50 1.55
Direct Plan - IDCW Option 0.75 1.77
8. Returns (%):
a. Last One Year
Scheme
Regular Plan Growth Option 63.9000 (25.7500)
Direct Plan - Growth Option 65.9800 (24.8300)
Benchmark
S&P BSE 200 TRI 76.2600 (25.2400)
b. Since Inception
Scheme
Regular Plan Growth Option 11.2200 8.0100
Direct Plan - Growth Option 13.6600 7.8800
Benchmark
S&P BSE 200 TRI 11.27 + 7.47 +
+ For Tax Saver Equity Fund: As Total Return Index (TRI) data is not available since inception of the scheme, benchmark performance is calculated using composite CAGR of S&P BSE 200 Price Return Index (PRI) values from date 05-Jan-2007 to date 29-Jun-2007 and TRI values since date 29-Jun-2007.
1. AAuM=Average daily net assets.2. Gross income = amount against (A) in the Revenue Account i.e. Income.3. Net income = amount against (C) in the Revenue Account i.e. Net Realised Gains / (Losses) for the year.4. Portfolio Turnover = Lower of sales or purchase divided by the Average AuM for the year.
key Statistics for the year ended March 31, 2021 (Contd...)
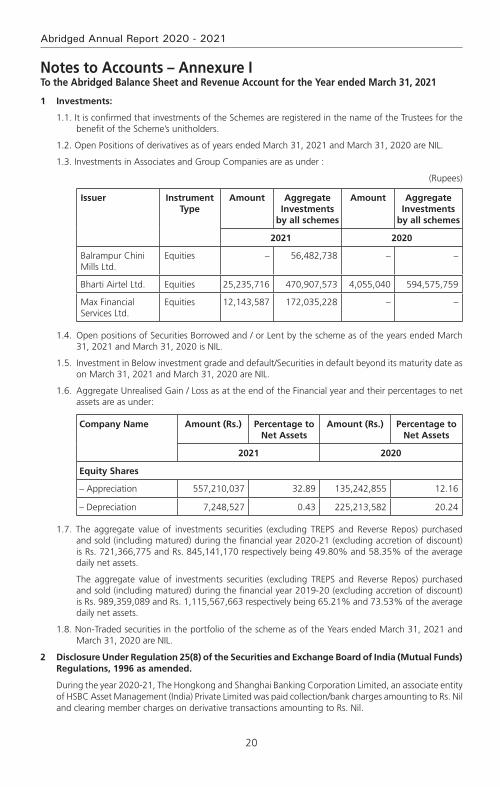
20
Abridged Annual Report 2020 - 2021
Notes to Accounts – Annexure ITo the Abridged Balance Sheet and Revenue Account for the year ended March 31, 2021
1 Investments:
1.1. It is confirmed that investments of the Schemes are registered in the name of the Trustees for the benefit of the Scheme’s unitholders.
1.2. Open Positions of derivatives as of years ended March 31, 2021 and March 31, 2020 are NIL.
1.3. Investments in Associates and Group Companies are as under :
(Rupees)
Issuer Instrument Type
Amount Aggregate Investments
by all schemes
Amount Aggregate Investments
by all schemes
2021 2020
Balrampur Chini Mills Ltd.
Equities – 56,482,738 – –
Bharti Airtel Ltd. Equities 25,235,716 470,907,573 4,055,040 594,575,759
Max Financial Services Ltd.
Equities 12,143,587 172,035,228 – –
1.4. Open positions of Securities Borrowed and / or Lent by the scheme as of the years ended March 31, 2021 and March 31, 2020 is NIL.
1.5. Investment in Below investment grade and default/Securities in default beyond its maturity date as on March 31, 2021 and March 31, 2020 are NIL.
1.6. Aggregate Unrealised Gain / Loss as at the end of the Financial year and their percentages to net assets are as under:
Company Name Amount (Rs.) Percentage to Net Assets
Amount (Rs.) Percentage to Net Assets
2021 2020
Equity Shares
– Appreciation 557,210,037 32.89 135,242,855 12.16
– Depreciation 7,248,527 0.43 225,213,582 20.24
1.7. The aggregate value of investments securities (excluding TREPS and Reverse Repos) purchased and sold (including matured) during the financial year 2020-21 (excluding accretion of discount) is Rs. 721,366,775 and Rs. 845,141,170 respectively being 49.80% and 58.35% of the average daily net assets.
The aggregate value of investments securities (excluding TREPS and Reverse Repos) purchased and sold (including matured) during the financial year 2019-20 (excluding accretion of discount) is Rs. 989,359,089 and Rs. 1,115,567,663 respectively being 65.21% and 73.53% of the average daily net assets.
1.8. Non-Traded securities in the portfolio of the scheme as of the Years ended March 31, 2021 and March 31, 2020 are NIL.
2 Disclosure Under Regulation 25(8) of the Securities and Exchange Board of India (Mutual Funds)Regulations, 1996 as amended.
During the year 2020-21, The Hongkong and Shanghai Banking Corporation Limited, an associate entity of HSBC Asset Management (India) Private Limited was paid collection/bank charges amounting to Rs. Nil and clearing member charges on derivative transactions amounting to Rs. Nil.
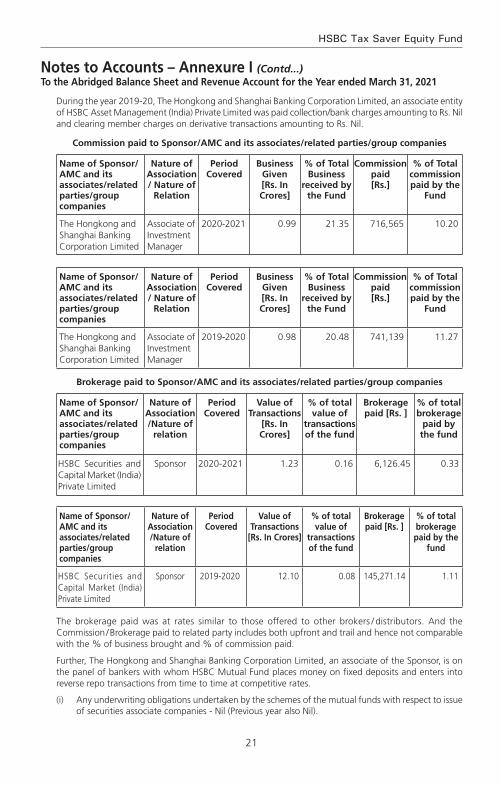
21
HSBC Tax Saver Equity Fund
During the year 2019-20, The Hongkong and Shanghai Banking Corporation Limited, an associate entity of HSBC Asset Management (India) Private Limited was paid collection/bank charges amounting to Rs. Nil and clearing member charges on derivative transactions amounting to Rs. Nil.
Commission paid to Sponsor/AMC and its associates/related parties/group companies
Name of Sponsor/AMC and its associates/related parties/group companies
Nature of Association / Nature of
Relation
Period Covered
Business given [Rs. In Crores]
% of Total Business
received by the fund
Commission paid [Rs.]
% of Total commission paid by the
fund
The Hongkong and Shanghai Banking Corporation Limited
Associate of Investment Manager
2020-2021 0.99 21.35 716,565 10.20
Name of Sponsor/AMC and its associates/related parties/group companies
Nature of Association / Nature of
Relation
Period Covered
Business given [Rs. In Crores]
% of Total Business
received by the fund
Commission paid [Rs.]
% of Total commission paid by the
fund
The Hongkong and Shanghai Banking Corporation Limited
Associate of Investment Manager
2019-2020 0.98 20.48 741,139 11.27
Brokerage paid to Sponsor/AMC and its associates/related parties/group companies
Name of Sponsor/AMC and its associates/related parties/group companies
Nature of Association /Nature of
relation
Period Covered
value of Transactions
[Rs. In Crores]
% of total value of
transactions of the fund
Brokerage paid [Rs. ]
% of total brokerage
paid by the fund
HSBC Securities and Capital Market (India) Private Limited
Sponsor 2020-2021 1.23 0.16 6,126.45 0.33
Name of Sponsor/AMC and its associates/related parties/group companies
Nature of Association /Nature of
relation
Period Covered
value of Transactions
[Rs. In Crores]
% of total value of
transactions of the fund
Brokerage paid [Rs. ]
% of total brokerage paid by the
fund
HSBC Securities and Capital Market (India) Private Limited
Sponsor 2019-2020 12.10 0.08 145,271.14 1.11
The brokerage paid was at rates similar to those offered to other brokers / distributors. And the Commission / Brokerage paid to related party includes both upfront and trail and hence not comparable with the % of business brought and % of commission paid.
Further, The Hongkong and Shanghai Banking Corporation Limited, an associate of the Sponsor, is on the panel of bankers with whom HSBC Mutual Fund places money on fixed deposits and enters into reverse repo transactions from time to time at competitive rates.
(i) Any underwriting obligations undertaken by the schemes of the mutual funds with respect to issue of securities associate companies - Nil (Previous year also Nil).
Notes to Accounts – Annexure I (Contd...)To the Abridged Balance Sheet and Revenue Account for the year ended March 31, 2021
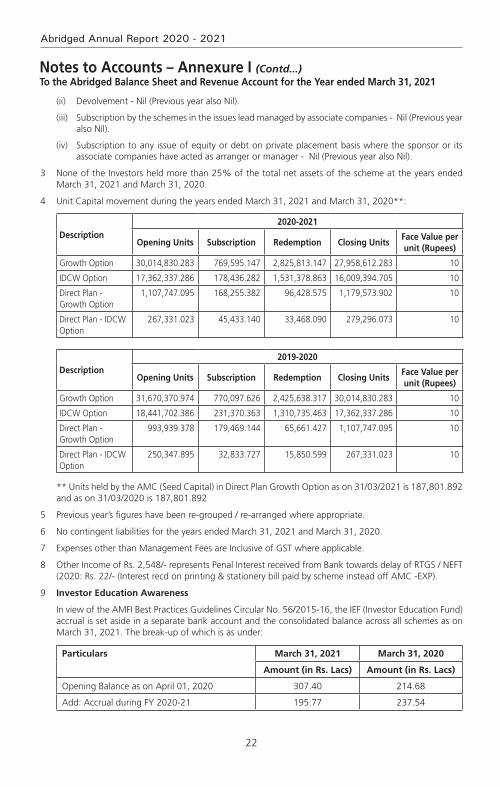
22
Abridged Annual Report 2020 - 2021
(ii) Devolvement - Nil (Previous year also Nil).
(iii) Subscription by the schemes in the issues lead managed by associate companies - Nil (Previous year also Nil).
(iv) Subscription to any issue of equity or debt on private placement basis where the sponsor or its associate companies have acted as arranger or manager - Nil (Previous year also Nil).
3 None of the Investors held more than 25% of the total net assets of the scheme at the years ended March 31, 2021 and March 31, 2020.
4 Unit Capital movement during the years ended March 31, 2021 and March 31, 2020**:
Description2020-2021
opening units Subscription Redemption Closing unitsface value per unit (Rupees)
Growth Option 30,014,830.283 769,595.147 2,825,813.147 27,958,612.283 10
IDCW Option 17,362,337.286 178,436.282 1,531,378.863 16,009,394.705 10
Direct Plan - Growth Option
1,107,747.095 168,255.382 96,428.575 1,179,573.902 10
Direct Plan - IDCW Option
267,331.023 45,433.140 33,468.090 279,296.073 10
Description2019-2020
opening units Subscription Redemption Closing unitsface value per unit (Rupees)
Growth Option 31,670,370.974 770,097.626 2,425,638.317 30,014,830.283 10
IDCW Option 18,441,702.386 231,370.363 1,310,735.463 17,362,337.286 10
Direct Plan - Growth Option
993,939.378 179,469.144 65,661.427 1,107,747.095 10
Direct Plan - IDCW Option
250,347.895 32,833.727 15,850.599 267,331.023 10
** Units held by the AMC (Seed Capital) in Direct Plan Growth Option as on 31/03/2021 is 187,801.892 and as on 31/03/2020 is 187,801.892
5 Previous year’s figures have been re-grouped / re-arranged where appropriate.
6 No contingent liabilities for the years ended March 31, 2021 and March 31, 2020.
7 Expenses other than Management Fees are Inclusive of GST where applicable.
8 Other Income of Rs. 2,548/- represents Penal Interest received from Bank towards delay of RTGS / NEFT (2020: Rs. 22/- (Interest recd on printing & stationery bill paid by scheme instead off AMC -EXP).
9 Investor Education Awareness
In view of the AMFI Best Practices Guidelines Circular No. 56/2015-16, the IEF (Investor Education Fund) accrual is set aside in a separate bank account and the consolidated balance across all schemes as on March 31, 2021. The break-up of which is as under:
Particulars March 31, 2021 March 31, 2020
Amount (in Rs. Lacs) Amount (in Rs. Lacs)
Opening Balance as on April 01, 2020 307.40 214.68
Add: Accrual during FY 2020-21 195.77 237.54
Notes to Accounts – Annexure I (Contd...)To the Abridged Balance Sheet and Revenue Account for the year ended March 31, 2021
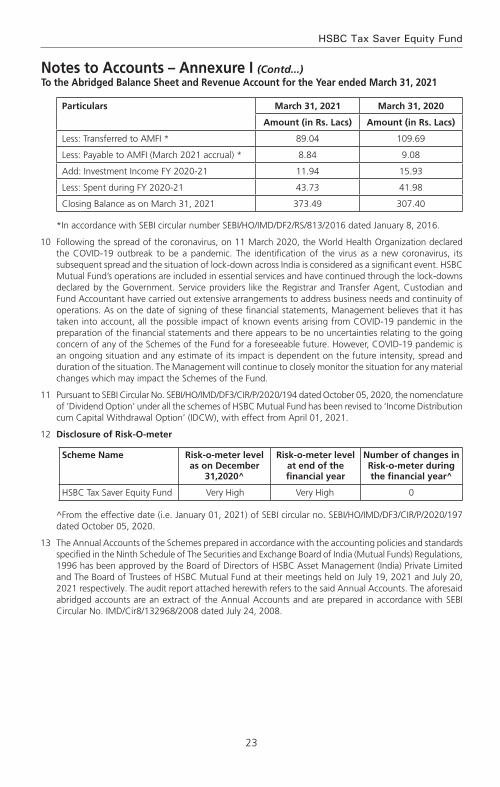
23
HSBC Tax Saver Equity Fund
Notes to Accounts – Annexure I (Contd...)To the Abridged Balance Sheet and Revenue Account for the year ended March 31, 2021
Particulars March 31, 2021 March 31, 2020
Amount (in Rs. Lacs) Amount (in Rs. Lacs)
Less: Transferred to AMFI * 89.04 109.69
Less: Payable to AMFI (March 2021 accrual) * 8.84 9.08
Add: Investment Income FY 2020-21 11.94 15.93
Less: Spent during FY 2020-21 43.73 41.98
Closing Balance as on March 31, 2021 373.49 307.40
*In accordance with SEBI circular number SEBI/HO/IMD/DF2/RS/813/2016 dated January 8, 2016.
10 Following the spread of the coronavirus, on 11 March 2020, the World Health Organization declared the COVID-19 outbreak to be a pandemic. The identification of the virus as a new coronavirus, its subsequent spread and the situation of lock-down across India is considered as a significant event. HSBC Mutual Fund’s operations are included in essential services and have continued through the lock-downs declared by the Government. Service providers like the Registrar and Transfer Agent, Custodian and Fund Accountant have carried out extensive arrangements to address business needs and continuity of operations. As on the date of signing of these financial statements, Management believes that it has taken into account, all the possible impact of known events arising from COVID-19 pandemic in the preparation of the financial statements and there appears to be no uncertainties relating to the going concern of any of the Schemes of the Fund for a foreseeable future. However, COVID-19 pandemic is an ongoing situation and any estimate of its impact is dependent on the future intensity, spread and duration of the situation. The Management will continue to closely monitor the situation for any material changes which may impact the Schemes of the Fund.
11 Pursuant to SEBI Circular No. SEBI/HO/IMD/DF3/CIR/P/2020/194 dated October 05, 2020, the nomenclature of ‘Dividend Option’ under all the schemes of HSBC Mutual Fund has been revised to ‘Income Distribution cum Capital Withdrawal Option’ (IDCW), with effect from April 01, 2021.
12 Disclosure of Risk-O-meter
Scheme Name Risk-o-meter level as on December
31,2020^
Risk-o-meter level at end of the financial year
Number of changes in Risk-o-meter during the financial year^
HSBC Tax Saver Equity Fund Very High Very High 0
^From the effective date (i.e. January 01, 2021) of SEBI circular no. SEBI/HO/IMD/DF3/CIR/P/2020/197 dated October 05, 2020.
13 The Annual Accounts of the Schemes prepared in accordance with the accounting policies and standards specified in the Ninth Schedule of The Securities and Exchange Board of India (Mutual Funds) Regulations, 1996 has been approved by the Board of Directors of HSBC Asset Management (India) Private Limited and The Board of Trustees of HSBC Mutual Fund at their meetings held on July 19, 2021 and July 20, 2021 respectively. The audit report attached herewith refers to the said Annual Accounts. The aforesaid abridged accounts are an extract of the Annual Accounts and are prepared in accordance with SEBI Circular No. IMD/Cir8/132968/2008 dated July 24, 2008.

24
Abridged Annual Report 2020 - 2021
voting Policy and Procedures
In view of SEBI guidelines related to “Role of Mutual Funds in Corporate Governance of Public Listed Companies”, HSBC AMC has formulated its “Policy for Proxy Voting in Public Listed Companies”. The said policy is available on our website and the details of actual exercise of proxy votes, the summary of votes casted and the auditor’s certificate for the Financial Year 2020 – 21 is forming part of our full Annual Report for the Financial Year 2020 – 21 which is uploaded on our website at http://www.assetmanagement.hsbc.co.in

25
HSBC Tax Saver Equity Fund
All the returns have been sourced from Mutual Funds India Explorer software. The performance of the schemes and the benchmark is calculated on a total return basis. This document has been prepared by HSBC Asset Management (India) Private Ltd (HSBC) for information purposes only and should not be construed as i) an offer or recommendation to buy or sell securities, commodities, currencies or other investments referred to herein; or ii) an offer to sell or a solicitation or an offer for purchase of any of the funds of HSBC Mutual Fund; or iii) an investment research or investment advice. All information contained in this document (including that sourced from third parties), is obtained from sources HSBC and the third party which HSBC believes to be reliable however, has not independently verified the same. The information and opinions contained within the document are based upon publicly available information and rates of taxation applicable (if any) at the time of publication, which are subject to change from time to time.
Expressions of opinion are those of HSBC only and are subject to change without notice. It does not have regard to specific investment objectives, financial situation and the particular needs of any specific person who may receive this document. Investors should seek personal and independent advice regarding the appropriateness of investing in any of the funds, securities, other investment or investment strategies that may have been discussed or referred herein and should understand that the views regarding future prospects may or may not be realized. In no event shall HSBC Mutual Fund / HSBC Asset management (India) Private Limited and / or its affiliates or any of their directors, trustees, officers and employees be liable for any direct, indirect, special, incidental or consequential damages arising out of the use of information / opinion herein. Neither this document nor the units of HSBC Mutual Fund have been registered in any jurisdiction. The distribution of this document in certain jurisdictions may be restricted or totally prohibited and accordingly, persons who come into possession of this document are required to inform themselves about, and to observe, any such restrictions.
Mutual fund investments are subject to market risks, read all scheme related documents carefully.
Statutory Details & Disclaimers

HSBC Equity Hybrid FundAggressive Hybrid fund – An open ended hybrid scheme investing predominantly in equity and equity related instruments
Abridged Annual Report 2020 - 2021

1
HSBC Equity Hybrid Fund
Dear Investor,
The beginning of the last financial year now almost seems like a distant memory. COVID-19 was still a relatively unknown enemy and governments across the world were grappling with ways to control and mitigate the risks associated with it. Nationwide lockdowns were the norm and our markets both equity and fixed income reacted negatively leading to significant erosion of wealth. Within a short period of time markets bounced back. This confounded even the most astute market pundits. How is it possible that when GDP growth had slowed down, unemployment had risen, inflation was high could there be such sharp up move in equity indices. Whilst the reasons are well known about easy global liquidity, demand resurgence, cost cutting by corporates etc. perhaps its most important to remember that the markets are not a reflector but a predictor of economic activity.
At all times particularly during such volatile times it is important to go back to the basics. Why do you save, why do you invest, what goals would you like to achieve, how old are you, what is your risk appetite? The replies to these simple questions will help you determine your asset allocation. As an example when equity markets corrected sharply last year, investors who reviewed their asset allocation, stayed invested during the lows of the past year and were able to capture the rebound and have seen prime returns since then. The current market movement in all likelihood would have also led to some imbalances in your asset allocation. Do not ignore that and I strongly recommend that you do review this with your advisor to check whether re-balancing is required.
During this financial year we had three very successful new fund launches. The pandemic showed us a clear trend of dominant players becoming stronger and profit pool getting consolidated within a few companies. To capture this opportunity, we launched the HSBC Focused Equity Fund which garnered close to Rs. 520 crores. During the second half of 2020, in the fixed income space, 3 - 5 year duration range had a favourable investment scenario as RBI’s accommodative policy and surplus liquidity had reduced the returns at the very short end of the yield curve. There was a demand for an actively managed moderate duration strategy with better credit quality which we fulfilled by launching HSBC Corporate Bond Fund. It garnered over 700 crores. Our latest and first of its kind offering, HSBC Global Equity Climate Change Fund of Fund saw a stupendous response with over 8000 investors investing over Rs. 616 crores. This is an investment opportunity which goes beyond the rationale of simply generating investment returns and is the future of responsible investing.
We worked towards augmenting our digital capabilities by launching a few key enhancements to our online transaction platform. Being mindful of the movement restrictions in place, this year we focused on digitizing offline processes so that an investor need not need step out of her home for investing or availing any key services. While our interactive chatbot AskMe, eased service queries, our end-to-end digital KYC module enabled a first time Mutual Fund investor to invest in our funds without any paperwork. We listened to your feedback and digitized consolidation of folios and change of tax status which eliminated the need for you to physically visit our branches.
I am a strong believer in the India story and this story has just begun. The opportunity to invest in this high growth market is a very exciting opportunity. I do hope you share my enthusiasm and I ask that you continue to invest whilst reviewing your asset allocation at all times. As always thank you for your business. Stay safe.
Warm regards,
Ravi MenonChief Executive Officer,
HSBC Asset Management India

2
Abridged Annual Report 2020 - 2021
SPONSOR
HSBC Securities and Capital Markets (India) Private LimitedRegd. Office: 52/60, Mahatma Gandhi Road, Fort, Mumbai - 400 001.
TRUSTEE
Board of TrusteesOffice: 16, Veer Nariman Road, Fort, Mumbai 400 001.
ASSET MANAGEMENT COMPANY
HSBC Asset Management (India) Private LimitedCorp. & Regd. Office: 16, Veer Nariman Road, Fort, Mumbai 400 001.
CUSTODIAN
Standard Chartered Bank (SCB)Corp. & Regd. Office: Crescenzo, Securities Services, 3rd Floor, C-38/39, G-Block,
Bandra Kurla Complex, Bandra East, Mumbai – 400051.
AUDITORS TO THE SCHEME
BSR & Co. LLPChartered Accountants
5th Floor, Lodha Excelus, Apollo Mills Compound, N. M. Joshi Marg, Mahalaxmi, Mumbai 400 011.
REGISTRAR & TRANSFER AGENTS
Computer Age Management Services Limited (CAMS)Unit: HSBC Mutual Fund ’C’ Block, 2nd Floor, Hanudev Info Park P. Ltd., SF No. 558/2, Udayampalayam Road, Nava India, Coimbatore - 641 028.
BOARD OF TRUSTEES
Ms. Jasmine Batliwalla - Chairperson
Mr. Nani Javeri - Trustee
Dr. T. C. Nair - Trustee
Mr. Pedro Bastos - Trustee
BOARD OF DIRECTORS
Mr. Dinesh Mittal - Director
Dr. Indu Shahani - Director
Mr. Ravi Menon - Director & Chief Executive Officer
3
HSBC Equity Hybrid Fund
The Trustees of HSBC Mutual Fund (“Fund”) present the Nineteenth Annual Report and the audited abridged financial statements of the schemes of the Fund for the year ended March 31, 2021.
As at March 31, 2021, the Fund offered 37 schemes across asset classes to meet the varying investment needs of the investors. During FY 2020-2021, the Fund has launched various new products namely HSBC Corporate Bond Fund, HSBC Focused Equity Fund and HSBC Global Equity Climate Change Fund of Fund to fill the gaps in our product offering.
The Fund continues its focus on delivering consistent long term returns. The comments on the performance of the Scheme(s) is provided hereinafter. Dividends were declared under various schemes as per the provisions contained in the respective Scheme Information Documents after considering the distributable surplus available under the respective Schemes. Details of dividends declared can be viewed on our website at www.assetmanagement.hsbc.co.in.
1. SCHEME PERFORMANCE, FUTURE OUTLOOk AND OPERATIONS OF THE SCHEMES
a. Operations and Performance of the Schemes
HSBC Equity Hybrid Fund (HEHF)
(An open ended hybrid scheme investing predominantly in equity and equity related instruments)
HEHF seeks to provide long term capital growth and income through investments in equity and equity related securities and fixed income instruments. However, there is no assurance that the investment objective of the Scheme will be achieved.
The net assets of HEHF amounted to Rs. 487.46 crores as at March 31, 2021 as compared to Rs 483.22 crore as on March, 31 2020. Around 73.79% of the net assets were invested in equities, 22.75% were invested in Debt and money market securities, 3.29% of the net assets were invested in reverse repos / TREPS and 0.17% in net current assets as at March 31, 2021 The inception date of the scheme is October 22, 2018.
HEHF was launched in October 2018. HEHF is an asset allocation product with a mix of equity and debt, falling in the aggressive category of equity hybrid schemes. The fund’s mandate provides flexibility to have an equity allocation between 65 – 80% of the portfolio while debt exposure will range between 20 – 35%. The fund has underperformed its benchmark over 1 year and since inception periods. The equity allocation in the fund stood at 73.8% as of 31 March 2021 The underperformance of the equity portion of the fund compared to the equity benchmark during the past year was largely on account of sector allocation to Utilities (underweight) and Healthcare (overweight). Stock selection within Communication Services, Industrials and Financials also adversely impacted the performance relative to the benchmark. The equity portion follows a flexi-cap strategy.
Looking ahead, the AMC believes that the trend of profit pool consolidating with the dominant players in respective sectors / industries, is likely to continue and disruptions such as COVID, could accelerate that shift. The Fund Manager is positive on the theme of profit pool migration and consolidation visible across and within sectors as well as market capitalization segments. So as a result, the AMC would be focusing on market leaders or dominant companies within each sectors that are available at reasonable valuations. The AMC’s bottom up stock selection also focuses on earnings growth and within that there is an emphasis on stocks that are likely to deliver positive earnings surprises.
The AMC is of the view that the impact of the second wave would be short term in nature followed by a quick rebound. As a result, the Fund Manager is maintaining a pro-cyclical bias in the portfolio. Earnings growth is expected to rebound sharply in FY22 (post the short disruption period in 1Q). Earnings growth momentum is expected to sustain in high-teens beyond FY22 on the back of economy witnessing a cyclical recovery due to revival in capex cycle over the next 2-3 years (first by the government followed by private capex). Benign cost of capital and reasonable valuations (in the context of multi-year earnings outlook), should act as additional support to the equity performance, in the medium term. From a sectoral perspective the order of preference is rate sensitives followed by domestic cyclicals, exporters and domestic consumption. Predominantly regulated businesses come last in the pecking order. This preference is dictated by AMC’s assessment of sectors / segments leading contribution to the market earnings growth over the next 2-3 years.
Trustees’ ReportFor the year ended March 31, 2021
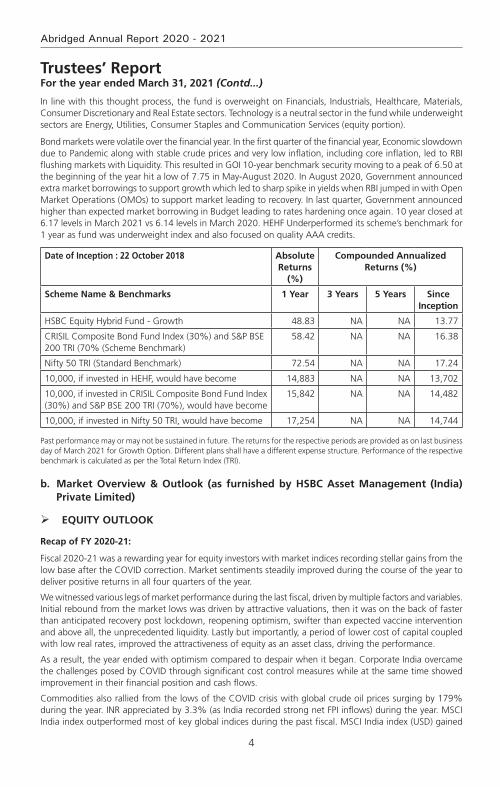
4
Abridged Annual Report 2020 - 2021
In line with this thought process, the fund is overweight on Financials, Industrials, Healthcare, Materials, Consumer Discretionary and Real Estate sectors. Technology is a neutral sector in the fund while underweight sectors are Energy, Utilities, Consumer Staples and Communication Services (equity portion).
Bond markets were volatile over the financial year. In the first quarter of the financial year, Economic slowdown due to Pandemic along with stable crude prices and very low inflation, including core inflation, led to RBI flushing markets with Liquidity. This resulted in GOI 10-year benchmark security moving to a peak of 6.50 at the beginning of the year hit a low of 7.75 in May-August 2020. In August 2020, Government announced extra market borrowings to support growth which led to sharp spike in yields when RBI jumped in with Open Market Operations (OMOs) to support market leading to recovery. In last quarter, Government announced higher than expected market borrowing in Budget leading to rates hardening once again. 10 year closed at 6.17 levels in March 2021 vs 6.14 levels in March 2020. HEHF Underperformed its scheme’s benchmark for 1 year as fund was underweight index and also focused on quality AAA credits.
Date of Inception : 22 October 2018 Absolute Returns
(%)
Compounded Annualized Returns (%)
Scheme Name & Benchmarks 1 Year 3 Years 5 Years Since Inception
HSBC Equity Hybrid Fund - Growth 48.83 NA NA 13.77
CRISIL Composite Bond Fund Index (30%) and S&P BSE 200 TRI (70% (Scheme Benchmark)
58.42 NA NA 16.38
Nifty 50 TRI (Standard Benchmark) 72.54 NA NA 17.24
10,000, if invested in HEHF, would have become 14,883 NA NA 13,702
10,000, if invested in CRISIL Composite Bond Fund Index (30%) and S&P BSE 200 TRI (70%), would have become
15,842 NA NA 14,482
10,000, if invested in Nifty 50 TRI, would have become 17,254 NA NA 14,744
Past performance may or may not be sustained in future. The returns for the respective periods are provided as on last business day of March 2021 for Growth Option. Different plans shall have a different expense structure. Performance of the respective benchmark is calculated as per the Total Return Index (TRI).
b. Market Overview & Outlook (as furnished by HSBC Asset Management (India) Private Limited)
EqUITY OUTLOOk
Recap of FY 2020-21:
Fiscal 2020-21 was a rewarding year for equity investors with market indices recording stellar gains from the low base after the COVID correction. Market sentiments steadily improved during the course of the year to deliver positive returns in all four quarters of the year.
We witnessed various legs of market performance during the last fiscal, driven by multiple factors and variables. Initial rebound from the market lows was driven by attractive valuations, then it was on the back of faster than anticipated recovery post lockdown, reopening optimism, swifter than expected vaccine intervention and above all, the unprecedented liquidity. Lastly but importantly, a period of lower cost of capital coupled with low real rates, improved the attractiveness of equity as an asset class, driving the performance.
As a result, the year ended with optimism compared to despair when it began. Corporate India overcame the challenges posed by COVID through significant cost control measures while at the same time showed improvement in their financial position and cash flows.
Commodities also rallied from the lows of the COVID crisis with global crude oil prices surging by 179% during the year. INR appreciated by 3.3% (as India recorded strong net FPI inflows) during the year. MSCI India index outperformed most of key global indices during the past fiscal. MSCI India index (USD) gained
Trustees’ ReportFor the year ended March 31, 2021 (Contd...)
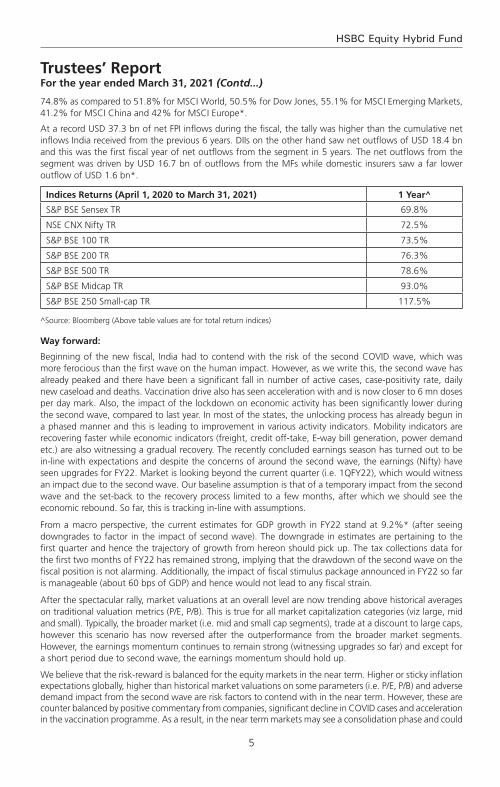
5
HSBC Equity Hybrid Fund
74.8% as compared to 51.8% for MSCI World, 50.5% for Dow Jones, 55.1% for MSCI Emerging Markets, 41.2% for MSCI China and 42% for MSCI Europe*.
At a record USD 37.3 bn of net FPI inflows during the fiscal, the tally was higher than the cumulative net inflows India received from the previous 6 years. DIIs on the other hand saw net outflows of USD 18.4 bn and this was the first fiscal year of net outflows from the segment in 5 years. The net outflows from the segment was driven by USD 16.7 bn of outflows from the MFs while domestic insurers saw a far lower outflow of USD 1.6 bn*.
Indices Returns (April 1, 2020 to March 31, 2021) 1 Year^
S&P BSE Sensex TR 69.8%
NSE CNX Nifty TR 72.5%
S&P BSE 100 TR 73.5%
S&P BSE 200 TR 76.3%
S&P BSE 500 TR 78.6%
S&P BSE Midcap TR 93.0%
S&P BSE 250 Small-cap TR 117.5%
^Source: Bloomberg (Above table values are for total return indices)
Way forward:
Beginning of the new fiscal, India had to contend with the risk of the second COVID wave, which was more ferocious than the first wave on the human impact. However, as we write this, the second wave has already peaked and there have been a significant fall in number of active cases, case-positivity rate, daily new caseload and deaths. Vaccination drive also has seen acceleration with and is now closer to 6 mn doses per day mark. Also, the impact of the lockdown on economic activity has been significantly lower during the second wave, compared to last year. In most of the states, the unlocking process has already begun in a phased manner and this is leading to improvement in various activity indicators. Mobility indicators are recovering faster while economic indicators (freight, credit off-take, E-way bill generation, power demand etc.) are also witnessing a gradual recovery. The recently concluded earnings season has turned out to be in-line with expectations and despite the concerns of around the second wave, the earnings (Nifty) have seen upgrades for FY22. Market is looking beyond the current quarter (i.e. 1QFY22), which would witness an impact due to the second wave. Our baseline assumption is that of a temporary impact from the second wave and the set-back to the recovery process limited to a few months, after which we should see the economic rebound. So far, this is tracking in-line with assumptions.
From a macro perspective, the current estimates for GDP growth in FY22 stand at 9.2%* (after seeing downgrades to factor in the impact of second wave). The downgrade in estimates are pertaining to the first quarter and hence the trajectory of growth from hereon should pick up. The tax collections data for the first two months of FY22 has remained strong, implying that the drawdown of the second wave on the fiscal position is not alarming. Additionally, the impact of fiscal stimulus package announced in FY22 so far is manageable (about 60 bps of GDP) and hence would not lead to any fiscal strain.
After the spectacular rally, market valuations at an overall level are now trending above historical averages on traditional valuation metrics (P/E, P/B). This is true for all market capitalization categories (viz large, mid and small). Typically, the broader market (i.e. mid and small cap segments), trade at a discount to large caps, however this scenario has now reversed after the outperformance from the broader market segments. However, the earnings momentum continues to remain strong (witnessing upgrades so far) and except for a short period due to second wave, the earnings momentum should hold up.
We believe that the risk-reward is balanced for the equity markets in the near term. Higher or sticky inflation expectations globally, higher than historical market valuations on some parameters (i.e. P/E, P/B) and adverse demand impact from the second wave are risk factors to contend with in the near term. However, these are counter balanced by positive commentary from companies, significant decline in COVID cases and acceleration in the vaccination programme. As a result, in the near term markets may see a consolidation phase and could
Trustees’ ReportFor the year ended March 31, 2021 (Contd...)
6
Abridged Annual Report 2020 - 2021
take cues from the upcoming earnings season with more focus on the corporate commentary and the outlook. From a medium to long term perspective, the outlook for equity markets remains positive. The expectation of cyclical revival in the economy brings in a multi-year earnings visibility. This along with a benign cost of capital environment, should support equity performance. However, equity returns are likely to moderate on the back of the relatively high valuations and the strong recovery we have already witnessed from the COVID lows. Equity performance is likely to mirror the earnings growth trends over the medium to long term.
Pace of vaccination, concerns about a third wave, corporate earnings trajectory, inflation trends (both global & domestic), monsoon trends and commodity prices (especially crude oil) are some of the key factors which could influence market performance in the short term.
From a portfolio perspective, we are maintaining a pro-cyclical bias. We expect earnings growth to rebound sharply post the current COVID phase. Earnings growth are expected to sustain in high-teens beyond FY22 on the back of economy witnessing a cyclical recovery due to revival in capex cycle over the next 2-3 years (first by the government followed by private capex). From a sectoral perspective our order of preference is rate sensitives followed by domestic cyclicals, exporters and domestic consumption. Predominantly regulated businesses come last in our pecking order. This preference is dictated by our assessment of sectors / segments leading contribution to the market earnings growth over the next 2-3 years. Our portfolio construction is driven by a bottom up approach to stock selection with a focus on names that can deliver positive earnings surprises. We continue to focus on this theme to identify likely outperformers.
*Source: Bloomberg
DEBT OUTLOOk
Market drivers during the course of the year FY21
The Fixed Income markets started the year with a bout of nervousness that was triggered by the pandemic. While RBI had calmed the markets with its large rate cut action of 75bp cut followed by liquidity supportive measures, the volatility continued until mid-May when government announced its relief package. While it was not fiscally expansive, it touched the right cords in terms of credit flow to desired sectors. This was followed up with RBI’s credit relief measures in terms of moratorium and restructuring of assets that were stressed due to the pandemic. Throughout the course of the year, RBI maintained its accommodative stance along with significant amount of surplus liquidity that was supportive and helped in maintaining stability in the market. However, as the year progressed and pressure on fiscal began to mount yields started seeing a spike towards the last quarter of the fiscal. While borrowing was stepped up to INR 12 trillion from previously budgeted INR 7.8 trillion in May 2020, it was further enhanced by and additional INR 1.1 trillion in October 2020. Overall GOI ended up borrowing a record amount of INR 13.9 trillion. The budget proved to be a shocker with GOI using the pandemic as an opportunity for setting the finances in order. GOI showed a record deficit of 9.5% for FY21 and projected a 6.8% for FY22 with estimated central government gross borrowing of INR 12 trillion. This seemed to reverse the support RBI had provided throughout the year with benchmark 10-year bond peaking to 6.23% in mid –Feb 2021. RBI’s statements to remain supportive were left in the sidelines. Overall it seemed that the 115bp of rate cut, along with significant liquidity infusion (OMO + Twist operations of ~INR 3 trillion, infusion via dollar purchases) seemed only a little to help in applying a brake to the one-way spike in yields. The year closed ~6.16% with absence of concrete action by RBI.
RBI Policy: Through the course of the year, RBI has maintained an accommodative stance, with an aggregate 115bp of rate cut done in March and May 2020 taking the repo rate from 5.15% to 4%. Subsequently while inflation pressures prevented RBI from taking any direct actions, RBI has used a combination of creative tools to keep the rates contained primarily via liquidity supportive tools such as OMOs, Twist Operations, Repo linked Term loans to needy sectors (LTROs, TLTROs), CRR cuts. While inflation was a worry for most part of the year, RBI kept it aside admitting that growth was a priority and inflation effects are more supply side rather than demand side. Prospectively into FY22, with the onset of the second wave, RBI continues to maintain the stance to prioritize growth.
Inflation: Inflation for most part of the year stayed above 6% primarily driven by supply side pressures and some intermittent spike from food inflation as well. While it has been coming off since December with cooling off of food inflation and positive base effects, it has been between 4- 5.5%. Structurally however inflation risks continue to remain as oil prices have increased and base effects will not remain supportive for long. Core inflation continues to remain sticky.
Trustees’ ReportFor the year ended March 31, 2021 (Contd...)
7
HSBC Equity Hybrid Fund
Liquidity: During the year, system liquidity has remained at significant surplus facilitated largely by RBI action such as OMOs, foreign exchange operations and government spending.
Budget: The FY2022 union budget focuses on growth and has accordingly, presented a 9.5% fiscal deficit for FY21 and 6.8% for FY22. On the revenue side, the assumptions are largely realistic, with FY22 (E) Nominal GDP growth at 14.4% and tax revenue growth at 17% considering the pandemic impact in FY 21. Compared to FY20, tax revenue growth is ~10%. While non-tax revenues are ambitious pegging the divestment at INR 1.75 trillion, with robust pipeline of assets including monetization of road and transmission assets, execution remains the key as in the past. On the expenditure side, better quality capex spending with focusing on rail, road, defense, urban infra is positive for long term structural growth. The revenue side expenditure adjusting for clearance of past subsidy arrears will be similar to budgetary estimates. Government using this opportunity to bring back off-balance sheet spending to on-balance sheet was a welcome move towards transparency and showing realistic projections. Alongside, states have also been given leeway to borrow upto 4% of their GDP with an additional 0.5% subject to conditions. Given that states are an important vehicle for capex investment, this move is welcome although it may entail additional state borrowing. The fiscal glide path is shifted to FY26 at below 4.5% for center and 3% for states suggesting that spending will continue and borrowing will come down gradually. In summary, from survival to revival, FY22 budget aims for structural growth leaving fiscal concerns sideways in the interim. Government’s intent seems clear on bringing back growth on the table, in a transparent manner.
While the second wave of the pandemic has once again derailed the revenue story, government will still have some cushion from its conservative estimates.
Currency and FII Flows: INR has been on an appreciation trajectory for most part of the year, aided by dollar underperformance supported by positive FII and FDI flows along with reduced imports on the domestic front as well. RBI has used most of the flows to accumulate reserves which has prevented any strong appreciation. Pandemic shock and global risk off led rupee over 75 in the beginning of the year only to close below 72 at the end of the fiscal year. While the second wave led to another spike in INR in April, it has since then cooled once again driven by dollar underperformance and pandemic recovery on the domestic front. Net FII flows was ~$30 bn with positive equity flows of~$37 bn while debt was negative ~$7bn and overall RBI’s forex reserves rose by a ~$100 bn to close ~$537 bn.
Credit growth: Credit growth for the entire year has been tepid as previous year’s credit events were followed by nervousness relating to the pandemic. Despite RBI opening up several windows to finance the non-AAA segment, there was very little fresh credit flowing that segment. Overall banking credit grew by only 6.5%. Risk appetite has however been improving from a complete risk aversion to opening up towards a calculated risk. Prospectively it is expected that once the pandemic risk abates, credit growth will resume primarily driven by government capex spending and demand recovery.
Market Outlook
The pandemic once again brought the country to a situation similar to last year and debt markets perhaps interpreted the same as a structural rise in rates. In the initial day’s post budget in Feb of 2021, market was expecting a concrete set of actions such as an OMO calendar from RBI, and RBI’s words alone failed to calm the market. The first auction of the fiscal year also saw a devolvement. However, RBI acted in the first policy of the year announcing a bond buyback program akin to QE (quantitative easing) and its subsequent cancellation of auctions wherein yields were perhaps quoted higher than RBI’s comfort levels brought back confidence into the market. Since then we have seen a strong rally with 10-year benchmark trending below 6% and the curve moving alongside. RBI reiteration of priority of growth and also supporting with higher than expected dividend payment stand out as a testimony of its support. While we do not expect RBI to act in terms of rate cuts, we believe that measures such as G-SAP, OMOs will continue until there is visibility of a structural growth. Therefore, the large borrowing program should go without any hiccups.
Furthermore, with the evidence of strong GST numbers until April 2021 (before the 2nd wave), it is expected that growth and therefore fiscal revenues will come back. Government’s conservative budget estimates are supportive. Also, given the fact that compared to last year there has not been a complete shutdown of activity (lockdowns being distributed), the impact on growth will not be similar to last year. Pent up demand will come back to support revenue collection. However, on the flipside, once growth resumes RBI will be forced
Trustees’ ReportFor the year ended March 31, 2021 (Contd...)
8
Abridged Annual Report 2020 - 2021
to withdraw liquidity in a phased manner to prevent asset bubbles. Nevertheless, RBI need not act in terms of rate actions and we believe that a prolonged pause in terms of RBI rates is in the offing.
Net-net therefore while growth is wanting no matter what, it may come at a small price of rise in yields with liquidity withdrawal. That is however expected more in the 2nd half of the year. Lower than expected borrowing numbers, later this year or if not in next year could be a surprise. We may therefore see a range bound rate action in the near term with a rising bias over time. Global rate environment, oil and currency risks are to be watched out for.
2. BRIEF BACkGROUND OF SPONSORS, BOARD OF TRUSTEES AND ASSET MANAGEMENT COMPANY
a. Sponsor
HSBC Mutual Fund is sponsored by HSBC Securities and Capital Markets (India) Private Limited (HSCI). The Sponsor is the Settler of the Mutual Fund Trust. The Sponsor has entrusted a sum of Rs. 1,00,000/- (Rupees One Lakh only) to the Trustee as the initial contribution towards the corpus of the Mutual Fund.
HSCI offers integrated investment banking services, securities and corporate finance & advisory. HSCI is a member of the Bombay Stock Exchange Limited and National Stock Exchange (capital and derivative market segments). HSCI holds 100% of the paid up equity share capital of HSBC Asset Management (India) Private Limited.
b. HSBC Mutual Fund
HSBC Mutual Fund (“the Mutual Fund” or “the Fund”) has been constituted as a Trust in accordance with the provisions of the Indian Trusts Act, 1882 (2 of 1882) vide a Trust Deed dated February 7, 2002 with HSBC Securities and Capital Markets (India) Private Limited, as the Sponsor and the Board of Individual Trustees. The Trustee has entered into an Investment Management Agreement dated February 7, 2002 with HSBC Asset Management (India) Private Limited (AMC) to function as the Investment Manager for all the schemes of the Fund. The Fund was registered with SEBI vide registration number MF/046/02/5 dated May 27, 2002.
The Trust has been formed for the purpose of pooling of capital from the public for collective investment in securities for the purpose of providing facilities for participation by persons as beneficiaries in such investments and in the profits/income arising therefrom.
c. Board of Trustees (the Trustees)
The Board of Trustees is the exclusive owner of the Trust Fund and holds the same in trust for the benefit of the unit holders. The Trustees have been discharging their duties and carrying out the responsibilities as provided in the SEBI (Mutual Funds) Regulations, 1996 and the Trust Deed. The Trustees seek to ensure that the Fund and the schemes floated there under are managed by the AMC in accordance with the Trust Deed, the said Regulations, directions and guidelines issued by the SEBI, the Stock Exchanges, the Association of Mutual Funds in India and other regulatory agencies.
d. Asset Management Company (the AMC)
HSBC Asset Management (India) Private Limited (the Investment Manager or the AMC) is a private limited company incorporated under the Companies Act, 1956 on December 12, 2001 having its Registered Office at 16, V. N. Road, Fort, Mumbai 400 001. HSBC Asset Management (India) Private Limited has been appointed as the Asset Management Company of HSBC Mutual Fund by the Trustee vide Investment Management Agreement (IMA) dated February 7, 2002 and executed between the Trustees and the AMC. SEBI approved the AMC to act as the Investment Manager of the Fund vide its letter No. MFD/BC/163/2002 dated May 27, 2002. The paid-up equity share capital of the AMC is Rs. 61.59 crores. The AMC is registered as a Portfolio Manager under the SEBI (Portfolio Managers) Regulations, 1993 vide registration no. INP000001322. The AMC also offers non-binding Advisory services to offshore funds under the mutual fund license.
HSBC Securities and Capital Markets (India) Private Limited holds 100% of the paid up equity share capital of the AMC.
Trustees’ ReportFor the year ended March 31, 2021 (Contd...)

9
HSBC Equity Hybrid Fund
Trustees’ ReportFor the year ended March 31, 2021 (Contd...)
3. INvESTMENT OBJECTIvE OF THE SCHEMESThe investment objective of the respective schemes has been provided above under the heading “Scheme Performance, Future Outlook and Operation of the Scheme” (Refer Section 1).
4. SIGNIFICANT ACCOUNTING POLICIES The Significant Accounting Policies form part of the Notes to the Accounts annexed to the Balance Sheet of the Schemes in the Full Annual Report. The accounting policies are in accordance with Securities Exchange Board of India (Mutual Funds) Regulations 1996.
5. UNCLAIMED DIvIDENDS & REDEMPTIONSSummary of number of investors & corresponding amount as on March 31, 2021:
Nil.
6. INvESTOR SERvICES
The number of official points of acceptance of transactions is 204 locations. In addition to the offices of the Registrar & Transfer agents, the AMC has Investor Service Centers in 9 locations at its own offices - namely Mumbai, New Delhi, Kolkata, Bangalore, Pune, Ahmedabad, Hyderabad, Chandigarh and Chennai. With a view to enhance customer convenience, the AMC has the facility of priority based servicing to key distributors through the enhancement of the Interactive Voice Reponses. The AMC has 2 Toll Free numbers (1-800-200-2434 /1-800-258-2434) which can be dialed from anywhere in India and 1 number i.e +91 44 39923900 (Investors calling from abroad). The call center service is being managed by the Registrar and Transfer Agents. Transactions for purchase / redemption of units in the schemes HSBC Mutual Fund can also be made through the online transaction facility on the AMC’s website at https://invest.assetmanagement.hsbc.co.in.
On the distribution front, the number of empaneled distributors was 1069 as on March 31, 2021. During the year, the AMC initiated tie-ups for online distribution of the Mutual Fund’s schemes with several channel partners taking the total number of such tie-ups to 52.
7. DETAILS OF INvESTOR GRIEvANCE REDRESSAL
The details of the redressal of investor complaints received against HSBC Mutual Fund during April 2020 - March 2021 are as follows:
2020-2021Com-plaint Code
Type of complaint# (a) No. of complaints pending at the begin-ning of the
year
(b) No. of Com-
plaints received during
the year
Action on (a) and (b)
Resolved Non Action-
able
Pending
Within 30
days
30 - 60 days
60 - 180 days
Beyond 180 days
0 - 3 months
3 - 6 months
6 - 9 months
9 - 12 months
I A Non receipt of Dividend on Units
0 0 0 0 0 0 0 0 0 0 0
I B Interest on delayed payment of Dividend
0 0 0 0 0 0 0 0 0 0 0
I C Non receipt of Redemption Proceeds
0 8 7 0 0 0 0 1 0 0 0
I D Interest on delayed payment of Redemption
0 0 0 0 0 0 0 0 0 0 0
II A Non receipt of Statement of Account / Unit Certificate
0 0 0 0 0 0 0 0 0 0 0
II B Discrepancy in Statement of Account
0 1 1 0 0 0 0 0 0 0 0
II C Data corrections in Investor details **
0 12 12 0 0 0 0 0 0 0 0
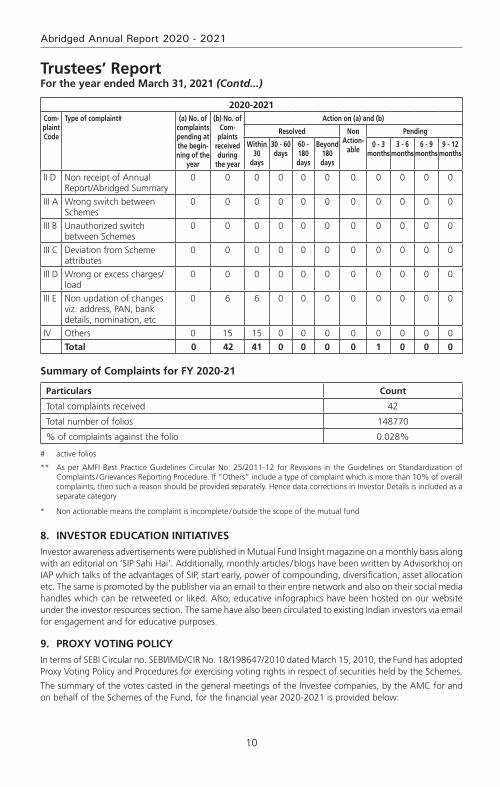
10
Abridged Annual Report 2020 - 2021
Trustees’ ReportFor the year ended March 31, 2021 (Contd...)
2020-2021Com-plaint Code
Type of complaint# (a) No. of complaints pending at the begin-ning of the
year
(b) No. of Com-
plaints received during
the year
Action on (a) and (b)
Resolved Non Action-
able
Pending
Within 30
days
30 - 60 days
60 - 180 days
Beyond 180 days
0 - 3 months
3 - 6 months
6 - 9 months
9 - 12 months
II D Non receipt of Annual Report/Abridged Summary
0 0 0 0 0 0 0 0 0 0 0
III A Wrong switch between Schemes
0 0 0 0 0 0 0 0 0 0 0
III B Unauthorized switch between Schemes
0 0 0 0 0 0 0 0 0 0 0
III C Deviation from Scheme attributes
0 0 0 0 0 0 0 0 0 0 0
III D Wrong or excess charges/load
0 0 0 0 0 0 0 0 0 0 0
III E Non updation of changes viz. address, PAN, bank details, nomination, etc
0 6 6 0 0 0 0 0 0 0 0
IV Others 0 15 15 0 0 0 0 0 0 0 0
Total 0 42 41 0 0 0 0 1 0 0 0
Summary of Complaints for FY 2020-21
Particulars Count
Total complaints received 42
Total number of folios 148770
% of complaints against the folio 0.028%
# active folios
** As per AMFI Best Practice Guidelines Circular No. 25/2011-12 for Revisions in the Guidelines on Standardization of Complaints / Grievances Reporting Procedure. If “Others” include a type of complaint which is more than 10% of overall complaints, then such a reason should be provided separately. Hence data corrections in Investor Details is included as a separate category
* Non actionable means the complaint is incomplete / outside the scope of the mutual fund
8. INvESTOR EDUCATION INITIATIvES
Investor awareness advertisements were published in Mutual Fund Insight magazine on a monthly basis along with an editorial on ‘SIP Sahi Hai’. Additionally, monthly articles / blogs have been written by Advisorkhoj on IAP which talks of the advantages of SIP, start early, power of compounding, diversification, asset allocation etc. The same is promoted by the publisher via an email to their entire network and also on their social media handles which can be retweeted or liked. Also, educative infographics have been hosted on our website under the investor resources section. The same have also been circulated to existing Indian investors via email for engagement and for educative purposes.
9. PROxY vOTING POLICY
In terms of SEBI Circular no. SEBI/IMD/CIR No. 18/198647/2010 dated March 15, 2010, the Fund has adopted Proxy Voting Policy and Procedures for exercising voting rights in respect of securities held by the Schemes.
The summary of the votes casted in the general meetings of the Investee companies, by the AMC for and on behalf of the Schemes of the Fund, for the financial year 2020-2021 is provided below:
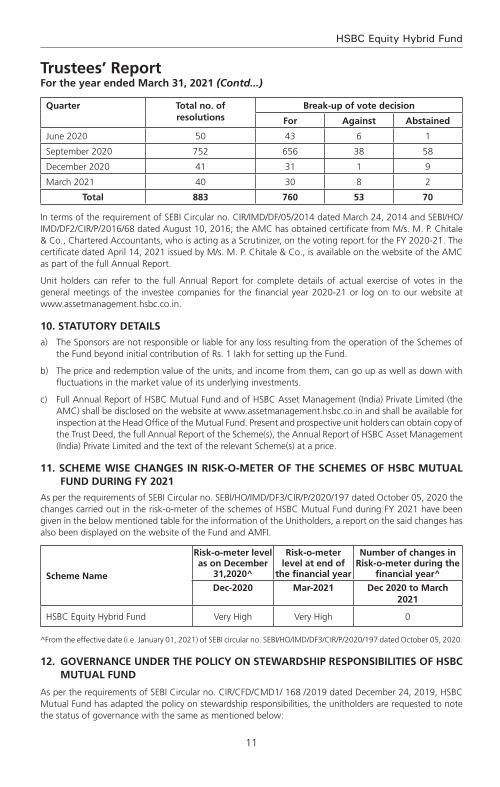
11
HSBC Equity Hybrid Fund
Trustees’ ReportFor the year ended March 31, 2021 (Contd...)
quarter Total no. of resolutions
Break-up of vote decision
For Against Abstained
June 2020 50 43 6 1
September 2020 752 656 38 58
December 2020 41 31 1 9
March 2021 40 30 8 2
Total 883 760 53 70
In terms of the requirement of SEBI Circular no. CIR/IMD/DF/05/2014 dated March 24, 2014 and SEBI/HO/IMD/DF2/CIR/P/2016/68 dated August 10, 2016; the AMC has obtained certificate from M/s. M. P. Chitale & Co., Chartered Accountants, who is acting as a Scrutinizer, on the voting report for the FY 2020-21. The certificate dated April 14, 2021 issued by M/s. M. P. Chitale & Co., is available on the website of the AMC as part of the full Annual Report.
Unit holders can refer to the full Annual Report for complete details of actual exercise of votes in the general meetings of the investee companies for the financial year 2020-21 or log on to our website at www.assetmanagement.hsbc.co.in.
10. STATUTORY DETAILS
a) The Sponsors are not responsible or liable for any loss resulting from the operation of the Schemes of the Fund beyond initial contribution of Rs. 1 lakh for setting up the Fund.
b) The price and redemption value of the units, and income from them, can go up as well as down with fluctuations in the market value of its underlying investments.
c) Full Annual Report of HSBC Mutual Fund and of HSBC Asset Management (India) Private Limited (the AMC) shall be disclosed on the website at www.assetmanagement.hsbc.co.in and shall be available for inspection at the Head Office of the Mutual Fund. Present and prospective unit holders can obtain copy of the Trust Deed, the full Annual Report of the Scheme(s), the Annual Report of HSBC Asset Management (India) Private Limited and the text of the relevant Scheme(s) at a price.
11. SCHEME WISE CHANGES IN RISk-O-METER OF THE SCHEMES OF HSBC MUTUAL FUND DURING FY 2021
As per the requirements of SEBI Circular no. SEBI/HO/IMD/DF3/CIR/P/2020/197 dated October 05, 2020 the changes carried out in the risk-o-meter of the schemes of HSBC Mutual Fund during FY 2021 have been given in the below mentioned table for the information of the Unitholders, a report on the said changes has also been displayed on the website of the Fund and AMFI.
Scheme Name
Risk-o-meter level as on December
31,2020^
Risk-o-meter level at end of
the financial year
Number of changes in Risk-o-meter during the
financial year^
Dec-2020 Mar-2021 Dec 2020 to March 2021
HSBC Equity Hybrid Fund Very High Very High 0
^From the effective date (i.e. January 01, 2021) of SEBI circular no. SEBI/HO/IMD/DF3/CIR/P/2020/197 dated October 05, 2020.
12. GOvERNANCE UNDER THE POLICY ON STEWARDSHIP RESPONSIBILITIES OF HSBC MUTUAL FUND
As per the requirements of SEBI Circular no. CIR/CFD/CMD1/ 168 /2019 dated December 24, 2019, HSBC Mutual Fund has adapted the policy on stewardship responsibilities, the unitholders are requested to note the status of governance with the same as mentioned below:
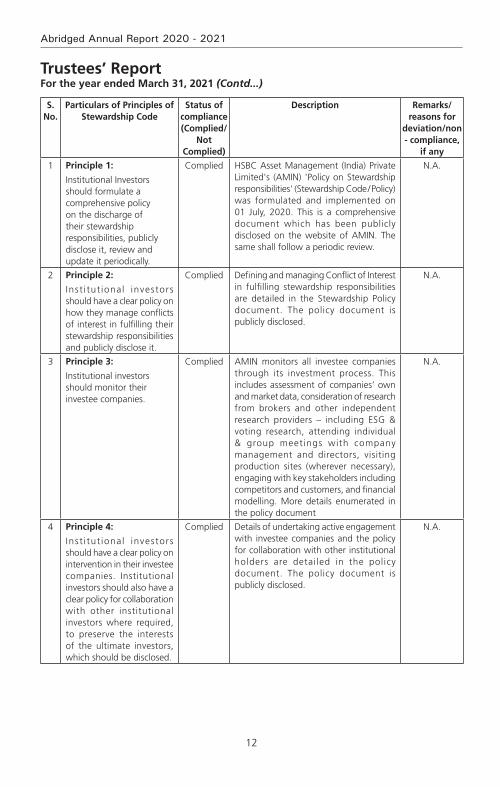
12
Abridged Annual Report 2020 - 2021
S. No.
Particulars of Principles of Stewardship Code
Status of compliance (Complied/
Not Complied)
Description Remarks/reasons for
deviation/non - compliance,
if any
1 Principle 1:
Institutional Investors should formulate a comprehensive policy on the discharge of their stewardship responsibilities, publicly disclose it, review and update it periodically.
Complied HSBC Asset Management (India) Private Limited's (AMIN) 'Policy on Stewardship responsibilities' (Stewardship Code / Policy) was formulated and implemented on 01 July, 2020. This is a comprehensive document which has been publicly disclosed on the website of AMIN. The same shall follow a periodic review.
N.A.
2 Principle 2:
Inst i tut ional investors should have a clear policy on how they manage conflicts of interest in fulfilling their stewardship responsibilities and publicly disclose it.
Complied Defining and managing Conflict of Interest in fulfilling stewardship responsibilities are detailed in the Stewardship Policy document. The policy document is publicly disclosed.
N.A.
3 Principle 3:
Institutional investors should monitor their investee companies.
Complied AMIN monitors all investee companies through its investment process. This includes assessment of companies’ own and market data, consideration of research from brokers and other independent research providers – including ESG & voting research, attending individual & group meetings with company management and directors, visiting production sites (wherever necessary), engaging with key stakeholders including competitors and customers, and financial modelling. More details enumerated in the policy document
N.A.
4 Principle 4:
Inst i tut ional investors should have a clear policy on intervention in their investee companies. Institutional investors should also have a clear policy for collaboration with other institutional investors where required, to preserve the interests of the ultimate investors, which should be disclosed.
Complied Details of undertaking active engagement with investee companies and the policy for collaboration with other institutional holders are detailed in the policy document. The policy document is publicly disclosed.
N.A.
Trustees’ ReportFor the year ended March 31, 2021 (Contd...)
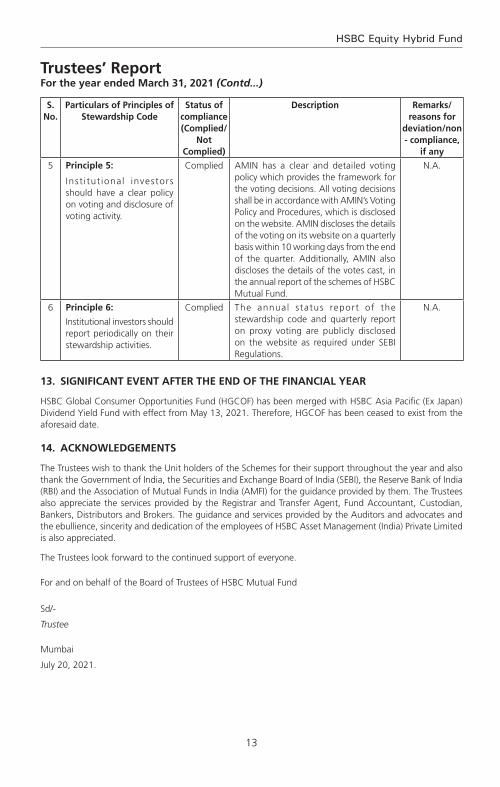
13
HSBC Equity Hybrid Fund
S. No.
Particulars of Principles of Stewardship Code
Status of compliance (Complied/
Not Complied)
Description Remarks/reasons for
deviation/non - compliance,
if any
5 Principle 5:
Inst i tut ional investors should have a clear policy on voting and disclosure of voting activity.
Complied AMIN has a clear and detailed voting policy which provides the framework for the voting decisions. All voting decisions shall be in accordance with AMIN’s Voting Policy and Procedures, which is disclosed on the website. AMIN discloses the details of the voting on its website on a quarterly basis within 10 working days from the end of the quarter. Additionally, AMIN also discloses the details of the votes cast, in the annual report of the schemes of HSBC Mutual Fund.
N.A.
6 Principle 6:
Institutional investors should report periodically on their stewardship activities.
Complied The annual status report of the stewardship code and quarterly report on proxy voting are publicly disclosed on the website as required under SEBI Regulations.
N.A.
13. SIGNIFICANT EvENT AFTER THE END OF THE FINANCIAL YEAR
HSBC Global Consumer Opportunities Fund (HGCOF) has been merged with HSBC Asia Pacific (Ex Japan) Dividend Yield Fund with effect from May 13, 2021. Therefore, HGCOF has been ceased to exist from the aforesaid date.
14. ACkNOWLEDGEMENTS
The Trustees wish to thank the Unit holders of the Schemes for their support throughout the year and also thank the Government of India, the Securities and Exchange Board of India (SEBI), the Reserve Bank of India (RBI) and the Association of Mutual Funds in India (AMFI) for the guidance provided by them. The Trustees also appreciate the services provided by the Registrar and Transfer Agent, Fund Accountant, Custodian, Bankers, Distributors and Brokers. The guidance and services provided by the Auditors and advocates and the ebullience, sincerity and dedication of the employees of HSBC Asset Management (India) Private Limited is also appreciated.
The Trustees look forward to the continued support of everyone.
For and on behalf of the Board of Trustees of HSBC Mutual Fund
Sd/-
Trustee
Mumbai
July 20, 2021.
Trustees’ ReportFor the year ended March 31, 2021 (Contd...)

14
Abridged Annual Report 2020 - 2021
To the Trustees of HSBC Mutual Fund
HSBC Equity Hybrid Fund
Report on the Audit of the Financial Statements
Opinion
We have audited the financial statements of HSBC Equity Hybrid Fund (the ‘Scheme’) of HSBC Mutual Fund, which comprise the balance sheet as at 31 March 2021 and the revenue account for the year then ended, and notes to the financial statements, including a summary of the significant accounting policies.
In our opinion and to the best of our information and according to the explanations given to us, the aforesaid financial statements give a true and fair view in conformity with the accounting principles generally accepted in India, of the state of affairs of the Scheme as at 31 March 2021, its net surplus for the year ended on that date.
Basis for Opinion
We conducted our audit in accordance with the Standards on Auditing (‘SAs’) issued by the Institute of Chartered Accountants of India (the ‘ICAI’). Our responsibilities under those SAs are further described in the Auditor’s Responsibilities for the Audit of the Financial Statements section of our report. We are independent of the Scheme in accordance with the Code of Ethics issued by the ICAI, and we have fulfilled our other ethical responsibilities in accordance with the Code of Ethics. We believe that the audit evidence we have obtained is sufficient and appropriate to provide a basis for our opinion.
Responsibilities of Management and Those Charged with Governance for the Financial Statements
The Scheme’s management, the Board of Directors of HSBC Mutual Fund (the ‘Trustees’) and the Board of Directors of HSBC Asset Management (India) Private Limited (the ‘AMC’) (collectively referred to as ‘Management’) are responsible for the preparation of these financial statements that give a true and fair view of the state of affairs, results of operations of the Scheme in accordance with the accounting policies and standards specified in the Ninth Schedule of the Securities and Exchange Board of India (Mutual Funds) Regulations, 1996, as amended (the ‘Regulations’) and the accounting principles generally accepted in India. This responsibility includes design, implementation and maintenance of internal control relevant to the preparation and presentation of the financial statements that give a true and fair view and are free from material misstatement, whether due to fraud or error.
In preparing the financial statements, management is responsible for assessing the Scheme’s ability to continue as a going concern, disclosing, as applicable, matters related to going concern and using the going concern basis of accounting unless management either intends to liquidate the Scheme or to cease operations, or has no realistic alternative but to do so.
The management is responsible for overseeing the Scheme’s financial reporting process.
Auditor’s Responsibilities for the Audit of the Financial Statements
Our objectives are to obtain reasonable assurance about whether the financial statements as a whole are free from material misstatement, whether due to fraud or error, and to issue an auditor’s report that includes our opinion. Reasonable assurance is a high level of assurance, but is not a guarantee that an audit conducted in accordance with SAs will always detect a material misstatement when it exists. Misstatements can arise from fraud or error and are considered material if, individually or in the aggregate, they could reasonably be expected to influence the economic decisions of users taken on the basis of these financial statements.
As part of an audit in accordance with SAs, we exercise professional judgment and maintain professional skepticism throughout the audit. We also:
• Identifyandassesstherisksofmaterialmisstatementofthefinancialstatements,whetherduetofraudor error, design and perform audit procedures responsive to those risks, and obtain audit evidence that is sufficient and appropriate to provide a basis for our opinion. The risk of not detecting a material
Independent Auditors’ Report
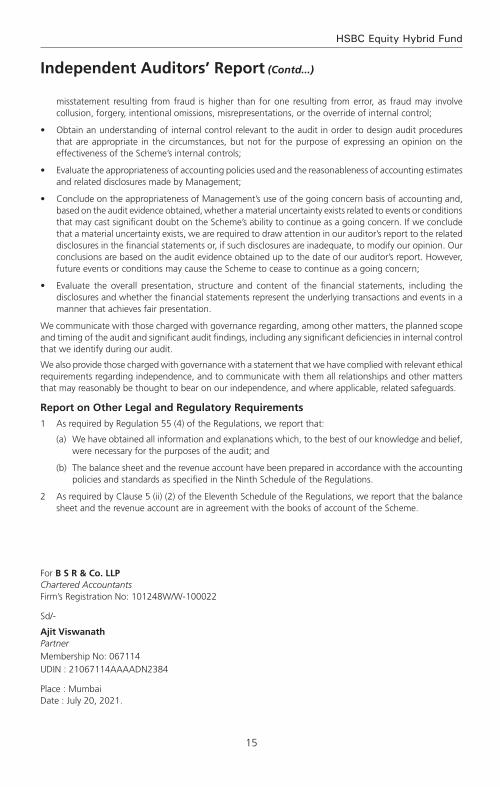
15
HSBC Equity Hybrid Fund
Independent Auditors’ Report (Contd...)
misstatement resulting from fraud is higher than for one resulting from error, as fraud may involve collusion, forgery, intentional omissions, misrepresentations, or the override of internal control;
• Obtainanunderstandingofinternalcontrolrelevanttotheauditinordertodesignauditproceduresthat are appropriate in the circumstances, but not for the purpose of expressing an opinion on the effectiveness of the Scheme’s internal controls;
• Evaluatetheappropriatenessofaccountingpoliciesusedandthereasonablenessofaccountingestimatesand related disclosures made by Management;
• ConcludeontheappropriatenessofManagement’suseofthegoingconcernbasisofaccountingand,based on the audit evidence obtained, whether a material uncertainty exists related to events or conditions that may cast significant doubt on the Scheme’s ability to continue as a going concern. If we conclude that a material uncertainty exists, we are required to draw attention in our auditor’s report to the related disclosures in the financial statements or, if such disclosures are inadequate, to modify our opinion. Our conclusions are based on the audit evidence obtained up to the date of our auditor’s report. However, future events or conditions may cause the Scheme to cease to continue as a going concern;
• Evaluate the overall presentation, structure and content of the financial statements, including thedisclosures and whether the financial statements represent the underlying transactions and events in a manner that achieves fair presentation.
We communicate with those charged with governance regarding, among other matters, the planned scope and timing of the audit and significant audit findings, including any significant deficiencies in internal control that we identify during our audit.
We also provide those charged with governance with a statement that we have complied with relevant ethical requirements regarding independence, and to communicate with them all relationships and other matters that may reasonably be thought to bear on our independence, and where applicable, related safeguards.
Report on Other Legal and Regulatory Requirements
1 As required by Regulation 55 (4) of the Regulations, we report that:
(a) We have obtained all information and explanations which, to the best of our knowledge and belief, were necessary for the purposes of the audit; and
(b) The balance sheet and the revenue account have been prepared in accordance with the accounting policies and standards as specified in the Ninth Schedule of the Regulations.
2 As required by Clause 5 (ii) (2) of the Eleventh Schedule of the Regulations, we report that the balance sheet and the revenue account are in agreement with the books of account of the Scheme.
For B S R & Co. LLP Chartered Accountants Firm’s Registration No: 101248W/W-100022
Sd/-
Ajit Viswanath PartnerMembership No: 067114UDIN : 21067114AAAADN2384
Place : Mumbai Date : July 20, 2021.
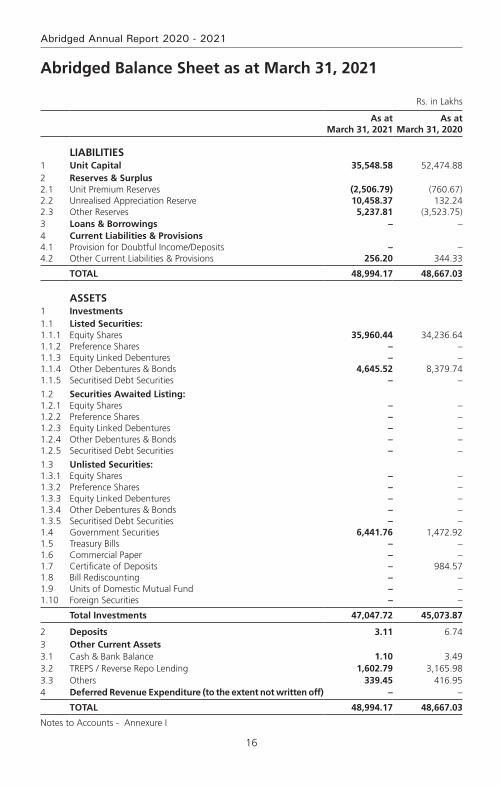
16
Abridged Annual Report 2020 - 2021
Rs. in Lakhs
As at March 31, 2021
As at March 31, 2020
LIABILITIES1 Unit Capital 35,548.58 52,474.88 2 Reserves & Surplus2.1 Unit Premium Reserves (2,506.79) (760.67)2.2 Unrealised Appreciation Reserve 10,458.37 132.24 2.3 Other Reserves 5,237.81 (3,523.75)3 Loans & Borrowings – –4 Current Liabilities & Provisions4.1 Provision for Doubtful Income/Deposits – – 4.2 Other Current Liabilities & Provisions 256.20 344.33
TOTAL 48,994.17 48,667.03
ASSETS1 Investments1.1 Listed Securities:1.1.1 Equity Shares 35,960.44 34,236.64 1.1.2 Preference Shares – – 1.1.3 Equity Linked Debentures – – 1.1.4 Other Debentures & Bonds 4,645.52 8,379.74 1.1.5 Securitised Debt Securities – –
1.2 Securities Awaited Listing:1.2.1 Equity Shares – – 1.2.2 Preference Shares – – 1.2.3 Equity Linked Debentures – – 1.2.4 Other Debentures & Bonds – – 1.2.5 Securitised Debt Securities – –
1.3 Unlisted Securities:1.3.1 Equity Shares – – 1.3.2 Preference Shares – – 1.3.3 Equity Linked Debentures – – 1.3.4 Other Debentures & Bonds – – 1.3.5 Securitised Debt Securities – – 1.4 Government Securities 6,441.76 1,472.92 1.5 Treasury Bills – – 1.6 Commercial Paper – – 1.7 Certificate of Deposits – 984.57 1.8 Bill Rediscounting – – 1.9 Units of Domestic Mutual Fund – – 1.10 Foreign Securities – –
Total Investments 47,047.72 45,073.87
2 Deposits 3.11 6.74 3 Other Current Assets3.1 Cash & Bank Balance 1.10 3.49 3.2 TREPS / Reverse Repo Lending 1,602.79 3,165.98 3.3 Others 339.45 416.95 4 Deferred Revenue Expenditure (to the extent not written off) – –
TOTAL 48,994.17 48,667.03
Notes to Accounts - Annexure I
Abridged Balance Sheet as at March 31, 2021
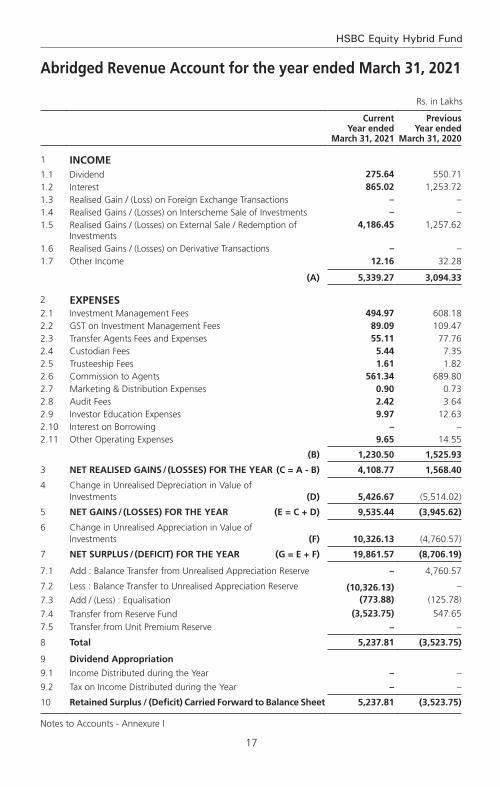
17
HSBC Equity Hybrid Fund
Abridged Revenue Account for the year ended March 31, 2021
Rs. in Lakhs
Current Year ended
March 31, 2021
Previous Year ended
March 31, 2020
1 INCOME1.1 Dividend 275.64 550.71 1.2 Interest 865.02 1,253.72 1.3 Realised Gain / (Loss) on Foreign Exchange Transactions – – 1.4 Realised Gains / (Losses) on Interscheme Sale of Investments – – 1.5 Realised Gains / (Losses) on External Sale / Redemption of
Investments 4,186.45 1,257.62
1.6 Realised Gains / (Losses) on Derivative Transactions – – 1.7 Other Income 12.16 32.28
(A) 5,339.27 3,094.33
2 ExPENSES2.1 Investment Management Fees 494.97 608.18 2.2 GST on Investment Management Fees 89.09 109.47 2.3 Transfer Agents Fees and Expenses 55.11 77.76 2.4 Custodian Fees 5.44 7.35 2.5 Trusteeship Fees 1.61 1.82 2.6 Commission to Agents 561.34 689.80 2.7 Marketing & Distribution Expenses 0.90 0.73 2.8 Audit Fees 2.42 3.64 2.9 Investor Education Expenses 9.97 12.63 2.10 Interest on Borrowing – – 2.11 Other Operating Expenses 9.65 14.55
(B) 1,230.50 1,525.93
3 NET REALISED GAINS / (LOSSES) FOR THE YEAR (C = A - B) 4,108.77 1,568.40
4 Change in Unrealised Depreciation in Value of Investments (D) 5,426.67 (5,514.02)
5 NET GAINS / (LOSSES) FOR THE YEAR (E = C + D) 9,535.44 (3,945.62)
6 Change in Unrealised Appreciation in Value of Investments (F) 10,326.13 (4,760.57)
7 NET SURPLUS / (DEFICIT) FOR THE YEAR (G = E + F) 19,861.57 (8,706.19)
7.1 Add : Balance Transfer from Unrealised Appreciation Reserve – 4,760.57
7.2 Less : Balance Transfer to Unrealised Appreciation Reserve (10,326.13) –
7.3 Add / (Less) : Equalisation (773.88) (125.78)
7.4 Transfer from Reserve Fund (3,523.75) 547.65
7.5 Transfer from Unit Premium Reserve – –
8 Total 5,237.81 (3,523.75)
9 Dividend Appropriation
9.1 Income Distributed during the Year – –
9.2 Tax on Income Distributed during the Year – –
10 Retained Surplus / (Deficit) Carried Forward to Balance Sheet 5,237.81 (3,523.75)
Notes to Accounts - Annexure I
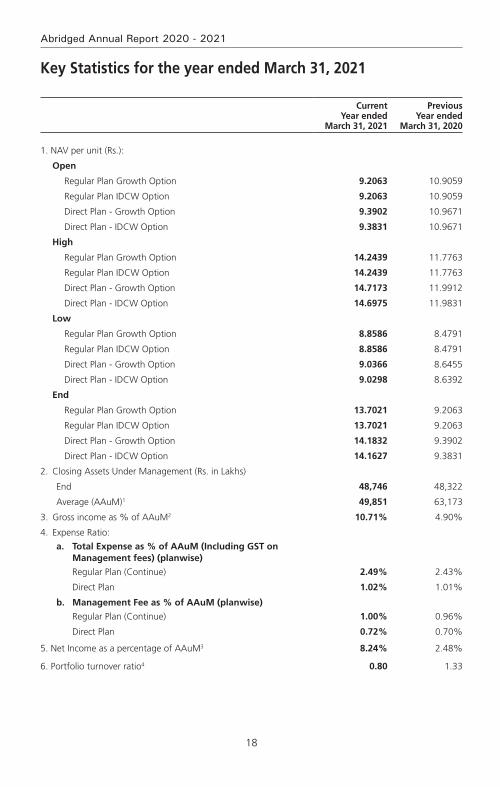
18
Abridged Annual Report 2020 - 2021
key Statistics for the year ended March 31, 2021
Current Year ended
March 31, 2021
Previous Year ended
March 31, 2020
1. NAV per unit (Rs.):
Open
Regular Plan Growth Option 9.2063 10.9059
Regular Plan IDCW Option 9.2063 10.9059
Direct Plan - Growth Option 9.3902 10.9671
Direct Plan - IDCW Option 9.3831 10.9671
High
Regular Plan Growth Option 14.2439 11.7763
Regular Plan IDCW Option 14.2439 11.7763
Direct Plan - Growth Option 14.7173 11.9912
Direct Plan - IDCW Option 14.6975 11.9831
Low
Regular Plan Growth Option 8.8586 8.4791
Regular Plan IDCW Option 8.8586 8.4791
Direct Plan - Growth Option 9.0366 8.6455
Direct Plan - IDCW Option 9.0298 8.6392
End
Regular Plan Growth Option 13.7021 9.2063
Regular Plan IDCW Option 13.7021 9.2063
Direct Plan - Growth Option 14.1832 9.3902
Direct Plan - IDCW Option 14.1627 9.3831
2. Closing Assets Under Management (Rs. in Lakhs)
End 48,746 48,322
Average (AAuM)1 49,851 63,173
3. Gross income as % of AAuM2 10.71% 4.90%
4. Expense Ratio:
a. Total Expense as % of AAuM (Including GST on Management fees) (planwise)
Regular Plan (Continue) 2.49% 2.43%
Direct Plan 1.02% 1.01%
b. Management Fee as % of AAuM (planwise)
Regular Plan (Continue) 1.00% 0.96%
Direct Plan 0.72% 0.70%
5. Net Income as a percentage of AAuM3 8.24% 2.48%
6. Portfolio turnover ratio4 0.80 1.33
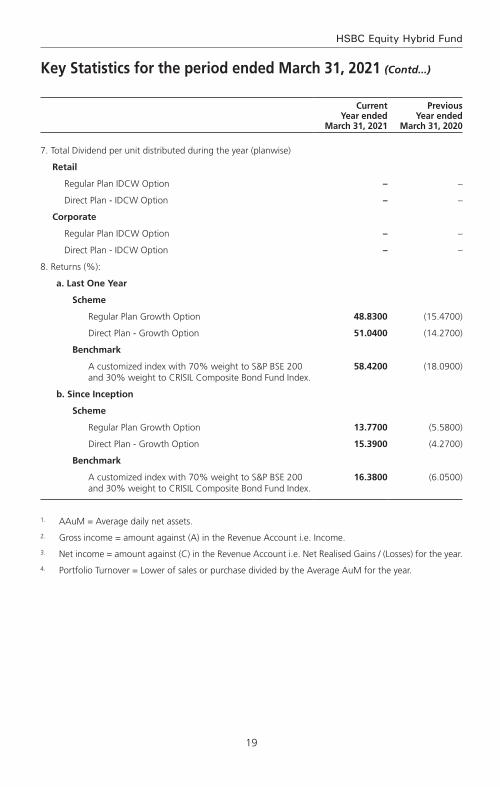
19
HSBC Equity Hybrid Fund
Current Year ended
March 31, 2021
Previous Year ended
March 31, 2020
7. Total Dividend per unit distributed during the year (planwise)
Retail
Regular Plan IDCW Option – –
Direct Plan - IDCW Option – –
Corporate
Regular Plan IDCW Option – –
Direct Plan - IDCW Option – –
8. Returns (%):
a. Last One Year
Scheme
Regular Plan Growth Option 48.8300 (15.4700)
Direct Plan - Growth Option 51.0400 (14.2700)
Benchmark
A customized index with 70% weight to S&P BSE 200 and 30% weight to CRISIL Composite Bond Fund Index.
58.4200 (18.0900)
b. Since Inception
Scheme
Regular Plan Growth Option 13.7700 (5.5800)
Direct Plan - Growth Option 15.3900 (4.2700)
Benchmark
A customized index with 70% weight to S&P BSE 200 and 30% weight to CRISIL Composite Bond Fund Index.
16.3800 (6.0500)
1. AAuM = Average daily net assets.
2. Gross income = amount against (A) in the Revenue Account i.e. Income.
3. Net income = amount against (C) in the Revenue Account i.e. Net Realised Gains / (Losses) for the year.
4. Portfolio Turnover = Lower of sales or purchase divided by the Average AuM for the year.
key Statistics for the period ended March 31, 2021 (Contd...)
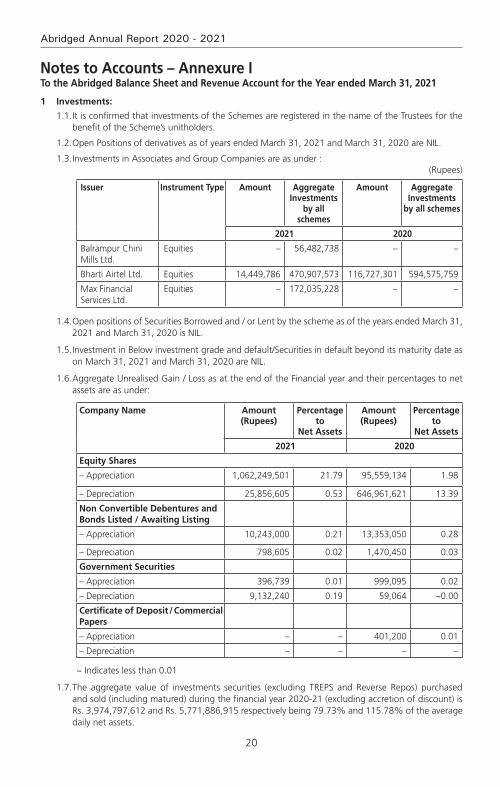
20
Abridged Annual Report 2020 - 2021
Notes to Accounts – Annexure ITo the Abridged Balance Sheet and Revenue Account for the Year ended March 31, 2021
1 Investments:
1.1. It is confirmed that investments of the Schemes are registered in the name of the Trustees for the benefit of the Scheme’s unitholders.
1.2. Open Positions of derivatives as of years ended March 31, 2021 and March 31, 2020 are NIL.
1.3. Investments in Associates and Group Companies are as under :(Rupees)
Issuer Instrument Type Amount Aggregate Investments
by all schemes
Amount Aggregate Investments
by all schemes
2021 2020
Balrampur Chini Mills Ltd.
Equities – 56,482,738 – –
Bharti Airtel Ltd. Equities 14,449,786 470,907,573 116,727,301 594,575,759
Max Financial Services Ltd.
Equities – 172,035,228 – –
1.4. Open positions of Securities Borrowed and / or Lent by the scheme as of the years ended March 31, 2021 and March 31, 2020 is NIL.
1.5. Investment in Below investment grade and default/Securities in default beyond its maturity date as on March 31, 2021 and March 31, 2020 are NIL.
1.6. Aggregate Unrealised Gain / Loss as at the end of the Financial year and their percentages to net assets are as under:
Company Name Amount (Rupees)
Percentage to
Net Assets
Amount (Rupees)
Percentage to
Net Assets
2021 2020
Equity Shares
– Appreciation 1,062,249,501 21.79 95,559,134 1.98
– Depreciation 25,856,605 0.53 646,961,621 13.39
Non Convertible Debentures and Bonds Listed / Awaiting Listing
– Appreciation 10,243,000 0.21 13,353,050 0.28
– Depreciation 798,605 0.02 1,470,450 0.03
Government Securities
– Appreciation 396,739 0.01 999,095 0.02
– Depreciation 9,132,240 0.19 59,064 ~0.00
Certificate of Deposit / Commercial Papers
– Appreciation – – 401,200 0.01
– Depreciation – – – –
~ Indicates less than 0.01
1.7. The aggregate value of investments securities (excluding TREPS and Reverse Repos) purchased and sold (including matured) during the financial year 2020-21 (excluding accretion of discount) is Rs. 3,974,797,612 and Rs. 5,771,886,915 respectively being 79.73% and 115.78% of the average daily net assets.
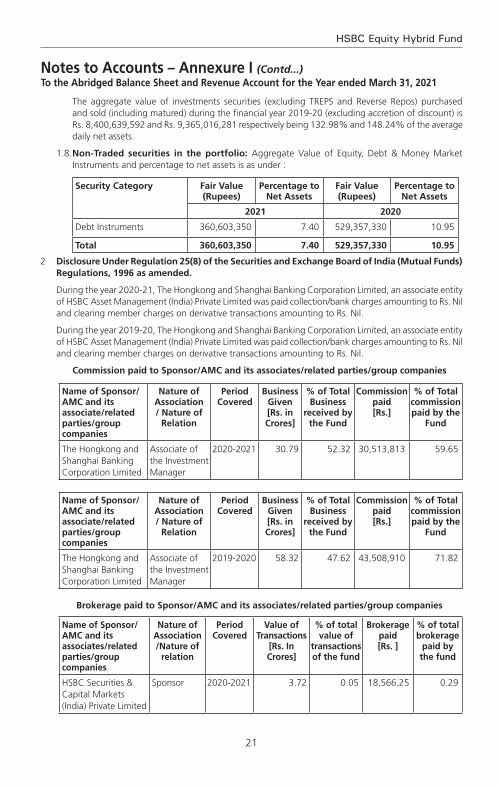
21
HSBC Equity Hybrid Fund
The aggregate value of investments securities (excluding TREPS and Reverse Repos) purchased and sold (including matured) during the financial year 2019-20 (excluding accretion of discount) is Rs. 8,400,639,592 and Rs. 9,365,016,281 respectively being 132.98% and 148.24% of the average daily net assets.
1.8. Non-Traded securities in the portfolio: Aggregate Value of Equity, Debt & Money Market Instruments and percentage to net assets is as under :
Security Category Fair value (Rupees)
Percentage to Net Assets
Fair value (Rupees)
Percentage to Net Assets
2021 2020
Debt Instruments 360,603,350 7.40 529,357,330 10.95
Total 360,603,350 7.40 529,357,330 10.95
2 Disclosure Under Regulation 25(8) of the Securities and Exchange Board of India (Mutual Funds) Regulations, 1996 as amended.
During the year 2020-21, The Hongkong and Shanghai Banking Corporation Limited, an associate entity of HSBC Asset Management (India) Private Limited was paid collection/bank charges amounting to Rs. Nil and clearing member charges on derivative transactions amounting to Rs. Nil.
During the year 2019-20, The Hongkong and Shanghai Banking Corporation Limited, an associate entity of HSBC Asset Management (India) Private Limited was paid collection/bank charges amounting to Rs. Nil and clearing member charges on derivative transactions amounting to Rs. Nil.
Commission paid to Sponsor/AMC and its associates/related parties/group companies
Name of Sponsor/AMC and its associate/related parties/group companies
Nature of Association / Nature of
Relation
Period Covered
Business Given [Rs. in Crores]
% of Total Business
received by the Fund
Commission paid [Rs.]
% of Total commission paid by the
Fund
The Hongkong and Shanghai Banking Corporation Limited
Associate of the Investment Manager
2020-2021 30.79 52.32 30,513,813 59.65
Name of Sponsor/AMC and its associate/related parties/group companies
Nature of Association / Nature of
Relation
Period Covered
Business Given [Rs. in Crores]
% of Total Business
received by the Fund
Commission paid [Rs.]
% of Total commission paid by the
Fund
The Hongkong and Shanghai Banking Corporation Limited
Associate of the Investment Manager
2019-2020 58.32 47.62 43,508,910 71.82
Brokerage paid to Sponsor/AMC and its associates/related parties/group companies
Name of Sponsor/AMC and its associates/related parties/group companies
Nature of Association /Nature of
relation
Period Covered
value of Transactions
[Rs. In Crores]
% of total value of
transactions of the fund
Brokerage paid [Rs. ]
% of total brokerage
paid by the fund
HSBC Securities & Capital Markets (India) Private Limited
Sponsor 2020-2021 3.72 0.05 18,566.25 0.29
Notes to Accounts – Annexure I (Contd...)To the Abridged Balance Sheet and Revenue Account for the Year ended March 31, 2021
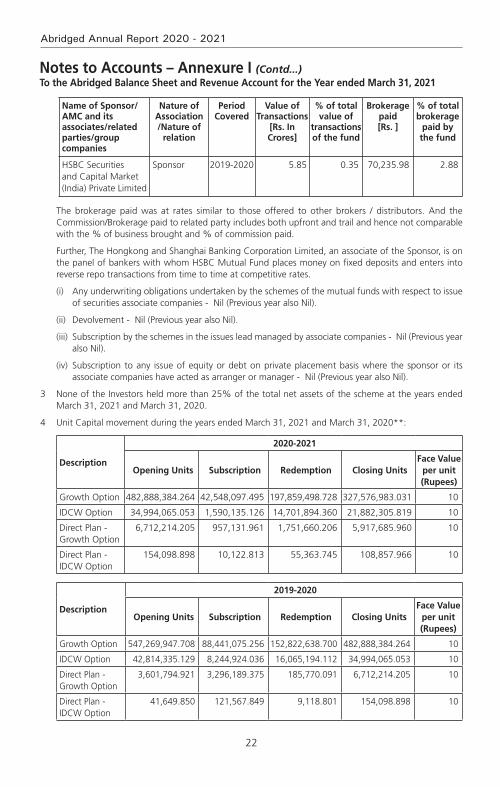
22
Abridged Annual Report 2020 - 2021
Name of Sponsor/AMC and its associates/related parties/group companies
Nature of Association /Nature of
relation
Period Covered
value of Transactions
[Rs. In Crores]
% of total value of
transactions of the fund
Brokerage paid [Rs. ]
% of total brokerage
paid by the fund
HSBC Securities and Capital Market (India) Private Limited
Sponsor 2019-2020 5.85 0.35 70,235.98 2.88
The brokerage paid was at rates similar to those offered to other brokers / distributors. And the Commission/Brokerage paid to related party includes both upfront and trail and hence not comparable with the % of business brought and % of commission paid.
Further, The Hongkong and Shanghai Banking Corporation Limited, an associate of the Sponsor, is on the panel of bankers with whom HSBC Mutual Fund places money on fixed deposits and enters into reverse repo transactions from time to time at competitive rates.
(i) Any underwriting obligations undertaken by the schemes of the mutual funds with respect to issue of securities associate companies - Nil (Previous year also Nil).
(ii) Devolvement - Nil (Previous year also Nil).
(iii) Subscription by the schemes in the issues lead managed by associate companies - Nil (Previous year also Nil).
(iv) Subscription to any issue of equity or debt on private placement basis where the sponsor or its associate companies have acted as arranger or manager - Nil (Previous year also Nil).
3 None of the Investors held more than 25% of the total net assets of the scheme at the years ended March 31, 2021 and March 31, 2020.
4 Unit Capital movement during the years ended March 31, 2021 and March 31, 2020**:
Description
2020-2021
Opening Units Subscription Redemption Closing UnitsFace value
per unit (Rupees)
Growth Option 482,888,384.264 42,548,097.495 197,859,498.728 327,576,983.031 10
IDCW Option 34,994,065.053 1,590,135.126 14,701,894.360 21,882,305.819 10
Direct Plan - Growth Option
6,712,214.205 957,131.961 1,751,660.206 5,917,685.960 10
Direct Plan - IDCW Option
154,098.898 10,122.813 55,363.745 108,857.966 10
Description
2019-2020
Opening Units Subscription Redemption Closing UnitsFace value
per unit (Rupees)
Growth Option 547,269,947.708 88,441,075.256 152,822,638.700 482,888,384.264 10
IDCW Option 42,814,335.129 8,244,924.036 16,065,194.112 34,994,065.053 10
Direct Plan - Growth Option
3,601,794.921 3,296,189.375 185,770.091 6,712,214.205 10
Direct Plan - IDCW Option
41,649.850 121,567.849 9,118.801 154,098.898 10
Notes to Accounts – Annexure I (Contd...)To the Abridged Balance Sheet and Revenue Account for the Year ended March 31, 2021
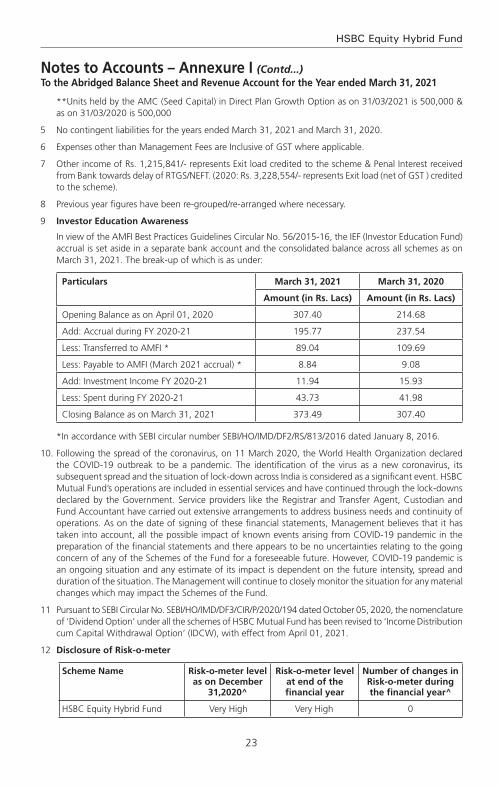
23
HSBC Equity Hybrid Fund
**Units held by the AMC (Seed Capital) in Direct Plan Growth Option as on 31/03/2021 is 500,000 & as on 31/03/2020 is 500,000
5 No contingent liabilities for the years ended March 31, 2021 and March 31, 2020.
6 Expenses other than Management Fees are Inclusive of GST where applicable.
7 Other income of Rs. 1,215,841/- represents Exit load credited to the scheme & Penal Interest received from Bank towards delay of RTGS/NEFT. (2020: Rs. 3,228,554/- represents Exit load (net of GST ) credited to the scheme).
8 Previous year figures have been re-grouped/re-arranged where necessary.
9 Investor Education Awareness
In view of the AMFI Best Practices Guidelines Circular No. 56/2015-16, the IEF (Investor Education Fund) accrual is set aside in a separate bank account and the consolidated balance across all schemes as on March 31, 2021. The break-up of which is as under:
Particulars March 31, 2021 March 31, 2020
Amount (in Rs. Lacs) Amount (in Rs. Lacs)
Opening Balance as on April 01, 2020 307.40 214.68
Add: Accrual during FY 2020-21 195.77 237.54
Less: Transferred to AMFI * 89.04 109.69
Less: Payable to AMFI (March 2021 accrual) * 8.84 9.08
Add: Investment Income FY 2020-21 11.94 15.93
Less: Spent during FY 2020-21 43.73 41.98
Closing Balance as on March 31, 2021 373.49 307.40
*In accordance with SEBI circular number SEBI/HO/IMD/DF2/RS/813/2016 dated January 8, 2016.
10. Following the spread of the coronavirus, on 11 March 2020, the World Health Organization declared the COVID-19 outbreak to be a pandemic. The identification of the virus as a new coronavirus, its subsequent spread and the situation of lock-down across India is considered as a significant event. HSBC Mutual Fund’s operations are included in essential services and have continued through the lock-downs declared by the Government. Service providers like the Registrar and Transfer Agent, Custodian and Fund Accountant have carried out extensive arrangements to address business needs and continuity of operations. As on the date of signing of these financial statements, Management believes that it has taken into account, all the possible impact of known events arising from COVID-19 pandemic in the preparation of the financial statements and there appears to be no uncertainties relating to the going concern of any of the Schemes of the Fund for a foreseeable future. However, COVID-19 pandemic is an ongoing situation and any estimate of its impact is dependent on the future intensity, spread and duration of the situation. The Management will continue to closely monitor the situation for any material changes which may impact the Schemes of the Fund.
11 Pursuant to SEBI Circular No. SEBI/HO/IMD/DF3/CIR/P/2020/194 dated October 05, 2020, the nomenclature of ‘Dividend Option’ under all the schemes of HSBC Mutual Fund has been revised to ‘Income Distribution cum Capital Withdrawal Option’ (IDCW), with effect from April 01, 2021.
12 Disclosure of Risk-o-meter
Scheme Name Risk-o-meter level as on December
31,2020^
Risk-o-meter level at end of the financial year
Number of changes in Risk-o-meter during the financial year^
HSBC Equity Hybrid Fund Very High Very High 0
Notes to Accounts – Annexure I (Contd...)To the Abridged Balance Sheet and Revenue Account for the Year ended March 31, 2021

24
Abridged Annual Report 2020 - 2021
Notes to Accounts – Annexure I (Contd...)To the Abridged Balance Sheet and Revenue Account for the Year ended March 31, 2021
^From the effective date (i.e. January 01, 2021) of SEBI circular no. SEBI/HO/IMD/DF3/CIR/P/2020/197 dated October 05, 2020.
13 The Annual Accounts of the Schemes prepared in accordance with the accounting policies and standards specified in the Ninth Schedule of The Securities and Exchange Board of India (Mutual Funds) Regulations, 1996 has been approved by the Board of Directors of HSBC Asset Management (India) Private Limited and The Board of Trustees of HSBC Mutual Fund at their meetings held on July 19, 2021 and July 20, 2021 respectively. The audit report attached herewith refers to the said Annual Accounts. The aforesaid abridged accounts are an extract of the Annual Accounts and are prepared in accordance with SEBI Circular No. IMD/Cir8/132968/2008 dated July 24, 2008.

25
HSBC Equity Hybrid Fund
voting Policy and Procedures
In view of SEBI guidelines related to “Role of Mutual Funds in Corporate Governance of Public Listed Companies”, HSBC AMC has formulated its “Policy for Proxy Voting in Public Listed Companies”. The said policy is available on our website and the details of actual exercise of proxy votes, the summary of votes casted and the auditor’s certificate for the Financial Year 2020 – 21 is forming part of our full Annual Report for the Financial Year 2020 – 21 which is uploaded on our website at http://www.assetmanagement.hsbc.co.in

26
Abridged Annual Report 2020 - 2021
Statutory Details & Disclaimers
All the returns have been sourced from Mutual Funds India Explorer software. The performance of the schemes and the benchmark is calculated on a total return basis. This document has been prepared by HSBC Asset Management (India) Private Ltd (HSBC) for information purposes only and should not be construed as i) an offer or recommendation to buy or sell securities, commodities, currencies or other investments referred to herein; or ii) an offer to sell or a solicitation or an offer for purchase of any of the funds of HSBC Mutual Fund; or iii) an investment research or investment advice. All information contained in this document (including that sourced from third parties), is obtained from sources HSBC and the third party which HSBC believes to be reliable however, has not independently verified the same. The information and opinions contained within the document are based upon publicly available information and rates of taxation applicable (if any) at the time of publication, which are subject to change from time to time.
Expressions of opinion are those of HSBC only and are subject to change without notice. It does not have regard to specific investment objectives, financial situation and the particular needs of any specific person who may receive this document. Investors should seek personal and independent advice regarding the appropriateness of investing in any of the funds, securities, other investment or investment strategies that may have been discussed or referred herein and should understand that the views regarding future prospects may or may not be realized. In no event shall HSBC Mutual Fund / HSBC Asset management (India) Private Limited and / or its affiliates or any of their directors, trustees, officers and employees be liable for any direct, indirect, special, incidental or consequential damages arising out of the use of information / opinion herein. Neither this document nor the units of HSBC Mutual Fund have been registered in any jurisdiction. The distribution of this document in certain jurisdictions may be restricted or totally prohibited and accordingly, persons who come into possession of this document are required to inform themselves about, and to observe, any such restrictions.
Mutual Fund investments are subject to market risks, read all scheme related documents carefully.

HSBC Infrastructure Equity FundAn open ended Equity Scheme following Infrastructure theme
Abridged Annual Report 2020 - 2021

1
HSBC Infrastructure Equity Fund
Dear Investor,
The beginning of the last financial year now almost seems like a distant memory. COVID-19 was still a relatively unknown enemy and governments across the world were grappling with ways to control and mitigate the risks associated with it. Nationwide lockdowns were the norm and our markets both equity and fixed income reacted negatively leading to significant erosion of wealth. Within a short period of time markets bounced back. This confounded even the most astute market pundits. How is it possible that when GDP growth had slowed down, unemployment had risen, inflation was high could there be such sharp up move in equity indices. Whilst the reasons are well known about easy global liquidity, demand resurgence, cost cutting by corporates etc. perhaps its most important to remember that the markets are not a reflector but a predictor of economic activity.
At all times particularly during such volatile times it is important to go back to the basics. Why do you save, why do you invest, what goals would you like to achieve, how old are you, what is your risk appetite? The replies to these simple questions will help you determine your asset allocation. As an example when equity markets corrected sharply last year, investors who reviewed their asset allocation, stayed invested during the lows of the past year and were able to capture the rebound and have seen prime returns since then. The current market movement in all likelihood would have also led to some imbalances in your asset allocation. Do not ignore that and I strongly recommend that you do review this with your advisor to check whether re-balancing is required.
During this financial year we had three very successful new fund launches. The pandemic showed us a clear trend of dominant players becoming stronger and profit pool getting consolidated within a few companies. To capture this opportunity, we launched the HSBC Focused Equity Fund which garnered close to Rs. 520 crores. During the second half of 2020, in the fixed income space, 3 - 5 year duration range had a favourable investment scenario as RBI’s accommodative policy and surplus liquidity had reduced the returns at the very short end of the yield curve. There was a demand for an actively managed moderate duration strategy with better credit quality which we fulfilled by launching HSBC Corporate Bond Fund. It garnered over 700 crores. Our latest and first of its kind offering, HSBC Global Equity Climate Change Fund of Fund saw a stupendous response with over 8000 investors investing over Rs. 616 crores. This is an investment opportunity which goes beyond the rationale of simply generating investment returns and is the future of responsible investing.
We worked towards augmenting our digital capabilities by launching a few key enhancements to our online transaction platform. Being mindful of the movement restrictions in place, this year we focused on digitizing offline processes so that an investor need not need step out of her home for investing or availing any key services. While our interactive chatbot AskMe, eased service queries, our end-to-end digital KYC module enabled a first time Mutual Fund investor to invest in our funds without any paperwork. We listened to your feedback and digitized consolidation of folios and change of tax status which eliminated the need for you to physically visit our branches.
I am a strong believer in the India story and this story has just begun. The opportunity to invest in this high growth market is a very exciting opportunity. I do hope you share my enthusiasm and I ask that you continue to invest whilst reviewing your asset allocation at all times. As always thank you for your business. Stay safe.
Warm regards,
Ravi MenonChief Executive Officer,
HSBC Asset Management India

2
Abridged Annual Report 2020 - 2021
SPONSOR
HSBC Securities and Capital Markets (India) Private LimitedRegd. Office: 52/60, Mahatma Gandhi Road, Fort, Mumbai - 400 001.
TRUSTEE
Board of TrusteesOffice: 16, Veer Nariman Road, Fort, Mumbai 400 001.
ASSET MANAGEMENT COMPANY
HSBC Asset Management (India) Private LimitedCorp. & Regd. Office: 16, Veer Nariman Road, Fort, Mumbai 400 001.
CUSTODIAN
Standard Chartered Bank (SCB)Corp. & Regd. Office: Crescenzo, Securities Services, 3rd Floor, C-38/39, G-Block,
Bandra Kurla Complex, Bandra East, Mumbai – 400051.
AUDITORS TO THE SCHEME
BSR & Co. LLPChartered Accountants
5th Floor, Lodha Excelus, Apollo Mills Compound, N. M. Joshi Marg, Mahalaxmi, Mumbai 400 011.
REGISTRAR & TRANSFER AGENTS
Computer Age Management Services Limited (CAMS)Unit: HSBC Mutual Fund ’C’ Block, 2nd Floor, Hanudev Info Park P. Ltd., SF No. 558/2, Udayampalayam Road, Nava India, Coimbatore - 641 028.
BOARD OF TRUSTEES
Ms. Jasmine Batliwalla - Chairperson
Mr. Nani Javeri - Trustee
Dr. T. C. Nair - Trustee
Mr. Pedro Bastos - Trustee
BOARD OF DIRECTORS
Mr. Dinesh Mittal - Director
Dr. Indu Shahani - Director
Mr. Ravi Menon - Director & Chief Executive Officer
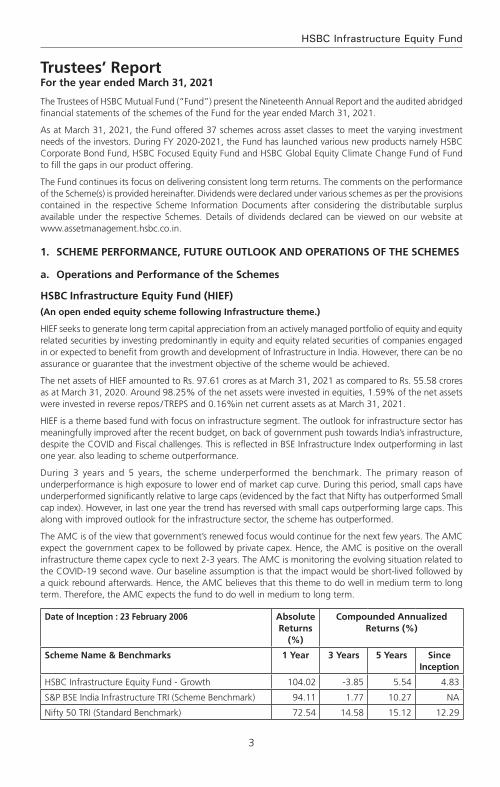
3
HSBC Infrastructure Equity Fund
The Trustees of HSBC Mutual Fund (“Fund”) present the Nineteenth Annual Report and the audited abridged financial statements of the schemes of the Fund for the year ended March 31, 2021.
As at March 31, 2021, the Fund offered 37 schemes across asset classes to meet the varying investment needs of the investors. During FY 2020-2021, the Fund has launched various new products namely HSBC Corporate Bond Fund, HSBC Focused Equity Fund and HSBC Global Equity Climate Change Fund of Fund to fill the gaps in our product offering.
The Fund continues its focus on delivering consistent long term returns. The comments on the performance of the Scheme(s) is provided hereinafter. Dividends were declared under various schemes as per the provisions contained in the respective Scheme Information Documents after considering the distributable surplus available under the respective Schemes. Details of dividends declared can be viewed on our website at www.assetmanagement.hsbc.co.in.
1. SCHEME PERFORMANCE, FUTURE OUTLOOk AND OPERATIONS OF THE SCHEMES
a. Operations and Performance of the Schemes
HSBC Infrastructure Equity Fund (HIEF)
(An open ended equity scheme following Infrastructure theme.)
HIEF seeks to generate long term capital appreciation from an actively managed portfolio of equity and equity related securities by investing predominantly in equity and equity related securities of companies engaged in or expected to benefit from growth and development of Infrastructure in India. However, there can be no assurance or guarantee that the investment objective of the scheme would be achieved.
The net assets of HIEF amounted to Rs. 97.61 crores as at March 31, 2021 as compared to Rs. 55.58 crores as at March 31, 2020. Around 98.25% of the net assets were invested in equities, 1.59% of the net assets were invested in reverse repos / TREPS and 0.16%in net current assets as at March 31, 2021.
HIEF is a theme based fund with focus on infrastructure segment. The outlook for infrastructure sector has meaningfully improved after the recent budget, on back of government push towards India’s infrastructure, despite the COVID and Fiscal challenges. This is reflected in BSE Infrastructure Index outperforming in last one year. also leading to scheme outperformance.
During 3 years and 5 years, the scheme underperformed the benchmark. The primary reason of underperformance is high exposure to lower end of market cap curve. During this period, small caps have underperformed significantly relative to large caps (evidenced by the fact that Nifty has outperformed Small cap index). However, in last one year the trend has reversed with small caps outperforming large caps. This along with improved outlook for the infrastructure sector, the scheme has outperformed.
The AMC is of the view that government’s renewed focus would continue for the next few years. The AMC expect the government capex to be followed by private capex. Hence, the AMC is positive on the overall infrastructure theme capex cycle to next 2-3 years. The AMC is monitoring the evolving situation related to the COVID-19 second wave. Our baseline assumption is that the impact would be short-lived followed by a quick rebound afterwards. Hence, the AMC believes that this theme to do well in medium term to long term. Therefore, the AMC expects the fund to do well in medium to long term.
Date of Inception : 23 February 2006 Absolute Returns
(%)
Compounded Annualized Returns (%)
Scheme Name & Benchmarks 1 Year 3 Years 5 Years Since Inception
HSBC Infrastructure Equity Fund - Growth 104.02 -3.85 5.54 4.83
S&P BSE India Infrastructure TRI (Scheme Benchmark) 94.11 1.77 10.27 NA
Nifty 50 TRI (Standard Benchmark) 72.54 14.58 15.12 12.29
Trustees’ ReportFor the year ended March 31, 2021
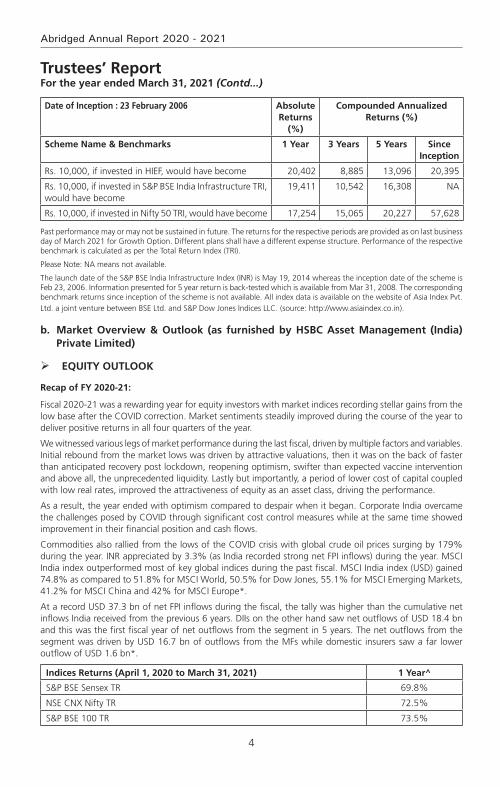
4
Abridged Annual Report 2020 - 2021
Date of Inception : 23 February 2006 Absolute Returns
(%)
Compounded Annualized Returns (%)
Scheme Name & Benchmarks 1 Year 3 Years 5 Years Since Inception
Rs. 10,000, if invested in HIEF, would have become 20,402 8,885 13,096 20,395
Rs. 10,000, if invested in S&P BSE India Infrastructure TRI, would have become
19,411 10,542 16,308 NA
Rs. 10,000, if invested in Nifty 50 TRI, would have become 17,254 15,065 20,227 57,628
Past performance may or may not be sustained in future. The returns for the respective periods are provided as on last business day of March 2021 for Growth Option. Different plans shall have a different expense structure. Performance of the respective benchmark is calculated as per the Total Return Index (TRI).
Please Note: NA means not available.
The launch date of the S&P BSE India Infrastructure Index (INR) is May 19, 2014 whereas the inception date of the scheme is Feb 23, 2006. Information presented for 5 year return is back-tested which is available from Mar 31, 2008. The corresponding benchmark returns since inception of the scheme is not available. All index data is available on the website of Asia Index Pvt. Ltd. a joint venture between BSE Ltd. and S&P Dow Jones Indices LLC. (source: http://www.asiaindex.co.in).
b. Market Overview & Outlook (as furnished by HSBC Asset Management (India) Private Limited)
EqUITY OUTLOOk
Recap of FY 2020-21:
Fiscal 2020-21 was a rewarding year for equity investors with market indices recording stellar gains from the low base after the COVID correction. Market sentiments steadily improved during the course of the year to deliver positive returns in all four quarters of the year.
We witnessed various legs of market performance during the last fiscal, driven by multiple factors and variables. Initial rebound from the market lows was driven by attractive valuations, then it was on the back of faster than anticipated recovery post lockdown, reopening optimism, swifter than expected vaccine intervention and above all, the unprecedented liquidity. Lastly but importantly, a period of lower cost of capital coupled with low real rates, improved the attractiveness of equity as an asset class, driving the performance.
As a result, the year ended with optimism compared to despair when it began. Corporate India overcame the challenges posed by COVID through significant cost control measures while at the same time showed improvement in their financial position and cash flows.
Commodities also rallied from the lows of the COVID crisis with global crude oil prices surging by 179% during the year. INR appreciated by 3.3% (as India recorded strong net FPI inflows) during the year. MSCI India index outperformed most of key global indices during the past fiscal. MSCI India index (USD) gained 74.8% as compared to 51.8% for MSCI World, 50.5% for Dow Jones, 55.1% for MSCI Emerging Markets, 41.2% for MSCI China and 42% for MSCI Europe*.
At a record USD 37.3 bn of net FPI inflows during the fiscal, the tally was higher than the cumulative net inflows India received from the previous 6 years. DIIs on the other hand saw net outflows of USD 18.4 bn and this was the first fiscal year of net outflows from the segment in 5 years. The net outflows from the segment was driven by USD 16.7 bn of outflows from the MFs while domestic insurers saw a far lower outflow of USD 1.6 bn*.
Indices Returns (April 1, 2020 to March 31, 2021) 1 Year^
S&P BSE Sensex TR 69.8%
NSE CNX Nifty TR 72.5%
S&P BSE 100 TR 73.5%
Trustees’ ReportFor the year ended March 31, 2021 (Contd...)
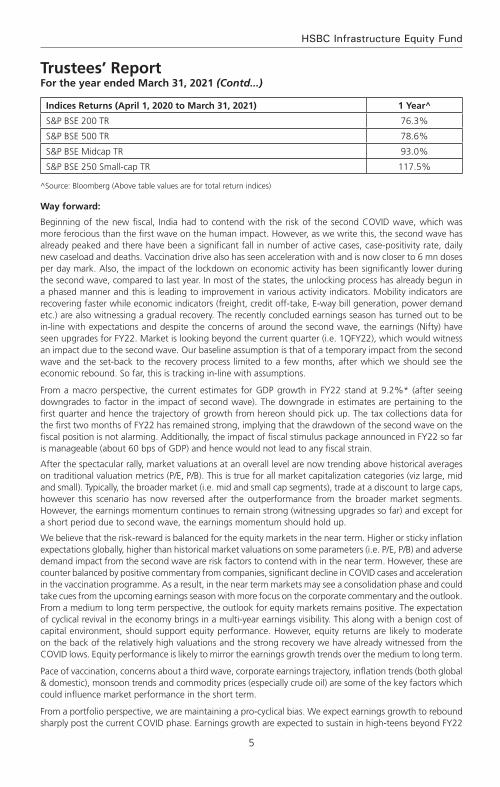
5
HSBC Infrastructure Equity Fund
Indices Returns (April 1, 2020 to March 31, 2021) 1 Year^
S&P BSE 200 TR 76.3%
S&P BSE 500 TR 78.6%
S&P BSE Midcap TR 93.0%
S&P BSE 250 Small-cap TR 117.5%
^Source: Bloomberg (Above table values are for total return indices)
Way forward:
Beginning of the new fiscal, India had to contend with the risk of the second COVID wave, which was more ferocious than the first wave on the human impact. However, as we write this, the second wave has already peaked and there have been a significant fall in number of active cases, case-positivity rate, daily new caseload and deaths. Vaccination drive also has seen acceleration with and is now closer to 6 mn doses per day mark. Also, the impact of the lockdown on economic activity has been significantly lower during the second wave, compared to last year. In most of the states, the unlocking process has already begun in a phased manner and this is leading to improvement in various activity indicators. Mobility indicators are recovering faster while economic indicators (freight, credit off-take, E-way bill generation, power demand etc.) are also witnessing a gradual recovery. The recently concluded earnings season has turned out to be in-line with expectations and despite the concerns of around the second wave, the earnings (Nifty) have seen upgrades for FY22. Market is looking beyond the current quarter (i.e. 1QFY22), which would witness an impact due to the second wave. Our baseline assumption is that of a temporary impact from the second wave and the set-back to the recovery process limited to a few months, after which we should see the economic rebound. So far, this is tracking in-line with assumptions.
From a macro perspective, the current estimates for GDP growth in FY22 stand at 9.2%* (after seeing downgrades to factor in the impact of second wave). The downgrade in estimates are pertaining to the first quarter and hence the trajectory of growth from hereon should pick up. The tax collections data for the first two months of FY22 has remained strong, implying that the drawdown of the second wave on the fiscal position is not alarming. Additionally, the impact of fiscal stimulus package announced in FY22 so far is manageable (about 60 bps of GDP) and hence would not lead to any fiscal strain.
After the spectacular rally, market valuations at an overall level are now trending above historical averages on traditional valuation metrics (P/E, P/B). This is true for all market capitalization categories (viz large, mid and small). Typically, the broader market (i.e. mid and small cap segments), trade at a discount to large caps, however this scenario has now reversed after the outperformance from the broader market segments. However, the earnings momentum continues to remain strong (witnessing upgrades so far) and except for a short period due to second wave, the earnings momentum should hold up.
We believe that the risk-reward is balanced for the equity markets in the near term. Higher or sticky inflation expectations globally, higher than historical market valuations on some parameters (i.e. P/E, P/B) and adverse demand impact from the second wave are risk factors to contend with in the near term. However, these are counter balanced by positive commentary from companies, significant decline in COVID cases and acceleration in the vaccination programme. As a result, in the near term markets may see a consolidation phase and could take cues from the upcoming earnings season with more focus on the corporate commentary and the outlook. From a medium to long term perspective, the outlook for equity markets remains positive. The expectation of cyclical revival in the economy brings in a multi-year earnings visibility. This along with a benign cost of capital environment, should support equity performance. However, equity returns are likely to moderate on the back of the relatively high valuations and the strong recovery we have already witnessed from the COVID lows. Equity performance is likely to mirror the earnings growth trends over the medium to long term.
Pace of vaccination, concerns about a third wave, corporate earnings trajectory, inflation trends (both global & domestic), monsoon trends and commodity prices (especially crude oil) are some of the key factors which could influence market performance in the short term.
From a portfolio perspective, we are maintaining a pro-cyclical bias. We expect earnings growth to rebound sharply post the current COVID phase. Earnings growth are expected to sustain in high-teens beyond FY22
Trustees’ ReportFor the year ended March 31, 2021 (Contd...)
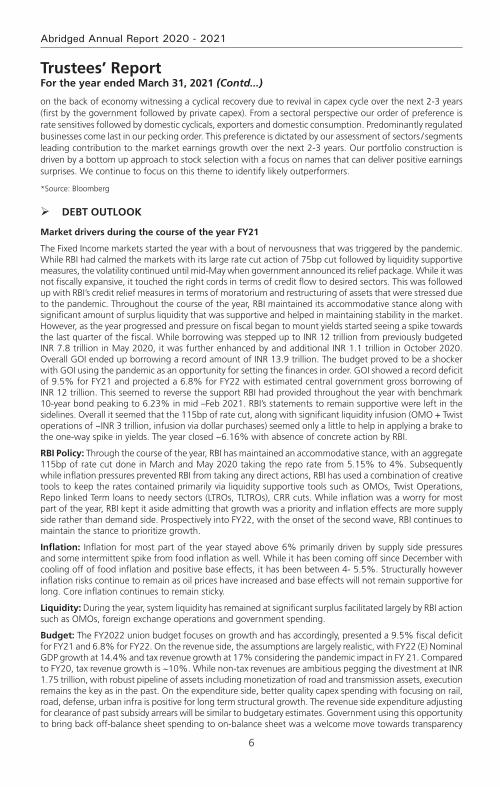
6
Abridged Annual Report 2020 - 2021
on the back of economy witnessing a cyclical recovery due to revival in capex cycle over the next 2-3 years (first by the government followed by private capex). From a sectoral perspective our order of preference is rate sensitives followed by domestic cyclicals, exporters and domestic consumption. Predominantly regulated businesses come last in our pecking order. This preference is dictated by our assessment of sectors / segments leading contribution to the market earnings growth over the next 2-3 years. Our portfolio construction is driven by a bottom up approach to stock selection with a focus on names that can deliver positive earnings surprises. We continue to focus on this theme to identify likely outperformers.
*Source: Bloomberg
DEBT OUTLOOk
Market drivers during the course of the year FY21
The Fixed Income markets started the year with a bout of nervousness that was triggered by the pandemic. While RBI had calmed the markets with its large rate cut action of 75bp cut followed by liquidity supportive measures, the volatility continued until mid-May when government announced its relief package. While it was not fiscally expansive, it touched the right cords in terms of credit flow to desired sectors. This was followed up with RBI’s credit relief measures in terms of moratorium and restructuring of assets that were stressed due to the pandemic. Throughout the course of the year, RBI maintained its accommodative stance along with significant amount of surplus liquidity that was supportive and helped in maintaining stability in the market. However, as the year progressed and pressure on fiscal began to mount yields started seeing a spike towards the last quarter of the fiscal. While borrowing was stepped up to INR 12 trillion from previously budgeted INR 7.8 trillion in May 2020, it was further enhanced by and additional INR 1.1 trillion in October 2020. Overall GOI ended up borrowing a record amount of INR 13.9 trillion. The budget proved to be a shocker with GOI using the pandemic as an opportunity for setting the finances in order. GOI showed a record deficit of 9.5% for FY21 and projected a 6.8% for FY22 with estimated central government gross borrowing of INR 12 trillion. This seemed to reverse the support RBI had provided throughout the year with benchmark 10-year bond peaking to 6.23% in mid –Feb 2021. RBI’s statements to remain supportive were left in the sidelines. Overall it seemed that the 115bp of rate cut, along with significant liquidity infusion (OMO + Twist operations of ~INR 3 trillion, infusion via dollar purchases) seemed only a little to help in applying a brake to the one-way spike in yields. The year closed ~6.16% with absence of concrete action by RBI.
RBI Policy: Through the course of the year, RBI has maintained an accommodative stance, with an aggregate 115bp of rate cut done in March and May 2020 taking the repo rate from 5.15% to 4%. Subsequently while inflation pressures prevented RBI from taking any direct actions, RBI has used a combination of creative tools to keep the rates contained primarily via liquidity supportive tools such as OMOs, Twist Operations, Repo linked Term loans to needy sectors (LTROs, TLTROs), CRR cuts. While inflation was a worry for most part of the year, RBI kept it aside admitting that growth was a priority and inflation effects are more supply side rather than demand side. Prospectively into FY22, with the onset of the second wave, RBI continues to maintain the stance to prioritize growth.
Inflation: Inflation for most part of the year stayed above 6% primarily driven by supply side pressures and some intermittent spike from food inflation as well. While it has been coming off since December with cooling off of food inflation and positive base effects, it has been between 4- 5.5%. Structurally however inflation risks continue to remain as oil prices have increased and base effects will not remain supportive for long. Core inflation continues to remain sticky.
Liquidity: During the year, system liquidity has remained at significant surplus facilitated largely by RBI action such as OMOs, foreign exchange operations and government spending.
Budget: The FY2022 union budget focuses on growth and has accordingly, presented a 9.5% fiscal deficit for FY21 and 6.8% for FY22. On the revenue side, the assumptions are largely realistic, with FY22 (E) Nominal GDP growth at 14.4% and tax revenue growth at 17% considering the pandemic impact in FY 21. Compared to FY20, tax revenue growth is ~10%. While non-tax revenues are ambitious pegging the divestment at INR 1.75 trillion, with robust pipeline of assets including monetization of road and transmission assets, execution remains the key as in the past. On the expenditure side, better quality capex spending with focusing on rail, road, defense, urban infra is positive for long term structural growth. The revenue side expenditure adjusting for clearance of past subsidy arrears will be similar to budgetary estimates. Government using this opportunity to bring back off-balance sheet spending to on-balance sheet was a welcome move towards transparency
Trustees’ ReportFor the year ended March 31, 2021 (Contd...)

7
HSBC Infrastructure Equity Fund
and showing realistic projections. Alongside, states have also been given leeway to borrow upto 4% of their GDP with an additional 0.5% subject to conditions. Given that states are an important vehicle for capex investment, this move is welcome although it may entail additional state borrowing. The fiscal glide path is shifted to FY26 at below 4.5% for center and 3% for states suggesting that spending will continue and borrowing will come down gradually. In summary, from survival to revival, FY22 budget aims for structural growth leaving fiscal concerns sideways in the interim. Government’s intent seems clear on bringing back growth on the table, in a transparent manner.
While the second wave of the pandemic has once again derailed the revenue story, government will still have some cushion from its conservative estimates.
Currency and FII Flows: INR has been on an appreciation trajectory for most part of the year, aided by dollar underperformance supported by positive FII and FDI flows along with reduced imports on the domestic front as well. RBI has used most of the flows to accumulate reserves which has prevented any strong appreciation. Pandemic shock and global risk off led rupee over 75 in the beginning of the year only to close below 72 at the end of the fiscal year. While the second wave led to another spike in INR in April, it has since then cooled once again driven by dollar underperformance and pandemic recovery on the domestic front. Net FII flows was ~$30 bn with positive equity flows of~$37 bn while debt was negative ~$7bn and overall RBI’s forex reserves rose by a ~$100 bn to close ~$537 bn.
Credit growth: Credit growth for the entire year has been tepid as previous year’s credit events were followed by nervousness relating to the pandemic. Despite RBI opening up several windows to finance the non-AAA segment, there was very little fresh credit flowing that segment. Overall banking credit grew by only 6.5%. Risk appetite has however been improving from a complete risk aversion to opening up towards a calculated risk. Prospectively it is expected that once the pandemic risk abates, credit growth will resume primarily driven by government capex spending and demand recovery.
Market Outlook
The pandemic once again brought the country to a situation similar to last year and debt markets perhaps interpreted the same as a structural rise in rates. In the initial day’s post budget in Feb of 2021, market was expecting a concrete set of actions such as an OMO calendar from RBI, and RBI’s words alone failed to calm the market. The first auction of the fiscal year also saw a devolvement. However, RBI acted in the first policy of the year announcing a bond buyback program akin to QE (quantitative easing) and its subsequent cancellation of auctions wherein yields were perhaps quoted higher than RBI’s comfort levels brought back confidence into the market. Since then we have seen a strong rally with 10-year benchmark trending below 6% and the curve moving alongside. RBI reiteration of priority of growth and also supporting with higher than expected dividend payment stand out as a testimony of its support. While we do not expect RBI to act in terms of rate cuts, we believe that measures such as G-SAP, OMOs will continue until there is visibility of a structural growth. Therefore, the large borrowing program should go without any hiccups.
Furthermore, with the evidence of strong GST numbers until April 2021 (before the 2nd wave), it is expected that growth and therefore fiscal revenues will come back. Government’s conservative budget estimates are supportive. Also, given the fact that compared to last year there has not been a complete shutdown of activity (lockdowns being distributed), the impact on growth will not be similar to last year. Pent up demand will come back to support revenue collection. However, on the flipside, once growth resumes RBI will be forced to withdraw liquidity in a phased manner to prevent asset bubbles. Nevertheless, RBI need not act in terms of rate actions and we believe that a prolonged pause in terms of RBI rates is in the offing.
Net-net therefore while growth is wanting no matter what, it may come at a small price of rise in yields with liquidity withdrawal. That is however expected more in the 2nd half of the year. Lower than expected borrowing numbers, later this year or if not in next year could be a surprise. We may therefore see a range bound rate action in the near term with a rising bias over time. Global rate environment, oil and currency risks are to be watched out for.
2. BRIEF BACkGROUND OF SPONSORS, BOARD OF TRUSTEES AND ASSET MANAGEMENT COMPANY
a. Sponsor
HSBC Mutual Fund is sponsored by HSBC Securities and Capital Markets (India) Private Limited (HSCI). The Sponsor is the Settler of the Mutual Fund Trust. The Sponsor has entrusted a sum of Rs. 1,00,000/-
Trustees’ ReportFor the year ended March 31, 2021 (Contd...)
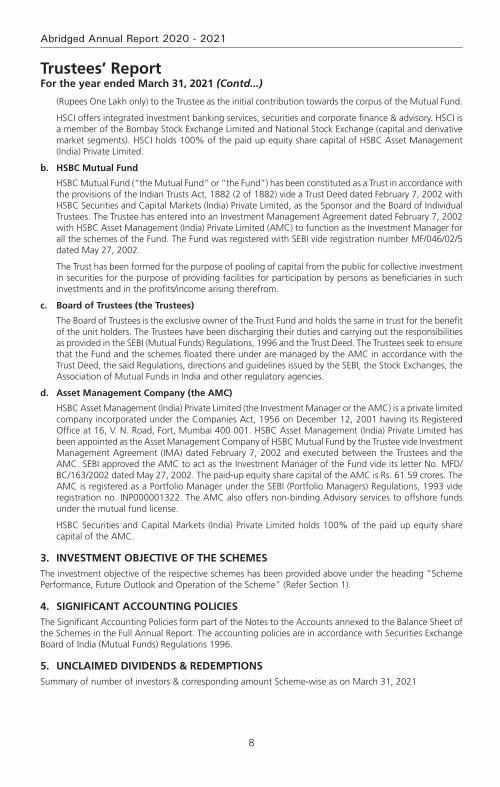
8
Abridged Annual Report 2020 - 2021
(Rupees One Lakh only) to the Trustee as the initial contribution towards the corpus of the Mutual Fund.
HSCI offers integrated investment banking services, securities and corporate finance & advisory. HSCI is a member of the Bombay Stock Exchange Limited and National Stock Exchange (capital and derivative market segments). HSCI holds 100% of the paid up equity share capital of HSBC Asset Management (India) Private Limited.
b. HSBC Mutual Fund
HSBC Mutual Fund (“the Mutual Fund” or “the Fund”) has been constituted as a Trust in accordance with the provisions of the Indian Trusts Act, 1882 (2 of 1882) vide a Trust Deed dated February 7, 2002 with HSBC Securities and Capital Markets (India) Private Limited, as the Sponsor and the Board of Individual Trustees. The Trustee has entered into an Investment Management Agreement dated February 7, 2002 with HSBC Asset Management (India) Private Limited (AMC) to function as the Investment Manager for all the schemes of the Fund. The Fund was registered with SEBI vide registration number MF/046/02/5 dated May 27, 2002.
The Trust has been formed for the purpose of pooling of capital from the public for collective investment in securities for the purpose of providing facilities for participation by persons as beneficiaries in such investments and in the profits/income arising therefrom.
c. Board of Trustees (the Trustees)
The Board of Trustees is the exclusive owner of the Trust Fund and holds the same in trust for the benefit of the unit holders. The Trustees have been discharging their duties and carrying out the responsibilities as provided in the SEBI (Mutual Funds) Regulations, 1996 and the Trust Deed. The Trustees seek to ensure that the Fund and the schemes floated there under are managed by the AMC in accordance with the Trust Deed, the said Regulations, directions and guidelines issued by the SEBI, the Stock Exchanges, the Association of Mutual Funds in India and other regulatory agencies.
d. Asset Management Company (the AMC)
HSBC Asset Management (India) Private Limited (the Investment Manager or the AMC) is a private limited company incorporated under the Companies Act, 1956 on December 12, 2001 having its Registered Office at 16, V. N. Road, Fort, Mumbai 400 001. HSBC Asset Management (India) Private Limited has been appointed as the Asset Management Company of HSBC Mutual Fund by the Trustee vide Investment Management Agreement (IMA) dated February 7, 2002 and executed between the Trustees and the AMC. SEBI approved the AMC to act as the Investment Manager of the Fund vide its letter No. MFD/BC/163/2002 dated May 27, 2002. The paid-up equity share capital of the AMC is Rs. 61.59 crores. The AMC is registered as a Portfolio Manager under the SEBI (Portfolio Managers) Regulations, 1993 vide registration no. INP000001322. The AMC also offers non-binding Advisory services to offshore funds under the mutual fund license.
HSBC Securities and Capital Markets (India) Private Limited holds 100% of the paid up equity share capital of the AMC.
3. INvESTMENT OBJECTIvE OF THE SCHEMESThe investment objective of the respective schemes has been provided above under the heading “Scheme Performance, Future Outlook and Operation of the Scheme” (Refer Section 1).
4. SIGNIFICANT ACCOUNTING POLICIES The Significant Accounting Policies form part of the Notes to the Accounts annexed to the Balance Sheet of the Schemes in the Full Annual Report. The accounting policies are in accordance with Securities Exchange Board of India (Mutual Funds) Regulations 1996.
5. UNCLAIMED DIvIDENDS & REDEMPTIONSSummary of number of investors & corresponding amount Scheme-wise as on March 31, 2021
Trustees’ ReportFor the year ended March 31, 2021 (Contd...)

9
HSBC Infrastructure Equity Fund
Trustees’ ReportFor the year ended March 31, 2021 (Contd...)
SchemeUnclaimed Dividend Unclaimed Redemption
Amount (Rs.) No. of Investors
Amount (Rs.) No. of Investors
HSBC Infrastructure Equity Fund 548,900.64 289 5,871,283.89 394
6. INvESTOR SERvICES
The number of official points of acceptance of transactions is 204 locations. In addition to the offices of the Registrar & Transfer agents, the AMC has Investor Service Centers in 9 locations at its own offices - namely Mumbai, New Delhi, Kolkata, Bangalore, Pune, Ahmedabad, Hyderabad, Chandigarh and Chennai. With a view to enhance customer convenience, the AMC has the facility of priority based servicing to key distributors through the enhancement of the Interactive Voice Reponses. The AMC has 2 Toll Free numbers (1-800-200-2434 /1-800-258-2434) which can be dialed from anywhere in India and 1 number i.e +91 44 39923900 (Investors calling from abroad). The call center service is being managed by the Registrar and Transfer Agents. Transactions for purchase / redemption of units in the schemes HSBC Mutual Fund can also be made through the online transaction facility on the AMC’s website at https://invest.assetmanagement.hsbc.co.in.
On the distribution front, the number of empaneled distributors was 1069 as on March 31, 2021. During the year, the AMC initiated tie-ups for online distribution of the Mutual Fund’s schemes with several channel partners taking the total number of such tie-ups to 52.
7. DETAILS OF INvESTOR GRIEvANCE REDRESSAL
The details of the redressal of investor complaints received against HSBC Mutual Fund during April 2020 - March 2021 are as follows:
2020-2021Com-plaint Code
Type of complaint# (a) No. of complaints pending at the begin-ning of the
year
(b) No. of Com-
plaints received during
the year
Action on (a) and (b)
Resolved Non Action-
able
Pending
Within 30
days
30 - 60 days
60 - 180 days
Beyond 180 days
0 - 3 months
3 - 6 months
6 - 9 months
9 - 12 months
I A Non receipt of Dividend on Units
0 0 0 0 0 0 0 0 0 0 0
I B Interest on delayed payment of Dividend
0 0 0 0 0 0 0 0 0 0 0
I C Non receipt of Redemption Proceeds
0 8 7 0 0 0 0 1 0 0 0
I D Interest on delayed payment of Redemption
0 0 0 0 0 0 0 0 0 0 0
II A Non receipt of Statement of Account / Unit Certificate
0 0 0 0 0 0 0 0 0 0 0
II B Discrepancy in Statement of Account
0 1 1 0 0 0 0 0 0 0 0
II C Data corrections in Investor details **
0 12 12 0 0 0 0 0 0 0 0
II D Non receipt of Annual Report/Abridged Summary
0 0 0 0 0 0 0 0 0 0 0
III A Wrong switch between Schemes
0 0 0 0 0 0 0 0 0 0 0
III B Unauthorized switch between Schemes
0 0 0 0 0 0 0 0 0 0 0
III C Deviation from Scheme attributes
0 0 0 0 0 0 0 0 0 0 0
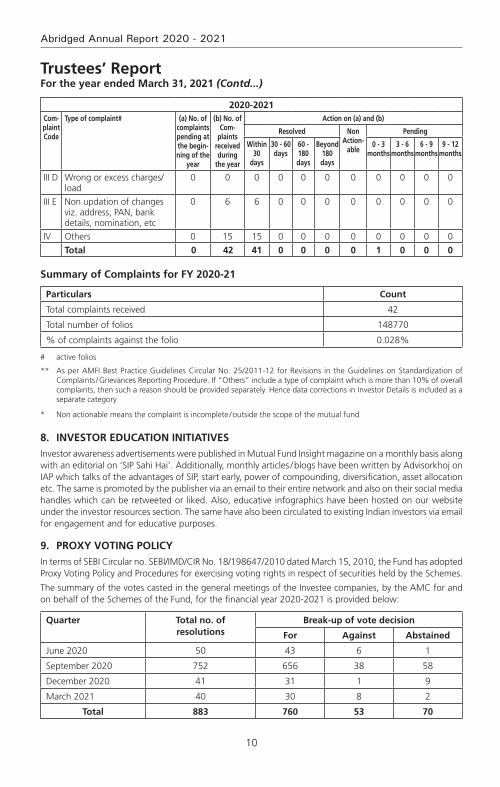
10
Abridged Annual Report 2020 - 2021
Trustees’ ReportFor the year ended March 31, 2021 (Contd...)
2020-2021Com-plaint Code
Type of complaint# (a) No. of complaints pending at the begin-ning of the
year
(b) No. of Com-
plaints received during
the year
Action on (a) and (b)
Resolved Non Action-
able
Pending
Within 30
days
30 - 60 days
60 - 180 days
Beyond 180 days
0 - 3 months
3 - 6 months
6 - 9 months
9 - 12 months
III D Wrong or excess charges/load
0 0 0 0 0 0 0 0 0 0 0
III E Non updation of changes viz. address, PAN, bank details, nomination, etc
0 6 6 0 0 0 0 0 0 0 0
IV Others 0 15 15 0 0 0 0 0 0 0 0
Total 0 42 41 0 0 0 0 1 0 0 0
Summary of Complaints for FY 2020-21
Particulars Count
Total complaints received 42
Total number of folios 148770
% of complaints against the folio 0.028%
# active folios
** As per AMFI Best Practice Guidelines Circular No. 25/2011-12 for Revisions in the Guidelines on Standardization of Complaints / Grievances Reporting Procedure. If “Others” include a type of complaint which is more than 10% of overall complaints, then such a reason should be provided separately. Hence data corrections in Investor Details is included as a separate category
* Non actionable means the complaint is incomplete / outside the scope of the mutual fund
8. INvESTOR EDUCATION INITIATIvES
Investor awareness advertisements were published in Mutual Fund Insight magazine on a monthly basis along with an editorial on ‘SIP Sahi Hai’. Additionally, monthly articles / blogs have been written by Advisorkhoj on IAP which talks of the advantages of SIP, start early, power of compounding, diversification, asset allocation etc. The same is promoted by the publisher via an email to their entire network and also on their social media handles which can be retweeted or liked. Also, educative infographics have been hosted on our website under the investor resources section. The same have also been circulated to existing Indian investors via email for engagement and for educative purposes.
9. PROxY vOTING POLICY
In terms of SEBI Circular no. SEBI/IMD/CIR No. 18/198647/2010 dated March 15, 2010, the Fund has adopted Proxy Voting Policy and Procedures for exercising voting rights in respect of securities held by the Schemes.
The summary of the votes casted in the general meetings of the Investee companies, by the AMC for and on behalf of the Schemes of the Fund, for the financial year 2020-2021 is provided below:
quarter Total no. of resolutions
Break-up of vote decision
For Against Abstained
June 2020 50 43 6 1
September 2020 752 656 38 58
December 2020 41 31 1 9
March 2021 40 30 8 2
Total 883 760 53 70
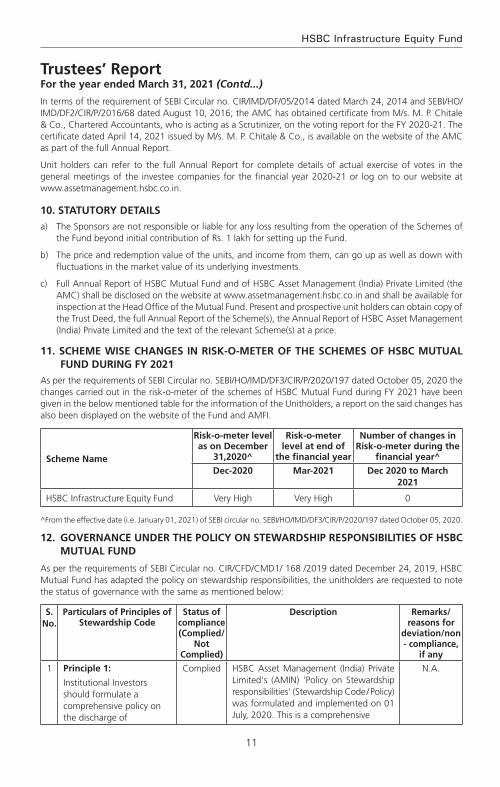
11
HSBC Infrastructure Equity Fund
Trustees’ ReportFor the year ended March 31, 2021 (Contd...)
In terms of the requirement of SEBI Circular no. CIR/IMD/DF/05/2014 dated March 24, 2014 and SEBI/HO/IMD/DF2/CIR/P/2016/68 dated August 10, 2016; the AMC has obtained certificate from M/s. M. P. Chitale & Co., Chartered Accountants, who is acting as a Scrutinizer, on the voting report for the FY 2020-21. The certificate dated April 14, 2021 issued by M/s. M. P. Chitale & Co., is available on the website of the AMC as part of the full Annual Report.
Unit holders can refer to the full Annual Report for complete details of actual exercise of votes in the general meetings of the investee companies for the financial year 2020-21 or log on to our website at www.assetmanagement.hsbc.co.in.
10. STATUTORY DETAILS
a) The Sponsors are not responsible or liable for any loss resulting from the operation of the Schemes of the Fund beyond initial contribution of Rs. 1 lakh for setting up the Fund.
b) The price and redemption value of the units, and income from them, can go up as well as down with fluctuations in the market value of its underlying investments.
c) Full Annual Report of HSBC Mutual Fund and of HSBC Asset Management (India) Private Limited (the AMC) shall be disclosed on the website at www.assetmanagement.hsbc.co.in and shall be available for inspection at the Head Office of the Mutual Fund. Present and prospective unit holders can obtain copy of the Trust Deed, the full Annual Report of the Scheme(s), the Annual Report of HSBC Asset Management (India) Private Limited and the text of the relevant Scheme(s) at a price.
11. SCHEME WISE CHANGES IN RISk-O-METER OF THE SCHEMES OF HSBC MUTUAL FUND DURING FY 2021
As per the requirements of SEBI Circular no. SEBI/HO/IMD/DF3/CIR/P/2020/197 dated October 05, 2020 the changes carried out in the risk-o-meter of the schemes of HSBC Mutual Fund during FY 2021 have been given in the below mentioned table for the information of the Unitholders, a report on the said changes has also been displayed on the website of the Fund and AMFI.
Scheme Name
Risk-o-meter level as on December
31,2020^
Risk-o-meter level at end of
the financial year
Number of changes in Risk-o-meter during the
financial year^
Dec-2020 Mar-2021 Dec 2020 to March 2021
HSBC Infrastructure Equity Fund Very High Very High 0
^From the effective date (i.e. January 01, 2021) of SEBI circular no. SEBI/HO/IMD/DF3/CIR/P/2020/197 dated October 05, 2020.
12. GOvERNANCE UNDER THE POLICY ON STEWARDSHIP RESPONSIBILITIES OF HSBC MUTUAL FUND
As per the requirements of SEBI Circular no. CIR/CFD/CMD1/ 168 /2019 dated December 24, 2019, HSBC Mutual Fund has adapted the policy on stewardship responsibilities, the unitholders are requested to note the status of governance with the same as mentioned below:
S. No.
Particulars of Principles of Stewardship Code
Status of compliance (Complied/
Not Complied)
Description Remarks/reasons for
deviation/non - compliance,
if any
1 Principle 1:
Institutional Investors should formulate a comprehensive policy on the discharge of
Complied HSBC Asset Management (India) Private Limited's (AMIN) 'Policy on Stewardship responsibilities' (Stewardship Code / Policy) was formulated and implemented on 01 July, 2020. This is a comprehensive
N.A.

12
Abridged Annual Report 2020 - 2021
S. No.
Particulars of Principles of Stewardship Code
Status of compliance (Complied/
Not Complied)
Description Remarks/reasons for
deviation/non - compliance,
if any
their stewardship responsibilities, publicly disclose it, review and update it periodically.
document which has been publicly disclosed on the website of AMIN. The same shall follow a periodic review.
2 Principle 2:Institutional investors should have a clear policy on how they manage conflicts of interest in fulfilling their stewardship responsibilities and publicly disclose it.
Complied Defining and managing Conflict of Interest in fulfilling stewardship responsibilities are detailed in the Stewardship Policy document. The policy document is publicly disclosed.
N.A.
3 Principle 3:Institutional investors should monitor their investee companies.
Complied AMIN monitors all investee companies through its investment process. This includes assessment of companies’ own and market data, consideration of research from brokers and other independent research providers – including ESG & voting research, attending individual & group meetings with company management and directors, visiting production sites (wherever necessary), engaging with key stakeholders including competitors and customers, and financial modelling. More details enumerated in the policy document
N.A.
4 Principle 4:Inst i tut ional investors should have a clear policy on intervention in their investee companies. Institutional investors should also have a clear policy for collaboration with other institutional investors where required, to preserve the interests of the ultimate investors, which should be disclosed.
Complied Details of undertaking active engagement with investee companies and the policy for collaboration with other institutional holders are detai led in the policy document. The policy document is publicly disclosed.
N.A.
5 Principle 5:
Inst i tut ional investors should have a clear policy on voting and disclosure of voting activity.
Complied AMIN has a clear and detailed voting policy which provides the framework for the voting decisions. All voting decisions shall be in accordance with AMIN’s Voting Policy and Procedures, which is disclosed on the website. AMIN discloses the details of the voting on its website on a quarterly basis within 10 working days from the end of the quarter. Additionally, AMIN also discloses the details of the votes cast, in the annual report of the schemes of HSBC Mutual Fund.
N.A.
Trustees’ ReportFor the year ended March 31, 2021 (Contd...)
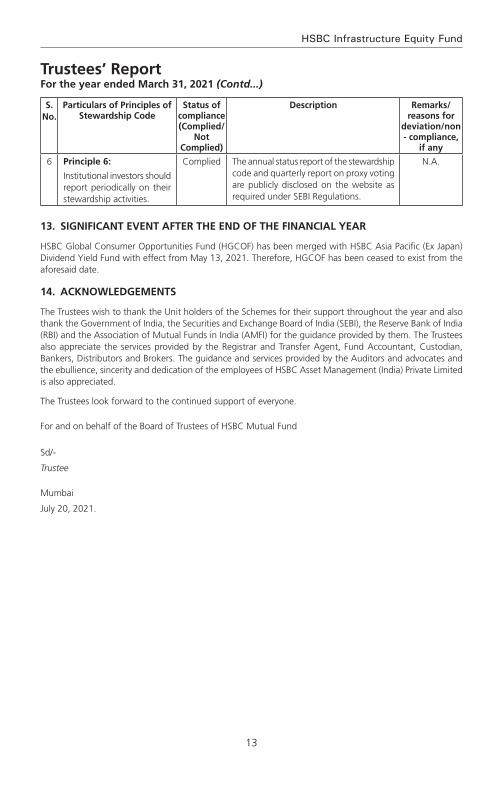
13
HSBC Infrastructure Equity Fund
S. No.
Particulars of Principles of Stewardship Code
Status of compliance (Complied/
Not Complied)
Description Remarks/reasons for
deviation/non - compliance,
if any
6 Principle 6:
Institutional investors should report periodically on their stewardship activities.
Complied The annual status report of the stewardship code and quarterly report on proxy voting are publicly disclosed on the website as required under SEBI Regulations.
N.A.
13. SIGNIFICANT EvENT AFTER THE END OF THE FINANCIAL YEAR
HSBC Global Consumer Opportunities Fund (HGCOF) has been merged with HSBC Asia Pacific (Ex Japan) Dividend Yield Fund with effect from May 13, 2021. Therefore, HGCOF has been ceased to exist from the aforesaid date.
14. ACkNOWLEDGEMENTS
The Trustees wish to thank the Unit holders of the Schemes for their support throughout the year and also thank the Government of India, the Securities and Exchange Board of India (SEBI), the Reserve Bank of India (RBI) and the Association of Mutual Funds in India (AMFI) for the guidance provided by them. The Trustees also appreciate the services provided by the Registrar and Transfer Agent, Fund Accountant, Custodian, Bankers, Distributors and Brokers. The guidance and services provided by the Auditors and advocates and the ebullience, sincerity and dedication of the employees of HSBC Asset Management (India) Private Limited is also appreciated.
The Trustees look forward to the continued support of everyone.
For and on behalf of the Board of Trustees of HSBC Mutual Fund
Sd/-
Trustee
Mumbai
July 20, 2021.
Trustees’ ReportFor the year ended March 31, 2021 (Contd...)

14
Abridged Annual Report 2020 - 2021
To the Trustees of HSBC Mutual Fund
HSBC Infrastructure Equity Fund
Report on the Audit of the Financial Statements
Opinion
We have audited the financial statements of HSBC Infrastructure Equity Fund (the ‘Scheme’) of HSBC Mutual Fund, which comprise the balance sheet as at 31 March 2021 and the revenue account for the year then ended, and notes to the financial statements, including a summary of the significant accounting policies.
In our opinion and to the best of our information and according to the explanations given to us, the aforesaid financial statements give a true and fair view in conformity with the accounting principles generally accepted in India, of the state of affairs of the Scheme as at 31 March 2021, its net surplus for the year ended on that date.
Basis for Opinion
We conducted our audit in accordance with the Standards on Auditing (‘SAs’) issued by the Institute of Chartered Accountants of India (the ‘ICAI’). Our responsibilities under those SAs are further described in the Auditor’s Responsibilities for the Audit of the Financial Statements section of our report. We are independent of the Scheme in accordance with the Code of Ethics issued by the ICAI, and we have fulfilled our other ethical responsibilities in accordance with the Code of Ethics. We believe that the audit evidence we have obtained is sufficient and appropriate to provide a basis for our opinion.
Responsibilities of Management and Those Charged with Governance for the Financial Statements
The Scheme’s management, the Board of Directors of HSBC Mutual Fund (the ‘Trustees’) and the Board of Directors of HSBC Asset Management (India) Private Limited (the ‘AMC’) (collectively referred to as ‘Management’) are responsible for the preparation of these financial statements that give a true and fair view of the state of affairs, results of operations of the Scheme in accordance with the accounting policies and standards specified in the Ninth Schedule of the Securities and Exchange Board of India (Mutual Funds) Regulations, 1996, as amended (the ‘Regulations’) and the accounting principles generally accepted in India. This responsibility includes design, implementation and maintenance of internal control relevant to the preparation and presentation of the financial statements that give a true and fair view and are free from material misstatement, whether due to fraud or error.
In preparing the financial statements, management is responsible for assessing the Scheme’s ability to continue as a going concern, disclosing, as applicable, matters related to going concern and using the going concern basis of accounting unless management either intends to liquidate the Scheme or to cease operations, or has no realistic alternative but to do so.
The management is responsible for overseeing the Scheme’s financial reporting process.
Auditor’s Responsibilities for the Audit of the Financial Statements
Our objectives are to obtain reasonable assurance about whether the financial statements as a whole are free from material misstatement, whether due to fraud or error, and to issue an auditor’s report that includes our opinion. Reasonable assurance is a high level of assurance, but is not a guarantee that an audit conducted in accordance with SAs will always detect a material misstatement when it exists. Misstatements can arise from fraud or error and are considered material if, individually or in the aggregate, they could reasonably be expected to influence the economic decisions of users taken on the basis of these financial statements.
As part of an audit in accordance with SAs, we exercise professional judgment and maintain professional skepticism throughout the audit. We also:
• Identifyandassesstherisksofmaterialmisstatementofthefinancialstatements,whetherduetofraudor error, design and perform audit procedures responsive to those risks, and obtain audit evidence that is sufficient and appropriate to provide a basis for our opinion. The risk of not detecting a material misstatement resulting from fraud is higher than for one resulting from error, as fraud may involve
Independent Auditors’ Report

15
HSBC Infrastructure Equity Fund
Independent Auditors’ Report (Contd...)
collusion, forgery, intentional omissions, misrepresentations, or the override of internal control;
• Obtainanunderstandingofinternalcontrolrelevanttotheauditinordertodesignauditproceduresthat are appropriate in the circumstances, but not for the purpose of expressing an opinion on the effectiveness of the Scheme’s internal controls;
• Evaluatetheappropriatenessofaccountingpoliciesusedandthereasonablenessofaccountingestimatesand related disclosures made by Management;
• ConcludeontheappropriatenessofManagement’suseofthegoingconcernbasisofaccountingand,based on the audit evidence obtained, whether a material uncertainty exists related to events or conditions that may cast significant doubt on the Scheme’s ability to continue as a going concern. If we conclude that a material uncertainty exists, we are required to draw attention in our auditor’s report to the related disclosures in the financial statements or, if such disclosures are inadequate, to modify our opinion. Our conclusions are based on the audit evidence obtained up to the date of our auditor’s report. However, future events or conditions may cause the Scheme to cease to continue as a going concern;
• Evaluate the overall presentation, structure and content of the financial statements, including thedisclosures and whether the financial statements represent the underlying transactions and events in a manner that achieves fair presentation.
We communicate with those charged with governance regarding, among other matters, the planned scope and timing of the audit and significant audit findings, including any significant deficiencies in internal control that we identify during our audit.
We also provide those charged with governance with a statement that we have complied with relevant ethical requirements regarding independence, and to communicate with them all relationships and other matters that may reasonably be thought to bear on our independence, and where applicable, related safeguards.
Report on Other Legal and Regulatory Requirements
1 As required by Regulation 55 (4) of the Regulations, we report that:
(a) We have obtained all information and explanations which, to the best of our knowledge and belief, were necessary for the purposes of the audit; and
(b) The balance sheet and the revenue account have been prepared in accordance with the accounting policies and standards as specified in the Ninth Schedule of the Regulations.
2 As required by Clause 5 (ii) (2) of the Eleventh Schedule of the Regulations, we report that the balance sheet and the revenue account are in agreement with the books of account of the Scheme.
For B S R & Co. LLP Chartered Accountants Firm’s Registration No: 101248W/W-100022
Sd/-
Ajit Viswanath PartnerMembership No: 067114UDIN : 21067114AAAADO7081
Place : Mumbai Date : July 20, 2021.

16
Abridged Annual Report 2020 - 2021
Rs. in Lakhs
As at March 31, 2021
As at March 31, 2020
LIABILITIES1 Unit Capital 5,060.95 5,852.95 2 Reserves & Surplus2.1 Unit Premium Reserves (7,684.58) (8,432.19)2.2 Unrealised Appreciation Reserve 3,458.78 – 2.3 Other Reserves 8,936.88 8,137.69 3 Loans & Borrowings – – 4 Current Liabilities & Provisions4.1 Provision for Doubtful Income/Deposits – – 4.2 Other Current Liabilities & Provisions 122.44 91.15
TOTAL 9,894.47 5,649.60
ASSETS1 Investments1.1 Listed Securities:1.1.1 Equity Shares 9,588.24 5,335.30 1.1.2 Preference Shares – – 1.1.3 Equity Linked Debentures – – 1.1.4 Other Debentures & Bonds – – 1.1.5 Securitised Debt Securities – –
1.2 Securities Awaited Listing:1.2.1 Equity Shares – – 1.2.2 Preference Shares – – 1.2.3 Equity Linked Debentures – – 1.2.4 Other Debentures & Bonds – – 1.2.5 Securitised Debt Securities – –
1.3 Unlisted Securities:1.3.1 Equity Shares – – 1.3.2 Preference Shares – – 1.3.3 Equity Linked Debentures – – 1.3.4 Other Debentures & Bonds – – 1.3.5 Securitised Debt Securities – – 1.4 Government Securities – – 1.5 Treasury Bills – – 1.6 Commercial Paper – – 1.7 Certificate of Deposits – – 1.8 Bill Rediscounting – – 1.9 Units of Domestic Mutual Fund – – 1.10 Foreign Securities – –
Total Investments 9,588.24 5,335.30
2 Deposits 1.58 1.50 3 Other Current Assets3.1 Cash & Bank Balance 11.06 3.75 3.2 TREPS / Reverse Repo Lending 154.80 175.25 3.3 Others 138.79 133.80 4 Deferred Revenue Expenditure (to the extent not written off) – –
TOTAL 9,894.47 5,649.60
Notes to Accounts - Annexure I
Abridged Balance Sheet as at March 31, 2021
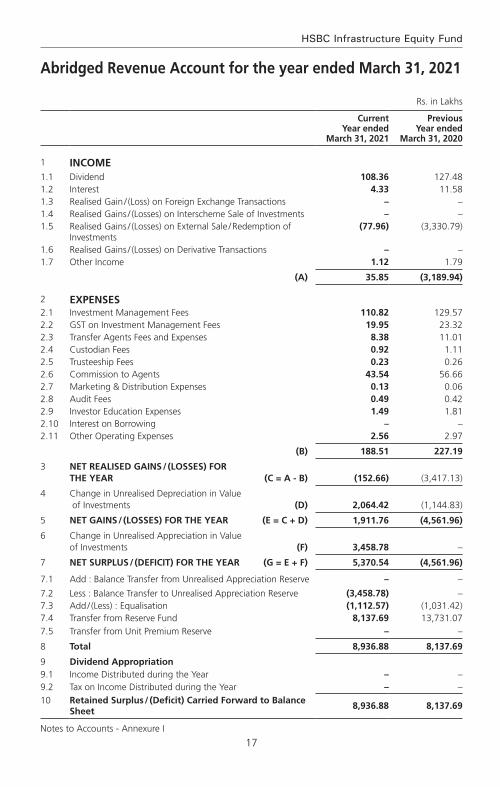
17
HSBC Infrastructure Equity Fund
Abridged Revenue Account for the year ended March 31, 2021
Rs. in Lakhs
Current Year ended
March 31, 2021
Previous Year ended
March 31, 2020
1 INCOME1.1 Dividend 108.36 127.48 1.2 Interest 4.33 11.58 1.3 Realised Gain / (Loss) on Foreign Exchange Transactions – – 1.4 Realised Gains / (Losses) on Interscheme Sale of Investments – – 1.5 Realised Gains / (Losses) on External Sale / Redemption of
Investments (77.96) (3,330.79)
1.6 Realised Gains / (Losses) on Derivative Transactions – – 1.7 Other Income 1.12 1.79
(A) 35.85 (3,189.94)
2 ExPENSES2.1 Investment Management Fees 110.82 129.57 2.2 GST on Investment Management Fees 19.95 23.32 2.3 Transfer Agents Fees and Expenses 8.38 11.01 2.4 Custodian Fees 0.92 1.11 2.5 Trusteeship Fees 0.23 0.26 2.6 Commission to Agents 43.54 56.66 2.7 Marketing & Distribution Expenses 0.13 0.06 2.8 Audit Fees 0.49 0.42 2.9 Investor Education Expenses 1.49 1.81 2.10 Interest on Borrowing – – 2.11 Other Operating Expenses 2.56 2.97
(B) 188.51 227.19
3 NET REALISED GAINS / (LOSSES) FOR THE YEAR (C = A - B) (152.66) (3,417.13)
4 Change in Unrealised Depreciation in Value of Investments (D) 2,064.42 (1,144.83)
5 NET GAINS / (LOSSES) FOR THE YEAR (E = C + D) 1,911.76 (4,561.96)
6 Change in Unrealised Appreciation in Value of Investments (F) 3,458.78 –
7 NET SURPLUS / (DEFICIT) FOR THE YEAR (G = E + F) 5,370.54 (4,561.96)
7.1 Add : Balance Transfer from Unrealised Appreciation Reserve – –
7.2 Less : Balance Transfer to Unrealised Appreciation Reserve (3,458.78) – 7.3 Add / (Less) : Equalisation (1,112.57) (1,031.42)7.4 Transfer from Reserve Fund 8,137.69 13,731.07
7.5 Transfer from Unit Premium Reserve – –
8 Total 8,936.88 8,137.69
9 Dividend Appropriation9.1 Income Distributed during the Year – – 9.2 Tax on Income Distributed during the Year – –
10 Retained Surplus / (Deficit) Carried Forward to Balance Sheet
8,936.88 8,137.69
Notes to Accounts - Annexure I
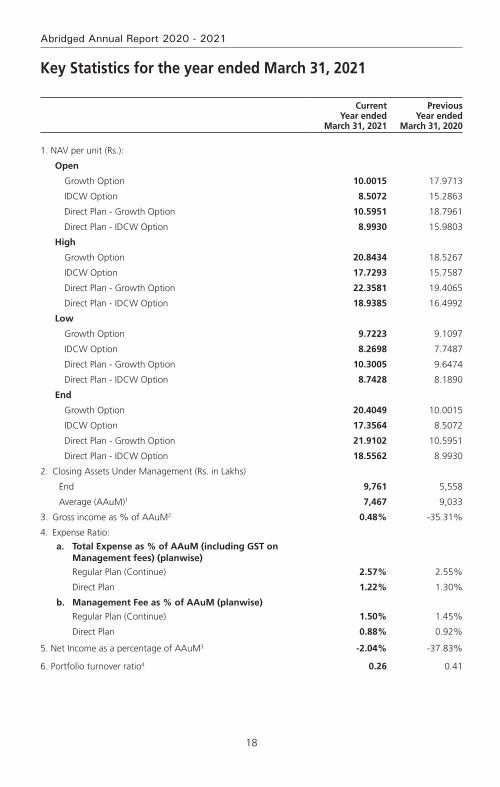
18
Abridged Annual Report 2020 - 2021
key Statistics for the year ended March 31, 2021
Current Year ended
March 31, 2021
Previous Year ended
March 31, 2020
1. NAV per unit (Rs.):
Open
Growth Option 10.0015 17.9713
IDCW Option 8.5072 15.2863
Direct Plan - Growth Option 10.5951 18.7961
Direct Plan - IDCW Option 8.9930 15.9803
High
Growth Option 20.8434 18.5267
IDCW Option 17.7293 15.7587
Direct Plan - Growth Option 22.3581 19.4065
Direct Plan - IDCW Option 18.9385 16.4992
Low
Growth Option 9.7223 9.1097
IDCW Option 8.2698 7.7487
Direct Plan - Growth Option 10.3005 9.6474
Direct Plan - IDCW Option 8.7428 8.1890
End
Growth Option 20.4049 10.0015
IDCW Option 17.3564 8.5072
Direct Plan - Growth Option 21.9102 10.5951
Direct Plan - IDCW Option 18.5562 8.9930
2. Closing Assets Under Management (Rs. in Lakhs)
End 9,761 5,558
Average (AAuM)1 7,467 9,033
3. Gross income as % of AAuM2 0.48% -35.31%
4. Expense Ratio:
a. Total Expense as % of AAuM (including GST on Management fees) (planwise)
Regular Plan (Continue) 2.57% 2.55%
Direct Plan 1.22% 1.30%
b. Management Fee as % of AAuM (planwise)
Regular Plan (Continue) 1.50% 1.45%
Direct Plan 0.88% 0.92%
5. Net Income as a percentage of AAuM3 -2.04% -37.83%
6. Portfolio turnover ratio4 0.26 0.41

19
HSBC Infrastructure Equity Fund
Current Year ended
March 31, 2021
Previous Year ended
March 31, 2020
7. Total Dividend per unit distributed during the year (planwise)
Retail
IDCW Option – –
Direct Plan - Growth Option – –
Corporate
IDCW Option – –
Direct Plan - Growth Option – –
8. Returns (%):
a. Last One Year
Scheme
Growth Option 104.0200 -44.0900
Direct Plan - Growth Option 106.8000 -43.3700
Benchmark
S&P BSE India Infrastructure Index 94.1100 -42.2100
b. Since Inception
Scheme
Growth Option 4.8300 0.0000
Direct Plan - Growth Option 7.0800 -2.2100
Benchmark
S&P BSE India Infrastructure Index TRI NA+ NA+
+ For HSBC Infrastructure Equity Fund: S&P BSE India Infrastructure Index was launched on 19 May 2014 i.e., post date of allotment of HSBC Infrastructure Equity Fund, the returns since inception are not available.
1. AAUM = Average daily net assets.
2. Gross income = amount against (A) in the Revenue account i.e. Income.
3. Net income = amount against (C) in the Revenue account i.e. Net Realised Gains / (Losses) for the year.
4. Portfolio Turnover = Lower of sales or purchase divided by the Average AuM for the year.
key Statistics for the year ended March 31, 2021 (Contd...)
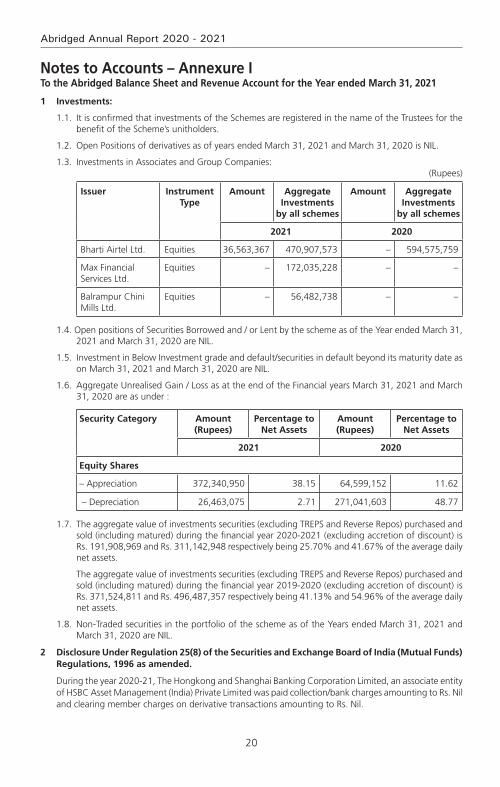
20
Abridged Annual Report 2020 - 2021
Notes to Accounts – Annexure ITo the Abridged Balance Sheet and Revenue Account for the Year ended March 31, 2021
1 Investments:
1.1. It is confirmed that investments of the Schemes are registered in the name of the Trustees for the benefit of the Scheme’s unitholders.
1.2. Open Positions of derivatives as of years ended March 31, 2021 and March 31, 2020 is NIL.
1.3. Investments in Associates and Group Companies:(Rupees)
Issuer Instrument Type
Amount Aggregate Investments
by all schemes
Amount Aggregate Investments
by all schemes
2021 2020
Bharti Airtel Ltd. Equities 36,563,367 470,907,573 – 594,575,759
Max Financial Services Ltd.
Equities – 172,035,228 – –
Balrampur Chini Mills Ltd.
Equities – 56,482,738 – –
1.4. Open positions of Securities Borrowed and / or Lent by the scheme as of the Year ended March 31, 2021 and March 31, 2020 are NIL.
1.5. Investment in Below Investment grade and default/securities in default beyond its maturity date as on March 31, 2021 and March 31, 2020 are NIL.
1.6. Aggregate Unrealised Gain / Loss as at the end of the Financial years March 31, 2021 and March 31, 2020 are as under :
Security Category Amount (Rupees)
Percentage to Net Assets
Amount (Rupees)
Percentage to Net Assets
2021 2020
Equity Shares
– Appreciation 372,340,950 38.15 64,599,152 11.62
– Depreciation 26,463,075 2.71 271,041,603 48.77
1.7. The aggregate value of investments securities (excluding TREPS and Reverse Repos) purchased and sold (including matured) during the financial year 2020-2021 (excluding accretion of discount) is Rs. 191,908,969 and Rs. 311,142,948 respectively being 25.70% and 41.67% of the average daily net assets.
The aggregate value of investments securities (excluding TREPS and Reverse Repos) purchased and sold (including matured) during the financial year 2019-2020 (excluding accretion of discount) is Rs. 371,524,811 and Rs. 496,487,357 respectively being 41.13% and 54.96% of the average daily net assets.
1.8. Non-Traded securities in the portfolio of the scheme as of the Years ended March 31, 2021 and March 31, 2020 are NIL.
2 Disclosure Under Regulation 25(8) of the Securities and Exchange Board of India (Mutual Funds) Regulations, 1996 as amended.
During the year 2020-21, The Hongkong and Shanghai Banking Corporation Limited, an associate entity of HSBC Asset Management (India) Private Limited was paid collection/bank charges amounting to Rs. Nil and clearing member charges on derivative transactions amounting to Rs. Nil.

21
HSBC Infrastructure Equity Fund
During the year 2019-20, The Hongkong and Shanghai Banking Corporation Limited, an associate entity of HSBC Asset Management (India) Private Limited was paid collection/bank charges amounting to Rs. Nil and clearing member charges on derivative transactions amounting to Rs. Nil.
Details of amounts paid to associates in terms of Regulation 25 (8) are as follows :
Commission paid to Sponsor/AMC and its associates/related parties/group companies
Name of Sponsor/AMC and its associate/related parties/group companies
Nature of Association / Nature of
Relation
Period Covered
Business Given [Rs. in Crores]
% of Total Business
received by the Fund
Commission paid [Rs.]
% of Total commission paid by the
Fund
The Hongkong and Shanghai Banking Corporation Limited
Associate of Investment Manager
2020-2021 0.64 16.04 938,378 33.92
Name of Sponsor/AMC and its associate/related parties/group companies
Nature of Association / Nature of
Relation
Period Covered
Business Given [Rs. in Crores]
% of Total Business
received by the Fund
Commission paid [Rs.]
% of Total commission paid by the
Fund
The Hongkong and Shanghai Banking Corporation Limited
Associate of Investment Manager
2019-2020 0.41 6.11 1,807,582 50.54
Brokerage paid to Sponsor/AMC and its associates/related parties/group companies is NIL. (Previous year also NIL)
The brokerage paid was at rates similar to those offered to other brokers / distributors. And the Commission/Brokerage paid to related party includes both upfront and trail and hence not comparable with the % of business brought and % of commission paid.
Further, The Hongkong and Shanghai Banking Corporation Limited, an associate of the Sponsor, is on the panel of bankers with whom HSBC Mutual Fund places money on fixed deposits and enters into reverse repo transactions from time to time at competitive rates.
(i) Any underwriting obligations undertaken by the schemes of the mutual funds with respect to issue of securities associate companies - Nil (Previous year also Nil).
(ii) Devolvement - Nil (Previous year also Nil).
(iii) Subscription by the schemes in the issues lead managed by associate companies - Nil (Previous year also Nil).
(iv) Subscription to any issue of equity or debt on private placement basis where the sponsor or its associate companies have acted as arranger or manager - Nil (Previous year also Nil).
3 None of the Investors held more than 25% of the total net assets of the scheme at the year ended March 31, 2021 and March 31, 2020.
Notes to Accounts – Annexure I (Contd...)To the Abridged Balance Sheet and Revenue Account for the Year ended March 31, 2021
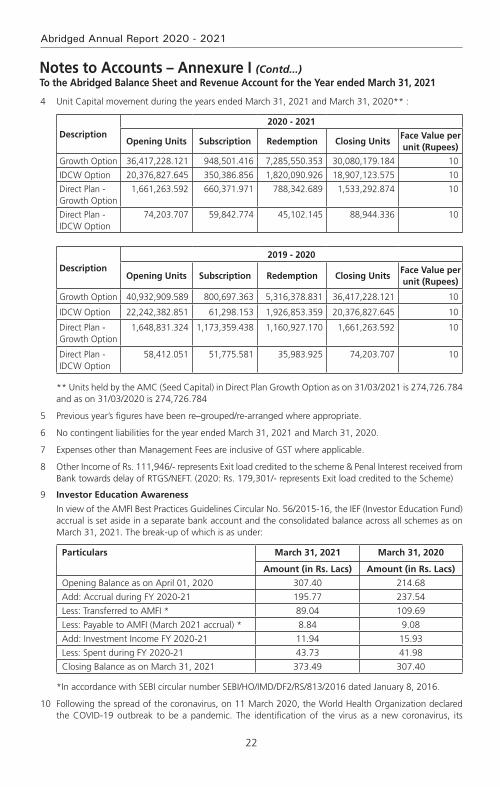
22
Abridged Annual Report 2020 - 2021
4 Unit Capital movement during the years ended March 31, 2021 and March 31, 2020** :
Description2020 - 2021
Opening Units Subscription Redemption Closing UnitsFace value per unit (Rupees)
Growth Option 36,417,228.121 948,501.416 7,285,550.353 30,080,179.184 10
IDCW Option 20,376,827.645 350,386.856 1,820,090.926 18,907,123.575 10
Direct Plan - Growth Option
1,661,263.592 660,371.971 788,342.689 1,533,292.874 10
Direct Plan - IDCW Option
74,203.707 59,842.774 45,102.145 88,944.336 10
Description2019 - 2020
Opening Units Subscription Redemption Closing UnitsFace value per unit (Rupees)
Growth Option 40,932,909.589 800,697.363 5,316,378.831 36,417,228.121 10
IDCW Option 22,242,382.851 61,298.153 1,926,853.359 20,376,827.645 10
Direct Plan - Growth Option
1,648,831.324 1,173,359.438 1,160,927.170 1,661,263.592 10
Direct Plan - IDCW Option
58,412.051 51,775.581 35,983.925 74,203.707 10
** Units held by the AMC (Seed Capital) in Direct Plan Growth Option as on 31/03/2021 is 274,726.784 and as on 31/03/2020 is 274,726.784
5 Previous year’s figures have been re–grouped/re-arranged where appropriate.
6 No contingent liabilities for the year ended March 31, 2021 and March 31, 2020.
7 Expenses other than Management Fees are inclusive of GST where applicable.
8 Other Income of Rs. 111,946/- represents Exit load credited to the scheme & Penal Interest received from Bank towards delay of RTGS/NEFT. (2020: Rs. 179,301/- represents Exit load credited to the Scheme)
9 Investor Education Awareness
In view of the AMFI Best Practices Guidelines Circular No. 56/2015-16, the IEF (Investor Education Fund) accrual is set aside in a separate bank account and the consolidated balance across all schemes as on March 31, 2021. The break-up of which is as under:
Particulars March 31, 2021 March 31, 2020
Amount (in Rs. Lacs) Amount (in Rs. Lacs)
Opening Balance as on April 01, 2020 307.40 214.68
Add: Accrual during FY 2020-21 195.77 237.54
Less: Transferred to AMFI * 89.04 109.69
Less: Payable to AMFI (March 2021 accrual) * 8.84 9.08
Add: Investment Income FY 2020-21 11.94 15.93
Less: Spent during FY 2020-21 43.73 41.98
Closing Balance as on March 31, 2021 373.49 307.40
*In accordance with SEBI circular number SEBI/HO/IMD/DF2/RS/813/2016 dated January 8, 2016.
10 Following the spread of the coronavirus, on 11 March 2020, the World Health Organization declared the COVID-19 outbreak to be a pandemic. The identification of the virus as a new coronavirus, its
Notes to Accounts – Annexure I (Contd...)To the Abridged Balance Sheet and Revenue Account for the Year ended March 31, 2021
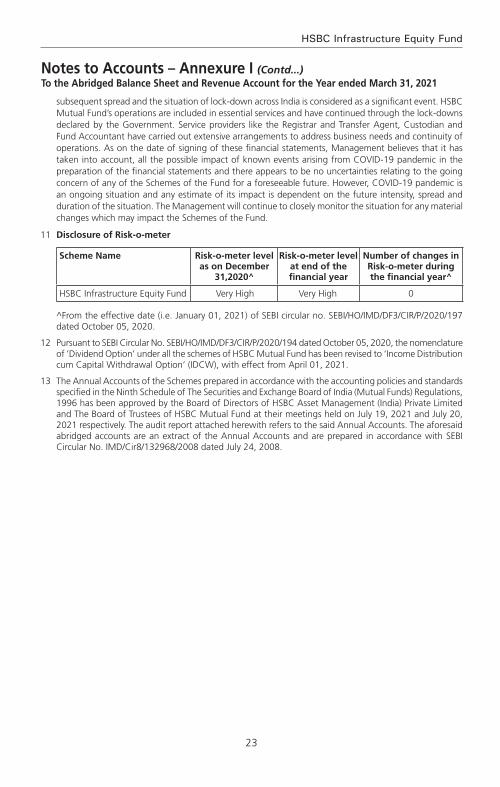
23
HSBC Infrastructure Equity Fund
Notes to Accounts – Annexure I (Contd...)To the Abridged Balance Sheet and Revenue Account for the Year ended March 31, 2021
subsequent spread and the situation of lock-down across India is considered as a significant event. HSBC Mutual Fund’s operations are included in essential services and have continued through the lock-downs declared by the Government. Service providers like the Registrar and Transfer Agent, Custodian and Fund Accountant have carried out extensive arrangements to address business needs and continuity of operations. As on the date of signing of these financial statements, Management believes that it has taken into account, all the possible impact of known events arising from COVID-19 pandemic in the preparation of the financial statements and there appears to be no uncertainties relating to the going concern of any of the Schemes of the Fund for a foreseeable future. However, COVID-19 pandemic is an ongoing situation and any estimate of its impact is dependent on the future intensity, spread and duration of the situation. The Management will continue to closely monitor the situation for any material changes which may impact the Schemes of the Fund.
11 Disclosure of Risk-o-meter
Scheme Name Risk-o-meter level as on December
31,2020^
Risk-o-meter level at end of the financial year
Number of changes in Risk-o-meter during the financial year^
HSBC Infrastructure Equity Fund Very High Very High 0
^From the effective date (i.e. January 01, 2021) of SEBI circular no. SEBI/HO/IMD/DF3/CIR/P/2020/197 dated October 05, 2020.
12 Pursuant to SEBI Circular No. SEBI/HO/IMD/DF3/CIR/P/2020/194 dated October 05, 2020, the nomenclature of ‘Dividend Option’ under all the schemes of HSBC Mutual Fund has been revised to ‘Income Distribution cum Capital Withdrawal Option’ (IDCW), with effect from April 01, 2021.
13 The Annual Accounts of the Schemes prepared in accordance with the accounting policies and standards specified in the Ninth Schedule of The Securities and Exchange Board of India (Mutual Funds) Regulations, 1996 has been approved by the Board of Directors of HSBC Asset Management (India) Private Limited and The Board of Trustees of HSBC Mutual Fund at their meetings held on July 19, 2021 and July 20, 2021 respectively. The audit report attached herewith refers to the said Annual Accounts. The aforesaid abridged accounts are an extract of the Annual Accounts and are prepared in accordance with SEBI Circular No. IMD/Cir8/132968/2008 dated July 24, 2008.

24
Abridged Annual Report 2020 - 2021
voting Policy and Procedures
In view of SEBI guidelines related to “Role of Mutual Funds in Corporate Governance of Public Listed Companies”, HSBC AMC has formulated its “Policy for Proxy Voting in Public Listed Companies”. The said policy is available on our website and the details of actual exercise of proxy votes, the summary of votes casted and the auditor’s certificate for the Financial Year 2020 – 21 is forming part of our full Annual Report for the Financial Year 2020 – 21 which is uploaded on our website at http://www.assetmanagement.hsbc.co.in

25
HSBC Infrastructure Equity Fund
Statutory Details & Disclaimers
All the returns have been sourced from Mutual Funds India Explorer software. The performance of the schemes and the benchmark is calculated on a total return basis. This document has been prepared by HSBC Asset Management (India) Private Ltd (HSBC) for information purposes only and should not be construed as i) an offer or recommendation to buy or sell securities, commodities, currencies or other investments referred to herein; or ii) an offer to sell or a solicitation or an offer for purchase of any of the funds of HSBC Mutual Fund; or iii) an investment research or investment advice. All information contained in this document (including that sourced from third parties), is obtained from sources HSBC and the third party which HSBC believes to be reliable however, has not independently verified the same. The information and opinions contained within the document are based upon publicly available information and rates of taxation applicable (if any) at the time of publication, which are subject to change from time to time.
Expressions of opinion are those of HSBC only and are subject to change without notice. It does not have regard to specific investment objectives, financial situation and the particular needs of any specific person who may receive this document. Investors should seek personal and independent advice regarding the appropriateness of investing in any of the funds, securities, other investment or investment strategies that may have been discussed or referred herein and should understand that the views regarding future prospects may or may not be realized. In no event shall HSBC Mutual Fund / HSBC Asset management (India) Private Limited and / or its affiliates or any of their directors, trustees, officers and employees be liable for any direct, indirect, special, incidental or consequential damages arising out of the use of information / opinion herein. Neither this document nor the units of HSBC Mutual Fund have been registered in any jurisdiction. The distribution of this document in certain jurisdictions may be restricted or totally prohibited and accordingly, persons who come into possession of this document are required to inform themselves about, and to observe, any such restrictions.
Mutual Fund investments are subject to market risks, read all scheme related documents carefully.

HSBC Small Cap Equity FundSmall Cap Fund - An open ended equity Scheme predominantly investing in small cap stocks
Abridged Annual Report 2020 - 2021

1
HSBC Small Cap Equity Fund
Dear Investor,
The beginning of the last financial year now almost seems like a distant memory. COVID-19 was still a relatively unknown enemy and governments across the world were grappling with ways to control and mitigate the risks associated with it. Nationwide lockdowns were the norm and our markets both equity and fixed income reacted negatively leading to significant erosion of wealth. Within a short period of time markets bounced back. This confounded even the most astute market pundits. How is it possible that when GDP growth had slowed down, unemployment had risen, inflation was high could there be such sharp up move in equity indices. Whilst the reasons are well known about easy global liquidity, demand resurgence, cost cutting by corporates etc. perhaps its most important to remember that the markets are not a reflector but a predictor of economic activity.
At all times particularly during such volatile times it is important to go back to the basics. Why do you save, why do you invest, what goals would you like to achieve, how old are you, what is your risk appetite? The replies to these simple questions will help you determine your asset allocation. As an example when equity markets corrected sharply last year, investors who reviewed their asset allocation, stayed invested during the lows of the past year and were able to capture the rebound and have seen prime returns since then. The current market movement in all likelihood would have also led to some imbalances in your asset allocation. Do not ignore that and I strongly recommend that you do review this with your advisor to check whether re-balancing is required.
During this financial year we had three very successful new fund launches. The pandemic showed us a clear trend of dominant players becoming stronger and profit pool getting consolidated within a few companies. To capture this opportunity, we launched the HSBC Focused Equity Fund which garnered close to Rs. 520 crores. During the second half of 2020, in the fixed income space, 3 - 5 year duration range had a favourable investment scenario as RBI’s accommodative policy and surplus liquidity had reduced the returns at the very short end of the yield curve. There was a demand for an actively managed moderate duration strategy with better credit quality which we fulfilled by launching HSBC Corporate Bond Fund. It garnered over 700 crores. Our latest and first of its kind offering, HSBC Global Equity Climate Change Fund of Fund saw a stupendous response with over 8000 investors investing over Rs. 616 crores. This is an investment opportunity which goes beyond the rationale of simply generating investment returns and is the future of responsible investing.
We worked towards augmenting our digital capabilities by launching a few key enhancements to our online transaction platform. Being mindful of the movement restrictions in place, this year we focused on digitizing offline processes so that an investor need not need step out of her home for investing or availing any key services. While our interactive chatbot AskMe, eased service queries, our end-to-end digital KYC module enabled a first time Mutual Fund investor to invest in our funds without any paperwork. We listened to your feedback and digitized consolidation of folios and change of tax status which eliminated the need for you to physically visit our branches.
I am a strong believer in the India story and this story has just begun. The opportunity to invest in this high growth market is a very exciting opportunity. I do hope you share my enthusiasm and I ask that you continue to invest whilst reviewing your asset allocation at all times. As always thank you for your business. Stay safe.
Warm regards,
Ravi MenonChief Executive Officer,
HSBC Asset Management India

2
Abridged Annual Report 2020 - 2021
SPONSOR
HSBC Securities and Capital Markets (India) Private LimitedRegd. Office: 52/60, Mahatma Gandhi Road, Fort, Mumbai - 400 001.
TRUSTEE
Board of TrusteesOffice: 16, Veer Nariman Road, Fort, Mumbai 400 001.
ASSET MANAGEMENT COMPANY
HSBC Asset Management (India) Private LimitedCorp. & Regd. Office: 16, Veer Nariman Road, Fort, Mumbai 400 001.
CUSTODIAN
Standard Chartered Bank (SCB)Corp. & Regd. Office: Crescenzo, Securities Services, 3rd Floor, C-38/39, G-Block,
Bandra Kurla Complex, Bandra East, Mumbai – 400051.
AUDITORS TO THE SCHEME
BSR & Co. LLPChartered Accountants
5th Floor, Lodha Excelus, Apollo Mills Compound, N. M. Joshi Marg, Mahalaxmi, Mumbai 400 011.
REGISTRAR & TRANSFER AGENTS
Computer Age Management Services Limited (CAMS)Unit: HSBC Mutual Fund ’C’ Block, 2nd Floor, Hanudev Info Park P. Ltd., SF No. 558/2, Udayampalayam Road, Nava India, Coimbatore - 641 028.
BOARD OF TRUSTEES
Ms. Jasmine Batliwalla - Chairperson
Mr. Nani Javeri - Trustee
Dr. T. C. Nair - Trustee
Mr. Pedro Bastos - Trustee
BOARD OF DIRECTORS
Mr. Dinesh Mittal - Director
Dr. Indu Shahani - Director
Mr. Ravi Menon - Director & Chief Executive Officer
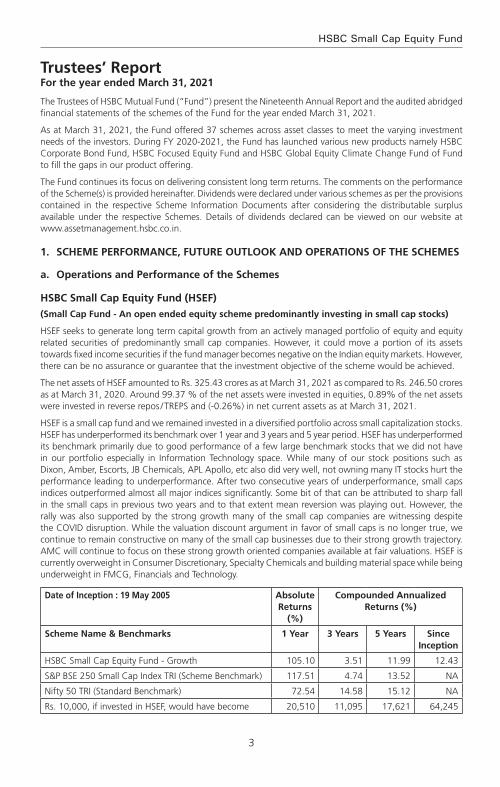
3
HSBC Small Cap Equity Fund
The Trustees of HSBC Mutual Fund (“Fund”) present the Nineteenth Annual Report and the audited abridged financial statements of the schemes of the Fund for the year ended March 31, 2021.
As at March 31, 2021, the Fund offered 37 schemes across asset classes to meet the varying investment needs of the investors. During FY 2020-2021, the Fund has launched various new products namely HSBC Corporate Bond Fund, HSBC Focused Equity Fund and HSBC Global Equity Climate Change Fund of Fund to fill the gaps in our product offering.
The Fund continues its focus on delivering consistent long term returns. The comments on the performance of the Scheme(s) is provided hereinafter. Dividends were declared under various schemes as per the provisions contained in the respective Scheme Information Documents after considering the distributable surplus available under the respective Schemes. Details of dividends declared can be viewed on our website at www.assetmanagement.hsbc.co.in.
1. SCHEME PERFORMANCE, FUTURE OUTLOOk AND OPERATIONS OF THE SCHEMES
a. Operations and Performance of the Schemes
HSBC Small Cap Equity Fund (HSEF)
(Small Cap Fund - An open ended equity scheme predominantly investing in small cap stocks)
HSEF seeks to generate long term capital growth from an actively managed portfolio of equity and equity related securities of predominantly small cap companies. However, it could move a portion of its assets towards fixed income securities if the fund manager becomes negative on the Indian equity markets. However, there can be no assurance or guarantee that the investment objective of the scheme would be achieved.
The net assets of HSEF amounted to Rs. 325.43 crores as at March 31, 2021 as compared to Rs. 246.50 crores as at March 31, 2020. Around 99.37 % of the net assets were invested in equities, 0.89% of the net assets were invested in reverse repos / TREPS and (-0.26%) in net current assets as at March 31, 2021.
HSEF is a small cap fund and we remained invested in a diversified portfolio across small capitalization stocks. HSEF has underperformed its benchmark over 1 year and 3 years and 5 year period. HSEF has underperformed its benchmark primarily due to good performance of a few large benchmark stocks that we did not have in our portfolio especially in Information Technology space. While many of our stock positions such as Dixon, Amber, Escorts, JB Chemicals, APL Apollo, etc also did very well, not owning many IT stocks hurt the performance leading to underperformance. After two consecutive years of underperformance, small caps indices outperformed almost all major indices significantly. Some bit of that can be attributed to sharp fall in the small caps in previous two years and to that extent mean reversion was playing out. However, the rally was also supported by the strong growth many of the small cap companies are witnessing despite the COVID disruption. While the valuation discount argument in favor of small caps is no longer true, we continue to remain constructive on many of the small cap businesses due to their strong growth trajectory. AMC will continue to focus on these strong growth oriented companies available at fair valuations. HSEF is currently overweight in Consumer Discretionary, Specialty Chemicals and building material space while being underweight in FMCG, Financials and Technology.
Date of Inception : 19 May 2005 Absolute Returns
(%)
Compounded Annualized Returns (%)
Scheme Name & Benchmarks 1 Year 3 Years 5 Years Since Inception
HSBC Small Cap Equity Fund - Growth 105.10 3.51 11.99 12.43
S&P BSE 250 Small Cap Index TRI (Scheme Benchmark) 117.51 4.74 13.52 NA
Nifty 50 TRI (Standard Benchmark) 72.54 14.58 15.12 NA
Rs. 10,000, if invested in HSEF, would have become 20,510 11,095 17,621 64,245
Trustees’ ReportFor the year ended March 31, 2021
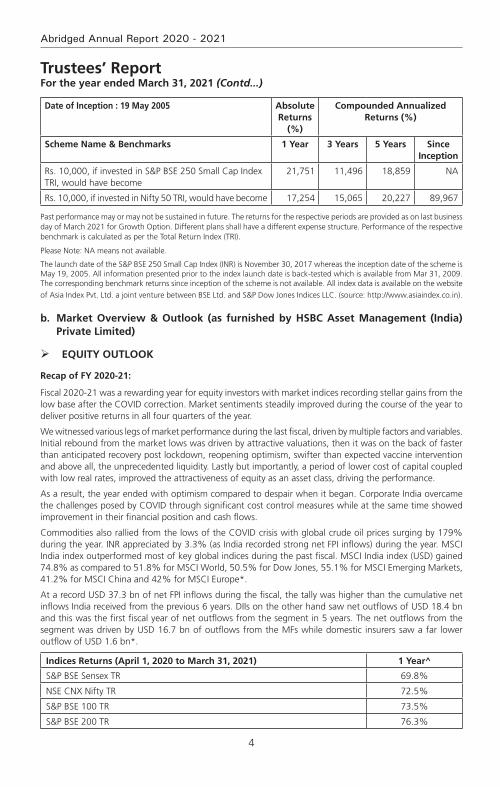
4
Abridged Annual Report 2020 - 2021
Date of Inception : 19 May 2005 Absolute Returns
(%)
Compounded Annualized Returns (%)
Scheme Name & Benchmarks 1 Year 3 Years 5 Years Since Inception
Rs. 10,000, if invested in S&P BSE 250 Small Cap Index TRI, would have become
21,751 11,496 18,859 NA
Rs. 10,000, if invested in Nifty 50 TRI, would have become 17,254 15,065 20,227 89,967
Past performance may or may not be sustained in future. The returns for the respective periods are provided as on last business day of March 2021 for Growth Option. Different plans shall have a different expense structure. Performance of the respective benchmark is calculated as per the Total Return Index (TRI).
Please Note: NA means not available.
The launch date of the S&P BSE 250 Small Cap Index (INR) is November 30, 2017 whereas the inception date of the scheme is May 19, 2005. All information presented prior to the index launch date is back-tested which is available from Mar 31, 2009. The corresponding benchmark returns since inception of the scheme is not available. All index data is available on the website
of Asia Index Pvt. Ltd. a joint venture between BSE Ltd. and S&P Dow Jones Indices LLC. (source: http://www.asiaindex.co.in).
b. Market Overview & Outlook (as furnished by HSBC Asset Management (India) Private Limited)
EqUITY OUTLOOk
Recap of FY 2020-21:
Fiscal 2020-21 was a rewarding year for equity investors with market indices recording stellar gains from the low base after the COVID correction. Market sentiments steadily improved during the course of the year to deliver positive returns in all four quarters of the year.
We witnessed various legs of market performance during the last fiscal, driven by multiple factors and variables. Initial rebound from the market lows was driven by attractive valuations, then it was on the back of faster than anticipated recovery post lockdown, reopening optimism, swifter than expected vaccine intervention and above all, the unprecedented liquidity. Lastly but importantly, a period of lower cost of capital coupled with low real rates, improved the attractiveness of equity as an asset class, driving the performance.
As a result, the year ended with optimism compared to despair when it began. Corporate India overcame the challenges posed by COVID through significant cost control measures while at the same time showed improvement in their financial position and cash flows.
Commodities also rallied from the lows of the COVID crisis with global crude oil prices surging by 179% during the year. INR appreciated by 3.3% (as India recorded strong net FPI inflows) during the year. MSCI India index outperformed most of key global indices during the past fiscal. MSCI India index (USD) gained 74.8% as compared to 51.8% for MSCI World, 50.5% for Dow Jones, 55.1% for MSCI Emerging Markets, 41.2% for MSCI China and 42% for MSCI Europe*.
At a record USD 37.3 bn of net FPI inflows during the fiscal, the tally was higher than the cumulative net inflows India received from the previous 6 years. DIIs on the other hand saw net outflows of USD 18.4 bn and this was the first fiscal year of net outflows from the segment in 5 years. The net outflows from the segment was driven by USD 16.7 bn of outflows from the MFs while domestic insurers saw a far lower outflow of USD 1.6 bn*.
Indices Returns (April 1, 2020 to March 31, 2021) 1 Year^
S&P BSE Sensex TR 69.8%
NSE CNX Nifty TR 72.5%
S&P BSE 100 TR 73.5%
S&P BSE 200 TR 76.3%
Trustees’ ReportFor the year ended March 31, 2021 (Contd...)
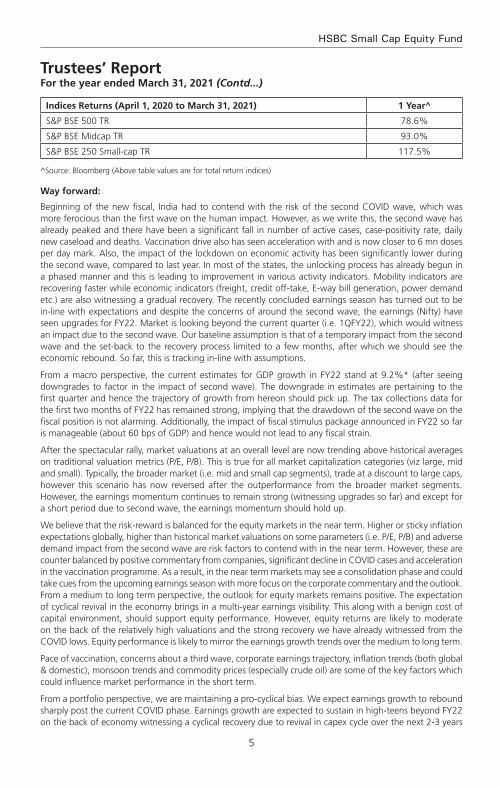
5
HSBC Small Cap Equity Fund
Indices Returns (April 1, 2020 to March 31, 2021) 1 Year^
S&P BSE 500 TR 78.6%
S&P BSE Midcap TR 93.0%
S&P BSE 250 Small-cap TR 117.5%
^Source: Bloomberg (Above table values are for total return indices)
Way forward:
Beginning of the new fiscal, India had to contend with the risk of the second COVID wave, which was more ferocious than the first wave on the human impact. However, as we write this, the second wave has already peaked and there have been a significant fall in number of active cases, case-positivity rate, daily new caseload and deaths. Vaccination drive also has seen acceleration with and is now closer to 6 mn doses per day mark. Also, the impact of the lockdown on economic activity has been significantly lower during the second wave, compared to last year. In most of the states, the unlocking process has already begun in a phased manner and this is leading to improvement in various activity indicators. Mobility indicators are recovering faster while economic indicators (freight, credit off-take, E-way bill generation, power demand etc.) are also witnessing a gradual recovery. The recently concluded earnings season has turned out to be in-line with expectations and despite the concerns of around the second wave, the earnings (Nifty) have seen upgrades for FY22. Market is looking beyond the current quarter (i.e. 1QFY22), which would witness an impact due to the second wave. Our baseline assumption is that of a temporary impact from the second wave and the set-back to the recovery process limited to a few months, after which we should see the economic rebound. So far, this is tracking in-line with assumptions.
From a macro perspective, the current estimates for GDP growth in FY22 stand at 9.2%* (after seeing downgrades to factor in the impact of second wave). The downgrade in estimates are pertaining to the first quarter and hence the trajectory of growth from hereon should pick up. The tax collections data for the first two months of FY22 has remained strong, implying that the drawdown of the second wave on the fiscal position is not alarming. Additionally, the impact of fiscal stimulus package announced in FY22 so far is manageable (about 60 bps of GDP) and hence would not lead to any fiscal strain.
After the spectacular rally, market valuations at an overall level are now trending above historical averages on traditional valuation metrics (P/E, P/B). This is true for all market capitalization categories (viz large, mid and small). Typically, the broader market (i.e. mid and small cap segments), trade at a discount to large caps, however this scenario has now reversed after the outperformance from the broader market segments. However, the earnings momentum continues to remain strong (witnessing upgrades so far) and except for a short period due to second wave, the earnings momentum should hold up.
We believe that the risk-reward is balanced for the equity markets in the near term. Higher or sticky inflation expectations globally, higher than historical market valuations on some parameters (i.e. P/E, P/B) and adverse demand impact from the second wave are risk factors to contend with in the near term. However, these are counter balanced by positive commentary from companies, significant decline in COVID cases and acceleration in the vaccination programme. As a result, in the near term markets may see a consolidation phase and could take cues from the upcoming earnings season with more focus on the corporate commentary and the outlook. From a medium to long term perspective, the outlook for equity markets remains positive. The expectation of cyclical revival in the economy brings in a multi-year earnings visibility. This along with a benign cost of capital environment, should support equity performance. However, equity returns are likely to moderate on the back of the relatively high valuations and the strong recovery we have already witnessed from the COVID lows. Equity performance is likely to mirror the earnings growth trends over the medium to long term.
Pace of vaccination, concerns about a third wave, corporate earnings trajectory, inflation trends (both global & domestic), monsoon trends and commodity prices (especially crude oil) are some of the key factors which could influence market performance in the short term.
From a portfolio perspective, we are maintaining a pro-cyclical bias. We expect earnings growth to rebound sharply post the current COVID phase. Earnings growth are expected to sustain in high-teens beyond FY22 on the back of economy witnessing a cyclical recovery due to revival in capex cycle over the next 2-3 years
Trustees’ ReportFor the year ended March 31, 2021 (Contd...)
6
Abridged Annual Report 2020 - 2021
(first by the government followed by private capex). From a sectoral perspective our order of preference is rate sensitives followed by domestic cyclicals, exporters and domestic consumption. Predominantly regulated businesses come last in our pecking order. This preference is dictated by our assessment of sectors / segments leading contribution to the market earnings growth over the next 2-3 years. Our portfolio construction is driven by a bottom up approach to stock selection with a focus on names that can deliver positive earnings surprises. We continue to focus on this theme to identify likely outperformers.
*Source: Bloomberg
DEBT OUTLOOk
Market drivers during the course of the year FY21
The Fixed Income markets started the year with a bout of nervousness that was triggered by the pandemic. While RBI had calmed the markets with its large rate cut action of 75bp cut followed by liquidity supportive measures, the volatility continued until mid-May when government announced its relief package. While it was not fiscally expansive, it touched the right cords in terms of credit flow to desired sectors. This was followed up with RBI’s credit relief measures in terms of moratorium and restructuring of assets that were stressed due to the pandemic. Throughout the course of the year, RBI maintained its accommodative stance along with significant amount of surplus liquidity that was supportive and helped in maintaining stability in the market. However, as the year progressed and pressure on fiscal began to mount yields started seeing a spike towards the last quarter of the fiscal. While borrowing was stepped up to INR 12 trillion from previously budgeted INR 7.8 trillion in May 2020, it was further enhanced by and additional INR 1.1 trillion in October 2020. Overall GOI ended up borrowing a record amount of INR 13.9 trillion. The budget proved to be a shocker with GOI using the pandemic as an opportunity for setting the finances in order. GOI showed a record deficit of 9.5% for FY21 and projected a 6.8% for FY22 with estimated central government gross borrowing of INR 12 trillion. This seemed to reverse the support RBI had provided throughout the year with benchmark 10-year bond peaking to 6.23% in mid –Feb 2021. RBI’s statements to remain supportive were left in the sidelines. Overall it seemed that the 115bp of rate cut, along with significant liquidity infusion (OMO + Twist operations of ~INR 3 trillion, infusion via dollar purchases) seemed only a little to help in applying a brake to the one-way spike in yields. The year closed ~6.16% with absence of concrete action by RBI.
RBI Policy: Through the course of the year, RBI has maintained an accommodative stance, with an aggregate 115bp of rate cut done in March and May 2020 taking the repo rate from 5.15% to 4%. Subsequently while inflation pressures prevented RBI from taking any direct actions, RBI has used a combination of creative tools to keep the rates contained primarily via liquidity supportive tools such as OMOs, Twist Operations, Repo linked Term loans to needy sectors (LTROs, TLTROs), CRR cuts. While inflation was a worry for most part of the year, RBI kept it aside admitting that growth was a priority and inflation effects are more supply side rather than demand side. Prospectively into FY22, with the onset of the second wave, RBI continues to maintain the stance to prioritize growth.
Inflation: Inflation for most part of the year stayed above 6% primarily driven by supply side pressures and some intermittent spike from food inflation as well. While it has been coming off since December with cooling off of food inflation and positive base effects, it has been between 4- 5.5%. Structurally however inflation risks continue to remain as oil prices have increased and base effects will not remain supportive for long. Core inflation continues to remain sticky.
Liquidity: During the year, system liquidity has remained at significant surplus facilitated largely by RBI action such as OMOs, foreign exchange operations and government spending.
Budget: The FY2022 union budget focuses on growth and has accordingly, presented a 9.5% fiscal deficit for FY21 and 6.8% for FY22. On the revenue side, the assumptions are largely realistic, with FY22 (E) Nominal GDP growth at 14.4% and tax revenue growth at 17% considering the pandemic impact in FY 21. Compared to FY20, tax revenue growth is ~10%. While non-tax revenues are ambitious pegging the divestment at INR 1.75 trillion, with robust pipeline of assets including monetization of road and transmission assets, execution remains the key as in the past. On the expenditure side, better quality capex spending with focusing on rail, road, defense, urban infra is positive for long term structural growth. The revenue side expenditure adjusting for clearance of past subsidy arrears will be similar to budgetary estimates. Government using this opportunity to bring back off-balance sheet spending to on-balance sheet was a welcome move towards transparency and showing realistic projections. Alongside, states have also been given leeway to borrow upto 4% of their
Trustees’ ReportFor the year ended March 31, 2021 (Contd...)
7
HSBC Small Cap Equity Fund
GDP with an additional 0.5% subject to conditions. Given that states are an important vehicle for capex investment, this move is welcome although it may entail additional state borrowing. The fiscal glide path is shifted to FY26 at below 4.5% for center and 3% for states suggesting that spending will continue and borrowing will come down gradually. In summary, from survival to revival, FY22 budget aims for structural growth leaving fiscal concerns sideways in the interim. Government’s intent seems clear on bringing back growth on the table, in a transparent manner.
While the second wave of the pandemic has once again derailed the revenue story, government will still have some cushion from its conservative estimates.
Currency and FII Flows: INR has been on an appreciation trajectory for most part of the year, aided by dollar underperformance supported by positive FII and FDI flows along with reduced imports on the domestic front as well. RBI has used most of the flows to accumulate reserves which has prevented any strong appreciation. Pandemic shock and global risk off led rupee over 75 in the beginning of the year only to close below 72 at the end of the fiscal year. While the second wave led to another spike in INR in April, it has since then cooled once again driven by dollar underperformance and pandemic recovery on the domestic front. Net FII flows was ~$30 bn with positive equity flows of~$37 bn while debt was negative ~$7bn and overall RBI’s forex reserves rose by a ~$100 bn to close ~$537 bn.
Credit growth: Credit growth for the entire year has been tepid as previous year’s credit events were followed by nervousness relating to the pandemic. Despite RBI opening up several windows to finance the non-AAA segment, there was very little fresh credit flowing that segment. Overall banking credit grew by only 6.5%. Risk appetite has however been improving from a complete risk aversion to opening up towards a calculated risk. Prospectively it is expected that once the pandemic risk abates, credit growth will resume primarily driven by government capex spending and demand recovery.
Market Outlook
The pandemic once again brought the country to a situation similar to last year and debt markets perhaps interpreted the same as a structural rise in rates. In the initial day’s post budget in Feb of 2021, market was expecting a concrete set of actions such as an OMO calendar from RBI, and RBI’s words alone failed to calm the market. The first auction of the fiscal year also saw a devolvement. However, RBI acted in the first policy of the year announcing a bond buyback program akin to QE (quantitative easing) and its subsequent cancellation of auctions wherein yields were perhaps quoted higher than RBI’s comfort levels brought back confidence into the market. Since then we have seen a strong rally with 10-year benchmark trending below 6% and the curve moving alongside. RBI reiteration of priority of growth and also supporting with higher than expected dividend payment stand out as a testimony of its support. While we do not expect RBI to act in terms of rate cuts, we believe that measures such as G-SAP, OMOs will continue until there is visibility of a structural growth. Therefore, the large borrowing program should go without any hiccups.
Furthermore, with the evidence of strong GST numbers until April 2021 (before the 2nd wave), it is expected that growth and therefore fiscal revenues will come back. Government’s conservative budget estimates are supportive. Also, given the fact that compared to last year there has not been a complete shutdown of activity (lockdowns being distributed), the impact on growth will not be similar to last year. Pent up demand will come back to support revenue collection. However, on the flipside, once growth resumes RBI will be forced to withdraw liquidity in a phased manner to prevent asset bubbles. Nevertheless, RBI need not act in terms of rate actions and we believe that a prolonged pause in terms of RBI rates is in the offing.
Net-net therefore while growth is wanting no matter what, it may come at a small price of rise in yields with liquidity withdrawal. That is however expected more in the 2nd half of the year. Lower than expected borrowing numbers, later this year or if not in next year could be a surprise. We may therefore see a range bound rate action in the near term with a rising bias over time. Global rate environment, oil and currency risks are to be watched out for.
2. BRIEF BACkGROUND OF SPONSORS, BOARD OF TRUSTEES AND ASSET MANAGEMENT COMPANY
a. Sponsor
HSBC Mutual Fund is sponsored by HSBC Securities and Capital Markets (India) Private Limited (HSCI). The Sponsor is the Settler of the Mutual Fund Trust. The Sponsor has entrusted a sum of Rs. 1,00,000/- (Rupees One Lakh only) to the Trustee as the initial contribution towards the corpus of the Mutual Fund.
Trustees’ ReportFor the year ended March 31, 2021 (Contd...)

8
Abridged Annual Report 2020 - 2021
HSCI offers integrated investment banking services, securities and corporate finance & advisory. HSCI is a member of the Bombay Stock Exchange Limited and National Stock Exchange (capital and derivative market segments). HSCI holds 100% of the paid up equity share capital of HSBC Asset Management (India) Private Limited.
b. HSBC Mutual Fund
HSBC Mutual Fund (“the Mutual Fund” or “the Fund”) has been constituted as a Trust in accordance with the provisions of the Indian Trusts Act, 1882 (2 of 1882) vide a Trust Deed dated February 7, 2002 with HSBC Securities and Capital Markets (India) Private Limited, as the Sponsor and the Board of Individual Trustees. The Trustee has entered into an Investment Management Agreement dated February 7, 2002 with HSBC Asset Management (India) Private Limited (AMC) to function as the Investment Manager for all the schemes of the Fund. The Fund was registered with SEBI vide registration number MF/046/02/5 dated May 27, 2002.
The Trust has been formed for the purpose of pooling of capital from the public for collective investment in securities for the purpose of providing facilities for participation by persons as beneficiaries in such investments and in the profits/income arising therefrom.
c. Board of Trustees (the Trustees)
The Board of Trustees is the exclusive owner of the Trust Fund and holds the same in trust for the benefit of the unit holders. The Trustees have been discharging their duties and carrying out the responsibilities as provided in the SEBI (Mutual Funds) Regulations, 1996 and the Trust Deed. The Trustees seek to ensure that the Fund and the schemes floated there under are managed by the AMC in accordance with the Trust Deed, the said Regulations, directions and guidelines issued by the SEBI, the Stock Exchanges, the Association of Mutual Funds in India and other regulatory agencies.
d. Asset Management Company (the AMC)
HSBC Asset Management (India) Private Limited (the Investment Manager or the AMC) is a private limited company incorporated under the Companies Act, 1956 on December 12, 2001 having its Registered Office at 16, V. N. Road, Fort, Mumbai 400 001. HSBC Asset Management (India) Private Limited has been appointed as the Asset Management Company of HSBC Mutual Fund by the Trustee vide Investment Management Agreement (IMA) dated February 7, 2002 and executed between the Trustees and the AMC. SEBI approved the AMC to act as the Investment Manager of the Fund vide its letter No. MFD/BC/163/2002 dated May 27, 2002. The paid-up equity share capital of the AMC is Rs. 61.59 crores. The AMC is registered as a Portfolio Manager under the SEBI (Portfolio Managers) Regulations, 1993 vide registration no. INP000001322. The AMC also offers non-binding Advisory services to offshore funds under the mutual fund license.
HSBC Securities and Capital Markets (India) Private Limited holds 100% of the paid up equity share capital of the AMC.
3. INvESTMENT OBJECTIvE OF THE SCHEMESThe investment objective of the respective schemes has been provided above under the heading “Scheme Performance, Future Outlook and Operation of the Scheme” (Refer Section 1).
4. SIGNIFICANT ACCOUNTING POLICIES The Significant Accounting Policies form part of the Notes to the Accounts annexed to the Balance Sheet of the Schemes in the Full Annual Report. The accounting policies are in accordance with Securities Exchange Board of India (Mutual Funds) Regulations 1996.
5. UNCLAIMED DIvIDENDS & REDEMPTIONSSummary of number of investors & corresponding amount Scheme-wise as on March 31, 2021
SchemeUnclaimed Dividend Unclaimed Redemption
Amount (Rs.) No. of Investors
Amount (Rs.) No. of Investors
HSBC Small cap Equity Fund 3,373,095.90 1307 1,546,774.30 90
Trustees’ ReportFor the year ended March 31, 2021 (Contd...)

9
HSBC Small Cap Equity Fund
Trustees’ ReportFor the year ended March 31, 2021 (Contd...)
6. INvESTOR SERvICESThe number of official points of acceptance of transactions is 204 locations. In addition to the offices of the Registrar & Transfer agents, the AMC has Investor Service Centers in 9 locations at its own offices - namely Mumbai, New Delhi, Kolkata, Bangalore, Pune, Ahmedabad, Hyderabad, Chandigarh and Chennai. With a view to enhance customer convenience, the AMC has the facility of priority based servicing to key distributors through the enhancement of the Interactive Voice Reponses. The AMC has 2 Toll Free numbers (1-800-200-2434 /1-800-258-2434) which can be dialed from anywhere in India and 1 number i.e +91 44 39923900 (Investors calling from abroad). The call center service is being managed by the Registrar and Transfer Agents. Transactions for purchase / redemption of units in the schemes HSBC Mutual Fund can also be made through the online transaction facility on the AMC’s website at https://invest.assetmanagement.hsbc.co.in.
On the distribution front, the number of empaneled distributors was 1069 as on March 31, 2021. During the year, the AMC initiated tie-ups for online distribution of the Mutual Fund’s schemes with several channel partners taking the total number of such tie-ups to 52.
7. DETAILS OF INvESTOR GRIEvANCE REDRESSALThe details of the redressal of investor complaints received against HSBC Mutual Fund during April 2020 - March 2021 are as follows:
2020-2021Com-plaint Code
Type of complaint# (a) No. of complaints pending at the begin-ning of the
year
(b) No. of Com-
plaints received during
the year
Action on (a) and (b)
Resolved Non Action-
able
Pending
Within 30
days
30 - 60 days
60 - 180 days
Beyond 180 days
0 - 3 months
3 - 6 months
6 - 9 months
9 - 12 months
I A Non receipt of Dividend on Units
0 0 0 0 0 0 0 0 0 0 0
I B Interest on delayed payment of Dividend
0 0 0 0 0 0 0 0 0 0 0
I C Non receipt of Redemption Proceeds
0 8 7 0 0 0 0 1 0 0 0
I D Interest on delayed payment of Redemption
0 0 0 0 0 0 0 0 0 0 0
II A Non receipt of Statement of Account / Unit Certificate
0 0 0 0 0 0 0 0 0 0 0
II B Discrepancy in Statement of Account
0 1 1 0 0 0 0 0 0 0 0
II C Data corrections in Investor details **
0 12 12 0 0 0 0 0 0 0 0
II D Non receipt of Annual Report/Abridged Summary
0 0 0 0 0 0 0 0 0 0 0
III A Wrong switch between Schemes
0 0 0 0 0 0 0 0 0 0 0
III B Unauthorized switch between Schemes
0 0 0 0 0 0 0 0 0 0 0
III C Deviation from Scheme attributes
0 0 0 0 0 0 0 0 0 0 0
III D Wrong or excess charges/load
0 0 0 0 0 0 0 0 0 0 0
III E Non updation of changes viz. address, PAN, bank details, nomination, etc
0 6 6 0 0 0 0 0 0 0 0
IV Others 0 15 15 0 0 0 0 0 0 0 0
Total 0 42 41 0 0 0 0 1 0 0 0

10
Abridged Annual Report 2020 - 2021
Summary of Complaints for FY 2020-21
Particulars Count
Total complaints received 42
Total number of folios 148770
% of complaints against the folio 0.028%
# active folios
** As per AMFI Best Practice Guidelines Circular No. 25/2011-12 for Revisions in the Guidelines on Standardization of Complaints / Grievances Reporting Procedure. If “Others” include a type of complaint which is more than 10% of overall complaints, then such a reason should be provided separately. Hence data corrections in Investor Details is included as a separate category
* Non actionable means the complaint is incomplete / outside the scope of the mutual fund
8. INvESTOR EDUCATION INITIATIvES
Investor awareness advertisements were published in Mutual Fund Insight magazine on a monthly basis along with an editorial on ‘SIP Sahi Hai’. Additionally, monthly articles / blogs have been written by Advisorkhoj on IAP which talks of the advantages of SIP, start early, power of compounding, diversification, asset allocation etc. The same is promoted by the publisher via an email to their entire network and also on their social media handles which can be retweeted or liked. Also, educative infographics have been hosted on our website under the investor resources section. The same have also been circulated to existing Indian investors via email for engagement and for educative purposes.
9. PROxY vOTING POLICY
In terms of SEBI Circular no. SEBI/IMD/CIR No. 18/198647/2010 dated March 15, 2010, the Fund has adopted Proxy Voting Policy and Procedures for exercising voting rights in respect of securities held by the Schemes.
The summary of the votes casted in the general meetings of the Investee companies, by the AMC for and on behalf of the Schemes of the Fund, for the financial year 2020-2021 is provided below:
quarter Total no. of resolutions
Break-up of vote decision
For Against Abstained
June 2020 50 43 6 1
September 2020 752 656 38 58
December 2020 41 31 1 9
March 2021 40 30 8 2
Total 883 760 53 70
In terms of the requirement of SEBI Circular no. CIR/IMD/DF/05/2014 dated March 24, 2014 and SEBI/HO/IMD/DF2/CIR/P/2016/68 dated August 10, 2016; the AMC has obtained certificate from M/s. M. P. Chitale & Co., Chartered Accountants, who is acting as a Scrutinizer, on the voting report for the FY 2020-21. The certificate dated April 14, 2021 issued by M/s. M. P. Chitale & Co., is available on the website of the AMC as part of the full Annual Report.
Unit holders can refer to the full Annual Report for complete details of actual exercise of votes in the general meetings of the investee companies for the financial year 2020-21 or log on to our website at www.assetmanagement.hsbc.co.in.
10. STATUTORY DETAILS
a) The Sponsors are not responsible or liable for any loss resulting from the operation of the Schemes of the Fund beyond initial contribution of Rs. 1 lakh for setting up the Fund.
Trustees’ ReportFor the year ended March 31, 2021 (Contd...)
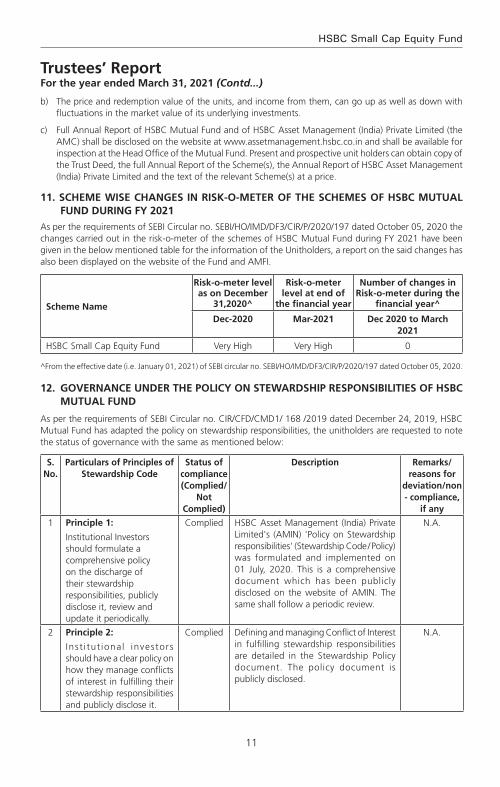
11
HSBC Small Cap Equity Fund
Trustees’ ReportFor the year ended March 31, 2021 (Contd...)
b) The price and redemption value of the units, and income from them, can go up as well as down with fluctuations in the market value of its underlying investments.
c) Full Annual Report of HSBC Mutual Fund and of HSBC Asset Management (India) Private Limited (the AMC) shall be disclosed on the website at www.assetmanagement.hsbc.co.in and shall be available for inspection at the Head Office of the Mutual Fund. Present and prospective unit holders can obtain copy of the Trust Deed, the full Annual Report of the Scheme(s), the Annual Report of HSBC Asset Management (India) Private Limited and the text of the relevant Scheme(s) at a price.
11. SCHEME WISE CHANGES IN RISk-O-METER OF THE SCHEMES OF HSBC MUTUAL FUND DURING FY 2021
As per the requirements of SEBI Circular no. SEBI/HO/IMD/DF3/CIR/P/2020/197 dated October 05, 2020 the changes carried out in the risk-o-meter of the schemes of HSBC Mutual Fund during FY 2021 have been given in the below mentioned table for the information of the Unitholders, a report on the said changes has also been displayed on the website of the Fund and AMFI.
Scheme Name
Risk-o-meter level as on December
31,2020^
Risk-o-meter level at end of
the financial year
Number of changes in Risk-o-meter during the
financial year^
Dec-2020 Mar-2021 Dec 2020 to March 2021
HSBC Small Cap Equity Fund Very High Very High 0
^From the effective date (i.e. January 01, 2021) of SEBI circular no. SEBI/HO/IMD/DF3/CIR/P/2020/197 dated October 05, 2020.
12. GOvERNANCE UNDER THE POLICY ON STEWARDSHIP RESPONSIBILITIES OF HSBC MUTUAL FUND
As per the requirements of SEBI Circular no. CIR/CFD/CMD1/ 168 /2019 dated December 24, 2019, HSBC Mutual Fund has adapted the policy on stewardship responsibilities, the unitholders are requested to note the status of governance with the same as mentioned below:
S. No.
Particulars of Principles of Stewardship Code
Status of compliance (Complied/
Not Complied)
Description Remarks/reasons for
deviation/non - compliance,
if any
1 Principle 1:
Institutional Investors should formulate a comprehensive policy on the discharge of their stewardship responsibilities, publicly disclose it, review and update it periodically.
Complied HSBC Asset Management (India) Private Limited's (AMIN) 'Policy on Stewardship responsibilities' (Stewardship Code / Policy) was formulated and implemented on 01 July, 2020. This is a comprehensive document which has been publicly disclosed on the website of AMIN. The same shall follow a periodic review.
N.A.
2 Principle 2:
Inst i tut ional investors should have a clear policy on how they manage conflicts of interest in fulfilling their stewardship responsibilities and publicly disclose it.
Complied Defining and managing Conflict of Interest in fulfilling stewardship responsibilities are detailed in the Stewardship Policy document. The policy document is publicly disclosed.
N.A.
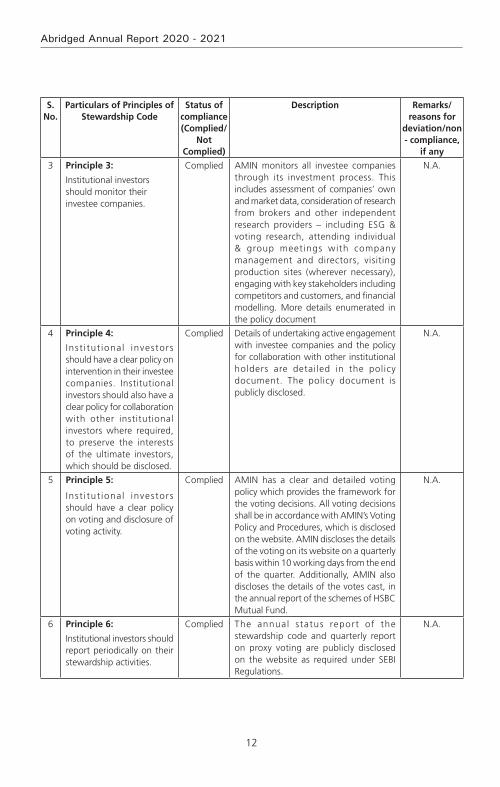
12
Abridged Annual Report 2020 - 2021
S. No.
Particulars of Principles of Stewardship Code
Status of compliance (Complied/
Not Complied)
Description Remarks/reasons for
deviation/non - compliance,
if any
3 Principle 3:
Institutional investors should monitor their investee companies.
Complied AMIN monitors all investee companies through its investment process. This includes assessment of companies’ own and market data, consideration of research from brokers and other independent research providers – including ESG & voting research, attending individual & group meetings with company management and directors, visiting production sites (wherever necessary), engaging with key stakeholders including competitors and customers, and financial modelling. More details enumerated in the policy document
N.A.
4 Principle 4:
Inst i tut ional investors should have a clear policy on intervention in their investee companies. Institutional investors should also have a clear policy for collaboration with other institutional investors where required, to preserve the interests of the ultimate investors, which should be disclosed.
Complied Details of undertaking active engagement with investee companies and the policy for collaboration with other institutional holders are detailed in the policy document. The policy document is publicly disclosed.
N.A.
5 Principle 5:
Inst i tut ional investors should have a clear policy on voting and disclosure of voting activity.
Complied AMIN has a clear and detailed voting policy which provides the framework for the voting decisions. All voting decisions shall be in accordance with AMIN’s Voting Policy and Procedures, which is disclosed on the website. AMIN discloses the details of the voting on its website on a quarterly basis within 10 working days from the end of the quarter. Additionally, AMIN also discloses the details of the votes cast, in the annual report of the schemes of HSBC Mutual Fund.
N.A.
6 Principle 6:
Institutional investors should report periodically on their stewardship activities.
Complied The annual status report of the stewardship code and quarterly report on proxy voting are publicly disclosed on the website as required under SEBI Regulations.
N.A.
13
HSBC Small Cap Equity Fund
13. SIGNIFICANT EvENT AFTER THE END OF THE FINANCIAL YEAR
HSBC Global Consumer Opportunities Fund (HGCOF) has been merged with HSBC Asia Pacific (Ex Japan) Dividend Yield Fund with effect from May 13, 2021. Therefore, HGCOF has been ceased to exist from the aforesaid date.
14. ACkNOWLEDGEMENTS
The Trustees wish to thank the Unit holders of the Schemes for their support throughout the year and also thank the Government of India, the Securities and Exchange Board of India (SEBI), the Reserve Bank of India (RBI) and the Association of Mutual Funds in India (AMFI) for the guidance provided by them. The Trustees also appreciate the services provided by the Registrar and Transfer Agent, Fund Accountant, Custodian, Bankers, Distributors and Brokers. The guidance and services provided by the Auditors and advocates and the ebullience, sincerity and dedication of the employees of HSBC Asset Management (India) Private Limited is also appreciated.
The Trustees look forward to the continued support of everyone.
For and on behalf of the Board of Trustees of HSBC Mutual Fund
Sd/-
Trustee
Mumbai
July 20, 2021.
14
Abridged Annual Report 2020 - 2021
To the Trustees of HSBC Mutual Fund
HSBC Small Cap Equity Fund
Report on the Audit of the Financial Statements
Opinion
We have audited the financial statements of HSBC Small Cap Equity Fund (the ‘Scheme’) of HSBC Mutual Fund, which comprise the balance sheet as at 31 March 2021 and the revenue account and cash flow statement for the year then ended, and notes to the financial statements, including a summary of the significant accounting policies.
In our opinion and to the best of our information and according to the explanations given to us, the aforesaid financial statements give a true and fair view in conformity with the accounting principles generally accepted in India, of the state of affairs of the Scheme as at 31 March 2021, its net surplus and cash flows for the year ended on that date.
Basis for Opinion
We conducted our audit in accordance with the Standards on Auditing (‘SAs’) issued by the Institute of Chartered Accountants of India (the ‘ICAI’). Our responsibilities under those SAs are further described in the Auditor’s Responsibilities for the Audit of the Financial Statements section of our report. We are independent of the Scheme in accordance with the Code of Ethics issued by the ICAI, and we have fulfilled our other ethical responsibilities in accordance with the Code of Ethics. We believe that the audit evidence we have obtained is sufficient and appropriate to provide a basis for our opinion.
Responsibilities of Management and Those Charged with Governance for the Financial Statements
The Scheme’s management, the Board of Directors of HSBC Mutual Fund (the ‘Trustees’) and the Board of Directors of HSBC Asset Management (India) Private Limited (the ‘AMC’) (collectively referred to as ‘Management’) are responsible for the preparation of these financial statements that give a true and fair view of the state of affairs, results of operations and cash flows of the Scheme in accordance with the accounting policies and standards specified in the Ninth Schedule of the Securities and Exchange Board of India (Mutual Funds) Regulations, 1996, as amended (the ‘Regulations’) and the accounting principles generally accepted in India. This responsibility includes design, implementation and maintenance of internal control relevant to the preparation and presentation of the financial statements that give a true and fair view and are free from material misstatement, whether due to fraud or error.
In preparing the financial statements, management is responsible for assessing the Scheme’s ability to continue as a going concern, disclosing, as applicable, matters related to going concern and using the going concern basis of accounting unless management either intends to liquidate the Scheme or to cease operations, or has no realistic alternative but to do so.
The management is responsible for overseeing the Scheme’s financial reporting process.
Auditor’s Responsibilities for the Audit of the Financial Statements
Our objectives are to obtain reasonable assurance about whether the financial statements as a whole are free from material misstatement, whether due to fraud or error, and to issue an auditor’s report that includes our opinion. Reasonable assurance is a high level of assurance, but is not a guarantee that an audit conducted in accordance with SAs will always detect a material misstatement when it exists. Misstatements can arise from fraud or error and are considered material if, individually or in the aggregate, they could reasonably be expected to influence the economic decisions of users taken on the basis of these financial statements.
As part of an audit in accordance with SAs, we exercise professional judgment and maintain professional skepticism throughout the audit. We also:
• Identifyandassesstherisksofmaterialmisstatementofthefinancialstatements,whetherduetofraudor error, design and perform audit procedures responsive to those risks, and obtain audit evidence that is sufficient and appropriate to provide a basis for our opinion. The risk of not detecting a material
Independent Auditors’ Report

15
HSBC Small Cap Equity Fund
Independent Auditors’ Report (Contd...)
misstatement resulting from fraud is higher than for one resulting from error, as fraud may involve collusion, forgery, intentional omissions, misrepresentations, or the override of internal control;
• Obtainanunderstandingofinternalcontrolrelevanttotheauditinordertodesignauditproceduresthat are appropriate in the circumstances, but not for the purpose of expressing an opinion on the effectiveness of the Scheme’s internal controls;
• Evaluatetheappropriatenessofaccountingpoliciesusedandthereasonablenessofaccountingestimatesand related disclosures made by Management;
• ConcludeontheappropriatenessofManagement’suseofthegoingconcernbasisofaccountingand,based on the audit evidence obtained, whether a material uncertainty exists related to events or conditions that may cast significant doubt on the Scheme’s ability to continue as a going concern. If we conclude that a material uncertainty exists, we are required to draw attention in our auditor’s report to the related disclosures in the financial statements or, if such disclosures are inadequate, to modify our opinion. Our conclusions are based on the audit evidence obtained up to the date of our auditor’s report. However, future events or conditions may cause the Scheme to cease to continue as a going concern;
• Evaluate the overall presentation, structure and content of the financial statements, including thedisclosures and whether the financial statements represent the underlying transactions and events in a manner that achieves fair presentation.
We communicate with those charged with governance regarding, among other matters, the planned scope and timing of the audit and significant audit findings, including any significant deficiencies in internal control that we identify during our audit.
We also provide those charged with governance with a statement that we have complied with relevant ethical requirements regarding independence, and to communicate with them all relationships and other matters that may reasonably be thought to bear on our independence, and where applicable, related safeguards.
Report on Other Legal and Regulatory Requirements
1 As required by Regulation 55 (4) of the Regulations, we report that:
(a) We have obtained all information and explanations which, to the best of our knowledge and belief, were necessary for the purposes of the audit; and
(b) The balance sheet and the revenue account have been prepared in accordance with the accounting policies and standards as specified in the Ninth Schedule of the Regulations.
2 As required by Clause 5 (ii) (2) of the Eleventh Schedule of the Regulations, we report that the balance sheet and the revenue account are in agreement with the books of account of the Scheme.
For B S R & Co. LLP Chartered Accountants Firm’s Registration No: 101248W/W-100022
Sd/-
Ajit Viswanath PartnerMembership No: 067114UDIN : 21067114AAAADP8051
Place : Mumbai Date : July 20, 2021.

16
Abridged Annual Report 2020 - 2021
Rs. in Lakhs
As at March 31, 2021
As at March 31, 2020
LIABILITIES1 Unit Capital 6,236.58 9,442.74 2 Reserves & Surplus2.1 Unit Premium Reserves 475.34 4,837.99 2.2 Unrealised Appreciation Reserve 11,038.63 –2.3 Other Reserves 14,774.16 10,407.62 3 Loans & Borrowings4 Current Liabilities & Provisions4.1 Provision for Doubtful Income/Deposits – –4.2 Other Current Liabilities & Provisions 387.28 268.61
TOTAL 32,911.99 24,956.96
ASSETS1 Investments1.1 Listed Securities:1.1.1 Equity Shares 32,336.30 23,252.61 1.1.2 Preference Shares – – 1.1.3 Equity Linked Debentures – – 1.1.4 Other Debentures & Bonds – – 1.1.5 Securitised Debt Securities – –
1.2 Securities Awaited Listing:1.2.1 Equity Shares – 6.66 1.2.2 Preference Shares – – 1.2.3 Equity Linked Debentures – – 1.2.4 Other Debentures & Bonds – – 1.2.5 Securitised Debt Securities – –
1.3 Unlisted Securities:1.3.1 Equity Shares – – 1.3.2 Preference Shares – – 1.3.3 Equity Linked Debentures – – 1.3.4 Other Debentures & Bonds – – 1.3.5 Securitised Debt Securities – – 1.4 Government Securities – – 1.5 Treasury Bills – – 1.6 Commercial Paper – – 1.7 Certificate of Deposits – – 1.8 Bill Rediscounting – – 1.9 Units of Domestic Mutual Fund – – 1.10 Foreign Securities – –
Total Investments 32,336.30 23,259.27
2 Deposits 1.75 1.50 3 Other Current Assets3.1 Cash & Bank Balance 10.78 6.05 3.2 TREPS / Reverse Repo Lending 290.06 1,593.17 3.3 Others 273.10 96.97 4 Deferred Revenue Expenditure (to the extent not written off) – –
TOTAL 32,911.99 24,956.96
Notes to Accounts - Annexure I
Abridged Balance Sheet as at March 31, 2021
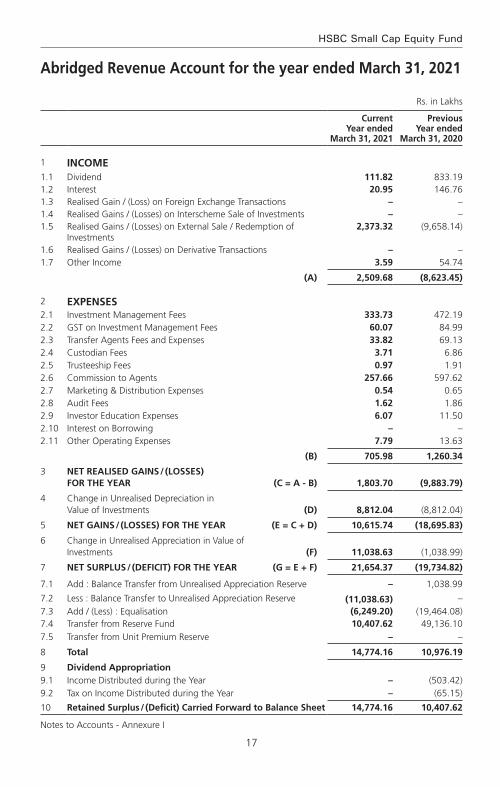
17
HSBC Small Cap Equity Fund
Abridged Revenue Account for the year ended March 31, 2021
Rs. in Lakhs
Current Year ended
March 31, 2021
Previous Year ended
March 31, 2020
1 INCOME1.1 Dividend 111.82 833.19 1.2 Interest 20.95 146.76 1.3 Realised Gain / (Loss) on Foreign Exchange Transactions – – 1.4 Realised Gains / (Losses) on Interscheme Sale of Investments – – 1.5 Realised Gains / (Losses) on External Sale / Redemption of
Investments 2,373.32 (9,658.14)
1.6 Realised Gains / (Losses) on Derivative Transactions – – 1.7 Other Income 3.59 54.74
(A) 2,509.68 (8,623.45)
2 ExPENSES2.1 Investment Management Fees 333.73 472.19 2.2 GST on Investment Management Fees 60.07 84.99 2.3 Transfer Agents Fees and Expenses 33.82 69.13 2.4 Custodian Fees 3.71 6.86 2.5 Trusteeship Fees 0.97 1.91 2.6 Commission to Agents 257.66 597.62 2.7 Marketing & Distribution Expenses 0.54 0.65 2.8 Audit Fees 1.62 1.86 2.9 Investor Education Expenses 6.07 11.50 2.10 Interest on Borrowing – –2.11 Other Operating Expenses 7.79 13.63
(B) 705.98 1,260.34
3 NET REALISED GAINS / (LOSSES) FOR THE YEAR (C = A - B) 1,803.70 (9,883.79)
4 Change in Unrealised Depreciation in Value of Investments (D) 8,812.04 (8,812.04)
5 NET GAINS / (LOSSES) FOR THE YEAR (E = C + D) 10,615.74 (18,695.83)
6 Change in Unrealised Appreciation in Value of Investments (F) 11,038.63 (1,038.99)
7 NET SURPLUS / (DEFICIT) FOR THE YEAR (G = E + F) 21,654.37 (19,734.82)
7.1 Add : Balance Transfer from Unrealised Appreciation Reserve – 1,038.99
7.2 Less : Balance Transfer to Unrealised Appreciation Reserve (11,038.63) – 7.3 Add / (Less) : Equalisation (6,249.20) (19,464.08)7.4 Transfer from Reserve Fund 10,407.62 49,136.10
7.5 Transfer from Unit Premium Reserve – –
8 Total 14,774.16 10,976.19
9 Dividend Appropriation9.1 Income Distributed during the Year – (503.42)9.2 Tax on Income Distributed during the Year – (65.15)
10 Retained Surplus / (Deficit) Carried Forward to Balance Sheet 14,774.16 10,407.62
Notes to Accounts - Annexure I

18
Abridged Annual Report 2020 - 2021
key Statistics for the year ended March 31, 2021
Current Year ended
March 31, 2021
Previous Year ended
March 31, 2020
1. NAV per unit (Rs.):
Open
Growth Option 31.3039 50.3996
IDCW Option 11.4695 19.9669
Direct Plan - Growth Option 33.2412 52.8019
Direct Plan - IDCW Option 14.5087 24.5461
High
Growth Option 65.5179 50.9137
IDCW Option 24.0053 20.1705
Direct Plan - Growth Option 70.4908 53.3423
Direct Plan - IDCW Option 30.7630 24.7973
Low
Growth Option 30.4236 29.1528
IDCW Option 11.1470 10.6814
Direct Plan - Growth Option 32.3104 30.9480
Direct Plan - IDCW Option 14.1025 13.5078
End
Growth Option 64.2047 31.3039
IDCW Option 23.5242 11.4695
Direct Plan - Growth Option 69.1529 33.2412
Direct Plan - IDCW Option 30.1786 14.5087
2. Closing Assets Under Management (Rs. in Lakhs)
End 32,543 24,650
Average (AAuM)1 30,364 57,496
3. Gross income as % of AAuM2 8.27% -15.00%
4. Expense Ratio:
a. Total Expense as % of AAuM (including GST on Management fees) (planwise)
Regular Plan (Continue) 2.51% 2.39%
Direct Plan 1.10% 1.07%
b. Management Fee as % of AAuM (planwise)
Regular Plan (Continue) 1.15% 0.84%
Direct Plan 0.77% 0.74%
5. Net Income as a percentage of AAuM3 5.94% -17.19%
6. Portfolio turnover ratio4 0.46 0.56
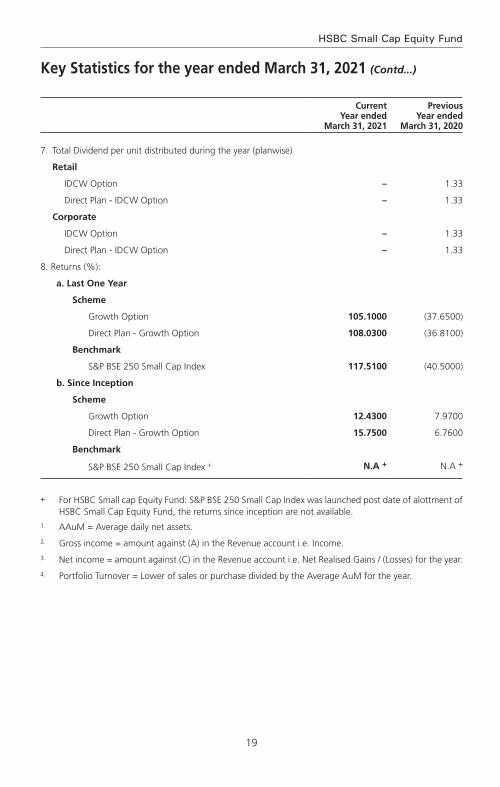
19
HSBC Small Cap Equity Fund
Current Year ended
March 31, 2021
Previous Year ended
March 31, 2020
7. Total Dividend per unit distributed during the year (planwise)
Retail
IDCW Option – 1.33
Direct Plan - IDCW Option – 1.33
Corporate
IDCW Option – 1.33
Direct Plan - IDCW Option – 1.33
8. Returns (%):
a. Last One Year
Scheme
Growth Option 105.1000 (37.6500)
Direct Plan - Growth Option 108.0300 (36.8100)
Benchmark
S&P BSE 250 Small Cap Index 117.5100 (40.5000)
b. Since Inception
Scheme
Growth Option 12.4300 7.9700
Direct Plan - Growth Option 15.7500 6.7600
Benchmark
S&P BSE 250 Small Cap Index + N.A + N.A +
+ For HSBC Small cap Equity Fund: S&P BSE 250 Small Cap Index was launched post date of alottment of HSBC Small Cap Equity Fund, the returns since inception are not available.
1. AAuM = Average daily net assets.
2. Gross income = amount against (A) in the Revenue account i.e. Income.
3. Net income = amount against (C) in the Revenue account i.e. Net Realised Gains / (Losses) for the year.
4. Portfolio Turnover = Lower of sales or purchase divided by the Average AuM for the year.
key Statistics for the year ended March 31, 2021 (Contd...)
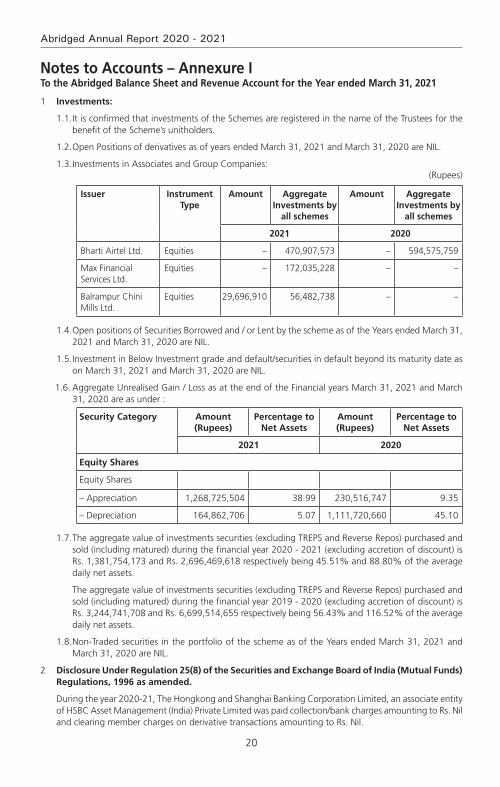
20
Abridged Annual Report 2020 - 2021
Notes to Accounts – Annexure ITo the Abridged Balance Sheet and Revenue Account for the Year ended March 31, 2021
1 Investments:
1.1. It is confirmed that investments of the Schemes are registered in the name of the Trustees for the benefit of the Scheme’s unitholders.
1.2. Open Positions of derivatives as of years ended March 31, 2021 and March 31, 2020 are NIL.
1.3. Investments in Associates and Group Companies:(Rupees)
Issuer Instrument Type
Amount Aggregate Investments by
all schemes
Amount Aggregate Investments by
all schemes
2021 2020
Bharti Airtel Ltd. Equities – 470,907,573 – 594,575,759
Max Financial Services Ltd.
Equities – 172,035,228 – –
Balrampur Chini Mills Ltd.
Equities 29,696,910 56,482,738 – –
1.4. Open positions of Securities Borrowed and / or Lent by the scheme as of the Years ended March 31, 2021 and March 31, 2020 are NIL.
1.5. Investment in Below Investment grade and default/securities in default beyond its maturity date as on March 31, 2021 and March 31, 2020 are NIL.
1.6. Aggregate Unrealised Gain / Loss as at the end of the Financial years March 31, 2021 and March 31, 2020 are as under :
Security Category Amount (Rupees)
Percentage to Net Assets
Amount (Rupees)
Percentage to Net Assets
2021 2020
Equity Shares
Equity Shares
– Appreciation 1,268,725,504 38.99 230,516,747 9.35
– Depreciation 164,862,706 5.07 1,111,720,660 45.10
1.7. The aggregate value of investments securities (excluding TREPS and Reverse Repos) purchased and sold (including matured) during the financial year 2020 - 2021 (excluding accretion of discount) is Rs. 1,381,754,173 and Rs. 2,696,469,618 respectively being 45.51% and 88.80% of the average daily net assets.
The aggregate value of investments securities (excluding TREPS and Reverse Repos) purchased and sold (including matured) during the financial year 2019 - 2020 (excluding accretion of discount) is Rs. 3,244,741,708 and Rs. 6,699,514,655 respectively being 56.43% and 116.52% of the average daily net assets.
1.8. Non-Traded securities in the portfolio of the scheme as of the Years ended March 31, 2021 and March 31, 2020 are NIL.
2 Disclosure Under Regulation 25(8) of the Securities and Exchange Board of India (Mutual Funds) Regulations, 1996 as amended.
During the year 2020-21, The Hongkong and Shanghai Banking Corporation Limited, an associate entity of HSBC Asset Management (India) Private Limited was paid collection/bank charges amounting to Rs. Nil and clearing member charges on derivative transactions amounting to Rs. Nil.

21
HSBC Small Cap Equity Fund
During the year 2019-20, The Hongkong and Shanghai Banking Corporation Limited, an associate entity of HSBC Asset Management (India) Private Limited was paid collection/bank charges amounting to Rs. Nil and clearing member charges on derivative transactions amounting to Rs. Nil.
Details of amounts paid to associates in terms of Regulation 25 (8) are as follows :
Commission paid to Sponsor/AMC and its associates/related parties/group companies
Name of Sponsor/AMC and its associates/related parties/group companies
Nature of Association / Nature of
Relation
Period Covered
Business Given [Rs. in Crores]
% of Total Business
received by the Fund
Commission paid [Rs.]
% of Total commission paid by the
Fund
The Hongkong and Shanghai Banking Corporation Limited
Associate of Investment Manager
2020-2021 5.99 28.73 11,148,082 48.65
Name of Sponsor/AMC and its associates/related parties/group companies
Nature of Association / Nature of
Relation
Period Covered
Business Given [Rs. in Crores]
% of Total Business
received by the Fund
Commission paid [Rs.]
% of Total commission paid by the
Fund
The Hongkong and Shanghai Banking Corporation Limited
Associate of Investment Manager
2019-2020 15.08 17.90 16,269,153.00 29.43
Brokerage paid to Sponsor/AMC and its associates/related parties/group companies
Name of Sponsor/AMC and its associates/related parties/group companies
Nature of Association /Nature of
relation
Period Covered
value of Transactions
[Rs. in Crores]
% of total value of
transactions of the fund
Brokerage paid [Rs.]
% of total brokerage paid by the
fund
HSBC Securities and Capital Market (India) Private Limited
Sponsor 2020-21 Nil
Name of Sponsor/AMC and its associates/related parties/group companies
Nature of Association /Nature of
relation
Period Covered
value of Transactions
[Rs. in Crores]
% of total value of
transactions of the fund
Brokerage paid [Rs.]
(on accrual basis)
% of total brokerage paid by the
fund
HSBC Securities and Capital Market (India) Private Limited
Sponsor 2019-2020 0.34 0.00 4,084 0.04
The brokerage paid was at rates similar to those offered to other brokers / distributors. And the Commission/Brokerage paid to related party includes both upfront and trail and hence not comparable with the % of business brought and % of commission paid.
Further, The Hongkong and Shanghai Banking Corporation Limited, an associate of the Sponsor, is on the panel of bankers with whom HSBC Mutual Fund places money on fixed deposits and enters into reverse repo transactions from time to time at competitive rates.
Notes to Accounts – Annexure I (Contd...)To the Abridged Balance Sheet and Revenue Account for the Year ended March 31, 2021
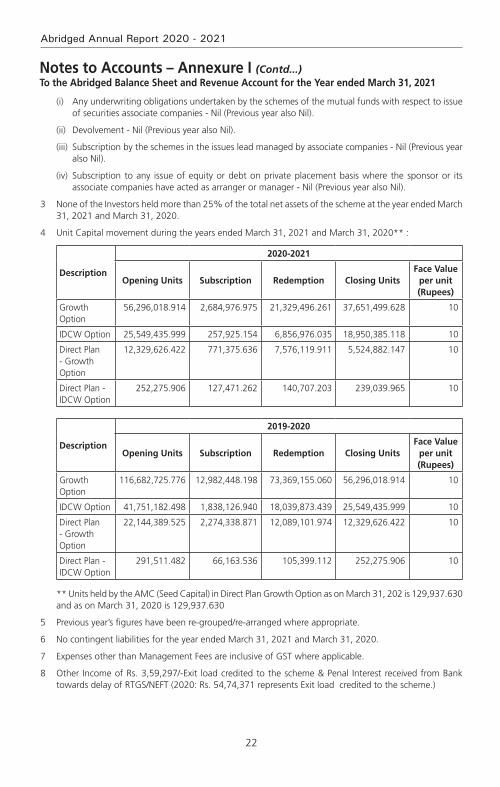
22
Abridged Annual Report 2020 - 2021
(i) Any underwriting obligations undertaken by the schemes of the mutual funds with respect to issue of securities associate companies - Nil (Previous year also Nil).
(ii) Devolvement - Nil (Previous year also Nil).
(iii) Subscription by the schemes in the issues lead managed by associate companies - Nil (Previous year also Nil).
(iv) Subscription to any issue of equity or debt on private placement basis where the sponsor or its associate companies have acted as arranger or manager - Nil (Previous year also Nil).
3 None of the Investors held more than 25% of the total net assets of the scheme at the year ended March 31, 2021 and March 31, 2020.
4 Unit Capital movement during the years ended March 31, 2021 and March 31, 2020** :
Description
2020-2021
Opening Units Subscription Redemption Closing UnitsFace value
per unit (Rupees)
Growth Option
56,296,018.914 2,684,976.975 21,329,496.261 37,651,499.628 10
IDCW Option 25,549,435.999 257,925.154 6,856,976.035 18,950,385.118 10
Direct Plan - Growth Option
12,329,626.422 771,375.636 7,576,119.911 5,524,882.147 10
Direct Plan - IDCW Option
252,275.906 127,471.262 140,707.203 239,039.965 10
Description
2019-2020
Opening Units Subscription Redemption Closing UnitsFace value
per unit (Rupees)
Growth Option
116,682,725.776 12,982,448.198 73,369,155.060 56,296,018.914 10
IDCW Option 41,751,182.498 1,838,126.940 18,039,873.439 25,549,435.999 10
Direct Plan - Growth Option
22,144,389.525 2,274,338.871 12,089,101.974 12,329,626.422 10
Direct Plan - IDCW Option
291,511.482 66,163.536 105,399.112 252,275.906 10
** Units held by the AMC (Seed Capital) in Direct Plan Growth Option as on March 31, 202 is 129,937.630 and as on March 31, 2020 is 129,937.630
5 Previous year’s figures have been re-grouped/re-arranged where appropriate.
6 No contingent liabilities for the year ended March 31, 2021 and March 31, 2020.
7 Expenses other than Management Fees are inclusive of GST where applicable.
8 Other Income of Rs. 3,59,297/-Exit load credited to the scheme & Penal Interest received from Bank towards delay of RTGS/NEFT (2020: Rs. 54,74,371 represents Exit load credited to the scheme.)
Notes to Accounts – Annexure I (Contd...)To the Abridged Balance Sheet and Revenue Account for the Year ended March 31, 2021

23
HSBC Small Cap Equity Fund
Notes to Accounts – Annexure I (Contd...)To the Abridged Balance Sheet and Revenue Account for the Year ended March 31, 2021
9 Investor Education Awareness
In view of the AMFI Best Practices Guidelines Circular No. 56/2015-16, the IEF (Investor Education Fund) accrual is set aside in a separate bank account and the consolidated balance across all schemes as on March 31, 2021. The break-up of which is as under:
Particulars March 31, 2021 March 31, 2020
Amount (in Rs. Lacs) Amount (in Rs. Lacs)
Opening Balance as on April 01, 2020 307.40 214.68
Add: Accrual during FY 2020-21 195.77 237.54
Less: Transferred to AMFI * 89.04 109.69
Less: Payable to AMFI (March 2021 accrual) * 8.84 9.08
Add: Investment Income FY 2020-21 11.94 15.93
Less: Spent during FY 2020-21 43.73 41.98
Closing Balance as on March 31, 2021 373.49 307.40
*In accordance with SEBI circular number SEBI/HO/IMD/DF2/RS/813/2016 dated January 8, 2016.
10 Following the spread of the coronavirus, on 11 March 2020, the World Health Organization declared the COVID-19 outbreak to be a pandemic. The identification of the virus as a new coronavirus, its subsequent spread and the situation of lock-down across India is considered as a significant event. HSBC Mutual Fund’s operations are included in essential services and have continued through the lock-downs declared by the Government. Service providers like the Registrar and Transfer Agent, Custodian and Fund Accountant have carried out extensive arrangements to address business needs and continuity of operations. As on the date of signing of these financial statements, Management believes that it has taken into account, all the possible impact of known events arising from COVID-19 pandemic in the preparation of the financial statements and there appears to be no uncertainties relating to the going concern of any of the Schemes of the Fund for a foreseeable future. However, COVID-19 pandemic is an ongoing situation and any estimate of its impact is dependent on the future intensity, spread and duration of the situation. The Management will continue to closely monitor the situation for any material changes which may impact the Schemes of the Fund.
11 Disclosure of Risk-o-meter
Scheme Name Risk-o-meter level as on December
31,2020^
Risk-o-meter level at end of the financial year
Number of changes in Risk-o-meter during the financial year^
HSBC Small Cap Equity Fund Very High Very High 0
^From the effective date (i.e. January 01, 2021) of SEBI circular no. SEBI/HO/IMD/DF3/CIR/P/2020/197 dated October 05, 2020.
12 Pursuant to SEBI Circular No. SEBI/HO/IMD/DF3/CIR/P/2020/194 dated October 05, 2020, the nomenclature of ‘Dividend Option’ under all the schemes of HSBC Mutual Fund has been revised to ‘Income Distribution cum Capital Withdrawal Option’ (IDCW), with effect from April 01, 2021.
13 The Annual Accounts of the Schemes prepared in accordance with the accounting policies and standards specified in the Ninth Schedule of The Securities and Exchange Board of India (Mutual Funds) Regulations, 1996 has been approved by the Board of Directors of HSBC Asset Management (India) Private Limited and The Board of Trustees of HSBC Mutual Fund at their meetings held on July 19, 2021 and July 20, 2021 respectively. The audit report attached herewith refers to the said Annual Accounts. The aforesaid abridged accounts are an extract of the Annual Accounts and are prepared in accordance with SEBI Circular No. IMD/Cir8/132968/2008 dated July 24, 2008.

24
Abridged Annual Report 2020 - 2021
voting Policy and Procedures
In view of SEBI guidelines related to “Role of Mutual Funds in Corporate Governance of Public Listed Companies”, HSBC AMC has formulated its “Policy for Proxy Voting in Public Listed Companies”. The said policy is available on our website and the details of actual exercise of proxy votes, the summary of votes casted and the auditor’s certificate for the Financial Year 2020 – 21 is forming part of our full Annual Report for the Financial Year 2020 – 21 which is uploaded on our website at http://www.assetmanagement.hsbc.co.in
25
HSBC Small Cap Equity Fund
Statutory Details & Disclaimers
All the returns have been sourced from Mutual Funds India Explorer software. The performance of the schemes and the benchmark is calculated on a total return basis. This document has been prepared by HSBC Asset Management (India) Private Ltd (HSBC) for information purposes only and should not be construed as i) an offer or recommendation to buy or sell securities, commodities, currencies or other investments referred to herein; or ii) an offer to sell or a solicitation or an offer for purchase of any of the funds of HSBC Mutual Fund; or iii) an investment research or investment advice. All information contained in this document (including that sourced from third parties), is obtained from sources HSBC and the third party which HSBC believes to be reliable however, has not independently verified the same. The information and opinions contained within the document are based upon publicly available information and rates of taxation applicable (if any) at the time of publication, which are subject to change from time to time.
Expressions of opinion are those of HSBC only and are subject to change without notice. It does not have regard to specific investment objectives, financial situation and the particular needs of any specific person who may receive this document. Investors should seek personal and independent advice regarding the appropriateness of investing in any of the funds, securities, other investment or investment strategies that may have been discussed or referred herein and should understand that the views regarding future prospects may or may not be realized. In no event shall HSBC Mutual Fund / HSBC Asset management (India) Private Limited and / or its affiliates or any of their directors, trustees, officers and employees be liable for any direct, indirect, special, incidental or consequential damages arising out of the use of information / opinion herein. Neither this document nor the units of HSBC Mutual Fund have been registered in any jurisdiction. The distribution of this document in certain jurisdictions may be restricted or totally prohibited and accordingly, persons who come into possession of this document are required to inform themselves about, and to observe, any such restrictions.
Mutual Fund investments are subject to market risks, read all scheme related documents carefully.
HSBC Large and Mid Cap Equity FundLarge & Mid Cap Fund - An open ended equity scheme investing in both large cap and mid cap stocks
Abridged Annual Report 2020 - 2021

1
HSBC Large and Mid Cap Equity Fund
Dear Investor,
The beginning of the last financial year now almost seems like a distant memory. COVID-19 was still a relatively unknown enemy and governments across the world were grappling with ways to control and mitigate the risks associated with it. Nationwide lockdowns were the norm and our markets both equity and fixed income reacted negatively leading to significant erosion of wealth. Within a short period of time markets bounced back. This confounded even the most astute market pundits. How is it possible that when GDP growth had slowed down, unemployment had risen, inflation was high could there be such sharp up move in equity indices. Whilst the reasons are well known about easy global liquidity, demand resurgence, cost cutting by corporates etc. perhaps its most important to remember that the markets are not a reflector but a predictor of economic activity.
At all times particularly during such volatile times it is important to go back to the basics. Why do you save, why do you invest, what goals would you like to achieve, how old are you, what is your risk appetite? The replies to these simple questions will help you determine your asset allocation. As an example when equity markets corrected sharply last year, investors who reviewed their asset allocation, stayed invested during the lows of the past year and were able to capture the rebound and have seen prime returns since then. The current market movement in all likelihood would have also led to some imbalances in your asset allocation. Do not ignore that and I strongly recommend that you do review this with your advisor to check whether re-balancing is required.
During this financial year we had three very successful new fund launches. The pandemic showed us a clear trend of dominant players becoming stronger and profit pool getting consolidated within a few companies. To capture this opportunity, we launched the HSBC Focused Equity Fund which garnered close to Rs. 520 crores. During the second half of 2020, in the fixed income space, 3 - 5 year duration range had a favourable investment scenario as RBI’s accommodative policy and surplus liquidity had reduced the returns at the very short end of the yield curve. There was a demand for an actively managed moderate duration strategy with better credit quality which we fulfilled by launching HSBC Corporate Bond Fund. It garnered over 700 crores. Our latest and first of its kind offering, HSBC Global Equity Climate Change Fund of Fund saw a stupendous response with over 8000 investors investing over Rs. 616 crores. This is an investment opportunity which goes beyond the rationale of simply generating investment returns and is the future of responsible investing.
We worked towards augmenting our digital capabilities by launching a few key enhancements to our online transaction platform. Being mindful of the movement restrictions in place, this year we focused on digitizing offline processes so that an investor need not need step out of her home for investing or availing any key services. While our interactive chatbot AskMe, eased service queries, our end-to-end digital KYC module enabled a first time Mutual Fund investor to invest in our funds without any paperwork. We listened to your feedback and digitized consolidation of folios and change of tax status which eliminated the need for you to physically visit our branches.
I am a strong believer in the India story and this story has just begun. The opportunity to invest in this high growth market is a very exciting opportunity. I do hope you share my enthusiasm and I ask that you continue to invest whilst reviewing your asset allocation at all times. As always thank you for your business. Stay safe.
Warm regards,
Ravi MenonChief Executive Officer,
HSBC Asset Management India

2
Abridged Annual Report 2020 - 2021
SPONSOR
HSBC Securities and Capital Markets (India) Private LimitedRegd. Office: 52/60, Mahatma Gandhi Road, Fort, Mumbai - 400 001.
TRUSTEE
Board of TrusteesOffice: 16, Veer Nariman Road, Fort, Mumbai 400 001.
ASSET MANAGEMENT COMPANY
HSBC Asset Management (India) Private LimitedCorp. & Regd. Office: 16, Veer Nariman Road, Fort, Mumbai 400 001.
CUSTODIAN
Standard Chartered Bank (SCB)Corp. & Regd. Office: Crescenzo, Securities Services, 3rd Floor, C-38/39, G-Block,
Bandra Kurla Complex, Bandra East, Mumbai – 400051.
AUDITORS TO THE SCHEME
BSR & Co. LLPChartered Accountants
5th Floor, Lodha Excelus, Apollo Mills Compound, N. M. Joshi Marg, Mahalaxmi, Mumbai 400 011.
REGISTRAR & TRANSFER AGENTS
Computer Age Management Services Limited (CAMS)Unit: HSBC Mutual Fund ’C’ Block, 2nd Floor, Hanudev Info Park P. Ltd., SF No. 558/2, Udayampalayam Road, Nava India, Coimbatore - 641 028.
BOARD OF TRUSTEES
Ms. Jasmine Batliwalla - Chairperson
Mr. Nani Javeri - Trustee
Dr. T. C. Nair - Trustee
Mr. Pedro Bastos - Trustee
BOARD OF DIRECTORS
Mr. Dinesh Mittal - Director
Dr. Indu Shahani - Director
Mr. Ravi Menon - Director & Chief Executive Officer
3
HSBC Large and Mid Cap Equity Fund
The Trustees of HSBC Mutual Fund (“Fund”) present the Nineteenth Annual Report and the audited abridged financial statements of the schemes of the Fund for the year ended March 31, 2021.
As at March 31, 2021, the Fund offered 37 schemes across asset classes to meet the varying investment needs of the investors. During FY 2020-2021, the Fund has launched various new products namely HSBC Corporate Bond Fund, HSBC Focused Equity Fund and HSBC Global Equity Climate Change Fund of Fund to fill the gaps in our product offering.
The Fund continues its focus on delivering consistent long term returns. The comments on the performance of the Scheme(s) is provided hereinafter. Dividends were declared under various schemes as per the provisions contained in the respective Scheme Information Documents after considering the distributable surplus available under the respective Schemes. Details of dividends declared can be viewed on our website at www.assetmanagement.hsbc.co.in.
1. SCHEME PERFORMANCE, FUTURE OUTLOOk AND OPERATIONS OF THE SCHEMES
a. Operations and Performance of the Schemes
HSBC Large and Mid-Cap Equity Fund (HLMEF) (Large & Mid Cap Fund - An open ended equity scheme investing in both large cap and mid cap stocks)
HLMEF seeks to provide long term capital growth through investments in both large cap and mid cap stocks. However, there is no assurance that the investment objective of the Scheme will be achieved.
The net assets of HLMEF amounted to Rs. 487.17 crores as at March 31, 2021 and Rs. 502.69 crores as at March 31 2020. Around 99.05%% of the net assets were invested in equities, 1.01% of the net assets were invested in reverse repos / TREPS and (-0.06%) in net current assets as at March 31, 2021. The inception date of the scheme is March 28, 2019.
HLMEF was launched in March 2019. The fund will maintain at least 35% each will be towards large cap stocks and mid cap stocks. The fund has underperformed its benchmark over 1 year and since inception periods. The 1-year performance was adversely impacted by stock selection within Industrials, Communication Services, Utilities, Materials and Financials (in that order). Remaining underweight in Utilities also hurt the performance. In terms of fund strategy, the AMC be looking to be in large caps where scale would be an advantage (like in the case of banks / financials) and while for midcaps the focus will be on sector leaders or niche players in their respective businesses. For example, in segments like retail, consumer durables, speciality chemicals etc., there are sector leaders and niche players within midcap and small caps. In some other cases like that of pharma it has a mix of large and midcaps as there are dominant players in hospitals, diagnostics which are midcaps. The key theme of the portfolio has been to be in sector leaders across the market capitalization spectrum and as they would gain from market share shift along with profit pool consolidation. Given the COVID related disruption, the AMC thinks the above theme would accelerate. The AMC is of the view that the impact of the second wave would be short term in nature followed by a quick rebound. As a result, the Fund Manager is maintaining a pro-cyclical bias in the portfolio. Earnings growth is expected to rebound sharply in FY22 (post the short disruption period in 1Q). Earnings growth momentum is expected to sustain in high-teens beyond FY22 on the back of economy witnessing a cyclical recovery due to revival in capex cycle over the next 2-3 years (first by the government followed by private capex). Benign cost of capital and reasonable valuations (in the context of multi-year earnings outlook), should act as additional support to the equity performance, in the medium term. From a sectoral perspective the order of preference is rate sensitives followed by domestic cyclicals, exporters and domestic consumption. Predominantly regulated businesses come last in the pecking order. This preference is dictated by AMC’s assessment of sectors / segments leading contribution to the market earnings growth over the next 2-3 years. In line with this thought process, the fund is overweight on Financials, Consumer Discretionary, Industrials, Healthcare, Technology, Materials and Real Estate sectors. The underweight sectors are Consumer Staples, Energy, Communication Services and Utilities.
Trustees’ ReportFor the year ended March 31, 2021

4
Abridged Annual Report 2020 - 2021
Date of Inception : 28 March 2019 Absolute Returns
(%)
Compounded Annualized Returns (%)
Scheme Name & Benchmarks 1 Year 3 Years 5 Years Since Inception
HSBC Large and Mid Cap Equity Fund- Growth 68.94 NA NA 14.05
NIFTY Large Midcap 250 TRI (Scheme Benchmark) 85.91 NA NA 16.46
Nifty 50 TRI (Standard Benchmark) 72.54 NA NA 13.92
10,000, if invested in HEHF, would have become 16,894 NA NA 13,026
10,000, if invested in NIFTY Large Midcap 250 TRI , would have become
18,591 NA NA 13,586
10,000, if invested in Nifty 50 TRI, would have become 17,254 NA NA 12,996
Past performance may or may not be sustained in future. The returns for the respective periods are provided as on last business day of March 2021 for Growth Option. Different plans shall have a different expense structure. Performance of the respective benchmark is calculated as per the Total Return Index (TRI).
b. Market Overview & Outlook (as furnished by HSBC Asset Management (India) Private Limited)
EqUITY OUTLOOk
Recap of FY 2020-21:
Fiscal 2020-21 was a rewarding year for equity investors with market indices recording stellar gains from the low base after the COVID correction. Market sentiments steadily improved during the course of the year to deliver positive returns in all four quarters of the year.
We witnessed various legs of market performance during the last fiscal, driven by multiple factors and variables. Initial rebound from the market lows was driven by attractive valuations, then it was on the back of faster than anticipated recovery post lockdown, reopening optimism, swifter than expected vaccine intervention and above all, the unprecedented liquidity. Lastly but importantly, a period of lower cost of capital coupled with low real rates, improved the attractiveness of equity as an asset class, driving the performance.
As a result, the year ended with optimism compared to despair when it began. Corporate India overcame the challenges posed by COVID through significant cost control measures while at the same time showed improvement in their financial position and cash flows.
Commodities also rallied from the lows of the COVID crisis with global crude oil prices surging by 179% during the year. INR appreciated by 3.3% (as India recorded strong net FPI inflows) during the year. MSCI India index outperformed most of key global indices during the past fiscal. MSCI India index (USD) gained 74.8% as compared to 51.8% for MSCI World, 50.5% for Dow Jones, 55.1% for MSCI Emerging Markets, 41.2% for MSCI China and 42% for MSCI Europe*.
At a record USD 37.3 bn of net FPI inflows during the fiscal, the tally was higher than the cumulative net inflows India received from the previous 6 years. DIIs on the other hand saw net outflows of USD 18.4 bn and this was the first fiscal year of net outflows from the segment in 5 years. The net outflows from the segment was driven by USD 16.7 bn of outflows from the MFs while domestic insurers saw a far lower outflow of USD 1.6 bn*.
Indices Returns (April 1, 2020 to March 31, 2021) 1 Year^
S&P BSE Sensex TR 69.8%
NSE CNX Nifty TR 72.5%
S&P BSE 100 TR 73.5%
Trustees’ ReportFor the year ended March 31, 2021 (Contd...)
5
HSBC Large and Mid Cap Equity Fund
Indices Returns (April 1, 2020 to March 31, 2021) 1 Year^
S&P BSE 200 TR 76.3%
S&P BSE 500 TR 78.6%
S&P BSE Midcap TR 93.0%
S&P BSE 250 Small-cap TR 117.5%
^Source: Bloomberg (Above table values are for total return indices)
Way forward:
Beginning of the new fiscal, India had to contend with the risk of the second COVID wave, which was more ferocious than the first wave on the human impact. However, as we write this, the second wave has already peaked and there have been a significant fall in number of active cases, case-positivity rate, daily new caseload and deaths. Vaccination drive also has seen acceleration with and is now closer to 6 mn doses per day mark. Also, the impact of the lockdown on economic activity has been significantly lower during the second wave, compared to last year. In most of the states, the unlocking process has already begun in a phased manner and this is leading to improvement in various activity indicators. Mobility indicators are recovering faster while economic indicators (freight, credit off-take, E-way bill generation, power demand etc.) are also witnessing a gradual recovery. The recently concluded earnings season has turned out to be in-line with expectations and despite the concerns of around the second wave, the earnings (Nifty) have seen upgrades for FY22. Market is looking beyond the current quarter (i.e. 1QFY22), which would witness an impact due to the second wave. Our baseline assumption is that of a temporary impact from the second wave and the set-back to the recovery process limited to a few months, after which we should see the economic rebound. So far, this is tracking in-line with assumptions.
From a macro perspective, the current estimates for GDP growth in FY22 stand at 9.2%* (after seeing downgrades to factor in the impact of second wave). The downgrade in estimates are pertaining to the first quarter and hence the trajectory of growth from hereon should pick up. The tax collections data for the first two months of FY22 has remained strong, implying that the drawdown of the second wave on the fiscal position is not alarming. Additionally, the impact of fiscal stimulus package announced in FY22 so far is manageable (about 60 bps of GDP) and hence would not lead to any fiscal strain.
After the spectacular rally, market valuations at an overall level are now trending above historical averages on traditional valuation metrics (P/E, P/B). This is true for all market capitalization categories (viz large, mid and small). Typically, the broader market (i.e. mid and small cap segments), trade at a discount to large caps, however this scenario has now reversed after the outperformance from the broader market segments. However, the earnings momentum continues to remain strong (witnessing upgrades so far) and except for a short period due to second wave, the earnings momentum should hold up.
We believe that the risk-reward is balanced for the equity markets in the near term. Higher or sticky inflation expectations globally, higher than historical market valuations on some parameters (i.e. P/E, P/B) and adverse demand impact from the second wave are risk factors to contend with in the near term. However, these are counter balanced by positive commentary from companies, significant decline in COVID cases and acceleration in the vaccination programme. As a result, in the near term markets may see a consolidation phase and could take cues from the upcoming earnings season with more focus on the corporate commentary and the outlook. From a medium to long term perspective, the outlook for equity markets remains positive. The expectation of cyclical revival in the economy brings in a multi-year earnings visibility. This along with a benign cost of capital environment, should support equity performance. However, equity returns are likely to moderate on the back of the relatively high valuations and the strong recovery we have already witnessed from the COVID lows. Equity performance is likely to mirror the earnings growth trends over the medium to long term.
Pace of vaccination, concerns about a third wave, corporate earnings trajectory, inflation trends (both global & domestic), monsoon trends and commodity prices (especially crude oil) are some of the key factors which could influence market performance in the short term.
Trustees’ ReportFor the year ended March 31, 2021 (Contd...)
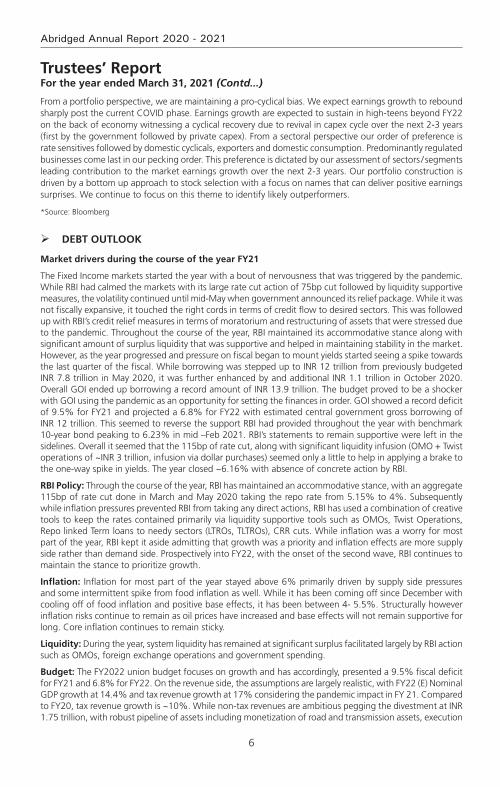
6
Abridged Annual Report 2020 - 2021
From a portfolio perspective, we are maintaining a pro-cyclical bias. We expect earnings growth to rebound sharply post the current COVID phase. Earnings growth are expected to sustain in high-teens beyond FY22 on the back of economy witnessing a cyclical recovery due to revival in capex cycle over the next 2-3 years (first by the government followed by private capex). From a sectoral perspective our order of preference is rate sensitives followed by domestic cyclicals, exporters and domestic consumption. Predominantly regulated businesses come last in our pecking order. This preference is dictated by our assessment of sectors / segments leading contribution to the market earnings growth over the next 2-3 years. Our portfolio construction is driven by a bottom up approach to stock selection with a focus on names that can deliver positive earnings surprises. We continue to focus on this theme to identify likely outperformers.
*Source: Bloomberg
DEBT OUTLOOk
Market drivers during the course of the year FY21
The Fixed Income markets started the year with a bout of nervousness that was triggered by the pandemic. While RBI had calmed the markets with its large rate cut action of 75bp cut followed by liquidity supportive measures, the volatility continued until mid-May when government announced its relief package. While it was not fiscally expansive, it touched the right cords in terms of credit flow to desired sectors. This was followed up with RBI’s credit relief measures in terms of moratorium and restructuring of assets that were stressed due to the pandemic. Throughout the course of the year, RBI maintained its accommodative stance along with significant amount of surplus liquidity that was supportive and helped in maintaining stability in the market. However, as the year progressed and pressure on fiscal began to mount yields started seeing a spike towards the last quarter of the fiscal. While borrowing was stepped up to INR 12 trillion from previously budgeted INR 7.8 trillion in May 2020, it was further enhanced by and additional INR 1.1 trillion in October 2020. Overall GOI ended up borrowing a record amount of INR 13.9 trillion. The budget proved to be a shocker with GOI using the pandemic as an opportunity for setting the finances in order. GOI showed a record deficit of 9.5% for FY21 and projected a 6.8% for FY22 with estimated central government gross borrowing of INR 12 trillion. This seemed to reverse the support RBI had provided throughout the year with benchmark 10-year bond peaking to 6.23% in mid –Feb 2021. RBI’s statements to remain supportive were left in the sidelines. Overall it seemed that the 115bp of rate cut, along with significant liquidity infusion (OMO + Twist operations of ~INR 3 trillion, infusion via dollar purchases) seemed only a little to help in applying a brake to the one-way spike in yields. The year closed ~6.16% with absence of concrete action by RBI.
RBI Policy: Through the course of the year, RBI has maintained an accommodative stance, with an aggregate 115bp of rate cut done in March and May 2020 taking the repo rate from 5.15% to 4%. Subsequently while inflation pressures prevented RBI from taking any direct actions, RBI has used a combination of creative tools to keep the rates contained primarily via liquidity supportive tools such as OMOs, Twist Operations, Repo linked Term loans to needy sectors (LTROs, TLTROs), CRR cuts. While inflation was a worry for most part of the year, RBI kept it aside admitting that growth was a priority and inflation effects are more supply side rather than demand side. Prospectively into FY22, with the onset of the second wave, RBI continues to maintain the stance to prioritize growth.
Inflation: Inflation for most part of the year stayed above 6% primarily driven by supply side pressures and some intermittent spike from food inflation as well. While it has been coming off since December with cooling off of food inflation and positive base effects, it has been between 4- 5.5%. Structurally however inflation risks continue to remain as oil prices have increased and base effects will not remain supportive for long. Core inflation continues to remain sticky.
Liquidity: During the year, system liquidity has remained at significant surplus facilitated largely by RBI action such as OMOs, foreign exchange operations and government spending.
Budget: The FY2022 union budget focuses on growth and has accordingly, presented a 9.5% fiscal deficit for FY21 and 6.8% for FY22. On the revenue side, the assumptions are largely realistic, with FY22 (E) Nominal GDP growth at 14.4% and tax revenue growth at 17% considering the pandemic impact in FY 21. Compared to FY20, tax revenue growth is ~10%. While non-tax revenues are ambitious pegging the divestment at INR 1.75 trillion, with robust pipeline of assets including monetization of road and transmission assets, execution
Trustees’ ReportFor the year ended March 31, 2021 (Contd...)

7
HSBC Large and Mid Cap Equity Fund
remains the key as in the past. On the expenditure side, better quality capex spending with focusing on rail, road, defense, urban infra is positive for long term structural growth. The revenue side expenditure adjusting for clearance of past subsidy arrears will be similar to budgetary estimates. Government using this opportunity to bring back off-balance sheet spending to on-balance sheet was a welcome move towards transparency and showing realistic projections. Alongside, states have also been given leeway to borrow upto 4% of their GDP with an additional 0.5% subject to conditions. Given that states are an important vehicle for capex investment, this move is welcome although it may entail additional state borrowing. The fiscal glide path is shifted to FY26 at below 4.5% for center and 3% for states suggesting that spending will continue and borrowing will come down gradually. In summary, from survival to revival, FY22 budget aims for structural growth leaving fiscal concerns sideways in the interim. Government’s intent seems clear on bringing back growth on the table, in a transparent manner.
While the second wave of the pandemic has once again derailed the revenue story, government will still have some cushion from its conservative estimates.
Currency and FII Flows: INR has been on an appreciation trajectory for most part of the year, aided by dollar underperformance supported by positive FII and FDI flows along with reduced imports on the domestic front as well. RBI has used most of the flows to accumulate reserves which has prevented any strong appreciation. Pandemic shock and global risk off led rupee over 75 in the beginning of the year only to close below 72 at the end of the fiscal year. While the second wave led to another spike in INR in April, it has since then cooled once again driven by dollar underperformance and pandemic recovery on the domestic front. Net FII flows was ~$30 bn with positive equity flows of~$37 bn while debt was negative ~$7bn and overall RBI’s forex reserves rose by a ~$100 bn to close ~$537 bn.
Credit growth: Credit growth for the entire year has been tepid as previous year’s credit events were followed by nervousness relating to the pandemic. Despite RBI opening up several windows to finance the non-AAA segment, there was very little fresh credit flowing that segment. Overall banking credit grew by only 6.5%. Risk appetite has however been improving from a complete risk aversion to opening up towards a calculated risk. Prospectively it is expected that once the pandemic risk abates, credit growth will resume primarily driven by government capex spending and demand recovery.
Market Outlook
The pandemic once again brought the country to a situation similar to last year and debt markets perhaps interpreted the same as a structural rise in rates. In the initial day’s post budget in Feb of 2021, market was expecting a concrete set of actions such as an OMO calendar from RBI, and RBI’s words alone failed to calm the market. The first auction of the fiscal year also saw a devolvement. However, RBI acted in the first policy of the year announcing a bond buyback program akin to QE (quantitative easing) and its subsequent cancellation of auctions wherein yields were perhaps quoted higher than RBI’s comfort levels brought back confidence into the market. Since then we have seen a strong rally with 10-year benchmark trending below 6% and the curve moving alongside. RBI reiteration of priority of growth and also supporting with higher than expected dividend payment stand out as a testimony of its support. While we do not expect RBI to act in terms of rate cuts, we believe that measures such as G-SAP, OMOs will continue until there is visibility of a structural growth. Therefore, the large borrowing program should go without any hiccups.
Furthermore, with the evidence of strong GST numbers until April 2021 (before the 2nd wave), it is expected that growth and therefore fiscal revenues will come back. Government’s conservative budget estimates are supportive. Also, given the fact that compared to last year there has not been a complete shutdown of activity (lockdowns being distributed), the impact on growth will not be similar to last year. Pent up demand will come back to support revenue collection. However, on the flipside, once growth resumes RBI will be forced to withdraw liquidity in a phased manner to prevent asset bubbles. Nevertheless, RBI need not act in terms of rate actions and we believe that a prolonged pause in terms of RBI rates is in the offing.
Net-net therefore while growth is wanting no matter what, it may come at a small price of rise in yields with liquidity withdrawal. That is however expected more in the 2nd half of the year. Lower than expected borrowing numbers, later this year or if not in next year could be a surprise. We may therefore see a range bound rate action in the near term with a rising bias over time. Global rate environment, oil and currency risks are to be watched out for.
Trustees’ ReportFor the year ended March 31, 2021 (Contd...)

8
Abridged Annual Report 2020 - 2021
2. BRIEF BACkGROUND OF SPONSORS, BOARD OF TRUSTEES AND ASSET MANAGEMENT COMPANY
a. Sponsor
HSBC Mutual Fund is sponsored by HSBC Securities and Capital Markets (India) Private Limited (HSCI). The Sponsor is the Settler of the Mutual Fund Trust. The Sponsor has entrusted a sum of Rs. 1,00,000/- (Rupees One Lakh only) to the Trustee as the initial contribution towards the corpus of the Mutual Fund.
HSCI offers integrated investment banking services, securities and corporate finance & advisory. HSCI is a member of the Bombay Stock Exchange Limited and National Stock Exchange (capital and derivative market segments). HSCI holds 100% of the paid up equity share capital of HSBC Asset Management (India) Private Limited.
b. HSBC Mutual Fund
HSBC Mutual Fund (“the Mutual Fund” or “the Fund”) has been constituted as a Trust in accordance with the provisions of the Indian Trusts Act, 1882 (2 of 1882) vide a Trust Deed dated February 7, 2002 with HSBC Securities and Capital Markets (India) Private Limited, as the Sponsor and the Board of Individual Trustees. The Trustee has entered into an Investment Management Agreement dated February 7, 2002 with HSBC Asset Management (India) Private Limited (AMC) to function as the Investment Manager for all the schemes of the Fund. The Fund was registered with SEBI vide registration number MF/046/02/5 dated May 27, 2002.
The Trust has been formed for the purpose of pooling of capital from the public for collective investment in securities for the purpose of providing facilities for participation by persons as beneficiaries in such investments and in the profits/income arising therefrom.
c. Board of Trustees (the Trustees)
The Board of Trustees is the exclusive owner of the Trust Fund and holds the same in trust for the benefit of the unit holders. The Trustees have been discharging their duties and carrying out the responsibilities as provided in the SEBI (Mutual Funds) Regulations, 1996 and the Trust Deed. The Trustees seek to ensure that the Fund and the schemes floated there under are managed by the AMC in accordance with the Trust Deed, the said Regulations, directions and guidelines issued by the SEBI, the Stock Exchanges, the Association of Mutual Funds in India and other regulatory agencies.
d. Asset Management Company (the AMC)
HSBC Asset Management (India) Private Limited (the Investment Manager or the AMC) is a private limited company incorporated under the Companies Act, 1956 on December 12, 2001 having its Registered Office at 16, V. N. Road, Fort, Mumbai 400 001. HSBC Asset Management (India) Private Limited has been appointed as the Asset Management Company of HSBC Mutual Fund by the Trustee vide Investment Management Agreement (IMA) dated February 7, 2002 and executed between the Trustees and the AMC. SEBI approved the AMC to act as the Investment Manager of the Fund vide its letter No. MFD/BC/163/2002 dated May 27, 2002. The paid-up equity share capital of the AMC is Rs. 61.59 crores. The AMC is registered as a Portfolio Manager under the SEBI (Portfolio Managers) Regulations, 1993 vide registration no. INP000001322. The AMC also offers non-binding Advisory services to offshore funds under the mutual fund license.
HSBC Securities and Capital Markets (India) Private Limited holds 100% of the paid up equity share capital of the AMC.
3. INvESTMENT OBJECTIvE OF THE SCHEMESThe investment objective of the respective schemes has been provided above under the heading “Scheme Performance, Future Outlook and Operation of the Scheme” (Refer Section 1).
4. SIGNIFICANT ACCOUNTING POLICIES The Significant Accounting Policies form part of the Notes to the Accounts annexed to the Balance Sheet of the Schemes in the Full Annual Report. The accounting policies are in accordance with Securities Exchange Board of India (Mutual Funds) Regulations 1996.
Trustees’ ReportFor the year ended March 31, 2021 (Contd...)
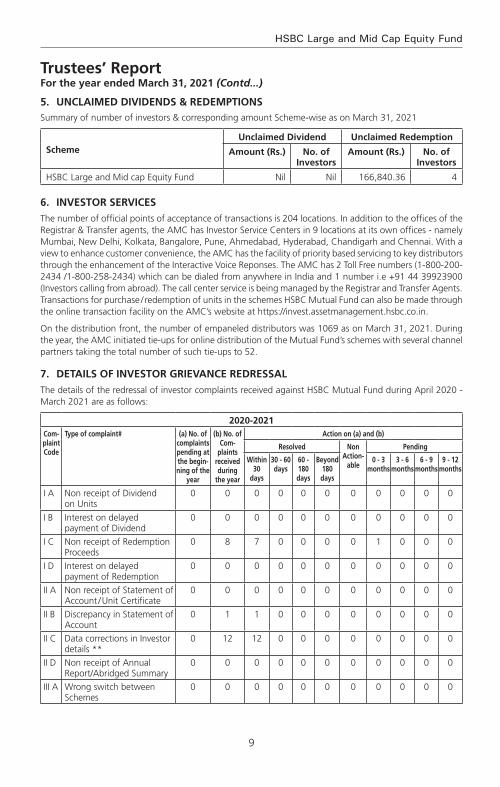
9
HSBC Large and Mid Cap Equity Fund
Trustees’ ReportFor the year ended March 31, 2021 (Contd...)
5. UNCLAIMED DIvIDENDS & REDEMPTIONSSummary of number of investors & corresponding amount Scheme-wise as on March 31, 2021
SchemeUnclaimed Dividend Unclaimed Redemption
Amount (Rs.) No. of Investors
Amount (Rs.) No. of Investors
HSBC Large and Mid cap Equity Fund Nil Nil 166,840.36 4
6. INvESTOR SERvICES
The number of official points of acceptance of transactions is 204 locations. In addition to the offices of the Registrar & Transfer agents, the AMC has Investor Service Centers in 9 locations at its own offices - namely Mumbai, New Delhi, Kolkata, Bangalore, Pune, Ahmedabad, Hyderabad, Chandigarh and Chennai. With a view to enhance customer convenience, the AMC has the facility of priority based servicing to key distributors through the enhancement of the Interactive Voice Reponses. The AMC has 2 Toll Free numbers (1-800-200-2434 /1-800-258-2434) which can be dialed from anywhere in India and 1 number i.e +91 44 39923900 (Investors calling from abroad). The call center service is being managed by the Registrar and Transfer Agents. Transactions for purchase / redemption of units in the schemes HSBC Mutual Fund can also be made through the online transaction facility on the AMC’s website at https://invest.assetmanagement.hsbc.co.in.
On the distribution front, the number of empaneled distributors was 1069 as on March 31, 2021. During the year, the AMC initiated tie-ups for online distribution of the Mutual Fund’s schemes with several channel partners taking the total number of such tie-ups to 52.
7. DETAILS OF INvESTOR GRIEvANCE REDRESSAL
The details of the redressal of investor complaints received against HSBC Mutual Fund during April 2020 - March 2021 are as follows:
2020-2021Com-plaint Code
Type of complaint# (a) No. of complaints pending at the begin-ning of the
year
(b) No. of Com-
plaints received during
the year
Action on (a) and (b)
Resolved Non Action-
able
Pending
Within 30
days
30 - 60 days
60 - 180 days
Beyond 180 days
0 - 3 months
3 - 6 months
6 - 9 months
9 - 12 months
I A Non receipt of Dividend on Units
0 0 0 0 0 0 0 0 0 0 0
I B Interest on delayed payment of Dividend
0 0 0 0 0 0 0 0 0 0 0
I C Non receipt of Redemption Proceeds
0 8 7 0 0 0 0 1 0 0 0
I D Interest on delayed payment of Redemption
0 0 0 0 0 0 0 0 0 0 0
II A Non receipt of Statement of Account / Unit Certificate
0 0 0 0 0 0 0 0 0 0 0
II B Discrepancy in Statement of Account
0 1 1 0 0 0 0 0 0 0 0
II C Data corrections in Investor details **
0 12 12 0 0 0 0 0 0 0 0
II D Non receipt of Annual Report/Abridged Summary
0 0 0 0 0 0 0 0 0 0 0
III A Wrong switch between Schemes
0 0 0 0 0 0 0 0 0 0 0
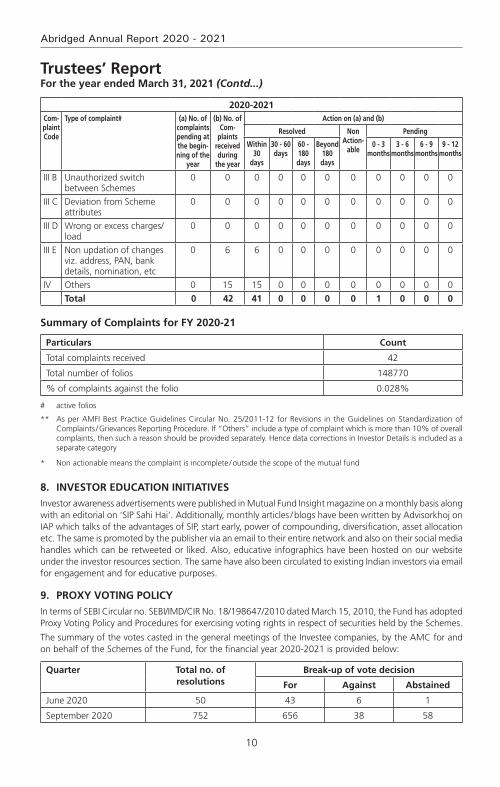
10
Abridged Annual Report 2020 - 2021
2020-2021Com-plaint Code
Type of complaint# (a) No. of complaints pending at the begin-ning of the
year
(b) No. of Com-
plaints received during
the year
Action on (a) and (b)
Resolved Non Action-
able
Pending
Within 30
days
30 - 60 days
60 - 180 days
Beyond 180 days
0 - 3 months
3 - 6 months
6 - 9 months
9 - 12 months
III B Unauthorized switch between Schemes
0 0 0 0 0 0 0 0 0 0 0
III C Deviation from Scheme attributes
0 0 0 0 0 0 0 0 0 0 0
III D Wrong or excess charges/load
0 0 0 0 0 0 0 0 0 0 0
III E Non updation of changes viz. address, PAN, bank details, nomination, etc
0 6 6 0 0 0 0 0 0 0 0
IV Others 0 15 15 0 0 0 0 0 0 0 0
Total 0 42 41 0 0 0 0 1 0 0 0
Summary of Complaints for FY 2020-21
Particulars Count
Total complaints received 42
Total number of folios 148770
% of complaints against the folio 0.028%
# active folios
** As per AMFI Best Practice Guidelines Circular No. 25/2011-12 for Revisions in the Guidelines on Standardization of Complaints / Grievances Reporting Procedure. If “Others” include a type of complaint which is more than 10% of overall complaints, then such a reason should be provided separately. Hence data corrections in Investor Details is included as a separate category
* Non actionable means the complaint is incomplete / outside the scope of the mutual fund
8. INvESTOR EDUCATION INITIATIvES
Investor awareness advertisements were published in Mutual Fund Insight magazine on a monthly basis along with an editorial on ‘SIP Sahi Hai’. Additionally, monthly articles / blogs have been written by Advisorkhoj on IAP which talks of the advantages of SIP, start early, power of compounding, diversification, asset allocation etc. The same is promoted by the publisher via an email to their entire network and also on their social media handles which can be retweeted or liked. Also, educative infographics have been hosted on our website under the investor resources section. The same have also been circulated to existing Indian investors via email for engagement and for educative purposes.
9. PROxY vOTING POLICY
In terms of SEBI Circular no. SEBI/IMD/CIR No. 18/198647/2010 dated March 15, 2010, the Fund has adopted Proxy Voting Policy and Procedures for exercising voting rights in respect of securities held by the Schemes.
The summary of the votes casted in the general meetings of the Investee companies, by the AMC for and on behalf of the Schemes of the Fund, for the financial year 2020-2021 is provided below:
quarter Total no. of resolutions
Break-up of vote decision
For Against Abstained
June 2020 50 43 6 1
September 2020 752 656 38 58
Trustees’ ReportFor the year ended March 31, 2021 (Contd...)
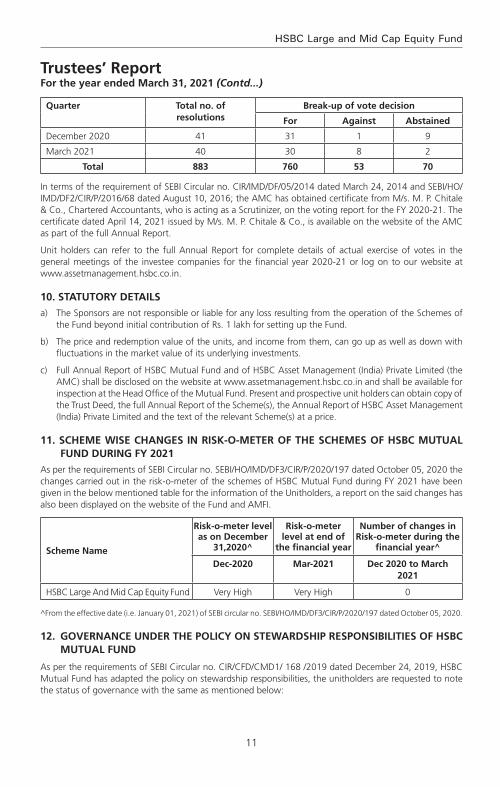
11
HSBC Large and Mid Cap Equity Fund
Trustees’ ReportFor the year ended March 31, 2021 (Contd...)
quarter Total no. of resolutions
Break-up of vote decision
For Against Abstained
December 2020 41 31 1 9
March 2021 40 30 8 2
Total 883 760 53 70
In terms of the requirement of SEBI Circular no. CIR/IMD/DF/05/2014 dated March 24, 2014 and SEBI/HO/IMD/DF2/CIR/P/2016/68 dated August 10, 2016; the AMC has obtained certificate from M/s. M. P. Chitale & Co., Chartered Accountants, who is acting as a Scrutinizer, on the voting report for the FY 2020-21. The certificate dated April 14, 2021 issued by M/s. M. P. Chitale & Co., is available on the website of the AMC as part of the full Annual Report.
Unit holders can refer to the full Annual Report for complete details of actual exercise of votes in the general meetings of the investee companies for the financial year 2020-21 or log on to our website at www.assetmanagement.hsbc.co.in.
10. STATUTORY DETAILS
a) The Sponsors are not responsible or liable for any loss resulting from the operation of the Schemes of the Fund beyond initial contribution of Rs. 1 lakh for setting up the Fund.
b) The price and redemption value of the units, and income from them, can go up as well as down with fluctuations in the market value of its underlying investments.
c) Full Annual Report of HSBC Mutual Fund and of HSBC Asset Management (India) Private Limited (the AMC) shall be disclosed on the website at www.assetmanagement.hsbc.co.in and shall be available for inspection at the Head Office of the Mutual Fund. Present and prospective unit holders can obtain copy of the Trust Deed, the full Annual Report of the Scheme(s), the Annual Report of HSBC Asset Management (India) Private Limited and the text of the relevant Scheme(s) at a price.
11. SCHEME WISE CHANGES IN RISk-O-METER OF THE SCHEMES OF HSBC MUTUAL FUND DURING FY 2021
As per the requirements of SEBI Circular no. SEBI/HO/IMD/DF3/CIR/P/2020/197 dated October 05, 2020 the changes carried out in the risk-o-meter of the schemes of HSBC Mutual Fund during FY 2021 have been given in the below mentioned table for the information of the Unitholders, a report on the said changes has also been displayed on the website of the Fund and AMFI.
Scheme Name
Risk-o-meter level as on December
31,2020^
Risk-o-meter level at end of
the financial year
Number of changes in Risk-o-meter during the
financial year^
Dec-2020 Mar-2021 Dec 2020 to March 2021
HSBC Large And Mid Cap Equity Fund Very High Very High 0
^From the effective date (i.e. January 01, 2021) of SEBI circular no. SEBI/HO/IMD/DF3/CIR/P/2020/197 dated October 05, 2020.
12. GOvERNANCE UNDER THE POLICY ON STEWARDSHIP RESPONSIBILITIES OF HSBC MUTUAL FUND
As per the requirements of SEBI Circular no. CIR/CFD/CMD1/ 168 /2019 dated December 24, 2019, HSBC Mutual Fund has adapted the policy on stewardship responsibilities, the unitholders are requested to note the status of governance with the same as mentioned below:

12
Abridged Annual Report 2020 - 2021
Trustees’ ReportFor the year ended March 31, 2021 (Contd...)
S. No.
Particulars of Principles of Stewardship Code
Status of compliance (Complied/
Not Complied)
Description Remarks/reasons for
deviation/non - compliance,
if any
1 Principle 1:
Institutional Investors should formulate a comprehensive policy on the discharge of their stewardship responsibilities, publicly disclose it, review and update it periodically.
Complied HSBC Asset Management (India) Private Limited's (AMIN) 'Policy on Stewardship responsibilities' (Stewardship Code / Policy) was formulated and implemented on 01 July, 2020. This is a comprehensive document which has been publicly disclosed on the website of AMIN. The same shall follow a periodic review.
N.A.
2 Principle 2:
Inst i tut ional investors should have a clear policy on how they manage conflicts of interest in fulfilling their stewardship responsibilities and publicly disclose it.
Complied Defining and managing Conflict of Interest in fulfilling stewardship responsibilities are detailed in the Stewardship Policy document. The policy document is publicly disclosed.
N.A.
3 Principle 3:
Institutional investors should monitor their investee companies.
Complied AMIN monitors all investee companies through its investment process. This includes assessment of companies’ own and market data, consideration of research from brokers and other independent research providers – including ESG & voting research, attending individual & group meetings with company management and directors, visiting production sites (wherever necessary), engaging with key stakeholders including competitors and customers, and financial modelling. More details enumerated in the policy document
N.A.
4 Principle 4:
Inst i tut ional investors should have a clear policy on intervention in their investee companies. Institutional investors should also have a clear policy for collaboration with other institutional investors where required, to preserve the interests of the ultimate investors, which should be disclosed.
Complied Details of undertaking active engagement with investee companies and the policy for collaboration with other institutional holders are detailed in the policy document. The policy document is publicly disclosed.
N.A.

13
HSBC Large and Mid Cap Equity Fund
Trustees’ ReportFor the year ended March 31, 2021 (Contd...)
S. No.
Particulars of Principles of Stewardship Code
Status of compliance (Complied/
Not Complied)
Description Remarks/reasons for
deviation/non - compliance,
if any
5 Principle 5:
Inst i tut ional investors should have a clear policy on voting and disclosure of voting activity.
Complied AMIN has a clear and detailed voting policy which provides the framework for the voting decisions. All voting decisions shall be in accordance with AMIN’s Voting Policy and Procedures, which is disclosed on the website. AMIN discloses the details of the voting on its website on a quarterly basis within 10 working days from the end of the quarter. Additionally, AMIN also discloses the details of the votes cast, in the annual report of the schemes of HSBC Mutual Fund.
N.A.
6 Principle 6:
Institutional investors should report periodically on their stewardship activities.
Complied The annual status report of the stewardship code and quarterly report on proxy voting are publicly disclosed on the website as required under SEBI Regulations.
N.A.
13. SIGNIFICANT EvENT AFTER THE END OF THE FINANCIAL YEAR
HSBC Global Consumer Opportunities Fund (HGCOF) has been merged with HSBC Asia Pacific (Ex Japan) Dividend Yield Fund with effect from May 13, 2021. Therefore, HGCOF has been ceased to exist from the aforesaid date.
14. ACkNOWLEDGEMENTS
The Trustees wish to thank the Unit holders of the Schemes for their support throughout the year and also thank the Government of India, the Securities and Exchange Board of India (SEBI), the Reserve Bank of India (RBI) and the Association of Mutual Funds in India (AMFI) for the guidance provided by them. The Trustees also appreciate the services provided by the Registrar and Transfer Agent, Fund Accountant, Custodian, Bankers, Distributors and Brokers. The guidance and services provided by the Auditors and advocates and the ebullience, sincerity and dedication of the employees of HSBC Asset Management (India) Private Limited is also appreciated.
The Trustees look forward to the continued support of everyone.
For and on behalf of the Board of Trustees of HSBC Mutual Fund
Sd/-
Trustee
Mumbai
July 20, 2021.

14
Abridged Annual Report 2020 - 2021
To the Trustees of HSBC Mutual Fund
HSBC Large And Mid Cap Equity Fund
Report on the Audit of the Financial Statements
Opinion
We have audited the financial statements of HSBC Large And Mid Cap Equity Fund (the ‘Scheme’) of HSBC Mutual Fund, which comprise the balance sheet as at 31 March 2021 and the revenue account and cash flow statement for the year then ended, and notes to the financial statements, including a summary of the significant accounting policies.
In our opinion and to the best of our information and according to the explanations given to us, the aforesaid financial statements give a true and fair view in conformity with the accounting principles generally accepted in India, of the state of affairs of the Scheme as at 31 March 2021, its net surplus and cash flows for the year ended on that date.
Basis for Opinion
We conducted our audit in accordance with the Standards on Auditing (‘SAs’) issued by the Institute of Chartered Accountants of India (the ‘ICAI’). Our responsibilities under those SAs are further described in the Auditor’s Responsibilities for the Audit of the Financial Statements section of our report. We are independent of the Scheme in accordance with the Code of Ethics issued by the ICAI, and we have fulfilled our other ethical responsibilities in accordance with the Code of Ethics. We believe that the audit evidence we have obtained is sufficient and appropriate to provide a basis for our opinion.
Responsibilities of Management and Those Charged with Governance for the Financial Statements
The Scheme’s management, the Board of Directors of HSBC Mutual Fund (the ‘Trustees’) and the Board of Directors of HSBC Asset Management (India) Private Limited (the ‘AMC’) (collectively referred to as ‘Management’) are responsible for the preparation of these financial statements that give a true and fair view of the state of affairs, results of operations and cash flows of the Scheme in accordance with the accounting policies and standards specified in the Ninth Schedule of the Securities and Exchange Board of India (Mutual Funds) Regulations, 1996, as amended (the ‘Regulations’) and the accounting principles generally accepted in India. This responsibility includes design, implementation and maintenance of internal control relevant to the preparation and presentation of the financial statements that give a true and fair view and are free from material misstatement, whether due to fraud or error.
In preparing the financial statements, management is responsible for assessing the Scheme’s ability to continue as a going concern, disclosing, as applicable, matters related to going concern and using the going concern basis of accounting unless management either intends to liquidate the Scheme or to cease operations, or has no realistic alternative but to do so.
The management is responsible for overseeing the Scheme’s financial reporting process.
Auditor’s Responsibilities for the Audit of the Financial Statements
Our objectives are to obtain reasonable assurance about whether the financial statements as a whole are free from material misstatement, whether due to fraud or error, and to issue an auditor’s report that includes our opinion. Reasonable assurance is a high level of assurance, but is not a guarantee that an audit conducted in accordance with SAs will always detect a material misstatement when it exists. Misstatements can arise from fraud or error and are considered material if, individually or in the aggregate, they could reasonably be expected to influence the economic decisions of users taken on the basis of these financial statements.
As part of an audit in accordance with SAs, we exercise professional judgment and maintain professional skepticism throughout the audit. We also:
• Identifyandassesstherisksofmaterialmisstatementofthefinancialstatements,whetherduetofraudor error, design and perform audit procedures responsive to those risks, and obtain audit evidence that
Independent Auditors’ Report

15
HSBC Large and Mid Cap Equity Fund
Independent Auditors’ Report (Contd...)
is sufficient and appropriate to provide a basis for our opinion. The risk of not detecting a material misstatement resulting from fraud is higher than for one resulting from error, as fraud may involve collusion, forgery, intentional omissions, misrepresentations, or the override of internal control;
• Obtainanunderstandingofinternalcontrolrelevanttotheauditinordertodesignauditproceduresthat are appropriate in the circumstances, but not for the purpose of expressing an opinion on the effectiveness of the Scheme’s internal controls;
• Evaluatetheappropriatenessofaccountingpoliciesusedandthereasonablenessofaccountingestimatesand related disclosures made by Management;
• ConcludeontheappropriatenessofManagement’suseofthegoingconcernbasisofaccountingand,based on the audit evidence obtained, whether a material uncertainty exists related to events or conditions that may cast significant doubt on the Scheme’s ability to continue as a going concern. If we conclude that a material uncertainty exists, we are required to draw attention in our auditor’s report to the related disclosures in the financial statements or, if such disclosures are inadequate, to modify our opinion. Our conclusions are based on the audit evidence obtained up to the date of our auditor’s report. However, future events or conditions may cause the Scheme to cease to continue as a going concern;
• Evaluate the overall presentation, structure and content of the financial statements, including thedisclosures and whether the financial statements represent the underlying transactions and events in a manner that achieves fair presentation.
We communicate with those charged with governance regarding, among other matters, the planned scope and timing of the audit and significant audit findings, including any significant deficiencies in internal control that we identify during our audit.
We also provide those charged with governance with a statement that we have complied with relevant ethical requirements regarding independence, and to communicate with them all relationships and other matters that may reasonably be thought to bear on our independence, and where applicable, related safeguards.
Report on Other Legal and Regulatory Requirements
1 As required by Regulation 55 (4) of the Regulations, we report that:
(a) We have obtained all information and explanations which, to the best of our knowledge and belief, were necessary for the purposes of the audit; and
(b) The balance sheet and the revenue account have been prepared in accordance with the accounting policies and standards as specified in the Ninth Schedule of the Regulations.
2 As required by Clause 5 (ii) (2) of the Eleventh Schedule of the Regulations, we report that the balance sheet and the revenue account are in agreement with the books of account of the Scheme.
For B S R & Co. LLP Chartered Accountants Firm’s Registration No: 101248W/W-100022
Sd/-
Ajit Viswanath PartnerMembership No: 067114UDIN : 21067114AAAADQ8213
Place : Mumbai Date : July 20, 2021.
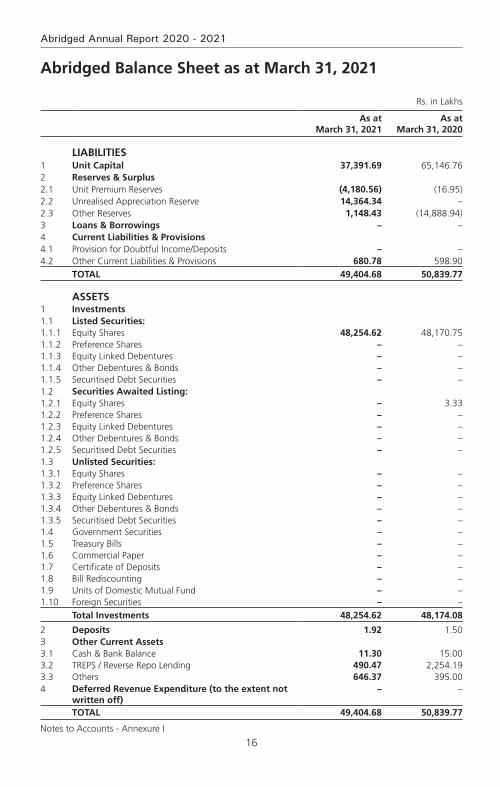
16
Abridged Annual Report 2020 - 2021
Rs. in Lakhs
As at March 31, 2021
As at March 31, 2020
LIABILITIES1 Unit Capital 37,391.69 65,146.76 2 Reserves & Surplus2.1 Unit Premium Reserves (4,180.56) (16.95)2.2 Unrealised Appreciation Reserve 14,364.34 – 2.3 Other Reserves 1,148.43 (14,888.94)3 Loans & Borrowings – – 4 Current Liabilities & Provisions4.1 Provision for Doubtful Income/Deposits – – 4.2 Other Current Liabilities & Provisions 680.78 598.90
TOTAL 49,404.68 50,839.77
ASSETS1 Investments1.1 Listed Securities:1.1.1 Equity Shares 48,254.62 48,170.75 1.1.2 Preference Shares – – 1.1.3 Equity Linked Debentures – – 1.1.4 Other Debentures & Bonds – – 1.1.5 Securitised Debt Securities – – 1.2 Securities Awaited Listing:1.2.1 Equity Shares – 3.33 1.2.2 Preference Shares – – 1.2.3 Equity Linked Debentures – – 1.2.4 Other Debentures & Bonds – – 1.2.5 Securitised Debt Securities – – 1.3 Unlisted Securities:1.3.1 Equity Shares – – 1.3.2 Preference Shares – – 1.3.3 Equity Linked Debentures – – 1.3.4 Other Debentures & Bonds – – 1.3.5 Securitised Debt Securities – – 1.4 Government Securities – – 1.5 Treasury Bills – – 1.6 Commercial Paper – – 1.7 Certificate of Deposits – – 1.8 Bill Rediscounting – – 1.9 Units of Domestic Mutual Fund – – 1.10 Foreign Securities – –
Total Investments 48,254.62 48,174.08
2 Deposits 1.92 1.50 3 Other Current Assets3.1 Cash & Bank Balance 11.30 15.00 3.2 TREPS / Reverse Repo Lending 490.47 2,254.19 3.3 Others 646.37 395.00 4 Deferred Revenue Expenditure (to the extent not
written off) – –
TOTAL 49,404.68 50,839.77
Notes to Accounts - Annexure I
Abridged Balance Sheet as at March 31, 2021

17
HSBC Large and Mid Cap Equity Fund
Abridged Revenue Account for the year ended March 31, 2021
Rs. in Lakhs
Current Year ended
March 31, 2021
Previous period ended
March 31, 2020
1 INCOME1.1 Dividend 340.54 678.43 1.2 Interest 27.70 204.10 1.3 Realised Gain / (Loss) on Foreign Exchange Transactions – – 1.4 Realised Gains / (Losses) on Interscheme Sale of Investments – – 1.5 Realised Gains / (Losses) on External Sale / Redemption of
Investments 3,298.39 (2,894.71)
1.6 Realised Gains / (Losses) on Derivative Transactions – – 1.7 Other Income 15.39 103.67
(A) 3,682.02 (1,908.51)
2 ExPENSES2.1 Investment Management Fees 494.25 558.09 2.2 GST on Investment Management Fees 88.97 100.46 2.3 Transfer Agents Fees and Expenses 59.13 80.06 2.4 Custodian Fees 6.55 7.61 2.5 Trusteeship Fees 1.75 1.85 2.6 Commission to Agents 626.38 748.04 2.7 Marketing & Distribution Expenses 0.95 0.54 2.8 Audit Fees 2.42 3.79 2.9 Investor Education Expenses 10.67 12.81 2.10 Interest on Borrowing – – 2.11 Other Operating Expenses 11.07 15.42
(B) 1,302.14 1,528.67
3 NET REALISED GAINS / (LOSSES) FOR THE YEAR (C = A - B) 2,379.88 (3,437.18)
4 Change in Unrealised Depreciation in Value of Investments (D) 11,387.09 (11,387.09)
5 NET GAINS / (LOSSES) FOR THE YEAR (E = C + D) 13,766.97 (14,824.27)
6 Change in Unrealised Appreciation in Value of Investments (F) 14,364.34 (30.89)
7 NET SURPLUS / (DEFICIT) FOR THE YEAR (G = E + F) 28,131.31 (14,855.16)
7.1 Add : Balance Transfer from Unrealised Appreciation Reserve – 30.89 7.2 Less : Balance Transfer to Unrealised Appreciation Reserve (14,364.34) – 7.3 Add / (Less) : Equalisation 2,270.40 (106.37)7.4 Transfer from Reserve Fund (14,888.94) 41.70 7.5 Transfer from Unit Premium Reserve – – 8 Total 1,148.43 (14,888.94)
9 Dividend Appropriation9.1 Income Distributed during the Year – – 9.2 Tax on Income Distributed during the Year – – 10 Retained Surplus / (Deficit) Carried Forward to
Balance Sheet 1,148.43 (14,888.94)
Notes to Accounts - Annexure I
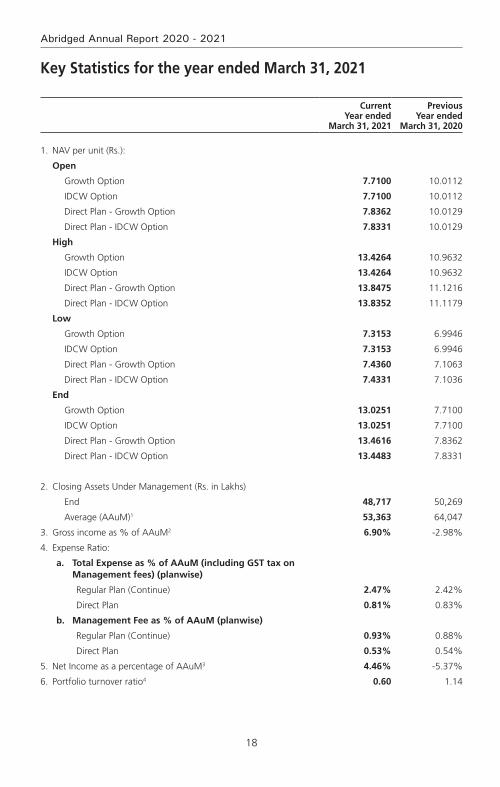
18
Abridged Annual Report 2020 - 2021
key Statistics for the year ended March 31, 2021
Current Year ended
March 31, 2021
Previous Year ended
March 31, 2020
1. NAV per unit (Rs.):
Open
Growth Option 7.7100 10.0112
IDCW Option 7.7100 10.0112
Direct Plan - Growth Option 7.8362 10.0129
Direct Plan - IDCW Option 7.8331 10.0129
High
Growth Option 13.4264 10.9632
IDCW Option 13.4264 10.9632
Direct Plan - Growth Option 13.8475 11.1216
Direct Plan - IDCW Option 13.8352 11.1179
Low
Growth Option 7.3153 6.9946
IDCW Option 7.3153 6.9946
Direct Plan - Growth Option 7.4360 7.1063
Direct Plan - IDCW Option 7.4331 7.1036
End
Growth Option 13.0251 7.7100
IDCW Option 13.0251 7.7100
Direct Plan - Growth Option 13.4616 7.8362
Direct Plan - IDCW Option 13.4483 7.8331
2. Closing Assets Under Management (Rs. in Lakhs)
End 48,717 50,269
Average (AAuM)1 53,363 64,047
3. Gross income as % of AAuM2 6.90% -2.98%
4. Expense Ratio:
a. Total Expense as % of AAuM (including GST tax on Management fees) (planwise)
Regular Plan (Continue) 2.47% 2.42%
Direct Plan 0.81% 0.83%
b. Management Fee as % of AAuM (planwise)
Regular Plan (Continue) 0.93% 0.88%
Direct Plan 0.53% 0.54%
5. Net Income as a percentage of AAuM3 4.46% -5.37%
6. Portfolio turnover ratio4 0.60 1.14
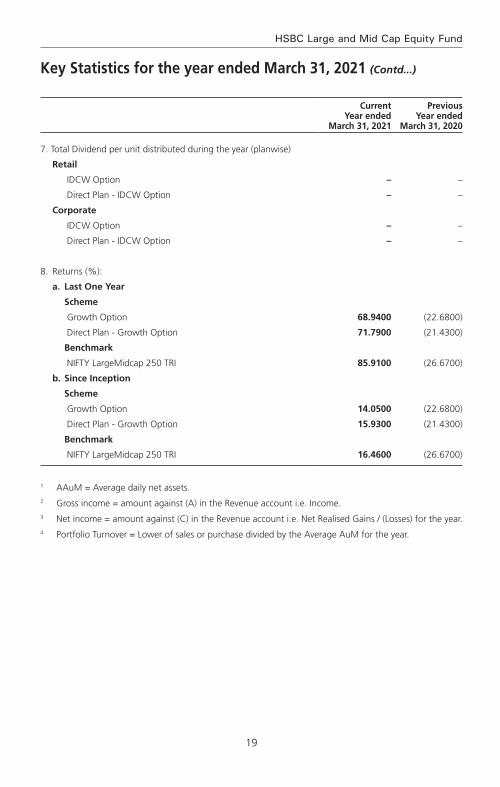
19
HSBC Large and Mid Cap Equity Fund
Current Year ended
March 31, 2021
Previous Year ended
March 31, 2020
7. Total Dividend per unit distributed during the year (planwise)
Retail
IDCW Option – –
Direct Plan - IDCW Option – –
Corporate
IDCW Option – –
Direct Plan - IDCW Option – –
8. Returns (%):
a. Last One Year
Scheme
Growth Option 68.9400 (22.6800)
Direct Plan - Growth Option 71.7900 (21.4300)
Benchmark
NIFTY LargeMidcap 250 TRI 85.9100 (26.6700)
b. Since Inception
Scheme
Growth Option 14.0500 (22.6800)
Direct Plan - Growth Option 15.9300 (21.4300)
Benchmark
NIFTY LargeMidcap 250 TRI 16.4600 (26.6700)
1 AAuM = Average daily net assets. 2 Gross income = amount against (A) in the Revenue account i.e. Income. 3 Net income = amount against (C) in the Revenue account i.e. Net Realised Gains / (Losses) for the year.4 Portfolio Turnover = Lower of sales or purchase divided by the Average AuM for the year.
key Statistics for the year ended March 31, 2021 (Contd...)
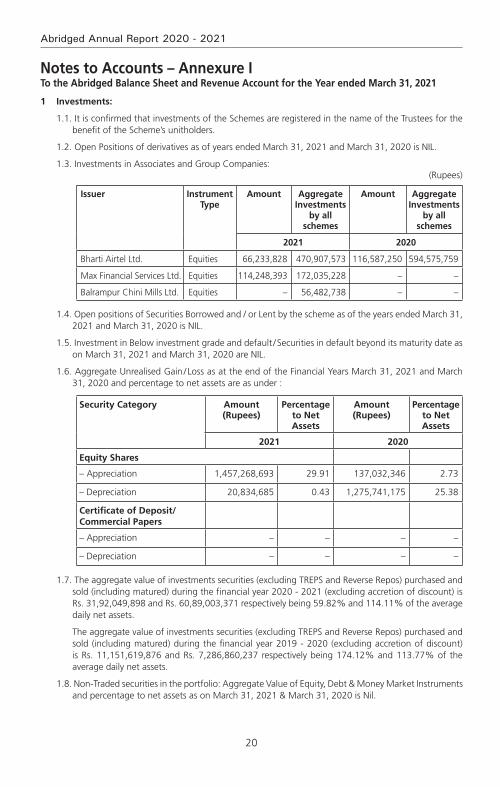
20
Abridged Annual Report 2020 - 2021
Notes to Accounts – Annexure ITo the Abridged Balance Sheet and Revenue Account for the Year ended March 31, 2021
1 Investments:
1.1. It is confirmed that investments of the Schemes are registered in the name of the Trustees for the benefit of the Scheme’s unitholders.
1.2. Open Positions of derivatives as of years ended March 31, 2021 and March 31, 2020 is NIL.
1.3. Investments in Associates and Group Companies:(Rupees)
Issuer Instrument Type
Amount Aggregate Investments
by all schemes
Amount Aggregate Investments
by all schemes
2021 2020
Bharti Airtel Ltd. Equities 66,233,828 470,907,573 116,587,250 594,575,759
Max Financial Services Ltd. Equities 114,248,393 172,035,228 – –
Balrampur Chini Mills Ltd. Equities – 56,482,738 – –
1.4. Open positions of Securities Borrowed and / or Lent by the scheme as of the years ended March 31, 2021 and March 31, 2020 is NIL.
1.5. Investment in Below investment grade and default / Securities in default beyond its maturity date as on March 31, 2021 and March 31, 2020 are NIL.
1.6. Aggregate Unrealised Gain / Loss as at the end of the Financial Years March 31, 2021 and March 31, 2020 and percentage to net assets are as under :
Security Category Amount (Rupees)
Percentage to Net Assets
Amount (Rupees)
Percentage to Net Assets
2021 2020
Equity Shares
– Appreciation 1,457,268,693 29.91 137,032,346 2.73
– Depreciation 20,834,685 0.43 1,275,741,175 25.38
Certificate of Deposit/Commercial Papers
– Appreciation – – – –
– Depreciation – – – –
1.7. The aggregate value of investments securities (excluding TREPS and Reverse Repos) purchased and sold (including matured) during the financial year 2020 - 2021 (excluding accretion of discount) is Rs. 31,92,049,898 and Rs. 60,89,003,371 respectively being 59.82% and 114.11% of the average daily net assets.
The aggregate value of investments securities (excluding TREPS and Reverse Repos) purchased and sold (including matured) during the financial year 2019 - 2020 (excluding accretion of discount) is Rs. 11,151,619,876 and Rs. 7,286,860,237 respectively being 174.12% and 113.77% of the average daily net assets.
1.8. Non-Traded securities in the portfolio: Aggregate Value of Equity, Debt & Money Market Instruments and percentage to net assets as on March 31, 2021 & March 31, 2020 is Nil.
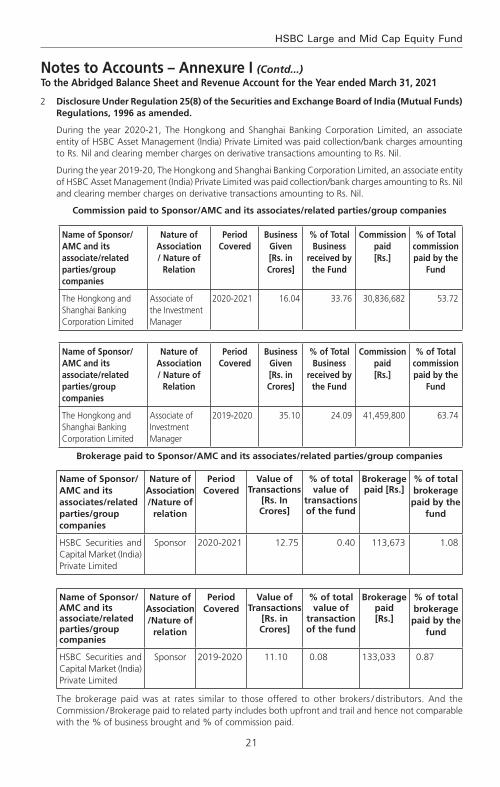
21
HSBC Large and Mid Cap Equity Fund
2 Disclosure Under Regulation 25(8) of the Securities and Exchange Board of India (Mutual Funds) Regulations, 1996 as amended.
During the year 2020-21, The Hongkong and Shanghai Banking Corporation Limited, an associate entity of HSBC Asset Management (India) Private Limited was paid collection/bank charges amounting to Rs. Nil and clearing member charges on derivative transactions amounting to Rs. Nil.
During the year 2019-20, The Hongkong and Shanghai Banking Corporation Limited, an associate entity of HSBC Asset Management (India) Private Limited was paid collection/bank charges amounting to Rs. Nil and clearing member charges on derivative transactions amounting to Rs. Nil.
Commission paid to Sponsor/AMC and its associates/related parties/group companies
Name of Sponsor/AMC and its associate/related parties/group companies
Nature of Association / Nature of
Relation
Period Covered
Business Given [Rs. in Crores]
% of Total Business
received by the Fund
Commission paid [Rs.]
% of Total commission paid by the
Fund
The Hongkong and Shanghai Banking Corporation Limited
Associate of the Investment Manager
2020-2021 16.04 33.76 30,836,682 53.72
Name of Sponsor/AMC and its associate/related parties/group companies
Nature of Association / Nature of
Relation
Period Covered
Business Given [Rs. in Crores]
% of Total Business
received by the Fund
Commission paid [Rs.]
% of Total commission paid by the
Fund
The Hongkong and Shanghai Banking Corporation Limited
Associate of Investment Manager
2019-2020 35.10 24.09 41,459,800 63.74
Brokerage paid to Sponsor/AMC and its associates/related parties/group companies
Name of Sponsor/AMC and its associates/related parties/group companies
Nature of Association /Nature of
relation
Period Covered
value of Transactions
[Rs. In Crores]
% of total value of
transactions of the fund
Brokerage paid [Rs.]
% of total brokerage paid by the
fund
HSBC Securities and Capital Market (India) Private Limited
Sponsor 2020-2021 12.75 0.40 113,673 1.08
Name of Sponsor/AMC and its associate/related parties/group companies
Nature of Association /Nature of
relation
Period Covered
value of Transactions
[Rs. in Crores]
% of total value of
transaction of the fund
Brokerage paid [Rs.]
% of total brokerage paid by the
fund
HSBC Securities and Capital Market (India) Private Limited
Sponsor 2019-2020 11.10 0.08 133,033 0.87
The brokerage paid was at rates similar to those offered to other brokers / distributors. And the Commission / Brokerage paid to related party includes both upfront and trail and hence not comparable with the % of business brought and % of commission paid.
Notes to Accounts – Annexure I (Contd...)To the Abridged Balance Sheet and Revenue Account for the Year ended March 31, 2021
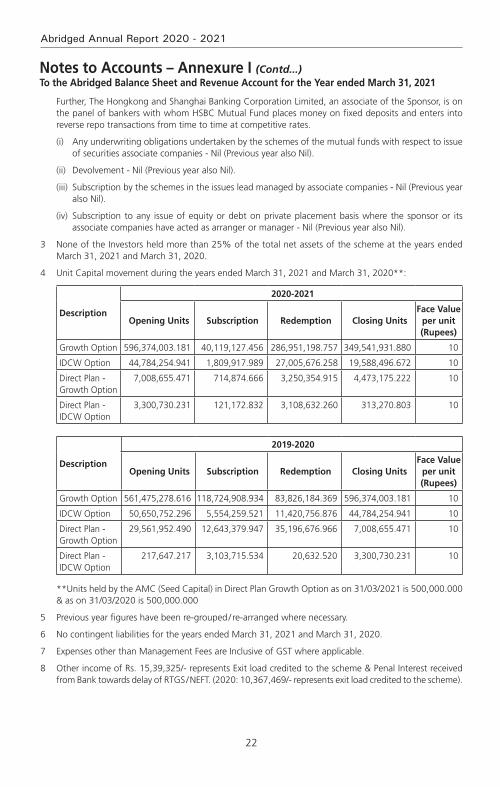
22
Abridged Annual Report 2020 - 2021
Further, The Hongkong and Shanghai Banking Corporation Limited, an associate of the Sponsor, is on the panel of bankers with whom HSBC Mutual Fund places money on fixed deposits and enters into reverse repo transactions from time to time at competitive rates.
(i) Any underwriting obligations undertaken by the schemes of the mutual funds with respect to issue of securities associate companies - Nil (Previous year also Nil).
(ii) Devolvement - Nil (Previous year also Nil).
(iii) Subscription by the schemes in the issues lead managed by associate companies - Nil (Previous year also Nil).
(iv) Subscription to any issue of equity or debt on private placement basis where the sponsor or its associate companies have acted as arranger or manager - Nil (Previous year also Nil).
3 None of the Investors held more than 25% of the total net assets of the scheme at the years ended March 31, 2021 and March 31, 2020.
4 Unit Capital movement during the years ended March 31, 2021 and March 31, 2020**:
Description
2020-2021
Opening Units Subscription Redemption Closing UnitsFace value
per unit (Rupees)
Growth Option 596,374,003.181 40,119,127.456 286,951,198.757 349,541,931.880 10
IDCW Option 44,784,254.941 1,809,917.989 27,005,676.258 19,588,496.672 10
Direct Plan - Growth Option
7,008,655.471 714,874.666 3,250,354.915 4,473,175.222 10
Direct Plan - IDCW Option
3,300,730.231 121,172.832 3,108,632.260 313,270.803 10
Description
2019-2020
Opening Units Subscription Redemption Closing UnitsFace value
per unit (Rupees)
Growth Option 561,475,278.616 118,724,908.934 83,826,184.369 596,374,003.181 10
IDCW Option 50,650,752.296 5,554,259.521 11,420,756.876 44,784,254.941 10
Direct Plan - Growth Option
29,561,952.490 12,643,379.947 35,196,676.966 7,008,655.471 10
Direct Plan - IDCW Option
217,647.217 3,103,715.534 20,632.520 3,300,730.231 10
**Units held by the AMC (Seed Capital) in Direct Plan Growth Option as on 31/03/2021 is 500,000.000 & as on 31/03/2020 is 500,000.000
5 Previous year figures have been re-grouped / re-arranged where necessary.
6 No contingent liabilities for the years ended March 31, 2021 and March 31, 2020.
7 Expenses other than Management Fees are Inclusive of GST where applicable.
8 Other income of Rs. 15,39,325/- represents Exit load credited to the scheme & Penal Interest received from Bank towards delay of RTGS / NEFT. (2020: 10,367,469/- represents exit load credited to the scheme).
Notes to Accounts – Annexure I (Contd...)To the Abridged Balance Sheet and Revenue Account for the Year ended March 31, 2021
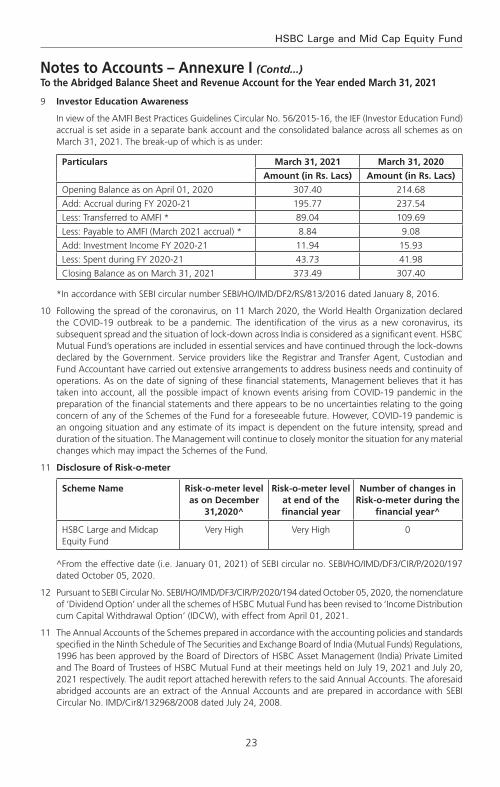
23
HSBC Large and Mid Cap Equity Fund
Notes to Accounts – Annexure I (Contd...)To the Abridged Balance Sheet and Revenue Account for the Year ended March 31, 2021
9 Investor Education Awareness
In view of the AMFI Best Practices Guidelines Circular No. 56/2015-16, the IEF (Investor Education Fund) accrual is set aside in a separate bank account and the consolidated balance across all schemes as on March 31, 2021. The break-up of which is as under:
Particulars March 31, 2021 March 31, 2020
Amount (in Rs. Lacs) Amount (in Rs. Lacs)
Opening Balance as on April 01, 2020 307.40 214.68
Add: Accrual during FY 2020-21 195.77 237.54
Less: Transferred to AMFI * 89.04 109.69
Less: Payable to AMFI (March 2021 accrual) * 8.84 9.08
Add: Investment Income FY 2020-21 11.94 15.93
Less: Spent during FY 2020-21 43.73 41.98
Closing Balance as on March 31, 2021 373.49 307.40
*In accordance with SEBI circular number SEBI/HO/IMD/DF2/RS/813/2016 dated January 8, 2016.
10 Following the spread of the coronavirus, on 11 March 2020, the World Health Organization declared the COVID-19 outbreak to be a pandemic. The identification of the virus as a new coronavirus, its subsequent spread and the situation of lock-down across India is considered as a significant event. HSBC Mutual Fund’s operations are included in essential services and have continued through the lock-downs declared by the Government. Service providers like the Registrar and Transfer Agent, Custodian and Fund Accountant have carried out extensive arrangements to address business needs and continuity of operations. As on the date of signing of these financial statements, Management believes that it has taken into account, all the possible impact of known events arising from COVID-19 pandemic in the preparation of the financial statements and there appears to be no uncertainties relating to the going concern of any of the Schemes of the Fund for a foreseeable future. However, COVID-19 pandemic is an ongoing situation and any estimate of its impact is dependent on the future intensity, spread and duration of the situation. The Management will continue to closely monitor the situation for any material changes which may impact the Schemes of the Fund.
11 Disclosure of Risk-o-meter
Scheme Name Risk-o-meter level as on December
31,2020^
Risk-o-meter level at end of the financial year
Number of changes in Risk-o-meter during the
financial year^
HSBC Large and Midcap Equity Fund
Very High Very High 0
^From the effective date (i.e. January 01, 2021) of SEBI circular no. SEBI/HO/IMD/DF3/CIR/P/2020/197 dated October 05, 2020.
12 Pursuant to SEBI Circular No. SEBI/HO/IMD/DF3/CIR/P/2020/194 dated October 05, 2020, the nomenclature of ‘Dividend Option’ under all the schemes of HSBC Mutual Fund has been revised to ‘Income Distribution cum Capital Withdrawal Option’ (IDCW), with effect from April 01, 2021.
11 The Annual Accounts of the Schemes prepared in accordance with the accounting policies and standards specified in the Ninth Schedule of The Securities and Exchange Board of India (Mutual Funds) Regulations, 1996 has been approved by the Board of Directors of HSBC Asset Management (India) Private Limited and The Board of Trustees of HSBC Mutual Fund at their meetings held on July 19, 2021 and July 20, 2021 respectively. The audit report attached herewith refers to the said Annual Accounts. The aforesaid abridged accounts are an extract of the Annual Accounts and are prepared in accordance with SEBI Circular No. IMD/Cir8/132968/2008 dated July 24, 2008.

24
Abridged Annual Report 2020 - 2021
voting Policy and Procedures
In view of SEBI guidelines related to “Role of Mutual Funds in Corporate Governance of Public Listed Companies”, HSBC AMC has formulated its “Policy for Proxy Voting in Public Listed Companies”. The said policy is available on our website and the details of actual exercise of proxy votes, the summary of votes casted and the auditor’s certificate for the Financial Year 2020 – 21 is forming part of our full Annual Report for the Financial Year 2020 – 21 which is uploaded on our website at http://www.assetmanagement.hsbc.co.in

25
HSBC Large and Mid Cap Equity Fund
Statutory Details & Disclaimers
All the returns have been sourced from Mutual Funds India Explorer software. The performance of the schemes and the benchmark is calculated on a total return basis. This document has been prepared by HSBC Asset Management (India) Private Ltd (HSBC) for information purposes only and should not be construed as i) an offer or recommendation to buy or sell securities, commodities, currencies or other investments referred to herein; or ii) an offer to sell or a solicitation or an offer for purchase of any of the funds of HSBC Mutual Fund; or iii) an investment research or investment advice. All information contained in this document (including that sourced from third parties), is obtained from sources HSBC and the third party which HSBC believes to be reliable however, has not independently verified the same. The information and opinions contained within the document are based upon publicly available information and rates of taxation applicable (if any) at the time of publication, which are subject to change from time to time.
Expressions of opinion are those of HSBC only and are subject to change without notice. It does not have regard to specific investment objectives, financial situation and the particular needs of any specific person who may receive this document. Investors should seek personal and independent advice regarding the appropriateness of investing in any of the funds, securities, other investment or investment strategies that may have been discussed or referred herein and should understand that the views regarding future prospects may or may not be realized. In no event shall HSBC Mutual Fund / HSBC Asset management (India) Private Limited and / or its affiliates or any of their directors, trustees, officers and employees be liable for any direct, indirect, special, incidental or consequential damages arising out of the use of information / opinion herein. Neither this document nor the units of HSBC Mutual Fund have been registered in any jurisdiction. The distribution of this document in certain jurisdictions may be restricted or totally prohibited and accordingly, persons who come into possession of this document are required to inform themselves about, and to observe, any such restrictions.
Mutual Fund investments are subject to market risks, read all scheme related documents carefully.
HSBC Focussed Equity FundAn open ended equity scheme investing in maximum 30 stocks across market caps (i.e. Multi-Cap)
Abridged Annual Report 2020 - 2021

1
HSBC Focussed Equity Fund#
Dear Investor,
The beginning of the last financial year now almost seems like a distant memory. COVID-19 was still a relatively unknown enemy and governments across the world were grappling with ways to control and mitigate the risks associated with it. Nationwide lockdowns were the norm and our markets both equity and fixed income reacted negatively leading to significant erosion of wealth. Within a short period of time markets bounced back. This confounded even the most astute market pundits. How is it possible that when GDP growth had slowed down, unemployment had risen, inflation was high could there be such sharp up move in equity indices. Whilst the reasons are well known about easy global liquidity, demand resurgence, cost cutting by corporates etc. perhaps its most important to remember that the markets are not a reflector but a predictor of economic activity.
At all times particularly during such volatile times it is important to go back to the basics. Why do you save, why do you invest, what goals would you like to achieve, how old are you, what is your risk appetite? The replies to these simple questions will help you determine your asset allocation. As an example when equity markets corrected sharply last year, investors who reviewed their asset allocation, stayed invested during the lows of the past year and were able to capture the rebound and have seen prime returns since then. The current market movement in all likelihood would have also led to some imbalances in your asset allocation. Do not ignore that and I strongly recommend that you do review this with your advisor to check whether re-balancing is required.
During this financial year we had three very successful new fund launches. The pandemic showed us a clear trend of dominant players becoming stronger and profit pool getting consolidated within a few companies. To capture this opportunity, we launched the HSBC Focused Equity Fund which garnered close to Rs. 520 crores. During the second half of 2020, in the fixed income space, 3 - 5 year duration range had a favourable investment scenario as RBI’s accommodative policy and surplus liquidity had reduced the returns at the very short end of the yield curve. There was a demand for an actively managed moderate duration strategy with better credit quality which we fulfilled by launching HSBC Corporate Bond Fund. It garnered over 700 crores. Our latest and first of its kind offering, HSBC Global Equity Climate Change Fund of Fund saw a stupendous response with over 8000 investors investing over Rs. 616 crores. This is an investment opportunity which goes beyond the rationale of simply generating investment returns and is the future of responsible investing.
We worked towards augmenting our digital capabilities by launching a few key enhancements to our online transaction platform. Being mindful of the movement restrictions in place, this year we focused on digitizing offline processes so that an investor need not need step out of her home for investing or availing any key services. While our interactive chatbot AskMe, eased service queries, our end-to-end digital KYC module enabled a first time Mutual Fund investor to invest in our funds without any paperwork. We listened to your feedback and digitized consolidation of folios and change of tax status which eliminated the need for you to physically visit our branches.
I am a strong believer in the India story and this story has just begun. The opportunity to invest in this high growth market is a very exciting opportunity. I do hope you share my enthusiasm and I ask that you continue to invest whilst reviewing your asset allocation at all times. As always thank you for your business. Stay safe.
Warm regards,
Ravi MenonChief Executive Officer,
HSBC Asset Management India

2
Abridged Annual Report 2020 - 2021
SPONSOR
HSBC Securities and Capital Markets (India) Private LimitedRegd. Office: 52/60, Mahatma Gandhi Road, Fort, Mumbai - 400 001.
TRUSTEE
Board of TrusteesOffice: 16, Veer Nariman Road, Fort, Mumbai 400 001.
ASSET MANAGEMENT COMPANY
HSBC Asset Management (India) Private LimitedCorp. & Regd. Office: 16, Veer Nariman Road, Fort, Mumbai 400 001.
CUSTODIAN
Standard Chartered Bank (SCB)Corp. & Regd. Office: Crescenzo, Securities Services, 3rd Floor, C-38/39, G-Block,Bandra Kurla Complex, Bandra East, Mumbai – 400051.
AUDITORS TO THE SCHEME
BSR & Co. LLPChartered Accountants
5th Floor, Lodha Excelus, Apollo Mills Compound, N. M. Joshi Marg, Mahalaxmi, Mumbai 400 011.
REGISTRAR & TRANSFER AGENTS
Computer Age Management Services Limited (CAMS)Unit: HSBC Mutual Fund ’C’ Block, 2nd Floor, Hanudev Info Park P. Ltd., SF No. 558/2, Udayampalayam Road, Nava India, Coimbatore - 641 028.
BOARD OF TRUSTEES
Ms. Jasmine Batliwalla - Chairperson
Mr. Nani Javeri - Trustee
Dr. T. C. Nair - Trustee
Mr. Pedro Bastos - Trustee
BOARD OF DIRECTORS
Mr. Dinesh Mittal - Director
Dr. Indu Shahani - Director
Mr. Ravi Menon - Director & Chief Executive Officer
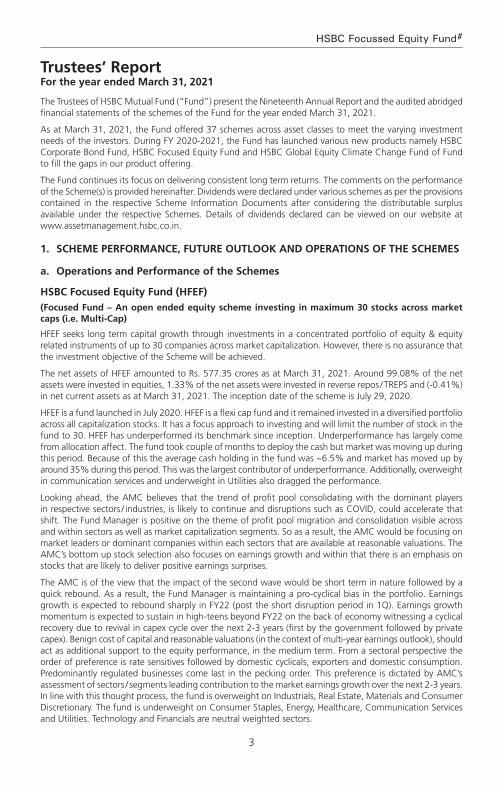
3
HSBC Focussed Equity Fund#
The Trustees of HSBC Mutual Fund (“Fund”) present the Nineteenth Annual Report and the audited abridged financial statements of the schemes of the Fund for the year ended March 31, 2021.
As at March 31, 2021, the Fund offered 37 schemes across asset classes to meet the varying investment needs of the investors. During FY 2020-2021, the Fund has launched various new products namely HSBC Corporate Bond Fund, HSBC Focused Equity Fund and HSBC Global Equity Climate Change Fund of Fund to fill the gaps in our product offering.
The Fund continues its focus on delivering consistent long term returns. The comments on the performance of the Scheme(s) is provided hereinafter. Dividends were declared under various schemes as per the provisions contained in the respective Scheme Information Documents after considering the distributable surplus available under the respective Schemes. Details of dividends declared can be viewed on our website at www.assetmanagement.hsbc.co.in.
1. Scheme Performance, future outlook and oPerationS of the SchemeS
a. operations and Performance of the Schemes
hSBc focused equity fund (hfef) (focused fund – an open ended equity scheme investing in maximum 30 stocks across market caps (i.e. multi-cap)
HFEF seeks long term capital growth through investments in a concentrated portfolio of equity & equity related instruments of up to 30 companies across market capitalization. However, there is no assurance that the investment objective of the Scheme will be achieved.
The net assets of HFEF amounted to Rs. 577.35 crores as at March 31, 2021. Around 99.08% of the net assets were invested in equities, 1.33% of the net assets were invested in reverse repos / TREPS and (-0.41%) in net current assets as at March 31, 2021. The inception date of the scheme is July 29, 2020.
HFEF is a fund launched in July 2020. HFEF is a flexi cap fund and it remained invested in a diversified portfolio across all capitalization stocks. It has a focus approach to investing and will limit the number of stock in the fund to 30. HFEF has underperformed its benchmark since inception. Underperformance has largely come from allocation affect. The fund took couple of months to deploy the cash but market was moving up during this period. Because of this the average cash holding in the fund was ~6.5% and market has moved up by around 35% during this period. This was the largest contributor of underperformance. Additionally, overweight in communication services and underweight in Utilities also dragged the performance.
Looking ahead, the AMC believes that the trend of profit pool consolidating with the dominant players in respective sectors / industries, is likely to continue and disruptions such as COVID, could accelerate that shift. The Fund Manager is positive on the theme of profit pool migration and consolidation visible across and within sectors as well as market capitalization segments. So as a result, the AMC would be focusing on market leaders or dominant companies within each sectors that are available at reasonable valuations. The AMC’s bottom up stock selection also focuses on earnings growth and within that there is an emphasis on stocks that are likely to deliver positive earnings surprises.
The AMC is of the view that the impact of the second wave would be short term in nature followed by a quick rebound. As a result, the Fund Manager is maintaining a pro-cyclical bias in the portfolio. Earnings growth is expected to rebound sharply in FY22 (post the short disruption period in 1Q). Earnings growth momentum is expected to sustain in high-teens beyond FY22 on the back of economy witnessing a cyclical recovery due to revival in capex cycle over the next 2-3 years (first by the government followed by private capex). Benign cost of capital and reasonable valuations (in the context of multi-year earnings outlook), should act as additional support to the equity performance, in the medium term. From a sectoral perspective the order of preference is rate sensitives followed by domestic cyclicals, exporters and domestic consumption. Predominantly regulated businesses come last in the pecking order. This preference is dictated by AMC’s assessment of sectors / segments leading contribution to the market earnings growth over the next 2-3 years. In line with this thought process, the fund is overweight on Industrials, Real Estate, Materials and Consumer Discretionary. The fund is underweight on Consumer Staples, Energy, Healthcare, Communication Services and Utilities. Technology and Financials are neutral weighted sectors.
Trustees’ ReportFor the year ended March 31, 2021

4
Abridged Annual Report 2020 - 2021
date of inception : 22 July 2020 absolute returns (%)
compounded annualized returns (%)
Scheme name & Benchmarks 6 months 1 year 3 Years 5 Years Since inception
HSBC Focused Equity Fund- Growth 30.92 NA NA NA 31.96
S&P BSE 200 TRI (Scheme Benchmark) 32.22 NA NA NA 35.93
Nifty 50 TRI (Standard Benchmark) 31.22 NA NA NA 32.84
10,000, if invested in HFEF, would have become
11,541.00 NA NA NA 13,196.00
10,000, if invested in S&P BSE 200 TRI, would have become
11,606.00 NA NA NA 13,593.00
10,000, if invested in Nifty 50 TRI, would have become
11,557.00 NA NA NA 13,284.00
Past performance may or may not be sustained in future. The returns for the respective periods are provided as on last business day of March 2021 for Growth Option. Different plans shall have a different expense structure. Performance of the respective benchmark is calculated as per the Total Return Index (TRI). Absolute returns have been provided for less than 1 year.
b. market overview & outlook (as furnished by hSBc asset management (india) Private limited)
equitY outlook
recap of fY 2020-21:
Fiscal 2020-21 was a rewarding year for equity investors with market indices recording stellar gains from the low base after the COVID correction. Market sentiments steadily improved during the course of the year to deliver positive returns in all four quarters of the year.
We witnessed various legs of market performance during the last fiscal, driven by multiple factors and variables. Initial rebound from the market lows was driven by attractive valuations, then it was on the back of faster than anticipated recovery post lockdown, reopening optimism, swifter than expected vaccine intervention and above all, the unprecedented liquidity. Lastly but importantly, a period of lower cost of capital coupled with low real rates, improved the attractiveness of equity as an asset class, driving the performance.
As a result, the year ended with optimism compared to despair when it began. Corporate India overcame the challenges posed by COVID through significant cost control measures while at the same time showed improvement in their financial position and cash flows.
Commodities also rallied from the lows of the COVID crisis with global crude oil prices surging by 179% during the year. INR appreciated by 3.3% (as India recorded strong net FPI inflows) during the year. MSCI India index outperformed most of key global indices during the past fiscal. MSCI India index (USD) gained 74.8% as compared to 51.8% for MSCI World, 50.5% for Dow Jones, 55.1% for MSCI Emerging Markets, 41.2% for MSCI China and 42% for MSCI Europe*.
At a record USD 37.3 bn of net FPI inflows during the fiscal, the tally was higher than the cumulative net inflows India received from the previous 6 years. DIIs on the other hand saw net outflows of USD 18.4 bn and this was the first fiscal year of net outflows from the segment in 5 years. The net outflows from the segment was driven by USD 16.7 bn of outflows from the MFs while domestic insurers saw a far lower outflow of USD 1.6 bn*.
indices returns (april 1, 2020 to march 31, 2021) 1 Year^
S&P BSE Sensex TR 69.8%
NSE CNX Nifty TR 72.5%
S&P BSE 100 TR 73.5%
Trustees’ ReportFor the year ended March 31, 2021 (Contd...)
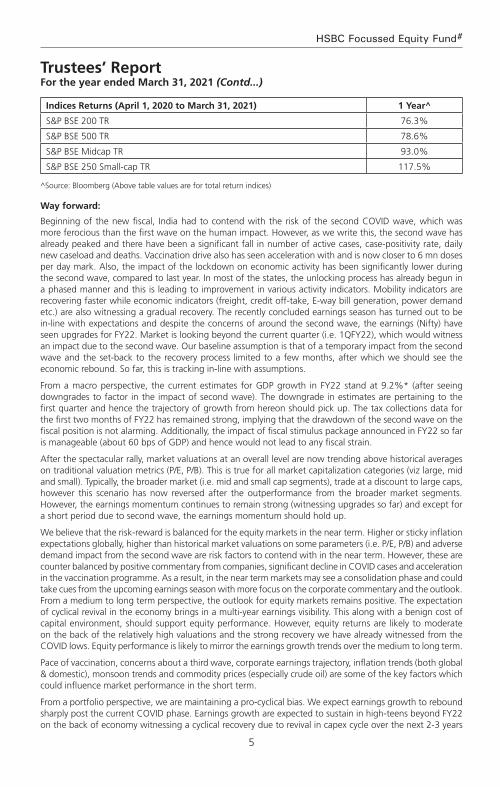
5
HSBC Focussed Equity Fund#
indices returns (april 1, 2020 to march 31, 2021) 1 Year^
S&P BSE 200 TR 76.3%
S&P BSE 500 TR 78.6%
S&P BSE Midcap TR 93.0%
S&P BSE 250 Small-cap TR 117.5%
^Source: Bloomberg (Above table values are for total return indices)
Way forward:
Beginning of the new fiscal, India had to contend with the risk of the second COVID wave, which was more ferocious than the first wave on the human impact. However, as we write this, the second wave has already peaked and there have been a significant fall in number of active cases, case-positivity rate, daily new caseload and deaths. Vaccination drive also has seen acceleration with and is now closer to 6 mn doses per day mark. Also, the impact of the lockdown on economic activity has been significantly lower during the second wave, compared to last year. In most of the states, the unlocking process has already begun in a phased manner and this is leading to improvement in various activity indicators. Mobility indicators are recovering faster while economic indicators (freight, credit off-take, E-way bill generation, power demand etc.) are also witnessing a gradual recovery. The recently concluded earnings season has turned out to be in-line with expectations and despite the concerns of around the second wave, the earnings (Nifty) have seen upgrades for FY22. Market is looking beyond the current quarter (i.e. 1QFY22), which would witness an impact due to the second wave. Our baseline assumption is that of a temporary impact from the second wave and the set-back to the recovery process limited to a few months, after which we should see the economic rebound. So far, this is tracking in-line with assumptions.
From a macro perspective, the current estimates for GDP growth in FY22 stand at 9.2%* (after seeing downgrades to factor in the impact of second wave). The downgrade in estimates are pertaining to the first quarter and hence the trajectory of growth from hereon should pick up. The tax collections data for the first two months of FY22 has remained strong, implying that the drawdown of the second wave on the fiscal position is not alarming. Additionally, the impact of fiscal stimulus package announced in FY22 so far is manageable (about 60 bps of GDP) and hence would not lead to any fiscal strain.
After the spectacular rally, market valuations at an overall level are now trending above historical averages on traditional valuation metrics (P/E, P/B). This is true for all market capitalization categories (viz large, mid and small). Typically, the broader market (i.e. mid and small cap segments), trade at a discount to large caps, however this scenario has now reversed after the outperformance from the broader market segments. However, the earnings momentum continues to remain strong (witnessing upgrades so far) and except for a short period due to second wave, the earnings momentum should hold up.
We believe that the risk-reward is balanced for the equity markets in the near term. Higher or sticky inflation expectations globally, higher than historical market valuations on some parameters (i.e. P/E, P/B) and adverse demand impact from the second wave are risk factors to contend with in the near term. However, these are counter balanced by positive commentary from companies, significant decline in COVID cases and acceleration in the vaccination programme. As a result, in the near term markets may see a consolidation phase and could take cues from the upcoming earnings season with more focus on the corporate commentary and the outlook. From a medium to long term perspective, the outlook for equity markets remains positive. The expectation of cyclical revival in the economy brings in a multi-year earnings visibility. This along with a benign cost of capital environment, should support equity performance. However, equity returns are likely to moderate on the back of the relatively high valuations and the strong recovery we have already witnessed from the COVID lows. Equity performance is likely to mirror the earnings growth trends over the medium to long term.
Pace of vaccination, concerns about a third wave, corporate earnings trajectory, inflation trends (both global & domestic), monsoon trends and commodity prices (especially crude oil) are some of the key factors which could influence market performance in the short term.
From a portfolio perspective, we are maintaining a pro-cyclical bias. We expect earnings growth to rebound sharply post the current COVID phase. Earnings growth are expected to sustain in high-teens beyond FY22 on the back of economy witnessing a cyclical recovery due to revival in capex cycle over the next 2-3 years
Trustees’ ReportFor the year ended March 31, 2021 (Contd...)
6
Abridged Annual Report 2020 - 2021
(first by the government followed by private capex). From a sectoral perspective our order of preference is rate sensitives followed by domestic cyclicals, exporters and domestic consumption. Predominantly regulated businesses come last in our pecking order. This preference is dictated by our assessment of sectors / segments leading contribution to the market earnings growth over the next 2-3 years. Our portfolio construction is driven by a bottom up approach to stock selection with a focus on names that can deliver positive earnings surprises. We continue to focus on this theme to identify likely outperformers.
*Source: Bloomberg
deBt outlook
market drivers during the course of the year fY21
The Fixed Income markets started the year with a bout of nervousness that was triggered by the pandemic. While RBI had calmed the markets with its large rate cut action of 75bp cut followed by liquidity supportive measures, the volatility continued until mid-May when government announced its relief package. While it was not fiscally expansive, it touched the right cords in terms of credit flow to desired sectors. This was followed up with RBI’s credit relief measures in terms of moratorium and restructuring of assets that were stressed due to the pandemic. Throughout the course of the year, RBI maintained its accommodative stance along with significant amount of surplus liquidity that was supportive and helped in maintaining stability in the market. However, as the year progressed and pressure on fiscal began to mount yields started seeing a spike towards the last quarter of the fiscal. While borrowing was stepped up to INR 12 trillion from previously budgeted INR 7.8 trillion in May 2020, it was further enhanced by and additional INR 1.1 trillion in October 2020. Overall GOI ended up borrowing a record amount of INR 13.9 trillion. The budget proved to be a shocker with GOI using the pandemic as an opportunity for setting the finances in order. GOI showed a record deficit of 9.5% for FY21 and projected a 6.8% for FY22 with estimated central government gross borrowing of INR 12 trillion. This seemed to reverse the support RBI had provided throughout the year with benchmark 10-year bond peaking to 6.23% in mid –Feb 2021. RBI’s statements to remain supportive were left in the sidelines. Overall it seemed that the 115bp of rate cut, along with significant liquidity infusion (OMO + Twist operations of ~INR 3 trillion, infusion via dollar purchases) seemed only a little to help in applying a brake to the one-way spike in yields. The year closed ~6.16% with absence of concrete action by RBI.
rBi Policy: Through the course of the year, RBI has maintained an accommodative stance, with an aggregate 115bp of rate cut done in March and May 2020 taking the repo rate from 5.15% to 4%. Subsequently while inflation pressures prevented RBI from taking any direct actions, RBI has used a combination of creative tools to keep the rates contained primarily via liquidity supportive tools such as OMOs, Twist Operations, Repo linked Term loans to needy sectors (LTROs, TLTROs), CRR cuts. While inflation was a worry for most part of the year, RBI kept it aside admitting that growth was a priority and inflation effects are more supply side rather than demand side. Prospectively into FY22, with the onset of the second wave, RBI continues to maintain the stance to prioritize growth.
inflation: Inflation for most part of the year stayed above 6% primarily driven by supply side pressures and some intermittent spike from food inflation as well. While it has been coming off since December with cooling off of food inflation and positive base effects, it has been between 4- 5.5%. Structurally however inflation risks continue to remain as oil prices have increased and base effects will not remain supportive for long. Core inflation continues to remain sticky.
liquidity: During the year, system liquidity has remained at significant surplus facilitated largely by RBI action such as OMOs, foreign exchange operations and government spending.
Budget: The FY2022 union budget focuses on growth and has accordingly, presented a 9.5% fiscal deficit for FY21 and 6.8% for FY22. On the revenue side, the assumptions are largely realistic, with FY22 (E) Nominal GDP growth at 14.4% and tax revenue growth at 17% considering the pandemic impact in FY 21. Compared to FY20, tax revenue growth is ~10%. While non-tax revenues are ambitious pegging the divestment at INR 1.75 trillion, with robust pipeline of assets including monetization of road and transmission assets, execution remains the key as in the past. On the expenditure side, better quality capex spending with focusing on rail, road, defense, urban infra is positive for long term structural growth. The revenue side expenditure adjusting for clearance of past subsidy arrears will be similar to budgetary estimates. Government using this opportunity to bring back off-balance sheet spending to on-balance sheet was a welcome move towards transparency and showing realistic projections. Alongside, states have also been given leeway to borrow upto 4% of their
Trustees’ ReportFor the year ended March 31, 2021 (Contd...)
7
HSBC Focussed Equity Fund#
GDP with an additional 0.5% subject to conditions. Given that states are an important vehicle for capex investment, this move is welcome although it may entail additional state borrowing. The fiscal glide path is shifted to FY26 at below 4.5% for center and 3% for states suggesting that spending will continue and borrowing will come down gradually. In summary, from survival to revival, FY22 budget aims for structural growth leaving fiscal concerns sideways in the interim. Government’s intent seems clear on bringing back growth on the table, in a transparent manner.
While the second wave of the pandemic has once again derailed the revenue story, government will still have some cushion from its conservative estimates.
currency and fii flows: INR has been on an appreciation trajectory for most part of the year, aided by dollar underperformance supported by positive FII and FDI flows along with reduced imports on the domestic front as well. RBI has used most of the flows to accumulate reserves which has prevented any strong appreciation. Pandemic shock and global risk off led rupee over 75 in the beginning of the year only to close below 72 at the end of the fiscal year. While the second wave led to another spike in INR in April, it has since then cooled once again driven by dollar underperformance and pandemic recovery on the domestic front. Net FII flows was ~$30 bn with positive equity flows of~$37 bn while debt was negative ~$7bn and overall RBI’s forex reserves rose by a ~$100 bn to close ~$537 bn.
credit growth: Credit growth for the entire year has been tepid as previous year’s credit events were followed by nervousness relating to the pandemic. Despite RBI opening up several windows to finance the non-AAA segment, there was very little fresh credit flowing that segment. Overall banking credit grew by only 6.5%. Risk appetite has however been improving from a complete risk aversion to opening up towards a calculated risk. Prospectively it is expected that once the pandemic risk abates, credit growth will resume primarily driven by government capex spending and demand recovery.
market outlook
The pandemic once again brought the country to a situation similar to last year and debt markets perhaps interpreted the same as a structural rise in rates. In the initial day’s post budget in Feb of 2021, market was expecting a concrete set of actions such as an OMO calendar from RBI, and RBI’s words alone failed to calm the market. The first auction of the fiscal year also saw a devolvement. However, RBI acted in the first policy of the year announcing a bond buyback program akin to QE (quantitative easing) and its subsequent cancellation of auctions wherein yields were perhaps quoted higher than RBI’s comfort levels brought back confidence into the market. Since then we have seen a strong rally with 10-year benchmark trending below 6% and the curve moving alongside. RBI reiteration of priority of growth and also supporting with higher than expected dividend payment stand out as a testimony of its support. While we do not expect RBI to act in terms of rate cuts, we believe that measures such as G-SAP, OMOs will continue until there is visibility of a structural growth. Therefore, the large borrowing program should go without any hiccups.
Furthermore, with the evidence of strong GST numbers until April 2021 (before the 2nd wave), it is expected that growth and therefore fiscal revenues will come back. Government’s conservative budget estimates are supportive. Also, given the fact that compared to last year there has not been a complete shutdown of activity (lockdowns being distributed), the impact on growth will not be similar to last year. Pent up demand will come back to support revenue collection. However, on the flipside, once growth resumes RBI will be forced to withdraw liquidity in a phased manner to prevent asset bubbles. Nevertheless, RBI need not act in terms of rate actions and we believe that a prolonged pause in terms of RBI rates is in the offing.
Net-net therefore while growth is wanting no matter what, it may come at a small price of rise in yields with liquidity withdrawal. That is however expected more in the 2nd half of the year. Lower than expected borrowing numbers, later this year or if not in next year could be a surprise. We may therefore see a range bound rate action in the near term with a rising bias over time. Global rate environment, oil and currency risks are to be watched out for.
2. Brief Background of SPonSorS, Board of truSteeS and aSSet management comPanY
a. Sponsor
HSBC Mutual Fund is sponsored by HSBC Securities and Capital Markets (India) Private Limited (HSCI). The Sponsor is the Settler of the Mutual Fund Trust. The Sponsor has entrusted a sum of Rs. 1,00,000/- (Rupees One Lakh only) to the Trustee as the initial contribution towards the corpus of the Mutual Fund.
Trustees’ ReportFor the year ended March 31, 2021 (Contd...)
8
Abridged Annual Report 2020 - 2021
HSCI offers integrated investment banking services, securities and corporate finance & advisory. HSCI is a member of the Bombay Stock Exchange Limited and National Stock Exchange (capital and derivative market segments). HSCI holds 100% of the paid up equity share capital of HSBC Asset Management (India) Private Limited.
b. hSBc mutual fund
HSBC Mutual Fund (“the Mutual Fund” or “the Fund”) has been constituted as a Trust in accordance with the provisions of the Indian Trusts Act, 1882 (2 of 1882) vide a Trust Deed dated February 7, 2002 with HSBC Securities and Capital Markets (India) Private Limited, as the Sponsor and the Board of Individual Trustees. The Trustee has entered into an Investment Management Agreement dated February 7, 2002 with HSBC Asset Management (India) Private Limited (AMC) to function as the Investment Manager for all the schemes of the Fund. The Fund was registered with SEBI vide registration number MF/046/02/5 dated May 27, 2002.
The Trust has been formed for the purpose of pooling of capital from the public for collective investment in securities for the purpose of providing facilities for participation by persons as beneficiaries in such investments and in the profits/income arising therefrom.
c. Board of trustees (the trustees)
The Board of Trustees is the exclusive owner of the Trust Fund and holds the same in trust for the benefit of the unit holders. The Trustees have been discharging their duties and carrying out the responsibilities as provided in the SEBI (Mutual Funds) Regulations, 1996 and the Trust Deed. The Trustees seek to ensure that the Fund and the schemes floated there under are managed by the AMC in accordance with the Trust Deed, the said Regulations, directions and guidelines issued by the SEBI, the Stock Exchanges, the Association of Mutual Funds in India and other regulatory agencies.
d. asset management company (the amc)
HSBC Asset Management (India) Private Limited (the Investment Manager or the AMC) is a private limited company incorporated under the Companies Act, 1956 on December 12, 2001 having its Registered Office at 16, V. N. Road, Fort, Mumbai 400 001. HSBC Asset Management (India) Private Limited has been appointed as the Asset Management Company of HSBC Mutual Fund by the Trustee vide Investment Management Agreement (IMA) dated February 7, 2002 and executed between the Trustees and the AMC. SEBI approved the AMC to act as the Investment Manager of the Fund vide its letter No. MFD/BC/163/2002 dated May 27, 2002. The paid-up equity share capital of the AMC is Rs. 61.59 crores. The AMC is registered as a Portfolio Manager under the SEBI (Portfolio Managers) Regulations, 1993 vide registration no. INP000001322. The AMC also offers non-binding Advisory services to offshore funds under the mutual fund license.
HSBC Securities and Capital Markets (India) Private Limited holds 100% of the paid up equity share capital of the AMC.
3. inveStment oBJective of the SchemeSThe investment objective of the respective schemes has been provided above under the heading “Scheme Performance, Future Outlook and Operation of the Scheme” (Refer Section 1).
4. Significant accounting PolicieS The Significant Accounting Policies form part of the Notes to the Accounts annexed to the Balance Sheet of the Schemes in the Full Annual Report. The accounting policies are in accordance with Securities Exchange Board of India (Mutual Funds) Regulations 1996.
5. unclaimed dividendS & redemPtionSSummary of number of investors & corresponding amount as on March 31, 2021:
Nil.
6. inveStor ServiceSThe number of official points of acceptance of transactions is 204 locations. In addition to the offices of the Registrar & Transfer agents, the AMC has Investor Service Centers in 9 locations at its own offices - namely
Trustees’ ReportFor the year ended March 31, 2021 (Contd...)
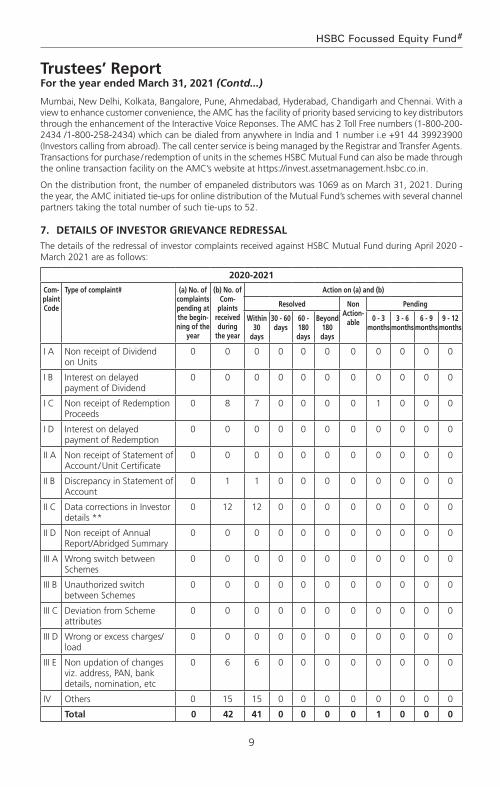
9
HSBC Focussed Equity Fund#
Mumbai, New Delhi, Kolkata, Bangalore, Pune, Ahmedabad, Hyderabad, Chandigarh and Chennai. With a view to enhance customer convenience, the AMC has the facility of priority based servicing to key distributors through the enhancement of the Interactive Voice Reponses. The AMC has 2 Toll Free numbers (1-800-200-2434 /1-800-258-2434) which can be dialed from anywhere in India and 1 number i.e +91 44 39923900 (Investors calling from abroad). The call center service is being managed by the Registrar and Transfer Agents. Transactions for purchase / redemption of units in the schemes HSBC Mutual Fund can also be made through the online transaction facility on the AMC’s website at https://invest.assetmanagement.hsbc.co.in.
On the distribution front, the number of empaneled distributors was 1069 as on March 31, 2021. During the year, the AMC initiated tie-ups for online distribution of the Mutual Fund’s schemes with several channel partners taking the total number of such tie-ups to 52.
7. detailS of inveStor grievance redreSSalThe details of the redressal of investor complaints received against HSBC Mutual Fund during April 2020 - March 2021 are as follows:
2020-2021
com-plaint code
type of complaint# (a) no. of complaints pending at the begin-ning of the
year
(b) no. of com-
plaints received during
the year
action on (a) and (b)
resolved non action-
able
Pending
Within 30
days
30 - 60 days
60 - 180 days
Beyond 180 days
0 - 3 months
3 - 6 months
6 - 9 months
9 - 12 months
I A Non receipt of Dividend on Units
0 0 0 0 0 0 0 0 0 0 0
I B Interest on delayed payment of Dividend
0 0 0 0 0 0 0 0 0 0 0
I C Non receipt of Redemption Proceeds
0 8 7 0 0 0 0 1 0 0 0
I D Interest on delayed payment of Redemption
0 0 0 0 0 0 0 0 0 0 0
II A Non receipt of Statement of Account / Unit Certificate
0 0 0 0 0 0 0 0 0 0 0
II B Discrepancy in Statement of Account
0 1 1 0 0 0 0 0 0 0 0
II C Data corrections in Investor details **
0 12 12 0 0 0 0 0 0 0 0
II D Non receipt of Annual Report/Abridged Summary
0 0 0 0 0 0 0 0 0 0 0
III A Wrong switch between Schemes
0 0 0 0 0 0 0 0 0 0 0
III B Unauthorized switch between Schemes
0 0 0 0 0 0 0 0 0 0 0
III C Deviation from Scheme attributes
0 0 0 0 0 0 0 0 0 0 0
III D Wrong or excess charges/load
0 0 0 0 0 0 0 0 0 0 0
III E Non updation of changes viz. address, PAN, bank details, nomination, etc
0 6 6 0 0 0 0 0 0 0 0
IV Others 0 15 15 0 0 0 0 0 0 0 0
total 0 42 41 0 0 0 0 1 0 0 0
Trustees’ ReportFor the year ended March 31, 2021 (Contd...)

10
Abridged Annual Report 2020 - 2021
Trustees’ ReportFor the year ended March 31, 2021 (Contd...)
Summary of complaints for fY 2020-21
Particulars count
Total complaints received 42
Total number of folios 148770
% of complaints against the folio 0.028%
# active folios
** As per AMFI Best Practice Guidelines Circular No. 25/2011-12 for Revisions in the Guidelines on Standardization of Complaints / Grievances Reporting Procedure. If “Others” include a type of complaint which is more than 10% of overall complaints, then such a reason should be provided separately. Hence data corrections in Investor Details is included as a separate category
* Non actionable means the complaint is incomplete / outside the scope of the mutual fund
8. inveStor education initiativeS Investor awareness advertisements were published in Mutual Fund Insight magazine on a monthly basis along with an editorial on ‘SIP Sahi Hai’. Additionally, monthly articles / blogs have been written by Advisorkhoj on IAP which talks of the advantages of SIP, start early, power of compounding, diversification, asset allocation etc. The same is promoted by the publisher via an email to their entire network and also on their social media handles which can be retweeted or liked. Also, educative infographics have been hosted on our website under the investor resources section. The same have also been circulated to existing Indian investors via email for engagement and for educative purposes.
9. ProxY voting PolicYIn terms of SEBI Circular no. SEBI/IMD/CIR No. 18/198647/2010 dated March 15, 2010, the Fund has adopted Proxy Voting Policy and Procedures for exercising voting rights in respect of securities held by the Schemes.
The summary of the votes casted in the general meetings of the Investee companies, by the AMC for and on behalf of the Schemes of the Fund, for the financial year 2020-2021 is provided below:
quarter total no. of resolutions
Break-up of vote decision
for against abstained
June 2020 50 43 6 1
September 2020 752 656 38 58
December 2020 41 31 1 9
March 2021 40 30 8 2
total 883 760 53 70
In terms of the requirement of SEBI Circular no. CIR/IMD/DF/05/2014 dated March 24, 2014 and SEBI/HO/IMD/DF2/CIR/P/2016/68 dated August 10, 2016; the AMC has obtained certificate from M/s. M. P. Chitale & Co., Chartered Accountants, who is acting as a Scrutinizer, on the voting report for the FY 2020-21. The certificate dated April 14, 2021 issued by M/s. M. P. Chitale & Co., is available on the website of the AMC as part of the full Annual Report.
Unit holders can refer to the full Annual Report for complete details of actual exercise of votes in the general meetings of the investee companies for the financial year 2020-21 or log on to our website at www.assetmanagement.hsbc.co.in.
10. StatutorY detailSa) The Sponsors are not responsible or liable for any loss resulting from the operation of the Schemes of
the Fund beyond initial contribution of Rs. 1 lakh for setting up the Fund.
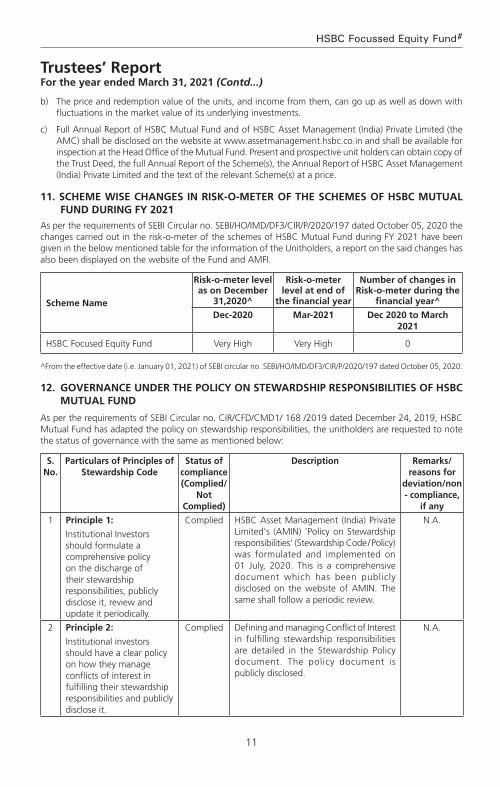
11
HSBC Focussed Equity Fund#
Trustees’ ReportFor the year ended March 31, 2021 (Contd...)
b) The price and redemption value of the units, and income from them, can go up as well as down with fluctuations in the market value of its underlying investments.
c) Full Annual Report of HSBC Mutual Fund and of HSBC Asset Management (India) Private Limited (the AMC) shall be disclosed on the website at www.assetmanagement.hsbc.co.in and shall be available for inspection at the Head Office of the Mutual Fund. Present and prospective unit holders can obtain copy of the Trust Deed, the full Annual Report of the Scheme(s), the Annual Report of HSBC Asset Management (India) Private Limited and the text of the relevant Scheme(s) at a price.
11. Scheme WiSe changeS in riSk-o-meter of the SchemeS of hSBc mutual fund during fY 2021
As per the requirements of SEBI Circular no. SEBI/HO/IMD/DF3/CIR/P/2020/197 dated October 05, 2020 the changes carried out in the risk-o-meter of the schemes of HSBC Mutual Fund during FY 2021 have been given in the below mentioned table for the information of the Unitholders, a report on the said changes has also been displayed on the website of the Fund and AMFI.
Scheme name
risk-o-meter level as on december
31,2020^
risk-o-meter level at end of
the financial year
number of changes in risk-o-meter during the
financial year^
dec-2020 mar-2021 dec 2020 to march 2021
HSBC Focused Equity Fund Very High Very High 0
^From the effective date (i.e. January 01, 2021) of SEBI circular no. SEBI/HO/IMD/DF3/CIR/P/2020/197 dated October 05, 2020.
12. governance under the PolicY on SteWardShiP reSPonSiBilitieS of hSBc mutual fund
As per the requirements of SEBI Circular no. CIR/CFD/CMD1/ 168 /2019 dated December 24, 2019, HSBC Mutual Fund has adapted the policy on stewardship responsibilities, the unitholders are requested to note the status of governance with the same as mentioned below:
S. no.
Particulars of Principles of Stewardship code
Status of compliance (complied/
not complied)
description remarks/reasons for
deviation/non - compliance,
if any
1 Principle 1:
Institutional Investors should formulate a comprehensive policy on the discharge of their stewardship responsibilities, publicly disclose it, review and update it periodically.
Complied HSBC Asset Management (India) Private Limited's (AMIN) 'Policy on Stewardship responsibilities' (Stewardship Code / Policy) was formulated and implemented on 01 July, 2020. This is a comprehensive document which has been publicly disclosed on the website of AMIN. The same shall follow a periodic review.
N.A.
2 Principle 2:
Institutional investors should have a clear policy on how they manage conflicts of interest in fulfilling their stewardship responsibilities and publicly disclose it.
Complied Defining and managing Conflict of Interest in fulfilling stewardship responsibilities are detailed in the Stewardship Policy document. The policy document is publicly disclosed.
N.A.
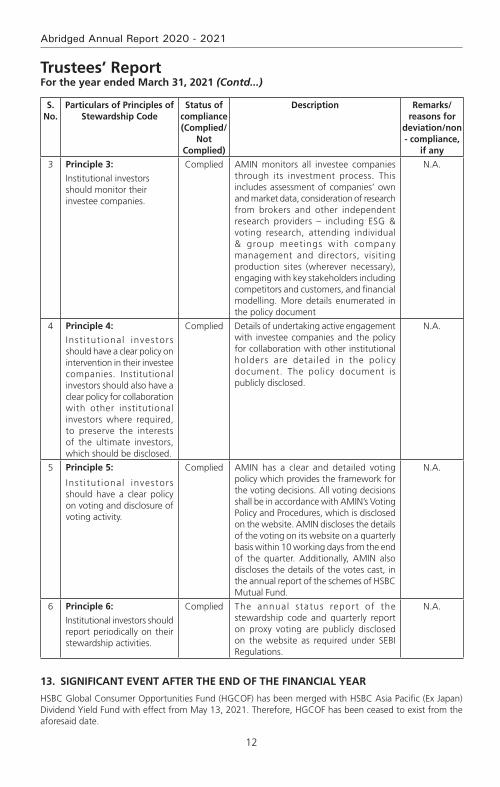
12
Abridged Annual Report 2020 - 2021
S. no.
Particulars of Principles of Stewardship code
Status of compliance (complied/
not complied)
description remarks/reasons for
deviation/non - compliance,
if any
3 Principle 3:
Institutional investors should monitor their investee companies.
Complied AMIN monitors all investee companies through its investment process. This includes assessment of companies’ own and market data, consideration of research from brokers and other independent research providers – including ESG & voting research, attending individual & group meetings with company management and directors, visiting production sites (wherever necessary), engaging with key stakeholders including competitors and customers, and financial modelling. More details enumerated in the policy document
N.A.
4 Principle 4:
Inst i tut ional investors should have a clear policy on intervention in their investee companies. Institutional investors should also have a clear policy for collaboration with other institutional investors where required, to preserve the interests of the ultimate investors, which should be disclosed.
Complied Details of undertaking active engagement with investee companies and the policy for collaboration with other institutional holders are detailed in the policy document. The policy document is publicly disclosed.
N.A.
5 Principle 5:
Inst i tut ional investors should have a clear policy on voting and disclosure of voting activity.
Complied AMIN has a clear and detailed voting policy which provides the framework for the voting decisions. All voting decisions shall be in accordance with AMIN’s Voting Policy and Procedures, which is disclosed on the website. AMIN discloses the details of the voting on its website on a quarterly basis within 10 working days from the end of the quarter. Additionally, AMIN also discloses the details of the votes cast, in the annual report of the schemes of HSBC Mutual Fund.
N.A.
6 Principle 6:
Institutional investors should report periodically on their stewardship activities.
Complied The annual status report of the stewardship code and quarterly report on proxy voting are publicly disclosed on the website as required under SEBI Regulations.
N.A.
13. Significant event after the end of the financial Year
HSBC Global Consumer Opportunities Fund (HGCOF) has been merged with HSBC Asia Pacific (Ex Japan) Dividend Yield Fund with effect from May 13, 2021. Therefore, HGCOF has been ceased to exist from the aforesaid date.
Trustees’ ReportFor the year ended March 31, 2021 (Contd...)

13
HSBC Focussed Equity Fund#
14. acknoWledgementS
The Trustees wish to thank the Unit holders of the Schemes for their support throughout the year and also thank the Government of India, the Securities and Exchange Board of India (SEBI), the Reserve Bank of India (RBI) and the Association of Mutual Funds in India (AMFI) for the guidance provided by them. The Trustees also appreciate the services provided by the Registrar and Transfer Agent, Fund Accountant, Custodian, Bankers, Distributors and Brokers. The guidance and services provided by the Auditors and advocates and the ebullience, sincerity and dedication of the employees of HSBC Asset Management (India) Private Limited is also appreciated.
The Trustees look forward to the continued support of everyone.
For and on behalf of the Board of Trustees of HSBC Mutual Fund
Sd/-
Trustee
Mumbai
July 20, 2021.
# Scheme launched during the current financial year
Trustees’ ReportFor the year ended March 31, 2021 (Contd...)

14
Abridged Annual Report 2020 - 2021
To the Trustees of HSBC Mutual Fund
hSBc focused equity fund
report on the audit of the financial Statements
opinionWe have audited the financial statements of hSBc focused equity fund (the ‘Scheme’) of HSBC Mutual Fund, which comprise the balance sheet as at 31 March 2021 and the revenue account for the period ended, and notes to the financial statements, including a summary of the significant accounting policies.
In our opinion and to the best of our information and according to the explanations given to us, the aforesaid financial statements give a true and fair view in conformity with the accounting principles generally accepted in India, of the state of affairs of the Scheme as at 31 March 2021, its net surplus for the period ended on that date.
Basis for opinionWe conducted our audit in accordance with the Standards on Auditing (‘SAs’) issued by the Institute of Chartered Accountants of India (the ‘ICAI’). Our responsibilities under those SAs are further described in the Auditor’s Responsibilities for the Audit of the Financial Statements section of our report. We are independent of the Scheme in accordance with the Code of Ethics issued by the ICAI, and we have fulfilled our other ethical responsibilities in accordance with the Code of Ethics. We believe that the audit evidence we have obtained is sufficient and appropriate to provide a basis for our opinion.
responsibilities of management and those charged with governance for the financial StatementsThe Scheme’s management, the Board of Directors of HSBC Mutual Fund (the ‘Trustees’) and the Board of Directors of HSBC Asset Management (India) Private Limited (the ‘AMC’) (collectively referred to as ‘Management’) are responsible for the preparation of these financial statements that give a true and fair view of the state of affairs, results of operations of the Scheme in accordance with the accounting policies and standards specified in the Ninth Schedule of the Securities and Exchange Board of India (Mutual Funds) Regulations, 1996, as amended (the ‘Regulations’) and the accounting principles generally accepted in India. This responsibility includes design, implementation and maintenance of internal control relevant to the preparation and presentation of the financial statements that give a true and fair view and are free from material misstatement, whether due to fraud or error.
In preparing the financial statements, management is responsible for assessing the Scheme’s ability to continue as a going concern, disclosing, as applicable, matters related to going concern and using the going concern basis of accounting unless management either intends to liquidate the Scheme or to cease operations, or has no realistic alternative but to do so.
The management is responsible for overseeing the Scheme’s financial reporting process.
auditor’s responsibilities for the audit of the financial StatementsOur objectives are to obtain reasonable assurance about whether the financial statements as a whole are free from material misstatement, whether due to fraud or error, and to issue an auditor’s report that includes our opinion. Reasonable assurance is a high level of assurance, but is not a guarantee that an audit conducted in accordance with SAs will always detect a material misstatement when it exists. Misstatements can arise from fraud or error and are considered material if, individually or in the aggregate, they could reasonably be expected to influence the economic decisions of users taken on the basis of these financial statements.
As part of an audit in accordance with SAs, we exercise professional judgment and maintain professional skepticism throughout the audit. We also:
• Identifyandassesstherisksofmaterialmisstatementofthefinancialstatements,whetherduetofraudor error, design and perform audit procedures responsive to those risks, and obtain audit evidence that is sufficient and appropriate to provide a basis for our opinion. The risk of not detecting a material misstatement resulting from fraud is higher than for one resulting from error, as fraud may involve
Independent Auditors’ Report

15
HSBC Focussed Equity Fund#
Independent Auditors’ Report (Contd...)
collusion, forgery, intentional omissions, misrepresentations, or the override of internal control;
• Obtainanunderstandingofinternalcontrolrelevanttotheauditinordertodesignauditproceduresthat are appropriate in the circumstances, but not for the purpose of expressing an opinion on the effectiveness of the Scheme’s internal controls;
• Evaluatetheappropriatenessofaccountingpoliciesusedandthereasonablenessofaccountingestimatesand related disclosures made by Management;
• ConcludeontheappropriatenessofManagement’suseofthegoingconcernbasisofaccountingand,based on the audit evidence obtained, whether a material uncertainty exists related to events or conditions that may cast significant doubt on the Scheme’s ability to continue as a going concern. If we conclude that a material uncertainty exists, we are required to draw attention in our auditor’s report to the related disclosures in the financial statements or, if such disclosures are inadequate, to modify our opinion. Our conclusions are based on the audit evidence obtained up to the date of our auditor’s report. However, future events or conditions may cause the Scheme to cease to continue as a going concern;
• Evaluate the overall presentation, structure and content of the financial statements, including thedisclosures and whether the financial statements represent the underlying transactions and events in a manner that achieves fair presentation.
We communicate with those charged with governance regarding, among other matters, the planned scope and timing of the audit and significant audit findings, including any significant deficiencies in internal control that we identify during our audit.
We also provide those charged with governance with a statement that we have complied with relevant ethical requirements regarding independence, and to communicate with them all relationships and other matters that may reasonably be thought to bear on our independence, and where applicable, related safeguards.
report on other legal and regulatory requirements 1 As required by Regulation 55 (4) of the Regulations, we report that:
(a) We have obtained all information and explanations which, to the best of our knowledge and belief, were necessary for the purposes of the audit; and
(b) The balance sheet and the revenue account have been prepared in accordance with the accounting policies and standards as specified in the Ninth Schedule of the Regulations.
2 As required by Clause 5 (ii) (2) of the Eleventh Schedule of the Regulations, we report that the balance sheet and the revenue account are in agreement with the books of account of the Scheme.
For B S R & Co. LLP Chartered Accountants Firm’s Registration No: 101248W/W-100022
Sd/-
Ajit Viswanath PartnerMembership No: 067114UDIN : 21067114AAAADR4219
Place : Mumbai Date : July 20, 2021.
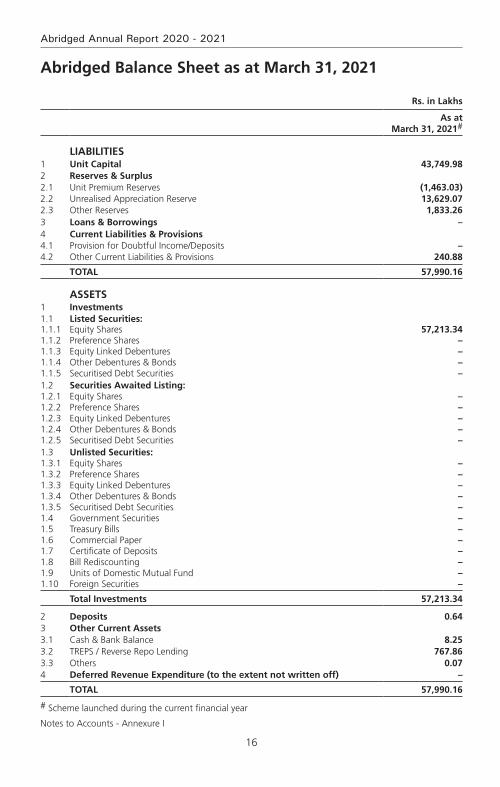
16
Abridged Annual Report 2020 - 2021
Rs. in Lakhs
As at March 31, 2021#
LIABILITIES1 Unit Capital 43,749.982 Reserves & Surplus2.1 Unit Premium Reserves (1,463.03)2.2 Unrealised Appreciation Reserve 13,629.072.3 Other Reserves 1,833.263 Loans & Borrowings –4 Current Liabilities & Provisions4.1 Provision for Doubtful Income/Deposits –4.2 Other Current Liabilities & Provisions 240.88
TOTAL 57,990.16
ASSETS1 Investments1.1 Listed Securities:1.1.1 Equity Shares 57,213.341.1.2 Preference Shares –1.1.3 Equity Linked Debentures –1.1.4 Other Debentures & Bonds –1.1.5 Securitised Debt Securities –1.2 Securities Awaited Listing:1.2.1 Equity Shares –1.2.2 Preference Shares –1.2.3 Equity Linked Debentures –1.2.4 Other Debentures & Bonds –1.2.5 Securitised Debt Securities –1.3 Unlisted Securities:1.3.1 Equity Shares –1.3.2 Preference Shares –1.3.3 Equity Linked Debentures –1.3.4 Other Debentures & Bonds –1.3.5 Securitised Debt Securities –1.4 Government Securities –1.5 Treasury Bills –1.6 Commercial Paper –1.7 Certificate of Deposits –1.8 Bill Rediscounting –1.9 Units of Domestic Mutual Fund –1.10 Foreign Securities –
Total Investments 57,213.34
2 Deposits 0.643 Other Current Assets3.1 Cash & Bank Balance 8.253.2 TREPS / Reverse Repo Lending 767.863.3 Others 0.074 Deferred Revenue Expenditure (to the extent not written off) –
TOTAL 57,990.16
# Scheme launched during the current financial year
Notes to Accounts - Annexure I
Abridged Balance Sheet as at March 31, 2021
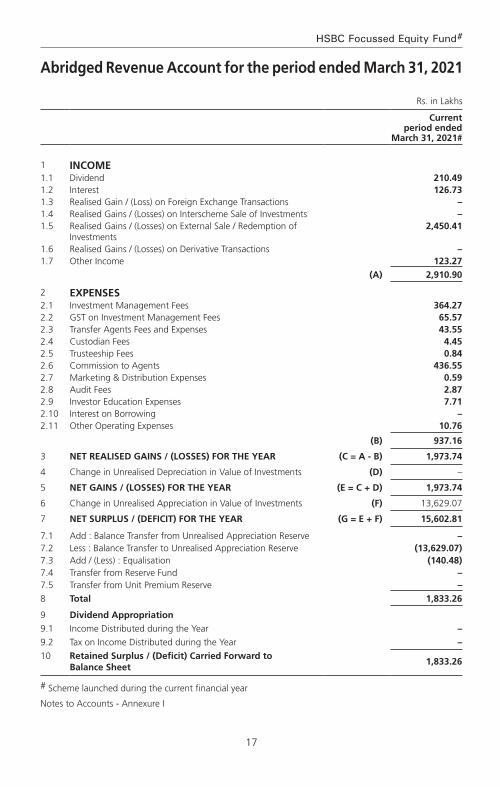
17
HSBC Focussed Equity Fund#
Abridged Revenue Account for the period ended March 31, 2021
Rs. in Lakhs
Current period ended
March 31, 2021#
1 INCOME1.1 Dividend 210.491.2 Interest 126.731.3 Realised Gain / (Loss) on Foreign Exchange Transactions –1.4 Realised Gains / (Losses) on Interscheme Sale of Investments –1.5 Realised Gains / (Losses) on External Sale / Redemption of
Investments2,450.41
1.6 Realised Gains / (Losses) on Derivative Transactions –1.7 Other Income 123.27
(A) 2,910.90
2 EXPENSES2.1 Investment Management Fees 364.272.2 GST on Investment Management Fees 65.572.3 Transfer Agents Fees and Expenses 43.552.4 Custodian Fees 4.452.5 Trusteeship Fees 0.842.6 Commission to Agents 436.552.7 Marketing & Distribution Expenses 0.592.8 Audit Fees 2.872.9 Investor Education Expenses 7.712.10 Interest on Borrowing –2.11 Other Operating Expenses 10.76
(B) 937.16
3 NET REALISED GAINS / (LOSSES) FOR THE YEAR (C = A - B) 1,973.74
4 Change in Unrealised Depreciation in Value of Investments (D) –
5 NET GAINS / (LOSSES) FOR THE YEAR (E = C + D) 1,973.74
6 Change in Unrealised Appreciation in Value of Investments (F) 13,629.07
7 NET SURPLUS / (DEFICIT) FOR THE YEAR (G = E + F) 15,602.81
7.1 Add : Balance Transfer from Unrealised Appreciation Reserve –7.2 Less : Balance Transfer to Unrealised Appreciation Reserve (13,629.07)7.3 Add / (Less) : Equalisation (140.48)7.4 Transfer from Reserve Fund –7.5 Transfer from Unit Premium Reserve –8 Total 1,833.26
9 Dividend Appropriation9.1 Income Distributed during the Year –9.2 Tax on Income Distributed during the Year –10 Retained Surplus / (Deficit) Carried Forward to
Balance Sheet1,833.26
# Scheme launched during the current financial year
Notes to Accounts - Annexure I

18
Abridged Annual Report 2020 - 2021
Key Statistics for the period ended March 31, 2021
Current period ended
March 31, 2021#
1. NAV per unit (Rs.):
Open
Growth Option –
IDCW Option –
Direct Plan - Growth Option –
Direct Plan - IDCW Option –
High
Growth Option 13.8024
IDCW Option 13.8024
Direct Plan - Growth Option 13.9322
Direct Plan - IDCW Option 13.9322
Low
Growth Option 9.6654
IDCW Option 9.6654
Direct Plan - Growth Option 9.6927
Direct Plan - IDCW Option 9.6927
End
Growth Option 13.1961
IDCW Option 13.1961
Direct Plan - Growth Option 13.3476
Direct Plan - IDCW Option 13.3476
2. Closing Assets Under Management (Rs. in Lakhs)
End 57,736
Average (AAuM)1 55,613
3. Gross income as % of AAuM2 (Annualised) 7.55%
4. Expense Ratio: a. Total Expense as % of AAuM
(including GST tax on Management fees) (planwise) (Annualised) Regular Plan (Continue) 2.47%
Direct Plan 0.82%
b. Management Fee as % of AAuM (planwise) (Annualised) Regular Plan (Continue) 0.95%
Direct Plan 0.54%
5. Net Income as a percentage of AAuM3 (Annualised) 5.12%
6. Portfolio turnover ratio4 0.30
7. Total Dividend per unit distributed during the year (planwise)
Retail
IDCW Option –
Direct Plan - IDCW Option –
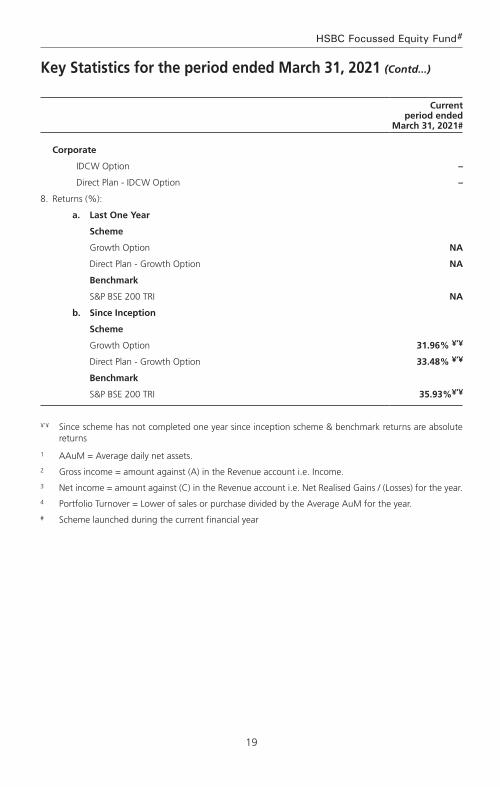
19
HSBC Focussed Equity Fund#
Current period ended
March 31, 2021#
Corporate
IDCW Option –
Direct Plan - IDCW Option –
8. Returns (%):
a. Last One Year
Scheme
Growth Option NA
Direct Plan - Growth Option NA
Benchmark
S&P BSE 200 TRI NA
b. Since Inception
Scheme
Growth Option 31.96% ¥’¥
Direct Plan - Growth Option 33.48% ¥’¥
Benchmark
S&P BSE 200 TRI 35.93%¥’¥
¥’¥ Since scheme has not completed one year since inception scheme & benchmark returns are absolute returns
1 AAuM = Average daily net assets.2 Gross income = amount against (A) in the Revenue account i.e. Income.3 Net income = amount against (C) in the Revenue account i.e. Net Realised Gains / (Losses) for the year.4 Portfolio Turnover = Lower of sales or purchase divided by the Average AuM for the year.# Scheme launched during the current financial year
Key Statistics for the period ended March 31, 2021 (Contd...)
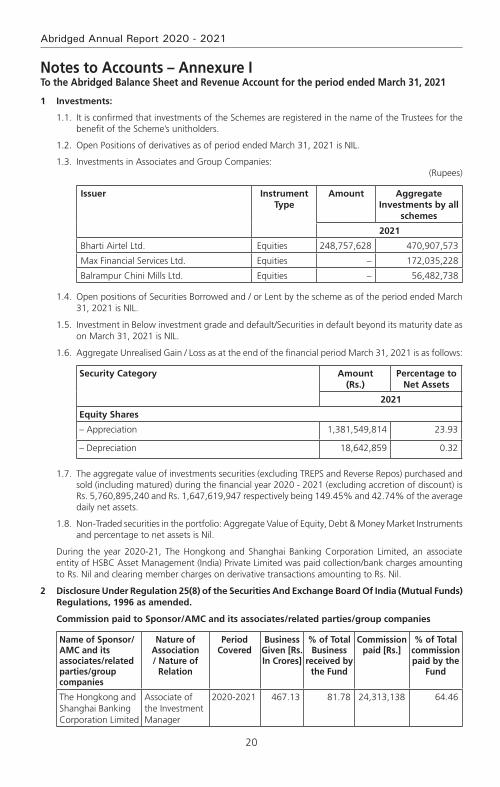
20
Abridged Annual Report 2020 - 2021
Notes to Accounts – Annexure ITo the Abridged Balance Sheet and Revenue Account for the period ended March 31, 2021
1 Investments:
1.1. It is confirmed that investments of the Schemes are registered in the name of the Trustees for the benefit of the Scheme’s unitholders.
1.2. Open Positions of derivatives as of period ended March 31, 2021 is NIL.
1.3. Investments in Associates and Group Companies: (Rupees)
Issuer Instrument Type
Amount Aggregate Investments by all
schemes
2021
Bharti Airtel Ltd. Equities 248,757,628 470,907,573
Max Financial Services Ltd. Equities – 172,035,228
Balrampur Chini Mills Ltd. Equities – 56,482,738
1.4. Open positions of Securities Borrowed and / or Lent by the scheme as of the period ended March 31, 2021 is NIL.
1.5. Investment in Below investment grade and default/Securities in default beyond its maturity date as on March 31, 2021 is NIL.
1.6. Aggregate Unrealised Gain / Loss as at the end of the financial period March 31, 2021 is as follows:
Security Category Amount (Rs.)
Percentage to Net Assets
2021
Equity Shares
– Appreciation 1,381,549,814 23.93
– Depreciation 18,642,859 0.32
1.7. The aggregate value of investments securities (excluding TREPS and Reverse Repos) purchased and sold (including matured) during the financial year 2020 - 2021 (excluding accretion of discount) is Rs. 5,760,895,240 and Rs. 1,647,619,947 respectively being 149.45% and 42.74% of the average daily net assets.
1.8. Non-Traded securities in the portfolio: Aggregate Value of Equity, Debt & Money Market Instruments and percentage to net assets is Nil.
During the year 2020-21, The Hongkong and Shanghai Banking Corporation Limited, an associate entity of HSBC Asset Management (India) Private Limited was paid collection/bank charges amounting to Rs. Nil and clearing member charges on derivative transactions amounting to Rs. Nil.
2 Disclosure Under Regulation 25(8) of the Securities And Exchange Board Of India (Mutual Funds) Regulations, 1996 as amended.
Commission paid to Sponsor/AMC and its associates/related parties/group companies
Name of Sponsor/AMC and its associates/related parties/group companies
Nature of Association / Nature of
Relation
Period Covered
Business Given [Rs. In Crores]
% of Total Business
received by the Fund
Commission paid [Rs.]
% of Total commission paid by the
Fund
The Hongkong and Shanghai Banking Corporation Limited
Associate of the Investment Manager
2020-2021 467.13 81.78 24,313,138 64.46

21
HSBC Focussed Equity Fund#
Brokerage paid to Sponsor/AMC and its associates/related parties/group companies is Nil.
The brokerage paid was at rates similar to those offered to other brokers / distributors. And the Commission/Brokerage paid to related party includes both upfront and trail and hence not comparable with the % of business brought and % of commission paid.
Further, The Hongkong and Shanghai Banking Corporation Limited, an associate of the Sponsor, is on the panel of bankers with whom HSBC Mutual Fund places money on fixed deposits and enters into reverse repo transactions from time to time at competitive rates.
(i) Any underwriting obligations undertaken by the schemes of the mutual funds with respect to issue of securities associate companies - Nil.
(ii) Devolvement - Nil.
(iii) Subscription by the schemes in the issues lead managed by associate companies - Nil.
(iv) Subscription to any issue of equity or debt on private placement basis where the sponsor or its associate companies have acted as arranger or manager - Nil.
3 None of the Investors held more than 25% of the total net assets of the scheme at the period ended March 31, 2021.
4 Unit Capital movement during the period ended March 31, 2021**:
Description 2020-2021
Opening Units
Subscription Redemption Closing Units Face Value per unit (Rupees)
Growth Option – 537,999,931.724 118,432,500.939 419,567,430.785 10
IDCW Option – 7,917,097.663 764,850.543 7,152,247.120 10
Direct Plan - Growth Option
– 11,961,390.753 1,250,705.545 10,710,685.208 10
Direct Plan - IDCW Option
– 71,559.432 2,117.561 69,441.871 10
**Units held by the AMC (Seed Capital) in Direct Plan Growth Option as on March 31, 2021 is 499,975.001
5 As these are the first financial statements of the schemes since the date of launch, there are no prior period comparatives.
6 No contingent liabilities for the period ended March 31, 2021.
7 Expenses other than Management Fees are Inclusive of GST where applicable.
8 Other income of Rs. 12,327,435/- represents Exit load credited to the scheme & Penal Interest received from Bank towards delay of RTGS/NEFT.
9 Investor Education Awareness
In view of the AMFI Best Practices Guidelines Circular No. 56/2015-16, the IEF ( Investor Education Fund) accrual is set aside in a separate bank account and the consolidated balance across all schemes as on March 31, 2021. The break-up of which is as under:
Particulars March 31, 2021
Amount (in Rs. Lacs)
Opening Balance as on April 01, 2020 307.40
Add: Accrual during FY 2020-21 195.77
Less: Transferred to AMFI * 89.04
Less: Payable to AMFI (March 2021 accrual) * 8.84
Notes to Accounts – Annexure I (Contd...)To the Abridged Balance Sheet and Revenue Account for the period ended March 31, 2021
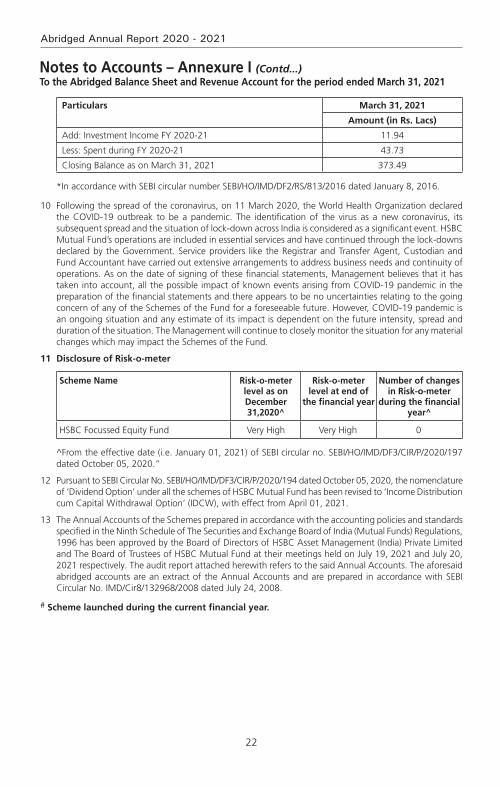
22
Abridged Annual Report 2020 - 2021
Particulars March 31, 2021
Amount (in Rs. Lacs)
Add: Investment Income FY 2020-21 11.94
Less: Spent during FY 2020-21 43.73
Closing Balance as on March 31, 2021 373.49
*In accordance with SEBI circular number SEBI/HO/IMD/DF2/RS/813/2016 dated January 8, 2016.
10 Following the spread of the coronavirus, on 11 March 2020, the World Health Organization declared the COVID-19 outbreak to be a pandemic. The identification of the virus as a new coronavirus, its subsequent spread and the situation of lock-down across India is considered as a significant event. HSBC Mutual Fund’s operations are included in essential services and have continued through the lock-downs declared by the Government. Service providers like the Registrar and Transfer Agent, Custodian and Fund Accountant have carried out extensive arrangements to address business needs and continuity of operations. As on the date of signing of these financial statements, Management believes that it has taken into account, all the possible impact of known events arising from COVID-19 pandemic in the preparation of the financial statements and there appears to be no uncertainties relating to the going concern of any of the Schemes of the Fund for a foreseeable future. However, COVID-19 pandemic is an ongoing situation and any estimate of its impact is dependent on the future intensity, spread and duration of the situation. The Management will continue to closely monitor the situation for any material changes which may impact the Schemes of the Fund.
11 Disclosure of Risk-o-meter
Scheme Name Risk-o-meter level as on December 31,2020^
Risk-o-meter level at end of
the financial year
Number of changes in Risk-o-meter
during the financial year^
HSBC Focussed Equity Fund Very High Very High 0
^From the effective date (i.e. January 01, 2021) of SEBI circular no. SEBI/HO/IMD/DF3/CIR/P/2020/197 dated October 05, 2020.”
12 Pursuant to SEBI Circular No. SEBI/HO/IMD/DF3/CIR/P/2020/194 dated October 05, 2020, the nomenclature of ‘Dividend Option’ under all the schemes of HSBC Mutual Fund has been revised to ‘Income Distribution cum Capital Withdrawal Option’ (IDCW), with effect from April 01, 2021.
13 The Annual Accounts of the Schemes prepared in accordance with the accounting policies and standards specified in the Ninth Schedule of The Securities and Exchange Board of India (Mutual Funds) Regulations, 1996 has been approved by the Board of Directors of HSBC Asset Management (India) Private Limited and The Board of Trustees of HSBC Mutual Fund at their meetings held on July 19, 2021 and July 20, 2021 respectively. The audit report attached herewith refers to the said Annual Accounts. The aforesaid abridged accounts are an extract of the Annual Accounts and are prepared in accordance with SEBI Circular No. IMD/Cir8/132968/2008 dated July 24, 2008.
# Scheme launched during the current financial year.
Notes to Accounts – Annexure I (Contd...)To the Abridged Balance Sheet and Revenue Account for the period ended March 31, 2021
23
HSBC Focussed Equity Fund#
Voting Policy and Procedures
In view of SEBI guidelines related to “Role of Mutual Funds in Corporate Governance of Public Listed Companies”, HSBC AMC has formulated its “Policy for Proxy Voting in Public Listed Companies”. The said policy is available on our website and the details of actual exercise of proxy votes, the summary of votes casted and the auditor’s certificate for the Financial Year 2020 – 21 is forming part of our full Annual Report for the Financial Year 2020 – 21 which is uploaded on our website at http://www.assetmanagement.hsbc.co.in

24
Abridged Annual Report 2020 - 2021
Statutory Details & Disclaimers
All the returns have been sourced from Mutual Funds India Explorer software. The performance of the schemes and the benchmark is calculated on a total return basis. This document has been prepared by HSBC Asset Management (India) Private Ltd (HSBC) for information purposes only and should not be construed as i) an offer or recommendation to buy or sell securities, commodities, currencies or other investments referred to herein; or ii) an offer to sell or a solicitation or an offer for purchase of any of the funds of HSBC Mutual Fund; or iii) an investment research or investment advice. All information contained in this document (including that sourced from third parties), is obtained from sources HSBC and the third party which HSBC believes to be reliable however, has not independently verified the same. The information and opinions contained within the document are based upon publicly available information and rates of taxation applicable (if any) at the time of publication, which are subject to change from time to time.
Expressions of opinion are those of HSBC only and are subject to change without notice. It does not have regard to specific investment objectives, financial situation and the particular needs of any specific person who may receive this document. Investors should seek personal and independent advice regarding the appropriateness of investing in any of the funds, securities, other investment or investment strategies that may have been discussed or referred herein and should understand that the views regarding future prospects may or may not be realized. In no event shall HSBC Mutual Fund / HSBC Asset management (India) Private Limited and / or its affiliates or any of their directors, trustees, officers and employees be liable for any direct, indirect, special, incidental or consequential damages arising out of the use of information / opinion herein. Neither this document nor the units of HSBC Mutual Fund have been registered in any jurisdiction. The distribution of this document in certain jurisdictions may be restricted or totally prohibited and accordingly, persons who come into possession of this document are required to inform themselves about, and to observe, any such restrictions.
mutual fund investments are subject to market risks, read all scheme related documents carefully.

HSBC Global Emerging Markets FundAn open ended fund of fund Scheme investing in HSBC Global Investment Funds - Global Emerging Markets Equity Fund
Abridged Annual Report 2020 - 2021

1
HSBC Global Emerging Markets Fund
Dear Investor,
The beginning of the last financial year now almost seems like a distant memory. COVID-19 was still a relatively unknown enemy and governments across the world were grappling with ways to control and mitigate the risks associated with it. Nationwide lockdowns were the norm and our markets both equity and fixed income reacted negatively leading to significant erosion of wealth. Within a short period of time markets bounced back. This confounded even the most astute market pundits. How is it possible that when GDP growth had slowed down, unemployment had risen, inflation was high could there be such sharp up move in equity indices. Whilst the reasons are well known about easy global liquidity, demand resurgence, cost cutting by corporates etc. perhaps its most important to remember that the markets are not a reflector but a predictor of economic activity.
At all times particularly during such volatile times it is important to go back to the basics. Why do you save, why do you invest, what goals would you like to achieve, how old are you, what is your risk appetite? The replies to these simple questions will help you determine your asset allocation. As an example when equity markets corrected sharply last year, investors who reviewed their asset allocation, stayed invested during the lows of the past year and were able to capture the rebound and have seen prime returns since then. The current market movement in all likelihood would have also led to some imbalances in your asset allocation. Do not ignore that and I strongly recommend that you do review this with your advisor to check whether re-balancing is required.
During this financial year we had three very successful new fund launches. The pandemic showed us a clear trend of dominant players becoming stronger and profit pool getting consolidated within a few companies. To capture this opportunity, we launched the HSBC Focused Equity Fund which garnered close to Rs. 520 crores. During the second half of 2020, in the fixed income space, 3 - 5 year duration range had a favourable investment scenario as RBI’s accommodative policy and surplus liquidity had reduced the returns at the very short end of the yield curve. There was a demand for an actively managed moderate duration strategy with better credit quality which we fulfilled by launching HSBC Corporate Bond Fund. It garnered over 700 crores. Our latest and first of its kind offering, HSBC Global Equity Climate Change Fund of Fund saw a stupendous response with over 8000 investors investing over Rs. 616 crores. This is an investment opportunity which goes beyond the rationale of simply generating investment returns and is the future of responsible investing.
We worked towards augmenting our digital capabilities by launching a few key enhancements to our online transaction platform. Being mindful of the movement restrictions in place, this year we focused on digitizing offline processes so that an investor need not need step out of her home for investing or availing any key services. While our interactive chatbot AskMe, eased service queries, our end-to-end digital KYC module enabled a first time Mutual Fund investor to invest in our funds without any paperwork. We listened to your feedback and digitized consolidation of folios and change of tax status which eliminated the need for you to physically visit our branches.
I am a strong believer in the India story and this story has just begun. The opportunity to invest in this high growth market is a very exciting opportunity. I do hope you share my enthusiasm and I ask that you continue to invest whilst reviewing your asset allocation at all times. As always thank you for your business. Stay safe.
Warm regards,
Ravi MenonChief Executive Officer,
HSBC Asset Management India

2
Abridged Annual Report 2020 - 2021
SPONSOR
HSBC Securities and Capital Markets (India) Private LimitedRegd. Office: 52/60, Mahatma Gandhi Road, Fort, Mumbai - 400 001.
TRUSTEE
Board of TrusteesOffice: 16, Veer Nariman Road, Fort, Mumbai 400 001.
ASSET MANAGEMENT COMPANY
HSBC Asset Management (India) Private LimitedCorp. & Regd. Office: 16, Veer Nariman Road, Fort, Mumbai 400 001.
CUSTODIAN
Standard Chartered Bank (SCB)Corp. & Regd. Office: Crescenzo, Securities Services, 3rd Floor, C-38/39, G-Block,Bandra Kurla Complex, Bandra East, Mumbai – 400051.
AUDITORS TO THE SCHEME
BSR & Co. LLPChartered Accountants
5th Floor, Lodha Excelus, Apollo Mills Compound, N. M. Joshi Marg, Mahalaxmi, Mumbai 400 011.
REGISTRAR & TRANSFER AGENTS
Computer Age Management Services Limited (CAMS)Unit: HSBC Mutual Fund ’C’ Block, 2nd Floor, Hanudev Info Park P. Ltd., SF No. 558/2, Udayampalayam Road, Nava India, Coimbatore - 641 028.
BOARD OF TRUSTEES
Ms. Jasmine Batliwalla - Chairperson
Mr. Nani Javeri - Trustee
Dr. T. C. Nair - Trustee
Mr. Pedro Bastos - Trustee
BOARD OF DIRECTORS
Mr. Dinesh Mittal - Director
Dr. Indu Shahani - Director
Mr. Ravi Menon - Director & Chief Executive Officer
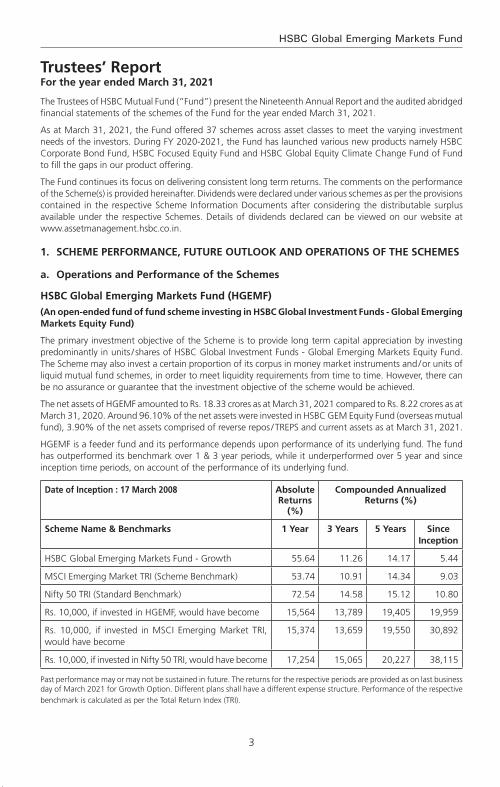
3
HSBC Global Emerging Markets Fund
The Trustees of HSBC Mutual Fund (“Fund”) present the Nineteenth Annual Report and the audited abridged financial statements of the schemes of the Fund for the year ended March 31, 2021.
As at March 31, 2021, the Fund offered 37 schemes across asset classes to meet the varying investment needs of the investors. During FY 2020-2021, the Fund has launched various new products namely HSBC Corporate Bond Fund, HSBC Focused Equity Fund and HSBC Global Equity Climate Change Fund of Fund to fill the gaps in our product offering.
The Fund continues its focus on delivering consistent long term returns. The comments on the performance of the Scheme(s) is provided hereinafter. Dividends were declared under various schemes as per the provisions contained in the respective Scheme Information Documents after considering the distributable surplus available under the respective Schemes. Details of dividends declared can be viewed on our website at www.assetmanagement.hsbc.co.in.
1. Scheme Performance, future outlook and oPerationS of the SchemeS
a. operations and Performance of the Schemes
hSBc Global emerging markets fund (hGemf)
(an open-ended fund of fund scheme investing in hSBc Global investment funds - Global emerging markets equity fund)
The primary investment objective of the Scheme is to provide long term capital appreciation by investing predominantly in units / shares of HSBC Global Investment Funds - Global Emerging Markets Equity Fund. The Scheme may also invest a certain proportion of its corpus in money market instruments and / or units of liquid mutual fund schemes, in order to meet liquidity requirements from time to time. However, there can be no assurance or guarantee that the investment objective of the scheme would be achieved.
The net assets of HGEMF amounted to Rs. 18.33 crores as at March 31, 2021 compared to Rs. 8.22 crores as at March 31, 2020. Around 96.10% of the net assets were invested in HSBC GEM Equity Fund (overseas mutual fund), 3.90% of the net assets comprised of reverse repos / TREPS and current assets as at March 31, 2021.
HGEMF is a feeder fund and its performance depends upon performance of its underlying fund. The fund has outperformed its benchmark over 1 & 3 year periods, while it underperformed over 5 year and since inception time periods, on account of the performance of its underlying fund.
date of inception : 17 march 2008 absolute returns
(%)
compounded annualized returns (%)
Scheme name & Benchmarks 1 Year 3 Years 5 Years Since inception
HSBC Global Emerging Markets Fund - Growth 55.64 11.26 14.17 5.44
MSCI Emerging Market TRI (Scheme Benchmark) 53.74 10.91 14.34 9.03
Nifty 50 TRI (Standard Benchmark) 72.54 14.58 15.12 10.80
Rs. 10,000, if invested in HGEMF, would have become 15,564 13,789 19,405 19,959
Rs. 10,000, if invested in MSCI Emerging Market TRI, would have become
15,374 13,659 19,550 30,892
Rs. 10,000, if invested in Nifty 50 TRI, would have become 17,254 15,065 20,227 38,115
Past performance may or may not be sustained in future. The returns for the respective periods are provided as on last business day of March 2021 for Growth Option. Different plans shall have a different expense structure. Performance of the respective benchmark is calculated as per the Total Return Index (TRI).
Trustees’ ReportFor the year ended March 31, 2021

4
Abridged Annual Report 2020 - 2021
b. market overview & outlook (as furnished by hSBc asset management (india) Private limited)
equitY outlook
recap of fY 2020-21:
Fiscal 2020-21 was a rewarding year for equity investors with market indices recording stellar gains from the low base after the COVID correction. Market sentiments steadily improved during the course of the year to deliver positive returns in all four quarters of the year.
We witnessed various legs of market performance during the last fiscal, driven by multiple factors and variables. Initial rebound from the market lows was driven by attractive valuations, then it was on the back of faster than anticipated recovery post lockdown, reopening optimism, swifter than expected vaccine intervention and above all, the unprecedented liquidity. Lastly but importantly, a period of lower cost of capital coupled with low real rates, improved the attractiveness of equity as an asset class, driving the performance.
As a result, the year ended with optimism compared to despair when it began. Corporate India overcame the challenges posed by COVID through significant cost control measures while at the same time showed improvement in their financial position and cash flows.
Commodities also rallied from the lows of the COVID crisis with global crude oil prices surging by 179% during the year. INR appreciated by 3.3% (as India recorded strong net FPI inflows) during the year. MSCI India index outperformed most of key global indices during the past fiscal. MSCI India index (USD) gained 74.8% as compared to 51.8% for MSCI World, 50.5% for Dow Jones, 55.1% for MSCI Emerging Markets, 41.2% for MSCI China and 42% for MSCI Europe*.
At a record USD 37.3 bn of net FPI inflows during the fiscal, the tally was higher than the cumulative net inflows India received from the previous 6 years. DIIs on the other hand saw net outflows of USD 18.4 bn and this was the first fiscal year of net outflows from the segment in 5 years. The net outflows from the segment was driven by USD 16.7 bn of outflows from the MFs while domestic insurers saw a far lower outflow of USD 1.6 bn*.
indices returns (april 1, 2020 to march 31, 2021) 1 Year^
S&P BSE Sensex TR 69.8%
NSE CNX Nifty TR 72.5%
S&P BSE 100 TR 73.5%
S&P BSE 200 TR 76.3%
S&P BSE 500 TR 78.6%
S&P BSE Midcap TR 93.0%
S&P BSE 250 Small-cap TR 117.5%
^Source: Bloomberg (Above table values are for total return indices)
Way forward:
Beginning of the new fiscal, India had to contend with the risk of the second COVID wave, which was more ferocious than the first wave on the human impact. However, as we write this, the second wave has already peaked and there have been a significant fall in number of active cases, case-positivity rate, daily new caseload and deaths. Vaccination drive also has seen acceleration with and is now closer to 6 mn doses per day mark. Also, the impact of the lockdown on economic activity has been significantly lower during the second wave, compared to last year. In most of the states, the unlocking process has already begun in a phased manner and this is leading to improvement in various activity indicators. Mobility indicators are recovering faster while economic indicators (freight, credit off-take, E-way bill generation, power demand etc.) are also witnessing a gradual recovery. The recently concluded earnings season has turned out to be in-line with expectations and despite the concerns of around the second wave, the earnings (Nifty) have seen upgrades for FY22. Market is looking beyond the current quarter (i.e. 1QFY22), which would witness
Trustees’ ReportFor the year ended March 31, 2021 (Contd...)
5
HSBC Global Emerging Markets Fund
an impact due to the second wave. Our baseline assumption is that of a temporary impact from the second wave and the set-back to the recovery process limited to a few months, after which we should see the economic rebound. So far, this is tracking in-line with assumptions.
From a macro perspective, the current estimates for GDP growth in FY22 stand at 9.2%* (after seeing downgrades to factor in the impact of second wave). The downgrade in estimates are pertaining to the first quarter and hence the trajectory of growth from hereon should pick up. The tax collections data for the first two months of FY22 has remained strong, implying that the drawdown of the second wave on the fiscal position is not alarming. Additionally, the impact of fiscal stimulus package announced in FY22 so far is manageable (about 60 bps of GDP) and hence would not lead to any fiscal strain.
After the spectacular rally, market valuations at an overall level are now trending above historical averages on traditional valuation metrics (P/E, P/B). This is true for all market capitalization categories (viz large, mid and small). Typically, the broader market (i.e. mid and small cap segments), trade at a discount to large caps, however this scenario has now reversed after the outperformance from the broader market segments. However, the earnings momentum continues to remain strong (witnessing upgrades so far) and except for a short period due to second wave, the earnings momentum should hold up.
We believe that the risk-reward is balanced for the equity markets in the near term. Higher or sticky inflation expectations globally, higher than historical market valuations on some parameters (i.e. P/E, P/B) and adverse demand impact from the second wave are risk factors to contend with in the near term. However, these are counter balanced by positive commentary from companies, significant decline in COVID cases and acceleration in the vaccination programme. As a result, in the near term markets may see a consolidation phase and could take cues from the upcoming earnings season with more focus on the corporate commentary and the outlook. From a medium to long term perspective, the outlook for equity markets remains positive. The expectation of cyclical revival in the economy brings in a multi-year earnings visibility. This along with a benign cost of capital environment, should support equity performance. However, equity returns are likely to moderate on the back of the relatively high valuations and the strong recovery we have already witnessed from the COVID lows. Equity performance is likely to mirror the earnings growth trends over the medium to long term.
Pace of vaccination, concerns about a third wave, corporate earnings trajectory, inflation trends (both global & domestic), monsoon trends and commodity prices (especially crude oil) are some of the key factors which could influence market performance in the short term.
From a portfolio perspective, we are maintaining a pro-cyclical bias. We expect earnings growth to rebound sharply post the current COVID phase. Earnings growth are expected to sustain in high-teens beyond FY22 on the back of economy witnessing a cyclical recovery due to revival in capex cycle over the next 2-3 years (first by the government followed by private capex). From a sectoral perspective our order of preference is rate sensitives followed by domestic cyclicals, exporters and domestic consumption. Predominantly regulated businesses come last in our pecking order. This preference is dictated by our assessment of sectors / segments leading contribution to the market earnings growth over the next 2-3 years. Our portfolio construction is driven by a bottom up approach to stock selection with a focus on names that can deliver positive earnings surprises. We continue to focus on this theme to identify likely outperformers.
*Source: Bloomberg
deBt outlook
market drivers during the course of the year fY21
The Fixed Income markets started the year with a bout of nervousness that was triggered by the pandemic. While RBI had calmed the markets with its large rate cut action of 75bp cut followed by liquidity supportive measures, the volatility continued until mid-May when government announced its relief package. While it was not fiscally expansive, it touched the right cords in terms of credit flow to desired sectors. This was followed up with RBI’s credit relief measures in terms of moratorium and restructuring of assets that were stressed due to the pandemic. Throughout the course of the year, RBI maintained its accommodative stance along with significant amount of surplus liquidity that was supportive and helped in maintaining stability in the market. However, as the year progressed and pressure on fiscal began to mount yields started seeing a spike towards
Trustees’ ReportFor the year ended March 31, 2021 (Contd...)

6
Abridged Annual Report 2020 - 2021
the last quarter of the fiscal. While borrowing was stepped up to INR 12 trillion from previously budgeted INR 7.8 trillion in May 2020, it was further enhanced by and additional INR 1.1 trillion in October 2020. Overall GOI ended up borrowing a record amount of INR 13.9 trillion. The budget proved to be a shocker with GOI using the pandemic as an opportunity for setting the finances in order. GOI showed a record deficit of 9.5% for FY21 and projected a 6.8% for FY22 with estimated central government gross borrowing of INR 12 trillion. This seemed to reverse the support RBI had provided throughout the year with benchmark 10-year bond peaking to 6.23% in mid –Feb 2021. RBI’s statements to remain supportive were left in the sidelines. Overall it seemed that the 115bp of rate cut, along with significant liquidity infusion (OMO + Twist operations of ~INR 3 trillion, infusion via dollar purchases) seemed only a little to help in applying a brake to the one-way spike in yields. The year closed ~6.16% with absence of concrete action by RBI.
rBi Policy: Through the course of the year, RBI has maintained an accommodative stance, with an aggregate 115bp of rate cut done in March and May 2020 taking the repo rate from 5.15% to 4%. Subsequently while inflation pressures prevented RBI from taking any direct actions, RBI has used a combination of creative tools to keep the rates contained primarily via liquidity supportive tools such as OMOs, Twist Operations, Repo linked Term loans to needy sectors (LTROs, TLTROs), CRR cuts. While inflation was a worry for most part of the year, RBI kept it aside admitting that growth was a priority and inflation effects are more supply side rather than demand side. Prospectively into FY22, with the onset of the second wave, RBI continues to maintain the stance to prioritize growth.
inflation: Inflation for most part of the year stayed above 6% primarily driven by supply side pressures and some intermittent spike from food inflation as well. While it has been coming off since December with cooling off of food inflation and positive base effects, it has been between 4- 5.5%. Structurally however inflation risks continue to remain as oil prices have increased and base effects will not remain supportive for long. Core inflation continues to remain sticky.
liquidity: During the year, system liquidity has remained at significant surplus facilitated largely by RBI action such as OMOs, foreign exchange operations and government spending.
Budget: The FY2022 union budget focuses on growth and has accordingly, presented a 9.5% fiscal deficit for FY21 and 6.8% for FY22. On the revenue side, the assumptions are largely realistic, with FY22 (E) Nominal GDP growth at 14.4% and tax revenue growth at 17% considering the pandemic impact in FY 21. Compared to FY20, tax revenue growth is ~10%. While non-tax revenues are ambitious pegging the divestment at INR 1.75 trillion, with robust pipeline of assets including monetization of road and transmission assets, execution remains the key as in the past. On the expenditure side, better quality capex spending with focusing on rail, road, defense, urban infra is positive for long term structural growth. The revenue side expenditure adjusting for clearance of past subsidy arrears will be similar to budgetary estimates. Government using this opportunity to bring back off-balance sheet spending to on-balance sheet was a welcome move towards transparency and showing realistic projections. Alongside, states have also been given leeway to borrow upto 4% of their GDP with an additional 0.5% subject to conditions. Given that states are an important vehicle for capex investment, this move is welcome although it may entail additional state borrowing. The fiscal glide path is shifted to FY26 at below 4.5% for center and 3% for states suggesting that spending will continue and borrowing will come down gradually. In summary, from survival to revival, FY22 budget aims for structural growth leaving fiscal concerns sideways in the interim. Government’s intent seems clear on bringing back growth on the table, in a transparent manner.
While the second wave of the pandemic has once again derailed the revenue story, government will still have some cushion from its conservative estimates.
currency and fii flows: INR has been on an appreciation trajectory for most part of the year, aided by dollar underperformance supported by positive FII and FDI flows along with reduced imports on the domestic front as well. RBI has used most of the flows to accumulate reserves which has prevented any strong appreciation. Pandemic shock and global risk off led rupee over 75 in the beginning of the year only to close below 72 at the end of the fiscal year. While the second wave led to another spike in INR in April, it has since then cooled once again driven by dollar underperformance and pandemic recovery on the domestic front. Net FII flows was ~$30 bn with positive equity flows of~$37 bn while debt was negative ~$7bn and overall RBI’s forex reserves rose by a ~$100 bn to close ~$537 bn.
credit growth: Credit growth for the entire year has been tepid as previous year’s credit events were followed by nervousness relating to the pandemic. Despite RBI opening up several windows to finance the
Trustees’ ReportFor the year ended March 31, 2021 (Contd...)
7
HSBC Global Emerging Markets Fund
non-AAA segment, there was very little fresh credit flowing that segment. Overall banking credit grew by only 6.5%. Risk appetite has however been improving from a complete risk aversion to opening up towards a calculated risk. Prospectively it is expected that once the pandemic risk abates, credit growth will resume primarily driven by government capex spending and demand recovery.
market outlook
The pandemic once again brought the country to a situation similar to last year and debt markets perhaps interpreted the same as a structural rise in rates. In the initial day’s post budget in Feb of 2021, market was expecting a concrete set of actions such as an OMO calendar from RBI, and RBI’s words alone failed to calm the market. The first auction of the fiscal year also saw a devolvement. However, RBI acted in the first policy of the year announcing a bond buyback program akin to QE (quantitative easing) and its subsequent cancellation of auctions wherein yields were perhaps quoted higher than RBI’s comfort levels brought back confidence into the market. Since then we have seen a strong rally with 10-year benchmark trending below 6% and the curve moving alongside. RBI reiteration of priority of growth and also supporting with higher than expected dividend payment stand out as a testimony of its support. While we do not expect RBI to act in terms of rate cuts, we believe that measures such as G-SAP, OMOs will continue until there is visibility of a structural growth. Therefore, the large borrowing program should go without any hiccups.
Furthermore, with the evidence of strong GST numbers until April 2021 (before the 2nd wave), it is expected that growth and therefore fiscal revenues will come back. Government’s conservative budget estimates are supportive. Also, given the fact that compared to last year there has not been a complete shutdown of activity (lockdowns being distributed), the impact on growth will not be similar to last year. Pent up demand will come back to support revenue collection. However, on the flipside, once growth resumes RBI will be forced to withdraw liquidity in a phased manner to prevent asset bubbles. Nevertheless, RBI need not act in terms of rate actions and we believe that a prolonged pause in terms of RBI rates is in the offing.
Net-net therefore while growth is wanting no matter what, it may come at a small price of rise in yields with liquidity withdrawal. That is however expected more in the 2nd half of the year. Lower than expected borrowing numbers, later this year or if not in next year could be a surprise. We may therefore see a range bound rate action in the near term with a rising bias over time. Global rate environment, oil and currency risks are to be watched out for.
2. Brief BackGround of SPonSorS, Board of truSteeS and aSSet manaGement comPanY
a. Sponsor
HSBC Mutual Fund is sponsored by HSBC Securities and Capital Markets (India) Private Limited (HSCI). The Sponsor is the Settler of the Mutual Fund Trust. The Sponsor has entrusted a sum of Rs. 1,00,000/- (Rupees One Lakh only) to the Trustee as the initial contribution towards the corpus of the Mutual Fund.
HSCI offers integrated investment banking services, securities and corporate finance & advisory. HSCI is a member of the Bombay Stock Exchange Limited and National Stock Exchange (capital and derivative market segments). HSCI holds 100% of the paid up equity share capital of HSBC Asset Management (India) Private Limited.
b. hSBc mutual fund
HSBC Mutual Fund (“the Mutual Fund” or “the Fund”) has been constituted as a Trust in accordance with the provisions of the Indian Trusts Act, 1882 (2 of 1882) vide a Trust Deed dated February 7, 2002 with HSBC Securities and Capital Markets (India) Private Limited, as the Sponsor and the Board of Individual Trustees. The Trustee has entered into an Investment Management Agreement dated February 7, 2002 with HSBC Asset Management (India) Private Limited (AMC) to function as the Investment Manager for all the schemes of the Fund. The Fund was registered with SEBI vide registration number MF/046/02/5 dated May 27, 2002.
The Trust has been formed for the purpose of pooling of capital from the public for collective investment in securities for the purpose of providing facilities for participation by persons as beneficiaries in such investments and in the profits/income arising therefrom.
Trustees’ ReportFor the year ended March 31, 2021 (Contd...)

8
Abridged Annual Report 2020 - 2021
c. Board of trustees (the trustees)
The Board of Trustees is the exclusive owner of the Trust Fund and holds the same in trust for the benefit of the unit holders. The Trustees have been discharging their duties and carrying out the responsibilities as provided in the SEBI (Mutual Funds) Regulations, 1996 and the Trust Deed. The Trustees seek to ensure that the Fund and the schemes floated there under are managed by the AMC in accordance with the Trust Deed, the said Regulations, directions and guidelines issued by the SEBI, the Stock Exchanges, the Association of Mutual Funds in India and other regulatory agencies.
d. asset management company (the amc)
HSBC Asset Management (India) Private Limited (the Investment Manager or the AMC) is a private limited company incorporated under the Companies Act, 1956 on December 12, 2001 having its Registered Office at 16, V. N. Road, Fort, Mumbai 400 001. HSBC Asset Management (India) Private Limited has been appointed as the Asset Management Company of HSBC Mutual Fund by the Trustee vide Investment Management Agreement (IMA) dated February 7, 2002 and executed between the Trustees and the AMC. SEBI approved the AMC to act as the Investment Manager of the Fund vide its letter No. MFD/BC/163/2002 dated May 27, 2002. The paid-up equity share capital of the AMC is Rs. 61.59 crores. The AMC is registered as a Portfolio Manager under the SEBI (Portfolio Managers) Regulations, 1993 vide registration no. INP000001322. The AMC also offers non-binding Advisory services to offshore funds under the mutual fund license.
HSBC Securities and Capital Markets (India) Private Limited holds 100% of the paid up equity share capital of the AMC.
3. inveStment oBjective of the SchemeSThe investment objective of the respective schemes has been provided above under the heading “Scheme Performance, Future Outlook and Operation of the Scheme” (Refer Section 1).
4. SiGnificant accountinG PolicieS The Significant Accounting Policies form part of the Notes to the Accounts annexed to the Balance Sheet of the Schemes in the Full Annual Report. The accounting policies are in accordance with Securities Exchange Board of India (Mutual Funds) Regulations 1996.
5. unclaimed dividendS & redemPtionSSummary of number of investors & corresponding amount Scheme-wise as on March 31, 2021
Schemeunclaimed dividend unclaimed redemption
amount (rs.) no. of investors
amount (rs.) no. of investors
HSBC Global Emerging Markets Fund 4,225.52 8 974,763.84 27
6. inveStor ServiceS
The number of official points of acceptance of transactions is 204 locations. In addition to the offices of the Registrar & Transfer agents, the AMC has Investor Service Centers in 9 locations at its own offices - namely Mumbai, New Delhi, Kolkata, Bangalore, Pune, Ahmedabad, Hyderabad, Chandigarh and Chennai. With a view to enhance customer convenience, the AMC has the facility of priority based servicing to key distributors through the enhancement of the Interactive Voice Reponses. The AMC has 2 Toll Free numbers (1-800-200-2434 /1-800-258-2434) which can be dialed from anywhere in India and 1 number i.e +91 44 39923900 (Investors calling from abroad). The call center service is being managed by the Registrar and Transfer Agents. Transactions for purchase / redemption of units in the schemes HSBC Mutual Fund can also be made through the online transaction facility on the AMC’s website at https://invest.assetmanagement.hsbc.co.in.
On the distribution front, the number of empaneled distributors was 1069 as on March 31, 2021. During the year, the AMC initiated tie-ups for online distribution of the Mutual Fund’s schemes with several channel partners taking the total number of such tie-ups to 52.
Trustees’ ReportFor the year ended March 31, 2021 (Contd...)
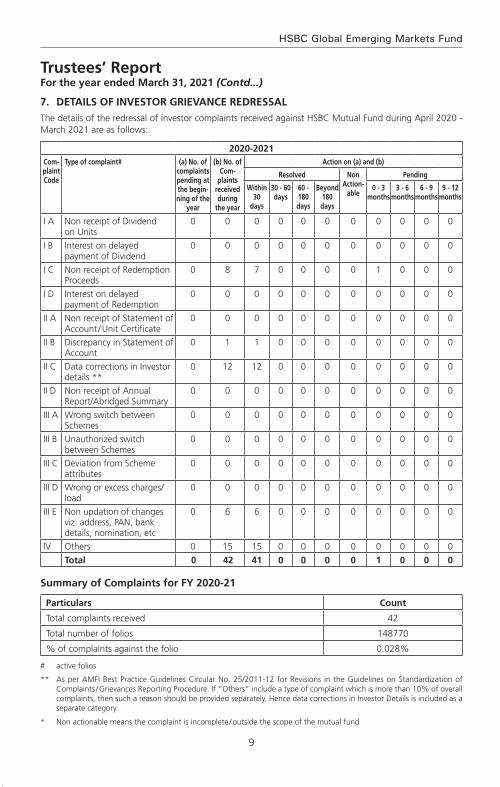
9
HSBC Global Emerging Markets Fund
Trustees’ ReportFor the year ended March 31, 2021 (Contd...)
7. detailS of inveStor Grievance redreSSal
The details of the redressal of investor complaints received against HSBC Mutual Fund during April 2020 - March 2021 are as follows:
2020-2021com-plaint code
type of complaint# (a) no. of complaints pending at the begin-ning of the
year
(b) no. of com-
plaints received during
the year
action on (a) and (b)
resolved non action-
able
Pending
Within 30
days
30 - 60 days
60 - 180 days
Beyond 180 days
0 - 3 months
3 - 6 months
6 - 9 months
9 - 12 months
I A Non receipt of Dividend on Units
0 0 0 0 0 0 0 0 0 0 0
I B Interest on delayed payment of Dividend
0 0 0 0 0 0 0 0 0 0 0
I C Non receipt of Redemption Proceeds
0 8 7 0 0 0 0 1 0 0 0
I D Interest on delayed payment of Redemption
0 0 0 0 0 0 0 0 0 0 0
II A Non receipt of Statement of Account / Unit Certificate
0 0 0 0 0 0 0 0 0 0 0
II B Discrepancy in Statement of Account
0 1 1 0 0 0 0 0 0 0 0
II C Data corrections in Investor details **
0 12 12 0 0 0 0 0 0 0 0
II D Non receipt of Annual Report/Abridged Summary
0 0 0 0 0 0 0 0 0 0 0
III A Wrong switch between Schemes
0 0 0 0 0 0 0 0 0 0 0
III B Unauthorized switch between Schemes
0 0 0 0 0 0 0 0 0 0 0
III C Deviation from Scheme attributes
0 0 0 0 0 0 0 0 0 0 0
III D Wrong or excess charges/load
0 0 0 0 0 0 0 0 0 0 0
III E Non updation of changes viz. address, PAN, bank details, nomination, etc
0 6 6 0 0 0 0 0 0 0 0
IV Others 0 15 15 0 0 0 0 0 0 0 0
total 0 42 41 0 0 0 0 1 0 0 0
Summary of complaints for fY 2020-21
Particulars count
Total complaints received 42
Total number of folios 148770
% of complaints against the folio 0.028%
# active folios
** As per AMFI Best Practice Guidelines Circular No. 25/2011-12 for Revisions in the Guidelines on Standardization of Complaints / Grievances Reporting Procedure. If “Others” include a type of complaint which is more than 10% of overall complaints, then such a reason should be provided separately. Hence data corrections in Investor Details is included as a separate category
* Non actionable means the complaint is incomplete / outside the scope of the mutual fund
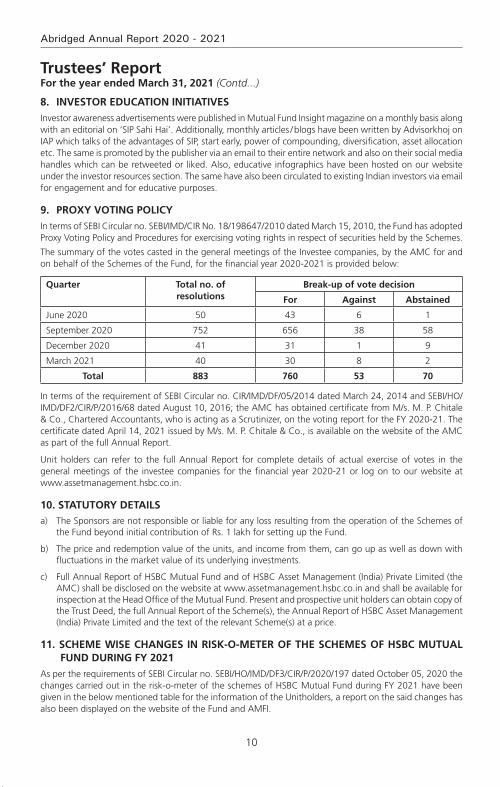
10
Abridged Annual Report 2020 - 2021
8. inveStor education initiativeS
Investor awareness advertisements were published in Mutual Fund Insight magazine on a monthly basis along with an editorial on ‘SIP Sahi Hai’. Additionally, monthly articles / blogs have been written by Advisorkhoj on IAP which talks of the advantages of SIP, start early, power of compounding, diversification, asset allocation etc. The same is promoted by the publisher via an email to their entire network and also on their social media handles which can be retweeted or liked. Also, educative infographics have been hosted on our website under the investor resources section. The same have also been circulated to existing Indian investors via email for engagement and for educative purposes.
9. ProxY votinG PolicY
In terms of SEBI Circular no. SEBI/IMD/CIR No. 18/198647/2010 dated March 15, 2010, the Fund has adopted Proxy Voting Policy and Procedures for exercising voting rights in respect of securities held by the Schemes.
The summary of the votes casted in the general meetings of the Investee companies, by the AMC for and on behalf of the Schemes of the Fund, for the financial year 2020-2021 is provided below:
quarter total no. of resolutions
Break-up of vote decision
for against abstained
June 2020 50 43 6 1
September 2020 752 656 38 58
December 2020 41 31 1 9
March 2021 40 30 8 2
total 883 760 53 70
In terms of the requirement of SEBI Circular no. CIR/IMD/DF/05/2014 dated March 24, 2014 and SEBI/HO/IMD/DF2/CIR/P/2016/68 dated August 10, 2016; the AMC has obtained certificate from M/s. M. P. Chitale & Co., Chartered Accountants, who is acting as a Scrutinizer, on the voting report for the FY 2020-21. The certificate dated April 14, 2021 issued by M/s. M. P. Chitale & Co., is available on the website of the AMC as part of the full Annual Report.
Unit holders can refer to the full Annual Report for complete details of actual exercise of votes in the general meetings of the investee companies for the financial year 2020-21 or log on to our website at www.assetmanagement.hsbc.co.in.
10. StatutorY detailSa) The Sponsors are not responsible or liable for any loss resulting from the operation of the Schemes of
the Fund beyond initial contribution of Rs. 1 lakh for setting up the Fund.
b) The price and redemption value of the units, and income from them, can go up as well as down with fluctuations in the market value of its underlying investments.
c) Full Annual Report of HSBC Mutual Fund and of HSBC Asset Management (India) Private Limited (the AMC) shall be disclosed on the website at www.assetmanagement.hsbc.co.in and shall be available for inspection at the Head Office of the Mutual Fund. Present and prospective unit holders can obtain copy of the Trust Deed, the full Annual Report of the Scheme(s), the Annual Report of HSBC Asset Management (India) Private Limited and the text of the relevant Scheme(s) at a price.
11. Scheme WiSe chanGeS in riSk-o-meter of the SchemeS of hSBc mutual fund durinG fY 2021
As per the requirements of SEBI Circular no. SEBI/HO/IMD/DF3/CIR/P/2020/197 dated October 05, 2020 the changes carried out in the risk-o-meter of the schemes of HSBC Mutual Fund during FY 2021 have been given in the below mentioned table for the information of the Unitholders, a report on the said changes has also been displayed on the website of the Fund and AMFI.
Trustees’ ReportFor the year ended March 31, 2021 (Contd...)
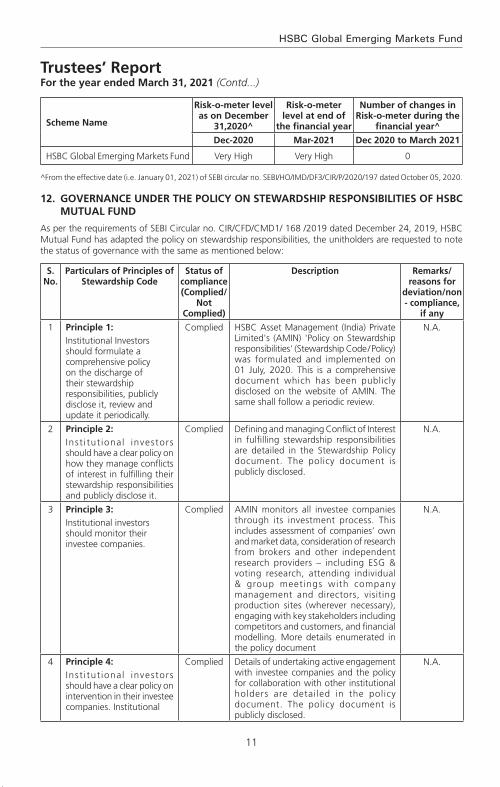
11
HSBC Global Emerging Markets Fund
Trustees’ ReportFor the year ended March 31, 2021 (Contd...)
Scheme name
risk-o-meter level as on december
31,2020^
risk-o-meter level at end of
the financial year
number of changes in risk-o-meter during the
financial year^
dec-2020 mar-2021 dec 2020 to march 2021
HSBC Global Emerging Markets Fund Very High Very High 0
^From the effective date (i.e. January 01, 2021) of SEBI circular no. SEBI/HO/IMD/DF3/CIR/P/2020/197 dated October 05, 2020.
12. Governance under the PolicY on SteWardShiP reSPonSiBilitieS of hSBc mutual fund
As per the requirements of SEBI Circular no. CIR/CFD/CMD1/ 168 /2019 dated December 24, 2019, HSBC Mutual Fund has adapted the policy on stewardship responsibilities, the unitholders are requested to note the status of governance with the same as mentioned below:
S. no.
Particulars of Principles of Stewardship code
Status of compliance (complied/
not complied)
description remarks/reasons for
deviation/non - compliance,
if any
1 Principle 1:Institutional Investors should formulate a comprehensive policy on the discharge of their stewardship responsibilities, publicly disclose it, review and update it periodically.
Complied HSBC Asset Management (India) Private Limited's (AMIN) 'Policy on Stewardship responsibilities' (Stewardship Code / Policy) was formulated and implemented on 01 July, 2020. This is a comprehensive document which has been publicly disclosed on the website of AMIN. The same shall follow a periodic review.
N.A.
2 Principle 2:Inst i tut ional investors should have a clear policy on how they manage conflicts of interest in fulfilling their stewardship responsibilities and publicly disclose it.
Complied Defining and managing Conflict of Interest in fulfilling stewardship responsibilities are detailed in the Stewardship Policy document. The policy document is publicly disclosed.
N.A.
3 Principle 3:Institutional investors should monitor their investee companies.
Complied AMIN monitors all investee companies through its investment process. This includes assessment of companies’ own and market data, consideration of research from brokers and other independent research providers – including ESG & voting research, attending individual & group meetings with company management and directors, visiting production sites (wherever necessary), engaging with key stakeholders including competitors and customers, and financial modelling. More details enumerated in the policy document
N.A.
4 Principle 4:Inst i tut ional investors should have a clear policy on intervention in their investee companies. Institutional
Complied Details of undertaking active engagement with investee companies and the policy for collaboration with other institutional holders are detailed in the policy document. The policy document is publicly disclosed.
N.A.

12
Abridged Annual Report 2020 - 2021
Trustees’ ReportFor the year ended March 31, 2021 (Contd...)
S. no.
Particulars of Principles of Stewardship code
Status of compliance (complied/
not complied)
description remarks/reasons for
deviation/non - compliance,
if any
investors should also have a clear policy for collaboration with other institutional investors where required, to preserve the interests of the ultimate investors, which should be disclosed.
5 Principle 5:
Inst i tut ional investors should have a clear policy on voting and disclosure of voting activity.
Complied AMIN has a clear and detailed voting policy which provides the framework for the voting decisions. All voting decisions shall be in accordance with AMIN’s Voting Policy and Procedures, which is disclosed on the website. AMIN discloses the details of the voting on its website on a quarterly basis within 10 working days from the end of the quarter. Additionally, AMIN also discloses the details of the votes cast, in the annual report of the schemes of HSBC Mutual Fund.
N.A.
6 Principle 6:Institutional investors should report periodically on their stewardship activities.
Complied The annual status report of the stewardship code and quarterly report on proxy voting are publicly disclosed on the website as required under SEBI Regulations.
N.A.
13. SiGnificant event after the end of the financial Year
HSBC Global Consumer Opportunities Fund (HGCOF) has been merged with HSBC Asia Pacific (Ex Japan) Dividend Yield Fund with effect from May 13, 2021. Therefore, HGCOF has been ceased to exist from the aforesaid date.
14. acknoWledGementS
The Trustees wish to thank the Unit holders of the Schemes for their support throughout the year and also thank the Government of India, the Securities and Exchange Board of India (SEBI), the Reserve Bank of India (RBI) and the Association of Mutual Funds in India (AMFI) for the guidance provided by them. The Trustees also appreciate the services provided by the Registrar and Transfer Agent, Fund Accountant, Custodian, Bankers, Distributors and Brokers. The guidance and services provided by the Auditors and advocates and the ebullience, sincerity and dedication of the employees of HSBC Asset Management (India) Private Limited is also appreciated.
The Trustees look forward to the continued support of everyone.
For and on behalf of the Board of Trustees of HSBC Mutual Fund
Sd/-
Trustee
Mumbai
July 20, 2021.
13
HSBC Global Emerging Markets Fund
To the Trustees of HSBC Mutual Fund
hSBc Global emerging markets fund
report on the audit of the financial Statements
OpinionWe have audited the financial statements of hSBc Global emerging markets fund (the ‘Scheme’) of HSBC Mutual Fund, which comprise the balance sheet as at 31 March 2021 and the revenue account for the year then ended, and notes to the financial statements, including a summary of the significant accounting policies.
In our opinion and to the best of our information and according to the explanations given to us, the aforesaid financial statements give a true and fair view in conformity with the accounting principles generally accepted in India, of the state of affairs of the Scheme as at 31 March 2021, its net surplus for the year ended on that date.
Basis for opinion
We conducted our audit in accordance with the Standards on Auditing (‘SAs’) issued by the Institute of Chartered Accountants of India (the ‘ICAI’). Our responsibilities under those SAs are further described in the Auditor’s Responsibilities for the Audit of the Financial Statements section of our report. We are independent of the Scheme in accordance with the Code of Ethics issued by the ICAI, and we have fulfilled our other ethical responsibilities in accordance with the Code of Ethics. We believe that the audit evidence we have obtained is sufficient and appropriate to provide a basis for our opinion.
responsibilities of management and those charged with Governance for the financial Statements
The Scheme’s management, the Board of Directors of HSBC Mutual Fund (the ‘Trustees’) and the Board of Directors of HSBC Asset Management (India) Private Limited (the ‘AMC’) (collectively referred to as ‘Management’) are responsible for the preparation of these financial statements that give a true and fair view of the state of affairs, results of operations of the Scheme in accordance with the accounting policies and standards specified in the Ninth Schedule of the Securities and Exchange Board of India (Mutual Funds) Regulations, 1996, as amended (the ‘Regulations’) and the accounting principles generally accepted in India. This responsibility includes design, implementation and maintenance of internal control relevant to the preparation and presentation of the financial statements that give a true and fair view and are free from material misstatement, whether due to fraud or error.
In preparing the financial statements, management is responsible for assessing the Scheme’s ability to continue as a going concern, disclosing, as applicable, matters related to going concern and using the going concern basis of accounting unless management either intends to liquidate the Scheme or to cease operations, or has no realistic alternative but to do so.
The management is responsible for overseeing the Scheme’s financial reporting process.
auditor’s responsibilities for the audit of the financial Statements
Our objectives are to obtain reasonable assurance about whether the financial statements as a whole are free from material misstatement, whether due to fraud or error, and to issue an auditor’s report that includes our opinion. Reasonable assurance is a high level of assurance, but is not a guarantee that an audit conducted in accordance with SAs will always detect a material misstatement when it exists. Misstatements can arise from fraud or error and are considered material if, individually or in the aggregate, they could reasonably be expected to influence the economic decisions of users taken on the basis of these financial statements.
As part of an audit in accordance with SAs, we exercise professional judgment and maintain professional skepticism throughout the audit. We also:
• Identifyandassesstherisksofmaterialmisstatementofthefinancialstatements,whetherduetofraudor error, design and perform audit procedures responsive to those risks, and obtain audit evidence that is sufficient and appropriate to provide a basis for our opinion. The risk of not detecting a material misstatement resulting from fraud is higher than for one resulting from error, as fraud may involve
Independent Auditors’ Report
14
Abridged Annual Report 2020 - 2021
Independent Auditors’ Report (Contd...)
collusion, forgery, intentional omissions, misrepresentations, or the override of internal control;
• Obtainanunderstandingofinternalcontrolrelevanttotheauditinordertodesignauditproceduresthat are appropriate in the circumstances, but not for the purpose of expressing an opinion on the effectiveness of the Scheme’s internal controls;
• Evaluatetheappropriatenessofaccountingpoliciesusedandthereasonablenessofaccountingestimatesand related disclosures made by Management;
• ConcludeontheappropriatenessofManagement’suseofthegoingconcernbasisofaccountingand,based on the audit evidence obtained, whether a material uncertainty exists related to events or conditions that may cast significant doubt on the Scheme’s ability to continue as a going concern. If we conclude that a material uncertainty exists, we are required to draw attention in our auditor’s report to the related disclosures in the financial statements or, if such disclosures are inadequate, to modify our opinion. Our conclusions are based on the audit evidence obtained up to the date of our auditor’s report. However, future events or conditions may cause the Scheme to cease to continue as a going concern;
• Evaluate the overall presentation, structure and content of the financial statements, including thedisclosures and whether the financial statements represent the underlying transactions and events in a manner that achieves fair presentation.
We communicate with those charged with governance regarding, among other matters, the planned scope and timing of the audit and significant audit findings, including any significant deficiencies in internal control that we identify during our audit.
We also provide those charged with governance with a statement that we have complied with relevant ethical requirements regarding independence, and to communicate with them all relationships and other matters that may reasonably be thought to bear on our independence, and where applicable, related safeguards.
report on other legal and regulatory requirements
1 As required by Regulation 55 (4) of the Regulations, we report that:
(a) We have obtained all information and explanations which, to the best of our knowledge and belief, were necessary for the purposes of the audit; and
(b) The balance sheet and the revenue account have been prepared in accordance with the accounting policies and standards as specified in the Ninth Schedule of the Regulations.
2 As required by Clause 5 (ii) (2) of the Eleventh Schedule of the Regulations, we report that the balance sheet and the revenue account are in agreement with the books of account of the Scheme.
For B S R & Co. LLP Chartered Accountants Firm’s Registration No: 101248W/W-100022
Sd/-
Ajit Viswanath PartnerMembership No: 067114UDIN : 21067114AAAADU3615
Place : Mumbai Date : July 20, 2021.

15
HSBC Global Emerging Markets Fund
Rs. in Lakhs
As at March 31, 2021
As at March 31, 2020
LIABILITIES1 Unit Capital 906.50 640.832 Reserves & Surplus2.1 Unit Premium Reserves (200.31) (436.85)2.2 Unrealised Appreciation Reserve 524.01 101.882.3 Other Reserves 603.31 516.143 Loans & Borrowings – –4 Current Liabilities & Provisions4.1 Provision for Doubtful Income/Deposits – –4.2 Other Current Liabilities & Provisions 20.70 14.04
TOTAL 1,854.21 836.04
ASSETS1 Investments1.1 Listed Securities:1.1.1 Equity Shares – –1.1.2 Preference Shares – –1.1.3 Equity Linked Debentures – –1.1.4 Other Debentures & Bonds – –1.1.5 Securitised Debt Securities – –1.2 Securities Awaited Listing:1.2.1 Equity Shares – –1.2.2 Preference Shares – –1.2.3 Equity Linked Debentures – –1.2.4 Other Debentures & Bonds – –1.2.5 Securitised Debt Securities – –1.3 Unlisted Securities:1.3.1 Equity Shares – –1.3.2 Preference Shares – –1.3.3 Equity Linked Debentures – –1.3.4 Other Debentures & Bonds – –1.3.5 Securitised Debt Securities – –1.4 Government Securities – –1.5 Treasury Bills – –1.6 Commercial Paper – –1.7 Certificate of Deposits – –1.8 Bill Rediscounting – –1.9 Units of Domestic Mutual Fund – –1.10 Foreign Securities 1,761.83 807.34
Total Investments 1,761.83 807.34
2 Deposits 1.59 1.503 Other Current Assets3.1 Cash & Bank Balance 0.27 0.463.2 TREPS / Reverse Repo Lending 80.62 17.843.3 Others 9.90 8.904 Deferred Revenue Expenditure (to the extent not written off) – –
TOTAL 1,854.21 836.04
Notes to Accounts - Annexure I
Abridged Balance Sheet as at March 31, 2021
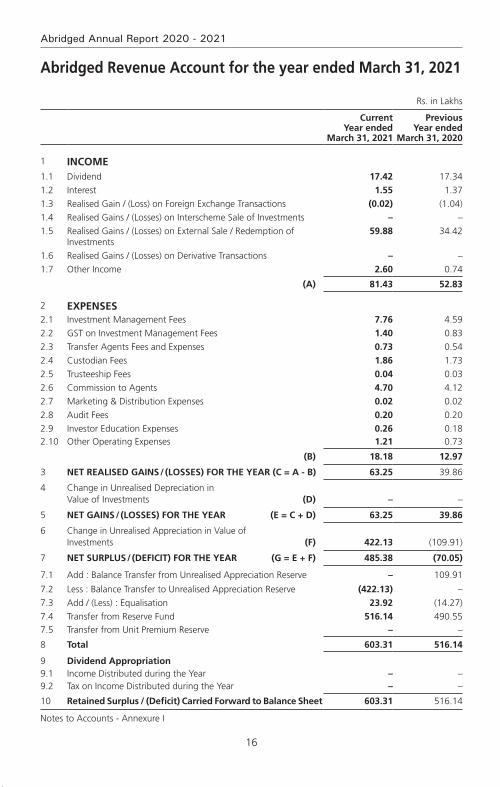
16
Abridged Annual Report 2020 - 2021
Abridged Revenue Account for the year ended March 31, 2021
Rs. in Lakhs
Current Year ended
March 31, 2021
Previous Year ended
March 31, 2020
1 INCOME1.1 Dividend 17.42 17.341.2 Interest 1.55 1.371.3 Realised Gain / (Loss) on Foreign Exchange Transactions (0.02) (1.04)1.4 Realised Gains / (Losses) on Interscheme Sale of Investments – –1.5 Realised Gains / (Losses) on External Sale / Redemption of
Investments59.88 34.42
1.6 Realised Gains / (Losses) on Derivative Transactions – –1.7 Other Income 2.60 0.74
(A) 81.43 52.83
2 EXPENSES2.1 Investment Management Fees 7.76 4.592.2 GST on Investment Management Fees 1.40 0.832.3 Transfer Agents Fees and Expenses 0.73 0.542.4 Custodian Fees 1.86 1.732.5 Trusteeship Fees 0.04 0.032.6 Commission to Agents 4.70 4.122.7 Marketing & Distribution Expenses 0.02 0.022.8 Audit Fees 0.20 0.202.9 Investor Education Expenses 0.26 0.182.10 Other Operating Expenses 1.21 0.73
(B) 18.18 12.97
3 NET REALISED GAINS / (LOSSES) FOR THE YEAR (C = A - B) 63.25 39.86
4 Change in Unrealised Depreciation in Value of Investments (D) – –
5 NET GAINS / (LOSSES) FOR THE YEAR (E = C + D) 63.25 39.86
6 Change in Unrealised Appreciation in Value of Investments (F) 422.13 (109.91)
7 NET SURPLUS / (DEFICIT) FOR THE YEAR (G = E + F) 485.38 (70.05)
7.1 Add : Balance Transfer from Unrealised Appreciation Reserve – 109.91
7.2 Less : Balance Transfer to Unrealised Appreciation Reserve (422.13) –7.3 Add / (Less) : Equalisation 23.92 (14.27)7.4 Transfer from Reserve Fund 516.14 490.557.5 Transfer from Unit Premium Reserve – –
8 Total 603.31 516.14
9 Dividend Appropriation9.1 Income Distributed during the Year – –9.2 Tax on Income Distributed during the Year – –
10 Retained Surplus / (Deficit) Carried Forward to Balance Sheet 603.31 516.14
Notes to Accounts - Annexure I
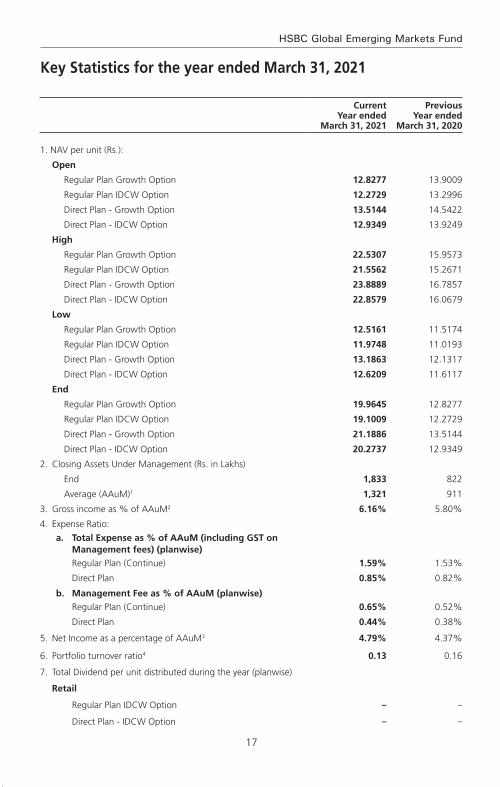
17
HSBC Global Emerging Markets Fund
Key Statistics for the year ended March 31, 2021
Current Year ended
March 31, 2021
Previous Year ended
March 31, 2020
1. NAV per unit (Rs.):
Open
Regular Plan Growth Option 12.8277 13.9009
Regular Plan IDCW Option 12.2729 13.2996
Direct Plan - Growth Option 13.5144 14.5422
Direct Plan - IDCW Option 12.9349 13.9249
High
Regular Plan Growth Option 22.5307 15.9573
Regular Plan IDCW Option 21.5562 15.2671
Direct Plan - Growth Option 23.8889 16.7857
Direct Plan - IDCW Option 22.8579 16.0679
Low
Regular Plan Growth Option 12.5161 11.5174
Regular Plan IDCW Option 11.9748 11.0193
Direct Plan - Growth Option 13.1863 12.1317
Direct Plan - IDCW Option 12.6209 11.6117
End
Regular Plan Growth Option 19.9645 12.8277
Regular Plan IDCW Option 19.1009 12.2729
Direct Plan - Growth Option 21.1886 13.5144
Direct Plan - IDCW Option 20.2737 12.9349
2. Closing Assets Under Management (Rs. in Lakhs)
End 1,833 822
Average (AAuM)1 1,321 911
3. Gross income as % of AAuM2 6.16% 5.80%
4. Expense Ratio:
a. total expense as % of aaum (including GSt on management fees) (planwise)
Regular Plan (Continue) 1.59% 1.53%
Direct Plan 0.85% 0.82%
b. management fee as % of aaum (planwise)
Regular Plan (Continue) 0.65% 0.52%
Direct Plan 0.44% 0.38%
5. Net Income as a percentage of AAuM3 4.79% 4.37%
6. Portfolio turnover ratio4 0.13 0.16
7. Total Dividend per unit distributed during the year (planwise)
Retail
Regular Plan IDCW Option – –
Direct Plan - IDCW Option – –
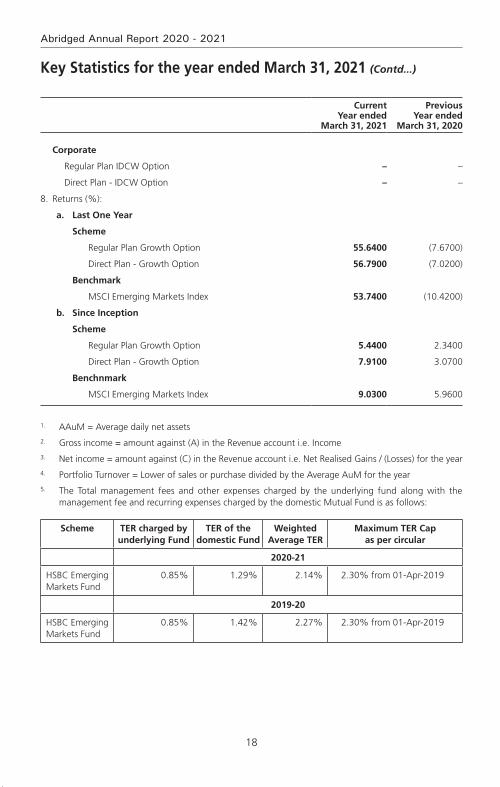
18
Abridged Annual Report 2020 - 2021
Current Year ended
March 31, 2021
Previous Year ended
March 31, 2020
Corporate
Regular Plan IDCW Option – –
Direct Plan - IDCW Option – –
8. Returns (%):
a. Last One Year
Scheme
Regular Plan Growth Option 55.6400 (7.6700)
Direct Plan - Growth Option 56.7900 (7.0200)
Benchmark
MSCI Emerging Markets Index 53.7400 (10.4200)
b. Since Inception
Scheme
Regular Plan Growth Option 5.4400 2.3400
Direct Plan - Growth Option 7.9100 3.0700
Benchnmark
MSCI Emerging Markets Index 9.0300 5.9600
1. AAuM = Average daily net assets2. Gross income = amount against (A) in the Revenue account i.e. Income3. Net income = amount against (C) in the Revenue account i.e. Net Realised Gains / (Losses) for the year4. Portfolio Turnover = Lower of sales or purchase divided by the Average AuM for the year5. The Total management fees and other expenses charged by the underlying fund along with the
management fee and recurring expenses charged by the domestic Mutual Fund is as follows:
Scheme TER charged by underlying Fund
TER of the domestic Fund
Weighted Average TER
Maximum TER Cap as per circular
2020-21
HSBC Emerging Markets Fund
0.85% 1.29% 2.14% 2.30% from 01-Apr-2019
2019-20
HSBC Emerging Markets Fund
0.85% 1.42% 2.27% 2.30% from 01-Apr-2019
Key Statistics for the year ended March 31, 2021 (Contd...)
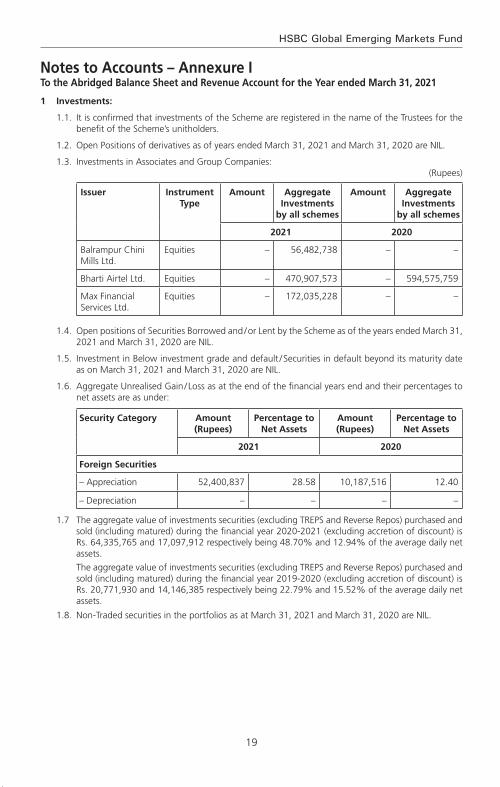
19
HSBC Global Emerging Markets Fund
Notes to Accounts – Annexure ITo the Abridged Balance Sheet and Revenue Account for the Year ended March 31, 2021
1 Investments:
1.1. It is confirmed that investments of the Scheme are registered in the name of the Trustees for the benefit of the Scheme’s unitholders.
1.2. Open Positions of derivatives as of years ended March 31, 2021 and March 31, 2020 are NIL.
1.3. Investments in Associates and Group Companies:(Rupees)
Issuer Instrument Type
Amount Aggregate Investments
by all schemes
Amount Aggregate Investments
by all schemes
2021 2020
Balrampur Chini Mills Ltd.
Equities – 56,482,738 – –
Bharti Airtel Ltd. Equities – 470,907,573 – 594,575,759
Max Financial Services Ltd.
Equities – 172,035,228 – –
1.4. Open positions of Securities Borrowed and / or Lent by the Scheme as of the years ended March 31, 2021 and March 31, 2020 are NIL.
1.5. Investment in Below investment grade and default / Securities in default beyond its maturity date as on March 31, 2021 and March 31, 2020 are NIL.
1.6. Aggregate Unrealised Gain / Loss as at the end of the financial years end and their percentages to net assets are as under:
Security Category Amount (Rupees)
Percentage to Net Assets
Amount (Rupees)
Percentage to Net Assets
2021 2020
Foreign Securities
– Appreciation 52,400,837 28.58 10,187,516 12.40
– Depreciation – – – –
1.7 The aggregate value of investments securities (excluding TREPS and Reverse Repos) purchased and sold (including matured) during the financial year 2020-2021 (excluding accretion of discount) is Rs. 64,335,765 and 17,097,912 respectively being 48.70% and 12.94% of the average daily net assets.
The aggregate value of investments securities (excluding TREPS and Reverse Repos) purchased and sold (including matured) during the financial year 2019-2020 (excluding accretion of discount) is Rs. 20,771,930 and 14,146,385 respectively being 22.79% and 15.52% of the average daily net assets.
1.8. Non-Traded securities in the portfolios as at March 31, 2021 and March 31, 2020 are NIL.
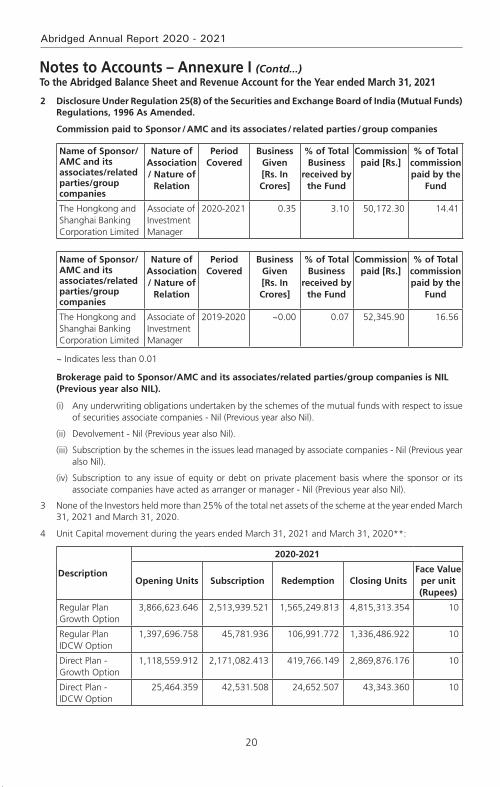
20
Abridged Annual Report 2020 - 2021
2 Disclosure Under Regulation 25(8) of the Securities and Exchange Board of India (Mutual Funds) Regulations, 1996 As Amended.
Commission paid to Sponsor / AMC and its associates / related parties / group companies
Name of Sponsor/AMC and its associates/related parties/group companies
Nature of Association / Nature of
Relation
Period Covered
Business Given [Rs. In Crores]
% of Total Business
received by the Fund
Commission paid [Rs.]
% of Total commission paid by the
Fund
The Hongkong and Shanghai Banking Corporation Limited
Associate of Investment Manager
2020-2021 0.35 3.10 50,172.30 14.41
Name of Sponsor/AMC and its associates/related parties/group companies
Nature of Association / Nature of
Relation
Period Covered
Business Given [Rs. In Crores]
% of Total Business
received by the Fund
Commission paid [Rs.]
% of Total commission paid by the
Fund
The Hongkong and Shanghai Banking Corporation Limited
Associate of Investment Manager
2019-2020 ~0.00 0.07 52,345.90 16.56
~ Indicates less than 0.01
Brokerage paid to Sponsor/AMC and its associates/related parties/group companies is NIL (Previous year also NIL).
(i) Any underwriting obligations undertaken by the schemes of the mutual funds with respect to issue of securities associate companies - Nil (Previous year also Nil).
(ii) Devolvement - Nil (Previous year also Nil).
(iii) Subscription by the schemes in the issues lead managed by associate companies - Nil (Previous year also Nil).
(iv) Subscription to any issue of equity or debt on private placement basis where the sponsor or its associate companies have acted as arranger or manager - Nil (Previous year also Nil).
3 None of the Investors held more than 25% of the total net assets of the scheme at the year ended March 31, 2021 and March 31, 2020.
4 Unit Capital movement during the years ended March 31, 2021 and March 31, 2020**:
Description
2020-2021
Opening Units Subscription Redemption Closing UnitsFace Value
per unit (Rupees)
Regular Plan Growth Option
3,866,623.646 2,513,939.521 1,565,249.813 4,815,313.354 10
Regular Plan IDCW Option
1,397,696.758 45,781.936 106,991.772 1,336,486.922 10
Direct Plan - Growth Option
1,118,559.912 2,171,082.413 419,766.149 2,869,876.176 10
Direct Plan - IDCW Option
25,464.359 42,531.508 24,652.507 43,343.360 10
Notes to Accounts – Annexure I (Contd...)To the Abridged Balance Sheet and Revenue Account for the Year ended March 31, 2021
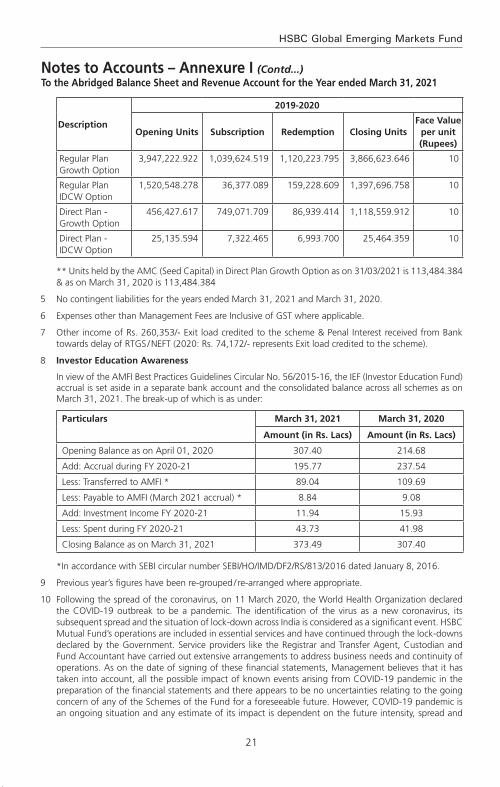
21
HSBC Global Emerging Markets Fund
Notes to Accounts – Annexure I (Contd...)To the Abridged Balance Sheet and Revenue Account for the Year ended March 31, 2021
Description
2019-2020
Opening Units Subscription Redemption Closing UnitsFace Value
per unit (Rupees)
Regular Plan Growth Option
3,947,222.922 1,039,624.519 1,120,223.795 3,866,623.646 10
Regular Plan IDCW Option
1,520,548.278 36,377.089 159,228.609 1,397,696.758 10
Direct Plan - Growth Option
456,427.617 749,071.709 86,939.414 1,118,559.912 10
Direct Plan - IDCW Option
25,135.594 7,322.465 6,993.700 25,464.359 10
** Units held by the AMC (Seed Capital) in Direct Plan Growth Option as on 31/03/2021 is 113,484.384 & as on March 31, 2020 is 113,484.384
5 No contingent liabilities for the years ended March 31, 2021 and March 31, 2020.
6 Expenses other than Management Fees are Inclusive of GST where applicable.
7 Other income of Rs. 260,353/- Exit load credited to the scheme & Penal Interest received from Bank towards delay of RTGS / NEFT (2020: Rs. 74,172/- represents Exit load credited to the scheme).
8 investor education awareness
In view of the AMFI Best Practices Guidelines Circular No. 56/2015-16, the IEF (Investor Education Fund) accrual is set aside in a separate bank account and the consolidated balance across all schemes as on March 31, 2021. The break-up of which is as under:
Particulars March 31, 2021 March 31, 2020
Amount (in Rs. Lacs) Amount (in Rs. Lacs)
Opening Balance as on April 01, 2020 307.40 214.68
Add: Accrual during FY 2020-21 195.77 237.54
Less: Transferred to AMFI * 89.04 109.69
Less: Payable to AMFI (March 2021 accrual) * 8.84 9.08
Add: Investment Income FY 2020-21 11.94 15.93
Less: Spent during FY 2020-21 43.73 41.98
Closing Balance as on March 31, 2021 373.49 307.40
*In accordance with SEBI circular number SEBI/HO/IMD/DF2/RS/813/2016 dated January 8, 2016.
9 Previous year’s figures have been re-grouped / re-arranged where appropriate.
10 Following the spread of the coronavirus, on 11 March 2020, the World Health Organization declared the COVID-19 outbreak to be a pandemic. The identification of the virus as a new coronavirus, its subsequent spread and the situation of lock-down across India is considered as a significant event. HSBC Mutual Fund’s operations are included in essential services and have continued through the lock-downs declared by the Government. Service providers like the Registrar and Transfer Agent, Custodian and Fund Accountant have carried out extensive arrangements to address business needs and continuity of operations. As on the date of signing of these financial statements, Management believes that it has taken into account, all the possible impact of known events arising from COVID-19 pandemic in the preparation of the financial statements and there appears to be no uncertainties relating to the going concern of any of the Schemes of the Fund for a foreseeable future. However, COVID-19 pandemic is an ongoing situation and any estimate of its impact is dependent on the future intensity, spread and
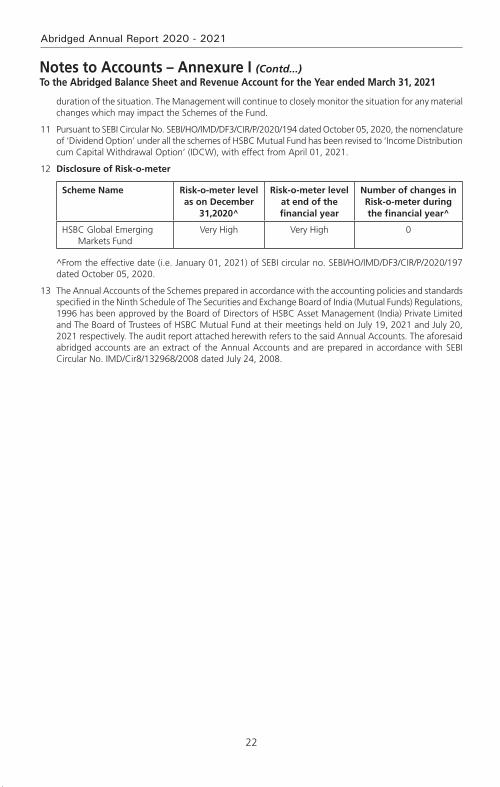
22
Abridged Annual Report 2020 - 2021
duration of the situation. The Management will continue to closely monitor the situation for any material changes which may impact the Schemes of the Fund.
11 Pursuant to SEBI Circular No. SEBI/HO/IMD/DF3/CIR/P/2020/194 dated October 05, 2020, the nomenclature of ‘Dividend Option’ under all the schemes of HSBC Mutual Fund has been revised to ‘Income Distribution cum Capital Withdrawal Option’ (IDCW), with effect from April 01, 2021.
12 disclosure of risk-o-meter
Scheme Name Risk-o-meter level as on December
31,2020^
Risk-o-meter level at end of the financial year
Number of changes in Risk-o-meter during the financial year^
HSBC Global Emerging Markets Fund
Very High Very High 0
^From the effective date (i.e. January 01, 2021) of SEBI circular no. SEBI/HO/IMD/DF3/CIR/P/2020/197 dated October 05, 2020.
13 The Annual Accounts of the Schemes prepared in accordance with the accounting policies and standards specified in the Ninth Schedule of The Securities and Exchange Board of India (Mutual Funds) Regulations, 1996 has been approved by the Board of Directors of HSBC Asset Management (India) Private Limited and The Board of Trustees of HSBC Mutual Fund at their meetings held on July 19, 2021 and July 20, 2021 respectively. The audit report attached herewith refers to the said Annual Accounts. The aforesaid abridged accounts are an extract of the Annual Accounts and are prepared in accordance with SEBI Circular No. IMD/Cir8/132968/2008 dated July 24, 2008.
Notes to Accounts – Annexure I (Contd...)To the Abridged Balance Sheet and Revenue Account for the Year ended March 31, 2021
23
HSBC Global Emerging Markets Fund
Voting Policy and Procedures
In view of SEBI guidelines related to “Role of Mutual Funds in Corporate Governance of Public Listed Companies”, HSBC AMC has formulated its “Policy for Proxy Voting in Public Listed Companies”. The said policy is available on our website and the details of actual exercise of proxy votes, the summary of votes casted and the auditor’s certificate for the Financial Year 2020 – 21 is forming part of our full Annual Report for the Financial Year 2020 – 21 which is uploaded on our website at http://www.assetmanagement.hsbc.co.in

24
Abridged Annual Report 2020 - 2021
Statutory Details & Disclaimers
All the returns have been sourced from Mutual Funds India Explorer software. The performance of the schemes and the benchmark is calculated on a total return basis. This document has been prepared by HSBC Asset Management (India) Private Ltd (HSBC) for information purposes only and should not be construed as i) an offer or recommendation to buy or sell securities, commodities, currencies or other investments referred to herein; or ii) an offer to sell or a solicitation or an offer for purchase of any of the funds of HSBC Mutual Fund; or iii) an investment research or investment advice. All information contained in this document (including that sourced from third parties), is obtained from sources HSBC and the third party which HSBC believes to be reliable however, has not independently verified the same. The information and opinions contained within the document are based upon publicly available information and rates of taxation applicable (if any) at the time of publication, which are subject to change from time to time.
Expressions of opinion are those of HSBC only and are subject to change without notice. It does not have regard to specific investment objectives, financial situation and the particular needs of any specific person who may receive this document. Investors should seek personal and independent advice regarding the appropriateness of investing in any of the funds, securities, other investment or investment strategies that may have been discussed or referred herein and should understand that the views regarding future prospects may or may not be realized. In no event shall HSBC Mutual Fund / HSBC Asset management (India) Private Limited and / or its affiliates or any of their directors, trustees, officers and employees be liable for any direct, indirect, special, incidental or consequential damages arising out of the use of information / opinion herein. Neither this document nor the units of HSBC Mutual Fund have been registered in any jurisdiction. The distribution of this document in certain jurisdictions may be restricted or totally prohibited and accordingly, persons who come into possession of this document are required to inform themselves about, and to observe, any such restrictions.
mutual fund investments are subject to market risks, read all scheme related documents carefully.

HSBC Brazil FundAn open ended fund of fund Scheme investing in HSBC Global Investments Fund - Brazil Equity Fund
Abridged Annual Report 2020 - 2021

1
HSBC Brazil Fund
Dear Investor,
The beginning of the last financial year now almost seems like a distant memory. COVID-19 was still a relatively unknown enemy and governments across the world were grappling with ways to control and mitigate the risks associated with it. Nationwide lockdowns were the norm and our markets both equity and fixed income reacted negatively leading to significant erosion of wealth. Within a short period of time markets bounced back. This confounded even the most astute market pundits. How is it possible that when GDP growth had slowed down, unemployment had risen, inflation was high could there be such sharp up move in equity indices. Whilst the reasons are well known about easy global liquidity, demand resurgence, cost cutting by corporates etc. perhaps its most important to remember that the markets are not a reflector but a predictor of economic activity.
At all times particularly during such volatile times it is important to go back to the basics. Why do you save, why do you invest, what goals would you like to achieve, how old are you, what is your risk appetite? The replies to these simple questions will help you determine your asset allocation. As an example when equity markets corrected sharply last year, investors who reviewed their asset allocation, stayed invested during the lows of the past year and were able to capture the rebound and have seen prime returns since then. The current market movement in all likelihood would have also led to some imbalances in your asset allocation. Do not ignore that and I strongly recommend that you do review this with your advisor to check whether re-balancing is required.
During this financial year we had three very successful new fund launches. The pandemic showed us a clear trend of dominant players becoming stronger and profit pool getting consolidated within a few companies. To capture this opportunity, we launched the HSBC Focused Equity Fund which garnered close to Rs. 520 crores. During the second half of 2020, in the fixed income space, 3 - 5 year duration range had a favourable investment scenario as RBI’s accommodative policy and surplus liquidity had reduced the returns at the very short end of the yield curve. There was a demand for an actively managed moderate duration strategy with better credit quality which we fulfilled by launching HSBC Corporate Bond Fund. It garnered over 700 crores. Our latest and first of its kind offering, HSBC Global Equity Climate Change Fund of Fund saw a stupendous response with over 8000 investors investing over Rs. 616 crores. This is an investment opportunity which goes beyond the rationale of simply generating investment returns and is the future of responsible investing.
We worked towards augmenting our digital capabilities by launching a few key enhancements to our online transaction platform. Being mindful of the movement restrictions in place, this year we focused on digitizing offline processes so that an investor need not need step out of her home for investing or availing any key services. While our interactive chatbot AskMe, eased service queries, our end-to-end digital KYC module enabled a first time Mutual Fund investor to invest in our funds without any paperwork. We listened to your feedback and digitized consolidation of folios and change of tax status which eliminated the need for you to physically visit our branches.
I am a strong believer in the India story and this story has just begun. The opportunity to invest in this high growth market is a very exciting opportunity. I do hope you share my enthusiasm and I ask that you continue to invest whilst reviewing your asset allocation at all times. As always thank you for your business. Stay safe.
Warm regards,
Ravi MenonChief Executive Officer,
HSBC Asset Management India

2
Abridged Annual Report 2020 - 2021
SPONSOR
HSBC Securities and Capital Markets (India) Private LimitedRegd. Office: 52/60, Mahatma Gandhi Road, Fort, Mumbai - 400 001.
TRUSTEE
Board of TrusteesOffice: 16, Veer Nariman Road, Fort, Mumbai 400 001.
ASSET MANAGEMENT COMPANY
HSBC Asset Management (India) Private LimitedCorp. & Regd. Office: 16, Veer Nariman Road, Fort, Mumbai 400 001.
CUSTODIAN
Standard Chartered Bank (SCB)Corp. & Regd. Office: Crescenzo, Securities Services, 3rd Floor, C-38/39, G-Block,
Bandra Kurla Complex, Bandra East, Mumbai – 400051.
AUDITORS TO THE SCHEME
BSR & Co. LLPChartered Accountants
5th Floor, Lodha Excelus, Apollo Mills Compound, N. M. Joshi Marg, Mahalaxmi, Mumbai 400 011.
REGISTRAR & TRANSFER AGENTS
Computer Age Management Services Limited (CAMS)Unit: HSBC Mutual Fund ’C’ Block, 2nd Floor, Hanudev Info Park P. Ltd., SF No. 558/2, Udayampalayam Road, Nava India, Coimbatore - 641 028.
BOARD OF TRUSTEES
Ms. Jasmine Batliwalla - Chairperson
Mr. Nani Javeri - Trustee
Dr. T. C. Nair - Trustee
Mr. Pedro Bastos - Trustee
BOARD OF DIRECTORS
Mr. Dinesh Mittal - Director
Dr. Indu Shahani - Director
Mr. Ravi Menon - Director & Chief Executive Officer
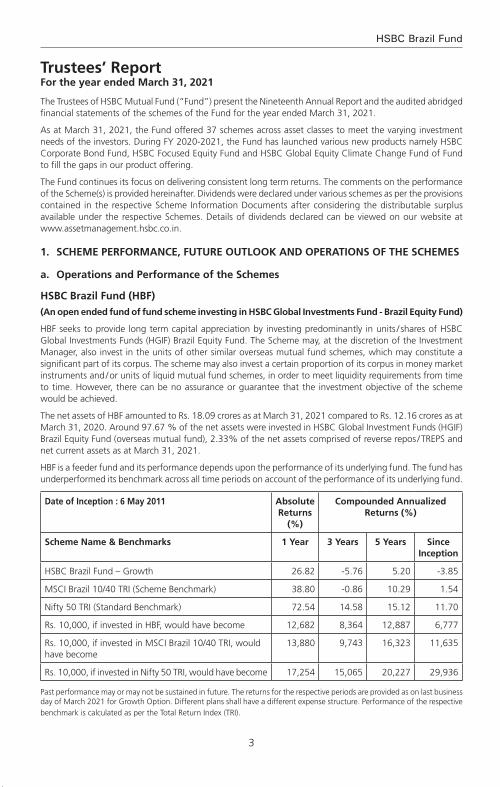
3
HSBC Brazil Fund
The Trustees of HSBC Mutual Fund (“Fund”) present the Nineteenth Annual Report and the audited abridged financial statements of the schemes of the Fund for the year ended March 31, 2021.
As at March 31, 2021, the Fund offered 37 schemes across asset classes to meet the varying investment needs of the investors. During FY 2020-2021, the Fund has launched various new products namely HSBC Corporate Bond Fund, HSBC Focused Equity Fund and HSBC Global Equity Climate Change Fund of Fund to fill the gaps in our product offering.
The Fund continues its focus on delivering consistent long term returns. The comments on the performance of the Scheme(s) is provided hereinafter. Dividends were declared under various schemes as per the provisions contained in the respective Scheme Information Documents after considering the distributable surplus available under the respective Schemes. Details of dividends declared can be viewed on our website at www.assetmanagement.hsbc.co.in.
1. SCHEME PERFORMANCE, FUTURE OUTLOOk AND OPERATIONS OF THE SCHEMES
a. Operations and Performance of the Schemes
HSBC Brazil Fund (HBF)
(An open ended fund of fund scheme investing in HSBC Global Investments Fund - Brazil Equity Fund)
HBF seeks to provide long term capital appreciation by investing predominantly in units / shares of HSBC Global Investments Funds (HGIF) Brazil Equity Fund. The Scheme may, at the discretion of the Investment Manager, also invest in the units of other similar overseas mutual fund schemes, which may constitute a significant part of its corpus. The scheme may also invest a certain proportion of its corpus in money market instruments and / or units of liquid mutual fund schemes, in order to meet liquidity requirements from time to time. However, there can be no assurance or guarantee that the investment objective of the scheme would be achieved.
The net assets of HBF amounted to Rs. 18.09 crores as at March 31, 2021 compared to Rs. 12.16 crores as at March 31, 2020. Around 97.67 % of the net assets were invested in HSBC Global Investment Funds (HGIF) Brazil Equity Fund (overseas mutual fund), 2.33% of the net assets comprised of reverse repos / TREPS and net current assets as at March 31, 2021.
HBF is a feeder fund and its performance depends upon the performance of its underlying fund. The fund has underperformed its benchmark across all time periods on account of the performance of its underlying fund.
Date of Inception : 6 May 2011 Absolute Returns
(%)
Compounded Annualized Returns (%)
Scheme Name & Benchmarks 1 Year 3 Years 5 Years Since Inception
HSBC Brazil Fund – Growth 26.82 -5.76 5.20 -3.85
MSCI Brazil 10/40 TRI (Scheme Benchmark) 38.80 -0.86 10.29 1.54
Nifty 50 TRI (Standard Benchmark) 72.54 14.58 15.12 11.70
Rs. 10,000, if invested in HBF, would have become 12,682 8,364 12,887 6,777
Rs. 10,000, if invested in MSCI Brazil 10/40 TRI, would have become
13,880 9,743 16,323 11,635
Rs. 10,000, if invested in Nifty 50 TRI, would have become 17,254 15,065 20,227 29,936
Past performance may or may not be sustained in future. The returns for the respective periods are provided as on last business day of March 2021 for Growth Option. Different plans shall have a different expense structure. Performance of the respective benchmark is calculated as per the Total Return Index (TRI).
Trustees’ ReportFor the year ended March 31, 2021

4
Abridged Annual Report 2020 - 2021
b. Market Overview & Outlook (as furnished by HSBC Asset Management (India) Private Limited)
EqUITY OUTLOOk
Recap of FY 2020-21:
Fiscal 2020-21 was a rewarding year for equity investors with market indices recording stellar gains from the low base after the COVID correction. Market sentiments steadily improved during the course of the year to deliver positive returns in all four quarters of the year.
We witnessed various legs of market performance during the last fiscal, driven by multiple factors and variables. Initial rebound from the market lows was driven by attractive valuations, then it was on the back of faster than anticipated recovery post lockdown, reopening optimism, swifter than expected vaccine intervention and above all, the unprecedented liquidity. Lastly but importantly, a period of lower cost of capital coupled with low real rates, improved the attractiveness of equity as an asset class, driving the performance.
As a result, the year ended with optimism compared to despair when it began. Corporate India overcame the challenges posed by COVID through significant cost control measures while at the same time showed improvement in their financial position and cash flows.
Commodities also rallied from the lows of the COVID crisis with global crude oil prices surging by 179% during the year. INR appreciated by 3.3% (as India recorded strong net FPI inflows) during the year. MSCI India index outperformed most of key global indices during the past fiscal. MSCI India index (USD) gained 74.8% as compared to 51.8% for MSCI World, 50.5% for Dow Jones, 55.1% for MSCI Emerging Markets, 41.2% for MSCI China and 42% for MSCI Europe*.
At a record USD 37.3 bn of net FPI inflows during the fiscal, the tally was higher than the cumulative net inflows India received from the previous 6 years. DIIs on the other hand saw net outflows of USD 18.4 bn and this was the first fiscal year of net outflows from the segment in 5 years. The net outflows from the segment was driven by USD 16.7 bn of outflows from the MFs while domestic insurers saw a far lower outflow of USD 1.6 bn*.
Indices Returns (April 1, 2020 to March 31, 2021) 1 Year^
S&P BSE Sensex TR 69.8%
NSE CNX Nifty TR 72.5%
S&P BSE 100 TR 73.5%
S&P BSE 200 TR 76.3%
S&P BSE 500 TR 78.6%
S&P BSE Midcap TR 93.0%
S&P BSE 250 Small-cap TR 117.5%
^Source: Bloomberg (Above table values are for total return indices)
Way forward:
Beginning of the new fiscal, India had to contend with the risk of the second COVID wave, which was more ferocious than the first wave on the human impact. However, as we write this, the second wave has already peaked and there have been a significant fall in number of active cases, case-positivity rate, daily new caseload and deaths. Vaccination drive also has seen acceleration with and is now closer to 6 mn doses per day mark. Also, the impact of the lockdown on economic activity has been significantly lower during the second wave, compared to last year. In most of the states, the unlocking process has already begun in a phased manner and this is leading to improvement in various activity indicators. Mobility indicators are recovering faster while economic indicators (freight, credit off-take, E-way bill generation, power demand etc.) are also witnessing a gradual recovery. The recently concluded earnings season has turned out to be in-line with expectations and despite the concerns of around the second wave, the earnings (Nifty) have seen upgrades for FY22. Market is looking beyond the current quarter (i.e. 1QFY22), which would witness an impact due to the second wave. Our baseline assumption is that of a temporary impact from the second
Trustees’ ReportFor the year ended March 31, 2021 (Contd...)
5
HSBC Brazil Fund
wave and the set-back to the recovery process limited to a few months, after which we should see the economic rebound. So far, this is tracking in-line with assumptions.
From a macro perspective, the current estimates for GDP growth in FY22 stand at 9.2%* (after seeing downgrades to factor in the impact of second wave). The downgrade in estimates are pertaining to the first quarter and hence the trajectory of growth from hereon should pick up. The tax collections data for the first two months of FY22 has remained strong, implying that the drawdown of the second wave on the fiscal position is not alarming. Additionally, the impact of fiscal stimulus package announced in FY22 so far is manageable (about 60 bps of GDP) and hence would not lead to any fiscal strain.
After the spectacular rally, market valuations at an overall level are now trending above historical averages on traditional valuation metrics (P/E, P/B). This is true for all market capitalization categories (viz large, mid and small). Typically, the broader market (i.e. mid and small cap segments), trade at a discount to large caps, however this scenario has now reversed after the outperformance from the broader market segments. However, the earnings momentum continues to remain strong (witnessing upgrades so far) and except for a short period due to second wave, the earnings momentum should hold up.
We believe that the risk-reward is balanced for the equity markets in the near term. Higher or sticky inflation expectations globally, higher than historical market valuations on some parameters (i.e. P/E, P/B) and adverse demand impact from the second wave are risk factors to contend with in the near term. However, these are counter balanced by positive commentary from companies, significant decline in COVID cases and acceleration in the vaccination programme. As a result, in the near term markets may see a consolidation phase and could take cues from the upcoming earnings season with more focus on the corporate commentary and the outlook. From a medium to long term perspective, the outlook for equity markets remains positive. The expectation of cyclical revival in the economy brings in a multi-year earnings visibility. This along with a benign cost of capital environment, should support equity performance. However, equity returns are likely to moderate on the back of the relatively high valuations and the strong recovery we have already witnessed from the COVID lows. Equity performance is likely to mirror the earnings growth trends over the medium to long term.
Pace of vaccination, concerns about a third wave, corporate earnings trajectory, inflation trends (both global & domestic), monsoon trends and commodity prices (especially crude oil) are some of the key factors which could influence market performance in the short term.
From a portfolio perspective, we are maintaining a pro-cyclical bias. We expect earnings growth to rebound sharply post the current COVID phase. Earnings growth are expected to sustain in high-teens beyond FY22 on the back of economy witnessing a cyclical recovery due to revival in capex cycle over the next 2-3 years (first by the government followed by private capex). From a sectoral perspective our order of preference is rate sensitives followed by domestic cyclicals, exporters and domestic consumption. Predominantly regulated businesses come last in our pecking order. This preference is dictated by our assessment of sectors / segments leading contribution to the market earnings growth over the next 2-3 years. Our portfolio construction is driven by a bottom up approach to stock selection with a focus on names that can deliver positive earnings surprises. We continue to focus on this theme to identify likely outperformers.
*Source: Bloomberg
DEBT OUTLOOk
Market drivers during the course of the year FY21
The Fixed Income markets started the year with a bout of nervousness that was triggered by the pandemic. While RBI had calmed the markets with its large rate cut action of 75bp cut followed by liquidity supportive measures, the volatility continued until mid-May when government announced its relief package. While it was not fiscally expansive, it touched the right cords in terms of credit flow to desired sectors. This was followed up with RBI’s credit relief measures in terms of moratorium and restructuring of assets that were stressed due to the pandemic. Throughout the course of the year, RBI maintained its accommodative stance along with significant amount of surplus liquidity that was supportive and helped in maintaining stability in the market. However, as the year progressed and pressure on fiscal began to mount yields started seeing a spike towards the last quarter of the fiscal. While borrowing was stepped up to INR 12 trillion from previously budgeted INR 7.8 trillion in May 2020, it was further enhanced by and additional INR 1.1 trillion in October 2020.
Trustees’ ReportFor the year ended March 31, 2021 (Contd...)
6
Abridged Annual Report 2020 - 2021
Overall GOI ended up borrowing a record amount of INR 13.9 trillion. The budget proved to be a shocker with GOI using the pandemic as an opportunity for setting the finances in order. GOI showed a record deficit of 9.5% for FY21 and projected a 6.8% for FY22 with estimated central government gross borrowing of INR 12 trillion. This seemed to reverse the support RBI had provided throughout the year with benchmark 10-year bond peaking to 6.23% in mid –Feb 2021. RBI’s statements to remain supportive were left in the sidelines. Overall it seemed that the 115bp of rate cut, along with significant liquidity infusion (OMO + Twist operations of ~INR 3 trillion, infusion via dollar purchases) seemed only a little to help in applying a brake to the one-way spike in yields. The year closed ~6.16% with absence of concrete action by RBI.
RBI Policy: Through the course of the year, RBI has maintained an accommodative stance, with an aggregate 115bp of rate cut done in March and May 2020 taking the repo rate from 5.15% to 4%. Subsequently while inflation pressures prevented RBI from taking any direct actions, RBI has used a combination of creative tools to keep the rates contained primarily via liquidity supportive tools such as OMOs, Twist Operations, Repo linked Term loans to needy sectors (LTROs, TLTROs), CRR cuts. While inflation was a worry for most part of the year, RBI kept it aside admitting that growth was a priority and inflation effects are more supply side rather than demand side. Prospectively into FY22, with the onset of the second wave, RBI continues to maintain the stance to prioritize growth.
Inflation: Inflation for most part of the year stayed above 6% primarily driven by supply side pressures and some intermittent spike from food inflation as well. While it has been coming off since December with cooling off of food inflation and positive base effects, it has been between 4- 5.5%. Structurally however inflation risks continue to remain as oil prices have increased and base effects will not remain supportive for long. Core inflation continues to remain sticky.
Liquidity: During the year, system liquidity has remained at significant surplus facilitated largely by RBI action such as OMOs, foreign exchange operations and government spending.
Budget: The FY2022 union budget focuses on growth and has accordingly, presented a 9.5% fiscal deficit for FY21 and 6.8% for FY22. On the revenue side, the assumptions are largely realistic, with FY22 (E) Nominal GDP growth at 14.4% and tax revenue growth at 17% considering the pandemic impact in FY 21. Compared to FY20, tax revenue growth is ~10%. While non-tax revenues are ambitious pegging the divestment at INR 1.75 trillion, with robust pipeline of assets including monetization of road and transmission assets, execution remains the key as in the past. On the expenditure side, better quality capex spending with focusing on rail, road, defense, urban infra is positive for long term structural growth. The revenue side expenditure adjusting for clearance of past subsidy arrears will be similar to budgetary estimates. Government using this opportunity to bring back off-balance sheet spending to on-balance sheet was a welcome move towards transparency and showing realistic projections. Alongside, states have also been given leeway to borrow upto 4% of their GDP with an additional 0.5% subject to conditions. Given that states are an important vehicle for capex investment, this move is welcome although it may entail additional state borrowing. The fiscal glide path is shifted to FY26 at below 4.5% for center and 3% for states suggesting that spending will continue and borrowing will come down gradually. In summary, from survival to revival, FY22 budget aims for structural growth leaving fiscal concerns sideways in the interim. Government’s intent seems clear on bringing back growth on the table, in a transparent manner.
While the second wave of the pandemic has once again derailed the revenue story, government will still have some cushion from its conservative estimates.
Currency and FII Flows: INR has been on an appreciation trajectory for most part of the year, aided by dollar underperformance supported by positive FII and FDI flows along with reduced imports on the domestic front as well. RBI has used most of the flows to accumulate reserves which has prevented any strong appreciation. Pandemic shock and global risk off led rupee over 75 in the beginning of the year only to close below 72 at the end of the fiscal year. While the second wave led to another spike in INR in April, it has since then cooled once again driven by dollar underperformance and pandemic recovery on the domestic front. Net FII flows was ~$30 bn with positive equity flows of~$37 bn while debt was negative ~$7bn and overall RBI’s forex reserves rose by a ~$100 bn to close ~$537 bn.
Credit growth: Credit growth for the entire year has been tepid as previous year’s credit events were followed by nervousness relating to the pandemic. Despite RBI opening up several windows to finance the non-AAA segment, there was very little fresh credit flowing that segment. Overall banking credit grew by only 6.5%. Risk appetite has however been improving from a complete risk aversion to opening up towards
Trustees’ ReportFor the year ended March 31, 2021 (Contd...)
7
HSBC Brazil Fund
a calculated risk. Prospectively it is expected that once the pandemic risk abates, credit growth will resume primarily driven by government capex spending and demand recovery.
Market Outlook
The pandemic once again brought the country to a situation similar to last year and debt markets perhaps interpreted the same as a structural rise in rates. In the initial day’s post budget in Feb of 2021, market was expecting a concrete set of actions such as an OMO calendar from RBI, and RBI’s words alone failed to calm the market. The first auction of the fiscal year also saw a devolvement. However, RBI acted in the first policy of the year announcing a bond buyback program akin to QE (quantitative easing) and its subsequent cancellation of auctions wherein yields were perhaps quoted higher than RBI’s comfort levels brought back confidence into the market. Since then we have seen a strong rally with 10-year benchmark trending below 6% and the curve moving alongside. RBI reiteration of priority of growth and also supporting with higher than expected dividend payment stand out as a testimony of its support. While we do not expect RBI to act in terms of rate cuts, we believe that measures such as G-SAP, OMOs will continue until there is visibility of a structural growth. Therefore, the large borrowing program should go without any hiccups.
Furthermore, with the evidence of strong GST numbers until April 2021 (before the 2nd wave), it is expected that growth and therefore fiscal revenues will come back. Government’s conservative budget estimates are supportive. Also, given the fact that compared to last year there has not been a complete shutdown of activity (lockdowns being distributed), the impact on growth will not be similar to last year. Pent up demand will come back to support revenue collection. However, on the flipside, once growth resumes RBI will be forced to withdraw liquidity in a phased manner to prevent asset bubbles. Nevertheless, RBI need not act in terms of rate actions and we believe that a prolonged pause in terms of RBI rates is in the offing.
Net-net therefore while growth is wanting no matter what, it may come at a small price of rise in yields with liquidity withdrawal. That is however expected more in the 2nd half of the year. Lower than expected borrowing numbers, later this year or if not in next year could be a surprise. We may therefore see a range bound rate action in the near term with a rising bias over time. Global rate environment, oil and currency risks are to be watched out for.
2. BRIEF BACkGROUND OF SPONSORS, BOARD OF TRUSTEES AND ASSET MANAGEMENT COMPANY
a. Sponsor
HSBC Mutual Fund is sponsored by HSBC Securities and Capital Markets (India) Private Limited (HSCI). The Sponsor is the Settler of the Mutual Fund Trust. The Sponsor has entrusted a sum of Rs. 1,00,000/- (Rupees One Lakh only) to the Trustee as the initial contribution towards the corpus of the Mutual Fund.
HSCI offers integrated investment banking services, securities and corporate finance & advisory. HSCI is a member of the Bombay Stock Exchange Limited and National Stock Exchange (capital and derivative market segments). HSCI holds 100% of the paid up equity share capital of HSBC Asset Management (India) Private Limited.
b. HSBC Mutual Fund
HSBC Mutual Fund (“the Mutual Fund” or “the Fund”) has been constituted as a Trust in accordance with the provisions of the Indian Trusts Act, 1882 (2 of 1882) vide a Trust Deed dated February 7, 2002 with HSBC Securities and Capital Markets (India) Private Limited, as the Sponsor and the Board of Individual Trustees. The Trustee has entered into an Investment Management Agreement dated February 7, 2002 with HSBC Asset Management (India) Private Limited (AMC) to function as the Investment Manager for all the schemes of the Fund. The Fund was registered with SEBI vide registration number MF/046/02/5 dated May 27, 2002.
The Trust has been formed for the purpose of pooling of capital from the public for collective investment in securities for the purpose of providing facilities for participation by persons as beneficiaries in such investments and in the profits/income arising therefrom.
c. Board of Trustees (the Trustees)
The Board of Trustees is the exclusive owner of the Trust Fund and holds the same in trust for the benefit of the unit holders. The Trustees have been discharging their duties and carrying out the responsibilities
Trustees’ ReportFor the year ended March 31, 2021 (Contd...)
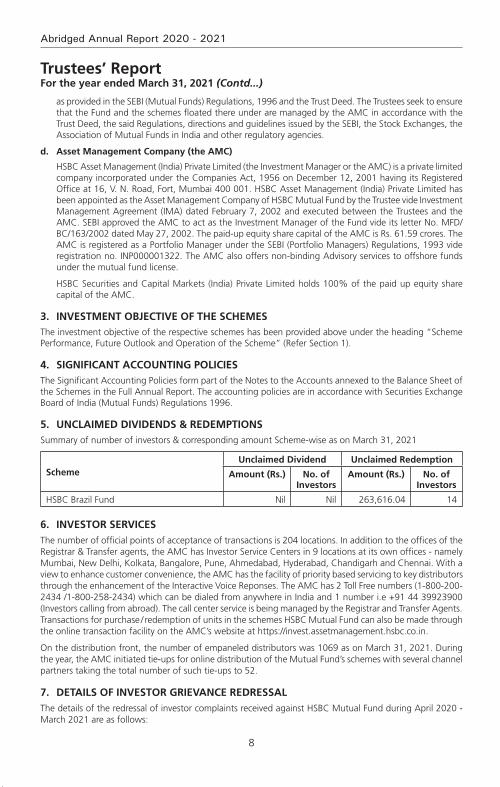
8
Abridged Annual Report 2020 - 2021
as provided in the SEBI (Mutual Funds) Regulations, 1996 and the Trust Deed. The Trustees seek to ensure that the Fund and the schemes floated there under are managed by the AMC in accordance with the Trust Deed, the said Regulations, directions and guidelines issued by the SEBI, the Stock Exchanges, the Association of Mutual Funds in India and other regulatory agencies.
d. Asset Management Company (the AMC)
HSBC Asset Management (India) Private Limited (the Investment Manager or the AMC) is a private limited company incorporated under the Companies Act, 1956 on December 12, 2001 having its Registered Office at 16, V. N. Road, Fort, Mumbai 400 001. HSBC Asset Management (India) Private Limited has been appointed as the Asset Management Company of HSBC Mutual Fund by the Trustee vide Investment Management Agreement (IMA) dated February 7, 2002 and executed between the Trustees and the AMC. SEBI approved the AMC to act as the Investment Manager of the Fund vide its letter No. MFD/BC/163/2002 dated May 27, 2002. The paid-up equity share capital of the AMC is Rs. 61.59 crores. The AMC is registered as a Portfolio Manager under the SEBI (Portfolio Managers) Regulations, 1993 vide registration no. INP000001322. The AMC also offers non-binding Advisory services to offshore funds under the mutual fund license.
HSBC Securities and Capital Markets (India) Private Limited holds 100% of the paid up equity share capital of the AMC.
3. INvESTMENT OBJECTIvE OF THE SCHEMESThe investment objective of the respective schemes has been provided above under the heading “Scheme Performance, Future Outlook and Operation of the Scheme” (Refer Section 1).
4. SIGNIFICANT ACCOUNTING POLICIES The Significant Accounting Policies form part of the Notes to the Accounts annexed to the Balance Sheet of the Schemes in the Full Annual Report. The accounting policies are in accordance with Securities Exchange Board of India (Mutual Funds) Regulations 1996.
5. UNCLAIMED DIvIDENDS & REDEMPTIONSSummary of number of investors & corresponding amount Scheme-wise as on March 31, 2021
SchemeUnclaimed Dividend Unclaimed Redemption
Amount (Rs.) No. of Investors
Amount (Rs.) No. of Investors
HSBC Brazil Fund Nil Nil 263,616.04 14
6. INvESTOR SERvICESThe number of official points of acceptance of transactions is 204 locations. In addition to the offices of the Registrar & Transfer agents, the AMC has Investor Service Centers in 9 locations at its own offices - namely Mumbai, New Delhi, Kolkata, Bangalore, Pune, Ahmedabad, Hyderabad, Chandigarh and Chennai. With a view to enhance customer convenience, the AMC has the facility of priority based servicing to key distributors through the enhancement of the Interactive Voice Reponses. The AMC has 2 Toll Free numbers (1-800-200-2434 /1-800-258-2434) which can be dialed from anywhere in India and 1 number i.e +91 44 39923900 (Investors calling from abroad). The call center service is being managed by the Registrar and Transfer Agents. Transactions for purchase / redemption of units in the schemes HSBC Mutual Fund can also be made through the online transaction facility on the AMC’s website at https://invest.assetmanagement.hsbc.co.in.
On the distribution front, the number of empaneled distributors was 1069 as on March 31, 2021. During the year, the AMC initiated tie-ups for online distribution of the Mutual Fund’s schemes with several channel partners taking the total number of such tie-ups to 52.
7. DETAILS OF INvESTOR GRIEvANCE REDRESSALThe details of the redressal of investor complaints received against HSBC Mutual Fund during April 2020 - March 2021 are as follows:
Trustees’ ReportFor the year ended March 31, 2021 (Contd...)
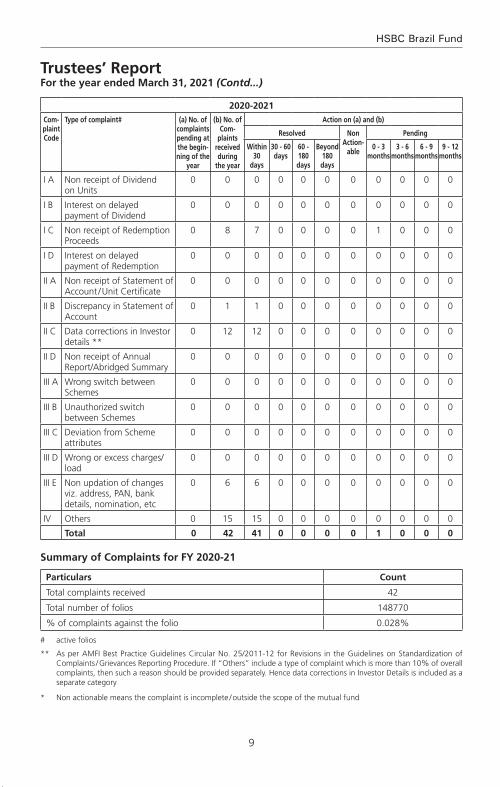
9
HSBC Brazil Fund
Trustees’ ReportFor the year ended March 31, 2021 (Contd...)
2020-2021
Com-plaint Code
Type of complaint# (a) No. of complaints pending at the begin-ning of the
year
(b) No. of Com-
plaints received during
the year
Action on (a) and (b)
Resolved Non Action-
able
Pending
Within 30
days
30 - 60 days
60 - 180 days
Beyond 180 days
0 - 3 months
3 - 6 months
6 - 9 months
9 - 12 months
I A Non receipt of Dividend on Units
0 0 0 0 0 0 0 0 0 0 0
I B Interest on delayed payment of Dividend
0 0 0 0 0 0 0 0 0 0 0
I C Non receipt of Redemption Proceeds
0 8 7 0 0 0 0 1 0 0 0
I D Interest on delayed payment of Redemption
0 0 0 0 0 0 0 0 0 0 0
II A Non receipt of Statement of Account / Unit Certificate
0 0 0 0 0 0 0 0 0 0 0
II B Discrepancy in Statement of Account
0 1 1 0 0 0 0 0 0 0 0
II C Data corrections in Investor details **
0 12 12 0 0 0 0 0 0 0 0
II D Non receipt of Annual Report/Abridged Summary
0 0 0 0 0 0 0 0 0 0 0
III A Wrong switch between Schemes
0 0 0 0 0 0 0 0 0 0 0
III B Unauthorized switch between Schemes
0 0 0 0 0 0 0 0 0 0 0
III C Deviation from Scheme attributes
0 0 0 0 0 0 0 0 0 0 0
III D Wrong or excess charges/load
0 0 0 0 0 0 0 0 0 0 0
III E Non updation of changes viz. address, PAN, bank details, nomination, etc
0 6 6 0 0 0 0 0 0 0 0
IV Others 0 15 15 0 0 0 0 0 0 0 0
Total 0 42 41 0 0 0 0 1 0 0 0
Summary of Complaints for FY 2020-21
Particulars Count
Total complaints received 42
Total number of folios 148770
% of complaints against the folio 0.028%
# active folios
** As per AMFI Best Practice Guidelines Circular No. 25/2011-12 for Revisions in the Guidelines on Standardization of Complaints / Grievances Reporting Procedure. If “Others” include a type of complaint which is more than 10% of overall complaints, then such a reason should be provided separately. Hence data corrections in Investor Details is included as a separate category
* Non actionable means the complaint is incomplete / outside the scope of the mutual fund

10
Abridged Annual Report 2020 - 2021
Trustees’ ReportFor the year ended March 31, 2021 (Contd...)
8. INvESTOR EDUCATION INITIATIvES Investor awareness advertisements were published in Mutual Fund Insight magazine on a monthly basis along with an editorial on ‘SIP Sahi Hai’. Additionally, monthly articles / blogs have been written by Advisorkhoj on IAP which talks of the advantages of SIP, start early, power of compounding, diversification, asset allocation etc. The same is promoted by the publisher via an email to their entire network and also on their social media handles which can be retweeted or liked. Also, educative infographics have been hosted on our website under the investor resources section. The same have also been circulated to existing Indian investors via email for engagement and for educative purposes.
9. PROxY vOTING POLICYIn terms of SEBI Circular no. SEBI/IMD/CIR No. 18/198647/2010 dated March 15, 2010, the Fund has adopted Proxy Voting Policy and Procedures for exercising voting rights in respect of securities held by the Schemes.
The summary of the votes casted in the general meetings of the Investee companies, by the AMC for and on behalf of the Schemes of the Fund, for the financial year 2020-2021 is provided below:
quarter Total no. of resolutions
Break-up of vote decision
For Against Abstained
June 2020 50 43 6 1
September 2020 752 656 38 58
December 2020 41 31 1 9
March 2021 40 30 8 2
Total 883 760 53 70
In terms of the requirement of SEBI Circular no. CIR/IMD/DF/05/2014 dated March 24, 2014 and SEBI/HO/IMD/DF2/CIR/P/2016/68 dated August 10, 2016; the AMC has obtained certificate from M/s. M. P. Chitale & Co., Chartered Accountants, who is acting as a Scrutinizer, on the voting report for the FY 2020-21. The certificate dated April 14, 2021 issued by M/s. M. P. Chitale & Co., is available on the website of the AMC as part of the full Annual Report.
Unit holders can refer to the full Annual Report for complete details of actual exercise of votes in the general meetings of the investee companies for the financial year 2020-21 or log on to our website at www.assetmanagement.hsbc.co.in.
10. STATUTORY DETAILSa) The Sponsors are not responsible or liable for any loss resulting from the operation of the Schemes of
the Fund beyond initial contribution of Rs. 1 lakh for setting up the Fund.
b) The price and redemption value of the units, and income from them, can go up as well as down with fluctuations in the market value of its underlying investments.
c) Full Annual Report of HSBC Mutual Fund and of HSBC Asset Management (India) Private Limited (the AMC) shall be disclosed on the website at www.assetmanagement.hsbc.co.in and shall be available for inspection at the Head Office of the Mutual Fund. Present and prospective unit holders can obtain copy of the Trust Deed, the full Annual Report of the Scheme(s), the Annual Report of HSBC Asset Management (India) Private Limited and the text of the relevant Scheme(s) at a price.
11. SCHEME WISE CHANGES IN RISk-O-METER OF THE SCHEMES OF HSBC MUTUAL FUND DURING FY 2021
As per the requirements of SEBI Circular no. SEBI/HO/IMD/DF3/CIR/P/2020/197 dated October 05, 2020 the changes carried out in the risk-o-meter of the schemes of HSBC Mutual Fund during FY 2021 have been given in the below mentioned table for the information of the Unitholders, a report on the said changes has also been displayed on the website of the Fund and AMFI.

11
HSBC Brazil Fund
Trustees’ ReportFor the year ended March 31, 2021 (Contd...)
Scheme Name
Risk-o-meter level as on December
31,2020^
Risk-o-meter level at end of
the financial year
Number of changes in Risk-o-meter during the
financial year^
Dec-2020 Mar-2021 Dec 2020 to March 2021
HSBC Brazil Fund Very High Very High 0
^From the effective date (i.e. January 01, 2021) of SEBI circular no. SEBI/HO/IMD/DF3/CIR/P/2020/197 dated October 05, 2020.
12. GOvERNANCE UNDER THE POLICY ON STEWARDSHIP RESPONSIBILITIES OF HSBC MUTUAL FUND
As per the requirements of SEBI Circular no. CIR/CFD/CMD1/ 168 /2019 dated December 24, 2019, HSBC Mutual Fund has adapted the policy on stewardship responsibilities, the unitholders are requested to note the status of governance with the same as mentioned below:
S. No.
Particulars of Principles of Stewardship Code
Status of compliance (Complied/
Not Complied)
Description Remarks/reasons for
deviation/non - compliance,
if any
1 Principle 1:
Institutional Investors should formulate a comprehensive policy on the discharge of their stewardship responsibilities, publicly disclose it, review and update it periodically.
Complied HSBC Asset Management (India) Private Limited's (AMIN) 'Policy on Stewardship responsibilities' (Stewardship Code / Policy) was formulated and implemented on 01 July, 2020. This is a comprehensive document which has been publicly disclosed on the website of AMIN. The same shall follow a periodic review.
N.A.
2 Principle 2:
Inst i tut ional investors should have a clear policy on how they manage conflicts of interest in fulfilling their stewardship responsibilities and publicly disclose it.
Complied Defining and managing Conflict of Interest in fulfilling stewardship responsibilities are detailed in the Stewardship Policy document. The policy document is publicly disclosed.
N.A.
3 Principle 3:
Institutional investors should monitor their investee companies.
Complied AMIN monitors all investee companies through its investment process. This includes assessment of companies’ own and market data, consideration of research from brokers and other independent research providers – including ESG & voting research, attending individual & group meetings with company management and directors, visiting production sites (wherever necessary), engaging with key stakeholders including competitors and customers, and financial modelling. More details enumerated in the policy document
N.A.

12
Abridged Annual Report 2020 - 2021
S. No.
Particulars of Principles of Stewardship Code
Status of compliance (Complied/
Not Complied)
Description Remarks/reasons for
deviation/non - compliance,
if any
4 Principle 4:Inst i tut ional investors should have a clear policy on intervention in their investee companies. Institutional investors should also have a clear policy for collaboration with other institutional investors where required, to preserve the interests of the ultimate investors, which should be disclosed.
Complied Details of undertaking active engagement with investee companies and the policy for collaboration with other institutional holders are detailed in the policy document. The policy document is publicly disclosed.
N.A.
5 Principle 5:
Inst i tut ional investors should have a clear policy on voting and disclosure of voting activity.
Complied AMIN has a clear and detailed voting policy which provides the framework for the voting decisions. All voting decisions shall be in accordance with AMIN’s Voting Policy and Procedures, which is disclosed on the website. AMIN discloses the details of the voting on its website on a quarterly basis within 10 working days from the end of the quarter. Additionally, AMIN also discloses the details of the votes cast, in the annual report of the schemes of HSBC Mutual Fund.
N.A.
6 Principle 6:Institutional investors should report periodically on their stewardship activities.
Complied The annual status report of the stewardship code and quarterly report on proxy voting are publicly disclosed on the website as required under SEBI Regulations.
N.A.
13. SIGNIFICANT EvENT AFTER THE END OF THE FINANCIAL YEAR
HSBC Global Consumer Opportunities Fund (HGCOF) has been merged with HSBC Asia Pacific (Ex Japan) Dividend Yield Fund with effect from May 13, 2021. Therefore, HGCOF has been ceased to exist from the aforesaid date.
14. ACkNOWLEDGEMENTS
The Trustees wish to thank the Unit holders of the Schemes for their support throughout the year and also thank the Government of India, the Securities and Exchange Board of India (SEBI), the Reserve Bank of India (RBI) and the Association of Mutual Funds in India (AMFI) for the guidance provided by them. The Trustees also appreciate the services provided by the Registrar and Transfer Agent, Fund Accountant, Custodian, Bankers, Distributors and Brokers. The guidance and services provided by the Auditors and advocates and the ebullience, sincerity and dedication of the employees of HSBC Asset Management (India) Private Limited is also appreciated.
The Trustees look forward to the continued support of everyone.
For and on behalf of the Board of Trustees of HSBC Mutual Fund
Sd/-
Trustee
MumbaiJuly 20, 2021.
Trustees’ ReportFor the year ended March 31, 2021 (Contd...)
13
HSBC Brazil Fund
To the Trustees of HSBC Mutual Fund
HSBC Brazil Fund
Report on the Audit of the Financial Statements
OpinionWe have audited the financial statements of HSBC Brazil Fund (the ‘Scheme’) of HSBC Mutual Fund, which comprise the balance sheet as at 31 March 2021 and the revenue account for the year then ended, and notes to the financial statements, including a summary of the significant accounting policies.
In our opinion and to the best of our information and according to the explanations given to us, the aforesaid financial statements give a true and fair view in conformity with the accounting principles generally accepted in India, of the state of affairs of the Scheme as at 31 March 2021, its net surplus for the year ended on that date.
Basis for OpinionWe conducted our audit in accordance with the Standards on Auditing (‘SAs’) issued by the Institute of Chartered Accountants of India (the ‘ICAI’). Our responsibilities under those SAs are further described in the Auditor’s Responsibilities for the Audit of the Financial Statements section of our report. We are independent of the Scheme in accordance with the Code of Ethics issued by the ICAI, and we have fulfilled our other ethical responsibilities in accordance with the Code of Ethics. We believe that the audit evidence we have obtained is sufficient and appropriate to provide a basis for our opinion.
Responsibilities of Management and Those Charged with Governance for the Financial StatementsThe Scheme’s management, the Board of Directors of HSBC Mutual Fund (the ‘Trustees’) and the Board of Directors of HSBC Asset Management (India) Private Limited (the ‘AMC’) (collectively referred to as ‘Management’) are responsible for the preparation of these financial statements that give a true and fair view of the state of affairs, results of operations of the Scheme in accordance with the accounting policies and standards specified in the Ninth Schedule of the Securities and Exchange Board of India (Mutual Funds) Regulations, 1996, as amended (the ‘Regulations’) and the accounting principles generally accepted in India. This responsibility includes design, implementation and maintenance of internal control relevant to the preparation and presentation of the financial statements that give a true and fair view and are free from material misstatement, whether due to fraud or error.
In preparing the financial statements, management is responsible for assessing the Scheme’s ability to continue as a going concern, disclosing, as applicable, matters related to going concern and using the going concern basis of accounting unless management either intends to liquidate the Scheme or to cease operations, or has no realistic alternative but to do so.
The management is responsible for overseeing the Scheme’s financial reporting process.
Auditor’s Responsibilities for the Audit of the Financial StatementsOur objectives are to obtain reasonable assurance about whether the financial statements as a whole are free from material misstatement, whether due to fraud or error, and to issue an auditor’s report that includes our opinion. Reasonable assurance is a high level of assurance, but is not a guarantee that an audit conducted in accordance with SAs will always detect a material misstatement when it exists. Misstatements can arise from fraud or error and are considered material if, individually or in the aggregate, they could reasonably be expected to influence the economic decisions of users taken on the basis of these financial statements.
As part of an audit in accordance with SAs, we exercise professional judgment and maintain professional skepticism throughout the audit. We also:
• Identifyandassesstherisksofmaterialmisstatementofthefinancialstatements,whetherduetofraudor error, design and perform audit procedures responsive to those risks, and obtain audit evidence that is sufficient and appropriate to provide a basis for our opinion. The risk of not detecting a material misstatement resulting from fraud is higher than for one resulting from error, as fraud may involve collusion, forgery, intentional omissions, misrepresentations, or the override of internal control;
Independent Auditors’ Report
14
Abridged Annual Report 2020 - 2021
Independent Auditors’ Report (Contd...)
• Obtainanunderstandingofinternalcontrolrelevanttotheauditinordertodesignauditproceduresthat are appropriate in the circumstances, but not for the purpose of expressing an opinion on the effectiveness of the Scheme’s internal controls;
• Evaluatetheappropriatenessofaccountingpoliciesusedandthereasonablenessofaccountingestimatesand related disclosures made by Management;
• ConcludeontheappropriatenessofManagement’suseofthegoingconcernbasisofaccountingand,based on the audit evidence obtained, whether a material uncertainty exists related to events or conditions that may cast significant doubt on the Scheme’s ability to continue as a going concern. If we conclude that a material uncertainty exists, we are required to draw attention in our auditor’s report to the related disclosures in the financial statements or, if such disclosures are inadequate, to modify our opinion. Our conclusions are based on the audit evidence obtained up to the date of our auditor’s report. However, future events or conditions may cause the Scheme to cease to continue as a going concern;
• Evaluate the overall presentation, structure and content of the financial statements, including thedisclosures and whether the financial statements represent the underlying transactions and events in a manner that achieves fair presentation.
We communicate with those charged with governance regarding, among other matters, the planned scope and timing of the audit and significant audit findings, including any significant deficiencies in internal control that we identify during our audit.
We also provide those charged with governance with a statement that we have complied with relevant ethical requirements regarding independence, and to communicate with them all relationships and other matters that may reasonably be thought to bear on our independence, and where applicable, related safeguards.
Report on Other Legal and Regulatory Requirements 1 As required by Regulation 55 (4) of the Regulations, we report that:
(a) We have obtained all information and explanations which, to the best of our knowledge and belief, were necessary for the purposes of the audit; and
(b) The balance sheet and the revenue account have been prepared in accordance with the accounting policies and standards as specified in the Ninth Schedule of the Regulations.
2 As required by Clause 5 (ii) (2) of the Eleventh Schedule of the Regulations, we report that the balance sheet and the revenue account are in agreement with the books of account of the Scheme.
For B S R & Co. LLP Chartered Accountants Firm’s Registration No: 101248W/W-100022
Sd/-
Ajit Viswanath PartnerMembership No: 067114UDIN : 21067114AAAADT4387
Place : Mumbai Date : July 20, 2021.
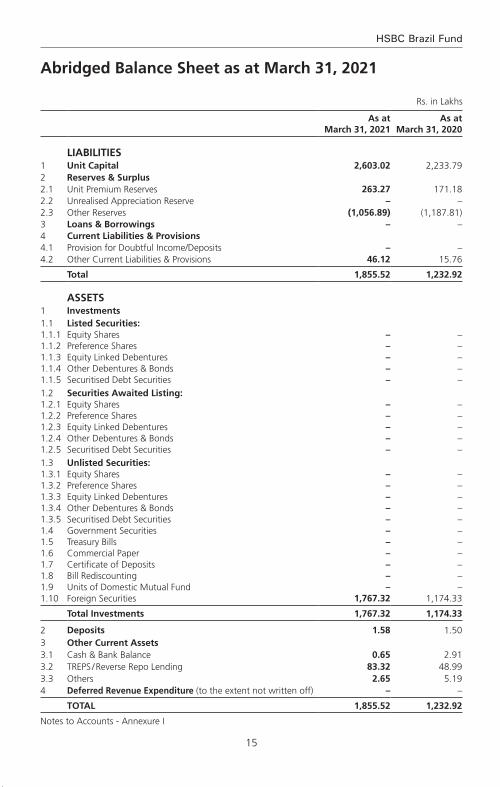
15
HSBC Brazil Fund
Rs. in Lakhs
As at March 31, 2021
As at March 31, 2020
LIABILITIES1 Unit Capital 2,603.02 2,233.79 2 Reserves & Surplus2.1 Unit Premium Reserves 263.27 171.18 2.2 Unrealised Appreciation Reserve – –2.3 Other Reserves (1,056.89) (1,187.81)3 Loans & Borrowings – –4 Current Liabilities & Provisions4.1 Provision for Doubtful Income/Deposits – –4.2 Other Current Liabilities & Provisions 46.12 15.76
Total 1,855.52 1,232.92
ASSETS1 Investments1.1 Listed Securities:1.1.1 Equity Shares – – 1.1.2 Preference Shares – – 1.1.3 Equity Linked Debentures – – 1.1.4 Other Debentures & Bonds – – 1.1.5 Securitised Debt Securities – –
1.2 Securities Awaited Listing:1.2.1 Equity Shares – – 1.2.2 Preference Shares – – 1.2.3 Equity Linked Debentures – – 1.2.4 Other Debentures & Bonds – – 1.2.5 Securitised Debt Securities – –
1.3 Unlisted Securities:1.3.1 Equity Shares – – 1.3.2 Preference Shares – – 1.3.3 Equity Linked Debentures – – 1.3.4 Other Debentures & Bonds – – 1.3.5 Securitised Debt Securities – – 1.4 Government Securities – – 1.5 Treasury Bills – – 1.6 Commercial Paper – – 1.7 Certificate of Deposits – – 1.8 Bill Rediscounting – – 1.9 Units of Domestic Mutual Fund – – 1.10 Foreign Securities 1,767.32 1,174.33
Total Investments 1,767.32 1,174.33
2 Deposits 1.58 1.50 3 Other Current Assets3.1 Cash & Bank Balance 0.65 2.91 3.2 TREPS / Reverse Repo Lending 83.32 48.99 3.3 Others 2.65 5.19 4 Deferred Revenue Expenditure (to the extent not written off) – –
TOTAL 1,855.52 1,232.92
Notes to Accounts - Annexure I
Abridged Balance Sheet as at March 31, 2021
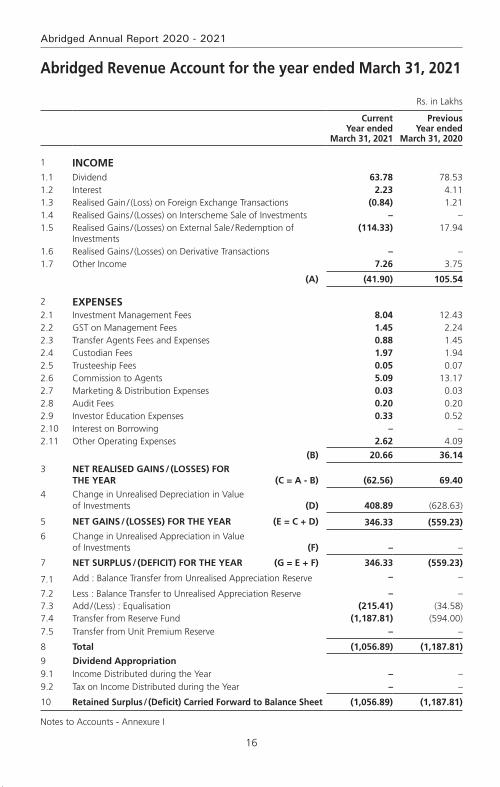
16
Abridged Annual Report 2020 - 2021
Abridged Revenue Account for the year ended March 31, 2021
Rs. in Lakhs
Current Year ended
March 31, 2021
Previous Year ended
March 31, 2020
1 INCOME1.1 Dividend 63.78 78.53 1.2 Interest 2.23 4.11 1.3 Realised Gain / (Loss) on Foreign Exchange Transactions (0.84) 1.21 1.4 Realised Gains / (Losses) on Interscheme Sale of Investments – –1.5 Realised Gains / (Losses) on External Sale / Redemption of
Investments (114.33) 17.94
1.6 Realised Gains / (Losses) on Derivative Transactions – –1.7 Other Income 7.26 3.75
(A) (41.90) 105.54
2 ExPENSES2.1 Investment Management Fees 8.04 12.43 2.2 GST on Management Fees 1.45 2.24 2.3 Transfer Agents Fees and Expenses 0.88 1.45 2.4 Custodian Fees 1.97 1.94 2.5 Trusteeship Fees 0.05 0.07 2.6 Commission to Agents 5.09 13.17 2.7 Marketing & Distribution Expenses 0.03 0.03 2.8 Audit Fees 0.20 0.20 2.9 Investor Education Expenses 0.33 0.52 2.10 Interest on Borrowing – –2.11 Other Operating Expenses 2.62 4.09
(B) 20.66 36.14
3 NET REALISED GAINS / (LOSSES) FOR THE YEAR (C = A - B) (62.56) 69.40
4 Change in Unrealised Depreciation in Value of Investments (D) 408.89 (628.63)
5 NET GAINS / (LOSSES) FOR THE YEAR (E = C + D) 346.33 (559.23)
6 Change in Unrealised Appreciation in Value of Investments (F) – –
7 NET SURPLUS / (DEFICIT) FOR THE YEAR (G = E + F) 346.33 (559.23)
7.1 Add : Balance Transfer from Unrealised Appreciation Reserve – –
7.2 Less : Balance Transfer to Unrealised Appreciation Reserve – –7.3 Add / (Less) : Equalisation (215.41) (34.58)7.4 Transfer from Reserve Fund (1,187.81) (594.00)
7.5 Transfer from Unit Premium Reserve – –
8 Total (1,056.89) (1,187.81)
9 Dividend Appropriation9.1 Income Distributed during the Year – –9.2 Tax on Income Distributed during the Year – –
10 Retained Surplus / (Deficit) Carried Forward to Balance Sheet (1,056.89) (1,187.81)
Notes to Accounts - Annexure I

17
HSBC Brazil Fund
key Statistics for the year ended March 31, 2021
Current Year ended
March 31, 2021
Previous Year ended
March 31, 2020
1. NAV per unit (Rs.):
Open
Regular Plan Growth Option 5.3445 8.4164
Regular Plan IDCW Option 5.3445 8.4164
Direct Plan - Growth Option 5.6337 8.8043
Direct Plan - IDCW Option 5.6312 8.8043
High
Regular Plan Growth Option 7.9447 10.2065
Regular Plan IDCW Option 7.9447 10.2065
Direct Plan - Growth Option 8.4270 10.7373
Direct Plan - IDCW Option 8.4223 10.7338
Low
Regular Plan Growth Option 4.7028 4.6685
Regular Plan IDCW Option 4.7028 4.6685
Direct Plan - Growth Option 4.9618 4.9201
Direct Plan - IDCW Option 4.9594 4.9180
End
Regular Plan Growth Option 6.7781 5.3445
Regular Plan IDCW Option 6.7781 5.3445
Direct Plan - Growth Option 7.2034 5.6337
Direct Plan - IDCW Option 7.1989 5.6312
2. Closing Assets Under Management (Rs. in Lakhs)
End 1,809 1,216
Average (AAuM)1 1,656 2,584
3. Gross income as % of AAuM2 -2.53% 4.08%
4. Expense Ratio:
a. Total Expense as % of AAuM (including GST on Management fees) (planwise)
Regular Plan (Continue) 1.59% 1.55%
Direct Plan 0.77% 0.79%
b. Management Fee as % of AAuM (planwise)
Regular Plan (Continue) 0.59% 0.50%
Direct Plan 0.34% 0.40%
5. Net Income as a percentage of AAuM3 -3.78% 2.69%
6. Portfolio turnover ratio4 0.21 0.17
7. Total Dividend per unit distributed during the year (planwise)
Retail
Regular Plan IDCW Option – –

18
Abridged Annual Report 2020 - 2021
Current Year ended
March 31, 2021
Previous Year ended
March 31, 2020
Direct Plan - IDCW Option – –
Corporate
Regular Plan IDCW Option – –
Direct Plan - IDCW Option – –
8. Returns (%):
a. Last One Year
Scheme
Regular Plan Growth Option 26.8200 (36.2700)
Direct Plan - Growth Option 27.8600 (35.7800)
Benchmark
MSCI Brazil 10/40 Index 38.8000 (33.4200)
b. Since Inception
Scheme
Regular Plan Growth Option (3.8500) (6.7900)
Direct Plan - Growth Option (3.9300) (7.6400)
Benchmark
MSCI Brazil 10/40 Index 1.5400 (1.9600)
1 AAuM = Average daily net assets.
2. Gross income = amount against (A) in the Revenue account i.e. Income
3. Net income = amount against (C) in the Revenue account i.e. Net Realised Gains / (Losses) for the year
4. Portfolio Turnover = Lower of sales or purchase divided by the Average AuM for the year
5. The Total management fees and other expenses charged by the underlying fund along with the management fee and recurring expenses charged by the domestic Mutual Fund is as follows:
Scheme TER charged by underlying Fund
TER of the domestic Fund
Weighted Average TER
Maximum TER Cap as per circular
2020-21
HSBC Brazil Fund 0.85% 1.20% 2.05% 2.30% from 01-Apr-2019
2019-20
HSBC Brazil Fund 0.85% 1.40% 2.25% 2.30% from 01-Apr-2019
key Statistics for the year ended March 31, 2021 (Contd...)

19
HSBC Brazil Fund
Notes to Accounts – Annexure ITo the Abridged Balance Sheet and Revenue Account for the Year ended March 31, 2021
1 Investments:
1.1. It is confirmed that investments of the Scheme are registered in the name of the Trustees for the benefit of the Scheme’s unitholders.
1.2. Open Positions of derivatives as of years ended March 31, 2021 and March 31, 2020 is NIL.
1.3. Investments in Associates and Group Companies:(Rupees)
Issuer Instrument Type
Amount Aggregate Investments
by all schemes
Amount Aggregate Investments
by all schemes
2021 2020
Balrampur Chini Mills Ltd.
Equities – 56,482,738 – –
Bharti Airtel Ltd. Equities – 470,907,573 – 594,575,759
Max Financial Services Ltd.
Equities – 172,035,228 – –
1.4. Open positions of Securities Borrowed and / or Lent by the Scheme as of the years ended March 31, 2021 and March 31, 2020 are NIL.
1.5. Investment in Below investment grade and default / Securities in default beyond its maturity date as on March 31, 2021 and March 31, 2020 are NIL.
1.6. Aggregate Unrealised Gain / Loss as at the end of the financial years end and their percentages to net assets are as under:
Security Category Amount (Rupees)
Percentage to Net Assets
Amount (Rupees)
Percentage to Net Assets
2021 2020
Foreign Securities
– Appreciation – – – –
– Depreciation 48,184,767 26.63 89,073,622 73.28
1.7 The aggregate value of investments securities (excluding TREPS and Reverse Repos) purchased and sold (including matured) during the financial year 2020-2021 (excluding accretion of discount) is Rs. 64,028,728 and Rs. 34,187,960 respectively being 38.66% and 20.64% of the average daily net assets.
The aggregate value of investments securities (excluding TREPS and Reverse Repos) purchased and sold (including matured) during the financial year 2019-2020 (excluding accretion of discount) is Rs. 45,178,307 and Rs. 121,839,906 respectively being 17.49% and 47.16% of the average daily net assets.
1.8. Non-Traded securities in the portfolios as at March 31, 2021 and March 31, 2020 are NIL.
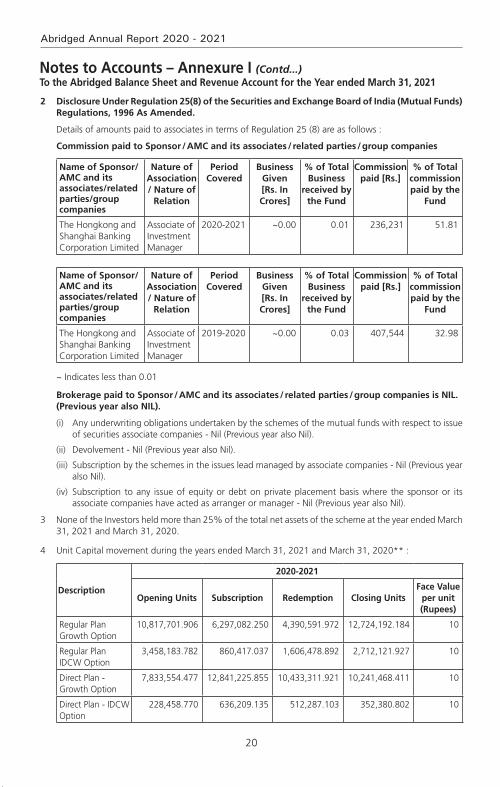
20
Abridged Annual Report 2020 - 2021
2 Disclosure Under Regulation 25(8) of the Securities and Exchange Board of India (Mutual Funds) Regulations, 1996 As Amended.
Details of amounts paid to associates in terms of Regulation 25 (8) are as follows :
Commission paid to Sponsor / AMC and its associates / related parties / group companies
Name of Sponsor/AMC and its associates/related parties/group companies
Nature of Association / Nature of
Relation
Period Covered
Business Given [Rs. In Crores]
% of Total Business
received by the Fund
Commission paid [Rs.]
% of Total commission paid by the
Fund
The Hongkong and Shanghai Banking Corporation Limited
Associate of Investment Manager
2020-2021 ~0.00 0.01 236,231 51.81
Name of Sponsor/AMC and its associates/related parties/group companies
Nature of Association / Nature of
Relation
Period Covered
Business Given [Rs. In Crores]
% of Total Business
received by the Fund
Commission paid [Rs.]
% of Total commission paid by the
Fund
The Hongkong and Shanghai Banking Corporation Limited
Associate of Investment Manager
2019-2020 ~0.00 0.03 407,544 32.98
~ Indicates less than 0.01
Brokerage paid to Sponsor / AMC and its associates / related parties / group companies is NIL. (Previous year also NIL).
(i) Any underwriting obligations undertaken by the schemes of the mutual funds with respect to issue of securities associate companies - Nil (Previous year also Nil).
(ii) Devolvement - Nil (Previous year also Nil).
(iii) Subscription by the schemes in the issues lead managed by associate companies - Nil (Previous year also Nil).
(iv) Subscription to any issue of equity or debt on private placement basis where the sponsor or its associate companies have acted as arranger or manager - Nil (Previous year also Nil).
3 None of the Investors held more than 25% of the total net assets of the scheme at the year ended March 31, 2021 and March 31, 2020.
4 Unit Capital movement during the years ended March 31, 2021 and March 31, 2020** :
Description
2020-2021
Opening Units Subscription Redemption Closing UnitsFace value
per unit (Rupees)
Regular Plan Growth Option
10,817,701.906 6,297,082.250 4,390,591.972 12,724,192.184 10
Regular Plan IDCW Option
3,458,183.782 860,417.037 1,606,478.892 2,712,121.927 10
Direct Plan - Growth Option
7,833,554.477 12,841,225.855 10,433,311.921 10,241,468.411 10
Direct Plan - IDCW Option
228,458.770 636,209.135 512,287.103 352,380.802 10
Notes to Accounts – Annexure I (Contd...)To the Abridged Balance Sheet and Revenue Account for the Year ended March 31, 2021
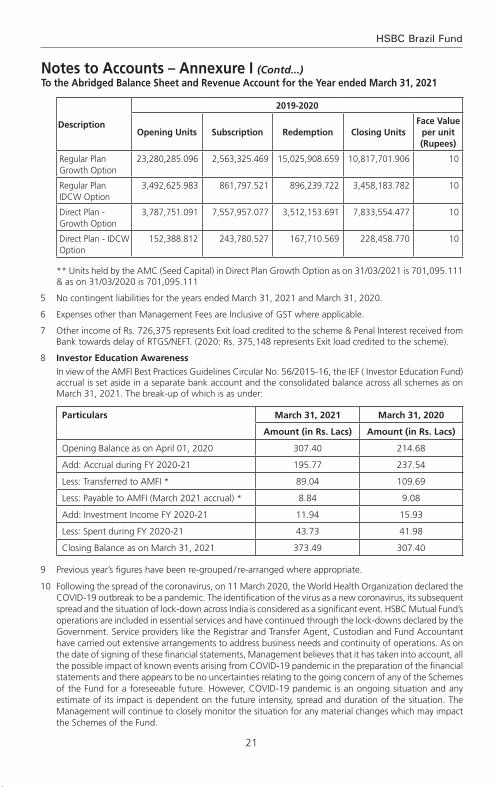
21
HSBC Brazil Fund
Notes to Accounts – Annexure I (Contd...)To the Abridged Balance Sheet and Revenue Account for the Year ended March 31, 2021
Description
2019-2020
Opening Units Subscription Redemption Closing UnitsFace value
per unit (Rupees)
Regular Plan Growth Option
23,280,285.096 2,563,325.469 15,025,908.659 10,817,701.906 10
Regular Plan IDCW Option
3,492,625.983 861,797.521 896,239.722 3,458,183.782 10
Direct Plan - Growth Option
3,787,751.091 7,557,957.077 3,512,153.691 7,833,554.477 10
Direct Plan - IDCW Option
152,388.812 243,780.527 167,710.569 228,458.770 10
** Units held by the AMC (Seed Capital) in Direct Plan Growth Option as on 31/03/2021 is 701,095.111 & as on 31/03/2020 is 701,095.111
5 No contingent liabilities for the years ended March 31, 2021 and March 31, 2020.
6 Expenses other than Management Fees are Inclusive of GST where applicable.
7 Other income of Rs. 726,375 represents Exit load credited to the scheme & Penal Interest received from Bank towards delay of RTGS/NEFT. (2020: Rs. 375,148 represents Exit load credited to the scheme).
8 Investor Education Awareness
In view of the AMFI Best Practices Guidelines Circular No. 56/2015-16, the IEF ( Investor Education Fund) accrual is set aside in a separate bank account and the consolidated balance across all schemes as on March 31, 2021. The break-up of which is as under:
Particulars March 31, 2021 March 31, 2020
Amount (in Rs. Lacs) Amount (in Rs. Lacs)
Opening Balance as on April 01, 2020 307.40 214.68
Add: Accrual during FY 2020-21 195.77 237.54
Less: Transferred to AMFI * 89.04 109.69
Less: Payable to AMFI (March 2021 accrual) * 8.84 9.08
Add: Investment Income FY 2020-21 11.94 15.93
Less: Spent during FY 2020-21 43.73 41.98
Closing Balance as on March 31, 2021 373.49 307.40
9 Previous year’s figures have been re-grouped / re-arranged where appropriate.
10 Following the spread of the coronavirus, on 11 March 2020, the World Health Organization declared the COVID-19 outbreak to be a pandemic. The identification of the virus as a new coronavirus, its subsequent spread and the situation of lock-down across India is considered as a significant event. HSBC Mutual Fund’s operations are included in essential services and have continued through the lock-downs declared by the Government. Service providers like the Registrar and Transfer Agent, Custodian and Fund Accountant have carried out extensive arrangements to address business needs and continuity of operations. As on the date of signing of these financial statements, Management believes that it has taken into account, all the possible impact of known events arising from COVID-19 pandemic in the preparation of the financial statements and there appears to be no uncertainties relating to the going concern of any of the Schemes of the Fund for a foreseeable future. However, COVID-19 pandemic is an ongoing situation and any estimate of its impact is dependent on the future intensity, spread and duration of the situation. The Management will continue to closely monitor the situation for any material changes which may impact the Schemes of the Fund.
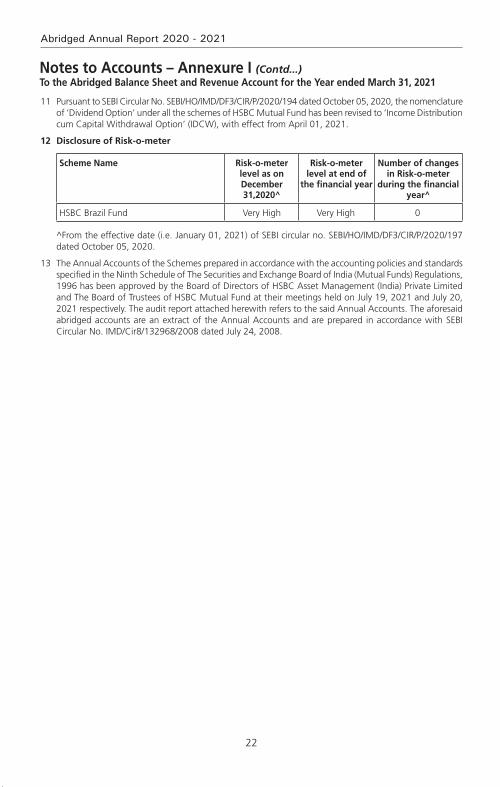
22
Abridged Annual Report 2020 - 2021
11 Pursuant to SEBI Circular No. SEBI/HO/IMD/DF3/CIR/P/2020/194 dated October 05, 2020, the nomenclature of ‘Dividend Option’ under all the schemes of HSBC Mutual Fund has been revised to ‘Income Distribution cum Capital Withdrawal Option’ (IDCW), with effect from April 01, 2021.
12 Disclosure of Risk-o-meter
Scheme Name Risk-o-meter level as on December 31,2020^
Risk-o-meter level at end of
the financial year
Number of changes in Risk-o-meter
during the financial year^
HSBC Brazil Fund Very High Very High 0
^From the effective date (i.e. January 01, 2021) of SEBI circular no. SEBI/HO/IMD/DF3/CIR/P/2020/197 dated October 05, 2020.
13 The Annual Accounts of the Schemes prepared in accordance with the accounting policies and standards specified in the Ninth Schedule of The Securities and Exchange Board of India (Mutual Funds) Regulations, 1996 has been approved by the Board of Directors of HSBC Asset Management (India) Private Limited and The Board of Trustees of HSBC Mutual Fund at their meetings held on July 19, 2021 and July 20, 2021 respectively. The audit report attached herewith refers to the said Annual Accounts. The aforesaid abridged accounts are an extract of the Annual Accounts and are prepared in accordance with SEBI Circular No. IMD/Cir8/132968/2008 dated July 24, 2008.
Notes to Accounts – Annexure I (Contd...)To the Abridged Balance Sheet and Revenue Account for the Year ended March 31, 2021

23
HSBC Brazil Fund
voting Policy and Procedures
In view of SEBI guidelines related to “Role of Mutual Funds in Corporate Governance of Public Listed Companies”, HSBC AMC has formulated its “Policy for Proxy Voting in Public Listed Companies”. The said policy is available on our website and the details of actual exercise of proxy votes, the summary of votes casted and the auditor’s certificate for the Financial Year 2020 – 21 is forming part of our full Annual Report for the Financial Year 2020 – 21 which is uploaded on our website at http://www.assetmanagement.hsbc.co.in

24
Abridged Annual Report 2020 - 2021
Statutory Details & Disclaimers
All the returns have been sourced from Mutual Funds India Explorer software. The performance of the schemes and the benchmark is calculated on a total return basis. This document has been prepared by HSBC Asset Management (India) Private Ltd (HSBC) for information purposes only and should not be construed as i) an offer or recommendation to buy or sell securities, commodities, currencies or other investments referred to herein; or ii) an offer to sell or a solicitation or an offer for purchase of any of the funds of HSBC Mutual Fund; or iii) an investment research or investment advice. All information contained in this document (including that sourced from third parties), is obtained from sources HSBC and the third party which HSBC believes to be reliable however, has not independently verified the same. The information and opinions contained within the document are based upon publicly available information and rates of taxation applicable (if any) at the time of publication, which are subject to change from time to time.
Expressions of opinion are those of HSBC only and are subject to change without notice. It does not have regard to specific investment objectives, financial situation and the particular needs of any specific person who may receive this document. Investors should seek personal and independent advice regarding the appropriateness of investing in any of the funds, securities, other investment or investment strategies that may have been discussed or referred herein and should understand that the views regarding future prospects may or may not be realized. In no event shall HSBC Mutual Fund / HSBC Asset management (India) Private Limited and / or its affiliates or any of their directors, trustees, officers and employees be liable for any direct, indirect, special, incidental or consequential damages arising out of the use of information / opinion herein. Neither this document nor the units of HSBC Mutual Fund have been registered in any jurisdiction. The distribution of this document in certain jurisdictions may be restricted or totally prohibited and accordingly, persons who come into possession of this document are required to inform themselves about, and to observe, any such restrictions.
Mutual Fund investments are subject to market risks, read all scheme related documents carefully.

HSBC Asia Pacific (Ex Japan) Dividend Yield FundAn open ended fund of fund Scheme investing in HSBC Global Investments Fund - Asia Pacific Ex Japan Equity High Dividend Fund
Abridged Annual Report 2020 - 2021

1
HSBC Asia Pacific (Ex Japan) Dividend Yield Fund
Dear Investor,
The beginning of the last financial year now almost seems like a distant memory. COVID-19 was still a relatively unknown enemy and governments across the world were grappling with ways to control and mitigate the risks associated with it. Nationwide lockdowns were the norm and our markets both equity and fixed income reacted negatively leading to significant erosion of wealth. Within a short period of time markets bounced back. This confounded even the most astute market pundits. How is it possible that when GDP growth had slowed down, unemployment had risen, inflation was high could there be such sharp up move in equity indices. Whilst the reasons are well known about easy global liquidity, demand resurgence, cost cutting by corporates etc. perhaps its most important to remember that the markets are not a reflector but a predictor of economic activity.
At all times particularly during such volatile times it is important to go back to the basics. Why do you save, why do you invest, what goals would you like to achieve, how old are you, what is your risk appetite? The replies to these simple questions will help you determine your asset allocation. As an example when equity markets corrected sharply last year, investors who reviewed their asset allocation, stayed invested during the lows of the past year and were able to capture the rebound and have seen prime returns since then. The current market movement in all likelihood would have also led to some imbalances in your asset allocation. Do not ignore that and I strongly recommend that you do review this with your advisor to check whether re-balancing is required.
During this financial year we had three very successful new fund launches. The pandemic showed us a clear trend of dominant players becoming stronger and profit pool getting consolidated within a few companies. To capture this opportunity, we launched the HSBC Focused Equity Fund which garnered close to Rs. 520 crores. During the second half of 2020, in the fixed income space, 3 - 5 year duration range had a favourable investment scenario as RBI’s accommodative policy and surplus liquidity had reduced the returns at the very short end of the yield curve. There was a demand for an actively managed moderate duration strategy with better credit quality which we fulfilled by launching HSBC Corporate Bond Fund. It garnered over 700 crores. Our latest and first of its kind offering, HSBC Global Equity Climate Change Fund of Fund saw a stupendous response with over 8000 investors investing over Rs. 616 crores. This is an investment opportunity which goes beyond the rationale of simply generating investment returns and is the future of responsible investing.
We worked towards augmenting our digital capabilities by launching a few key enhancements to our online transaction platform. Being mindful of the movement restrictions in place, this year we focused on digitizing offline processes so that an investor need not need step out of her home for investing or availing any key services. While our interactive chatbot AskMe, eased service queries, our end-to-end digital KYC module enabled a first time Mutual Fund investor to invest in our funds without any paperwork. We listened to your feedback and digitized consolidation of folios and change of tax status which eliminated the need for you to physically visit our branches.
I am a strong believer in the India story and this story has just begun. The opportunity to invest in this high growth market is a very exciting opportunity. I do hope you share my enthusiasm and I ask that you continue to invest whilst reviewing your asset allocation at all times. As always thank you for your business. Stay safe.
Warm regards,
Ravi MenonChief Executive Officer,
HSBC Asset Management India

2
Abridged Annual Report 2020 - 2021
SPONSOR
HSBC Securities and Capital Markets (India) Private LimitedRegd. Office: 52/60, Mahatma Gandhi Road, Fort, Mumbai - 400 001.
TRUSTEE
Board of TrusteesOffice: 16, Veer Nariman Road, Fort, Mumbai 400 001.
ASSET MANAGEMENT COMPANY
HSBC Asset Management (India) Private LimitedCorp. & Regd. Office: 16, Veer Nariman Road, Fort, Mumbai 400 001.
CUSTODIAN
Standard Chartered Bank (SCB)Corp. & Regd. Office: Crescenzo, Securities Services, 3rd Floor, C-38/39, G-Block,
Bandra Kurla Complex, Bandra East, Mumbai – 400051.
AUDITORS TO THE SCHEME
BSR & Co. LLPChartered Accountants
5th Floor, Lodha Excelus, Apollo Mills Compound, N. M. Joshi Marg, Mahalaxmi, Mumbai 400 011.
REGISTRAR & TRANSFER AGENTS
Computer Age Management Services Limited (CAMS)Unit: HSBC Mutual Fund ’C’ Block, 2nd Floor, Hanudev Info Park P. Ltd., SF No. 558/2, Udayampalayam Road, Nava India, Coimbatore - 641 028.
BOARD OF TRUSTEES
Ms. Jasmine Batliwalla - Chairperson
Mr. Nani Javeri - Trustee
Dr. T. C. Nair - Trustee
Mr. Pedro Bastos - Trustee
BOARD OF DIRECTORS
Mr. Dinesh Mittal - Director
Dr. Indu Shahani - Director
Mr. Ravi Menon - Director & Chief Executive Officer
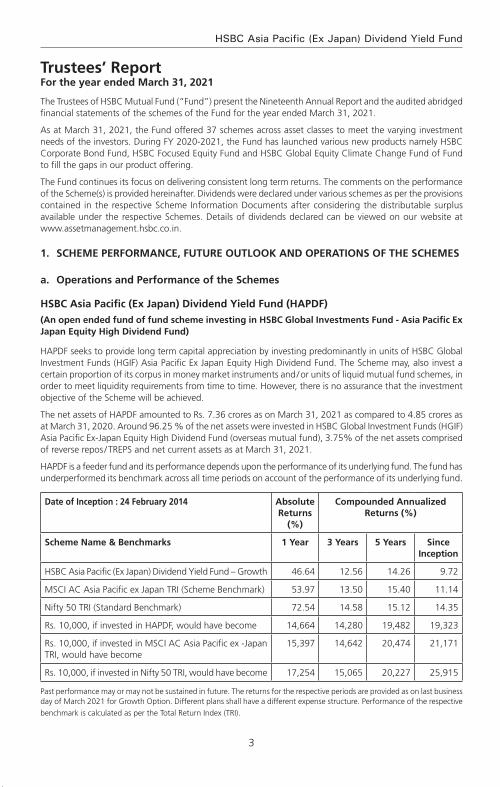
3
HSBC Asia Pacific (Ex Japan) Dividend Yield Fund
The Trustees of HSBC Mutual Fund (“Fund”) present the Nineteenth Annual Report and the audited abridged financial statements of the schemes of the Fund for the year ended March 31, 2021.
As at March 31, 2021, the Fund offered 37 schemes across asset classes to meet the varying investment needs of the investors. During FY 2020-2021, the Fund has launched various new products namely HSBC Corporate Bond Fund, HSBC Focused Equity Fund and HSBC Global Equity Climate Change Fund of Fund to fill the gaps in our product offering.
The Fund continues its focus on delivering consistent long term returns. The comments on the performance of the Scheme(s) is provided hereinafter. Dividends were declared under various schemes as per the provisions contained in the respective Scheme Information Documents after considering the distributable surplus available under the respective Schemes. Details of dividends declared can be viewed on our website at www.assetmanagement.hsbc.co.in.
1. SCHEME PERFORMANCE, FUTURE OUTLOOk AND OPERATIONS OF THE SCHEMES
a. Operations and Performance of the Schemes
HSBC Asia Pacific (Ex Japan) Dividend Yield Fund (HAPDF)
(An open ended fund of fund scheme investing in HSBC Global Investments Fund - Asia Pacific Ex Japan Equity High Dividend Fund)
HAPDF seeks to provide long term capital appreciation by investing predominantly in units of HSBC Global Investment Funds (HGIF) Asia Pacific Ex Japan Equity High Dividend Fund. The Scheme may, also invest a certain proportion of its corpus in money market instruments and / or units of liquid mutual fund schemes, in order to meet liquidity requirements from time to time. However, there is no assurance that the investment objective of the Scheme will be achieved.
The net assets of HAPDF amounted to Rs. 7.36 crores as on March 31, 2021 as compared to 4.85 crores as at March 31, 2020. Around 96.25 % of the net assets were invested in HSBC Global Investment Funds (HGIF) Asia Pacific Ex-Japan Equity High Dividend Fund (overseas mutual fund), 3.75% of the net assets comprised of reverse repos / TREPS and net current assets as at March 31, 2021.
HAPDF is a feeder fund and its performance depends upon the performance of its underlying fund. The fund has underperformed its benchmark across all time periods on account of the performance of its underlying fund.
Date of Inception : 24 February 2014 Absolute Returns
(%)
Compounded Annualized Returns (%)
Scheme Name & Benchmarks 1 Year 3 Years 5 Years Since Inception
HSBC Asia Pacific (Ex Japan) Dividend Yield Fund – Growth 46.64 12.56 14.26 9.72
MSCI AC Asia Pacific ex Japan TRI (Scheme Benchmark) 53.97 13.50 15.40 11.14
Nifty 50 TRI (Standard Benchmark) 72.54 14.58 15.12 14.35
Rs. 10,000, if invested in HAPDF, would have become 14,664 14,280 19,482 19,323
Rs. 10,000, if invested in MSCI AC Asia Pacific ex -Japan TRI, would have become
15,397 14,642 20,474 21,171
Rs. 10,000, if invested in Nifty 50 TRI, would have become 17,254 15,065 20,227 25,915
Past performance may or may not be sustained in future. The returns for the respective periods are provided as on last business day of March 2021 for Growth Option. Different plans shall have a different expense structure. Performance of the respective
benchmark is calculated as per the Total Return Index (TRI).
Trustees’ ReportFor the year ended March 31, 2021

4
Abridged Annual Report 2020 - 2021
b. Market Overview & Outlook (as furnished by HSBC Asset Management (India) Private Limited)
EqUITY OUTLOOk
Recap of FY 2020-21:
Fiscal 2020-21 was a rewarding year for equity investors with market indices recording stellar gains from the low base after the COVID correction. Market sentiments steadily improved during the course of the year to deliver positive returns in all four quarters of the year.
We witnessed various legs of market performance during the last fiscal, driven by multiple factors and variables. Initial rebound from the market lows was driven by attractive valuations, then it was on the back of faster than anticipated recovery post lockdown, reopening optimism, swifter than expected vaccine intervention and above all, the unprecedented liquidity. Lastly but importantly, a period of lower cost of capital coupled with low real rates, improved the attractiveness of equity as an asset class, driving the performance.
As a result, the year ended with optimism compared to despair when it began. Corporate India overcame the challenges posed by COVID through significant cost control measures while at the same time showed improvement in their financial position and cash flows.
Commodities also rallied from the lows of the COVID crisis with global crude oil prices surging by 179% during the year. INR appreciated by 3.3% (as India recorded strong net FPI inflows) during the year. MSCI India index outperformed most of key global indices during the past fiscal. MSCI India index (USD) gained 74.8% as compared to 51.8% for MSCI World, 50.5% for Dow Jones, 55.1% for MSCI Emerging Markets, 41.2% for MSCI China and 42% for MSCI Europe*.
At a record USD 37.3 bn of net FPI inflows during the fiscal, the tally was higher than the cumulative net inflows India received from the previous 6 years. DIIs on the other hand saw net outflows of USD 18.4 bn and this was the first fiscal year of net outflows from the segment in 5 years. The net outflows from the segment was driven by USD 16.7 bn of outflows from the MFs while domestic insurers saw a far lower outflow of USD 1.6 bn*.
Indices Returns (April 1, 2020 to March 31, 2021) 1 Year^
S&P BSE Sensex TR 69.8%
NSE CNX Nifty TR 72.5%
S&P BSE 100 TR 73.5%
S&P BSE 200 TR 76.3%
S&P BSE 500 TR 78.6%
S&P BSE Midcap TR 93.0%
S&P BSE 250 Small-cap TR 117.5%
^Source: Bloomberg (Above table values are for total return indices)
Way forward:
Beginning of the new fiscal, India had to contend with the risk of the second COVID wave, which was more ferocious than the first wave on the human impact. However, as we write this, the second wave has already peaked and there have been a significant fall in number of active cases, case-positivity rate, daily new caseload and deaths. Vaccination drive also has seen acceleration with and is now closer to 6 mn doses per day mark. Also, the impact of the lockdown on economic activity has been significantly lower during the second wave, compared to last year. In most of the states, the unlocking process has already begun in a phased manner and this is leading to improvement in various activity indicators. Mobility indicators are recovering faster while economic indicators (freight, credit off-take, E-way bill generation, power demand etc.) are also witnessing a gradual recovery. The recently concluded earnings season has turned out to be in-line with expectations and despite the concerns of around the second wave, the earnings (Nifty) have seen upgrades for FY22. Market is looking beyond the current quarter (i.e. 1QFY22), which would witness an impact due to the second wave. Our baseline assumption is that of a temporary impact from the second
Trustees’ ReportFor the year ended March 31, 2021 (Contd...)

5
HSBC Asia Pacific (Ex Japan) Dividend Yield Fund
wave and the set-back to the recovery process limited to a few months, after which we should see the economic rebound. So far, this is tracking in-line with assumptions.
From a macro perspective, the current estimates for GDP growth in FY22 stand at 9.2%* (after seeing downgrades to factor in the impact of second wave). The downgrade in estimates are pertaining to the first quarter and hence the trajectory of growth from hereon should pick up. The tax collections data for the first two months of FY22 has remained strong, implying that the drawdown of the second wave on the fiscal position is not alarming. Additionally, the impact of fiscal stimulus package announced in FY22 so far is manageable (about 60 bps of GDP) and hence would not lead to any fiscal strain.
After the spectacular rally, market valuations at an overall level are now trending above historical averages on traditional valuation metrics (P/E, P/B). This is true for all market capitalization categories (viz large, mid and small). Typically, the broader market (i.e. mid and small cap segments), trade at a discount to large caps, however this scenario has now reversed after the outperformance from the broader market segments. However, the earnings momentum continues to remain strong (witnessing upgrades so far) and except for a short period due to second wave, the earnings momentum should hold up.
We believe that the risk-reward is balanced for the equity markets in the near term. Higher or sticky inflation expectations globally, higher than historical market valuations on some parameters (i.e. P/E, P/B) and adverse demand impact from the second wave are risk factors to contend with in the near term. However, these are counter balanced by positive commentary from companies, significant decline in COVID cases and acceleration in the vaccination programme. As a result, in the near term markets may see a consolidation phase and could take cues from the upcoming earnings season with more focus on the corporate commentary and the outlook. From a medium to long term perspective, the outlook for equity markets remains positive. The expectation of cyclical revival in the economy brings in a multi-year earnings visibility. This along with a benign cost of capital environment, should support equity performance. However, equity returns are likely to moderate on the back of the relatively high valuations and the strong recovery we have already witnessed from the COVID lows. Equity performance is likely to mirror the earnings growth trends over the medium to long term.
Pace of vaccination, concerns about a third wave, corporate earnings trajectory, inflation trends (both global & domestic), monsoon trends and commodity prices (especially crude oil) are some of the key factors which could influence market performance in the short term.
From a portfolio perspective, we are maintaining a pro-cyclical bias. We expect earnings growth to rebound sharply post the current COVID phase. Earnings growth are expected to sustain in high-teens beyond FY22 on the back of economy witnessing a cyclical recovery due to revival in capex cycle over the next 2-3 years (first by the government followed by private capex). From a sectoral perspective our order of preference is rate sensitives followed by domestic cyclicals, exporters and domestic consumption. Predominantly regulated businesses come last in our pecking order. This preference is dictated by our assessment of sectors / segments leading contribution to the market earnings growth over the next 2-3 years. Our portfolio construction is driven by a bottom up approach to stock selection with a focus on names that can deliver positive earnings surprises. We continue to focus on this theme to identify likely outperformers.
*Source: Bloomberg
DEBT OUTLOOk
Market drivers during the course of the year FY21
The Fixed Income markets started the year with a bout of nervousness that was triggered by the pandemic. While RBI had calmed the markets with its large rate cut action of 75bp cut followed by liquidity supportive measures, the volatility continued until mid-May when government announced its relief package. While it was not fiscally expansive, it touched the right cords in terms of credit flow to desired sectors. This was followed up with RBI’s credit relief measures in terms of moratorium and restructuring of assets that were stressed due to the pandemic. Throughout the course of the year, RBI maintained its accommodative stance along with significant amount of surplus liquidity that was supportive and helped in maintaining stability in the market. However, as the year progressed and pressure on fiscal began to mount yields started seeing a spike towards the last quarter of the fiscal. While borrowing was stepped up to INR 12 trillion from previously budgeted INR 7.8 trillion in May 2020, it was further enhanced by and additional INR 1.1 trillion in October 2020.
Trustees’ ReportFor the year ended March 31, 2021 (Contd...)

6
Abridged Annual Report 2020 - 2021
Overall GOI ended up borrowing a record amount of INR 13.9 trillion. The budget proved to be a shocker with GOI using the pandemic as an opportunity for setting the finances in order. GOI showed a record deficit of 9.5% for FY21 and projected a 6.8% for FY22 with estimated central government gross borrowing of INR 12 trillion. This seemed to reverse the support RBI had provided throughout the year with benchmark 10-year bond peaking to 6.23% in mid –Feb 2021. RBI’s statements to remain supportive were left in the sidelines. Overall it seemed that the 115bp of rate cut, along with significant liquidity infusion (OMO + Twist operations of ~INR 3 trillion, infusion via dollar purchases) seemed only a little to help in applying a brake to the one-way spike in yields. The year closed ~6.16% with absence of concrete action by RBI.
RBI Policy: Through the course of the year, RBI has maintained an accommodative stance, with an aggregate 115bp of rate cut done in March and May 2020 taking the repo rate from 5.15% to 4%. Subsequently while inflation pressures prevented RBI from taking any direct actions, RBI has used a combination of creative tools to keep the rates contained primarily via liquidity supportive tools such as OMOs, Twist Operations, Repo linked Term loans to needy sectors (LTROs, TLTROs), CRR cuts. While inflation was a worry for most part of the year, RBI kept it aside admitting that growth was a priority and inflation effects are more supply side rather than demand side. Prospectively into FY22, with the onset of the second wave, RBI continues to maintain the stance to prioritize growth.
Inflation: Inflation for most part of the year stayed above 6% primarily driven by supply side pressures and some intermittent spike from food inflation as well. While it has been coming off since December with cooling off of food inflation and positive base effects, it has been between 4- 5.5%. Structurally however inflation risks continue to remain as oil prices have increased and base effects will not remain supportive for long. Core inflation continues to remain sticky.
Liquidity: During the year, system liquidity has remained at significant surplus facilitated largely by RBI action such as OMOs, foreign exchange operations and government spending.
Budget: The FY2022 union budget focuses on growth and has accordingly, presented a 9.5% fiscal deficit for FY21 and 6.8% for FY22. On the revenue side, the assumptions are largely realistic, with FY22 (E) Nominal GDP growth at 14.4% and tax revenue growth at 17% considering the pandemic impact in FY 21. Compared to FY20, tax revenue growth is ~10%. While non-tax revenues are ambitious pegging the divestment at INR 1.75 trillion, with robust pipeline of assets including monetization of road and transmission assets, execution remains the key as in the past. On the expenditure side, better quality capex spending with focusing on rail, road, defense, urban infra is positive for long term structural growth. The revenue side expenditure adjusting for clearance of past subsidy arrears will be similar to budgetary estimates. Government using this opportunity to bring back off-balance sheet spending to on-balance sheet was a welcome move towards transparency and showing realistic projections. Alongside, states have also been given leeway to borrow upto 4% of their GDP with an additional 0.5% subject to conditions. Given that states are an important vehicle for capex investment, this move is welcome although it may entail additional state borrowing. The fiscal glide path is shifted to FY26 at below 4.5% for center and 3% for states suggesting that spending will continue and borrowing will come down gradually. In summary, from survival to revival, FY22 budget aims for structural growth leaving fiscal concerns sideways in the interim. Government’s intent seems clear on bringing back growth on the table, in a transparent manner.
While the second wave of the pandemic has once again derailed the revenue story, government will still have some cushion from its conservative estimates.
Currency and FII Flows: INR has been on an appreciation trajectory for most part of the year, aided by dollar underperformance supported by positive FII and FDI flows along with reduced imports on the domestic front as well. RBI has used most of the flows to accumulate reserves which has prevented any strong appreciation. Pandemic shock and global risk off led rupee over 75 in the beginning of the year only to close below 72 at the end of the fiscal year. While the second wave led to another spike in INR in April, it has since then cooled once again driven by dollar underperformance and pandemic recovery on the domestic front. Net FII flows was ~$30 bn with positive equity flows of~$37 bn while debt was negative ~$7bn and overall RBI’s forex reserves rose by a ~$100 bn to close ~$537 bn.
Credit growth: Credit growth for the entire year has been tepid as previous year’s credit events were followed by nervousness relating to the pandemic. Despite RBI opening up several windows to finance the non-AAA segment, there was very little fresh credit flowing that segment. Overall banking credit grew by
Trustees’ ReportFor the year ended March 31, 2021 (Contd...)
7
HSBC Asia Pacific (Ex Japan) Dividend Yield Fund
only 6.5%. Risk appetite has however been improving from a complete risk aversion to opening up towards a calculated risk. Prospectively it is expected that once the pandemic risk abates, credit growth will resume primarily driven by government capex spending and demand recovery.
Market Outlook
The pandemic once again brought the country to a situation similar to last year and debt markets perhaps interpreted the same as a structural rise in rates. In the initial day’s post budget in Feb of 2021, market was expecting a concrete set of actions such as an OMO calendar from RBI, and RBI’s words alone failed to calm the market. The first auction of the fiscal year also saw a devolvement. However, RBI acted in the first policy of the year announcing a bond buyback program akin to QE (quantitative easing) and its subsequent cancellation of auctions wherein yields were perhaps quoted higher than RBI’s comfort levels brought back confidence into the market. Since then we have seen a strong rally with 10-year benchmark trending below 6% and the curve moving alongside. RBI reiteration of priority of growth and also supporting with higher than expected dividend payment stand out as a testimony of its support. While we do not expect RBI to act in terms of rate cuts, we believe that measures such as G-SAP, OMOs will continue until there is visibility of a structural growth. Therefore, the large borrowing program should go without any hiccups.
Furthermore, with the evidence of strong GST numbers until April 2021 (before the 2nd wave), it is expected that growth and therefore fiscal revenues will come back. Government’s conservative budget estimates are supportive. Also, given the fact that compared to last year there has not been a complete shutdown of activity (lockdowns being distributed), the impact on growth will not be similar to last year. Pent up demand will come back to support revenue collection. However, on the flipside, once growth resumes RBI will be forced to withdraw liquidity in a phased manner to prevent asset bubbles. Nevertheless, RBI need not act in terms of rate actions and we believe that a prolonged pause in terms of RBI rates is in the offing.
Net-net therefore while growth is wanting no matter what, it may come at a small price of rise in yields with liquidity withdrawal. That is however expected more in the 2nd half of the year. Lower than expected borrowing numbers, later this year or if not in next year could be a surprise. We may therefore see a range bound rate action in the near term with a rising bias over time. Global rate environment, oil and currency risks are to be watched out for.
2. BRIEF BACkGROUND OF SPONSORS, BOARD OF TRUSTEES AND ASSET MANAGEMENT COMPANY
a. Sponsor
HSBC Mutual Fund is sponsored by HSBC Securities and Capital Markets (India) Private Limited (HSCI). The Sponsor is the Settler of the Mutual Fund Trust. The Sponsor has entrusted a sum of Rs. 1,00,000/- (Rupees One Lakh only) to the Trustee as the initial contribution towards the corpus of the Mutual Fund.
HSCI offers integrated investment banking services, securities and corporate finance & advisory. HSCI is a member of the Bombay Stock Exchange Limited and National Stock Exchange (capital and derivative market segments). HSCI holds 100% of the paid up equity share capital of HSBC Asset Management (India) Private Limited.
b. HSBC Mutual Fund
HSBC Mutual Fund (“the Mutual Fund” or “the Fund”) has been constituted as a Trust in accordance with the provisions of the Indian Trusts Act, 1882 (2 of 1882) vide a Trust Deed dated February 7, 2002 with HSBC Securities and Capital Markets (India) Private Limited, as the Sponsor and the Board of Individual Trustees. The Trustee has entered into an Investment Management Agreement dated February 7, 2002 with HSBC Asset Management (India) Private Limited (AMC) to function as the Investment Manager for all the schemes of the Fund. The Fund was registered with SEBI vide registration number MF/046/02/5 dated May 27, 2002.
The Trust has been formed for the purpose of pooling of capital from the public for collective investment in securities for the purpose of providing facilities for participation by persons as beneficiaries in such investments and in the profits/income arising therefrom.
Trustees’ ReportFor the year ended March 31, 2021 (Contd...)

8
Abridged Annual Report 2020 - 2021
c. Board of Trustees (the Trustees)
The Board of Trustees is the exclusive owner of the Trust Fund and holds the same in trust for the benefit of the unit holders. The Trustees have been discharging their duties and carrying out the responsibilities as provided in the SEBI (Mutual Funds) Regulations, 1996 and the Trust Deed. The Trustees seek to ensure that the Fund and the schemes floated there under are managed by the AMC in accordance with the Trust Deed, the said Regulations, directions and guidelines issued by the SEBI, the Stock Exchanges, the Association of Mutual Funds in India and other regulatory agencies.
d. Asset Management Company (the AMC)
HSBC Asset Management (India) Private Limited (the Investment Manager or the AMC) is a private limited company incorporated under the Companies Act, 1956 on December 12, 2001 having its Registered Office at 16, V. N. Road, Fort, Mumbai 400 001. HSBC Asset Management (India) Private Limited has been appointed as the Asset Management Company of HSBC Mutual Fund by the Trustee vide Investment Management Agreement (IMA) dated February 7, 2002 and executed between the Trustees and the AMC. SEBI approved the AMC to act as the Investment Manager of the Fund vide its letter No. MFD/BC/163/2002 dated May 27, 2002. The paid-up equity share capital of the AMC is Rs. 61.59 crores. The AMC is registered as a Portfolio Manager under the SEBI (Portfolio Managers) Regulations, 1993 vide registration no. INP000001322. The AMC also offers non-binding Advisory services to offshore funds under the mutual fund license.
HSBC Securities and Capital Markets (India) Private Limited holds 100% of the paid up equity share capital of the AMC.
3. INvESTMENT OBJECTIvE OF THE SCHEMESThe investment objective of the respective schemes has been provided above under the heading “Scheme Performance, Future Outlook and Operation of the Scheme” (Refer Section 1).
4. SIGNIFICANT ACCOUNTING POLICIES The Significant Accounting Policies form part of the Notes to the Accounts annexed to the Balance Sheet of the Schemes in the Full Annual Report. The accounting policies are in accordance with Securities Exchange Board of India (Mutual Funds) Regulations 1996.
5. UNCLAIMED DIvIDENDS & REDEMPTIONSSummary of number of investors & corresponding amount as on March 31, 2021:
Nil.
6. INvESTOR SERvICESThe number of official points of acceptance of transactions is 204 locations. In addition to the offices of the Registrar & Transfer agents, the AMC has Investor Service Centers in 9 locations at its own offices - namely Mumbai, New Delhi, Kolkata, Bangalore, Pune, Ahmedabad, Hyderabad, Chandigarh and Chennai. With a view to enhance customer convenience, the AMC has the facility of priority based servicing to key distributors through the enhancement of the Interactive Voice Reponses. The AMC has 2 Toll Free numbers (1-800-200-2434 /1-800-258-2434) which can be dialed from anywhere in India and 1 number i.e +91 44 39923900 (Investors calling from abroad). The call center service is being managed by the Registrar and Transfer Agents. Transactions for purchase / redemption of units in the schemes HSBC Mutual Fund can also be made through the online transaction facility on the AMC’s website at https://invest.assetmanagement.hsbc.co.in.
On the distribution front, the number of empaneled distributors was 1069 as on March 31, 2021. During the year, the AMC initiated tie-ups for online distribution of the Mutual Fund’s schemes with several channel partners taking the total number of such tie-ups to 52.
7. DETAILS OF INvESTOR GRIEvANCE REDRESSALThe details of the redressal of investor complaints received against HSBC Mutual Fund during April 2020 - March 2021 are as follows:
Trustees’ ReportFor the year ended March 31, 2021 (Contd...)

9
HSBC Asia Pacific (Ex Japan) Dividend Yield Fund
2020-2021
Com-plaint Code
Type of complaint# (a) No. of complaints pending at the begin-ning of the
year
(b) No. of Com-
plaints received during
the year
Action on (a) and (b)
Resolved Non Action-
able
Pending
Within 30
days
30 - 60 days
60 - 180 days
Beyond 180 days
0 - 3 months
3 - 6 months
6 - 9 months
9 - 12 months
I A Non receipt of Dividend on Units
0 0 0 0 0 0 0 0 0 0 0
I B Interest on delayed payment of Dividend
0 0 0 0 0 0 0 0 0 0 0
I C Non receipt of Redemption Proceeds
0 8 7 0 0 0 0 1 0 0 0
I D Interest on delayed payment of Redemption
0 0 0 0 0 0 0 0 0 0 0
II A Non receipt of Statement of Account / Unit Certificate
0 0 0 0 0 0 0 0 0 0 0
II B Discrepancy in Statement of Account
0 1 1 0 0 0 0 0 0 0 0
II C Data corrections in Investor details **
0 12 12 0 0 0 0 0 0 0 0
II D Non receipt of Annual Report/Abridged Summary
0 0 0 0 0 0 0 0 0 0 0
III A Wrong switch between Schemes
0 0 0 0 0 0 0 0 0 0 0
III B Unauthorized switch between Schemes
0 0 0 0 0 0 0 0 0 0 0
III C Deviation from Scheme attributes
0 0 0 0 0 0 0 0 0 0 0
III D Wrong or excess charges/load
0 0 0 0 0 0 0 0 0 0 0
III E Non updation of changes viz. address, PAN, bank details, nomination, etc
0 6 6 0 0 0 0 0 0 0 0
IV Others 0 15 15 0 0 0 0 0 0 0 0
Total 0 42 41 0 0 0 0 1 0 0 0
Summary of Complaints for FY 2020-21
Particulars Count
Total complaints received 42
Total number of folios 148770
% of complaints against the folio 0.028%
# active folios
** As per AMFI Best Practice Guidelines Circular No. 25/2011-12 for Revisions in the Guidelines on Standardization of Complaints / Grievances Reporting Procedure. If “Others” include a type of complaint which is more than 10% of overall complaints, then such a reason should be provided separately. Hence data corrections in Investor Details is included as a separate category
* Non actionable means the complaint is incomplete / outside the scope of the mutual fund
Trustees’ ReportFor the year ended March 31, 2021 (Contd...)

10
Abridged Annual Report 2020 - 2021
Trustees’ ReportFor the year ended March 31, 2021 (Contd...)
8. INvESTOR EDUCATION INITIATIvES Investor awareness advertisements were published in Mutual Fund Insight magazine on a monthly basis along with an editorial on ‘SIP Sahi Hai’. Additionally, monthly articles / blogs have been written by Advisorkhoj on IAP which talks of the advantages of SIP, start early, power of compounding, diversification, asset allocation etc. The same is promoted by the publisher via an email to their entire network and also on their social media handles which can be retweeted or liked. Also, educative infographics have been hosted on our website under the investor resources section. The same have also been circulated to existing Indian investors via email for engagement and for educative purposes.
9. PROxY vOTING POLICYIn terms of SEBI Circular no. SEBI/IMD/CIR No. 18/198647/2010 dated March 15, 2010, the Fund has adopted Proxy Voting Policy and Procedures for exercising voting rights in respect of securities held by the Schemes.
The summary of the votes casted in the general meetings of the Investee companies, by the AMC for and on behalf of the Schemes of the Fund, for the financial year 2020-2021 is provided below:
quarter Total no. of resolutions
Break-up of vote decision
For Against Abstained
June 2020 50 43 6 1
September 2020 752 656 38 58
December 2020 41 31 1 9
March 2021 40 30 8 2
Total 883 760 53 70
In terms of the requirement of SEBI Circular no. CIR/IMD/DF/05/2014 dated March 24, 2014 and SEBI/HO/IMD/DF2/CIR/P/2016/68 dated August 10, 2016; the AMC has obtained certificate from M/s. M. P. Chitale & Co., Chartered Accountants, who is acting as a Scrutinizer, on the voting report for the FY 2020-21. The certificate dated April 14, 2021 issued by M/s. M. P. Chitale & Co., is available on the website of the AMC as part of the full Annual Report.
Unit holders can refer to the full Annual Report for complete details of actual exercise of votes in the general meetings of the investee companies for the financial year 2020-21 or log on to our website at www.assetmanagement.hsbc.co.in.
10. STATUTORY DETAILSa) The Sponsors are not responsible or liable for any loss resulting from the operation of the Schemes of
the Fund beyond initial contribution of Rs. 1 lakh for setting up the Fund.
b) The price and redemption value of the units, and income from them, can go up as well as down with fluctuations in the market value of its underlying investments.
c) Full Annual Report of HSBC Mutual Fund and of HSBC Asset Management (India) Private Limited (the AMC) shall be disclosed on the website at www.assetmanagement.hsbc.co.in and shall be available for inspection at the Head Office of the Mutual Fund. Present and prospective unit holders can obtain copy of the Trust Deed, the full Annual Report of the Scheme(s), the Annual Report of HSBC Asset Management (India) Private Limited and the text of the relevant Scheme(s) at a price.
11. SCHEME WISE CHANGES IN RISk-O-METER OF THE SCHEMES OF HSBC MUTUAL FUND DURING FY 2021
As per the requirements of SEBI Circular no. SEBI/HO/IMD/DF3/CIR/P/2020/197 dated October 05, 2020 the changes carried out in the risk-o-meter of the schemes of HSBC Mutual Fund during FY 2021 have been given in the below mentioned table for the information of the Unitholders, a report on the said changes has also been displayed on the website of the Fund and AMFI.
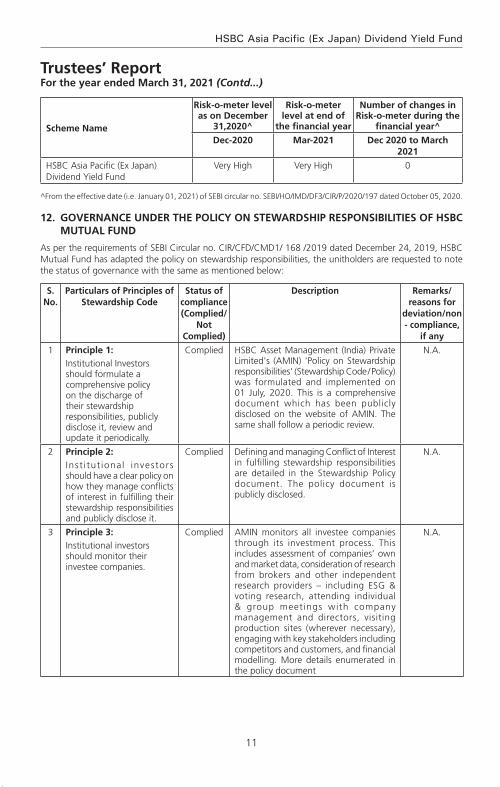
11
HSBC Asia Pacific (Ex Japan) Dividend Yield Fund
Trustees’ ReportFor the year ended March 31, 2021 (Contd...)
Scheme Name
Risk-o-meter level as on December
31,2020^
Risk-o-meter level at end of
the financial year
Number of changes in Risk-o-meter during the
financial year^
Dec-2020 Mar-2021 Dec 2020 to March 2021
HSBC Asia Pacific (Ex Japan) Dividend Yield Fund
Very High Very High 0
^From the effective date (i.e. January 01, 2021) of SEBI circular no. SEBI/HO/IMD/DF3/CIR/P/2020/197 dated October 05, 2020.
12. GOvERNANCE UNDER THE POLICY ON STEWARDSHIP RESPONSIBILITIES OF HSBC MUTUAL FUND
As per the requirements of SEBI Circular no. CIR/CFD/CMD1/ 168 /2019 dated December 24, 2019, HSBC Mutual Fund has adapted the policy on stewardship responsibilities, the unitholders are requested to note the status of governance with the same as mentioned below:
S. No.
Particulars of Principles of Stewardship Code
Status of compliance (Complied/
Not Complied)
Description Remarks/reasons for
deviation/non - compliance,
if any
1 Principle 1:Institutional Investors should formulate a comprehensive policy on the discharge of their stewardship responsibilities, publicly disclose it, review and update it periodically.
Complied HSBC Asset Management (India) Private Limited's (AMIN) 'Policy on Stewardship responsibilities' (Stewardship Code / Policy) was formulated and implemented on 01 July, 2020. This is a comprehensive document which has been publicly disclosed on the website of AMIN. The same shall follow a periodic review.
N.A.
2 Principle 2:Inst i tut ional investors should have a clear policy on how they manage conflicts of interest in fulfilling their stewardship responsibilities and publicly disclose it.
Complied Defining and managing Conflict of Interest in fulfilling stewardship responsibilities are detailed in the Stewardship Policy document. The policy document is publicly disclosed.
N.A.
3 Principle 3:Institutional investors should monitor their investee companies.
Complied AMIN monitors all investee companies through its investment process. This includes assessment of companies’ own and market data, consideration of research from brokers and other independent research providers – including ESG & voting research, attending individual & group meetings with company management and directors, visiting production sites (wherever necessary), engaging with key stakeholders including competitors and customers, and financial modelling. More details enumerated in the policy document
N.A.
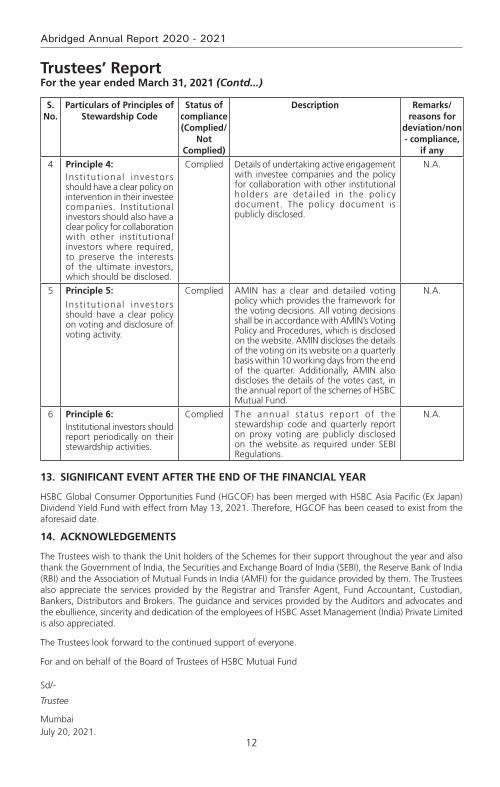
12
Abridged Annual Report 2020 - 2021
S. No.
Particulars of Principles of Stewardship Code
Status of compliance (Complied/
Not Complied)
Description Remarks/reasons for
deviation/non - compliance,
if any
4 Principle 4:Inst i tut ional investors should have a clear policy on intervention in their investee companies. Institutional investors should also have a clear policy for collaboration with other institutional investors where required, to preserve the interests of the ultimate investors, which should be disclosed.
Complied Details of undertaking active engagement with investee companies and the policy for collaboration with other institutional holders are detailed in the policy document. The policy document is publicly disclosed.
N.A.
5 Principle 5:
Inst i tut ional investors should have a clear policy on voting and disclosure of voting activity.
Complied AMIN has a clear and detailed voting policy which provides the framework for the voting decisions. All voting decisions shall be in accordance with AMIN’s Voting Policy and Procedures, which is disclosed on the website. AMIN discloses the details of the voting on its website on a quarterly basis within 10 working days from the end of the quarter. Additionally, AMIN also discloses the details of the votes cast, in the annual report of the schemes of HSBC Mutual Fund.
N.A.
6 Principle 6:Institutional investors should report periodically on their stewardship activities.
Complied The annual status report of the stewardship code and quarterly report on proxy voting are publicly disclosed on the website as required under SEBI Regulations.
N.A.
13. SIGNIFICANT EvENT AFTER THE END OF THE FINANCIAL YEAR
HSBC Global Consumer Opportunities Fund (HGCOF) has been merged with HSBC Asia Pacific (Ex Japan) Dividend Yield Fund with effect from May 13, 2021. Therefore, HGCOF has been ceased to exist from the aforesaid date.
14. ACkNOWLEDGEMENTS
The Trustees wish to thank the Unit holders of the Schemes for their support throughout the year and also thank the Government of India, the Securities and Exchange Board of India (SEBI), the Reserve Bank of India (RBI) and the Association of Mutual Funds in India (AMFI) for the guidance provided by them. The Trustees also appreciate the services provided by the Registrar and Transfer Agent, Fund Accountant, Custodian, Bankers, Distributors and Brokers. The guidance and services provided by the Auditors and advocates and the ebullience, sincerity and dedication of the employees of HSBC Asset Management (India) Private Limited is also appreciated.
The Trustees look forward to the continued support of everyone.
For and on behalf of the Board of Trustees of HSBC Mutual Fund
Sd/-
Trustee
MumbaiJuly 20, 2021.
Trustees’ ReportFor the year ended March 31, 2021 (Contd...)

13
HSBC Asia Pacific (Ex Japan) Dividend Yield Fund
To the Trustees of HSBC Mutual Fund
HSBC Asia Pacific (Ex Japan) Dividend Yield Fund
Report on the Audit of the Financial Statements
OpinionWe have audited the financial statements of HSBC Asia Pacific (Ex Japan) Dividend Yield Fund (the ‘Scheme’) of HSBC Mutual Fund, which comprise the balance sheet as at 31 March 2021 and the revenue account for the year then ended, and notes to the financial statements, including a summary of the significant accounting policies.
In our opinion and to the best of our information and according to the explanations given to us, the aforesaid financial statements give a true and fair view in conformity with the accounting principles generally accepted in India, of the state of affairs of the Scheme as at 31 March 2021, its net surplus for the year ended on that date.
Basis for OpinionWe conducted our audit in accordance with the Standards on Auditing (‘SAs’) issued by the Institute of Chartered Accountants of India (the ‘ICAI’). Our responsibilities under those SAs are further described in the Auditor’s Responsibilities for the Audit of the Financial Statements section of our report. We are independent of the Scheme in accordance with the Code of Ethics issued by the ICAI, and we have fulfilled our other ethical responsibilities in accordance with the Code of Ethics. We believe that the audit evidence we have obtained is sufficient and appropriate to provide a basis for our opinion.
Responsibilities of Management and Those Charged with Governance for the Financial StatementsThe Scheme’s management, the Board of Directors of HSBC Mutual Fund (the ‘Trustees’) and the Board of Directors of HSBC Asset Management (India) Private Limited (the ‘AMC’) (collectively referred to as ‘Management’) are responsible for the preparation of these financial statements that give a true and fair view of the state of affairs, results of operations of the Scheme in accordance with the accounting policies and standards specified in the Ninth Schedule of the Securities and Exchange Board of India (Mutual Funds) Regulations, 1996, as amended (the ‘Regulations’) and the accounting principles generally accepted in India. This responsibility includes design, implementation and maintenance of internal control relevant to the preparation and presentation of the financial statements that give a true and fair view and are free from material misstatement, whether due to fraud or error.
In preparing the financial statements, management is responsible for assessing the Scheme’s ability to continue as a going concern, disclosing, as applicable, matters related to going concern and using the going concern basis of accounting unless management either intends to liquidate the Scheme or to cease operations, or has no realistic alternative but to do so.
The management is responsible for overseeing the Scheme’s financial reporting process.
Auditor’s Responsibilities for the Audit of the Financial StatementsOur objectives are to obtain reasonable assurance about whether the financial statements as a whole are free from material misstatement, whether due to fraud or error, and to issue an auditor’s report that includes our opinion. Reasonable assurance is a high level of assurance, but is not a guarantee that an audit conducted in accordance with SAs will always detect a material misstatement when it exists. Misstatements can arise from fraud or error and are considered material if, individually or in the aggregate, they could reasonably be expected to influence the economic decisions of users taken on the basis of these financial statements.
As part of an audit in accordance with SAs, we exercise professional judgment and maintain professional skepticism throughout the audit. We also:
• Identifyandassesstherisksofmaterialmisstatementofthefinancialstatements,whetherduetofraudor error, design and perform audit procedures responsive to those risks, and obtain audit evidence that is sufficient and appropriate to provide a basis for our opinion. The risk of not detecting a material
Independent Auditors’ Report
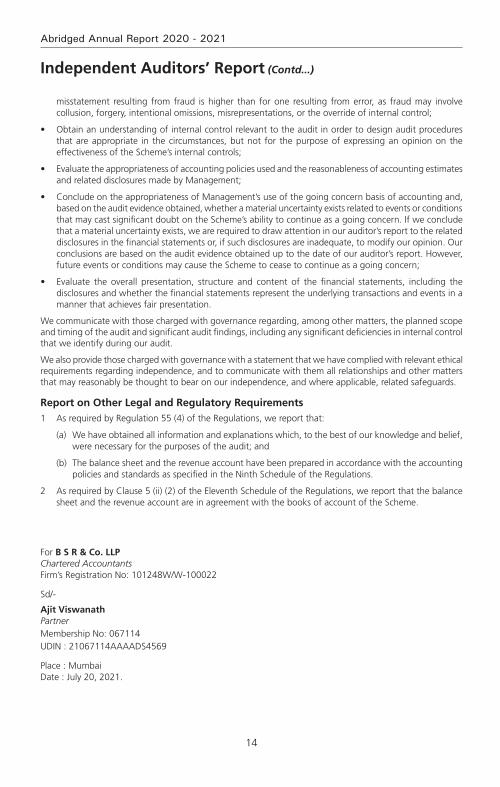
14
Abridged Annual Report 2020 - 2021
Independent Auditors’ Report (Contd...)
misstatement resulting from fraud is higher than for one resulting from error, as fraud may involve collusion, forgery, intentional omissions, misrepresentations, or the override of internal control;
• Obtainanunderstandingofinternalcontrolrelevanttotheauditinordertodesignauditproceduresthat are appropriate in the circumstances, but not for the purpose of expressing an opinion on the effectiveness of the Scheme’s internal controls;
• Evaluatetheappropriatenessofaccountingpoliciesusedandthereasonablenessofaccountingestimatesand related disclosures made by Management;
• ConcludeontheappropriatenessofManagement’suseofthegoingconcernbasisofaccountingand,based on the audit evidence obtained, whether a material uncertainty exists related to events or conditions that may cast significant doubt on the Scheme’s ability to continue as a going concern. If we conclude that a material uncertainty exists, we are required to draw attention in our auditor’s report to the related disclosures in the financial statements or, if such disclosures are inadequate, to modify our opinion. Our conclusions are based on the audit evidence obtained up to the date of our auditor’s report. However, future events or conditions may cause the Scheme to cease to continue as a going concern;
• Evaluate the overall presentation, structure and content of the financial statements, including thedisclosures and whether the financial statements represent the underlying transactions and events in a manner that achieves fair presentation.
We communicate with those charged with governance regarding, among other matters, the planned scope and timing of the audit and significant audit findings, including any significant deficiencies in internal control that we identify during our audit.
We also provide those charged with governance with a statement that we have complied with relevant ethical requirements regarding independence, and to communicate with them all relationships and other matters that may reasonably be thought to bear on our independence, and where applicable, related safeguards.
Report on Other Legal and Regulatory Requirements 1 As required by Regulation 55 (4) of the Regulations, we report that:
(a) We have obtained all information and explanations which, to the best of our knowledge and belief, were necessary for the purposes of the audit; and
(b) The balance sheet and the revenue account have been prepared in accordance with the accounting policies and standards as specified in the Ninth Schedule of the Regulations.
2 As required by Clause 5 (ii) (2) of the Eleventh Schedule of the Regulations, we report that the balance sheet and the revenue account are in agreement with the books of account of the Scheme.
For B S R & Co. LLP Chartered Accountants Firm’s Registration No: 101248W/W-100022
Sd/-
Ajit Viswanath PartnerMembership No: 067114UDIN : 21067114AAAADS4569
Place : Mumbai Date : July 20, 2021.
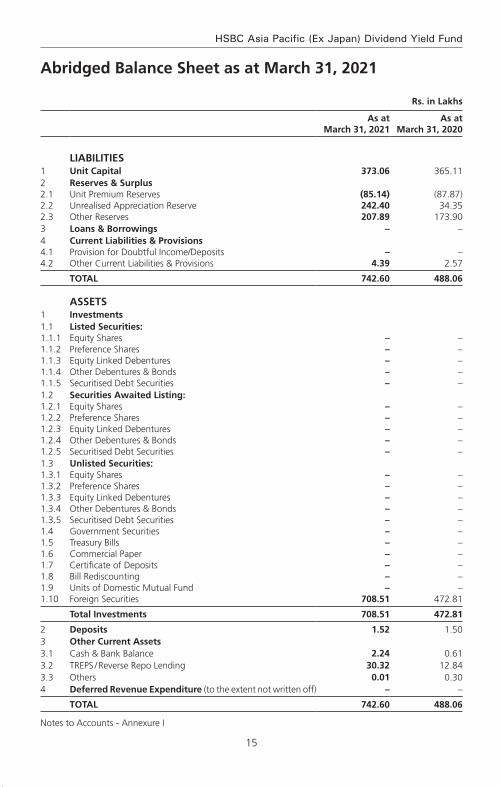
15
HSBC Asia Pacific (Ex Japan) Dividend Yield Fund
Rs. in Lakhs
As at March 31, 2021
As at March 31, 2020
LIABILITIES1 Unit Capital 373.06 365.11 2 Reserves & Surplus2.1 Unit Premium Reserves (85.14) (87.87)2.2 Unrealised Appreciation Reserve 242.40 34.35 2.3 Other Reserves 207.89 173.90 3 Loans & Borrowings – –4 Current Liabilities & Provisions4.1 Provision for Doubtful Income/Deposits – –4.2 Other Current Liabilities & Provisions 4.39 2.57
TOTAL 742.60 488.06
ASSETS1 Investments1.1 Listed Securities:1.1.1 Equity Shares – – 1.1.2 Preference Shares – – 1.1.3 Equity Linked Debentures – – 1.1.4 Other Debentures & Bonds – – 1.1.5 Securitised Debt Securities – – 1.2 Securities Awaited Listing:1.2.1 Equity Shares – – 1.2.2 Preference Shares – – 1.2.3 Equity Linked Debentures – – 1.2.4 Other Debentures & Bonds – – 1.2.5 Securitised Debt Securities – – 1.3 Unlisted Securities:1.3.1 Equity Shares – – 1.3.2 Preference Shares – – 1.3.3 Equity Linked Debentures – – 1.3.4 Other Debentures & Bonds – – 1.3.5 Securitised Debt Securities – – 1.4 Government Securities – – 1.5 Treasury Bills – – 1.6 Commercial Paper – – 1.7 Certificate of Deposits – – 1.8 Bill Rediscounting – – 1.9 Units of Domestic Mutual Fund – – 1.10 Foreign Securities 708.51 472.81
Total Investments 708.51 472.81
2 Deposits 1.52 1.50 3 Other Current Assets3.1 Cash & Bank Balance 2.24 0.61 3.2 TREPS / Reverse Repo Lending 30.32 12.84 3.3 Others 0.01 0.30 4 Deferred Revenue Expenditure (to the extent not written off) – –
TOTAL 742.60 488.06
Notes to Accounts - Annexure I
Abridged Balance Sheet as at March 31, 2021
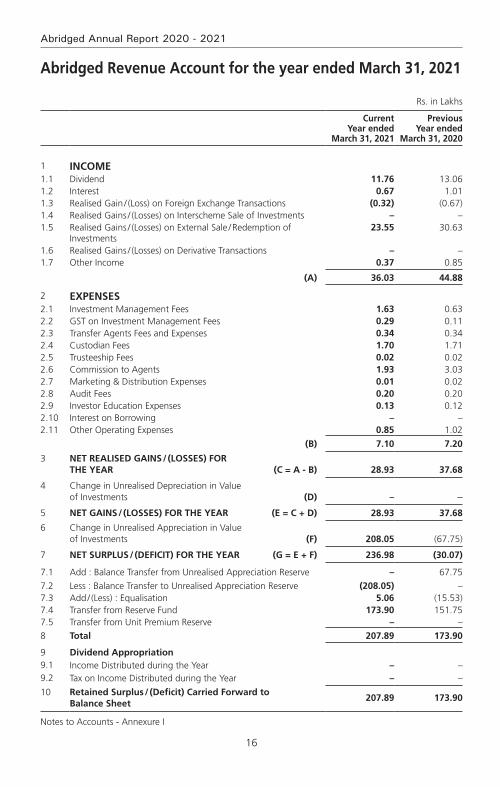
16
Abridged Annual Report 2020 - 2021
Abridged Revenue Account for the year ended March 31, 2021
Rs. in Lakhs
Current Year ended
March 31, 2021
Previous Year ended
March 31, 2020
1 INCOME1.1 Dividend 11.76 13.06 1.2 Interest 0.67 1.01 1.3 Realised Gain / (Loss) on Foreign Exchange Transactions (0.32) (0.67)1.4 Realised Gains / (Losses) on Interscheme Sale of Investments – –1.5 Realised Gains / (Losses) on External Sale / Redemption of
Investments 23.55 30.63
1.6 Realised Gains / (Losses) on Derivative Transactions – –1.7 Other Income 0.37 0.85
(A) 36.03 44.88
2 ExPENSES2.1 Investment Management Fees 1.63 0.63 2.2 GST on Investment Management Fees 0.29 0.11 2.3 Transfer Agents Fees and Expenses 0.34 0.34 2.4 Custodian Fees 1.70 1.71 2.5 Trusteeship Fees 0.02 0.02 2.6 Commission to Agents 1.93 3.03 2.7 Marketing & Distribution Expenses 0.01 0.02 2.8 Audit Fees 0.20 0.20 2.9 Investor Education Expenses 0.13 0.12 2.10 Interest on Borrowing – –2.11 Other Operating Expenses 0.85 1.02
(B) 7.10 7.20
3 NET REALISED GAINS / (LOSSES) FOR THE YEAR (C = A - B) 28.93 37.68
4 Change in Unrealised Depreciation in Value of Investments (D) – –
5 NET GAINS / (LOSSES) FOR THE YEAR (E = C + D) 28.93 37.68
6 Change in Unrealised Appreciation in Value of Investments (F) 208.05 (67.75)
7 NET SURPLUS / (DEFICIT) FOR THE YEAR (G = E + F) 236.98 (30.07)
7.1 Add : Balance Transfer from Unrealised Appreciation Reserve – 67.75
7.2 Less : Balance Transfer to Unrealised Appreciation Reserve (208.05) –7.3 Add / (Less) : Equalisation 5.06 (15.53)7.4 Transfer from Reserve Fund 173.90 151.75 7.5 Transfer from Unit Premium Reserve – –
8 Total 207.89 173.90
9 Dividend Appropriation9.1 Income Distributed during the Year – –9.2 Tax on Income Distributed during the Year – –
10 Retained Surplus / (Deficit) Carried Forward to Balance Sheet
207.89 173.90
Notes to Accounts - Annexure I

17
HSBC Asia Pacific (Ex Japan) Dividend Yield Fund
key Statistics for the year ended March 31, 2021
Current Year ended
March 31, 2021
Previous Year ended
March 31, 2020
1. NAV per unit (Rs.):
Open
Regular Plan Growth Option 13.1734 14.2247
Regular Plan IDCW Option 13.1734 14.2247
Direct Plan - Growth Option 13.7538 14.7458
Direct Plan - IDCW Option 13.7495 14.7458
High
Regular Plan Growth Option 19.7682 16.0827
Regular Plan IDCW Option 19.7682 16.0827
Direct Plan - Growth Option 20.7877 16.7629
Direct Plan - IDCW Option 20.7794 16.7580
Low
Regular Plan Growth Option 12.9281 11.6819
Regular Plan IDCW Option 12.9281 11.6819
Direct Plan - Growth Option 13.4980 12.1932
Direct Plan - IDCW Option 13.4938 12.1895
End
Regular Plan Growth Option 19.3173 13.1734
Regular Plan IDCW Option 19.3173 13.1734
Direct Plan - Growth Option 20.3285 13.7538
Direct Plan - IDCW Option 20.3203 13.7495
2. Closing Assets Under Management (Rs. in Lakhs)
End 736 485
Average (AAuM)1 635 580
3. Gross income as % of AAuM2 5.67% 7.74%
4. Expense Ratio:
a. Total Expense as % of AAuM (including GST on Management fees) (planwise)
Regular Plan (Continue) 1.42% 1.38%
Direct Plan 0.64% 0.66%
b. Management Fee as % of AAuM (planwise)
Regular Plan (Continue) 0.35% 0.12%
Direct Plan 0.10% 0.06%
5. Net Income as a percentage of AAuM3 4.55% 6.49%
6. Portfolio turnover ratio4 0.16 0.19
7. Total Dividend per unit distributed during the year (planwise)
Retail
Regular Plan IDCW Option – –
Direct Plan - IDCW Option – –
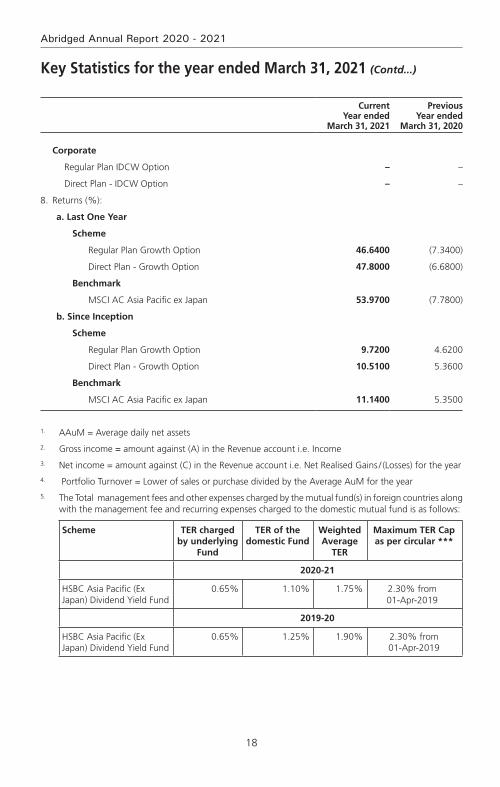
18
Abridged Annual Report 2020 - 2021
Current Year ended
March 31, 2021
Previous Year ended
March 31, 2020
Corporate
Regular Plan IDCW Option – –
Direct Plan - IDCW Option – –
8. Returns (%):
a. Last One Year
Scheme
Regular Plan Growth Option 46.6400 (7.3400)
Direct Plan - Growth Option 47.8000 (6.6800)
Benchmark
MSCI AC Asia Pacific ex Japan 53.9700 (7.7800)
b. Since Inception
Scheme
Regular Plan Growth Option 9.7200 4.6200
Direct Plan - Growth Option 10.5100 5.3600
Benchmark
MSCI AC Asia Pacific ex Japan 11.1400 5.3500
1. AAuM = Average daily net assets
2. Gross income = amount against (A) in the Revenue account i.e. Income
3. Net income = amount against (C) in the Revenue account i.e. Net Realised Gains / (Losses) for the year
4. Portfolio Turnover = Lower of sales or purchase divided by the Average AuM for the year
5. The Total management fees and other expenses charged by the mutual fund(s) in foreign countries along with the management fee and recurring expenses charged to the domestic mutual fund is as follows:
Scheme TER charged by underlying
Fund
TER of the domestic Fund
Weighted Average
TER
Maximum TER Cap as per circular ***
2020-21
HSBC Asia Pacific (Ex Japan) Dividend Yield Fund
0.65% 1.10% 1.75% 2.30% from 01-Apr-2019
2019-20
HSBC Asia Pacific (Ex Japan) Dividend Yield Fund
0.65% 1.25% 1.90% 2.30% from 01-Apr-2019
key Statistics for the year ended March 31, 2021 (Contd...)

19
HSBC Asia Pacific (Ex Japan) Dividend Yield Fund
Notes to Accounts – Annexure ITo the Abridged Balance Sheet and Revenue Account for the Year ended March 31, 2021
1 Investments:
1.1. It is confirmed that investments of the Scheme are registered in the name of the Trustees for the benefit of the Scheme’s unitholders.
1.2. Open Positions of derivatives as of years ended March 31, 2021 and March 31, 2020 is NIL.
1.3. Investments in Associates and Group Companies:(Rupees)
Issuer Instrument Type
Amount Aggregate Investments
by all schemes
Amount Aggregate Investments
by all schemes
2021 2020
Balrampur Chini Mills Ltd.
Equities – 56,482,738 – –
Bharti Airtel Ltd. Equities – 470,907,573 – 594,575,759
Max Financial Services Ltd.
Equities – 172,035,228 – –
1.4. Open positions of Securities Borrowed and / or Lent by the Scheme as of the years ended March 31, 2021 and March 31, 2020 are NIL.
1.5. Investment in Below investment grade and default / Securities in default beyond its maturity date as on March 31, 2021 and March 31, 2020 are NIL.
1.6. Aggregate Unrealised Gain / Loss as at the end of the financial years end and their percentages to net assets are as under:
Security Category Amount (Rs.)
Percentage to Net Assets
Amount (Rs.)
Percentage to Net Assets
2021 2020
Foreign Securities
– Appreciation 24,228,717 32.91% 3,423,710 7.05%
– Depreciation – – – –
1.7 The aggregate value of investments securities (excluding TREPS and Reverse Repos) purchased and sold (including matured) during the financial period 2020-2021 (excluding accretion of discount) is Rs. 10,450,888 and 10,042,155 respectively being 16.45% and 15.81% of the average daily net assets.
The aggregate value of investments securities (excluding TREPS and Reverse Repos) purchased and sold (including matured) during the financial period 2019-2020 (excluding accretion of discount) is Rs. 11,072,962 and 16,824,496 respectively being 19.09% and 29.00% of the average daily net assets.
1.8. Non-Traded securities in the portfolios as at March 31, 2021 and March 31, 2020 are NIL.
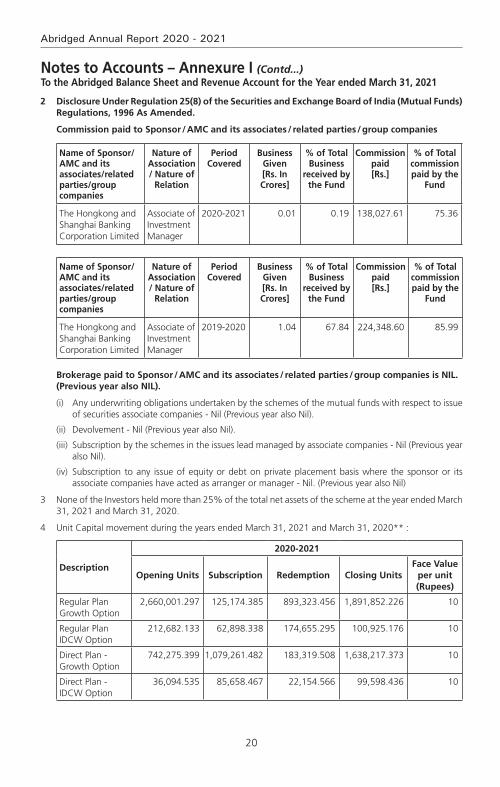
20
Abridged Annual Report 2020 - 2021
2 Disclosure Under Regulation 25(8) of the Securities and Exchange Board of India (Mutual Funds) Regulations, 1996 As Amended.
Commission paid to Sponsor / AMC and its associates / related parties / group companies
Name of Sponsor/AMC and its associates/related parties/group companies
Nature of Association / Nature of
Relation
Period Covered
Business Given [Rs. In Crores]
% of Total Business
received by the Fund
Commission paid [Rs.]
% of Total commission paid by the
Fund
The Hongkong and Shanghai Banking Corporation Limited
Associate of Investment Manager
2020-2021 0.01 0.19 138,027.61 75.36
Name of Sponsor/AMC and its associates/related parties/group companies
Nature of Association / Nature of
Relation
Period Covered
Business Given [Rs. In Crores]
% of Total Business
received by the Fund
Commission paid [Rs.]
% of Total commission paid by the
Fund
The Hongkong and Shanghai Banking Corporation Limited
Associate of Investment Manager
2019-2020 1.04 67.84 224,348.60 85.99
Brokerage paid to Sponsor / AMC and its associates / related parties / group companies is NIL. (Previous year also NIL).
(i) Any underwriting obligations undertaken by the schemes of the mutual funds with respect to issue of securities associate companies - Nil (Previous year also Nil).
(ii) Devolvement - Nil (Previous year also Nil).
(iii) Subscription by the schemes in the issues lead managed by associate companies - Nil (Previous year also Nil).
(iv) Subscription to any issue of equity or debt on private placement basis where the sponsor or its associate companies have acted as arranger or manager - Nil. (Previous year also Nil)
3 None of the Investors held more than 25% of the total net assets of the scheme at the year ended March 31, 2021 and March 31, 2020.
4 Unit Capital movement during the years ended March 31, 2021 and March 31, 2020** :
Description
2020-2021
Opening Units Subscription Redemption Closing UnitsFace value
per unit (Rupees)
Regular Plan Growth Option
2,660,001.297 125,174.385 893,323.456 1,891,852.226 10
Regular Plan IDCW Option
212,682.133 62,898.338 174,655.295 100,925.176 10
Direct Plan - Growth Option
742,275.399 1,079,261.482 183,319.508 1,638,217.373 10
Direct Plan - IDCW Option
36,094.535 85,658.467 22,154.566 99,598.436 10
Notes to Accounts – Annexure I (Contd...)To the Abridged Balance Sheet and Revenue Account for the Year ended March 31, 2021

21
HSBC Asia Pacific (Ex Japan) Dividend Yield Fund
Description
2019-2020
Opening Units Subscription Redemption Closing UnitsFace value
per unit (Rupees)
Regular Plan Growth Option
2,766,039.111 832,258.138 938,295.952 2,660,001.297 10
Regular Plan IDCW Option
629,618.415 60,017.932 476,954.214 212,682.133 10
Direct Plan - Growth Option
648,213.059 166,456.857 72,394.517 742,275.399 10
Direct Plan - IDCW Option
21,196.866 27,034.936 12,137.267 36,094.535 10
** Units held by the AMC (Seed Capital) in Direct Plan Growth Option as on 31/03/2021 is 434,480.361 & as on 31/03/2020 is 434,480.361
5 No contingent liabilities for the years ended March 31, 2021 and March 31, 2020.
6 Expenses other than Management Fees are Inclusive of GST where applicable.
7 Other income credited to the scheme of Rs. 37,202 represents Exit load credited to the scheme & Penal Interest received from Bank towards delay of RTGS/NEFT.
(2020 :- Rs. 84,824 represents Exit load credited to the scheme.)
8 Investor Education Awareness
In view of the AMFI Best Practices Guidelines Circular No. 56/2015-16, the IEF (Investor Education Fund) accrual is set aside in a separate bank account and the consolidated balance across all schemes as on March 31, 2021. The break-up of which is as under:
Particulars March 31, 2021 March 31, 2020
Amount (in Rs. Lacs) Amount (in Rs. Lacs)
Opening Balance as on April 01, 2020 307.40 214.68
Add: Accrual during FY 2020-21 195.77 237.54
Less: Transferred to AMFI * 89.04 109.69
Less: Payable to AMFI (March 2021 accrual) * 8.84 9.08
Add: Investment Income FY 2020-21 11.94 15.93
Less: Spent during FY 2020-21 43.73 41.98
Closing Balance as on March 31, 2021 373.49 307.40
*In accordance with SEBI circular number SEBI/HO/IMD/DF2/RS/813/2016 dated January 8, 2016.
9 Previous year’s figures have been re-grouped / re-arranged where appropriate.
10 Following the spread of the coronavirus, on 11 March 2020, the World Health Organization declared the COVID-19 outbreak to be a pandemic. The identification of the virus as a new coronavirus, its subsequent spread and the situation of lock-down across India is considered as a significant event. HSBC Mutual Fund’s operations are included in essential services and have continued through the lock-downs declared by the Government. Service providers like the Registrar and Transfer Agent, Custodian and Fund Accountant have carried out extensive arrangements to address business needs and continuity of operations. As on the date of signing of these financial statements, Management believes that it has taken into account, all the possible impact of known events arising from COVID-19 pandemic in the preparation of the financial statements and there appears to be no uncertainties relating to the going
Notes to Accounts – Annexure I (Contd...)To the Abridged Balance Sheet and Revenue Account for the Year ended March 31, 2021
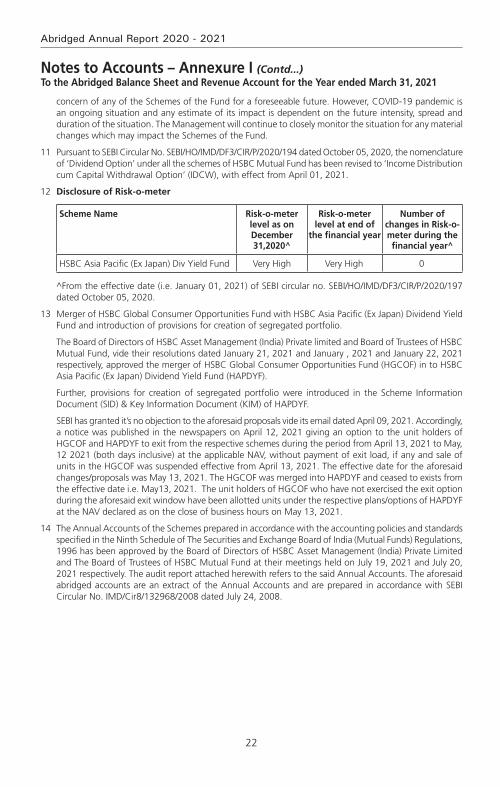
22
Abridged Annual Report 2020 - 2021
concern of any of the Schemes of the Fund for a foreseeable future. However, COVID-19 pandemic is an ongoing situation and any estimate of its impact is dependent on the future intensity, spread and duration of the situation. The Management will continue to closely monitor the situation for any material changes which may impact the Schemes of the Fund.
11 Pursuant to SEBI Circular No. SEBI/HO/IMD/DF3/CIR/P/2020/194 dated October 05, 2020, the nomenclature of ‘Dividend Option’ under all the schemes of HSBC Mutual Fund has been revised to ‘Income Distribution cum Capital Withdrawal Option’ (IDCW), with effect from April 01, 2021.
12 Disclosure of Risk-o-meter
Scheme Name Risk-o-meter level as on December 31,2020^
Risk-o-meter level at end of
the financial year
Number of changes in Risk-o-meter during the financial year^
HSBC Asia Pacific (Ex Japan) Div Yield Fund Very High Very High 0
^From the effective date (i.e. January 01, 2021) of SEBI circular no. SEBI/HO/IMD/DF3/CIR/P/2020/197 dated October 05, 2020.
13 Merger of HSBC Global Consumer Opportunities Fund with HSBC Asia Pacific (Ex Japan) Dividend Yield Fund and introduction of provisions for creation of segregated portfolio.
The Board of Directors of HSBC Asset Management (India) Private limited and Board of Trustees of HSBC Mutual Fund, vide their resolutions dated January 21, 2021 and January , 2021 and January 22, 2021 respectively, approved the merger of HSBC Global Consumer Opportunities Fund (HGCOF) in to HSBC Asia Pacific (Ex Japan) Dividend Yield Fund (HAPDYF).
Further, provisions for creation of segregated portfolio were introduced in the Scheme Information Document (SID) & Key Information Document (KIM) of HAPDYF.
SEBI has granted it’s no objection to the aforesaid proposals vide its email dated April 09, 2021. Accordingly, a notice was published in the newspapers on April 12, 2021 giving an option to the unit holders of HGCOF and HAPDYF to exit from the respective schemes during the period from April 13, 2021 to May, 12 2021 (both days inclusive) at the applicable NAV, without payment of exit load, if any and sale of units in the HGCOF was suspended effective from April 13, 2021. The effective date for the aforesaid changes/proposals was May 13, 2021. The HGCOF was merged into HAPDYF and ceased to exists from the effective date i.e. May13, 2021. The unit holders of HGCOF who have not exercised the exit option during the aforesaid exit window have been allotted units under the respective plans/options of HAPDYF at the NAV declared as on the close of business hours on May 13, 2021.
14 The Annual Accounts of the Schemes prepared in accordance with the accounting policies and standards specified in the Ninth Schedule of The Securities and Exchange Board of India (Mutual Funds) Regulations, 1996 has been approved by the Board of Directors of HSBC Asset Management (India) Private Limited and The Board of Trustees of HSBC Mutual Fund at their meetings held on July 19, 2021 and July 20, 2021 respectively. The audit report attached herewith refers to the said Annual Accounts. The aforesaid abridged accounts are an extract of the Annual Accounts and are prepared in accordance with SEBI Circular No. IMD/Cir8/132968/2008 dated July 24, 2008.
Notes to Accounts – Annexure I (Contd...)To the Abridged Balance Sheet and Revenue Account for the Year ended March 31, 2021
23
HSBC Asia Pacific (Ex Japan) Dividend Yield Fund
voting Policy and Procedures
In view of SEBI guidelines related to “Role of Mutual Funds in Corporate Governance of Public Listed Companies”, HSBC AMC has formulated its “Policy for Proxy Voting in Public Listed Companies”. The said policy is available on our website and the details of actual exercise of proxy votes, the summary of votes casted and the auditor’s certificate for the Financial Year 2020 – 21 is forming part of our full Annual Report for the Financial Year 2020 – 21 which is uploaded on our website at http://www.assetmanagement.hsbc.co.in

24
Abridged Annual Report 2020 - 2021
Statutory Details & Disclaimers
All the returns have been sourced from Mutual Funds India Explorer software. The performance of the schemes and the benchmark is calculated on a total return basis. This document has been prepared by HSBC Asset Management (India) Private Ltd (HSBC) for information purposes only and should not be construed as i) an offer or recommendation to buy or sell securities, commodities, currencies or other investments referred to herein; or ii) an offer to sell or a solicitation or an offer for purchase of any of the funds of HSBC Mutual Fund; or iii) an investment research or investment advice. All information contained in this document (including that sourced from third parties), is obtained from sources HSBC and the third party which HSBC believes to be reliable however, has not independently verified the same. The information and opinions contained within the document are based upon publicly available information and rates of taxation applicable (if any) at the time of publication, which are subject to change from time to time.
Expressions of opinion are those of HSBC only and are subject to change without notice. It does not have regard to specific investment objectives, financial situation and the particular needs of any specific person who may receive this document. Investors should seek personal and independent advice regarding the appropriateness of investing in any of the funds, securities, other investment or investment strategies that may have been discussed or referred herein and should understand that the views regarding future prospects may or may not be realized. In no event shall HSBC Mutual Fund / HSBC Asset management (India) Private Limited and / or its affiliates or any of their directors, trustees, officers and employees be liable for any direct, indirect, special, incidental or consequential damages arising out of the use of information / opinion herein. Neither this document nor the units of HSBC Mutual Fund have been registered in any jurisdiction. The distribution of this document in certain jurisdictions may be restricted or totally prohibited and accordingly, persons who come into possession of this document are required to inform themselves about, and to observe, any such restrictions.
Mutual Fund investments are subject to market risks, read all scheme related documents carefully.
HSBC Global Consumer Opportunities Fund – Benefiting From China’s Growing Consumption PowerAn open ended fund of fund Scheme investing in HSBC Global Investments Fund - China Consumer Opportunities Fund
Abridged Annual Report 2020 - 2021

1
HSBC Global Consumer Opportunities Fund – Benefiting From China’s Growing Consumption Power
Dear Investor,
The beginning of the last financial year now almost seems like a distant memory. COVID-19 was still a relatively unknown enemy and governments across the world were grappling with ways to control and mitigate the risks associated with it. Nationwide lockdowns were the norm and our markets both equity and fixed income reacted negatively leading to significant erosion of wealth. Within a short period of time markets bounced back. This confounded even the most astute market pundits. How is it possible that when GDP growth had slowed down, unemployment had risen, inflation was high could there be such sharp up move in equity indices. Whilst the reasons are well known about easy global liquidity, demand resurgence, cost cutting by corporates etc. perhaps its most important to remember that the markets are not a reflector but a predictor of economic activity.
At all times particularly during such volatile times it is important to go back to the basics. Why do you save, why do you invest, what goals would you like to achieve, how old are you, what is your risk appetite? The replies to these simple questions will help you determine your asset allocation. As an example when equity markets corrected sharply last year, investors who reviewed their asset allocation, stayed invested during the lows of the past year and were able to capture the rebound and have seen prime returns since then. The current market movement in all likelihood would have also led to some imbalances in your asset allocation. Do not ignore that and I strongly recommend that you do review this with your advisor to check whether re-balancing is required.
During this financial year we had three very successful new fund launches. The pandemic showed us a clear trend of dominant players becoming stronger and profit pool getting consolidated within a few companies. To capture this opportunity, we launched the HSBC Focused Equity Fund which garnered close to Rs. 520 crores. During the second half of 2020, in the fixed income space, 3 - 5 year duration range had a favourable investment scenario as RBI’s accommodative policy and surplus liquidity had reduced the returns at the very short end of the yield curve. There was a demand for an actively managed moderate duration strategy with better credit quality which we fulfilled by launching HSBC Corporate Bond Fund. It garnered over 700 crores. Our latest and first of its kind offering, HSBC Global Equity Climate Change Fund of Fund saw a stupendous response with over 8000 investors investing over Rs. 616 crores. This is an investment opportunity which goes beyond the rationale of simply generating investment returns and is the future of responsible investing.
We worked towards augmenting our digital capabilities by launching a few key enhancements to our online transaction platform. Being mindful of the movement restrictions in place, this year we focused on digitizing offline processes so that an investor need not need step out of her home for investing or availing any key services. While our interactive chatbot AskMe, eased service queries, our end-to-end digital KYC module enabled a first time Mutual Fund investor to invest in our funds without any paperwork. We listened to your feedback and digitized consolidation of folios and change of tax status which eliminated the need for you to physically visit our branches.
I am a strong believer in the India story and this story has just begun. The opportunity to invest in this high growth market is a very exciting opportunity. I do hope you share my enthusiasm and I ask that you continue to invest whilst reviewing your asset allocation at all times. As always thank you for your business. Stay safe.
Warm regards,
Ravi MenonChief Executive Officer,
HSBC Asset Management India

2
Abridged Annual Report 2020 - 2021
SPONSOR
HSBC Securities and Capital Markets (India) Private LimitedRegd. Office: 52/60, Mahatma Gandhi Road, Fort, Mumbai - 400 001.
TRUSTEE
Board of TrusteesOffice: 16, Veer Nariman Road, Fort, Mumbai 400 001.
ASSET MANAGEMENT COMPANY
HSBC Asset Management (India) Private LimitedCorp. & Regd. Office: 16, Veer Nariman Road, Fort, Mumbai 400 001.
CUSTODIAN
Standard Chartered Bank (SCB)Corp. & Regd. Office: Crescenzo, Securities Services, 3rd Floor, C-38/39, G-Block,Bandra Kurla Complex, Bandra East, Mumbai – 400051.
AUDITORS TO THE SCHEME
BSR & Co. LLPChartered Accountants
5th Floor, Lodha Excelus, Apollo Mills Compound, N. M. Joshi Marg, Mahalaxmi, Mumbai 400 011.
REGISTRAR & TRANSFER AGENTS
Computer Age Management Services Limited (CAMS)Unit: HSBC Mutual Fund ’C’ Block, 2nd Floor, Hanudev Info Park P. Ltd., SF No. 558/2, Udayampalayam Road, Nava India, Coimbatore - 641 028.
BOARD OF TRUSTEES
Ms. Jasmine Batliwalla - Chairperson
Mr. Nani Javeri - Trustee
Dr. T. C. Nair - Trustee
Mr. Pedro Bastos - Trustee
BOARD OF DIRECTORS
Mr. Dinesh Mittal - Director
Dr. Indu Shahani - Director
Mr. Ravi Menon - Director & Chief Executive Officer
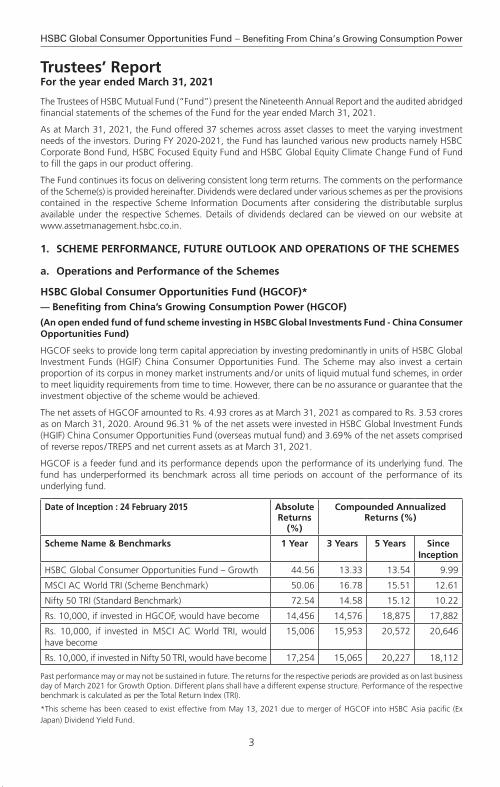
3
HSBC Global Consumer Opportunities Fund – Benefiting From China’s Growing Consumption Power
The Trustees of HSBC Mutual Fund (“Fund”) present the Nineteenth Annual Report and the audited abridged financial statements of the schemes of the Fund for the year ended March 31, 2021.
As at March 31, 2021, the Fund offered 37 schemes across asset classes to meet the varying investment needs of the investors. During FY 2020-2021, the Fund has launched various new products namely HSBC Corporate Bond Fund, HSBC Focused Equity Fund and HSBC Global Equity Climate Change Fund of Fund to fill the gaps in our product offering.
The Fund continues its focus on delivering consistent long term returns. The comments on the performance of the Scheme(s) is provided hereinafter. Dividends were declared under various schemes as per the provisions contained in the respective Scheme Information Documents after considering the distributable surplus available under the respective Schemes. Details of dividends declared can be viewed on our website at www.assetmanagement.hsbc.co.in.
1. Scheme Performance, future outlook and oPerationS of the SchemeS
a. operations and Performance of the Schemes
hSBc Global consumer opportunities fund (hGcof)* –– Benefiting from china’s Growing consumption Power (hGcof)
(an open ended fund of fund scheme investing in hSBc Global investments fund - china consumer opportunities fund)
HGCOF seeks to provide long term capital appreciation by investing predominantly in units of HSBC Global Investment Funds (HGIF) China Consumer Opportunities Fund. The Scheme may also invest a certain proportion of its corpus in money market instruments and / or units of liquid mutual fund schemes, in order to meet liquidity requirements from time to time. However, there can be no assurance or guarantee that the investment objective of the scheme would be achieved.
The net assets of HGCOF amounted to Rs. 4.93 crores as at March 31, 2021 as compared to Rs. 3.53 crores as on March 31, 2020. Around 96.31 % of the net assets were invested in HSBC Global Investment Funds (HGIF) China Consumer Opportunities Fund (overseas mutual fund) and 3.69% of the net assets comprised of reverse repos / TREPS and net current assets as at March 31, 2021.
HGCOF is a feeder fund and its performance depends upon the performance of its underlying fund. The fund has underperformed its benchmark across all time periods on account of the performance of its underlying fund.
date of inception : 24 february 2015 absolute returns
(%)
compounded annualized returns (%)
Scheme name & Benchmarks 1 Year 3 Years 5 Years Since inception
HSBC Global Consumer Opportunities Fund – Growth 44.56 13.33 13.54 9.99
MSCI AC World TRI (Scheme Benchmark) 50.06 16.78 15.51 12.61
Nifty 50 TRI (Standard Benchmark) 72.54 14.58 15.12 10.22
Rs. 10,000, if invested in HGCOF, would have become 14,456 14,576 18,875 17,882
Rs. 10,000, if invested in MSCI AC World TRI, would have become
15,006 15,953 20,572 20,646
Rs. 10,000, if invested in Nifty 50 TRI, would have become 17,254 15,065 20,227 18,112
Past performance may or may not be sustained in future. The returns for the respective periods are provided as on last business day of March 2021 for Growth Option. Different plans shall have a different expense structure. Performance of the respective benchmark is calculated as per the Total Return Index (TRI).
*This scheme has been ceased to exist effective from May 13, 2021 due to merger of HGCOF into HSBC Asia pacific (Ex Japan) Dividend Yield Fund.
Trustees’ ReportFor the year ended March 31, 2021
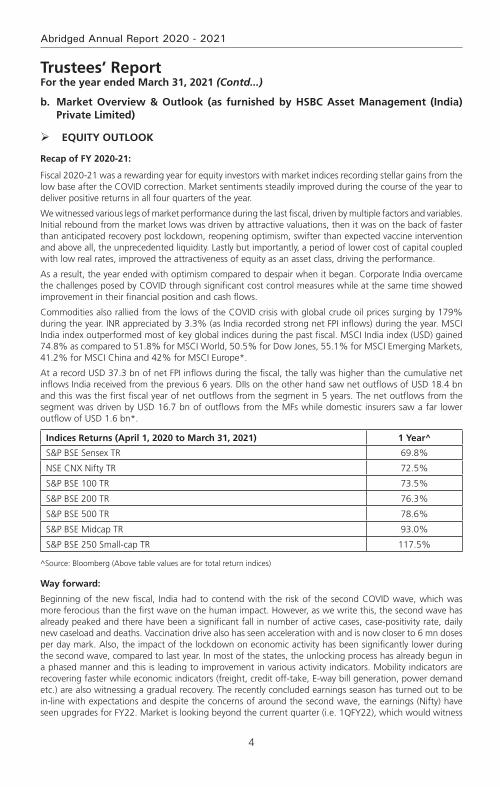
4
Abridged Annual Report 2020 - 2021
b. market overview & outlook (as furnished by hSBc asset management (india) Private limited)
equitY outlook
recap of fY 2020-21:
Fiscal 2020-21 was a rewarding year for equity investors with market indices recording stellar gains from the low base after the COVID correction. Market sentiments steadily improved during the course of the year to deliver positive returns in all four quarters of the year.
We witnessed various legs of market performance during the last fiscal, driven by multiple factors and variables. Initial rebound from the market lows was driven by attractive valuations, then it was on the back of faster than anticipated recovery post lockdown, reopening optimism, swifter than expected vaccine intervention and above all, the unprecedented liquidity. Lastly but importantly, a period of lower cost of capital coupled with low real rates, improved the attractiveness of equity as an asset class, driving the performance.
As a result, the year ended with optimism compared to despair when it began. Corporate India overcame the challenges posed by COVID through significant cost control measures while at the same time showed improvement in their financial position and cash flows.
Commodities also rallied from the lows of the COVID crisis with global crude oil prices surging by 179% during the year. INR appreciated by 3.3% (as India recorded strong net FPI inflows) during the year. MSCI India index outperformed most of key global indices during the past fiscal. MSCI India index (USD) gained 74.8% as compared to 51.8% for MSCI World, 50.5% for Dow Jones, 55.1% for MSCI Emerging Markets, 41.2% for MSCI China and 42% for MSCI Europe*.
At a record USD 37.3 bn of net FPI inflows during the fiscal, the tally was higher than the cumulative net inflows India received from the previous 6 years. DIIs on the other hand saw net outflows of USD 18.4 bn and this was the first fiscal year of net outflows from the segment in 5 years. The net outflows from the segment was driven by USD 16.7 bn of outflows from the MFs while domestic insurers saw a far lower outflow of USD 1.6 bn*.
indices returns (april 1, 2020 to march 31, 2021) 1 Year^
S&P BSE Sensex TR 69.8%
NSE CNX Nifty TR 72.5%
S&P BSE 100 TR 73.5%
S&P BSE 200 TR 76.3%
S&P BSE 500 TR 78.6%
S&P BSE Midcap TR 93.0%
S&P BSE 250 Small-cap TR 117.5%
^Source: Bloomberg (Above table values are for total return indices)
Way forward:
Beginning of the new fiscal, India had to contend with the risk of the second COVID wave, which was more ferocious than the first wave on the human impact. However, as we write this, the second wave has already peaked and there have been a significant fall in number of active cases, case-positivity rate, daily new caseload and deaths. Vaccination drive also has seen acceleration with and is now closer to 6 mn doses per day mark. Also, the impact of the lockdown on economic activity has been significantly lower during the second wave, compared to last year. In most of the states, the unlocking process has already begun in a phased manner and this is leading to improvement in various activity indicators. Mobility indicators are recovering faster while economic indicators (freight, credit off-take, E-way bill generation, power demand etc.) are also witnessing a gradual recovery. The recently concluded earnings season has turned out to be in-line with expectations and despite the concerns of around the second wave, the earnings (Nifty) have seen upgrades for FY22. Market is looking beyond the current quarter (i.e. 1QFY22), which would witness
Trustees’ ReportFor the year ended March 31, 2021 (Contd...)
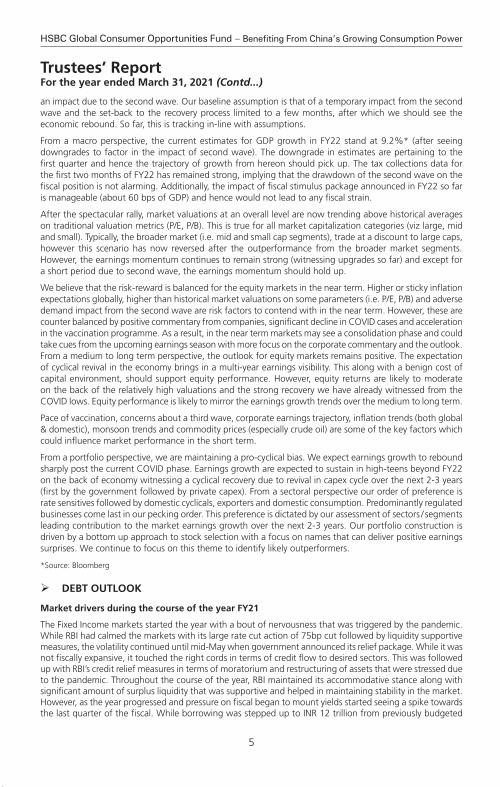
5
HSBC Global Consumer Opportunities Fund – Benefiting From China’s Growing Consumption Power
an impact due to the second wave. Our baseline assumption is that of a temporary impact from the second wave and the set-back to the recovery process limited to a few months, after which we should see the economic rebound. So far, this is tracking in-line with assumptions.
From a macro perspective, the current estimates for GDP growth in FY22 stand at 9.2%* (after seeing downgrades to factor in the impact of second wave). The downgrade in estimates are pertaining to the first quarter and hence the trajectory of growth from hereon should pick up. The tax collections data for the first two months of FY22 has remained strong, implying that the drawdown of the second wave on the fiscal position is not alarming. Additionally, the impact of fiscal stimulus package announced in FY22 so far is manageable (about 60 bps of GDP) and hence would not lead to any fiscal strain.
After the spectacular rally, market valuations at an overall level are now trending above historical averages on traditional valuation metrics (P/E, P/B). This is true for all market capitalization categories (viz large, mid and small). Typically, the broader market (i.e. mid and small cap segments), trade at a discount to large caps, however this scenario has now reversed after the outperformance from the broader market segments. However, the earnings momentum continues to remain strong (witnessing upgrades so far) and except for a short period due to second wave, the earnings momentum should hold up.
We believe that the risk-reward is balanced for the equity markets in the near term. Higher or sticky inflation expectations globally, higher than historical market valuations on some parameters (i.e. P/E, P/B) and adverse demand impact from the second wave are risk factors to contend with in the near term. However, these are counter balanced by positive commentary from companies, significant decline in COVID cases and acceleration in the vaccination programme. As a result, in the near term markets may see a consolidation phase and could take cues from the upcoming earnings season with more focus on the corporate commentary and the outlook. From a medium to long term perspective, the outlook for equity markets remains positive. The expectation of cyclical revival in the economy brings in a multi-year earnings visibility. This along with a benign cost of capital environment, should support equity performance. However, equity returns are likely to moderate on the back of the relatively high valuations and the strong recovery we have already witnessed from the COVID lows. Equity performance is likely to mirror the earnings growth trends over the medium to long term.
Pace of vaccination, concerns about a third wave, corporate earnings trajectory, inflation trends (both global & domestic), monsoon trends and commodity prices (especially crude oil) are some of the key factors which could influence market performance in the short term.
From a portfolio perspective, we are maintaining a pro-cyclical bias. We expect earnings growth to rebound sharply post the current COVID phase. Earnings growth are expected to sustain in high-teens beyond FY22 on the back of economy witnessing a cyclical recovery due to revival in capex cycle over the next 2-3 years (first by the government followed by private capex). From a sectoral perspective our order of preference is rate sensitives followed by domestic cyclicals, exporters and domestic consumption. Predominantly regulated businesses come last in our pecking order. This preference is dictated by our assessment of sectors / segments leading contribution to the market earnings growth over the next 2-3 years. Our portfolio construction is driven by a bottom up approach to stock selection with a focus on names that can deliver positive earnings surprises. We continue to focus on this theme to identify likely outperformers.
*Source: Bloomberg
deBt outlook
market drivers during the course of the year fY21
The Fixed Income markets started the year with a bout of nervousness that was triggered by the pandemic. While RBI had calmed the markets with its large rate cut action of 75bp cut followed by liquidity supportive measures, the volatility continued until mid-May when government announced its relief package. While it was not fiscally expansive, it touched the right cords in terms of credit flow to desired sectors. This was followed up with RBI’s credit relief measures in terms of moratorium and restructuring of assets that were stressed due to the pandemic. Throughout the course of the year, RBI maintained its accommodative stance along with significant amount of surplus liquidity that was supportive and helped in maintaining stability in the market. However, as the year progressed and pressure on fiscal began to mount yields started seeing a spike towards the last quarter of the fiscal. While borrowing was stepped up to INR 12 trillion from previously budgeted
Trustees’ ReportFor the year ended March 31, 2021 (Contd...)

6
Abridged Annual Report 2020 - 2021
INR 7.8 trillion in May 2020, it was further enhanced by and additional INR 1.1 trillion in October 2020. Overall GOI ended up borrowing a record amount of INR 13.9 trillion. The budget proved to be a shocker with GOI using the pandemic as an opportunity for setting the finances in order. GOI showed a record deficit of 9.5% for FY21 and projected a 6.8% for FY22 with estimated central government gross borrowing of INR 12 trillion. This seemed to reverse the support RBI had provided throughout the year with benchmark 10-year bond peaking to 6.23% in mid –Feb 2021. RBI’s statements to remain supportive were left in the sidelines. Overall it seemed that the 115bp of rate cut, along with significant liquidity infusion (OMO + Twist operations of ~INR 3 trillion, infusion via dollar purchases) seemed only a little to help in applying a brake to the one-way spike in yields. The year closed ~6.16% with absence of concrete action by RBI.
rBi Policy: Through the course of the year, RBI has maintained an accommodative stance, with an aggregate 115bp of rate cut done in March and May 2020 taking the repo rate from 5.15% to 4%. Subsequently while inflation pressures prevented RBI from taking any direct actions, RBI has used a combination of creative tools to keep the rates contained primarily via liquidity supportive tools such as OMOs, Twist Operations, Repo linked Term loans to needy sectors (LTROs, TLTROs), CRR cuts. While inflation was a worry for most part of the year, RBI kept it aside admitting that growth was a priority and inflation effects are more supply side rather than demand side. Prospectively into FY22, with the onset of the second wave, RBI continues to maintain the stance to prioritize growth.
inflation: Inflation for most part of the year stayed above 6% primarily driven by supply side pressures and some intermittent spike from food inflation as well. While it has been coming off since December with cooling off of food inflation and positive base effects, it has been between 4- 5.5%. Structurally however inflation risks continue to remain as oil prices have increased and base effects will not remain supportive for long. Core inflation continues to remain sticky.
liquidity: During the year, system liquidity has remained at significant surplus facilitated largely by RBI action such as OMOs, foreign exchange operations and government spending.
Budget: The FY2022 union budget focuses on growth and has accordingly, presented a 9.5% fiscal deficit for FY21 and 6.8% for FY22. On the revenue side, the assumptions are largely realistic, with FY22 (E) Nominal GDP growth at 14.4% and tax revenue growth at 17% considering the pandemic impact in FY 21. Compared to FY20, tax revenue growth is ~10%. While non-tax revenues are ambitious pegging the divestment at INR 1.75 trillion, with robust pipeline of assets including monetization of road and transmission assets, execution remains the key as in the past. On the expenditure side, better quality capex spending with focusing on rail, road, defense, urban infra is positive for long term structural growth. The revenue side expenditure adjusting for clearance of past subsidy arrears will be similar to budgetary estimates. Government using this opportunity to bring back off-balance sheet spending to on-balance sheet was a welcome move towards transparency and showing realistic projections. Alongside, states have also been given leeway to borrow upto 4% of their GDP with an additional 0.5% subject to conditions. Given that states are an important vehicle for capex investment, this move is welcome although it may entail additional state borrowing. The fiscal glide path is shifted to FY26 at below 4.5% for center and 3% for states suggesting that spending will continue and borrowing will come down gradually. In summary, from survival to revival, FY22 budget aims for structural growth leaving fiscal concerns sideways in the interim. Government’s intent seems clear on bringing back growth on the table, in a transparent manner.
While the second wave of the pandemic has once again derailed the revenue story, government will still have some cushion from its conservative estimates.
currency and fii flows: INR has been on an appreciation trajectory for most part of the year, aided by dollar underperformance supported by positive FII and FDI flows along with reduced imports on the domestic front as well. RBI has used most of the flows to accumulate reserves which has prevented any strong appreciation. Pandemic shock and global risk off led rupee over 75 in the beginning of the year only to close below 72 at the end of the fiscal year. While the second wave led to another spike in INR in April, it has since then cooled once again driven by dollar underperformance and pandemic recovery on the domestic front. Net FII flows was ~$30 bn with positive equity flows of~$37 bn while debt was negative ~$7bn and overall RBI’s forex reserves rose by a ~$100 bn to close ~$537 bn.
credit growth: Credit growth for the entire year has been tepid as previous year’s credit events were followed by nervousness relating to the pandemic. Despite RBI opening up several windows to finance the non-AAA segment, there was very little fresh credit flowing that segment. Overall banking credit grew by
Trustees’ ReportFor the year ended March 31, 2021 (Contd...)
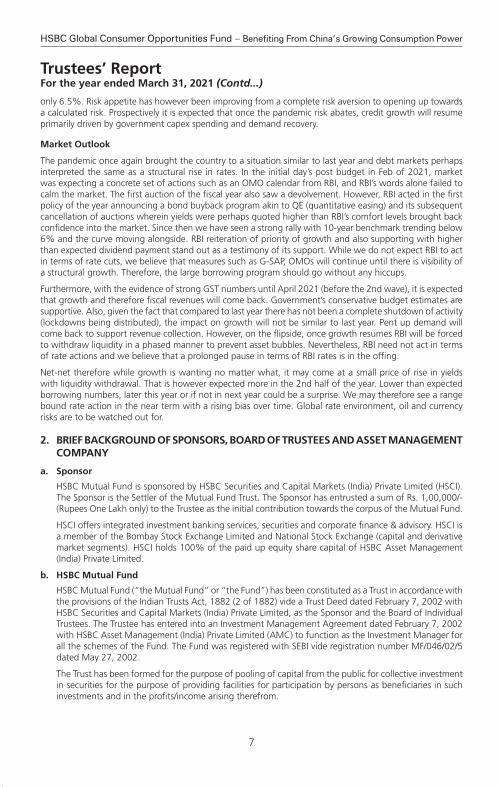
7
HSBC Global Consumer Opportunities Fund – Benefiting From China’s Growing Consumption Power
only 6.5%. Risk appetite has however been improving from a complete risk aversion to opening up towards a calculated risk. Prospectively it is expected that once the pandemic risk abates, credit growth will resume primarily driven by government capex spending and demand recovery.
market outlook
The pandemic once again brought the country to a situation similar to last year and debt markets perhaps interpreted the same as a structural rise in rates. In the initial day’s post budget in Feb of 2021, market was expecting a concrete set of actions such as an OMO calendar from RBI, and RBI’s words alone failed to calm the market. The first auction of the fiscal year also saw a devolvement. However, RBI acted in the first policy of the year announcing a bond buyback program akin to QE (quantitative easing) and its subsequent cancellation of auctions wherein yields were perhaps quoted higher than RBI’s comfort levels brought back confidence into the market. Since then we have seen a strong rally with 10-year benchmark trending below 6% and the curve moving alongside. RBI reiteration of priority of growth and also supporting with higher than expected dividend payment stand out as a testimony of its support. While we do not expect RBI to act in terms of rate cuts, we believe that measures such as G-SAP, OMOs will continue until there is visibility of a structural growth. Therefore, the large borrowing program should go without any hiccups.
Furthermore, with the evidence of strong GST numbers until April 2021 (before the 2nd wave), it is expected that growth and therefore fiscal revenues will come back. Government’s conservative budget estimates are supportive. Also, given the fact that compared to last year there has not been a complete shutdown of activity (lockdowns being distributed), the impact on growth will not be similar to last year. Pent up demand will come back to support revenue collection. However, on the flipside, once growth resumes RBI will be forced to withdraw liquidity in a phased manner to prevent asset bubbles. Nevertheless, RBI need not act in terms of rate actions and we believe that a prolonged pause in terms of RBI rates is in the offing.
Net-net therefore while growth is wanting no matter what, it may come at a small price of rise in yields with liquidity withdrawal. That is however expected more in the 2nd half of the year. Lower than expected borrowing numbers, later this year or if not in next year could be a surprise. We may therefore see a range bound rate action in the near term with a rising bias over time. Global rate environment, oil and currency risks are to be watched out for.
2. Brief BackGround of SPonSorS, Board of truSteeS and aSSet manaGement comPanY
a. Sponsor
HSBC Mutual Fund is sponsored by HSBC Securities and Capital Markets (India) Private Limited (HSCI). The Sponsor is the Settler of the Mutual Fund Trust. The Sponsor has entrusted a sum of Rs. 1,00,000/- (Rupees One Lakh only) to the Trustee as the initial contribution towards the corpus of the Mutual Fund.
HSCI offers integrated investment banking services, securities and corporate finance & advisory. HSCI is a member of the Bombay Stock Exchange Limited and National Stock Exchange (capital and derivative market segments). HSCI holds 100% of the paid up equity share capital of HSBC Asset Management (India) Private Limited.
b. hSBc mutual fund
HSBC Mutual Fund (“the Mutual Fund” or “the Fund”) has been constituted as a Trust in accordance with the provisions of the Indian Trusts Act, 1882 (2 of 1882) vide a Trust Deed dated February 7, 2002 with HSBC Securities and Capital Markets (India) Private Limited, as the Sponsor and the Board of Individual Trustees. The Trustee has entered into an Investment Management Agreement dated February 7, 2002 with HSBC Asset Management (India) Private Limited (AMC) to function as the Investment Manager for all the schemes of the Fund. The Fund was registered with SEBI vide registration number MF/046/02/5 dated May 27, 2002.
The Trust has been formed for the purpose of pooling of capital from the public for collective investment in securities for the purpose of providing facilities for participation by persons as beneficiaries in such investments and in the profits/income arising therefrom.
Trustees’ ReportFor the year ended March 31, 2021 (Contd...)
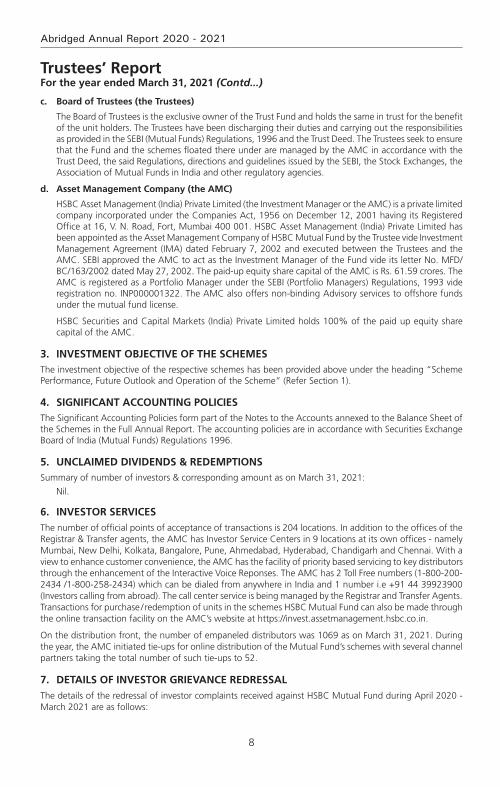
8
Abridged Annual Report 2020 - 2021
c. Board of trustees (the trustees)
The Board of Trustees is the exclusive owner of the Trust Fund and holds the same in trust for the benefit of the unit holders. The Trustees have been discharging their duties and carrying out the responsibilities as provided in the SEBI (Mutual Funds) Regulations, 1996 and the Trust Deed. The Trustees seek to ensure that the Fund and the schemes floated there under are managed by the AMC in accordance with the Trust Deed, the said Regulations, directions and guidelines issued by the SEBI, the Stock Exchanges, the Association of Mutual Funds in India and other regulatory agencies.
d. asset management company (the amc)
HSBC Asset Management (India) Private Limited (the Investment Manager or the AMC) is a private limited company incorporated under the Companies Act, 1956 on December 12, 2001 having its Registered Office at 16, V. N. Road, Fort, Mumbai 400 001. HSBC Asset Management (India) Private Limited has been appointed as the Asset Management Company of HSBC Mutual Fund by the Trustee vide Investment Management Agreement (IMA) dated February 7, 2002 and executed between the Trustees and the AMC. SEBI approved the AMC to act as the Investment Manager of the Fund vide its letter No. MFD/BC/163/2002 dated May 27, 2002. The paid-up equity share capital of the AMC is Rs. 61.59 crores. The AMC is registered as a Portfolio Manager under the SEBI (Portfolio Managers) Regulations, 1993 vide registration no. INP000001322. The AMC also offers non-binding Advisory services to offshore funds under the mutual fund license.
HSBC Securities and Capital Markets (India) Private Limited holds 100% of the paid up equity share capital of the AMC.
3. inveStment oBjective of the SchemeSThe investment objective of the respective schemes has been provided above under the heading “Scheme Performance, Future Outlook and Operation of the Scheme” (Refer Section 1).
4. SiGnificant accountinG PolicieS The Significant Accounting Policies form part of the Notes to the Accounts annexed to the Balance Sheet of the Schemes in the Full Annual Report. The accounting policies are in accordance with Securities Exchange Board of India (Mutual Funds) Regulations 1996.
5. unclaimed dividendS & redemPtionSSummary of number of investors & corresponding amount as on March 31, 2021:
Nil.
6. inveStor ServiceSThe number of official points of acceptance of transactions is 204 locations. In addition to the offices of the Registrar & Transfer agents, the AMC has Investor Service Centers in 9 locations at its own offices - namely Mumbai, New Delhi, Kolkata, Bangalore, Pune, Ahmedabad, Hyderabad, Chandigarh and Chennai. With a view to enhance customer convenience, the AMC has the facility of priority based servicing to key distributors through the enhancement of the Interactive Voice Reponses. The AMC has 2 Toll Free numbers (1-800-200-2434 /1-800-258-2434) which can be dialed from anywhere in India and 1 number i.e +91 44 39923900 (Investors calling from abroad). The call center service is being managed by the Registrar and Transfer Agents. Transactions for purchase / redemption of units in the schemes HSBC Mutual Fund can also be made through the online transaction facility on the AMC’s website at https://invest.assetmanagement.hsbc.co.in.
On the distribution front, the number of empaneled distributors was 1069 as on March 31, 2021. During the year, the AMC initiated tie-ups for online distribution of the Mutual Fund’s schemes with several channel partners taking the total number of such tie-ups to 52.
7. detailS of inveStor Grievance redreSSalThe details of the redressal of investor complaints received against HSBC Mutual Fund during April 2020 - March 2021 are as follows:
Trustees’ ReportFor the year ended March 31, 2021 (Contd...)
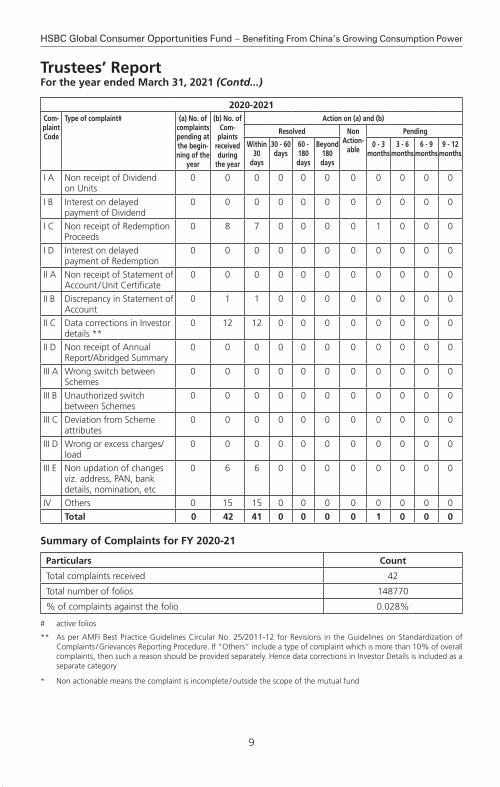
9
HSBC Global Consumer Opportunities Fund – Benefiting From China’s Growing Consumption Power
Trustees’ ReportFor the year ended March 31, 2021 (Contd...)
2020-2021com-plaint code
type of complaint# (a) no. of complaints pending at the begin-ning of the
year
(b) no. of com-
plaints received during
the year
action on (a) and (b)
resolved non action-
able
Pending
Within 30
days
30 - 60 days
60 - 180 days
Beyond 180 days
0 - 3 months
3 - 6 months
6 - 9 months
9 - 12 months
I A Non receipt of Dividend on Units
0 0 0 0 0 0 0 0 0 0 0
I B Interest on delayed payment of Dividend
0 0 0 0 0 0 0 0 0 0 0
I C Non receipt of Redemption Proceeds
0 8 7 0 0 0 0 1 0 0 0
I D Interest on delayed payment of Redemption
0 0 0 0 0 0 0 0 0 0 0
II A Non receipt of Statement of Account / Unit Certificate
0 0 0 0 0 0 0 0 0 0 0
II B Discrepancy in Statement of Account
0 1 1 0 0 0 0 0 0 0 0
II C Data corrections in Investor details **
0 12 12 0 0 0 0 0 0 0 0
II D Non receipt of Annual Report/Abridged Summary
0 0 0 0 0 0 0 0 0 0 0
III A Wrong switch between Schemes
0 0 0 0 0 0 0 0 0 0 0
III B Unauthorized switch between Schemes
0 0 0 0 0 0 0 0 0 0 0
III C Deviation from Scheme attributes
0 0 0 0 0 0 0 0 0 0 0
III D Wrong or excess charges/load
0 0 0 0 0 0 0 0 0 0 0
III E Non updation of changes viz. address, PAN, bank details, nomination, etc
0 6 6 0 0 0 0 0 0 0 0
IV Others 0 15 15 0 0 0 0 0 0 0 0
total 0 42 41 0 0 0 0 1 0 0 0
Summary of complaints for fY 2020-21
Particulars count
Total complaints received 42
Total number of folios 148770
% of complaints against the folio 0.028%
# active folios
** As per AMFI Best Practice Guidelines Circular No. 25/2011-12 for Revisions in the Guidelines on Standardization of Complaints / Grievances Reporting Procedure. If “Others” include a type of complaint which is more than 10% of overall complaints, then such a reason should be provided separately. Hence data corrections in Investor Details is included as a separate category
* Non actionable means the complaint is incomplete / outside the scope of the mutual fund
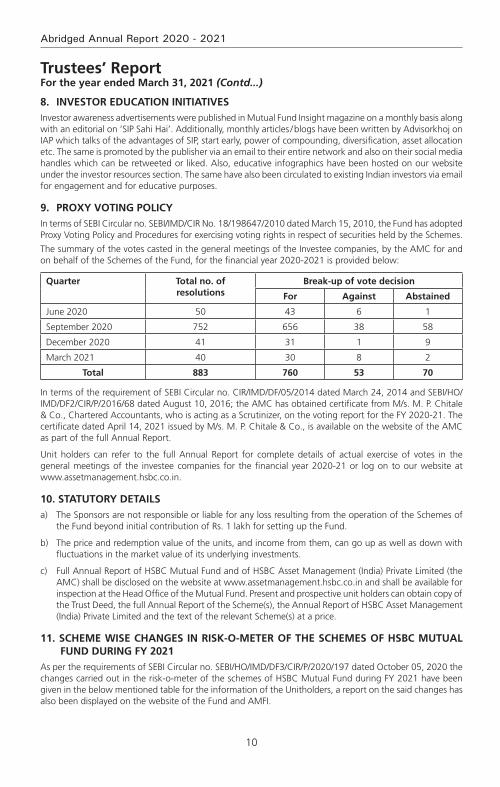
10
Abridged Annual Report 2020 - 2021
Trustees’ ReportFor the year ended March 31, 2021 (Contd...)
8. inveStor education initiativeS Investor awareness advertisements were published in Mutual Fund Insight magazine on a monthly basis along with an editorial on ‘SIP Sahi Hai’. Additionally, monthly articles / blogs have been written by Advisorkhoj on IAP which talks of the advantages of SIP, start early, power of compounding, diversification, asset allocation etc. The same is promoted by the publisher via an email to their entire network and also on their social media handles which can be retweeted or liked. Also, educative infographics have been hosted on our website under the investor resources section. The same have also been circulated to existing Indian investors via email for engagement and for educative purposes.
9. ProxY votinG PolicYIn terms of SEBI Circular no. SEBI/IMD/CIR No. 18/198647/2010 dated March 15, 2010, the Fund has adopted Proxy Voting Policy and Procedures for exercising voting rights in respect of securities held by the Schemes.
The summary of the votes casted in the general meetings of the Investee companies, by the AMC for and on behalf of the Schemes of the Fund, for the financial year 2020-2021 is provided below:
quarter total no. of resolutions
Break-up of vote decision
for against abstained
June 2020 50 43 6 1
September 2020 752 656 38 58
December 2020 41 31 1 9
March 2021 40 30 8 2
total 883 760 53 70
In terms of the requirement of SEBI Circular no. CIR/IMD/DF/05/2014 dated March 24, 2014 and SEBI/HO/IMD/DF2/CIR/P/2016/68 dated August 10, 2016; the AMC has obtained certificate from M/s. M. P. Chitale & Co., Chartered Accountants, who is acting as a Scrutinizer, on the voting report for the FY 2020-21. The certificate dated April 14, 2021 issued by M/s. M. P. Chitale & Co., is available on the website of the AMC as part of the full Annual Report.
Unit holders can refer to the full Annual Report for complete details of actual exercise of votes in the general meetings of the investee companies for the financial year 2020-21 or log on to our website at www.assetmanagement.hsbc.co.in.
10. StatutorY detailSa) The Sponsors are not responsible or liable for any loss resulting from the operation of the Schemes of
the Fund beyond initial contribution of Rs. 1 lakh for setting up the Fund.
b) The price and redemption value of the units, and income from them, can go up as well as down with fluctuations in the market value of its underlying investments.
c) Full Annual Report of HSBC Mutual Fund and of HSBC Asset Management (India) Private Limited (the AMC) shall be disclosed on the website at www.assetmanagement.hsbc.co.in and shall be available for inspection at the Head Office of the Mutual Fund. Present and prospective unit holders can obtain copy of the Trust Deed, the full Annual Report of the Scheme(s), the Annual Report of HSBC Asset Management (India) Private Limited and the text of the relevant Scheme(s) at a price.
11. Scheme WiSe chanGeS in riSk-o-meter of the SchemeS of hSBc mutual fund durinG fY 2021
As per the requirements of SEBI Circular no. SEBI/HO/IMD/DF3/CIR/P/2020/197 dated October 05, 2020 the changes carried out in the risk-o-meter of the schemes of HSBC Mutual Fund during FY 2021 have been given in the below mentioned table for the information of the Unitholders, a report on the said changes has also been displayed on the website of the Fund and AMFI.
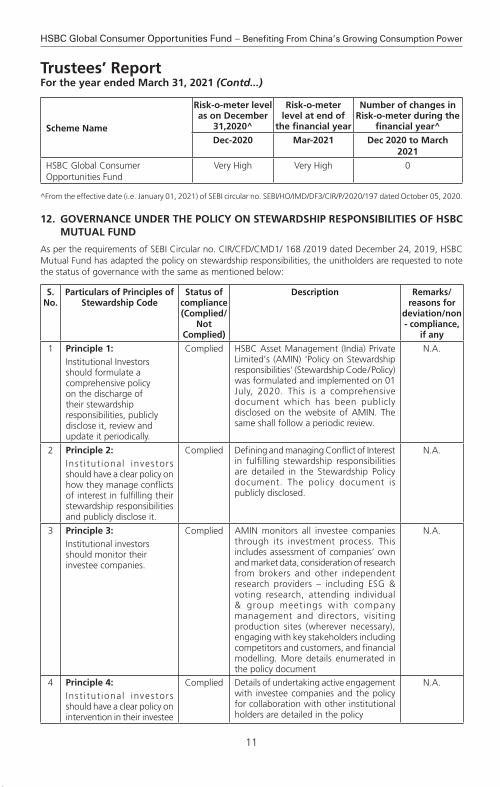
11
HSBC Global Consumer Opportunities Fund – Benefiting From China’s Growing Consumption Power
Trustees’ ReportFor the year ended March 31, 2021 (Contd...)
Scheme name
risk-o-meter level as on december
31,2020^
risk-o-meter level at end of
the financial year
number of changes in risk-o-meter during the
financial year^
dec-2020 mar-2021 dec 2020 to march 2021
HSBC Global Consumer Opportunities Fund
Very High Very High 0
^From the effective date (i.e. January 01, 2021) of SEBI circular no. SEBI/HO/IMD/DF3/CIR/P/2020/197 dated October 05, 2020.
12. Governance under the PolicY on SteWardShiP reSPonSiBilitieS of hSBc mutual fund
As per the requirements of SEBI Circular no. CIR/CFD/CMD1/ 168 /2019 dated December 24, 2019, HSBC Mutual Fund has adapted the policy on stewardship responsibilities, the unitholders are requested to note the status of governance with the same as mentioned below:
S. no.
Particulars of Principles of Stewardship code
Status of compliance (complied/
not complied)
description remarks/reasons for
deviation/non - compliance,
if any
1 Principle 1:Institutional Investors should formulate a comprehensive policy on the discharge of their stewardship responsibilities, publicly disclose it, review and update it periodically.
Complied HSBC Asset Management (India) Private Limited's (AMIN) 'Policy on Stewardship responsibilities' (Stewardship Code / Policy) was formulated and implemented on 01 July, 2020. This is a comprehensive document which has been publicly disclosed on the website of AMIN. The same shall follow a periodic review.
N.A.
2 Principle 2:Inst i tut ional investors should have a clear policy on how they manage conflicts of interest in fulfilling their stewardship responsibilities and publicly disclose it.
Complied Defining and managing Conflict of Interest in fulfilling stewardship responsibilities are detailed in the Stewardship Policy document. The policy document is publicly disclosed.
N.A.
3 Principle 3:Institutional investors should monitor their investee companies.
Complied AMIN monitors all investee companies through its investment process. This includes assessment of companies’ own and market data, consideration of research from brokers and other independent research providers – including ESG & voting research, attending individual & group meetings with company management and directors, visiting production sites (wherever necessary), engaging with key stakeholders including competitors and customers, and financial modelling. More details enumerated in the policy document
N.A.
4 Principle 4:Inst i tut ional investors should have a clear policy on intervention in their investee
Complied Details of undertaking active engagement with investee companies and the policy for collaboration with other institutional holders are detailed in the policy
N.A.
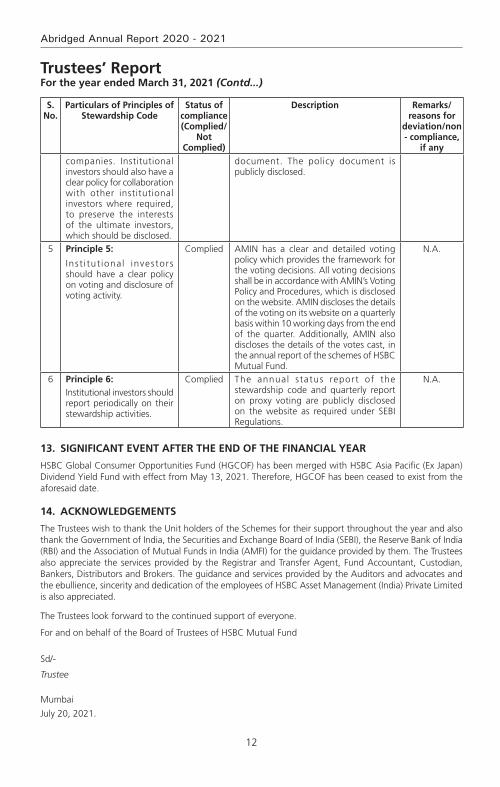
12
Abridged Annual Report 2020 - 2021
Trustees’ ReportFor the year ended March 31, 2021 (Contd...)
S. no.
Particulars of Principles of Stewardship code
Status of compliance (complied/
not complied)
description remarks/reasons for
deviation/non - compliance,
if any
companies. Institutional investors should also have a clear policy for collaboration with other institutional investors where required, to preserve the interests of the ultimate investors, which should be disclosed.
document. The policy document is publicly disclosed.
5 Principle 5:
Inst i tut ional investors should have a clear policy on voting and disclosure of voting activity.
Complied AMIN has a clear and detailed voting policy which provides the framework for the voting decisions. All voting decisions shall be in accordance with AMIN’s Voting Policy and Procedures, which is disclosed on the website. AMIN discloses the details of the voting on its website on a quarterly basis within 10 working days from the end of the quarter. Additionally, AMIN also discloses the details of the votes cast, in the annual report of the schemes of HSBC Mutual Fund.
N.A.
6 Principle 6:Institutional investors should report periodically on their stewardship activities.
Complied The annual status report of the stewardship code and quarterly report on proxy voting are publicly disclosed on the website as required under SEBI Regulations.
N.A.
13. SiGnificant event after the end of the financial Year
HSBC Global Consumer Opportunities Fund (HGCOF) has been merged with HSBC Asia Pacific (Ex Japan) Dividend Yield Fund with effect from May 13, 2021. Therefore, HGCOF has been ceased to exist from the aforesaid date.
14. acknoWledGementS
The Trustees wish to thank the Unit holders of the Schemes for their support throughout the year and also thank the Government of India, the Securities and Exchange Board of India (SEBI), the Reserve Bank of India (RBI) and the Association of Mutual Funds in India (AMFI) for the guidance provided by them. The Trustees also appreciate the services provided by the Registrar and Transfer Agent, Fund Accountant, Custodian, Bankers, Distributors and Brokers. The guidance and services provided by the Auditors and advocates and the ebullience, sincerity and dedication of the employees of HSBC Asset Management (India) Private Limited is also appreciated.
The Trustees look forward to the continued support of everyone.
For and on behalf of the Board of Trustees of HSBC Mutual Fund
Sd/-
Trustee
Mumbai
July 20, 2021.
13
HSBC Global Consumer Opportunities Fund – Benefiting From China’s Growing Consumption Power
To the Trustees of HSBC Mutual Fund
hSBc Global consumer opportunities fund
Report on the Audit of the Financial Statements
OpinionWe have audited the financial statements of hSBc Global consumer opportunities fund (the ‘Scheme’) of HSBC Mutual Fund, which comprise the balance sheet as at 31 March 2021 and the revenue account for the year then ended, and notes to the financial statements, including a summary of the significant accounting policies.
In our opinion and to the best of our information and according to the explanations given to us, the aforesaid financial statements give a true and fair view in conformity with the accounting principles generally accepted in India, of the state of affairs of the Scheme as at 31 March 2021, its net surplus for the year ended on that date.
Basis for opinionWe conducted our audit in accordance with the Standards on Auditing (‘SAs’) issued by the Institute of Chartered Accountants of India (the ‘ICAI’). Our responsibilities under those SAs are further described in the Auditor’s Responsibilities for the Audit of the Financial Statements section of our report. We are independent of the Scheme in accordance with the Code of Ethics issued by the ICAI, and we have fulfilled our other ethical responsibilities in accordance with the Code of Ethics. We believe that the audit evidence we have obtained is sufficient and appropriate to provide a basis for our opinion.
responsibilities of management and those charged with Governance for the financial StatementsThe Scheme’s management, the Board of Directors of HSBC Mutual Fund (the ‘Trustees’) and the Board of Directors of HSBC Asset Management (India) Private Limited (the ‘AMC’) (collectively referred to as ‘Management’) are responsible for the preparation of these financial statements that give a true and fair view of the state of affairs, results of operations of the Scheme in accordance with the accounting policies and standards specified in the Ninth Schedule of the Securities and Exchange Board of India (Mutual Funds) Regulations, 1996, as amended (the ‘Regulations’) and the accounting principles generally accepted in India. This responsibility includes design, implementation and maintenance of internal control relevant to the preparation and presentation of the financial statements that give a true and fair view and are free from material misstatement, whether due to fraud or error.
In preparing the financial statements, management is responsible for assessing the Scheme’s ability to continue as a going concern, disclosing, as applicable, matters related to going concern and using the going concern basis of accounting unless management either intends to liquidate the Scheme or to cease operations, or has no realistic alternative but to do so.
The management is responsible for overseeing the Scheme’s financial reporting process.
auditor’s responsibilities for the audit of the financial StatementsOur objectives are to obtain reasonable assurance about whether the financial statements as a whole are free from material misstatement, whether due to fraud or error, and to issue an auditor’s report that includes our opinion. Reasonable assurance is a high level of assurance, but is not a guarantee that an audit conducted in accordance with SAs will always detect a material misstatement when it exists. Misstatements can arise from fraud or error and are considered material if, individually or in the aggregate, they could reasonably be expected to influence the economic decisions of users taken on the basis of these financial statements.
As part of an audit in accordance with SAs, we exercise professional judgment and maintain professional skepticism throughout the audit. We also:
• Identifyandassesstherisksofmaterialmisstatementofthefinancialstatements,whetherduetofraudor error, design and perform audit procedures responsive to those risks, and obtain audit evidence that is sufficient and appropriate to provide a basis for our opinion. The risk of not detecting a material
Independent Auditors’ Report
14
Abridged Annual Report 2020 - 2021
Independent Auditors’ Report (Contd...)
misstatement resulting from fraud is higher than for one resulting from error, as fraud may involve collusion, forgery, intentional omissions, misrepresentations, or the override of internal control;
• Obtainanunderstandingofinternalcontrolrelevanttotheauditinordertodesignauditproceduresthat are appropriate in the circumstances, but not for the purpose of expressing an opinion on the effectiveness of the Scheme’s internal controls;
• Evaluatetheappropriatenessofaccountingpoliciesusedandthereasonablenessofaccountingestimatesand related disclosures made by Management;
• ConcludeontheappropriatenessofManagement’suseofthegoingconcernbasisofaccountingand,based on the audit evidence obtained, whether a material uncertainty exists related to events or conditions that may cast significant doubt on the Scheme’s ability to continue as a going concern. If we conclude that a material uncertainty exists, we are required to draw attention in our auditor’s report to the related disclosures in the financial statements or, if such disclosures are inadequate, to modify our opinion. Our conclusions are based on the audit evidence obtained up to the date of our auditor’s report. However, future events or conditions may cause the Scheme to cease to continue as a going concern;
• Evaluate the overall presentation, structure and content of the financial statements, including thedisclosures and whether the financial statements represent the underlying transactions and events in a manner that achieves fair presentation.
We communicate with those charged with governance regarding, among other matters, the planned scope and timing of the audit and significant audit findings, including any significant deficiencies in internal control that we identify during our audit.
We also provide those charged with governance with a statement that we have complied with relevant ethical requirements regarding independence, and to communicate with them all relationships and other matters that may reasonably be thought to bear on our independence, and where applicable, related safeguards.
report on other legal and regulatory requirements 1 As required by Regulation 55 (4) of the Regulations, we report that:
(a) We have obtained all information and explanations which, to the best of our knowledge and belief, were necessary for the purposes of the audit; and
(b) The balance sheet and the revenue account have been prepared in accordance with the accounting policies and standards as specified in the Ninth Schedule of the Regulations.
2 As required by Clause 5 (ii) (2) of the Eleventh Schedule of the Regulations, we report that the balance sheet and the revenue account are in agreement with the books of account of the Scheme.
For B S R & Co. LLP Chartered Accountants Firm’s Registration No: 101248W/W-100022
Sd/-
Ajit Viswanath PartnerMembership No: 067114UDIN : 21067114AAAADV9934
Place : Mumbai Date : July 20, 2021.
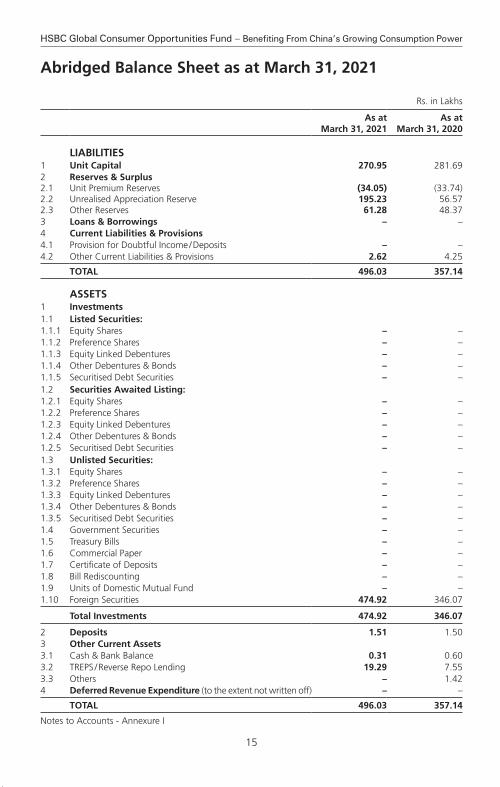
15
HSBC Global Consumer Opportunities Fund – Benefiting From China’s Growing Consumption Power
Rs. in Lakhs
As at March 31, 2021
As at March 31, 2020
LIABILITIES1 Unit Capital 270.95 281.692 Reserves & Surplus2.1 Unit Premium Reserves (34.05) (33.74)2.2 Unrealised Appreciation Reserve 195.23 56.572.3 Other Reserves 61.28 48.373 Loans & Borrowings – –4 Current Liabilities & Provisions4.1 Provision for Doubtful Income / Deposits – –4.2 Other Current Liabilities & Provisions 2.62 4.25
TOTAL 496.03 357.14
ASSETS1 Investments1.1 Listed Securities:1.1.1 Equity Shares – –1.1.2 Preference Shares – –1.1.3 Equity Linked Debentures – –1.1.4 Other Debentures & Bonds – –1.1.5 Securitised Debt Securities – –1.2 Securities Awaited Listing:1.2.1 Equity Shares – –1.2.2 Preference Shares – –1.2.3 Equity Linked Debentures – –1.2.4 Other Debentures & Bonds – –1.2.5 Securitised Debt Securities – –1.3 Unlisted Securities:1.3.1 Equity Shares – –1.3.2 Preference Shares – –1.3.3 Equity Linked Debentures – –1.3.4 Other Debentures & Bonds – –1.3.5 Securitised Debt Securities – –1.4 Government Securities – –1.5 Treasury Bills – –1.6 Commercial Paper – –1.7 Certificate of Deposits – –1.8 Bill Rediscounting – –1.9 Units of Domestic Mutual Fund – –1.10 Foreign Securities 474.92 346.07
Total Investments 474.92 346.07
2 Deposits 1.51 1.503 Other Current Assets3.1 Cash & Bank Balance 0.31 0.603.2 TREPS / Reverse Repo Lending 19.29 7.553.3 Others – 1.424 Deferred Revenue Expenditure (to the extent not written off) – –
TOTAL 496.03 357.14
Notes to Accounts - Annexure I
Abridged Balance Sheet as at March 31, 2021
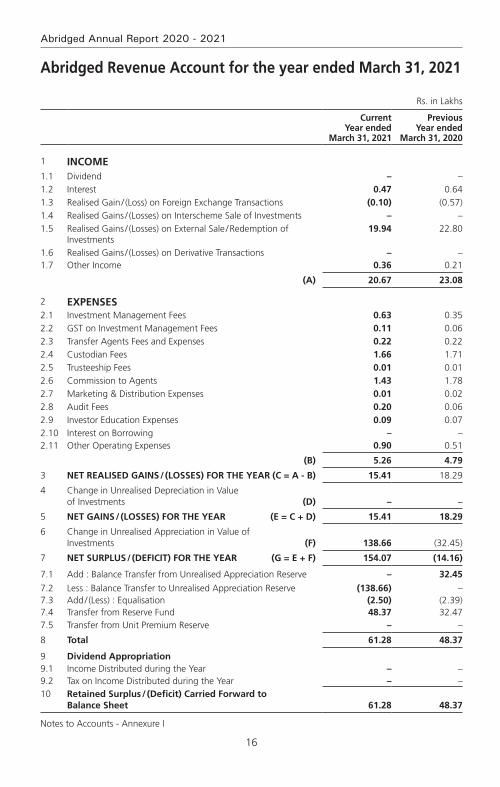
16
Abridged Annual Report 2020 - 2021
Abridged Revenue Account for the year ended March 31, 2021
Rs. in Lakhs
Current Year ended
March 31, 2021
Previous Year ended
March 31, 2020
1 INCOME1.1 Dividend – –1.2 Interest 0.47 0.641.3 Realised Gain / (Loss) on Foreign Exchange Transactions (0.10) (0.57)1.4 Realised Gains / (Losses) on Interscheme Sale of Investments – –1.5 Realised Gains / (Losses) on External Sale / Redemption of
Investments19.94 22.80
1.6 Realised Gains / (Losses) on Derivative Transactions – –1.7 Other Income 0.36 0.21
(A) 20.67 23.08
2 EXPENSES2.1 Investment Management Fees 0.63 0.352.2 GST on Investment Management Fees 0.11 0.062.3 Transfer Agents Fees and Expenses 0.22 0.222.4 Custodian Fees 1.66 1.712.5 Trusteeship Fees 0.01 0.012.6 Commission to Agents 1.43 1.782.7 Marketing & Distribution Expenses 0.01 0.022.8 Audit Fees 0.20 0.062.9 Investor Education Expenses 0.09 0.072.10 Interest on Borrowing – –2.11 Other Operating Expenses 0.90 0.51
(B) 5.26 4.79
3 NET REALISED GAINS / (LOSSES) FOR THE YEAR (C = A - B) 15.41 18.29
4 Change in Unrealised Depreciation in Value of Investments (D) – –
5 NET GAINS / (LOSSES) FOR THE YEAR (E = C + D) 15.41 18.29
6 Change in Unrealised Appreciation in Value of Investments (F) 138.66 (32.45)
7 NET SURPLUS / (DEFICIT) FOR THE YEAR (G = E + F) 154.07 (14.16)
7.1 Add : Balance Transfer from Unrealised Appreciation Reserve – 32.45
7.2 Less : Balance Transfer to Unrealised Appreciation Reserve (138.66) –7.3 Add / (Less) : Equalisation (2.50) (2.39)7.4 Transfer from Reserve Fund 48.37 32.477.5 Transfer from Unit Premium Reserve – –
8 Total 61.28 48.37
9 Dividend Appropriation9.1 Income Distributed during the Year – –9.2 Tax on Income Distributed during the Year – –10 Retained Surplus / (Deficit) Carried Forward to
Balance Sheet 61.28 48.37
Notes to Accounts - Annexure I

17
HSBC Global Consumer Opportunities Fund – Benefiting From China’s Growing Consumption Power
Key Statistics for the year ended March 31, 2021
Current Year ended
March 31, 2021
Previous Year ended
March 31, 2020
1 NAV per unit (Rs.):
Open
Regular Plan Growth Option 12.3687 12.8929
Direct Plan - Growth Option 12.8253 13.2749
High
Regular Plan Growth Option 17.8800 15.0112
Direct Plan - Growth Option 18.6716 15.5378
Low
Regular Plan Growth Option 11.9892 10.6794
Direct Plan - Growth Option 12.4320 11.0716
End
Regular Plan Growth Option 17.8800 12.3687
Direct Plan - Growth Option 18.6716 12.8253
2. Closing Assets Under Management (Rs. in Lakhs)
End 493 353
Average (AAuM)1 427 362
3. Gross income as % of AAuM2 4.84% 6.38%
4. Expense Ratio: a. total expense as % of aaum (including GSt on
management fees) (planwise)Regular Plan (Continue) 1.52% 1.48%
Direct Plan 0.81% 0.78%
b. management fee as % of aaum (planwise)Regular Plan (Continue) 0.20% 0.11%
Direct Plan 0.07% 0.06%
5. Net Income as a percentage of AAuM3 3.61% 5.05%
6. Portfolio turnover ratio4 0.07 0.22
7. Total Dividend per unit distributed during the year (planwise)
Retail
Regular Plan IDCW Option – –
Direct Plan - IDCW Option – –
Corporate
Regular Plan IDCW Option – –
Direct Plan - IDCW Option – –
8. Returns (%):
a. Last One Year
Scheme
Regular Plan Growth Option 44.5600 (4.0400)
Direct Plan - Growth Option 45.5800 (3.3600)

18
Abridged Annual Report 2020 - 2021
Current Year ended
March 31, 2021
Previous Year ended
March 31, 2020
Benchmark
MSCI AC World Index 50.0600 (3.4800)
b. Since Inception
Scheme
Regular Plan Growth Option 9.9900 4.2500
Direct Plan - Growth Option 10.7700 5.0000
Benchmark
MSCI AC World Index 12.6100 6.4500
1. AAuM=Average daily net assets2. Gross income = amount against (A) in the Revenue account i.e. Income3. Net income = amount against (C) in the Revenue account i.e. Net Realised Gains / (Losses) for the year4. Portfolio Turnover = Lower of sales or purchase divided by the Average AuM for the year5. The Total management fees and other expenses charged by the underlying fund along with the
management fee and recurring expenses charged by the domestic Mutual Fund is as follows:
Scheme TER charged by underlying
Fund
TER of the domestic
Fund
Total TER Maximum TER Cap as per circular
2020-21
HSBC Global Consumer Opportunities Fund – Benefiting From China’s Growing Consumption Power
0.70% 1.23% 1.93% 2.30% from 01-Apr-2019
2019-20
HSBC Global Consumer Opportunities Fund – Benefiting From China’s Growing Consumption Power
0.70% 1.33% 2.03% 2.30% from 01-Apr-2019
Key Statistics for the year ended March 31, 2021 (Contd...)
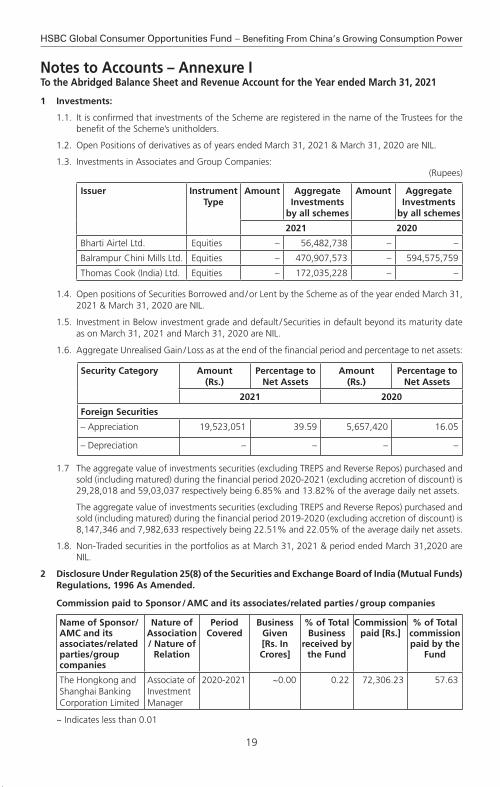
19
HSBC Global Consumer Opportunities Fund – Benefiting From China’s Growing Consumption Power
Notes to Accounts – Annexure ITo the Abridged Balance Sheet and Revenue Account for the Year ended March 31, 2021
1 Investments:
1.1. It is confirmed that investments of the Scheme are registered in the name of the Trustees for the benefit of the Scheme’s unitholders.
1.2. Open Positions of derivatives as of years ended March 31, 2021 & March 31, 2020 are NIL.
1.3. Investments in Associates and Group Companies:(Rupees)
Issuer Instrument Type
Amount Aggregate Investments
by all schemes
Amount Aggregate Investments
by all schemes
2021 2020
Bharti Airtel Ltd. Equities – 56,482,738 – –
Balrampur Chini Mills Ltd. Equities – 470,907,573 – 594,575,759
Thomas Cook (India) Ltd. Equities – 172,035,228 – –
1.4. Open positions of Securities Borrowed and / or Lent by the Scheme as of the year ended March 31, 2021 & March 31, 2020 are NIL.
1.5. Investment in Below investment grade and default / Securities in default beyond its maturity date as on March 31, 2021 and March 31, 2020 are NIL.
1.6. Aggregate Unrealised Gain / Loss as at the end of the financial period and percentage to net assets:
Security Category Amount (Rs.)
Percentage to Net Assets
Amount (Rs.)
Percentage to Net Assets
2021 2020
Foreign Securities
– Appreciation 19,523,051 39.59 5,657,420 16.05
– Depreciation – – – –
1.7 The aggregate value of investments securities (excluding TREPS and Reverse Repos) purchased and sold (including matured) during the financial period 2020-2021 (excluding accretion of discount) is 29,28,018 and 59,03,037 respectively being 6.85% and 13.82% of the average daily net assets.
The aggregate value of investments securities (excluding TREPS and Reverse Repos) purchased and sold (including matured) during the financial period 2019-2020 (excluding accretion of discount) is 8,147,346 and 7,982,633 respectively being 22.51% and 22.05% of the average daily net assets.
1.8. Non-Traded securities in the portfolios as at March 31, 2021 & period ended March 31,2020 are NIL.
2 Disclosure Under Regulation 25(8) of the Securities and Exchange Board of India (Mutual Funds) Regulations, 1996 As Amended.
Commission paid to Sponsor / AMC and its associates/related parties / group companies
Name of Sponsor/AMC and its associates/related parties/group companies
Nature of Association / Nature of
Relation
Period Covered
Business Given [Rs. In Crores]
% of Total Business
received by the Fund
Commission paid [Rs.]
% of Total commission paid by the
Fund
The Hongkong and Shanghai Banking Corporation Limited
Associate of Investment Manager
2020-2021 ~0.00 0.22 72,306.23 57.63
~ Indicates less than 0.01
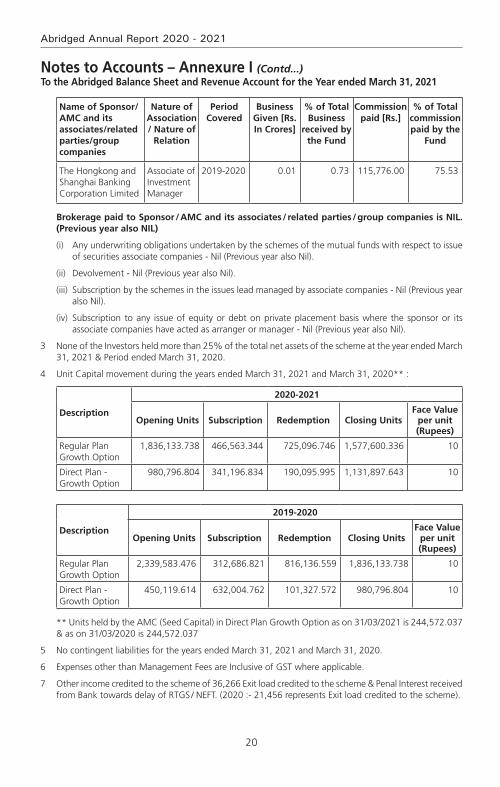
20
Abridged Annual Report 2020 - 2021
Name of Sponsor/AMC and its associates/related parties/group companies
Nature of Association / Nature of
Relation
Period Covered
Business Given [Rs. In Crores]
% of Total Business
received by the Fund
Commission paid [Rs.]
% of Total commission paid by the
Fund
The Hongkong and Shanghai Banking Corporation Limited
Associate of Investment Manager
2019-2020 0.01 0.73 115,776.00 75.53
Brokerage paid to Sponsor / AMC and its associates / related parties / group companies is NIL. (Previous year also NIL)
(i) Any underwriting obligations undertaken by the schemes of the mutual funds with respect to issue of securities associate companies - Nil (Previous year also Nil).
(ii) Devolvement - Nil (Previous year also Nil).
(iii) Subscription by the schemes in the issues lead managed by associate companies - Nil (Previous year also Nil).
(iv) Subscription to any issue of equity or debt on private placement basis where the sponsor or its associate companies have acted as arranger or manager - Nil (Previous year also Nil).
3 None of the Investors held more than 25% of the total net assets of the scheme at the year ended March 31, 2021 & Period ended March 31, 2020.
4 Unit Capital movement during the years ended March 31, 2021 and March 31, 2020** :
Description
2020-2021
Opening Units Subscription Redemption Closing UnitsFace Value
per unit (Rupees)
Regular Plan Growth Option
1,836,133.738 466,563.344 725,096.746 1,577,600.336 10
Direct Plan - Growth Option
980,796.804 341,196.834 190,095.995 1,131,897.643 10
Description
2019-2020
Opening Units Subscription Redemption Closing UnitsFace Value
per unit (Rupees)
Regular Plan Growth Option
2,339,583.476 312,686.821 816,136.559 1,836,133.738 10
Direct Plan - Growth Option
450,119.614 632,004.762 101,327.572 980,796.804 10
** Units held by the AMC (Seed Capital) in Direct Plan Growth Option as on 31/03/2021 is 244,572.037 & as on 31/03/2020 is 244,572.037
5 No contingent liabilities for the years ended March 31, 2021 and March 31, 2020.
6 Expenses other than Management Fees are Inclusive of GST where applicable.
7 Other income credited to the scheme of 36,266 Exit load credited to the scheme & Penal Interest received from Bank towards delay of RTGS / NEFT. (2020 :- 21,456 represents Exit load credited to the scheme).
Notes to Accounts – Annexure I (Contd...)To the Abridged Balance Sheet and Revenue Account for the Year ended March 31, 2021
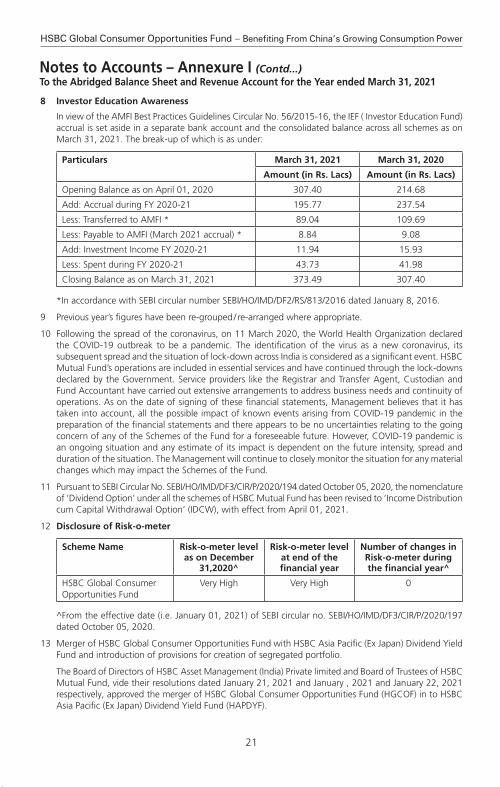
21
HSBC Global Consumer Opportunities Fund – Benefiting From China’s Growing Consumption Power
8 Investor Education Awareness
In view of the AMFI Best Practices Guidelines Circular No. 56/2015-16, the IEF ( Investor Education Fund) accrual is set aside in a separate bank account and the consolidated balance across all schemes as on March 31, 2021. The break-up of which is as under:
Particulars March 31, 2021 March 31, 2020
Amount (in Rs. Lacs) Amount (in Rs. Lacs)
Opening Balance as on April 01, 2020 307.40 214.68
Add: Accrual during FY 2020-21 195.77 237.54
Less: Transferred to AMFI * 89.04 109.69
Less: Payable to AMFI (March 2021 accrual) * 8.84 9.08
Add: Investment Income FY 2020-21 11.94 15.93
Less: Spent during FY 2020-21 43.73 41.98
Closing Balance as on March 31, 2021 373.49 307.40
*In accordance with SEBI circular number SEBI/HO/IMD/DF2/RS/813/2016 dated January 8, 2016.
9 Previous year’s figures have been re-grouped / re-arranged where appropriate.
10 Following the spread of the coronavirus, on 11 March 2020, the World Health Organization declared the COVID-19 outbreak to be a pandemic. The identification of the virus as a new coronavirus, its subsequent spread and the situation of lock-down across India is considered as a significant event. HSBC Mutual Fund’s operations are included in essential services and have continued through the lock-downs declared by the Government. Service providers like the Registrar and Transfer Agent, Custodian and Fund Accountant have carried out extensive arrangements to address business needs and continuity of operations. As on the date of signing of these financial statements, Management believes that it has taken into account, all the possible impact of known events arising from COVID-19 pandemic in the preparation of the financial statements and there appears to be no uncertainties relating to the going concern of any of the Schemes of the Fund for a foreseeable future. However, COVID-19 pandemic is an ongoing situation and any estimate of its impact is dependent on the future intensity, spread and duration of the situation. The Management will continue to closely monitor the situation for any material changes which may impact the Schemes of the Fund.
11 Pursuant to SEBI Circular No. SEBI/HO/IMD/DF3/CIR/P/2020/194 dated October 05, 2020, the nomenclature of ‘Dividend Option’ under all the schemes of HSBC Mutual Fund has been revised to ‘Income Distribution cum Capital Withdrawal Option’ (IDCW), with effect from April 01, 2021.
12 disclosure of risk-o-meter
Scheme Name Risk-o-meter level as on December
31,2020^
Risk-o-meter level at end of the financial year
Number of changes in Risk-o-meter during the financial year^
HSBC Global Consumer Opportunities Fund
Very High Very High 0
^From the effective date (i.e. January 01, 2021) of SEBI circular no. SEBI/HO/IMD/DF3/CIR/P/2020/197 dated October 05, 2020.
13 Merger of HSBC Global Consumer Opportunities Fund with HSBC Asia Pacific (Ex Japan) Dividend Yield Fund and introduction of provisions for creation of segregated portfolio.
The Board of Directors of HSBC Asset Management (India) Private limited and Board of Trustees of HSBC Mutual Fund, vide their resolutions dated January 21, 2021 and January , 2021 and January 22, 2021 respectively, approved the merger of HSBC Global Consumer Opportunities Fund (HGCOF) in to HSBC Asia Pacific (Ex Japan) Dividend Yield Fund (HAPDYF).
Notes to Accounts – Annexure I (Contd...)To the Abridged Balance Sheet and Revenue Account for the Year ended March 31, 2021
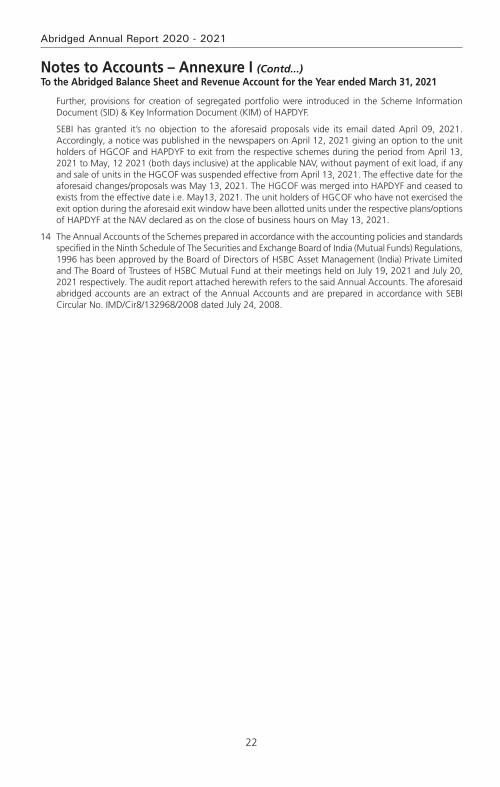
22
Abridged Annual Report 2020 - 2021
Further, provisions for creation of segregated portfolio were introduced in the Scheme Information Document (SID) & Key Information Document (KIM) of HAPDYF.
SEBI has granted it’s no objection to the aforesaid proposals vide its email dated April 09, 2021. Accordingly, a notice was published in the newspapers on April 12, 2021 giving an option to the unit holders of HGCOF and HAPDYF to exit from the respective schemes during the period from April 13, 2021 to May, 12 2021 (both days inclusive) at the applicable NAV, without payment of exit load, if any and sale of units in the HGCOF was suspended effective from April 13, 2021. The effective date for the aforesaid changes/proposals was May 13, 2021. The HGCOF was merged into HAPDYF and ceased to exists from the effective date i.e. May13, 2021. The unit holders of HGCOF who have not exercised the exit option during the aforesaid exit window have been allotted units under the respective plans/options of HAPDYF at the NAV declared as on the close of business hours on May 13, 2021.
14 The Annual Accounts of the Schemes prepared in accordance with the accounting policies and standards specified in the Ninth Schedule of The Securities and Exchange Board of India (Mutual Funds) Regulations, 1996 has been approved by the Board of Directors of HSBC Asset Management (India) Private Limited and The Board of Trustees of HSBC Mutual Fund at their meetings held on July 19, 2021 and July 20, 2021 respectively. The audit report attached herewith refers to the said Annual Accounts. The aforesaid abridged accounts are an extract of the Annual Accounts and are prepared in accordance with SEBI Circular No. IMD/Cir8/132968/2008 dated July 24, 2008.
Notes to Accounts – Annexure I (Contd...)To the Abridged Balance Sheet and Revenue Account for the Year ended March 31, 2021
23
HSBC Global Consumer Opportunities Fund – Benefiting From China’s Growing Consumption Power
Voting Policy and Procedures
In view of SEBI guidelines related to “Role of Mutual Funds in Corporate Governance of Public Listed Companies”, HSBC AMC has formulated its “Policy for Proxy Voting in Public Listed Companies”. The said policy is available on our website and the details of actual exercise of proxy votes, the summary of votes casted and the auditor’s certificate for the Financial Year 2020 – 21 is forming part of our full Annual Report for the Financial Year 2020 – 21 which is uploaded on our website at http://www.assetmanagement.hsbc.co.in

24
Abridged Annual Report 2020 - 2021
Statutory Details & Disclaimers
All the returns have been sourced from Mutual Funds India Explorer software. The performance of the schemes and the benchmark is calculated on a total return basis. This document has been prepared by HSBC Asset Management (India) Private Ltd (HSBC) for information purposes only and should not be construed as i) an offer or recommendation to buy or sell securities, commodities, currencies or other investments referred to herein; or ii) an offer to sell or a solicitation or an offer for purchase of any of the funds of HSBC Mutual Fund; or iii) an investment research or investment advice. All information contained in this document (including that sourced from third parties), is obtained from sources HSBC and the third party which HSBC believes to be reliable however, has not independently verified the same. The information and opinions contained within the document are based upon publicly available information and rates of taxation applicable (if any) at the time of publication, which are subject to change from time to time.
Expressions of opinion are those of HSBC only and are subject to change without notice. It does not have regard to specific investment objectives, financial situation and the particular needs of any specific person who may receive this document. Investors should seek personal and independent advice regarding the appropriateness of investing in any of the funds, securities, other investment or investment strategies that may have been discussed or referred herein and should understand that the views regarding future prospects may or may not be realized. In no event shall HSBC Mutual Fund / HSBC Asset management (India) Private Limited and / or its affiliates or any of their directors, trustees, officers and employees be liable for any direct, indirect, special, incidental or consequential damages arising out of the use of information / opinion herein. Neither this document nor the units of HSBC Mutual Fund have been registered in any jurisdiction. The distribution of this document in certain jurisdictions may be restricted or totally prohibited and accordingly, persons who come into possession of this document are required to inform themselves about, and to observe, any such restrictions.
mutual fund investments are subject to market risks, read all scheme related documents carefully.

iii
HSBC Global Consumer Opportunities Fund – Benefiting From China’s Growing Consumption Power
Link your PAN to your Aadhaar CardPlease note as per regulatory requirement, PAN-Aadhaar linking is mandatory with effect from October 1, 2021. We request you to ensure PAN-Aadhaar linking is completed for all the holders in the folio (including guardian in case of minor) in order to avoid any disruption in financial and non-financial transactions.
To check the PAN-Aadhaar linking status of your PAN visit the following link:
https://eportal.incometax.gov.in/iec/foservices/#/pre-login/bl-link-aadhaar
useful links for self service options
• ToInvestonlineorUpdateyourBankdetailsorNominee visit: https://invest.assetmanagement.hsbc.co.in
• use our 24 x 7 chatbot - “aSkme” for any queries or service requestvisit: https://invest.assetmanagement.hsbc.co.in
• to update your Personal details like Pan & email idvisit: https://new.camsonline.com
SmS your request to hSBc mutual fund
• CurrentValuation-SMS CAMS O VAL <Folio> to 56767
example: CAMS O VAL 123456
• LatestAccountStatementviaEmail-SMS CAMS O SOA <Folio> <password>* to 56767
example: CAMS O SOA 123456 hsbc12
*The password length must be 6 characters, and must contain atleast 2 numbers and 2 alphabets.
important updates
HSBC Global Equity Climate Change Fund of FundAn open ended fund of fund scheme investing in HSBC Global Investment Funds – Global Equity Climate Change
Abridged Annual Report 2020 - 2021

1
HSBC Global Equity Climate Change Fund of Fund#
Dear Investor,
The beginning of the last financial year now almost seems like a distant memory. COVID-19 was still a relatively unknown enemy and governments across the world were grappling with ways to control and mitigate the risks associated with it. Nationwide lockdowns were the norm and our markets both equity and fixed income reacted negatively leading to significant erosion of wealth. Within a short period of time markets bounced back. This confounded even the most astute market pundits. How is it possible that when GDP growth had slowed down, unemployment had risen, inflation was high could there be such sharp up move in equity indices. Whilst the reasons are well known about easy global liquidity, demand resurgence, cost cutting by corporates etc. perhaps its most important to remember that the markets are not a reflector but a predictor of economic activity.
At all times particularly during such volatile times it is important to go back to the basics. Why do you save, why do you invest, what goals would you like to achieve, how old are you, what is your risk appetite? The replies to these simple questions will help you determine your asset allocation. As an example when equity markets corrected sharply last year, investors who reviewed their asset allocation, stayed invested during the lows of the past year and were able to capture the rebound and have seen prime returns since then. The current market movement in all likelihood would have also led to some imbalances in your asset allocation. Do not ignore that and I strongly recommend that you do review this with your advisor to check whether re-balancing is required.
During this financial year we had three very successful new fund launches. The pandemic showed us a clear trend of dominant players becoming stronger and profit pool getting consolidated within a few companies. To capture this opportunity, we launched the HSBC Focused Equity Fund which garnered close to Rs. 520 crores. During the second half of 2020, in the fixed income space, 3 - 5 year duration range had a favourable investment scenario as RBI’s accommodative policy and surplus liquidity had reduced the returns at the very short end of the yield curve. There was a demand for an actively managed moderate duration strategy with better credit quality which we fulfilled by launching HSBC Corporate Bond Fund. It garnered over 700 crores. Our latest and first of its kind offering, HSBC Global Equity Climate Change Fund of Fund saw a stupendous response with over 8000 investors investing over Rs. 616 crores. This is an investment opportunity which goes beyond the rationale of simply generating investment returns and is the future of responsible investing.
We worked towards augmenting our digital capabilities by launching a few key enhancements to our online transaction platform. Being mindful of the movement restrictions in place, this year we focused on digitizing offline processes so that an investor need not need step out of her home for investing or availing any key services. While our interactive chatbot AskMe, eased service queries, our end-to-end digital KYC module enabled a first time Mutual Fund investor to invest in our funds without any paperwork. We listened to your feedback and digitized consolidation of folios and change of tax status which eliminated the need for you to physically visit our branches.
I am a strong believer in the India story and this story has just begun. The opportunity to invest in this high growth market is a very exciting opportunity. I do hope you share my enthusiasm and I ask that you continue to invest whilst reviewing your asset allocation at all times. As always thank you for your business. Stay safe.
Warm regards,
Ravi MenonChief Executive Officer,
HSBC Asset Management India

2
Abridged Annual Report 2020 - 2021
SPONSOR
HSBC Securities and Capital Markets (India) Private LimitedRegd. Office: 52/60, Mahatma Gandhi Road, Fort, Mumbai - 400 001.
TRUSTEE
Board of TrusteesOffice: 16, Veer Nariman Road, Fort, Mumbai 400 001.
ASSET MANAGEMENT COMPANY
HSBC Asset Management (India) Private LimitedCorp. & Regd. Office: 16, Veer Nariman Road, Fort, Mumbai 400 001.
CUSTODIAN
Standard Chartered Bank (SCB)Corp. & Regd. Office: Crescenzo, Securities Services, 3rd Floor, C-38/39, G-Block,
Bandra Kurla Complex, Bandra East, Mumbai – 400051.
AUDITORS TO THE SCHEME
BSR & Co. LLPChartered Accountants
5th Floor, Lodha Excelus, Apollo Mills Compound, N. M. Joshi Marg, Mahalaxmi, Mumbai 400 011.
REGISTRAR & TRANSFER AGENTS
Computer Age Management Services Limited (CAMS)Unit: HSBC Mutual Fund ’C’ Block, 2nd Floor, Hanudev Info Park P. Ltd., SF No. 558/2, Udayampalayam Road, Nava India, Coimbatore - 641 028.
BOARD OF TRUSTEES
Ms. Jasmine Batliwalla - Chairperson
Mr. Nani Javeri - Trustee
Dr. T. C. Nair - Trustee
Mr. Pedro Bastos - Trustee
BOARD OF DIRECTORS
Mr. Dinesh Mittal - Director
Dr. Indu Shahani - Director
Mr. Ravi Menon - Director & Chief Executive Officer

3
HSBC Global Equity Climate Change Fund of Fund#
The Trustees of HSBC Mutual Fund (“Fund”) present the Nineteenth Annual Report and the audited abridged financial statements of the schemes of the Fund for the year ended March 31, 2021.
As at March 31, 2021, the Fund offered 37 schemes across asset classes to meet the varying investment needs of the investors. During FY 2020-2021, the Fund has launched various new products namely HSBC Corporate Bond Fund, HSBC Focused Equity Fund and HSBC Global Equity Climate Change Fund of Fund to fill the gaps in our product offering.
The Fund continues its focus on delivering consistent long term returns. The comments on the performance of the Scheme(s) is provided hereinafter. Dividends were declared under various schemes as per the provisions contained in the respective Scheme Information Documents after considering the distributable surplus available under the respective Schemes. Details of dividends declared can be viewed on our website at www.assetmanagement.hsbc.co.in.
1. SCHEME PERFORMANCE, FUTURE OUTLOOk AND OPERATIONS OF THE SCHEMES
a. Operations and Performance of the Schemes
HSBC Global Equity Climate Change Fund of Fund (HGCECF) @ (An open ended fund of fund scheme investing in HSBC Global Investments Funds - Global Equity Climate Change)
HGCECF seeks to provide long term capital appreciation by investing predominantly in units of HSBC Global Investment Funds – Global Equity Climate Change. The Scheme may also invest a certain proportion of its corpus in money market instruments and / or units of overnight / liquid mutual fund schemes, in order to meet liquidity requirements from time to time. However, there is no assurance that the investment objective of the Scheme will be achieved.
The net assets of HGCECF amounted to Rs. 621.88 crores as on March 31, 2021. Around 35.74 % of the net assets were invested in HSBC Global Equity Climate Change Fund of Fund (overseas mutual fund), 64.26% of the net assets comprised of reverse repos / TREPS and net current assets as at March 31, 2021. The inception date of the fund was March 22, 2021.
@Note: The Performance of HSBC Global Equity Climate Change Fund of Fund has not been provided as the scheme has not completed six months from the date of inception as on March 31, 2021.
b. Market Overview & Outlook (as furnished by HSBC Asset Management (India) Private Limited)
EqUITY OUTLOOk
Recap of FY 2020-21:
Fiscal 2020-21 was a rewarding year for equity investors with market indices recording stellar gains from the low base after the COVID correction. Market sentiments steadily improved during the course of the year to deliver positive returns in all four quarters of the year.
We witnessed various legs of market performance during the last fiscal, driven by multiple factors and variables. Initial rebound from the market lows was driven by attractive valuations, then it was on the back of faster than anticipated recovery post lockdown, reopening optimism, swifter than expected vaccine intervention and above all, the unprecedented liquidity. Lastly but importantly, a period of lower cost of capital coupled with low real rates, improved the attractiveness of equity as an asset class, driving the performance.
As a result, the year ended with optimism compared to despair when it began. Corporate India overcame the challenges posed by COVID through significant cost control measures while at the same time showed improvement in their financial position and cash flows.
Commodities also rallied from the lows of the COVID crisis with global crude oil prices surging by 179% during the year. INR appreciated by 3.3% (as India recorded strong net FPI inflows) during the year. MSCI India index outperformed most of key global indices during the past fiscal. MSCI India index (USD) gained
Trustees’ ReportFor the year ended March 31, 2021

4
Abridged Annual Report 2020 - 2021
74.8% as compared to 51.8% for MSCI World, 50.5% for Dow Jones, 55.1% for MSCI Emerging Markets, 41.2% for MSCI China and 42% for MSCI Europe*.
At a record USD 37.3 bn of net FPI inflows during the fiscal, the tally was higher than the cumulative net inflows India received from the previous 6 years. DIIs on the other hand saw net outflows of USD 18.4 bn and this was the first fiscal year of net outflows from the segment in 5 years. The net outflows from the segment was driven by USD 16.7 bn of outflows from the MFs while domestic insurers saw a far lower outflow of USD 1.6 bn*.
Indices Returns (April 1, 2020 to March 31, 2021) 1 Year^
S&P BSE Sensex TR 69.8%
NSE CNX Nifty TR 72.5%
S&P BSE 100 TR 73.5%
S&P BSE 200 TR 76.3%
S&P BSE 500 TR 78.6%
S&P BSE Midcap TR 93.0%
S&P BSE 250 Small-cap TR 117.5%
^Source: Bloomberg (Above table values are for total return indices)
Way forward:
Beginning of the new fiscal, India had to contend with the risk of the second COVID wave, which was more ferocious than the first wave on the human impact. However, as we write this, the second wave has already peaked and there have been a significant fall in number of active cases, case-positivity rate, daily new caseload and deaths. Vaccination drive also has seen acceleration with and is now closer to 6 mn doses per day mark. Also, the impact of the lockdown on economic activity has been significantly lower during the second wave, compared to last year. In most of the states, the unlocking process has already begun in a phased manner and this is leading to improvement in various activity indicators. Mobility indicators are recovering faster while economic indicators (freight, credit off-take, E-way bill generation, power demand etc.) are also witnessing a gradual recovery. The recently concluded earnings season has turned out to be in-line with expectations and despite the concerns of around the second wave, the earnings (Nifty) have seen upgrades for FY22. Market is looking beyond the current quarter (i.e. 1QFY22), which would witness an impact due to the second wave. Our baseline assumption is that of a temporary impact from the second wave and the set-back to the recovery process limited to a few months, after which we should see the economic rebound. So far, this is tracking in-line with assumptions.
From a macro perspective, the current estimates for GDP growth in FY22 stand at 9.2%* (after seeing downgrades to factor in the impact of second wave). The downgrade in estimates are pertaining to the first quarter and hence the trajectory of growth from hereon should pick up. The tax collections data for the first two months of FY22 has remained strong, implying that the drawdown of the second wave on the fiscal position is not alarming. Additionally, the impact of fiscal stimulus package announced in FY22 so far is manageable (about 60 bps of GDP) and hence would not lead to any fiscal strain.
After the spectacular rally, market valuations at an overall level are now trending above historical averages on traditional valuation metrics (P/E, P/B). This is true for all market capitalization categories (viz large, mid and small). Typically, the broader market (i.e. mid and small cap segments), trade at a discount to large caps, however this scenario has now reversed after the outperformance from the broader market segments. However, the earnings momentum continues to remain strong (witnessing upgrades so far) and except for a short period due to second wave, the earnings momentum should hold up.
We believe that the risk-reward is balanced for the equity markets in the near term. Higher or sticky inflation expectations globally, higher than historical market valuations on some parameters (i.e. P/E, P/B) and adverse demand impact from the second wave are risk factors to contend with in the near term. However, these are counter balanced by positive commentary from companies, significant decline in COVID cases and acceleration in the vaccination programme. As a result, in the near term markets may see a consolidation phase and could take cues from the upcoming earnings season with more focus on the corporate commentary and the outlook.
Trustees’ ReportFor the year ended March 31, 2021 (Contd...)
5
HSBC Global Equity Climate Change Fund of Fund#
From a medium to long term perspective, the outlook for equity markets remains positive. The expectation of cyclical revival in the economy brings in a multi-year earnings visibility. This along with a benign cost of capital environment, should support equity performance. However, equity returns are likely to moderate on the back of the relatively high valuations and the strong recovery we have already witnessed from the COVID lows. Equity performance is likely to mirror the earnings growth trends over the medium to long term.
Pace of vaccination, concerns about a third wave, corporate earnings trajectory, inflation trends (both global & domestic), monsoon trends and commodity prices (especially crude oil) are some of the key factors which could influence market performance in the short term.
From a portfolio perspective, we are maintaining a pro-cyclical bias. We expect earnings growth to rebound sharply post the current COVID phase. Earnings growth are expected to sustain in high-teens beyond FY22 on the back of economy witnessing a cyclical recovery due to revival in capex cycle over the next 2-3 years (first by the government followed by private capex). From a sectoral perspective our order of preference is rate sensitives followed by domestic cyclicals, exporters and domestic consumption. Predominantly regulated businesses come last in our pecking order. This preference is dictated by our assessment of sectors / segments leading contribution to the market earnings growth over the next 2-3 years. Our portfolio construction is driven by a bottom up approach to stock selection with a focus on names that can deliver positive earnings surprises. We continue to focus on this theme to identify likely outperformers.
*Source: Bloomberg
DEBT OUTLOOk
Market drivers during the course of the year FY21
The Fixed Income markets started the year with a bout of nervousness that was triggered by the pandemic. While RBI had calmed the markets with its large rate cut action of 75bp cut followed by liquidity supportive measures, the volatility continued until mid-May when government announced its relief package. While it was not fiscally expansive, it touched the right cords in terms of credit flow to desired sectors. This was followed up with RBI’s credit relief measures in terms of moratorium and restructuring of assets that were stressed due to the pandemic. Throughout the course of the year, RBI maintained its accommodative stance along with significant amount of surplus liquidity that was supportive and helped in maintaining stability in the market. However, as the year progressed and pressure on fiscal began to mount yields started seeing a spike towards the last quarter of the fiscal. While borrowing was stepped up to INR 12 trillion from previously budgeted INR 7.8 trillion in May 2020, it was further enhanced by and additional INR 1.1 trillion in October 2020. Overall GOI ended up borrowing a record amount of INR 13.9 trillion. The budget proved to be a shocker with GOI using the pandemic as an opportunity for setting the finances in order. GOI showed a record deficit of 9.5% for FY21 and projected a 6.8% for FY22 with estimated central government gross borrowing of INR 12 trillion. This seemed to reverse the support RBI had provided throughout the year with benchmark 10-year bond peaking to 6.23% in mid –Feb 2021. RBI’s statements to remain supportive were left in the sidelines. Overall it seemed that the 115bp of rate cut, along with significant liquidity infusion (OMO + Twist operations of ~INR 3 trillion, infusion via dollar purchases) seemed only a little to help in applying a brake to the one-way spike in yields. The year closed ~6.16% with absence of concrete action by RBI.
RBI Policy: Through the course of the year, RBI has maintained an accommodative stance, with an aggregate 115bp of rate cut done in March and May 2020 taking the repo rate from 5.15% to 4%. Subsequently while inflation pressures prevented RBI from taking any direct actions, RBI has used a combination of creative tools to keep the rates contained primarily via liquidity supportive tools such as OMOs, Twist Operations, Repo linked Term loans to needy sectors (LTROs, TLTROs), CRR cuts. While inflation was a worry for most part of the year, RBI kept it aside admitting that growth was a priority and inflation effects are more supply side rather than demand side. Prospectively into FY22, with the onset of the second wave, RBI continues to maintain the stance to prioritize growth.
Inflation: Inflation for most part of the year stayed above 6% primarily driven by supply side pressures and some intermittent spike from food inflation as well. While it has been coming off since December with cooling off of food inflation and positive base effects, it has been between 4- 5.5%. Structurally however inflation risks continue to remain as oil prices have increased and base effects will not remain supportive for long. Core inflation continues to remain sticky.
Trustees’ ReportFor the year ended March 31, 2021 (Contd...)
6
Abridged Annual Report 2020 - 2021
Liquidity: During the year, system liquidity has remained at significant surplus facilitated largely by RBI action such as OMOs, foreign exchange operations and government spending.
Budget: The FY2022 union budget focuses on growth and has accordingly, presented a 9.5% fiscal deficit for FY21 and 6.8% for FY22. On the revenue side, the assumptions are largely realistic, with FY22 (E) Nominal GDP growth at 14.4% and tax revenue growth at 17% considering the pandemic impact in FY 21. Compared to FY20, tax revenue growth is ~10%. While non-tax revenues are ambitious pegging the divestment at INR 1.75 trillion, with robust pipeline of assets including monetization of road and transmission assets, execution remains the key as in the past. On the expenditure side, better quality capex spending with focusing on rail, road, defense, urban infra is positive for long term structural growth. The revenue side expenditure adjusting for clearance of past subsidy arrears will be similar to budgetary estimates. Government using this opportunity to bring back off-balance sheet spending to on-balance sheet was a welcome move towards transparency and showing realistic projections. Alongside, states have also been given leeway to borrow upto 4% of their GDP with an additional 0.5% subject to conditions. Given that states are an important vehicle for capex investment, this move is welcome although it may entail additional state borrowing. The fiscal glide path is shifted to FY26 at below 4.5% for center and 3% for states suggesting that spending will continue and borrowing will come down gradually. In summary, from survival to revival, FY22 budget aims for structural growth leaving fiscal concerns sideways in the interim. Government’s intent seems clear on bringing back growth on the table, in a transparent manner.
While the second wave of the pandemic has once again derailed the revenue story, government will still have some cushion from its conservative estimates.
Currency and FII Flows: INR has been on an appreciation trajectory for most part of the year, aided by dollar underperformance supported by positive FII and FDI flows along with reduced imports on the domestic front as well. RBI has used most of the flows to accumulate reserves which has prevented any strong appreciation. Pandemic shock and global risk off led rupee over 75 in the beginning of the year only to close below 72 at the end of the fiscal year. While the second wave led to another spike in INR in April, it has since then cooled once again driven by dollar underperformance and pandemic recovery on the domestic front. Net FII flows was ~$30 bn with positive equity flows of~$37 bn while debt was negative ~$7bn and overall RBI’s forex reserves rose by a ~$100 bn to close ~$537 bn.
Credit growth: Credit growth for the entire year has been tepid as previous year’s credit events were followed by nervousness relating to the pandemic. Despite RBI opening up several windows to finance the non-AAA segment, there was very little fresh credit flowing that segment. Overall banking credit grew by only 6.5%. Risk appetite has however been improving from a complete risk aversion to opening up towards a calculated risk. Prospectively it is expected that once the pandemic risk abates, credit growth will resume primarily driven by government capex spending and demand recovery.
Market Outlook
The pandemic once again brought the country to a situation similar to last year and debt markets perhaps interpreted the same as a structural rise in rates. In the initial day’s post budget in Feb of 2021, market was expecting a concrete set of actions such as an OMO calendar from RBI, and RBI’s words alone failed to calm the market. The first auction of the fiscal year also saw a devolvement. However, RBI acted in the first policy of the year announcing a bond buyback program akin to QE (quantitative easing) and its subsequent cancellation of auctions wherein yields were perhaps quoted higher than RBI’s comfort levels brought back confidence into the market. Since then we have seen a strong rally with 10-year benchmark trending below 6% and the curve moving alongside. RBI reiteration of priority of growth and also supporting with higher than expected dividend payment stand out as a testimony of its support. While we do not expect RBI to act in terms of rate cuts, we believe that measures such as G-SAP, OMOs will continue until there is visibility of a structural growth. Therefore, the large borrowing program should go without any hiccups.
Furthermore, with the evidence of strong GST numbers until April 2021 (before the 2nd wave), it is expected that growth and therefore fiscal revenues will come back. Government’s conservative budget estimates are supportive. Also, given the fact that compared to last year there has not been a complete shutdown of activity (lockdowns being distributed), the impact on growth will not be similar to last year. Pent up demand will come back to support revenue collection. However, on the flipside, once growth resumes RBI will be forced to withdraw liquidity in a phased manner to prevent asset bubbles. Nevertheless, RBI need not act in terms of rate actions and we believe that a prolonged pause in terms of RBI rates is in the offing.
Trustees’ ReportFor the year ended March 31, 2021 (Contd...)
7
HSBC Global Equity Climate Change Fund of Fund#
Net-net therefore while growth is wanting no matter what, it may come at a small price of rise in yields with liquidity withdrawal. That is however expected more in the 2nd half of the year. Lower than expected borrowing numbers, later this year or if not in next year could be a surprise. We may therefore see a range bound rate action in the near term with a rising bias over time. Global rate environment, oil and currency risks are to be watched out for.
2. BRIEF BACkGROUND OF SPONSORS, BOARD OF TRUSTEES AND ASSET MANAGEMENT COMPANY
a. Sponsor
HSBC Mutual Fund is sponsored by HSBC Securities and Capital Markets (India) Private Limited (HSCI). The Sponsor is the Settler of the Mutual Fund Trust. The Sponsor has entrusted a sum of Rs. 1,00,000/- (Rupees One Lakh only) to the Trustee as the initial contribution towards the corpus of the Mutual Fund.
HSCI offers integrated investment banking services, securities and corporate finance & advisory. HSCI is a member of the Bombay Stock Exchange Limited and National Stock Exchange (capital and derivative market segments). HSCI holds 100% of the paid up equity share capital of HSBC Asset Management (India) Private Limited.
b. HSBC Mutual Fund
HSBC Mutual Fund (“the Mutual Fund” or “the Fund”) has been constituted as a Trust in accordance with the provisions of the Indian Trusts Act, 1882 (2 of 1882) vide a Trust Deed dated February 7, 2002 with HSBC Securities and Capital Markets (India) Private Limited, as the Sponsor and the Board of Individual Trustees. The Trustee has entered into an Investment Management Agreement dated February 7, 2002 with HSBC Asset Management (India) Private Limited (AMC) to function as the Investment Manager for all the schemes of the Fund. The Fund was registered with SEBI vide registration number MF/046/02/5 dated May 27, 2002.
The Trust has been formed for the purpose of pooling of capital from the public for collective investment in securities for the purpose of providing facilities for participation by persons as beneficiaries in such investments and in the profits/income arising therefrom.
c. Board of Trustees (the Trustees)
The Board of Trustees is the exclusive owner of the Trust Fund and holds the same in trust for the benefit of the unit holders. The Trustees have been discharging their duties and carrying out the responsibilities as provided in the SEBI (Mutual Funds) Regulations, 1996 and the Trust Deed. The Trustees seek to ensure that the Fund and the schemes floated there under are managed by the AMC in accordance with the Trust Deed, the said Regulations, directions and guidelines issued by the SEBI, the Stock Exchanges, the Association of Mutual Funds in India and other regulatory agencies.
d. Asset Management Company (the AMC)
HSBC Asset Management (India) Private Limited (the Investment Manager or the AMC) is a private limited company incorporated under the Companies Act, 1956 on December 12, 2001 having its Registered Office at 16, V. N. Road, Fort, Mumbai 400 001. HSBC Asset Management (India) Private Limited has been appointed as the Asset Management Company of HSBC Mutual Fund by the Trustee vide Investment Management Agreement (IMA) dated February 7, 2002 and executed between the Trustees and the AMC. SEBI approved the AMC to act as the Investment Manager of the Fund vide its letter No. MFD/BC/163/2002 dated May 27, 2002. The paid-up equity share capital of the AMC is Rs. 61.59 crores. The AMC is registered as a Portfolio Manager under the SEBI (Portfolio Managers) Regulations, 1993 vide registration no. INP000001322. The AMC also offers non-binding Advisory services to offshore funds under the mutual fund license.
HSBC Securities and Capital Markets (India) Private Limited holds 100% of the paid up equity share capital of the AMC.
3. INvESTMENT OBJECTIvE OF THE SCHEMESThe investment objective of the respective schemes has been provided above under the heading “Scheme Performance, Future Outlook and Operation of the Scheme” (Refer Section 1).
Trustees’ ReportFor the year ended March 31, 2021 (Contd...)
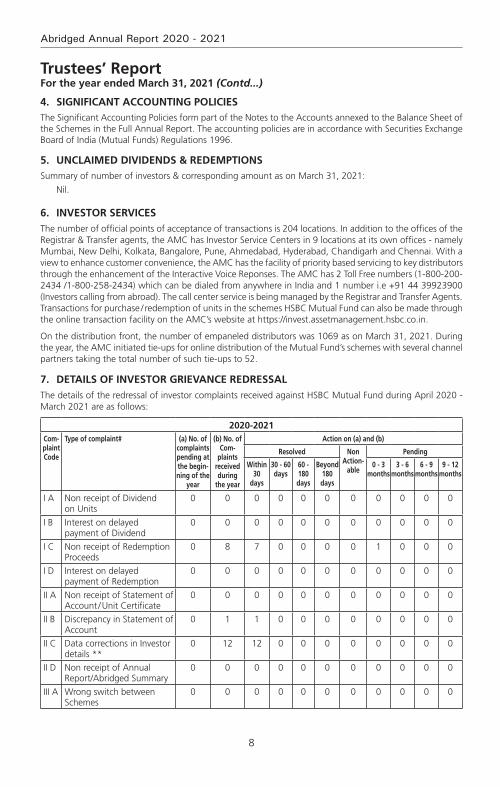
8
Abridged Annual Report 2020 - 2021
4. SIGNIFICANT ACCOUNTING POLICIES The Significant Accounting Policies form part of the Notes to the Accounts annexed to the Balance Sheet of the Schemes in the Full Annual Report. The accounting policies are in accordance with Securities Exchange Board of India (Mutual Funds) Regulations 1996.
5. UNCLAIMED DIvIDENDS & REDEMPTIONSSummary of number of investors & corresponding amount as on March 31, 2021:
Nil.
6. INvESTOR SERvICESThe number of official points of acceptance of transactions is 204 locations. In addition to the offices of the Registrar & Transfer agents, the AMC has Investor Service Centers in 9 locations at its own offices - namely Mumbai, New Delhi, Kolkata, Bangalore, Pune, Ahmedabad, Hyderabad, Chandigarh and Chennai. With a view to enhance customer convenience, the AMC has the facility of priority based servicing to key distributors through the enhancement of the Interactive Voice Reponses. The AMC has 2 Toll Free numbers (1-800-200-2434 /1-800-258-2434) which can be dialed from anywhere in India and 1 number i.e +91 44 39923900 (Investors calling from abroad). The call center service is being managed by the Registrar and Transfer Agents. Transactions for purchase / redemption of units in the schemes HSBC Mutual Fund can also be made through the online transaction facility on the AMC’s website at https://invest.assetmanagement.hsbc.co.in.
On the distribution front, the number of empaneled distributors was 1069 as on March 31, 2021. During the year, the AMC initiated tie-ups for online distribution of the Mutual Fund’s schemes with several channel partners taking the total number of such tie-ups to 52.
7. DETAILS OF INvESTOR GRIEvANCE REDRESSALThe details of the redressal of investor complaints received against HSBC Mutual Fund during April 2020 - March 2021 are as follows:
2020-2021Com-plaint Code
Type of complaint# (a) No. of complaints pending at the begin-ning of the
year
(b) No. of Com-
plaints received during
the year
Action on (a) and (b)
Resolved Non Action-
able
Pending
Within 30
days
30 - 60 days
60 - 180 days
Beyond 180 days
0 - 3 months
3 - 6 months
6 - 9 months
9 - 12 months
I A Non receipt of Dividend on Units
0 0 0 0 0 0 0 0 0 0 0
I B Interest on delayed payment of Dividend
0 0 0 0 0 0 0 0 0 0 0
I C Non receipt of Redemption Proceeds
0 8 7 0 0 0 0 1 0 0 0
I D Interest on delayed payment of Redemption
0 0 0 0 0 0 0 0 0 0 0
II A Non receipt of Statement of Account / Unit Certificate
0 0 0 0 0 0 0 0 0 0 0
II B Discrepancy in Statement of Account
0 1 1 0 0 0 0 0 0 0 0
II C Data corrections in Investor details **
0 12 12 0 0 0 0 0 0 0 0
II D Non receipt of Annual Report/Abridged Summary
0 0 0 0 0 0 0 0 0 0 0
III A Wrong switch between Schemes
0 0 0 0 0 0 0 0 0 0 0
Trustees’ ReportFor the year ended March 31, 2021 (Contd...)

9
HSBC Global Equity Climate Change Fund of Fund#
2020-2021Com-plaint Code
Type of complaint# (a) No. of complaints pending at the begin-ning of the
year
(b) No. of Com-
plaints received during
the year
Action on (a) and (b)
Resolved Non Action-
able
Pending
Within 30
days
30 - 60 days
60 - 180 days
Beyond 180 days
0 - 3 months
3 - 6 months
6 - 9 months
9 - 12 months
III B Unauthorized switch between Schemes
0 0 0 0 0 0 0 0 0 0 0
III C Deviation from Scheme attributes
0 0 0 0 0 0 0 0 0 0 0
III D Wrong or excess charges/load
0 0 0 0 0 0 0 0 0 0 0
III E Non updation of changes viz. address, PAN, bank details, nomination, etc
0 6 6 0 0 0 0 0 0 0 0
IV Others 0 15 15 0 0 0 0 0 0 0 0
Total 0 42 41 0 0 0 0 1 0 0 0
Summary of Complaints for FY 2020-21
Particulars Count
Total complaints received 42
Total number of folios 148770
% of complaints against the folio 0.028%
# active folios
** As per AMFI Best Practice Guidelines Circular No. 25/2011-12 for Revisions in the Guidelines on Standardization of Complaints / Grievances Reporting Procedure. If “Others” include a type of complaint which is more than 10% of overall complaints, then such a reason should be provided separately. Hence data corrections in Investor Details is included as a separate category
* Non actionable means the complaint is incomplete / outside the scope of the mutual fund
8. INvESTOR EDUCATION INITIATIvES Investor awareness advertisements were published in Mutual Fund Insight magazine on a monthly basis along with an editorial on ‘SIP Sahi Hai’. Additionally, monthly articles / blogs have been written by Advisorkhoj on IAP which talks of the advantages of SIP, start early, power of compounding, diversification, asset allocation etc. The same is promoted by the publisher via an email to their entire network and also on their social media handles which can be retweeted or liked. Also, educative infographics have been hosted on our website under the investor resources section. The same have also been circulated to existing Indian investors via email for engagement and for educative purposes.
9. PROxY vOTING POLICYIn terms of SEBI Circular no. SEBI/IMD/CIR No. 18/198647/2010 dated March 15, 2010, the Fund has adopted Proxy Voting Policy and Procedures for exercising voting rights in respect of securities held by the Schemes.
The summary of the votes casted in the general meetings of the Investee companies, by the AMC for and on behalf of the Schemes of the Fund, for the financial year 2020-2021 is provided below:
quarter Total no. of resolutions
Break-up of vote decision
For Against Abstained
June 2020 50 43 6 1
September 2020 752 656 38 58
Trustees’ ReportFor the year ended March 31, 2021 (Contd...)
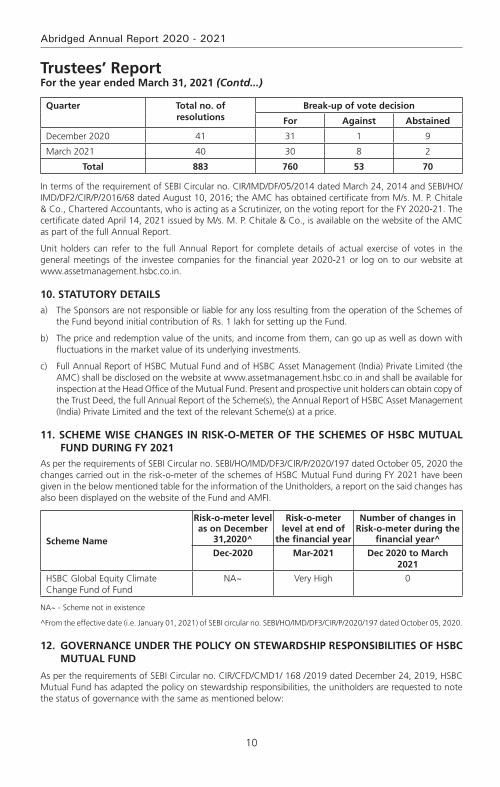
10
Abridged Annual Report 2020 - 2021
Trustees’ ReportFor the year ended March 31, 2021 (Contd...)
quarter Total no. of resolutions
Break-up of vote decision
For Against Abstained
December 2020 41 31 1 9
March 2021 40 30 8 2
Total 883 760 53 70
In terms of the requirement of SEBI Circular no. CIR/IMD/DF/05/2014 dated March 24, 2014 and SEBI/HO/IMD/DF2/CIR/P/2016/68 dated August 10, 2016; the AMC has obtained certificate from M/s. M. P. Chitale & Co., Chartered Accountants, who is acting as a Scrutinizer, on the voting report for the FY 2020-21. The certificate dated April 14, 2021 issued by M/s. M. P. Chitale & Co., is available on the website of the AMC as part of the full Annual Report.
Unit holders can refer to the full Annual Report for complete details of actual exercise of votes in the general meetings of the investee companies for the financial year 2020-21 or log on to our website at www.assetmanagement.hsbc.co.in.
10. STATUTORY DETAILSa) The Sponsors are not responsible or liable for any loss resulting from the operation of the Schemes of
the Fund beyond initial contribution of Rs. 1 lakh for setting up the Fund.
b) The price and redemption value of the units, and income from them, can go up as well as down with fluctuations in the market value of its underlying investments.
c) Full Annual Report of HSBC Mutual Fund and of HSBC Asset Management (India) Private Limited (the AMC) shall be disclosed on the website at www.assetmanagement.hsbc.co.in and shall be available for inspection at the Head Office of the Mutual Fund. Present and prospective unit holders can obtain copy of the Trust Deed, the full Annual Report of the Scheme(s), the Annual Report of HSBC Asset Management (India) Private Limited and the text of the relevant Scheme(s) at a price.
11. SCHEME WISE CHANGES IN RISk-O-METER OF THE SCHEMES OF HSBC MUTUAL FUND DURING FY 2021
As per the requirements of SEBI Circular no. SEBI/HO/IMD/DF3/CIR/P/2020/197 dated October 05, 2020 the changes carried out in the risk-o-meter of the schemes of HSBC Mutual Fund during FY 2021 have been given in the below mentioned table for the information of the Unitholders, a report on the said changes has also been displayed on the website of the Fund and AMFI.
Scheme Name
Risk-o-meter level as on December
31,2020^
Risk-o-meter level at end of
the financial year
Number of changes in Risk-o-meter during the
financial year^
Dec-2020 Mar-2021 Dec 2020 to March 2021
HSBC Global Equity Climate Change Fund of Fund
NA~ Very High 0
NA~ - Scheme not in existence
^From the effective date (i.e. January 01, 2021) of SEBI circular no. SEBI/HO/IMD/DF3/CIR/P/2020/197 dated October 05, 2020.
12. GOvERNANCE UNDER THE POLICY ON STEWARDSHIP RESPONSIBILITIES OF HSBC MUTUAL FUND
As per the requirements of SEBI Circular no. CIR/CFD/CMD1/ 168 /2019 dated December 24, 2019, HSBC Mutual Fund has adapted the policy on stewardship responsibilities, the unitholders are requested to note the status of governance with the same as mentioned below:
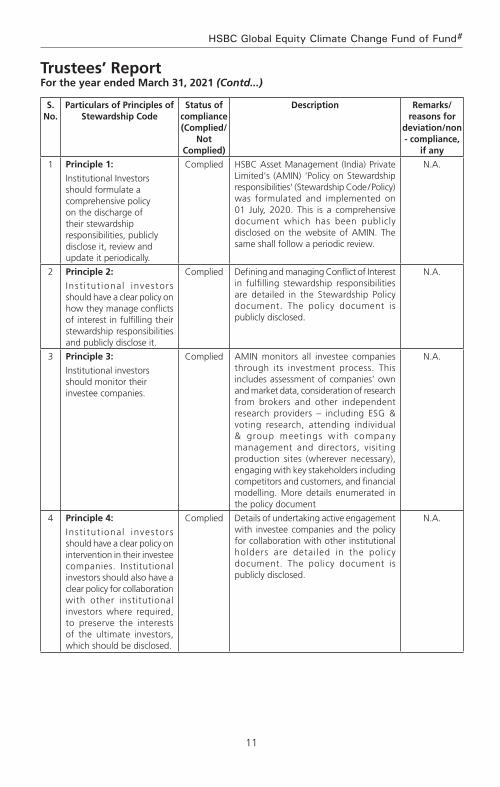
11
HSBC Global Equity Climate Change Fund of Fund#
Trustees’ ReportFor the year ended March 31, 2021 (Contd...)
S. No.
Particulars of Principles of Stewardship Code
Status of compliance (Complied/
Not Complied)
Description Remarks/reasons for
deviation/non - compliance,
if any
1 Principle 1:
Institutional Investors should formulate a comprehensive policy on the discharge of their stewardship responsibilities, publicly disclose it, review and update it periodically.
Complied HSBC Asset Management (India) Private Limited's (AMIN) 'Policy on Stewardship responsibilities' (Stewardship Code / Policy) was formulated and implemented on 01 July, 2020. This is a comprehensive document which has been publicly disclosed on the website of AMIN. The same shall follow a periodic review.
N.A.
2 Principle 2:
Inst i tut ional investors should have a clear policy on how they manage conflicts of interest in fulfilling their stewardship responsibilities and publicly disclose it.
Complied Defining and managing Conflict of Interest in fulfilling stewardship responsibilities are detailed in the Stewardship Policy document. The policy document is publicly disclosed.
N.A.
3 Principle 3:
Institutional investors should monitor their investee companies.
Complied AMIN monitors all investee companies through its investment process. This includes assessment of companies’ own and market data, consideration of research from brokers and other independent research providers – including ESG & voting research, attending individual & group meetings with company management and directors, visiting production sites (wherever necessary), engaging with key stakeholders including competitors and customers, and financial modelling. More details enumerated in the policy document
N.A.
4 Principle 4:
Inst i tut ional investors should have a clear policy on intervention in their investee companies. Institutional investors should also have a clear policy for collaboration with other institutional investors where required, to preserve the interests of the ultimate investors, which should be disclosed.
Complied Details of undertaking active engagement with investee companies and the policy for collaboration with other institutional holders are detailed in the policy document. The policy document is publicly disclosed.
N.A.

12
Abridged Annual Report 2020 - 2021
Trustees’ ReportFor the year ended March 31, 2021 (Contd...)
S. No.
Particulars of Principles of Stewardship Code
Status of compliance (Complied/
Not Complied)
Description Remarks/reasons for
deviation/non - compliance,
if any
5 Principle 5:
Inst i tut ional investors should have a clear policy on voting and disclosure of voting activity.
Complied AMIN has a clear and detailed voting policy which provides the framework for the voting decisions. All voting decisions shall be in accordance with AMIN’s Voting Policy and Procedures, which is disclosed on the website. AMIN discloses the details of the voting on its website on a quarterly basis within 10 working days from the end of the quarter. Additionally, AMIN also discloses the details of the votes cast, in the annual report of the schemes of HSBC Mutual Fund.
N.A.
6 Principle 6:
Institutional investors should report periodically on their stewardship activities.
Complied The annual status report of the stewardship code and quarterly report on proxy voting are publicly disclosed on the website as required under SEBI Regulations.
N.A.
13. SIGNIFICANT EvENT AFTER THE END OF THE FINANCIAL YEAR
HSBC Global Consumer Opportunities Fund (HGCOF) has been merged with HSBC Asia Pacific (Ex Japan) Dividend Yield Fund with effect from May 13, 2021. Therefore, HGCOF has been ceased to exist from the aforesaid date.
14. ACkNOWLEDGEMENTS
The Trustees wish to thank the Unit holders of the Schemes for their support throughout the year and also thank the Government of India, the Securities and Exchange Board of India (SEBI), the Reserve Bank of India (RBI) and the Association of Mutual Funds in India (AMFI) for the guidance provided by them. The Trustees also appreciate the services provided by the Registrar and Transfer Agent, Fund Accountant, Custodian, Bankers, Distributors and Brokers. The guidance and services provided by the Auditors and advocates and the ebullience, sincerity and dedication of the employees of HSBC Asset Management (India) Private Limited is also appreciated.
The Trustees look forward to the continued support of everyone.
For and on behalf of the Board of Trustees of HSBC Mutual Fund
Sd/-
Trustee
Mumbai
July 20, 2021.
# Scheme launched during the current financial year
13
HSBC Global Equity Climate Change Fund of Fund#
To the Trustees of HSBC Mutual Fund
HSBC Global Equity Climate Change Fund of Fund
Report on the Audit of the Financial Statements
OpinionWe have audited the financial statements of HSBC Global Equity Climate Change Fund of Fund (the ‘Scheme’) of HSBC Mutual Fund, which comprise the balance sheet as at 31 March 2021 and the revenue account for the period ended, and notes to the financial statements, including a summary of the significant accounting policies.
In our opinion and to the best of our information and according to the explanations given to us, the aforesaid financial statements give a true and fair view in conformity with the accounting principles generally accepted in India, of the state of affairs of the Scheme as at 31 March 2021, its net deficit for the period ended on that date.
Basis for OpinionWe conducted our audit in accordance with the Standards on Auditing (‘SAs’) issued by the Institute of Chartered Accountants of India (the ‘ICAI’). Our responsibilities under those SAs are further described in the Auditor’s Responsibilities for the Audit of the Financial Statements section of our report. We are independent of the Scheme in accordance with the Code of Ethics issued by the ICAI, and we have fulfilled our other ethical responsibilities in accordance with the Code of Ethics. We believe that the audit evidence we have obtained is sufficient and appropriate to provide a basis for our opinion.
Responsibilities of Management and Those Charged with Governance for the Financial StatementsThe Scheme’s management, the Board of Directors of HSBC Mutual Fund (the ‘Trustees’) and the Board of Directors of HSBC Asset Management (India) Private Limited (the ‘AMC’) (collectively referred to as ‘Management’) are responsible for the preparation of these financial statements that give a true and fair view of the state of affairs, results of operations of the Scheme in accordance with the accounting policies and standards specified in the Ninth Schedule of the Securities and Exchange Board of India (Mutual Funds) Regulations, 1996, as amended (the ‘Regulations’) and the accounting principles generally accepted in India. This responsibility includes design, implementation and maintenance of internal control relevant to the preparation and presentation of the financial statements that give a true and fair view and are free from material misstatement, whether due to fraud or error.
In preparing the financial statements, management is responsible for assessing the Scheme’s ability to continue as a going concern, disclosing, as applicable, matters related to going concern and using the going concern basis of accounting unless management either intends to liquidate the Scheme or to cease operations, or has no realistic alternative but to do so.
The management is responsible for overseeing the Scheme’s financial reporting process.
Auditor’s Responsibilities for the Audit of the Financial StatementsOur objectives are to obtain reasonable assurance about whether the financial statements as a whole are free from material misstatement, whether due to fraud or error, and to issue an auditor’s report that includes our opinion. Reasonable assurance is a high level of assurance, but is not a guarantee that an audit conducted in accordance with SAs will always detect a material misstatement when it exists. Misstatements can arise from fraud or error and are considered material if, individually or in the aggregate, they could reasonably be expected to influence the economic decisions of users taken on the basis of these financial statements.
As part of an audit in accordance with SAs, we exercise professional judgment and maintain professional skepticism throughout the audit. We also:
• Identifyandassesstherisksofmaterialmisstatementofthefinancialstatements,whetherduetofraudor error, design and perform audit procedures responsive to those risks, and obtain audit evidence that is sufficient and appropriate to provide a basis for our opinion. The risk of not detecting a material
Independent Auditors’ Report

14
Abridged Annual Report 2020 - 2021
Independent Auditors’ Report (Contd...)
misstatement resulting from fraud is higher than for one resulting from error, as fraud may involve collusion, forgery, intentional omissions, misrepresentations, or the override of internal control;
• Obtainanunderstandingofinternalcontrolrelevanttotheauditinordertodesignauditproceduresthat are appropriate in the circumstances, but not for the purpose of expressing an opinion on the effectiveness of the Scheme’s internal controls;
• Evaluatetheappropriatenessofaccountingpoliciesusedandthereasonablenessofaccountingestimatesand related disclosures made by Management;
• ConcludeontheappropriatenessofManagement’suseofthegoingconcernbasisofaccountingand,based on the audit evidence obtained, whether a material uncertainty exists related to events or conditions that may cast significant doubt on the Scheme’s ability to continue as a going concern. If we conclude that a material uncertainty exists, we are required to draw attention in our auditor’s report to the related disclosures in the financial statements or, if such disclosures are inadequate, to modify our opinion. Our conclusions are based on the audit evidence obtained up to the date of our auditor’s report. However, future events or conditions may cause the Scheme to cease to continue as a going concern;
• Evaluate the overall presentation, structure and content of the financial statements, including thedisclosures and whether the financial statements represent the underlying transactions and events in a manner that achieves fair presentation.
We communicate with those charged with governance regarding, among other matters, the planned scope and timing of the audit and significant audit findings, including any significant deficiencies in internal control that we identify during our audit.
We also provide those charged with governance with a statement that we have complied with relevant ethical requirements regarding independence, and to communicate with them all relationships and other matters that may reasonably be thought to bear on our independence, and where applicable, related safeguards.
Report on Other Legal and Regulatory Requirements 1 As required by Regulation 55 (4) of the Regulations, we report that:
(a) We have obtained all information and explanations which, to the best of our knowledge and belief, were necessary for the purposes of the audit; and
(b) The balance sheet and the revenue account have been prepared in accordance with the accounting policies and standards as specified in the Ninth Schedule of the Regulations.
2 As required by Clause 5 (ii) (2) of the Eleventh Schedule of the Regulations, we report that the balance sheet and the revenue account are in agreement with the books of account of the Scheme.
For B S R & Co. LLP Chartered Accountants Firm’s Registration No: 101248W/W-100022
Sd/-
Ajit Viswanath PartnerMembership No: 067114UDIN : 21067114AAAADW7269
Place : Mumbai Date : July 20, 2021.
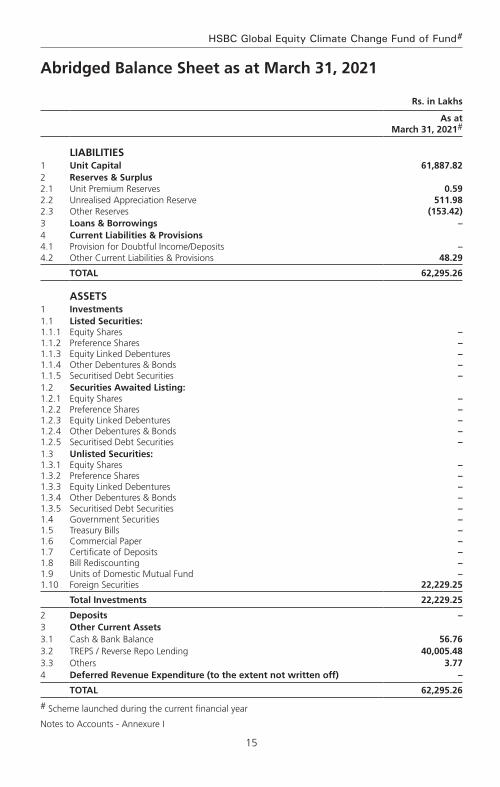
15
HSBC Global Equity Climate Change Fund of Fund#
Rs. in Lakhs
As at March 31, 2021#
LIABILITIES1 Unit Capital 61,887.82 2 Reserves & Surplus2.1 Unit Premium Reserves 0.59 2.2 Unrealised Appreciation Reserve 511.98 2.3 Other Reserves (153.42)3 Loans & Borrowings – 4 Current Liabilities & Provisions4.1 Provision for Doubtful Income/Deposits – 4.2 Other Current Liabilities & Provisions 48.29
TOTAL 62,295.26
ASSETS1 Investments1.1 Listed Securities:1.1.1 Equity Shares – 1.1.2 Preference Shares – 1.1.3 Equity Linked Debentures – 1.1.4 Other Debentures & Bonds – 1.1.5 Securitised Debt Securities – 1.2 Securities Awaited Listing:1.2.1 Equity Shares – 1.2.2 Preference Shares – 1.2.3 Equity Linked Debentures – 1.2.4 Other Debentures & Bonds – 1.2.5 Securitised Debt Securities – 1.3 Unlisted Securities:1.3.1 Equity Shares – 1.3.2 Preference Shares – 1.3.3 Equity Linked Debentures – 1.3.4 Other Debentures & Bonds – 1.3.5 Securitised Debt Securities – 1.4 Government Securities – 1.5 Treasury Bills – 1.6 Commercial Paper – 1.7 Certificate of Deposits – 1.8 Bill Rediscounting – 1.9 Units of Domestic Mutual Fund – 1.10 Foreign Securities 22,229.25
Total Investments 22,229.25
2 Deposits – 3 Other Current Assets3.1 Cash & Bank Balance 56.76 3.2 TREPS / Reverse Repo Lending 40,005.48 3.3 Others 3.77 4 Deferred Revenue Expenditure (to the extent not written off) –
TOTAL 62,295.26
# Scheme launched during the current financial year
Notes to Accounts - Annexure I
Abridged Balance Sheet as at March 31, 2021

16
Abridged Annual Report 2020 - 2021
Abridged Revenue Account for the period ended March 31, 2021
Rs. in Lakhs
Current period ended
March 31, 2021#
1 INCOME1.1 Dividend – 1.2 Interest 90.38 1.3 Realised Gain / (Loss) on Foreign Exchange Transactions (219.48)1.4 Realised Gains / (Losses) on Interscheme Sale of Investments – 1.5 Realised Gains / (Losses) on External Sale / Redemption of
Investments (0.73)
1.6 Realised Gains / (Losses) on Derivative Transactions – 1.7 Other Income 0.18
(A) (129.65)
2 ExPENSES2.1 Investment Management Fees 9.06 2.2 GST on Investment Management Fees 1.63 2.3 Transfer Agents Fees and Expenses 1.63 2.4 Custodian Fees 0.38 2.5 Trusteeship Fees – 2.6 Commission to Agents 10.11 2.7 Marketing & Distribution Expenses – 2.8 Audit Fees 0.20 2.9 Investor Education Expenses 0.34 2.10 Interest on Borrowing – 2.11 Other Operating Expenses 0.31
(B) 23.66
3 NET REALISED GAINS / (LOSSES) FOR THE YEAR (C = A - B) (153.31)
4 Change in Unrealised Depreciation in Value of Investments (D) –
5 NET GAINS / (LOSSES) FOR THE YEAR (E = C + D) (153.31)
6 Change in Unrealised Appreciation in Value of Investments (F) 511.98
7 NET SURPLUS / (DEFICIT) FOR THE YEAR (G = E + F) 358.67
7.1 Add : Balance Transfer from Unrealised Appreciation Reserve – 7.2 Less : Balance Transfer to Unrealised Appreciation Reserve (511.98)7.3 Add / (Less) : Equalisation (0.11)7.4 Transfer from Reserve Fund – 7.5 Transfer from Unit Premium Reserve –
8 Total (153.42)
9 Dividend Appropriation
9.1 Income Distributed during the Year –
9.2 Tax on Income Distributed during the Year –
10 Retained Surplus / (Deficit) Carried Forward to Balance Sheet
(153.42)
# Scheme launched during the current financial year
Notes to Accounts - Annexure I
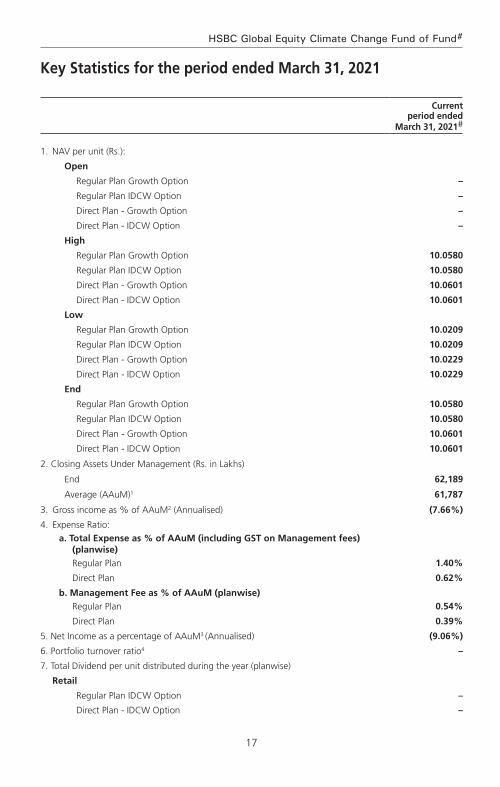
17
HSBC Global Equity Climate Change Fund of Fund#
key Statistics for the period ended March 31, 2021
Current period ended
March 31, 2021#
1. NAV per unit (Rs.):
Open
Regular Plan Growth Option –
Regular Plan IDCW Option –
Direct Plan - Growth Option –
Direct Plan - IDCW Option –
High
Regular Plan Growth Option 10.0580
Regular Plan IDCW Option 10.0580
Direct Plan - Growth Option 10.0601
Direct Plan - IDCW Option 10.0601
Low
Regular Plan Growth Option 10.0209
Regular Plan IDCW Option 10.0209
Direct Plan - Growth Option 10.0229
Direct Plan - IDCW Option 10.0229
End
Regular Plan Growth Option 10.0580
Regular Plan IDCW Option 10.0580
Direct Plan - Growth Option 10.0601
Direct Plan - IDCW Option 10.0601
2. Closing Assets Under Management (Rs. in Lakhs)
End 62,189
Average (AAuM)1 61,787
3. Gross income as % of AAuM2 (Annualised) (7.66%)
4. Expense Ratio:
a. Total Expense as % of AAuM (including GST on Management fees) (planwise)
Regular Plan 1.40%
Direct Plan 0.62%
b. Management Fee as % of AAuM (planwise)
Regular Plan 0.54%
Direct Plan 0.39%
5. Net Income as a percentage of AAuM3 (Annualised) (9.06%)
6. Portfolio turnover ratio4 –
7. Total Dividend per unit distributed during the year (planwise)
Retail
Regular Plan IDCW Option –
Direct Plan - IDCW Option –
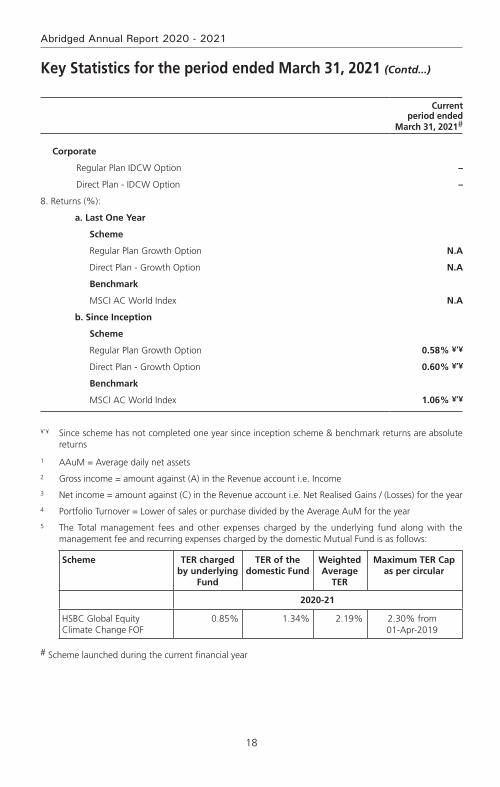
18
Abridged Annual Report 2020 - 2021
Current period ended
March 31, 2021#
Corporate
Regular Plan IDCW Option –
Direct Plan - IDCW Option –
8. Returns (%):
a. Last One Year
Scheme
Regular Plan Growth Option N.A
Direct Plan - Growth Option N.A
Benchmark
MSCI AC World Index N.A
b. Since Inception
Scheme
Regular Plan Growth Option 0.58% ¥'¥
Direct Plan - Growth Option 0.60% ¥’¥
Benchmark
MSCI AC World Index 1.06% ¥’¥
¥’¥ Since scheme has not completed one year since inception scheme & benchmark returns are absolute returns
1 AAuM = Average daily net assets
2 Gross income = amount against (A) in the Revenue account i.e. Income
3 Net income = amount against (C) in the Revenue account i.e. Net Realised Gains / (Losses) for the year
4 Portfolio Turnover = Lower of sales or purchase divided by the Average AuM for the year
5 The Total management fees and other expenses charged by the underlying fund along with the management fee and recurring expenses charged by the domestic Mutual Fund is as follows:
Scheme TER charged by underlying
Fund
TER of the domestic Fund
Weighted Average
TER
Maximum TER Cap as per circular
2020-21
HSBC Global Equity Climate Change FOF
0.85% 1.34% 2.19% 2.30% from 01-Apr-2019
# Scheme launched during the current financial year
key Statistics for the period ended March 31, 2021 (Contd...)
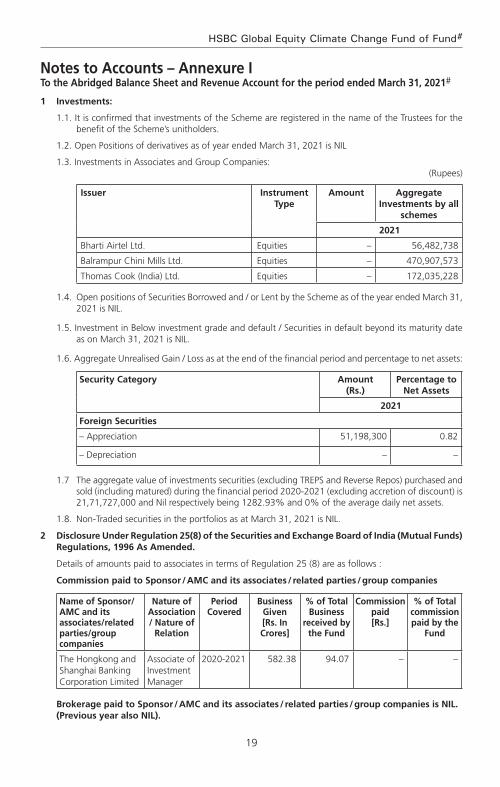
19
HSBC Global Equity Climate Change Fund of Fund#
Notes to Accounts – Annexure ITo the Abridged Balance Sheet and Revenue Account for the period ended March 31, 2021#
1 Investments:
1.1. It is confirmed that investments of the Scheme are registered in the name of the Trustees for the benefit of the Scheme’s unitholders.
1.2. Open Positions of derivatives as of year ended March 31, 2021 is NIL
1.3. Investments in Associates and Group Companies: (Rupees)
Issuer Instrument Type
Amount Aggregate Investments by all
schemes
2021
Bharti Airtel Ltd. Equities – 56,482,738
Balrampur Chini Mills Ltd. Equities – 470,907,573
Thomas Cook (India) Ltd. Equities – 172,035,228
1.4. Open positions of Securities Borrowed and / or Lent by the Scheme as of the year ended March 31, 2021 is NIL.
1.5. Investment in Below investment grade and default / Securities in default beyond its maturity date as on March 31, 2021 is NIL.
1.6. Aggregate Unrealised Gain / Loss as at the end of the financial period and percentage to net assets:
Security Category Amount (Rs.)
Percentage to Net Assets
2021
Foreign Securities
– Appreciation 51,198,300 0.82
– Depreciation – –
1.7 The aggregate value of investments securities (excluding TREPS and Reverse Repos) purchased and sold (including matured) during the financial period 2020-2021 (excluding accretion of discount) is 21,71,727,000 and Nil respectively being 1282.93% and 0% of the average daily net assets.
1.8. Non-Traded securities in the portfolios as at March 31, 2021 is NIL.
2 Disclosure Under Regulation 25(8) of the Securities and Exchange Board of India (Mutual Funds) Regulations, 1996 As Amended.
Details of amounts paid to associates in terms of Regulation 25 (8) are as follows :
Commission paid to Sponsor / AMC and its associates / related parties / group companies
Name of Sponsor/AMC and its associates/related parties/group companies
Nature of Association / Nature of
Relation
Period Covered
Business Given [Rs. In Crores]
% of Total Business
received by the Fund
Commission paid [Rs.]
% of Total commission paid by the
Fund
The Hongkong and Shanghai Banking Corporation Limited
Associate of Investment Manager
2020-2021 582.38 94.07 – –
Brokerage paid to Sponsor / AMC and its associates / related parties / group companies is NIL. (Previous year also NIL).
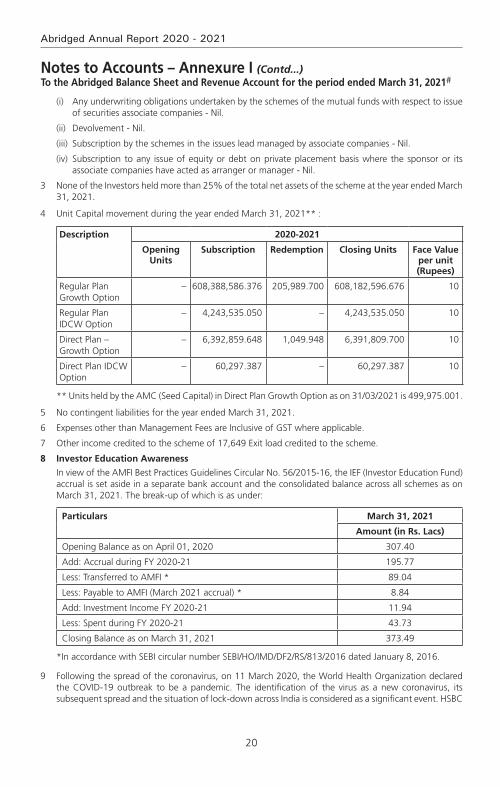
20
Abridged Annual Report 2020 - 2021
(i) Any underwriting obligations undertaken by the schemes of the mutual funds with respect to issue of securities associate companies - Nil.
(ii) Devolvement - Nil.
(iii) Subscription by the schemes in the issues lead managed by associate companies - Nil.
(iv) Subscription to any issue of equity or debt on private placement basis where the sponsor or its associate companies have acted as arranger or manager - Nil.
3 None of the Investors held more than 25% of the total net assets of the scheme at the year ended March 31, 2021.
4 Unit Capital movement during the year ended March 31, 2021** :
Description 2020-2021
Opening Units
Subscription Redemption Closing Units Face value per unit (Rupees)
Regular Plan Growth Option
– 608,388,586.376 205,989.700 608,182,596.676 10
Regular Plan IDCW Option
– 4,243,535.050 – 4,243,535.050 10
Direct Plan – Growth Option
– 6,392,859.648 1,049.948 6,391,809.700 10
Direct Plan IDCW Option
– 60,297.387 – 60,297.387 10
** Units held by the AMC (Seed Capital) in Direct Plan Growth Option as on 31/03/2021 is 499,975.001.
5 No contingent liabilities for the year ended March 31, 2021.
6 Expenses other than Management Fees are Inclusive of GST where applicable.
7 Other income credited to the scheme of 17,649 Exit load credited to the scheme.
8 Investor Education Awareness
In view of the AMFI Best Practices Guidelines Circular No. 56/2015-16, the IEF (Investor Education Fund) accrual is set aside in a separate bank account and the consolidated balance across all schemes as on March 31, 2021. The break-up of which is as under:
Particulars March 31, 2021
Amount (in Rs. Lacs)
Opening Balance as on April 01, 2020 307.40
Add: Accrual during FY 2020-21 195.77
Less: Transferred to AMFI * 89.04
Less: Payable to AMFI (March 2021 accrual) * 8.84
Add: Investment Income FY 2020-21 11.94
Less: Spent during FY 2020-21 43.73
Closing Balance as on March 31, 2021 373.49
*In accordance with SEBI circular number SEBI/HO/IMD/DF2/RS/813/2016 dated January 8, 2016.
9 Following the spread of the coronavirus, on 11 March 2020, the World Health Organization declared the COVID-19 outbreak to be a pandemic. The identification of the virus as a new coronavirus, its subsequent spread and the situation of lock-down across India is considered as a significant event. HSBC
Notes to Accounts – Annexure I (Contd...)To the Abridged Balance Sheet and Revenue Account for the period ended March 31, 2021#

21
HSBC Global Equity Climate Change Fund of Fund#
Mutual Fund’s operations are included in essential services and have continued through the lock-downs declared by the Government. Service providers like the Registrar and Transfer Agent, Custodian and Fund Accountant have carried out extensive arrangements to address business needs and continuity of operations. As on the date of signing of these financial statements, Management believes that it has taken into account, all the possible impact of known events arising from COVID-19 pandemic in the preparation of the financial statements and there appears to be no uncertainties relating to the going concern of any of the Schemes of the Fund for a foreseeable future. However, COVID-19 pandemic is an ongoing situation and any estimate of its impact is dependent on the future intensity, spread and duration of the situation. The Management will continue to closely monitor the situation for any material changes which may impact the Schemes of the Fund.
10 Pursuant to SEBI Circular No. SEBI/HO/IMD/DF3/CIR/P/2020/194 dated October 05, 2020, the nomenclature of ‘Dividend Option’ under all the schemes of HSBC Mutual Fund has been revised to ‘Income Distribution cum Capital Withdrawal Option’ (IDCW), with effect from April 01, 2021.
11 Disclosure of Risk-o-meter
Scheme Name Risk-o-meter level as on
December 31, 2020^
Risk-o-meter level at end of
the financial year
Number of changes in Risk-o-meter during the financial year^
HSBC Global Equity Climate Change FOF NA~ Very High 0
NA~ - Scheme not in existence
^From the effective date (i.e. January 01, 2021) of SEBI circular no. SEBI/HO/IMD/DF3/CIR/P/2020/197 dated October 05, 2020.
12 As these are the first financial statements of the scheme since the date of launch, there are no prior period comparatives.
13 The Annual Accounts of the Schemes prepared in accordance with the accounting policies and standards specified in the Ninth Schedule of The Securities and Exchange Board of India (Mutual Funds) Regulations, 1996 has been approved by the Board of Directors of HSBC Asset Management (India) Private Limited and The Board of Trustees of HSBC Mutual Fund at their meetings held on July 19, 2021 and July 20, 2021 respectively. The audit report attached herewith refers to the said Annual Accounts. The aforesaid abridged accounts are an extract of the Annual Accounts and are prepared in accordance with SEBI Circular No. IMD/Cir8/132968/2008 dated July 24, 2008.
# Scheme launched during the current financial year.
Notes to Accounts – Annexure I (Contd...)To the Abridged Balance Sheet and Revenue Account for the period ended March 31, 2021#
22
Abridged Annual Report 2020 - 2021
voting Policy and Procedures
In view of SEBI guidelines related to “Role of Mutual Funds in Corporate Governance of Public Listed Companies”, HSBC AMC has formulated its “Policy for Proxy Voting in Public Listed Companies”. The said policy is available on our website and the details of actual exercise of proxy votes, the summary of votes casted and the auditor’s certificate for the Financial Year 2020 – 21 is forming part of our full Annual Report for the Financial Year 2020 – 21 which is uploaded on our website at http://www.assetmanagement.hsbc.co.in
23
HSBC Global Equity Climate Change Fund of Fund#
Statutory Details & Disclaimers
All the returns have been sourced from Mutual Funds India Explorer software. The performance of the schemes and the benchmark is calculated on a total return basis. This document has been prepared by HSBC Asset Management (India) Private Ltd (HSBC) for information purposes only and should not be construed as i) an offer or recommendation to buy or sell securities, commodities, currencies or other investments referred to herein; or ii) an offer to sell or a solicitation or an offer for purchase of any of the funds of HSBC Mutual Fund; or iii) an investment research or investment advice. All information contained in this document (including that sourced from third parties), is obtained from sources HSBC and the third party which HSBC believes to be reliable however, has not independently verified the same. The information and opinions contained within the document are based upon publicly available information and rates of taxation applicable (if any) at the time of publication, which are subject to change from time to time.
Expressions of opinion are those of HSBC only and are subject to change without notice. It does not have regard to specific investment objectives, financial situation and the particular needs of any specific person who may receive this document. Investors should seek personal and independent advice regarding the appropriateness of investing in any of the funds, securities, other investment or investment strategies that may have been discussed or referred herein and should understand that the views regarding future prospects may or may not be realized. In no event shall HSBC Mutual Fund / HSBC Asset management (India) Private Limited and / or its affiliates or any of their directors, trustees, officers and employees be liable for any direct, indirect, special, incidental or consequential damages arising out of the use of information / opinion herein. Neither this document nor the units of HSBC Mutual Fund have been registered in any jurisdiction. The distribution of this document in certain jurisdictions may be restricted or totally prohibited and accordingly, persons who come into possession of this document are required to inform themselves about, and to observe, any such restrictions.
Mutual Fund investments are subject to market risks, read all scheme related documents carefully.

i
HSBC Managed Solutions
HSBC Managed SolutionsAn open ended fund of fund Scheme investing in a basket of equity, debt, Gold and other Exchange Traded Funds
Abridged Annual Report 2020 - 2021

1
HSBC Managed Solutions
Dear Investor,
The beginning of the last financial year now almost seems like a distant memory. COVID-19 was still a relatively unknown enemy and governments across the world were grappling with ways to control and mitigate the risks associated with it. Nationwide lockdowns were the norm and our markets both equity and fixed income reacted negatively leading to significant erosion of wealth. Within a short period of time markets bounced back. This confounded even the most astute market pundits. How is it possible that when GDP growth had slowed down, unemployment had risen, inflation was high could there be such sharp up move in equity indices. Whilst the reasons are well known about easy global liquidity, demand resurgence, cost cutting by corporates etc. perhaps its most important to remember that the markets are not a reflector but a predictor of economic activity.
At all times particularly during such volatile times it is important to go back to the basics. Why do you save, why do you invest, what goals would you like to achieve, how old are you, what is your risk appetite? The replies to these simple questions will help you determine your asset allocation. As an example when equity markets corrected sharply last year, investors who reviewed their asset allocation, stayed invested during the lows of the past year and were able to capture the rebound and have seen prime returns since then. The current market movement in all likelihood would have also led to some imbalances in your asset allocation. Do not ignore that and I strongly recommend that you do review this with your advisor to check whether re-balancing is required.
During this financial year we had three very successful new fund launches. The pandemic showed us a clear trend of dominant players becoming stronger and profit pool getting consolidated within a few companies. To capture this opportunity, we launched the HSBC Focused Equity Fund which garnered close to Rs. 520 crores. During the second half of 2020, in the fixed income space, 3 - 5 year duration range had a favourable investment scenario as RBI’s accommodative policy and surplus liquidity had reduced the returns at the very short end of the yield curve. There was a demand for an actively managed moderate duration strategy with better credit quality which we fulfilled by launching HSBC Corporate Bond Fund. It garnered over 700 crores. Our latest and first of its kind offering, HSBC Global Equity Climate Change Fund of Fund saw a stupendous response with over 8000 investors investing over Rs. 616 crores. This is an investment opportunity which goes beyond the rationale of simply generating investment returns and is the future of responsible investing.
We worked towards augmenting our digital capabilities by launching a few key enhancements to our online transaction platform. Being mindful of the movement restrictions in place, this year we focused on digitizing offline processes so that an investor need not need step out of her home for investing or availing any key services. While our interactive chatbot AskMe, eased service queries, our end-to-end digital KYC module enabled a first time Mutual Fund investor to invest in our funds without any paperwork. We listened to your feedback and digitized consolidation of folios and change of tax status which eliminated the need for you to physically visit our branches.
I am a strong believer in the India story and this story has just begun. The opportunity to invest in this high growth market is a very exciting opportunity. I do hope you share my enthusiasm and I ask that you continue to invest whilst reviewing your asset allocation at all times. As always thank you for your business. Stay safe.
Warm regards,
Ravi MenonChief Executive Officer,
HSBC Asset Management India

2
Abridged Annual Report 2020 - 2021
SPONSOR
HSBC Securities and Capital Markets (India) Private LimitedRegd. Office: 52/60, Mahatma Gandhi Road, Fort, Mumbai - 400 001.
TRUSTEE
Board of TrusteesOffice: 16, Veer Nariman Road, Fort, Mumbai 400 001.
ASSET MANAGEMENT COMPANY
HSBC Asset Management (India) Private LimitedCorp. & Regd. Office: 16, Veer Nariman Road, Fort, Mumbai 400 001.
CUSTODIAN
Standard Chartered Bank (SCB)Corp. & Regd. Office: Crescenzo, Securities Services, 3rd Floor, C-38/39, G-Block,
Bandra Kurla Complex, Bandra East, Mumbai – 400051.
AUDITORS TO THE SCHEME
BSR & Co. LLPChartered Accountants
5th Floor, Lodha Excelus, Apollo Mills Compound, N. M. Joshi Marg, Mahalaxmi, Mumbai 400 011.
REGISTRAR & TRANSFER AGENTS
Computer Age Management Services Limited (CAMS)Unit: HSBC Mutual Fund ’C’ Block, 2nd Floor, Hanudev Info Park P. Ltd., SF No. 558/2, Udayampalayam Road, Nava India, Coimbatore - 641 028.
BOARD OF TRUSTEES
Ms. Jasmine Batliwalla - Chairperson
Mr. Nani Javeri - Trustee
Dr. T. C. Nair - Trustee
Mr. Pedro Bastos - Trustee
BOARD OF DIRECTORS
Mr. Dinesh Mittal - Director
Dr. Indu Shahani - Director
Mr. Ravi Menon - Director & Chief Executive Officer

3
HSBC Managed Solutions
The Trustees of HSBC Mutual Fund (“Fund”) present the Nineteenth Annual Report and the audited abridged financial statements of the schemes of the Fund for the year ended March 31, 2021.
As at March 31, 2021, the Fund offered 37 schemes across asset classes to meet the varying investment needs of the investors. During FY 2020-2021, the Fund has launched various new products namely HSBC Corporate Bond Fund, HSBC Focused Equity Fund and HSBC Global Equity Climate Change Fund of Fund to fill the gaps in our product offering.
The Fund continues its focus on delivering consistent long term returns. The comments on the performance of the Scheme(s) is provided hereinafter. Dividends were declared under various schemes as per the provisions contained in the respective Scheme Information Documents after considering the distributable surplus available under the respective Schemes. Details of dividends declared can be viewed on our website at www.assetmanagement.hsbc.co.in.
1. SCHEME PERFORMANCE, FUTURE OUTLOOk AND OPERATIONS OF THE SCHEMES
a. Operations and Performance of the Schemes
HSBC Managed Solutions (HMS)
(An open ended fund of fund scheme investing in a basket of equity, debt, Gold and other Exchange Traded Funds)
HMS seeks to provide long term total return primarily by seeking capital appreciation through an active asset allocation with diversification commensurate with the risk profile of investments by investing predominantly in units of equity mutual funds as well as in a basket of debt mutual funds, gold exchange traded funds (ETFs) and other ETFs, offshore mutual funds and money market instruments.
The Scheme has three plans – Conservative Plan, Growth Plan and the Moderate Plan. The plans under the Scheme will invest predominantly in schemes of HSBC Mutual Fund, units of third party domestic mutual funds, units of offshore equity oriented funds managed by HSBC Global Asset Management, gold ETFs and other ETFs of third parties until such time that the Fund doesn’t have such scheme offerings.
The net assets of HMS – Conservative Plan amounted to Rs. 49.70 crores as at March 31, 2021 as compared to Rs. 114.91crores as at March 31, 2020. Around 99.51% of the net assets was invested in mutual fund schemes, (0.49% of the net assets comprised of reverse repos / TREPS and net current assets as at March 31, 2021. The net assets of HMS – Growth Plan amounted to Rs. 40.29 crores as at March 31, 2021 as compared to Rs. 51.15 crores as at March 31, 2020. Around 99.54% of the net assets were invested in Mutual fund schemes, 0.46% of the net assets comprised of reverse repos / TREPS and net current assets as at March 31, 2021. The net assets of HMS – Moderate Plan amounted to Rs. 68.72 crores as at March 31, 2021 as compared to Rs. 93.46 crores as at March 31, 2020. Around 99.45% of the net assets were invested in mutual fund schemes, 0.55% of the net assets comprised of reverse repos / TREPS and net current assets as at March 31, 2021.
The performance of HMS – Growth Plan is benchmarked against Composite Index constituting 80% of BSE 200 Index and 20% of CRISIL Composite Bond Index, while the performance of HMS – Moderate Plan is benchmarked against CRISIL Balanced Fund Index. The performance of HMS – Conservative Plan is benchmarked against Composite Index constituting of 90% into CRISIL Composite Bond Index and 10% of BSE 200 Index.
Underperformance of the schemes particularly Conservative and moderate is driven by the a) DHFL exposure in the short duration fund which is visible in the 1 year returns. As SDF had DHFL which was written off in May 2020 and subsequently sold in July 2020 and therefore the impact is visible in the one-year performance and not in shorter tenors. In addition, the duration funds have underperformed the benchmark during the last quarter as heavy borrowing announcement in the budget followed by the onset of the second wave added to nervousness in the market. Performs of equity funds have however offset the underperformance to some extent.
Trustees’ ReportFor the year ended March 31, 2021

4
Abridged Annual Report 2020 - 2021
Date of Inception : 30 April 2014 Absolute Returns
(%)
Compounded Annualized Returns (%)
Scheme Name & Benchmarks 1 Year 3 Years 5 Years Since Inception
HSBC Managed Solutions India - Growth 59.75 9.72 12.61 12.62
Customised Benchmark Index Fund (Scheme Benchmark)* 64.59 13.17 14.59 13.90
Nifty 50 TRI (Standard Benchmark) 72.54 14.58 15.12 13.43
CRISIL 10 Year Gilt Index (Standard Benchmark) 3.60 8.24 7.17 8.32
10,000, if invested in HMSG, would have become 15,975 13,222 18,114 22,769
10,000, if invested in Customised Benchmark Index, would have become
16,459 14,514 19,765 24,622
10,000, if invested in Nifty 50 TRI, would have become 17,254 15,065 20,227 23,927
10,000, if invested in CRISIL 10 Year Gilt Index, would have become
10,360 12,692 14,140 17,390
*Composite index of S&P BSE 200 TRI (80%) and CRISIL Composite Bond Fund Index (20%).
Date of Inception : 30 April 2014 Absolute Returns
(%)
Compounded Annualized Returns (%)
Scheme Name & Benchmarks 1 Year 3 Years 5 Years Since Inception
HSBC Managed Solutions India - Moderate – Growth 47.19 9.16 11.49 11.55
CRISIL Hybrid 35+65 - Aggressive Index (Scheme Benchmark)
49.75 12.88 13.61 13.22
Nifty 50 TRI (Standard Benchmark) 72.54 14.58 15.12 13.43
CRISIL 10 Year Gilt Index (Standard Benchmark) 3.60 8.24 7.17 8.32
10,000, if invested in HMSM, would have become 14,719 13,020 17,231 21,313
10,000,if invested in CRISIL Hybrid 35+65 would have become
14,975 14,402 18,934 23,622
10,000, if invested in Nifty 50 TRI, would have become 17,254 15,065 20,227 23,927
10,000, if invested in CRISIL 10 Year Gilt Index, would have become
10,360 12,692 14,140 17,390
Date of Inception : 30 April 2014 Absolute Returns
(%)
Compounded Annualized Returns (%)
Scheme Name & Benchmarks 1 Year 3 Years 5 Years Since Inception
HSBC Managed Solutions India - Conservative – Growth 9.66 6.32 6.78 7.70
Customised Benchmark Index Fund (Scheme Benchmark)*
15.87 9.78 9.68 10.16
Nifty 50 (Standard Benchmark) 72.54 14.58 15.12 13.43
CRISIL 10 Year Gilt Index (Standard Benchmark) 3.60 8.24 7.17 8.32
10,000, if invested in HMSC, would have become 10,966 12,026 13,884 16,712
Trustees’ ReportFor the year ended March 31, 2021 (Contd...)
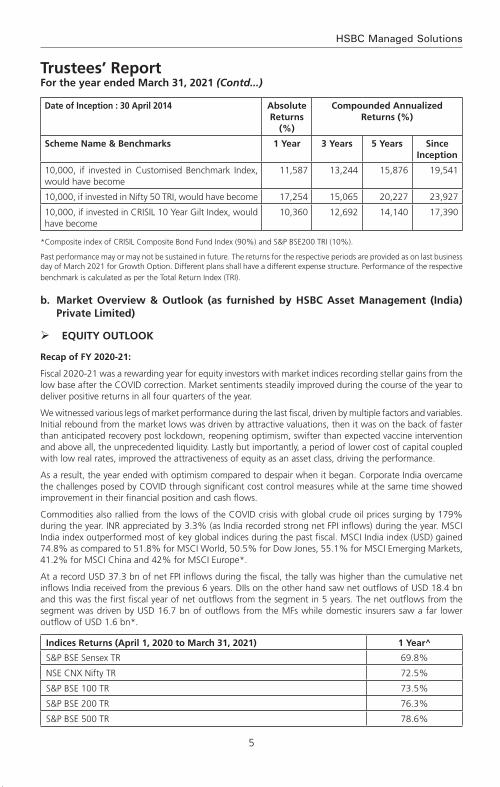
5
HSBC Managed Solutions
Date of Inception : 30 April 2014 Absolute Returns
(%)
Compounded Annualized Returns (%)
Scheme Name & Benchmarks 1 Year 3 Years 5 Years Since Inception
10,000, if invested in Customised Benchmark Index, would have become
11,587 13,244 15,876 19,541
10,000, if invested in Nifty 50 TRI, would have become 17,254 15,065 20,227 23,927
10,000, if invested in CRISIL 10 Year Gilt Index, would have become
10,360 12,692 14,140 17,390
*Composite index of CRISIL Composite Bond Fund Index (90%) and S&P BSE200 TRI (10%).
Past performance may or may not be sustained in future. The returns for the respective periods are provided as on last business day of March 2021 for Growth Option. Different plans shall have a different expense structure. Performance of the respective benchmark is calculated as per the Total Return Index (TRI).
b. Market Overview & Outlook (as furnished by HSBC Asset Management (India) Private Limited)
EqUITY OUTLOOk
Recap of FY 2020-21:
Fiscal 2020-21 was a rewarding year for equity investors with market indices recording stellar gains from the low base after the COVID correction. Market sentiments steadily improved during the course of the year to deliver positive returns in all four quarters of the year.
We witnessed various legs of market performance during the last fiscal, driven by multiple factors and variables. Initial rebound from the market lows was driven by attractive valuations, then it was on the back of faster than anticipated recovery post lockdown, reopening optimism, swifter than expected vaccine intervention and above all, the unprecedented liquidity. Lastly but importantly, a period of lower cost of capital coupled with low real rates, improved the attractiveness of equity as an asset class, driving the performance.
As a result, the year ended with optimism compared to despair when it began. Corporate India overcame the challenges posed by COVID through significant cost control measures while at the same time showed improvement in their financial position and cash flows.
Commodities also rallied from the lows of the COVID crisis with global crude oil prices surging by 179% during the year. INR appreciated by 3.3% (as India recorded strong net FPI inflows) during the year. MSCI India index outperformed most of key global indices during the past fiscal. MSCI India index (USD) gained 74.8% as compared to 51.8% for MSCI World, 50.5% for Dow Jones, 55.1% for MSCI Emerging Markets, 41.2% for MSCI China and 42% for MSCI Europe*.
At a record USD 37.3 bn of net FPI inflows during the fiscal, the tally was higher than the cumulative net inflows India received from the previous 6 years. DIIs on the other hand saw net outflows of USD 18.4 bn and this was the first fiscal year of net outflows from the segment in 5 years. The net outflows from the segment was driven by USD 16.7 bn of outflows from the MFs while domestic insurers saw a far lower outflow of USD 1.6 bn*.
Indices Returns (April 1, 2020 to March 31, 2021) 1 Year^
S&P BSE Sensex TR 69.8%
NSE CNX Nifty TR 72.5%
S&P BSE 100 TR 73.5%
S&P BSE 200 TR 76.3%
S&P BSE 500 TR 78.6%
Trustees’ ReportFor the year ended March 31, 2021 (Contd...)
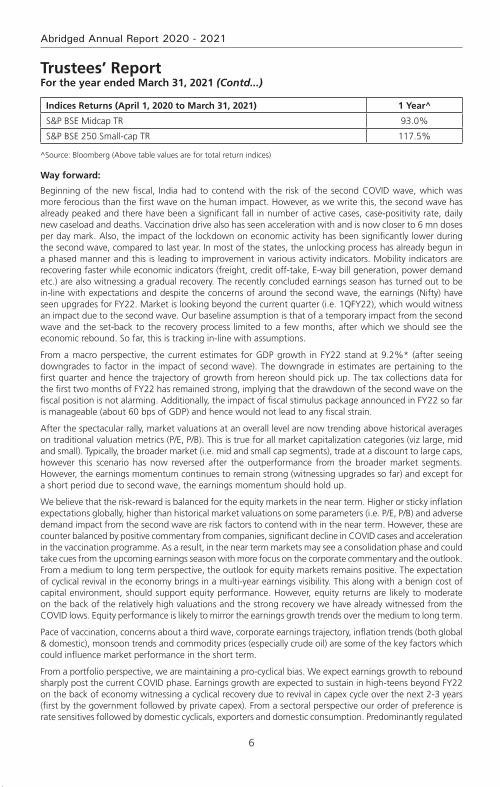
6
Abridged Annual Report 2020 - 2021
Indices Returns (April 1, 2020 to March 31, 2021) 1 Year^
S&P BSE Midcap TR 93.0%
S&P BSE 250 Small-cap TR 117.5%
^Source: Bloomberg (Above table values are for total return indices)
Way forward:
Beginning of the new fiscal, India had to contend with the risk of the second COVID wave, which was more ferocious than the first wave on the human impact. However, as we write this, the second wave has already peaked and there have been a significant fall in number of active cases, case-positivity rate, daily new caseload and deaths. Vaccination drive also has seen acceleration with and is now closer to 6 mn doses per day mark. Also, the impact of the lockdown on economic activity has been significantly lower during the second wave, compared to last year. In most of the states, the unlocking process has already begun in a phased manner and this is leading to improvement in various activity indicators. Mobility indicators are recovering faster while economic indicators (freight, credit off-take, E-way bill generation, power demand etc.) are also witnessing a gradual recovery. The recently concluded earnings season has turned out to be in-line with expectations and despite the concerns of around the second wave, the earnings (Nifty) have seen upgrades for FY22. Market is looking beyond the current quarter (i.e. 1QFY22), which would witness an impact due to the second wave. Our baseline assumption is that of a temporary impact from the second wave and the set-back to the recovery process limited to a few months, after which we should see the economic rebound. So far, this is tracking in-line with assumptions.
From a macro perspective, the current estimates for GDP growth in FY22 stand at 9.2%* (after seeing downgrades to factor in the impact of second wave). The downgrade in estimates are pertaining to the first quarter and hence the trajectory of growth from hereon should pick up. The tax collections data for the first two months of FY22 has remained strong, implying that the drawdown of the second wave on the fiscal position is not alarming. Additionally, the impact of fiscal stimulus package announced in FY22 so far is manageable (about 60 bps of GDP) and hence would not lead to any fiscal strain.
After the spectacular rally, market valuations at an overall level are now trending above historical averages on traditional valuation metrics (P/E, P/B). This is true for all market capitalization categories (viz large, mid and small). Typically, the broader market (i.e. mid and small cap segments), trade at a discount to large caps, however this scenario has now reversed after the outperformance from the broader market segments. However, the earnings momentum continues to remain strong (witnessing upgrades so far) and except for a short period due to second wave, the earnings momentum should hold up.
We believe that the risk-reward is balanced for the equity markets in the near term. Higher or sticky inflation expectations globally, higher than historical market valuations on some parameters (i.e. P/E, P/B) and adverse demand impact from the second wave are risk factors to contend with in the near term. However, these are counter balanced by positive commentary from companies, significant decline in COVID cases and acceleration in the vaccination programme. As a result, in the near term markets may see a consolidation phase and could take cues from the upcoming earnings season with more focus on the corporate commentary and the outlook. From a medium to long term perspective, the outlook for equity markets remains positive. The expectation of cyclical revival in the economy brings in a multi-year earnings visibility. This along with a benign cost of capital environment, should support equity performance. However, equity returns are likely to moderate on the back of the relatively high valuations and the strong recovery we have already witnessed from the COVID lows. Equity performance is likely to mirror the earnings growth trends over the medium to long term.
Pace of vaccination, concerns about a third wave, corporate earnings trajectory, inflation trends (both global & domestic), monsoon trends and commodity prices (especially crude oil) are some of the key factors which could influence market performance in the short term.
From a portfolio perspective, we are maintaining a pro-cyclical bias. We expect earnings growth to rebound sharply post the current COVID phase. Earnings growth are expected to sustain in high-teens beyond FY22 on the back of economy witnessing a cyclical recovery due to revival in capex cycle over the next 2-3 years (first by the government followed by private capex). From a sectoral perspective our order of preference is rate sensitives followed by domestic cyclicals, exporters and domestic consumption. Predominantly regulated
Trustees’ ReportFor the year ended March 31, 2021 (Contd...)

7
HSBC Managed Solutions
businesses come last in our pecking order. This preference is dictated by our assessment of sectors / segments leading contribution to the market earnings growth over the next 2-3 years. Our portfolio construction is driven by a bottom up approach to stock selection with a focus on names that can deliver positive earnings surprises. We continue to focus on this theme to identify likely outperformers.
*Source: Bloomberg
DEBT OUTLOOk
Market drivers during the course of the year FY21
The Fixed Income markets started the year with a bout of nervousness that was triggered by the pandemic. While RBI had calmed the markets with its large rate cut action of 75bp cut followed by liquidity supportive measures, the volatility continued until mid-May when government announced its relief package. While it was not fiscally expansive, it touched the right cords in terms of credit flow to desired sectors. This was followed up with RBI’s credit relief measures in terms of moratorium and restructuring of assets that were stressed due to the pandemic. Throughout the course of the year, RBI maintained its accommodative stance along with significant amount of surplus liquidity that was supportive and helped in maintaining stability in the market. However, as the year progressed and pressure on fiscal began to mount yields started seeing a spike towards the last quarter of the fiscal. While borrowing was stepped up to INR 12 trillion from previously budgeted INR 7.8 trillion in May 2020, it was further enhanced by and additional INR 1.1 trillion in October 2020. Overall GOI ended up borrowing a record amount of INR 13.9 trillion. The budget proved to be a shocker with GOI using the pandemic as an opportunity for setting the finances in order. GOI showed a record deficit of 9.5% for FY21 and projected a 6.8% for FY22 with estimated central government gross borrowing of INR 12 trillion. This seemed to reverse the support RBI had provided throughout the year with benchmark 10-year bond peaking to 6.23% in mid –Feb 2021. RBI’s statements to remain supportive were left in the sidelines. Overall it seemed that the 115bp of rate cut, along with significant liquidity infusion (OMO + Twist operations of ~INR 3 trillion, infusion via dollar purchases) seemed only a little to help in applying a brake to the one-way spike in yields. The year closed ~6.16% with absence of concrete action by RBI.
RBI Policy: Through the course of the year, RBI has maintained an accommodative stance, with an aggregate 115bp of rate cut done in March and May 2020 taking the repo rate from 5.15% to 4%. Subsequently while inflation pressures prevented RBI from taking any direct actions, RBI has used a combination of creative tools to keep the rates contained primarily via liquidity supportive tools such as OMOs, Twist Operations, Repo linked Term loans to needy sectors (LTROs, TLTROs), CRR cuts. While inflation was a worry for most part of the year, RBI kept it aside admitting that growth was a priority and inflation effects are more supply side rather than demand side. Prospectively into FY22, with the onset of the second wave, RBI continues to maintain the stance to prioritize growth.
Inflation: Inflation for most part of the year stayed above 6% primarily driven by supply side pressures and some intermittent spike from food inflation as well. While it has been coming off since December with cooling off of food inflation and positive base effects, it has been between 4- 5.5%. Structurally however inflation risks continue to remain as oil prices have increased and base effects will not remain supportive for long. Core inflation continues to remain sticky.
Liquidity: During the year, system liquidity has remained at significant surplus facilitated largely by RBI action such as OMOs, foreign exchange operations and government spending.
Budget: The FY2022 union budget focuses on growth and has accordingly, presented a 9.5% fiscal deficit for FY21 and 6.8% for FY22. On the revenue side, the assumptions are largely realistic, with FY22 (E) Nominal GDP growth at 14.4% and tax revenue growth at 17% considering the pandemic impact in FY 21. Compared to FY20, tax revenue growth is ~10%. While non-tax revenues are ambitious pegging the divestment at INR 1.75 trillion, with robust pipeline of assets including monetization of road and transmission assets, execution remains the key as in the past. On the expenditure side, better quality capex spending with focusing on rail, road, defense, urban infra is positive for long term structural growth. The revenue side expenditure adjusting for clearance of past subsidy arrears will be similar to budgetary estimates. Government using this opportunity to bring back off-balance sheet spending to on-balance sheet was a welcome move towards transparency and showing realistic projections. Alongside, states have also been given leeway to borrow upto 4% of their GDP with an additional 0.5% subject to conditions. Given that states are an important vehicle for capex investment, this move is welcome although it may entail additional state borrowing. The fiscal glide path
Trustees’ ReportFor the year ended March 31, 2021 (Contd...)

8
Abridged Annual Report 2020 - 2021
is shifted to FY26 at below 4.5% for center and 3% for states suggesting that spending will continue and borrowing will come down gradually. In summary, from survival to revival, FY22 budget aims for structural growth leaving fiscal concerns sideways in the interim. Government’s intent seems clear on bringing back growth on the table, in a transparent manner.
While the second wave of the pandemic has once again derailed the revenue story, government will still have some cushion from its conservative estimates.
Currency and FII Flows: INR has been on an appreciation trajectory for most part of the year, aided by dollar underperformance supported by positive FII and FDI flows along with reduced imports on the domestic front as well. RBI has used most of the flows to accumulate reserves which has prevented any strong appreciation. Pandemic shock and global risk off led rupee over 75 in the beginning of the year only to close below 72 at the end of the fiscal year. While the second wave led to another spike in INR in April, it has since then cooled once again driven by dollar underperformance and pandemic recovery on the domestic front. Net FII flows was ~$30 bn with positive equity flows of~$37 bn while debt was negative ~$7bn and overall RBI’s forex reserves rose by a ~$100 bn to close ~$537 bn.
Credit growth: Credit growth for the entire year has been tepid as previous year’s credit events were followed by nervousness relating to the pandemic. Despite RBI opening up several windows to finance the non-AAA segment, there was very little fresh credit flowing that segment. Overall banking credit grew by only 6.5%. Risk appetite has however been improving from a complete risk aversion to opening up towards a calculated risk. Prospectively it is expected that once the pandemic risk abates, credit growth will resume primarily driven by government capex spending and demand recovery.
Market Outlook
The pandemic once again brought the country to a situation similar to last year and debt markets perhaps interpreted the same as a structural rise in rates. In the initial day’s post budget in Feb of 2021, market was expecting a concrete set of actions such as an OMO calendar from RBI, and RBI’s words alone failed to calm the market. The first auction of the fiscal year also saw a devolvement. However, RBI acted in the first policy of the year announcing a bond buyback program akin to QE (quantitative easing) and its subsequent cancellation of auctions wherein yields were perhaps quoted higher than RBI’s comfort levels brought back confidence into the market. Since then we have seen a strong rally with 10-year benchmark trending below 6% and the curve moving alongside. RBI reiteration of priority of growth and also supporting with higher than expected dividend payment stand out as a testimony of its support. While we do not expect RBI to act in terms of rate cuts, we believe that measures such as G-SAP, OMOs will continue until there is visibility of a structural growth. Therefore, the large borrowing program should go without any hiccups.
Furthermore, with the evidence of strong GST numbers until April 2021 (before the 2nd wave), it is expected that growth and therefore fiscal revenues will come back. Government’s conservative budget estimates are supportive. Also, given the fact that compared to last year there has not been a complete shutdown of activity (lockdowns being distributed), the impact on growth will not be similar to last year. Pent up demand will come back to support revenue collection. However, on the flipside, once growth resumes RBI will be forced to withdraw liquidity in a phased manner to prevent asset bubbles. Nevertheless, RBI need not act in terms of rate actions and we believe that a prolonged pause in terms of RBI rates is in the offing.
Net-net therefore while growth is wanting no matter what, it may come at a small price of rise in yields with liquidity withdrawal. That is however expected more in the 2nd half of the year. Lower than expected borrowing numbers, later this year or if not in next year could be a surprise. We may therefore see a range bound rate action in the near term with a rising bias over time. Global rate environment, oil and currency risks are to be watched out for.
2. BRIEF BACkGROUND OF SPONSORS, BOARD OF TRUSTEES AND ASSET MANAGEMENT COMPANY
a. Sponsor
HSBC Mutual Fund is sponsored by HSBC Securities and Capital Markets (India) Private Limited (HSCI). The Sponsor is the Settler of the Mutual Fund Trust. The Sponsor has entrusted a sum of Rs. 1,00,000/- (Rupees One Lakh only) to the Trustee as the initial contribution towards the corpus of the Mutual Fund.
HSCI offers integrated investment banking services, securities and corporate finance & advisory. HSCI is
Trustees’ ReportFor the year ended March 31, 2021 (Contd...)
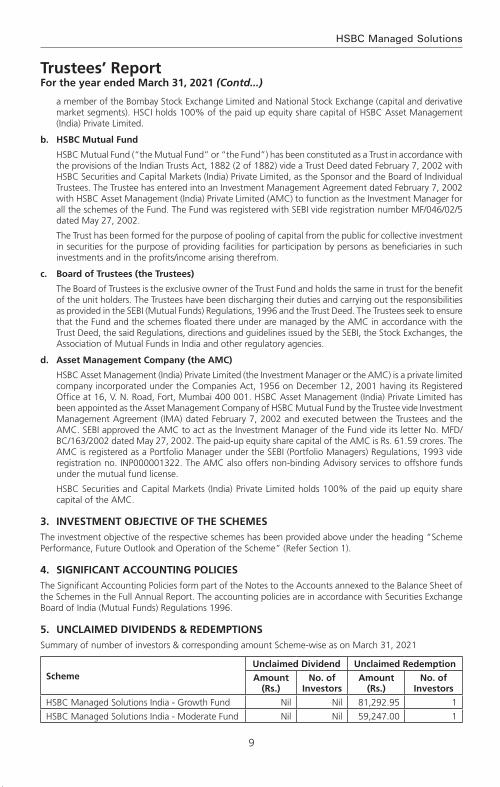
9
HSBC Managed Solutions
Trustees’ ReportFor the year ended March 31, 2021 (Contd...)
a member of the Bombay Stock Exchange Limited and National Stock Exchange (capital and derivative market segments). HSCI holds 100% of the paid up equity share capital of HSBC Asset Management (India) Private Limited.
b. HSBC Mutual Fund
HSBC Mutual Fund (“the Mutual Fund” or “the Fund”) has been constituted as a Trust in accordance with the provisions of the Indian Trusts Act, 1882 (2 of 1882) vide a Trust Deed dated February 7, 2002 with HSBC Securities and Capital Markets (India) Private Limited, as the Sponsor and the Board of Individual Trustees. The Trustee has entered into an Investment Management Agreement dated February 7, 2002 with HSBC Asset Management (India) Private Limited (AMC) to function as the Investment Manager for all the schemes of the Fund. The Fund was registered with SEBI vide registration number MF/046/02/5 dated May 27, 2002.
The Trust has been formed for the purpose of pooling of capital from the public for collective investment in securities for the purpose of providing facilities for participation by persons as beneficiaries in such investments and in the profits/income arising therefrom.
c. Board of Trustees (the Trustees)
The Board of Trustees is the exclusive owner of the Trust Fund and holds the same in trust for the benefit of the unit holders. The Trustees have been discharging their duties and carrying out the responsibilities as provided in the SEBI (Mutual Funds) Regulations, 1996 and the Trust Deed. The Trustees seek to ensure that the Fund and the schemes floated there under are managed by the AMC in accordance with the Trust Deed, the said Regulations, directions and guidelines issued by the SEBI, the Stock Exchanges, the Association of Mutual Funds in India and other regulatory agencies.
d. Asset Management Company (the AMC)
HSBC Asset Management (India) Private Limited (the Investment Manager or the AMC) is a private limited company incorporated under the Companies Act, 1956 on December 12, 2001 having its Registered Office at 16, V. N. Road, Fort, Mumbai 400 001. HSBC Asset Management (India) Private Limited has been appointed as the Asset Management Company of HSBC Mutual Fund by the Trustee vide Investment Management Agreement (IMA) dated February 7, 2002 and executed between the Trustees and the AMC. SEBI approved the AMC to act as the Investment Manager of the Fund vide its letter No. MFD/BC/163/2002 dated May 27, 2002. The paid-up equity share capital of the AMC is Rs. 61.59 crores. The AMC is registered as a Portfolio Manager under the SEBI (Portfolio Managers) Regulations, 1993 vide registration no. INP000001322. The AMC also offers non-binding Advisory services to offshore funds under the mutual fund license.
HSBC Securities and Capital Markets (India) Private Limited holds 100% of the paid up equity share capital of the AMC.
3. INvESTMENT OBJECTIvE OF THE SCHEMESThe investment objective of the respective schemes has been provided above under the heading “Scheme Performance, Future Outlook and Operation of the Scheme” (Refer Section 1).
4. SIGNIFICANT ACCOUNTING POLICIES The Significant Accounting Policies form part of the Notes to the Accounts annexed to the Balance Sheet of the Schemes in the Full Annual Report. The accounting policies are in accordance with Securities Exchange Board of India (Mutual Funds) Regulations 1996.
5. UNCLAIMED DIvIDENDS & REDEMPTIONSSummary of number of investors & corresponding amount Scheme-wise as on March 31, 2021
SchemeUnclaimed Dividend Unclaimed Redemption
Amount (Rs.)
No. of Investors
Amount (Rs.)
No. of Investors
HSBC Managed Solutions India - Growth Fund Nil Nil 81,292.95 1
HSBC Managed Solutions India - Moderate Fund Nil Nil 59,247.00 1

10
Abridged Annual Report 2020 - 2021
6. INvESTOR SERvICESThe number of official points of acceptance of transactions is 204 locations. In addition to the offices of the Registrar & Transfer agents, the AMC has Investor Service Centers in 9 locations at its own offices - namely Mumbai, New Delhi, Kolkata, Bangalore, Pune, Ahmedabad, Hyderabad, Chandigarh and Chennai. With a view to enhance customer convenience, the AMC has the facility of priority based servicing to key distributors through the enhancement of the Interactive Voice Reponses. The AMC has 2 Toll Free numbers (1-800-200-2434 /1-800-258-2434) which can be dialed from anywhere in India and 1 number i.e +91 44 39923900 (Investors calling from abroad). The call center service is being managed by the Registrar and Transfer Agents. Transactions for purchase / redemption of units in the schemes HSBC Mutual Fund can also be made through the online transaction facility on the AMC’s website at https://invest.assetmanagement.hsbc.co.in.
On the distribution front, the number of empaneled distributors was 1069 as on March 31, 2021. During the year, the AMC initiated tie-ups for online distribution of the Mutual Fund’s schemes with several channel partners taking the total number of such tie-ups to 52.
7. DETAILS OF INvESTOR GRIEvANCE REDRESSALThe details of the redressal of investor complaints received against HSBC Mutual Fund during April 2020 - March 2021 are as follows:
2020-2021Com-plaint Code
Type of complaint# (a) No. of complaints pending at the begin-ning of the
year
(b) No. of Com-
plaints received during
the year
Action on (a) and (b)
Resolved Non Action-
able
Pending
Within 30
days
30 - 60 days
60 - 180 days
Beyond 180 days
0 - 3 months
3 - 6 months
6 - 9 months
9 - 12 months
I A Non receipt of Dividend on Units
0 0 0 0 0 0 0 0 0 0 0
I B Interest on delayed payment of Dividend
0 0 0 0 0 0 0 0 0 0 0
I C Non receipt of Redemption Proceeds
0 8 7 0 0 0 0 1 0 0 0
I D Interest on delayed payment of Redemption
0 0 0 0 0 0 0 0 0 0 0
II A Non receipt of Statement of Account / Unit Certificate
0 0 0 0 0 0 0 0 0 0 0
II B Discrepancy in Statement of Account
0 1 1 0 0 0 0 0 0 0 0
II C Data corrections in Investor details **
0 12 12 0 0 0 0 0 0 0 0
II D Non receipt of Annual Report/Abridged Summary
0 0 0 0 0 0 0 0 0 0 0
III A Wrong switch between Schemes
0 0 0 0 0 0 0 0 0 0 0
III B Unauthorized switch between Schemes
0 0 0 0 0 0 0 0 0 0 0
III C Deviation from Scheme attributes
0 0 0 0 0 0 0 0 0 0 0
III D Wrong or excess charges/load
0 0 0 0 0 0 0 0 0 0 0
III E Non updation of changes viz. address, PAN, bank details, nomination, etc
0 6 6 0 0 0 0 0 0 0 0
IV Others 0 15 15 0 0 0 0 0 0 0 0
Total 0 42 41 0 0 0 0 1 0 0 0
Trustees’ ReportFor the year ended March 31, 2021 (Contd...)
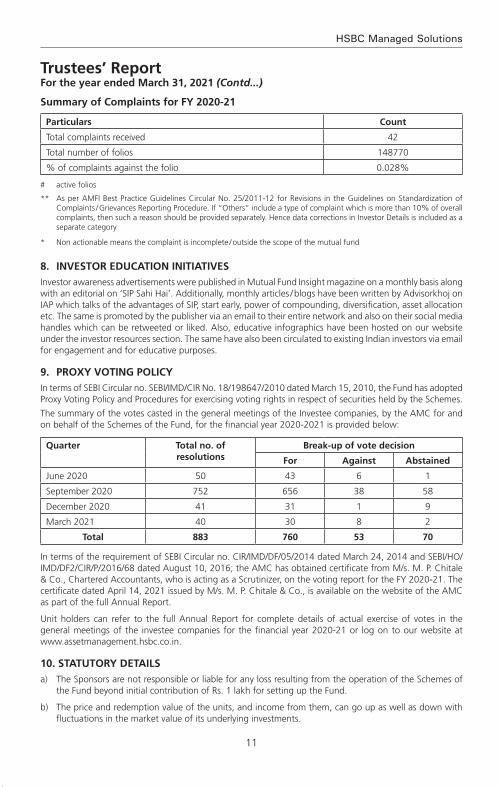
11
HSBC Managed Solutions
Summary of Complaints for FY 2020-21
Particulars Count
Total complaints received 42
Total number of folios 148770
% of complaints against the folio 0.028%
# active folios
** As per AMFI Best Practice Guidelines Circular No. 25/2011-12 for Revisions in the Guidelines on Standardization of Complaints / Grievances Reporting Procedure. If “Others” include a type of complaint which is more than 10% of overall complaints, then such a reason should be provided separately. Hence data corrections in Investor Details is included as a separate category
* Non actionable means the complaint is incomplete / outside the scope of the mutual fund
8. INvESTOR EDUCATION INITIATIvES Investor awareness advertisements were published in Mutual Fund Insight magazine on a monthly basis along with an editorial on ‘SIP Sahi Hai’. Additionally, monthly articles / blogs have been written by Advisorkhoj on IAP which talks of the advantages of SIP, start early, power of compounding, diversification, asset allocation etc. The same is promoted by the publisher via an email to their entire network and also on their social media handles which can be retweeted or liked. Also, educative infographics have been hosted on our website under the investor resources section. The same have also been circulated to existing Indian investors via email for engagement and for educative purposes.
9. PROxY vOTING POLICYIn terms of SEBI Circular no. SEBI/IMD/CIR No. 18/198647/2010 dated March 15, 2010, the Fund has adopted Proxy Voting Policy and Procedures for exercising voting rights in respect of securities held by the Schemes.
The summary of the votes casted in the general meetings of the Investee companies, by the AMC for and on behalf of the Schemes of the Fund, for the financial year 2020-2021 is provided below:
quarter Total no. of resolutions
Break-up of vote decision
For Against Abstained
June 2020 50 43 6 1
September 2020 752 656 38 58
December 2020 41 31 1 9
March 2021 40 30 8 2
Total 883 760 53 70
In terms of the requirement of SEBI Circular no. CIR/IMD/DF/05/2014 dated March 24, 2014 and SEBI/HO/IMD/DF2/CIR/P/2016/68 dated August 10, 2016; the AMC has obtained certificate from M/s. M. P. Chitale & Co., Chartered Accountants, who is acting as a Scrutinizer, on the voting report for the FY 2020-21. The certificate dated April 14, 2021 issued by M/s. M. P. Chitale & Co., is available on the website of the AMC as part of the full Annual Report.
Unit holders can refer to the full Annual Report for complete details of actual exercise of votes in the general meetings of the investee companies for the financial year 2020-21 or log on to our website at www.assetmanagement.hsbc.co.in.
10. STATUTORY DETAILSa) The Sponsors are not responsible or liable for any loss resulting from the operation of the Schemes of
the Fund beyond initial contribution of Rs. 1 lakh for setting up the Fund.
b) The price and redemption value of the units, and income from them, can go up as well as down with fluctuations in the market value of its underlying investments.
Trustees’ ReportFor the year ended March 31, 2021 (Contd...)
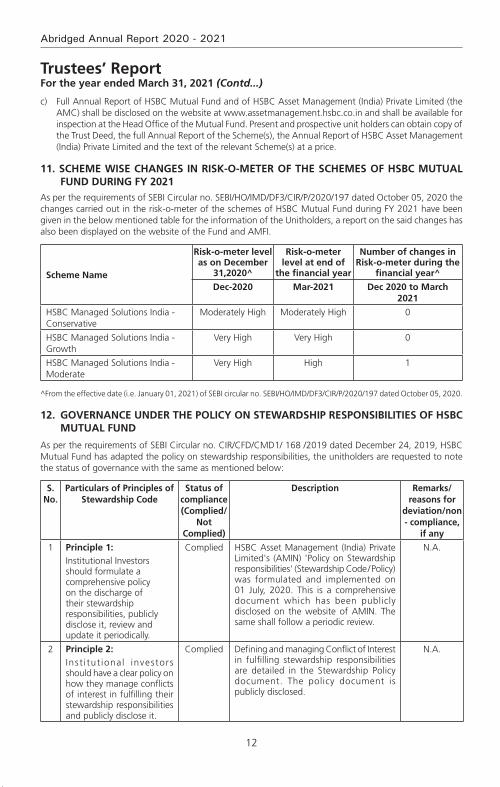
12
Abridged Annual Report 2020 - 2021
c) Full Annual Report of HSBC Mutual Fund and of HSBC Asset Management (India) Private Limited (the AMC) shall be disclosed on the website at www.assetmanagement.hsbc.co.in and shall be available for inspection at the Head Office of the Mutual Fund. Present and prospective unit holders can obtain copy of the Trust Deed, the full Annual Report of the Scheme(s), the Annual Report of HSBC Asset Management (India) Private Limited and the text of the relevant Scheme(s) at a price.
11. SCHEME WISE CHANGES IN RISk-O-METER OF THE SCHEMES OF HSBC MUTUAL FUND DURING FY 2021
As per the requirements of SEBI Circular no. SEBI/HO/IMD/DF3/CIR/P/2020/197 dated October 05, 2020 the changes carried out in the risk-o-meter of the schemes of HSBC Mutual Fund during FY 2021 have been given in the below mentioned table for the information of the Unitholders, a report on the said changes has also been displayed on the website of the Fund and AMFI.
Scheme Name
Risk-o-meter level as on December
31,2020^
Risk-o-meter level at end of
the financial year
Number of changes in Risk-o-meter during the
financial year^
Dec-2020 Mar-2021 Dec 2020 to March 2021
HSBC Managed Solutions India - Conservative
Moderately High Moderately High 0
HSBC Managed Solutions India - Growth
Very High Very High 0
HSBC Managed Solutions India - Moderate
Very High High 1
^From the effective date (i.e. January 01, 2021) of SEBI circular no. SEBI/HO/IMD/DF3/CIR/P/2020/197 dated October 05, 2020.
12. GOvERNANCE UNDER THE POLICY ON STEWARDSHIP RESPONSIBILITIES OF HSBC MUTUAL FUND
As per the requirements of SEBI Circular no. CIR/CFD/CMD1/ 168 /2019 dated December 24, 2019, HSBC Mutual Fund has adapted the policy on stewardship responsibilities, the unitholders are requested to note the status of governance with the same as mentioned below:
S. No.
Particulars of Principles of Stewardship Code
Status of compliance (Complied/
Not Complied)
Description Remarks/reasons for
deviation/non - compliance,
if any
1 Principle 1:Institutional Investors should formulate a comprehensive policy on the discharge of their stewardship responsibilities, publicly disclose it, review and update it periodically.
Complied HSBC Asset Management (India) Private Limited's (AMIN) 'Policy on Stewardship responsibilities' (Stewardship Code / Policy) was formulated and implemented on 01 July, 2020. This is a comprehensive document which has been publicly disclosed on the website of AMIN. The same shall follow a periodic review.
N.A.
2 Principle 2:Inst i tut ional investors should have a clear policy on how they manage conflicts of interest in fulfilling their stewardship responsibilities and publicly disclose it.
Complied Defining and managing Conflict of Interest in fulfilling stewardship responsibilities are detailed in the Stewardship Policy document. The policy document is publicly disclosed.
N.A.
Trustees’ ReportFor the year ended March 31, 2021 (Contd...)
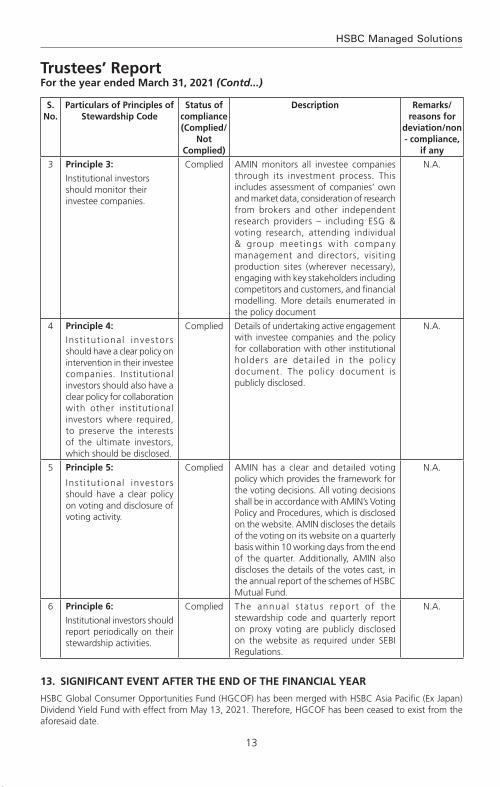
13
HSBC Managed Solutions
Trustees’ ReportFor the year ended March 31, 2021 (Contd...)
S. No.
Particulars of Principles of Stewardship Code
Status of compliance (Complied/
Not Complied)
Description Remarks/reasons for
deviation/non - compliance,
if any
3 Principle 3:
Institutional investors should monitor their investee companies.
Complied AMIN monitors all investee companies through its investment process. This includes assessment of companies’ own and market data, consideration of research from brokers and other independent research providers – including ESG & voting research, attending individual & group meetings with company management and directors, visiting production sites (wherever necessary), engaging with key stakeholders including competitors and customers, and financial modelling. More details enumerated in the policy document
N.A.
4 Principle 4:
Inst i tut ional investors should have a clear policy on intervention in their investee companies. Institutional investors should also have a clear policy for collaboration with other institutional investors where required, to preserve the interests of the ultimate investors, which should be disclosed.
Complied Details of undertaking active engagement with investee companies and the policy for collaboration with other institutional holders are detailed in the policy document. The policy document is publicly disclosed.
N.A.
5 Principle 5:
Inst i tut ional investors should have a clear policy on voting and disclosure of voting activity.
Complied AMIN has a clear and detailed voting policy which provides the framework for the voting decisions. All voting decisions shall be in accordance with AMIN’s Voting Policy and Procedures, which is disclosed on the website. AMIN discloses the details of the voting on its website on a quarterly basis within 10 working days from the end of the quarter. Additionally, AMIN also discloses the details of the votes cast, in the annual report of the schemes of HSBC Mutual Fund.
N.A.
6 Principle 6:
Institutional investors should report periodically on their stewardship activities.
Complied The annual status report of the stewardship code and quarterly report on proxy voting are publicly disclosed on the website as required under SEBI Regulations.
N.A.
13. SIGNIFICANT EvENT AFTER THE END OF THE FINANCIAL YEAR
HSBC Global Consumer Opportunities Fund (HGCOF) has been merged with HSBC Asia Pacific (Ex Japan) Dividend Yield Fund with effect from May 13, 2021. Therefore, HGCOF has been ceased to exist from the aforesaid date.
14
Abridged Annual Report 2020 - 2021
Trustees’ ReportFor the year ended March 31, 2021 (Contd...)
14. ACkNOWLEDGEMENTS
The Trustees wish to thank the Unit holders of the Schemes for their support throughout the year and also thank the Government of India, the Securities and Exchange Board of India (SEBI), the Reserve Bank of India (RBI) and the Association of Mutual Funds in India (AMFI) for the guidance provided by them. The Trustees also appreciate the services provided by the Registrar and Transfer Agent, Fund Accountant, Custodian, Bankers, Distributors and Brokers. The guidance and services provided by the Auditors and advocates and the ebullience, sincerity and dedication of the employees of HSBC Asset Management (India) Private Limited is also appreciated.
The Trustees look forward to the continued support of everyone.
For and on behalf of the Board of Trustees of HSBC Mutual Fund
Sd/-
Trustee
Mumbai
July 20, 2021.

15
HSBC Managed Solutions
To the Trustees of HSBC Mutual Fund
HSBC Managed Solutions India - Growth
Report on the Audit of the Financial Statements
OpinionWe have audited the financial statements of HSBC Managed Solutions India - Growth (the ‘Scheme’) of HSBC Mutual Fund, which comprise the balance sheet as at 31 March 2021 and the revenue account for the year then ended, and notes to the financial statements, including a summary of the significant accounting policies.
In our opinion and to the best of our information and according to the explanations given to us, the aforesaid financial statements give a true and fair view in conformity with the accounting principles generally accepted in India, of the state of affairs of the Scheme as at 31 March 2021, its net surplus for the year ended on that date.
Basis for OpinionWe conducted our audit in accordance with the Standards on Auditing (‘SAs’) issued by the Institute of Chartered Accountants of India (the ‘ICAI’). Our responsibilities under those SAs are further described in the Auditor’s Responsibilities for the Audit of the Financial Statements section of our report. We are independent of the Scheme in accordance with the Code of Ethics issued by the ICAI, and we have fulfilled our other ethical responsibilities in accordance with the Code of Ethics. We believe that the audit evidence we have obtained is sufficient and appropriate to provide a basis for our opinion.
Responsibilities of Management and Those Charged with Governance for the Financial StatementsThe Scheme’s management, the Board of Directors of HSBC Mutual Fund (the ‘Trustees’) and the Board of Directors of HSBC Asset Management (India) Private Limited (the ‘AMC’) (collectively referred to as ‘Management’) are responsible for the preparation of these financial statements that give a true and fair view of the state of affairs, results of operations of the Scheme in accordance with the accounting policies and standards specified in the Ninth Schedule of the Securities and Exchange Board of India (Mutual Funds) Regulations, 1996, as amended (the ‘Regulations’) and the accounting principles generally accepted in India. This responsibility includes design, implementation and maintenance of internal control relevant to the preparation and presentation of the financial statements that give a true and fair view and are free from material misstatement, whether due to fraud or error.
In preparing the financial statements, management is responsible for assessing the Scheme’s ability to continue as a going concern, disclosing, as applicable, matters related to going concern and using the going concern basis of accounting unless management either intends to liquidate the Scheme or to cease operations, or has no realistic alternative but to do so.
The management is responsible for overseeing the Scheme’s financial reporting process.
Auditor’s Responsibilities for the Audit of the Financial StatementsOur objectives are to obtain reasonable assurance about whether the financial statements as a whole are free from material misstatement, whether due to fraud or error, and to issue an auditor’s report that includes our opinion. Reasonable assurance is a high level of assurance, but is not a guarantee that an audit conducted in accordance with SAs will always detect a material misstatement when it exists. Misstatements can arise from fraud or error and are considered material if, individually or in the aggregate, they could reasonably be expected to influence the economic decisions of users taken on the basis of these financial statements.
As part of an audit in accordance with SAs, we exercise professional judgment and maintain professional skepticism throughout the audit. We also:
• Identifyandassesstherisksofmaterialmisstatementofthefinancialstatements,whetherduetofraudor error, design and perform audit procedures responsive to those risks, and obtain audit evidence that is sufficient and appropriate to provide a basis for our opinion. The risk of not detecting a material misstatement resulting from fraud is higher than for one resulting from error, as fraud may involve
Independent Auditors’ Report

16
Abridged Annual Report 2020 - 2021
Independent Auditors’ Report (Contd...)
collusion, forgery, intentional omissions, misrepresentations, or the override of internal control;
• Obtainanunderstandingofinternalcontrolrelevanttotheauditinordertodesignauditproceduresthat are appropriate in the circumstances, but not for the purpose of expressing an opinion on the effectiveness of the Scheme’s internal controls;
• Evaluatetheappropriatenessofaccountingpoliciesusedandthereasonablenessofaccountingestimatesand related disclosures made by Management;
• ConcludeontheappropriatenessofManagement’suseofthegoingconcernbasisofaccountingand,based on the audit evidence obtained, whether a material uncertainty exists related to events or conditions that may cast significant doubt on the Scheme’s ability to continue as a going concern. If we conclude that a material uncertainty exists, we are required to draw attention in our auditor’s report to the related disclosures in the financial statements or, if such disclosures are inadequate, to modify our opinion. Our conclusions are based on the audit evidence obtained up to the date of our auditor’s report. However, future events or conditions may cause the Scheme to cease to continue as a going concern;
• Evaluate the overall presentation, structure and content of the financial statements, including thedisclosures and whether the financial statements represent the underlying transactions and events in a manner that achieves fair presentation.
We communicate with those charged with governance regarding, among other matters, the planned scope and timing of the audit and significant audit findings, including any significant deficiencies in internal control that we identify during our audit.
We also provide those charged with governance with a statement that we have complied with relevant ethical requirements regarding independence, and to communicate with them all relationships and other matters that may reasonably be thought to bear on our independence, and where applicable, related safeguards.
Report on Other Legal and Regulatory Requirements 1 As required by Regulation 55 (4) of the Regulations, we report that:
(a) We have obtained all information and explanations which, to the best of our knowledge and belief, were necessary for the purposes of the audit; and
(b) The balance sheet and the revenue account have been prepared in accordance with the accounting policies and standards as specified in the Ninth Schedule of the Regulations.
2 As required by Clause 5 (ii) (2) of the Eleventh Schedule of the Regulations, we report that the balance sheet and the revenue account are in agreement with the books of account of the Scheme.
For B S R & Co. LLP Chartered Accountants Firm’s Registration No: 101248W/W-100022
Sd/-
Ajit Viswanath PartnerMembership No: 067114UDIN : 21067114AAAADY3444
Place : Mumbai Date : July 20, 2021.
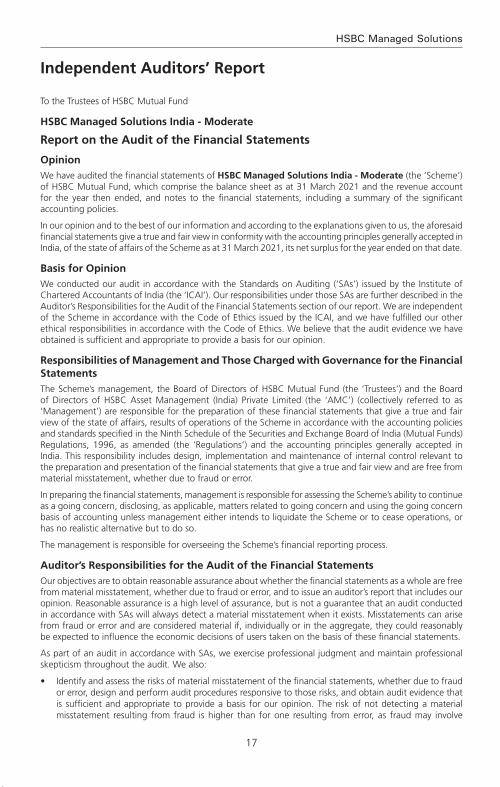
17
HSBC Managed Solutions
To the Trustees of HSBC Mutual Fund
HSBC Managed Solutions India - Moderate
Report on the Audit of the Financial Statements
OpinionWe have audited the financial statements of HSBC Managed Solutions India - Moderate (the ‘Scheme’) of HSBC Mutual Fund, which comprise the balance sheet as at 31 March 2021 and the revenue account for the year then ended, and notes to the financial statements, including a summary of the significant accounting policies.
In our opinion and to the best of our information and according to the explanations given to us, the aforesaid financial statements give a true and fair view in conformity with the accounting principles generally accepted in India, of the state of affairs of the Scheme as at 31 March 2021, its net surplus for the year ended on that date.
Basis for OpinionWe conducted our audit in accordance with the Standards on Auditing (‘SAs’) issued by the Institute of Chartered Accountants of India (the ‘ICAI’). Our responsibilities under those SAs are further described in the Auditor’s Responsibilities for the Audit of the Financial Statements section of our report. We are independent of the Scheme in accordance with the Code of Ethics issued by the ICAI, and we have fulfilled our other ethical responsibilities in accordance with the Code of Ethics. We believe that the audit evidence we have obtained is sufficient and appropriate to provide a basis for our opinion.
Responsibilities of Management and Those Charged with Governance for the Financial StatementsThe Scheme’s management, the Board of Directors of HSBC Mutual Fund (the ‘Trustees’) and the Board of Directors of HSBC Asset Management (India) Private Limited (the ‘AMC’) (collectively referred to as ‘Management’) are responsible for the preparation of these financial statements that give a true and fair view of the state of affairs, results of operations of the Scheme in accordance with the accounting policies and standards specified in the Ninth Schedule of the Securities and Exchange Board of India (Mutual Funds) Regulations, 1996, as amended (the ‘Regulations’) and the accounting principles generally accepted in India. This responsibility includes design, implementation and maintenance of internal control relevant to the preparation and presentation of the financial statements that give a true and fair view and are free from material misstatement, whether due to fraud or error.
In preparing the financial statements, management is responsible for assessing the Scheme’s ability to continue as a going concern, disclosing, as applicable, matters related to going concern and using the going concern basis of accounting unless management either intends to liquidate the Scheme or to cease operations, or has no realistic alternative but to do so.
The management is responsible for overseeing the Scheme’s financial reporting process.
Auditor’s Responsibilities for the Audit of the Financial StatementsOur objectives are to obtain reasonable assurance about whether the financial statements as a whole are free from material misstatement, whether due to fraud or error, and to issue an auditor’s report that includes our opinion. Reasonable assurance is a high level of assurance, but is not a guarantee that an audit conducted in accordance with SAs will always detect a material misstatement when it exists. Misstatements can arise from fraud or error and are considered material if, individually or in the aggregate, they could reasonably be expected to influence the economic decisions of users taken on the basis of these financial statements.
As part of an audit in accordance with SAs, we exercise professional judgment and maintain professional skepticism throughout the audit. We also:
• Identifyandassesstherisksofmaterialmisstatementofthefinancialstatements,whetherduetofraudor error, design and perform audit procedures responsive to those risks, and obtain audit evidence that is sufficient and appropriate to provide a basis for our opinion. The risk of not detecting a material misstatement resulting from fraud is higher than for one resulting from error, as fraud may involve
Independent Auditors’ Report
18
Abridged Annual Report 2020 - 2021
collusion, forgery, intentional omissions, misrepresentations, or the override of internal control;
• Obtainanunderstandingofinternalcontrolrelevanttotheauditinordertodesignauditproceduresthat are appropriate in the circumstances, but not for the purpose of expressing an opinion on the effectiveness of the Scheme’s internal controls;
• Evaluatetheappropriatenessofaccountingpoliciesusedandthereasonablenessofaccountingestimatesand related disclosures made by Management;
• ConcludeontheappropriatenessofManagement’suseofthegoingconcernbasisofaccountingand,based on the audit evidence obtained, whether a material uncertainty exists related to events or conditions that may cast significant doubt on the Scheme’s ability to continue as a going concern. If we conclude that a material uncertainty exists, we are required to draw attention in our auditor’s report to the related disclosures in the financial statements or, if such disclosures are inadequate, to modify our opinion. Our conclusions are based on the audit evidence obtained up to the date of our auditor’s report. However, future events or conditions may cause the Scheme to cease to continue as a going concern;
• Evaluate the overall presentation, structure and content of the financial statements, including thedisclosures and whether the financial statements represent the underlying transactions and events in a manner that achieves fair presentation.
We communicate with those charged with governance regarding, among other matters, the planned scope and timing of the audit and significant audit findings, including any significant deficiencies in internal control that we identify during our audit.
We also provide those charged with governance with a statement that we have complied with relevant ethical requirements regarding independence, and to communicate with them all relationships and other matters that may reasonably be thought to bear on our independence, and where applicable, related safeguards.
Report on Other Legal and Regulatory Requirements 1 As required by Regulation 55 (4) of the Regulations, we report that:
(a) We have obtained all information and explanations which, to the best of our knowledge and belief, were necessary for the purposes of the audit; and
(b) The balance sheet and the revenue account have been prepared in accordance with the accounting policies and standards as specified in the Ninth Schedule of the Regulations.
2 As required by Clause 5 (ii) (2) of the Eleventh Schedule of the Regulations, we report that the balance sheet and the revenue account are in agreement with the books of account of the Scheme.
For B S R & Co. LLP Chartered Accountants Firm’s Registration No: 101248W/W-100022
Sd/-
Ajit Viswanath PartnerMembership No: 067114UDIN : 21067114AAAADZ6270
Place : Mumbai Date : July 20, 2021.
Independent Auditors’ Report (Contd...)
19
HSBC Managed Solutions
Independent Auditors’ Report
To the Trustees of HSBC Mutual Fund
HSBC Managed Solutions India - Conservative
Report on the Audit of the Financial Statements
OpinionWe have audited the financial statements of HSBC Managed Solutions India - Conservative (the ‘Scheme’) of HSBC Mutual Fund, which comprise the balance sheet as at 31 March 2021 and the revenue account for the year then ended, and notes to the financial statements, including a summary of the significant accounting policies.
In our opinion and to the best of our information and according to the explanations given to us, the aforesaid financial statements give a true and fair view in conformity with the accounting principles generally accepted in India, of the state of affairs of the Scheme as at 31 March 2021, its net surplus for the year ended on that date.
Basis for OpinionWe conducted our audit in accordance with the Standards on Auditing (‘SAs’) issued by the Institute of Chartered Accountants of India (the ‘ICAI’). Our responsibilities under those SAs are further described in the Auditor’s Responsibilities for the Audit of the Financial Statements section of our report. We are independent of the Scheme in accordance with the Code of Ethics issued by the ICAI, and we have fulfilled our other ethical responsibilities in accordance with the Code of Ethics. We believe that the audit evidence we have obtained is sufficient and appropriate to provide a basis for our opinion.
Responsibilities of Management and Those Charged with Governance for the Financial StatementsThe Scheme’s management, the Board of Directors of HSBC Mutual Fund (the ‘Trustees’) and the Board of Directors of HSBC Asset Management (India) Private Limited (the ‘AMC’) (collectively referred to as ‘Management’) are responsible for the preparation of these financial statements that give a true and fair view of the state of affairs, results of operations of the Scheme in accordance with the accounting policies and standards specified in the Ninth Schedule of the Securities and Exchange Board of India (Mutual Funds) Regulations, 1996, as amended (the ‘Regulations’) and the accounting principles generally accepted in India. This responsibility includes design, implementation and maintenance of internal control relevant to the preparation and presentation of the financial statements that give a true and fair view and are free from material misstatement, whether due to fraud or error.
In preparing the financial statements, management is responsible for assessing the Scheme’s ability to continue as a going concern, disclosing, as applicable, matters related to going concern and using the going concern basis of accounting unless management either intends to liquidate the Scheme or to cease operations, or has no realistic alternative but to do so.
The management is responsible for overseeing the Scheme’s financial reporting process.
Auditor’s Responsibilities for the Audit of the Financial StatementsOur objectives are to obtain reasonable assurance about whether the financial statements as a whole are free from material misstatement, whether due to fraud or error, and to issue an auditor’s report that includes our opinion. Reasonable assurance is a high level of assurance, but is not a guarantee that an audit conducted in accordance with SAs will always detect a material misstatement when it exists. Misstatements can arise from fraud or error and are considered material if, individually or in the aggregate, they could reasonably be expected to influence the economic decisions of users taken on the basis of these financial statements.
As part of an audit in accordance with SAs, we exercise professional judgment and maintain professional skepticism throughout the audit. We also:
• Identifyandassesstherisksofmaterialmisstatementofthefinancialstatements,whetherduetofraudor error, design and perform audit procedures responsive to those risks, and obtain audit evidence that is sufficient and appropriate to provide a basis for our opinion. The risk of not detecting a material misstatement resulting from fraud is higher than for one resulting from error, as fraud may involve

20
Abridged Annual Report 2020 - 2021
collusion, forgery, intentional omissions, misrepresentations, or the override of internal control;
• Obtainanunderstandingofinternalcontrolrelevanttotheauditinordertodesignauditproceduresthat are appropriate in the circumstances, but not for the purpose of expressing an opinion on the effectiveness of the Scheme’s internal controls;
• Evaluatetheappropriatenessofaccountingpoliciesusedandthereasonablenessofaccountingestimatesand related disclosures made by Management;
• ConcludeontheappropriatenessofManagement’suseofthegoingconcernbasisofaccountingand,based on the audit evidence obtained, whether a material uncertainty exists related to events or conditions that may cast significant doubt on the Scheme’s ability to continue as a going concern. If we conclude that a material uncertainty exists, we are required to draw attention in our auditor’s report to the related disclosures in the financial statements or, if such disclosures are inadequate, to modify our opinion. Our conclusions are based on the audit evidence obtained up to the date of our auditor’s report. However, future events or conditions may cause the Scheme to cease to continue as a going concern;
• Evaluate the overall presentation, structure and content of the financial statements, including thedisclosures and whether the financial statements represent the underlying transactions and events in a manner that achieves fair presentation.
We communicate with those charged with governance regarding, among other matters, the planned scope and timing of the audit and significant audit findings, including any significant deficiencies in internal control that we identify during our audit.
We also provide those charged with governance with a statement that we have complied with relevant ethical requirements regarding independence, and to communicate with them all relationships and other matters that may reasonably be thought to bear on our independence, and where applicable, related safeguards.
Report on Other Legal and Regulatory Requirements 1 As required by Regulation 55 (4) of the Regulations, we report that:
(a) We have obtained all information and explanations which, to the best of our knowledge and belief, were necessary for the purposes of the audit; and
(b) The balance sheet and the revenue account have been prepared in accordance with the accounting policies and standards as specified in the Ninth Schedule of the Regulations.
2 As required by Clause 5 (ii) (2) of the Eleventh Schedule of the Regulations, we report that the balance sheet and the revenue account are in agreement with the books of account of the Scheme.
For B S R & Co. LLP Chartered Accountants Firm’s Registration No: 101248W/W-100022
Sd/-
Ajit Viswanath PartnerMembership No: 067114UDIN : 21067114AAAADX5825
Place : Mumbai Date : July 20, 2021.
Independent Auditors’ Report (Contd...)

21
HSBC Managed Solutions
Rs. in Lakhs
HSBC MANAGED SOLUTIONS INDIA – GROWTHAs at
March 31, 2021As at
March 31, 2020
LIABILITIES1 Unit Capital 1,768.61 3,557.30 2 Reserves & Surplus2.1 Unit Premium Reserves (1,231.15) (1,221.56)2.2 Unrealised Appreciation Reserve 1,619.69 432.71 2.3 Other Reserves 1,872.51 2,310.53 3 Loans & Borrowings – – 4 Current Liabilities & Provisions4.1 Provision for Doubtful Income/Deposits – – 4.2 Other Current Liabilities & Provisions 17.22 152.48
TOTAL 4,046.88 5,231.46
ASSETS1 Investments1.1 Listed Securities:1.1.1 Equity Shares – – 1.1.2 Preference Shares – – 1.1.3 Equity Linked Debentures – – 1.1.4 Other Debentures & Bonds – – 1.1.5 Securitised Debt Securities – – 1.2 Securities Awaited Listing:1.2.1 Equity Shares – – 1.2.2 Preference Shares – – 1.2.3 Equity Linked Debentures – – 1.2.4 Other Debentures & Bonds – – 1.2.5 Securitised Debt Securities – – 1.3 Unlisted Securities:1.3.1 Equity Shares – – 1.3.2 Preference Shares – – 1.3.3 Equity Linked Debentures – – 1.3.4 Other Debentures & Bonds – – 1.3.5 Securitised Debt Securities – – 1.4 Government Securities – – 1.5 Treasury Bills – – 1.6 Commercial Paper – – 1.7 Certificate of Deposits – – 1.8 Bill Rediscounting – – 1.9 Units of Domestic Mutual Fund 4,010.97 5,050.71 1.10 Foreign Securities – –
Total Investments 4,010.97 5,050.71
2 Deposits 1.53 1.50 3 Other Current Assets3.1 Cash & Bank Balance 0.03 0.06 3.2 TREPS / Reverse Repo Lending 33.51 103.38 3.3 Others 0.84 75.81 4 Deferred Revenue Expenditure (to the extent not written off) – –
TOTAL 4,046.88 5,231.46
Notes to Accounts - Annexure I
Abridged Balance Sheet as at March 31, 2021

22
Abridged Annual Report 2020 - 2021
Abridged Revenue Account for the year ended March 31, 2021
Rs. in Lakhs
HSBC MANAGED SOLUTIONS INDIA – GROWTH
Current Year ended
March 31, 2021
Previous Year ended
March 31, 2020
1 INCOME1.1 Dividend – –1.2 Interest 2.08 4.81 1.3 Realised Gain / (Loss) on Foreign Exchange Transactions – –1.4 Realised Gains / (Losses) on Interscheme Sale of Investments – –1.5 Realised Gains / (Losses) on External Sale / Redemption of
Investments 739.24 1,119.05
1.6 Realised Gains / (Losses) on Derivative Transactions – –1.7 Other Income 0.19 0.63
(A) 741.51 1,124.49
2 ExPENSES2.1 Investment Management Fees 2.77 6.41 2.2 GST on Investment Management Fees 0.50 1.15 2.3 Transfer Agents Fees and Expenses 1.98 4.78 2.4 Custodian Fees 1.62 1.64 2.5 Trusteeship Fees 0.13 0.25 2.6 Commission to Agents 11.66 24.18 2.7 Marketing & Distribution Expenses 0.07 0.11 2.8 Audit Fees 0.20 0.38 2.9 Investor Education Expenses 0.81 1.69 2.10 Interest on Borrowing – –2.11 Other Operating Expenses 0.93 1.83
(B) 20.67 42.42
3 NET REALISED GAINS / (LOSSES) FOR THE YEAR (C = A - B) 720.84 1,082.07
4 Change in Unrealised Depreciation in Value of Investments (D) – –
5 NET GAINS / (LOSSES) FOR THE YEAR (E = C + D) 720.84 1,082.07
6 Change in Unrealised Appreciation in Value of Investments (F) 1,186.98 (2,494.15)
7 NET SURPLUS / (DEFICIT) FOR THE YEAR (G = E + F) 1,907.82 (1,412.08)
7.1 Add : Balance Transfer from Unrealised Appreciation Reserve – 2,494.15 7.2 Less : Balance Transfer to Unrealised Appreciation Reserve (1,186.98) –7.3 Add / (Less) : Equalisation (1,158.86) (1,098.03)7.4 Transfer from Reserve Fund 2,310.53 2,326.49 7.5 Transfer from Unit Premium Reserve – –
8 Total 1,872.51 2,310.53 9 Dividend Appropriation9.1 Income Distributed during the Year – –9.2 Tax on Income Distributed during the Year – –10 Retained Surplus / (Deficit) Carried Forward to Balance Sheet 1,872.51 2,310.53
Notes to Accounts - Annexure I

23
HSBC Managed Solutions
key Statistics for the year ended March 31, 2021
HSBC MANAGED SOLUTIONS INDIA – GROWTH
Current Year ended
March 31, 2021
Previous Year ended
March 31, 2020
1. NAV per unit (Rs.):
Open
Regular Plan Growth Option 14.2510 17.9487
Regular Plan IDCW Option 14.2510 17.9487
Direct Plan - Growth Option 14.4912 18.1888
Direct Plan - IDCW Option 14.4912 18.1888
High
Regular Plan Growth Option 23.5012 18.9716
Regular Plan IDCW Option 23.5012 18.9716
Direct Plan - Growth Option 23.9725 19.2819
Direct Plan - IDCW Option 23.9725 19.2819
Low
Regular Plan Growth Option 13.6945 13.0740
Regular Plan IDCW Option 13.6945 13.0740
Direct Plan - Growth Option 13.9257 13.2933
Direct Plan - IDCW Option 13.9257 13.2933
End
Regular Plan Growth Option 22.7661 14.2510
Regular Plan IDCW Option 22.7661 14.2510
Direct Plan - Growth Option 23.2324 14.4912
Direct Plan - IDCW Option 23.2324 14.4912
2. Closing Assets Under Management (Rs. in Lakhs)
End 4,030 5,115
Average (AAuM)1 4,030 8,469
3. Gross income as % of AAuM2 18.40% 13.28%
4. Expense Ratio:
a. Total Expense as % of AAuM (including GST on Management fees) (planwise)
Regular Plan (Continue) 0.53% 0.53%
Direct Plan 0.17% 0.19%
b. Management Fee as % of AAuM (planwise)
Regular Plan (Continue) 0.07% 0.08%
Direct Plan 0.03% 0.05%
5. Net Income as a percentage of AAuM3 17.89% 12.78%
6. Portfolio turnover ratio4 0.12 0.06
7. Total Dividend per unit distributed during the period (planwise)
Retail
Regular Plan IDCW Option – –
Direct Plan - IDCW Option – –
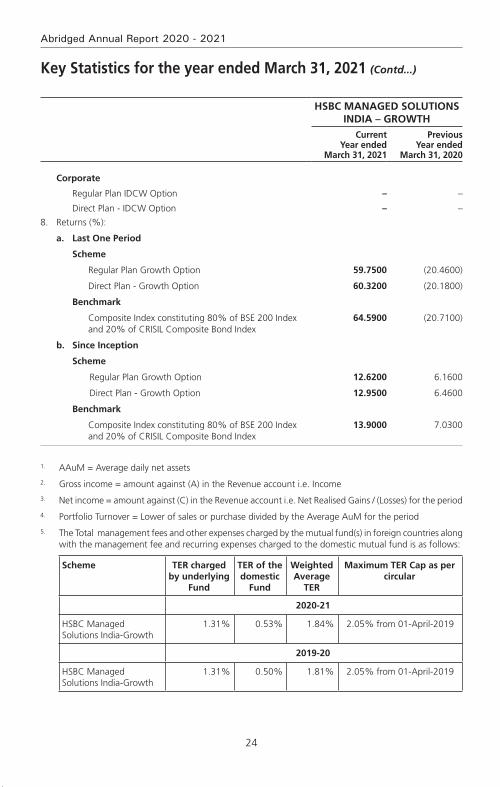
24
Abridged Annual Report 2020 - 2021
key Statistics for the year ended March 31, 2021 (Contd...)
HSBC MANAGED SOLUTIONS INDIA – GROWTH
Current Year ended
March 31, 2021
Previous Year ended
March 31, 2020
Corporate
Regular Plan IDCW Option – –
Direct Plan - IDCW Option – –
8. Returns (%):
a. Last One Period
Scheme
Regular Plan Growth Option 59.7500 (20.4600)
Direct Plan - Growth Option 60.3200 (20.1800)
Benchmark
Composite Index constituting 80% of BSE 200 Index and 20% of CRISIL Composite Bond Index
64.5900 (20.7100)
b. Since Inception
Scheme
Regular Plan Growth Option 12.6200 6.1600
Direct Plan - Growth Option 12.9500 6.4600
Benchmark
Composite Index constituting 80% of BSE 200 Index and 20% of CRISIL Composite Bond Index
13.9000 7.0300
1. AAuM = Average daily net assets
2. Gross income = amount against (A) in the Revenue account i.e. Income
3. Net income = amount against (C) in the Revenue account i.e. Net Realised Gains / (Losses) for the period
4. Portfolio Turnover = Lower of sales or purchase divided by the Average AuM for the period
5. The Total management fees and other expenses charged by the mutual fund(s) in foreign countries along with the management fee and recurring expenses charged to the domestic mutual fund is as follows:
Scheme TER charged by underlying
Fund
TER of the domestic
Fund
Weighted Average
TER
Maximum TER Cap as per circular
2020-21
HSBC Managed Solutions India-Growth
1.31% 0.53% 1.84% 2.05% from 01-April-2019
2019-20
HSBC Managed Solutions India-Growth
1.31% 0.50% 1.81% 2.05% from 01-April-2019
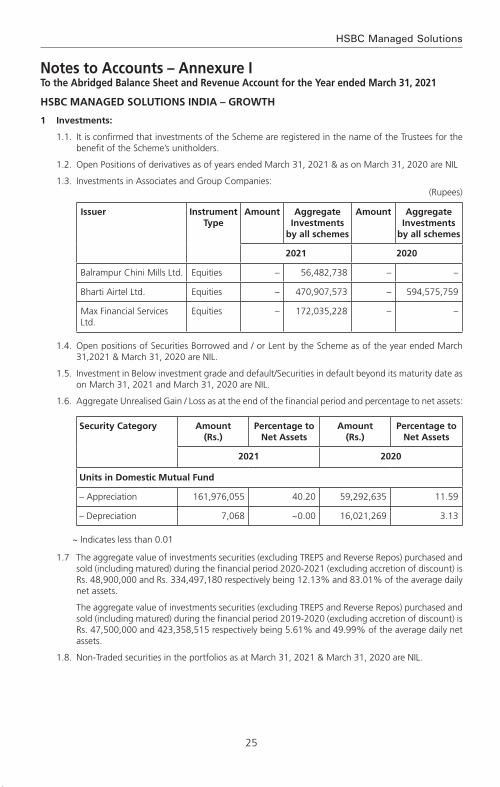
25
HSBC Managed Solutions
Notes to Accounts – Annexure ITo the Abridged Balance Sheet and Revenue Account for the Year ended March 31, 2021
HSBC MANAGED SOLUTIONS INDIA – GROWTH
1 Investments:
1.1. It is confirmed that investments of the Scheme are registered in the name of the Trustees for the benefit of the Scheme’s unitholders.
1.2. Open Positions of derivatives as of years ended March 31, 2021 & as on March 31, 2020 are NIL
1.3. Investments in Associates and Group Companies:(Rupees)
Issuer Instrument Type
Amount Aggregate Investments
by all schemes
Amount Aggregate Investments
by all schemes
2021 2020
Balrampur Chini Mills Ltd. Equities – 56,482,738 – –
Bharti Airtel Ltd. Equities – 470,907,573 – 594,575,759
Max Financial Services Ltd.
Equities – 172,035,228 – –
1.4. Open positions of Securities Borrowed and / or Lent by the Scheme as of the year ended March 31,2021 & March 31, 2020 are NIL.
1.5. Investment in Below investment grade and default/Securities in default beyond its maturity date as on March 31, 2021 and March 31, 2020 are NIL.
1.6. Aggregate Unrealised Gain / Loss as at the end of the financial period and percentage to net assets:
Security Category Amount (Rs.)
Percentage to Net Assets
Amount (Rs.)
Percentage to Net Assets
2021 2020
Units in Domestic Mutual Fund
– Appreciation 161,976,055 40.20 59,292,635 11.59
– Depreciation 7,068 ~0.00 16,021,269 3.13
~ Indicates less than 0.01
1.7 The aggregate value of investments securities (excluding TREPS and Reverse Repos) purchased and sold (including matured) during the financial period 2020-2021 (excluding accretion of discount) is Rs. 48,900,000 and Rs. 334,497,180 respectively being 12.13% and 83.01% of the average daily net assets.
The aggregate value of investments securities (excluding TREPS and Reverse Repos) purchased and sold (including matured) during the financial period 2019-2020 (excluding accretion of discount) is Rs. 47,500,000 and 423,358,515 respectively being 5.61% and 49.99% of the average daily net assets.
1.8. Non-Traded securities in the portfolios as at March 31, 2021 & March 31, 2020 are NIL.
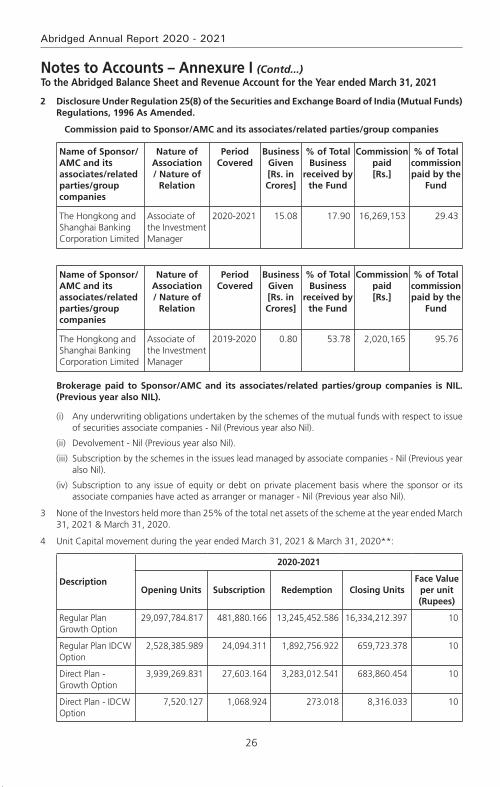
26
Abridged Annual Report 2020 - 2021
2 Disclosure Under Regulation 25(8) of the Securities and Exchange Board of India (Mutual Funds) Regulations, 1996 As Amended.
Commission paid to Sponsor/AMC and its associates/related parties/group companies
Name of Sponsor/AMC and its associates/related parties/group companies
Nature of Association / Nature of
Relation
Period Covered
Business Given [Rs. in Crores]
% of Total Business
received by the Fund
Commission paid [Rs.]
% of Total commission paid by the
Fund
The Hongkong and Shanghai Banking Corporation Limited
Associate of the Investment Manager
2020-2021 15.08 17.90 16,269,153 29.43
Name of Sponsor/AMC and its associates/related parties/group companies
Nature of Association / Nature of
Relation
Period Covered
Business Given [Rs. in Crores]
% of Total Business
received by the Fund
Commission paid [Rs.]
% of Total commission paid by the
Fund
The Hongkong and Shanghai Banking Corporation Limited
Associate of the Investment Manager
2019-2020 0.80 53.78 2,020,165 95.76
Brokerage paid to Sponsor/AMC and its associates/related parties/group companies is NIL. (Previous year also NIL).
(i) Any underwriting obligations undertaken by the schemes of the mutual funds with respect to issue of securities associate companies - Nil (Previous year also Nil).
(ii) Devolvement - Nil (Previous year also Nil).
(iii) Subscription by the schemes in the issues lead managed by associate companies - Nil (Previous year also Nil).
(iv) Subscription to any issue of equity or debt on private placement basis where the sponsor or its associate companies have acted as arranger or manager - Nil (Previous year also Nil).
3 None of the Investors held more than 25% of the total net assets of the scheme at the year ended March 31, 2021 & March 31, 2020.
4 Unit Capital movement during the year ended March 31, 2021 & March 31, 2020**:
Description
2020-2021
Opening Units Subscription Redemption Closing UnitsFace value
per unit (Rupees)
Regular Plan Growth Option
29,097,784.817 481,880.166 13,245,452.586 16,334,212.397 10
Regular Plan IDCW Option
2,528,385.989 24,094.311 1,892,756.922 659,723.378 10
Direct Plan - Growth Option
3,939,269.831 27,603.164 3,283,012.541 683,860.454 10
Direct Plan - IDCW Option
7,520.127 1,068.924 273.018 8,316.033 10
Notes to Accounts – Annexure I (Contd...)To the Abridged Balance Sheet and Revenue Account for the Year ended March 31, 2021
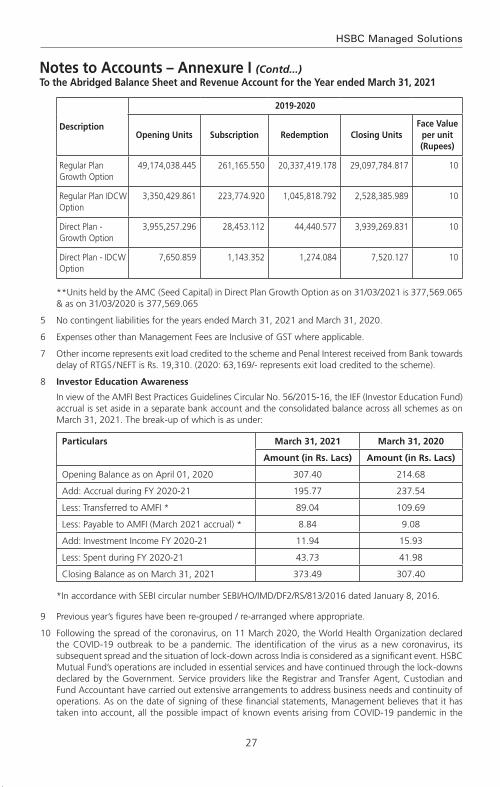
27
HSBC Managed Solutions
Description
2019-2020
Opening Units Subscription Redemption Closing UnitsFace value
per unit (Rupees)
Regular Plan Growth Option
49,174,038.445 261,165.550 20,337,419.178 29,097,784.817 10
Regular Plan IDCW Option
3,350,429.861 223,774.920 1,045,818.792 2,528,385.989 10
Direct Plan - Growth Option
3,955,257.296 28,453.112 44,440.577 3,939,269.831 10
Direct Plan - IDCW Option
7,650.859 1,143.352 1,274.084 7,520.127 10
**Units held by the AMC (Seed Capital) in Direct Plan Growth Option as on 31/03/2021 is 377,569.065 & as on 31/03/2020 is 377,569.065
5 No contingent liabilities for the years ended March 31, 2021 and March 31, 2020.
6 Expenses other than Management Fees are Inclusive of GST where applicable.
7 Other income represents exit load credited to the scheme and Penal Interest received from Bank towards delay of RTGS / NEFT is Rs. 19,310. (2020: 63,169/- represents exit load credited to the scheme).
8 Investor Education Awareness
In view of the AMFI Best Practices Guidelines Circular No. 56/2015-16, the IEF (Investor Education Fund) accrual is set aside in a separate bank account and the consolidated balance across all schemes as on March 31, 2021. The break-up of which is as under:
Particulars March 31, 2021 March 31, 2020
Amount (in Rs. Lacs) Amount (in Rs. Lacs)
Opening Balance as on April 01, 2020 307.40 214.68
Add: Accrual during FY 2020-21 195.77 237.54
Less: Transferred to AMFI * 89.04 109.69
Less: Payable to AMFI (March 2021 accrual) * 8.84 9.08
Add: Investment Income FY 2020-21 11.94 15.93
Less: Spent during FY 2020-21 43.73 41.98
Closing Balance as on March 31, 2021 373.49 307.40
*In accordance with SEBI circular number SEBI/HO/IMD/DF2/RS/813/2016 dated January 8, 2016.
9 Previous year’s figures have been re-grouped / re-arranged where appropriate.
10 Following the spread of the coronavirus, on 11 March 2020, the World Health Organization declared the COVID-19 outbreak to be a pandemic. The identification of the virus as a new coronavirus, its subsequent spread and the situation of lock-down across India is considered as a significant event. HSBC Mutual Fund’s operations are included in essential services and have continued through the lock-downs declared by the Government. Service providers like the Registrar and Transfer Agent, Custodian and Fund Accountant have carried out extensive arrangements to address business needs and continuity of operations. As on the date of signing of these financial statements, Management believes that it has taken into account, all the possible impact of known events arising from COVID-19 pandemic in the
Notes to Accounts – Annexure I (Contd...)To the Abridged Balance Sheet and Revenue Account for the Year ended March 31, 2021
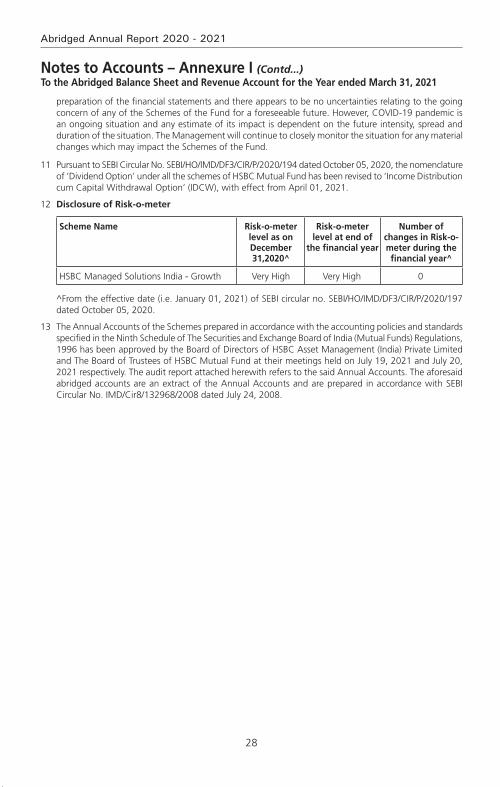
28
Abridged Annual Report 2020 - 2021
preparation of the financial statements and there appears to be no uncertainties relating to the going concern of any of the Schemes of the Fund for a foreseeable future. However, COVID-19 pandemic is an ongoing situation and any estimate of its impact is dependent on the future intensity, spread and duration of the situation. The Management will continue to closely monitor the situation for any material changes which may impact the Schemes of the Fund.
11 Pursuant to SEBI Circular No. SEBI/HO/IMD/DF3/CIR/P/2020/194 dated October 05, 2020, the nomenclature of ‘Dividend Option’ under all the schemes of HSBC Mutual Fund has been revised to ‘Income Distribution cum Capital Withdrawal Option’ (IDCW), with effect from April 01, 2021.
12 Disclosure of Risk-o-meter
Scheme Name Risk-o-meter level as on December 31,2020^
Risk-o-meter level at end of
the financial year
Number of changes in Risk-o-meter during the financial year^
HSBC Managed Solutions India - Growth Very High Very High 0
^From the effective date (i.e. January 01, 2021) of SEBI circular no. SEBI/HO/IMD/DF3/CIR/P/2020/197 dated October 05, 2020.
13 The Annual Accounts of the Schemes prepared in accordance with the accounting policies and standards specified in the Ninth Schedule of The Securities and Exchange Board of India (Mutual Funds) Regulations, 1996 has been approved by the Board of Directors of HSBC Asset Management (India) Private Limited and The Board of Trustees of HSBC Mutual Fund at their meetings held on July 19, 2021 and July 20, 2021 respectively. The audit report attached herewith refers to the said Annual Accounts. The aforesaid abridged accounts are an extract of the Annual Accounts and are prepared in accordance with SEBI Circular No. IMD/Cir8/132968/2008 dated July 24, 2008.
Notes to Accounts – Annexure I (Contd...)To the Abridged Balance Sheet and Revenue Account for the Year ended March 31, 2021

29
HSBC Managed Solutions
Rs. in Lakhs
HSBC MANAGED SOLUTIONS INDIA – MODERATEAs at
March 31, 2021As at
March 31, 2020
LIABILITIES1 Unit Capital 3,221.82 6,454.48 2 Reserves & Surplus2.1 Unit Premium Reserves (1,889.67) (1,573.42)2.2 Unrealised Appreciation Reserve 2,605.66 1,032.63 2.3 Other Reserves 2,930.99 3,432.28 3 Loans & Borrowings – – 4 Current Liabilities & Provisions4.1 Provision for Doubtful Income/Deposits – –4.2 Other Current Liabilities & Provisions 24.37 343.43
TOTAL 6,893.17 9,689.40
ASSETS1 Investments1.1 Listed Securities:1.1.1 Equity Shares – – 1.1.2 Preference Shares – – 1.1.3 Equity Linked Debentures – – 1.1.4 Other Debentures & Bonds – – 1.1.5 Securitised Debt Securities – – 1.2 Securities Awaited Listing:1.2.1 Equity Shares – – 1.2.2 Preference Shares – – 1.2.3 Equity Linked Debentures – – 1.2.4 Other Debentures & Bonds – – 1.2.5 Securitised Debt Securities – – 1.3 Unlisted Securities:1.3.1 Equity Shares – – 1.3.2 Preference Shares – – 1.3.3 Equity Linked Debentures – – 1.3.4 Other Debentures & Bonds – – 1.3.5 Securitised Debt Securities – – 1.4 Government Securities – – 1.5 Treasury Bills – – 1.6 Commercial Paper – – 1.7 Certificate of Deposits – – 1.8 Bill Rediscounting – – 1.9 Units of Domestic Mutual Fund 6,834.48 9,306.03 1.10 Foreign Securities – –
Total Investments 6,834.48 9,306.03
2 Deposits 1.68 1.50 3 Other Current Assets3.1 Cash & Bank Balance 0.03 0.15 3.2 TREPS / Reverse Repo Lending 56.37 351.71 3.3 Others 0.61 30.01 4 Deferred Revenue Expenditure (to the extent not written off) – –
TOTAL 6,893.17 9,689.40
Notes to Accounts - Annexure I
Abridged Balance Sheet as at March 31, 2021
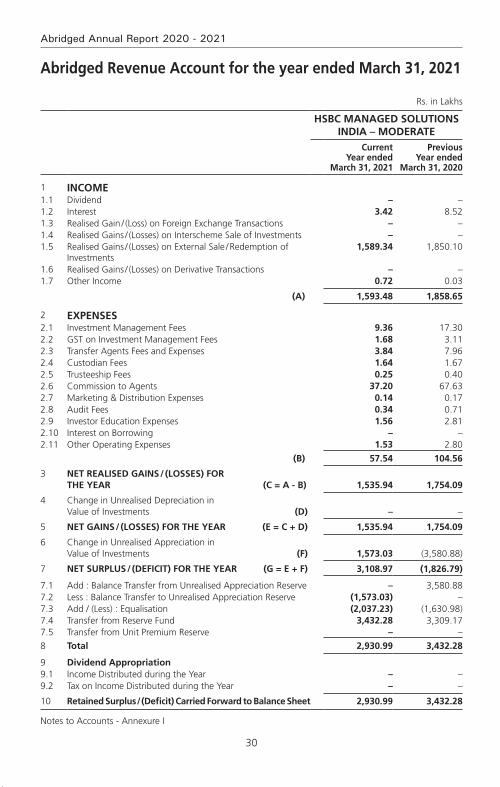
30
Abridged Annual Report 2020 - 2021
Abridged Revenue Account for the year ended March 31, 2021
Rs. in Lakhs
HSBC MANAGED SOLUTIONS INDIA – MODERATE
Current Year ended
March 31, 2021
Previous Year ended
March 31, 2020
1 INCOME1.1 Dividend – – 1.2 Interest 3.42 8.52 1.3 Realised Gain / (Loss) on Foreign Exchange Transactions – – 1.4 Realised Gains / (Losses) on Interscheme Sale of Investments – – 1.5 Realised Gains / (Losses) on External Sale / Redemption of
Investments 1,589.34 1,850.10
1.6 Realised Gains / (Losses) on Derivative Transactions – – 1.7 Other Income 0.72 0.03
(A) 1,593.48 1,858.65
2 ExPENSES2.1 Investment Management Fees 9.36 17.30 2.2 GST on Investment Management Fees 1.68 3.11 2.3 Transfer Agents Fees and Expenses 3.84 7.96 2.4 Custodian Fees 1.64 1.67 2.5 Trusteeship Fees 0.25 0.40 2.6 Commission to Agents 37.20 67.63 2.7 Marketing & Distribution Expenses 0.14 0.17 2.8 Audit Fees 0.34 0.71 2.9 Investor Education Expenses 1.56 2.81 2.10 Interest on Borrowing – –2.11 Other Operating Expenses 1.53 2.80
(B) 57.54 104.56
3 NET REALISED GAINS / (LOSSES) FOR THE YEAR (C = A - B) 1,535.94 1,754.09
4 Change in Unrealised Depreciation in Value of Investments (D) – –
5 NET GAINS / (LOSSES) FOR THE YEAR (E = C + D) 1,535.94 1,754.09
6 Change in Unrealised Appreciation in Value of Investments (F) 1,573.03 (3,580.88)
7 NET SURPLUS / (DEFICIT) FOR THE YEAR (G = E + F) 3,108.97 (1,826.79)
7.1 Add : Balance Transfer from Unrealised Appreciation Reserve – 3,580.88 7.2 Less : Balance Transfer to Unrealised Appreciation Reserve (1,573.03) –7.3 Add / (Less) : Equalisation (2,037.23) (1,630.98)7.4 Transfer from Reserve Fund 3,432.28 3,309.17 7.5 Transfer from Unit Premium Reserve – –
8 Total 2,930.99 3,432.28
9 Dividend Appropriation9.1 Income Distributed during the Year – –9.2 Tax on Income Distributed during the Year – –
10 Retained Surplus / (Deficit) Carried Forward to Balance Sheet 2,930.99 3,432.28
Notes to Accounts - Annexure I
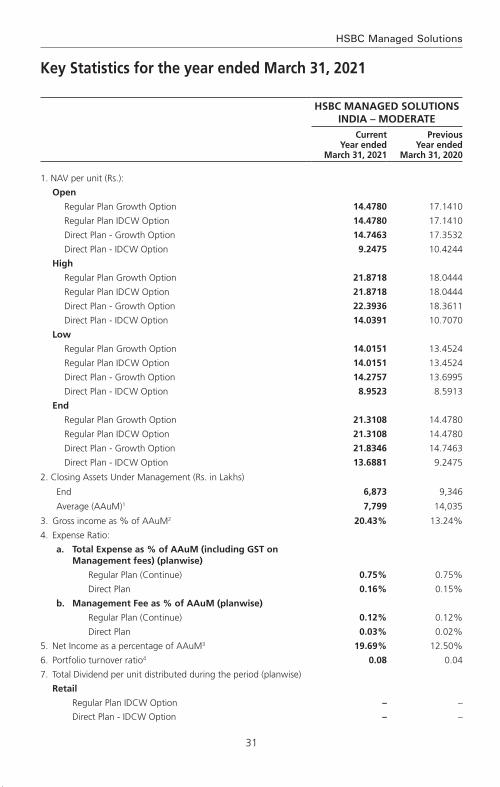
31
HSBC Managed Solutions
key Statistics for the year ended March 31, 2021
HSBC MANAGED SOLUTIONS INDIA – MODERATE
Current Year ended
March 31, 2021
Previous Year ended
March 31, 2020
1. NAV per unit (Rs.):
Open
Regular Plan Growth Option 14.4780 17.1410
Regular Plan IDCW Option 14.4780 17.1410
Direct Plan - Growth Option 14.7463 17.3532
Direct Plan - IDCW Option 9.2475 10.4244
High
Regular Plan Growth Option 21.8718 18.0444
Regular Plan IDCW Option 21.8718 18.0444
Direct Plan - Growth Option 22.3936 18.3611
Direct Plan - IDCW Option 14.0391 10.7070
Low
Regular Plan Growth Option 14.0151 13.4524
Regular Plan IDCW Option 14.0151 13.4524
Direct Plan - Growth Option 14.2757 13.6995
Direct Plan - IDCW Option 8.9523 8.5913
End
Regular Plan Growth Option 21.3108 14.4780
Regular Plan IDCW Option 21.3108 14.4780
Direct Plan - Growth Option 21.8346 14.7463
Direct Plan - IDCW Option 13.6881 9.2475
2. Closing Assets Under Management (Rs. in Lakhs)
End 6,873 9,346
Average (AAuM)1 7,799 14,035
3. Gross income as % of AAuM2 20.43% 13.24%
4. Expense Ratio:
a. Total Expense as % of AAuM (including GST on Management fees) (planwise)
Regular Plan (Continue) 0.75% 0.75%
Direct Plan 0.16% 0.15%
b. Management Fee as % of AAuM (planwise)
Regular Plan (Continue) 0.12% 0.12%
Direct Plan 0.03% 0.02%
5. Net Income as a percentage of AAuM3 19.69% 12.50%
6. Portfolio turnover ratio4 0.08 0.04
7. Total Dividend per unit distributed during the period (planwise)
Retail
Regular Plan IDCW Option – –
Direct Plan - IDCW Option – –
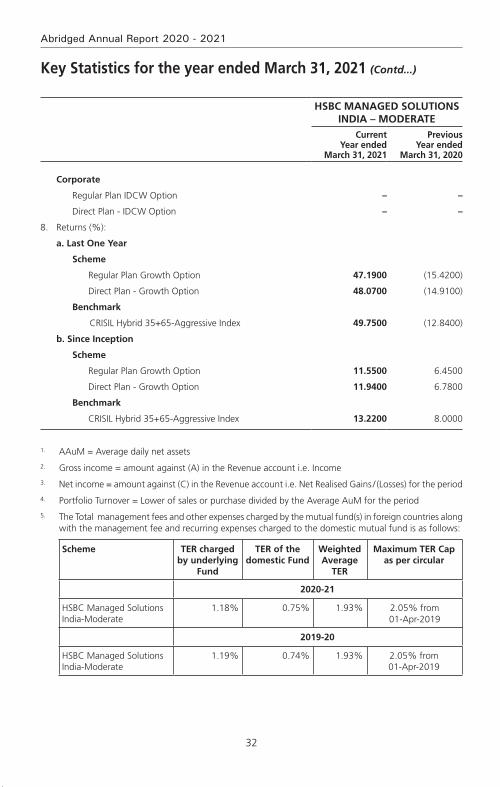
32
Abridged Annual Report 2020 - 2021
HSBC MANAGED SOLUTIONS INDIA – MODERATE
Current Year ended
March 31, 2021
Previous Year ended
March 31, 2020
Corporate
Regular Plan IDCW Option – –
Direct Plan - IDCW Option – –
8. Returns (%):
a. Last One Year
Scheme
Regular Plan Growth Option 47.1900 (15.4200)
Direct Plan - Growth Option 48.0700 (14.9100)
Benchmark
CRISIL Hybrid 35+65-Aggressive Index 49.7500 (12.8400)
b. Since Inception
Scheme
Regular Plan Growth Option 11.5500 6.4500
Direct Plan - Growth Option 11.9400 6.7800
Benchmark
CRISIL Hybrid 35+65-Aggressive Index 13.2200 8.0000
1. AAuM = Average daily net assets
2. Gross income = amount against (A) in the Revenue account i.e. Income
3. Net income = amount against (C) in the Revenue account i.e. Net Realised Gains / (Losses) for the period
4. Portfolio Turnover = Lower of sales or purchase divided by the Average AuM for the period
5. The Total management fees and other expenses charged by the mutual fund(s) in foreign countries along with the management fee and recurring expenses charged to the domestic mutual fund is as follows:
Scheme TER charged by underlying
Fund
TER of the domestic Fund
Weighted Average
TER
Maximum TER Cap as per circular
2020-21
HSBC Managed Solutions India-Moderate
1.18% 0.75% 1.93% 2.05% from 01-Apr-2019
2019-20
HSBC Managed Solutions India-Moderate
1.19% 0.74% 1.93% 2.05% from 01-Apr-2019
key Statistics for the year ended March 31, 2021 (Contd...)
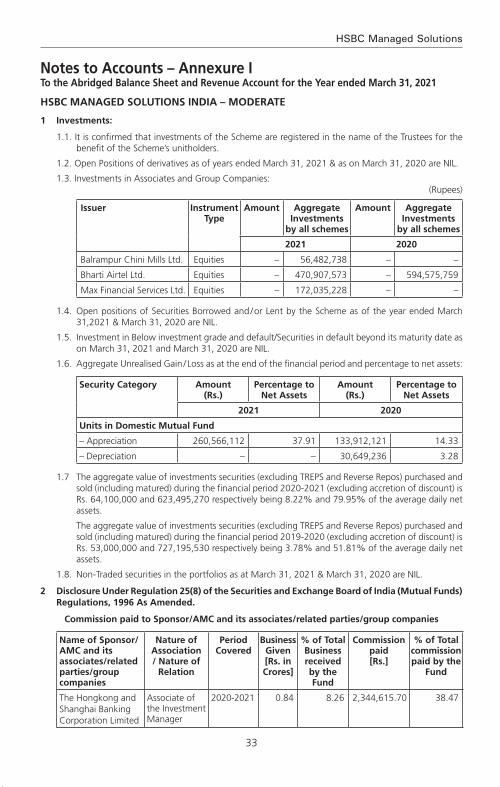
33
HSBC Managed Solutions
Notes to Accounts – Annexure ITo the Abridged Balance Sheet and Revenue Account for the Year ended March 31, 2021
HSBC MANAGED SOLUTIONS INDIA – MODERATE
1 Investments:
1.1. It is confirmed that investments of the Scheme are registered in the name of the Trustees for the benefit of the Scheme’s unitholders.
1.2. Open Positions of derivatives as of years ended March 31, 2021 & as on March 31, 2020 are NIL.
1.3. Investments in Associates and Group Companies:(Rupees)
Issuer Instrument Type
Amount Aggregate Investments
by all schemes
Amount Aggregate Investments
by all schemes
2021 2020
Balrampur Chini Mills Ltd. Equities – 56,482,738 – –
Bharti Airtel Ltd. Equities – 470,907,573 – 594,575,759
Max Financial Services Ltd. Equities – 172,035,228 – –
1.4. Open positions of Securities Borrowed and / or Lent by the Scheme as of the year ended March 31,2021 & March 31, 2020 are NIL.
1.5. Investment in Below investment grade and default/Securities in default beyond its maturity date as on March 31, 2021 and March 31, 2020 are NIL.
1.6. Aggregate Unrealised Gain / Loss as at the end of the financial period and percentage to net assets:
Security Category Amount (Rs.)
Percentage to Net Assets
Amount (Rs.)
Percentage to Net Assets
2021 2020
Units in Domestic Mutual Fund
– Appreciation 260,566,112 37.91 133,912,121 14.33
– Depreciation – – 30,649,236 3.28
1.7 The aggregate value of investments securities (excluding TREPS and Reverse Repos) purchased and sold (including matured) during the financial period 2020-2021 (excluding accretion of discount) is Rs. 64,100,000 and 623,495,270 respectively being 8.22% and 79.95% of the average daily net assets.
The aggregate value of investments securities (excluding TREPS and Reverse Repos) purchased and sold (including matured) during the financial period 2019-2020 (excluding accretion of discount) is Rs. 53,000,000 and 727,195,530 respectively being 3.78% and 51.81% of the average daily net assets.
1.8. Non-Traded securities in the portfolios as at March 31, 2021 & March 31, 2020 are NIL.
2 Disclosure Under Regulation 25(8) of the Securities and Exchange Board of India (Mutual Funds) Regulations, 1996 As Amended.
Commission paid to Sponsor/AMC and its associates/related parties/group companies
Name of Sponsor/AMC and its associates/related parties/group companies
Nature of Association / Nature of
Relation
Period Covered
Business Given [Rs. in Crores]
% of Total Business received by the Fund
Commission paid [Rs.]
% of Total commission paid by the
Fund
The Hongkong and Shanghai Banking Corporation Limited
Associate of the Investment Manager
2020-2021 0.84 8.26 2,344,615.70 38.47
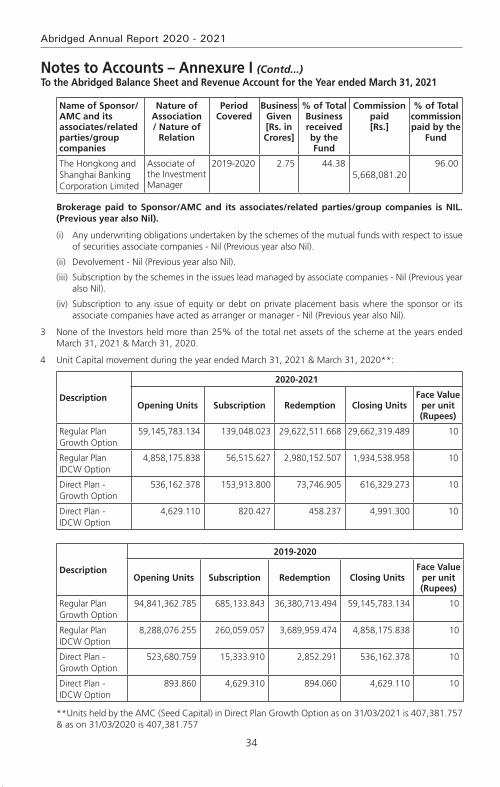
34
Abridged Annual Report 2020 - 2021
Name of Sponsor/AMC and its associates/related parties/group companies
Nature of Association / Nature of
Relation
Period Covered
Business Given [Rs. in Crores]
% of Total Business received by the Fund
Commission paid [Rs.]
% of Total commission paid by the
Fund
The Hongkong and Shanghai Banking Corporation Limited
Associate of the Investment Manager
2019-2020 2.75 44.38 5,668,081.20
96.00
Brokerage paid to Sponsor/AMC and its associates/related parties/group companies is NIL. (Previous year also Nil).
(i) Any underwriting obligations undertaken by the schemes of the mutual funds with respect to issue of securities associate companies - Nil (Previous year also Nil).
(ii) Devolvement - Nil (Previous year also Nil).
(iii) Subscription by the schemes in the issues lead managed by associate companies - Nil (Previous year also Nil).
(iv) Subscription to any issue of equity or debt on private placement basis where the sponsor or its associate companies have acted as arranger or manager - Nil (Previous year also Nil).
3 None of the Investors held more than 25% of the total net assets of the scheme at the years ended March 31, 2021 & March 31, 2020.
4 Unit Capital movement during the year ended March 31, 2021 & March 31, 2020**:
Description
2020-2021
Opening Units Subscription Redemption Closing UnitsFace value
per unit (Rupees)
Regular Plan Growth Option
59,145,783.134 139,048.023 29,622,511.668 29,662,319.489 10
Regular Plan IDCW Option
4,858,175.838 56,515.627 2,980,152.507 1,934,538.958 10
Direct Plan - Growth Option
536,162.378 153,913.800 73,746.905 616,329.273 10
Direct Plan - IDCW Option
4,629.110 820.427 458.237 4,991.300 10
Description
2019-2020
Opening Units Subscription Redemption Closing UnitsFace value
per unit (Rupees)
Regular Plan Growth Option
94,841,362.785 685,133.843 36,380,713.494 59,145,783.134 10
Regular Plan IDCW Option
8,288,076.255 260,059.057 3,689,959.474 4,858,175.838 10
Direct Plan - Growth Option
523,680.759 15,333.910 2,852.291 536,162.378 10
Direct Plan - IDCW Option
893.860 4,629.310 894.060 4,629.110 10
**Units held by the AMC (Seed Capital) in Direct Plan Growth Option as on 31/03/2021 is 407,381.757 & as on 31/03/2020 is 407,381.757
Notes to Accounts – Annexure I (Contd...)To the Abridged Balance Sheet and Revenue Account for the Year ended March 31, 2021
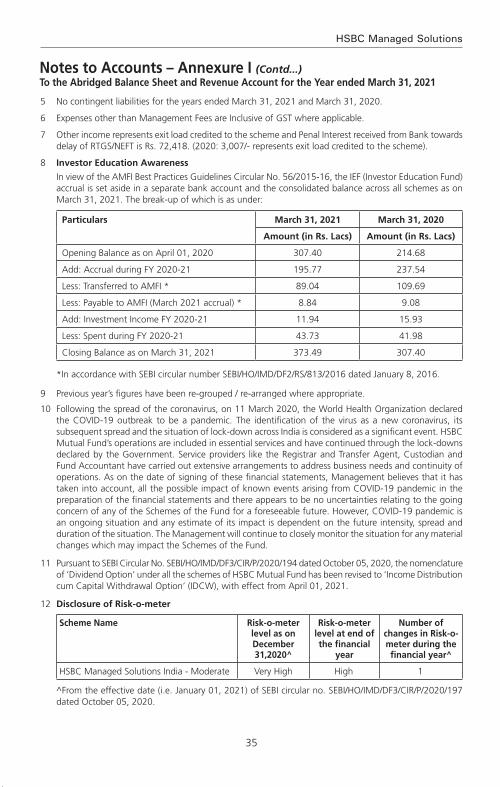
35
HSBC Managed Solutions
5 No contingent liabilities for the years ended March 31, 2021 and March 31, 2020.
6 Expenses other than Management Fees are Inclusive of GST where applicable.
7 Other income represents exit load credited to the scheme and Penal Interest received from Bank towards delay of RTGS/NEFT is Rs. 72,418. (2020: 3,007/- represents exit load credited to the scheme).
8 Investor Education Awareness
In view of the AMFI Best Practices Guidelines Circular No. 56/2015-16, the IEF (Investor Education Fund) accrual is set aside in a separate bank account and the consolidated balance across all schemes as on March 31, 2021. The break-up of which is as under:
Particulars March 31, 2021 March 31, 2020
Amount (in Rs. Lacs) Amount (in Rs. Lacs)
Opening Balance as on April 01, 2020 307.40 214.68
Add: Accrual during FY 2020-21 195.77 237.54
Less: Transferred to AMFI * 89.04 109.69
Less: Payable to AMFI (March 2021 accrual) * 8.84 9.08
Add: Investment Income FY 2020-21 11.94 15.93
Less: Spent during FY 2020-21 43.73 41.98
Closing Balance as on March 31, 2021 373.49 307.40
*In accordance with SEBI circular number SEBI/HO/IMD/DF2/RS/813/2016 dated January 8, 2016.
9 Previous year’s figures have been re-grouped / re-arranged where appropriate.
10 Following the spread of the coronavirus, on 11 March 2020, the World Health Organization declared the COVID-19 outbreak to be a pandemic. The identification of the virus as a new coronavirus, its subsequent spread and the situation of lock-down across India is considered as a significant event. HSBC Mutual Fund’s operations are included in essential services and have continued through the lock-downs declared by the Government. Service providers like the Registrar and Transfer Agent, Custodian and Fund Accountant have carried out extensive arrangements to address business needs and continuity of operations. As on the date of signing of these financial statements, Management believes that it has taken into account, all the possible impact of known events arising from COVID-19 pandemic in the preparation of the financial statements and there appears to be no uncertainties relating to the going concern of any of the Schemes of the Fund for a foreseeable future. However, COVID-19 pandemic is an ongoing situation and any estimate of its impact is dependent on the future intensity, spread and duration of the situation. The Management will continue to closely monitor the situation for any material changes which may impact the Schemes of the Fund.
11 Pursuant to SEBI Circular No. SEBI/HO/IMD/DF3/CIR/P/2020/194 dated October 05, 2020, the nomenclature of ‘Dividend Option’ under all the schemes of HSBC Mutual Fund has been revised to ‘Income Distribution cum Capital Withdrawal Option’ (IDCW), with effect from April 01, 2021.
12 Disclosure of Risk-o-meter
Scheme Name Risk-o-meter level as on December 31,2020^
Risk-o-meter level at end of the financial
year
Number of changes in Risk-o-meter during the financial year^
HSBC Managed Solutions India - Moderate Very High High 1
^From the effective date (i.e. January 01, 2021) of SEBI circular no. SEBI/HO/IMD/DF3/CIR/P/2020/197 dated October 05, 2020.
Notes to Accounts – Annexure I (Contd...)To the Abridged Balance Sheet and Revenue Account for the Year ended March 31, 2021

36
Abridged Annual Report 2020 - 2021
13 The Annual Accounts of the Schemes prepared in accordance with the accounting policies and standards specified in the Ninth Schedule of The Securities and Exchange Board of India (Mutual Funds) Regulations, 1996 has been approved by the Board of Directors of HSBC Asset Management (India) Private Limited and The Board of Trustees of HSBC Mutual Fund at their meetings held on July 19, 2021 and July 20, 2021 respectively. The audit report attached herewith refers to the said Annual Accounts. The aforesaid abridged accounts are an extract of the Annual Accounts and are prepared in accordance with SEBI Circular No. IMD/Cir8/132968/2008 dated July 24, 2008.
Notes to Accounts – Annexure I (Contd...)To the Abridged Balance Sheet and Revenue Account for the Year ended March 31, 2021
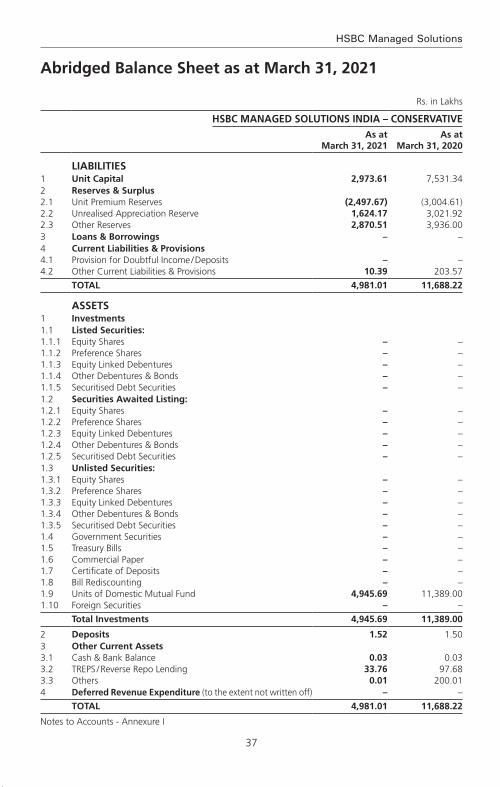
37
HSBC Managed Solutions
Rs. in Lakhs
HSBC MANAGED SOLUTIONS INDIA – CONSERvATIvEAs at
March 31, 2021As at
March 31, 2020
LIABILITIES1 Unit Capital 2,973.61 7,531.34 2 Reserves & Surplus2.1 Unit Premium Reserves (2,497.67) (3,004.61)2.2 Unrealised Appreciation Reserve 1,624.17 3,021.92 2.3 Other Reserves 2,870.51 3,936.00 3 Loans & Borrowings – –4 Current Liabilities & Provisions4.1 Provision for Doubtful Income / Deposits – –4.2 Other Current Liabilities & Provisions 10.39 203.57
TOTAL 4,981.01 11,688.22
ASSETS1 Investments1.1 Listed Securities:1.1.1 Equity Shares – – 1.1.2 Preference Shares – – 1.1.3 Equity Linked Debentures – – 1.1.4 Other Debentures & Bonds – – 1.1.5 Securitised Debt Securities – – 1.2 Securities Awaited Listing:1.2.1 Equity Shares – – 1.2.2 Preference Shares – – 1.2.3 Equity Linked Debentures – – 1.2.4 Other Debentures & Bonds – – 1.2.5 Securitised Debt Securities – – 1.3 Unlisted Securities:1.3.1 Equity Shares – – 1.3.2 Preference Shares – – 1.3.3 Equity Linked Debentures – – 1.3.4 Other Debentures & Bonds – – 1.3.5 Securitised Debt Securities – – 1.4 Government Securities – – 1.5 Treasury Bills – – 1.6 Commercial Paper – – 1.7 Certificate of Deposits – – 1.8 Bill Rediscounting – – 1.9 Units of Domestic Mutual Fund 4,945.69 11,389.00 1.10 Foreign Securities – –
Total Investments 4,945.69 11,389.00
2 Deposits 1.52 1.50 3 Other Current Assets3.1 Cash & Bank Balance 0.03 0.03 3.2 TREPS / Reverse Repo Lending 33.76 97.68 3.3 Others 0.01 200.01 4 Deferred Revenue Expenditure (to the extent not written off) – –
TOTAL 4,981.01 11,688.22
Notes to Accounts - Annexure I
Abridged Balance Sheet as at March 31, 2021
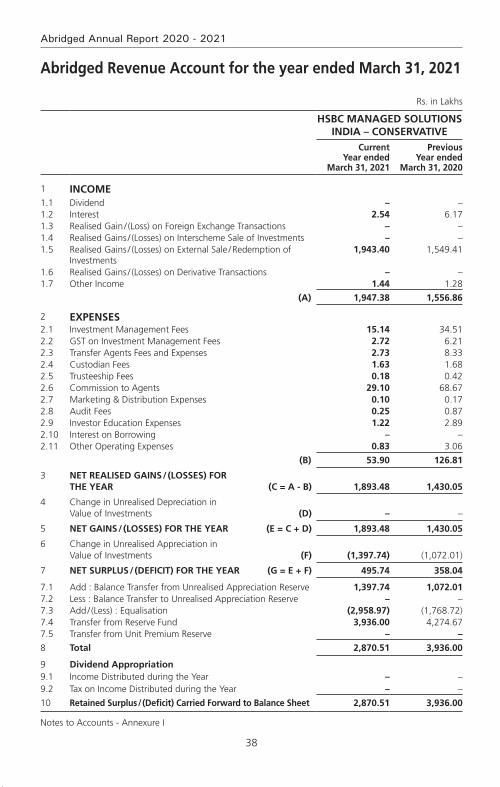
38
Abridged Annual Report 2020 - 2021
Abridged Revenue Account for the year ended March 31, 2021
Rs. in Lakhs
HSBC MANAGED SOLUTIONS INDIA – CONSERvATIvE
Current Year ended
March 31, 2021
Previous Year ended
March 31, 2020
1 INCOME1.1 Dividend – – 1.2 Interest 2.54 6.17 1.3 Realised Gain / (Loss) on Foreign Exchange Transactions – – 1.4 Realised Gains / (Losses) on Interscheme Sale of Investments – – 1.5 Realised Gains / (Losses) on External Sale / Redemption of
Investments 1,943.40 1,549.41
1.6 Realised Gains / (Losses) on Derivative Transactions – – 1.7 Other Income 1.44 1.28
(A) 1,947.38 1,556.86
2 ExPENSES2.1 Investment Management Fees 15.14 34.51 2.2 GST on Investment Management Fees 2.72 6.21 2.3 Transfer Agents Fees and Expenses 2.73 8.33 2.4 Custodian Fees 1.63 1.68 2.5 Trusteeship Fees 0.18 0.42 2.6 Commission to Agents 29.10 68.67 2.7 Marketing & Distribution Expenses 0.10 0.17 2.8 Audit Fees 0.25 0.87 2.9 Investor Education Expenses 1.22 2.89 2.10 Interest on Borrowing – – 2.11 Other Operating Expenses 0.83 3.06
(B) 53.90 126.81
3 NET REALISED GAINS / (LOSSES) FOR THE YEAR (C = A - B) 1,893.48 1,430.05
4 Change in Unrealised Depreciation in Value of Investments (D) – –
5 NET GAINS / (LOSSES) FOR THE YEAR (E = C + D) 1,893.48 1,430.05
6 Change in Unrealised Appreciation in Value of Investments (F) (1,397.74) (1,072.01)
7 NET SURPLUS / (DEFICIT) FOR THE YEAR (G = E + F) 495.74 358.04
7.1 Add : Balance Transfer from Unrealised Appreciation Reserve 1,397.74 1,072.01 7.2 Less : Balance Transfer to Unrealised Appreciation Reserve – –7.3 Add / (Less) : Equalisation (2,958.97) (1,768.72)7.4 Transfer from Reserve Fund 3,936.00 4,274.67 7.5 Transfer from Unit Premium Reserve – –
8 Total 2,870.51 3,936.00
9 Dividend Appropriation9.1 Income Distributed during the Year – – 9.2 Tax on Income Distributed during the Year – –
10 Retained Surplus / (Deficit) Carried Forward to Balance Sheet 2,870.51 3,936.00
Notes to Accounts - Annexure I

39
HSBC Managed Solutions
key Statistics for the year ended March 31, 2021
HSBC MANAGED SOLUTIONS INDIA – CONSERvATIvE
Current Year ended
March 31, 2021
Previous Year ended
March 31, 2020
1. NAV per unit (Rs.):
Open
Regular Plan Growth Option 15.2368 14.8717
Regular Plan IDCW Option 15.2368 14.8717
Direct Plan - Growth Option 15.5363 15.0559
High
Regular Plan Growth Option 16.8224 15.6127
Regular Plan IDCW Option 16.8224 15.6127
Direct Plan - Growth Option 17.2525 15.9035
Direct Plan - IDCW Option 17.2525 –
Low
Regular Plan Growth Option 14.7822 14.5537
Regular Plan IDCW Option 14.7822 14.5537
Direct Plan - Growth Option 15.0853 14.7519
Direct Plan - IDCW Option 16.8407 –
End
Regular Plan Growth Option 16.7087 15.2368
Regular Plan IDCW Option 16.7087 15.2368
Direct Plan - Growth Option 17.1655 15.5363
2. Closing Assets Under Management (Rs. in Lakhs)
End 4,971 11,491
Average (AAuM)1 6,083 14,447
3. Gross income as % of AAuM2 32.01% 10.78%
4. Expense Ratio:
a. Total Expense as % of AAuM (including GST on Management fees) (planwise)
Regular Plan (Continue) 0.90% 0.90%
Direct Plan 0.16% 0.19%
b. Management Fee as % of AAuM (planwise)
Regular Plan (Continue) 0.26% 0.25%
Direct Plan 0.06% 0.06%
5. Net Income as a percentage of AAuM3 31.13% 9.90%
6. Portfolio turnover ratio4 0.10 0.04
7. Total Dividend per unit distributed during the period (planwise)
Retail
Regular Plan IDCW Option – –
Direct Plan - IDCW Option – –

40
Abridged Annual Report 2020 - 2021
HSBC MANAGED SOLUTIONS INDIA – CONSERvATIvE
Current Year ended
March 31, 2021
Previous Year ended
March 31, 2020
Corporate
Regular Plan IDCW Option – –
Direct Plan - IDCW Option – –
8. Returns (%):
a. Last One Period
Scheme
Regular Plan Growth Option 9.6600 2.4300
Direct Plan - Growth Option 10.4900 3.1600
Benchmark
Composite Index constituting of 90% into CRISIL Composite Bond Index and 10% of BSE 200 Index
15.8700 6.1600
b. Since Inception
Scheme
Regular Plan Growth Option 7.7000 7.3700
Direct Plan - Growth Option 8.1200 7.7200
Benchmark
Composite Index constituting of 90% into CRISIL Composite Bond Index and 10% of BSE 200 Index
10.1600 9.2300
1. AAuM = Average daily net assets
2. Gross income = amount against (A) in the Revenue account i.e. Income
3. Net income = amount against (C) in the Revenue account i.e. Net Realised Gains / (Losses) for the period
4. Portfolio Turnover = Lower of sales or purchase divided by the Average AuM for the period
5. The Total management fees and other expenses charged by the mutual fund(s) in foreign countries along with the management fee and recurring expenses charged to the domestic mutual fund is as follows:
Scheme TER charged by underlying
Fund
TER of the domestic
Fund
Weighted Average
TER
Maximum TER Cap as per circular
2020-21
HSBC Managed Solutions India - Conservative
0.75% 0.90% 1.65% 2.05% from 01-Apr-2019
2019-20
HSBC Managed Solutions India - Conservative
0.77% 0.88% 1.65% 2.05% from 01-Apr-2019
key Statistics for the year ended March 31, 2021 (Contd...)
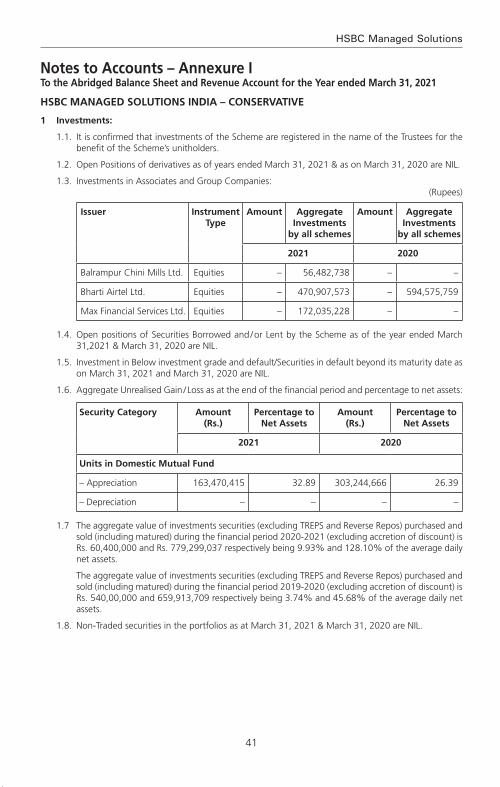
41
HSBC Managed Solutions
Notes to Accounts – Annexure ITo the Abridged Balance Sheet and Revenue Account for the Year ended March 31, 2021
HSBC MANAGED SOLUTIONS INDIA – CONSERvATIvE
1 Investments:
1.1. It is confirmed that investments of the Scheme are registered in the name of the Trustees for the benefit of the Scheme’s unitholders.
1.2. Open Positions of derivatives as of years ended March 31, 2021 & as on March 31, 2020 are NIL.
1.3. Investments in Associates and Group Companies:(Rupees)
Issuer Instrument Type
Amount Aggregate Investments
by all schemes
Amount Aggregate Investments
by all schemes
2021 2020
Balrampur Chini Mills Ltd. Equities – 56,482,738 – –
Bharti Airtel Ltd. Equities – 470,907,573 – 594,575,759
Max Financial Services Ltd. Equities – 172,035,228 – –
1.4. Open positions of Securities Borrowed and / or Lent by the Scheme as of the year ended March 31,2021 & March 31, 2020 are NIL.
1.5. Investment in Below investment grade and default/Securities in default beyond its maturity date as on March 31, 2021 and March 31, 2020 are NIL.
1.6. Aggregate Unrealised Gain / Loss as at the end of the financial period and percentage to net assets:
Security Category Amount (Rs.)
Percentage to Net Assets
Amount (Rs.)
Percentage to Net Assets
2021 2020
Units in Domestic Mutual Fund
– Appreciation 163,470,415 32.89 303,244,666 26.39
– Depreciation – – – –
1.7 The aggregate value of investments securities (excluding TREPS and Reverse Repos) purchased and sold (including matured) during the financial period 2020-2021 (excluding accretion of discount) is Rs. 60,400,000 and Rs. 779,299,037 respectively being 9.93% and 128.10% of the average daily net assets.
The aggregate value of investments securities (excluding TREPS and Reverse Repos) purchased and sold (including matured) during the financial period 2019-2020 (excluding accretion of discount) is Rs. 540,00,000 and 659,913,709 respectively being 3.74% and 45.68% of the average daily net assets.
1.8. Non-Traded securities in the portfolios as at March 31, 2021 & March 31, 2020 are NIL.
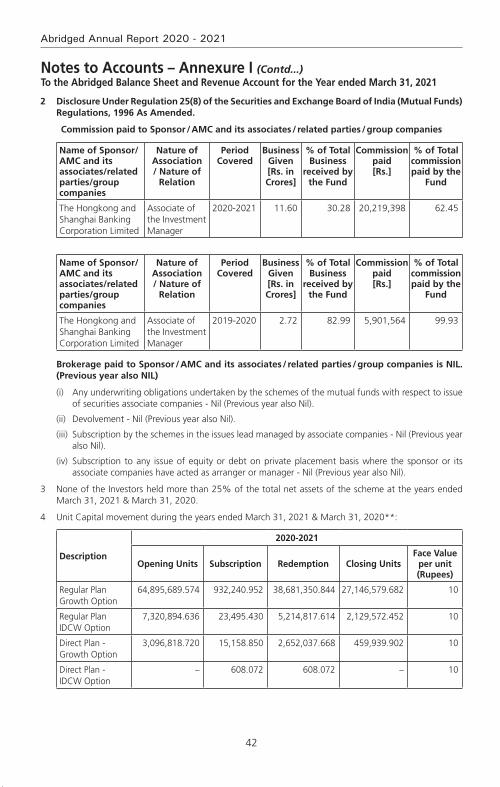
42
Abridged Annual Report 2020 - 2021
2 Disclosure Under Regulation 25(8) of the Securities and Exchange Board of India (Mutual Funds) Regulations, 1996 As Amended.
Commission paid to Sponsor / AMC and its associates / related parties / group companies
Name of Sponsor/AMC and its associates/related parties/group companies
Nature of Association / Nature of
Relation
Period Covered
Business Given [Rs. in Crores]
% of Total Business
received by the Fund
Commission paid [Rs.]
% of Total commission paid by the
Fund
The Hongkong and Shanghai Banking Corporation Limited
Associate of the Investment Manager
2020-2021 11.60 30.28 20,219,398 62.45
Name of Sponsor/AMC and its associates/related parties/group companies
Nature of Association / Nature of
Relation
Period Covered
Business Given [Rs. in Crores]
% of Total Business
received by the Fund
Commission paid [Rs.]
% of Total commission paid by the
Fund
The Hongkong and Shanghai Banking Corporation Limited
Associate of the Investment Manager
2019-2020 2.72 82.99 5,901,564 99.93
Brokerage paid to Sponsor / AMC and its associates / related parties / group companies is NIL. (Previous year also NIL)
(i) Any underwriting obligations undertaken by the schemes of the mutual funds with respect to issue of securities associate companies - Nil (Previous year also Nil).
(ii) Devolvement - Nil (Previous year also Nil).
(iii) Subscription by the schemes in the issues lead managed by associate companies - Nil (Previous year also Nil).
(iv) Subscription to any issue of equity or debt on private placement basis where the sponsor or its associate companies have acted as arranger or manager - Nil (Previous year also Nil).
3 None of the Investors held more than 25% of the total net assets of the scheme at the years ended March 31, 2021 & March 31, 2020.
4 Unit Capital movement during the years ended March 31, 2021 & March 31, 2020**:
Description
2020-2021
Opening Units Subscription Redemption Closing UnitsFace value
per unit (Rupees)
Regular Plan Growth Option
64,895,689.574 932,240.952 38,681,350.844 27,146,579.682 10
Regular Plan IDCW Option
7,320,894.636 23,495.430 5,214,817.614 2,129,572.452 10
Direct Plan - Growth Option
3,096,818.720 15,158.850 2,652,037.668 459,939.902 10
Direct Plan - IDCW Option
– 608.072 608.072 – 10
Notes to Accounts – Annexure I (Contd...)To the Abridged Balance Sheet and Revenue Account for the Year ended March 31, 2021

43
HSBC Managed Solutions
Description
2019-2020
Opening Units Subscription Redemption Closing UnitsFace value
per unit (Rupees)
Regular Plan Growth Option
100,776,578.260 1,176,586.434 37,057,475.120 64,895,689.574 10
Regular Plan IDCW Option
11,658,010.804 121,150.010 4,458,266.178 7,320,894.636 10
Direct Plan - Growth Option
3,257,090.614 2,819.250 163,091.144 3,096,818.720 10
**Units held by the AMC (Seed Capital) in Direct Plan Growth Option as on 31/03/2021 is 434,786.389 & as on 31/03/2020 is 434,786.389
5 No contingent liabilities for the years ended March 31, 2021 and March 31, 2020.
6 Expenses other than Management Fees are Inclusive of GST where applicable.
7 Other income represents exit load credited to the scheme and Penal Interest received from Bank towards delay of RTGS/NEFT is Rs. 143,985. (2020: 127,547/- represents exit load credited to the scheme).
8 Investor Education Awareness
In view of the AMFI Best Practices Guidelines Circular No. 56/2015-16, the IEF ( Investor Education Fund) accrual is set aside in a separate bank account and the consolidated balance across all schemes as on March 31, 2021. The break-up of which is as under:
Particulars March 31, 2021 March 31, 2020
Amount (in Rs. Lacs) Amount (in Rs. Lacs)
Opening Balance as on April 01, 2020 307.40 214.68
Add: Accrual during FY 2020-21 195.77 237.54
Less: Transferred to AMFI * 89.04 109.69
Less: Payable to AMFI (March 2021 accrual) * 8.84 9.08
Add: Investment Income FY 2020-21 11.94 15.93
Less: Spent during FY 2020-21 43.73 41.98
Closing Balance as on March 31, 2021 373.49 307.40
*In accordance with SEBI circular number SEBI/HO/IMD/DF2/RS/813/2016 dated January 8, 2016.
9 Previous year’s figures have been re-grouped / re-arranged where appropriate.
10 Following the spread of the coronavirus, on 11 March 2020, the World Health Organization declared the COVID-19 outbreak to be a pandemic. The identification of the virus as a new coronavirus, its subsequent spread and the situation of lock-down across India is considered as a significant event. HSBC Mutual Fund’s operations are included in essential services and have continued through the lock-downs declared by the Government. Service providers like the Registrar and Transfer Agent, Custodian and Fund Accountant have carried out extensive arrangements to address business needs and continuity of operations. As on the date of signing of these financial statements, Management believes that it has taken into account, all the possible impact of known events arising from COVID-19 pandemic in the preparation of the financial statements and there appears to be no uncertainties relating to the going concern of any of the Schemes of the Fund for a foreseeable future. However, COVID-19 pandemic is an ongoing situation and any estimate of its impact is dependent on the future intensity, spread and duration of the situation. The Management will continue to closely monitor the situation for any material changes which may impact the Schemes of the Fund.
Notes to Accounts – Annexure I (Contd...)To the Abridged Balance Sheet and Revenue Account for the Year ended March 31, 2021
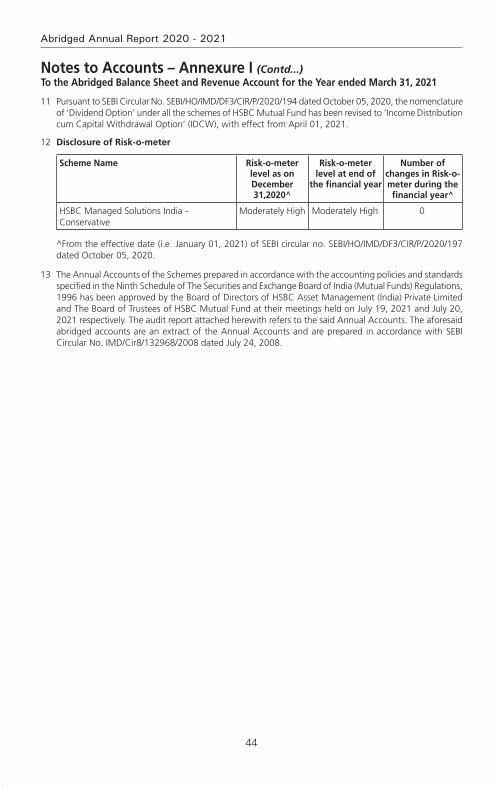
44
Abridged Annual Report 2020 - 2021
11 Pursuant to SEBI Circular No. SEBI/HO/IMD/DF3/CIR/P/2020/194 dated October 05, 2020, the nomenclature of ‘Dividend Option’ under all the schemes of HSBC Mutual Fund has been revised to ‘Income Distribution cum Capital Withdrawal Option’ (IDCW), with effect from April 01, 2021.
12 Disclosure of Risk-o-meter
Scheme Name Risk-o-meter level as on December 31,2020^
Risk-o-meter level at end of
the financial year
Number of changes in Risk-o-meter during the financial year^
HSBC Managed Solutions India - Conservative
Moderately High Moderately High 0
^From the effective date (i.e. January 01, 2021) of SEBI circular no. SEBI/HO/IMD/DF3/CIR/P/2020/197 dated October 05, 2020.
13 The Annual Accounts of the Schemes prepared in accordance with the accounting policies and standards specified in the Ninth Schedule of The Securities and Exchange Board of India (Mutual Funds) Regulations, 1996 has been approved by the Board of Directors of HSBC Asset Management (India) Private Limited and The Board of Trustees of HSBC Mutual Fund at their meetings held on July 19, 2021 and July 20, 2021 respectively. The audit report attached herewith refers to the said Annual Accounts. The aforesaid abridged accounts are an extract of the Annual Accounts and are prepared in accordance with SEBI Circular No. IMD/Cir8/132968/2008 dated July 24, 2008.
Notes to Accounts – Annexure I (Contd...)To the Abridged Balance Sheet and Revenue Account for the Year ended March 31, 2021

45
HSBC Managed Solutions
voting Policy and Procedures
In view of SEBI guidelines related to “Role of Mutual Funds in Corporate Governance of Public Listed Companies”, HSBC AMC has formulated its “Policy for Proxy Voting in Public Listed Companies”. The said policy is available on our website and the details of actual exercise of proxy votes, the summary of votes casted and the auditor’s certificate for the Financial Year 2020 – 21 is forming part of our full Annual Report for the Financial Year 2020 – 21 which is uploaded on our website at http://www.assetmanagement.hsbc.co.in
46
Abridged Annual Report 2020 - 2021
Statutory Details & Disclaimers
All the returns have been sourced from Mutual Funds India Explorer software. The performance of the schemes and the benchmark is calculated on a total return basis. This document has been prepared by HSBC Asset Management (India) Private Ltd (HSBC) for information purposes only and should not be construed as i) an offer or recommendation to buy or sell securities, commodities, currencies or other investments referred to herein; or ii) an offer to sell or a solicitation or an offer for purchase of any of the funds of HSBC Mutual Fund; or iii) an investment research or investment advice. All information contained in this document (including that sourced from third parties), is obtained from sources HSBC and the third party which HSBC believes to be reliable however, has not independently verified the same. The information and opinions contained within the document are based upon publicly available information and rates of taxation applicable (if any) at the time of publication, which are subject to change from time to time.
Expressions of opinion are those of HSBC only and are subject to change without notice. It does not have regard to specific investment objectives, financial situation and the particular needs of any specific person who may receive this document. Investors should seek personal and independent advice regarding the appropriateness of investing in any of the funds, securities, other investment or investment strategies that may have been discussed or referred herein and should understand that the views regarding future prospects may or may not be realized. In no event shall HSBC Mutual Fund / HSBC Asset management (India) Private Limited and / or its affiliates or any of their directors, trustees, officers and employees be liable for any direct, indirect, special, incidental or consequential damages arising out of the use of information / opinion herein. Neither this document nor the units of HSBC Mutual Fund have been registered in any jurisdiction. The distribution of this document in certain jurisdictions may be restricted or totally prohibited and accordingly, persons who come into possession of this document are required to inform themselves about, and to observe, any such restrictions.
Mutual Fund investments are subject to market risks, read all scheme related documents carefully.

HSBC Flexi Debt FundAn open ended dynamic debt scheme investing across duration
Abridged Annual Report 2020 - 2021

1
HSBC Flexi Debt Fund
Dear Investor,
The beginning of the last financial year now almost seems like a distant memory. COVID-19 was still a relatively unknown enemy and governments across the world were grappling with ways to control and mitigate the risks associated with it. Nationwide lockdowns were the norm and our markets both equity and fixed income reacted negatively leading to significant erosion of wealth. Within a short period of time markets bounced back. This confounded even the most astute market pundits. How is it possible that when GDP growth had slowed down, unemployment had risen, inflation was high could there be such sharp up move in equity indices. Whilst the reasons are well known about easy global liquidity, demand resurgence, cost cutting by corporates etc. perhaps its most important to remember that the markets are not a reflector but a predictor of economic activity.
At all times particularly during such volatile times it is important to go back to the basics. Why do you save, why do you invest, what goals would you like to achieve, how old are you, what is your risk appetite? The replies to these simple questions will help you determine your asset allocation. As an example when equity markets corrected sharply last year, investors who reviewed their asset allocation, stayed invested during the lows of the past year and were able to capture the rebound and have seen prime returns since then. The current market movement in all likelihood would have also led to some imbalances in your asset allocation. Do not ignore that and I strongly recommend that you do review this with your advisor to check whether re-balancing is required.
During this financial year we had three very successful new fund launches. The pandemic showed us a clear trend of dominant players becoming stronger and profit pool getting consolidated within a few companies. To capture this opportunity, we launched the HSBC Focused Equity Fund which garnered close to Rs. 520 crores. During the second half of 2020, in the fixed income space, 3 - 5 year duration range had a favourable investment scenario as RBI’s accommodative policy and surplus liquidity had reduced the returns at the very short end of the yield curve. There was a demand for an actively managed moderate duration strategy with better credit quality which we fulfilled by launching HSBC Corporate Bond Fund. It garnered over 700 crores. Our latest and first of its kind offering, HSBC Global Equity Climate Change Fund of Fund saw a stupendous response with over 8000 investors investing over Rs. 616 crores. This is an investment opportunity which goes beyond the rationale of simply generating investment returns and is the future of responsible investing.
We worked towards augmenting our digital capabilities by launching a few key enhancements to our online transaction platform. Being mindful of the movement restrictions in place, this year we focused on digitizing offline processes so that an investor need not need step out of her home for investing or availing any key services. While our interactive chatbot AskMe, eased service queries, our end-to-end digital KYC module enabled a first time Mutual Fund investor to invest in our funds without any paperwork. We listened to your feedback and digitized consolidation of folios and change of tax status which eliminated the need for you to physically visit our branches.
I am a strong believer in the India story and this story has just begun. The opportunity to invest in this high growth market is a very exciting opportunity. I do hope you share my enthusiasm and I ask that you continue to invest whilst reviewing your asset allocation at all times. As always thank you for your business. Stay safe.
Warm regards,
Ravi MenonChief Executive Officer,
HSBC Asset Management India

2
Abridged Annual Report 2020 - 2021
SPONSOR
HSBC Securities and Capital Markets (India) Private LimitedRegd. Office: 52/60, Mahatma Gandhi Road, Fort, Mumbai - 400 001.
TRUSTEE
Board of TrusteesOffice: 16, Veer Nariman Road, Fort, Mumbai 400 001.
ASSET MANAGEMENT COMPANY
HSBC Asset Management (India) Private LimitedCorp. & Regd. Office: 16, Veer Nariman Road, Fort, Mumbai 400 001.
CUSTODIAN
Standard Chartered Bank (SCB)Corp. & Regd. Office: Crescenzo, Securities Services, 3rd Floor, C-38/39, G-Block,Bandra Kurla Complex, Bandra East, Mumbai – 400051.
AUDITORS TO THE SCHEME
BSR & Co. LLPChartered Accountants
5th Floor, Lodha Excelus, Apollo Mills Compound, N. M. Joshi Marg, Mahalaxmi, Mumbai 400 011.
REGISTRAR & TRANSFER AGENTS
Computer Age Management Services Limited (CAMS)Unit: HSBC Mutual Fund ’C’ Block, 2nd Floor, Hanudev Info Park P. Ltd., SF No. 558/2, Udayampalayam Road, Nava India, Coimbatore - 641 028.
BOARD OF TRUSTEES
Ms. Jasmine Batliwalla - Chairperson
Mr. Nani Javeri - Trustee
Dr. T. C. Nair - Trustee
Mr. Pedro Bastos - Trustee
BOARD OF DIRECTORS
Mr. Dinesh Mittal - Director
Dr. Indu Shahani - Director
Mr. Ravi Menon - Director & Chief Executive Officer
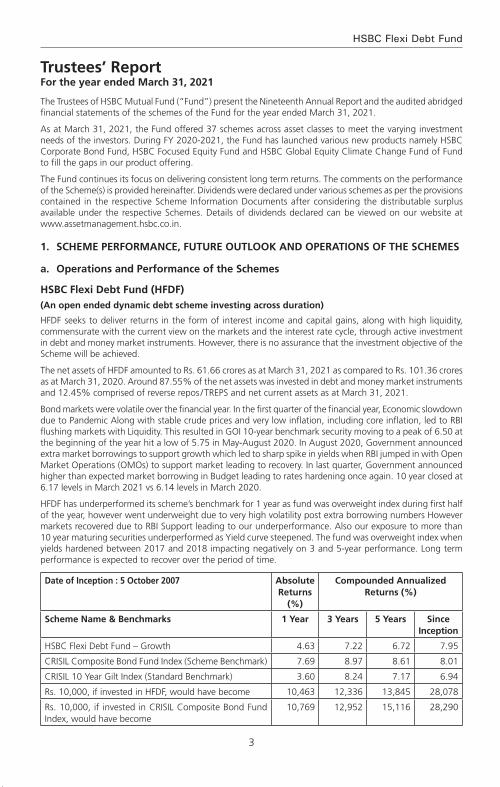
3
HSBC Flexi Debt Fund
The Trustees of HSBC Mutual Fund (“Fund”) present the Nineteenth Annual Report and the audited abridged financial statements of the schemes of the Fund for the year ended March 31, 2021.
As at March 31, 2021, the Fund offered 37 schemes across asset classes to meet the varying investment needs of the investors. During FY 2020-2021, the Fund has launched various new products namely HSBC Corporate Bond Fund, HSBC Focused Equity Fund and HSBC Global Equity Climate Change Fund of Fund to fill the gaps in our product offering.
The Fund continues its focus on delivering consistent long term returns. The comments on the performance of the Scheme(s) is provided hereinafter. Dividends were declared under various schemes as per the provisions contained in the respective Scheme Information Documents after considering the distributable surplus available under the respective Schemes. Details of dividends declared can be viewed on our website at www.assetmanagement.hsbc.co.in.
1. Scheme Performance, future outlook and oPerationS of the SchemeS
a. operations and Performance of the Schemes
hSBc flexi debt fund (hfdf) (an open ended dynamic debt scheme investing across duration)
HFDF seeks to deliver returns in the form of interest income and capital gains, along with high liquidity, commensurate with the current view on the markets and the interest rate cycle, through active investment in debt and money market instruments. However, there is no assurance that the investment objective of the Scheme will be achieved.
The net assets of HFDF amounted to Rs. 61.66 crores as at March 31, 2021 as compared to Rs. 101.36 crores as at March 31, 2020. Around 87.55% of the net assets was invested in debt and money market instruments and 12.45% comprised of reverse repos / TREPS and net current assets as at March 31, 2021.
Bond markets were volatile over the financial year. In the first quarter of the financial year, Economic slowdown due to Pandemic Along with stable crude prices and very low inflation, including core inflation, led to RBI flushing markets with Liquidity. This resulted in GOI 10-year benchmark security moving to a peak of 6.50 at the beginning of the year hit a low of 5.75 in May-August 2020. In August 2020, Government announced extra market borrowings to support growth which led to sharp spike in yields when RBI jumped in with Open Market Operations (OMOs) to support market leading to recovery. In last quarter, Government announced higher than expected market borrowing in Budget leading to rates hardening once again. 10 year closed at 6.17 levels in March 2021 vs 6.14 levels in March 2020.
HFDF has underperformed its scheme’s benchmark for 1 year as fund was overweight index during first half of the year, however went underweight due to very high volatility post extra borrowing numbers However markets recovered due to RBI Support leading to our underperformance. Also our exposure to more than 10 year maturing securities underperformed as Yield curve steepened. The fund was overweight index when yields hardened between 2017 and 2018 impacting negatively on 3 and 5-year performance. Long term performance is expected to recover over the period of time.
date of inception : 5 october 2007 absolute returns
(%)
compounded annualized returns (%)
Scheme name & Benchmarks 1 Year 3 Years 5 Years Since inception
HSBC Flexi Debt Fund – Growth 4.63 7.22 6.72 7.95
CRISIL Composite Bond Fund Index (Scheme Benchmark) 7.69 8.97 8.61 8.01
CRISIL 10 Year Gilt Index (Standard Benchmark) 3.60 8.24 7.17 6.94
Rs. 10,000, if invested in HFDF, would have become 10,463 12,336 13,845 28,078
Rs. 10,000, if invested in CRISIL Composite Bond Fund Index, would have become
10,769 12,952 15,116 28,290
Trustees’ ReportFor the year ended March 31, 2021
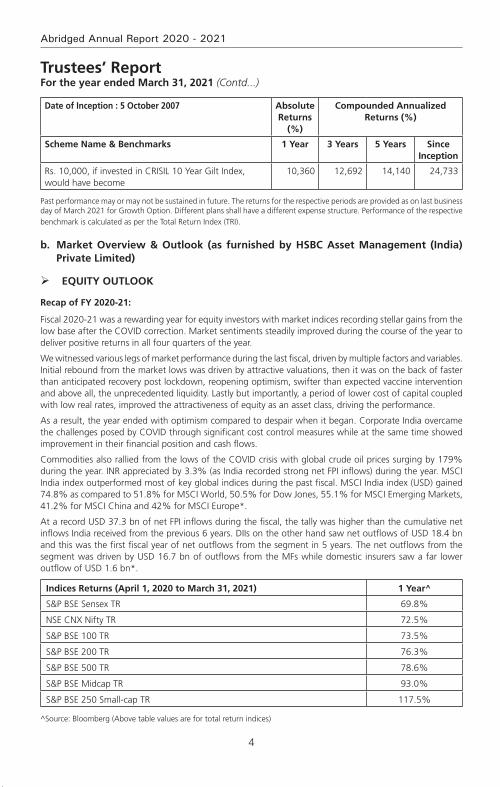
4
Abridged Annual Report 2020 - 2021
date of inception : 5 october 2007 absolute returns
(%)
compounded annualized returns (%)
Scheme name & Benchmarks 1 Year 3 Years 5 Years Since inception
Rs. 10,000, if invested in CRISIL 10 Year Gilt Index, would have become
10,360 12,692 14,140 24,733
Past performance may or may not be sustained in future. The returns for the respective periods are provided as on last business day of March 2021 for Growth Option. Different plans shall have a different expense structure. Performance of the respective benchmark is calculated as per the Total Return Index (TRI).
b. market overview & outlook (as furnished by hSBc asset management (india) Private limited)
equitY outlook
recap of fY 2020-21:
Fiscal 2020-21 was a rewarding year for equity investors with market indices recording stellar gains from the low base after the COVID correction. Market sentiments steadily improved during the course of the year to deliver positive returns in all four quarters of the year.
We witnessed various legs of market performance during the last fiscal, driven by multiple factors and variables. Initial rebound from the market lows was driven by attractive valuations, then it was on the back of faster than anticipated recovery post lockdown, reopening optimism, swifter than expected vaccine intervention and above all, the unprecedented liquidity. Lastly but importantly, a period of lower cost of capital coupled with low real rates, improved the attractiveness of equity as an asset class, driving the performance.
As a result, the year ended with optimism compared to despair when it began. Corporate India overcame the challenges posed by COVID through significant cost control measures while at the same time showed improvement in their financial position and cash flows.
Commodities also rallied from the lows of the COVID crisis with global crude oil prices surging by 179% during the year. INR appreciated by 3.3% (as India recorded strong net FPI inflows) during the year. MSCI India index outperformed most of key global indices during the past fiscal. MSCI India index (USD) gained 74.8% as compared to 51.8% for MSCI World, 50.5% for Dow Jones, 55.1% for MSCI Emerging Markets, 41.2% for MSCI China and 42% for MSCI Europe*.
At a record USD 37.3 bn of net FPI inflows during the fiscal, the tally was higher than the cumulative net inflows India received from the previous 6 years. DIIs on the other hand saw net outflows of USD 18.4 bn and this was the first fiscal year of net outflows from the segment in 5 years. The net outflows from the segment was driven by USD 16.7 bn of outflows from the MFs while domestic insurers saw a far lower outflow of USD 1.6 bn*.
indices returns (april 1, 2020 to march 31, 2021) 1 Year^
S&P BSE Sensex TR 69.8%
NSE CNX Nifty TR 72.5%
S&P BSE 100 TR 73.5%
S&P BSE 200 TR 76.3%
S&P BSE 500 TR 78.6%
S&P BSE Midcap TR 93.0%
S&P BSE 250 Small-cap TR 117.5%
^Source: Bloomberg (Above table values are for total return indices)
Trustees’ ReportFor the year ended March 31, 2021 (Contd...)
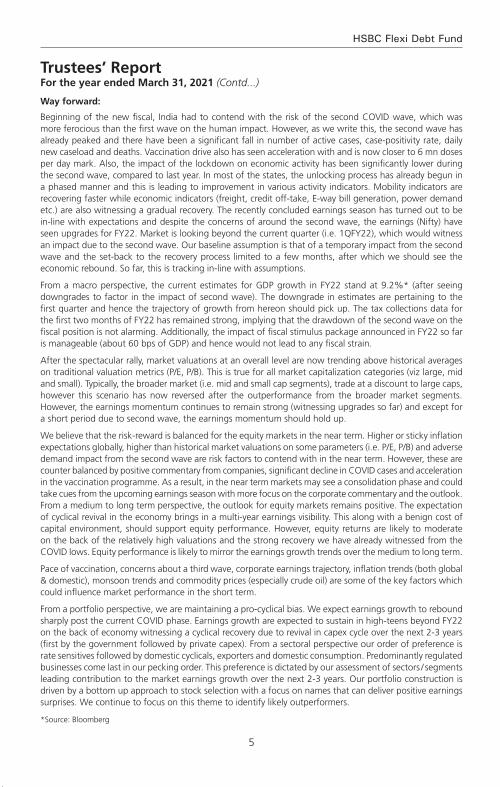
5
HSBC Flexi Debt Fund
Way forward:
Beginning of the new fiscal, India had to contend with the risk of the second COVID wave, which was more ferocious than the first wave on the human impact. However, as we write this, the second wave has already peaked and there have been a significant fall in number of active cases, case-positivity rate, daily new caseload and deaths. Vaccination drive also has seen acceleration with and is now closer to 6 mn doses per day mark. Also, the impact of the lockdown on economic activity has been significantly lower during the second wave, compared to last year. In most of the states, the unlocking process has already begun in a phased manner and this is leading to improvement in various activity indicators. Mobility indicators are recovering faster while economic indicators (freight, credit off-take, E-way bill generation, power demand etc.) are also witnessing a gradual recovery. The recently concluded earnings season has turned out to be in-line with expectations and despite the concerns of around the second wave, the earnings (Nifty) have seen upgrades for FY22. Market is looking beyond the current quarter (i.e. 1QFY22), which would witness an impact due to the second wave. Our baseline assumption is that of a temporary impact from the second wave and the set-back to the recovery process limited to a few months, after which we should see the economic rebound. So far, this is tracking in-line with assumptions.
From a macro perspective, the current estimates for GDP growth in FY22 stand at 9.2%* (after seeing downgrades to factor in the impact of second wave). The downgrade in estimates are pertaining to the first quarter and hence the trajectory of growth from hereon should pick up. The tax collections data for the first two months of FY22 has remained strong, implying that the drawdown of the second wave on the fiscal position is not alarming. Additionally, the impact of fiscal stimulus package announced in FY22 so far is manageable (about 60 bps of GDP) and hence would not lead to any fiscal strain.
After the spectacular rally, market valuations at an overall level are now trending above historical averages on traditional valuation metrics (P/E, P/B). This is true for all market capitalization categories (viz large, mid and small). Typically, the broader market (i.e. mid and small cap segments), trade at a discount to large caps, however this scenario has now reversed after the outperformance from the broader market segments. However, the earnings momentum continues to remain strong (witnessing upgrades so far) and except for a short period due to second wave, the earnings momentum should hold up.
We believe that the risk-reward is balanced for the equity markets in the near term. Higher or sticky inflation expectations globally, higher than historical market valuations on some parameters (i.e. P/E, P/B) and adverse demand impact from the second wave are risk factors to contend with in the near term. However, these are counter balanced by positive commentary from companies, significant decline in COVID cases and acceleration in the vaccination programme. As a result, in the near term markets may see a consolidation phase and could take cues from the upcoming earnings season with more focus on the corporate commentary and the outlook. From a medium to long term perspective, the outlook for equity markets remains positive. The expectation of cyclical revival in the economy brings in a multi-year earnings visibility. This along with a benign cost of capital environment, should support equity performance. However, equity returns are likely to moderate on the back of the relatively high valuations and the strong recovery we have already witnessed from the COVID lows. Equity performance is likely to mirror the earnings growth trends over the medium to long term.
Pace of vaccination, concerns about a third wave, corporate earnings trajectory, inflation trends (both global & domestic), monsoon trends and commodity prices (especially crude oil) are some of the key factors which could influence market performance in the short term.
From a portfolio perspective, we are maintaining a pro-cyclical bias. We expect earnings growth to rebound sharply post the current COVID phase. Earnings growth are expected to sustain in high-teens beyond FY22 on the back of economy witnessing a cyclical recovery due to revival in capex cycle over the next 2-3 years (first by the government followed by private capex). From a sectoral perspective our order of preference is rate sensitives followed by domestic cyclicals, exporters and domestic consumption. Predominantly regulated businesses come last in our pecking order. This preference is dictated by our assessment of sectors / segments leading contribution to the market earnings growth over the next 2-3 years. Our portfolio construction is driven by a bottom up approach to stock selection with a focus on names that can deliver positive earnings surprises. We continue to focus on this theme to identify likely outperformers.
*Source: Bloomberg
Trustees’ ReportFor the year ended March 31, 2021 (Contd...)
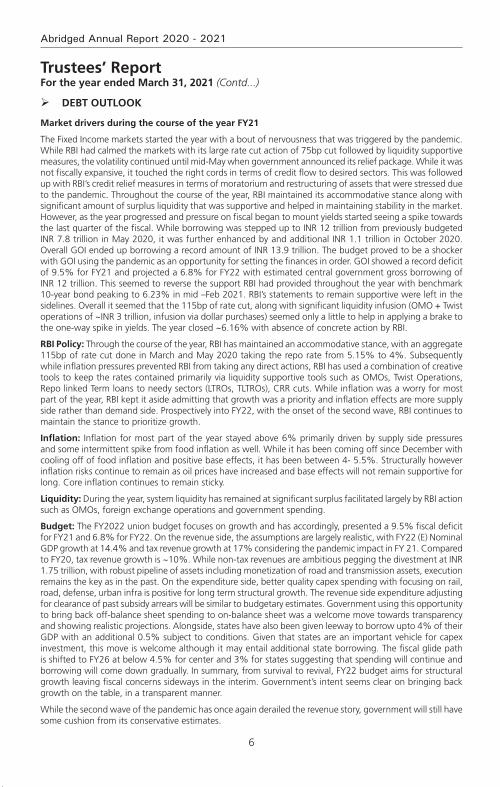
6
Abridged Annual Report 2020 - 2021
deBt outlook
market drivers during the course of the year fY21
The Fixed Income markets started the year with a bout of nervousness that was triggered by the pandemic. While RBI had calmed the markets with its large rate cut action of 75bp cut followed by liquidity supportive measures, the volatility continued until mid-May when government announced its relief package. While it was not fiscally expansive, it touched the right cords in terms of credit flow to desired sectors. This was followed up with RBI’s credit relief measures in terms of moratorium and restructuring of assets that were stressed due to the pandemic. Throughout the course of the year, RBI maintained its accommodative stance along with significant amount of surplus liquidity that was supportive and helped in maintaining stability in the market. However, as the year progressed and pressure on fiscal began to mount yields started seeing a spike towards the last quarter of the fiscal. While borrowing was stepped up to INR 12 trillion from previously budgeted INR 7.8 trillion in May 2020, it was further enhanced by and additional INR 1.1 trillion in October 2020. Overall GOI ended up borrowing a record amount of INR 13.9 trillion. The budget proved to be a shocker with GOI using the pandemic as an opportunity for setting the finances in order. GOI showed a record deficit of 9.5% for FY21 and projected a 6.8% for FY22 with estimated central government gross borrowing of INR 12 trillion. This seemed to reverse the support RBI had provided throughout the year with benchmark 10-year bond peaking to 6.23% in mid –Feb 2021. RBI’s statements to remain supportive were left in the sidelines. Overall it seemed that the 115bp of rate cut, along with significant liquidity infusion (OMO + Twist operations of ~INR 3 trillion, infusion via dollar purchases) seemed only a little to help in applying a brake to the one-way spike in yields. The year closed ~6.16% with absence of concrete action by RBI.
rBi Policy: Through the course of the year, RBI has maintained an accommodative stance, with an aggregate 115bp of rate cut done in March and May 2020 taking the repo rate from 5.15% to 4%. Subsequently while inflation pressures prevented RBI from taking any direct actions, RBI has used a combination of creative tools to keep the rates contained primarily via liquidity supportive tools such as OMOs, Twist Operations, Repo linked Term loans to needy sectors (LTROs, TLTROs), CRR cuts. While inflation was a worry for most part of the year, RBI kept it aside admitting that growth was a priority and inflation effects are more supply side rather than demand side. Prospectively into FY22, with the onset of the second wave, RBI continues to maintain the stance to prioritize growth.
inflation: Inflation for most part of the year stayed above 6% primarily driven by supply side pressures and some intermittent spike from food inflation as well. While it has been coming off since December with cooling off of food inflation and positive base effects, it has been between 4- 5.5%. Structurally however inflation risks continue to remain as oil prices have increased and base effects will not remain supportive for long. Core inflation continues to remain sticky.
liquidity: During the year, system liquidity has remained at significant surplus facilitated largely by RBI action such as OMOs, foreign exchange operations and government spending.
Budget: The FY2022 union budget focuses on growth and has accordingly, presented a 9.5% fiscal deficit for FY21 and 6.8% for FY22. On the revenue side, the assumptions are largely realistic, with FY22 (E) Nominal GDP growth at 14.4% and tax revenue growth at 17% considering the pandemic impact in FY 21. Compared to FY20, tax revenue growth is ~10%. While non-tax revenues are ambitious pegging the divestment at INR 1.75 trillion, with robust pipeline of assets including monetization of road and transmission assets, execution remains the key as in the past. On the expenditure side, better quality capex spending with focusing on rail, road, defense, urban infra is positive for long term structural growth. The revenue side expenditure adjusting for clearance of past subsidy arrears will be similar to budgetary estimates. Government using this opportunity to bring back off-balance sheet spending to on-balance sheet was a welcome move towards transparency and showing realistic projections. Alongside, states have also been given leeway to borrow upto 4% of their GDP with an additional 0.5% subject to conditions. Given that states are an important vehicle for capex investment, this move is welcome although it may entail additional state borrowing. The fiscal glide path is shifted to FY26 at below 4.5% for center and 3% for states suggesting that spending will continue and borrowing will come down gradually. In summary, from survival to revival, FY22 budget aims for structural growth leaving fiscal concerns sideways in the interim. Government’s intent seems clear on bringing back growth on the table, in a transparent manner.
While the second wave of the pandemic has once again derailed the revenue story, government will still have some cushion from its conservative estimates.
Trustees’ ReportFor the year ended March 31, 2021 (Contd...)
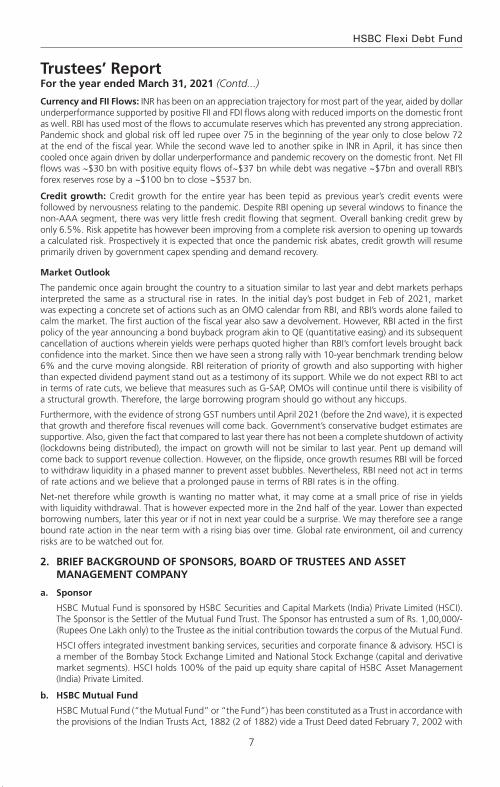
7
HSBC Flexi Debt Fund
currency and fii flows: INR has been on an appreciation trajectory for most part of the year, aided by dollar underperformance supported by positive FII and FDI flows along with reduced imports on the domestic front as well. RBI has used most of the flows to accumulate reserves which has prevented any strong appreciation. Pandemic shock and global risk off led rupee over 75 in the beginning of the year only to close below 72 at the end of the fiscal year. While the second wave led to another spike in INR in April, it has since then cooled once again driven by dollar underperformance and pandemic recovery on the domestic front. Net FII flows was ~$30 bn with positive equity flows of~$37 bn while debt was negative ~$7bn and overall RBI’s forex reserves rose by a ~$100 bn to close ~$537 bn.
credit growth: Credit growth for the entire year has been tepid as previous year’s credit events were followed by nervousness relating to the pandemic. Despite RBI opening up several windows to finance the non-AAA segment, there was very little fresh credit flowing that segment. Overall banking credit grew by only 6.5%. Risk appetite has however been improving from a complete risk aversion to opening up towards a calculated risk. Prospectively it is expected that once the pandemic risk abates, credit growth will resume primarily driven by government capex spending and demand recovery.
market outlook
The pandemic once again brought the country to a situation similar to last year and debt markets perhaps interpreted the same as a structural rise in rates. In the initial day’s post budget in Feb of 2021, market was expecting a concrete set of actions such as an OMO calendar from RBI, and RBI’s words alone failed to calm the market. The first auction of the fiscal year also saw a devolvement. However, RBI acted in the first policy of the year announcing a bond buyback program akin to QE (quantitative easing) and its subsequent cancellation of auctions wherein yields were perhaps quoted higher than RBI’s comfort levels brought back confidence into the market. Since then we have seen a strong rally with 10-year benchmark trending below 6% and the curve moving alongside. RBI reiteration of priority of growth and also supporting with higher than expected dividend payment stand out as a testimony of its support. While we do not expect RBI to act in terms of rate cuts, we believe that measures such as G-SAP, OMOs will continue until there is visibility of a structural growth. Therefore, the large borrowing program should go without any hiccups.
Furthermore, with the evidence of strong GST numbers until April 2021 (before the 2nd wave), it is expected that growth and therefore fiscal revenues will come back. Government’s conservative budget estimates are supportive. Also, given the fact that compared to last year there has not been a complete shutdown of activity (lockdowns being distributed), the impact on growth will not be similar to last year. Pent up demand will come back to support revenue collection. However, on the flipside, once growth resumes RBI will be forced to withdraw liquidity in a phased manner to prevent asset bubbles. Nevertheless, RBI need not act in terms of rate actions and we believe that a prolonged pause in terms of RBI rates is in the offing.
Net-net therefore while growth is wanting no matter what, it may come at a small price of rise in yields with liquidity withdrawal. That is however expected more in the 2nd half of the year. Lower than expected borrowing numbers, later this year or if not in next year could be a surprise. We may therefore see a range bound rate action in the near term with a rising bias over time. Global rate environment, oil and currency risks are to be watched out for.
2. Brief Background of SPonSorS, Board of truSteeS and aSSet management comPanY
a. Sponsor
HSBC Mutual Fund is sponsored by HSBC Securities and Capital Markets (India) Private Limited (HSCI). The Sponsor is the Settler of the Mutual Fund Trust. The Sponsor has entrusted a sum of Rs. 1,00,000/- (Rupees One Lakh only) to the Trustee as the initial contribution towards the corpus of the Mutual Fund.
HSCI offers integrated investment banking services, securities and corporate finance & advisory. HSCI is a member of the Bombay Stock Exchange Limited and National Stock Exchange (capital and derivative market segments). HSCI holds 100% of the paid up equity share capital of HSBC Asset Management (India) Private Limited.
b. hSBc mutual fund
HSBC Mutual Fund (“the Mutual Fund” or “the Fund”) has been constituted as a Trust in accordance with the provisions of the Indian Trusts Act, 1882 (2 of 1882) vide a Trust Deed dated February 7, 2002 with
Trustees’ ReportFor the year ended March 31, 2021 (Contd...)

8
Abridged Annual Report 2020 - 2021
HSBC Securities and Capital Markets (India) Private Limited, as the Sponsor and the Board of Individual Trustees. The Trustee has entered into an Investment Management Agreement dated February 7, 2002 with HSBC Asset Management (India) Private Limited (AMC) to function as the Investment Manager for all the schemes of the Fund. The Fund was registered with SEBI vide registration number MF/046/02/5 dated May 27, 2002.
The Trust has been formed for the purpose of pooling of capital from the public for collective investment in securities for the purpose of providing facilities for participation by persons as beneficiaries in such investments and in the profits/income arising therefrom.
c. Board of trustees (the trustees)
The Board of Trustees is the exclusive owner of the Trust Fund and holds the same in trust for the benefit of the unit holders. The Trustees have been discharging their duties and carrying out the responsibilities as provided in the SEBI (Mutual Funds) Regulations, 1996 and the Trust Deed. The Trustees seek to ensure that the Fund and the schemes floated there under are managed by the AMC in accordance with the Trust Deed, the said Regulations, directions and guidelines issued by the SEBI, the Stock Exchanges, the Association of Mutual Funds in India and other regulatory agencies.
d. asset management company (the amc)
HSBC Asset Management (India) Private Limited (the Investment Manager or the AMC) is a private limited company incorporated under the Companies Act, 1956 on December 12, 2001 having its Registered Office at 16, V. N. Road, Fort, Mumbai 400 001. HSBC Asset Management (India) Private Limited has been appointed as the Asset Management Company of HSBC Mutual Fund by the Trustee vide Investment Management Agreement (IMA) dated February 7, 2002 and executed between the Trustees and the AMC. SEBI approved the AMC to act as the Investment Manager of the Fund vide its letter No. MFD/BC/163/2002 dated May 27, 2002. The paid-up equity share capital of the AMC is Rs. 61.59 crores. The AMC is registered as a Portfolio Manager under the SEBI (Portfolio Managers) Regulations, 1993 vide registration no. INP000001322. The AMC also offers non-binding Advisory services to offshore funds under the mutual fund license.
HSBC Securities and Capital Markets (India) Private Limited holds 100% of the paid up equity share capital of the AMC.
3. inveStment oBjective of the SchemeSThe investment objective of the respective schemes has been provided above under the heading “Scheme Performance, Future Outlook and Operation of the Scheme” (Refer Section 1).
4. Significant accounting PolicieS The Significant Accounting Policies form part of the Notes to the Accounts annexed to the Balance Sheet of the Schemes in the Full Annual Report. The accounting policies are in accordance with Securities Exchange Board of India (Mutual Funds) Regulations 1996.
5. unclaimed dividendS & redemPtionSSummary of number of investors & corresponding amount Scheme-wise as on March 31, 2021
Schemeunclaimed dividend unclaimed redemption
amount (rs.) no. of investors
amount (rs.) no. of investors
HSBC Flexi Debt Fund 24,739.30 14 Nil Nil
6. inveStor ServiceS
The number of official points of acceptance of transactions is 204 locations. In addition to the offices of the Registrar & Transfer agents, the AMC has Investor Service Centers in 9 locations at its own offices - namely Mumbai, New Delhi, Kolkata, Bangalore, Pune, Ahmedabad, Hyderabad, Chandigarh and Chennai. With a view to enhance customer convenience, the AMC has the facility of priority based servicing to key distributors
Trustees’ ReportFor the year ended March 31, 2021 (Contd...)

9
HSBC Flexi Debt Fund
Trustees’ ReportFor the year ended March 31, 2021 (Contd...)
through the enhancement of the Interactive Voice Reponses. The AMC has 2 Toll Free numbers (1-800-200-2434 /1-800-258-2434) which can be dialed from anywhere in India and 1 number i.e +91 44 39923900 (Investors calling from abroad). The call center service is being managed by the Registrar and Transfer Agents. Transactions for purchase / redemption of units in the schemes HSBC Mutual Fund can also be made through the online transaction facility on the AMC’s website at https://invest.assetmanagement.hsbc.co.in.
On the distribution front, the number of empaneled distributors was 1069 as on March 31, 2021. During the year, the AMC initiated tie-ups for online distribution of the Mutual Fund’s schemes with several channel partners taking the total number of such tie-ups to 52.
7. detailS of inveStor grievance redreSSal
The details of the redressal of investor complaints received against HSBC Mutual Fund during April 2020 - March 2021 are as follows:
2020-2021
com-plaint code
type of complaint# (a) no. of complaints pending at the begin-ning of the
year
(b) no. of com-
plaints received during
the year
action on (a) and (b)
resolved non action-
able
Pending
Within 30
days
30 - 60 days
60 - 180 days
Beyond 180 days
0 - 3 months
3 - 6 months
6 - 9 months
9 - 12 months
I A Non receipt of Dividend on Units
0 0 0 0 0 0 0 0 0 0 0
I B Interest on delayed payment of Dividend
0 0 0 0 0 0 0 0 0 0 0
I C Non receipt of Redemption Proceeds
0 8 7 0 0 0 0 1 0 0 0
I D Interest on delayed payment of Redemption
0 0 0 0 0 0 0 0 0 0 0
II A Non receipt of Statement of Account / Unit Certificate
0 0 0 0 0 0 0 0 0 0 0
II B Discrepancy in Statement of Account
0 1 1 0 0 0 0 0 0 0 0
II C Data corrections in Investor details **
0 12 12 0 0 0 0 0 0 0 0
II D Non receipt of Annual Report/Abridged Summary
0 0 0 0 0 0 0 0 0 0 0
III A Wrong switch between Schemes
0 0 0 0 0 0 0 0 0 0 0
III B Unauthorized switch between Schemes
0 0 0 0 0 0 0 0 0 0 0
III C Deviation from Scheme attributes
0 0 0 0 0 0 0 0 0 0 0
III D Wrong or excess charges/load
0 0 0 0 0 0 0 0 0 0 0
III E Non updation of changes viz. address, PAN, bank details, nomination, etc
0 6 6 0 0 0 0 0 0 0 0
IV Others 0 15 15 0 0 0 0 0 0 0 0
total 0 42 41 0 0 0 0 1 0 0 0
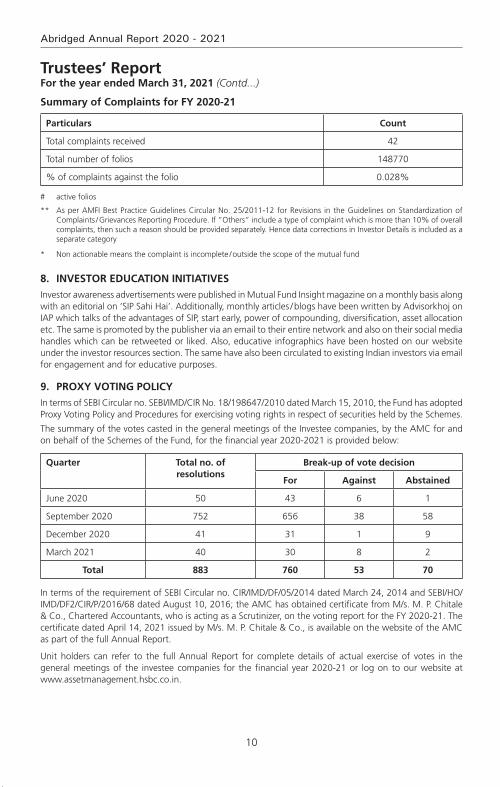
10
Abridged Annual Report 2020 - 2021
Trustees’ ReportFor the year ended March 31, 2021 (Contd...)
Summary of complaints for fY 2020-21
Particulars count
Total complaints received 42
Total number of folios 148770
% of complaints against the folio 0.028%
# active folios
** As per AMFI Best Practice Guidelines Circular No. 25/2011-12 for Revisions in the Guidelines on Standardization of Complaints / Grievances Reporting Procedure. If “Others” include a type of complaint which is more than 10% of overall complaints, then such a reason should be provided separately. Hence data corrections in Investor Details is included as a separate category
* Non actionable means the complaint is incomplete / outside the scope of the mutual fund
8. inveStor education initiativeS
Investor awareness advertisements were published in Mutual Fund Insight magazine on a monthly basis along with an editorial on ‘SIP Sahi Hai’. Additionally, monthly articles / blogs have been written by Advisorkhoj on IAP which talks of the advantages of SIP, start early, power of compounding, diversification, asset allocation etc. The same is promoted by the publisher via an email to their entire network and also on their social media handles which can be retweeted or liked. Also, educative infographics have been hosted on our website under the investor resources section. The same have also been circulated to existing Indian investors via email for engagement and for educative purposes.
9. ProxY voting PolicY
In terms of SEBI Circular no. SEBI/IMD/CIR No. 18/198647/2010 dated March 15, 2010, the Fund has adopted Proxy Voting Policy and Procedures for exercising voting rights in respect of securities held by the Schemes.
The summary of the votes casted in the general meetings of the Investee companies, by the AMC for and on behalf of the Schemes of the Fund, for the financial year 2020-2021 is provided below:
quarter total no. of resolutions
Break-up of vote decision
for against abstained
June 2020 50 43 6 1
September 2020 752 656 38 58
December 2020 41 31 1 9
March 2021 40 30 8 2
total 883 760 53 70
In terms of the requirement of SEBI Circular no. CIR/IMD/DF/05/2014 dated March 24, 2014 and SEBI/HO/IMD/DF2/CIR/P/2016/68 dated August 10, 2016; the AMC has obtained certificate from M/s. M. P. Chitale & Co., Chartered Accountants, who is acting as a Scrutinizer, on the voting report for the FY 2020-21. The certificate dated April 14, 2021 issued by M/s. M. P. Chitale & Co., is available on the website of the AMC as part of the full Annual Report.
Unit holders can refer to the full Annual Report for complete details of actual exercise of votes in the general meetings of the investee companies for the financial year 2020-21 or log on to our website at www.assetmanagement.hsbc.co.in.
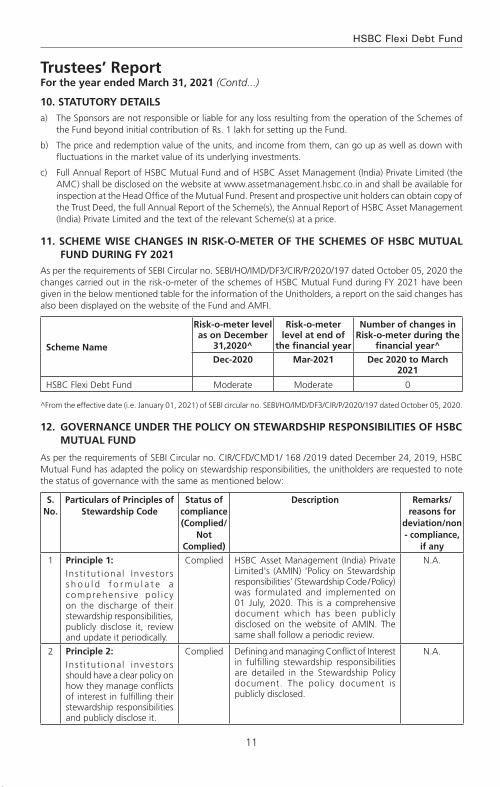
11
HSBC Flexi Debt Fund
Trustees’ ReportFor the year ended March 31, 2021 (Contd...)
10. StatutorY detailS
a) The Sponsors are not responsible or liable for any loss resulting from the operation of the Schemes of the Fund beyond initial contribution of Rs. 1 lakh for setting up the Fund.
b) The price and redemption value of the units, and income from them, can go up as well as down with fluctuations in the market value of its underlying investments.
c) Full Annual Report of HSBC Mutual Fund and of HSBC Asset Management (India) Private Limited (the AMC) shall be disclosed on the website at www.assetmanagement.hsbc.co.in and shall be available for inspection at the Head Office of the Mutual Fund. Present and prospective unit holders can obtain copy of the Trust Deed, the full Annual Report of the Scheme(s), the Annual Report of HSBC Asset Management (India) Private Limited and the text of the relevant Scheme(s) at a price.
11. Scheme WiSe changeS in riSk-o-meter of the SchemeS of hSBc mutual fund during fY 2021
As per the requirements of SEBI Circular no. SEBI/HO/IMD/DF3/CIR/P/2020/197 dated October 05, 2020 the changes carried out in the risk-o-meter of the schemes of HSBC Mutual Fund during FY 2021 have been given in the below mentioned table for the information of the Unitholders, a report on the said changes has also been displayed on the website of the Fund and AMFI.
Scheme name
risk-o-meter level as on december
31,2020^
risk-o-meter level at end of
the financial year
number of changes in risk-o-meter during the
financial year^
dec-2020 mar-2021 dec 2020 to march 2021
HSBC Flexi Debt Fund Moderate Moderate 0
^From the effective date (i.e. January 01, 2021) of SEBI circular no. SEBI/HO/IMD/DF3/CIR/P/2020/197 dated October 05, 2020.
12. governance under the PolicY on SteWardShiP reSPonSiBilitieS of hSBc mutual fund
As per the requirements of SEBI Circular no. CIR/CFD/CMD1/ 168 /2019 dated December 24, 2019, HSBC Mutual Fund has adapted the policy on stewardship responsibilities, the unitholders are requested to note the status of governance with the same as mentioned below:
S. no.
Particulars of Principles of Stewardship code
Status of compliance (complied/
not complied)
description remarks/reasons for
deviation/non - compliance,
if any
1 Principle 1:Inst i tut ional Investors s h o u l d f o r m u l a t e a comprehens i ve po l i cy on the discharge of their stewardship responsibilities, publicly disclose it, review and update it periodically.
Complied HSBC Asset Management (India) Private Limited's (AMIN) 'Policy on Stewardship responsibilities' (Stewardship Code / Policy) was formulated and implemented on 01 July, 2020. This is a comprehensive document which has been publicly disclosed on the website of AMIN. The same shall follow a periodic review.
N.A.
2 Principle 2:Inst i tut ional investors should have a clear policy on how they manage conflicts of interest in fulfilling their stewardship responsibilities and publicly disclose it.
Complied Defining and managing Conflict of Interest in fulfilling stewardship responsibilities are detailed in the Stewardship Policy document. The policy document is publicly disclosed.
N.A.

12
Abridged Annual Report 2020 - 2021
Trustees’ ReportFor the year ended March 31, 2021 (Contd...)
S. no.
Particulars of Principles of Stewardship code
Status of compliance (complied/
not complied)
description remarks/reasons for
deviation/non - compliance,
if any
3 Principle 3:
Institutional investors should monitor their investee companies.
Complied AMIN monitors all investee companies through its investment process. This includes assessment of companies’ own and market data, consideration of research from brokers and other independent research providers – including ESG & voting research, attending individual & group meetings with company management and directors, visiting production sites (wherever necessary), engaging with key stakeholders including competitors and customers, and financial modelling. More details enumerated in the policy document
N.A.
4 Principle 4:
Inst i tut ional investors should have a clear policy on intervention in their investee companies. Institutional investors should also have a clear policy for collaboration with other institutional investors where required, to preserve the interests of the ultimate investors, which should be disclosed.
Complied Details of undertaking active engagement with investee companies and the policy for collaboration with other institutional holders are detailed in the policy document. The policy document is publicly disclosed.
N.A.
5 Principle 5:
Inst i tut ional investors should have a clear policy on voting and disclosure of voting activity.
Complied AMIN has a clear and detailed voting policy which provides the framework for the voting decisions. All voting decisions shall be in accordance with AMIN’s Voting Policy and Procedures, which is disclosed on the website. AMIN discloses the details of the voting on its website on a quarterly basis within 10 working days from the end of the quarter. Additionally, AMIN also discloses the details of the votes cast, in the annual report of the schemes of HSBC Mutual Fund.
N.A.
6 Principle 6:
Institutional investors should report periodically on their stewardship activities.
Complied The annual status report of the stewardship code and quarterly report on proxy voting are publicly disclosed on the website as required under SEBI Regulations.
N.A.
13
HSBC Flexi Debt Fund
Trustees’ ReportFor the year ended March 31, 2021 (Contd...)
13. Significant event after the end of the financial Year
HSBC Global Consumer Opportunities Fund (HGCOF) has been merged with HSBC Asia Pacific (Ex Japan) Dividend Yield Fund with effect from May 13, 2021. Therefore, HGCOF has been ceased to exist from the aforesaid date.
14. acknoWledgementS
The Trustees wish to thank the Unit holders of the Schemes for their support throughout the year and also thank the Government of India, the Securities and Exchange Board of India (SEBI), the Reserve Bank of India (RBI) and the Association of Mutual Funds in India (AMFI) for the guidance provided by them. The Trustees also appreciate the services provided by the Registrar and Transfer Agent, Fund Accountant, Custodian, Bankers, Distributors and Brokers. The guidance and services provided by the Auditors and advocates and the ebullience, sincerity and dedication of the employees of HSBC Asset Management (India) Private Limited is also appreciated.
The Trustees look forward to the continued support of everyone.
For and on behalf of the Board of Trustees of HSBC Mutual Fund
Sd/-
Trustee
Mumbai
July 20, 2021.
14
Abridged Annual Report 2020 - 2021
To the Trustees of HSBC Mutual Fund
hSBc flexi debt fund
Report on the Audit of the Financial Statements
OpinionWe have audited the financial statements of hSBc flexi debt Fund (the ‘Scheme’) of HSBC Mutual Fund, which comprise the balance sheet as at 31 March 2021 and the revenue account and cash flow statement for the year then ended, and notes to the financial statements, including a summary of the significant accounting policies.
In our opinion and to the best of our information and according to the explanations given to us, the aforesaid financial statements give a true and fair view in conformity with the accounting principles generally accepted in India, of the state of affairs of the Scheme as at 31 March 2021, its net surplus and cash flows for the year ended on that date.
Basis for opinionWe conducted our audit in accordance with the Standards on Auditing (‘SAs’) issued by the Institute of Chartered Accountants of India (the ‘ICAI’). Our responsibilities under those SAs are further described in the Auditor’s Responsibilities for the Audit of the Financial Statements section of our report. We are independent of the Scheme in accordance with the Code of Ethics issued by the ICAI, and we have fulfilled our other ethical responsibilities in accordance with the Code of Ethics. We believe that the audit evidence we have obtained is sufficient and appropriate to provide a basis for our opinion.
responsibilities of management and those charged with governance for the financial StatementsThe Scheme’s management, the Board of Directors of HSSBC Mutual Fund (the ‘Trustee’) and the Board of Directors of HSBC Asset Management (India) Private Limited (the ‘AMC’) (collectively referred to as ‘Management’) are responsible for the preparation of these financial statements that give a true and fair view of the state of affairs, results of operations and cash flows of the Scheme in accordance with the accounting policies and standards specified in the Ninth Schedule of the Securities and Exchange Board of India (Mutual Funds) Regulations, 1996, as amended (the ‘Regulations’) and the accounting principles generally accepted in India. This responsibility includes design, implementation and maintenance of internal control relevant to the preparation and presentation of the financial statements that give a true and fair view and are free from material misstatement, whether due to fraud or error.
In preparing the financial statements, management is responsible for assessing the Scheme’s ability to continue as a going concern, disclosing, as applicable, matters related to going concern and using the going concern basis of accounting unless management either intends to liquidate the Scheme or to cease operations, or has no realistic alternative but to do so.
The management is responsible for overseeing the Scheme’s financial reporting process.
auditor’s responsibilities for the audit of the financial StatementsOur objectives are to obtain reasonable assurance about whether the financial statements as a whole are free from material misstatement, whether due to fraud or error, and to issue an auditor’s report that includes our opinion. Reasonable assurance is a high level of assurance, but is not a guarantee that an audit conducted in accordance with SAs will always detect a material misstatement when it exists. Misstatements can arise from fraud or error and are considered material if, individually or in the aggregate, they could reasonably be expected to influence the economic decisions of users taken on the basis of these financial statements.
As part of an audit in accordance with SAs, we exercise professional judgment and maintain professional skepticism throughout the audit. We also:
• Identifyandassesstherisksofmaterialmisstatementofthefinancialstatements,whetherduetofraudor error, design and perform audit procedures responsive to those risks, and obtain audit evidence that is sufficient and appropriate to provide a basis for our opinion. The risk of not detecting a material
Independent Auditors’ Report
15
HSBC Flexi Debt Fund
Independent Auditors’ Report (Contd...)
misstatement resulting from fraud is higher than for one resulting from error, as fraud may involve collusion, forgery, intentional omissions, misrepresentations, or the override of internal control;
• Obtainanunderstandingofinternalcontrolrelevanttotheauditinordertodesignauditproceduresthat are appropriate in the circumstances, but not for the purpose of expressing an opinion on the effectiveness of the Scheme’s internal controls;
• Evaluatetheappropriatenessofaccountingpoliciesusedandthereasonablenessofaccountingestimatesand related disclosures made by Management;
• ConcludeontheappropriatenessofManagement’suseofthegoingconcernbasisofaccountingand,based on the audit evidence obtained, whether a material uncertainty exists related to events or conditions that may cast significant doubt on the Scheme’s ability to continue as a going concern. If we conclude that a material uncertainty exists, we are required to draw attention in our auditor’s report to the related disclosures in the financial statements or, if such disclosures are inadequate, to modify our opinion. Our conclusions are based on the audit evidence obtained up to the date of our auditor’s report. However, future events or conditions may cause the Scheme to cease to continue as a going concern;
• Evaluate the overall presentation, structure and content of the financial statements, including thedisclosures and whether the financial statements represent the underlying transactions and events in a manner that achieves fair presentation.
We communicate with those charged with governance regarding, among other matters, the planned scope and timing of the audit and significant audit findings, including any significant deficiencies in internal control that we identify during our audit.
We also provide those charged with governance with a statement that we have complied with relevant ethical requirements regarding independence, and to communicate with them all relationships and other matters that may reasonably be thought to bear on our independence, and where applicable, related safeguards.
report on other legal and regulatory requirements 1 As required by Regulation 55 (4) of the Regulations, we report that:
(a) We have obtained all information and explanations which, to the best of our knowledge and belief, were necessary for the purposes of the audit; and
(b) The balance sheet and the revenue account have been prepared in accordance with the accounting policies and standards as specified in the Ninth Schedule of the Regulations.
2 As required by Clause 5 (ii) (2) of the Eleventh Schedule of the Regulations, we report that the balance sheet and the revenue account are in agreement with the books of account of the Scheme.
3 As required by the Eight Schedule of the Regulations, we report that, in our opinion and on the basis of information and explanations given to us, the methods used to value non - traded securities, as at 31 March 2021, as determined by the Board of Directors of the AMC, are in accordance with the Regulations and other guidelines issued by the Securities and Exchange Board of India as applicable and approved by the Board of Directors of the Trustee, are fair and reasonable.
For B S R & Co. LLP Chartered Accountants Firm’s Registration No: 101248W/W-100022
Sd/-
Ajit Viswanath PartnerMembership No: 067114UDIN : 21067114AAAADB4360
Place : Mumbai Date : July 20, 2021.
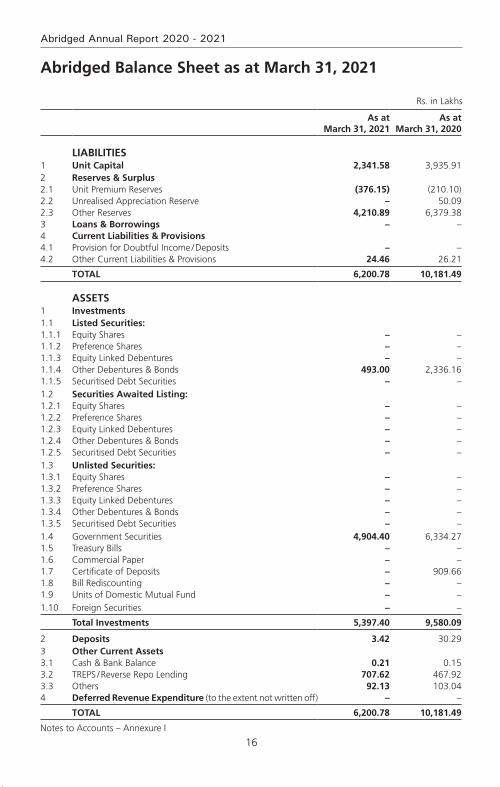
16
Abridged Annual Report 2020 - 2021
Rs. in Lakhs
As at March 31, 2021
As at March 31, 2020
LIABILITIES1 Unit Capital 2,341.58 3,935.912 Reserves & Surplus2.1 Unit Premium Reserves (376.15) (210.10)2.2 Unrealised Appreciation Reserve – 50.092.3 Other Reserves 4,210.89 6,379.383 Loans & Borrowings – –4 Current Liabilities & Provisions4.1 Provision for Doubtful Income / Deposits – –4.2 Other Current Liabilities & Provisions 24.46 26.21
TOTAL 6,200.78 10,181.49
ASSETS1 Investments1.1 Listed Securities:1.1.1 Equity Shares – –1.1.2 Preference Shares – –1.1.3 Equity Linked Debentures – –1.1.4 Other Debentures & Bonds 493.00 2,336.161.1.5 Securitised Debt Securities – –1.2 Securities Awaited Listing:1.2.1 Equity Shares – –1.2.2 Preference Shares – –1.2.3 Equity Linked Debentures – –1.2.4 Other Debentures & Bonds – –1.2.5 Securitised Debt Securities – –1.3 Unlisted Securities:1.3.1 Equity Shares – –1.3.2 Preference Shares – –1.3.3 Equity Linked Debentures – –1.3.4 Other Debentures & Bonds – –1.3.5 Securitised Debt Securities – –1.4 Government Securities 4,904.40 6,334.271.5 Treasury Bills – –1.6 Commercial Paper – –1.7 Certificate of Deposits – 909.661.8 Bill Rediscounting – –1.9 Units of Domestic Mutual Fund – –1.10 Foreign Securities – –
Total Investments 5,397.40 9,580.09
2 Deposits 3.42 30.293 Other Current Assets3.1 Cash & Bank Balance 0.21 0.153.2 TREPS / Reverse Repo Lending 707.62 467.923.3 Others 92.13 103.044 Deferred Revenue Expenditure (to the extent not written off) – –
TOTAL 6,200.78 10,181.49
Notes to Accounts – Annexure I
Abridged Balance Sheet as at March 31, 2021
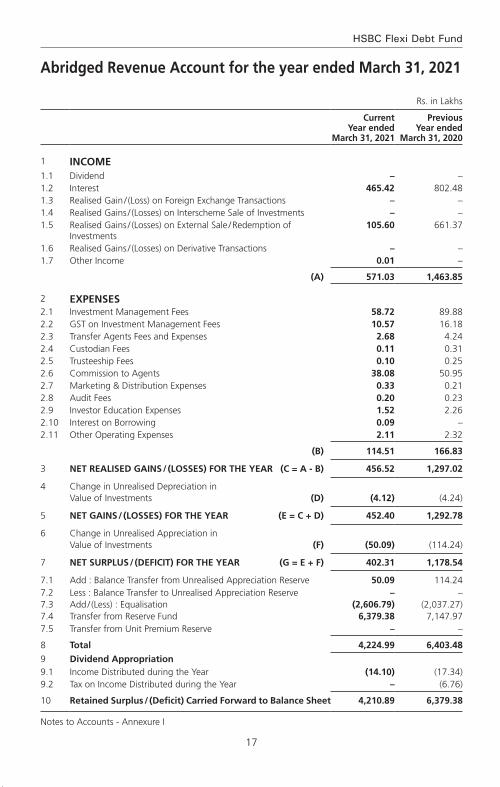
17
HSBC Flexi Debt Fund
Abridged Revenue Account for the year ended March 31, 2021
Rs. in Lakhs
Current Year ended
March 31, 2021
Previous Year ended
March 31, 2020
1 INCOME1.1 Dividend – –1.2 Interest 465.42 802.481.3 Realised Gain / (Loss) on Foreign Exchange Transactions – –1.4 Realised Gains / (Losses) on Interscheme Sale of Investments – –1.5 Realised Gains / (Losses) on External Sale / Redemption of
Investments105.60 661.37
1.6 Realised Gains / (Losses) on Derivative Transactions – –1.7 Other Income 0.01 –
(A) 571.03 1,463.85
2 EXPENSES2.1 Investment Management Fees 58.72 89.882.2 GST on Investment Management Fees 10.57 16.182.3 Transfer Agents Fees and Expenses 2.68 4.242.4 Custodian Fees 0.11 0.312.5 Trusteeship Fees 0.10 0.252.6 Commission to Agents 38.08 50.952.7 Marketing & Distribution Expenses 0.33 0.212.8 Audit Fees 0.20 0.232.9 Investor Education Expenses 1.52 2.262.10 Interest on Borrowing 0.09 –2.11 Other Operating Expenses 2.11 2.32
(B) 114.51 166.83
3 NET REALISED GAINS / (LOSSES) FOR THE YEAR (C = A - B) 456.52 1,297.02
4 Change in Unrealised Depreciation in Value of Investments (D) (4.12) (4.24)
5 NET GAINS / (LOSSES) FOR THE YEAR (E = C + D) 452.40 1,292.78
6 Change in Unrealised Appreciation in Value of Investments (F) (50.09) (114.24)
7 NET SURPLUS / (DEFICIT) FOR THE YEAR (G = E + F) 402.31 1,178.54
7.1 Add : Balance Transfer from Unrealised Appreciation Reserve 50.09 114.247.2 Less : Balance Transfer to Unrealised Appreciation Reserve – –7.3 Add / (Less) : Equalisation (2,606.79) (2,037.27)7.4 Transfer from Reserve Fund 6,379.38 7,147.977.5 Transfer from Unit Premium Reserve – –
8 Total 4,224.99 6,403.48
9 Dividend Appropriation9.1 Income Distributed during the Year (14.10) (17.34)9.2 Tax on Income Distributed during the Year – (6.76)
10 Retained Surplus / (Deficit) Carried Forward to Balance Sheet 4,210.89 6,379.38
Notes to Accounts - Annexure I
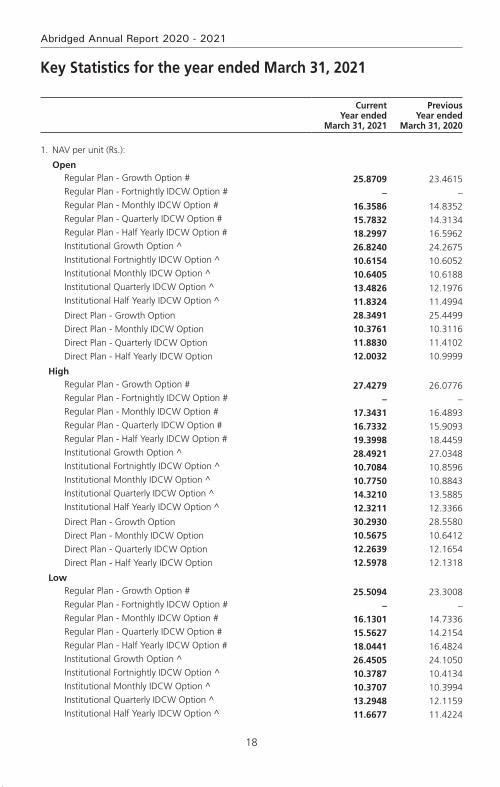
18
Abridged Annual Report 2020 - 2021
Key Statistics for the year ended March 31, 2021
Current Year ended
March 31, 2021
Previous Year ended
March 31, 2020
1. NAV per unit (Rs.):
OpenRegular Plan - Growth Option # 25.8709 23.4615Regular Plan - Fortnightly IDCW Option # – –Regular Plan - Monthly IDCW Option # 16.3586 14.8352 Regular Plan - Quarterly IDCW Option # 15.7832 14.3134 Regular Plan - Half Yearly IDCW Option # 18.2997 16.5962 Institutional Growth Option ^ 26.8240 24.2675 Institutional Fortnightly IDCW Option ^ 10.6154 10.6052 Institutional Monthly IDCW Option ^ 10.6405 10.6188 Institutional Quarterly IDCW Option ^ 13.4826 12.1976 Institutional Half Yearly IDCW Option ^ 11.8324 11.4994 Direct Plan - Growth Option 28.3491 25.4499 Direct Plan - Monthly IDCW Option 10.3761 10.3116 Direct Plan - Quarterly IDCW Option 11.8830 11.4102 Direct Plan - Half Yearly IDCW Option 12.0032 10.9999
HighRegular Plan - Growth Option # 27.4279 26.0776Regular Plan - Fortnightly IDCW Option # – –Regular Plan - Monthly IDCW Option # 17.3431 16.4893 Regular Plan - Quarterly IDCW Option # 16.7332 15.9093 Regular Plan - Half Yearly IDCW Option # 19.3998 18.4459 Institutional Growth Option ^ 28.4921 27.0348 Institutional Fortnightly IDCW Option ^ 10.7084 10.8596 Institutional Monthly IDCW Option ^ 10.7750 10.8843 Institutional Quarterly IDCW Option ^ 14.3210 13.5885 Institutional Half Yearly IDCW Option ^ 12.3211 12.3366 Direct Plan - Growth Option 30.2930 28.5580 Direct Plan - Monthly IDCW Option 10.5675 10.6412 Direct Plan - Quarterly IDCW Option 12.2639 12.1654 Direct Plan - Half Yearly IDCW Option 12.5978 12.1318
LowRegular Plan - Growth Option # 25.5094 23.3008Regular Plan - Fortnightly IDCW Option # – –Regular Plan - Monthly IDCW Option # 16.1301 14.7336 Regular Plan - Quarterly IDCW Option # 15.5627 14.2154 Regular Plan - Half Yearly IDCW Option # 18.0441 16.4824 Institutional Growth Option ^ 26.4505 24.1050 Institutional Fortnightly IDCW Option ^ 10.3787 10.4134 Institutional Monthly IDCW Option ^ 10.3707 10.3994 Institutional Quarterly IDCW Option ^ 13.2948 12.1159 Institutional Half Yearly IDCW Option ^ 11.6677 11.4224

19
HSBC Flexi Debt Fund
Current Year ended
March 31, 2021
Previous Year ended
March 31, 2020
Direct Plan - Growth Option 27.9592 25.2908
Direct Plan - Monthly IDCW Option 10.1174 10.1385
Direct Plan - Quarterly IDCW Option 11.7195 11.3389
Direct Plan - Half Yearly IDCW Option 11.8211 10.9311
EndRegular Plan - Growth Option # 27.0033 25.8709Regular Plan - Fortnightly IDCW Option # – –Regular Plan - Monthly IDCW Option # 17.0746 16.3586 Regular Plan - Quarterly IDCW Option # 16.4741 15.7832 Regular Plan - Half Yearly IDCW Option # 19.0990 18.2997 Institutional Growth Option ^ 28.0668 26.8240 Institutional Fortnightly IDCW Option ^ 10.4849 10.6154 Institutional Monthly IDCW Option ^ 10.4768 10.6405 Institutional Quarterly IDCW Option ^ 14.1072 13.4826 Institutional Half Yearly IDCW Option ^ 11.6755 11.8324
Direct Plan - Growth Option 29.8957 28.3491
Direct Plan - Monthly IDCW Option 10.2256 10.3761
Direct Plan - Quarterly IDCW Option 11.8019 11.8830
Direct Plan - Half Yearly IDCW Option – 12.0032
2. Closing Assets Under Management (Rs. in Lakhs)
End 6,166 10,136
Average (AAuM)1 7,598 11,322
3. Gross income as % of AAuM2 7.52% 12.93%
4. Expense Ratio:
a. total expense as % of aaum (including gSt on management fees) (planwise)
Regular Plan - Growth Option # 1.98% 1.98%Institutional Growth Option ^ 1.74% 1.74%
Direct Plan - Growth Option 0.96% 0.97%
b. Management Fee as % of AAuM (planwise)
Regular Plan - Growth Option # 0.76% 0.76%Institutional Growth Option ^ 0.80% 0.82%
Direct Plan - Growth Option 0.73% 0.75%
5. Net Income as a percentage of AAuM3 6.01% 11.46%
6. Portfolio turnover ratio4 – –
7. Total Dividend per unit distributed during the year (planwise)
Retail
Institutional Fortnightly IDCW Option ^ 0.6128 0.7629
Institutional Monthly IDCW Option ^ 0.6473 0.7541
Key Statistics for the year ended March 31, 2021 (Contd...)
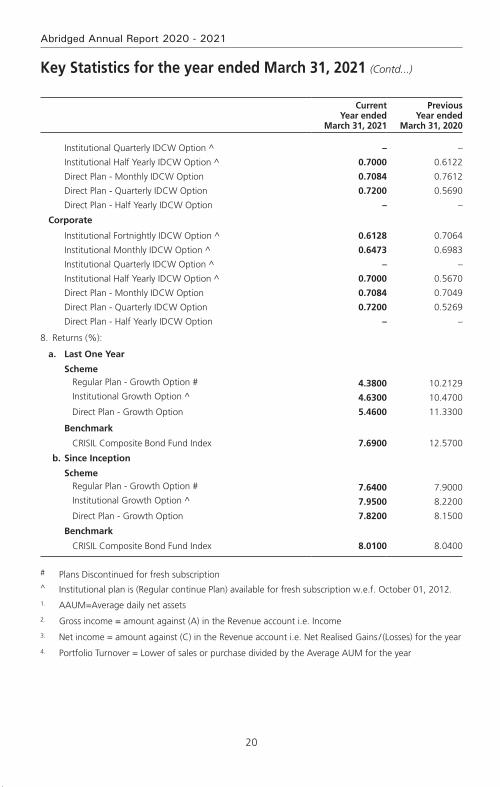
20
Abridged Annual Report 2020 - 2021
Current Year ended
March 31, 2021
Previous Year ended
March 31, 2020
Institutional Quarterly IDCW Option ^ – –
Institutional Half Yearly IDCW Option ^ 0.7000 0.6122
Direct Plan - Monthly IDCW Option 0.7084 0.7612
Direct Plan - Quarterly IDCW Option 0.7200 0.5690
Direct Plan - Half Yearly IDCW Option – –
Corporate
Institutional Fortnightly IDCW Option ^ 0.6128 0.7064
Institutional Monthly IDCW Option ^ 0.6473 0.6983
Institutional Quarterly IDCW Option ^ – –
Institutional Half Yearly IDCW Option ^ 0.7000 0.5670
Direct Plan - Monthly IDCW Option 0.7084 0.7049
Direct Plan - Quarterly IDCW Option 0.7200 0.5269
Direct Plan - Half Yearly IDCW Option – –
8. Returns (%):
a. Last One Year
SchemeRegular Plan - Growth Option # 4.3800 10.2129Institutional Growth Option ^ 4.6300 10.4700
Direct Plan - Growth Option 5.4600 11.3300
Benchmark
CRISIL Composite Bond Fund Index 7.6900 12.5700
b. Since Inception
SchemeRegular Plan - Growth Option # 7.6400 7.9000Institutional Growth Option ^ 7.9500 8.2200
Direct Plan - Growth Option 7.8200 8.1500
Benchmark
CRISIL Composite Bond Fund Index 8.0100 8.0400
# Plans Discontinued for fresh subscription^ Institutional plan is (Regular continue Plan) available for fresh subscription w.e.f. October 01, 2012.1. AAUM=Average daily net assets2. Gross income = amount against (A) in the Revenue account i.e. Income3. Net income = amount against (C) in the Revenue account i.e. Net Realised Gains / (Losses) for the year4. Portfolio Turnover = Lower of sales or purchase divided by the Average AUM for the year
Key Statistics for the year ended March 31, 2021 (Contd...)
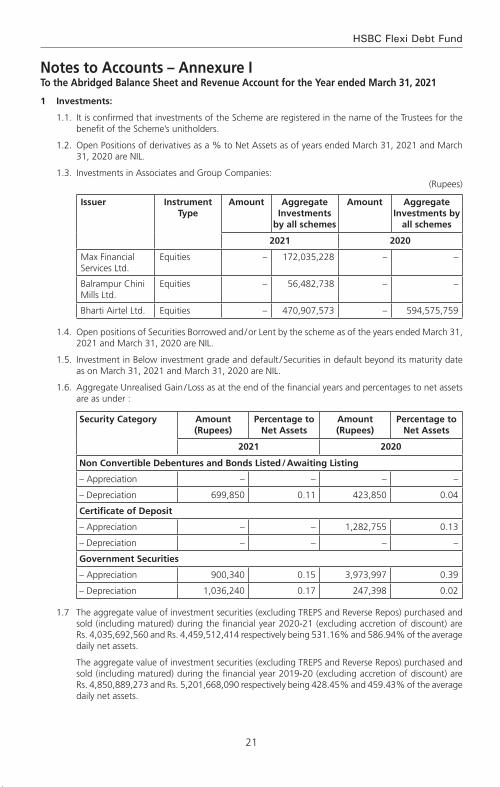
21
HSBC Flexi Debt Fund
Notes to Accounts – Annexure ITo the Abridged Balance Sheet and Revenue Account for the Year ended March 31, 2021
1 Investments:
1.1. It is confirmed that investments of the Scheme are registered in the name of the Trustees for the benefit of the Scheme’s unitholders.
1.2. Open Positions of derivatives as a % to Net Assets as of years ended March 31, 2021 and March 31, 2020 are NIL.
1.3. Investments in Associates and Group Companies:(Rupees)
Issuer Instrument Type
Amount Aggregate Investments
by all schemes
Amount Aggregate Investments by
all schemes
2021 2020
Max Financial Services Ltd.
Equities – 172,035,228 – –
Balrampur Chini Mills Ltd.
Equities – 56,482,738 – –
Bharti Airtel Ltd. Equities – 470,907,573 – 594,575,759
1.4. Open positions of Securities Borrowed and / or Lent by the scheme as of the years ended March 31, 2021 and March 31, 2020 are NIL.
1.5. Investment in Below investment grade and default / Securities in default beyond its maturity date as on March 31, 2021 and March 31, 2020 are NIL.
1.6. Aggregate Unrealised Gain / Loss as at the end of the financial years and percentages to net assets are as under :
Security Category Amount (Rupees)
Percentage to Net Assets
Amount (Rupees)
Percentage to Net Assets
2021 2020
Non Convertible Debentures and Bonds Listed / Awaiting Listing
– Appreciation – – – –
– Depreciation 699,850 0.11 423,850 0.04
Certificate of Deposit
– Appreciation – – 1,282,755 0.13
– Depreciation – – – –
Government Securities
– Appreciation 900,340 0.15 3,973,997 0.39
– Depreciation 1,036,240 0.17 247,398 0.02
1.7 The aggregate value of investment securities (excluding TREPS and Reverse Repos) purchased and sold (including matured) during the financial year 2020-21 (excluding accretion of discount) are Rs. 4,035,692,560 and Rs. 4,459,512,414 respectively being 531.16% and 586.94% of the average daily net assets.
The aggregate value of investment securities (excluding TREPS and Reverse Repos) purchased and sold (including matured) during the financial year 2019-20 (excluding accretion of discount) are Rs. 4,850,889,273 and Rs. 5,201,668,090 respectively being 428.45% and 459.43% of the average daily net assets.
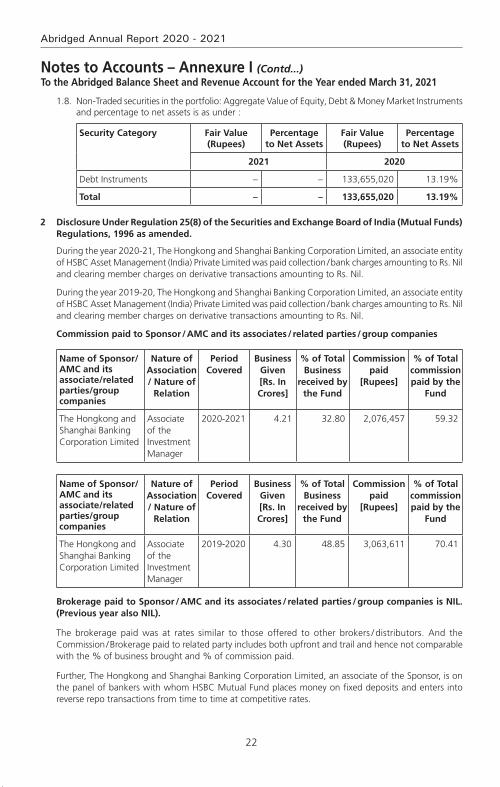
22
Abridged Annual Report 2020 - 2021
1.8. Non-Traded securities in the portfolio: Aggregate Value of Equity, Debt & Money Market Instruments and percentage to net assets is as under :
Security Category Fair Value (Rupees)
Percentage to Net Assets
Fair Value (Rupees)
Percentage to Net Assets
2021 2020
Debt Instruments – – 133,655,020 13.19%
Total – – 133,655,020 13.19%
2 Disclosure Under Regulation 25(8) of the Securities and Exchange Board of India (Mutual Funds) Regulations, 1996 as amended.
During the year 2020-21, The Hongkong and Shanghai Banking Corporation Limited, an associate entity of HSBC Asset Management (India) Private Limited was paid collection / bank charges amounting to Rs. Nil and clearing member charges on derivative transactions amounting to Rs. Nil.
During the year 2019-20, The Hongkong and Shanghai Banking Corporation Limited, an associate entity of HSBC Asset Management (India) Private Limited was paid collection / bank charges amounting to Rs. Nil and clearing member charges on derivative transactions amounting to Rs. Nil.
Commission paid to Sponsor / AMC and its associates / related parties / group companies
Name of Sponsor/AMC and its associate/related parties/group companies
Nature of Association / Nature of
Relation
Period Covered
Business Given [Rs. In Crores]
% of Total Business
received by the Fund
Commission paid
[Rupees]
% of Total commission paid by the
Fund
The Hongkong and Shanghai Banking Corporation Limited
Associate of the Investment Manager
2020-2021 4.21 32.80 2,076,457 59.32
Name of Sponsor/AMC and its associate/related parties/group companies
Nature of Association / Nature of
Relation
Period Covered
Business Given [Rs. In Crores]
% of Total Business
received by the Fund
Commission paid
[Rupees]
% of Total commission paid by the
Fund
The Hongkong and Shanghai Banking Corporation Limited
Associate of the Investment Manager
2019-2020 4.30 48.85 3,063,611 70.41
Brokerage paid to Sponsor / amc and its associates / related parties / group companies is nil. (Previous year also nil).
The brokerage paid was at rates similar to those offered to other brokers / distributors. And the Commission / Brokerage paid to related party includes both upfront and trail and hence not comparable with the % of business brought and % of commission paid.
Further, The Hongkong and Shanghai Banking Corporation Limited, an associate of the Sponsor, is on the panel of bankers with whom HSBC Mutual Fund places money on fixed deposits and enters into reverse repo transactions from time to time at competitive rates.
Notes to Accounts – Annexure I (Contd...)To the Abridged Balance Sheet and Revenue Account for the Year ended March 31, 2021
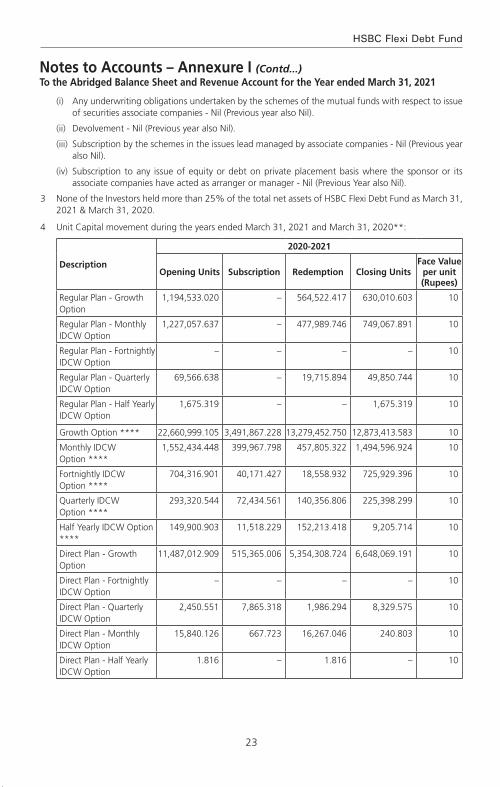
23
HSBC Flexi Debt Fund
(i) Any underwriting obligations undertaken by the schemes of the mutual funds with respect to issue of securities associate companies - Nil (Previous year also Nil).
(ii) Devolvement - Nil (Previous year also Nil).
(iii) Subscription by the schemes in the issues lead managed by associate companies - Nil (Previous year also Nil).
(iv) Subscription to any issue of equity or debt on private placement basis where the sponsor or its associate companies have acted as arranger or manager - Nil (Previous Year also Nil).
3 None of the Investors held more than 25% of the total net assets of HSBC Flexi Debt Fund as March 31, 2021 & March 31, 2020.
4 Unit Capital movement during the years ended March 31, 2021 and March 31, 2020**:
Description
2020-2021
Opening Units Subscription Redemption Closing UnitsFace Value
per unit (Rupees)
Regular Plan - Growth Option
1,194,533.020 – 564,522.417 630,010.603 10
Regular Plan - Monthly IDCW Option
1,227,057.637 – 477,989.746 749,067.891 10
Regular Plan - Fortnightly IDCW Option
– – – – 10
Regular Plan - Quarterly IDCW Option
69,566.638 – 19,715.894 49,850.744 10
Regular Plan - Half Yearly IDCW Option
1,675.319 – – 1,675.319 10
Growth Option **** 22,660,999.105 3,491,867.228 13,279,452.750 12,873,413.583 10
Monthly IDCW Option ****
1,552,434.448 399,967.798 457,805.322 1,494,596.924 10
Fortnightly IDCW Option ****
704,316.901 40,171.427 18,558.932 725,929.396 10
Quarterly IDCW Option ****
293,320.544 72,434.561 140,356.806 225,398.299 10
Half Yearly IDCW Option ****
149,900.903 11,518.229 152,213.418 9,205.714 10
Direct Plan - Growth Option
11,487,012.909 515,365.006 5,354,308.724 6,648,069.191 10
Direct Plan - Fortnightly IDCW Option
– – – – 10
Direct Plan - Quarterly IDCW Option
2,450.551 7,865.318 1,986.294 8,329.575 10
Direct Plan - Monthly IDCW Option
15,840.126 667.723 16,267.046 240.803 10
Direct Plan - Half Yearly IDCW Option
1.816 – 1.816 – 10
Notes to Accounts – Annexure I (Contd...)To the Abridged Balance Sheet and Revenue Account for the Year ended March 31, 2021
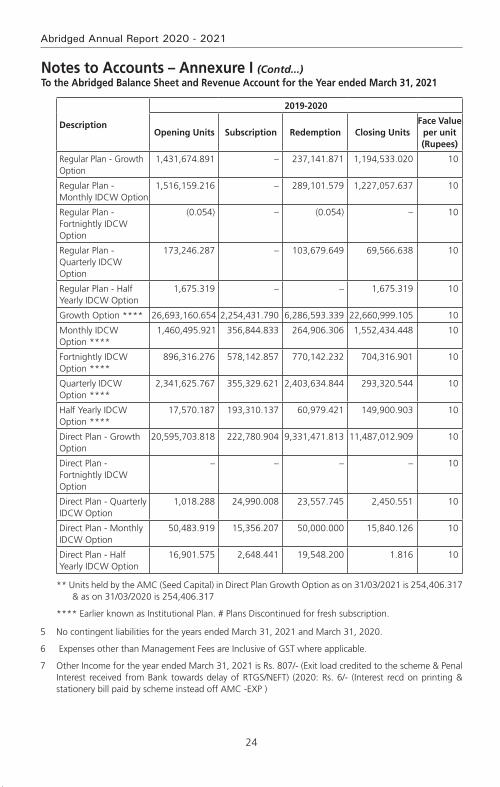
24
Abridged Annual Report 2020 - 2021
Notes to Accounts – Annexure I (Contd...)To the Abridged Balance Sheet and Revenue Account for the Year ended March 31, 2021
Description
2019-2020
Opening Units Subscription Redemption Closing UnitsFace Value
per unit (Rupees)
Regular Plan - Growth Option
1,431,674.891 – 237,141.871 1,194,533.020 10
Regular Plan - Monthly IDCW Option
1,516,159.216 – 289,101.579 1,227,057.637 10
Regular Plan - Fortnightly IDCW Option
(0.054) – (0.054) – 10
Regular Plan - Quarterly IDCW Option
173,246.287 – 103,679.649 69,566.638 10
Regular Plan - Half Yearly IDCW Option
1,675.319 – – 1,675.319 10
Growth Option **** 26,693,160.654 2,254,431.790 6,286,593.339 22,660,999.105 10
Monthly IDCW Option ****
1,460,495.921 356,844.833 264,906.306 1,552,434.448 10
Fortnightly IDCW Option ****
896,316.276 578,142.857 770,142.232 704,316.901 10
Quarterly IDCW Option ****
2,341,625.767 355,329.621 2,403,634.844 293,320.544 10
Half Yearly IDCW Option ****
17,570.187 193,310.137 60,979.421 149,900.903 10
Direct Plan - Growth Option
20,595,703.818 222,780.904 9,331,471.813 11,487,012.909 10
Direct Plan - Fortnightly IDCW Option
– – – – 10
Direct Plan - Quarterly IDCW Option
1,018.288 24,990.008 23,557.745 2,450.551 10
Direct Plan - Monthly IDCW Option
50,483.919 15,356.207 50,000.000 15,840.126 10
Direct Plan - Half Yearly IDCW Option
16,901.575 2,648.441 19,548.200 1.816 10
** Units held by the AMC (Seed Capital) in Direct Plan Growth Option as on 31/03/2021 is 254,406.317 & as on 31/03/2020 is 254,406.317
**** Earlier known as Institutional Plan. # Plans Discontinued for fresh subscription.
5 No contingent liabilities for the years ended March 31, 2021 and March 31, 2020.
6 Expenses other than Management Fees are Inclusive of GST where applicable.
7 Other Income for the year ended March 31, 2021 is Rs. 807/- (Exit load credited to the scheme & Penal Interest received from Bank towards delay of RTGS/NEFT) (2020: Rs. 6/- (Interest recd on printing & stationery bill paid by scheme instead off AMC -EXP )

25
HSBC Flexi Debt Fund
8 Investor Education Awareness
In view of the AMFI Best Practices Guidelines Circular No. 56/2016-17, the IEF ( Investor Education Fund) accrual is set aside in a separate bank account and the consolidated balance across all schemes as on March 31, 2021. The break-up of which is as under:
Particulars March 31, 2021 March 31, 2020
Amount (in Rs. Lacs) Amount (in Rs. Lacs)
Opening Balance as on April 01, 2020 307.40 214.68
Add: Accrual during FY 2020-21 195.77 237.54
Less: Transferred to AMFI * 89.04 109.69
Less: Payable to AMFI (March 2021 accrual) * 8.84 9.08
Add: Investment Income FY 2020-21 11.94 15.93
Less: Spent during FY 2020-21 43.73 41.98
Closing Balance as on March 31, 2021 373.49 307.40
*In accordance with SEBI circular number SEBI/HO/IMD/DF2/RS/813/2016 dated January 8, 2016.
9 Previous year’s figures have been re-grouped / re-arranged where appropriate.
10 garnishee notice from income tax authorities
During the financial year 2011-12, an Income tax demand of Rs. 32.58 crores was purported to be recovered under garnishee proceedings, by Income Tax Authorities in respect of investments made in Pass through Certificates (PTC) by some of the debt schemes (including matured schemes) of HSBC Mutual Fund (HSBC MF), for A.Y. 2009-2010. The said demand, impacting various mutual fund players in the industry, raised originally on the trusts sponsored by IL&FS Trust Company Ltd., (Appellants) was sought to be also recovered u/s 177(3) of the Income Tax Act, from HSBC MF.
Similar to AY 2009-10, HSBC MF had received a demand notice from the Income Tax authorities for AY 2010-11 for Rs. 6.95 crores.
Further, assessment for the A.Y. 2007-2008 was also been reopened by the Income Tax Authorities and demand of Rs. 2.04 Crores was made on the trust sponsored by IL&FS Trust Company Ltd. HSBC MF has not received any demand notice from the Income Tax authorities for this assessment year.
Against all the above demands, an appeal was filed by the Appellant with the first Appellate Authority CIT(A) and thereafter with ITAT.
The matter of several Loan Trusts were consolidated and heard by ITAT and vide order dated 17th February 2017, the Income Tax Appellate Tribunal (ITAT) passed an order allowing the appeal of the assess and dismissed the appeal of the Revenue.
The Department has filed rectification applications under section 254(2) of the Income Tax Act with ITAT against the favourable orders passed by ITAT on the ground that the Income Tax Appellate Tribunal has failed to consider all aspects of revenue contentions / appeal.
The hearing for the said matter is scheduled on September 24, 2021.
11 Following the spread of the coronavirus, on 11 March 2020, the World Health Organization declared the COVID-19 outbreak to be a pandemic. The identification of the virus as a new coronavirus, its subsequent spread and the situation of lock-down across India is considered as a significant event. HSBC Mutual Fund’s operations are included in essential services and have continued through the lock-downs declared by the Government. Service providers like the Registrar and Transfer Agent, Custodian and Fund Accountant have carried out extensive arrangements to address business needs and continuity of operations. As on the date of signing of these financial statements, Management believes that it has taken into account, all the possible impact of known events arising from COVID-19 pandemic in the
Notes to Accounts – Annexure I (Contd...)To the Abridged Balance Sheet and Revenue Account for the Year ended March 31, 2021
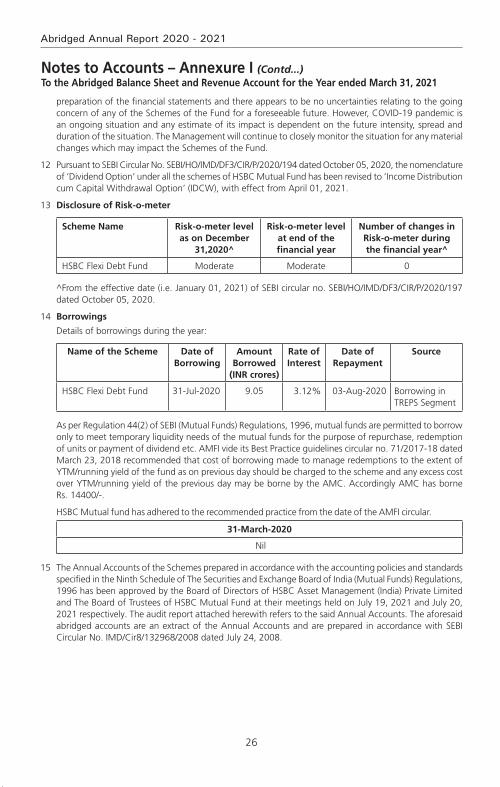
26
Abridged Annual Report 2020 - 2021
preparation of the financial statements and there appears to be no uncertainties relating to the going concern of any of the Schemes of the Fund for a foreseeable future. However, COVID-19 pandemic is an ongoing situation and any estimate of its impact is dependent on the future intensity, spread and duration of the situation. The Management will continue to closely monitor the situation for any material changes which may impact the Schemes of the Fund.
12 Pursuant to SEBI Circular No. SEBI/HO/IMD/DF3/CIR/P/2020/194 dated October 05, 2020, the nomenclature of ‘Dividend Option’ under all the schemes of HSBC Mutual Fund has been revised to ‘Income Distribution cum Capital Withdrawal Option’ (IDCW), with effect from April 01, 2021.
13 disclosure of risk-o-meter
Scheme Name Risk-o-meter level as on December
31,2020^
Risk-o-meter level at end of the financial year
Number of changes in Risk-o-meter during the financial year^
HSBC Flexi Debt Fund Moderate Moderate 0
^From the effective date (i.e. January 01, 2021) of SEBI circular no. SEBI/HO/IMD/DF3/CIR/P/2020/197 dated October 05, 2020.
14 Borrowings
Details of borrowings during the year:
Name of the Scheme Date of Borrowing
Amount Borrowed
(INR crores)
Rate of Interest
Date of Repayment
Source
HSBC Flexi Debt Fund 31-Jul-2020 9.05 3.12% 03-Aug-2020 Borrowing in TREPS Segment
As per Regulation 44(2) of SEBI (Mutual Funds) Regulations, 1996, mutual funds are permitted to borrow only to meet temporary liquidity needs of the mutual funds for the purpose of repurchase, redemption of units or payment of dividend etc. AMFI vide its Best Practice guidelines circular no. 71/2017-18 dated March 23, 2018 recommended that cost of borrowing made to manage redemptions to the extent of YTM/running yield of the fund as on previous day should be charged to the scheme and any excess cost over YTM/running yield of the previous day may be borne by the AMC. Accordingly AMC has borne Rs. 14400/-.
HSBC Mutual fund has adhered to the recommended practice from the date of the AMFI circular.
31-March-2020
Nil
15 The Annual Accounts of the Schemes prepared in accordance with the accounting policies and standards specified in the Ninth Schedule of The Securities and Exchange Board of India (Mutual Funds) Regulations, 1996 has been approved by the Board of Directors of HSBC Asset Management (India) Private Limited and The Board of Trustees of HSBC Mutual Fund at their meetings held on July 19, 2021 and July 20, 2021 respectively. The audit report attached herewith refers to the said Annual Accounts. The aforesaid abridged accounts are an extract of the Annual Accounts and are prepared in accordance with SEBI Circular No. IMD/Cir8/132968/2008 dated July 24, 2008.
Notes to Accounts – Annexure I (Contd...)To the Abridged Balance Sheet and Revenue Account for the Year ended March 31, 2021

27
HSBC Flexi Debt Fund
Voting Policy and Procedures
In view of SEBI guidelines related to “Role of Mutual Funds in Corporate Governance of Public Listed Companies”, HSBC AMC has formulated its “Policy for Proxy Voting in Public Listed Companies”. The said policy is available on our website and the details of actual exercise of proxy votes, the summary of votes casted and the auditor’s certificate for the Financial Year 2020 – 21 is forming part of our full Annual Report for the Financial Year 2020 – 21 which is uploaded on our website at http://www.assetmanagement.hsbc.co.in
28
Abridged Annual Report 2020 - 2021
Statutory Details & Disclaimers
All the returns have been sourced from Mutual Funds India Explorer software. The performance of the schemes and the benchmark is calculated on a total return basis. This document has been prepared by HSBC Asset Management (India) Private Ltd (HSBC) for information purposes only and should not be construed as i) an offer or recommendation to buy or sell securities, commodities, currencies or other investments referred to herein; or ii) an offer to sell or a solicitation or an offer for purchase of any of the funds of HSBC Mutual Fund; or iii) an investment research or investment advice. All information contained in this document (including that sourced from third parties), is obtained from sources HSBC and the third party which HSBC believes to be reliable however, has not independently verified the same. The information and opinions contained within the document are based upon publicly available information and rates of taxation applicable (if any) at the time of publication, which are subject to change from time to time.
Expressions of opinion are those of HSBC only and are subject to change without notice. It does not have regard to specific investment objectives, financial situation and the particular needs of any specific person who may receive this document. Investors should seek personal and independent advice regarding the appropriateness of investing in any of the funds, securities, other investment or investment strategies that may have been discussed or referred herein and should understand that the views regarding future prospects may or may not be realized. In no event shall HSBC Mutual Fund / HSBC Asset management (India) Private Limited and / or its affiliates or any of their directors, trustees, officers and employees be liable for any direct, indirect, special, incidental or consequential damages arising out of the use of information / opinion herein. Neither this document nor the units of HSBC Mutual Fund have been registered in any jurisdiction. The distribution of this document in certain jurisdictions may be restricted or totally prohibited and accordingly, persons who come into possession of this document are required to inform themselves about, and to observe, any such restrictions.
mutual fund investments are subject to market risks, read all scheme related documents carefully.
HSBC Debt FundAn open ended medium to long term debt Scheme investing in instruments such that the Macaulay duration of the portfolio is between 4 years to 7 years
Abridged Annual Report 2020 - 2021

1
HSBC Debt Fund
Dear Investor,
The beginning of the last financial year now almost seems like a distant memory. COVID-19 was still a relatively unknown enemy and governments across the world were grappling with ways to control and mitigate the risks associated with it. Nationwide lockdowns were the norm and our markets both equity and fixed income reacted negatively leading to significant erosion of wealth. Within a short period of time markets bounced back. This confounded even the most astute market pundits. How is it possible that when GDP growth had slowed down, unemployment had risen, inflation was high could there be such sharp up move in equity indices. Whilst the reasons are well known about easy global liquidity, demand resurgence, cost cutting by corporates etc. perhaps its most important to remember that the markets are not a reflector but a predictor of economic activity.
At all times particularly during such volatile times it is important to go back to the basics. Why do you save, why do you invest, what goals would you like to achieve, how old are you, what is your risk appetite? The replies to these simple questions will help you determine your asset allocation. As an example when equity markets corrected sharply last year, investors who reviewed their asset allocation, stayed invested during the lows of the past year and were able to capture the rebound and have seen prime returns since then. The current market movement in all likelihood would have also led to some imbalances in your asset allocation. Do not ignore that and I strongly recommend that you do review this with your advisor to check whether re-balancing is required.
During this financial year we had three very successful new fund launches. The pandemic showed us a clear trend of dominant players becoming stronger and profit pool getting consolidated within a few companies. To capture this opportunity, we launched the HSBC Focused Equity Fund which garnered close to Rs. 520 crores. During the second half of 2020, in the fixed income space, 3 - 5 year duration range had a favourable investment scenario as RBI’s accommodative policy and surplus liquidity had reduced the returns at the very short end of the yield curve. There was a demand for an actively managed moderate duration strategy with better credit quality which we fulfilled by launching HSBC Corporate Bond Fund. It garnered over 700 crores. Our latest and first of its kind offering, HSBC Global Equity Climate Change Fund of Fund saw a stupendous response with over 8000 investors investing over Rs. 616 crores. This is an investment opportunity which goes beyond the rationale of simply generating investment returns and is the future of responsible investing.
We worked towards augmenting our digital capabilities by launching a few key enhancements to our online transaction platform. Being mindful of the movement restrictions in place, this year we focused on digitizing offline processes so that an investor need not need step out of her home for investing or availing any key services. While our interactive chatbot AskMe, eased service queries, our end-to-end digital KYC module enabled a first time Mutual Fund investor to invest in our funds without any paperwork. We listened to your feedback and digitized consolidation of folios and change of tax status which eliminated the need for you to physically visit our branches.
I am a strong believer in the India story and this story has just begun. The opportunity to invest in this high growth market is a very exciting opportunity. I do hope you share my enthusiasm and I ask that you continue to invest whilst reviewing your asset allocation at all times. As always thank you for your business. Stay safe.
Warm regards,
Ravi MenonChief Executive Officer,
HSBC Asset Management India

2
Abridged Annual Report 2020 - 2021
SPONSOR
HSBC Securities and Capital Markets (India) Private LimitedRegd. Office: 52/60, Mahatma Gandhi Road, Fort, Mumbai - 400 001.
TRUSTEE
Board of TrusteesOffice: 16, Veer Nariman Road, Fort, Mumbai 400 001.
ASSET MANAGEMENT COMPANY
HSBC Asset Management (India) Private LimitedCorp. & Regd. Office: 16, Veer Nariman Road, Fort, Mumbai 400 001.
CUSTODIAN
Standard Chartered Bank (SCB)Corp. & Regd. Office: Crescenzo, Securities Services, 3rd Floor, C-38/39, G-Block,Bandra Kurla Complex, Bandra East, Mumbai – 400051.
AUDITORS TO THE SCHEME
BSR & Co. LLPChartered Accountants
5th Floor, Lodha Excelus, Apollo Mills Compound, N. M. Joshi Marg, Mahalaxmi, Mumbai 400 011.
REGISTRAR & TRANSFER AGENTS
Computer Age Management Services Limited (CAMS)Unit: HSBC Mutual Fund ’C’ Block, 2nd Floor, Hanudev Info Park P. Ltd., SF No. 558/2, Udayampalayam Road, Nava India, Coimbatore - 641 028.
BOARD OF TRUSTEES
Ms. Jasmine Batliwalla - Chairperson
Mr. Nani Javeri - Trustee
Dr. T. C. Nair - Trustee
Mr. Pedro Bastos - Trustee
BOARD OF DIRECTORS
Mr. Dinesh Mittal - Director
Dr. Indu Shahani - Director
Mr. Ravi Menon - Director & Chief Executive Officer
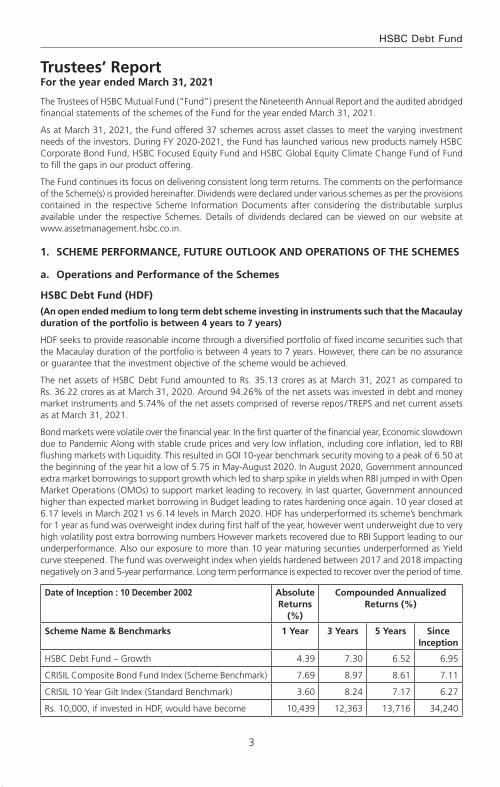
3
HSBC Debt Fund
The Trustees of HSBC Mutual Fund (“Fund”) present the Nineteenth Annual Report and the audited abridged financial statements of the schemes of the Fund for the year ended March 31, 2021.
As at March 31, 2021, the Fund offered 37 schemes across asset classes to meet the varying investment needs of the investors. During FY 2020-2021, the Fund has launched various new products namely HSBC Corporate Bond Fund, HSBC Focused Equity Fund and HSBC Global Equity Climate Change Fund of Fund to fill the gaps in our product offering.
The Fund continues its focus on delivering consistent long term returns. The comments on the performance of the Scheme(s) is provided hereinafter. Dividends were declared under various schemes as per the provisions contained in the respective Scheme Information Documents after considering the distributable surplus available under the respective Schemes. Details of dividends declared can be viewed on our website at www.assetmanagement.hsbc.co.in.
1. Scheme Performance, future outlook and oPerationS of the SchemeS
a. operations and Performance of the Schemes
hSBc debt fund (hdf)
(an open ended medium to long term debt scheme investing in instruments such that the macaulay duration of the portfolio is between 4 years to 7 years)
HDF seeks to provide reasonable income through a diversified portfolio of fixed income securities such that the Macaulay duration of the portfolio is between 4 years to 7 years. However, there can be no assurance or guarantee that the investment objective of the scheme would be achieved.
The net assets of HSBC Debt Fund amounted to Rs. 35.13 crores as at March 31, 2021 as compared to Rs. 36.22 crores as at March 31, 2020. Around 94.26% of the net assets was invested in debt and money market instruments and 5.74% of the net assets comprised of reverse repos / TREPS and net current assets as at March 31, 2021.
Bond markets were volatile over the financial year. In the first quarter of the financial year, Economic slowdown due to Pandemic Along with stable crude prices and very low inflation, including core inflation, led to RBI flushing markets with Liquidity. This resulted in GOI 10-year benchmark security moving to a peak of 6.50 at the beginning of the year hit a low of 5.75 in May-August 2020. In August 2020, Government announced extra market borrowings to support growth which led to sharp spike in yields when RBI jumped in with Open Market Operations (OMOs) to support market leading to recovery. In last quarter, Government announced higher than expected market borrowing in Budget leading to rates hardening once again. 10 year closed at 6.17 levels in March 2021 vs 6.14 levels in March 2020. HDF has underperformed its scheme’s benchmark for 1 year as fund was overweight index during first half of the year, however went underweight due to very high volatility post extra borrowing numbers However markets recovered due to RBI Support leading to our underperformance. Also our exposure to more than 10 year maturing securities underperformed as Yield curve steepened. The fund was overweight index when yields hardened between 2017 and 2018 impacting negatively on 3 and 5-year performance. Long term performance is expected to recover over the period of time.
date of inception : 10 december 2002 absolute returns
(%)
compounded annualized returns (%)
Scheme name & Benchmarks 1 Year 3 Years 5 Years Since inception
HSBC Debt Fund – Growth 4.39 7.30 6.52 6.95
CRISIL Composite Bond Fund Index (Scheme Benchmark) 7.69 8.97 8.61 7.11
CRISIL 10 Year Gilt Index (Standard Benchmark) 3.60 8.24 7.17 6.27
Rs. 10,000, if invested in HDF, would have become 10,439 12,363 13,716 34,240
Trustees’ ReportFor the year ended March 31, 2021
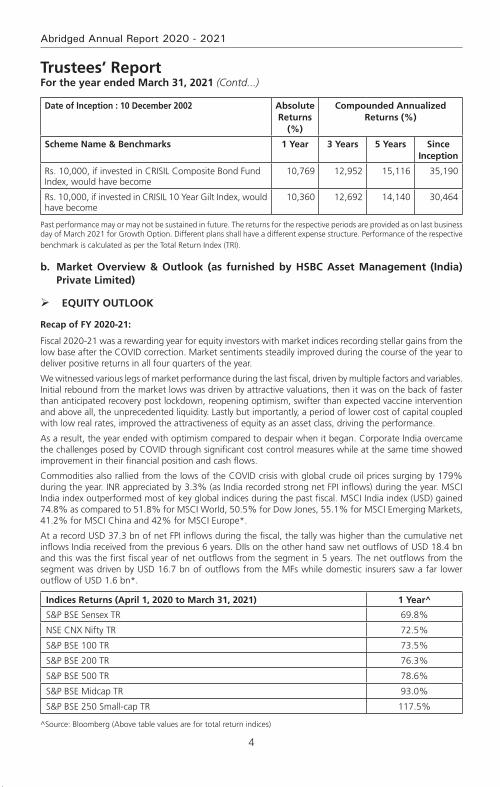
4
Abridged Annual Report 2020 - 2021
date of inception : 10 december 2002 absolute returns
(%)
compounded annualized returns (%)
Scheme name & Benchmarks 1 Year 3 Years 5 Years Since inception
Rs. 10,000, if invested in CRISIL Composite Bond Fund Index, would have become
10,769 12,952 15,116 35,190
Rs. 10,000, if invested in CRISIL 10 Year Gilt Index, would have become
10,360 12,692 14,140 30,464
Past performance may or may not be sustained in future. The returns for the respective periods are provided as on last business day of March 2021 for Growth Option. Different plans shall have a different expense structure. Performance of the respective benchmark is calculated as per the Total Return Index (TRI).
b. market overview & outlook (as furnished by hSBc asset management (india) Private limited)
equitY outlook
recap of fY 2020-21:
Fiscal 2020-21 was a rewarding year for equity investors with market indices recording stellar gains from the low base after the COVID correction. Market sentiments steadily improved during the course of the year to deliver positive returns in all four quarters of the year.
We witnessed various legs of market performance during the last fiscal, driven by multiple factors and variables. Initial rebound from the market lows was driven by attractive valuations, then it was on the back of faster than anticipated recovery post lockdown, reopening optimism, swifter than expected vaccine intervention and above all, the unprecedented liquidity. Lastly but importantly, a period of lower cost of capital coupled with low real rates, improved the attractiveness of equity as an asset class, driving the performance.
As a result, the year ended with optimism compared to despair when it began. Corporate India overcame the challenges posed by COVID through significant cost control measures while at the same time showed improvement in their financial position and cash flows.
Commodities also rallied from the lows of the COVID crisis with global crude oil prices surging by 179% during the year. INR appreciated by 3.3% (as India recorded strong net FPI inflows) during the year. MSCI India index outperformed most of key global indices during the past fiscal. MSCI India index (USD) gained 74.8% as compared to 51.8% for MSCI World, 50.5% for Dow Jones, 55.1% for MSCI Emerging Markets, 41.2% for MSCI China and 42% for MSCI Europe*.
At a record USD 37.3 bn of net FPI inflows during the fiscal, the tally was higher than the cumulative net inflows India received from the previous 6 years. DIIs on the other hand saw net outflows of USD 18.4 bn and this was the first fiscal year of net outflows from the segment in 5 years. The net outflows from the segment was driven by USD 16.7 bn of outflows from the MFs while domestic insurers saw a far lower outflow of USD 1.6 bn*.
indices returns (april 1, 2020 to march 31, 2021) 1 Year^
S&P BSE Sensex TR 69.8%
NSE CNX Nifty TR 72.5%
S&P BSE 100 TR 73.5%
S&P BSE 200 TR 76.3%
S&P BSE 500 TR 78.6%
S&P BSE Midcap TR 93.0%
S&P BSE 250 Small-cap TR 117.5%
^Source: Bloomberg (Above table values are for total return indices)
Trustees’ ReportFor the year ended March 31, 2021 (Contd...)
5
HSBC Debt Fund
Way forward:
Beginning of the new fiscal, India had to contend with the risk of the second COVID wave, which was more ferocious than the first wave on the human impact. However, as we write this, the second wave has already peaked and there have been a significant fall in number of active cases, case-positivity rate, daily new caseload and deaths. Vaccination drive also has seen acceleration with and is now closer to 6 mn doses per day mark. Also, the impact of the lockdown on economic activity has been significantly lower during the second wave, compared to last year. In most of the states, the unlocking process has already begun in a phased manner and this is leading to improvement in various activity indicators. Mobility indicators are recovering faster while economic indicators (freight, credit off-take, E-way bill generation, power demand etc.) are also witnessing a gradual recovery. The recently concluded earnings season has turned out to be in-line with expectations and despite the concerns of around the second wave, the earnings (Nifty) have seen upgrades for FY22. Market is looking beyond the current quarter (i.e. 1QFY22), which would witness an impact due to the second wave. Our baseline assumption is that of a temporary impact from the second wave and the set-back to the recovery process limited to a few months, after which we should see the economic rebound. So far, this is tracking in-line with assumptions.
From a macro perspective, the current estimates for GDP growth in FY22 stand at 9.2%* (after seeing downgrades to factor in the impact of second wave). The downgrade in estimates are pertaining to the first quarter and hence the trajectory of growth from hereon should pick up. The tax collections data for the first two months of FY22 has remained strong, implying that the drawdown of the second wave on the fiscal position is not alarming. Additionally, the impact of fiscal stimulus package announced in FY22 so far is manageable (about 60 bps of GDP) and hence would not lead to any fiscal strain.
After the spectacular rally, market valuations at an overall level are now trending above historical averages on traditional valuation metrics (P/E, P/B). This is true for all market capitalization categories (viz large, mid and small). Typically, the broader market (i.e. mid and small cap segments), trade at a discount to large caps, however this scenario has now reversed after the outperformance from the broader market segments. However, the earnings momentum continues to remain strong (witnessing upgrades so far) and except for a short period due to second wave, the earnings momentum should hold up.
We believe that the risk-reward is balanced for the equity markets in the near term. Higher or sticky inflation expectations globally, higher than historical market valuations on some parameters (i.e. P/E, P/B) and adverse demand impact from the second wave are risk factors to contend with in the near term. However, these are counter balanced by positive commentary from companies, significant decline in COVID cases and acceleration in the vaccination programme. As a result, in the near term markets may see a consolidation phase and could take cues from the upcoming earnings season with more focus on the corporate commentary and the outlook. From a medium to long term perspective, the outlook for equity markets remains positive. The expectation of cyclical revival in the economy brings in a multi-year earnings visibility. This along with a benign cost of capital environment, should support equity performance. However, equity returns are likely to moderate on the back of the relatively high valuations and the strong recovery we have already witnessed from the COVID lows. Equity performance is likely to mirror the earnings growth trends over the medium to long term.
Pace of vaccination, concerns about a third wave, corporate earnings trajectory, inflation trends (both global & domestic), monsoon trends and commodity prices (especially crude oil) are some of the key factors which could influence market performance in the short term.
From a portfolio perspective, we are maintaining a pro-cyclical bias. We expect earnings growth to rebound sharply post the current COVID phase. Earnings growth are expected to sustain in high-teens beyond FY22 on the back of economy witnessing a cyclical recovery due to revival in capex cycle over the next 2-3 years (first by the government followed by private capex). From a sectoral perspective our order of preference is rate sensitives followed by domestic cyclicals, exporters and domestic consumption. Predominantly regulated businesses come last in our pecking order. This preference is dictated by our assessment of sectors / segments leading contribution to the market earnings growth over the next 2-3 years. Our portfolio construction is driven by a bottom up approach to stock selection with a focus on names that can deliver positive earnings surprises. We continue to focus on this theme to identify likely outperformers.
*Source: Bloomberg
Trustees’ ReportFor the year ended March 31, 2021 (Contd...)
6
Abridged Annual Report 2020 - 2021
deBt outlook
market drivers during the course of the year fY21
The Fixed Income markets started the year with a bout of nervousness that was triggered by the pandemic. While RBI had calmed the markets with its large rate cut action of 75bp cut followed by liquidity supportive measures, the volatility continued until mid-May when government announced its relief package. While it was not fiscally expansive, it touched the right cords in terms of credit flow to desired sectors. This was followed up with RBI’s credit relief measures in terms of moratorium and restructuring of assets that were stressed due to the pandemic. Throughout the course of the year, RBI maintained its accommodative stance along with significant amount of surplus liquidity that was supportive and helped in maintaining stability in the market. However, as the year progressed and pressure on fiscal began to mount yields started seeing a spike towards the last quarter of the fiscal. While borrowing was stepped up to INR 12 trillion from previously budgeted INR 7.8 trillion in May 2020, it was further enhanced by and additional INR 1.1 trillion in October 2020. Overall GOI ended up borrowing a record amount of INR 13.9 trillion. The budget proved to be a shocker with GOI using the pandemic as an opportunity for setting the finances in order. GOI showed a record deficit of 9.5% for FY21 and projected a 6.8% for FY22 with estimated central government gross borrowing of INR 12 trillion. This seemed to reverse the support RBI had provided throughout the year with benchmark 10-year bond peaking to 6.23% in mid –Feb 2021. RBI’s statements to remain supportive were left in the sidelines. Overall it seemed that the 115bp of rate cut, along with significant liquidity infusion (OMO + Twist operations of ~INR 3 trillion, infusion via dollar purchases) seemed only a little to help in applying a brake to the one-way spike in yields. The year closed ~6.16% with absence of concrete action by RBI.
rBi Policy: Through the course of the year, RBI has maintained an accommodative stance, with an aggregate 115bp of rate cut done in March and May 2020 taking the repo rate from 5.15% to 4%. Subsequently while inflation pressures prevented RBI from taking any direct actions, RBI has used a combination of creative tools to keep the rates contained primarily via liquidity supportive tools such as OMOs, Twist Operations, Repo linked Term loans to needy sectors (LTROs, TLTROs), CRR cuts. While inflation was a worry for most part of the year, RBI kept it aside admitting that growth was a priority and inflation effects are more supply side rather than demand side. Prospectively into FY22, with the onset of the second wave, RBI continues to maintain the stance to prioritize growth.
inflation: Inflation for most part of the year stayed above 6% primarily driven by supply side pressures and some intermittent spike from food inflation as well. While it has been coming off since December with cooling off of food inflation and positive base effects, it has been between 4- 5.5%. Structurally however inflation risks continue to remain as oil prices have increased and base effects will not remain supportive for long. Core inflation continues to remain sticky.
liquidity: During the year, system liquidity has remained at significant surplus facilitated largely by RBI action such as OMOs, foreign exchange operations and government spending.
Budget: The FY2022 union budget focuses on growth and has accordingly, presented a 9.5% fiscal deficit for FY21 and 6.8% for FY22. On the revenue side, the assumptions are largely realistic, with FY22 (E) Nominal GDP growth at 14.4% and tax revenue growth at 17% considering the pandemic impact in FY 21. Compared to FY20, tax revenue growth is ~10%. While non-tax revenues are ambitious pegging the divestment at INR 1.75 trillion, with robust pipeline of assets including monetization of road and transmission assets, execution remains the key as in the past. On the expenditure side, better quality capex spending with focusing on rail, road, defense, urban infra is positive for long term structural growth. The revenue side expenditure adjusting for clearance of past subsidy arrears will be similar to budgetary estimates. Government using this opportunity to bring back off-balance sheet spending to on-balance sheet was a welcome move towards transparency and showing realistic projections. Alongside, states have also been given leeway to borrow upto 4% of their GDP with an additional 0.5% subject to conditions. Given that states are an important vehicle for capex investment, this move is welcome although it may entail additional state borrowing. The fiscal glide path is shifted to FY26 at below 4.5% for center and 3% for states suggesting that spending will continue and borrowing will come down gradually. In summary, from survival to revival, FY22 budget aims for structural growth leaving fiscal concerns sideways in the interim. Government’s intent seems clear on bringing back growth on the table, in a transparent manner.
While the second wave of the pandemic has once again derailed the revenue story, government will still have some cushion from its conservative estimates.
Trustees’ ReportFor the year ended March 31, 2021 (Contd...)

7
HSBC Debt Fund
currency and fii flows: INR has been on an appreciation trajectory for most part of the year, aided by dollar underperformance supported by positive FII and FDI flows along with reduced imports on the domestic front as well. RBI has used most of the flows to accumulate reserves which has prevented any strong appreciation. Pandemic shock and global risk off led rupee over 75 in the beginning of the year only to close below 72 at the end of the fiscal year. While the second wave led to another spike in INR in April, it has since then cooled once again driven by dollar underperformance and pandemic recovery on the domestic front. Net FII flows was ~$30 bn with positive equity flows of~$37 bn while debt was negative ~$7bn and overall RBI’s forex reserves rose by a ~$100 bn to close ~$537 bn.
credit growth: Credit growth for the entire year has been tepid as previous year’s credit events were followed by nervousness relating to the pandemic. Despite RBI opening up several windows to finance the non-AAA segment, there was very little fresh credit flowing that segment. Overall banking credit grew by only 6.5%. Risk appetite has however been improving from a complete risk aversion to opening up towards a calculated risk. Prospectively it is expected that once the pandemic risk abates, credit growth will resume primarily driven by government capex spending and demand recovery.
market outlook
The pandemic once again brought the country to a situation similar to last year and debt markets perhaps interpreted the same as a structural rise in rates. In the initial day’s post budget in Feb of 2021, market was expecting a concrete set of actions such as an OMO calendar from RBI, and RBI’s words alone failed to calm the market. The first auction of the fiscal year also saw a devolvement. However, RBI acted in the first policy of the year announcing a bond buyback program akin to QE (quantitative easing) and its subsequent cancellation of auctions wherein yields were perhaps quoted higher than RBI’s comfort levels brought back confidence into the market. Since then we have seen a strong rally with 10-year benchmark trending below 6% and the curve moving alongside. RBI reiteration of priority of growth and also supporting with higher than expected dividend payment stand out as a testimony of its support. While we do not expect RBI to act in terms of rate cuts, we believe that measures such as G-SAP, OMOs will continue until there is visibility of a structural growth. Therefore, the large borrowing program should go without any hiccups.
Furthermore, with the evidence of strong GST numbers until April 2021 (before the 2nd wave), it is expected that growth and therefore fiscal revenues will come back. Government’s conservative budget estimates are supportive. Also, given the fact that compared to last year there has not been a complete shutdown of activity (lockdowns being distributed), the impact on growth will not be similar to last year. Pent up demand will come back to support revenue collection. However, on the flipside, once growth resumes RBI will be forced to withdraw liquidity in a phased manner to prevent asset bubbles. Nevertheless, RBI need not act in terms of rate actions and we believe that a prolonged pause in terms of RBI rates is in the offing.
Net-net therefore while growth is wanting no matter what, it may come at a small price of rise in yields with liquidity withdrawal. That is however expected more in the 2nd half of the year. Lower than expected borrowing numbers, later this year or if not in next year could be a surprise. We may therefore see a range bound rate action in the near term with a rising bias over time. Global rate environment, oil and currency risks are to be watched out for.
2. Brief Background of SPonSorS, Board of truSteeS and aSSet management comPanY
a. Sponsor
HSBC Mutual Fund is sponsored by HSBC Securities and Capital Markets (India) Private Limited (HSCI). The Sponsor is the Settler of the Mutual Fund Trust. The Sponsor has entrusted a sum of Rs. 1,00,000/- (Rupees One Lakh only) to the Trustee as the initial contribution towards the corpus of the Mutual Fund.
HSCI offers integrated investment banking services, securities and corporate finance & advisory. HSCI is a member of the Bombay Stock Exchange Limited and National Stock Exchange (capital and derivative market segments). HSCI holds 100% of the paid up equity share capital of HSBC Asset Management (India) Private Limited.
Trustees’ ReportFor the year ended March 31, 2021 (Contd...)
8
Abridged Annual Report 2020 - 2021
b. hSBc mutual fund
HSBC Mutual Fund (“the Mutual Fund” or “the Fund”) has been constituted as a Trust in accordance with the provisions of the Indian Trusts Act, 1882 (2 of 1882) vide a Trust Deed dated February 7, 2002 with HSBC Securities and Capital Markets (India) Private Limited, as the Sponsor and the Board of Individual Trustees. The Trustee has entered into an Investment Management Agreement dated February 7, 2002 with HSBC Asset Management (India) Private Limited (AMC) to function as the Investment Manager for all the schemes of the Fund. The Fund was registered with SEBI vide registration number MF/046/02/5 dated May 27, 2002.
The Trust has been formed for the purpose of pooling of capital from the public for collective investment in securities for the purpose of providing facilities for participation by persons as beneficiaries in such investments and in the profits/income arising therefrom.
c. Board of trustees (the trustees)
The Board of Trustees is the exclusive owner of the Trust Fund and holds the same in trust for the benefit of the unit holders. The Trustees have been discharging their duties and carrying out the responsibilities as provided in the SEBI (Mutual Funds) Regulations, 1996 and the Trust Deed. The Trustees seek to ensure that the Fund and the schemes floated there under are managed by the AMC in accordance with the Trust Deed, the said Regulations, directions and guidelines issued by the SEBI, the Stock Exchanges, the Association of Mutual Funds in India and other regulatory agencies.
d. asset management company (the amc)
HSBC Asset Management (India) Private Limited (the Investment Manager or the AMC) is a private limited company incorporated under the Companies Act, 1956 on December 12, 2001 having its Registered Office at 16, V. N. Road, Fort, Mumbai 400 001. HSBC Asset Management (India) Private Limited has been appointed as the Asset Management Company of HSBC Mutual Fund by the Trustee vide Investment Management Agreement (IMA) dated February 7, 2002 and executed between the Trustees and the AMC. SEBI approved the AMC to act as the Investment Manager of the Fund vide its letter No. MFD/BC/163/2002 dated May 27, 2002. The paid-up equity share capital of the AMC is Rs. 61.59 crores. The AMC is registered as a Portfolio Manager under the SEBI (Portfolio Managers) Regulations, 1993 vide registration no. INP000001322. The AMC also offers non-binding Advisory services to offshore funds under the mutual fund license.
HSBC Securities and Capital Markets (India) Private Limited holds 100% of the paid up equity share capital of the AMC.
3. inveStment oBjective of the SchemeSThe investment objective of the respective schemes has been provided above under the heading “Scheme Performance, Future Outlook and Operation of the Scheme” (Refer Section 1).
4. Significant accounting PolicieS The Significant Accounting Policies form part of the Notes to the Accounts annexed to the Balance Sheet of the Schemes in the Full Annual Report. The accounting policies are in accordance with Securities Exchange Board of India (Mutual Funds) Regulations 1996.
5. unclaimed dividendS & redemPtionSSummary of number of investors & corresponding amount Scheme-wise as on March 31, 2021
Schemeunclaimed dividend unclaimed redemption
amount (rs.) no. of investors
amount (rs.) no. of investors
HSBC Debt Fund 680,906.04 1846 1,551,485.84 33
6. inveStor ServiceS
The number of official points of acceptance of transactions is 204 locations. In addition to the offices of the Registrar & Transfer agents, the AMC has Investor Service Centers in 9 locations at its own offices - namely
Trustees’ ReportFor the year ended March 31, 2021 (Contd...)

9
HSBC Debt Fund
Trustees’ ReportFor the year ended March 31, 2021 (Contd...)
Mumbai, New Delhi, Kolkata, Bangalore, Pune, Ahmedabad, Hyderabad, Chandigarh and Chennai. With a view to enhance customer convenience, the AMC has the facility of priority based servicing to key distributors through the enhancement of the Interactive Voice Reponses. The AMC has 2 Toll Free numbers (1-800-200-2434 /1-800-258-2434) which can be dialed from anywhere in India and 1 number i.e +91 44 39923900 (Investors calling from abroad). The call center service is being managed by the Registrar and Transfer Agents. Transactions for purchase / redemption of units in the schemes HSBC Mutual Fund can also be made through the online transaction facility on the AMC’s website at https://invest.assetmanagement.hsbc.co.in.
On the distribution front, the number of empaneled distributors was 1069 as on March 31, 2021. During the year, the AMC initiated tie-ups for online distribution of the Mutual Fund’s schemes with several channel partners taking the total number of such tie-ups to 52.
7. detailS of inveStor grievance redreSSal
The details of the redressal of investor complaints received against HSBC Mutual Fund during April 2020 - March 2021 are as follows:
2020-2021
com-plaint code
type of complaint# (a) no. of complaints pending at the begin-ning of the
year
(b) no. of com-
plaints received during
the year
action on (a) and (b)
resolved non action-
able
Pending
Within 30
days
30 - 60 days
60 - 180 days
Beyond 180 days
0 - 3 months
3 - 6 months
6 - 9 months
9 - 12 months
I A Non receipt of Dividend on Units
0 0 0 0 0 0 0 0 0 0 0
I B Interest on delayed payment of Dividend
0 0 0 0 0 0 0 0 0 0 0
I C Non receipt of Redemption Proceeds
0 8 7 0 0 0 0 1 0 0 0
I D Interest on delayed payment of Redemption
0 0 0 0 0 0 0 0 0 0 0
II A Non receipt of Statement of Account / Unit Certificate
0 0 0 0 0 0 0 0 0 0 0
II B Discrepancy in Statement of Account
0 1 1 0 0 0 0 0 0 0 0
II C Data corrections in Investor details **
0 12 12 0 0 0 0 0 0 0 0
II D Non receipt of Annual Report/Abridged Summary
0 0 0 0 0 0 0 0 0 0 0
III A Wrong switch between Schemes
0 0 0 0 0 0 0 0 0 0 0
III B Unauthorized switch between Schemes
0 0 0 0 0 0 0 0 0 0 0
III C Deviation from Scheme attributes
0 0 0 0 0 0 0 0 0 0 0
III D Wrong or excess charges/load
0 0 0 0 0 0 0 0 0 0 0
III E Non updation of changes viz. address, PAN, bank details, nomination, etc
0 6 6 0 0 0 0 0 0 0 0
IV Others 0 15 15 0 0 0 0 0 0 0 0
total 0 42 41 0 0 0 0 1 0 0 0
10
Abridged Annual Report 2020 - 2021
Summary of complaints for fY 2020-21
Particulars count
Total complaints received 42
Total number of folios 148770
% of complaints against the folio 0.028%
# active folios
** As per AMFI Best Practice Guidelines Circular No. 25/2011-12 for Revisions in the Guidelines on Standardization of Complaints / Grievances Reporting Procedure. If “Others” include a type of complaint which is more than 10% of overall complaints, then such a reason should be provided separately. Hence data corrections in Investor Details is included as a separate category
* Non actionable means the complaint is incomplete / outside the scope of the mutual fund
8. inveStor education initiativeS
Investor awareness advertisements were published in Mutual Fund Insight magazine on a monthly basis along with an editorial on ‘SIP Sahi Hai’. Additionally, monthly articles / blogs have been written by Advisorkhoj on IAP which talks of the advantages of SIP, start early, power of compounding, diversification, asset allocation etc. The same is promoted by the publisher via an email to their entire network and also on their social media handles which can be retweeted or liked. Also, educative infographics have been hosted on our website under the investor resources section. The same have also been circulated to existing Indian investors via email for engagement and for educative purposes.
9. ProxY voting PolicY
In terms of SEBI Circular no. SEBI/IMD/CIR No. 18/198647/2010 dated March 15, 2010, the Fund has adopted Proxy Voting Policy and Procedures for exercising voting rights in respect of securities held by the Schemes.
The summary of the votes casted in the general meetings of the Investee companies, by the AMC for and on behalf of the Schemes of the Fund, for the financial year 2020-2021 is provided below:
quarter total no. of resolutions
Break-up of vote decision
for against abstained
June 2020 50 43 6 1
September 2020 752 656 38 58
December 2020 41 31 1 9
March 2021 40 30 8 2
total 883 760 53 70
In terms of the requirement of SEBI Circular no. CIR/IMD/DF/05/2014 dated March 24, 2014 and SEBI/HO/IMD/DF2/CIR/P/2016/68 dated August 10, 2016; the AMC has obtained certificate from M/s. M. P. Chitale & Co., Chartered Accountants, who is acting as a Scrutinizer, on the voting report for the FY 2020-21. The certificate dated April 14, 2021 issued by M/s. M. P. Chitale & Co., is available on the website of the AMC as part of the full Annual Report.
Unit holders can refer to the full Annual Report for complete details of actual exercise of votes in the general meetings of the investee companies for the financial year 2020-21 or log on to our website at www.assetmanagement.hsbc.co.in.
10. StatutorY detailS
a) The Sponsors are not responsible or liable for any loss resulting from the operation of the Schemes of the Fund beyond initial contribution of Rs. 1 lakh for setting up the Fund.
Trustees’ ReportFor the year ended March 31, 2021 (Contd...)
11
HSBC Debt Fund
Trustees’ ReportFor the year ended March 31, 2021 (Contd...)
b) The price and redemption value of the units, and income from them, can go up as well as down with fluctuations in the market value of its underlying investments.
c) Full Annual Report of HSBC Mutual Fund and of HSBC Asset Management (India) Private Limited (the AMC) shall be disclosed on the website at www.assetmanagement.hsbc.co.in and shall be available for inspection at the Head Office of the Mutual Fund. Present and prospective unit holders can obtain copy of the Trust Deed, the full Annual Report of the Scheme(s), the Annual Report of HSBC Asset Management (India) Private Limited and the text of the relevant Scheme(s) at a price.
11. Scheme WiSe changeS in riSk-o-meter of the SchemeS of hSBc mutual fund during fY 2021
As per the requirements of SEBI Circular no. SEBI/HO/IMD/DF3/CIR/P/2020/197 dated October 05, 2020 the changes carried out in the risk-o-meter of the schemes of HSBC Mutual Fund during FY 2021 have been given in the below mentioned table for the information of the Unitholders, a report on the said changes has also been displayed on the website of the Fund and AMFI.
Scheme name
risk-o-meter level as on december
31,2020^
risk-o-meter level at end of
the financial year
number of changes in risk-o-meter during the
financial year^
dec-2020 mar-2021 dec 2020 to march 2021
HSBC Debt Fund Moderate Moderate 0
^From the effective date (i.e. January 01, 2021) of SEBI circular no. SEBI/HO/IMD/DF3/CIR/P/2020/197 dated October 05, 2020.
12. governance under the PolicY on SteWardShiP reSPonSiBilitieS of hSBc mutual fund
As per the requirements of SEBI Circular no. CIR/CFD/CMD1/ 168 /2019 dated December 24, 2019, HSBC Mutual Fund has adapted the policy on stewardship responsibilities, the unitholders are requested to note the status of governance with the same as mentioned below:
S. no.
Particulars of Principles of Stewardship code
Status of compliance (complied/
not complied)
description remarks/reasons for
deviation/non - compliance,
if any
1 Principle 1:
Institutional Investors should formulate a comprehensive policy on the discharge of their stewardship responsibilities, publicly disclose it, review and update it periodically.
Complied HSBC Asset Management (India) Private Limited's (AMIN) 'Policy on Stewardship responsibilities' (Stewardship Code / Policy) was formulated and implemented on 01 July, 2020. This is a comprehensive document which has been publicly disclosed on the website of AMIN. The same shall follow a periodic review.
N.A.
2 Principle 2:
Inst i tut ional investors should have a clear policy on how they manage conflicts of interest in fulfilling their stewardship responsibilities and publicly disclose it.
Complied Defining and managing Conflict of Interest in fulfilling stewardship responsibilities are detailed in the Stewardship Policy document. The policy document is publicly disclosed.
N.A.

12
Abridged Annual Report 2020 - 2021
Trustees’ ReportFor the year ended March 31, 2021 (Contd...)
S. no.
Particulars of Principles of Stewardship code
Status of compliance (complied/
not complied)
description remarks/reasons for
deviation/non - compliance,
if any
3 Principle 3:
Institutional investors should monitor their investee companies.
Complied AMIN monitors all investee companies through its investment process. This includes assessment of companies’ own and market data, consideration of research from brokers and other independent research providers – including ESG & voting research, attending individual & group meetings with company management and directors, visiting production sites (wherever necessary), engaging with key stakeholders including competitors and customers, and financial modelling. More details enumerated in the policy document
N.A.
4 Principle 4:
Inst i tut ional investors should have a clear policy on intervention in their investee companies. Institutional investors should also have a clear policy for collaboration with other institutional investors where required, to preserve the interests of the ultimate investors, which should be disclosed.
Complied Details of undertaking active engagement with investee companies and the policy for collaboration with other institutional holders are detailed in the policy document. The policy document is publicly disclosed.
N.A.
5 Principle 5:
Inst i tut ional investors should have a clear policy on voting and disclosure of voting activity.
Complied AMIN has a clear and detailed voting policy which provides the framework for the voting decisions. All voting decisions shall be in accordance with AMIN’s Voting Policy and Procedures, which is disclosed on the website. AMIN discloses the details of the voting on its website on a quarterly basis within 10 working days from the end of the quarter. Additionally, AMIN also discloses the details of the votes cast, in the annual report of the schemes of HSBC Mutual Fund.
N.A.
6 Principle 6:
Institutional investors should report periodically on their stewardship activities.
Complied The annual status report of the stewardship code and quarterly report on proxy voting are publicly disclosed on the website as required under SEBI Regulations.
N.A.
13
HSBC Debt Fund
Trustees’ ReportFor the year ended March 31, 2021 (Contd...)
13. Significant event after the end of the financial Year
HSBC Global Consumer Opportunities Fund (HGCOF) has been merged with HSBC Asia Pacific (Ex Japan) Dividend Yield Fund with effect from May 13, 2021. Therefore, HGCOF has been ceased to exist from the aforesaid date.
14. acknoWledgementS
The Trustees wish to thank the Unit holders of the Schemes for their support throughout the year and also thank the Government of India, the Securities and Exchange Board of India (SEBI), the Reserve Bank of India (RBI) and the Association of Mutual Funds in India (AMFI) for the guidance provided by them. The Trustees also appreciate the services provided by the Registrar and Transfer Agent, Fund Accountant, Custodian, Bankers, Distributors and Brokers. The guidance and services provided by the Auditors and advocates and the ebullience, sincerity and dedication of the employees of HSBC Asset Management (India) Private Limited is also appreciated.
The Trustees look forward to the continued support of everyone.
For and on behalf of the Board of Trustees of HSBC Mutual Fund
Sd/-
Trustee
Mumbai
July 20, 2021.

14
Abridged Annual Report 2020 - 2021
To the Trustees of HSBC Mutual Fund
hSBc debt fund
Report on the Audit of the Financial Statements
OpinionWe have audited the financial statements of hSBc debt fund (the ‘Scheme’) of HSBC Mutual Fund, which comprise the balance sheet as at 31 March 2021 and the revenue account for the year then ended, and notes to the financial statements, including a summary of the significant accounting policies.
In our opinion and to the best of our information and according to the explanations given to us, the aforesaid financial statements give a true and fair view in conformity with the accounting principles generally accepted in India, of the state of affairs of the Scheme as at 31 March 2021, its net surplus for the year ended on that date.
Basis for opinionWe conducted our audit in accordance with the Standards on Auditing (‘SAs’) issued by the Institute of Chartered Accountants of India (the ‘ICAI’). Our responsibilities under those SAs are further described in the Auditor’s Responsibilities for the Audit of the Financial Statements section of our report. We are independent of the Scheme in accordance with the Code of Ethics issued by the ICAI, and we have fulfilled our other ethical responsibilities in accordance with the Code of Ethics. We believe that the audit evidence we have obtained is sufficient and appropriate to provide a basis for our opinion.
responsibilities of management and those charged with governance for the financial StatementsThe Scheme’s management, the Board of Directors of HSSBC Mutual Fund (the ‘Trustee’) and the Board of Directors of HSBC Asset Management (India) Private Limited (the ‘AMC’) (collectively referred to as ‘Management’) are responsible for the preparation of these financial statements that give a true and fair view of the state of affairs, results of operations of the Scheme in accordance with the accounting policies and standards specified in the Ninth Schedule of the Securities and Exchange Board of India (Mutual Funds) Regulations, 1996, as amended (the ‘Regulations’) and the accounting principles generally accepted in India. This responsibility includes design, implementation and maintenance of internal control relevant to the preparation and presentation of the financial statements that give a true and fair view and are free from material misstatement, whether due to fraud or error.
In preparing the financial statements, management is responsible for assessing the Scheme’s ability to continue as a going concern, disclosing, as applicable, matters related to going concern and using the going concern basis of accounting unless management either intends to liquidate the Scheme or to cease operations, or has no realistic alternative but to do so.
The management is responsible for overseeing the Scheme’s financial reporting process.
auditor’s responsibilities for the audit of the financial StatementsOur objectives are to obtain reasonable assurance about whether the financial statements as a whole are free from material misstatement, whether due to fraud or error, and to issue an auditor’s report that includes our opinion. Reasonable assurance is a high level of assurance, but is not a guarantee that an audit conducted in accordance with SAs will always detect a material misstatement when it exists. Misstatements can arise from fraud or error and are considered material if, individually or in the aggregate, they could reasonably be expected to influence the economic decisions of users taken on the basis of these financial statements.
As part of an audit in accordance with SAs, we exercise professional judgment and maintain professional skepticism throughout the audit. We also:
• Identifyandassesstherisksofmaterialmisstatementofthefinancialstatements,whetherduetofraudor error, design and perform audit procedures responsive to those risks, and obtain audit evidence that is sufficient and appropriate to provide a basis for our opinion. The risk of not detecting a material misstatement resulting from fraud is higher than for one resulting from error, as fraud may involve collusion, forgery, intentional omissions, misrepresentations, or the override of internal control;
Independent Auditors’ Report
15
HSBC Debt Fund
Independent Auditors’ Report (Contd...)
• Obtainanunderstandingofinternalcontrolrelevanttotheauditinordertodesignauditproceduresthat are appropriate in the circumstances, but not for the purpose of expressing an opinion on the effectiveness of the Scheme’s internal controls;
• Evaluatetheappropriatenessofaccountingpoliciesusedandthereasonablenessofaccountingestimatesand related disclosures made by Management;
• ConcludeontheappropriatenessofManagement’suseofthegoingconcernbasisofaccountingand,based on the audit evidence obtained, whether a material uncertainty exists related to events or conditions that may cast significant doubt on the Scheme’s ability to continue as a going concern. If we conclude that a material uncertainty exists, we are required to draw attention in our auditor’s report to the related disclosures in the financial statements or, if such disclosures are inadequate, to modify our opinion. Our conclusions are based on the audit evidence obtained up to the date of our auditor’s report. However, future events or conditions may cause the Scheme to cease to continue as a going concern;
• Evaluate the overall presentation, structure and content of the financial statements, including thedisclosures and whether the financial statements represent the underlying transactions and events in a manner that achieves fair presentation.
We communicate with those charged with governance regarding, among other matters, the planned scope and timing of the audit and significant audit findings, including any significant deficiencies in internal control that we identify during our audit.
We also provide those charged with governance with a statement that we have complied with relevant ethical requirements regarding independence, and to communicate with them all relationships and other matters that may reasonably be thought to bear on our independence, and where applicable, related safeguards.
report on other legal and regulatory requirements 1 As required by Regulation 55 (4) of the Regulations, we report that:
(a) We have obtained all information and explanations which, to the best of our knowledge and belief, were necessary for the purposes of the audit; and
(b) The balance sheet and the revenue account have been prepared in accordance with the accounting
policies and standards as specified in the Ninth Schedule of the Regulations.
2 As required by Clause 5 (ii) (2) of the Eleventh Schedule of the Regulations, we report that the balance sheet and the revenue account are in agreement with the books of account of the Scheme.
3 As required by the Eight Schedule of the Regulations, we report that, in our opinion and on the basis of information and explanations given to us, the methods used to value non - traded securities, as at 31 March 2021, as determined by the Board of Directors of the AMC, are in accordance with the Regulations and other guidelines issued by the Securities and Exchange Board of India as applicable and approved by the Board of Directors of the Trustee, are fair and reasonable.
For B S R & Co. LLP Chartered Accountants Firm’s Registration No: 101248W/W-100022
Sd/-
Ajit Viswanath PartnerMembership No: 067114UDIN : 21067114AAAADC1824
Place : Mumbai Date : July 20, 2021.
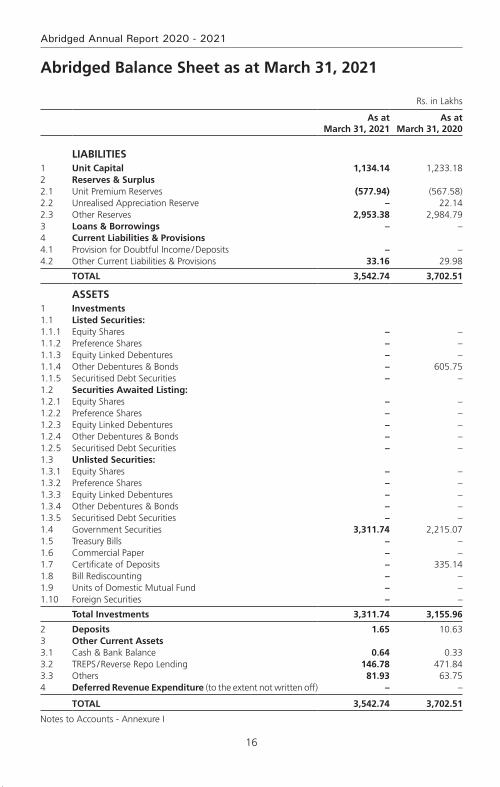
16
Abridged Annual Report 2020 - 2021
Abridged Balance Sheet as at March 31, 2021
Rs. in Lakhs
As at March 31, 2021
As at March 31, 2020
LIABILITIES1 Unit Capital 1,134.14 1,233.182 Reserves & Surplus2.1 Unit Premium Reserves (577.94) (567.58)2.2 Unrealised Appreciation Reserve – 22.142.3 Other Reserves 2,953.38 2,984.793 Loans & Borrowings – –4 Current Liabilities & Provisions4.1 Provision for Doubtful Income / Deposits – –4.2 Other Current Liabilities & Provisions 33.16 29.98
TOTAL 3,542.74 3,702.51
ASSETS1 Investments1.1 Listed Securities:1.1.1 Equity Shares – –1.1.2 Preference Shares – –1.1.3 Equity Linked Debentures – –1.1.4 Other Debentures & Bonds – 605.751.1.5 Securitised Debt Securities – –1.2 Securities Awaited Listing:1.2.1 Equity Shares – –1.2.2 Preference Shares – –1.2.3 Equity Linked Debentures – –1.2.4 Other Debentures & Bonds – –1.2.5 Securitised Debt Securities – –1.3 Unlisted Securities:1.3.1 Equity Shares – –1.3.2 Preference Shares – –1.3.3 Equity Linked Debentures – –1.3.4 Other Debentures & Bonds – –1.3.5 Securitised Debt Securities – –1.4 Government Securities 3,311.74 2,215.071.5 Treasury Bills – –1.6 Commercial Paper – –1.7 Certificate of Deposits – 335.141.8 Bill Rediscounting – –1.9 Units of Domestic Mutual Fund – –1.10 Foreign Securities – –
Total Investments 3,311.74 3,155.96
2 Deposits 1.65 10.633 Other Current Assets3.1 Cash & Bank Balance 0.64 0.333.2 TREPS / Reverse Repo Lending 146.78 471.843.3 Others 81.93 63.754 Deferred Revenue Expenditure (to the extent not written off) – –
TOTAL 3,542.74 3,702.51
Notes to Accounts - Annexure I
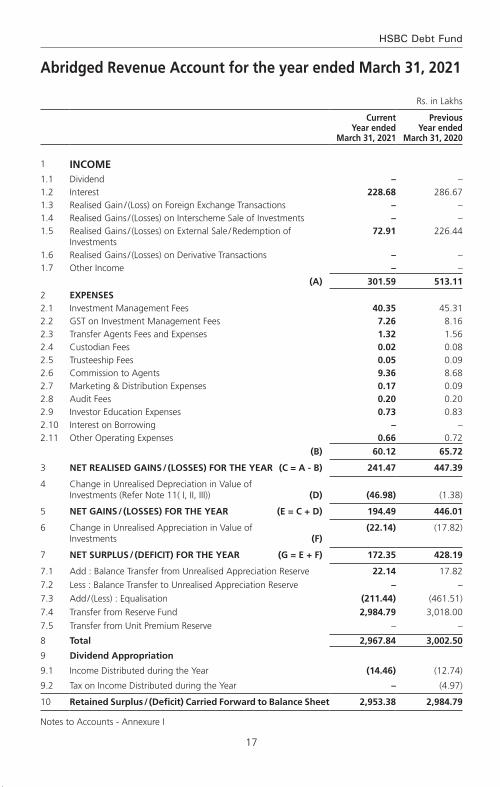
17
HSBC Debt Fund
Abridged Revenue Account for the year ended March 31, 2021
Rs. in Lakhs
Current Year ended
March 31, 2021
Previous Year ended
March 31, 2020
1 INCOME1.1 Dividend – –1.2 Interest 228.68 286.671.3 Realised Gain / (Loss) on Foreign Exchange Transactions – –1.4 Realised Gains / (Losses) on Interscheme Sale of Investments – –1.5 Realised Gains / (Losses) on External Sale / Redemption of
Investments72.91 226.44
1.6 Realised Gains / (Losses) on Derivative Transactions – –1.7 Other Income – –
(A) 301.59 513.112 EXPENSES2.1 Investment Management Fees 40.35 45.312.2 GST on Investment Management Fees 7.26 8.162.3 Transfer Agents Fees and Expenses 1.32 1.562.4 Custodian Fees 0.02 0.082.5 Trusteeship Fees 0.05 0.092.6 Commission to Agents 9.36 8.682.7 Marketing & Distribution Expenses 0.17 0.092.8 Audit Fees 0.20 0.202.9 Investor Education Expenses 0.73 0.832.10 Interest on Borrowing – –2.11 Other Operating Expenses 0.66 0.72
(B) 60.12 65.72
3 NET REALISED GAINS / (LOSSES) FOR THE YEAR (C = A - B) 241.47 447.39
4 Change in Unrealised Depreciation in Value of Investments (Refer Note 11( I, II, III)) (D) (46.98) (1.38)
5 NET GAINS / (LOSSES) FOR THE YEAR (E = C + D) 194.49 446.01
6 Change in Unrealised Appreciation in Value of Investments (F)
(22.14) (17.82)
7 NET SURPLUS / (DEFICIT) FOR THE YEAR (G = E + F) 172.35 428.19
7.1 Add : Balance Transfer from Unrealised Appreciation Reserve 22.14 17.827.2 Less : Balance Transfer to Unrealised Appreciation Reserve – –7.3 Add / (Less) : Equalisation (211.44) (461.51)7.4 Transfer from Reserve Fund 2,984.79 3,018.007.5 Transfer from Unit Premium Reserve – –
8 Total 2,967.84 3,002.50
9 Dividend Appropriation
9.1 Income Distributed during the Year (14.46) (12.74)
9.2 Tax on Income Distributed during the Year – (4.97)
10 Retained Surplus / (Deficit) Carried Forward to Balance Sheet 2,953.38 2,984.79
Notes to Accounts - Annexure I
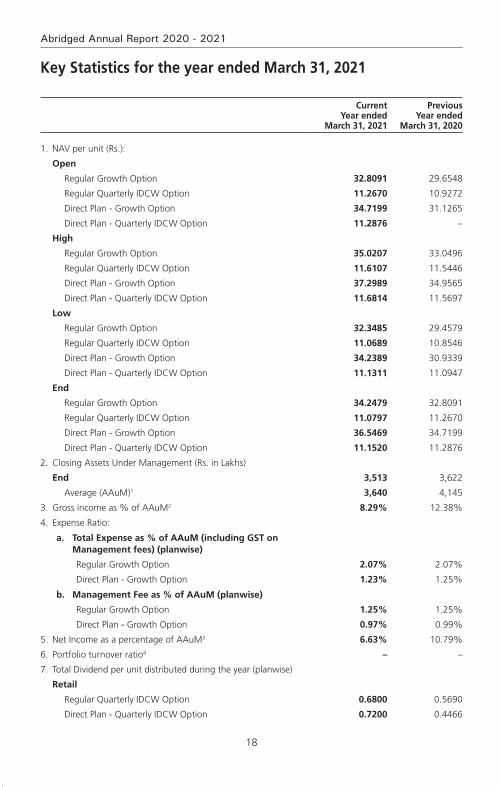
18
Abridged Annual Report 2020 - 2021
Key Statistics for the year ended March 31, 2021
Current Year ended
March 31, 2021
Previous Year ended
March 31, 2020
1. NAV per unit (Rs.):
Open
Regular Growth Option 32.8091 29.6548
Regular Quarterly IDCW Option 11.2670 10.9272
Direct Plan - Growth Option 34.7199 31.1265
Direct Plan - Quarterly IDCW Option 11.2876 –
High
Regular Growth Option 35.0207 33.0496
Regular Quarterly IDCW Option 11.6107 11.5446
Direct Plan - Growth Option 37.2989 34.9565
Direct Plan - Quarterly IDCW Option 11.6814 11.5697
Low
Regular Growth Option 32.3485 29.4579
Regular Quarterly IDCW Option 11.0689 10.8546
Direct Plan - Growth Option 34.2389 30.9339
Direct Plan - Quarterly IDCW Option 11.1311 11.0947
End
Regular Growth Option 34.2479 32.8091
Regular Quarterly IDCW Option 11.0797 11.2670
Direct Plan - Growth Option 36.5469 34.7199
Direct Plan - Quarterly IDCW Option 11.1520 11.2876
2. Closing Assets Under Management (Rs. in Lakhs)
End 3,513 3,622
Average (AAuM)1 3,640 4,145
3. Gross income as % of AAuM2 8.29% 12.38%
4. Expense Ratio:
a. total expense as % of aaum (including gSt on management fees) (planwise)
Regular Growth Option 2.07% 2.07%
Direct Plan - Growth Option 1.23% 1.25%
b. management fee as % of aaum (planwise)
Regular Growth Option 1.25% 1.25%
Direct Plan - Growth Option 0.97% 0.99%
5. Net Income as a percentage of AAuM3 6.63% 10.79%
6. Portfolio turnover ratio4 – –
7. Total Dividend per unit distributed during the year (planwise)
Retail
Regular Quarterly IDCW Option 0.6800 0.5690
Direct Plan - Quarterly IDCW Option 0.7200 0.4466
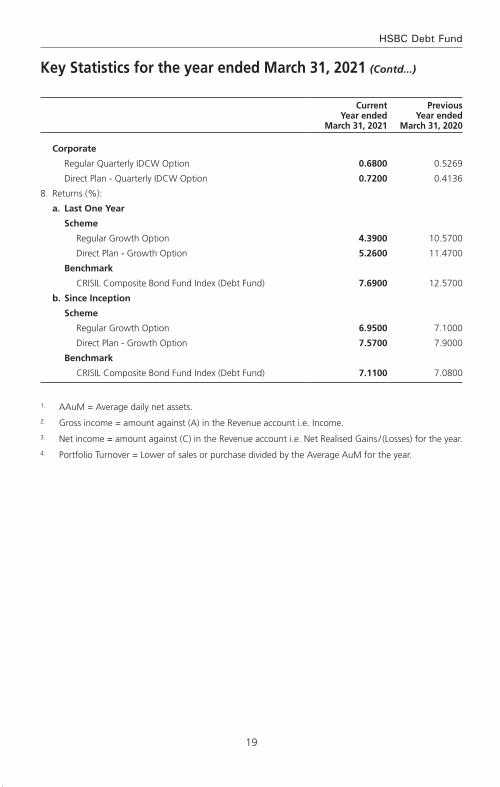
19
HSBC Debt Fund
Current Year ended
March 31, 2021
Previous Year ended
March 31, 2020
Corporate
Regular Quarterly IDCW Option 0.6800 0.5269
Direct Plan - Quarterly IDCW Option 0.7200 0.4136
8. Returns (%):
a. Last One Year
Scheme
Regular Growth Option 4.3900 10.5700
Direct Plan - Growth Option 5.2600 11.4700
Benchmark
CRISIL Composite Bond Fund Index (Debt Fund) 7.6900 12.5700
b. Since Inception
Scheme
Regular Growth Option 6.9500 7.1000
Direct Plan - Growth Option 7.5700 7.9000
Benchmark
CRISIL Composite Bond Fund Index (Debt Fund) 7.1100 7.0800
1. AAuM = Average daily net assets.2. Gross income = amount against (A) in the Revenue account i.e. Income.3. Net income = amount against (C) in the Revenue account i.e. Net Realised Gains / (Losses) for the year.4. Portfolio Turnover = Lower of sales or purchase divided by the Average AuM for the year.
Key Statistics for the year ended March 31, 2021 (Contd...)
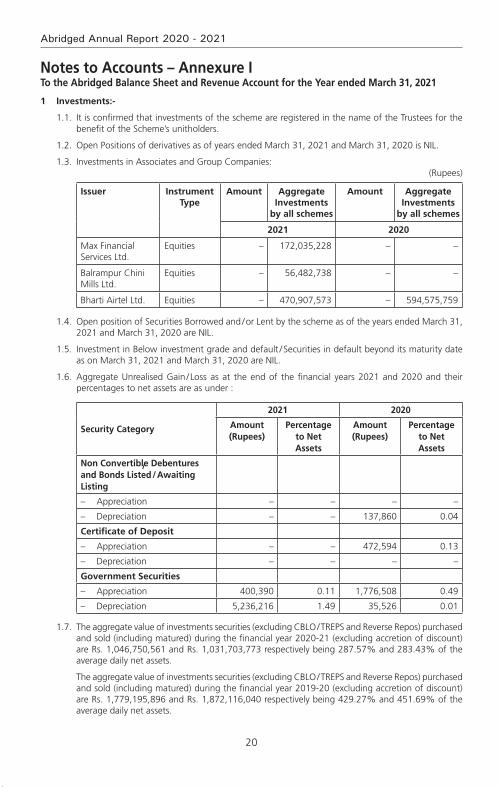
20
Abridged Annual Report 2020 - 2021
Notes to Accounts – Annexure ITo the Abridged Balance Sheet and Revenue Account for the Year ended March 31, 2021
1 Investments:-
1.1. It is confirmed that investments of the scheme are registered in the name of the Trustees for the benefit of the Scheme’s unitholders.
1.2. Open Positions of derivatives as of years ended March 31, 2021 and March 31, 2020 is NIL.
1.3. Investments in Associates and Group Companies:(Rupees)
Issuer Instrument Type
Amount Aggregate Investments
by all schemes
Amount Aggregate Investments
by all schemes
2021 2020
Max Financial Services Ltd.
Equities – 172,035,228 – –
Balrampur Chini Mills Ltd.
Equities – 56,482,738 – –
Bharti Airtel Ltd. Equities – 470,907,573 – 594,575,759
1.4. Open position of Securities Borrowed and / or Lent by the scheme as of the years ended March 31, 2021 and March 31, 2020 are NIL.
1.5. Investment in Below investment grade and default / Securities in default beyond its maturity date as on March 31, 2021 and March 31, 2020 are NIL.
1.6. Aggregate Unrealised Gain / Loss as at the end of the financial years 2021 and 2020 and their percentages to net assets are as under :
Security Category
2021 2020
Amount (Rupees)
Percentage to Net Assets
Amount (Rupees)
Percentage to Net Assets
Non Convertible Debentures and Bonds Listed / Awaiting Listing
– Appreciation – – – –
– Depreciation – – 137,860 0.04
Certificate of Deposit
– Appreciation – – 472,594 0.13
– Depreciation – – – –
Government Securities
– Appreciation 400,390 0.11 1,776,508 0.49
– Depreciation 5,236,216 1.49 35,526 0.01
1.7. The aggregate value of investments securities (excluding CBLO / TREPS and Reverse Repos) purchased and sold (including matured) during the financial year 2020-21 (excluding accretion of discount) are Rs. 1,046,750,561 and Rs. 1,031,703,773 respectively being 287.57% and 283.43% of the average daily net assets.
The aggregate value of investments securities (excluding CBLO / TREPS and Reverse Repos) purchased and sold (including matured) during the financial year 2019-20 (excluding accretion of discount) are Rs. 1,779,195,896 and Rs. 1,872,116,040 respectively being 429.27% and 451.69% of the average daily net assets.
/
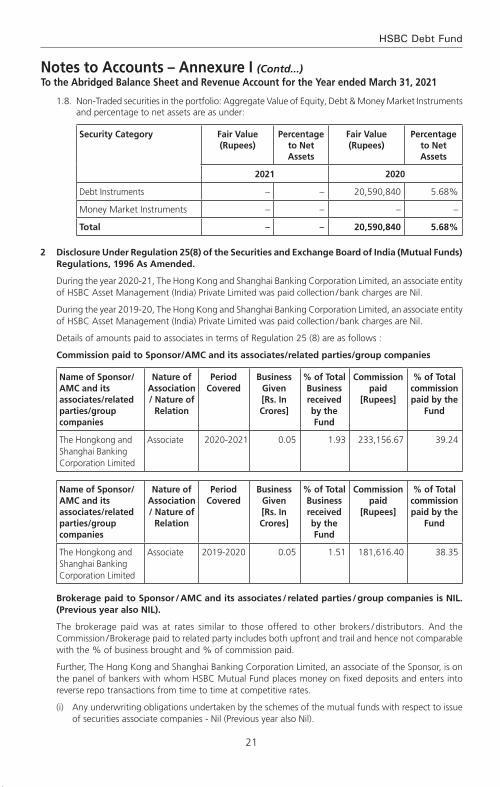
21
HSBC Debt Fund
1.8. Non-Traded securities in the portfolio: Aggregate Value of Equity, Debt & Money Market Instruments and percentage to net assets are as under:
Security Category Fair Value (Rupees)
Percentage to Net Assets
Fair Value (Rupees)
Percentage to Net Assets
2021 2020
Debt Instruments – – 20,590,840 5.68%
Money Market Instruments – – – –
Total – – 20,590,840 5.68%
2 Disclosure Under Regulation 25(8) of the Securities and Exchange Board of India (Mutual Funds) Regulations, 1996 As Amended.
During the year 2020-21, The Hong Kong and Shanghai Banking Corporation Limited, an associate entity of HSBC Asset Management (India) Private Limited was paid collection / bank charges are Nil.
During the year 2019-20, The Hong Kong and Shanghai Banking Corporation Limited, an associate entity of HSBC Asset Management (India) Private Limited was paid collection / bank charges are Nil.
Details of amounts paid to associates in terms of Regulation 25 (8) are as follows :
Commission paid to Sponsor/AMC and its associates/related parties/group companies
Name of Sponsor/AMC and its associates/related parties/group companies
Nature of Association / Nature of
Relation
Period Covered
Business Given [Rs. In Crores]
% of Total Business received by the Fund
Commission paid
[Rupees]
% of Total commission paid by the
Fund
The Hongkong and Shanghai Banking Corporation Limited
Associate 2020-2021 0.05 1.93 233,156.67 39.24
Name of Sponsor/AMC and its associates/related parties/group companies
Nature of Association / Nature of
Relation
Period Covered
Business Given [Rs. In Crores]
% of Total Business received by the Fund
Commission paid
[Rupees]
% of Total commission paid by the
Fund
The Hongkong and Shanghai Banking Corporation Limited
Associate 2019-2020 0.05 1.51 181,616.40 38.35
Brokerage paid to Sponsor / AMC and its associates / related parties / group companies is NIL. (Previous year also NIL).
The brokerage paid was at rates similar to those offered to other brokers / distributors. And the Commission / Brokerage paid to related party includes both upfront and trail and hence not comparable with the % of business brought and % of commission paid.
Further, The Hong Kong and Shanghai Banking Corporation Limited, an associate of the Sponsor, is on the panel of bankers with whom HSBC Mutual Fund places money on fixed deposits and enters into reverse repo transactions from time to time at competitive rates.
(i) Any underwriting obligations undertaken by the schemes of the mutual funds with respect to issue of securities associate companies - Nil (Previous year also Nil).
Notes to Accounts – Annexure I (Contd...)To the Abridged Balance Sheet and Revenue Account for the Year ended March 31, 2021
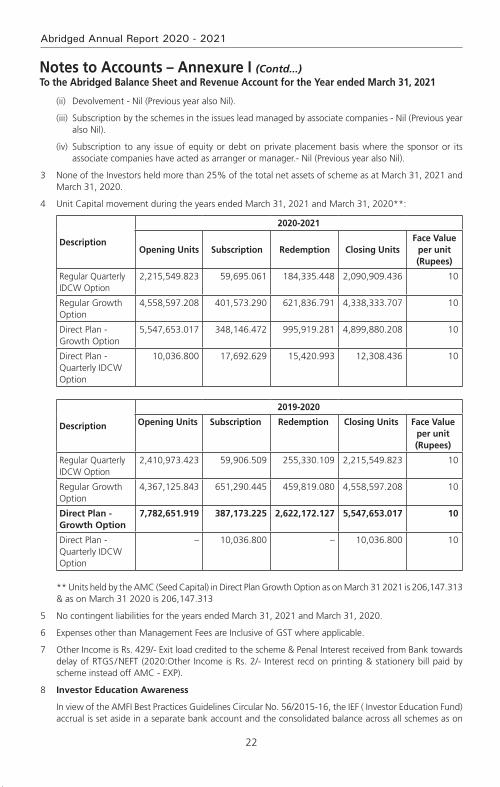
22
Abridged Annual Report 2020 - 2021
(ii) Devolvement - Nil (Previous year also Nil).
(iii) Subscription by the schemes in the issues lead managed by associate companies - Nil (Previous year also Nil).
(iv) Subscription to any issue of equity or debt on private placement basis where the sponsor or its associate companies have acted as arranger or manager.- Nil (Previous year also Nil).
3 None of the Investors held more than 25% of the total net assets of scheme as at March 31, 2021 and March 31, 2020.
4 Unit Capital movement during the years ended March 31, 2021 and March 31, 2020**:
Description
2020-2021
Opening Units Subscription Redemption Closing UnitsFace Value
per unit (Rupees)
Regular Quarterly IDCW Option
2,215,549.823 59,695.061 184,335.448 2,090,909.436 10
Regular Growth Option
4,558,597.208 401,573.290 621,836.791 4,338,333.707 10
Direct Plan - Growth Option
5,547,653.017 348,146.472 995,919.281 4,899,880.208 10
Direct Plan - Quarterly IDCW Option
10,036.800 17,692.629 15,420.993 12,308.436 10
Description
2019-2020
Opening Units Subscription Redemption Closing Units Face Value per unit (Rupees)
Regular Quarterly IDCW Option
2,410,973.423 59,906.509 255,330.109 2,215,549.823 10
Regular Growth Option
4,367,125.843 651,290.445 459,819.080 4,558,597.208 10
Direct Plan - Growth Option
7,782,651.919 387,173.225 2,622,172.127 5,547,653.017 10
Direct Plan - Quarterly IDCW Option
– 10,036.800 – 10,036.800 10
** Units held by the AMC (Seed Capital) in Direct Plan Growth Option as on March 31 2021 is 206,147.313 & as on March 31 2020 is 206,147.313
5 No contingent liabilities for the years ended March 31, 2021 and March 31, 2020.
6 Expenses other than Management Fees are Inclusive of GST where applicable.
7 Other Income is Rs. 429/- Exit load credited to the scheme & Penal Interest received from Bank towards delay of RTGS / NEFT (2020:Other Income is Rs. 2/- Interest recd on printing & stationery bill paid by scheme instead off AMC - EXP).
8 investor education awareness
In view of the AMFI Best Practices Guidelines Circular No. 56/2015-16, the IEF ( Investor Education Fund) accrual is set aside in a separate bank account and the consolidated balance across all schemes as on
Notes to Accounts – Annexure I (Contd...)To the Abridged Balance Sheet and Revenue Account for the Year ended March 31, 2021
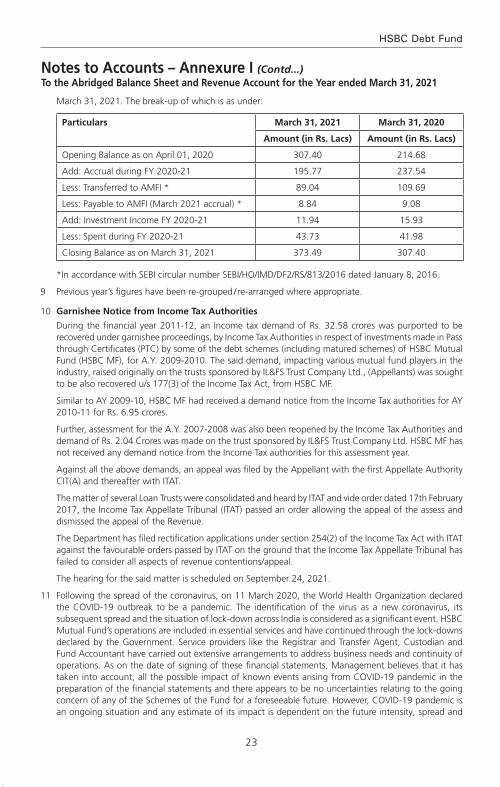
23
HSBC Debt Fund
Notes to Accounts – Annexure I (Contd...)To the Abridged Balance Sheet and Revenue Account for the Year ended March 31, 2021
March 31, 2021. The break-up of which is as under:
Particulars March 31, 2021 March 31, 2020
Amount (in Rs. Lacs) Amount (in Rs. Lacs)
Opening Balance as on April 01, 2020 307.40 214.68
Add: Accrual during FY 2020-21 195.77 237.54
Less: Transferred to AMFI * 89.04 109.69
Less: Payable to AMFI (March 2021 accrual) * 8.84 9.08
Add: Investment Income FY 2020-21 11.94 15.93
Less: Spent during FY 2020-21 43.73 41.98
Closing Balance as on March 31, 2021 373.49 307.40
*In accordance with SEBI circular number SEBI/HO/IMD/DF2/RS/813/2016 dated January 8, 2016.
9 Previous year’s figures have been re-grouped / re-arranged where appropriate.
10 Garnishee Notice from Income Tax Authorities
During the financial year 2011-12, an Income tax demand of Rs. 32.58 crores was purported to be recovered under garnishee proceedings, by Income Tax Authorities in respect of investments made in Pass through Certificates (PTC) by some of the debt schemes (including matured schemes) of HSBC Mutual Fund (HSBC MF), for A.Y. 2009-2010. The said demand, impacting various mutual fund players in the industry, raised originally on the trusts sponsored by IL&FS Trust Company Ltd., (Appellants) was sought to be also recovered u/s 177(3) of the Income Tax Act, from HSBC MF.
Similar to AY 2009-10, HSBC MF had received a demand notice from the Income Tax authorities for AY 2010-11 for Rs. 6.95 crores.
Further, assessment for the A.Y. 2007-2008 was also been reopened by the Income Tax Authorities and demand of Rs. 2.04 Crores was made on the trust sponsored by IL&FS Trust Company Ltd. HSBC MF has not received any demand notice from the Income Tax authorities for this assessment year.
Against all the above demands, an appeal was filed by the Appellant with the first Appellate Authority CIT(A) and thereafter with ITAT.
The matter of several Loan Trusts were consolidated and heard by ITAT and vide order dated 17th February 2017, the Income Tax Appellate Tribunal (ITAT) passed an order allowing the appeal of the assess and dismissed the appeal of the Revenue.
The Department has filed rectification applications under section 254(2) of the Income Tax Act with ITAT against the favourable orders passed by ITAT on the ground that the Income Tax Appellate Tribunal has failed to consider all aspects of revenue contentions/appeal.
The hearing for the said matter is scheduled on September 24, 2021.
11 Following the spread of the coronavirus, on 11 March 2020, the World Health Organization declared the COVID-19 outbreak to be a pandemic. The identification of the virus as a new coronavirus, its subsequent spread and the situation of lock-down across India is considered as a significant event. HSBC Mutual Fund’s operations are included in essential services and have continued through the lock-downs declared by the Government. Service providers like the Registrar and Transfer Agent, Custodian and Fund Accountant have carried out extensive arrangements to address business needs and continuity of operations. As on the date of signing of these financial statements, Management believes that it has taken into account, all the possible impact of known events arising from COVID-19 pandemic in the preparation of the financial statements and there appears to be no uncertainties relating to the going concern of any of the Schemes of the Fund for a foreseeable future. However, COVID-19 pandemic is an ongoing situation and any estimate of its impact is dependent on the future intensity, spread and
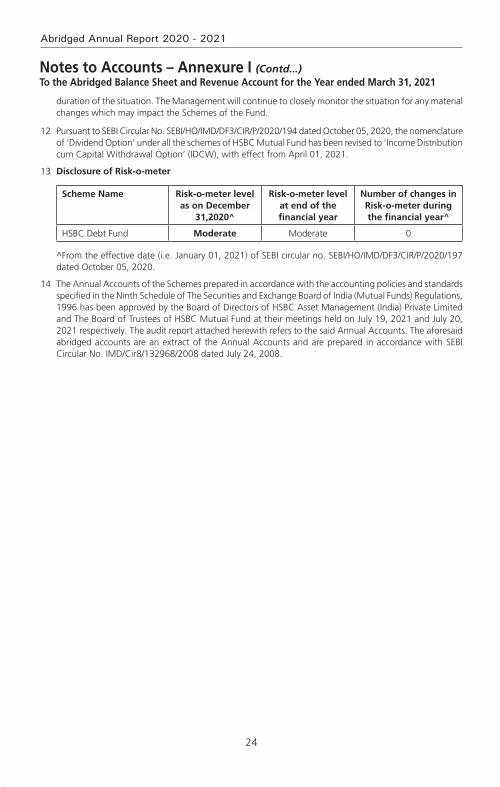
24
Abridged Annual Report 2020 - 2021
duration of the situation. The Management will continue to closely monitor the situation for any material changes which may impact the Schemes of the Fund.
12 Pursuant to SEBI Circular No. SEBI/HO/IMD/DF3/CIR/P/2020/194 dated October 05, 2020, the nomenclature of ‘Dividend Option’ under all the schemes of HSBC Mutual Fund has been revised to ‘Income Distribution cum Capital Withdrawal Option’ (IDCW), with effect from April 01, 2021.
13 Disclosure of Risk-o-meter
Scheme Name Risk-o-meter level as on December
31,2020^
Risk-o-meter level at end of the financial year
Number of changes in Risk-o-meter during the financial year^
HSBC Debt Fund Moderate Moderate 0
^From the effective date (i.e. January 01, 2021) of SEBI circular no. SEBI/HO/IMD/DF3/CIR/P/2020/197 dated October 05, 2020.
14 The Annual Accounts of the Schemes prepared in accordance with the accounting policies and standards specified in the Ninth Schedule of The Securities and Exchange Board of India (Mutual Funds) Regulations, 1996 has been approved by the Board of Directors of HSBC Asset Management (India) Private Limited and The Board of Trustees of HSBC Mutual Fund at their meetings held on July 19, 2021 and July 20, 2021 respectively. The audit report attached herewith refers to the said Annual Accounts. The aforesaid abridged accounts are an extract of the Annual Accounts and are prepared in accordance with SEBI Circular No. IMD/Cir8/132968/2008 dated July 24, 2008.
Notes to Accounts – Annexure I (Contd...)To the Abridged Balance Sheet and Revenue Account for the Year ended March 31, 2021

25
HSBC Debt Fund
Voting Policy and Procedures
In view of SEBI guidelines related to “Role of Mutual Funds in Corporate Governance of Public Listed Companies”, HSBC AMC has formulated its “Policy for Proxy Voting in Public Listed Companies”. The said policy is available on our website and the details of actual exercise of proxy votes, the summary of votes casted and the auditor’s certificate for the Financial Year 2020 – 21 is forming part of our full Annual Report for the Financial Year 2020 – 21 which is uploaded on our website at http://www.assetmanagement.hsbc.co.in

26
Abridged Annual Report 2020 - 2021
Statutory Details & Disclaimers
All the returns have been sourced from Mutual Funds India Explorer software. The performance of the schemes and the benchmark is calculated on a total return basis. This document has been prepared by HSBC Asset Management (India) Private Ltd (HSBC) for information purposes only and should not be construed as i) an offer or recommendation to buy or sell securities, commodities, currencies or other investments referred to herein; or ii) an offer to sell or a solicitation or an offer for purchase of any of the funds of HSBC Mutual Fund; or iii) an investment research or investment advice. All information contained in this document (including that sourced from third parties), is obtained from sources HSBC and the third party which HSBC believes to be reliable however, has not independently verified the same. The information and opinions contained within the document are based upon publicly available information and rates of taxation applicable (if any) at the time of publication, which are subject to change from time to time.
Expressions of opinion are those of HSBC only and are subject to change without notice. It does not have regard to specific investment objectives, financial situation and the particular needs of any specific person who may receive this document. Investors should seek personal and independent advice regarding the appropriateness of investing in any of the funds, securities, other investment or investment strategies that may have been discussed or referred herein and should understand that the views regarding future prospects may or may not be realized. In no event shall HSBC Mutual Fund / HSBC Asset management (India) Private Limited and / or its affiliates or any of their directors, trustees, officers and employees be liable for any direct, indirect, special, incidental or consequential damages arising out of the use of information / opinion herein. Neither this document nor the units of HSBC Mutual Fund have been registered in any jurisdiction. The distribution of this document in certain jurisdictions may be restricted or totally prohibited and accordingly, persons who come into possession of this document are required to inform themselves about, and to observe, any such restrictions.
mutual fund investments are subject to market risks, read all scheme related documents carefully.
HSBC Short Duration FundAn open ended short term debt Scheme investing in instruments such that the Macaulay duration of the portfolio is between 1 year to 3 years
Abridged Annual Report 2020 - 2021

1
HSBC Short Duration Fund
Dear Investor,
The beginning of the last financial year now almost seems like a distant memory. COVID-19 was still a relatively unknown enemy and governments across the world were grappling with ways to control and mitigate the risks associated with it. Nationwide lockdowns were the norm and our markets both equity and fixed income reacted negatively leading to significant erosion of wealth. Within a short period of time markets bounced back. This confounded even the most astute market pundits. How is it possible that when GDP growth had slowed down, unemployment had risen, inflation was high could there be such sharp up move in equity indices. Whilst the reasons are well known about easy global liquidity, demand resurgence, cost cutting by corporates etc. perhaps its most important to remember that the markets are not a reflector but a predictor of economic activity.
At all times particularly during such volatile times it is important to go back to the basics. Why do you save, why do you invest, what goals would you like to achieve, how old are you, what is your risk appetite? The replies to these simple questions will help you determine your asset allocation. As an example when equity markets corrected sharply last year, investors who reviewed their asset allocation, stayed invested during the lows of the past year and were able to capture the rebound and have seen prime returns since then. The current market movement in all likelihood would have also led to some imbalances in your asset allocation. Do not ignore that and I strongly recommend that you do review this with your advisor to check whether re-balancing is required.
During this financial year we had three very successful new fund launches. The pandemic showed us a clear trend of dominant players becoming stronger and profit pool getting consolidated within a few companies. To capture this opportunity, we launched the HSBC Focused Equity Fund which garnered close to Rs. 520 crores. During the second half of 2020, in the fixed income space, 3 - 5 year duration range had a favourable investment scenario as RBI’s accommodative policy and surplus liquidity had reduced the returns at the very short end of the yield curve. There was a demand for an actively managed moderate duration strategy with better credit quality which we fulfilled by launching HSBC Corporate Bond Fund. It garnered over 700 crores. Our latest and first of its kind offering, HSBC Global Equity Climate Change Fund of Fund saw a stupendous response with over 8000 investors investing over Rs. 616 crores. This is an investment opportunity which goes beyond the rationale of simply generating investment returns and is the future of responsible investing.
We worked towards augmenting our digital capabilities by launching a few key enhancements to our online transaction platform. Being mindful of the movement restrictions in place, this year we focused on digitizing offline processes so that an investor need not need step out of her home for investing or availing any key services. While our interactive chatbot AskMe, eased service queries, our end-to-end digital KYC module enabled a first time Mutual Fund investor to invest in our funds without any paperwork. We listened to your feedback and digitized consolidation of folios and change of tax status which eliminated the need for you to physically visit our branches.
I am a strong believer in the India story and this story has just begun. The opportunity to invest in this high growth market is a very exciting opportunity. I do hope you share my enthusiasm and I ask that you continue to invest whilst reviewing your asset allocation at all times. As always thank you for your business. Stay safe.
Warm regards,
Ravi MenonChief Executive Officer,
HSBC Asset Management India
2
Abridged Annual Report 2020 - 2021
SPONSOR
HSBC Securities and Capital Markets (India) Private LimitedRegd. Office: 52/60, Mahatma Gandhi Road, Fort, Mumbai - 400 001.
TRUSTEE
Board of TrusteesOffice: 16, Veer Nariman Road, Fort, Mumbai 400 001.
ASSET MANAGEMENT COMPANY
HSBC Asset Management (India) Private LimitedCorp. & Regd. Office: 16, Veer Nariman Road, Fort, Mumbai 400 001.
CUSTODIAN
Standard Chartered Bank (SCB)Corp. & Regd. Office: Crescenzo, Securities Services, 3rd Floor, C-38/39, G-Block,Bandra Kurla Complex, Bandra East, Mumbai – 400051.
AUDITORS TO THE SCHEME
BSR & Co. LLPChartered Accountants
5th Floor, Lodha Excelus, Apollo Mills Compound, N. M. Joshi Marg, Mahalaxmi, Mumbai 400 011.
REGISTRAR & TRANSFER AGENTS
Computer Age Management Services Limited (CAMS)Unit: HSBC Mutual Fund ’C’ Block, 2nd Floor, Hanudev Info Park P. Ltd., SF No. 558/2, Udayampalayam Road, Nava India, Coimbatore - 641 028.
BOARD OF TRUSTEES
Ms. Jasmine Batliwalla - Chairperson
Mr. Nani Javeri - Trustee
Dr. T. C. Nair - Trustee
Mr. Pedro Bastos - Trustee
BOARD OF DIRECTORS
Mr. Dinesh Mittal - Director
Dr. Indu Shahani - Director
Mr. Ravi Menon - Director & Chief Executive Officer

3
HSBC Short Duration Fund
The Trustees of HSBC Mutual Fund (“Fund”) present the Nineteenth Annual Report and the audited abridged financial statements of the schemes of the Fund for the year ended March 31, 2021.
As at March 31, 2021, the Fund offered 37 schemes across asset classes to meet the varying investment needs of the investors. During FY 2020-2021, the Fund has launched various new products namely HSBC Corporate Bond Fund, HSBC Focused Equity Fund and HSBC Global Equity Climate Change Fund of Fund to fill the gaps in our product offering.
The Fund continues its focus on delivering consistent long term returns. The comments on the performance of the Scheme(s) is provided hereinafter. Dividends were declared under various schemes as per the provisions contained in the respective Scheme Information Documents after considering the distributable surplus available under the respective Schemes. Details of dividends declared can be viewed on our website at www.assetmanagement.hsbc.co.in.
1. Scheme Performance, future outlook and oPerationS of the SchemeS
a. operations and Performance of the Schemes
hSBc Short duration fund (hSdf)
(an open ended short term debt scheme investing in instruments such that the macaulay duration of the portfolio is between 1 year to 3 years)
HSDF seeks to provide reasonable income through a diversified portfolio of fixed income securities such that the Macaulay duration of the portfolio is between 1 year to 3 years. However, there can be no assurance or guarantee that the investment objective of the scheme would be achieved.
The net assets of HSBC Short Duration Fund amounted to Rs. 153.39 crores as at March 31, 2021 as compared to Rs. 324.67 crores as at March 31, 2020. Around 94.20% of the net assets were invested in debt and money market instruments and 5.80% of the net assets comprised of reverse repos / TREPS and net current assets as at March 31, 2021.
HSDF underperformed its scheme’s benchmark. One of scheme’s exposure (Dewan Housing Finance Corporation Ltd) has been downgraded to “D’ from ‘BBB-’. Scheme written off 75% of the interest accrued till 3rd June 2019 and have also written off principal by 75%, resulting in underperformance. On 8th May 2020, we had written off 100% and later in the month of July we sold off the position at ~22 cents to dollar as outlook of the recovery look grim due ongoing pandemic.
date of inception : 10 december 2002 absolute returns
(%)
compounded annualized returns (%)
Scheme name & Benchmarks 1 Year 3 Years 5 Years Since inception
HSBC Short Duration Fund - Growth 3.71 3.00 4.54 6.38
CRISIL Short Term Bond Fund Index (Scheme Benchmark) 7.80 8.38 8.08 7.33
CRISIL 1 Year T-Bill Index (Standard Benchmark)* 4.66 6.48 6.50 6.03
CRISIL 10 Year Gilt Index (Standard Benchmark)* 3.60 8.25 7.17 6.27
Rs. 10,000, if invested in HSDF, would have become 10,371 10,931 12,487 31,047
Rs. 10,000, if invested in CRISIL Short Term Bond Fund Index, would have become
10,780 12,742 14,751 36,538
Rs. 10,000, if invested in CRISIL 1 Year T-Bill Index, would have become
10,466 12,081 13,703 29,228
Rs. 10,000, if invested in CRISIL 10 Year Gilt Index, would have become
10,007 12,686 14,138 30,493
Trustees’ ReportFor the year ended March 31, 2021
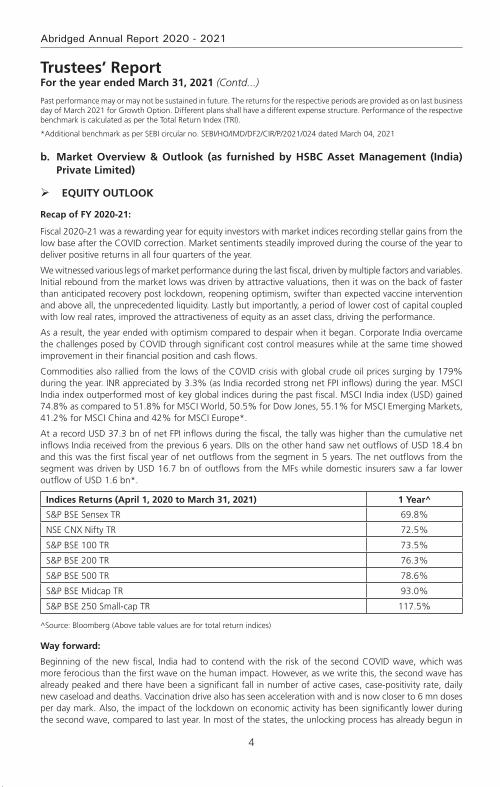
4
Abridged Annual Report 2020 - 2021
Past performance may or may not be sustained in future. The returns for the respective periods are provided as on last business day of March 2021 for Growth Option. Different plans shall have a different expense structure. Performance of the respective benchmark is calculated as per the Total Return Index (TRI).
*Additional benchmark as per SEBI circular no. SEBI/HO/IMD/DF2/CIR/P/2021/024 dated March 04, 2021
b. market overview & outlook (as furnished by hSBc asset management (india) Private limited)
equitY outlook
recap of fY 2020-21:
Fiscal 2020-21 was a rewarding year for equity investors with market indices recording stellar gains from the low base after the COVID correction. Market sentiments steadily improved during the course of the year to deliver positive returns in all four quarters of the year.
We witnessed various legs of market performance during the last fiscal, driven by multiple factors and variables. Initial rebound from the market lows was driven by attractive valuations, then it was on the back of faster than anticipated recovery post lockdown, reopening optimism, swifter than expected vaccine intervention and above all, the unprecedented liquidity. Lastly but importantly, a period of lower cost of capital coupled with low real rates, improved the attractiveness of equity as an asset class, driving the performance.
As a result, the year ended with optimism compared to despair when it began. Corporate India overcame the challenges posed by COVID through significant cost control measures while at the same time showed improvement in their financial position and cash flows.
Commodities also rallied from the lows of the COVID crisis with global crude oil prices surging by 179% during the year. INR appreciated by 3.3% (as India recorded strong net FPI inflows) during the year. MSCI India index outperformed most of key global indices during the past fiscal. MSCI India index (USD) gained 74.8% as compared to 51.8% for MSCI World, 50.5% for Dow Jones, 55.1% for MSCI Emerging Markets, 41.2% for MSCI China and 42% for MSCI Europe*.
At a record USD 37.3 bn of net FPI inflows during the fiscal, the tally was higher than the cumulative net inflows India received from the previous 6 years. DIIs on the other hand saw net outflows of USD 18.4 bn and this was the first fiscal year of net outflows from the segment in 5 years. The net outflows from the segment was driven by USD 16.7 bn of outflows from the MFs while domestic insurers saw a far lower outflow of USD 1.6 bn*.
indices returns (april 1, 2020 to march 31, 2021) 1 Year^
S&P BSE Sensex TR 69.8%
NSE CNX Nifty TR 72.5%
S&P BSE 100 TR 73.5%
S&P BSE 200 TR 76.3%
S&P BSE 500 TR 78.6%
S&P BSE Midcap TR 93.0%
S&P BSE 250 Small-cap TR 117.5%
^Source: Bloomberg (Above table values are for total return indices)
Way forward:
Beginning of the new fiscal, India had to contend with the risk of the second COVID wave, which was more ferocious than the first wave on the human impact. However, as we write this, the second wave has already peaked and there have been a significant fall in number of active cases, case-positivity rate, daily new caseload and deaths. Vaccination drive also has seen acceleration with and is now closer to 6 mn doses per day mark. Also, the impact of the lockdown on economic activity has been significantly lower during the second wave, compared to last year. In most of the states, the unlocking process has already begun in
Trustees’ ReportFor the year ended March 31, 2021 (Contd...)
5
HSBC Short Duration Fund
a phased manner and this is leading to improvement in various activity indicators. Mobility indicators are recovering faster while economic indicators (freight, credit off-take, E-way bill generation, power demand etc.) are also witnessing a gradual recovery. The recently concluded earnings season has turned out to be in-line with expectations and despite the concerns of around the second wave, the earnings (Nifty) have seen upgrades for FY22. Market is looking beyond the current quarter (i.e. 1QFY22), which would witness an impact due to the second wave. Our baseline assumption is that of a temporary impact from the second wave and the set-back to the recovery process limited to a few months, after which we should see the economic rebound. So far, this is tracking in-line with assumptions.
From a macro perspective, the current estimates for GDP growth in FY22 stand at 9.2%* (after seeing downgrades to factor in the impact of second wave). The downgrade in estimates are pertaining to the first quarter and hence the trajectory of growth from hereon should pick up. The tax collections data for the first two months of FY22 has remained strong, implying that the drawdown of the second wave on the fiscal position is not alarming. Additionally, the impact of fiscal stimulus package announced in FY22 so far is manageable (about 60 bps of GDP) and hence would not lead to any fiscal strain.
After the spectacular rally, market valuations at an overall level are now trending above historical averages on traditional valuation metrics (P/E, P/B). This is true for all market capitalization categories (viz large, mid and small). Typically, the broader market (i.e. mid and small cap segments), trade at a discount to large caps, however this scenario has now reversed after the outperformance from the broader market segments. However, the earnings momentum continues to remain strong (witnessing upgrades so far) and except for a short period due to second wave, the earnings momentum should hold up.
We believe that the risk-reward is balanced for the equity markets in the near term. Higher or sticky inflation expectations globally, higher than historical market valuations on some parameters (i.e. P/E, P/B) and adverse demand impact from the second wave are risk factors to contend with in the near term. However, these are counter balanced by positive commentary from companies, significant decline in COVID cases and acceleration in the vaccination programme. As a result, in the near term markets may see a consolidation phase and could take cues from the upcoming earnings season with more focus on the corporate commentary and the outlook. From a medium to long term perspective, the outlook for equity markets remains positive. The expectation of cyclical revival in the economy brings in a multi-year earnings visibility. This along with a benign cost of capital environment, should support equity performance. However, equity returns are likely to moderate on the back of the relatively high valuations and the strong recovery we have already witnessed from the COVID lows. Equity performance is likely to mirror the earnings growth trends over the medium to long term.
Pace of vaccination, concerns about a third wave, corporate earnings trajectory, inflation trends (both global & domestic), monsoon trends and commodity prices (especially crude oil) are some of the key factors which could influence market performance in the short term.
From a portfolio perspective, we are maintaining a pro-cyclical bias. We expect earnings growth to rebound sharply post the current COVID phase. Earnings growth are expected to sustain in high-teens beyond FY22 on the back of economy witnessing a cyclical recovery due to revival in capex cycle over the next 2-3 years (first by the government followed by private capex). From a sectoral perspective our order of preference is rate sensitives followed by domestic cyclicals, exporters and domestic consumption. Predominantly regulated businesses come last in our pecking order. This preference is dictated by our assessment of sectors / segments leading contribution to the market earnings growth over the next 2-3 years. Our portfolio construction is driven by a bottom up approach to stock selection with a focus on names that can deliver positive earnings surprises. We continue to focus on this theme to identify likely outperformers.
*Source: Bloomberg
deBt outlook
market drivers during the course of the year fY21
The Fixed Income markets started the year with a bout of nervousness that was triggered by the pandemic. While RBI had calmed the markets with its large rate cut action of 75bp cut followed by liquidity supportive measures, the volatility continued until mid-May when government announced its relief package. While it was
Trustees’ ReportFor the year ended March 31, 2021 (Contd...)
6
Abridged Annual Report 2020 - 2021
not fiscally expansive, it touched the right cords in terms of credit flow to desired sectors. This was followed up with RBI’s credit relief measures in terms of moratorium and restructuring of assets that were stressed due to the pandemic. Throughout the course of the year, RBI maintained its accommodative stance along with significant amount of surplus liquidity that was supportive and helped in maintaining stability in the market. However, as the year progressed and pressure on fiscal began to mount yields started seeing a spike towards the last quarter of the fiscal. While borrowing was stepped up to INR 12 trillion from previously budgeted INR 7.8 trillion in May 2020, it was further enhanced by and additional INR 1.1 trillion in October 2020. Overall GOI ended up borrowing a record amount of INR 13.9 trillion. The budget proved to be a shocker with GOI using the pandemic as an opportunity for setting the finances in order. GOI showed a record deficit of 9.5% for FY21 and projected a 6.8% for FY22 with estimated central government gross borrowing of INR 12 trillion. This seemed to reverse the support RBI had provided throughout the year with benchmark 10-year bond peaking to 6.23% in mid –Feb 2021. RBI’s statements to remain supportive were left in the sidelines. Overall it seemed that the 115bp of rate cut, along with significant liquidity infusion (OMO + Twist operations of ~INR 3 trillion, infusion via dollar purchases) seemed only a little to help in applying a brake to the one-way spike in yields. The year closed ~6.16% with absence of concrete action by RBI.
rBi Policy: Through the course of the year, RBI has maintained an accommodative stance, with an aggregate 115bp of rate cut done in March and May 2020 taking the repo rate from 5.15% to 4%. Subsequently while inflation pressures prevented RBI from taking any direct actions, RBI has used a combination of creative tools to keep the rates contained primarily via liquidity supportive tools such as OMOs, Twist Operations, Repo linked Term loans to needy sectors (LTROs, TLTROs), CRR cuts. While inflation was a worry for most part of the year, RBI kept it aside admitting that growth was a priority and inflation effects are more supply side rather than demand side. Prospectively into FY22, with the onset of the second wave, RBI continues to maintain the stance to prioritize growth.
inflation: Inflation for most part of the year stayed above 6% primarily driven by supply side pressures and some intermittent spike from food inflation as well. While it has been coming off since December with cooling off of food inflation and positive base effects, it has been between 4- 5.5%. Structurally however inflation risks continue to remain as oil prices have increased and base effects will not remain supportive for long. Core inflation continues to remain sticky.
liquidity: During the year, system liquidity has remained at significant surplus facilitated largely by RBI action such as OMOs, foreign exchange operations and government spending.
Budget: The FY2022 union budget focuses on growth and has accordingly, presented a 9.5% fiscal deficit for FY21 and 6.8% for FY22. On the revenue side, the assumptions are largely realistic, with FY22 (E) Nominal GDP growth at 14.4% and tax revenue growth at 17% considering the pandemic impact in FY 21. Compared to FY20, tax revenue growth is ~10%. While non-tax revenues are ambitious pegging the divestment at INR 1.75 trillion, with robust pipeline of assets including monetization of road and transmission assets, execution remains the key as in the past. On the expenditure side, better quality capex spending with focusing on rail, road, defense, urban infra is positive for long term structural growth. The revenue side expenditure adjusting for clearance of past subsidy arrears will be similar to budgetary estimates. Government using this opportunity to bring back off-balance sheet spending to on-balance sheet was a welcome move towards transparency and showing realistic projections. Alongside, states have also been given leeway to borrow upto 4% of their GDP with an additional 0.5% subject to conditions. Given that states are an important vehicle for capex investment, this move is welcome although it may entail additional state borrowing. The fiscal glide path is shifted to FY26 at below 4.5% for center and 3% for states suggesting that spending will continue and borrowing will come down gradually. In summary, from survival to revival, FY22 budget aims for structural growth leaving fiscal concerns sideways in the interim. Government’s intent seems clear on bringing back growth on the table, in a transparent manner.
While the second wave of the pandemic has once again derailed the revenue story, government will still have some cushion from its conservative estimates.
currency and fii flows: INR has been on an appreciation trajectory for most part of the year, aided by dollar underperformance supported by positive FII and FDI flows along with reduced imports on the domestic front as well. RBI has used most of the flows to accumulate reserves which has prevented any strong appreciation. Pandemic shock and global risk off led rupee over 75 in the beginning of the year only to close below 72 at the end of the fiscal year. While the second wave led to another spike in INR in April, it has since then cooled once again driven by dollar underperformance and pandemic recovery on the domestic front. Net FII
Trustees’ ReportFor the year ended March 31, 2021 (Contd...)

7
HSBC Short Duration Fund
flows was ~$30 bn with positive equity flows of~$37 bn while debt was negative ~$7bn and overall RBI’s forex reserves rose by a ~$100 bn to close ~$537 bn.
credit growth: Credit growth for the entire year has been tepid as previous year’s credit events were followed by nervousness relating to the pandemic. Despite RBI opening up several windows to finance the non-AAA segment, there was very little fresh credit flowing that segment. Overall banking credit grew by only 6.5%. Risk appetite has however been improving from a complete risk aversion to opening up towards a calculated risk. Prospectively it is expected that once the pandemic risk abates, credit growth will resume primarily driven by government capex spending and demand recovery.
market outlook
The pandemic once again brought the country to a situation similar to last year and debt markets perhaps interpreted the same as a structural rise in rates. In the initial day’s post budget in Feb of 2021, market was expecting a concrete set of actions such as an OMO calendar from RBI, and RBI’s words alone failed to calm the market. The first auction of the fiscal year also saw a devolvement. However, RBI acted in the first policy of the year announcing a bond buyback program akin to QE (quantitative easing) and its subsequent cancellation of auctions wherein yields were perhaps quoted higher than RBI’s comfort levels brought back confidence into the market. Since then we have seen a strong rally with 10-year benchmark trending below 6% and the curve moving alongside. RBI reiteration of priority of growth and also supporting with higher than expected dividend payment stand out as a testimony of its support. While we do not expect RBI to act in terms of rate cuts, we believe that measures such as G-SAP, OMOs will continue until there is visibility of a structural growth. Therefore, the large borrowing program should go without any hiccups.
Furthermore, with the evidence of strong GST numbers until April 2021 (before the 2nd wave), it is expected that growth and therefore fiscal revenues will come back. Government’s conservative budget estimates are supportive. Also, given the fact that compared to last year there has not been a complete shutdown of activity (lockdowns being distributed), the impact on growth will not be similar to last year. Pent up demand will come back to support revenue collection. However, on the flipside, once growth resumes RBI will be forced to withdraw liquidity in a phased manner to prevent asset bubbles. Nevertheless, RBI need not act in terms of rate actions and we believe that a prolonged pause in terms of RBI rates is in the offing.
Net-net therefore while growth is wanting no matter what, it may come at a small price of rise in yields with liquidity withdrawal. That is however expected more in the 2nd half of the year. Lower than expected borrowing numbers, later this year or if not in next year could be a surprise. We may therefore see a range bound rate action in the near term with a rising bias over time. Global rate environment, oil and currency risks are to be watched out for.
2. Brief Background of SPonSorS, Board of truSteeS and aSSet management comPanY
a. Sponsor
HSBC Mutual Fund is sponsored by HSBC Securities and Capital Markets (India) Private Limited (HSCI). The Sponsor is the Settler of the Mutual Fund Trust. The Sponsor has entrusted a sum of Rs. 1,00,000/- (Rupees One Lakh only) to the Trustee as the initial contribution towards the corpus of the Mutual Fund.
HSCI offers integrated investment banking services, securities and corporate finance & advisory. HSCI is a member of the Bombay Stock Exchange Limited and National Stock Exchange (capital and derivative market segments). HSCI holds 100% of the paid up equity share capital of HSBC Asset Management (India) Private Limited.
b. hSBc mutual fund
HSBC Mutual Fund (“the Mutual Fund” or “the Fund”) has been constituted as a Trust in accordance with the provisions of the Indian Trusts Act, 1882 (2 of 1882) vide a Trust Deed dated February 7, 2002 with HSBC Securities and Capital Markets (India) Private Limited, as the Sponsor and the Board of Individual Trustees. The Trustee has entered into an Investment Management Agreement dated February 7, 2002 with HSBC Asset Management (India) Private Limited (AMC) to function as the Investment Manager for all the schemes of the Fund. The Fund was registered with SEBI vide registration number MF/046/02/5 dated May 27, 2002.
Trustees’ ReportFor the year ended March 31, 2021 (Contd...)
8
Abridged Annual Report 2020 - 2021
The Trust has been formed for the purpose of pooling of capital from the public for collective investment in securities for the purpose of providing facilities for participation by persons as beneficiaries in such investments and in the profits/income arising therefrom.
c. Board of trustees (the trustees)
The Board of Trustees is the exclusive owner of the Trust Fund and holds the same in trust for the benefit of the unit holders. The Trustees have been discharging their duties and carrying out the responsibilities as provided in the SEBI (Mutual Funds) Regulations, 1996 and the Trust Deed. The Trustees seek to ensure that the Fund and the schemes floated there under are managed by the AMC in accordance with the Trust Deed, the said Regulations, directions and guidelines issued by the SEBI, the Stock Exchanges, the Association of Mutual Funds in India and other regulatory agencies.
d. asset management company (the amc)
HSBC Asset Management (India) Private Limited (the Investment Manager or the AMC) is a private limited company incorporated under the Companies Act, 1956 on December 12, 2001 having its Registered Office at 16, V. N. Road, Fort, Mumbai 400 001. HSBC Asset Management (India) Private Limited has been appointed as the Asset Management Company of HSBC Mutual Fund by the Trustee vide Investment Management Agreement (IMA) dated February 7, 2002 and executed between the Trustees and the AMC. SEBI approved the AMC to act as the Investment Manager of the Fund vide its letter No. MFD/BC/163/2002 dated May 27, 2002. The paid-up equity share capital of the AMC is Rs. 61.59 crores. The AMC is registered as a Portfolio Manager under the SEBI (Portfolio Managers) Regulations, 1993 vide registration no. INP000001322. The AMC also offers non-binding Advisory services to offshore funds under the mutual fund license.
HSBC Securities and Capital Markets (India) Private Limited holds 100% of the paid up equity share capital of the AMC.
3. inveStment oBjective of the SchemeSThe investment objective of the respective schemes has been provided above under the heading “Scheme Performance, Future Outlook and Operation of the Scheme” (Refer Section 1).
4. Significant accounting PolicieS The Significant Accounting Policies form part of the Notes to the Accounts annexed to the Balance Sheet of the Schemes in the Full Annual Report. The accounting policies are in accordance with Securities Exchange Board of India (Mutual Funds) Regulations 1996.
5. unclaimed dividendS & redemPtionSSummary of number of investors & corresponding amount Scheme-wise as on March 31, 2021
Schemeunclaimed dividend unclaimed redemption
amount (rs.) no. of investors
amount (rs.) no. of investors
HSBC Short Duration Fund 481,603.05 260 1,098,235.19 5
6. inveStor ServiceSThe number of official points of acceptance of transactions is 204 locations. In addition to the offices of the Registrar & Transfer agents, the AMC has Investor Service Centers in 9 locations at its own offices - namely Mumbai, New Delhi, Kolkata, Bangalore, Pune, Ahmedabad, Hyderabad, Chandigarh and Chennai. With a view to enhance customer convenience, the AMC has the facility of priority based servicing to key distributors through the enhancement of the Interactive Voice Reponses. The AMC has 2 Toll Free numbers (1-800-200-2434 /1-800-258-2434) which can be dialed from anywhere in India and 1 number i.e +91 44 39923900 (Investors calling from abroad). The call center service is being managed by the Registrar and Transfer Agents. Transactions for purchase / redemption of units in the schemes HSBC Mutual Fund can also be made through the online transaction facility on the AMC’s website at https://invest.assetmanagement.hsbc.co.in.
Trustees’ ReportFor the year ended March 31, 2021 (Contd...)

9
HSBC Short Duration Fund
Trustees’ ReportFor the year ended March 31, 2021 (Contd...)
On the distribution front, the number of empaneled distributors was 1069 as on March 31, 2021. During the year, the AMC initiated tie-ups for online distribution of the Mutual Fund’s schemes with several channel partners taking the total number of such tie-ups to 52.
7. detailS of inveStor grievance redreSSalThe details of the redressal of investor complaints received against HSBC Mutual Fund during April 2020 - March 2021 are as follows:
2020-2021com-plaint code
type of complaint# (a) no. of complaints pending at the begin-ning of the
year
(b) no. of com-
plaints received during
the year
action on (a) and (b)
resolved non action-
able
Pending
Within 30
days
30 - 60 days
60 - 180 days
Beyond 180 days
0 - 3 months
3 - 6 months
6 - 9 months
9 - 12 months
I A Non receipt of Dividend on Units
0 0 0 0 0 0 0 0 0 0 0
I B Interest on delayed payment of Dividend
0 0 0 0 0 0 0 0 0 0 0
I C Non receipt of Redemption Proceeds
0 8 7 0 0 0 0 1 0 0 0
I D Interest on delayed payment of Redemption
0 0 0 0 0 0 0 0 0 0 0
II A Non receipt of Statement of Account / Unit Certificate
0 0 0 0 0 0 0 0 0 0 0
II B Discrepancy in Statement of Account
0 1 1 0 0 0 0 0 0 0 0
II C Data corrections in Investor details **
0 12 12 0 0 0 0 0 0 0 0
II D Non receipt of Annual Report/Abridged Summary
0 0 0 0 0 0 0 0 0 0 0
III A Wrong switch between Schemes
0 0 0 0 0 0 0 0 0 0 0
III B Unauthorized switch between Schemes
0 0 0 0 0 0 0 0 0 0 0
III C Deviation from Scheme attributes
0 0 0 0 0 0 0 0 0 0 0
III D Wrong or excess charges/load
0 0 0 0 0 0 0 0 0 0 0
III E Non updation of changes viz. address, PAN, bank details, nomination, etc
0 6 6 0 0 0 0 0 0 0 0
IV Others 0 15 15 0 0 0 0 0 0 0 0
total 0 42 41 0 0 0 0 1 0 0 0
Summary of complaints for fY 2020-21
Particulars count
Total complaints received 42
Total number of folios 148770
% of complaints against the folio 0.028%
# active folios
** As per AMFI Best Practice Guidelines Circular No. 25/2011-12 for Revisions in the Guidelines on Standardization of Complaints / Grievances Reporting Procedure. If “Others” include a type of complaint which is more than 10% of overall
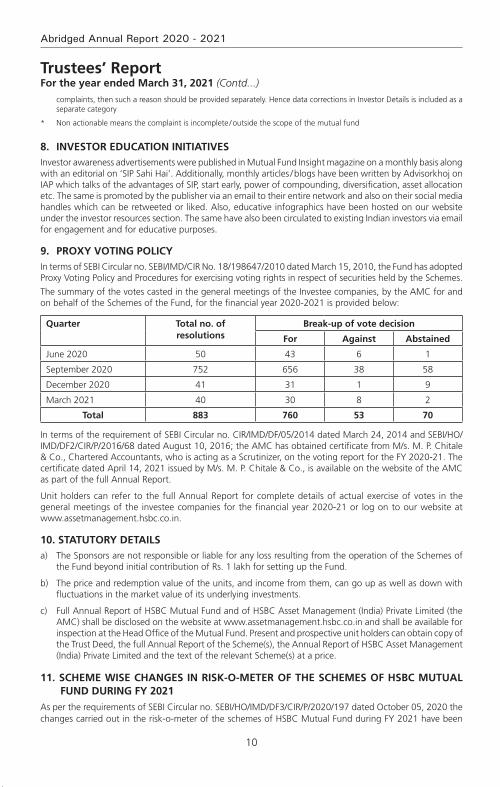
10
Abridged Annual Report 2020 - 2021
complaints, then such a reason should be provided separately. Hence data corrections in Investor Details is included as a separate category
* Non actionable means the complaint is incomplete / outside the scope of the mutual fund
8. inveStor education initiativeS Investor awareness advertisements were published in Mutual Fund Insight magazine on a monthly basis along with an editorial on ‘SIP Sahi Hai’. Additionally, monthly articles / blogs have been written by Advisorkhoj on IAP which talks of the advantages of SIP, start early, power of compounding, diversification, asset allocation etc. The same is promoted by the publisher via an email to their entire network and also on their social media handles which can be retweeted or liked. Also, educative infographics have been hosted on our website under the investor resources section. The same have also been circulated to existing Indian investors via email for engagement and for educative purposes.
9. ProxY voting PolicYIn terms of SEBI Circular no. SEBI/IMD/CIR No. 18/198647/2010 dated March 15, 2010, the Fund has adopted Proxy Voting Policy and Procedures for exercising voting rights in respect of securities held by the Schemes.
The summary of the votes casted in the general meetings of the Investee companies, by the AMC for and on behalf of the Schemes of the Fund, for the financial year 2020-2021 is provided below:
quarter total no. of resolutions
Break-up of vote decision
for against abstained
June 2020 50 43 6 1
September 2020 752 656 38 58
December 2020 41 31 1 9
March 2021 40 30 8 2
total 883 760 53 70
In terms of the requirement of SEBI Circular no. CIR/IMD/DF/05/2014 dated March 24, 2014 and SEBI/HO/IMD/DF2/CIR/P/2016/68 dated August 10, 2016; the AMC has obtained certificate from M/s. M. P. Chitale & Co., Chartered Accountants, who is acting as a Scrutinizer, on the voting report for the FY 2020-21. The certificate dated April 14, 2021 issued by M/s. M. P. Chitale & Co., is available on the website of the AMC as part of the full Annual Report.
Unit holders can refer to the full Annual Report for complete details of actual exercise of votes in the general meetings of the investee companies for the financial year 2020-21 or log on to our website at www.assetmanagement.hsbc.co.in.
10. StatutorY detailSa) The Sponsors are not responsible or liable for any loss resulting from the operation of the Schemes of
the Fund beyond initial contribution of Rs. 1 lakh for setting up the Fund.
b) The price and redemption value of the units, and income from them, can go up as well as down with fluctuations in the market value of its underlying investments.
c) Full Annual Report of HSBC Mutual Fund and of HSBC Asset Management (India) Private Limited (the AMC) shall be disclosed on the website at www.assetmanagement.hsbc.co.in and shall be available for inspection at the Head Office of the Mutual Fund. Present and prospective unit holders can obtain copy of the Trust Deed, the full Annual Report of the Scheme(s), the Annual Report of HSBC Asset Management (India) Private Limited and the text of the relevant Scheme(s) at a price.
11. Scheme WiSe changeS in riSk-o-meter of the SchemeS of hSBc mutual fund during fY 2021
As per the requirements of SEBI Circular no. SEBI/HO/IMD/DF3/CIR/P/2020/197 dated October 05, 2020 the changes carried out in the risk-o-meter of the schemes of HSBC Mutual Fund during FY 2021 have been
Trustees’ ReportFor the year ended March 31, 2021 (Contd...)

11
HSBC Short Duration Fund
Trustees’ ReportFor the year ended March 31, 2021 (Contd...)
given in the below mentioned table for the information of the Unitholders, a report on the said changes has also been displayed on the website of the Fund and AMFI.
Scheme name
risk-o-meter level as on december
31,2020^
risk-o-meter level at end of
the financial year
number of changes in risk-o-meter during the
financial year^
dec-2020 mar-2021 dec 2020 to march 2021
HSBC Short Duration Fund Moderate Moderate 0
^From the effective date (i.e. January 01, 2021) of SEBI circular no. SEBI/HO/IMD/DF3/CIR/P/2020/197 dated October 05, 2020.
12. governance under the PolicY on SteWardShiP reSPonSiBilitieS of hSBc mutual fund
As per the requirements of SEBI Circular no. CIR/CFD/CMD1/ 168 /2019 dated December 24, 2019, HSBC Mutual Fund has adapted the policy on stewardship responsibilities, the unitholders are requested to note the status of governance with the same as mentioned below:
S. no.
Particulars of Principles of Stewardship code
Status of compliance (complied/
not complied)
description remarks/reasons for
deviation/non - compliance,
if any
1 Principle 1:
Institutional Investors should formulate a comprehensive policy on the discharge of their stewardship responsibilities, publicly disclose it, review and update it periodically.
Complied HSBC Asset Management (India) Private Limited's (AMIN) 'Policy on Stewardship responsibilities' (Stewardship Code / Policy) was formulated and implemented on 01 July, 2020. This is a comprehensive document which has been publicly disclosed on the website of AMIN. The same shall follow a periodic review.
N.A.
2 Principle 2:
Inst i tut ional investors should have a clear policy on how they manage conflicts of interest in fulfilling their stewardship responsibilities and publicly disclose it.
Complied Defining and managing Conflict of Interest in fulfilling stewardship responsibilities are detailed in the Stewardship Policy document. The policy document is publicly disclosed.
N.A.
3 Principle 3:
Institutional investors should monitor their investee companies.
Complied AMIN monitors all investee companies through its investment process. This includes assessment of companies’ own and market data, consideration of research from brokers and other independent research providers – including ESG & voting research, attending individual & group meetings with company management and directors, visiting production sites (wherever necessary), engaging with key stakeholders including competitors and customers, and financial modelling. More details enumerated in the policy document
N.A.

12
Abridged Annual Report 2020 - 2021
Trustees’ ReportFor the year ended March 31, 2021 (Contd...)
S. no.
Particulars of Principles of Stewardship code
Status of compliance (complied/
not complied)
description remarks/reasons for
deviation/non - compliance,
if any
4 Principle 4:Inst i tut ional investors should have a clear policy on intervention in their investee companies. Institutional investors should also have a clear policy for collaboration with other institutional investors where required, to preserve the interests of the ultimate investors, which should be disclosed.
Complied Details of undertaking active engagement with investee companies and the policy for collaboration with other institutional holders are detailed in the policy document. The policy document is publicly disclosed.
N.A.
5 Principle 5:
Inst i tut ional investors should have a clear policy on voting and disclosure of voting activity.
Complied AMIN has a clear and detailed voting policy which provides the framework for the voting decisions. All voting decisions shall be in accordance with AMIN’s Voting Policy and Procedures, which is disclosed on the website. AMIN discloses the details of the voting on its website on a quarterly basis within 10 working days from the end of the quarter. Additionally, AMIN also discloses the details of the votes cast, in the annual report of the schemes of HSBC Mutual Fund.
N.A.
6 Principle 6:Institutional investors should report periodically on their stewardship activities.
Complied The annual status report of the stewardship code and quarterly report on proxy voting are publicly disclosed on the website as required under SEBI Regulations.
N.A.
13. Significant event after the end of the financial Year HSBC Global Consumer Opportunities Fund (HGCOF) has been merged with HSBC Asia Pacific (Ex Japan) Dividend Yield Fund with effect from May 13, 2021. Therefore, HGCOF has been ceased to exist from the aforesaid date.
14. acknoWledgementSThe Trustees wish to thank the Unit holders of the Schemes for their support throughout the year and also thank the Government of India, the Securities and Exchange Board of India (SEBI), the Reserve Bank of India (RBI) and the Association of Mutual Funds in India (AMFI) for the guidance provided by them. The Trustees also appreciate the services provided by the Registrar and Transfer Agent, Fund Accountant, Custodian, Bankers, Distributors and Brokers. The guidance and services provided by the Auditors and advocates and the ebullience, sincerity and dedication of the employees of HSBC Asset Management (India) Private Limited is also appreciated.
The Trustees look forward to the continued support of everyone.
For and on behalf of the Board of Trustees of HSBC Mutual Fund
Sd/-
Trustee
Mumbai
July 20, 2021.

13
HSBC Short Duration Fund
To the Trustees of HSBC Mutual Fund
hSBc Short duration fund
Report on the Audit of the Financial Statements
OpinionWe have audited the financial statements of hSBc Short duration fund (the ‘Scheme’) of HSBC Mutual Fund, which comprise the balance sheet as at 31 March 2021 and the revenue account and cash flow statement for the year then ended, and notes to the financial statements, including a summary of the significant accounting policies.
In our opinion and to the best of our information and according to the explanations given to us, the aforesaid financial statements give a true and fair view in conformity with the accounting principles generally accepted in India, of the state of affairs of the Scheme as at 31 March 2021, its net surplus and cash flows for the year ended on that date.
Basis for opinionWe conducted our audit in accordance with the Standards on Auditing (‘SAs’) issued by the Institute of Chartered Accountants of India (the ‘ICAI’). Our responsibilities under those SAs are further described in the Auditor’s Responsibilities for the Audit of the Financial Statements section of our report. We are independent of the Scheme in accordance with the Code of Ethics issued by the ICAI, and we have fulfilled our other ethical responsibilities in accordance with the Code of Ethics. We believe that the audit evidence we have obtained is sufficient and appropriate to provide a basis for our opinion.
responsibilities of management and those charged with governance for the financial StatementsThe Scheme’s management, the Board of Directors of HSSBC Mutual Fund (the ‘Trustee’) and the Board of Directors of HSBC Asset Management (India) Private Limited (the ‘AMC’) (collectively referred to as ‘Management’) are responsible for the preparation of these financial statements that give a true and fair view of the state of affairs, results of operations and cash flows of the Scheme in accordance with the accounting policies and standards specified in the Ninth Schedule of the Securities and Exchange Board of India (Mutual Funds) Regulations, 1996, as amended (the ‘Regulations’) and the accounting principles generally accepted in India. This responsibility includes design, implementation and maintenance of internal control relevant to the preparation and presentation of the financial statements that give a true and fair view and are free from material misstatement, whether due to fraud or error.
In preparing the financial statements, management is responsible for assessing the Scheme’s ability to continue as a going concern, disclosing, as applicable, matters related to going concern and using the going concern basis of accounting unless management either intends to liquidate the Scheme or to cease operations, or has no realistic alternative but to do so.
The management is responsible for overseeing the Scheme’s financial reporting process.
auditor’s responsibilities for the audit of the financial StatementsOur objectives are to obtain reasonable assurance about whether the financial statements as a whole are free from material misstatement, whether due to fraud or error, and to issue an auditor’s report that includes our opinion. Reasonable assurance is a high level of assurance, but is not a guarantee that an audit conducted in accordance with SAs will always detect a material misstatement when it exists. Misstatements can arise from fraud or error and are considered material if, individually or in the aggregate, they could reasonably be expected to influence the economic decisions of users taken on the basis of these financial statements.
As part of an audit in accordance with SAs, we exercise professional judgment and maintain professional skepticism throughout the audit. We also:
• Identifyandassesstherisksofmaterialmisstatementofthefinancialstatements,whetherduetofraudor error, design and perform audit procedures responsive to those risks, and obtain audit evidence that is sufficient and appropriate to provide a basis for our opinion. The risk of not detecting a material
Independent Auditors’ Report
14
Abridged Annual Report 2020 - 2021
Independent Auditors’ Report (Contd...)
misstatement resulting from fraud is higher than for one resulting from error, as fraud may involve collusion, forgery, intentional omissions, misrepresentations, or the override of internal control;
• Obtainanunderstandingofinternalcontrolrelevanttotheauditinordertodesignauditproceduresthat are appropriate in the circumstances, but not for the purpose of expressing an opinion on the effectiveness of the Scheme’s internal controls;
• Evaluatetheappropriatenessofaccountingpoliciesusedandthereasonablenessofaccountingestimatesand related disclosures made by Management;
• ConcludeontheappropriatenessofManagement’suseofthegoingconcernbasisofaccountingand,based on the audit evidence obtained, whether a material uncertainty exists related to events or conditions that may cast significant doubt on the Scheme’s ability to continue as a going concern. If we conclude that a material uncertainty exists, we are required to draw attention in our auditor’s report to the related disclosures in the financial statements or, if such disclosures are inadequate, to modify our opinion. Our conclusions are based on the audit evidence obtained up to the date of our auditor’s report. However, future events or conditions may cause the Scheme to cease to continue as a going concern;
• Evaluate the overall presentation, structure and content of the financial statements, including thedisclosures and whether the financial statements represent the underlying transactions and events in a manner that achieves fair presentation.
We communicate with those charged with governance regarding, among other matters, the planned scope and timing of the audit and significant audit findings, including any significant deficiencies in internal control that we identify during our audit.
We also provide those charged with governance with a statement that we have complied with relevant ethical requirements regarding independence, and to communicate with them all relationships and other matters that may reasonably be thought to bear on our independence, and where applicable, related safeguards.
report on other legal and regulatory requirements 1 As required by Regulation 55 (4) of the Regulations, we report that:
(a) We have obtained all information and explanations which, to the best of our knowledge and belief, were necessary for the purposes of the audit; and
(b) The balance sheet and the revenue account have been prepared in accordance with the accounting policies and standards as specified in the Ninth Schedule of the Regulations.
2 As required by Clause 5 (ii) (2) of the Eleventh Schedule of the Regulations, we report that the balance sheet and the revenue account are in agreement with the books of account of the Scheme.
3 As required by the Eight Schedule of the Regulations, we report that, in our opinion and on the basis of information and explanations given to us, the methods used to value non - traded securities, as at 31 March 2021, as determined by the Board of Directors of the AMC, are in accordance with the Regulations and other guidelines issued by the Securities and Exchange Board of India as applicable and approved by the Board of Directors of the Trustee, are fair and reasonable.
For B S R & Co. LLP Chartered Accountants Firm’s Registration No: 101248W/W-100022
Sd/-
Ajit Viswanath PartnerMembership No: 067114UDIN : 21067114AAAADD6818
Place : Mumbai Date : July 20, 2021.

15
HSBC Short Duration Fund
Abridged Balance Sheet as at March 31, 2021
Rs. in Lakhs
As at March 31, 2021
As at March 31, 2020
LIABILITIES1 Unit Capital 5,635.64 13,355.472 Reserves & Surplus2.1 Unit Premium Reserves 115.32 1,307.202.2 Unrealised Appreciation Reserve – –2.3 Other Reserves 9,640.03 17,752.073 Loans & Borrowings – –4 Current Liabilities & Provisions4.1 Provision for Doubtful Income / Deposits – –4.2 Other Current Liabilities & Provisions 130.30 368.57
TOTAL 15,521.29 32,783.31
ASSETS1 Investments1.1 Listed Securities:1.1.1 Equity Shares – –1.1.2 Preference Shares – –1.1.3 Equity Linked Debentures – –1.1.4 Other Debentures & Bonds 9,757.93 29,397.311.1.5 Securitised Debt Securities – –1.2 Securities Awaited Listing:1.2.1 Equity Shares – –1.2.2 Preference Shares – –1.2.3 Equity Linked Debentures – –1.2.4 Other Debentures & Bonds – –1.2.5 Securitised Debt Securities – –1.3 Unlisted Securities:1.3.1 Equity Shares – –1.3.2 Preference Shares – –1.3.3 Equity Linked Debentures – –1.3.4 Other Debentures & Bonds – –1.3.5 Securitised Debt Securities – –1.4 Government Securities 4,695.19 –1.5 Treasury Bills – –1.6 Commercial Paper – –1.7 Certificate of Deposits – –1.8 Bill Rediscounting – –1.9 Units of Domestic Mutual Fund – –1.10 Foreign Securities – –
Total Investments 14,453.12 29,397.31
2 Deposits 3.29 18.033 Other Current Assets3.1 Cash & Bank Balance 1.16 0.093.2 TREPS / Reverse Repo Lending 598.75 608.253.3 Others 464.97 2,759.634 Deferred Revenue Expenditure (to the extent not written off) – –
TOTAL 15,521.29 32,783.31
Notes to Accounts - Annexure I
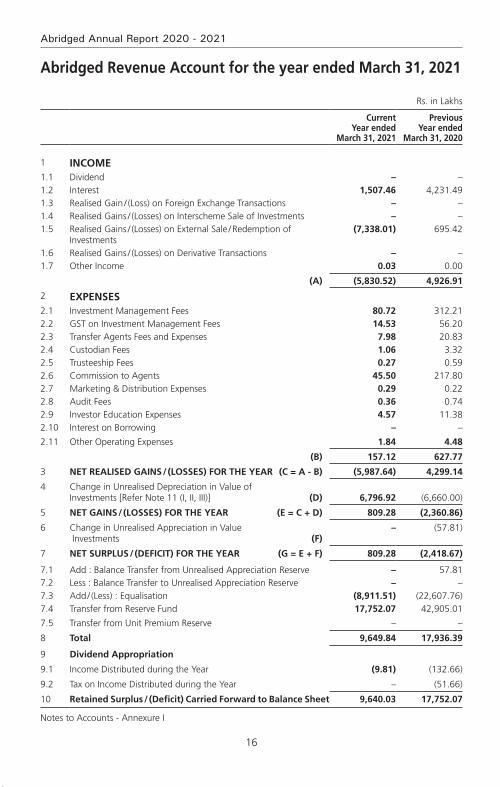
16
Abridged Annual Report 2020 - 2021
Abridged Revenue Account for the year ended March 31, 2021
Rs. in Lakhs
Current Year ended
March 31, 2021
Previous Year ended
March 31, 2020
1 INCOME1.1 Dividend – –1.2 Interest 1,507.46 4,231.491.3 Realised Gain / (Loss) on Foreign Exchange Transactions – –1.4 Realised Gains / (Losses) on Interscheme Sale of Investments – –1.5 Realised Gains / (Losses) on External Sale / Redemption of
Investments(7,338.01) 695.42
1.6 Realised Gains / (Losses) on Derivative Transactions – –1.7 Other Income 0.03 0.00
(A) (5,830.52) 4,926.91
2 exPenSeS2.1 Investment Management Fees 80.72 312.212.2 GST on Investment Management Fees 14.53 56.202.3 Transfer Agents Fees and Expenses 7.98 20.832.4 Custodian Fees 1.06 3.322.5 Trusteeship Fees 0.27 0.592.6 Commission to Agents 45.50 217.802.7 Marketing & Distribution Expenses 0.29 0.222.8 Audit Fees 0.36 0.742.9 Investor Education Expenses 4.57 11.382.10 Interest on Borrowing – –
2.11 Other Operating Expenses 1.84 4.48
(B) 157.12 627.77
3 NET REALISED GAINS / (LOSSES) FOR THE YEAR (C = A - B) (5,987.64) 4,299.14
4 Change in Unrealised Depreciation in Value of Investments [Refer Note 11 (I, II, III)] (D) 6,796.92 (6,660.00)
5 NET GAINS / (LOSSES) FOR THE YEAR (E = C + D) 809.28 (2,360.86)
6 Change in Unrealised Appreciation in Value Investments (F)
– (57.81)
7 NET SURPLUS / (DEFICIT) FOR THE YEAR (G = E + F) 809.28 (2,418.67)
7.1 Add : Balance Transfer from Unrealised Appreciation Reserve – 57.817.2 Less : Balance Transfer to Unrealised Appreciation Reserve – –7.3 Add / (Less) : Equalisation (8,911.51) (22,607.76)7.4 Transfer from Reserve Fund 17,752.07 42,905.01
7.5 Transfer from Unit Premium Reserve – –
8 Total 9,649.84 17,936.39
9 Dividend Appropriation
9.1 Income Distributed during the Year (9.81) (132.66)
9.2 Tax on Income Distributed during the Year – (51.66)
10 Retained Surplus / (Deficit) Carried Forward to Balance Sheet 9,640.03 17,752.07
Notes to Accounts - Annexure I
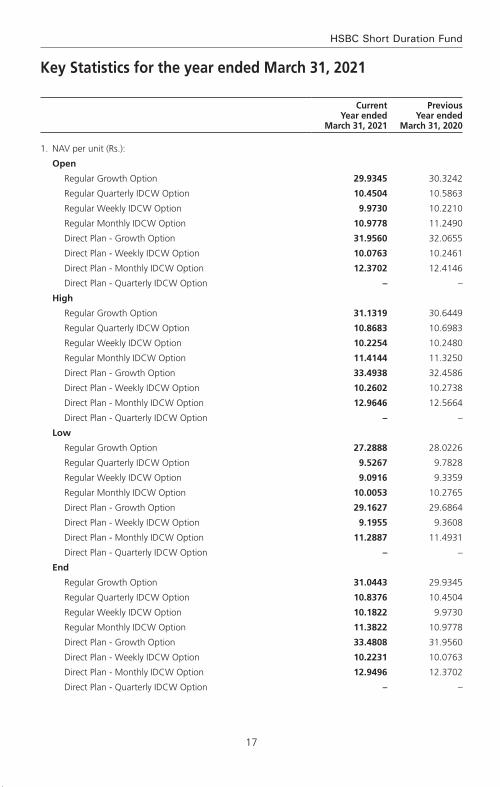
17
HSBC Short Duration Fund
Key Statistics for the year ended March 31, 2021
Current Year ended
March 31, 2021
Previous Year ended
March 31, 2020
1. NAV per unit (Rs.):
Open
Regular Growth Option 29.9345 30.3242
Regular Quarterly IDCW Option 10.4504 10.5863
Regular Weekly IDCW Option 9.9730 10.2210
Regular Monthly IDCW Option 10.9778 11.2490
Direct Plan - Growth Option 31.9560 32.0655
Direct Plan - Weekly IDCW Option 10.0763 10.2461
Direct Plan - Monthly IDCW Option 12.3702 12.4146
Direct Plan - Quarterly IDCW Option – –
High
Regular Growth Option 31.1319 30.6449
Regular Quarterly IDCW Option 10.8683 10.6983
Regular Weekly IDCW Option 10.2254 10.2480
Regular Monthly IDCW Option 11.4144 11.3250
Direct Plan - Growth Option 33.4938 32.4586
Direct Plan - Weekly IDCW Option 10.2602 10.2738
Direct Plan - Monthly IDCW Option 12.9646 12.5664
Direct Plan - Quarterly IDCW Option – –
Low
Regular Growth Option 27.2888 28.0226
Regular Quarterly IDCW Option 9.5267 9.7828
Regular Weekly IDCW Option 9.0916 9.3359
Regular Monthly IDCW Option 10.0053 10.2765
Direct Plan - Growth Option 29.1627 29.6864
Direct Plan - Weekly IDCW Option 9.1955 9.3608
Direct Plan - Monthly IDCW Option 11.2887 11.4931
Direct Plan - Quarterly IDCW Option – –
End
Regular Growth Option 31.0443 29.9345
Regular Quarterly IDCW Option 10.8376 10.4504
Regular Weekly IDCW Option 10.1822 9.9730
Regular Monthly IDCW Option 11.3822 10.9778
Direct Plan - Growth Option 33.4808 31.9560
Direct Plan - Weekly IDCW Option 10.2231 10.0763
Direct Plan - Monthly IDCW Option 12.9496 12.3702
Direct Plan - Quarterly IDCW Option – –

18
Abridged Annual Report 2020 - 2021
Key Statistics for the year ended March 31, 2021 (Contd...)
Current Year ended
March 31, 2021
Previous Year ended
March 31, 2020
2. Closing Assets Under Management (Rs. in Lakhs)
End 15,339 32,467
Average (AAuM)1 22,845 56,890
3. Gross income as % of AAuM2 -25.52% 8.66%
4. Expense Ratio:
a. Total Expense as % of AAuM (including GST on Management fees) (planwise)
Regular Growth Option 1.29% 1.29%
Direct Plan - Growth Option 0.27% 0.34%
b. Management Fee as % of AAuM (planwise)
Regular Growth Option 0.67% 0.63%
Direct Plan - Growth Option 0.17% 0.23%
5. Net Income as a percentage of AAuM3 -26.21% 7.56%
6. Portfolio turnover ratio4 – –
7. Total Dividend per unit distributed during the year (planwise)
Retail
Regular Weekly IDCW Option 0.1596 0.0857
Regular Quarterly IDCW Option – –
Regular Monthly IDCW Option 0.0025 0.0932
Direct Plan - Weekly IDCW Option 0.3215 0.0979
Direct Plan - Monthly IDCW Option – –
Direct Plan - Quarterly IDCW Option – –
Corporate
Regular Weekly IDCW Option 0.1596 0.0793
Regular Quarterly IDCW Option – –
Regular Monthly IDCW Option 0.0025 0.0863
Direct Plan - Weekly IDCW Option 0.3215 0.0906
Direct Plan - Monthly IDCW Option – –
Direct Plan - Quarterly IDCW Option – –
8. Returns (%):
a. Last One Year
Scheme
Regular Growth Option 3.7100 (1.2400)
Direct Plan - Growth Option 4.7700 (0.3000)
Benchmark
CRISIL Short-Term Bond Fund Index 7.8000 9.7800
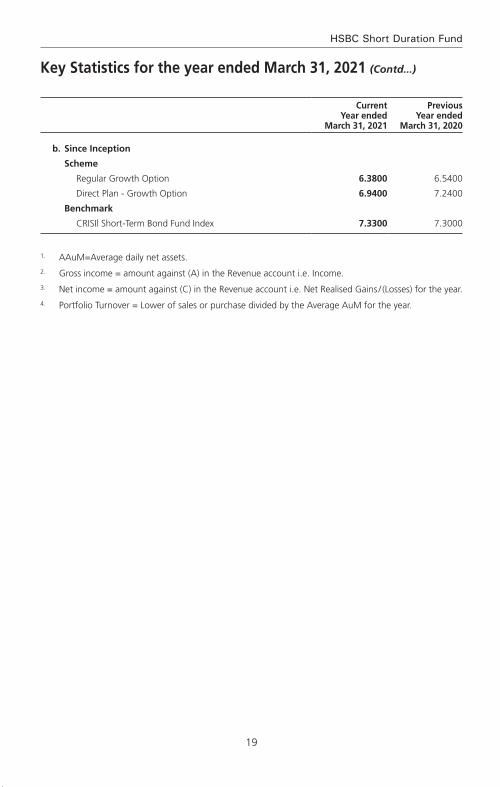
19
HSBC Short Duration Fund
Current Year ended
March 31, 2021
Previous Year ended
March 31, 2020
b. Since Inception
Scheme
Regular Growth Option 6.3800 6.5400
Direct Plan - Growth Option 6.9400 7.2400
Benchmark
CRISIl Short-Term Bond Fund Index 7.3300 7.3000
1. AAuM=Average daily net assets.2. Gross income = amount against (A) in the Revenue account i.e. Income.3. Net income = amount against (C) in the Revenue account i.e. Net Realised Gains / (Losses) for the year.4. Portfolio Turnover = Lower of sales or purchase divided by the Average AuM for the year.
Key Statistics for the year ended March 31, 2021 (Contd...)

20
Abridged Annual Report 2020 - 2021
Notes to Accounts – Annexure ITo the Abridged Balance Sheet and Revenue Account for the Year ended March 31, 2021
1 Investments:-
1.1. It is confirmed that investments of the scheme are registered in the name of the Trustees for the benefit of the Scheme’s unitholders.
1.2. Open Positions of derivatives as of years ended March 31, 2021 and March 31, 2020 is NIL.
1.3. Investments in Associates and Group Companies:(Rupees)
Issuer Instrument Type
Amount Aggregate Investments
by all schemes
Amount Aggregate Investments
by all schemes
2021 2020
Bharti Airtel Ltd. Equities – 470,907,573 – 594,575,759
Max Financial Services Ltd.
Equities – 172,035,228 – –
Balrampur Chini Mills Ltd.
Equities – 56,482,738 – –
1.4. Open position of Securities Borrowed and / or Lent by the scheme as of the years ended March 31, 2021 and March 31, 2020 are NIL.
1.5. Investment in Below investment grade and default / Securities in default beyond its maturity date as on March 31, 2021 & March 31, 2020 (Ref. Note 11).
1.6. Aggregate Unrealised Gain / Loss as at the end of the financial years 2021 and 2020 and their percentages to net assets are as under :
Security Category
2021 2020
Amount (Rupees)
Percentage to Net Assets
Amount (Rupees)
Percentage to Net Assets
Non Convertible Debentures and Bonds Listed / Awaiting Listing
– Appreciation 4,217,998 0.27 38,743,159 1.19
– Depreciation 4,721,555 0.31 199,879,520 6.16
Certificate of Deposit
– Appreciation – – – –
– Depreciation – – – –
Government Securities
– Appreciation 313,530 0.02 – –
– Depreciation 3,502,066 0.23 – –
1.7. The aggregate value of investments securities (excluding CBLO / TREPS and Reverse Repos) purchased and sold (including matured) during the financial year 2020-21 (excluding accretion of discount) are Rs. 5,908,533,203 and Rs. 7,377,052,326 respectively being 258.63% and 322.91% of the average daily net assets.
The aggregate value of investments securities (excluding CBLO / TREPS and Reverse Repos) purchased and sold (including matured) during the financial year 2019-20 (excluding accretion of discount) are Rs. 6,162,041,296 and Rs. 11,174,466,636 respectively being 108.31% and 196.42% of the average daily net assets.
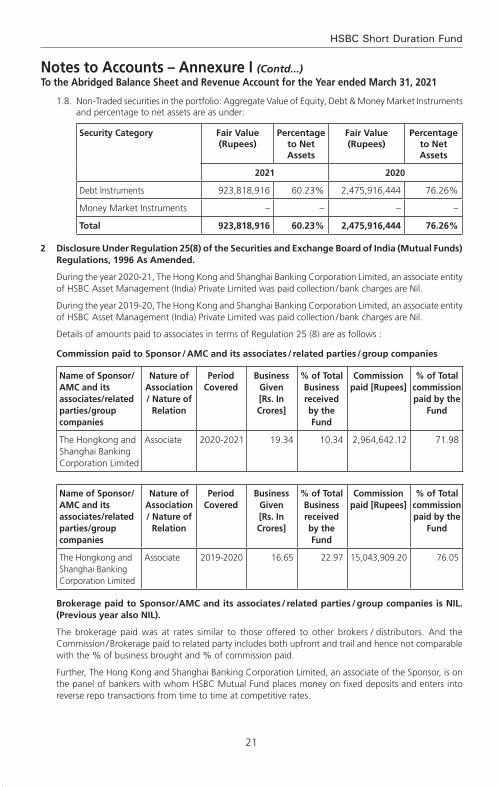
21
HSBC Short Duration Fund
1.8. Non-Traded securities in the portfolio: Aggregate Value of Equity, Debt & Money Market Instruments and percentage to net assets are as under:
Security Category Fair Value (Rupees)
Percentage to Net Assets
Fair Value (Rupees)
Percentage to Net Assets
2021 2020
Debt Instruments 923,818,916 60.23% 2,475,916,444 76.26%
Money Market Instruments – – – –
Total 923,818,916 60.23% 2,475,916,444 76.26%
2 Disclosure Under Regulation 25(8) of the Securities and Exchange Board of India (Mutual Funds) Regulations, 1996 As Amended.
During the year 2020-21, The Hong Kong and Shanghai Banking Corporation Limited, an associate entity of HSBC Asset Management (India) Private Limited was paid collection / bank charges are Nil.
During the year 2019-20, The Hong Kong and Shanghai Banking Corporation Limited, an associate entity of HSBC Asset Management (India) Private Limited was paid collection / bank charges are Nil.
Details of amounts paid to associates in terms of Regulation 25 (8) are as follows :
Commission paid to Sponsor / AMC and its associates / related parties / group companies
Name of Sponsor/AMC and its associates/related parties/group companies
Nature of Association / Nature of
Relation
Period Covered
Business Given [Rs. In Crores]
% of Total Business received by the Fund
Commission paid [Rupees]
% of Total commission paid by the
Fund
The Hongkong and Shanghai Banking Corporation Limited
Associate 2020-2021 19.34 10.34 2,964,642.12 71.98
Name of Sponsor/AMC and its associates/related parties/group companies
Nature of Association / Nature of
Relation
Period Covered
Business Given [Rs. In Crores]
% of Total Business received by the Fund
Commission paid [Rupees]
% of Total commission paid by the
Fund
The Hongkong and Shanghai Banking Corporation Limited
Associate 2019-2020 16.65 22.97 15,043,909.20 76.05
Brokerage paid to Sponsor/AMC and its associates / related parties / group companies is NIL. (Previous year also NIL).
The brokerage paid was at rates similar to those offered to other brokers / distributors. And the Commission / Brokerage paid to related party includes both upfront and trail and hence not comparable with the % of business brought and % of commission paid.
Further, The Hong Kong and Shanghai Banking Corporation Limited, an associate of the Sponsor, is on the panel of bankers with whom HSBC Mutual Fund places money on fixed deposits and enters into reverse repo transactions from time to time at competitive rates.
Notes to Accounts – Annexure I (Contd...)To the Abridged Balance Sheet and Revenue Account for the Year ended March 31, 2021
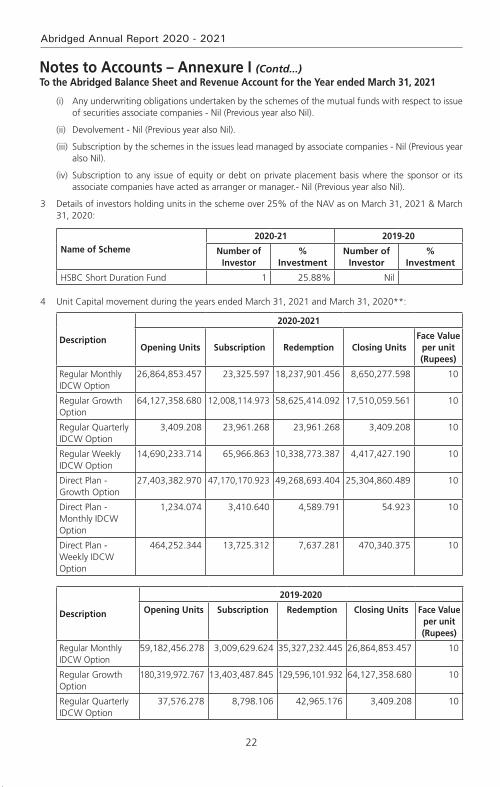
22
Abridged Annual Report 2020 - 2021
(i) Any underwriting obligations undertaken by the schemes of the mutual funds with respect to issue of securities associate companies - Nil (Previous year also Nil).
(ii) Devolvement - Nil (Previous year also Nil).
(iii) Subscription by the schemes in the issues lead managed by associate companies - Nil (Previous year also Nil).
(iv) Subscription to any issue of equity or debt on private placement basis where the sponsor or its associate companies have acted as arranger or manager.- Nil (Previous year also Nil).
3 Details of investors holding units in the scheme over 25% of the NAV as on March 31, 2021 & March 31, 2020:
Name of Scheme2020-21 2019-20
Number of Investor
% Investment
Number of Investor
% Investment
HSBC Short Duration Fund 1 25.88% Nil
4 Unit Capital movement during the years ended March 31, 2021 and March 31, 2020**:
Description
2020-2021
Opening Units Subscription Redemption Closing UnitsFace Value
per unit (Rupees)
Regular Monthly IDCW Option
26,864,853.457 23,325.597 18,237,901.456 8,650,277.598 10
Regular Growth Option
64,127,358.680 12,008,114.973 58,625,414.092 17,510,059.561 10
Regular Quarterly IDCW Option
3,409.208 23,961.268 23,961.268 3,409.208 10
Regular Weekly IDCW Option
14,690,233.714 65,966.863 10,338,773.387 4,417,427.190 10
Direct Plan - Growth Option
27,403,382.970 47,170,170.923 49,268,693.404 25,304,860.489 10
Direct Plan - Monthly IDCW Option
1,234.074 3,410.640 4,589.791 54.923 10
Direct Plan - Weekly IDCW Option
464,252.344 13,725.312 7,637.281 470,340.375 10
Description
2019-2020
Opening Units Subscription Redemption Closing Units Face Value per unit (Rupees)
Regular Monthly IDCW Option
59,182,456.278 3,009,629.624 35,327,232.445 26,864,853.457 10
Regular Growth Option
180,319,972.767 13,403,487.845 129,596,101.932 64,127,358.680 10
Regular Quarterly IDCW Option
37,576.278 8,798.106 42,965.176 3,409.208 10
Notes to Accounts – Annexure I (Contd...)To the Abridged Balance Sheet and Revenue Account for the Year ended March 31, 2021
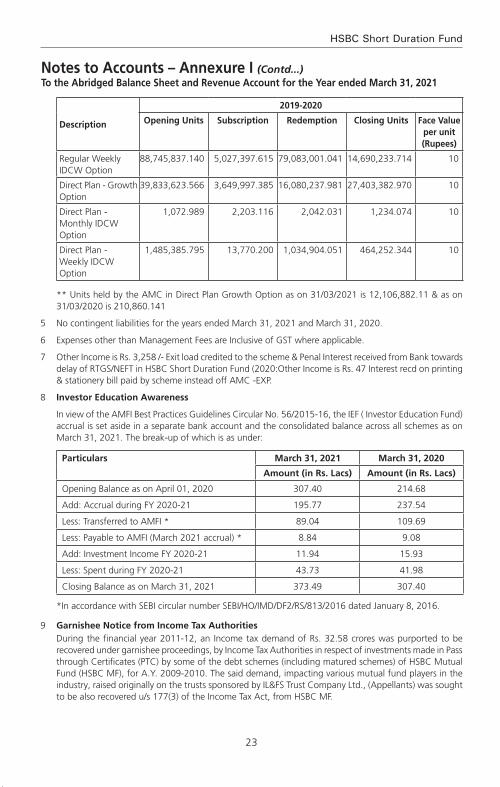
23
HSBC Short Duration Fund
Notes to Accounts – Annexure I (Contd...)To the Abridged Balance Sheet and Revenue Account for the Year ended March 31, 2021
Description
2019-2020
Opening Units Subscription Redemption Closing Units Face Value per unit (Rupees)
Regular Weekly IDCW Option
88,745,837.140 5,027,397.615 79,083,001.041 14,690,233.714 10
Direct Plan - Growth Option
39,833,623.566 3,649,997.385 16,080,237.981 27,403,382.970 10
Direct Plan - Monthly IDCW Option
1,072.989 2,203.116 2,042.031 1,234.074 10
Direct Plan - Weekly IDCW Option
1,485,385.795 13,770.200 1,034,904.051 464,252.344 10
** Units held by the AMC in Direct Plan Growth Option as on 31/03/2021 is 12,106,882.11 & as on 31/03/2020 is 210,860.141
5 No contingent liabilities for the years ended March 31, 2021 and March 31, 2020.
6 Expenses other than Management Fees are Inclusive of GST where applicable.
7 Other Income is Rs. 3,258 /- Exit load credited to the scheme & Penal Interest received from Bank towards delay of RTGS/NEFT in HSBC Short Duration Fund (2020:Other Income is Rs. 47 Interest recd on printing & stationery bill paid by scheme instead off AMC -EXP.
8 Investor Education Awareness
In view of the AMFI Best Practices Guidelines Circular No. 56/2015-16, the IEF ( Investor Education Fund) accrual is set aside in a separate bank account and the consolidated balance across all schemes as on March 31, 2021. The break-up of which is as under:
Particulars March 31, 2021 March 31, 2020
Amount (in Rs. Lacs) Amount (in Rs. Lacs)
Opening Balance as on April 01, 2020 307.40 214.68
Add: Accrual during FY 2020-21 195.77 237.54
Less: Transferred to AMFI * 89.04 109.69
Less: Payable to AMFI (March 2021 accrual) * 8.84 9.08
Add: Investment Income FY 2020-21 11.94 15.93
Less: Spent during FY 2020-21 43.73 41.98
Closing Balance as on March 31, 2021 373.49 307.40
*In accordance with SEBI circular number SEBI/HO/IMD/DF2/RS/813/2016 dated January 8, 2016.
9 Garnishee Notice from Income Tax Authorities During the financial year 2011-12, an Income tax demand of Rs. 32.58 crores was purported to be
recovered under garnishee proceedings, by Income Tax Authorities in respect of investments made in Pass through Certificates (PTC) by some of the debt schemes (including matured schemes) of HSBC Mutual Fund (HSBC MF), for A.Y. 2009-2010. The said demand, impacting various mutual fund players in the industry, raised originally on the trusts sponsored by IL&FS Trust Company Ltd., (Appellants) was sought to be also recovered u/s 177(3) of the Income Tax Act, from HSBC MF.

24
Abridged Annual Report 2020 - 2021
Similar to AY 2009-10, HSBC MF had received a demand notice from the Income Tax authorities for AY 2010-11 for Rs. 6.95 crores.
Further, assessment for the A.Y. 2007-2008 was also been reopened by the Income Tax Authorities and demand of Rs. 2.04 Crores was made on the trust sponsored by IL&FS Trust Company Ltd. HSBC MF has not received any demand notice from the Income Tax authorities for this assessment year.
Against all the above demands, an appeal was filed by the Appellant with the first Appellate Authority CIT(A) and thereafter with ITAT.
The matter of several Loan Trusts were consolidated and heard by ITAT and vide order dated 17th February 2017, the Income Tax Appellate Tribunal (ITAT) passed an order allowing the appeal of the assess and dismissed the appeal of the Revenue.
The Department has filed rectification applications under section 254(2) of the Income Tax Act with ITAT against the favourable orders passed by ITAT on the ground that the Income Tax Appellate Tribunal has failed to consider all aspects of revenue contentions / appeal.
The hearing for the said matter is scheduled on September 24, 2021.
10 Previous year’s figures have been re-grouped / re-arranged where appropriate.
11 I) Hair Cut in receivables & interest during the year in security rated below Investment Grade or Default :
31-March-2021 (Rs. in Lakhs)
Scheme name Name of the security
ISIN Hair cut in receivables
(A)
Hair cut in interest
accrued (B) #
Total Hair cut during the Year (A+B)
HSBC Short Duration Fund
8.9% DHFL NCD RED 04-06-2021
INE202B07IY2 – – –
HSBC Short Duration Fund
9.10% DEWAN HSG FIN NCD RED 16-08-2019
INE202B07HQ0 1,250.00 91.00 1,341.00
HSBC Short Duration Fund
9.05% DEWAN HSG FIN NCD RED 09-09-2019
INE202B07IJ3 375.00 24.83 399.83
31-March-2020
(Rs. in Lakhs)
Scheme name Name of the security
ISIN Hair cut in receivables
(A)
Hair cut in interest
accrued (B)#
Total Hair cut during the Year (A+B)
HSBC Short Duration Fund
8.9% DHFL NCD RED 04-06-2021
INE202B07IY2 1,578.67 – 1,578.67
HSBC Short Duration Fund
9.10% DEWAN HSG FIN NCD RED 16-08-2019
INE202B07HQ0 – – –
HSBC Short Duration Fund
9.05% DEWAN HSG FIN NCD RED 09-09-2019
INE202B07IJ3 – – –
# Interest Accrual was stopped from 04th June 2019
Notes to Accounts – Annexure I (Contd...)To the Abridged Balance Sheet and Revenue Account for the Year ended March 31, 2021
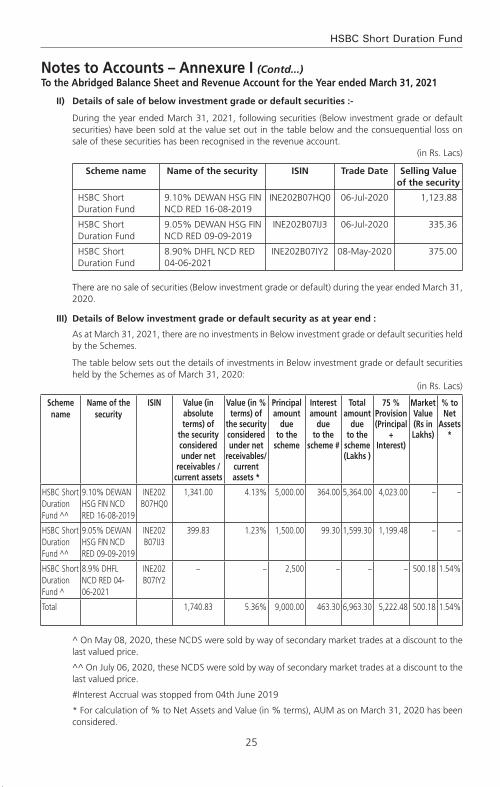
25
HSBC Short Duration Fund
II) Details of sale of below investment grade or default securities :-
During the year ended March 31, 2021, following securities (Below investment grade or default securities) have been sold at the value set out in the table below and the consuequential loss on sale of these securities has been recognised in the revenue account.
(in Rs. Lacs)
Scheme name Name of the security ISIN Trade Date Selling Value of the security
HSBC Short Duration Fund
9.10% DEWAN HSG FIN NCD RED 16-08-2019
INE202B07HQ0 06-Jul-2020 1,123.88
HSBC Short Duration Fund
9.05% DEWAN HSG FIN NCD RED 09-09-2019
INE202B07IJ3 06-Jul-2020 335.36
HSBC Short Duration Fund
8.90% DHFL NCD RED 04-06-2021
INE202B07IY2 08-May-2020 375.00
There are no sale of securities (Below investment grade or default) during the year ended March 31, 2020.
III) Details of Below investment grade or default security as at year end :
As at March 31, 2021, there are no investments in Below investment grade or default securities held by the Schemes.
The table below sets out the details of investments in Below investment grade or default securities held by the Schemes as of March 31, 2020:
(in Rs. Lacs)
Scheme name
Name of the security
ISIN Value (in absolute terms) of
the security considered under net
receivables /current assets
Value (in % terms) of
the security considered under net
receivables/ current assets *
Principal amount
due to the
scheme
Interest amount
due to the
scheme #
Total amount
due to the
scheme (Lakhs )
75 % Provision (Principal
+ Interest)
Market Value (Rs in Lakhs)
% to Net
Assets *
HSBC Short Duration Fund ^^
9.10% DEWAN HSG FIN NCD RED 16-08-2019
INE202 B07HQ0
1,341.00 4.13% 5,000.00 364.00 5,364.00 4,023.00 – –
HSBC Short Duration Fund ^^
9.05% DEWAN HSG FIN NCD RED 09-09-2019
INE202 B07IJ3
399.83 1.23% 1,500.00 99.30 1,599.30 1,199.48 – –
HSBC Short Duration Fund ^
8.9% DHFL NCD RED 04-06-2021
INE202 B07IY2
– – 2,500 – – – 500.18 1.54%
Total 1,740.83 5.36% 9,000.00 463.30 6,963.30 5,222.48 500.18 1.54%
^ On May 08, 2020, these NCDS were sold by way of secondary market trades at a discount to the last valued price.
^^ On July 06, 2020, these NCDS were sold by way of secondary market trades at a discount to the last valued price.
#Interest Accrual was stopped from 04th June 2019
* For calculation of % to Net Assets and Value (in % terms), AUM as on March 31, 2020 has been considered.
Notes to Accounts – Annexure I (Contd...)To the Abridged Balance Sheet and Revenue Account for the Year ended March 31, 2021
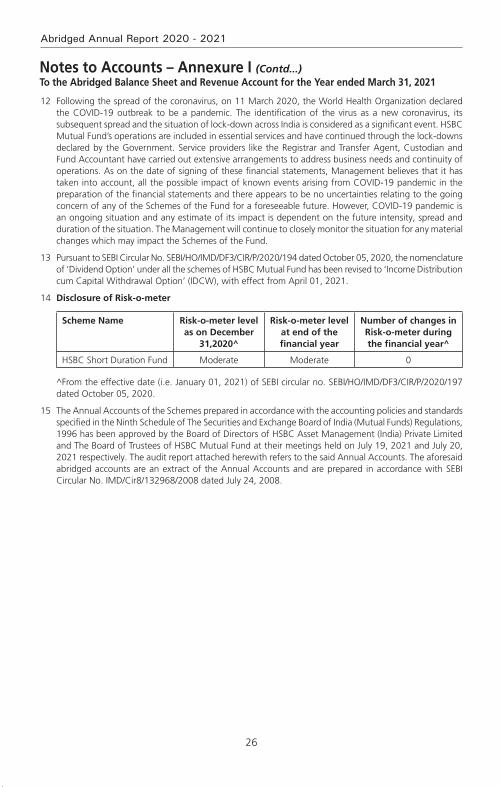
26
Abridged Annual Report 2020 - 2021
12 Following the spread of the coronavirus, on 11 March 2020, the World Health Organization declared the COVID-19 outbreak to be a pandemic. The identification of the virus as a new coronavirus, its subsequent spread and the situation of lock-down across India is considered as a significant event. HSBC Mutual Fund’s operations are included in essential services and have continued through the lock-downs declared by the Government. Service providers like the Registrar and Transfer Agent, Custodian and Fund Accountant have carried out extensive arrangements to address business needs and continuity of operations. As on the date of signing of these financial statements, Management believes that it has taken into account, all the possible impact of known events arising from COVID-19 pandemic in the preparation of the financial statements and there appears to be no uncertainties relating to the going concern of any of the Schemes of the Fund for a foreseeable future. However, COVID-19 pandemic is an ongoing situation and any estimate of its impact is dependent on the future intensity, spread and duration of the situation. The Management will continue to closely monitor the situation for any material changes which may impact the Schemes of the Fund.
13 Pursuant to SEBI Circular No. SEBI/HO/IMD/DF3/CIR/P/2020/194 dated October 05, 2020, the nomenclature of ‘Dividend Option’ under all the schemes of HSBC Mutual Fund has been revised to ‘Income Distribution cum Capital Withdrawal Option’ (IDCW), with effect from April 01, 2021.
14 Disclosure of Risk-o-meter
Scheme Name Risk-o-meter level as on December
31,2020^
Risk-o-meter level at end of the financial year
Number of changes in Risk-o-meter during the financial year^
HSBC Short Duration Fund Moderate Moderate 0
^From the effective date (i.e. January 01, 2021) of SEBI circular no. SEBI/HO/IMD/DF3/CIR/P/2020/197 dated October 05, 2020.
15 The Annual Accounts of the Schemes prepared in accordance with the accounting policies and standards specified in the Ninth Schedule of The Securities and Exchange Board of India (Mutual Funds) Regulations, 1996 has been approved by the Board of Directors of HSBC Asset Management (India) Private Limited and The Board of Trustees of HSBC Mutual Fund at their meetings held on July 19, 2021 and July 20, 2021 respectively. The audit report attached herewith refers to the said Annual Accounts. The aforesaid abridged accounts are an extract of the Annual Accounts and are prepared in accordance with SEBI Circular No. IMD/Cir8/132968/2008 dated July 24, 2008.
Notes to Accounts – Annexure I (Contd...)To the Abridged Balance Sheet and Revenue Account for the Year ended March 31, 2021

27
HSBC Short Duration Fund
Voting Policy and Procedures
In view of SEBI guidelines related to “Role of Mutual Funds in Corporate Governance of Public Listed Companies”, HSBC AMC has formulated its “Policy for Proxy Voting in Public Listed Companies”. The said policy is available on our website and the details of actual exercise of proxy votes, the summary of votes casted and the auditor’s certificate for the Financial Year 2020 – 21 is forming part of our full Annual Report for the Financial Year 2020 – 21 which is uploaded on our website at http://www.assetmanagement.hsbc.co.in

28
Abridged Annual Report 2020 - 2021
Statutory Details & Disclaimers
All the returns have been sourced from Mutual Funds India Explorer software. The performance of the schemes and the benchmark is calculated on a total return basis. This document has been prepared by HSBC Asset Management (India) Private Ltd (HSBC) for information purposes only and should not be construed as i) an offer or recommendation to buy or sell securities, commodities, currencies or other investments referred to herein; or ii) an offer to sell or a solicitation or an offer for purchase of any of the funds of HSBC Mutual Fund; or iii) an investment research or investment advice. All information contained in this document (including that sourced from third parties), is obtained from sources HSBC and the third party which HSBC believes to be reliable however, has not independently verified the same. The information and opinions contained within the document are based upon publicly available information and rates of taxation applicable (if any) at the time of publication, which are subject to change from time to time.
Expressions of opinion are those of HSBC only and are subject to change without notice. It does not have regard to specific investment objectives, financial situation and the particular needs of any specific person who may receive this document. Investors should seek personal and independent advice regarding the appropriateness of investing in any of the funds, securities, other investment or investment strategies that may have been discussed or referred herein and should understand that the views regarding future prospects may or may not be realized. In no event shall HSBC Mutual Fund / HSBC Asset management (India) Private Limited and / or its affiliates or any of their directors, trustees, officers and employees be liable for any direct, indirect, special, incidental or consequential damages arising out of the use of information / opinion herein. Neither this document nor the units of HSBC Mutual Fund have been registered in any jurisdiction. The distribution of this document in certain jurisdictions may be restricted or totally prohibited and accordingly, persons who come into possession of this document are required to inform themselves about, and to observe, any such restrictions.
mutual fund investments are subject to market risks, read all scheme related documents carefully.

HSBC Corporate Bond FundAn open ended debt scheme predominantly investing in AA+and above rated corporate bonds
Abridged Annual Report 2020 - 2021

1
HSBC Corporate Bond Fund#
Dear Investor,
The beginning of the last financial year now almost seems like a distant memory. COVID-19 was still a relatively unknown enemy and governments across the world were grappling with ways to control and mitigate the risks associated with it. Nationwide lockdowns were the norm and our markets both equity and fixed income reacted negatively leading to significant erosion of wealth. Within a short period of time markets bounced back. This confounded even the most astute market pundits. How is it possible that when GDP growth had slowed down, unemployment had risen, inflation was high could there be such sharp up move in equity indices. Whilst the reasons are well known about easy global liquidity, demand resurgence, cost cutting by corporates etc. perhaps its most important to remember that the markets are not a reflector but a predictor of economic activity.
At all times particularly during such volatile times it is important to go back to the basics. Why do you save, why do you invest, what goals would you like to achieve, how old are you, what is your risk appetite? The replies to these simple questions will help you determine your asset allocation. As an example when equity markets corrected sharply last year, investors who reviewed their asset allocation, stayed invested during the lows of the past year and were able to capture the rebound and have seen prime returns since then. The current market movement in all likelihood would have also led to some imbalances in your asset allocation. Do not ignore that and I strongly recommend that you do review this with your advisor to check whether re-balancing is required.
During this financial year we had three very successful new fund launches. The pandemic showed us a clear trend of dominant players becoming stronger and profit pool getting consolidated within a few companies. To capture this opportunity, we launched the HSBC Focused Equity Fund which garnered close to Rs. 520 crores. During the second half of 2020, in the fixed income space, 3 - 5 year duration range had a favourable investment scenario as RBI’s accommodative policy and surplus liquidity had reduced the returns at the very short end of the yield curve. There was a demand for an actively managed moderate duration strategy with better credit quality which we fulfilled by launching HSBC Corporate Bond Fund. It garnered over 700 crores. Our latest and first of its kind offering, HSBC Global Equity Climate Change Fund of Fund saw a stupendous response with over 8000 investors investing over Rs. 616 crores. This is an investment opportunity which goes beyond the rationale of simply generating investment returns and is the future of responsible investing.
We worked towards augmenting our digital capabilities by launching a few key enhancements to our online transaction platform. Being mindful of the movement restrictions in place, this year we focused on digitizing offline processes so that an investor need not need step out of her home for investing or availing any key services. While our interactive chatbot AskMe, eased service queries, our end-to-end digital KYC module enabled a first time Mutual Fund investor to invest in our funds without any paperwork. We listened to your feedback and digitized consolidation of folios and change of tax status which eliminated the need for you to physically visit our branches.
I am a strong believer in the India story and this story has just begun. The opportunity to invest in this high growth market is a very exciting opportunity. I do hope you share my enthusiasm and I ask that you continue to invest whilst reviewing your asset allocation at all times. As always thank you for your business. Stay safe.
Warm regards,
Ravi MenonChief Executive Officer,
HSBC Asset Management India

2
Abridged Annual Report 2020 - 2021
SPONSOR
HSBC Securities and Capital Markets (India) Private LimitedRegd. Office: 52/60, Mahatma Gandhi Road, Fort, Mumbai - 400 001.
TRUSTEE
Board of TrusteesOffice: 16, Veer Nariman Road, Fort, Mumbai 400 001.
ASSET MANAGEMENT COMPANY
HSBC Asset Management (India) Private LimitedCorp. & Regd. Office: 16, Veer Nariman Road, Fort, Mumbai 400 001.
CUSTODIAN
Standard Chartered Bank (SCB)Corp. & Regd. Office: Crescenzo, Securities Services, 3rd Floor, C-38/39, G-Block,Bandra Kurla Complex, Bandra East, Mumbai – 400051.
AUDITORS TO THE SCHEME
BSR & Co. LLPChartered Accountants
5th Floor, Lodha Excelus, Apollo Mills Compound, N. M. Joshi Marg, Mahalaxmi, Mumbai 400 011.
REGISTRAR & TRANSFER AGENTS
Computer Age Management Services Limited (CAMS)Unit: HSBC Mutual Fund ’C’ Block, 2nd Floor, Hanudev Info Park P. Ltd., SF No. 558/2, Udayampalayam Road, Nava India, Coimbatore - 641 028.
BOARD OF TRUSTEES
Ms. Jasmine Batliwalla - Chairperson
Mr. Nani Javeri - Trustee
Dr. T. C. Nair - Trustee
Mr. Pedro Bastos - Trustee
BOARD OF DIRECTORS
Mr. Dinesh Mittal - Director
Dr. Indu Shahani - Director
Mr. Ravi Menon - Director & Chief Executive Officer

3
HSBC Corporate Bond Fund#
The Trustees of HSBC Mutual Fund (“Fund”) present the Nineteenth Annual Report and the audited abridged financial statements of the schemes of the Fund for the year ended March 31, 2021.
As at March 31, 2021, the Fund offered 37 schemes across asset classes to meet the varying investment needs of the investors. During FY 2020-2021, the Fund has launched various new products namely HSBC Corporate Bond Fund, HSBC Focused Equity Fund and HSBC Global Equity Climate Change Fund of Fund to fill the gaps in our product offering.
The Fund continues its focus on delivering consistent long term returns. The comments on the performance of the Scheme(s) is provided hereinafter. Dividends were declared under various schemes as per the provisions contained in the respective Scheme Information Documents after considering the distributable surplus available under the respective Schemes. Details of dividends declared can be viewed on our website at www.assetmanagement.hsbc.co.in.
1. Scheme Performance, future outlook and oPerationS of the SchemeS
a. operations and Performance of the Schemes
hSBc corporate Bond fund (hcBf)
(an open ended debt scheme predominantly investing in aa+and above rated corporate bonds)
HCBF seeks seek to generate reasonable income and provide risk-adjusted returns by investing primarily in AA+ and above rated corporate debt securities. However, there can be no assurance or guarantee that the investment objective of the scheme would be achieved.
The net assets of HSBC Corporate Bond Fund amounted to Rs. 374.10 crores as at March 31, 2021. The entire net assets were invested in debt and money market instruments as at March 31, 2021. The scheme was launched on September 29, 2020.
HCBF was launched in Sep. 20. During the portfolio construction stage markets rallied leading to its underperformance. Also due to conservative investments and under ownership of non AAA Assets it lagged in the first six months.
date of inception : 29 September 2020 absolute returns (%)
compounded annualized (%)
Scheme name & Benchmarks 6 months
1 Year 3 Years 5 Years Since inception
HSBC Corporate Bond Fund - Growth 1.44 NA NA NA 1.48
NIFTY Corporate Bond Index (Scheme Benchmark) 3.27 NA NA NA 3.23
CRISIL 10 year Gilt Index (Standard Benchmark) 1.62 NA NA NA 1.83
CRISIL Corporate Bond Composite Index* (Standard Benchmark)*
3.62 NA NA NA 3.62
Rs. 10,000, if invested in HCBF, would have become 10,071 NA NA NA 10,074
Rs. 10,000, if invested in NIFTY Corporate Bond Index, would have become
10,162 NA NA NA 10,161
Rs. 10,000, if invested in CRISIL 10 year Gilt Index, would have become
10,080 NA NA NA 10,091
Rs. 10,000, if invested in CRISIL Corporate Bond Composite Index, would have become
10,179 NA NA NA 10,180
Past performance may or may not be sustained in future. The returns for the respective periods are provided as on last business day of March 2021 for Growth Option. Different plans shall have a different expense structure. Performance of the respective
benchmark is calculated as per the Total Return Index (TRI). Absolute returns have been provided for less than 1 year.
Trustees’ ReportFor the year ended March 31, 2021
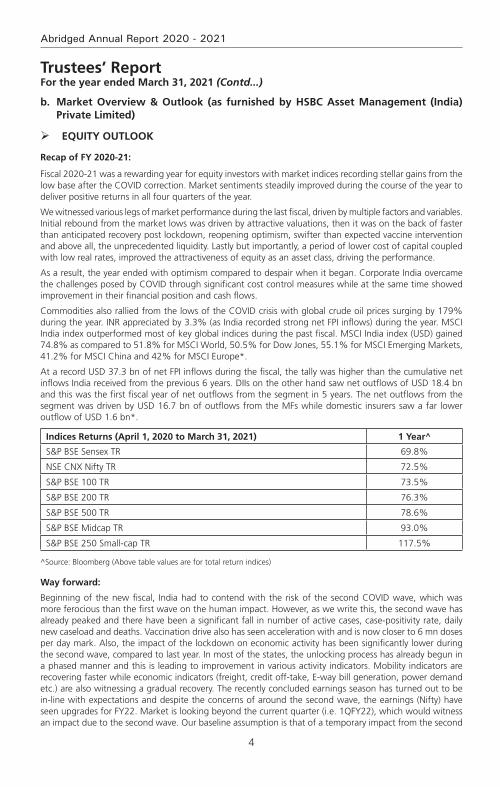
4
Abridged Annual Report 2020 - 2021
b. market overview & outlook (as furnished by hSBc asset management (india) Private limited)
equitY outlook
recap of fY 2020-21:
Fiscal 2020-21 was a rewarding year for equity investors with market indices recording stellar gains from the low base after the COVID correction. Market sentiments steadily improved during the course of the year to deliver positive returns in all four quarters of the year.
We witnessed various legs of market performance during the last fiscal, driven by multiple factors and variables. Initial rebound from the market lows was driven by attractive valuations, then it was on the back of faster than anticipated recovery post lockdown, reopening optimism, swifter than expected vaccine intervention and above all, the unprecedented liquidity. Lastly but importantly, a period of lower cost of capital coupled with low real rates, improved the attractiveness of equity as an asset class, driving the performance.
As a result, the year ended with optimism compared to despair when it began. Corporate India overcame the challenges posed by COVID through significant cost control measures while at the same time showed improvement in their financial position and cash flows.
Commodities also rallied from the lows of the COVID crisis with global crude oil prices surging by 179% during the year. INR appreciated by 3.3% (as India recorded strong net FPI inflows) during the year. MSCI India index outperformed most of key global indices during the past fiscal. MSCI India index (USD) gained 74.8% as compared to 51.8% for MSCI World, 50.5% for Dow Jones, 55.1% for MSCI Emerging Markets, 41.2% for MSCI China and 42% for MSCI Europe*.
At a record USD 37.3 bn of net FPI inflows during the fiscal, the tally was higher than the cumulative net inflows India received from the previous 6 years. DIIs on the other hand saw net outflows of USD 18.4 bn and this was the first fiscal year of net outflows from the segment in 5 years. The net outflows from the segment was driven by USD 16.7 bn of outflows from the MFs while domestic insurers saw a far lower outflow of USD 1.6 bn*.
indices returns (april 1, 2020 to march 31, 2021) 1 Year^
S&P BSE Sensex TR 69.8%
NSE CNX Nifty TR 72.5%
S&P BSE 100 TR 73.5%
S&P BSE 200 TR 76.3%
S&P BSE 500 TR 78.6%
S&P BSE Midcap TR 93.0%
S&P BSE 250 Small-cap TR 117.5%
^Source: Bloomberg (Above table values are for total return indices)
Way forward:
Beginning of the new fiscal, India had to contend with the risk of the second COVID wave, which was more ferocious than the first wave on the human impact. However, as we write this, the second wave has already peaked and there have been a significant fall in number of active cases, case-positivity rate, daily new caseload and deaths. Vaccination drive also has seen acceleration with and is now closer to 6 mn doses per day mark. Also, the impact of the lockdown on economic activity has been significantly lower during the second wave, compared to last year. In most of the states, the unlocking process has already begun in a phased manner and this is leading to improvement in various activity indicators. Mobility indicators are recovering faster while economic indicators (freight, credit off-take, E-way bill generation, power demand etc.) are also witnessing a gradual recovery. The recently concluded earnings season has turned out to be in-line with expectations and despite the concerns of around the second wave, the earnings (Nifty) have seen upgrades for FY22. Market is looking beyond the current quarter (i.e. 1QFY22), which would witness an impact due to the second wave. Our baseline assumption is that of a temporary impact from the second
Trustees’ ReportFor the year ended March 31, 2021 (Contd...)
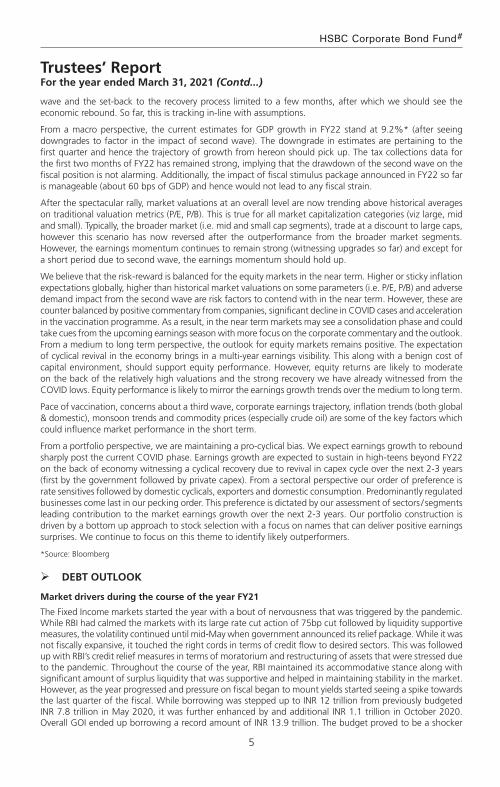
5
HSBC Corporate Bond Fund#
wave and the set-back to the recovery process limited to a few months, after which we should see the economic rebound. So far, this is tracking in-line with assumptions.
From a macro perspective, the current estimates for GDP growth in FY22 stand at 9.2%* (after seeing downgrades to factor in the impact of second wave). The downgrade in estimates are pertaining to the first quarter and hence the trajectory of growth from hereon should pick up. The tax collections data for the first two months of FY22 has remained strong, implying that the drawdown of the second wave on the fiscal position is not alarming. Additionally, the impact of fiscal stimulus package announced in FY22 so far is manageable (about 60 bps of GDP) and hence would not lead to any fiscal strain.
After the spectacular rally, market valuations at an overall level are now trending above historical averages on traditional valuation metrics (P/E, P/B). This is true for all market capitalization categories (viz large, mid and small). Typically, the broader market (i.e. mid and small cap segments), trade at a discount to large caps, however this scenario has now reversed after the outperformance from the broader market segments. However, the earnings momentum continues to remain strong (witnessing upgrades so far) and except for a short period due to second wave, the earnings momentum should hold up.
We believe that the risk-reward is balanced for the equity markets in the near term. Higher or sticky inflation expectations globally, higher than historical market valuations on some parameters (i.e. P/E, P/B) and adverse demand impact from the second wave are risk factors to contend with in the near term. However, these are counter balanced by positive commentary from companies, significant decline in COVID cases and acceleration in the vaccination programme. As a result, in the near term markets may see a consolidation phase and could take cues from the upcoming earnings season with more focus on the corporate commentary and the outlook. From a medium to long term perspective, the outlook for equity markets remains positive. The expectation of cyclical revival in the economy brings in a multi-year earnings visibility. This along with a benign cost of capital environment, should support equity performance. However, equity returns are likely to moderate on the back of the relatively high valuations and the strong recovery we have already witnessed from the COVID lows. Equity performance is likely to mirror the earnings growth trends over the medium to long term.
Pace of vaccination, concerns about a third wave, corporate earnings trajectory, inflation trends (both global & domestic), monsoon trends and commodity prices (especially crude oil) are some of the key factors which could influence market performance in the short term.
From a portfolio perspective, we are maintaining a pro-cyclical bias. We expect earnings growth to rebound sharply post the current COVID phase. Earnings growth are expected to sustain in high-teens beyond FY22 on the back of economy witnessing a cyclical recovery due to revival in capex cycle over the next 2-3 years (first by the government followed by private capex). From a sectoral perspective our order of preference is rate sensitives followed by domestic cyclicals, exporters and domestic consumption. Predominantly regulated businesses come last in our pecking order. This preference is dictated by our assessment of sectors / segments leading contribution to the market earnings growth over the next 2-3 years. Our portfolio construction is driven by a bottom up approach to stock selection with a focus on names that can deliver positive earnings surprises. We continue to focus on this theme to identify likely outperformers.
*Source: Bloomberg
deBt outlook
market drivers during the course of the year fY21
The Fixed Income markets started the year with a bout of nervousness that was triggered by the pandemic. While RBI had calmed the markets with its large rate cut action of 75bp cut followed by liquidity supportive measures, the volatility continued until mid-May when government announced its relief package. While it was not fiscally expansive, it touched the right cords in terms of credit flow to desired sectors. This was followed up with RBI’s credit relief measures in terms of moratorium and restructuring of assets that were stressed due to the pandemic. Throughout the course of the year, RBI maintained its accommodative stance along with significant amount of surplus liquidity that was supportive and helped in maintaining stability in the market. However, as the year progressed and pressure on fiscal began to mount yields started seeing a spike towards the last quarter of the fiscal. While borrowing was stepped up to INR 12 trillion from previously budgeted INR 7.8 trillion in May 2020, it was further enhanced by and additional INR 1.1 trillion in October 2020. Overall GOI ended up borrowing a record amount of INR 13.9 trillion. The budget proved to be a shocker
Trustees’ ReportFor the year ended March 31, 2021 (Contd...)
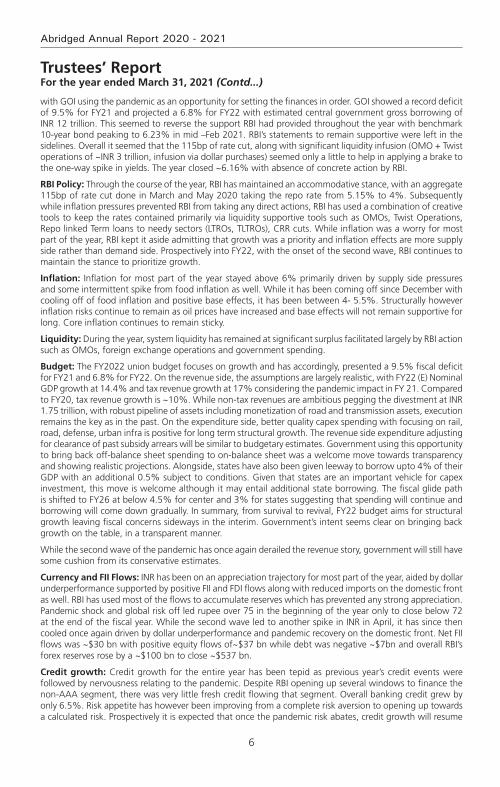
6
Abridged Annual Report 2020 - 2021
with GOI using the pandemic as an opportunity for setting the finances in order. GOI showed a record deficit of 9.5% for FY21 and projected a 6.8% for FY22 with estimated central government gross borrowing of INR 12 trillion. This seemed to reverse the support RBI had provided throughout the year with benchmark 10-year bond peaking to 6.23% in mid –Feb 2021. RBI’s statements to remain supportive were left in the sidelines. Overall it seemed that the 115bp of rate cut, along with significant liquidity infusion (OMO + Twist operations of ~INR 3 trillion, infusion via dollar purchases) seemed only a little to help in applying a brake to the one-way spike in yields. The year closed ~6.16% with absence of concrete action by RBI.
rBi Policy: Through the course of the year, RBI has maintained an accommodative stance, with an aggregate 115bp of rate cut done in March and May 2020 taking the repo rate from 5.15% to 4%. Subsequently while inflation pressures prevented RBI from taking any direct actions, RBI has used a combination of creative tools to keep the rates contained primarily via liquidity supportive tools such as OMOs, Twist Operations, Repo linked Term loans to needy sectors (LTROs, TLTROs), CRR cuts. While inflation was a worry for most part of the year, RBI kept it aside admitting that growth was a priority and inflation effects are more supply side rather than demand side. Prospectively into FY22, with the onset of the second wave, RBI continues to maintain the stance to prioritize growth.
inflation: Inflation for most part of the year stayed above 6% primarily driven by supply side pressures and some intermittent spike from food inflation as well. While it has been coming off since December with cooling off of food inflation and positive base effects, it has been between 4- 5.5%. Structurally however inflation risks continue to remain as oil prices have increased and base effects will not remain supportive for long. Core inflation continues to remain sticky.
liquidity: During the year, system liquidity has remained at significant surplus facilitated largely by RBI action such as OMOs, foreign exchange operations and government spending.
Budget: The FY2022 union budget focuses on growth and has accordingly, presented a 9.5% fiscal deficit for FY21 and 6.8% for FY22. On the revenue side, the assumptions are largely realistic, with FY22 (E) Nominal GDP growth at 14.4% and tax revenue growth at 17% considering the pandemic impact in FY 21. Compared to FY20, tax revenue growth is ~10%. While non-tax revenues are ambitious pegging the divestment at INR 1.75 trillion, with robust pipeline of assets including monetization of road and transmission assets, execution remains the key as in the past. On the expenditure side, better quality capex spending with focusing on rail, road, defense, urban infra is positive for long term structural growth. The revenue side expenditure adjusting for clearance of past subsidy arrears will be similar to budgetary estimates. Government using this opportunity to bring back off-balance sheet spending to on-balance sheet was a welcome move towards transparency and showing realistic projections. Alongside, states have also been given leeway to borrow upto 4% of their GDP with an additional 0.5% subject to conditions. Given that states are an important vehicle for capex investment, this move is welcome although it may entail additional state borrowing. The fiscal glide path is shifted to FY26 at below 4.5% for center and 3% for states suggesting that spending will continue and borrowing will come down gradually. In summary, from survival to revival, FY22 budget aims for structural growth leaving fiscal concerns sideways in the interim. Government’s intent seems clear on bringing back growth on the table, in a transparent manner.
While the second wave of the pandemic has once again derailed the revenue story, government will still have some cushion from its conservative estimates.
currency and fii flows: INR has been on an appreciation trajectory for most part of the year, aided by dollar underperformance supported by positive FII and FDI flows along with reduced imports on the domestic front as well. RBI has used most of the flows to accumulate reserves which has prevented any strong appreciation. Pandemic shock and global risk off led rupee over 75 in the beginning of the year only to close below 72 at the end of the fiscal year. While the second wave led to another spike in INR in April, it has since then cooled once again driven by dollar underperformance and pandemic recovery on the domestic front. Net FII flows was ~$30 bn with positive equity flows of~$37 bn while debt was negative ~$7bn and overall RBI’s forex reserves rose by a ~$100 bn to close ~$537 bn.
credit growth: Credit growth for the entire year has been tepid as previous year’s credit events were followed by nervousness relating to the pandemic. Despite RBI opening up several windows to finance the non-AAA segment, there was very little fresh credit flowing that segment. Overall banking credit grew by only 6.5%. Risk appetite has however been improving from a complete risk aversion to opening up towards a calculated risk. Prospectively it is expected that once the pandemic risk abates, credit growth will resume
Trustees’ ReportFor the year ended March 31, 2021 (Contd...)
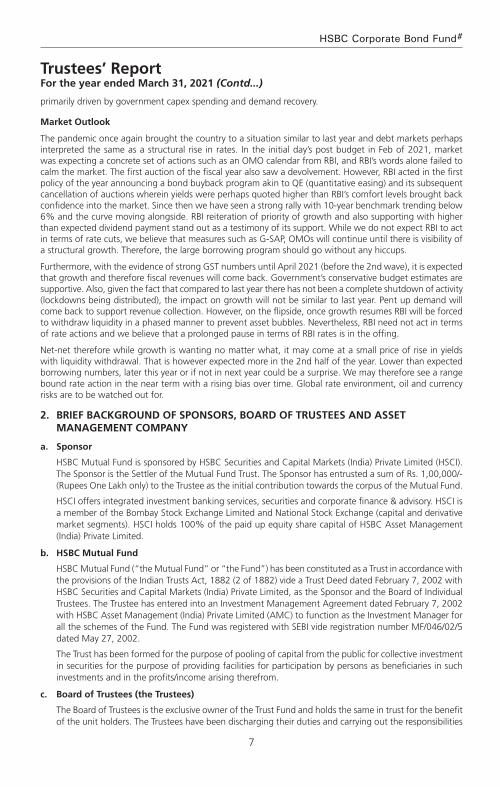
7
HSBC Corporate Bond Fund#
primarily driven by government capex spending and demand recovery.
market outlook
The pandemic once again brought the country to a situation similar to last year and debt markets perhaps interpreted the same as a structural rise in rates. In the initial day’s post budget in Feb of 2021, market was expecting a concrete set of actions such as an OMO calendar from RBI, and RBI’s words alone failed to calm the market. The first auction of the fiscal year also saw a devolvement. However, RBI acted in the first policy of the year announcing a bond buyback program akin to QE (quantitative easing) and its subsequent cancellation of auctions wherein yields were perhaps quoted higher than RBI’s comfort levels brought back confidence into the market. Since then we have seen a strong rally with 10-year benchmark trending below 6% and the curve moving alongside. RBI reiteration of priority of growth and also supporting with higher than expected dividend payment stand out as a testimony of its support. While we do not expect RBI to act in terms of rate cuts, we believe that measures such as G-SAP, OMOs will continue until there is visibility of a structural growth. Therefore, the large borrowing program should go without any hiccups.
Furthermore, with the evidence of strong GST numbers until April 2021 (before the 2nd wave), it is expected that growth and therefore fiscal revenues will come back. Government’s conservative budget estimates are supportive. Also, given the fact that compared to last year there has not been a complete shutdown of activity (lockdowns being distributed), the impact on growth will not be similar to last year. Pent up demand will come back to support revenue collection. However, on the flipside, once growth resumes RBI will be forced to withdraw liquidity in a phased manner to prevent asset bubbles. Nevertheless, RBI need not act in terms of rate actions and we believe that a prolonged pause in terms of RBI rates is in the offing.
Net-net therefore while growth is wanting no matter what, it may come at a small price of rise in yields with liquidity withdrawal. That is however expected more in the 2nd half of the year. Lower than expected borrowing numbers, later this year or if not in next year could be a surprise. We may therefore see a range bound rate action in the near term with a rising bias over time. Global rate environment, oil and currency risks are to be watched out for.
2. Brief Background of SPonSorS, Board of truSteeS and aSSet management comPanY
a. Sponsor
HSBC Mutual Fund is sponsored by HSBC Securities and Capital Markets (India) Private Limited (HSCI). The Sponsor is the Settler of the Mutual Fund Trust. The Sponsor has entrusted a sum of Rs. 1,00,000/- (Rupees One Lakh only) to the Trustee as the initial contribution towards the corpus of the Mutual Fund.
HSCI offers integrated investment banking services, securities and corporate finance & advisory. HSCI is a member of the Bombay Stock Exchange Limited and National Stock Exchange (capital and derivative market segments). HSCI holds 100% of the paid up equity share capital of HSBC Asset Management (India) Private Limited.
b. hSBc mutual fund
HSBC Mutual Fund (“the Mutual Fund” or “the Fund”) has been constituted as a Trust in accordance with the provisions of the Indian Trusts Act, 1882 (2 of 1882) vide a Trust Deed dated February 7, 2002 with HSBC Securities and Capital Markets (India) Private Limited, as the Sponsor and the Board of Individual Trustees. The Trustee has entered into an Investment Management Agreement dated February 7, 2002 with HSBC Asset Management (India) Private Limited (AMC) to function as the Investment Manager for all the schemes of the Fund. The Fund was registered with SEBI vide registration number MF/046/02/5 dated May 27, 2002.
The Trust has been formed for the purpose of pooling of capital from the public for collective investment in securities for the purpose of providing facilities for participation by persons as beneficiaries in such investments and in the profits/income arising therefrom.
c. Board of trustees (the trustees)
The Board of Trustees is the exclusive owner of the Trust Fund and holds the same in trust for the benefit of the unit holders. The Trustees have been discharging their duties and carrying out the responsibilities
Trustees’ ReportFor the year ended March 31, 2021 (Contd...)
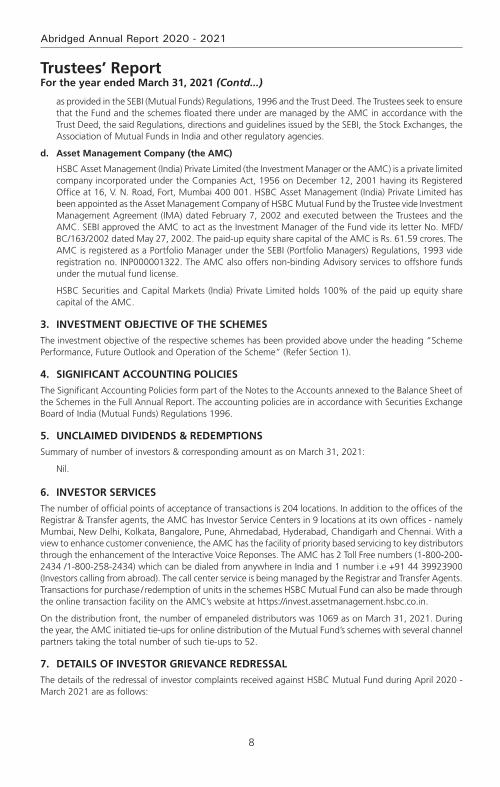
8
Abridged Annual Report 2020 - 2021
as provided in the SEBI (Mutual Funds) Regulations, 1996 and the Trust Deed. The Trustees seek to ensure that the Fund and the schemes floated there under are managed by the AMC in accordance with the Trust Deed, the said Regulations, directions and guidelines issued by the SEBI, the Stock Exchanges, the Association of Mutual Funds in India and other regulatory agencies.
d. asset management company (the amc)
HSBC Asset Management (India) Private Limited (the Investment Manager or the AMC) is a private limited company incorporated under the Companies Act, 1956 on December 12, 2001 having its Registered Office at 16, V. N. Road, Fort, Mumbai 400 001. HSBC Asset Management (India) Private Limited has been appointed as the Asset Management Company of HSBC Mutual Fund by the Trustee vide Investment Management Agreement (IMA) dated February 7, 2002 and executed between the Trustees and the AMC. SEBI approved the AMC to act as the Investment Manager of the Fund vide its letter No. MFD/BC/163/2002 dated May 27, 2002. The paid-up equity share capital of the AMC is Rs. 61.59 crores. The AMC is registered as a Portfolio Manager under the SEBI (Portfolio Managers) Regulations, 1993 vide registration no. INP000001322. The AMC also offers non-binding Advisory services to offshore funds under the mutual fund license.
HSBC Securities and Capital Markets (India) Private Limited holds 100% of the paid up equity share capital of the AMC.
3. inveStment oBjective of the SchemeS
The investment objective of the respective schemes has been provided above under the heading “Scheme Performance, Future Outlook and Operation of the Scheme” (Refer Section 1).
4. Significant accounting PolicieS
The Significant Accounting Policies form part of the Notes to the Accounts annexed to the Balance Sheet of the Schemes in the Full Annual Report. The accounting policies are in accordance with Securities Exchange Board of India (Mutual Funds) Regulations 1996.
5. unclaimed dividendS & redemPtionS
Summary of number of investors & corresponding amount as on March 31, 2021:
Nil.
6. inveStor ServiceS
The number of official points of acceptance of transactions is 204 locations. In addition to the offices of the Registrar & Transfer agents, the AMC has Investor Service Centers in 9 locations at its own offices - namely Mumbai, New Delhi, Kolkata, Bangalore, Pune, Ahmedabad, Hyderabad, Chandigarh and Chennai. With a view to enhance customer convenience, the AMC has the facility of priority based servicing to key distributors through the enhancement of the Interactive Voice Reponses. The AMC has 2 Toll Free numbers (1-800-200-2434 /1-800-258-2434) which can be dialed from anywhere in India and 1 number i.e +91 44 39923900 (Investors calling from abroad). The call center service is being managed by the Registrar and Transfer Agents. Transactions for purchase / redemption of units in the schemes HSBC Mutual Fund can also be made through the online transaction facility on the AMC’s website at https://invest.assetmanagement.hsbc.co.in.
On the distribution front, the number of empaneled distributors was 1069 as on March 31, 2021. During the year, the AMC initiated tie-ups for online distribution of the Mutual Fund’s schemes with several channel partners taking the total number of such tie-ups to 52.
7. detailS of inveStor grievance redreSSal
The details of the redressal of investor complaints received against HSBC Mutual Fund during April 2020 - March 2021 are as follows:
Trustees’ ReportFor the year ended March 31, 2021 (Contd...)
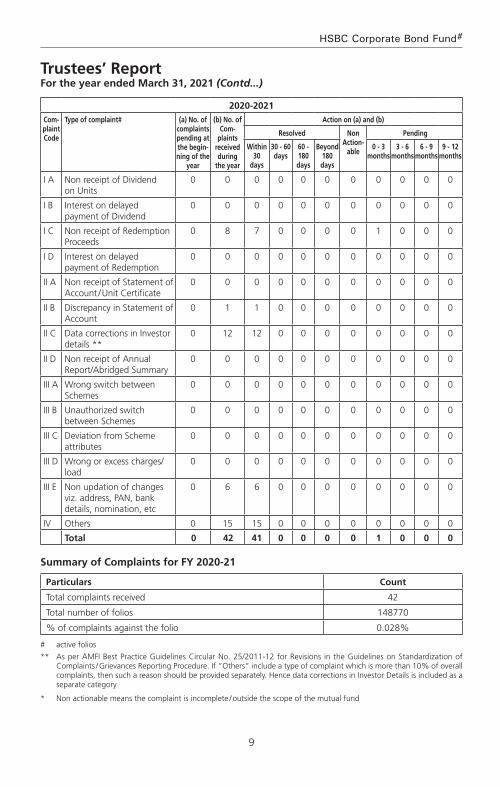
9
HSBC Corporate Bond Fund#
2020-2021
com-plaint code
type of complaint# (a) no. of complaints pending at the begin-ning of the
year
(b) no. of com-
plaints received during
the year
action on (a) and (b)
resolved non action-
able
Pending
Within 30
days
30 - 60 days
60 - 180 days
Beyond 180 days
0 - 3 months
3 - 6 months
6 - 9 months
9 - 12 months
I A Non receipt of Dividend on Units
0 0 0 0 0 0 0 0 0 0 0
I B Interest on delayed payment of Dividend
0 0 0 0 0 0 0 0 0 0 0
I C Non receipt of Redemption Proceeds
0 8 7 0 0 0 0 1 0 0 0
I D Interest on delayed payment of Redemption
0 0 0 0 0 0 0 0 0 0 0
II A Non receipt of Statement of Account / Unit Certificate
0 0 0 0 0 0 0 0 0 0 0
II B Discrepancy in Statement of Account
0 1 1 0 0 0 0 0 0 0 0
II C Data corrections in Investor details **
0 12 12 0 0 0 0 0 0 0 0
II D Non receipt of Annual Report/Abridged Summary
0 0 0 0 0 0 0 0 0 0 0
III A Wrong switch between Schemes
0 0 0 0 0 0 0 0 0 0 0
III B Unauthorized switch between Schemes
0 0 0 0 0 0 0 0 0 0 0
III C Deviation from Scheme attributes
0 0 0 0 0 0 0 0 0 0 0
III D Wrong or excess charges/load
0 0 0 0 0 0 0 0 0 0 0
III E Non updation of changes viz. address, PAN, bank details, nomination, etc
0 6 6 0 0 0 0 0 0 0 0
IV Others 0 15 15 0 0 0 0 0 0 0 0
total 0 42 41 0 0 0 0 1 0 0 0
Summary of complaints for fY 2020-21
Particulars count
Total complaints received 42
Total number of folios 148770
% of complaints against the folio 0.028%
# active folios
** As per AMFI Best Practice Guidelines Circular No. 25/2011-12 for Revisions in the Guidelines on Standardization of Complaints / Grievances Reporting Procedure. If “Others” include a type of complaint which is more than 10% of overall complaints, then such a reason should be provided separately. Hence data corrections in Investor Details is included as a separate category
* Non actionable means the complaint is incomplete / outside the scope of the mutual fund
Trustees’ ReportFor the year ended March 31, 2021 (Contd...)
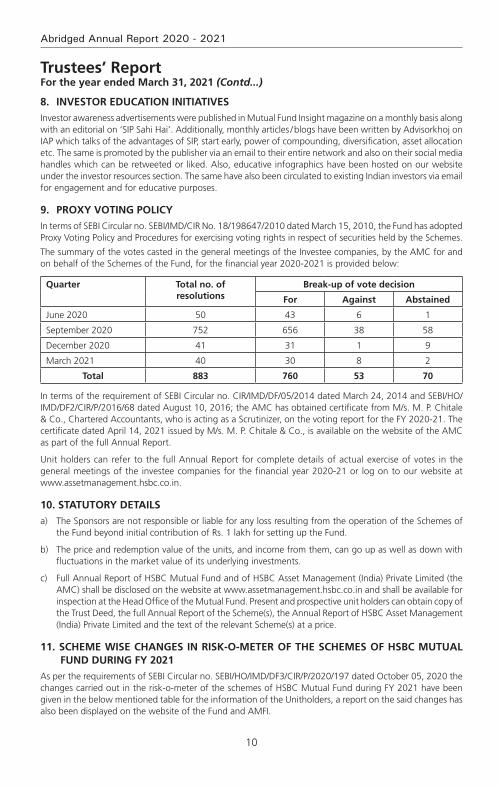
10
Abridged Annual Report 2020 - 2021
Trustees’ ReportFor the year ended March 31, 2021 (Contd...)
8. inveStor education initiativeS
Investor awareness advertisements were published in Mutual Fund Insight magazine on a monthly basis along with an editorial on ‘SIP Sahi Hai’. Additionally, monthly articles / blogs have been written by Advisorkhoj on IAP which talks of the advantages of SIP, start early, power of compounding, diversification, asset allocation etc. The same is promoted by the publisher via an email to their entire network and also on their social media handles which can be retweeted or liked. Also, educative infographics have been hosted on our website under the investor resources section. The same have also been circulated to existing Indian investors via email for engagement and for educative purposes.
9. ProxY voting PolicY
In terms of SEBI Circular no. SEBI/IMD/CIR No. 18/198647/2010 dated March 15, 2010, the Fund has adopted Proxy Voting Policy and Procedures for exercising voting rights in respect of securities held by the Schemes.
The summary of the votes casted in the general meetings of the Investee companies, by the AMC for and on behalf of the Schemes of the Fund, for the financial year 2020-2021 is provided below:
quarter total no. of resolutions
Break-up of vote decision
for against abstained
June 2020 50 43 6 1
September 2020 752 656 38 58
December 2020 41 31 1 9
March 2021 40 30 8 2
total 883 760 53 70
In terms of the requirement of SEBI Circular no. CIR/IMD/DF/05/2014 dated March 24, 2014 and SEBI/HO/IMD/DF2/CIR/P/2016/68 dated August 10, 2016; the AMC has obtained certificate from M/s. M. P. Chitale & Co., Chartered Accountants, who is acting as a Scrutinizer, on the voting report for the FY 2020-21. The certificate dated April 14, 2021 issued by M/s. M. P. Chitale & Co., is available on the website of the AMC as part of the full Annual Report.
Unit holders can refer to the full Annual Report for complete details of actual exercise of votes in the general meetings of the investee companies for the financial year 2020-21 or log on to our website at www.assetmanagement.hsbc.co.in.
10. StatutorY detailS
a) The Sponsors are not responsible or liable for any loss resulting from the operation of the Schemes of the Fund beyond initial contribution of Rs. 1 lakh for setting up the Fund.
b) The price and redemption value of the units, and income from them, can go up as well as down with fluctuations in the market value of its underlying investments.
c) Full Annual Report of HSBC Mutual Fund and of HSBC Asset Management (India) Private Limited (the AMC) shall be disclosed on the website at www.assetmanagement.hsbc.co.in and shall be available for inspection at the Head Office of the Mutual Fund. Present and prospective unit holders can obtain copy of the Trust Deed, the full Annual Report of the Scheme(s), the Annual Report of HSBC Asset Management (India) Private Limited and the text of the relevant Scheme(s) at a price.
11. Scheme WiSe changeS in riSk-o-meter of the SchemeS of hSBc mutual fund during fY 2021
As per the requirements of SEBI Circular no. SEBI/HO/IMD/DF3/CIR/P/2020/197 dated October 05, 2020 the changes carried out in the risk-o-meter of the schemes of HSBC Mutual Fund during FY 2021 have been given in the below mentioned table for the information of the Unitholders, a report on the said changes has also been displayed on the website of the Fund and AMFI.

11
HSBC Corporate Bond Fund#
Trustees’ ReportFor the year ended March 31, 2021 (Contd...)
Scheme name
risk-o-meter level as on december
31,2020^
risk-o-meter level at end of
the financial year
number of changes in risk-o-meter during the
financial year^
dec-2020 mar-2021 dec 2020 to march 2021
HSBC Corporate Bond Fund Moderate Moderate 0
^From the effective date (i.e. January 01, 2021) of SEBI circular no. SEBI/HO/IMD/DF3/CIR/P/2020/197 dated October 05, 2020.
12. governance under the PolicY on SteWardShiP reSPonSiBilitieS of hSBc mutual fund
As per the requirements of SEBI Circular no. CIR/CFD/CMD1/ 168 /2019 dated December 24, 2019, HSBC Mutual Fund has adapted the policy on stewardship responsibilities, the unitholders are requested to note the status of governance with the same as mentioned below:
S. no.
Particulars of Principles of Stewardship code
Status of compliance (complied/
not complied)
description remarks/reasons for
deviation/non - compliance,
if any
1 Principle 1:Institutional Investors should formulate a comprehensive policy on the discharge of their stewardship responsibilities, publicly disclose it, review and update it periodically.
Complied HSBC Asset Management (India) Private Limited's (AMIN) 'Policy on Stewardship responsibilities' (Stewardship Code / Policy) was formulated and implemented on 01 July, 2020. This is a comprehensive document which has been publicly disclosed on the website of AMIN. The same shall follow a periodic review.
N.A.
2 Principle 2:Inst i tut ional investors should have a clear policy on how they manage conflicts of interest in fulfilling their stewardship responsibilities and publicly disclose it.
Complied Defining and managing Conflict of Interest in fulfilling stewardship responsibilities are detailed in the Stewardship Policy document. The policy document is publicly disclosed.
N.A.
3 Principle 3:Institutional investors should monitor their investee companies.
Complied AMIN monitors all investee companies through its investment process. This includes assessment of companies’ own and market data, consideration of research from brokers and other independent research providers – including ESG & voting research, attending individual & group meetings with company management and directors, visiting production sites (wherever necessary), engaging with key stakeholders including competitors and customers, and financial modelling. More details enumerated in the policy document
N.A.
4 Principle 4:Inst i tut ional investors should have a clear policy on intervention in their investee companies. Institutional investors should also have a
Complied Details of undertaking active engagement with investee companies and the policy for collaboration with other institutional holders are detai led in the policy document. The policy document is publicly disclosed.
N.A.
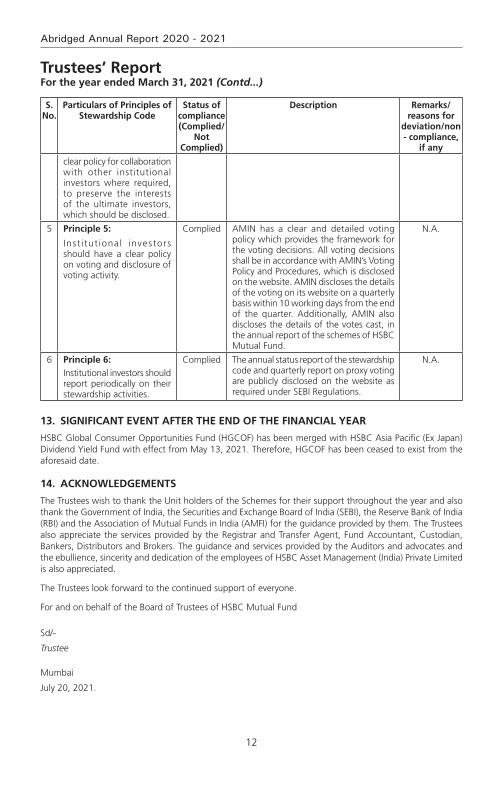
12
Abridged Annual Report 2020 - 2021
Trustees’ ReportFor the year ended March 31, 2021 (Contd...)
S. no.
Particulars of Principles of Stewardship code
Status of compliance (complied/
not complied)
description remarks/reasons for
deviation/non - compliance,
if any
clear policy for collaboration with other institutional investors where required, to preserve the interests of the ultimate investors, which should be disclosed.
5 Principle 5:
Inst i tut ional investors should have a clear policy on voting and disclosure of voting activity.
Complied AMIN has a clear and detailed voting policy which provides the framework for the voting decisions. All voting decisions shall be in accordance with AMIN’s Voting Policy and Procedures, which is disclosed on the website. AMIN discloses the details of the voting on its website on a quarterly basis within 10 working days from the end of the quarter. Additionally, AMIN also discloses the details of the votes cast, in the annual report of the schemes of HSBC Mutual Fund.
N.A.
6 Principle 6:Institutional investors should report periodically on their stewardship activities.
Complied The annual status report of the stewardship code and quarterly report on proxy voting are publicly disclosed on the website as required under SEBI Regulations.
N.A.
13. Significant event after the end of the financial Year
HSBC Global Consumer Opportunities Fund (HGCOF) has been merged with HSBC Asia Pacific (Ex Japan) Dividend Yield Fund with effect from May 13, 2021. Therefore, HGCOF has been ceased to exist from the aforesaid date.
14. acknoWledgementS
The Trustees wish to thank the Unit holders of the Schemes for their support throughout the year and also thank the Government of India, the Securities and Exchange Board of India (SEBI), the Reserve Bank of India (RBI) and the Association of Mutual Funds in India (AMFI) for the guidance provided by them. The Trustees also appreciate the services provided by the Registrar and Transfer Agent, Fund Accountant, Custodian, Bankers, Distributors and Brokers. The guidance and services provided by the Auditors and advocates and the ebullience, sincerity and dedication of the employees of HSBC Asset Management (India) Private Limited is also appreciated.
The Trustees look forward to the continued support of everyone.
For and on behalf of the Board of Trustees of HSBC Mutual Fund
Sd/-
Trustee
Mumbai
July 20, 2021.
13
HSBC Corporate Bond Fund#
To the Trustees of HSBC Mutual Fund
hSBc corporate Bond fund
report on the audit of the financial Statements
opinionWe have audited the financial statements of hSBc corporate Bond fund (the ‘Scheme’) of HSBC Mutual Fund, which comprise the balance sheet as at 31 March 2021 and the revenue account for the period ended, and notes to the financial statements, including a summary of the significant accounting policies.
In our opinion and to the best of our information and according to the explanations given to us, the aforesaid financial statements give a true and fair view in conformity with the accounting principles generally accepted in India, of the state of affairs of the Scheme as at 31 March 2021, its net surplus for the period ended on that date.
Basis for opinionWe conducted our audit in accordance with the Standards on Auditing (‘SAs’) issued by the Institute of Chartered Accountants of India (the ‘ICAI’). Our responsibilities under those SAs are further described in the Auditor’s Responsibilities for the Audit of the Financial Statements section of our report. We are independent of the Scheme in accordance with the Code of Ethics issued by the ICAI, and we have fulfilled our other ethical responsibilities in accordance with the Code of Ethics. We believe that the audit evidence we have obtained is sufficient and appropriate to provide a basis for our opinion.
responsibilities of management and those charged with governance for the financial StatementsThe Scheme’s management, the Board of Directors of HSSBC Mutual Fund (the ‘Trustee’) and the Board of Directors of HSBC Asset Management (India) Private Limited (the ‘AMC’) (collectively referred to as ‘Management’) are responsible for the preparation of these financial statements that give a true and fair view of the state of affairs, results of operations of the Scheme in accordance with the accounting policies and standards specified in the Ninth Schedule of the Securities and Exchange Board of India (Mutual Funds) Regulations, 1996, as amended (the ‘Regulations’) and the accounting principles generally accepted in India. This responsibility includes design, implementation and maintenance of internal control relevant to the preparation and presentation of the financial statements that give a true and fair view and are free from material misstatement, whether due to fraud or error.
In preparing the financial statements, management is responsible for assessing the Scheme’s ability to continue as a going concern, disclosing, as applicable, matters related to going concern and using the going concern basis of accounting unless management either intends to liquidate the Scheme or to cease operations, or has no realistic alternative but to do so.
The management is responsible for overseeing the Scheme’s financial reporting process.
auditor’s responsibilities for the audit of the financial StatementsOur objectives are to obtain reasonable assurance about whether the financial statements as a whole are free from material misstatement, whether due to fraud or error, and to issue an auditor’s report that includes our opinion. Reasonable assurance is a high level of assurance, but is not a guarantee that an audit conducted in accordance with SAs will always detect a material misstatement when it exists. Misstatements can arise from fraud or error and are considered material if, individually or in the aggregate, they could reasonably be expected to influence the economic decisions of users taken on the basis of these financial statements.
As part of an audit in accordance with SAs, we exercise professional judgment and maintain professional skepticism throughout the audit. We also:
• Identifyandassesstherisksofmaterialmisstatementofthefinancialstatements,whetherduetofraudor error, design and perform audit procedures responsive to those risks, and obtain audit evidence that is sufficient and appropriate to provide a basis for our opinion. The risk of not detecting a material misstatement resulting from fraud is higher than for one resulting from error, as fraud may involve
Independent Auditors’ Report
14
Abridged Annual Report 2020 - 2021
Independent Auditors’ Report (Contd...)
collusion, forgery, intentional omissions, misrepresentations, or the override of internal control;
• Obtainanunderstandingofinternalcontrolrelevanttotheauditinordertodesignauditproceduresthat are appropriate in the circumstances, but not for the purpose of expressing an opinion on the effectiveness of the Scheme’s internal controls;
• Evaluatetheappropriatenessofaccountingpoliciesusedandthereasonablenessofaccountingestimatesand related disclosures made by Management;
• ConcludeontheappropriatenessofManagement’suseofthegoingconcernbasisofaccountingand,based on the audit evidence obtained, whether a material uncertainty exists related to events or conditions that may cast significant doubt on the Scheme’s ability to continue as a going concern. If we conclude that a material uncertainty exists, we are required to draw attention in our auditor’s report to the related disclosures in the financial statements or, if such disclosures are inadequate, to modify our opinion. Our conclusions are based on the audit evidence obtained up to the date of our auditor’s report. However, future events or conditions may cause the Scheme to cease to continue as a going concern;
• Evaluate the overall presentation, structure and content of the financial statements, including thedisclosures and whether the financial statements represent the underlying transactions and events in a manner that achieves fair presentation.
We communicate with those charged with governance regarding, among other matters, the planned scope and timing of the audit and significant audit findings, including any significant deficiencies in internal control that we identify during our audit.
We also provide those charged with governance with a statement that we have complied with relevant ethical requirements regarding independence, and to communicate with them all relationships and other matters that may reasonably be thought to bear on our independence, and where applicable, related safeguards.
report on other legal and regulatory requirements 1 As required by Regulation 55 (4) of the Regulations, we report that:
(a) We have obtained all information and explanations which, to the best of our knowledge and belief, were necessary for the purposes of the audit; and
(b) The balance sheet and the revenue account have been prepared in accordance with the accounting policies and standards as specified in the Ninth Schedule of the Regulations.
2 As required by Clause 5 (ii) (2) of the Eleventh Schedule of the Regulations, we report that the balance sheet and the revenue account are in agreement with the books of account of the Scheme.
3 As required by the Eight Schedule of the Regulations, we report that, in our opinion and on the basis of information and explanations given to us, the methods used to value non - traded securities, as at 31 March 2021, as determined by the Board of Directors of the AMC, are in accordance with the Regulations and other guidelines issued by the Securities and Exchange Board of India as applicable and approved by the Board of Directors of the Trustee, are fair and reasonable.
For B S R & Co. LLP Chartered Accountants Firm’s Registration No: 101248W/W-100022
Sd/-
Ajit Viswanath PartnerMembership No: 067114UDIN : 21067114AAAADE9170
Place : Mumbai Date : July 20, 2021.

15
HSBC Corporate Bond Fund#
Rs. in Lakhs
As at March 31, 2021#
LIABILITIES1 Unit Capital 36,853.092 Reserves & Surplus2.1 Unit Premium Reserves 14.712.2 Unrealised Appreciation Reserve 9.582.3 Other Reserves 528.723 Loans & Borrowings –4 Current Liabilities & Provisions4.1 Provision for Doubtful Income / Deposits –4.2 Other Current Liabilities & Provisions 74.88
TOTAL 37,480.98
ASSETS1 Investments1.1 Listed Securities:1.1.1 Equity Shares –1.1.2 Preference Shares –1.1.3 Equity Linked Debentures –1.1.4 Other Debentures & Bonds 31,078.801.1.5 Securitised Debt Securities –1.2 Securities Awaited Listing:1.2.1 Equity Shares –1.2.2 Preference Shares –1.2.3 Equity Linked Debentures –1.2.4 Other Debentures & Bonds –1.2.5 Securitised Debt Securities –1.3 Unlisted Securities:1.3.1 Equity Shares –1.3.2 Preference Shares –1.3.3 Equity Linked Debentures –1.3.4 Other Debentures & Bonds –1.3.5 Securitised Debt Securities –1.4 Government Securities 4,057.191.5 Treasury Bills –1.6 Commercial Paper –1.7 Certificate of Deposits –1.8 Bill Rediscounting –1.9 Units of Domestic Mutual Fund –1.10 Foreign Securities –
Total Investments 35,135.99
2 Deposits 4.123 Other Current Assets3.1 Cash & Bank Balance 2.353.2 TREPS / Reverse Repo Lending 1,154.883.3 Others 1,183.644 Deferred Revenue Expenditure (to the extent not written off) –
TOTAL 37,480.98
# Scheme launched during the current financial year
Notes to Accounts – Annexure I
Abridged Balance Sheet as at March 31, 2021
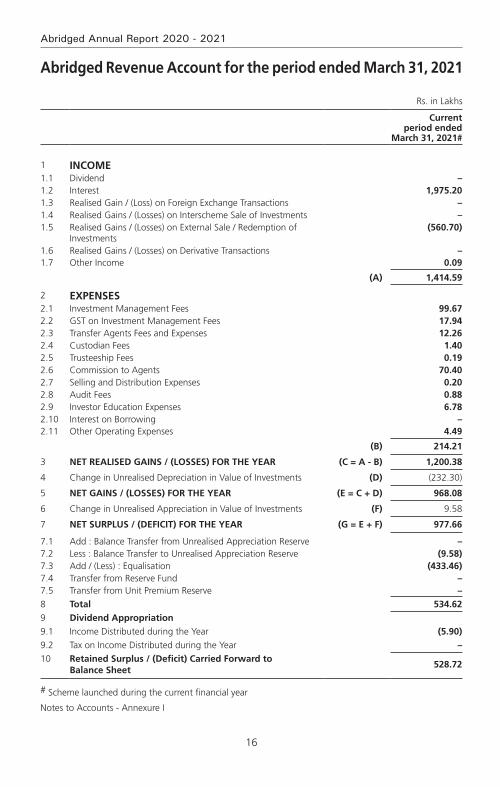
16
Abridged Annual Report 2020 - 2021
Abridged Revenue Account for the period ended March 31, 2021
Rs. in Lakhs
Current period ended
March 31, 2021#
1 INCOME1.1 Dividend –1.2 Interest 1,975.201.3 Realised Gain / (Loss) on Foreign Exchange Transactions –1.4 Realised Gains / (Losses) on Interscheme Sale of Investments –1.5 Realised Gains / (Losses) on External Sale / Redemption of
Investments(560.70)
1.6 Realised Gains / (Losses) on Derivative Transactions –1.7 Other Income 0.09
(A) 1,414.59
2 EXPENSES2.1 Investment Management Fees 99.672.2 GST on Investment Management Fees 17.942.3 Transfer Agents Fees and Expenses 12.262.4 Custodian Fees 1.402.5 Trusteeship Fees 0.192.6 Commission to Agents 70.402.7 Selling and Distribution Expenses 0.202.8 Audit Fees 0.882.9 Investor Education Expenses 6.782.10 Interest on Borrowing –2.11 Other Operating Expenses 4.49
(B) 214.21
3 NET REALISED GAINS / (LOSSES) FOR THE YEAR (C = A - B) 1,200.38
4 Change in Unrealised Depreciation in Value of Investments (D) (232.30)
5 NET GAINS / (LOSSES) FOR THE YEAR (E = C + D) 968.08
6 Change in Unrealised Appreciation in Value of Investments (F) 9.58
7 NET SURPLUS / (DEFICIT) FOR THE YEAR (G = E + F) 977.66
7.1 Add : Balance Transfer from Unrealised Appreciation Reserve –7.2 Less : Balance Transfer to Unrealised Appreciation Reserve (9.58)7.3 Add / (Less) : Equalisation (433.46)7.4 Transfer from Reserve Fund –7.5 Transfer from Unit Premium Reserve –8 Total 534.629 Dividend Appropriation9.1 Income Distributed during the Year (5.90)9.2 Tax on Income Distributed during the Year –10 Retained Surplus / (Deficit) Carried Forward to
Balance Sheet528.72
# Scheme launched during the current financial year
Notes to Accounts - Annexure I
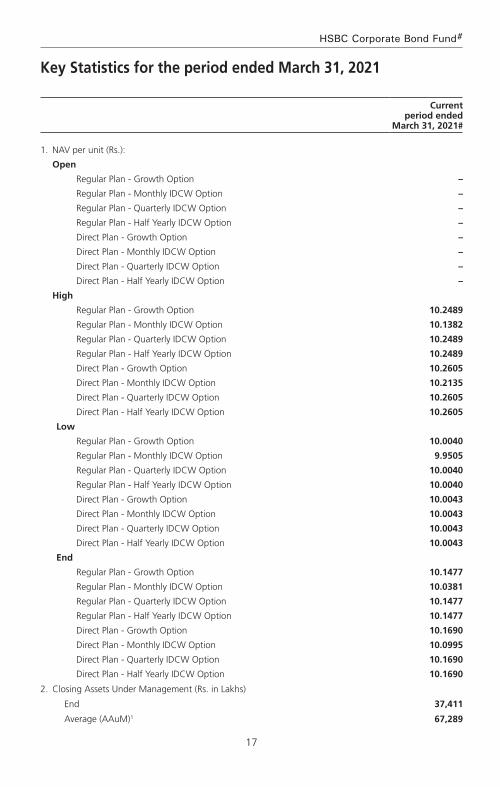
17
HSBC Corporate Bond Fund#
Key Statistics for the period ended March 31, 2021
Current period ended
March 31, 2021#
1. NAV per unit (Rs.):
Open
Regular Plan - Growth Option –
Regular Plan - Monthly IDCW Option –
Regular Plan - Quarterly IDCW Option –
Regular Plan - Half Yearly IDCW Option –
Direct Plan - Growth Option –
Direct Plan - Monthly IDCW Option –
Direct Plan - Quarterly IDCW Option –
Direct Plan - Half Yearly IDCW Option –
High
Regular Plan - Growth Option 10.2489
Regular Plan - Monthly IDCW Option 10.1382
Regular Plan - Quarterly IDCW Option 10.2489
Regular Plan - Half Yearly IDCW Option 10.2489
Direct Plan - Growth Option 10.2605
Direct Plan - Monthly IDCW Option 10.2135
Direct Plan - Quarterly IDCW Option 10.2605
Direct Plan - Half Yearly IDCW Option 10.2605
Low
Regular Plan - Growth Option 10.0040
Regular Plan - Monthly IDCW Option 9.9505
Regular Plan - Quarterly IDCW Option 10.0040
Regular Plan - Half Yearly IDCW Option 10.0040
Direct Plan - Growth Option 10.0043
Direct Plan - Monthly IDCW Option 10.0043
Direct Plan - Quarterly IDCW Option 10.0043
Direct Plan - Half Yearly IDCW Option 10.0043
End
Regular Plan - Growth Option 10.1477
Regular Plan - Monthly IDCW Option 10.0381
Regular Plan - Quarterly IDCW Option 10.1477
Regular Plan - Half Yearly IDCW Option 10.1477
Direct Plan - Growth Option 10.1690
Direct Plan - Monthly IDCW Option 10.0995
Direct Plan - Quarterly IDCW Option 10.1690
Direct Plan - Half Yearly IDCW Option 10.1690
2. Closing Assets Under Management (Rs. in Lakhs)
End 37,411
Average (AAuM)1 67,289
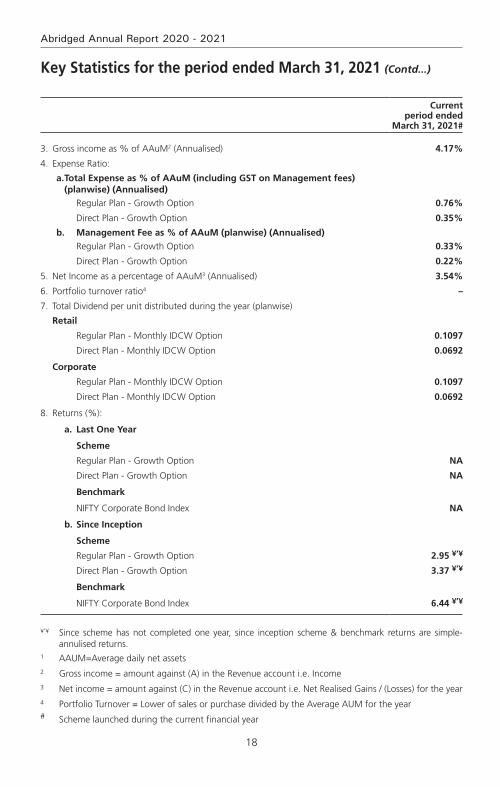
18
Abridged Annual Report 2020 - 2021
Current period ended
March 31, 2021#
3. Gross income as % of AAuM2 (Annualised) 4.17%
4. Expense Ratio:
a. Total Expense as % of AAuM (including GST on Management fees) (planwise) (Annualised)
Regular Plan - Growth Option 0.76%
Direct Plan - Growth Option 0.35%
b. Management Fee as % of AAuM (planwise) (Annualised)Regular Plan - Growth Option 0.33%
Direct Plan - Growth Option 0.22%
5. Net Income as a percentage of AAuM3 (Annualised) 3.54%
6. Portfolio turnover ratio4 –
7. Total Dividend per unit distributed during the year (planwise)
Retail
Regular Plan - Monthly IDCW Option 0.1097
Direct Plan - Monthly IDCW Option 0.0692
Corporate
Regular Plan - Monthly IDCW Option 0.1097
Direct Plan - Monthly IDCW Option 0.0692
8. Returns (%):
a. Last One Year
Scheme
Regular Plan - Growth Option NA
Direct Plan - Growth Option NA
Benchmark
NIFTY Corporate Bond Index NA
b. Since Inception
Scheme
Regular Plan - Growth Option 2.95 ¥’¥
Direct Plan - Growth Option 3.37 ¥’¥
Benchmark
NIFTY Corporate Bond Index 6.44 ¥’¥
¥’¥ Since scheme has not completed one year, since inception scheme & benchmark returns are simple-annulised returns.
1 AAUM=Average daily net assets2 Gross income = amount against (A) in the Revenue account i.e. Income3 Net income = amount against (C) in the Revenue account i.e. Net Realised Gains / (Losses) for the year4 Portfolio Turnover = Lower of sales or purchase divided by the Average AUM for the year# Scheme launched during the current financial year
Key Statistics for the period ended March 31, 2021 (Contd...)
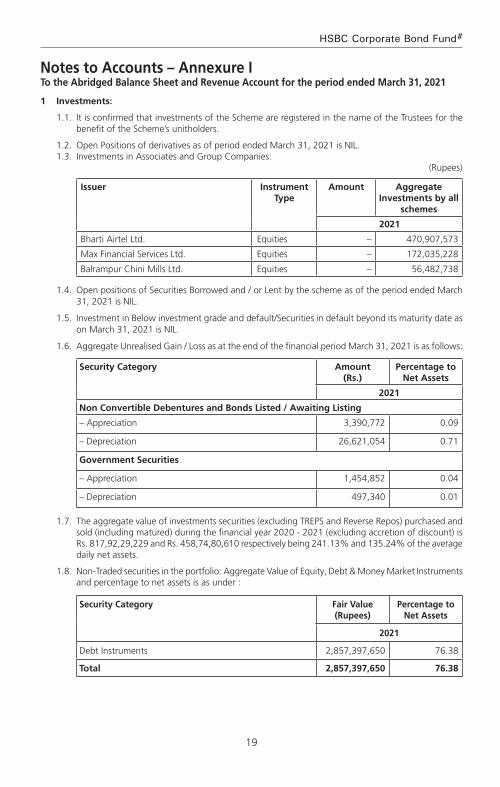
19
HSBC Corporate Bond Fund#
Notes to Accounts – Annexure ITo the Abridged Balance Sheet and Revenue Account for the period ended March 31, 2021
1 Investments:
1.1. It is confirmed that investments of the Scheme are registered in the name of the Trustees for the benefit of the Scheme’s unitholders.
1.2. Open Positions of derivatives as of period ended March 31, 2021 is NIL. 1.3. Investments in Associates and Group Companies: (Rupees)
Issuer Instrument Type
Amount Aggregate Investments by all
schemes
2021
Bharti Airtel Ltd. Equities – 470,907,573
Max Financial Services Ltd. Equities – 172,035,228
Balrampur Chini Mills Ltd. Equities – 56,482,738
1.4. Open positions of Securities Borrowed and / or Lent by the scheme as of the period ended March 31, 2021 is NIL.
1.5. Investment in Below investment grade and default/Securities in default beyond its maturity date as on March 31, 2021 is NIL.
1.6. Aggregate Unrealised Gain / Loss as at the end of the financial period March 31, 2021 is as follows:
Security Category Amount (Rs.)
Percentage to Net Assets
2021
Non Convertible Debentures and Bonds Listed / Awaiting Listing
– Appreciation 3,390,772 0.09
– Depreciation 26,621,054 0.71
Government Securities
– Appreciation 1,454,852 0.04
– Depreciation 497,340 0.01
1.7. The aggregate value of investments securities (excluding TREPS and Reverse Repos) purchased and sold (including matured) during the financial year 2020 - 2021 (excluding accretion of discount) is Rs. 817,92,29,229 and Rs. 458,74,80,610 respectively being 241.13% and 135.24% of the average daily net assets.
1.8. Non-Traded securities in the portfolio: Aggregate Value of Equity, Debt & Money Market Instruments and percentage to net assets is as under :
Security Category Fair Value (Rupees)
Percentage to Net Assets
2021
Debt Instruments 2,857,397,650 76.38
Total 2,857,397,650 76.38
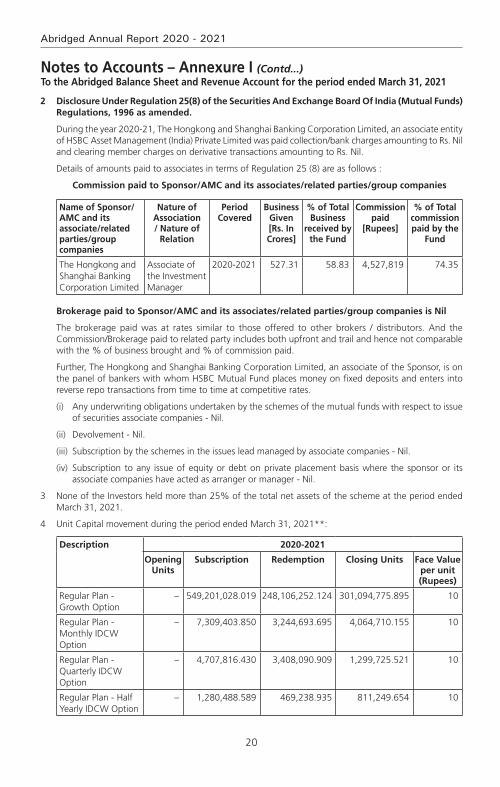
20
Abridged Annual Report 2020 - 2021
2 Disclosure Under Regulation 25(8) of the Securities And Exchange Board Of India (Mutual Funds) Regulations, 1996 as amended.
During the year 2020-21, The Hongkong and Shanghai Banking Corporation Limited, an associate entity of HSBC Asset Management (India) Private Limited was paid collection/bank charges amounting to Rs. Nil and clearing member charges on derivative transactions amounting to Rs. Nil.
Details of amounts paid to associates in terms of Regulation 25 (8) are as follows :
Commission paid to Sponsor/AMC and its associates/related parties/group companies
Name of Sponsor/AMC and its associate/related parties/group companies
Nature of Association / Nature of
Relation
Period Covered
Business Given [Rs. In Crores]
% of Total Business
received by the Fund
Commission paid
[Rupees]
% of Total commission paid by the
Fund
The Hongkong and Shanghai Banking Corporation Limited
Associate of the Investment Manager
2020-2021 527.31 58.83 4,527,819 74.35
Brokerage paid to Sponsor/AMC and its associates/related parties/group companies is Nil
The brokerage paid was at rates similar to those offered to other brokers / distributors. And the Commission/Brokerage paid to related party includes both upfront and trail and hence not comparable with the % of business brought and % of commission paid.
Further, The Hongkong and Shanghai Banking Corporation Limited, an associate of the Sponsor, is on the panel of bankers with whom HSBC Mutual Fund places money on fixed deposits and enters into reverse repo transactions from time to time at competitive rates.
(i) Any underwriting obligations undertaken by the schemes of the mutual funds with respect to issue of securities associate companies - Nil.
(ii) Devolvement - Nil.
(iii) Subscription by the schemes in the issues lead managed by associate companies - Nil.
(iv) Subscription to any issue of equity or debt on private placement basis where the sponsor or its associate companies have acted as arranger or manager - Nil.
3 None of the Investors held more than 25% of the total net assets of the scheme at the period ended March 31, 2021.
4 Unit Capital movement during the period ended March 31, 2021**:
Description 2020-2021
Opening Units
Subscription Redemption Closing Units Face Value per unit (Rupees)
Regular Plan - Growth Option
– 549,201,028.019 248,106,252.124 301,094,775.895 10
Regular Plan - Monthly IDCW Option
– 7,309,403.850 3,244,693.695 4,064,710.155 10
Regular Plan - Quarterly IDCW Option
– 4,707,816.430 3,408,090.909 1,299,725.521 10
Regular Plan - Half Yearly IDCW Option
– 1,280,488.589 469,238.935 811,249.654 10
Notes to Accounts – Annexure I (Contd...)To the Abridged Balance Sheet and Revenue Account for the period ended March 31, 2021
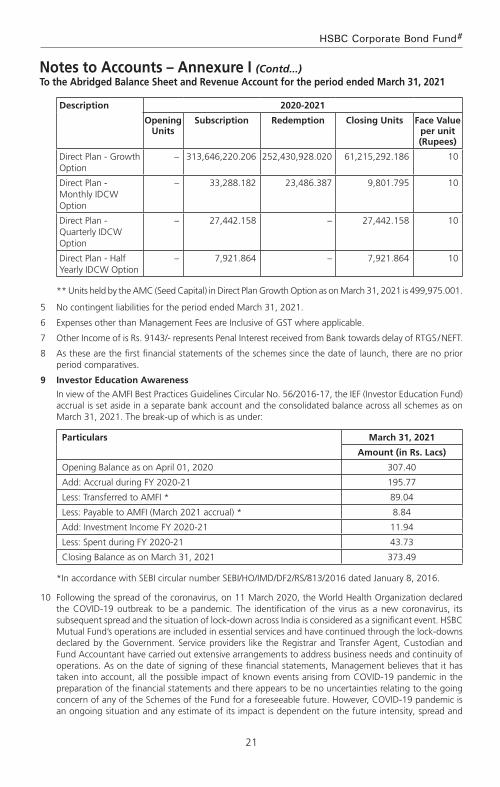
21
HSBC Corporate Bond Fund#
Description 2020-2021
Opening Units
Subscription Redemption Closing Units Face Value per unit (Rupees)
Direct Plan - Growth Option
– 313,646,220.206 252,430,928.020 61,215,292.186 10
Direct Plan - Monthly IDCW Option
– 33,288.182 23,486.387 9,801.795 10
Direct Plan - Quarterly IDCW Option
– 27,442.158 – 27,442.158 10
Direct Plan - Half Yearly IDCW Option
– 7,921.864 – 7,921.864 10
** Units held by the AMC (Seed Capital) in Direct Plan Growth Option as on March 31, 2021 is 499,975.001.
5 No contingent liabilities for the period ended March 31, 2021.
6 Expenses other than Management Fees are Inclusive of GST where applicable.
7 Other Income of is Rs. 9143/- represents Penal Interest received from Bank towards delay of RTGS / NEFT.
8 As these are the first financial statements of the schemes since the date of launch, there are no prior period comparatives.
9 Investor Education Awareness
In view of the AMFI Best Practices Guidelines Circular No. 56/2016-17, the IEF (Investor Education Fund) accrual is set aside in a separate bank account and the consolidated balance across all schemes as on March 31, 2021. The break-up of which is as under:
Particulars March 31, 2021
Amount (in Rs. Lacs)
Opening Balance as on April 01, 2020 307.40
Add: Accrual during FY 2020-21 195.77
Less: Transferred to AMFI * 89.04
Less: Payable to AMFI (March 2021 accrual) * 8.84
Add: Investment Income FY 2020-21 11.94
Less: Spent during FY 2020-21 43.73
Closing Balance as on March 31, 2021 373.49
*In accordance with SEBI circular number SEBI/HO/IMD/DF2/RS/813/2016 dated January 8, 2016.
10 Following the spread of the coronavirus, on 11 March 2020, the World Health Organization declared the COVID-19 outbreak to be a pandemic. The identification of the virus as a new coronavirus, its subsequent spread and the situation of lock-down across India is considered as a significant event. HSBC Mutual Fund’s operations are included in essential services and have continued through the lock-downs declared by the Government. Service providers like the Registrar and Transfer Agent, Custodian and Fund Accountant have carried out extensive arrangements to address business needs and continuity of operations. As on the date of signing of these financial statements, Management believes that it has taken into account, all the possible impact of known events arising from COVID-19 pandemic in the preparation of the financial statements and there appears to be no uncertainties relating to the going concern of any of the Schemes of the Fund for a foreseeable future. However, COVID-19 pandemic is an ongoing situation and any estimate of its impact is dependent on the future intensity, spread and
Notes to Accounts – Annexure I (Contd...)To the Abridged Balance Sheet and Revenue Account for the period ended March 31, 2021
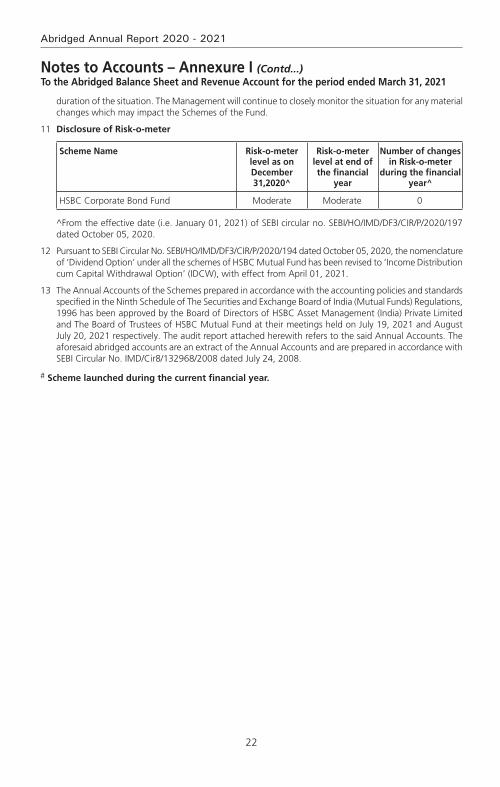
22
Abridged Annual Report 2020 - 2021
Notes to Accounts – Annexure I (Contd...)To the Abridged Balance Sheet and Revenue Account for the period ended March 31, 2021
duration of the situation. The Management will continue to closely monitor the situation for any material changes which may impact the Schemes of the Fund.
11 Disclosure of Risk-o-meter
Scheme Name Risk-o-meter level as on December 31,2020^
Risk-o-meter level at end of the financial
year
Number of changes in Risk-o-meter
during the financial year^
HSBC Corporate Bond Fund Moderate Moderate 0
^From the effective date (i.e. January 01, 2021) of SEBI circular no. SEBI/HO/IMD/DF3/CIR/P/2020/197 dated October 05, 2020.
12 Pursuant to SEBI Circular No. SEBI/HO/IMD/DF3/CIR/P/2020/194 dated October 05, 2020, the nomenclature of ‘Dividend Option’ under all the schemes of HSBC Mutual Fund has been revised to ‘Income Distribution cum Capital Withdrawal Option’ (IDCW), with effect from April 01, 2021.
13 The Annual Accounts of the Schemes prepared in accordance with the accounting policies and standards specified in the Ninth Schedule of The Securities and Exchange Board of India (Mutual Funds) Regulations, 1996 has been approved by the Board of Directors of HSBC Asset Management (India) Private Limited and The Board of Trustees of HSBC Mutual Fund at their meetings held on July 19, 2021 and August July 20, 2021 respectively. The audit report attached herewith refers to the said Annual Accounts. The aforesaid abridged accounts are an extract of the Annual Accounts and are prepared in accordance with SEBI Circular No. IMD/Cir8/132968/2008 dated July 24, 2008.
# Scheme launched during the current financial year.

23
HSBC Corporate Bond Fund#
Voting Policy and Procedures
In view of SEBI guidelines related to “Role of Mutual Funds in Corporate Governance of Public Listed Companies”, HSBC AMC has formulated its “Policy for Proxy Voting in Public Listed Companies”. The said policy is available on our website and the details of actual exercise of proxy votes, the summary of votes casted and the auditor’s certificate for the Financial Year 2020 – 21 is forming part of our full Annual Report for the Financial Year 2020 – 21 which is uploaded on our website at http://www.assetmanagement.hsbc.co.in

24
Abridged Annual Report 2020 - 2021
Statutory Details & Disclaimers
All the returns have been sourced from Mutual Funds India Explorer software. The performance of the schemes and the benchmark is calculated on a total return basis. This document has been prepared by HSBC Asset Management (India) Private Ltd (HSBC) for information purposes only and should not be construed as i) an offer or recommendation to buy or sell securities, commodities, currencies or other investments referred to herein; or ii) an offer to sell or a solicitation or an offer for purchase of any of the funds of HSBC Mutual Fund; or iii) an investment research or investment advice. All information contained in this document (including that sourced from third parties), is obtained from sources HSBC and the third party which HSBC believes to be reliable however, has not independently verified the same. The information and opinions contained within the document are based upon publicly available information and rates of taxation applicable (if any) at the time of publication, which are subject to change from time to time.
Expressions of opinion are those of HSBC only and are subject to change without notice. It does not have regard to specific investment objectives, financial situation and the particular needs of any specific person who may receive this document. Investors should seek personal and independent advice regarding the appropriateness of investing in any of the funds, securities, other investment or investment strategies that may have been discussed or referred herein and should understand that the views regarding future prospects may or may not be realized. In no event shall HSBC Mutual Fund / HSBC Asset management (India) Private Limited and / or its affiliates or any of their directors, trustees, officers and employees be liable for any direct, indirect, special, incidental or consequential damages arising out of the use of information / opinion herein. Neither this document nor the units of HSBC Mutual Fund have been registered in any jurisdiction. The distribution of this document in certain jurisdictions may be restricted or totally prohibited and accordingly, persons who come into possession of this document are required to inform themselves about, and to observe, any such restrictions.
mutual fund investments are subject to market risks, read all scheme related documents carefully.
HSBC Low Duration FundAn open ended low duration debt Scheme investing in instruments such that the Macaulay duration of the portfolio is between 6 months to 12 months
Abridged Annual Report 2020 - 2021

1
HSBC Low Duration Fund
Dear Investor,
The beginning of the last financial year now almost seems like a distant memory. COVID-19 was still a relatively unknown enemy and governments across the world were grappling with ways to control and mitigate the risks associated with it. Nationwide lockdowns were the norm and our markets both equity and fixed income reacted negatively leading to significant erosion of wealth. Within a short period of time markets bounced back. This confounded even the most astute market pundits. How is it possible that when GDP growth had slowed down, unemployment had risen, inflation was high could there be such sharp up move in equity indices. Whilst the reasons are well known about easy global liquidity, demand resurgence, cost cutting by corporates etc. perhaps its most important to remember that the markets are not a reflector but a predictor of economic activity.
At all times particularly during such volatile times it is important to go back to the basics. Why do you save, why do you invest, what goals would you like to achieve, how old are you, what is your risk appetite? The replies to these simple questions will help you determine your asset allocation. As an example when equity markets corrected sharply last year, investors who reviewed their asset allocation, stayed invested during the lows of the past year and were able to capture the rebound and have seen prime returns since then. The current market movement in all likelihood would have also led to some imbalances in your asset allocation. Do not ignore that and I strongly recommend that you do review this with your advisor to check whether re-balancing is required.
During this financial year we had three very successful new fund launches. The pandemic showed us a clear trend of dominant players becoming stronger and profit pool getting consolidated within a few companies. To capture this opportunity, we launched the HSBC Focused Equity Fund which garnered close to Rs. 520 crores. During the second half of 2020, in the fixed income space, 3 - 5 year duration range had a favourable investment scenario as RBI’s accommodative policy and surplus liquidity had reduced the returns at the very short end of the yield curve. There was a demand for an actively managed moderate duration strategy with better credit quality which we fulfilled by launching HSBC Corporate Bond Fund. It garnered over 700 crores. Our latest and first of its kind offering, HSBC Global Equity Climate Change Fund of Fund saw a stupendous response with over 8000 investors investing over Rs. 616 crores. This is an investment opportunity which goes beyond the rationale of simply generating investment returns and is the future of responsible investing.
We worked towards augmenting our digital capabilities by launching a few key enhancements to our online transaction platform. Being mindful of the movement restrictions in place, this year we focused on digitizing offline processes so that an investor need not need step out of her home for investing or availing any key services. While our interactive chatbot AskMe, eased service queries, our end-to-end digital KYC module enabled a first time Mutual Fund investor to invest in our funds without any paperwork. We listened to your feedback and digitized consolidation of folios and change of tax status which eliminated the need for you to physically visit our branches.
I am a strong believer in the India story and this story has just begun. The opportunity to invest in this high growth market is a very exciting opportunity. I do hope you share my enthusiasm and I ask that you continue to invest whilst reviewing your asset allocation at all times. As always thank you for your business. Stay safe.
Warm regards,
Ravi MenonChief Executive Officer,
HSBC Asset Management India

2
Abridged Annual Report 2020 - 2021
SPONSOR
HSBC Securities and Capital Markets (India) Private LimitedRegd. Office: 52/60, Mahatma Gandhi Road, Fort, Mumbai - 400 001.
TRUSTEE
Board of TrusteesOffice: 16, Veer Nariman Road, Fort, Mumbai 400 001.
ASSET MANAGEMENT COMPANY
HSBC Asset Management (India) Private LimitedCorp. & Regd. Office: 16, Veer Nariman Road, Fort, Mumbai 400 001.
CUSTODIAN
Standard Chartered Bank (SCB)Corp. & Regd. Office: Crescenzo, Securities Services, 3rd Floor, C-38/39, G-Block,Bandra Kurla Complex, Bandra East, Mumbai – 400051.
AUDITORS TO THE SCHEME
BSR & Co. LLPChartered Accountants
5th Floor, Lodha Excelus, Apollo Mills Compound, N. M. Joshi Marg, Mahalaxmi, Mumbai 400 011.
REGISTRAR & TRANSFER AGENTS
Computer Age Management Services Limited (CAMS)Unit: HSBC Mutual Fund ’C’ Block, 2nd Floor, Hanudev Info Park P. Ltd., SF No. 558/2, Udayampalayam Road, Nava India, Coimbatore - 641 028.
BOARD OF TRUSTEES
Ms. Jasmine Batliwalla - Chairperson
Mr. Nani Javeri - Trustee
Dr. T. C. Nair - Trustee
Mr. Pedro Bastos - Trustee
BOARD OF DIRECTORS
Mr. Dinesh Mittal - Director
Dr. Indu Shahani - Director
Mr. Ravi Menon - Director & Chief Executive Officer
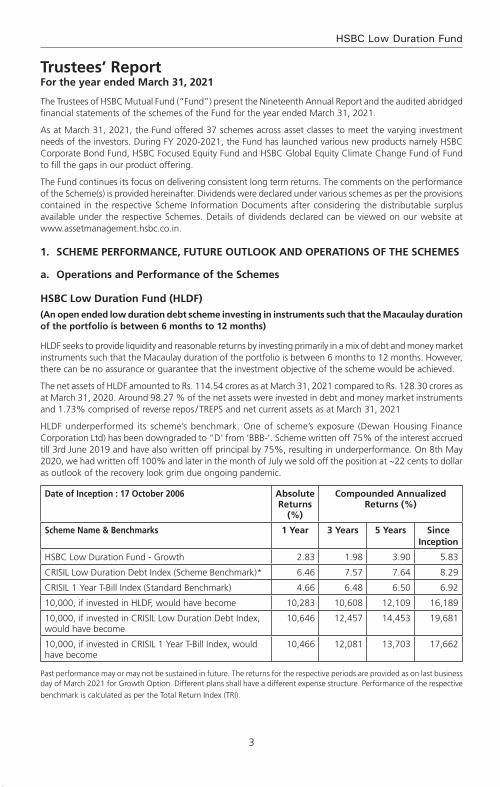
3
HSBC Low Duration Fund
The Trustees of HSBC Mutual Fund (“Fund”) present the Nineteenth Annual Report and the audited abridged financial statements of the schemes of the Fund for the year ended March 31, 2021.
As at March 31, 2021, the Fund offered 37 schemes across asset classes to meet the varying investment needs of the investors. During FY 2020-2021, the Fund has launched various new products namely HSBC Corporate Bond Fund, HSBC Focused Equity Fund and HSBC Global Equity Climate Change Fund of Fund to fill the gaps in our product offering.
The Fund continues its focus on delivering consistent long term returns. The comments on the performance of the Scheme(s) is provided hereinafter. Dividends were declared under various schemes as per the provisions contained in the respective Scheme Information Documents after considering the distributable surplus available under the respective Schemes. Details of dividends declared can be viewed on our website at www.assetmanagement.hsbc.co.in.
1. Scheme Performance, future outlook and oPerationS of the SchemeS
a. operations and Performance of the Schemes
hSBc low duration fund (hldf)
(an open ended low duration debt scheme investing in instruments such that the macaulay duration of the portfolio is between 6 months to 12 months)
HLDF seeks to provide liquidity and reasonable returns by investing primarily in a mix of debt and money market instruments such that the Macaulay duration of the portfolio is between 6 months to 12 months. However, there can be no assurance or guarantee that the investment objective of the scheme would be achieved.
The net assets of HLDF amounted to Rs. 114.54 crores as at March 31, 2021 compared to Rs. 128.30 crores as at March 31, 2020. Around 98.27 % of the net assets were invested in debt and money market instruments and 1.73% comprised of reverse repos / TREPS and net current assets as at March 31, 2021
HLDF underperformed its scheme’s benchmark. One of scheme’s exposure (Dewan Housing Finance Corporation Ltd) has been downgraded to “D’ from ‘BBB-’. Scheme written off 75% of the interest accrued till 3rd June 2019 and have also written off principal by 75%, resulting in underperformance. On 8th May 2020, we had written off 100% and later in the month of July we sold off the position at ~22 cents to dollar as outlook of the recovery look grim due ongoing pandemic.
date of inception : 17 october 2006 absolute returns
(%)
compounded annualized returns (%)
Scheme name & Benchmarks 1 Year 3 Years 5 Years Since inception
HSBC Low Duration Fund - Growth 2.83 1.98 3.90 5.83
CRISIL Low Duration Debt Index (Scheme Benchmark)* 6.46 7.57 7.64 8.29
CRISIL 1 Year T-Bill Index (Standard Benchmark) 4.66 6.48 6.50 6.92
10,000, if invested in HLDF, would have become 10,283 10,608 12,109 16,189
10,000, if invested in CRISIL Low Duration Debt Index, would have become
10,646 12,457 14,453 19,681
10,000, if invested in CRISIL 1 Year T-Bill Index, would have become
10,466 12,081 13,703 17,662
Past performance may or may not be sustained in future. The returns for the respective periods are provided as on last business day of March 2021 for Growth Option. Different plans shall have a different expense structure. Performance of the respective
benchmark is calculated as per the Total Return Index (TRI).
Trustees’ ReportFor the year ended March 31, 2021

4
Abridged Annual Report 2020 - 2021
b. market overview & outlook (as furnished by hSBc asset management (india) Private limited)
equitY outlook
recap of fY 2020-21:
Fiscal 2020-21 was a rewarding year for equity investors with market indices recording stellar gains from the low base after the COVID correction. Market sentiments steadily improved during the course of the year to deliver positive returns in all four quarters of the year.
We witnessed various legs of market performance during the last fiscal, driven by multiple factors and variables. Initial rebound from the market lows was driven by attractive valuations, then it was on the back of faster than anticipated recovery post lockdown, reopening optimism, swifter than expected vaccine intervention and above all, the unprecedented liquidity. Lastly but importantly, a period of lower cost of capital coupled with low real rates, improved the attractiveness of equity as an asset class, driving the performance.
As a result, the year ended with optimism compared to despair when it began. Corporate India overcame the challenges posed by COVID through significant cost control measures while at the same time showed improvement in their financial position and cash flows.
Commodities also rallied from the lows of the COVID crisis with global crude oil prices surging by 179% during the year. INR appreciated by 3.3% (as India recorded strong net FPI inflows) during the year. MSCI India index outperformed most of key global indices during the past fiscal. MSCI India index (USD) gained 74.8% as compared to 51.8% for MSCI World, 50.5% for Dow Jones, 55.1% for MSCI Emerging Markets, 41.2% for MSCI China and 42% for MSCI Europe*.
At a record USD 37.3 bn of net FPI inflows during the fiscal, the tally was higher than the cumulative net inflows India received from the previous 6 years. DIIs on the other hand saw net outflows of USD 18.4 bn and this was the first fiscal year of net outflows from the segment in 5 years. The net outflows from the segment was driven by USD 16.7 bn of outflows from the MFs while domestic insurers saw a far lower outflow of USD 1.6 bn*.
indices returns (april 1, 2020 to march 31, 2021) 1 Year^
S&P BSE Sensex TR 69.8%
NSE CNX Nifty TR 72.5%
S&P BSE 100 TR 73.5%
S&P BSE 200 TR 76.3%
S&P BSE 500 TR 78.6%
S&P BSE Midcap TR 93.0%
S&P BSE 250 Small-cap TR 117.5%
^Source: Bloomberg (Above table values are for total return indices)
Way forward:
Beginning of the new fiscal, India had to contend with the risk of the second COVID wave, which was more ferocious than the first wave on the human impact. However, as we write this, the second wave has already peaked and there have been a significant fall in number of active cases, case-positivity rate, daily new caseload and deaths. Vaccination drive also has seen acceleration with and is now closer to 6 mn doses per day mark. Also, the impact of the lockdown on economic activity has been significantly lower during the second wave, compared to last year. In most of the states, the unlocking process has already begun in a phased manner and this is leading to improvement in various activity indicators. Mobility indicators are recovering faster while economic indicators (freight, credit off-take, E-way bill generation, power demand etc.) are also witnessing a gradual recovery. The recently concluded earnings season has turned out to be in-line with expectations and despite the concerns of around the second wave, the earnings (Nifty) have seen upgrades for FY22. Market is looking beyond the current quarter (i.e. 1QFY22), which would witness
Trustees’ ReportFor the year ended March 31, 2021 (Contd...)

5
HSBC Low Duration Fund
an impact due to the second wave. Our baseline assumption is that of a temporary impact from the second wave and the set-back to the recovery process limited to a few months, after which we should see the economic rebound. So far, this is tracking in-line with assumptions.
From a macro perspective, the current estimates for GDP growth in FY22 stand at 9.2%* (after seeing downgrades to factor in the impact of second wave). The downgrade in estimates are pertaining to the first quarter and hence the trajectory of growth from hereon should pick up. The tax collections data for the first two months of FY22 has remained strong, implying that the drawdown of the second wave on the fiscal position is not alarming. Additionally, the impact of fiscal stimulus package announced in FY22 so far is manageable (about 60 bps of GDP) and hence would not lead to any fiscal strain.
After the spectacular rally, market valuations at an overall level are now trending above historical averages on traditional valuation metrics (P/E, P/B). This is true for all market capitalization categories (viz large, mid and small). Typically, the broader market (i.e. mid and small cap segments), trade at a discount to large caps, however this scenario has now reversed after the outperformance from the broader market segments. However, the earnings momentum continues to remain strong (witnessing upgrades so far) and except for a short period due to second wave, the earnings momentum should hold up.
We believe that the risk-reward is balanced for the equity markets in the near term. Higher or sticky inflation expectations globally, higher than historical market valuations on some parameters (i.e. P/E, P/B) and adverse demand impact from the second wave are risk factors to contend with in the near term. However, these are counter balanced by positive commentary from companies, significant decline in COVID cases and acceleration in the vaccination programme. As a result, in the near term markets may see a consolidation phase and could take cues from the upcoming earnings season with more focus on the corporate commentary and the outlook. From a medium to long term perspective, the outlook for equity markets remains positive. The expectation of cyclical revival in the economy brings in a multi-year earnings visibility. This along with a benign cost of capital environment, should support equity performance. However, equity returns are likely to moderate on the back of the relatively high valuations and the strong recovery we have already witnessed from the COVID lows. Equity performance is likely to mirror the earnings growth trends over the medium to long term.
Pace of vaccination, concerns about a third wave, corporate earnings trajectory, inflation trends (both global & domestic), monsoon trends and commodity prices (especially crude oil) are some of the key factors which could influence market performance in the short term.
From a portfolio perspective, we are maintaining a pro-cyclical bias. We expect earnings growth to rebound sharply post the current COVID phase. Earnings growth are expected to sustain in high-teens beyond FY22 on the back of economy witnessing a cyclical recovery due to revival in capex cycle over the next 2-3 years (first by the government followed by private capex). From a sectoral perspective our order of preference is rate sensitives followed by domestic cyclicals, exporters and domestic consumption. Predominantly regulated businesses come last in our pecking order. This preference is dictated by our assessment of sectors / segments leading contribution to the market earnings growth over the next 2-3 years. Our portfolio construction is driven by a bottom up approach to stock selection with a focus on names that can deliver positive earnings surprises. We continue to focus on this theme to identify likely outperformers.
*Source: Bloomberg
deBt outlook
market drivers during the course of the year fY21
The Fixed Income markets started the year with a bout of nervousness that was triggered by the pandemic. While RBI had calmed the markets with its large rate cut action of 75bp cut followed by liquidity supportive measures, the volatility continued until mid-May when government announced its relief package. While it was not fiscally expansive, it touched the right cords in terms of credit flow to desired sectors. This was followed up with RBI’s credit relief measures in terms of moratorium and restructuring of assets that were stressed due to the pandemic. Throughout the course of the year, RBI maintained its accommodative stance along with significant amount of surplus liquidity that was supportive and helped in maintaining stability in the market. However, as the year progressed and pressure on fiscal began to mount yields started seeing a spike towards the last quarter of the fiscal. While borrowing was stepped up to INR 12 trillion from previously budgeted
Trustees’ ReportFor the year ended March 31, 2021 (Contd...)

6
Abridged Annual Report 2020 - 2021
INR 7.8 trillion in May 2020, it was further enhanced by and additional INR 1.1 trillion in October 2020. Overall GOI ended up borrowing a record amount of INR 13.9 trillion. The budget proved to be a shocker with GOI using the pandemic as an opportunity for setting the finances in order. GOI showed a record deficit of 9.5% for FY21 and projected a 6.8% for FY22 with estimated central government gross borrowing of INR 12 trillion. This seemed to reverse the support RBI had provided throughout the year with benchmark 10-year bond peaking to 6.23% in mid –Feb 2021. RBI’s statements to remain supportive were left in the sidelines. Overall it seemed that the 115bp of rate cut, along with significant liquidity infusion (OMO + Twist operations of ~INR 3 trillion, infusion via dollar purchases) seemed only a little to help in applying a brake to the one-way spike in yields. The year closed ~6.16% with absence of concrete action by RBI.
rBi Policy: Through the course of the year, RBI has maintained an accommodative stance, with an aggregate 115bp of rate cut done in March and May 2020 taking the repo rate from 5.15% to 4%. Subsequently while inflation pressures prevented RBI from taking any direct actions, RBI has used a combination of creative tools to keep the rates contained primarily via liquidity supportive tools such as OMOs, Twist Operations, Repo linked Term loans to needy sectors (LTROs, TLTROs), CRR cuts. While inflation was a worry for most part of the year, RBI kept it aside admitting that growth was a priority and inflation effects are more supply side rather than demand side. Prospectively into FY22, with the onset of the second wave, RBI continues to maintain the stance to prioritize growth.
inflation: Inflation for most part of the year stayed above 6% primarily driven by supply side pressures and some intermittent spike from food inflation as well. While it has been coming off since December with cooling off of food inflation and positive base effects, it has been between 4- 5.5%. Structurally however inflation risks continue to remain as oil prices have increased and base effects will not remain supportive for long. Core inflation continues to remain sticky.
liquidity: During the year, system liquidity has remained at significant surplus facilitated largely by RBI action such as OMOs, foreign exchange operations and government spending.
Budget: The FY2022 union budget focuses on growth and has accordingly, presented a 9.5% fiscal deficit for FY21 and 6.8% for FY22. On the revenue side, the assumptions are largely realistic, with FY22 (E) Nominal GDP growth at 14.4% and tax revenue growth at 17% considering the pandemic impact in FY 21. Compared to FY20, tax revenue growth is ~10%. While non-tax revenues are ambitious pegging the divestment at INR 1.75 trillion, with robust pipeline of assets including monetization of road and transmission assets, execution remains the key as in the past. On the expenditure side, better quality capex spending with focusing on rail, road, defense, urban infra is positive for long term structural growth. The revenue side expenditure adjusting for clearance of past subsidy arrears will be similar to budgetary estimates. Government using this opportunity to bring back off-balance sheet spending to on-balance sheet was a welcome move towards transparency and showing realistic projections. Alongside, states have also been given leeway to borrow upto 4% of their GDP with an additional 0.5% subject to conditions. Given that states are an important vehicle for capex investment, this move is welcome although it may entail additional state borrowing. The fiscal glide path is shifted to FY26 at below 4.5% for center and 3% for states suggesting that spending will continue and borrowing will come down gradually. In summary, from survival to revival, FY22 budget aims for structural growth leaving fiscal concerns sideways in the interim. Government’s intent seems clear on bringing back growth on the table, in a transparent manner.
While the second wave of the pandemic has once again derailed the revenue story, government will still have some cushion from its conservative estimates.
currency and fii flows: INR has been on an appreciation trajectory for most part of the year, aided by dollar underperformance supported by positive FII and FDI flows along with reduced imports on the domestic front as well. RBI has used most of the flows to accumulate reserves which has prevented any strong appreciation. Pandemic shock and global risk off led rupee over 75 in the beginning of the year only to close below 72 at the end of the fiscal year. While the second wave led to another spike in INR in April, it has since then cooled once again driven by dollar underperformance and pandemic recovery on the domestic front. Net FII flows was ~$30 bn with positive equity flows of~$37 bn while debt was negative ~$7bn and overall RBI’s forex reserves rose by a ~$100 bn to close ~$537 bn.
credit growth: Credit growth for the entire year has been tepid as previous year’s credit events were followed by nervousness relating to the pandemic. Despite RBI opening up several windows to finance the
Trustees’ ReportFor the year ended March 31, 2021 (Contd...)
7
HSBC Low Duration Fund
non-AAA segment, there was very little fresh credit flowing that segment. Overall banking credit grew by only 6.5%. Risk appetite has however been improving from a complete risk aversion to opening up towards a calculated risk. Prospectively it is expected that once the pandemic risk abates, credit growth will resume primarily driven by government capex spending and demand recovery.
market outlook
The pandemic once again brought the country to a situation similar to last year and debt markets perhaps interpreted the same as a structural rise in rates. In the initial day’s post budget in Feb of 2021, market was expecting a concrete set of actions such as an OMO calendar from RBI, and RBI’s words alone failed to calm the market. The first auction of the fiscal year also saw a devolvement. However, RBI acted in the first policy of the year announcing a bond buyback program akin to QE (quantitative easing) and its subsequent cancellation of auctions wherein yields were perhaps quoted higher than RBI’s comfort levels brought back confidence into the market. Since then we have seen a strong rally with 10-year benchmark trending below 6% and the curve moving alongside. RBI reiteration of priority of growth and also supporting with higher than expected dividend payment stand out as a testimony of its support. While we do not expect RBI to act in terms of rate cuts, we believe that measures such as G-SAP, OMOs will continue until there is visibility of a structural growth. Therefore, the large borrowing program should go without any hiccups.
Furthermore, with the evidence of strong GST numbers until April 2021 (before the 2nd wave), it is expected that growth and therefore fiscal revenues will come back. Government’s conservative budget estimates are supportive. Also, given the fact that compared to last year there has not been a complete shutdown of activity (lockdowns being distributed), the impact on growth will not be similar to last year. Pent up demand will come back to support revenue collection. However, on the flipside, once growth resumes RBI will be forced to withdraw liquidity in a phased manner to prevent asset bubbles. Nevertheless, RBI need not act in terms of rate actions and we believe that a prolonged pause in terms of RBI rates is in the offing.
Net-net therefore while growth is wanting no matter what, it may come at a small price of rise in yields with liquidity withdrawal. That is however expected more in the 2nd half of the year. Lower than expected borrowing numbers, later this year or if not in next year could be a surprise. We may therefore see a range bound rate action in the near term with a rising bias over time. Global rate environment, oil and currency risks are to be watched out for.
2. Brief Background of SPonSorS, Board of truSteeS and aSSet management comPanY
a. Sponsor
HSBC Mutual Fund is sponsored by HSBC Securities and Capital Markets (India) Private Limited (HSCI). The Sponsor is the Settler of the Mutual Fund Trust. The Sponsor has entrusted a sum of Rs. 1,00,000/- (Rupees One Lakh only) to the Trustee as the initial contribution towards the corpus of the Mutual Fund.
HSCI offers integrated investment banking services, securities and corporate finance & advisory. HSCI is a member of the Bombay Stock Exchange Limited and National Stock Exchange (capital and derivative market segments). HSCI holds 100% of the paid up equity share capital of HSBC Asset Management (India) Private Limited.
b. hSBc mutual fund
HSBC Mutual Fund (“the Mutual Fund” or “the Fund”) has been constituted as a Trust in accordance with the provisions of the Indian Trusts Act, 1882 (2 of 1882) vide a Trust Deed dated February 7, 2002 with HSBC Securities and Capital Markets (India) Private Limited, as the Sponsor and the Board of Individual Trustees. The Trustee has entered into an Investment Management Agreement dated February 7, 2002 with HSBC Asset Management (India) Private Limited (AMC) to function as the Investment Manager for all the schemes of the Fund. The Fund was registered with SEBI vide registration number MF/046/02/5 dated May 27, 2002.
The Trust has been formed for the purpose of pooling of capital from the public for collective investment in securities for the purpose of providing facilities for participation by persons as beneficiaries in such investments and in the profits/income arising therefrom.
Trustees’ ReportFor the year ended March 31, 2021 (Contd...)
8
Abridged Annual Report 2020 - 2021
c. Board of trustees (the trustees)
The Board of Trustees is the exclusive owner of the Trust Fund and holds the same in trust for the benefit of the unit holders. The Trustees have been discharging their duties and carrying out the responsibilities as provided in the SEBI (Mutual Funds) Regulations, 1996 and the Trust Deed. The Trustees seek to ensure that the Fund and the schemes floated there under are managed by the AMC in accordance with the Trust Deed, the said Regulations, directions and guidelines issued by the SEBI, the Stock Exchanges, the Association of Mutual Funds in India and other regulatory agencies.
d. asset management company (the amc)
HSBC Asset Management (India) Private Limited (the Investment Manager or the AMC) is a private limited company incorporated under the Companies Act, 1956 on December 12, 2001 having its Registered Office at 16, V. N. Road, Fort, Mumbai 400 001. HSBC Asset Management (India) Private Limited has been appointed as the Asset Management Company of HSBC Mutual Fund by the Trustee vide Investment Management Agreement (IMA) dated February 7, 2002 and executed between the Trustees and the AMC. SEBI approved the AMC to act as the Investment Manager of the Fund vide its letter No. MFD/BC/163/2002 dated May 27, 2002. The paid-up equity share capital of the AMC is Rs. 61.59 crores. The AMC is registered as a Portfolio Manager under the SEBI (Portfolio Managers) Regulations, 1993 vide registration no. INP000001322. The AMC also offers non-binding Advisory services to offshore funds under the mutual fund license.
HSBC Securities and Capital Markets (India) Private Limited holds 100% of the paid up equity share capital of the AMC.
3. inveStment oBjective of the SchemeSThe investment objective of the respective schemes has been provided above under the heading “Scheme Performance, Future Outlook and Operation of the Scheme” (Refer Section 1).
4. Significant accounting PolicieS The Significant Accounting Policies form part of the Notes to the Accounts annexed to the Balance Sheet of the Schemes in the Full Annual Report. The accounting policies are in accordance with Securities Exchange Board of India (Mutual Funds) Regulations 1996.
5. unclaimed dividendS & redemPtionSSummary of number of investors & corresponding amount Scheme-wise as on March 31, 2021
Schemeunclaimed dividend unclaimed redemption
amount (rs.) no. of investors
amount (rs.) no. of investors
HSBC Low Duration Fund 34,644.98 68 84,278.89 14
6. inveStor ServiceS
The number of official points of acceptance of transactions is 204 locations. In addition to the offices of the Registrar & Transfer agents, the AMC has Investor Service Centers in 9 locations at its own offices - namely Mumbai, New Delhi, Kolkata, Bangalore, Pune, Ahmedabad, Hyderabad, Chandigarh and Chennai. With a view to enhance customer convenience, the AMC has the facility of priority based servicing to key distributors through the enhancement of the Interactive Voice Reponses. The AMC has 2 Toll Free numbers (1-800-200-2434 /1-800-258-2434) which can be dialed from anywhere in India and 1 number i.e +91 44 39923900 (Investors calling from abroad). The call center service is being managed by the Registrar and Transfer Agents. Transactions for purchase / redemption of units in the schemes HSBC Mutual Fund can also be made through the online transaction facility on the AMC’s website at https://invest.assetmanagement.hsbc.co.in.
On the distribution front, the number of empaneled distributors was 1069 as on March 31, 2021. During the year, the AMC initiated tie-ups for online distribution of the Mutual Fund’s schemes with several channel partners taking the total number of such tie-ups to 52.
Trustees’ ReportFor the year ended March 31, 2021 (Contd...)
9
HSBC Low Duration Fund
Trustees’ ReportFor the year ended March 31, 2021 (Contd...)
7. detailS of inveStor grievance redreSSal
The details of the redressal of investor complaints received against HSBC Mutual Fund during April 2020 - March 2021 are as follows:
2020-2021com-plaint code
type of complaint# (a) no. of complaints pending at the begin-ning of the
year
(b) no. of com-
plaints received during
the year
action on (a) and (b)
resolved non action-
able
Pending
Within 30
days
30 - 60 days
60 - 180 days
Beyond 180 days
0 - 3 months
3 - 6 months
6 - 9 months
9 - 12 months
I A Non receipt of Dividend on Units
0 0 0 0 0 0 0 0 0 0 0
I B Interest on delayed payment of Dividend
0 0 0 0 0 0 0 0 0 0 0
I C Non receipt of Redemption Proceeds
0 8 7 0 0 0 0 1 0 0 0
I D Interest on delayed payment of Redemption
0 0 0 0 0 0 0 0 0 0 0
II A Non receipt of Statement of Account / Unit Certificate
0 0 0 0 0 0 0 0 0 0 0
II B Discrepancy in Statement of Account
0 1 1 0 0 0 0 0 0 0 0
II C Data corrections in Investor details **
0 12 12 0 0 0 0 0 0 0 0
II D Non receipt of Annual Report/Abridged Summary
0 0 0 0 0 0 0 0 0 0 0
III A Wrong switch between Schemes
0 0 0 0 0 0 0 0 0 0 0
III B Unauthorized switch between Schemes
0 0 0 0 0 0 0 0 0 0 0
III C Deviation from Scheme attributes
0 0 0 0 0 0 0 0 0 0 0
III D Wrong or excess charges/load
0 0 0 0 0 0 0 0 0 0 0
III E Non updation of changes viz. address, PAN, bank details, nomination, etc
0 6 6 0 0 0 0 0 0 0 0
IV Others 0 15 15 0 0 0 0 0 0 0 0
total 0 42 41 0 0 0 0 1 0 0 0
Summary of complaints for fY 2020-21
Particulars count
Total complaints received 42
Total number of folios 148770
% of complaints against the folio 0.028%
# active folios
** As per AMFI Best Practice Guidelines Circular No. 25/2011-12 for Revisions in the Guidelines on Standardization of Complaints / Grievances Reporting Procedure. If “Others” include a type of complaint which is more than 10% of overall complaints, then such a reason should be provided separately. Hence data corrections in Investor Details is included as a separate category
* Non actionable means the complaint is incomplete / outside the scope of the mutual fund

10
Abridged Annual Report 2020 - 2021
8. inveStor education initiativeS
Investor awareness advertisements were published in Mutual Fund Insight magazine on a monthly basis along with an editorial on ‘SIP Sahi Hai’. Additionally, monthly articles / blogs have been written by Advisorkhoj on IAP which talks of the advantages of SIP, start early, power of compounding, diversification, asset allocation etc. The same is promoted by the publisher via an email to their entire network and also on their social media handles which can be retweeted or liked. Also, educative infographics have been hosted on our website under the investor resources section. The same have also been circulated to existing Indian investors via email for engagement and for educative purposes.
9. ProxY voting PolicY
In terms of SEBI Circular no. SEBI/IMD/CIR No. 18/198647/2010 dated March 15, 2010, the Fund has adopted Proxy Voting Policy and Procedures for exercising voting rights in respect of securities held by the Schemes.
The summary of the votes casted in the general meetings of the Investee companies, by the AMC for and on behalf of the Schemes of the Fund, for the financial year 2020-2021 is provided below:
quarter total no. of resolutions
Break-up of vote decision
for against abstained
June 2020 50 43 6 1
September 2020 752 656 38 58
December 2020 41 31 1 9
March 2021 40 30 8 2
total 883 760 53 70
In terms of the requirement of SEBI Circular no. CIR/IMD/DF/05/2014 dated March 24, 2014 and SEBI/HO/IMD/DF2/CIR/P/2016/68 dated August 10, 2016; the AMC has obtained certificate from M/s. M. P. Chitale & Co., Chartered Accountants, who is acting as a Scrutinizer, on the voting report for the FY 2020-21. The certificate dated April 14, 2021 issued by M/s. M. P. Chitale & Co., is available on the website of the AMC as part of the full Annual Report.
Unit holders can refer to the full Annual Report for complete details of actual exercise of votes in the general meetings of the investee companies for the financial year 2020-21 or log on to our website at www.assetmanagement.hsbc.co.in.
10. StatutorY detailS
a) The Sponsors are not responsible or liable for any loss resulting from the operation of the Schemes of the Fund beyond initial contribution of Rs. 1 lakh for setting up the Fund.
b) The price and redemption value of the units, and income from them, can go up as well as down with fluctuations in the market value of its underlying investments.
c) Full Annual Report of HSBC Mutual Fund and of HSBC Asset Management (India) Private Limited (the AMC) shall be disclosed on the website at www.assetmanagement.hsbc.co.in and shall be available for inspection at the Head Office of the Mutual Fund. Present and prospective unit holders can obtain copy of the Trust Deed, the full Annual Report of the Scheme(s), the Annual Report of HSBC Asset Management (India) Private Limited and the text of the relevant Scheme(s) at a price.
11. Scheme WiSe changeS in riSk-o-meter of the SchemeS of hSBc mutual fund during fY 2021
As per the requirements of SEBI Circular no. SEBI/HO/IMD/DF3/CIR/P/2020/197 dated October 05, 2020 the changes carried out in the risk-o-meter of the schemes of HSBC Mutual Fund during FY 2021 have been given in the below mentioned table for the information of the Unitholders, a report on the said changes has also been displayed on the website of the Fund and AMFI.
Trustees’ ReportFor the year ended March 31, 2021 (Contd...)

11
HSBC Low Duration Fund
Trustees’ ReportFor the year ended March 31, 2021 (Contd...)
Scheme name
risk-o-meter level as on december
31,2020^
risk-o-meter level at end of
the financial year
number of changes in risk-o-meter during the
financial year^
dec-2020 mar-2021 dec 2020 to march 2021
HSBC Low Duration Fund Low to Moderate Low to Moderate 0
^From the effective date (i.e. January 01, 2021) of SEBI circular no. SEBI/HO/IMD/DF3/CIR/P/2020/197 dated October 05, 2020.
12. governance under the PolicY on SteWardShiP reSPonSiBilitieS of hSBc mutual fund
As per the requirements of SEBI Circular no. CIR/CFD/CMD1/ 168 /2019 dated December 24, 2019, HSBC Mutual Fund has adapted the policy on stewardship responsibilities, the unitholders are requested to note the status of governance with the same as mentioned below:
S. no.
Particulars of Principles of Stewardship code
Status of compliance (complied/
not complied)
description remarks/reasons for
deviation/non - compliance,
if any
1 Principle 1:Institutional Investors should formulate a comprehensive policy on the discharge of their stewardship responsibilities, publicly disclose it, review and update it periodically.
Complied HSBC Asset Management (India) Private Limited's (AMIN) 'Policy on Stewardship responsibilities' (Stewardship Code / Policy) was formulated and implemented on 01 July, 2020. This is a comprehensive document which has been publicly disclosed on the website of AMIN. The same shall follow a periodic review.
N.A.
2 Principle 2:Inst i tut ional investors should have a clear policy on how they manage conflicts of interest in fulfilling their stewardship responsibilities and publicly disclose it.
Complied Defining and managing Conflict of Interest in fulfilling stewardship responsibilities are detailed in the Stewardship Policy document. The policy document is publicly disclosed.
N.A.
3 Principle 3:Institutional investors should monitor their investee companies.
Complied AMIN monitors all investee companies through its investment process. This includes assessment of companies’ own and market data, consideration of research from brokers and other independent research providers – including ESG & voting research, attending individual & group meetings with company management and directors, visiting production sites (wherever necessary), engaging with key stakeholders including competitors and customers, and financial modelling. More details enumerated in the policy document
N.A.
4 Principle 4:Inst i tut ional investors should have a clear policy on intervention in their investee companies. Institutional investors should also have a
Complied Details of undertaking active engagement with investee companies and the policy for collaboration with other institutional holders are detailed in the policy document. The policy document is publicly disclosed.
N.A.
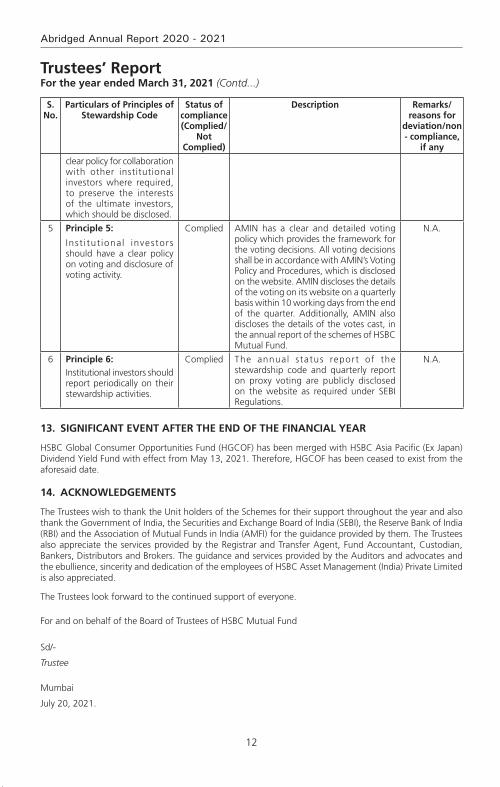
12
Abridged Annual Report 2020 - 2021
S. no.
Particulars of Principles of Stewardship code
Status of compliance (complied/
not complied)
description remarks/reasons for
deviation/non - compliance,
if any
clear policy for collaboration with other institutional investors where required, to preserve the interests of the ultimate investors, which should be disclosed.
5 Principle 5:
Inst i tut ional investors should have a clear policy on voting and disclosure of voting activity.
Complied AMIN has a clear and detailed voting policy which provides the framework for the voting decisions. All voting decisions shall be in accordance with AMIN’s Voting Policy and Procedures, which is disclosed on the website. AMIN discloses the details of the voting on its website on a quarterly basis within 10 working days from the end of the quarter. Additionally, AMIN also discloses the details of the votes cast, in the annual report of the schemes of HSBC Mutual Fund.
N.A.
6 Principle 6:Institutional investors should report periodically on their stewardship activities.
Complied The annual status report of the stewardship code and quarterly report on proxy voting are publicly disclosed on the website as required under SEBI Regulations.
N.A.
13. Significant event after the end of the financial Year
HSBC Global Consumer Opportunities Fund (HGCOF) has been merged with HSBC Asia Pacific (Ex Japan) Dividend Yield Fund with effect from May 13, 2021. Therefore, HGCOF has been ceased to exist from the aforesaid date.
14. acknoWledgementS
The Trustees wish to thank the Unit holders of the Schemes for their support throughout the year and also thank the Government of India, the Securities and Exchange Board of India (SEBI), the Reserve Bank of India (RBI) and the Association of Mutual Funds in India (AMFI) for the guidance provided by them. The Trustees also appreciate the services provided by the Registrar and Transfer Agent, Fund Accountant, Custodian, Bankers, Distributors and Brokers. The guidance and services provided by the Auditors and advocates and the ebullience, sincerity and dedication of the employees of HSBC Asset Management (India) Private Limited is also appreciated.
The Trustees look forward to the continued support of everyone.
For and on behalf of the Board of Trustees of HSBC Mutual Fund
Sd/-
Trustee
Mumbai
July 20, 2021.
Trustees’ ReportFor the year ended March 31, 2021 (Contd...)
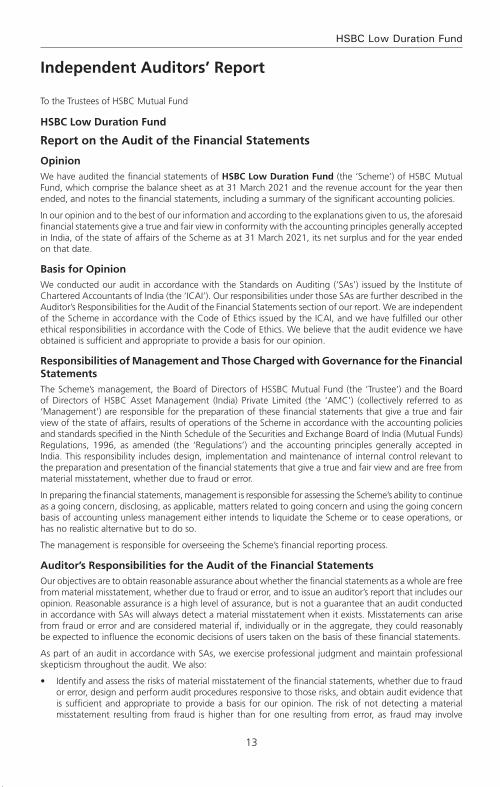
13
HSBC Low Duration Fund
To the Trustees of HSBC Mutual Fund
hSBc low duration fund
Report on the Audit of the Financial Statements
OpinionWe have audited the financial statements of hSBc low duration fund (the ‘Scheme’) of HSBC Mutual Fund, which comprise the balance sheet as at 31 March 2021 and the revenue account for the year then ended, and notes to the financial statements, including a summary of the significant accounting policies.
In our opinion and to the best of our information and according to the explanations given to us, the aforesaid financial statements give a true and fair view in conformity with the accounting principles generally accepted in India, of the state of affairs of the Scheme as at 31 March 2021, its net surplus and for the year ended on that date.
Basis for opinionWe conducted our audit in accordance with the Standards on Auditing (‘SAs’) issued by the Institute of Chartered Accountants of India (the ‘ICAI’). Our responsibilities under those SAs are further described in the Auditor’s Responsibilities for the Audit of the Financial Statements section of our report. We are independent of the Scheme in accordance with the Code of Ethics issued by the ICAI, and we have fulfilled our other ethical responsibilities in accordance with the Code of Ethics. We believe that the audit evidence we have obtained is sufficient and appropriate to provide a basis for our opinion.
responsibilities of management and those charged with governance for the financial StatementsThe Scheme’s management, the Board of Directors of HSSBC Mutual Fund (the ‘Trustee’) and the Board of Directors of HSBC Asset Management (India) Private Limited (the ‘AMC’) (collectively referred to as ‘Management’) are responsible for the preparation of these financial statements that give a true and fair view of the state of affairs, results of operations of the Scheme in accordance with the accounting policies and standards specified in the Ninth Schedule of the Securities and Exchange Board of India (Mutual Funds) Regulations, 1996, as amended (the ‘Regulations’) and the accounting principles generally accepted in India. This responsibility includes design, implementation and maintenance of internal control relevant to the preparation and presentation of the financial statements that give a true and fair view and are free from material misstatement, whether due to fraud or error.
In preparing the financial statements, management is responsible for assessing the Scheme’s ability to continue as a going concern, disclosing, as applicable, matters related to going concern and using the going concern basis of accounting unless management either intends to liquidate the Scheme or to cease operations, or has no realistic alternative but to do so.
The management is responsible for overseeing the Scheme’s financial reporting process.
auditor’s responsibilities for the audit of the financial StatementsOur objectives are to obtain reasonable assurance about whether the financial statements as a whole are free from material misstatement, whether due to fraud or error, and to issue an auditor’s report that includes our opinion. Reasonable assurance is a high level of assurance, but is not a guarantee that an audit conducted in accordance with SAs will always detect a material misstatement when it exists. Misstatements can arise from fraud or error and are considered material if, individually or in the aggregate, they could reasonably be expected to influence the economic decisions of users taken on the basis of these financial statements.
As part of an audit in accordance with SAs, we exercise professional judgment and maintain professional skepticism throughout the audit. We also:
• Identifyandassesstherisksofmaterialmisstatementofthefinancialstatements,whetherduetofraudor error, design and perform audit procedures responsive to those risks, and obtain audit evidence that is sufficient and appropriate to provide a basis for our opinion. The risk of not detecting a material misstatement resulting from fraud is higher than for one resulting from error, as fraud may involve
Independent Auditors’ Report
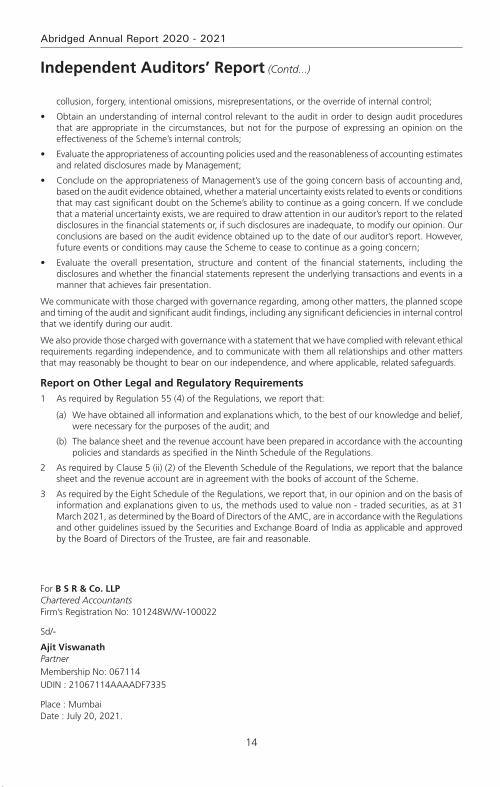
14
Abridged Annual Report 2020 - 2021
Independent Auditors’ Report (Contd...)
collusion, forgery, intentional omissions, misrepresentations, or the override of internal control;
• Obtainanunderstandingofinternalcontrolrelevanttotheauditinordertodesignauditproceduresthat are appropriate in the circumstances, but not for the purpose of expressing an opinion on the effectiveness of the Scheme’s internal controls;
• Evaluatetheappropriatenessofaccountingpoliciesusedandthereasonablenessofaccountingestimatesand related disclosures made by Management;
• ConcludeontheappropriatenessofManagement’suseofthegoingconcernbasisofaccountingand,based on the audit evidence obtained, whether a material uncertainty exists related to events or conditions that may cast significant doubt on the Scheme’s ability to continue as a going concern. If we conclude that a material uncertainty exists, we are required to draw attention in our auditor’s report to the related disclosures in the financial statements or, if such disclosures are inadequate, to modify our opinion. Our conclusions are based on the audit evidence obtained up to the date of our auditor’s report. However, future events or conditions may cause the Scheme to cease to continue as a going concern;
• Evaluate the overall presentation, structure and content of the financial statements, including thedisclosures and whether the financial statements represent the underlying transactions and events in a manner that achieves fair presentation.
We communicate with those charged with governance regarding, among other matters, the planned scope and timing of the audit and significant audit findings, including any significant deficiencies in internal control that we identify during our audit.
We also provide those charged with governance with a statement that we have complied with relevant ethical requirements regarding independence, and to communicate with them all relationships and other matters that may reasonably be thought to bear on our independence, and where applicable, related safeguards.
report on other legal and regulatory requirements 1 As required by Regulation 55 (4) of the Regulations, we report that:
(a) We have obtained all information and explanations which, to the best of our knowledge and belief, were necessary for the purposes of the audit; and
(b) The balance sheet and the revenue account have been prepared in accordance with the accounting policies and standards as specified in the Ninth Schedule of the Regulations.
2 As required by Clause 5 (ii) (2) of the Eleventh Schedule of the Regulations, we report that the balance sheet and the revenue account are in agreement with the books of account of the Scheme.
3 As required by the Eight Schedule of the Regulations, we report that, in our opinion and on the basis of information and explanations given to us, the methods used to value non - traded securities, as at 31 March 2021, as determined by the Board of Directors of the AMC, are in accordance with the Regulations and other guidelines issued by the Securities and Exchange Board of India as applicable and approved by the Board of Directors of the Trustee, are fair and reasonable.
For B S R & Co. LLP Chartered Accountants Firm’s Registration No: 101248W/W-100022
Sd/-
Ajit Viswanath PartnerMembership No: 067114UDIN : 21067114AAAADF7335
Place : Mumbai Date : July 20, 2021.

15
HSBC Low Duration Fund
Rs. in Lakhs
As at March 31, 2021
As at March 31, 2020
LIABILITIES1 Unit Capital 8,169.67 11,007.112 Reserves & Surplus2.1 Unit Premium Reserves (66.50) (109.39)2.2 Unrealised Appreciation Reserve 1.41 48.572.3 Other Reserves 4,346.96 1,882.643 Loans & Borrowings – –4 Current Liabilities & Provisions4.1 Provision for Doubtful Income/Deposits – –4.2 Other Current Liabilities & Provisions 44.65 105.42
TOTAL 12,496.19 12,934.35
ASSETS1 Investments1.1 Listed Securities:1.1.1 Equity Shares – –1.1.2 Preference Shares – –1.1.3 Equity Linked Debentures – –1.1.4 Other Debentures & Bonds 9,224.40 6,067.221.1.5 Securitised Debt Securities – –1.2 Securities Awaited Listing:1.2.1 Equity Shares – –1.2.2 Preference Shares – –1.2.3 Equity Linked Debentures – –1.2.4 Other Debentures & Bonds – –1.2.5 Securitised Debt Securities – –1.3 Unlisted Securities:1.3.1 Equity Shares – –1.3.2 Preference Shares – –1.3.3 Equity Linked Debentures – –1.3.4 Other Debentures & Bonds – –1.3.5 Securitised Debt Securities – –1.4 Government Securities 1,046.51 –1.5 Treasury Bills – –1.6 Commercial Paper – –1.7 Certificate of Deposits 984.84 4,306.771.8 Bill Rediscounting – –1.9 Units of Domestic Mutual Fund – –1.10 Foreign Securities – –
Total Investments 11,255.75 10,373.992 Deposits 2.47 1.503 Other Current Assets3.1 Cash & Bank Balance 0.43 0.463.2 TREPS / Reverse Repo Lending 887.51 1,355.163.3 Others 350.03 1,203.244 Deferred Revenue Expenditure (to the extent not written off) – –
TOTAL 12,496.19 12,934.35
Notes to Accounts - Annexure I
Abridged Balance Sheet as at March 31, 2021

16
Abridged Annual Report 2020 - 2021
Abridged Revenue Account for the year ended March 31, 2021
Rs. in Lakhs
Current Year ended
March 31, 2021
Previous Year ended
March 31, 2020
1 INCOME1.1 Dividend – –1.2 Interest 740.11 1,547.901.3 Realised Gain / (Loss) on Foreign Exchange Transactions – –1.4 Realised Gains / (Losses) on Interscheme Sale of Investments – –1.5 Realised Gains / (Losses) on External Sale / Redemption of
Investments(2,890.69) 152.48
1.6 Realised Gains / (Losses) on Derivative Transactions – –1.7 Other Income 0.76 1.82
(A) (2,149.82) 1,702.20
2 EXPENSES2.1 Investment Management Fees 34.09 98.102.2 GST on Investment Management Fees 6.14 17.662.3 Transfer Agents Fees and Expenses 4.40 8.022.4 Custodian Fees 0.66 1.352.5 Trusteeship Fees 0.14 0.222.6 Commission to Agents 22.50 68.192.7 Marketing & Distribution Expenses 0.08 0.112.8 Audit Fees 0.27 0.292.9 Investor Education Expenses 2.45 4.382.10 Interest on Borrowing – –
2.11 Other Operating Expenses 1.47 2.23
(B) 72.20 200.55
3 NET REALISED GAINS / (LOSSES) FOR THE YEAR (C = A - B) (2,222.02) 1,501.65
4 Change in Unrealised Depreciation in Value of Investments (Refer Note 11) (D) 2,773.80 (2,779.26)
5 NET GAINS / (LOSSES) FOR THE YEAR (E = C + D) 551.78 (1,277.61)
6 Change in Unrealised Appreciation in Value of Investments (F) (47.16) 5.61
7 NET SURPLUS / (DEFICIT) FOR THE YEAR (G = E + F) 504.62 (1,272.00)
7.1 Add : Balance Transfer from Unrealised Appreciation Reserve 47.16 –7.2 Less : Balance Transfer to Unrealised Appreciation Reserve – (5.61)7.3 Add / (Less) : Equalisation 1,912.64 (2,708.02)7.4 Transfer from Reserve Fund 1,882.64 6,083.51
7.5 Transfer from Unit Premium Reserve – –
8 Total 4,347.06 2,097.889 Dividend Appropriation9.1 Income Distributed during the Year (0.10) (152.20)
9.2 Tax on Income Distributed during the Year – (63.04)
10 Retained Surplus / (Deficit) Carried Forward to Balance Sheet 4,346.96 1,882.64
Notes to Accounts - Annexure I

17
HSBC Low Duration Fund
Key Statistics for the year ended March 31, 2021
Current Year ended
March 31, 2021
Previous Year ended
March 31, 2020
1 NAV per unit (Rs.):
OpenRegular Growth Option # 22.6722 23.6148
Regular Daily IDCW Option # 9.4999 10.0070
Regular Weekly IDCW Option # 9.5163 10.0282Institutional Growth Option ^ 15.7429 16.3481
Institutional Daily IDCW Option ^ 9.5697 10.0557
Institutional Weekly IDCW Option ^ 9.5828 10.0532
Institutional Monthly IDCW Option ^ 9.6637 10.1577
Institutional Plus Daily IDCW Option – 18.6771
Direct Plan - Growth Option 16.6003 17.1004
Direct Plan - Daily IDCW Option 9.6644 10.0889
Direct Plan - Weekly IDCW Option 9.6749 10.1029
Direct Plan - Monthly IDCW Option 9.9240 10.3626
High
Regular Growth Option # 23.2443 23.8736
Regular Daily IDCW Option # 9.7396 10.0033
Regular Weekly IDCW Option # 9.7564 10.0405
Institutional Growth Option ^ 16.1886 16.5359
Institutional Daily IDCW Option ^ 9.8407 10.0519
Institutional Weekly IDCW Option ^ 9.8543 10.0684
Institutional Monthly IDCW Option ^ 9.9373 10.1962
Institutional Plus Daily IDCW Option – 18.9165
Direct Plan - Growth Option 17.2111 17.3211
Direct Plan - Daily IDCW Option 10.0179 10.0846
Direct Plan - Weekly IDCW Option 10.0287 10.1160
Direct Plan - Monthly IDCW Option 10.0665 10.4078
Low
Regular Growth Option # 20.5839 21.6293
Regular Daily IDCW Option # 8.6249 9.0629
Regular Weekly IDCW Option # 8.6397 9.0786
Institutional Growth Option ^ 14.2977 14.9815
Institutional Daily IDCW Option ^ 8.6912 9.1070
Institutional Weekly IDCW Option ^ 8.7031 9.1194
Institutional Monthly IDCW Option ^ 8.7766 9.1963
Institutional Plus Daily IDCW Option – 17.1387
Direct Plan - Growth Option 15.0901 15.6933
Direct Plan - Daily IDCW Option 8.7851 9.1368
Direct Plan - Weekly IDCW Option 8.7946 9.1467
Direct Plan - Monthly IDCW Option 9.0211 9.3822

18
Abridged Annual Report 2020 - 2021
Current Year ended
March 31, 2021
Previous Year ended
March 31, 2020
End
Regular Growth Option # 23.2443 22.6722
Regular Daily IDCW Option # 9.7396 9.4999
Regular Weekly IDCW Option # 9.7564 9.5163
Institutional Growth Option ^ 16.1886 15.7429
Institutional Daily IDCW Option ^ 9.8407 9.5697
Institutional Weekly IDCW Option ^ 9.8543 9.5828
Institutional Monthly IDCW Option ^ 9.9373 9.6637
Institutional Plus Daily IDCW Option – –
Direct Plan - Growth Option 17.2111 16.6003
Direct Plan - Daily IDCW Option 10.0179 9.6644
Direct Plan - Weekly IDCW Option 10.0287 9.6749
Direct Plan - Monthly IDCW Option 10.0158 9.9240
2. Closing Assets Under Management (Rs. in Lakhs)
End 11,454 12,830
Average (AAuM)1 12,240 21,916
3. Gross income as % of AAuM2 -17.56% 7.77%
4. Expense Ratio: a. total expense as % of aaum (including gSt on
management fees) (planwise)
Regular Growth Option # 1.32% 1.32%
Institutional Growth Option ^ 1.02% 1.02%
Institutional Plus Growth Option NA 0.27%
Direct Plan - Growth Option 0.20% 0.22%
b. Management Fee as % of AAuM (planwise)
Regular Growth Option # 0.12% 0.13%
Institutional Growth Option ^ 0.53% 0.51%
Institutional Plus Growth Option NA 0.10%
Direct Plan - Growth Option 0.10% 0.12%
5. Net Income as a percentage of AAuM3 -18.15% 6.85%
6. Portfolio turnover ratio4 – –
7. Total Dividend per unit distributed during the year (planwise)
Retail
Regular Daily IDCW Option # – 0.0812
Regular Weekly IDCW Option # – 0.0841
Institutional Daily IDCW Option ^ – 0.0855
Institutional Weekly IDCW Option ^ – 0.0738
Institutional Monthly IDCW Option ^ – 0.0888
Direct Plan - Daily IDCW Option – 0.0963
Direct Plan - Weekly IDCW Option – 0.0985
Direct Plan - Monthly IDCW Option 0.2679 0.1009
Key Statistics for the year ended March 31, 2021 (Contd...)
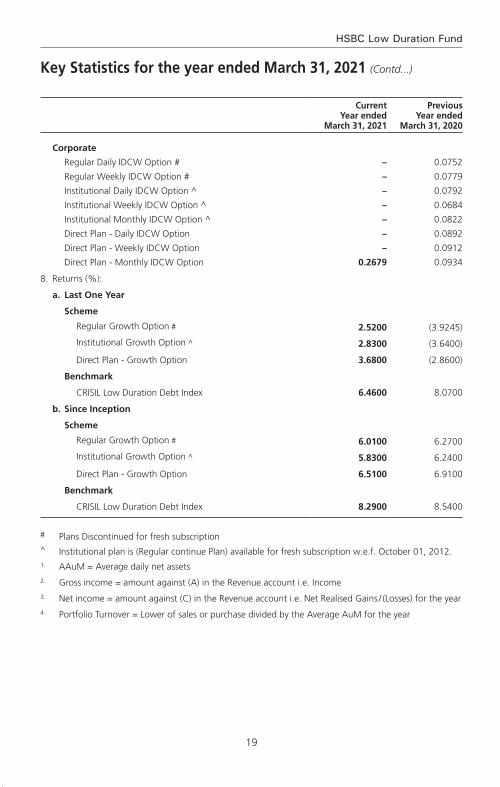
19
HSBC Low Duration Fund
Key Statistics for the year ended March 31, 2021 (Contd...)
Current Year ended
March 31, 2021
Previous Year ended
March 31, 2020
Corporate
Regular Daily IDCW Option # – 0.0752
Regular Weekly IDCW Option # – 0.0779
Institutional Daily IDCW Option ^ – 0.0792
Institutional Weekly IDCW Option ^ – 0.0684
Institutional Monthly IDCW Option ^ – 0.0822
Direct Plan - Daily IDCW Option – 0.0892
Direct Plan - Weekly IDCW Option – 0.0912
Direct Plan - Monthly IDCW Option 0.2679 0.0934
8. Returns (%):
a. Last One Year
Scheme
Regular Growth Option # 2.5200 (3.9245)
Institutional Growth Option ^ 2.8300 (3.6400)
Direct Plan - Growth Option 3.6800 (2.8600)
Benchmark
CRISIL Low Duration Debt Index 6.4600 8.0700
b. Since Inception
Scheme
Regular Growth Option # 6.0100 6.2700
Institutional Growth Option ^ 5.8300 6.2400
Direct Plan - Growth Option 6.5100 6.9100
Benchmark
CRISIL Low Duration Debt Index 8.2900 8.5400
# Plans Discontinued for fresh subscription^ Institutional plan is (Regular continue Plan) available for fresh subscription w.e.f. October 01, 2012.1. AAuM = Average daily net assets2. Gross income = amount against (A) in the Revenue account i.e. Income3. Net income = amount against (C) in the Revenue account i.e. Net Realised Gains / (Losses) for the year4. Portfolio Turnover = Lower of sales or purchase divided by the Average AuM for the year
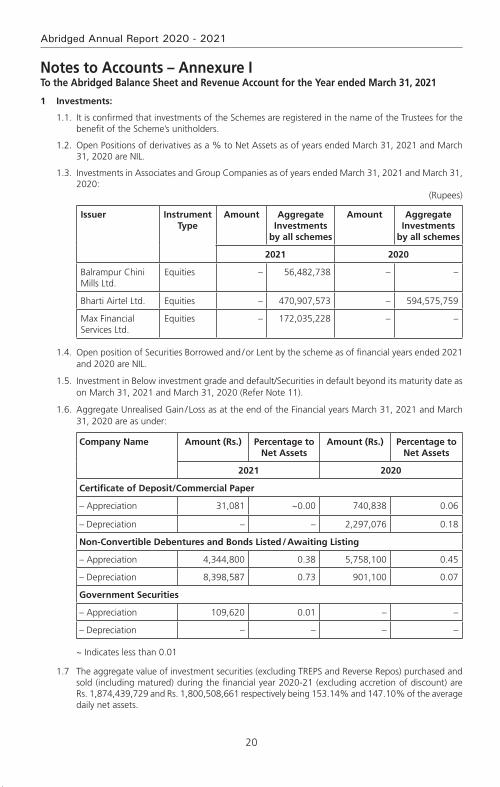
20
Abridged Annual Report 2020 - 2021
Notes to Accounts – Annexure ITo the Abridged Balance Sheet and Revenue Account for the Year ended March 31, 2021
1 Investments:
1.1. It is confirmed that investments of the Schemes are registered in the name of the Trustees for the benefit of the Scheme’s unitholders.
1.2. Open Positions of derivatives as a % to Net Assets as of years ended March 31, 2021 and March 31, 2020 are NIL.
1.3. Investments in Associates and Group Companies as of years ended March 31, 2021 and March 31, 2020:
(Rupees)
Issuer Instrument Type
Amount Aggregate Investments
by all schemes
Amount Aggregate Investments
by all schemes
2021 2020
Balrampur Chini Mills Ltd.
Equities – 56,482,738 – –
Bharti Airtel Ltd. Equities – 470,907,573 – 594,575,759
Max Financial Services Ltd.
Equities – 172,035,228 – –
1.4. Open position of Securities Borrowed and / or Lent by the scheme as of financial years ended 2021 and 2020 are NIL.
1.5. Investment in Below investment grade and default/Securities in default beyond its maturity date as on March 31, 2021 and March 31, 2020 (Refer Note 11).
1.6. Aggregate Unrealised Gain / Loss as at the end of the Financial years March 31, 2021 and March 31, 2020 are as under:
Company Name Amount (Rs.) Percentage to Net Assets
Amount (Rs.) Percentage to Net Assets
2021 2020
Certificate of Deposit/Commercial Paper
– Appreciation 31,081 ~0.00 740,838 0.06
– Depreciation – – 2,297,076 0.18
Non-Convertible Debentures and Bonds Listed / Awaiting Listing
– Appreciation 4,344,800 0.38 5,758,100 0.45
– Depreciation 8,398,587 0.73 901,100 0.07
Government Securities
– Appreciation 109,620 0.01 – –
– Depreciation – – – –
~ Indicates less than 0.01
1.7 The aggregate value of investment securities (excluding TREPS and Reverse Repos) purchased and sold (including matured) during the financial year 2020-21 (excluding accretion of discount) are Rs. 1,874,439,729 and Rs. 1,800,508,661 respectively being 153.14% and 147.10% of the average daily net assets.

21
HSBC Low Duration Fund
The aggregate value of investment securities (excluding TREPS and Reverse Repos) purchased and sold (including matured) during the financial year 2019-20 (excluding accretion of discount) are Rs. 3,396,186,467 and Rs. 5,696,476,500 respectively being 154.97% and 259.93% of the average daily net assets.
1.8. Non-Traded securities in the portfolio :
Aggregate Value of Equity, Debt & Money Market Instruments and their percentages to Net assets are as under :
Security Category Fair Value (Rupees)
% to Net Assets
Fair Value (Rupees)
% to Net Assets
2021 2020
Debt Instruments 714,778,700 62.40% 606,721,900 47.29%
Money market Instruments
98,483,500 8.60% 282,992,550 22.06%
Total 813,262,200 71.00% 889,714,450 69.35%
2 Disclosure Under Regulation 25(8) of the Securities and Exchange Board of India (Mutual Funds) Regulations, 1996 as amended.
Details of amounts paid to associates in terms of Regulation 25 (8) are as follows :
Commission paid to Sponsor / AMC and its associates / related parties / group companies
Name of Sponsor/AMC and its associates/related parties/group companies
Nature of Association / Nature of
Relation
Period Covered
Business Given [Rs. In Crores]
% of Total Business
received by the Fund
Commission paid [Rs.]
% of Total commission paid by the
Fund
The Hongkong and Shanghai Banking Corporation Limited
Associate 2020-2021 39.59 23.77 1,087,384 53.38
Name of Sponsor/AMC and its associates/related parties/group companies
Nature of Association / Nature of
Relation
Period Covered
Business Given [Rs. In Crores]
% of Total Business
received by the Fund
Commission paid [Rs.]
% of Total commission paid by the
Fund
The Hongkong and Shanghai Banking Corporation Limited
Associate 2019-2020 21.87 19.81 4,411,719 69.13
Brokerage paid to Sponsor / AMC and its associates / related parties / group companies is NIL. (Previous year also NIL).
The brokerage paid was at rates similar to those offered to other distributors. And the Commission / Brokerage paid to related party includes both up front and trail and hence not comparable with the % of business brought and % of commission paid.
Further, The Hongkong and Shanghai Banking Corporation Limited, an associate of the Sponsor, is on the panel of bankers with whom HSBC Mutual Fund places money on fixed deposits and enters into reverse repo transactions from time to time at competitive rates.
(i) Any underwriting obligations undertaken by the schemes of the mutual funds with respect to issue of securities associate companies - Nil (Previous year also Nil).
Notes to Accounts – Annexure I (Contd...)To the Abridged Balance Sheet and Revenue Account for the Year ended March 31, 2021
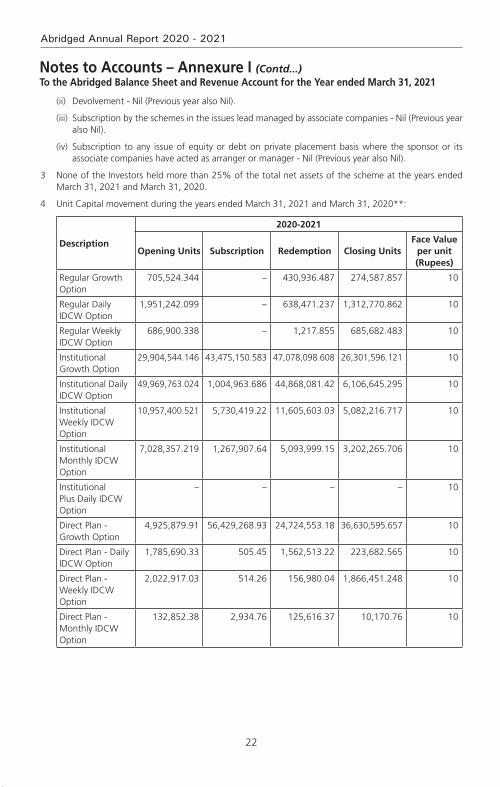
22
Abridged Annual Report 2020 - 2021
(ii) Devolvement - Nil (Previous year also Nil).
(iii) Subscription by the schemes in the issues lead managed by associate companies - Nil (Previous year also Nil).
(iv) Subscription to any issue of equity or debt on private placement basis where the sponsor or its associate companies have acted as arranger or manager - Nil (Previous year also Nil).
3 None of the Investors held more than 25% of the total net assets of the scheme at the years ended March 31, 2021 and March 31, 2020.
4 Unit Capital movement during the years ended March 31, 2021 and March 31, 2020**:
Description
2020-2021
Opening Units Subscription Redemption Closing UnitsFace Value
per unit (Rupees)
Regular Growth Option
705,524.344 – 430,936.487 274,587.857 10
Regular Daily IDCW Option
1,951,242.099 – 638,471.237 1,312,770.862 10
Regular Weekly IDCW Option
686,900.338 – 1,217.855 685,682.483 10
Institutional Growth Option
29,904,544.146 43,475,150.583 47,078,098.608 26,301,596.121 10
Institutional Daily IDCW Option
49,969,763.024 1,004,963.686 44,868,081.42 6,106,645.295 10
Institutional Weekly IDCW Option
10,957,400.521 5,730,419.22 11,605,603.03 5,082,216.717 10
Institutional Monthly IDCW Option
7,028,357.219 1,267,907.64 5,093,999.15 3,202,265.706 10
Institutional Plus Daily IDCW Option
– – – – 10
Direct Plan - Growth Option
4,925,879.91 56,429,268.93 24,724,553.18 36,630,595.657 10
Direct Plan - Daily IDCW Option
1,785,690.33 505.45 1,562,513.22 223,682.565 10
Direct Plan - Weekly IDCW Option
2,022,917.03 514.26 156,980.04 1,866,451.248 10
Direct Plan - Monthly IDCW Option
132,852.38 2,934.76 125,616.37 10,170.76 10
Notes to Accounts – Annexure I (Contd...)To the Abridged Balance Sheet and Revenue Account for the Year ended March 31, 2021
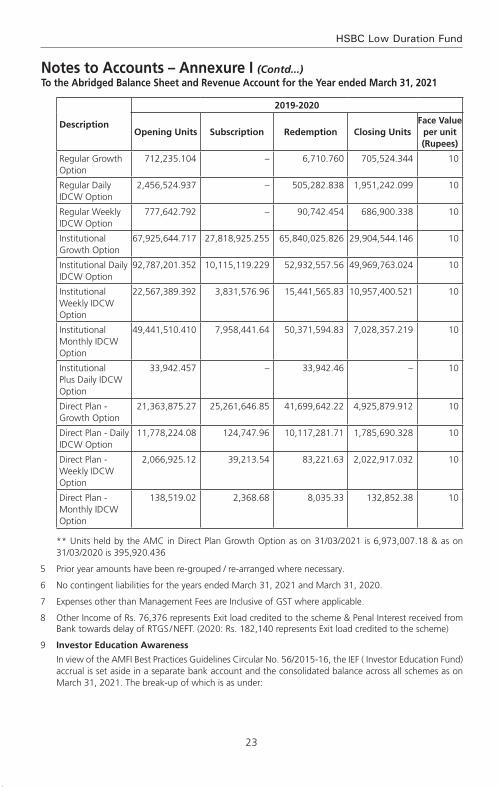
23
HSBC Low Duration Fund
Notes to Accounts – Annexure I (Contd...)To the Abridged Balance Sheet and Revenue Account for the Year ended March 31, 2021
Description
2019-2020
Opening Units Subscription Redemption Closing UnitsFace Value
per unit (Rupees)
Regular Growth Option
712,235.104 – 6,710.760 705,524.344 10
Regular Daily IDCW Option
2,456,524.937 – 505,282.838 1,951,242.099 10
Regular Weekly IDCW Option
777,642.792 – 90,742.454 686,900.338 10
Institutional Growth Option
67,925,644.717 27,818,925.255 65,840,025.826 29,904,544.146 10
Institutional Daily IDCW Option
92,787,201.352 10,115,119.229 52,932,557.56 49,969,763.024 10
Institutional Weekly IDCW Option
22,567,389.392 3,831,576.96 15,441,565.83 10,957,400.521 10
Institutional Monthly IDCW Option
49,441,510.410 7,958,441.64 50,371,594.83 7,028,357.219 10
Institutional Plus Daily IDCW Option
33,942.457 – 33,942.46 – 10
Direct Plan - Growth Option
21,363,875.27 25,261,646.85 41,699,642.22 4,925,879.912 10
Direct Plan - Daily IDCW Option
11,778,224.08 124,747.96 10,117,281.71 1,785,690.328 10
Direct Plan - Weekly IDCW Option
2,066,925.12 39,213.54 83,221.63 2,022,917.032 10
Direct Plan - Monthly IDCW Option
138,519.02 2,368.68 8,035.33 132,852.38 10
** Units held by the AMC in Direct Plan Growth Option as on 31/03/2021 is 6,973,007.18 & as on 31/03/2020 is 395,920.436
5 Prior year amounts have been re-grouped / re-arranged where necessary.
6 No contingent liabilities for the years ended March 31, 2021 and March 31, 2020.
7 Expenses other than Management Fees are Inclusive of GST where applicable.
8 Other Income of Rs. 76,376 represents Exit load credited to the scheme & Penal Interest received from Bank towards delay of RTGS / NEFT. (2020: Rs. 182,140 represents Exit load credited to the scheme)
9 Investor Education Awareness
In view of the AMFI Best Practices Guidelines Circular No. 56/2015-16, the IEF ( Investor Education Fund) accrual is set aside in a separate bank account and the consolidated balance across all schemes as on March 31, 2021. The break-up of which is as under:
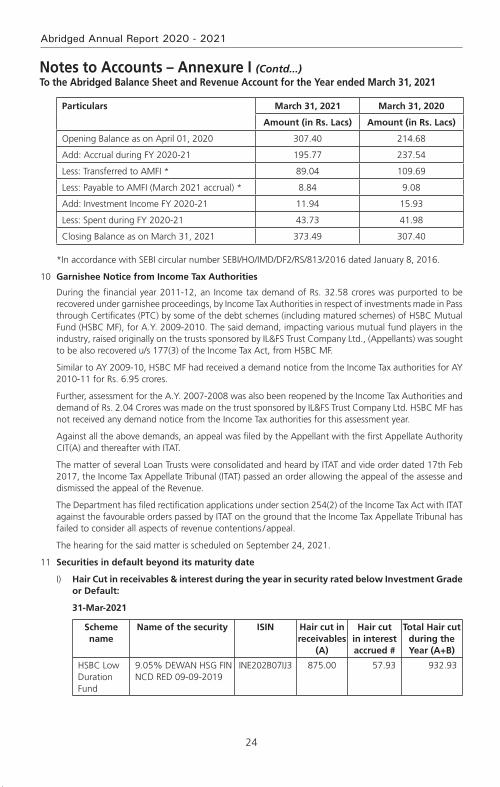
24
Abridged Annual Report 2020 - 2021
Particulars March 31, 2021 March 31, 2020
Amount (in Rs. Lacs) Amount (in Rs. Lacs)
Opening Balance as on April 01, 2020 307.40 214.68
Add: Accrual during FY 2020-21 195.77 237.54
Less: Transferred to AMFI * 89.04 109.69
Less: Payable to AMFI (March 2021 accrual) * 8.84 9.08
Add: Investment Income FY 2020-21 11.94 15.93
Less: Spent during FY 2020-21 43.73 41.98
Closing Balance as on March 31, 2021 373.49 307.40
*In accordance with SEBI circular number SEBI/HO/IMD/DF2/RS/813/2016 dated January 8, 2016.
10 Garnishee Notice from Income Tax Authorities
During the financial year 2011-12, an Income tax demand of Rs. 32.58 crores was purported to be recovered under garnishee proceedings, by Income Tax Authorities in respect of investments made in Pass through Certificates (PTC) by some of the debt schemes (including matured schemes) of HSBC Mutual Fund (HSBC MF), for A.Y. 2009-2010. The said demand, impacting various mutual fund players in the industry, raised originally on the trusts sponsored by IL&FS Trust Company Ltd., (Appellants) was sought to be also recovered u/s 177(3) of the Income Tax Act, from HSBC MF.
Similar to AY 2009-10, HSBC MF had received a demand notice from the Income Tax authorities for AY 2010-11 for Rs. 6.95 crores.
Further, assessment for the A.Y. 2007-2008 was also been reopened by the Income Tax Authorities and demand of Rs. 2.04 Crores was made on the trust sponsored by IL&FS Trust Company Ltd. HSBC MF has not received any demand notice from the Income Tax authorities for this assessment year.
Against all the above demands, an appeal was filed by the Appellant with the first Appellate Authority CIT(A) and thereafter with ITAT.
The matter of several Loan Trusts were consolidated and heard by ITAT and vide order dated 17th Feb 2017, the Income Tax Appellate Tribunal (ITAT) passed an order allowing the appeal of the assesse and dismissed the appeal of the Revenue.
The Department has filed rectification applications under section 254(2) of the Income Tax Act with ITAT against the favourable orders passed by ITAT on the ground that the Income Tax Appellate Tribunal has failed to consider all aspects of revenue contentions / appeal.
The hearing for the said matter is scheduled on September 24, 2021.
11 Securities in default beyond its maturity date
I) Hair Cut in receivables & interest during the year in security rated below Investment Grade or Default:
31-Mar-2021
Scheme name
Name of the security ISIN Hair cut in receivables
(A)
Hair cut in interest accrued #
Total Hair cut during the Year (A+B)
HSBC Low Duration Fund
9.05% DEWAN HSG FIN NCD RED 09-09-2019
INE202B07IJ3 875.00 57.93 932.93
Notes to Accounts – Annexure I (Contd...)To the Abridged Balance Sheet and Revenue Account for the Year ended March 31, 2021
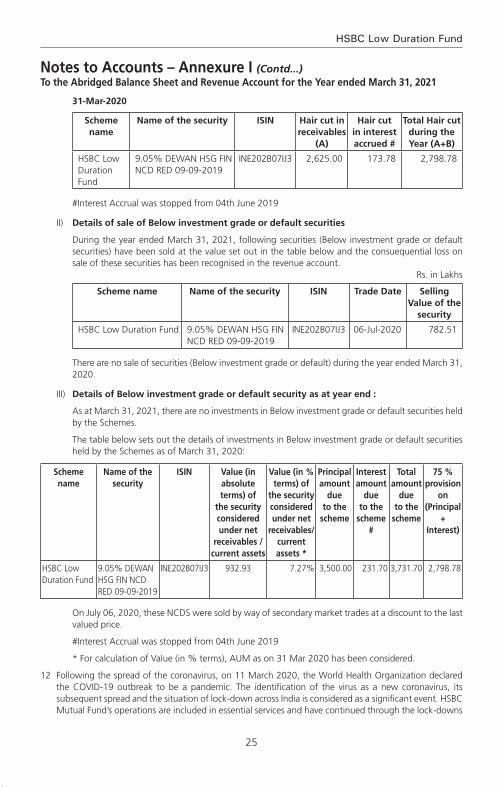
25
HSBC Low Duration Fund
Notes to Accounts – Annexure I (Contd...)To the Abridged Balance Sheet and Revenue Account for the Year ended March 31, 2021
31-Mar-2020
Scheme name
Name of the security ISIN Hair cut in receivables
(A)
Hair cut in interest accrued #
Total Hair cut during the Year (A+B)
HSBC Low Duration Fund
9.05% DEWAN HSG FIN NCD RED 09-09-2019
INE202B07IJ3 2,625.00 173.78 2,798.78
#Interest Accrual was stopped from 04th June 2019
II) Details of sale of Below investment grade or default securities
During the year ended March 31, 2021, following securities (Below investment grade or default securities) have been sold at the value set out in the table below and the consuequential loss on sale of these securities has been recognised in the revenue account.
Rs. in Lakhs
Scheme name Name of the security ISIN Trade Date Selling Value of the
security
HSBC Low Duration Fund 9.05% DEWAN HSG FIN NCD RED 09-09-2019
INE202B07IJ3 06-Jul-2020 782.51
There are no sale of securities (Below investment grade or default) during the year ended March 31, 2020.
III) Details of Below investment grade or default security as at year end :
As at March 31, 2021, there are no investments in Below investment grade or default securities held by the Schemes.
The table below sets out the details of investments in Below investment grade or default securities held by the Schemes as of March 31, 2020:
Scheme name
Name of the security
ISIN Value (in absolute terms) of
the security considered under net
receivables /current assets
Value (in % terms) of
the security considered under net
receivables/ current assets *
Principal amount
due to the
scheme
Interest amount
due to the
scheme #
Total amount
due to the
scheme
75 % provision
on (Principal
+ Interest)
HSBC Low Duration Fund
9.05% DEWAN HSG FIN NCD RED 09-09-2019
INE202B07IJ3 932.93 7.27% 3,500.00 231.70 3,731.70 2,798.78
On July 06, 2020, these NCDS were sold by way of secondary market trades at a discount to the last valued price.
#Interest Accrual was stopped from 04th June 2019
* For calculation of Value (in % terms), AUM as on 31 Mar 2020 has been considered.
12 Following the spread of the coronavirus, on 11 March 2020, the World Health Organization declared the COVID-19 outbreak to be a pandemic. The identification of the virus as a new coronavirus, its subsequent spread and the situation of lock-down across India is considered as a significant event. HSBC Mutual Fund’s operations are included in essential services and have continued through the lock-downs

26
Abridged Annual Report 2020 - 2021
declared by the Government. Service providers like the Registrar and Transfer Agent, Custodian and Fund Accountant have carried out extensive arrangements to address business needs and continuity of operations. As on the date of signing of these financial statements, Management believes that it has taken into account, all the possible impact of known events arising from COVID-19 pandemic in the preparation of the financial statements and there appears to be no uncertainties relating to the going concern of any of the Schemes of the Fund for a foreseeable future. However, COVID-19 pandemic is an ongoing situation and any estimate of its impact is dependent on the future intensity, spread and duration of the situation. The Management will continue to closely monitor the situation for any material changes which may impact the Schemes of the Fund.
13 Pursuant to SEBI Circular No. SEBI/HO/IMD/DF3/CIR/P/2020/194 dated October 05, 2020, the nomenclature of ‘Dividend Option’ under all the schemes of HSBC Mutual Fund has been revised to ‘Income Distribution cum Capital Withdrawal Option’ (IDCW), with effect from April 01, 2021.
14 Disclosure of Risk-o-meter
Scheme Name Risk-o-meter level as on December
31,2020^
Risk-o-meter level at end of the financial year
Number of changes in Risk-o-meter during the financial year^
HSBC Low Duration Fund Low to Moderate Low to Moderate 0
^From the effective date (i.e. January 01, 2021) of SEBI circular no. SEBI/HO/IMD/DF3/CIR/P/2020/197 dated October 05, 2020.
15 The Annual Accounts of the Schemes prepared in accordance with the accounting policies and standards specified in the Ninth Schedule of The Securities and Exchange Board of India (Mutual Funds) Regulations, 1996 has been approved by the Board of Directors of HSBC Asset Management (India) Private Limited and The Board of Trustees of HSBC Mutual Fund at their meetings held on July 19, 2021 and July 20, 2020 respectively. The audit report attached herewith refers to the said Annual Accounts. The aforesaid abridged accounts are an extract of the Annual Accounts and are prepared in accordance with SEBI Circular No. IMD/Cir8/132968/2008 dated July 24, 2008.
Notes to Accounts – Annexure I (Contd...)To the Abridged Balance Sheet and Revenue Account for the Year ended March 31, 2021

27
HSBC Low Duration Fund
Voting Policy and Procedures
In view of SEBI guidelines related to “Role of Mutual Funds in Corporate Governance of Public Listed Companies”, HSBC AMC has formulated its “Policy for Proxy Voting in Public Listed Companies”. The said policy is available on our website and the details of actual exercise of proxy votes, the summary of votes casted and the auditor’s certificate for the Financial Year 2020 – 21 is forming part of our full Annual Report for the Financial Year 2020 – 21 which is uploaded on our website at http://www.assetmanagement.hsbc.co.in

28
Abridged Annual Report 2020 - 2021
Statutory Details & Disclaimers
All the returns have been sourced from Mutual Funds India Explorer software. The performance of the schemes and the benchmark is calculated on a total return basis. This document has been prepared by HSBC Asset Management (India) Private Ltd (HSBC) for information purposes only and should not be construed as i) an offer or recommendation to buy or sell securities, commodities, currencies or other investments referred to herein; or ii) an offer to sell or a solicitation or an offer for purchase of any of the funds of HSBC Mutual Fund; or iii) an investment research or investment advice. All information contained in this document (including that sourced from third parties), is obtained from sources HSBC and the third party which HSBC believes to be reliable however, has not independently verified the same. The information and opinions contained within the document are based upon publicly available information and rates of taxation applicable (if any) at the time of publication, which are subject to change from time to time.
Expressions of opinion are those of HSBC only and are subject to change without notice. It does not have regard to specific investment objectives, financial situation and the particular needs of any specific person who may receive this document. Investors should seek personal and independent advice regarding the appropriateness of investing in any of the funds, securities, other investment or investment strategies that may have been discussed or referred herein and should understand that the views regarding future prospects may or may not be realized. In no event shall HSBC Mutual Fund / HSBC Asset management (India) Private Limited and / or its affiliates or any of their directors, trustees, officers and employees be liable for any direct, indirect, special, incidental or consequential damages arising out of the use of information / opinion herein. Neither this document nor the units of HSBC Mutual Fund have been registered in any jurisdiction. The distribution of this document in certain jurisdictions may be restricted or totally prohibited and accordingly, persons who come into possession of this document are required to inform themselves about, and to observe, any such restrictions.
mutual fund investments are subject to market risks, read all scheme related documents carefully.

i
HSBC Cash Fund
HSBC Cash FundAn Open ended Liquid Scheme
Abridged Annual Report 2020 - 2021

1
HSBC Cash Fund
Dear Investor,
The beginning of the last financial year now almost seems like a distant memory. COVID-19 was still a relatively unknown enemy and governments across the world were grappling with ways to control and mitigate the risks associated with it. Nationwide lockdowns were the norm and our markets both equity and fixed income reacted negatively leading to significant erosion of wealth. Within a short period of time markets bounced back. This confounded even the most astute market pundits. How is it possible that when GDP growth had slowed down, unemployment had risen, inflation was high could there be such sharp up move in equity indices. Whilst the reasons are well known about easy global liquidity, demand resurgence, cost cutting by corporates etc. perhaps its most important to remember that the markets are not a reflector but a predictor of economic activity.
At all times particularly during such volatile times it is important to go back to the basics. Why do you save, why do you invest, what goals would you like to achieve, how old are you, what is your risk appetite? The replies to these simple questions will help you determine your asset allocation. As an example when equity markets corrected sharply last year, investors who reviewed their asset allocation, stayed invested during the lows of the past year and were able to capture the rebound and have seen prime returns since then. The current market movement in all likelihood would have also led to some imbalances in your asset allocation. Do not ignore that and I strongly recommend that you do review this with your advisor to check whether re-balancing is required.
During this financial year we had three very successful new fund launches. The pandemic showed us a clear trend of dominant players becoming stronger and profit pool getting consolidated within a few companies. To capture this opportunity, we launched the HSBC Focused Equity Fund which garnered close to Rs. 520 crores. During the second half of 2020, in the fixed income space, 3 - 5 year duration range had a favourable investment scenario as RBI’s accommodative policy and surplus liquidity had reduced the returns at the very short end of the yield curve. There was a demand for an actively managed moderate duration strategy with better credit quality which we fulfilled by launching HSBC Corporate Bond Fund. It garnered over 700 crores. Our latest and first of its kind offering, HSBC Global Equity Climate Change Fund of Fund saw a stupendous response with over 8000 investors investing over Rs. 616 crores. This is an investment opportunity which goes beyond the rationale of simply generating investment returns and is the future of responsible investing.
We worked towards augmenting our digital capabilities by launching a few key enhancements to our online transaction platform. Being mindful of the movement restrictions in place, this year we focused on digitizing offline processes so that an investor need not need step out of her home for investing or availing any key services. While our interactive chatbot AskMe, eased service queries, our end-to-end digital KYC module enabled a first time Mutual Fund investor to invest in our funds without any paperwork. We listened to your feedback and digitized consolidation of folios and change of tax status which eliminated the need for you to physically visit our branches.
I am a strong believer in the India story and this story has just begun. The opportunity to invest in this high growth market is a very exciting opportunity. I do hope you share my enthusiasm and I ask that you continue to invest whilst reviewing your asset allocation at all times. As always thank you for your business. Stay safe.
Warm regards,
Ravi MenonChief Executive Officer,
HSBC Asset Management India

2
Abridged Annual Report 2020 - 2021
SPONSOR
HSBC Securities and Capital Markets (India) Private LimitedRegd. Office: 52/60, Mahatma Gandhi Road, Fort, Mumbai - 400 001.
TRUSTEE
Board of TrusteesOffice: 16, Veer Nariman Road, Fort, Mumbai 400 001.
ASSET MANAGEMENT COMPANY
HSBC Asset Management (India) Private LimitedCorp. & Regd. Office: 16, Veer Nariman Road, Fort, Mumbai 400 001.
CUSTODIAN
Standard Chartered Bank (SCB)Corp. & Regd. Office: Crescenzo, Securities Services, 3rd Floor, C-38/39, G-Block,Bandra Kurla Complex, Bandra East, Mumbai – 400051.
AUDITORS TO THE SCHEME
BSR & Co. LLPChartered Accountants
5th Floor, Lodha Excelus, Apollo Mills Compound, N. M. Joshi Marg, Mahalaxmi, Mumbai 400 011.
REGISTRAR & TRANSFER AGENTS
Computer Age Management Services Limited (CAMS)Unit: HSBC Mutual Fund ’C’ Block, 2nd Floor, Hanudev Info Park P. Ltd., SF No. 558/2, Udayampalayam Road, Nava India, Coimbatore - 641 028.
BOARD OF TRUSTEES
Ms. Jasmine Batliwalla - Chairperson
Mr. Nani Javeri - Trustee
Dr. T. C. Nair - Trustee
Mr. Pedro Bastos - Trustee
BOARD OF DIRECTORS
Mr. Dinesh Mittal - Director
Dr. Indu Shahani - Director
Mr. Ravi Menon - Director & Chief Executive Officer

3
HSBC Cash Fund
The Trustees of HSBC Mutual Fund (“Fund”) present the Nineteenth Annual Report and the audited abridged financial statements of the schemes of the Fund for the year ended March 31, 2021.
As at March 31, 2021, the Fund offered 37 schemes across asset classes to meet the varying investment needs of the investors. During FY 2020-2021, the Fund has launched various new products namely HSBC Corporate Bond Fund, HSBC Focused Equity Fund and HSBC Global Equity Climate Change Fund of Fund to fill the gaps in our product offering.
The Fund continues its focus on delivering consistent long term returns. The comments on the performance of the Scheme(s) is provided hereinafter. Dividends were declared under various schemes as per the provisions contained in the respective Scheme Information Documents after considering the distributable surplus available under the respective Schemes. Details of dividends declared can be viewed on our website at www.assetmanagement.hsbc.co.in.
1. Scheme Performance, future outlook and oPerationS of the SchemeS
a. operations and Performance of the Schemes
hSBc cash fund (hcf) (an open-ended liquid Scheme)
HCF seeks to provide reasonable returns, commensurate with low risk while providing a high level of liquidity, through a portfolio of money market and debt securities. However, there can be no assurance that the Scheme’s objective can be realized.
The net assets of HCF amounted to Rs. 3,368.55 crores as at March 31, 2021 as compared to Rs. 3,833.3 crores as at March 31, 2020. The entire net asset remains invested in debt and money market instruments including reverse repos / TREPS as at March 31, 2021.
HCF is governed by Internal Global Liquidity Guidelines which are conservative even when compared to SEBI guidelines. Also our investments were made in Long term AAA credits and with higher allocation to Treasury Bills. This led to marginal lower performance than the benchmark.
date of inception : 4 december, 2002
Simple annualized returns (%)
compounded annualized returns (%)
Scheme name & Benchmarks
last 7 days as on 31 march
2021
last 15 days as on 31 march
2021
last 30 days as on 31 march
2021
1 Year 3 Years 5 Years Since inception
HSBC Cash Fund – Growth 3.53 3.66 3.25 3.50 5.69 6.21 7.48
CRISIL Liquid Fund Index (Scheme Benchmark)
3.69 3.94 3.61 4.07 6.01 6.40 7.51
CRISIL 91 Day T-Bill Index (Standard Benchmark)
4.40 3.66 2.98 3.76 5.68 6.02 7.13
CRISIL 1 Year T-Bill Index)* (Standard Benchmark)
3.92 4.13 4.48 4.66 6.48 6.50 7.04
Rs. 10,000, if invested in HCF, would have become
10,007 10,015 10,027 10,350 11,813 13,518 20,386
Rs. 10,000, if invested in CRISIL Liquid Fund Index, would have become
10,007 10,016 10,027 10,407 11,921 13,639 20,442
Rs. 10,000, if invested in CRISIL 91 Day T-Bill Index, would have become
10,008 10,015 10,025 10,376 11,810 13,397 19,740
Rs. 10,000, if invested in CRISIL 1 Year T-Bill Index, would have become
10,008 10,017 10,037 10,466 12,112 13,734 19,572
Trustees’ ReportFor the year ended March 31, 2021
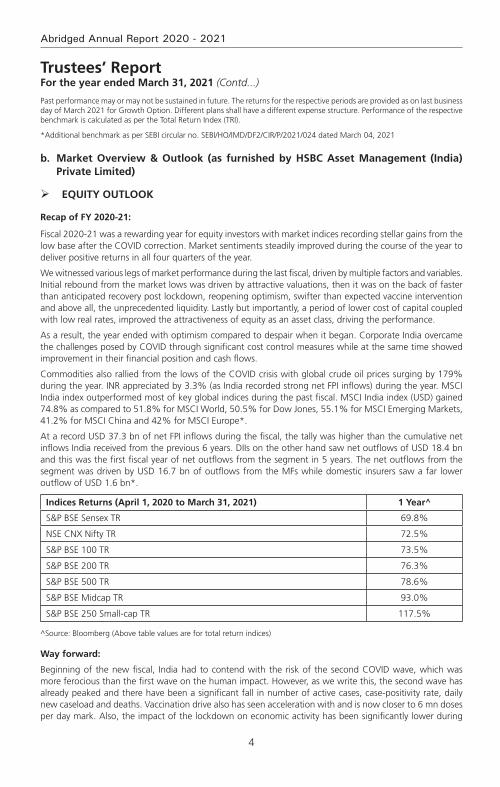
4
Abridged Annual Report 2020 - 2021
Past performance may or may not be sustained in future. The returns for the respective periods are provided as on last business day of March 2021 for Growth Option. Different plans shall have a different expense structure. Performance of the respective benchmark is calculated as per the Total Return Index (TRI).
*Additional benchmark as per SEBI circular no. SEBI/HO/IMD/DF2/CIR/P/2021/024 dated March 04, 2021
b. market overview & outlook (as furnished by hSBc asset management (india) Private limited)
equitY outlook
recap of fY 2020-21:
Fiscal 2020-21 was a rewarding year for equity investors with market indices recording stellar gains from the low base after the COVID correction. Market sentiments steadily improved during the course of the year to deliver positive returns in all four quarters of the year.
We witnessed various legs of market performance during the last fiscal, driven by multiple factors and variables. Initial rebound from the market lows was driven by attractive valuations, then it was on the back of faster than anticipated recovery post lockdown, reopening optimism, swifter than expected vaccine intervention and above all, the unprecedented liquidity. Lastly but importantly, a period of lower cost of capital coupled with low real rates, improved the attractiveness of equity as an asset class, driving the performance.
As a result, the year ended with optimism compared to despair when it began. Corporate India overcame the challenges posed by COVID through significant cost control measures while at the same time showed improvement in their financial position and cash flows.
Commodities also rallied from the lows of the COVID crisis with global crude oil prices surging by 179% during the year. INR appreciated by 3.3% (as India recorded strong net FPI inflows) during the year. MSCI India index outperformed most of key global indices during the past fiscal. MSCI India index (USD) gained 74.8% as compared to 51.8% for MSCI World, 50.5% for Dow Jones, 55.1% for MSCI Emerging Markets, 41.2% for MSCI China and 42% for MSCI Europe*.
At a record USD 37.3 bn of net FPI inflows during the fiscal, the tally was higher than the cumulative net inflows India received from the previous 6 years. DIIs on the other hand saw net outflows of USD 18.4 bn and this was the first fiscal year of net outflows from the segment in 5 years. The net outflows from the segment was driven by USD 16.7 bn of outflows from the MFs while domestic insurers saw a far lower outflow of USD 1.6 bn*.
indices returns (april 1, 2020 to march 31, 2021) 1 Year^
S&P BSE Sensex TR 69.8%
NSE CNX Nifty TR 72.5%
S&P BSE 100 TR 73.5%
S&P BSE 200 TR 76.3%
S&P BSE 500 TR 78.6%
S&P BSE Midcap TR 93.0%
S&P BSE 250 Small-cap TR 117.5%
^Source: Bloomberg (Above table values are for total return indices)
Way forward:
Beginning of the new fiscal, India had to contend with the risk of the second COVID wave, which was more ferocious than the first wave on the human impact. However, as we write this, the second wave has already peaked and there have been a significant fall in number of active cases, case-positivity rate, daily new caseload and deaths. Vaccination drive also has seen acceleration with and is now closer to 6 mn doses per day mark. Also, the impact of the lockdown on economic activity has been significantly lower during
Trustees’ ReportFor the year ended March 31, 2021 (Contd...)

5
HSBC Cash Fund
the second wave, compared to last year. In most of the states, the unlocking process has already begun in a phased manner and this is leading to improvement in various activity indicators. Mobility indicators are recovering faster while economic indicators (freight, credit off-take, E-way bill generation, power demand etc.) are also witnessing a gradual recovery. The recently concluded earnings season has turned out to be in-line with expectations and despite the concerns of around the second wave, the earnings (Nifty) have seen upgrades for FY22. Market is looking beyond the current quarter (i.e. 1QFY22), which would witness an impact due to the second wave. Our baseline assumption is that of a temporary impact from the second wave and the set-back to the recovery process limited to a few months, after which we should see the economic rebound. So far, this is tracking in-line with assumptions.
From a macro perspective, the current estimates for GDP growth in FY22 stand at 9.2%* (after seeing downgrades to factor in the impact of second wave). The downgrade in estimates are pertaining to the first quarter and hence the trajectory of growth from hereon should pick up. The tax collections data for the first two months of FY22 has remained strong, implying that the drawdown of the second wave on the fiscal position is not alarming. Additionally, the impact of fiscal stimulus package announced in FY22 so far is manageable (about 60 bps of GDP) and hence would not lead to any fiscal strain.
After the spectacular rally, market valuations at an overall level are now trending above historical averages on traditional valuation metrics (P/E, P/B). This is true for all market capitalization categories (viz large, mid and small). Typically, the broader market (i.e. mid and small cap segments), trade at a discount to large caps, however this scenario has now reversed after the outperformance from the broader market segments. However, the earnings momentum continues to remain strong (witnessing upgrades so far) and except for a short period due to second wave, the earnings momentum should hold up.
We believe that the risk-reward is balanced for the equity markets in the near term. Higher or sticky inflation expectations globally, higher than historical market valuations on some parameters (i.e. P/E, P/B) and adverse demand impact from the second wave are risk factors to contend with in the near term. However, these are counter balanced by positive commentary from companies, significant decline in COVID cases and acceleration in the vaccination programme. As a result, in the near term markets may see a consolidation phase and could take cues from the upcoming earnings season with more focus on the corporate commentary and the outlook. From a medium to long term perspective, the outlook for equity markets remains positive. The expectation of cyclical revival in the economy brings in a multi-year earnings visibility. This along with a benign cost of capital environment, should support equity performance. However, equity returns are likely to moderate on the back of the relatively high valuations and the strong recovery we have already witnessed from the COVID lows. Equity performance is likely to mirror the earnings growth trends over the medium to long term.
Pace of vaccination, concerns about a third wave, corporate earnings trajectory, inflation trends (both global & domestic), monsoon trends and commodity prices (especially crude oil) are some of the key factors which could influence market performance in the short term.
From a portfolio perspective, we are maintaining a pro-cyclical bias. We expect earnings growth to rebound sharply post the current COVID phase. Earnings growth are expected to sustain in high-teens beyond FY22 on the back of economy witnessing a cyclical recovery due to revival in capex cycle over the next 2-3 years (first by the government followed by private capex). From a sectoral perspective our order of preference is rate sensitives followed by domestic cyclicals, exporters and domestic consumption. Predominantly regulated businesses come last in our pecking order. This preference is dictated by our assessment of sectors / segments leading contribution to the market earnings growth over the next 2-3 years. Our portfolio construction is driven by a bottom up approach to stock selection with a focus on names that can deliver positive earnings surprises. We continue to focus on this theme to identify likely outperformers.
*Source: Bloomberg
deBt outlook
market drivers during the course of the year fY21
The Fixed Income markets started the year with a bout of nervousness that was triggered by the pandemic. While RBI had calmed the markets with its large rate cut action of 75bp cut followed by liquidity supportive
Trustees’ ReportFor the year ended March 31, 2021 (Contd...)
6
Abridged Annual Report 2020 - 2021
measures, the volatility continued until mid-May when government announced its relief package. While it was not fiscally expansive, it touched the right cords in terms of credit flow to desired sectors. This was followed up with RBI’s credit relief measures in terms of moratorium and restructuring of assets that were stressed due to the pandemic. Throughout the course of the year, RBI maintained its accommodative stance along with significant amount of surplus liquidity that was supportive and helped in maintaining stability in the market. However, as the year progressed and pressure on fiscal began to mount yields started seeing a spike towards the last quarter of the fiscal. While borrowing was stepped up to INR 12 trillion from previously budgeted INR 7.8 trillion in May 2020, it was further enhanced by and additional INR 1.1 trillion in October 2020. Overall GOI ended up borrowing a record amount of INR 13.9 trillion. The budget proved to be a shocker with GOI using the pandemic as an opportunity for setting the finances in order. GOI showed a record deficit of 9.5% for FY21 and projected a 6.8% for FY22 with estimated central government gross borrowing of INR 12 trillion. This seemed to reverse the support RBI had provided throughout the year with benchmark 10-year bond peaking to 6.23% in mid –Feb 2021. RBI’s statements to remain supportive were left in the sidelines. Overall it seemed that the 115bp of rate cut, along with significant liquidity infusion (OMO + Twist operations of ~INR 3 trillion, infusion via dollar purchases) seemed only a little to help in applying a brake to the one-way spike in yields. The year closed ~6.16% with absence of concrete action by RBI.
rBi Policy: Through the course of the year, RBI has maintained an accommodative stance, with an aggregate 115bp of rate cut done in March and May 2020 taking the repo rate from 5.15% to 4%. Subsequently while inflation pressures prevented RBI from taking any direct actions, RBI has used a combination of creative tools to keep the rates contained primarily via liquidity supportive tools such as OMOs, Twist Operations, Repo linked Term loans to needy sectors (LTROs, TLTROs), CRR cuts. While inflation was a worry for most part of the year, RBI kept it aside admitting that growth was a priority and inflation effects are more supply side rather than demand side. Prospectively into FY22, with the onset of the second wave, RBI continues to maintain the stance to prioritize growth.
inflation: Inflation for most part of the year stayed above 6% primarily driven by supply side pressures and some intermittent spike from food inflation as well. While it has been coming off since December with cooling off of food inflation and positive base effects, it has been between 4- 5.5%. Structurally however inflation risks continue to remain as oil prices have increased and base effects will not remain supportive for long. Core inflation continues to remain sticky.
liquidity: During the year, system liquidity has remained at significant surplus facilitated largely by RBI action such as OMOs, foreign exchange operations and government spending.
Budget: The FY2022 union budget focuses on growth and has accordingly, presented a 9.5% fiscal deficit for FY21 and 6.8% for FY22. On the revenue side, the assumptions are largely realistic, with FY22 (E) Nominal GDP growth at 14.4% and tax revenue growth at 17% considering the pandemic impact in FY 21. Compared to FY20, tax revenue growth is ~10%. While non-tax revenues are ambitious pegging the divestment at INR 1.75 trillion, with robust pipeline of assets including monetization of road and transmission assets, execution remains the key as in the past. On the expenditure side, better quality capex spending with focusing on rail, road, defense, urban infra is positive for long term structural growth. The revenue side expenditure adjusting for clearance of past subsidy arrears will be similar to budgetary estimates. Government using this opportunity to bring back off-balance sheet spending to on-balance sheet was a welcome move towards transparency and showing realistic projections. Alongside, states have also been given leeway to borrow upto 4% of their GDP with an additional 0.5% subject to conditions. Given that states are an important vehicle for capex investment, this move is welcome although it may entail additional state borrowing. The fiscal glide path is shifted to FY26 at below 4.5% for center and 3% for states suggesting that spending will continue and borrowing will come down gradually. In summary, from survival to revival, FY22 budget aims for structural growth leaving fiscal concerns sideways in the interim. Government’s intent seems clear on bringing back growth on the table, in a transparent manner.
While the second wave of the pandemic has once again derailed the revenue story, government will still have some cushion from its conservative estimates.
currency and fii flows: INR has been on an appreciation trajectory for most part of the year, aided by dollar underperformance supported by positive FII and FDI flows along with reduced imports on the domestic front as well. RBI has used most of the flows to accumulate reserves which has prevented any strong appreciation. Pandemic shock and global risk off led rupee over 75 in the beginning of the year only to close below 72
Trustees’ ReportFor the year ended March 31, 2021 (Contd...)
7
HSBC Cash Fund
at the end of the fiscal year. While the second wave led to another spike in INR in April, it has since then cooled once again driven by dollar underperformance and pandemic recovery on the domestic front. Net FII flows was ~$30 bn with positive equity flows of~$37 bn while debt was negative ~$7bn and overall RBI’s forex reserves rose by a ~$100 bn to close ~$537 bn.
credit growth: Credit growth for the entire year has been tepid as previous year’s credit events were followed by nervousness relating to the pandemic. Despite RBI opening up several windows to finance the non-AAA segment, there was very little fresh credit flowing that segment. Overall banking credit grew by only 6.5%. Risk appetite has however been improving from a complete risk aversion to opening up towards a calculated risk. Prospectively it is expected that once the pandemic risk abates, credit growth will resume primarily driven by government capex spending and demand recovery.
market outlook
The pandemic once again brought the country to a situation similar to last year and debt markets perhaps interpreted the same as a structural rise in rates. In the initial day’s post budget in Feb of 2021, market was expecting a concrete set of actions such as an OMO calendar from RBI, and RBI’s words alone failed to calm the market. The first auction of the fiscal year also saw a devolvement. However, RBI acted in the first policy of the year announcing a bond buyback program akin to QE (quantitative easing) and its subsequent cancellation of auctions wherein yields were perhaps quoted higher than RBI’s comfort levels brought back confidence into the market. Since then we have seen a strong rally with 10-year benchmark trending below 6% and the curve moving alongside. RBI reiteration of priority of growth and also supporting with higher than expected dividend payment stand out as a testimony of its support. While we do not expect RBI to act in terms of rate cuts, we believe that measures such as G-SAP, OMOs will continue until there is visibility of a structural growth. Therefore, the large borrowing program should go without any hiccups.
Furthermore, with the evidence of strong GST numbers until April 2021 (before the 2nd wave), it is expected that growth and therefore fiscal revenues will come back. Government’s conservative budget estimates are supportive. Also, given the fact that compared to last year there has not been a complete shutdown of activity (lockdowns being distributed), the impact on growth will not be similar to last year. Pent up demand will come back to support revenue collection. However, on the flipside, once growth resumes RBI will be forced to withdraw liquidity in a phased manner to prevent asset bubbles. Nevertheless, RBI need not act in terms of rate actions and we believe that a prolonged pause in terms of RBI rates is in the offing.
Net-net therefore while growth is wanting no matter what, it may come at a small price of rise in yields with liquidity withdrawal. That is however expected more in the 2nd half of the year. Lower than expected borrowing numbers, later this year or if not in next year could be a surprise. We may therefore see a range bound rate action in the near term with a rising bias over time. Global rate environment, oil and currency risks are to be watched out for.
2. Brief Background of SPonSorS, Board of truSteeS and aSSet management comPanY
a. Sponsor
HSBC Mutual Fund is sponsored by HSBC Securities and Capital Markets (India) Private Limited (HSCI). The Sponsor is the Settler of the Mutual Fund Trust. The Sponsor has entrusted a sum of Rs. 1,00,000/- (Rupees One Lakh only) to the Trustee as the initial contribution towards the corpus of the Mutual Fund.
HSCI offers integrated investment banking services, securities and corporate finance & advisory. HSCI is a member of the Bombay Stock Exchange Limited and National Stock Exchange (capital and derivative market segments). HSCI holds 100% of the paid up equity share capital of HSBC Asset Management (India) Private Limited.
b. hSBc mutual fund
HSBC Mutual Fund (“the Mutual Fund” or “the Fund”) has been constituted as a Trust in accordance with the provisions of the Indian Trusts Act, 1882 (2 of 1882) vide a Trust Deed dated February 7, 2002 with HSBC Securities and Capital Markets (India) Private Limited, as the Sponsor and the Board of Individual
Trustees’ ReportFor the year ended March 31, 2021 (Contd...)
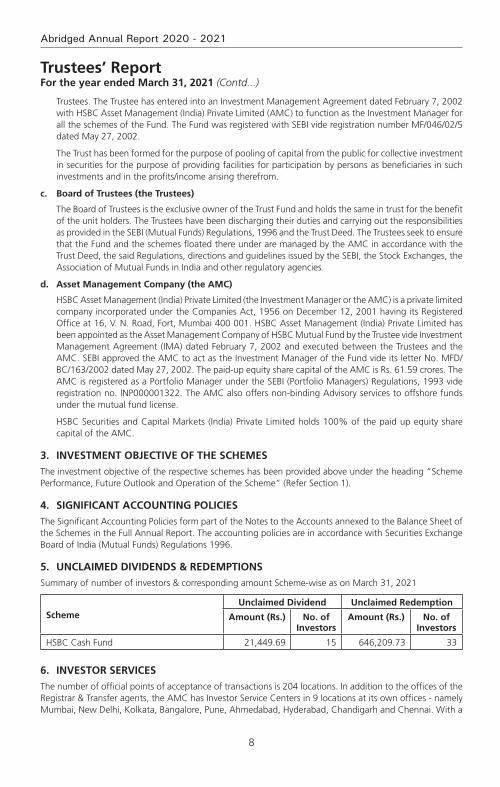
8
Abridged Annual Report 2020 - 2021
Trustees. The Trustee has entered into an Investment Management Agreement dated February 7, 2002 with HSBC Asset Management (India) Private Limited (AMC) to function as the Investment Manager for all the schemes of the Fund. The Fund was registered with SEBI vide registration number MF/046/02/5 dated May 27, 2002.
The Trust has been formed for the purpose of pooling of capital from the public for collective investment in securities for the purpose of providing facilities for participation by persons as beneficiaries in such investments and in the profits/income arising therefrom.
c. Board of trustees (the trustees)
The Board of Trustees is the exclusive owner of the Trust Fund and holds the same in trust for the benefit of the unit holders. The Trustees have been discharging their duties and carrying out the responsibilities as provided in the SEBI (Mutual Funds) Regulations, 1996 and the Trust Deed. The Trustees seek to ensure that the Fund and the schemes floated there under are managed by the AMC in accordance with the Trust Deed, the said Regulations, directions and guidelines issued by the SEBI, the Stock Exchanges, the Association of Mutual Funds in India and other regulatory agencies.
d. asset management company (the amc)
HSBC Asset Management (India) Private Limited (the Investment Manager or the AMC) is a private limited company incorporated under the Companies Act, 1956 on December 12, 2001 having its Registered Office at 16, V. N. Road, Fort, Mumbai 400 001. HSBC Asset Management (India) Private Limited has been appointed as the Asset Management Company of HSBC Mutual Fund by the Trustee vide Investment Management Agreement (IMA) dated February 7, 2002 and executed between the Trustees and the AMC. SEBI approved the AMC to act as the Investment Manager of the Fund vide its letter No. MFD/BC/163/2002 dated May 27, 2002. The paid-up equity share capital of the AMC is Rs. 61.59 crores. The AMC is registered as a Portfolio Manager under the SEBI (Portfolio Managers) Regulations, 1993 vide registration no. INP000001322. The AMC also offers non-binding Advisory services to offshore funds under the mutual fund license.
HSBC Securities and Capital Markets (India) Private Limited holds 100% of the paid up equity share capital of the AMC.
3. inveStment oBjective of the SchemeS
The investment objective of the respective schemes has been provided above under the heading “Scheme Performance, Future Outlook and Operation of the Scheme” (Refer Section 1).
4. Significant accounting PolicieS
The Significant Accounting Policies form part of the Notes to the Accounts annexed to the Balance Sheet of the Schemes in the Full Annual Report. The accounting policies are in accordance with Securities Exchange Board of India (Mutual Funds) Regulations 1996.
5. unclaimed dividendS & redemPtionS
Summary of number of investors & corresponding amount Scheme-wise as on March 31, 2021
Schemeunclaimed dividend unclaimed redemption
amount (rs.) no. of investors
amount (rs.) no. of investors
HSBC Cash Fund 21,449.69 15 646,209.73 33
6. inveStor ServiceS
The number of official points of acceptance of transactions is 204 locations. In addition to the offices of the Registrar & Transfer agents, the AMC has Investor Service Centers in 9 locations at its own offices - namely Mumbai, New Delhi, Kolkata, Bangalore, Pune, Ahmedabad, Hyderabad, Chandigarh and Chennai. With a
Trustees’ ReportFor the year ended March 31, 2021 (Contd...)
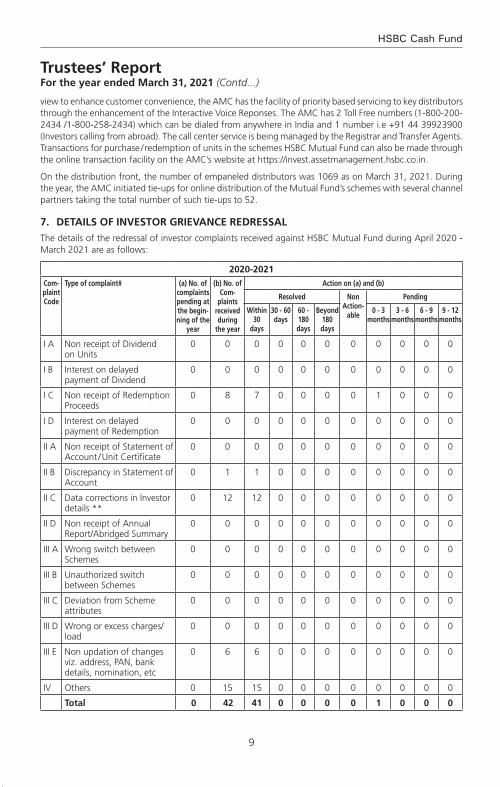
9
HSBC Cash Fund
Trustees’ ReportFor the year ended March 31, 2021 (Contd...)
view to enhance customer convenience, the AMC has the facility of priority based servicing to key distributors through the enhancement of the Interactive Voice Reponses. The AMC has 2 Toll Free numbers (1-800-200-2434 /1-800-258-2434) which can be dialed from anywhere in India and 1 number i.e +91 44 39923900 (Investors calling from abroad). The call center service is being managed by the Registrar and Transfer Agents. Transactions for purchase / redemption of units in the schemes HSBC Mutual Fund can also be made through the online transaction facility on the AMC’s website at https://invest.assetmanagement.hsbc.co.in.
On the distribution front, the number of empaneled distributors was 1069 as on March 31, 2021. During the year, the AMC initiated tie-ups for online distribution of the Mutual Fund’s schemes with several channel partners taking the total number of such tie-ups to 52.
7. detailS of inveStor grievance redreSSal
The details of the redressal of investor complaints received against HSBC Mutual Fund during April 2020 - March 2021 are as follows:
2020-2021
com-plaint code
type of complaint# (a) no. of complaints pending at the begin-ning of the
year
(b) no. of com-
plaints received during
the year
action on (a) and (b)
resolved non action-
able
Pending
Within 30
days
30 - 60 days
60 - 180 days
Beyond 180 days
0 - 3 months
3 - 6 months
6 - 9 months
9 - 12 months
I A Non receipt of Dividend on Units
0 0 0 0 0 0 0 0 0 0 0
I B Interest on delayed payment of Dividend
0 0 0 0 0 0 0 0 0 0 0
I C Non receipt of Redemption Proceeds
0 8 7 0 0 0 0 1 0 0 0
I D Interest on delayed payment of Redemption
0 0 0 0 0 0 0 0 0 0 0
II A Non receipt of Statement of Account / Unit Certificate
0 0 0 0 0 0 0 0 0 0 0
II B Discrepancy in Statement of Account
0 1 1 0 0 0 0 0 0 0 0
II C Data corrections in Investor details **
0 12 12 0 0 0 0 0 0 0 0
II D Non receipt of Annual Report/Abridged Summary
0 0 0 0 0 0 0 0 0 0 0
III A Wrong switch between Schemes
0 0 0 0 0 0 0 0 0 0 0
III B Unauthorized switch between Schemes
0 0 0 0 0 0 0 0 0 0 0
III C Deviation from Scheme attributes
0 0 0 0 0 0 0 0 0 0 0
III D Wrong or excess charges/load
0 0 0 0 0 0 0 0 0 0 0
III E Non updation of changes viz. address, PAN, bank details, nomination, etc
0 6 6 0 0 0 0 0 0 0 0
IV Others 0 15 15 0 0 0 0 0 0 0 0
total 0 42 41 0 0 0 0 1 0 0 0

10
Abridged Annual Report 2020 - 2021
Trustees’ ReportFor the year ended March 31, 2021 (Contd...)
Summary of complaints for fY 2020-21
Particulars count
Total complaints received 42
Total number of folios 148770
% of complaints against the folio 0.028%
# active folios
** As per AMFI Best Practice Guidelines Circular No. 25/2011-12 for Revisions in the Guidelines on Standardization of Complaints / Grievances Reporting Procedure. If “Others” include a type of complaint which is more than 10% of overall complaints, then such a reason should be provided separately. Hence data corrections in Investor Details is included as a separate category
* Non actionable means the complaint is incomplete / outside the scope of the mutual fund
8. inveStor education initiativeS
Investor awareness advertisements were published in Mutual Fund Insight magazine on a monthly basis along with an editorial on ‘SIP Sahi Hai’. Additionally, monthly articles / blogs have been written by Advisorkhoj on IAP which talks of the advantages of SIP, start early, power of compounding, diversification, asset allocation etc. The same is promoted by the publisher via an email to their entire network and also on their social media handles which can be retweeted or liked. Also, educative infographics have been hosted on our website under the investor resources section. The same have also been circulated to existing Indian investors via email for engagement and for educative purposes.
9. ProxY voting PolicY
In terms of SEBI Circular no. SEBI/IMD/CIR No. 18/198647/2010 dated March 15, 2010, the Fund has adopted Proxy Voting Policy and Procedures for exercising voting rights in respect of securities held by the Schemes.
The summary of the votes casted in the general meetings of the Investee companies, by the AMC for and on behalf of the Schemes of the Fund, for the financial year 2020-2021 is provided below:
quarter total no. of resolutions
Break-up of vote decision
for against abstained
June 2020 50 43 6 1
September 2020 752 656 38 58
December 2020 41 31 1 9
March 2021 40 30 8 2
total 883 760 53 70
In terms of the requirement of SEBI Circular no. CIR/IMD/DF/05/2014 dated March 24, 2014 and SEBI/HO/IMD/DF2/CIR/P/2016/68 dated August 10, 2016; the AMC has obtained certificate from M/s. M. P. Chitale & Co., Chartered Accountants, who is acting as a Scrutinizer, on the voting report for the FY 2020-21. The certificate dated April 14, 2021 issued by M/s. M. P. Chitale & Co., is available on the website of the AMC as part of the full Annual Report.
Unit holders can refer to the full Annual Report for complete details of actual exercise of votes in the general meetings of the investee companies for the financial year 2020-21 or log on to our website at www.assetmanagement.hsbc.co.in.
10. StatutorY detailS
a) The Sponsors are not responsible or liable for any loss resulting from the operation of the Schemes of the Fund beyond initial contribution of Rs. 1 lakh for setting up the Fund.
b) The price and redemption value of the units, and income from them, can go up as well as down with fluctuations in the market value of its underlying investments.
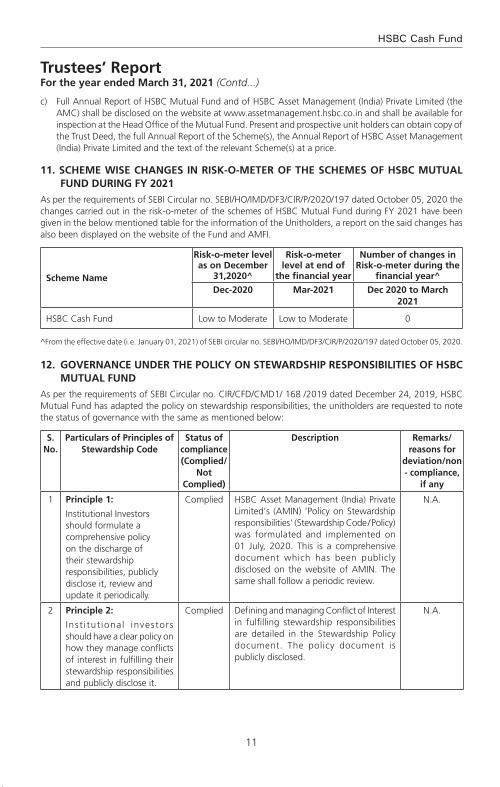
11
HSBC Cash Fund
Trustees’ ReportFor the year ended March 31, 2021 (Contd...)
c) Full Annual Report of HSBC Mutual Fund and of HSBC Asset Management (India) Private Limited (the AMC) shall be disclosed on the website at www.assetmanagement.hsbc.co.in and shall be available for inspection at the Head Office of the Mutual Fund. Present and prospective unit holders can obtain copy of the Trust Deed, the full Annual Report of the Scheme(s), the Annual Report of HSBC Asset Management (India) Private Limited and the text of the relevant Scheme(s) at a price.
11. Scheme WiSe changeS in riSk-o-meter of the SchemeS of hSBc mutual fund during fY 2021
As per the requirements of SEBI Circular no. SEBI/HO/IMD/DF3/CIR/P/2020/197 dated October 05, 2020 the changes carried out in the risk-o-meter of the schemes of HSBC Mutual Fund during FY 2021 have been given in the below mentioned table for the information of the Unitholders, a report on the said changes has also been displayed on the website of the Fund and AMFI.
Scheme name
risk-o-meter level as on december
31,2020^
risk-o-meter level at end of
the financial year
number of changes in risk-o-meter during the
financial year^
dec-2020 mar-2021 dec 2020 to march 2021
HSBC Cash Fund Low to Moderate Low to Moderate 0
^From the effective date (i.e. January 01, 2021) of SEBI circular no. SEBI/HO/IMD/DF3/CIR/P/2020/197 dated October 05, 2020.
12. governance under the PolicY on SteWardShiP reSPonSiBilitieS of hSBc mutual fund
As per the requirements of SEBI Circular no. CIR/CFD/CMD1/ 168 /2019 dated December 24, 2019, HSBC Mutual Fund has adapted the policy on stewardship responsibilities, the unitholders are requested to note the status of governance with the same as mentioned below:
S. no.
Particulars of Principles of Stewardship code
Status of compliance (complied/
not complied)
description remarks/reasons for
deviation/non - compliance,
if any
1 Principle 1:
Institutional Investors should formulate a comprehensive policy on the discharge of their stewardship responsibilities, publicly disclose it, review and update it periodically.
Complied HSBC Asset Management (India) Private Limited's (AMIN) 'Policy on Stewardship responsibilities' (Stewardship Code / Policy) was formulated and implemented on 01 July, 2020. This is a comprehensive document which has been publicly disclosed on the website of AMIN. The same shall follow a periodic review.
N.A.
2 Principle 2:
Inst i tut ional investors should have a clear policy on how they manage conflicts of interest in fulfilling their stewardship responsibilities and publicly disclose it.
Complied Defining and managing Conflict of Interest in fulfilling stewardship responsibilities are detailed in the Stewardship Policy document. The policy document is publicly disclosed.
N.A.

12
Abridged Annual Report 2020 - 2021
S. no.
Particulars of Principles of Stewardship code
Status of compliance (complied/
not complied)
description remarks/reasons for
deviation/non - compliance,
if any
3 Principle 3:
Institutional investors should monitor their investee companies.
Complied AMIN monitors all investee companies through its investment process. This includes assessment of companies’ own and market data, consideration of research from brokers and other independent research providers – including ESG & voting research, attending individual & group meetings with company management and directors, visiting production sites (wherever necessary), engaging with key stakeholders including competitors and customers, and financial modelling. More details enumerated in the policy document
N.A.
4 Principle 4:
Inst i tut ional investors should have a clear policy on intervention in their investee companies. Institutional investors should also have a clear policy for collaboration with other institutional investors where required, to preserve the interests of the ultimate investors, which should be disclosed.
Complied Details of undertaking active engagement with investee companies and the policy for collaboration with other institutional holders are detailed in the policy document. The policy document is publicly disclosed.
N.A.
5 Principle 5:
Inst i tut ional investors should have a clear policy on voting and disclosure of voting activity.
Complied AMIN has a clear and detailed voting policy which provides the framework for the voting decisions. All voting decisions shall be in accordance with AMIN’s Voting Policy and Procedures, which is disclosed on the website. AMIN discloses the details of the voting on its website on a quarterly basis within 10 working days from the end of the quarter. Additionally, AMIN also discloses the details of the votes cast, in the annual report of the schemes of HSBC Mutual Fund.
N.A.
6 Principle 6:
Institutional investors should report periodically on their stewardship activities.
Complied The annual status report of the stewardship code and quarterly report on proxy voting are publicly disclosed on the website as required under SEBI Regulations.
N.A.
Trustees’ ReportFor the year ended March 31, 2021 (Contd...)

13
HSBC Cash Fund
13. Significant event after the end of the financial Year
HSBC Global Consumer Opportunities Fund (HGCOF) has been merged with HSBC Asia Pacific (Ex Japan) Dividend Yield Fund with effect from May 13, 2021. Therefore, HGCOF has been ceased to exist from the aforesaid date.
14. acknoWledgementS
The Trustees wish to thank the Unit holders of the Schemes for their support throughout the year and also thank the Government of India, the Securities and Exchange Board of India (SEBI), the Reserve Bank of India (RBI) and the Association of Mutual Funds in India (AMFI) for the guidance provided by them. The Trustees also appreciate the services provided by the Registrar and Transfer Agent, Fund Accountant, Custodian, Bankers, Distributors and Brokers. The guidance and services provided by the Auditors and advocates and the ebullience, sincerity and dedication of the employees of HSBC Asset Management (India) Private Limited is also appreciated.
The Trustees look forward to the continued support of everyone.
For and on behalf of the Board of Trustees of HSBC Mutual Fund
Sd/-
Trustee
Mumbai
July 20, 2021.
Trustees’ ReportFor the year ended March 31, 2021 (Contd...)
14
Abridged Annual Report 2020 - 2021
To the Trustees of HSBC Mutual Fund
hSBc cash fund
Report on the Audit of the Financial Statements
OpinionWe have audited the financial statements of hSBc cash fund (the ‘Scheme’) of HSBC Mutual Fund, which comprise the balance sheet as at 31 March 2021 and the revenue account and cash flow statement for the year then ended, and notes to the financial statements, including a summary of the significant accounting policies.
In our opinion and to the best of our information and according to the explanations given to us, the aforesaid financial statements give a true and fair view in conformity with the accounting principles generally accepted in India, of the state of affairs of the Scheme as at 31 March 2021, its net surplus and cash flows for the year ended on that date.
Basis for opinionWe conducted our audit in accordance with the Standards on Auditing (‘SAs’) issued by the Institute of Chartered Accountants of India (the ‘ICAI’). Our responsibilities under those SAs are further described in the Auditor’s Responsibilities for the Audit of the Financial Statements section of our report. We are independent of the Scheme in accordance with the Code of Ethics issued by the ICAI, and we have fulfilled our other ethical responsibilities in accordance with the Code of Ethics. We believe that the audit evidence we have obtained is sufficient and appropriate to provide a basis for our opinion.
responsibilities of management and those charged with governance for the financial StatementsThe Scheme’s management, the Board of Directors of HSSBC Mutual Fund (the ‘Trustee’) and the Board of Directors of HSBC Asset Management (India) Private Limited (the ‘AMC’) (collectively referred to as ‘Management’) are responsible for the preparation of these financial statements that give a true and fair view of the state of affairs, results of operations and cash flows of the Scheme in accordance with the accounting policies and standards specified in the Ninth Schedule of the Securities and Exchange Board of India (Mutual Funds) Regulations, 1996, as amended (the ‘Regulations’) and the accounting principles generally accepted in India. This responsibility includes design, implementation and maintenance of internal control relevant to the preparation and presentation of the financial statements that give a true and fair view and are free from material misstatement, whether due to fraud or error.
In preparing the financial statements, management is responsible for assessing the Scheme’s ability to continue as a going concern, disclosing, as applicable, matters related to going concern and using the going concern basis of accounting unless management either intends to liquidate the Scheme or to cease operations, or has no realistic alternative but to do so.
The management is responsible for overseeing the Scheme’s financial reporting process.
auditor’s responsibilities for the audit of the financial StatementsOur objectives are to obtain reasonable assurance about whether the financial statements as a whole are free from material misstatement, whether due to fraud or error, and to issue an auditor’s report that includes our opinion. Reasonable assurance is a high level of assurance, but is not a guarantee that an audit conducted in accordance with SAs will always detect a material misstatement when it exists. Misstatements can arise from fraud or error and are considered material if, individually or in the aggregate, they could reasonably be expected to influence the economic decisions of users taken on the basis of these financial statements.
As part of an audit in accordance with SAs, we exercise professional judgment and maintain professional skepticism throughout the audit. We also:
• Identifyandassesstherisksofmaterialmisstatementofthefinancialstatements,whetherduetofraudor error, design and perform audit procedures responsive to those risks, and obtain audit evidence that is sufficient and appropriate to provide a basis for our opinion. The risk of not detecting a material misstatement resulting from fraud is higher than for one resulting from error, as fraud may involve
Independent Auditors’ Report
15
HSBC Cash Fund
Independent Auditors’ Report (Contd...)
collusion, forgery, intentional omissions, misrepresentations, or the override of internal control;
• Obtainanunderstandingofinternalcontrolrelevanttotheauditinordertodesignauditproceduresthat are appropriate in the circumstances, but not for the purpose of expressing an opinion on the effectiveness of the Scheme’s internal controls;
• Evaluatetheappropriatenessofaccountingpoliciesusedandthereasonablenessofaccountingestimatesand related disclosures made by Management;
• ConcludeontheappropriatenessofManagement’suseofthegoingconcernbasisofaccountingand,based on the audit evidence obtained, whether a material uncertainty exists related to events or conditions that may cast significant doubt on the Scheme’s ability to continue as a going concern. If we conclude that a material uncertainty exists, we are required to draw attention in our auditor’s report to the related disclosures in the financial statements or, if such disclosures are inadequate, to modify our opinion. Our conclusions are based on the audit evidence obtained up to the date of our auditor’s report. However, future events or conditions may cause the Scheme to cease to continue as a going concern;
• Evaluate the overall presentation, structure and content of the financial statements, including thedisclosures and whether the financial statements represent the underlying transactions and events in a manner that achieves fair presentation.
We communicate with those charged with governance regarding, among other matters, the planned scope and timing of the audit and significant audit findings, including any significant deficiencies in internal control that we identify during our audit.
We also provide those charged with governance with a statement that we have complied with relevant ethical requirements regarding independence, and to communicate with them all relationships and other matters that may reasonably be thought to bear on our independence, and where applicable, related safeguards.
report on other legal and regulatory requirements 1 As required by Regulation 55 (4) of the Regulations, we report that:
(a) We have obtained all information and explanations which, to the best of our knowledge and belief, were necessary for the purposes of the audit; and
(b) The balance sheet and the revenue account have been prepared in accordance with the accounting policies and standards as specified in the Ninth Schedule of the Regulations.
2 As required by Clause 5 (ii) (2) of the Eleventh Schedule of the Regulations, we report that the balance sheet and the revenue account are in agreement with the books of account of the Scheme.
3 As required by the Eight Schedule of the Regulations, we report that, in our opinion and on the basis of information and explanations given to us, the methods used to value non - traded securities, as at 31 March 2021, as determined by the Board of Directors of the AMC, are in accordance with the Regulations and other guidelines issued by the Securities and Exchange Board of India as applicable and approved by the Board of Directors of the Trustee, are fair and reasonable.
For B S R & Co. LLP Chartered Accountants Firm’s Registration No: 101248W/W-100022
Sd/-
Ajit Viswanath PartnerMembership No: 067114UDIN : 21067114AAAADI2930
Place : Mumbai Date : July 20, 2021.
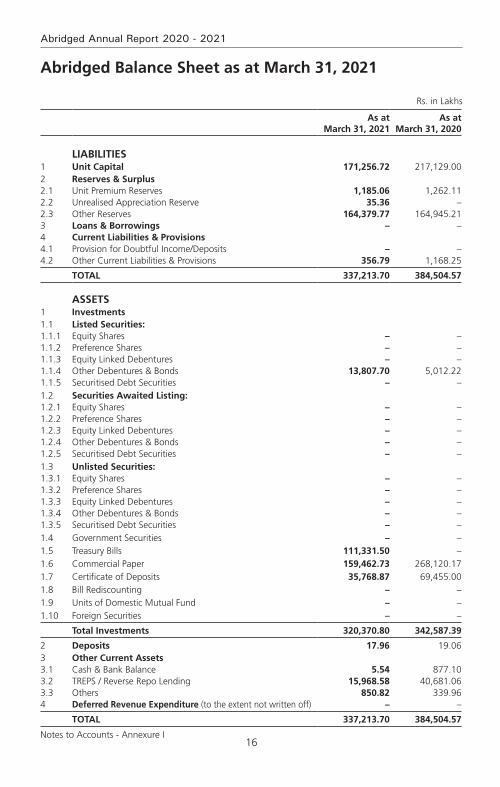
16
Abridged Annual Report 2020 - 2021
Rs. in Lakhs
As at March 31, 2021
As at March 31, 2020
LIABILITIES1 Unit Capital 171,256.72 217,129.002 Reserves & Surplus2.1 Unit Premium Reserves 1,185.06 1,262.112.2 Unrealised Appreciation Reserve 35.36 –2.3 Other Reserves 164,379.77 164,945.213 Loans & Borrowings – –4 Current Liabilities & Provisions4.1 Provision for Doubtful Income/Deposits – –4.2 Other Current Liabilities & Provisions 356.79 1,168.25
TOTAL 337,213.70 384,504.57
ASSETS1 Investments1.1 Listed Securities:1.1.1 Equity Shares – –1.1.2 Preference Shares – –1.1.3 Equity Linked Debentures – –1.1.4 Other Debentures & Bonds 13,807.70 5,012.221.1.5 Securitised Debt Securities – –1.2 Securities Awaited Listing:1.2.1 Equity Shares – –1.2.2 Preference Shares – –1.2.3 Equity Linked Debentures – –1.2.4 Other Debentures & Bonds – –1.2.5 Securitised Debt Securities – –1.3 Unlisted Securities:1.3.1 Equity Shares – –1.3.2 Preference Shares – –1.3.3 Equity Linked Debentures – –1.3.4 Other Debentures & Bonds – –1.3.5 Securitised Debt Securities – –1.4 Government Securities – –1.5 Treasury Bills 111,331.50 –1.6 Commercial Paper 159,462.73 268,120.171.7 Certificate of Deposits 35,768.87 69,455.001.8 Bill Rediscounting – –1.9 Units of Domestic Mutual Fund – –1.10 Foreign Securities – –
Total Investments 320,370.80 342,587.39
2 Deposits 17.96 19.063 Other Current Assets3.1 Cash & Bank Balance 5.54 877.103.2 TREPS / Reverse Repo Lending 15,968.58 40,681.063.3 Others 850.82 339.964 Deferred Revenue Expenditure (to the extent not written off) – –
TOTAL 337,213.70 384,504.57
Notes to Accounts - Annexure I
Abridged Balance Sheet as at March 31, 2021

17
HSBC Cash Fund
Abridged Revenue Account for the year ended March 31, 2021
Rs. in Lakhs
Current Year ended
March 31, 2021
Previous Year ended
March 31, 2020
1 INCOME1.1 Dividend – –1.2 Interest 14,246.25 36,386.071.3 Realised Gain / (Loss) on Foreign Exchange Transactions – –1.4 Realised Gains / (Losses) on Interscheme Sale of Investments – –1.5 Realised Gains / (Losses) on External Sale / Redemption of
Investments(453.93) (63.69)
1.6 Realised Gains / (Losses) on Derivative Transactions – –1.7 Other Income 14.08 5.19
(A) 13,806.40 36,327.57
2 EXPENSES2.1 Investment Management Fees 296.11 409.35 2.2 GST on Investment Management Fees 53.30 73.68 2.3 Transfer Agents Fees and Expenses 58.11 102.53 2.4 Custodian Fees 6.40 14.84 2.5 Trusteeship Fees 2.69 5.39 2.6 Commission to Agents 56.25 70.07 2.7 Marketing & Distribution Expenses 1.35 2.05 2.8 Audit Fees 5.05 5.55 2.9 Investor Education Expenses 92.31 144.42 2.10 Interest on Borrowing – 72.21 2.11 Other Operating Expenses 20.85 36.05
(B) 592.42 936.14
3 NET REALISED GAINS / (LOSSES) FOR THE YEAR (C = A - B) 13,213.98 35,391.43
4 Change in Unrealised Depreciation in Value of Investments (D) 43.84 (45.48)
5 NET GAINS / (LOSSES) FOR THE YEAR (E = C + D) 13,257.82 35,345.95
6 Change in Unrealised Appreciation in Value of Investments (F) 35.36 (169.91)
7 NET SURPLUS / (DEFICIT) FOR THE YEAR (G = E + F) 13,293.18 35,176.04
7.1 Add : Balance Transfer from Unrealised Appreciation Reserve – 169.91
7.2 Less : Balance Transfer to Unrealised Appreciation Reserve (35.36) –7.3 Add / (Less) : Equalisation (12,944.92) 21,396.857.4 Transfer from Reserve Fund 164,945.21 116,015.857.5 Transfer from Unit Premium Reserve – –
8 Total 165,258.11 172,758.65
9 Dividend Appropriation9.1 Income Distributed during the Year (878.34) (5,368.13)9.2 Tax on Income Distributed during the Year – (2,445.31)
10 Retained Surplus / (Deficit) Carried Forward to Balance Sheet 164,379.77 164,945.21
Notes to Accounts - Annexure I
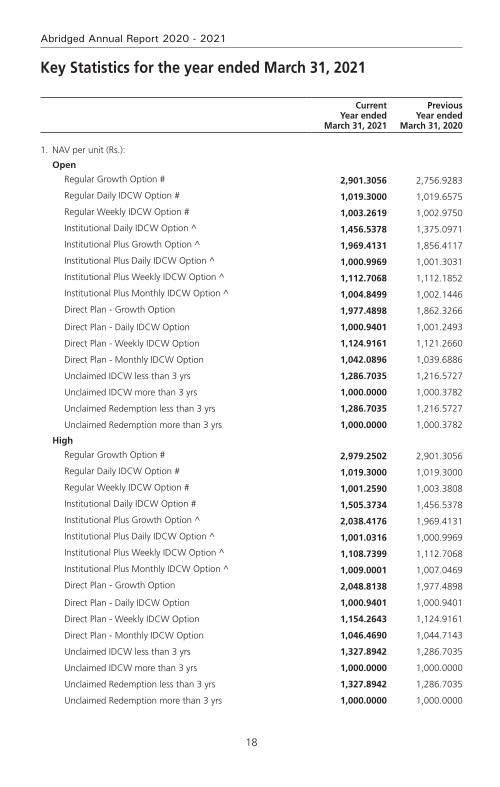
18
Abridged Annual Report 2020 - 2021
Key Statistics for the year ended March 31, 2021
Current Year ended
March 31, 2021
Previous Year ended
March 31, 2020
1. NAV per unit (Rs.):
Open
Regular Growth Option # 2,901.3056 2,756.9283
Regular Daily IDCW Option # 1,019.3000 1,019.6575
Regular Weekly IDCW Option # 1,003.2619 1,002.9750
Institutional Daily IDCW Option ^ 1,456.5378 1,375.0971
Institutional Plus Growth Option ^ 1,969.4131 1,856.4117
Institutional Plus Daily IDCW Option ^ 1,000.9969 1,001.3031
Institutional Plus Weekly IDCW Option ^ 1,112.7068 1,112.1852
Institutional Plus Monthly IDCW Option ^ 1,004.8499 1,002.1446
Direct Plan - Growth Option 1,977.4898 1,862.3266
Direct Plan - Daily IDCW Option 1,000.9401 1,001.2493
Direct Plan - Weekly IDCW Option 1,124.9161 1,121.2660
Direct Plan - Monthly IDCW Option 1,042.0896 1,039.6886
Unclaimed IDCW less than 3 yrs 1,286.7035 1,216.5727
Unclaimed IDCW more than 3 yrs 1,000.0000 1,000.3782
Unclaimed Redemption less than 3 yrs 1,286.7035 1,216.5727
Unclaimed Redemption more than 3 yrs 1,000.0000 1,000.3782
High
Regular Growth Option # 2,979.2502 2,901.3056
Regular Daily IDCW Option # 1,019.3000 1,019.3000
Regular Weekly IDCW Option # 1,001.2590 1,003.3808
Institutional Daily IDCW Option # 1,505.3734 1,456.5378
Institutional Plus Growth Option ^ 2,038.4176 1,969.4131
Institutional Plus Daily IDCW Option ^ 1,001.0316 1,000.9969
Institutional Plus Weekly IDCW Option ^ 1,108.7399 1,112.7068
Institutional Plus Monthly IDCW Option ^ 1,009.0001 1,007.0469
Direct Plan - Growth Option 2,048.8138 1,977.4898
Direct Plan - Daily IDCW Option 1,000.9401 1,000.9401
Direct Plan - Weekly IDCW Option 1,154.2643 1,124.9161
Direct Plan - Monthly IDCW Option 1,046.4690 1,044.7143
Unclaimed IDCW less than 3 yrs 1,327.8942 1,286.7035
Unclaimed IDCW more than 3 yrs 1,000.0000 1,000.0000
Unclaimed Redemption less than 3 yrs 1,327.8942 1,286.7035
Unclaimed Redemption more than 3 yrs 1,000.0000 1,000.0000
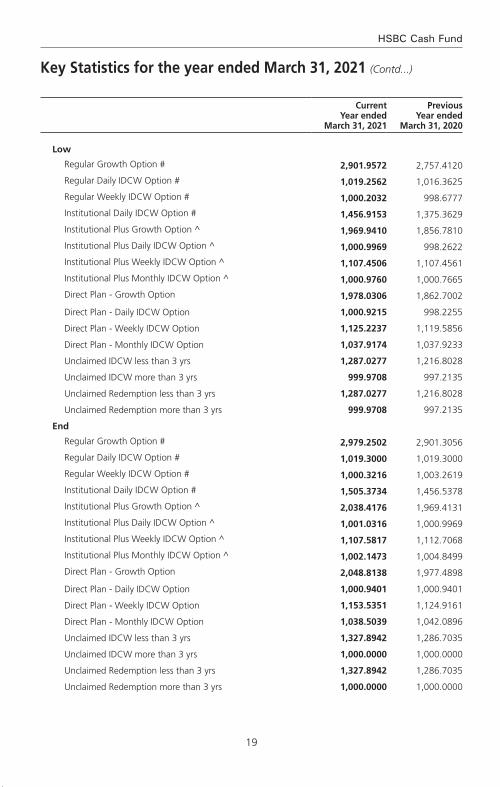
19
HSBC Cash Fund
Current Year ended
March 31, 2021
Previous Year ended
March 31, 2020
Low
Regular Growth Option # 2,901.9572 2,757.4120
Regular Daily IDCW Option # 1,019.2562 1,016.3625
Regular Weekly IDCW Option # 1,000.2032 998.6777
Institutional Daily IDCW Option # 1,456.9153 1,375.3629
Institutional Plus Growth Option ^ 1,969.9410 1,856.7810
Institutional Plus Daily IDCW Option ^ 1,000.9969 998.2622
Institutional Plus Weekly IDCW Option ^ 1,107.4506 1,107.4561
Institutional Plus Monthly IDCW Option ^ 1,000.9760 1,000.7665
Direct Plan - Growth Option 1,978.0306 1,862.7002
Direct Plan - Daily IDCW Option 1,000.9215 998.2255
Direct Plan - Weekly IDCW Option 1,125.2237 1,119.5856
Direct Plan - Monthly IDCW Option 1,037.9174 1,037.9233
Unclaimed IDCW less than 3 yrs 1,287.0277 1,216.8028
Unclaimed IDCW more than 3 yrs 999.9708 997.2135
Unclaimed Redemption less than 3 yrs 1,287.0277 1,216.8028
Unclaimed Redemption more than 3 yrs 999.9708 997.2135
End
Regular Growth Option # 2,979.2502 2,901.3056
Regular Daily IDCW Option # 1,019.3000 1,019.3000
Regular Weekly IDCW Option # 1,000.3216 1,003.2619
Institutional Daily IDCW Option # 1,505.3734 1,456.5378
Institutional Plus Growth Option ^ 2,038.4176 1,969.4131
Institutional Plus Daily IDCW Option ^ 1,001.0316 1,000.9969
Institutional Plus Weekly IDCW Option ^ 1,107.5817 1,112.7068
Institutional Plus Monthly IDCW Option ^ 1,002.1473 1,004.8499
Direct Plan - Growth Option 2,048.8138 1,977.4898
Direct Plan - Daily IDCW Option 1,000.9401 1,000.9401
Direct Plan - Weekly IDCW Option 1,153.5351 1,124.9161
Direct Plan - Monthly IDCW Option 1,038.5039 1,042.0896
Unclaimed IDCW less than 3 yrs 1,327.8942 1,286.7035
Unclaimed IDCW more than 3 yrs 1,000.0000 1,000.0000
Unclaimed Redemption less than 3 yrs 1,327.8942 1,286.7035
Unclaimed Redemption more than 3 yrs 1,000.0000 1,000.0000
Key Statistics for the year ended March 31, 2021 (Contd...)
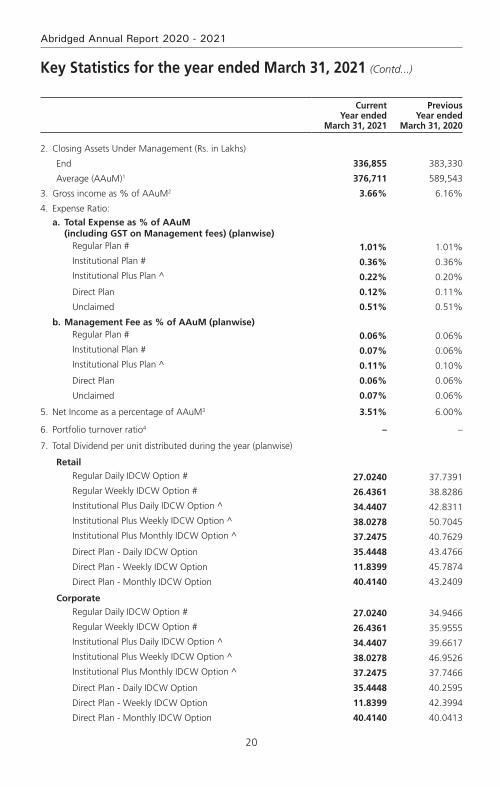
20
Abridged Annual Report 2020 - 2021
Current Year ended
March 31, 2021
Previous Year ended
March 31, 2020
2. Closing Assets Under Management (Rs. in Lakhs)
End 336,855 383,330
Average (AAuM)1 376,711 589,543
3. Gross income as % of AAuM2 3.66% 6.16%
4. Expense Ratio:
a. total expense as % of aaum (including gSt on management fees) (planwise)
Regular Plan # 1.01% 1.01%Institutional Plan # 0.36% 0.36%Institutional Plus Plan ^ 0.22% 0.20%
Direct Plan 0.12% 0.11%
Unclaimed 0.51% 0.51%
b. management fee as % of aaum (planwise)Regular Plan # 0.06% 0.06%Institutional Plan # 0.07% 0.06%Institutional Plus Plan ^ 0.11% 0.10%
Direct Plan 0.06% 0.06%
Unclaimed 0.07% 0.06%
5. Net Income as a percentage of AAuM3 3.51% 6.00%
6. Portfolio turnover ratio4 – –
7. Total Dividend per unit distributed during the year (planwise)
RetailRegular Daily IDCW Option # 27.0240 37.7391Regular Weekly IDCW Option # 26.4361 38.8286Institutional Plus Daily IDCW Option ^ 34.4407 42.8311Institutional Plus Weekly IDCW Option ^ 38.0278 50.7045Institutional Plus Monthly IDCW Option ^ 37.2475 40.7629
Direct Plan - Daily IDCW Option 35.4448 43.4766
Direct Plan - Weekly IDCW Option 11.8399 45.7874
Direct Plan - Monthly IDCW Option 40.4140 43.2409
CorporateRegular Daily IDCW Option # 27.0240 34.9466Regular Weekly IDCW Option # 26.4361 35.9555Institutional Plus Daily IDCW Option ^ 34.4407 39.6617Institutional Plus Weekly IDCW Option ^ 38.0278 46.9526Institutional Plus Monthly IDCW Option ^ 37.2475 37.7466
Direct Plan - Daily IDCW Option 35.4448 40.2595
Direct Plan - Weekly IDCW Option 11.8399 42.3994
Direct Plan - Monthly IDCW Option 40.4140 40.0413
Key Statistics for the year ended March 31, 2021 (Contd...)

21
HSBC Cash Fund
Key Statistics for the year ended March 31, 2021 (Contd...)
Current Year ended
March 31, 2021
Previous Year ended
March 31, 2020
8. Returns (%):
a. Last One Year
Scheme
Regular Growth Option # N.A. 5.2304
Institutional Growth Option # N.A. N.A.
Institutional Plus Growth Option ^ 3.5000 6.0800
Direct Plan - Growth Option 3.6100 6.1700
Benchmark
CRISIl Liquid Fund Index 4.0700 6.3700
b. Since Inception
Scheme
Regular Growth Option # N.A. 6.3400
Institutional Growth Option # N.A. N.A.
Institutional Plus Growth Option ^ 7.4800 7.9400
Direct Plan - Growth Option 7.3000 7.8200
Benchmark
CRISIL Liquid Fund Index 7.5100 7.9000
# Plans Discontinued for fresh subscription
^ Institutional Plus plan is (Regular continue Plan) available for fresh subscription w.e.f. October 01, 2012.1. AAuM = Average daily net assets2. Gross income = amount against (A) in the Revenue account i.e. Income3. Net income = amount against (C) in the Revenue account i.e. Net Realised Gains / (Losses) for the year4. Portfolio Turnover = Lower of sales or purchase divided by the Average AuM for the year
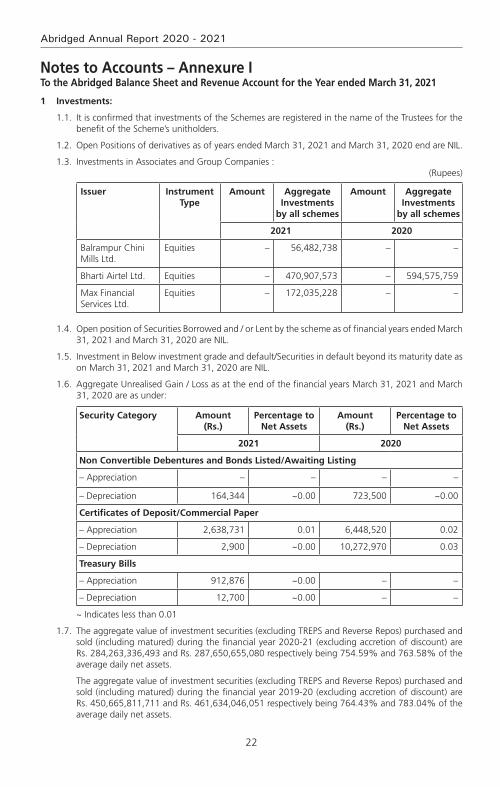
22
Abridged Annual Report 2020 - 2021
Notes to Accounts – Annexure ITo the Abridged Balance Sheet and Revenue Account for the Year ended March 31, 2021
1 Investments:
1.1. It is confirmed that investments of the Schemes are registered in the name of the Trustees for the benefit of the Scheme’s unitholders.
1.2. Open Positions of derivatives as of years ended March 31, 2021 and March 31, 2020 end are NIL.
1.3. Investments in Associates and Group Companies :(Rupees)
Issuer Instrument Type
Amount Aggregate Investments
by all schemes
Amount Aggregate Investments
by all schemes
2021 2020
Balrampur Chini Mills Ltd.
Equities – 56,482,738 – –
Bharti Airtel Ltd. Equities – 470,907,573 – 594,575,759
Max Financial Services Ltd.
Equities – 172,035,228 – –
1.4. Open position of Securities Borrowed and / or Lent by the scheme as of financial years ended March 31, 2021 and March 31, 2020 are NIL.
1.5. Investment in Below investment grade and default/Securities in default beyond its maturity date as on March 31, 2021 and March 31, 2020 are NIL.
1.6. Aggregate Unrealised Gain / Loss as at the end of the financial years March 31, 2021 and March 31, 2020 are as under:
Security Category Amount (Rs.)
Percentage to Net Assets
Amount (Rs.)
Percentage to Net Assets
2021 2020
Non Convertible Debentures and Bonds Listed/Awaiting Listing
– Appreciation – – – –
– Depreciation 164,344 ~0.00 723,500 ~0.00
Certificates of Deposit/Commercial Paper
– Appreciation 2,638,731 0.01 6,448,520 0.02
– Depreciation 2,900 ~0.00 10,272,970 0.03
Treasury Bills
– Appreciation 912,876 ~0.00 – –
– Depreciation 12,700 ~0.00 – –
~ Indicates less than 0.01
1.7. The aggregate value of investment securities (excluding TREPS and Reverse Repos) purchased and sold (including matured) during the financial year 2020-21 (excluding accretion of discount) are Rs. 284,263,336,493 and Rs. 287,650,655,080 respectively being 754.59% and 763.58% of the average daily net assets.
The aggregate value of investment securities (excluding TREPS and Reverse Repos) purchased and sold (including matured) during the financial year 2019-20 (excluding accretion of discount) are Rs. 450,665,811,711 and Rs. 461,634,046,051 respectively being 764.43% and 783.04% of the average daily net assets.

23
HSBC Cash Fund
1.8. Non-Traded securities in the portfolio: Aggregate Value of Equity, Debt & Money Market Instruments and percentage to net assets is as under:
Security Category Amount (Rs.)
Percentage to Net Assets
Amount (Rs.)
Percentage to Net Assets
2021 2020
Debt Instruments 572,987,100 1.70% 501,222,500.00 1.31%
Money Market Instruments
19,523,158,500 57.96% 30,266,814,960 78.96%
2 Disclosure Under Regulation 25(8) of the Securities and Exchange Board of India (Mutual Funds) Regulations, 1996 as amended.
Details of amounts paid to associates in terms of Regulation 25 (8) are as follows :
Commission paid to Sponsor/AMC and its associates/related parties/group companies
Name of Sponsor/AMC and its associates/related parties/group companies
Nature of Association / Nature of
Relation
Period Covered
Business Given [Rs. In Crores]
% of Total Business
received by the Fund
Commission paid [Rs.]
% of Total commission paid by the
Fund
The Hongkong and Shanghai Banking Corporation Limited
Associate of the Investment Manager
2020-2021 692.51 3.04 2,525,595 48.67
Name of Sponsor/AMC and its associates/related parties/group companies
Nature of Association / Nature of
Relation
Period Covered
Business Given [Rs. In Crores]
% of Total Business
received by the Fund
Commission paid [Rs.]
% of Total commission paid by the
Fund
The Hongkong and Shanghai Banking Corporation Limited
Associate of the Investment Manager
2019-2020 1,125.66 0.83 2,879,357 47.01
Brokerage paid to Sponsor/AMC and its associates/related parties/group companies is NIL. (Previous year also NIL).
The brokerage paid was at rates similar to those offered to other distributors. And the Commission/Brokerage paid to related party includes both upfornt and trail and hence not comparable with the % of business brought and % of commission paid.
Further, The Hongkong and Shanghai Banking Corporation Limited, an associate of the Sponsor, is on the panel of bankers with whom HSBC Mutual Fund places money on fixed deposits and enters into reverse repo transactions from time to time at competitive rates.
(i) Any underwriting obligations undertaken by the schemes of the mutual funds with respect to issue of securities associate companies - Nil (Previous year also Nil).
(ii) Devolvement - Nil (Previous year also Nil).
(iii) Subscription by the schemes in the issues lead managed by associate companies - Nil (Previous year also Nil).
(iv) Subscription to any issue of equity or debt on private placement basis where the sponsor or its associate companies have acted as arranger or manager - Nil (Previous year also Nil).
Notes to Accounts – Annexure I (Contd...)To the Abridged Balance Sheet and Revenue Account for the Year ended March 31, 2021
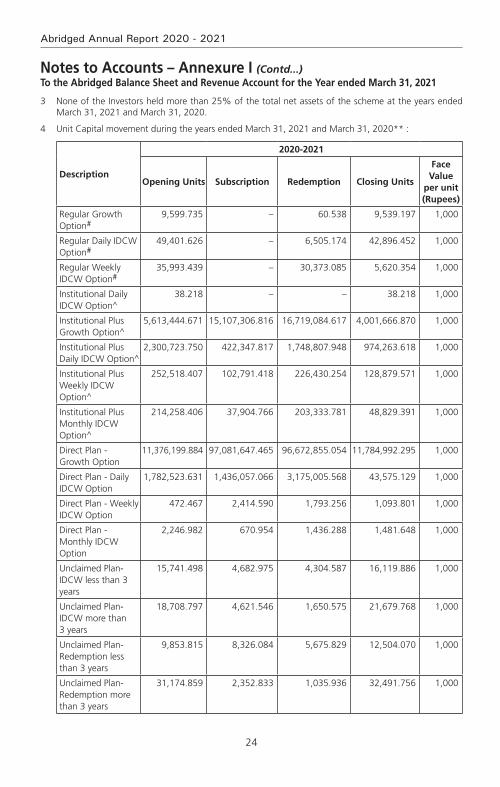
24
Abridged Annual Report 2020 - 2021
3 None of the Investors held more than 25% of the total net assets of the scheme at the years ended March 31, 2021 and March 31, 2020.
4 Unit Capital movement during the years ended March 31, 2021 and March 31, 2020** :
Description
2020-2021
Opening Units Subscription Redemption Closing Units
Face Value
per unit (Rupees)
Regular Growth Option#
9,599.735 – 60.538 9,539.197 1,000
Regular Daily IDCW Option#
49,401.626 – 6,505.174 42,896.452 1,000
Regular Weekly IDCW Option#
35,993.439 – 30,373.085 5,620.354 1,000
Institutional Daily IDCW Option^
38.218 – – 38.218 1,000
Institutional Plus Growth Option^
5,613,444.671 15,107,306.816 16,719,084.617 4,001,666.870 1,000
Institutional Plus Daily IDCW Option^
2,300,723.750 422,347.817 1,748,807.948 974,263.618 1,000
Institutional Plus Weekly IDCW Option^
252,518.407 102,791.418 226,430.254 128,879.571 1,000
Institutional Plus Monthly IDCW Option^
214,258.406 37,904.766 203,333.781 48,829.391 1,000
Direct Plan - Growth Option
11,376,199.884 97,081,647.465 96,672,855.054 11,784,992.295 1,000
Direct Plan - Daily IDCW Option
1,782,523.631 1,436,057.066 3,175,005.568 43,575.129 1,000
Direct Plan - Weekly IDCW Option
472.467 2,414.590 1,793.256 1,093.801 1,000
Direct Plan - Monthly IDCW Option
2,246.982 670.954 1,436.288 1,481.648 1,000
Unclaimed Plan- IDCW less than 3 years
15,741.498 4,682.975 4,304.587 16,119.886 1,000
Unclaimed Plan- IDCW more than 3 years
18,708.797 4,621.546 1,650.575 21,679.768 1,000
Unclaimed Plan- Redemption less than 3 years
9,853.815 8,326.084 5,675.829 12,504.070 1,000
Unclaimed Plan- Redemption more than 3 years
31,174.859 2,352.833 1,035.936 32,491.756 1,000
Notes to Accounts – Annexure I (Contd...)To the Abridged Balance Sheet and Revenue Account for the Year ended March 31, 2021
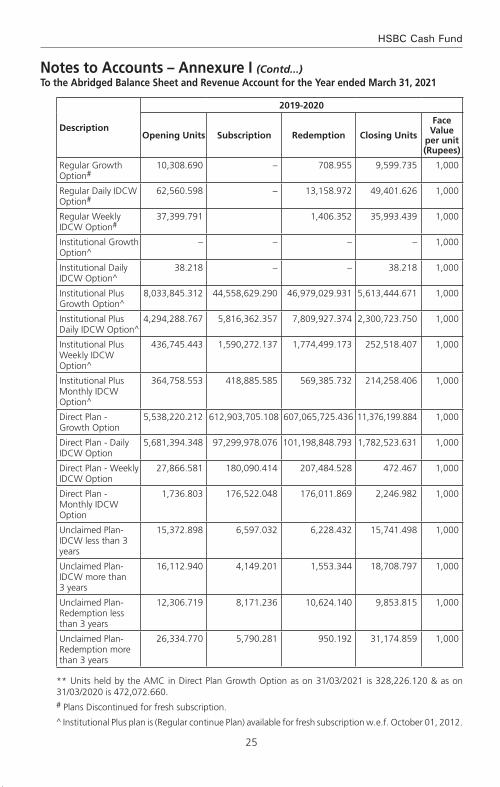
25
HSBC Cash Fund
Notes to Accounts – Annexure I (Contd...)To the Abridged Balance Sheet and Revenue Account for the Year ended March 31, 2021
Description
2019-2020
Opening Units Subscription Redemption Closing Units
Face Value
per unit (Rupees)
Regular Growth Option#
10,308.690 – 708.955 9,599.735 1,000
Regular Daily IDCW Option#
62,560.598 – 13,158.972 49,401.626 1,000
Regular Weekly IDCW Option#
37,399.791 1,406.352 35,993.439 1,000
Institutional Growth Option^
– – – – 1,000
Institutional Daily IDCW Option^
38.218 – – 38.218 1,000
Institutional Plus Growth Option^
8,033,845.312 44,558,629.290 46,979,029.931 5,613,444.671 1,000
Institutional Plus Daily IDCW Option^
4,294,288.767 5,816,362.357 7,809,927.374 2,300,723.750 1,000
Institutional Plus Weekly IDCW Option^
436,745.443 1,590,272.137 1,774,499.173 252,518.407 1,000
Institutional Plus Monthly IDCW Option^
364,758.553 418,885.585 569,385.732 214,258.406 1,000
Direct Plan - Growth Option
5,538,220.212 612,903,705.108 607,065,725.436 11,376,199.884 1,000
Direct Plan - Daily IDCW Option
5,681,394.348 97,299,978.076 101,198,848.793 1,782,523.631 1,000
Direct Plan - Weekly IDCW Option
27,866.581 180,090.414 207,484.528 472.467 1,000
Direct Plan - Monthly IDCW Option
1,736.803 176,522.048 176,011.869 2,246.982 1,000
Unclaimed Plan- IDCW less than 3 years
15,372.898 6,597.032 6,228.432 15,741.498 1,000
Unclaimed Plan- IDCW more than 3 years
16,112.940 4,149.201 1,553.344 18,708.797 1,000
Unclaimed Plan- Redemption less than 3 years
12,306.719 8,171.236 10,624.140 9,853.815 1,000
Unclaimed Plan- Redemption more than 3 years
26,334.770 5,790.281 950.192 31,174.859 1,000
** Units held by the AMC in Direct Plan Growth Option as on 31/03/2021 is 328,226.120 & as on 31/03/2020 is 472,072.660.
# Plans Discontinued for fresh subscription.
^ Institutional Plus plan is (Regular continue Plan) available for fresh subscription w.e.f. October 01, 2012.
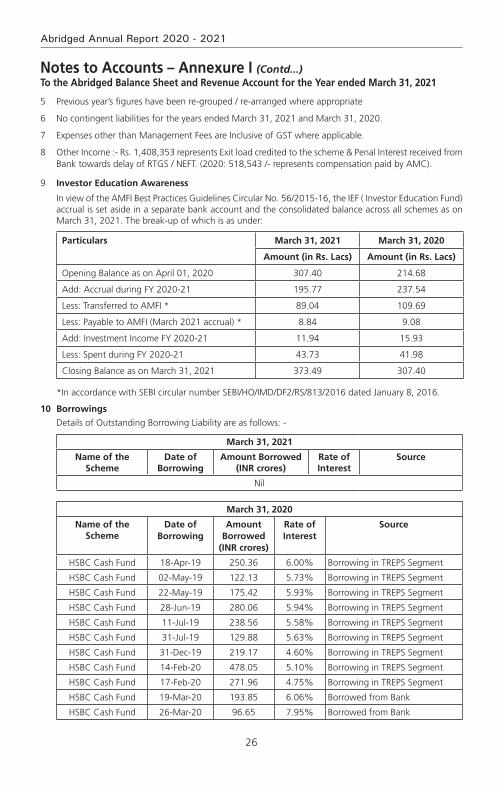
26
Abridged Annual Report 2020 - 2021
5 Previous year’s figures have been re-grouped / re-arranged where appropriate
6 No contingent liabilities for the years ended March 31, 2021 and March 31, 2020.
7 Expenses other than Management Fees are Inclusive of GST where applicable.
8 Other Income :- Rs. 1,408,353 represents Exit load credited to the scheme & Penal Interest received from Bank towards delay of RTGS / NEFT. (2020: 518,543 /- represents compensation paid by AMC).
9 Investor Education Awareness
In view of the AMFI Best Practices Guidelines Circular No. 56/2015-16, the IEF ( Investor Education Fund) accrual is set aside in a separate bank account and the consolidated balance across all schemes as on March 31, 2021. The break-up of which is as under:
Particulars March 31, 2021 March 31, 2020
Amount (in Rs. Lacs) Amount (in Rs. Lacs)
Opening Balance as on April 01, 2020 307.40 214.68
Add: Accrual during FY 2020-21 195.77 237.54
Less: Transferred to AMFI * 89.04 109.69
Less: Payable to AMFI (March 2021 accrual) * 8.84 9.08
Add: Investment Income FY 2020-21 11.94 15.93
Less: Spent during FY 2020-21 43.73 41.98
Closing Balance as on March 31, 2021 373.49 307.40
*In accordance with SEBI circular number SEBI/HO/IMD/DF2/RS/813/2016 dated January 8, 2016.
10 Borrowings
Details of Outstanding Borrowing Liability are as follows: -
March 31, 2021
Name of the Scheme
Date of Borrowing
Amount Borrowed (INR crores)
Rate of Interest
Source
Nil
March 31, 2020
Name of the Scheme
Date of Borrowing
Amount Borrowed
(INR crores)
Rate of Interest
Source
HSBC Cash Fund 18-Apr-19 250.36 6.00% Borrowing in TREPS Segment
HSBC Cash Fund 02-May-19 122.13 5.73% Borrowing in TREPS Segment
HSBC Cash Fund 22-May-19 175.42 5.93% Borrowing in TREPS Segment
HSBC Cash Fund 28-Jun-19 280.06 5.94% Borrowing in TREPS Segment
HSBC Cash Fund 11-Jul-19 238.56 5.58% Borrowing in TREPS Segment
HSBC Cash Fund 31-Jul-19 129.88 5.63% Borrowing in TREPS Segment
HSBC Cash Fund 31-Dec-19 219.17 4.60% Borrowing in TREPS Segment
HSBC Cash Fund 14-Feb-20 478.05 5.10% Borrowing in TREPS Segment
HSBC Cash Fund 17-Feb-20 271.96 4.75% Borrowing in TREPS Segment
HSBC Cash Fund 19-Mar-20 193.85 6.06% Borrowed from Bank
HSBC Cash Fund 26-Mar-20 96.65 7.95% Borrowed from Bank
Notes to Accounts – Annexure I (Contd...)To the Abridged Balance Sheet and Revenue Account for the Year ended March 31, 2021
27
HSBC Cash Fund
As per Regulation 44(2) of SEBI (Mutual Funds) Regulations, 1996, mutual funds are permitted to borrow only to meet temporary liquidity needs of the mutual funds for the purpose of repurchase, redemption of units or payment of dividend etc. AMFI vide its Best Practice guidelines circular no. 71/2017-18 dated Mar 23, 2018 recommended that cost of borrowing made to manage redemptions to the extent of YTM/running yield of the fund as on previous day should be charged to the scheme and any excess cost over YTM/running yield of the previous day may be borne by the AMC. Accordingly AMC has borne Rs 1,00,377/-.
HSBC Mutual fund has adhered to the recommended practice from the date of the AMFI circular.
11 Garnishee Notice from Income Tax Authorities
During the financial year 2011-12, an Income tax demand of Rs. 32.58 crores was purported to be recovered under garnishee proceedings, by Income Tax Authorities in respect of investments made in Pass through Certificates (PTC) by some of the debt schemes (including matured schemes) of HSBC Mutual Fund (HSBC MF), for A.Y. 2009-2010. The said demand, impacting various mutual fund players in the industry, raised originally on the trusts sponsored by IL&FS Trust Company Ltd., (Appellants) was sought to be also recovered u/s 177(3) of the Income Tax Act, from HSBC MF.
Similar to AY 2009-10, HSBC MF had received a demand notice from the Income Tax authorities for AY 2010-11 for Rs. 6.95 crores.
Further, assessment for the A.Y. 2007-2008 was also been reopened by the Income Tax Authorities and demand of Rs. 2.04 Crores was made on the trust sponsored by IL&FS Trust Company Ltd. HSBC MF has not received any demand notice from the Income Tax authorities for this assessment year.
Against all the above demands, an appeal was filed by the Appellant with the first Appellate Authority CIT(A) and thereafter with ITAT.
The matter of several Loan Trusts were consolidated and heard by ITAT and vide order dated 17th Feb 2017, the Income Tax Appellate Tribunal (ITAT) passed an order allowing the appeal of the assesse and dismissed the appeal of the Revenue.
The Department has filed rectification applications under section 254(2) of the Income Tax Act with ITAT against the favourable orders passed by ITAT on the ground that the Income Tax Appellate Tribunal has failed to consider all aspects of revenue contentions/appeal.
The hearing for the said matter is scheduled on September 24, 2021.
12 Following the spread of the coronavirus, on 11 March 2020, the World Health Organization declared the COVID-19 outbreak to be a pandemic. The identification of the virus as a new coronavirus, its subsequent spread and the situation of lock-down across India is considered as a significant event. HSBC Mutual Fund’s operations are included in essential services and have continued through the lock-downs declared by the Government. Service providers like the Registrar and Transfer Agent, Custodian and Fund Accountant have carried out extensive arrangements to address business needs and continuity of operations. As on the date of signing of these financial statements, Management believes that it has taken into account, all the possible impact of known events arising from COVID-19 pandemic in the preparation of the financial statements and there appears to be no uncertainties relating to the going concern of any of the Schemes of the Fund for a foreseeable future. However, COVID-19 pandemic is an ongoing situation and any estimate of its impact is dependent on the future intensity, spread and duration of the situation. The Management will continue to closely monitor the situation for any material changes which may impact the Schemes of the Fund.
13 Disclosure of Risk-o-meter
Scheme Name Risk-o-meter level as on December
31,2020^
Risk-o-meter level at end of the financial year
Number of changes in Risk-o-meter during the financial year^
HSBC Cash Fund Low to Moderate Low to Moderate 0
^From the effective date (i.e. January 01, 2021) of SEBI circular no. SEBI/HO/IMD/DF3/CIR/P/2020/197 dated October 05, 2020.
Notes to Accounts – Annexure I (Contd...)To the Abridged Balance Sheet and Revenue Account for the Year ended March 31, 2021

28
Abridged Annual Report 2020 - 2021
14 Pursuant to SEBI Circular No. SEBI/HO/IMD/DF3/CIR/P/2020/194 dated October 05, 2020, the nomenclature of ‘Dividend Option’ under all the schemes of HSBC Mutual Fund has been revised to ‘Income Distribution cum Capital Withdrawal Option’ (IDCW), with effect from April 01, 2021.
15 The Annual Accounts of the Schemes prepared in accordance with the accounting policies and standards specified in the Ninth Schedule of The Securities and Exchange Board of India (Mutual Funds) Regulations, 1996 has been approved by the Board of Directors of HSBC Asset Management (India) Private Limited and The Board of Trustees of HSBC Mutual Fund at their meetings held on July 19, 2021 and July 20, 2021 respectively. The audit report attached herewith refers to the said Annual Accounts. The aforesaid abridged accounts are an extract of the Annual Accounts and are prepared in accordance with SEBI Circular No. IMD/Cir8/132968/2008 dated July 24, 2008.
Notes to Accounts – Annexure I (Contd...)To the Abridged Balance Sheet and Revenue Account for the Year ended March 31, 2021

29
HSBC Cash Fund
Voting Policy and Procedures
In view of SEBI guidelines related to “Role of Mutual Funds in Corporate Governance of Public Listed Companies”, HSBC AMC has formulated its “Policy for Proxy Voting in Public Listed Companies”. The said policy is available on our website and the details of actual exercise of proxy votes, the summary of votes casted and the auditor’s certificate for the Financial Year 2020 – 21 is forming part of our full Annual Report for the Financial Year 2020 – 21 which is uploaded on our website at http://www.assetmanagement.hsbc.co.in

30
Abridged Annual Report 2020 - 2021
Statutory Details & Disclaimers
All the returns have been sourced from Mutual Funds India Explorer software. The performance of the schemes and the benchmark is calculated on a total return basis. This document has been prepared by HSBC Asset Management (India) Private Ltd (HSBC) for information purposes only and should not be construed as i) an offer or recommendation to buy or sell securities, commodities, currencies or other investments referred to herein; or ii) an offer to sell or a solicitation or an offer for purchase of any of the funds of HSBC Mutual Fund; or iii) an investment research or investment advice. All information contained in this document (including that sourced from third parties), is obtained from sources HSBC and the third party which HSBC believes to be reliable however, has not independently verified the same. The information and opinions contained within the document are based upon publicly available information and rates of taxation applicable (if any) at the time of publication, which are subject to change from time to time.
Expressions of opinion are those of HSBC only and are subject to change without notice. It does not have regard to specific investment objectives, financial situation and the particular needs of any specific person who may receive this document. Investors should seek personal and independent advice regarding the appropriateness of investing in any of the funds, securities, other investment or investment strategies that may have been discussed or referred herein and should understand that the views regarding future prospects may or may not be realized. In no event shall HSBC Mutual Fund / HSBC Asset management (India) Private Limited and / or its affiliates or any of their directors, trustees, officers and employees be liable for any direct, indirect, special, incidental or consequential damages arising out of the use of information / opinion herein. Neither this document nor the units of HSBC Mutual Fund have been registered in any jurisdiction. The distribution of this document in certain jurisdictions may be restricted or totally prohibited and accordingly, persons who come into possession of this document are required to inform themselves about, and to observe, any such restrictions.
mutual fund investments are subject to market risks, read all scheme related documents carefully.
HSBC Ultra Short Duration FundAn open ended ultra-short term debt scheme investing in instruments such that the Macaulay Duration of the portfolio is between 3 months to 6 months
Abridged Annual Report 2020 - 2021

1
HSBC Ultra Short Duration Fund
Dear Investor,
The beginning of the last financial year now almost seems like a distant memory. COVID-19 was still a relatively unknown enemy and governments across the world were grappling with ways to control and mitigate the risks associated with it. Nationwide lockdowns were the norm and our markets both equity and fixed income reacted negatively leading to significant erosion of wealth. Within a short period of time markets bounced back. This confounded even the most astute market pundits. How is it possible that when GDP growth had slowed down, unemployment had risen, inflation was high could there be such sharp up move in equity indices. Whilst the reasons are well known about easy global liquidity, demand resurgence, cost cutting by corporates etc. perhaps its most important to remember that the markets are not a reflector but a predictor of economic activity.
At all times particularly during such volatile times it is important to go back to the basics. Why do you save, why do you invest, what goals would you like to achieve, how old are you, what is your risk appetite? The replies to these simple questions will help you determine your asset allocation. As an example when equity markets corrected sharply last year, investors who reviewed their asset allocation, stayed invested during the lows of the past year and were able to capture the rebound and have seen prime returns since then. The current market movement in all likelihood would have also led to some imbalances in your asset allocation. Do not ignore that and I strongly recommend that you do review this with your advisor to check whether re-balancing is required.
During this financial year we had three very successful new fund launches. The pandemic showed us a clear trend of dominant players becoming stronger and profit pool getting consolidated within a few companies. To capture this opportunity, we launched the HSBC Focused Equity Fund which garnered close to Rs. 520 crores. During the second half of 2020, in the fixed income space, 3 - 5 year duration range had a favourable investment scenario as RBI’s accommodative policy and surplus liquidity had reduced the returns at the very short end of the yield curve. There was a demand for an actively managed moderate duration strategy with better credit quality which we fulfilled by launching HSBC Corporate Bond Fund. It garnered over 700 crores. Our latest and first of its kind offering, HSBC Global Equity Climate Change Fund of Fund saw a stupendous response with over 8000 investors investing over Rs. 616 crores. This is an investment opportunity which goes beyond the rationale of simply generating investment returns and is the future of responsible investing.
We worked towards augmenting our digital capabilities by launching a few key enhancements to our online transaction platform. Being mindful of the movement restrictions in place, this year we focused on digitizing offline processes so that an investor need not need step out of her home for investing or availing any key services. While our interactive chatbot AskMe, eased service queries, our end-to-end digital KYC module enabled a first time Mutual Fund investor to invest in our funds without any paperwork. We listened to your feedback and digitized consolidation of folios and change of tax status which eliminated the need for you to physically visit our branches.
I am a strong believer in the India story and this story has just begun. The opportunity to invest in this high growth market is a very exciting opportunity. I do hope you share my enthusiasm and I ask that you continue to invest whilst reviewing your asset allocation at all times. As always thank you for your business. Stay safe.
Warm regards,
Ravi MenonChief Executive Officer,
HSBC Asset Management India

2
Abridged Annual Report 2020 - 2021
SPONSOR
HSBC Securities and Capital Markets (India) Private LimitedRegd. Office: 52/60, Mahatma Gandhi Road, Fort, Mumbai - 400 001.
TRUSTEE
Board of TrusteesOffice: 16, Veer Nariman Road, Fort, Mumbai 400 001.
ASSET MANAGEMENT COMPANY
HSBC Asset Management (India) Private LimitedCorp. & Regd. Office: 16, Veer Nariman Road, Fort, Mumbai 400 001.
CUSTODIAN
Standard Chartered Bank (SCB)Corp. & Regd. Office: Crescenzo, Securities Services, 3rd Floor, C-38/39, G-Block,Bandra Kurla Complex, Bandra East, Mumbai – 400051.
AUDITORS TO THE SCHEME
BSR & Co. LLPChartered Accountants
5th Floor, Lodha Excelus, Apollo Mills Compound, N. M. Joshi Marg, Mahalaxmi, Mumbai 400 011.
REGISTRAR & TRANSFER AGENTS
Computer Age Management Services Limited (CAMS)Unit: HSBC Mutual Fund ’C’ Block, 2nd Floor, Hanudev Info Park P. Ltd., SF No. 558/2, Udayampalayam Road, Nava India, Coimbatore - 641 028.
BOARD OF TRUSTEES
Ms. Jasmine Batliwalla - Chairperson
Mr. Nani Javeri - Trustee
Dr. T. C. Nair - Trustee
Mr. Pedro Bastos - Trustee
BOARD OF DIRECTORS
Mr. Dinesh Mittal - Director
Dr. Indu Shahani - Director
Mr. Ravi Menon - Director & Chief Executive Officer

3
HSBC Ultra Short Duration Fund
The Trustees of HSBC Mutual Fund (“Fund”) present the Nineteenth Annual Report and the audited abridged financial statements of the schemes of the Fund for the year ended March 31, 2021.
As at March 31, 2021, the Fund offered 37 schemes across asset classes to meet the varying investment needs of the investors. During FY 2020-2021, the Fund has launched various new products namely HSBC Corporate Bond Fund, HSBC Focused Equity Fund and HSBC Global Equity Climate Change Fund of Fund to fill the gaps in our product offering.
The Fund continues its focus on delivering consistent long term returns. The comments on the performance of the Scheme(s) is provided hereinafter. Dividends were declared under various schemes as per the provisions contained in the respective Scheme Information Documents after considering the distributable surplus available under the respective Schemes. Details of dividends declared can be viewed on our website at www.assetmanagement.hsbc.co.in.
1. Scheme Performance, future outlook and oPerationS of the SchemeS
a. operations and Performance of the Schemes
hSBc ultra Short duration fund (huSdf)@
(an open ended ultra-short term debt scheme investing in instruments such that the macaulay duration of the portfolio is between 3 months to 6 months)
HUSDF seeks to provide liquidity and generate reasonable returns with low volatility through investment in a portfolio comprising of debt & money market instruments. However, there is no assurance that the investment objective of the scheme will be achieved.
The net assets of HSBC Ultra Short Duration Fund amounted to Rs. 583.00 crores as at March 31, 2021 as compared to Rs. 475.75 crores as at March 31,2020. The entire net assets were invested in debt and money market instruments as at March 31, 2021. The scheme was launched on January 29, 2020.
HUSTBF underperformed its benchmark due to conservative investments and limiting overall investment tenor up to 1 year. HUSTF exposure being only on long term AAA rated credit led to underperformance versus index.
date of inception : 29 January 2020 absolute returns
(%)
compounded annualized returns (%)
Scheme name & Benchmarks 1 Year 3 Years 5 Years Since inception
HSBC Ultra Short Duration Fund - Growth 4.87 NA NA 4.94
CRISIL Ultra Short Term Debt Index (Scheme Benchmark) 5.41 NA NA 5.62
NIFTY Ultra Short Duration Debt Index (Standard Benchmark)
4.91 NA NA 5.10
CRISIL 1 Year T-Bill Index (Standard Benchmark)* 4.66 NA NA 5.39
Rs. 10,000, if invested in HUSDF, would have become 10,487 NA NA 10,580
Rs. 10,000, if invested in CRISIL Ultra Short Term Debt Index, would have become
10,541 NA NA 10,661
Rs. 10,000, if invested in NIFTY Ultra Short Duration Debt Index, would have become
10,491 NA NA 10,599
Rs. 10,000, if invested in CRISIL 1 Year T-Bill Index, would have become
10,466 NA NA 10,635
Past performance may or may not be sustained in future. The returns for the respective periods are provided as on last business day of March 2021 for Growth Option. Different plans shall have a different expense structure. Performance of the respective
benchmark is calculated as per the Total Return Index (TRI).
Trustees’ ReportFor the year ended March 31, 2021

4
Abridged Annual Report 2020 - 2021
b. market overview & outlook (as furnished by hSBc asset management (india) Private limited)
equitY outlook
recap of fY 2020-21:
Fiscal 2020-21 was a rewarding year for equity investors with market indices recording stellar gains from the low base after the COVID correction. Market sentiments steadily improved during the course of the year to deliver positive returns in all four quarters of the year.
We witnessed various legs of market performance during the last fiscal, driven by multiple factors and variables. Initial rebound from the market lows was driven by attractive valuations, then it was on the back of faster than anticipated recovery post lockdown, reopening optimism, swifter than expected vaccine intervention and above all, the unprecedented liquidity. Lastly but importantly, a period of lower cost of capital coupled with low real rates, improved the attractiveness of equity as an asset class, driving the performance.
As a result, the year ended with optimism compared to despair when it began. Corporate India overcame the challenges posed by COVID through significant cost control measures while at the same time showed improvement in their financial position and cash flows.
Commodities also rallied from the lows of the COVID crisis with global crude oil prices surging by 179% during the year. INR appreciated by 3.3% (as India recorded strong net FPI inflows) during the year. MSCI India index outperformed most of key global indices during the past fiscal. MSCI India index (USD) gained 74.8% as compared to 51.8% for MSCI World, 50.5% for Dow Jones, 55.1% for MSCI Emerging Markets, 41.2% for MSCI China and 42% for MSCI Europe*.
At a record USD 37.3 bn of net FPI inflows during the fiscal, the tally was higher than the cumulative net inflows India received from the previous 6 years. DIIs on the other hand saw net outflows of USD 18.4 bn and this was the first fiscal year of net outflows from the segment in 5 years. The net outflows from the segment was driven by USD 16.7 bn of outflows from the MFs while domestic insurers saw a far lower outflow of USD 1.6 bn*.
indices returns (april 1, 2020 to march 31, 2021) 1 Year^
S&P BSE Sensex TR 69.8%
NSE CNX Nifty TR 72.5%
S&P BSE 100 TR 73.5%
S&P BSE 200 TR 76.3%
S&P BSE 500 TR 78.6%
S&P BSE Midcap TR 93.0%
S&P BSE 250 Small-cap TR 117.5%
^Source: Bloomberg (Above table values are for total return indices)
Way forward:
Beginning of the new fiscal, India had to contend with the risk of the second COVID wave, which was more ferocious than the first wave on the human impact. However, as we write this, the second wave has already peaked and there have been a significant fall in number of active cases, case-positivity rate, daily new caseload and deaths. Vaccination drive also has seen acceleration with and is now closer to 6 mn doses per day mark. Also, the impact of the lockdown on economic activity has been significantly lower during the second wave, compared to last year. In most of the states, the unlocking process has already begun in a phased manner and this is leading to improvement in various activity indicators. Mobility indicators are recovering faster while economic indicators (freight, credit off-take, E-way bill generation, power demand etc.) are also witnessing a gradual recovery. The recently concluded earnings season has turned out to be in-line with expectations and despite the concerns of around the second wave, the earnings (Nifty) have seen upgrades for FY22. Market is looking beyond the current quarter (i.e. 1QFY22), which would witness
Trustees’ ReportFor the year ended March 31, 2021 (Contd...)

5
HSBC Ultra Short Duration Fund
an impact due to the second wave. Our baseline assumption is that of a temporary impact from the second wave and the set-back to the recovery process limited to a few months, after which we should see the economic rebound. So far, this is tracking in-line with assumptions.
From a macro perspective, the current estimates for GDP growth in FY22 stand at 9.2%* (after seeing downgrades to factor in the impact of second wave). The downgrade in estimates are pertaining to the first quarter and hence the trajectory of growth from hereon should pick up. The tax collections data for the first two months of FY22 has remained strong, implying that the drawdown of the second wave on the fiscal position is not alarming. Additionally, the impact of fiscal stimulus package announced in FY22 so far is manageable (about 60 bps of GDP) and hence would not lead to any fiscal strain.
After the spectacular rally, market valuations at an overall level are now trending above historical averages on traditional valuation metrics (P/E, P/B). This is true for all market capitalization categories (viz large, mid and small). Typically, the broader market (i.e. mid and small cap segments), trade at a discount to large caps, however this scenario has now reversed after the outperformance from the broader market segments. However, the earnings momentum continues to remain strong (witnessing upgrades so far) and except for a short period due to second wave, the earnings momentum should hold up.
We believe that the risk-reward is balanced for the equity markets in the near term. Higher or sticky inflation expectations globally, higher than historical market valuations on some parameters (i.e. P/E, P/B) and adverse demand impact from the second wave are risk factors to contend with in the near term. However, these are counter balanced by positive commentary from companies, significant decline in COVID cases and acceleration in the vaccination programme. As a result, in the near term markets may see a consolidation phase and could take cues from the upcoming earnings season with more focus on the corporate commentary and the outlook. From a medium to long term perspective, the outlook for equity markets remains positive. The expectation of cyclical revival in the economy brings in a multi-year earnings visibility. This along with a benign cost of capital environment, should support equity performance. However, equity returns are likely to moderate on the back of the relatively high valuations and the strong recovery we have already witnessed from the COVID lows. Equity performance is likely to mirror the earnings growth trends over the medium to long term.
Pace of vaccination, concerns about a third wave, corporate earnings trajectory, inflation trends (both global & domestic), monsoon trends and commodity prices (especially crude oil) are some of the key factors which could influence market performance in the short term.
From a portfolio perspective, we are maintaining a pro-cyclical bias. We expect earnings growth to rebound sharply post the current COVID phase. Earnings growth are expected to sustain in high-teens beyond FY22 on the back of economy witnessing a cyclical recovery due to revival in capex cycle over the next 2-3 years (first by the government followed by private capex). From a sectoral perspective our order of preference is rate sensitives followed by domestic cyclicals, exporters and domestic consumption. Predominantly regulated businesses come last in our pecking order. This preference is dictated by our assessment of sectors / segments leading contribution to the market earnings growth over the next 2-3 years. Our portfolio construction is driven by a bottom up approach to stock selection with a focus on names that can deliver positive earnings surprises. We continue to focus on this theme to identify likely outperformers.
*Source: Bloomberg
deBt outlook
market drivers during the course of the year fY21
The Fixed Income markets started the year with a bout of nervousness that was triggered by the pandemic. While RBI had calmed the markets with its large rate cut action of 75bp cut followed by liquidity supportive measures, the volatility continued until mid-May when government announced its relief package. While it was not fiscally expansive, it touched the right cords in terms of credit flow to desired sectors. This was followed up with RBI’s credit relief measures in terms of moratorium and restructuring of assets that were stressed due to the pandemic. Throughout the course of the year, RBI maintained its accommodative stance along with significant amount of surplus liquidity that was supportive and helped in maintaining stability in the market. However, as the year progressed and pressure on fiscal began to mount yields started seeing a spike towards the last quarter of the fiscal. While borrowing was stepped up to INR 12 trillion from previously budgeted
Trustees’ ReportFor the year ended March 31, 2021 (Contd...)
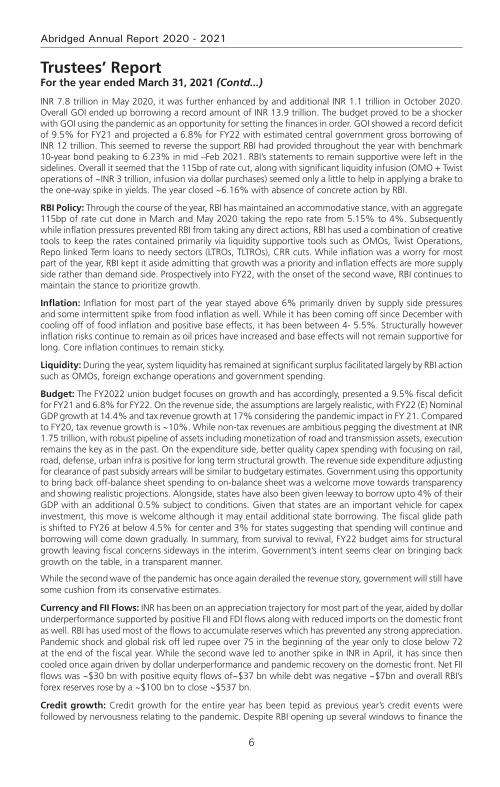
6
Abridged Annual Report 2020 - 2021
INR 7.8 trillion in May 2020, it was further enhanced by and additional INR 1.1 trillion in October 2020. Overall GOI ended up borrowing a record amount of INR 13.9 trillion. The budget proved to be a shocker with GOI using the pandemic as an opportunity for setting the finances in order. GOI showed a record deficit of 9.5% for FY21 and projected a 6.8% for FY22 with estimated central government gross borrowing of INR 12 trillion. This seemed to reverse the support RBI had provided throughout the year with benchmark 10-year bond peaking to 6.23% in mid –Feb 2021. RBI’s statements to remain supportive were left in the sidelines. Overall it seemed that the 115bp of rate cut, along with significant liquidity infusion (OMO + Twist operations of ~INR 3 trillion, infusion via dollar purchases) seemed only a little to help in applying a brake to the one-way spike in yields. The year closed ~6.16% with absence of concrete action by RBI.
rBi Policy: Through the course of the year, RBI has maintained an accommodative stance, with an aggregate 115bp of rate cut done in March and May 2020 taking the repo rate from 5.15% to 4%. Subsequently while inflation pressures prevented RBI from taking any direct actions, RBI has used a combination of creative tools to keep the rates contained primarily via liquidity supportive tools such as OMOs, Twist Operations, Repo linked Term loans to needy sectors (LTROs, TLTROs), CRR cuts. While inflation was a worry for most part of the year, RBI kept it aside admitting that growth was a priority and inflation effects are more supply side rather than demand side. Prospectively into FY22, with the onset of the second wave, RBI continues to maintain the stance to prioritize growth.
inflation: Inflation for most part of the year stayed above 6% primarily driven by supply side pressures and some intermittent spike from food inflation as well. While it has been coming off since December with cooling off of food inflation and positive base effects, it has been between 4- 5.5%. Structurally however inflation risks continue to remain as oil prices have increased and base effects will not remain supportive for long. Core inflation continues to remain sticky.
liquidity: During the year, system liquidity has remained at significant surplus facilitated largely by RBI action such as OMOs, foreign exchange operations and government spending.
Budget: The FY2022 union budget focuses on growth and has accordingly, presented a 9.5% fiscal deficit for FY21 and 6.8% for FY22. On the revenue side, the assumptions are largely realistic, with FY22 (E) Nominal GDP growth at 14.4% and tax revenue growth at 17% considering the pandemic impact in FY 21. Compared to FY20, tax revenue growth is ~10%. While non-tax revenues are ambitious pegging the divestment at INR 1.75 trillion, with robust pipeline of assets including monetization of road and transmission assets, execution remains the key as in the past. On the expenditure side, better quality capex spending with focusing on rail, road, defense, urban infra is positive for long term structural growth. The revenue side expenditure adjusting for clearance of past subsidy arrears will be similar to budgetary estimates. Government using this opportunity to bring back off-balance sheet spending to on-balance sheet was a welcome move towards transparency and showing realistic projections. Alongside, states have also been given leeway to borrow upto 4% of their GDP with an additional 0.5% subject to conditions. Given that states are an important vehicle for capex investment, this move is welcome although it may entail additional state borrowing. The fiscal glide path is shifted to FY26 at below 4.5% for center and 3% for states suggesting that spending will continue and borrowing will come down gradually. In summary, from survival to revival, FY22 budget aims for structural growth leaving fiscal concerns sideways in the interim. Government’s intent seems clear on bringing back growth on the table, in a transparent manner.
While the second wave of the pandemic has once again derailed the revenue story, government will still have some cushion from its conservative estimates.
currency and fii flows: INR has been on an appreciation trajectory for most part of the year, aided by dollar underperformance supported by positive FII and FDI flows along with reduced imports on the domestic front as well. RBI has used most of the flows to accumulate reserves which has prevented any strong appreciation. Pandemic shock and global risk off led rupee over 75 in the beginning of the year only to close below 72 at the end of the fiscal year. While the second wave led to another spike in INR in April, it has since then cooled once again driven by dollar underperformance and pandemic recovery on the domestic front. Net FII flows was ~$30 bn with positive equity flows of~$37 bn while debt was negative ~$7bn and overall RBI’s forex reserves rose by a ~$100 bn to close ~$537 bn.
credit growth: Credit growth for the entire year has been tepid as previous year’s credit events were followed by nervousness relating to the pandemic. Despite RBI opening up several windows to finance the
Trustees’ ReportFor the year ended March 31, 2021 (Contd...)
7
HSBC Ultra Short Duration Fund
non-AAA segment, there was very little fresh credit flowing that segment. Overall banking credit grew by only 6.5%. Risk appetite has however been improving from a complete risk aversion to opening up towards a calculated risk. Prospectively it is expected that once the pandemic risk abates, credit growth will resume primarily driven by government capex spending and demand recovery.
market outlook
The pandemic once again brought the country to a situation similar to last year and debt markets perhaps interpreted the same as a structural rise in rates. In the initial day’s post budget in Feb of 2021, market was expecting a concrete set of actions such as an OMO calendar from RBI, and RBI’s words alone failed to calm the market. The first auction of the fiscal year also saw a devolvement. However, RBI acted in the first policy of the year announcing a bond buyback program akin to QE (quantitative easing) and its subsequent cancellation of auctions wherein yields were perhaps quoted higher than RBI’s comfort levels brought back confidence into the market. Since then we have seen a strong rally with 10-year benchmark trending below 6% and the curve moving alongside. RBI reiteration of priority of growth and also supporting with higher than expected dividend payment stand out as a testimony of its support. While we do not expect RBI to act in terms of rate cuts, we believe that measures such as G-SAP, OMOs will continue until there is visibility of a structural growth. Therefore, the large borrowing program should go without any hiccups.
Furthermore, with the evidence of strong GST numbers until April 2021 (before the 2nd wave), it is expected that growth and therefore fiscal revenues will come back. Government’s conservative budget estimates are supportive. Also, given the fact that compared to last year there has not been a complete shutdown of activity (lockdowns being distributed), the impact on growth will not be similar to last year. Pent up demand will come back to support revenue collection. However, on the flipside, once growth resumes RBI will be forced to withdraw liquidity in a phased manner to prevent asset bubbles. Nevertheless, RBI need not act in terms of rate actions and we believe that a prolonged pause in terms of RBI rates is in the offing.
Net-net therefore while growth is wanting no matter what, it may come at a small price of rise in yields with liquidity withdrawal. That is however expected more in the 2nd half of the year. Lower than expected borrowing numbers, later this year or if not in next year could be a surprise. We may therefore see a range bound rate action in the near term with a rising bias over time. Global rate environment, oil and currency risks are to be watched out for.
2. Brief Background of SPonSorS, Board of truSteeS and aSSet management comPanY
a. Sponsor
HSBC Mutual Fund is sponsored by HSBC Securities and Capital Markets (India) Private Limited (HSCI). The Sponsor is the Settler of the Mutual Fund Trust. The Sponsor has entrusted a sum of Rs. 1,00,000/- (Rupees One Lakh only) to the Trustee as the initial contribution towards the corpus of the Mutual Fund.
HSCI offers integrated investment banking services, securities and corporate finance & advisory. HSCI is a member of the Bombay Stock Exchange Limited and National Stock Exchange (capital and derivative market segments). HSCI holds 100% of the paid up equity share capital of HSBC Asset Management (India) Private Limited.
b. hSBc mutual fund
HSBC Mutual Fund (“the Mutual Fund” or “the Fund”) has been constituted as a Trust in accordance with the provisions of the Indian Trusts Act, 1882 (2 of 1882) vide a Trust Deed dated February 7, 2002 with HSBC Securities and Capital Markets (India) Private Limited, as the Sponsor and the Board of Individual Trustees. The Trustee has entered into an Investment Management Agreement dated February 7, 2002 with HSBC Asset Management (India) Private Limited (AMC) to function as the Investment Manager for all the schemes of the Fund. The Fund was registered with SEBI vide registration number MF/046/02/5 dated May 27, 2002.
The Trust has been formed for the purpose of pooling of capital from the public for collective investment in securities for the purpose of providing facilities for participation by persons as beneficiaries in such investments and in the profits/income arising therefrom.
Trustees’ ReportFor the year ended March 31, 2021 (Contd...)
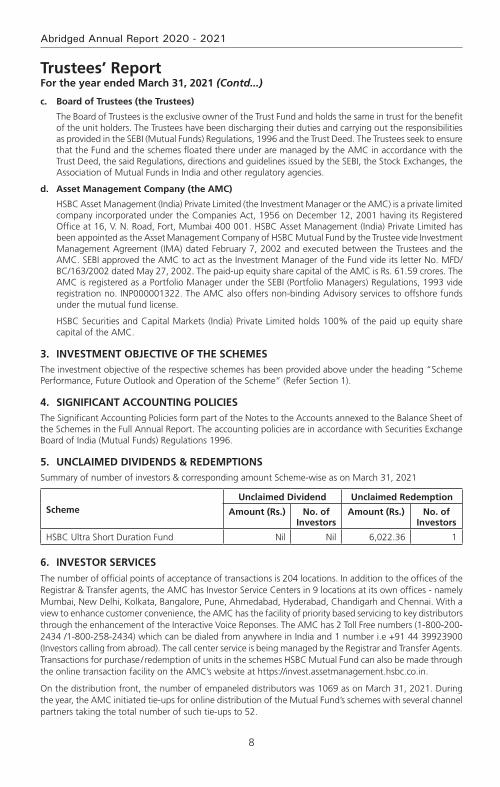
8
Abridged Annual Report 2020 - 2021
c. Board of trustees (the trustees)
The Board of Trustees is the exclusive owner of the Trust Fund and holds the same in trust for the benefit of the unit holders. The Trustees have been discharging their duties and carrying out the responsibilities as provided in the SEBI (Mutual Funds) Regulations, 1996 and the Trust Deed. The Trustees seek to ensure that the Fund and the schemes floated there under are managed by the AMC in accordance with the Trust Deed, the said Regulations, directions and guidelines issued by the SEBI, the Stock Exchanges, the Association of Mutual Funds in India and other regulatory agencies.
d. asset management company (the amc)
HSBC Asset Management (India) Private Limited (the Investment Manager or the AMC) is a private limited company incorporated under the Companies Act, 1956 on December 12, 2001 having its Registered Office at 16, V. N. Road, Fort, Mumbai 400 001. HSBC Asset Management (India) Private Limited has been appointed as the Asset Management Company of HSBC Mutual Fund by the Trustee vide Investment Management Agreement (IMA) dated February 7, 2002 and executed between the Trustees and the AMC. SEBI approved the AMC to act as the Investment Manager of the Fund vide its letter No. MFD/BC/163/2002 dated May 27, 2002. The paid-up equity share capital of the AMC is Rs. 61.59 crores. The AMC is registered as a Portfolio Manager under the SEBI (Portfolio Managers) Regulations, 1993 vide registration no. INP000001322. The AMC also offers non-binding Advisory services to offshore funds under the mutual fund license.
HSBC Securities and Capital Markets (India) Private Limited holds 100% of the paid up equity share capital of the AMC.
3. inveStment oBJective of the SchemeSThe investment objective of the respective schemes has been provided above under the heading “Scheme Performance, Future Outlook and Operation of the Scheme” (Refer Section 1).
4. Significant accounting PolicieS The Significant Accounting Policies form part of the Notes to the Accounts annexed to the Balance Sheet of the Schemes in the Full Annual Report. The accounting policies are in accordance with Securities Exchange Board of India (Mutual Funds) Regulations 1996.
5. unclaimed dividendS & redemPtionSSummary of number of investors & corresponding amount Scheme-wise as on March 31, 2021
Schemeunclaimed dividend unclaimed redemption
amount (rs.) no. of investors
amount (rs.) no. of investors
HSBC Ultra Short Duration Fund Nil Nil 6,022.36 1
6. inveStor ServiceS
The number of official points of acceptance of transactions is 204 locations. In addition to the offices of the Registrar & Transfer agents, the AMC has Investor Service Centers in 9 locations at its own offices - namely Mumbai, New Delhi, Kolkata, Bangalore, Pune, Ahmedabad, Hyderabad, Chandigarh and Chennai. With a view to enhance customer convenience, the AMC has the facility of priority based servicing to key distributors through the enhancement of the Interactive Voice Reponses. The AMC has 2 Toll Free numbers (1-800-200-2434 /1-800-258-2434) which can be dialed from anywhere in India and 1 number i.e +91 44 39923900 (Investors calling from abroad). The call center service is being managed by the Registrar and Transfer Agents. Transactions for purchase / redemption of units in the schemes HSBC Mutual Fund can also be made through the online transaction facility on the AMC’s website at https://invest.assetmanagement.hsbc.co.in.
On the distribution front, the number of empaneled distributors was 1069 as on March 31, 2021. During the year, the AMC initiated tie-ups for online distribution of the Mutual Fund’s schemes with several channel partners taking the total number of such tie-ups to 52.
Trustees’ ReportFor the year ended March 31, 2021 (Contd...)
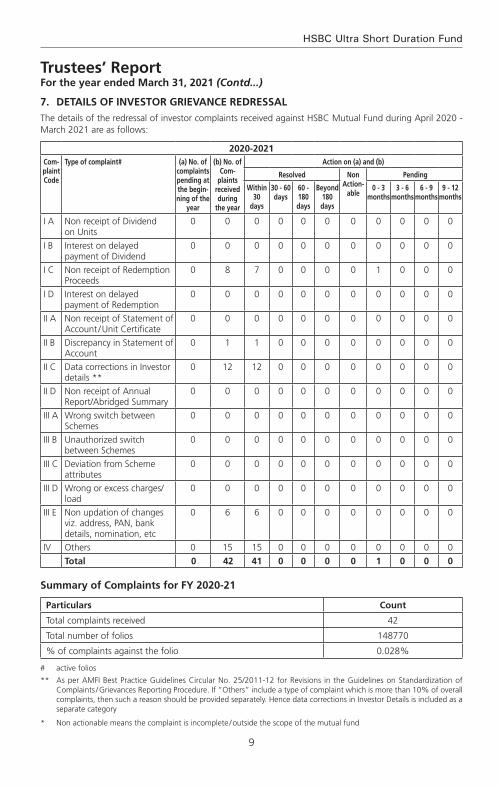
9
HSBC Ultra Short Duration Fund
Trustees’ ReportFor the year ended March 31, 2021 (Contd...)
7. detailS of inveStor grievance redreSSal
The details of the redressal of investor complaints received against HSBC Mutual Fund during April 2020 - March 2021 are as follows:
2020-2021com-plaint code
type of complaint# (a) no. of complaints pending at the begin-ning of the
year
(b) no. of com-
plaints received during
the year
action on (a) and (b)
resolved non action-
able
Pending
Within 30
days
30 - 60 days
60 - 180 days
Beyond 180 days
0 - 3 months
3 - 6 months
6 - 9 months
9 - 12 months
I A Non receipt of Dividend on Units
0 0 0 0 0 0 0 0 0 0 0
I B Interest on delayed payment of Dividend
0 0 0 0 0 0 0 0 0 0 0
I C Non receipt of Redemption Proceeds
0 8 7 0 0 0 0 1 0 0 0
I D Interest on delayed payment of Redemption
0 0 0 0 0 0 0 0 0 0 0
II A Non receipt of Statement of Account / Unit Certificate
0 0 0 0 0 0 0 0 0 0 0
II B Discrepancy in Statement of Account
0 1 1 0 0 0 0 0 0 0 0
II C Data corrections in Investor details **
0 12 12 0 0 0 0 0 0 0 0
II D Non receipt of Annual Report/Abridged Summary
0 0 0 0 0 0 0 0 0 0 0
III A Wrong switch between Schemes
0 0 0 0 0 0 0 0 0 0 0
III B Unauthorized switch between Schemes
0 0 0 0 0 0 0 0 0 0 0
III C Deviation from Scheme attributes
0 0 0 0 0 0 0 0 0 0 0
III D Wrong or excess charges/load
0 0 0 0 0 0 0 0 0 0 0
III E Non updation of changes viz. address, PAN, bank details, nomination, etc
0 6 6 0 0 0 0 0 0 0 0
IV Others 0 15 15 0 0 0 0 0 0 0 0
total 0 42 41 0 0 0 0 1 0 0 0
Summary of complaints for fY 2020-21
Particulars count
Total complaints received 42
Total number of folios 148770
% of complaints against the folio 0.028%
# active folios
** As per AMFI Best Practice Guidelines Circular No. 25/2011-12 for Revisions in the Guidelines on Standardization of Complaints / Grievances Reporting Procedure. If “Others” include a type of complaint which is more than 10% of overall complaints, then such a reason should be provided separately. Hence data corrections in Investor Details is included as a separate category
* Non actionable means the complaint is incomplete / outside the scope of the mutual fund

10
Abridged Annual Report 2020 - 2021
8. inveStor education initiativeS
Investor awareness advertisements were published in Mutual Fund Insight magazine on a monthly basis along with an editorial on ‘SIP Sahi Hai’. Additionally, monthly articles / blogs have been written by Advisorkhoj on IAP which talks of the advantages of SIP, start early, power of compounding, diversification, asset allocation etc. The same is promoted by the publisher via an email to their entire network and also on their social media handles which can be retweeted or liked. Also, educative infographics have been hosted on our website under the investor resources section. The same have also been circulated to existing Indian investors via email for engagement and for educative purposes.
9. ProxY voting PolicY
In terms of SEBI Circular no. SEBI/IMD/CIR No. 18/198647/2010 dated March 15, 2010, the Fund has adopted Proxy Voting Policy and Procedures for exercising voting rights in respect of securities held by the Schemes.
The summary of the votes casted in the general meetings of the Investee companies, by the AMC for and on behalf of the Schemes of the Fund, for the financial year 2020-2021 is provided below:
quarter total no. of resolutions
Break-up of vote decision
for against abstained
June 2020 50 43 6 1
September 2020 752 656 38 58
December 2020 41 31 1 9
March 2021 40 30 8 2
total 883 760 53 70
In terms of the requirement of SEBI Circular no. CIR/IMD/DF/05/2014 dated March 24, 2014 and SEBI/HO/IMD/DF2/CIR/P/2016/68 dated August 10, 2016; the AMC has obtained certificate from M/s. M. P. Chitale & Co., Chartered Accountants, who is acting as a Scrutinizer, on the voting report for the FY 2020-21. The certificate dated April 14, 2021 issued by M/s. M. P. Chitale & Co., is available on the website of the AMC as part of the full Annual Report.
Unit holders can refer to the full Annual Report for complete details of actual exercise of votes in the general meetings of the investee companies for the financial year 2020-21 or log on to our website at www.assetmanagement.hsbc.co.in.
10. StatutorY detailS
a) The Sponsors are not responsible or liable for any loss resulting from the operation of the Schemes of the Fund beyond initial contribution of Rs. 1 lakh for setting up the Fund.
b) The price and redemption value of the units, and income from them, can go up as well as down with fluctuations in the market value of its underlying investments.
c) Full Annual Report of HSBC Mutual Fund and of HSBC Asset Management (India) Private Limited (the AMC) shall be disclosed on the website at www.assetmanagement.hsbc.co.in and shall be available for inspection at the Head Office of the Mutual Fund. Present and prospective unit holders can obtain copy of the Trust Deed, the full Annual Report of the Scheme(s), the Annual Report of HSBC Asset Management (India) Private Limited and the text of the relevant Scheme(s) at a price.
11. Scheme WiSe changeS in riSk-o-meter of the SchemeS of hSBc mutual fund during fY 2021
As per the requirements of SEBI Circular no. SEBI/HO/IMD/DF3/CIR/P/2020/197 dated October 05, 2020 the changes carried out in the risk-o-meter of the schemes of HSBC Mutual Fund during FY 2021 have been given in the below mentioned table for the information of the Unitholders, a report on the said changes has also been displayed on the website of the Fund and AMFI.
Trustees’ ReportFor the year ended March 31, 2021 (Contd...)

11
HSBC Ultra Short Duration Fund
Trustees’ ReportFor the year ended March 31, 2021 (Contd...)
Scheme name
risk-o-meter level as on december
31,2020^
risk-o-meter level at end of
the financial year
number of changes in risk-o-meter during the
financial year^
dec-2020 mar-2021 dec 2020 to march 2021
HSBC Ultra Short Duration Fund Low to Moderate Low to Moderate 0
^From the effective date (i.e. January 01, 2021) of SEBI circular no. SEBI/HO/IMD/DF3/CIR/P/2020/197 dated October 05, 2020.
12. governance under the PolicY on SteWardShiP reSPonSiBilitieS of hSBc mutual fund
As per the requirements of SEBI Circular no. CIR/CFD/CMD1/ 168 /2019 dated December 24, 2019, HSBC Mutual Fund has adapted the policy on stewardship responsibilities, the unitholders are requested to note the status of governance with the same as mentioned below:
S. no.
Particulars of Principles of Stewardship code
Status of compliance (complied/
not complied)
description remarks/reasons for
deviation/non - compliance,
if any
1 Principle 1:Institutional Investors should formulate a comprehensive policy on the discharge of their stewardship responsibilities, publicly disclose it, review and update it periodically.
Complied HSBC Asset Management (India) Private Limited's (AMIN) 'Policy on Stewardship responsibilities' (Stewardship Code / Policy) was formulated and implemented on 01 July, 2020. This is a comprehensive document which has been publicly disclosed on the website of AMIN. The same shall follow a periodic review.
N.A.
2 Principle 2:Inst i tut ional investors should have a clear policy on how they manage conflicts of interest in fulfilling their stewardship responsibilities and publicly disclose it.
Complied Defining and managing Conflict of Interest in fulfilling stewardship responsibilities are detailed in the Stewardship Policy document. The policy document is publicly disclosed.
N.A.
3 Principle 3:Institutional investors should monitor their investee companies.
Complied AMIN monitors all investee companies through its investment process. This includes assessment of companies’ own and market data, consideration of research from brokers and other independent research providers – including ESG & voting research, attending individual & group meetings with company management and directors, visiting production sites (wherever necessary), engaging with key stakeholders including competitors and customers, and financial modelling. More details enumerated in the policy document
N.A.
4 Principle 4:Inst i tut ional investors should have a clear policy on intervention in their investee companies. Institutional investors should also have a
Complied Details of undertaking active engagement with investee companies and the policy for collaboration with other institutional holders are detailed in the policy document. The policy document is publicly disclosed.
N.A.
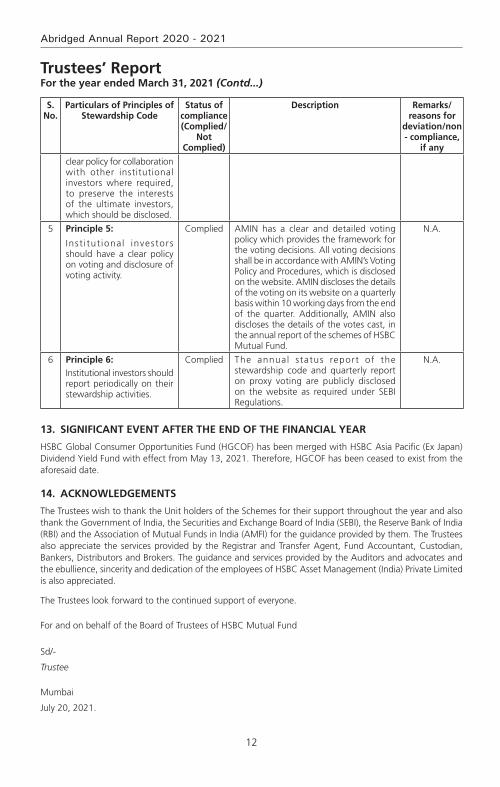
12
Abridged Annual Report 2020 - 2021
Trustees’ ReportFor the year ended March 31, 2021 (Contd...)
S. no.
Particulars of Principles of Stewardship code
Status of compliance (complied/
not complied)
description remarks/reasons for
deviation/non - compliance,
if any
clear policy for collaboration with other institutional investors where required, to preserve the interests of the ultimate investors, which should be disclosed.
5 Principle 5:
Inst i tut ional investors should have a clear policy on voting and disclosure of voting activity.
Complied AMIN has a clear and detailed voting policy which provides the framework for the voting decisions. All voting decisions shall be in accordance with AMIN’s Voting Policy and Procedures, which is disclosed on the website. AMIN discloses the details of the voting on its website on a quarterly basis within 10 working days from the end of the quarter. Additionally, AMIN also discloses the details of the votes cast, in the annual report of the schemes of HSBC Mutual Fund.
N.A.
6 Principle 6:Institutional investors should report periodically on their stewardship activities.
Complied The annual status report of the stewardship code and quarterly report on proxy voting are publicly disclosed on the website as required under SEBI Regulations.
N.A.
13. Significant event after the end of the financial Year
HSBC Global Consumer Opportunities Fund (HGCOF) has been merged with HSBC Asia Pacific (Ex Japan) Dividend Yield Fund with effect from May 13, 2021. Therefore, HGCOF has been ceased to exist from the aforesaid date.
14. acknoWledgementS
The Trustees wish to thank the Unit holders of the Schemes for their support throughout the year and also thank the Government of India, the Securities and Exchange Board of India (SEBI), the Reserve Bank of India (RBI) and the Association of Mutual Funds in India (AMFI) for the guidance provided by them. The Trustees also appreciate the services provided by the Registrar and Transfer Agent, Fund Accountant, Custodian, Bankers, Distributors and Brokers. The guidance and services provided by the Auditors and advocates and the ebullience, sincerity and dedication of the employees of HSBC Asset Management (India) Private Limited is also appreciated.
The Trustees look forward to the continued support of everyone.
For and on behalf of the Board of Trustees of HSBC Mutual Fund
Sd/-
Trustee
Mumbai
July 20, 2021.

13
HSBC Ultra Short Duration Fund
To the Trustees of HSBC Mutual Fund
hSBc ultra Short duration fund
Report on the Audit of the Financial Statements
opinionWe have audited the financial statements of hSBc ultra Short duration fund (the ‘Scheme’) of HSBC Mutual Fund, which comprise the balance sheet as at 31 March 2021 and the revenue account for the year then ended, and notes to the financial statements, including a summary of the significant accounting policies.
In our opinion and to the best of our information and according to the explanations given to us, the aforesaid financial statements give a true and fair view in conformity with the accounting principles generally accepted in India, of the state of affairs of the Scheme as at 31 March 2021, its net surplus for the year ended on that date.
Basis for opinionWe conducted our audit in accordance with the Standards on Auditing (‘SAs’) issued by the Institute of Chartered Accountants of India (the ‘ICAI’). Our responsibilities under those SAs are further described in the Auditor’s Responsibilities for the Audit of the Financial Statements section of our report. We are independent of the Scheme in accordance with the Code of Ethics issued by the ICAI, and we have fulfilled our other ethical responsibilities in accordance with the Code of Ethics. We believe that the audit evidence we have obtained is sufficient and appropriate to provide a basis for our opinion.
responsibilities of management and those charged with governance for the financial StatementsThe Scheme’s management, the Board of Directors of HSSBC Mutual Fund (the ‘Trustee’) and the Board of Directors of HSBC Asset Management (India) Private Limited (the ‘AMC’) (collectively referred to as ‘Management’) are responsible for the preparation of these financial statements that give a true and fair view of the state of affairs, results of operations of the Scheme in accordance with the accounting policies and standards specified in the Ninth Schedule of the Securities and Exchange Board of India (Mutual Funds) Regulations, 1996, as amended (the ‘Regulations’) and the accounting principles generally accepted in India. This responsibility includes design, implementation and maintenance of internal control relevant to the preparation and presentation of the financial statements that give a true and fair view and are free from material misstatement, whether due to fraud or error.
In preparing the financial statements, management is responsible for assessing the Scheme’s ability to continue as a going concern, disclosing, as applicable, matters related to going concern and using the going concern basis of accounting unless management either intends to liquidate the Scheme or to cease operations, or has no realistic alternative but to do so.
The management is responsible for overseeing the Scheme’s financial reporting process.
auditor’s responsibilities for the audit of the financial StatementsOur objectives are to obtain reasonable assurance about whether the financial statements as a whole are free from material misstatement, whether due to fraud or error, and to issue an auditor’s report that includes our opinion. Reasonable assurance is a high level of assurance, but is not a guarantee that an audit conducted in accordance with SAs will always detect a material misstatement when it exists. Misstatements can arise from fraud or error and are considered material if, individually or in the aggregate, they could reasonably be expected to influence the economic decisions of users taken on the basis of these financial statements.
As part of an audit in accordance with SAs, we exercise professional judgment and maintain professional skepticism throughout the audit. We also:
• Identifyandassesstherisksofmaterialmisstatementofthefinancialstatements,whetherduetofraudor error, design and perform audit procedures responsive to those risks, and obtain audit evidence that is sufficient and appropriate to provide a basis for our opinion. The risk of not detecting a material misstatement resulting from fraud is higher than for one resulting from error, as fraud may involve
Independent Auditors’ Report

14
Abridged Annual Report 2020 - 2021
Independent Auditors’ Report (Contd...)
collusion, forgery, intentional omissions, misrepresentations, or the override of internal control;
• Obtainanunderstandingofinternalcontrolrelevanttotheauditinordertodesignauditproceduresthat are appropriate in the circumstances, but not for the purpose of expressing an opinion on the effectiveness of the Scheme’s internal controls;
• Evaluatetheappropriatenessofaccountingpoliciesusedandthereasonablenessofaccountingestimatesand related disclosures made by Management;
• ConcludeontheappropriatenessofManagement’suseofthegoingconcernbasisofaccountingand,based on the audit evidence obtained, whether a material uncertainty exists related to events or conditions that may cast significant doubt on the Scheme’s ability to continue as a going concern. If we conclude that a material uncertainty exists, we are required to draw attention in our auditor’s report to the related disclosures in the financial statements or, if such disclosures are inadequate, to modify our opinion. Our conclusions are based on the audit evidence obtained up to the date of our auditor’s report. However, future events or conditions may cause the Scheme to cease to continue as a going concern;
• Evaluate the overall presentation, structure and content of the financial statements, including thedisclosures and whether the financial statements represent the underlying transactions and events in a manner that achieves fair presentation.
We communicate with those charged with governance regarding, among other matters, the planned scope and timing of the audit and significant audit findings, including any significant deficiencies in internal control that we identify during our audit.
We also provide those charged with governance with a statement that we have complied with relevant ethical requirements regarding independence, and to communicate with them all relationships and other matters that may reasonably be thought to bear on our independence, and where applicable, related safeguards.
report on other legal and regulatory requirements
1 As required by Regulation 55 (4) of the Regulations, we report that:
(a) We have obtained all information and explanations which, to the best of our knowledge and belief, were necessary for the purposes of the audit; and
(b) The balance sheet and the revenue account have been prepared in accordance with the accounting policies and standards as specified in the Ninth Schedule of the Regulations.
2 As required by Clause 5 (ii) (2) of the Eleventh Schedule of the Regulations, we report that the balance sheet and the revenue account are in agreement with the books of account of the Scheme.
3 As required by the Eight Schedule of the Regulations, we report that, in our opinion and on the basis of information and explanations given to us, the methods used to value non - traded securities, as at 31 March 2021, as determined by the Board of Directors of the AMC, are in accordance with the Regulations and other guidelines issued by the Securities and Exchange Board of India as applicable and approved by the Board of Directors of the Trustee, are fair and reasonable.
For B S R & Co. LLP Chartered Accountants Firm’s Registration No: 101248W/W-100022
Sd/-
Ajit Viswanath PartnerMembership No: 067114UDIN : 21067114AAAADG7381
Place : Mumbai Date : July 20, 2021.
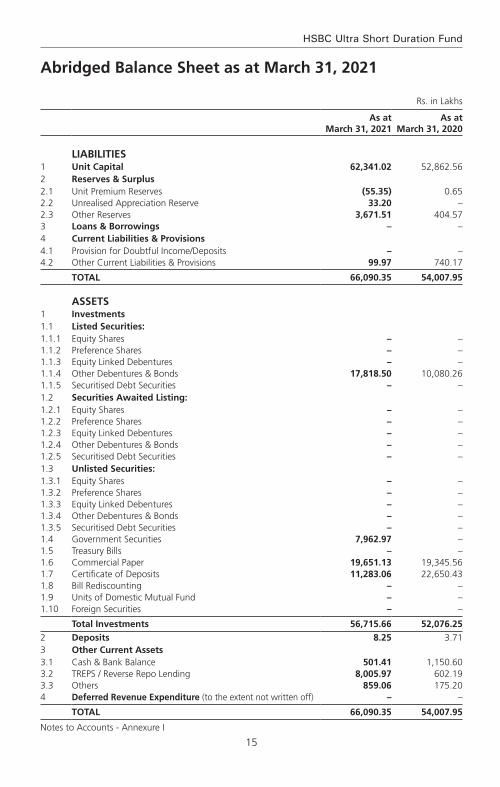
15
HSBC Ultra Short Duration Fund
Rs. in Lakhs
As at March 31, 2021
As at March 31, 2020
LIABILITIES1 Unit Capital 62,341.02 52,862.562 Reserves & Surplus2.1 Unit Premium Reserves (55.35) 0.652.2 Unrealised Appreciation Reserve 33.20 –2.3 Other Reserves 3,671.51 404.573 Loans & Borrowings – –4 Current Liabilities & Provisions4.1 Provision for Doubtful Income/Deposits – –4.2 Other Current Liabilities & Provisions 99.97 740.17
TOTAL 66,090.35 54,007.95
ASSETS1 Investments1.1 Listed Securities:1.1.1 Equity Shares – –1.1.2 Preference Shares – –1.1.3 Equity Linked Debentures – –1.1.4 Other Debentures & Bonds 17,818.50 10,080.261.1.5 Securitised Debt Securities – –1.2 Securities Awaited Listing:1.2.1 Equity Shares – –1.2.2 Preference Shares – –1.2.3 Equity Linked Debentures – –1.2.4 Other Debentures & Bonds – –1.2.5 Securitised Debt Securities – –1.3 Unlisted Securities:1.3.1 Equity Shares – –1.3.2 Preference Shares – –1.3.3 Equity Linked Debentures – –1.3.4 Other Debentures & Bonds – –1.3.5 Securitised Debt Securities – –1.4 Government Securities 7,962.97 –1.5 Treasury Bills – –1.6 Commercial Paper 19,651.13 19,345.561.7 Certificate of Deposits 11,283.06 22,650.431.8 Bill Rediscounting – –1.9 Units of Domestic Mutual Fund – –1.10 Foreign Securities – –
Total Investments 56,715.66 52,076.252 Deposits 8.25 3.713 Other Current Assets3.1 Cash & Bank Balance 501.41 1,150.603.2 TREPS / Reverse Repo Lending 8,005.97 602.193.3 Others 859.06 175.204 Deferred Revenue Expenditure (to the extent not written off) – –
TOTAL 66,090.35 54,007.95
Notes to Accounts - Annexure I
Abridged Balance Sheet as at March 31, 2021
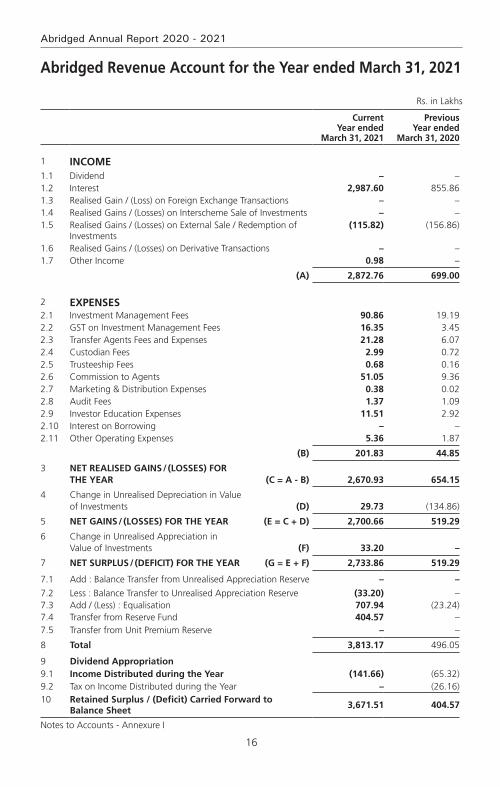
16
Abridged Annual Report 2020 - 2021
Abridged Revenue Account for the Year ended March 31, 2021
Rs. in Lakhs
Current Year ended
March 31, 2021
Previous Year ended
March 31, 2020
1 INCOME1.1 Dividend – –1.2 Interest 2,987.60 855.861.3 Realised Gain / (Loss) on Foreign Exchange Transactions – –1.4 Realised Gains / (Losses) on Interscheme Sale of Investments – –1.5 Realised Gains / (Losses) on External Sale / Redemption of
Investments(115.82) (156.86)
1.6 Realised Gains / (Losses) on Derivative Transactions – –1.7 Other Income 0.98 –
(A) 2,872.76 699.00
2 EXPENSES2.1 Investment Management Fees 90.86 19.192.2 GST on Investment Management Fees 16.35 3.452.3 Transfer Agents Fees and Expenses 21.28 6.072.4 Custodian Fees 2.99 0.722.5 Trusteeship Fees 0.68 0.162.6 Commission to Agents 51.05 9.362.7 Marketing & Distribution Expenses 0.38 0.022.8 Audit Fees 1.37 1.092.9 Investor Education Expenses 11.51 2.922.10 Interest on Borrowing – –2.11 Other Operating Expenses 5.36 1.87
(B) 201.83 44.85
3 NET REALISED GAINS / (LOSSES) FOR THE YEAR (C = A - B) 2,670.93 654.15
4 Change in Unrealised Depreciation in Value of Investments (D) 29.73 (134.86)
5 NET GAINS / (LOSSES) FOR THE YEAR (E = C + D) 2,700.66 519.29
6 Change in Unrealised Appreciation in Value of Investments (F) 33.20 –
7 NET SURPLUS / (DEFICIT) FOR THE YEAR (G = E + F) 2,733.86 519.29
7.1 Add : Balance Transfer from Unrealised Appreciation Reserve – –
7.2 Less : Balance Transfer to Unrealised Appreciation Reserve (33.20) –7.3 Add / (Less) : Equalisation 707.94 (23.24)7.4 Transfer from Reserve Fund 404.57 –7.5 Transfer from Unit Premium Reserve – –
8 Total 3,813.17 496.05
9 Dividend Appropriation9.1 Income Distributed during the Year (141.66) (65.32)9.2 Tax on Income Distributed during the Year – (26.16)10 Retained Surplus / (Deficit) Carried Forward to
Balance Sheet 3,671.51 404.57
Notes to Accounts - Annexure I
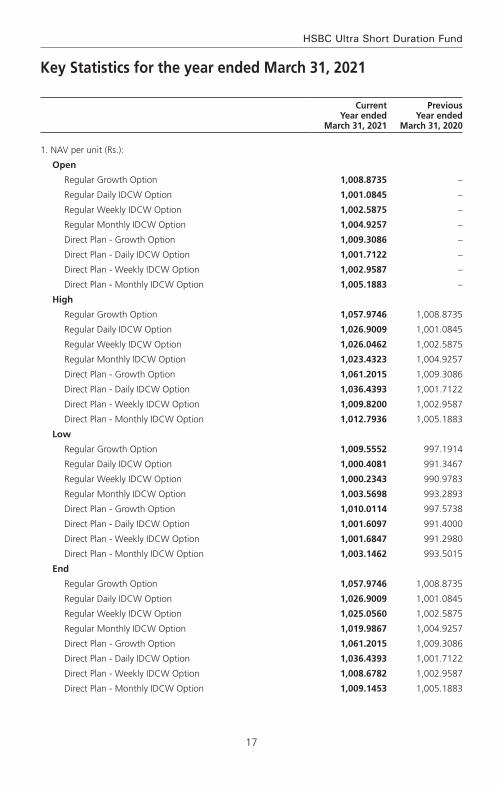
17
HSBC Ultra Short Duration Fund
Key Statistics for the year ended March 31, 2021
Current Year ended
March 31, 2021
Previous Year ended
March 31, 2020
1. NAV per unit (Rs.):
Open
Regular Growth Option 1,008.8735 –
Regular Daily IDCW Option 1,001.0845 –
Regular Weekly IDCW Option 1,002.5875 –
Regular Monthly IDCW Option 1,004.9257 –
Direct Plan - Growth Option 1,009.3086 –
Direct Plan - Daily IDCW Option 1,001.7122 –
Direct Plan - Weekly IDCW Option 1,002.9587 –
Direct Plan - Monthly IDCW Option 1,005.1883 –
High
Regular Growth Option 1,057.9746 1,008.8735
Regular Daily IDCW Option 1,026.9009 1,001.0845
Regular Weekly IDCW Option 1,026.0462 1,002.5875
Regular Monthly IDCW Option 1,023.4323 1,004.9257
Direct Plan - Growth Option 1,061.2015 1,009.3086
Direct Plan - Daily IDCW Option 1,036.4393 1,001.7122
Direct Plan - Weekly IDCW Option 1,009.8200 1,002.9587
Direct Plan - Monthly IDCW Option 1,012.7936 1,005.1883
Low
Regular Growth Option 1,009.5552 997.1914
Regular Daily IDCW Option 1,000.4081 991.3467
Regular Weekly IDCW Option 1,000.2343 990.9783
Regular Monthly IDCW Option 1,003.5698 993.2893
Direct Plan - Growth Option 1,010.0114 997.5738
Direct Plan - Daily IDCW Option 1,001.6097 991.4000
Direct Plan - Weekly IDCW Option 1,001.6847 991.2980
Direct Plan - Monthly IDCW Option 1,003.1462 993.5015
End
Regular Growth Option 1,057.9746 1,008.8735
Regular Daily IDCW Option 1,026.9009 1,001.0845
Regular Weekly IDCW Option 1,025.0560 1,002.5875
Regular Monthly IDCW Option 1,019.9867 1,004.9257
Direct Plan - Growth Option 1,061.2015 1,009.3086
Direct Plan - Daily IDCW Option 1,036.4393 1,001.7122
Direct Plan - Weekly IDCW Option 1,008.6782 1,002.9587
Direct Plan - Monthly IDCW Option 1,009.1453 1,005.1883
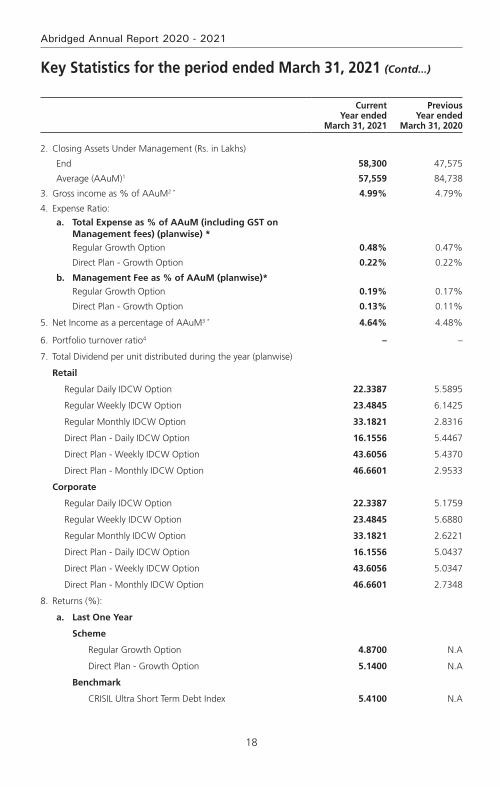
18
Abridged Annual Report 2020 - 2021
Current Year ended
March 31, 2021
Previous Year ended
March 31, 2020
2. Closing Assets Under Management (Rs. in Lakhs)
End 58,300 47,575
Average (AAuM)1 57,559 84,738
3. Gross income as % of AAuM2 * 4.99% 4.79%
4. Expense Ratio:
a. total expense as % of aaum (including gSt on management fees) (planwise) *
Regular Growth Option 0.48% 0.47%
Direct Plan - Growth Option 0.22% 0.22%
b. management fee as % of aaum (planwise)*
Regular Growth Option 0.19% 0.17%
Direct Plan - Growth Option 0.13% 0.11%
5. Net Income as a percentage of AAuM3 * 4.64% 4.48%
6. Portfolio turnover ratio4 – –
7. Total Dividend per unit distributed during the year (planwise)
Retail
Regular Daily IDCW Option 22.3387 5.5895
Regular Weekly IDCW Option 23.4845 6.1425
Regular Monthly IDCW Option 33.1821 2.8316
Direct Plan - Daily IDCW Option 16.1556 5.4467
Direct Plan - Weekly IDCW Option 43.6056 5.4370
Direct Plan - Monthly IDCW Option 46.6601 2.9533
Corporate
Regular Daily IDCW Option 22.3387 5.1759
Regular Weekly IDCW Option 23.4845 5.6880
Regular Monthly IDCW Option 33.1821 2.6221
Direct Plan - Daily IDCW Option 16.1556 5.0437
Direct Plan - Weekly IDCW Option 43.6056 5.0347
Direct Plan - Monthly IDCW Option 46.6601 2.7348
8. Returns (%):
a. Last One Year
Scheme
Regular Growth Option 4.8700 N.A
Direct Plan - Growth Option 5.1400 N.A
Benchmark
CRISIL Ultra Short Term Debt Index 5.4100 N.A
Key Statistics for the period ended March 31, 2021 (Contd...)
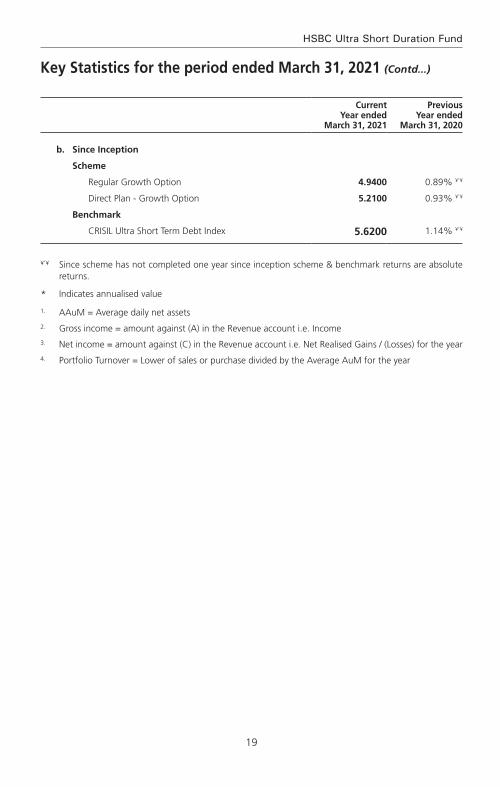
19
HSBC Ultra Short Duration Fund
Key Statistics for the period ended March 31, 2021 (Contd...)
Current Year ended
March 31, 2021
Previous Year ended
March 31, 2020
b. Since Inception
Scheme
Regular Growth Option 4.9400 0.89% ¥’¥
Direct Plan - Growth Option 5.2100 0.93% ¥’¥
Benchmark
CRISIL Ultra Short Term Debt Index 5.6200 1.14% ¥’¥
¥’¥ Since scheme has not completed one year since inception scheme & benchmark returns are absolute returns.
* Indicates annualised value
1. AAuM = Average daily net assets2. Gross income = amount against (A) in the Revenue account i.e. Income3. Net income = amount against (C) in the Revenue account i.e. Net Realised Gains / (Losses) for the year4. Portfolio Turnover = Lower of sales or purchase divided by the Average AuM for the year
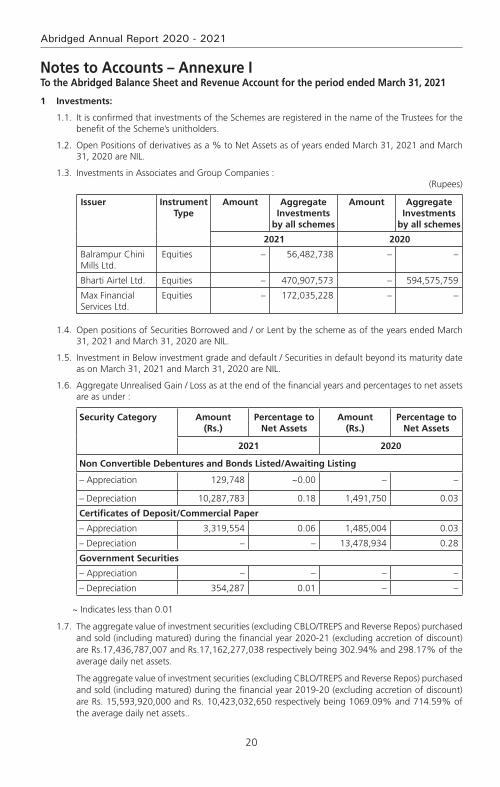
20
Abridged Annual Report 2020 - 2021
1 Investments:
1.1. It is confirmed that investments of the Schemes are registered in the name of the Trustees for the benefit of the Scheme’s unitholders.
1.2. Open Positions of derivatives as a % to Net Assets as of years ended March 31, 2021 and March 31, 2020 are NIL.
1.3. Investments in Associates and Group Companies :(Rupees)
Issuer Instrument Type
Amount Aggregate Investments
by all schemes
Amount Aggregate Investments
by all schemes
2021 2020
Balrampur Chini Mills Ltd.
Equities – 56,482,738 – –
Bharti Airtel Ltd. Equities – 470,907,573 – 594,575,759
Max Financial Services Ltd.
Equities – 172,035,228 – –
1.4. Open positions of Securities Borrowed and / or Lent by the scheme as of the years ended March 31, 2021 and March 31, 2020 are NIL.
1.5. Investment in Below investment grade and default / Securities in default beyond its maturity date as on March 31, 2021 and March 31, 2020 are NIL.
1.6. Aggregate Unrealised Gain / Loss as at the end of the financial years and percentages to net assets are as under :
Security Category Amount (Rs.)
Percentage to Net Assets
Amount (Rs.)
Percentage to Net Assets
2021 2020
Non Convertible Debentures and Bonds Listed/Awaiting Listing
– Appreciation 129,748 ~0.00 – –
– Depreciation 10,287,783 0.18 1,491,750 0.03
Certificates of Deposit/Commercial Paper
– Appreciation 3,319,554 0.06 1,485,004 0.03
– Depreciation – – 13,478,934 0.28
Government Securities
– Appreciation – – – –
– Depreciation 354,287 0.01 – –
~ Indicates less than 0.01
1.7. The aggregate value of investment securities (excluding CBLO/TREPS and Reverse Repos) purchased and sold (including matured) during the financial year 2020-21 (excluding accretion of discount) are Rs.17,436,787,007 and Rs.17,162,277,038 respectively being 302.94% and 298.17% of the average daily net assets.
The aggregate value of investment securities (excluding CBLO/TREPS and Reverse Repos) purchased and sold (including matured) during the financial year 2019-20 (excluding accretion of discount) are Rs. 15,593,920,000 and Rs. 10,423,032,650 respectively being 1069.09% and 714.59% of the average daily net assets..
Notes to Accounts – Annexure ITo the Abridged Balance Sheet and Revenue Account for the period ended March 31, 2021

21
HSBC Ultra Short Duration Fund
1.8. Non-Traded securities in the portfolio: Aggregate Value of Equity, Debt & Money Market Instruments and percentage to net assets is as under :
Security Category Fair Value (Rupees)
% to Net Assets
Fair Value (Rupees)
% to Net Assets
2021 2020
Debt Instruments 1,781,850,350 30.56% 503,209,750 10.58%
Money market Instruments 3,093,418,000 53.06% 4,199,599,050 88.27%
Total 4,875,268,350 83.62% 4,702,808,800 98.85%
2 Disclosure Under Regulation 25(8) of the Securities and Exchange Board of India (Mutual Funds) Regulations, 1996 as amended.
Details of amounts paid to associates in terms of Regulation 25 (8) are as follows :
Commission paid to Sponsor/AMC and its associates/related parties/group companies
Name of Sponsor/AMC and its associates/related parties/group companies
Nature of Association / Nature of
Relation
Period Covered
Business Given [Rs. In Crores]
% of Total Business
received by the Fund
Commission paid [Rs.]
% of Total commission paid by the
Fund
The Hongkong and Shanghai Banking Corporation Limited
Associate of the Investment Manager
2020-2021 510.07 31.14 3,555,047 76.31
Name of Sponsor/AMC and its associates/related parties/group companies
Nature of Association / Nature of
Relation
Period Covered
Business Given [Rs. In Crores]
% of Total Business
received by the Fund
Commission paid [Rs.]
% of Total commission paid by the
Fund
The Hongkong and Shanghai Banking Corporation Limited
Associate of the Investment Manager
2019-2020 430.84 35.63 35,099 42.89
Brokerage paid to Sponsor/amc and its associates/related parties/group companies is nil. (Previous year also nil).
The brokerage paid was at rates similar to those offered to other distributors. And the Commission / Brokerage paid to related party includes both upfront and trail and hence not comparable with the % of business brought and % of commission paid.
Further, The Hongkong and Shanghai Banking Corporation Limited, an associate of the Sponsor, is on the panel of bankers with whom HSBC Mutual Fund places money on fixed deposits and enters into reverse repo transactions from time to time at competitive rates.
(i) Any underwriting obligations undertaken by the schemes of the mutual funds with respect to issue of securities associate companies - Nil (Previous year also Nil).
(ii) Devolvement - Nil (Previous year also Nil).
(iii) Subscription by the schemes in the issues lead managed by associate companies - Nil (Previous year also Nil).
(iii) Subscription by the schemes in the issues lead managed by associate companies - Nil (Previous year also Nil).
(iv) Subscription to any issue of equity or debt on private placement basis where the sponsor or its associate companies have acted as arranger or manager - Nil (Previous Year also Nil).
Notes to Accounts – Annexure I (Contd...)To the Abridged Balance Sheet and Revenue Account for the period ended March 31, 2021
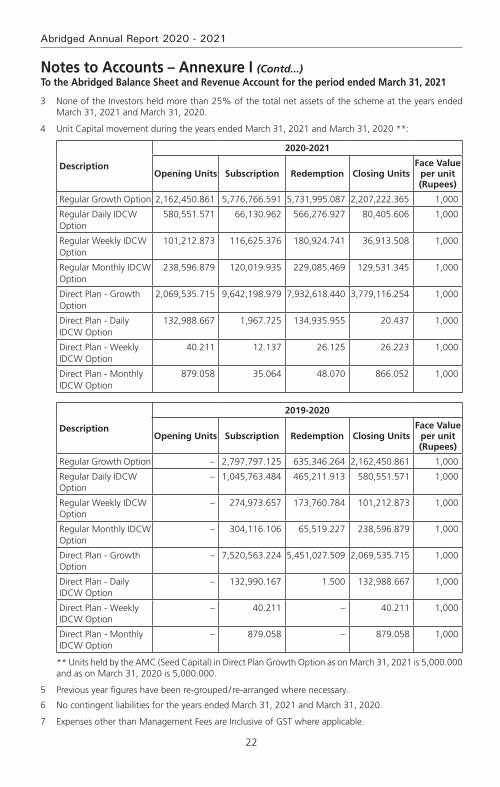
22
Abridged Annual Report 2020 - 2021
3 None of the Investors held more than 25% of the total net assets of the scheme at the years ended March 31, 2021 and March 31, 2020.
4 Unit Capital movement during the years ended March 31, 2021 and March 31, 2020 **:
Description
2020-2021
Opening Units Subscription Redemption Closing UnitsFace Value
per unit (Rupees)
Regular Growth Option 2,162,450.861 5,776,766.591 5,731,995.087 2,207,222.365 1,000
Regular Daily IDCW Option
580,551.571 66,130.962 566,276.927 80,405.606 1,000
Regular Weekly IDCW Option
101,212.873 116,625.376 180,924.741 36,913.508 1,000
Regular Monthly IDCW Option
238,596.879 120,019.935 229,085.469 129,531.345 1,000
Direct Plan - Growth Option
2,069,535.715 9,642,198.979 7,932,618.440 3,779,116.254 1,000
Direct Plan - Daily IDCW Option
132,988.667 1,967.725 134,935.955 20.437 1,000
Direct Plan - Weekly IDCW Option
40.211 12.137 26.125 26.223 1,000
Direct Plan - Monthly IDCW Option
879.058 35.064 48.070 866.052 1,000
Description
2019-2020
Opening Units Subscription Redemption Closing UnitsFace Value
per unit (Rupees)
Regular Growth Option – 2,797,797.125 635,346.264 2,162,450.861 1,000
Regular Daily IDCW Option
– 1,045,763.484 465,211.913 580,551.571 1,000
Regular Weekly IDCW Option
– 274,973.657 173,760.784 101,212.873 1,000
Regular Monthly IDCW Option
– 304,116.106 65,519.227 238,596.879 1,000
Direct Plan - Growth Option
– 7,520,563.224 5,451,027.509 2,069,535.715 1,000
Direct Plan - Daily IDCW Option
– 132,990.167 1.500 132,988.667 1,000
Direct Plan - Weekly IDCW Option
– 40.211 – 40.211 1,000
Direct Plan - Monthly IDCW Option
– 879.058 – 879.058 1,000
** Units held by the AMC (Seed Capital) in Direct Plan Growth Option as on March 31, 2021 is 5,000.000 and as on March 31, 2020 is 5,000.000.
5 Previous year figures have been re-grouped / re-arranged where necessary.
6 No contingent liabilities for the years ended March 31, 2021 and March 31, 2020.
7 Expenses other than Management Fees are Inclusive of GST where applicable.
Notes to Accounts – Annexure I (Contd...)To the Abridged Balance Sheet and Revenue Account for the period ended March 31, 2021

23
HSBC Ultra Short Duration Fund
8 Other Income of Rs. 97,809 represents Exit load credited to the scheme & Penal Interest received from Bank towards delay of RTGS / NEFT (2020 :- Rs. Nil).
9 Investor Education Awareness
In view of the AMFI Best Practices Guidelines Circular No. 56/2015-16, the IEF Investor Education Fund) accrual is set aside in a separate bank account and the consolidated balance across all schemes as on March 31, 2021. The break-up of which is as under:
Particulars March 31, 2021 March 31, 2020
Amount (in Rs. Lacs) Amount (in Rs. Lacs)
Opening Balance as on April 01, 2020 307.40 214.68
Add: Accrual during FY 2020-21 195.77 237.54
Less: Transferred to AMFI * 89.04 109.69
Less: Payable to AMFI (March 2021 accrual) * 8.84 9.08
Add: Investment Income FY 2020-21 11.94 15.93
Less: Spent during FY 2020-21 43.73 41.98
Closing Balance as on March 31, 2021 373.49 307.40
*In accordance with SEBI circular number SEBI/HO/IMD/DF2/RS/813/2016 dated January 8, 2016.
10 Following the spread of the coronavirus, on 11 March 2020, the World Health Organization declared the COVID-19 outbreak to be a pandemic. The identification of the virus as a new coronavirus, its subsequent spread and the situation of lock-down across India is considered as a significant event. HSBC Mutual Fund’s operations are included in essential services and have continued through the lock-downs declared by the Government. Service providers like the Registrar and Transfer Agent, Custodian and Fund Accountant have carried out extensive arrangements to address business needs and continuity of operations. As on the date of signing of these financial statements, Management believes that it has taken into account, all the possible impact of known events arising from COVID-19 pandemic in the preparation of the financial statements and there appears to be no uncertainties relating to the going concern of any of the Schemes of the Fund for a foreseeable future. However, COVID-19 pandemic is an ongoing situation and any estimate of its impact is dependent on the future intensity, spread and duration of the situation. The Management will continue to closely monitor the situation for any material changes which may impact the Schemes of the Fund.
11 disclosure of risk-o-meter
Scheme Name Risk-o-meter level as on December
31,2020^
Risk-o-meter level at end of the financial year
Number of changes in Risk-o-meter during the financial year^
HSBC Ultra Short Duration Fund Low to Moderate Low to Moderate 0
^From the effective date (i.e. January 01, 2021) of SEBI circular no. SEBI/HO/IMD/DF3/CIR/P/2020/197 dated October 05, 2020.
12 Pursuant to SEBI Circular No. SEBI/HO/IMD/DF3/CIR/P/2020/194 dated October 05, 2020, the nomenclature of ‘Dividend Option’ under all the schemes of HSBC Mutual Fund has been revised to ‘Income Distribution cum Capital Withdrawal Option’ (IDCW), with effect from April 01, 2021.
13 The Annual Accounts of the Schemes prepared in accordance with the accounting policies and standards specified in the Ninth Schedule of The Securities and Exchange Board of India (Mutual Funds) Regulations, 1996 has been approved by the Board of Directors of HSBC Asset Management (India) Private Limited and The Board of Trustees of HSBC Mutual Fund at their meetings held on July 19, 2021 and July 20, 2021 respectively. The audit report attached herewith refers to the said Annual Accounts. The aforesaid abridged accounts are an extract of the Annual Accounts and are prepared in accordance with SEBI Circular No. IMD/Cir8/132968/2008 dated July 24, 2008.
Notes to Accounts – Annexure I (Contd...)To the Abridged Balance Sheet and Revenue Account for the period ended March 31, 2021

24
Abridged Annual Report 2020 - 2021
Voting Policy and Procedures
In view of SEBI guidelines related to “Role of Mutual Funds in Corporate Governance of Public Listed Companies”, HSBC AMC has formulated its “Policy for Proxy Voting in Public Listed Companies”. The said policy is available on our website and the details of actual exercise of proxy votes, the summary of votes casted and the auditor’s certificate for the Financial Year 2019 – 20 is forming part of our full Annual Report for the Financial Year 2019 – 20 which is uploaded on our website at http://www.assetmanagement.hsbc.co.in

25
HSBC Ultra Short Duration Fund
Statutory Details & Disclaimers
All the returns have been sourced from Mutual Funds India Explorer software. The performance of the schemes and the benchmark is calculated on a total return basis. This document has been prepared by HSBC Asset Management (India) Private Ltd (HSBC) for information purposes only and should not be construed as i) an offer or recommendation to buy or sell securities, commodities, currencies or other investments referred to herein; or ii) an offer to sell or a solicitation or an offer for purchase of any of the funds of HSBC Mutual Fund; or iii) an investment research or investment advice. All information contained in this document (including that sourced from third parties), is obtained from sources HSBC and the third party which HSBC believes to be reliable however, has not independently verified the same. The information and opinions contained within the document are based upon publicly available information and rates of taxation applicable (if any) at the time of publication, which are subject to change from time to time.
Expressions of opinion are those of HSBC only and are subject to change without notice. It does not have regard to specific investment objectives, financial situation and the particular needs of any specific person who may receive this document. Investors should seek personal and independent advice regarding the appropriateness of investing in any of the funds, securities, other investment or investment strategies that may have been discussed or referred herein and should understand that the views regarding future prospects may or may not be realized. In no event shall HSBC Mutual Fund / HSBC Asset management (India) Private Limited and / or its affiliates or any of their directors, trustees, officers and employees be liable for any direct, indirect, special, incidental or consequential damages arising out of the use of information / opinion herein. Neither this document nor the units of HSBC Mutual Fund have been registered in any jurisdiction. The distribution of this document in certain jurisdictions may be restricted or totally prohibited and accordingly, persons who come into possession of this document are required to inform themselves about, and to observe, any such restrictions.
mutual fund investments are subject to market risks, read all scheme related documents carefully.

HSBC Overnight FundOvernight fund – An open ended debt scheme investing in overnight securities
Abridged Annual Report 2020 - 2021

1
HSBC Overnight Fund
Dear Investor,
The beginning of the last financial year now almost seems like a distant memory. COVID-19 was still a relatively unknown enemy and governments across the world were grappling with ways to control and mitigate the risks associated with it. Nationwide lockdowns were the norm and our markets both equity and fixed income reacted negatively leading to significant erosion of wealth. Within a short period of time markets bounced back. This confounded even the most astute market pundits. How is it possible that when GDP growth had slowed down, unemployment had risen, inflation was high could there be such sharp up move in equity indices. Whilst the reasons are well known about easy global liquidity, demand resurgence, cost cutting by corporates etc. perhaps its most important to remember that the markets are not a reflector but a predictor of economic activity.
At all times particularly during such volatile times it is important to go back to the basics. Why do you save, why do you invest, what goals would you like to achieve, how old are you, what is your risk appetite? The replies to these simple questions will help you determine your asset allocation. As an example when equity markets corrected sharply last year, investors who reviewed their asset allocation, stayed invested during the lows of the past year and were able to capture the rebound and have seen prime returns since then. The current market movement in all likelihood would have also led to some imbalances in your asset allocation. Do not ignore that and I strongly recommend that you do review this with your advisor to check whether re-balancing is required.
During this financial year we had three very successful new fund launches. The pandemic showed us a clear trend of dominant players becoming stronger and profit pool getting consolidated within a few companies. To capture this opportunity, we launched the HSBC Focused Equity Fund which garnered close to Rs. 520 crores. During the second half of 2020, in the fixed income space, 3 - 5 year duration range had a favourable investment scenario as RBI’s accommodative policy and surplus liquidity had reduced the returns at the very short end of the yield curve. There was a demand for an actively managed moderate duration strategy with better credit quality which we fulfilled by launching HSBC Corporate Bond Fund. It garnered over 700 crores. Our latest and first of its kind offering, HSBC Global Equity Climate Change Fund of Fund saw a stupendous response with over 8000 investors investing over Rs. 616 crores. This is an investment opportunity which goes beyond the rationale of simply generating investment returns and is the future of responsible investing.
We worked towards augmenting our digital capabilities by launching a few key enhancements to our online transaction platform. Being mindful of the movement restrictions in place, this year we focused on digitizing offline processes so that an investor need not need step out of her home for investing or availing any key services. While our interactive chatbot AskMe, eased service queries, our end-to-end digital KYC module enabled a first time Mutual Fund investor to invest in our funds without any paperwork. We listened to your feedback and digitized consolidation of folios and change of tax status which eliminated the need for you to physically visit our branches.
I am a strong believer in the India story and this story has just begun. The opportunity to invest in this high growth market is a very exciting opportunity. I do hope you share my enthusiasm and I ask that you continue to invest whilst reviewing your asset allocation at all times. As always thank you for your business. Stay safe.
Warm regards,
Ravi MenonChief Executive Officer,
HSBC Asset Management India

2
Abridged Annual Report 2020 - 2021
SPONSOR
HSBC Securities and Capital Markets (India) Private LimitedRegd. Office: 52/60, Mahatma Gandhi Road, Fort, Mumbai - 400 001.
TRUSTEE
Board of TrusteesOffice: 16, Veer Nariman Road, Fort, Mumbai 400 001.
ASSET MANAGEMENT COMPANY
HSBC Asset Management (India) Private LimitedCorp. & Regd. Office: 16, Veer Nariman Road, Fort, Mumbai 400 001.
CUSTODIAN
Standard Chartered Bank (SCB)Corp. & Regd. Office: Crescenzo, Securities Services, 3rd Floor, C-38/39, G-Block,
Bandra Kurla Complex, Bandra East, Mumbai – 400051.
AUDITORS TO THE SCHEME
BSR & Co. LLPChartered Accountants
5th Floor, Lodha Excelus, Apollo Mills Compound, N. M. Joshi Marg, Mahalaxmi, Mumbai 400 011.
REGISTRAR & TRANSFER AGENTS
Computer Age Management Services Limited (CAMS)Unit: HSBC Mutual Fund ’C’ Block, 2nd Floor, Hanudev Info Park P. Ltd., SF No. 558/2, Udayampalayam Road, Nava India, Coimbatore - 641 028.
BOARD OF TRUSTEES
Ms. Jasmine Batliwalla - Chairperson
Mr. Nani Javeri - Trustee
Dr. T. C. Nair - Trustee
Mr. Pedro Bastos - Trustee
BOARD OF DIRECTORS
Mr. Dinesh Mittal - Director
Dr. Indu Shahani - Director
Mr. Ravi Menon - Director & Chief Executive Officer

3
HSBC Overnight Fund
The Trustees of HSBC Mutual Fund (“Fund”) present the Nineteenth Annual Report and the audited abridged financial statements of the schemes of the Fund for the year ended March 31, 2021.
As at March 31, 2021, the Fund offered 37 schemes across asset classes to meet the varying investment needs of the investors. During FY 2020-2021, the Fund has launched various new products namely HSBC Corporate Bond Fund, HSBC Focused Equity Fund and HSBC Global Equity Climate Change Fund of Fund to fill the gaps in our product offering.
The Fund continues its focus on delivering consistent long term returns. The comments on the performance of the Scheme(s) is provided hereinafter. Dividends were declared under various schemes as per the provisions contained in the respective Scheme Information Documents after considering the distributable surplus available under the respective Schemes. Details of dividends declared can be viewed on our website at www.assetmanagement.hsbc.co.in.
1. SCHEME PERFORMANCE, FUTURE OUTLOOk AND OPERATIONS OF THE SCHEMES
a. Operations and Performance of the Schemes
HSBC Overnight Fund (HOF)
(An open ended debt scheme investing in overnight securities)
HOF seeks to offer reasonable returns commensurate with low risk and high degree of liquidity through investments in overnight securities. However, there is no assurance that the investment objective of the Scheme will be achieved.
The net assets of HOF amounted to Rs. 354.48 crores as at March 31, 2021 as compared to Rs. 286.74 crores as at March 31, 2020 The entire net asset remains invested in debt and money market instruments including reverse repos / TREPS as at March 31, 2021. The scheme was launched on May 22, 2019.
HOF performed marginally lower than its benchmark due to conservative investments and the focus being only on overnight market i.e. TREPS and CROMS.
Date of Inception : 22 May 2019 Absolute Returns
(%)
Compounded Annualized Returns (%)
Scheme Name & Benchmarks 1 Year 3 Years 5 Years Since Inception
HSBC Overnight Fund – Growth 2.96 NA NA 3.86
CRISIL Overnight Index (Scheme Benchmark) 3.08 NA NA 4.02
Nifty 1D Rate Index (Standard Benchmark) 3.08 NA NA 4.02
CRISIL 1 Year T-Bill Index (Standard Benchmark)* 4.66 NA NA 6.05
Rs. 10,000, if invested in HOF, would have become 10,296 NA NA 10,730
Rs. 10,000, if invested in CRISIL Overnight Index, would have become
10,308 NA NA 10,761
Rs. 10,000, if invested in Nifty 1D Rate Index, would have become
10,308 NA NA 10,761
Rs. 10,000, if invested in CRISIL 1 Year T-Bill Index, would have become
10,466 NA NA 11,156
Past performance may or may not be sustained in future. The returns for the respective periods are provided as on last business day of March 2021 for Growth Option. Different plans shall have a different expense structure. Performance of the respective
benchmark is calculated as per the Total Return Index (TRI).
Trustees’ ReportFor the year ended March 31, 2021

4
Abridged Annual Report 2020 - 2021
b. Market Overview & Outlook (as furnished by HSBC Asset Management (India) Private Limited)
EqUITY OUTLOOk
Recap of FY 2020-21:
Fiscal 2020-21 was a rewarding year for equity investors with market indices recording stellar gains from the low base after the COVID correction. Market sentiments steadily improved during the course of the year to deliver positive returns in all four quarters of the year.
We witnessed various legs of market performance during the last fiscal, driven by multiple factors and variables. Initial rebound from the market lows was driven by attractive valuations, then it was on the back of faster than anticipated recovery post lockdown, reopening optimism, swifter than expected vaccine intervention and above all, the unprecedented liquidity. Lastly but importantly, a period of lower cost of capital coupled with low real rates, improved the attractiveness of equity as an asset class, driving the performance.
As a result, the year ended with optimism compared to despair when it began. Corporate India overcame the challenges posed by COVID through significant cost control measures while at the same time showed improvement in their financial position and cash flows.
Commodities also rallied from the lows of the COVID crisis with global crude oil prices surging by 179% during the year. INR appreciated by 3.3% (as India recorded strong net FPI inflows) during the year. MSCI India index outperformed most of key global indices during the past fiscal. MSCI India index (USD) gained 74.8% as compared to 51.8% for MSCI World, 50.5% for Dow Jones, 55.1% for MSCI Emerging Markets, 41.2% for MSCI China and 42% for MSCI Europe*.
At a record USD 37.3 bn of net FPI inflows during the fiscal, the tally was higher than the cumulative net inflows India received from the previous 6 years. DIIs on the other hand saw net outflows of USD 18.4 bn and this was the first fiscal year of net outflows from the segment in 5 years. The net outflows from the segment was driven by USD 16.7 bn of outflows from the MFs while domestic insurers saw a far lower outflow of USD 1.6 bn*.
Indices Returns (April 1, 2020 to March 31, 2021) 1 Year^
S&P BSE Sensex TR 69.8%
NSE CNX Nifty TR 72.5%
S&P BSE 100 TR 73.5%
S&P BSE 200 TR 76.3%
S&P BSE 500 TR 78.6%
S&P BSE Midcap TR 93.0%
S&P BSE 250 Small-cap TR 117.5%
^Source: Bloomberg (Above table values are for total return indices)
Way forward:
Beginning of the new fiscal, India had to contend with the risk of the second COVID wave, which was more ferocious than the first wave on the human impact. However, as we write this, the second wave has already peaked and there have been a significant fall in number of active cases, case-positivity rate, daily new caseload and deaths. Vaccination drive also has seen acceleration with and is now closer to 6 mn doses per day mark. Also, the impact of the lockdown on economic activity has been significantly lower during the second wave, compared to last year. In most of the states, the unlocking process has already begun in a phased manner and this is leading to improvement in various activity indicators. Mobility indicators are recovering faster while economic indicators (freight, credit off-take, E-way bill generation, power demand etc.) are also witnessing a gradual recovery. The recently concluded earnings season has turned out to be in-line with expectations and despite the concerns of around the second wave, the earnings (Nifty) have seen upgrades for FY22. Market is looking beyond the current quarter (i.e. 1QFY22), which would witness an impact due to the second wave. Our baseline assumption is that of a temporary impact from the second
Trustees’ ReportFor the year ended March 31, 2021 (Contd...)

5
HSBC Overnight Fund
wave and the set-back to the recovery process limited to a few months, after which we should see the economic rebound. So far, this is tracking in-line with assumptions.
From a macro perspective, the current estimates for GDP growth in FY22 stand at 9.2%* (after seeing downgrades to factor in the impact of second wave). The downgrade in estimates are pertaining to the first quarter and hence the trajectory of growth from hereon should pick up. The tax collections data for the first two months of FY22 has remained strong, implying that the drawdown of the second wave on the fiscal position is not alarming. Additionally, the impact of fiscal stimulus package announced in FY22 so far is manageable (about 60 bps of GDP) and hence would not lead to any fiscal strain.
After the spectacular rally, market valuations at an overall level are now trending above historical averages on traditional valuation metrics (P/E, P/B). This is true for all market capitalization categories (viz large, mid and small). Typically, the broader market (i.e. mid and small cap segments), trade at a discount to large caps, however this scenario has now reversed after the outperformance from the broader market segments. However, the earnings momentum continues to remain strong (witnessing upgrades so far) and except for a short period due to second wave, the earnings momentum should hold up.
We believe that the risk-reward is balanced for the equity markets in the near term. Higher or sticky inflation expectations globally, higher than historical market valuations on some parameters (i.e. P/E, P/B) and adverse demand impact from the second wave are risk factors to contend with in the near term. However, these are counter balanced by positive commentary from companies, significant decline in COVID cases and acceleration in the vaccination programme. As a result, in the near term markets may see a consolidation phase and could take cues from the upcoming earnings season with more focus on the corporate commentary and the outlook. From a medium to long term perspective, the outlook for equity markets remains positive. The expectation of cyclical revival in the economy brings in a multi-year earnings visibility. This along with a benign cost of capital environment, should support equity performance. However, equity returns are likely to moderate on the back of the relatively high valuations and the strong recovery we have already witnessed from the COVID lows. Equity performance is likely to mirror the earnings growth trends over the medium to long term.
Pace of vaccination, concerns about a third wave, corporate earnings trajectory, inflation trends (both global & domestic), monsoon trends and commodity prices (especially crude oil) are some of the key factors which could influence market performance in the short term.
From a portfolio perspective, we are maintaining a pro-cyclical bias. We expect earnings growth to rebound sharply post the current COVID phase. Earnings growth are expected to sustain in high-teens beyond FY22 on the back of economy witnessing a cyclical recovery due to revival in capex cycle over the next 2-3 years (first by the government followed by private capex). From a sectoral perspective our order of preference is rate sensitives followed by domestic cyclicals, exporters and domestic consumption. Predominantly regulated businesses come last in our pecking order. This preference is dictated by our assessment of sectors / segments leading contribution to the market earnings growth over the next 2-3 years. Our portfolio construction is driven by a bottom up approach to stock selection with a focus on names that can deliver positive earnings surprises. We continue to focus on this theme to identify likely outperformers.
*Source: Bloomberg
DEBT OUTLOOk
Market drivers during the course of the year FY21
The Fixed Income markets started the year with a bout of nervousness that was triggered by the pandemic. While RBI had calmed the markets with its large rate cut action of 75bp cut followed by liquidity supportive measures, the volatility continued until mid-May when government announced its relief package. While it was not fiscally expansive, it touched the right cords in terms of credit flow to desired sectors. This was followed up with RBI’s credit relief measures in terms of moratorium and restructuring of assets that were stressed due to the pandemic. Throughout the course of the year, RBI maintained its accommodative stance along with significant amount of surplus liquidity that was supportive and helped in maintaining stability in the market. However, as the year progressed and pressure on fiscal began to mount yields started seeing a spike towards the last quarter of the fiscal. While borrowing was stepped up to INR 12 trillion from previously budgeted INR 7.8 trillion in May 2020, it was further enhanced by and additional INR 1.1 trillion in October 2020.
Trustees’ ReportFor the year ended March 31, 2021 (Contd...)

6
Abridged Annual Report 2020 - 2021
Overall GOI ended up borrowing a record amount of INR 13.9 trillion. The budget proved to be a shocker with GOI using the pandemic as an opportunity for setting the finances in order. GOI showed a record deficit of 9.5% for FY21 and projected a 6.8% for FY22 with estimated central government gross borrowing of INR 12 trillion. This seemed to reverse the support RBI had provided throughout the year with benchmark 10-year bond peaking to 6.23% in mid –Feb 2021. RBI’s statements to remain supportive were left in the sidelines. Overall it seemed that the 115bp of rate cut, along with significant liquidity infusion (OMO + Twist operations of ~INR 3 trillion, infusion via dollar purchases) seemed only a little to help in applying a brake to the one-way spike in yields. The year closed ~6.16% with absence of concrete action by RBI.
RBI Policy: Through the course of the year, RBI has maintained an accommodative stance, with an aggregate 115bp of rate cut done in March and May 2020 taking the repo rate from 5.15% to 4%. Subsequently while inflation pressures prevented RBI from taking any direct actions, RBI has used a combination of creative tools to keep the rates contained primarily via liquidity supportive tools such as OMOs, Twist Operations, Repo linked Term loans to needy sectors (LTROs, TLTROs), CRR cuts. While inflation was a worry for most part of the year, RBI kept it aside admitting that growth was a priority and inflation effects are more supply side rather than demand side. Prospectively into FY22, with the onset of the second wave, RBI continues to maintain the stance to prioritize growth.
Inflation: Inflation for most part of the year stayed above 6% primarily driven by supply side pressures and some intermittent spike from food inflation as well. While it has been coming off since December with cooling off of food inflation and positive base effects, it has been between 4- 5.5%. Structurally however inflation risks continue to remain as oil prices have increased and base effects will not remain supportive for long. Core inflation continues to remain sticky.
Liquidity: During the year, system liquidity has remained at significant surplus facilitated largely by RBI action such as OMOs, foreign exchange operations and government spending.
Budget: The FY2022 union budget focuses on growth and has accordingly, presented a 9.5% fiscal deficit for FY21 and 6.8% for FY22. On the revenue side, the assumptions are largely realistic, with FY22 (E) Nominal GDP growth at 14.4% and tax revenue growth at 17% considering the pandemic impact in FY 21. Compared to FY20, tax revenue growth is ~10%. While non-tax revenues are ambitious pegging the divestment at INR 1.75 trillion, with robust pipeline of assets including monetization of road and transmission assets, execution remains the key as in the past. On the expenditure side, better quality capex spending with focusing on rail, road, defense, urban infra is positive for long term structural growth. The revenue side expenditure adjusting for clearance of past subsidy arrears will be similar to budgetary estimates. Government using this opportunity to bring back off-balance sheet spending to on-balance sheet was a welcome move towards transparency and showing realistic projections. Alongside, states have also been given leeway to borrow upto 4% of their GDP with an additional 0.5% subject to conditions. Given that states are an important vehicle for capex investment, this move is welcome although it may entail additional state borrowing. The fiscal glide path is shifted to FY26 at below 4.5% for center and 3% for states suggesting that spending will continue and borrowing will come down gradually. In summary, from survival to revival, FY22 budget aims for structural growth leaving fiscal concerns sideways in the interim. Government’s intent seems clear on bringing back growth on the table, in a transparent manner.
While the second wave of the pandemic has once again derailed the revenue story, government will still have some cushion from its conservative estimates.
Currency and FII Flows: INR has been on an appreciation trajectory for most part of the year, aided by dollar underperformance supported by positive FII and FDI flows along with reduced imports on the domestic front as well. RBI has used most of the flows to accumulate reserves which has prevented any strong appreciation. Pandemic shock and global risk off led rupee over 75 in the beginning of the year only to close below 72 at the end of the fiscal year. While the second wave led to another spike in INR in April, it has since then cooled once again driven by dollar underperformance and pandemic recovery on the domestic front. Net FII flows was ~$30 bn with positive equity flows of~$37 bn while debt was negative ~$7bn and overall RBI’s forex reserves rose by a ~$100 bn to close ~$537 bn.
Credit growth: Credit growth for the entire year has been tepid as previous year’s credit events were followed by nervousness relating to the pandemic. Despite RBI opening up several windows to finance the non-AAA segment, there was very little fresh credit flowing that segment. Overall banking credit grew by
Trustees’ ReportFor the year ended March 31, 2021 (Contd...)
7
HSBC Overnight Fund
only 6.5%. Risk appetite has however been improving from a complete risk aversion to opening up towards a calculated risk. Prospectively it is expected that once the pandemic risk abates, credit growth will resume primarily driven by government capex spending and demand recovery.
Market Outlook
The pandemic once again brought the country to a situation similar to last year and debt markets perhaps interpreted the same as a structural rise in rates. In the initial day’s post budget in Feb of 2021, market was expecting a concrete set of actions such as an OMO calendar from RBI, and RBI’s words alone failed to calm the market. The first auction of the fiscal year also saw a devolvement. However, RBI acted in the first policy of the year announcing a bond buyback program akin to QE (quantitative easing) and its subsequent cancellation of auctions wherein yields were perhaps quoted higher than RBI’s comfort levels brought back confidence into the market. Since then we have seen a strong rally with 10-year benchmark trending below 6% and the curve moving alongside. RBI reiteration of priority of growth and also supporting with higher than expected dividend payment stand out as a testimony of its support. While we do not expect RBI to act in terms of rate cuts, we believe that measures such as G-SAP, OMOs will continue until there is visibility of a structural growth. Therefore, the large borrowing program should go without any hiccups.
Furthermore, with the evidence of strong GST numbers until April 2021 (before the 2nd wave), it is expected that growth and therefore fiscal revenues will come back. Government’s conservative budget estimates are supportive. Also, given the fact that compared to last year there has not been a complete shutdown of activity (lockdowns being distributed), the impact on growth will not be similar to last year. Pent up demand will come back to support revenue collection. However, on the flipside, once growth resumes RBI will be forced to withdraw liquidity in a phased manner to prevent asset bubbles. Nevertheless, RBI need not act in terms of rate actions and we believe that a prolonged pause in terms of RBI rates is in the offing.
Net-net therefore while growth is wanting no matter what, it may come at a small price of rise in yields with liquidity withdrawal. That is however expected more in the 2nd half of the year. Lower than expected borrowing numbers, later this year or if not in next year could be a surprise. We may therefore see a range bound rate action in the near term with a rising bias over time. Global rate environment, oil and currency risks are to be watched out for.
2. BRIEF BACkGROUND OF SPONSORS, BOARD OF TRUSTEES AND ASSET MANAGEMENT COMPANY
a. Sponsor
HSBC Mutual Fund is sponsored by HSBC Securities and Capital Markets (India) Private Limited (HSCI). The Sponsor is the Settler of the Mutual Fund Trust. The Sponsor has entrusted a sum of Rs. 1,00,000/- (Rupees One Lakh only) to the Trustee as the initial contribution towards the corpus of the Mutual Fund.
HSCI offers integrated investment banking services, securities and corporate finance & advisory. HSCI is a member of the Bombay Stock Exchange Limited and National Stock Exchange (capital and derivative market segments). HSCI holds 100% of the paid up equity share capital of HSBC Asset Management (India) Private Limited.
b. HSBC Mutual Fund
HSBC Mutual Fund (“the Mutual Fund” or “the Fund”) has been constituted as a Trust in accordance with the provisions of the Indian Trusts Act, 1882 (2 of 1882) vide a Trust Deed dated February 7, 2002 with HSBC Securities and Capital Markets (India) Private Limited, as the Sponsor and the Board of Individual Trustees. The Trustee has entered into an Investment Management Agreement dated February 7, 2002 with HSBC Asset Management (India) Private Limited (AMC) to function as the Investment Manager for all the schemes of the Fund. The Fund was registered with SEBI vide registration number MF/046/02/5 dated May 27, 2002.
The Trust has been formed for the purpose of pooling of capital from the public for collective investment in securities for the purpose of providing facilities for participation by persons as beneficiaries in such investments and in the profits/income arising therefrom.
Trustees’ ReportFor the year ended March 31, 2021 (Contd...)
8
Abridged Annual Report 2020 - 2021
c. Board of Trustees (the Trustees)
The Board of Trustees is the exclusive owner of the Trust Fund and holds the same in trust for the benefit of the unit holders. The Trustees have been discharging their duties and carrying out the responsibilities as provided in the SEBI (Mutual Funds) Regulations, 1996 and the Trust Deed. The Trustees seek to ensure that the Fund and the schemes floated there under are managed by the AMC in accordance with the Trust Deed, the said Regulations, directions and guidelines issued by the SEBI, the Stock Exchanges, the Association of Mutual Funds in India and other regulatory agencies.
d. Asset Management Company (the AMC)
HSBC Asset Management (India) Private Limited (the Investment Manager or the AMC) is a private limited company incorporated under the Companies Act, 1956 on December 12, 2001 having its Registered Office at 16, V. N. Road, Fort, Mumbai 400 001. HSBC Asset Management (India) Private Limited has been appointed as the Asset Management Company of HSBC Mutual Fund by the Trustee vide Investment Management Agreement (IMA) dated February 7, 2002 and executed between the Trustees and the AMC. SEBI approved the AMC to act as the Investment Manager of the Fund vide its letter No. MFD/BC/163/2002 dated May 27, 2002. The paid-up equity share capital of the AMC is Rs. 61.59 crores. The AMC is registered as a Portfolio Manager under the SEBI (Portfolio Managers) Regulations, 1993 vide registration no. INP000001322. The AMC also offers non-binding Advisory services to offshore funds under the mutual fund license.
HSBC Securities and Capital Markets (India) Private Limited holds 100% of the paid up equity share capital of the AMC.
3. INvESTMENT OBJECTIvE OF THE SCHEMESThe investment objective of the respective schemes has been provided above under the heading “Scheme Performance, Future Outlook and Operation of the Scheme” (Refer Section 1).
4. SIGNIFICANT ACCOUNTING POLICIES The Significant Accounting Policies form part of the Notes to the Accounts annexed to the Balance Sheet of the Schemes in the Full Annual Report. The accounting policies are in accordance with Securities Exchange Board of India (Mutual Funds) Regulations 1996.
5. UNCLAIMED DIvIDENDS & REDEMPTIONSSummary of number of investors & corresponding amount as on March 31, 2021:
Nil.
6. INvESTOR SERvICESThe number of official points of acceptance of transactions is 204 locations. In addition to the offices of the Registrar & Transfer agents, the AMC has Investor Service Centers in 9 locations at its own offices - namely Mumbai, New Delhi, Kolkata, Bangalore, Pune, Ahmedabad, Hyderabad, Chandigarh and Chennai. With a view to enhance customer convenience, the AMC has the facility of priority based servicing to key distributors through the enhancement of the Interactive Voice Reponses. The AMC has 2 Toll Free numbers (1-800-200-2434 /1-800-258-2434) which can be dialed from anywhere in India and 1 number i.e +91 44 39923900 (Investors calling from abroad). The call center service is being managed by the Registrar and Transfer Agents. Transactions for purchase / redemption of units in the schemes HSBC Mutual Fund can also be made through the online transaction facility on the AMC’s website at https://invest.assetmanagement.hsbc.co.in.
On the distribution front, the number of empaneled distributors was 1069 as on March 31, 2021. During the year, the AMC initiated tie-ups for online distribution of the Mutual Fund’s schemes with several channel partners taking the total number of such tie-ups to 52.
7. DETAILS OF INvESTOR GRIEvANCE REDRESSALThe details of the redressal of investor complaints received against HSBC Mutual Fund during April 2020 - March 2021 are as follows:
Trustees’ ReportFor the year ended March 31, 2021 (Contd...)
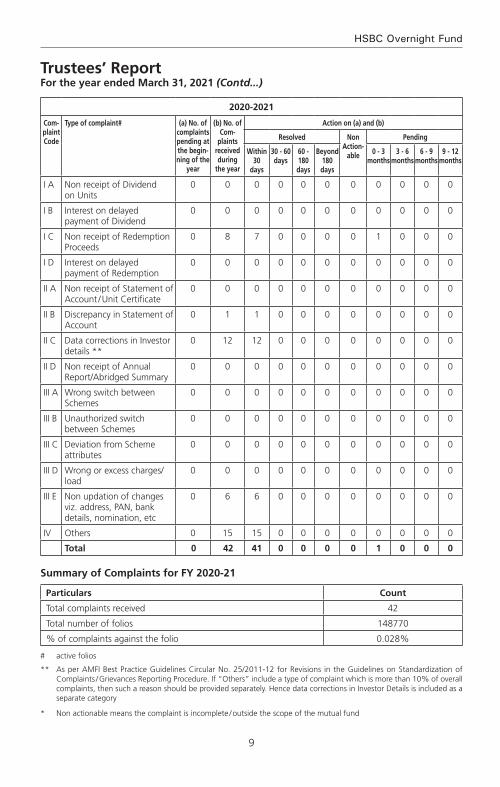
9
HSBC Overnight Fund
Trustees’ ReportFor the year ended March 31, 2021 (Contd...)
2020-2021
Com-plaint Code
Type of complaint# (a) No. of complaints pending at the begin-ning of the
year
(b) No. of Com-
plaints received during
the year
Action on (a) and (b)
Resolved Non Action-
able
Pending
Within 30
days
30 - 60 days
60 - 180 days
Beyond 180 days
0 - 3 months
3 - 6 months
6 - 9 months
9 - 12 months
I A Non receipt of Dividend on Units
0 0 0 0 0 0 0 0 0 0 0
I B Interest on delayed payment of Dividend
0 0 0 0 0 0 0 0 0 0 0
I C Non receipt of Redemption Proceeds
0 8 7 0 0 0 0 1 0 0 0
I D Interest on delayed payment of Redemption
0 0 0 0 0 0 0 0 0 0 0
II A Non receipt of Statement of Account / Unit Certificate
0 0 0 0 0 0 0 0 0 0 0
II B Discrepancy in Statement of Account
0 1 1 0 0 0 0 0 0 0 0
II C Data corrections in Investor details **
0 12 12 0 0 0 0 0 0 0 0
II D Non receipt of Annual Report/Abridged Summary
0 0 0 0 0 0 0 0 0 0 0
III A Wrong switch between Schemes
0 0 0 0 0 0 0 0 0 0 0
III B Unauthorized switch between Schemes
0 0 0 0 0 0 0 0 0 0 0
III C Deviation from Scheme attributes
0 0 0 0 0 0 0 0 0 0 0
III D Wrong or excess charges/load
0 0 0 0 0 0 0 0 0 0 0
III E Non updation of changes viz. address, PAN, bank details, nomination, etc
0 6 6 0 0 0 0 0 0 0 0
IV Others 0 15 15 0 0 0 0 0 0 0 0
Total 0 42 41 0 0 0 0 1 0 0 0
Summary of Complaints for FY 2020-21
Particulars Count
Total complaints received 42
Total number of folios 148770
% of complaints against the folio 0.028%
# active folios
** As per AMFI Best Practice Guidelines Circular No. 25/2011-12 for Revisions in the Guidelines on Standardization of Complaints / Grievances Reporting Procedure. If “Others” include a type of complaint which is more than 10% of overall complaints, then such a reason should be provided separately. Hence data corrections in Investor Details is included as a separate category
* Non actionable means the complaint is incomplete / outside the scope of the mutual fund
10
Abridged Annual Report 2020 - 2021
8. INvESTOR EDUCATION INITIATIvES Investor awareness advertisements were published in Mutual Fund Insight magazine on a monthly basis along with an editorial on ‘SIP Sahi Hai’. Additionally, monthly articles / blogs have been written by Advisorkhoj on IAP which talks of the advantages of SIP, start early, power of compounding, diversification, asset allocation etc. The same is promoted by the publisher via an email to their entire network and also on their social media handles which can be retweeted or liked. Also, educative infographics have been hosted on our website under the investor resources section. The same have also been circulated to existing Indian investors via email for engagement and for educative purposes.
9. PROxY vOTING POLICYIn terms of SEBI Circular no. SEBI/IMD/CIR No. 18/198647/2010 dated March 15, 2010, the Fund has adopted Proxy Voting Policy and Procedures for exercising voting rights in respect of securities held by the Schemes.
The summary of the votes casted in the general meetings of the Investee companies, by the AMC for and on behalf of the Schemes of the Fund, for the financial year 2020-2021 is provided below:
quarter Total no. of resolutions
Break-up of vote decision
For Against Abstained
June 2020 50 43 6 1
September 2020 752 656 38 58
December 2020 41 31 1 9
March 2021 40 30 8 2
Total 883 760 53 70
In terms of the requirement of SEBI Circular no. CIR/IMD/DF/05/2014 dated March 24, 2014 and SEBI/HO/IMD/DF2/CIR/P/2016/68 dated August 10, 2016; the AMC has obtained certificate from M/s. M. P. Chitale & Co., Chartered Accountants, who is acting as a Scrutinizer, on the voting report for the FY 2020-21. The certificate dated April 14, 2021 issued by M/s. M. P. Chitale & Co., is available on the website of the AMC as part of the full Annual Report.
Unit holders can refer to the full Annual Report for complete details of actual exercise of votes in the general meetings of the investee companies for the financial year 2020-21 or log on to our website at www.assetmanagement.hsbc.co.in.
10. STATUTORY DETAILSa) The Sponsors are not responsible or liable for any loss resulting from the operation of the Schemes of
the Fund beyond initial contribution of Rs. 1 lakh for setting up the Fund.
b) The price and redemption value of the units, and income from them, can go up as well as down with fluctuations in the market value of its underlying investments.
c) Full Annual Report of HSBC Mutual Fund and of HSBC Asset Management (India) Private Limited (the AMC) shall be disclosed on the website at www.assetmanagement.hsbc.co.in and shall be available for inspection at the Head Office of the Mutual Fund. Present and prospective unit holders can obtain copy of the Trust Deed, the full Annual Report of the Scheme(s), the Annual Report of HSBC Asset Management (India) Private Limited and the text of the relevant Scheme(s) at a price.
11. SCHEME WISE CHANGES IN RISk-O-METER OF THE SCHEMES OF HSBC MUTUAL FUND DURING FY 2021
As per the requirements of SEBI Circular no. SEBI/HO/IMD/DF3/CIR/P/2020/197 dated October 05, 2020 the changes carried out in the risk-o-meter of the schemes of HSBC Mutual Fund during FY 2021 have been given in the below mentioned table for the information of the Unitholders, a report on the said changes has also been displayed on the website of the Fund and AMFI.
Trustees’ ReportFor the year ended March 31, 2021 (Contd...)

11
HSBC Overnight Fund
Trustees’ ReportFor the year ended March 31, 2021 (Contd...)
Scheme Name
Risk-o-meter level as on December
31,2020^
Risk-o-meter level at end of
the financial year
Number of changes in Risk-o-meter during the
financial year^
Dec-2020 Mar-2021 Dec 2020 to March 2021
HSBC Overnight Fund Low Low 0
^From the effective date (i.e. January 01, 2021) of SEBI circular no. SEBI/HO/IMD/DF3/CIR/P/2020/197 dated October 05, 2020.
12. GOvERNANCE UNDER THE POLICY ON STEWARDSHIP RESPONSIBILITIES OF HSBC MUTUAL FUND
As per the requirements of SEBI Circular no. CIR/CFD/CMD1/ 168 /2019 dated December 24, 2019, HSBC Mutual Fund has adapted the policy on stewardship responsibilities, the unitholders are requested to note the status of governance with the same as mentioned below:
S. No.
Particulars of Principles of Stewardship Code
Status of compliance (Complied/
Not Complied)
Description Remarks/reasons for
deviation/non - compliance,
if any
1 Principle 1:Institutional Investors should formulate a comprehensive policy on the discharge of their stewardship responsibilities, publicly disclose it, review and update it periodically.
Complied HSBC Asset Management (India) Private Limited's (AMIN) 'Policy on Stewardship responsibilities' (Stewardship Code / Policy) was formulated and implemented on 01 July, 2020. This is a comprehensive document which has been publicly disclosed on the website of AMIN. The same shall follow a periodic review.
N.A.
2 Principle 2:Inst i tut ional investors should have a clear policy on how they manage conflicts of interest in fulfilling their stewardship responsibilities and publicly disclose it.
Complied Defining and managing Conflict of Interest in fulfilling stewardship responsibilities are detailed in the Stewardship Policy document. The policy document is publicly disclosed.
N.A.
3 Principle 3:Institutional investors should monitor their investee companies.
Complied AMIN monitors all investee companies through its investment process. This includes assessment of companies’ own and market data, consideration of research from brokers and other independent research providers – including ESG & voting research, attending individual & group meetings with company management and directors, visiting production sites (wherever necessary), engaging with key stakeholders including competitors and customers, and financial modelling. More details enumerated in the policy document
N.A.
4 Principle 4:Inst i tut ional investors should have a clear policy on intervention in their investee companies. Institutional investors should also have a
Complied Details of undertaking active engagement with investee companies and the policy for collaboration with other institutional holders are detai led in the policy document. The policy document is publicly disclosed.
N.A.

12
Abridged Annual Report 2020 - 2021
Trustees’ ReportFor the year ended March 31, 2021 (Contd...)
S. No.
Particulars of Principles of Stewardship Code
Status of compliance (Complied/
Not Complied)
Description Remarks/reasons for
deviation/non - compliance,
if any
clear policy for collaboration with other institutional investors where required, to preserve the interests of the ultimate investors, which should be disclosed.
5 Principle 5:
Inst i tut ional investors should have a clear policy on voting and disclosure of voting activity.
Complied AMIN has a clear and detailed voting policy which provides the framework for the voting decisions. All voting decisions shall be in accordance with AMIN’s Voting Policy and Procedures, which is disclosed on the website. AMIN discloses the details of the voting on its website on a quarterly basis within 10 working days from the end of the quarter. Additionally, AMIN also discloses the details of the votes cast, in the annual report of the schemes of HSBC Mutual Fund.
N.A.
6 Principle 6:Institutional investors should report periodically on their stewardship activities.
Complied The annual status report of the stewardship code and quarterly report on proxy voting are publicly disclosed on the website as required under SEBI Regulations.
N.A.
13. SIGNIFICANT EvENT AFTER THE END OF THE FINANCIAL YEAR
HSBC Global Consumer Opportunities Fund (HGCOF) has been merged with HSBC Asia Pacific (Ex Japan) Dividend Yield Fund with effect from May 13, 2021. Therefore, HGCOF has been ceased to exist from the aforesaid date.
14. ACkNOWLEDGEMENTS
The Trustees wish to thank the Unit holders of the Schemes for their support throughout the year and also thank the Government of India, the Securities and Exchange Board of India (SEBI), the Reserve Bank of India (RBI) and the Association of Mutual Funds in India (AMFI) for the guidance provided by them. The Trustees also appreciate the services provided by the Registrar and Transfer Agent, Fund Accountant, Custodian, Bankers, Distributors and Brokers. The guidance and services provided by the Auditors and advocates and the ebullience, sincerity and dedication of the employees of HSBC Asset Management (India) Private Limited is also appreciated.
The Trustees look forward to the continued support of everyone.
For and on behalf of the Board of Trustees of HSBC Mutual Fund
Sd/-
Trustee
Mumbai
July 20, 2021.

13
HSBC Overnight Fund
To the Trustees of HSBC Mutual Fund
HSBC Overnight Fund
Report on the Audit of the Financial Statements
OpinionWe have audited the financial statements of HSBC Overnight Fund (the ‘Scheme’) of HSBC Mutual Fund, which comprise the balance sheet as at 31 March 2021 and the revenue account for the year then ended, and notes to the financial statements, including a summary of the significant accounting policies.
In our opinion and to the best of our information and according to the explanations given to us, the aforesaid financial statements give a true and fair view in conformity with the accounting principles generally accepted in India, of the state of affairs of the Scheme as at 31 March 2021, its net surplus for the year ended on that date.
Basis for OpinionWe conducted our audit in accordance with the Standards on Auditing (‘SAs’) issued by the Institute of Chartered Accountants of India (the ‘ICAI’). Our responsibilities under those SAs are further described in the Auditor’s Responsibilities for the Audit of the Financial Statements section of our report. We are independent of the Scheme in accordance with the Code of Ethics issued by the ICAI, and we have fulfilled our other ethical responsibilities in accordance with the Code of Ethics. We believe that the audit evidence we have obtained is sufficient and appropriate to provide a basis for our opinion.
Responsibilities of Management and Those Charged with Governance for the Financial StatementsThe Scheme’s management, the Board of Directors of HSSBC Mutual Fund (the ‘Trustee’) and the Board of Directors of HSBC Asset Management (India) Private Limited (the ‘AMC’) (collectively referred to as ‘Management’) are responsible for the preparation of these financial statements that give a true and fair view of the state of affairs, results of operations of the Scheme in accordance with the accounting policies and standards specified in the Ninth Schedule of the Securities and Exchange Board of India (Mutual Funds) Regulations, 1996, as amended (the ‘Regulations’) and the accounting principles generally accepted in India. This responsibility includes design, implementation and maintenance of internal control relevant to the preparation and presentation of the financial statements that give a true and fair view and are free from material misstatement, whether due to fraud or error.
In preparing the financial statements, management is responsible for assessing the Scheme’s ability to continue as a going concern, disclosing, as applicable, matters related to going concern and using the going concern basis of accounting unless management either intends to liquidate the Scheme or to cease operations, or has no realistic alternative but to do so.
The management is responsible for overseeing the Scheme’s financial reporting process.
Auditor’s Responsibilities for the Audit of the Financial StatementsOur objectives are to obtain reasonable assurance about whether the financial statements as a whole are free from material misstatement, whether due to fraud or error, and to issue an auditor’s report that includes our opinion. Reasonable assurance is a high level of assurance, but is not a guarantee that an audit conducted in accordance with SAs will always detect a material misstatement when it exists. Misstatements can arise from fraud or error and are considered material if, individually or in the aggregate, they could reasonably be expected to influence the economic decisions of users taken on the basis of these financial statements.
As part of an audit in accordance with SAs, we exercise professional judgment and maintain professional skepticism throughout the audit. We also:
• Identifyandassesstherisksofmaterialmisstatementofthefinancialstatements,whetherduetofraudor error, design and perform audit procedures responsive to those risks, and obtain audit evidence that is sufficient and appropriate to provide a basis for our opinion. The risk of not detecting a material misstatement resulting from fraud is higher than for one resulting from error, as fraud may involve collusion, forgery, intentional omissions, misrepresentations, or the override of internal control;
Independent Auditors’ Report

14
Abridged Annual Report 2020 - 2021
Independent Auditors’ Report (Contd...)
• Obtainanunderstandingofinternalcontrolrelevanttotheauditinordertodesignauditproceduresthat are appropriate in the circumstances, but not for the purpose of expressing an opinion on the effectiveness of the Scheme’s internal controls;
• Evaluatetheappropriatenessofaccountingpoliciesusedandthereasonablenessofaccountingestimatesand related disclosures made by Management;
• ConcludeontheappropriatenessofManagement’suseofthegoingconcernbasisofaccountingand,based on the audit evidence obtained, whether a material uncertainty exists related to events or conditions that may cast significant doubt on the Scheme’s ability to continue as a going concern. If we conclude that a material uncertainty exists, we are required to draw attention in our auditor’s report to the related disclosures in the financial statements or, if such disclosures are inadequate, to modify our opinion. Our conclusions are based on the audit evidence obtained up to the date of our auditor’s report. However, future events or conditions may cause the Scheme to cease to continue as a going concern;
• Evaluate the overall presentation, structure and content of the financial statements, including thedisclosures and whether the financial statements represent the underlying transactions and events in a manner that achieves fair presentation.
We communicate with those charged with governance regarding, among other matters, the planned scope and timing of the audit and significant audit findings, including any significant deficiencies in internal control that we identify during our audit.
We also provide those charged with governance with a statement that we have complied with relevant ethical requirements regarding independence, and to communicate with them all relationships and other matters that may reasonably be thought to bear on our independence, and where applicable, related safeguards.
Report on Other Legal and Regulatory Requirements 1 As required by Regulation 55 (4) of the Regulations, we report that:
(a) We have obtained all information and explanations which, to the best of our knowledge and belief, were necessary for the purposes of the audit; and
(b) The balance sheet and the revenue account have been prepared in accordance with the accounting policies and standards as specified in the Ninth Schedule of the Regulations.
2 As required by Clause 5 (ii) (2) of the Eleventh Schedule of the Regulations, we report that the balance sheet and the revenue account are in agreement with the books of account of the Scheme.
3 As required by the Eight Schedule of the Regulations, we report that, in our opinion and on the basis of information and explanations given to us, the methods used to value non - traded securities, as at 31 March 2021, as determined by the Board of Directors of the AMC, are in accordance with the Regulations and other guidelines issued by the Securities and Exchange Board of India as applicable and approved by the Board of Directors of the Trustee, are fair and reasonable.
For B S R & Co. LLP Chartered Accountants Firm’s Registration No: 101248W/W-100022
Sd/-
Ajit Viswanath PartnerMembership No: 067114UDIN : 21067114AAAADH9966
Place : Mumbai Date : July 20, 2021.
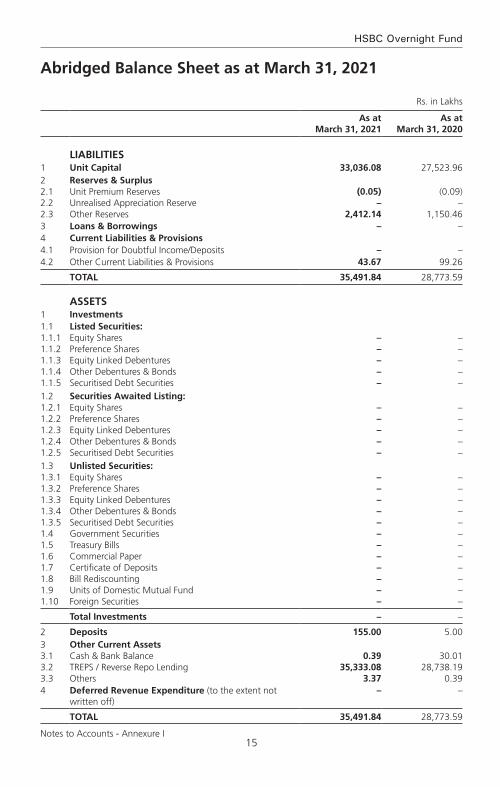
15
HSBC Overnight Fund
Rs. in Lakhs
As at March 31, 2021
As at March 31, 2020
LIABILITIES1 Unit Capital 33,036.08 27,523.96 2 Reserves & Surplus2.1 Unit Premium Reserves (0.05) (0.09)2.2 Unrealised Appreciation Reserve – – 2.3 Other Reserves 2,412.14 1,150.46 3 Loans & Borrowings – – 4 Current Liabilities & Provisions4.1 Provision for Doubtful Income/Deposits – – 4.2 Other Current Liabilities & Provisions 43.67 99.26
TOTAL 35,491.84 28,773.59
ASSETS1 Investments1.1 Listed Securities:1.1.1 Equity Shares – – 1.1.2 Preference Shares – – 1.1.3 Equity Linked Debentures – – 1.1.4 Other Debentures & Bonds – – 1.1.5 Securitised Debt Securities – –
1.2 Securities Awaited Listing:1.2.1 Equity Shares – – 1.2.2 Preference Shares – – 1.2.3 Equity Linked Debentures – – 1.2.4 Other Debentures & Bonds – – 1.2.5 Securitised Debt Securities – –
1.3 Unlisted Securities:1.3.1 Equity Shares – – 1.3.2 Preference Shares – – 1.3.3 Equity Linked Debentures – – 1.3.4 Other Debentures & Bonds – – 1.3.5 Securitised Debt Securities – – 1.4 Government Securities – – 1.5 Treasury Bills – – 1.6 Commercial Paper – – 1.7 Certificate of Deposits – – 1.8 Bill Rediscounting – – 1.9 Units of Domestic Mutual Fund – – 1.10 Foreign Securities – –
Total Investments – –
2 Deposits 155.00 5.00 3 Other Current Assets3.1 Cash & Bank Balance 0.39 30.01 3.2 TREPS / Reverse Repo Lending 35,333.08 28,738.19 3.3 Others 3.37 0.39 4 Deferred Revenue Expenditure (to the extent not
written off) – –
TOTAL 35,491.84 28,773.59
Notes to Accounts - Annexure I
Abridged Balance Sheet as at March 31, 2021
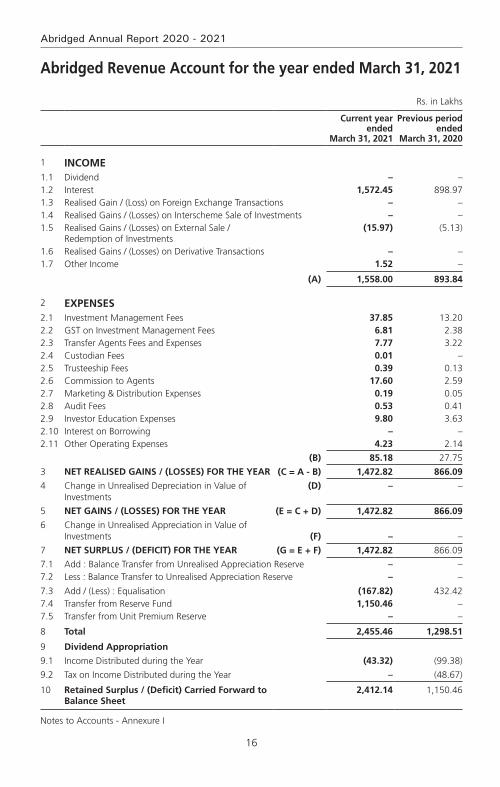
16
Abridged Annual Report 2020 - 2021
Abridged Revenue Account for the year ended March 31, 2021
Rs. in Lakhs
Current year ended
March 31, 2021
Previous period ended
March 31, 2020
1 INCOME1.1 Dividend – – 1.2 Interest 1,572.45 898.97 1.3 Realised Gain / (Loss) on Foreign Exchange Transactions – – 1.4 Realised Gains / (Losses) on Interscheme Sale of Investments – – 1.5 Realised Gains / (Losses) on External Sale /
Redemption of Investments (15.97) (5.13)
1.6 Realised Gains / (Losses) on Derivative Transactions – – 1.7 Other Income 1.52 –
(A) 1,558.00 893.84
2 ExPENSES2.1 Investment Management Fees 37.85 13.20 2.2 GST on Investment Management Fees 6.81 2.38 2.3 Transfer Agents Fees and Expenses 7.77 3.22 2.4 Custodian Fees 0.01 – 2.5 Trusteeship Fees 0.39 0.13 2.6 Commission to Agents 17.60 2.59 2.7 Marketing & Distribution Expenses 0.19 0.05 2.8 Audit Fees 0.53 0.41 2.9 Investor Education Expenses 9.80 3.63 2.10 Interest on Borrowing – – 2.11 Other Operating Expenses 4.23 2.14
(B) 85.18 27.75
3 NET REALISED GAINS / (LOSSES) FOR THE YEAR (C = A - B) 1,472.82 866.09
4 Change in Unrealised Depreciation in Value of Investments
(D) – –
5 NET GAINS / (LOSSES) FOR THE YEAR (E = C + D) 1,472.82 866.09
6 Change in Unrealised Appreciation in Value of Investments (F) – –
7 NET SURPLUS / (DEFICIT) FOR THE YEAR (G = E + F) 1,472.82 866.09
7.1 Add : Balance Transfer from Unrealised Appreciation Reserve – – 7.2 Less : Balance Transfer to Unrealised Appreciation Reserve – –
7.3 Add / (Less) : Equalisation (167.82) 432.42 7.4 Transfer from Reserve Fund 1,150.46 – 7.5 Transfer from Unit Premium Reserve – –
8 Total 2,455.46 1,298.51
9 Dividend Appropriation
9.1 Income Distributed during the Year (43.32) (99.38)
9.2 Tax on Income Distributed during the Year – (48.67)
10 Retained Surplus / (Deficit) Carried Forward to Balance Sheet
2,412.14 1,150.46
Notes to Accounts - Annexure I
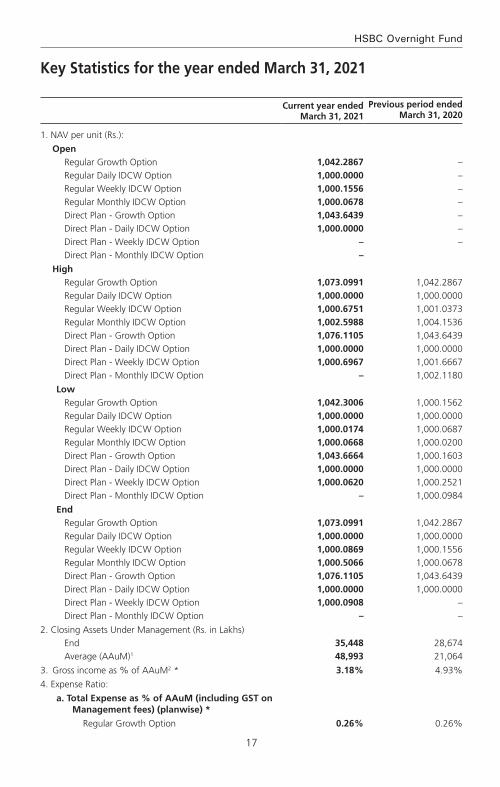
17
HSBC Overnight Fund
key Statistics for the year ended March 31, 2021
Current year ended March 31, 2021
Previous period ended March 31, 2020
1. NAV per unit (Rs.):
OpenRegular Growth Option 1,042.2867 –
Regular Daily IDCW Option 1,000.0000 –
Regular Weekly IDCW Option 1,000.1556 –
Regular Monthly IDCW Option 1,000.0678 –
Direct Plan - Growth Option 1,043.6439 –
Direct Plan - Daily IDCW Option 1,000.0000 –
Direct Plan - Weekly IDCW Option – –
Direct Plan - Monthly IDCW Option –
HighRegular Growth Option 1,073.0991 1,042.2867
Regular Daily IDCW Option 1,000.0000 1,000.0000
Regular Weekly IDCW Option 1,000.6751 1,001.0373
Regular Monthly IDCW Option 1,002.5988 1,004.1536
Direct Plan - Growth Option 1,076.1105 1,043.6439
Direct Plan - Daily IDCW Option 1,000.0000 1,000.0000
Direct Plan - Weekly IDCW Option 1,000.6967 1,001.6667
Direct Plan - Monthly IDCW Option – 1,002.1180
LowRegular Growth Option 1,042.3006 1,000.1562
Regular Daily IDCW Option 1,000.0000 1,000.0000
Regular Weekly IDCW Option 1,000.0174 1,000.0687
Regular Monthly IDCW Option 1,000.0668 1,000.0200
Direct Plan - Growth Option 1,043.6664 1,000.1603
Direct Plan - Daily IDCW Option 1,000.0000 1,000.0000
Direct Plan - Weekly IDCW Option 1,000.0620 1,000.2521
Direct Plan - Monthly IDCW Option – 1,000.0984
EndRegular Growth Option 1,073.0991 1,042.2867
Regular Daily IDCW Option 1,000.0000 1,000.0000
Regular Weekly IDCW Option 1,000.0869 1,000.1556
Regular Monthly IDCW Option 1,000.5066 1,000.0678
Direct Plan - Growth Option 1,076.1105 1,043.6439
Direct Plan - Daily IDCW Option 1,000.0000 1,000.0000
Direct Plan - Weekly IDCW Option 1,000.0908 –
Direct Plan - Monthly IDCW Option – –
2. Closing Assets Under Management (Rs. in Lakhs)
End 35,448 28,674
Average (AAuM)1 48,993 21,064
3. Gross income as % of AAuM2 * 3.18% 4.93%
4. Expense Ratio:
a. Total Expense as % of AAuM (including GST on Management fees) (planwise) *
Regular Growth Option 0.26% 0.26%
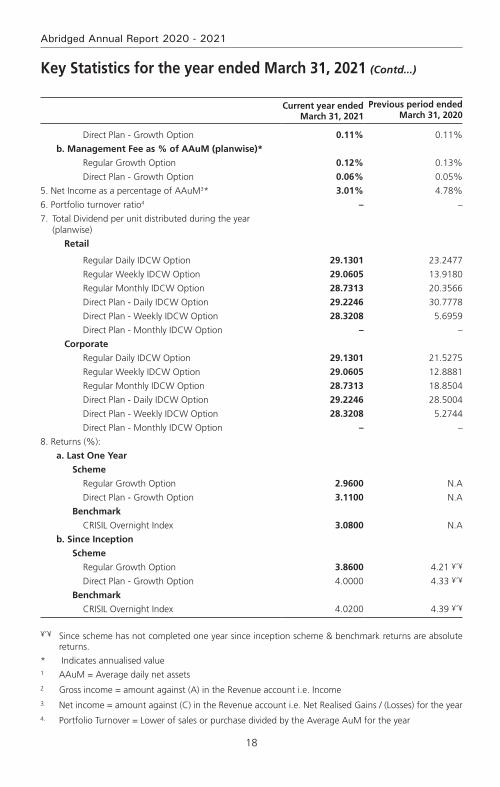
18
Abridged Annual Report 2020 - 2021
Current year ended March 31, 2021
Previous period ended March 31, 2020
Direct Plan - Growth Option 0.11% 0.11%
b. Management Fee as % of AAuM (planwise)*
Regular Growth Option 0.12% 0.13%
Direct Plan - Growth Option 0.06% 0.05%
5. Net Income as a percentage of AAuM3* 3.01% 4.78%
6. Portfolio turnover ratio4 – –
7. Total Dividend per unit distributed during the year (planwise)
Retail
Regular Daily IDCW Option 29.1301 23.2477
Regular Weekly IDCW Option 29.0605 13.9180
Regular Monthly IDCW Option 28.7313 20.3566
Direct Plan - Daily IDCW Option 29.2246 30.7778
Direct Plan - Weekly IDCW Option 28.3208 5.6959
Direct Plan - Monthly IDCW Option – –
Corporate
Regular Daily IDCW Option 29.1301 21.5275
Regular Weekly IDCW Option 29.0605 12.8881
Regular Monthly IDCW Option 28.7313 18.8504
Direct Plan - Daily IDCW Option 29.2246 28.5004
Direct Plan - Weekly IDCW Option 28.3208 5.2744
Direct Plan - Monthly IDCW Option – –
8. Returns (%):
a. Last One Year
Scheme
Regular Growth Option 2.9600 N.A
Direct Plan - Growth Option 3.1100 N.A
Benchmark
CRISIL Overnight Index 3.0800 N.A
b. Since Inception
Scheme
Regular Growth Option 3.8600 4.21 ¥’¥
Direct Plan - Growth Option 4.0000 4.33 ¥’¥
Benchmark
CRISIL Overnight Index 4.0200 4.39 ¥’¥
¥’¥ Since scheme has not completed one year since inception scheme & benchmark returns are absolute returns.
* Indicates annualised value1 AAuM = Average daily net assets2 Gross income = amount against (A) in the Revenue account i.e. Income3. Net income = amount against (C) in the Revenue account i.e. Net Realised Gains / (Losses) for the year4. Portfolio Turnover = Lower of sales or purchase divided by the Average AuM for the year
key Statistics for the year ended March 31, 2021 (Contd...)
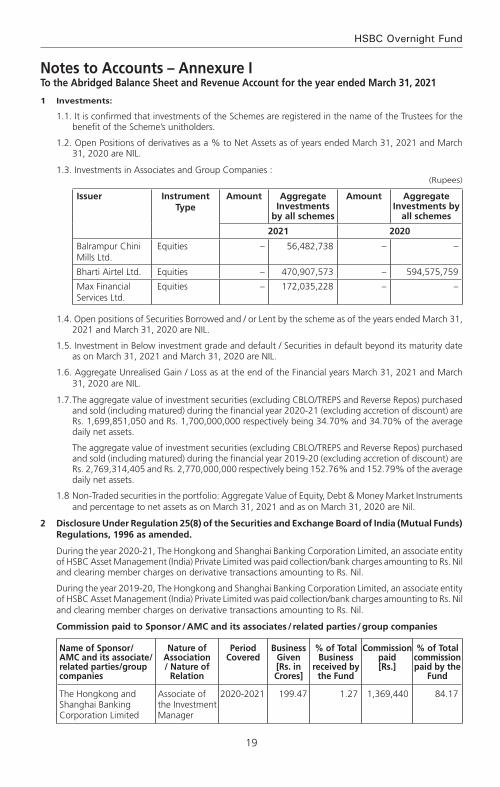
19
HSBC Overnight Fund
Notes to Accounts – Annexure ITo the Abridged Balance Sheet and Revenue Account for the year ended March 31, 2021
1 Investments:
1.1. It is confirmed that investments of the Schemes are registered in the name of the Trustees for the benefit of the Scheme’s unitholders.
1.2. Open Positions of derivatives as a % to Net Assets as of years ended March 31, 2021 and March 31, 2020 are NIL.
1.3. Investments in Associates and Group Companies :(Rupees)
Issuer Instrument Type
Amount Aggregate Investments
by all schemes
Amount Aggregate Investments by
all schemes
2021 2020
Balrampur Chini Mills Ltd.
Equities – 56,482,738 – –
Bharti Airtel Ltd. Equities – 470,907,573 – 594,575,759
Max Financial Services Ltd.
Equities – 172,035,228 – –
1.4. Open positions of Securities Borrowed and / or Lent by the scheme as of the years ended March 31, 2021 and March 31, 2020 are NIL.
1.5. Investment in Below investment grade and default / Securities in default beyond its maturity date as on March 31, 2021 and March 31, 2020 are NIL.
1.6. Aggregate Unrealised Gain / Loss as at the end of the Financial years March 31, 2021 and March 31, 2020 are NIL.
1.7. The aggregate value of investment securities (excluding CBLO/TREPS and Reverse Repos) purchased and sold (including matured) during the financial year 2020-21 (excluding accretion of discount) are Rs. 1,699,851,050 and Rs. 1,700,000,000 respectively being 34.70% and 34.70% of the average daily net assets.
The aggregate value of investment securities (excluding CBLO/TREPS and Reverse Repos) purchased and sold (including matured) during the financial year 2019-20 (excluding accretion of discount) are Rs. 2,769,314,405 and Rs. 2,770,000,000 respectively being 152.76% and 152.79% of the average daily net assets.
1.8 Non-Traded securities in the portfolio: Aggregate Value of Equity, Debt & Money Market Instruments and percentage to net assets as on March 31, 2021 and as on March 31, 2020 are Nil.
2 Disclosure Under Regulation 25(8) of the Securities and Exchange Board of India (Mutual Funds) Regulations, 1996 as amended.
During the year 2020-21, The Hongkong and Shanghai Banking Corporation Limited, an associate entity of HSBC Asset Management (India) Private Limited was paid collection/bank charges amounting to Rs. Nil and clearing member charges on derivative transactions amounting to Rs. Nil.
During the year 2019-20, The Hongkong and Shanghai Banking Corporation Limited, an associate entity of HSBC Asset Management (India) Private Limited was paid collection/bank charges amounting to Rs. Nil and clearing member charges on derivative transactions amounting to Rs. Nil.
Commission paid to Sponsor / AMC and its associates / related parties / group companies
Name of Sponsor/AMC and its associate/related parties/group companies
Nature of Association / Nature of
Relation
Period Covered
Business Given [Rs. in Crores]
% of Total Business
received by the Fund
Commission paid [Rs.]
% of Total commission paid by the
Fund
The Hongkong and Shanghai Banking Corporation Limited
Associate of the Investment Manager
2020-2021 199.47 1.27 1,369,440 84.17
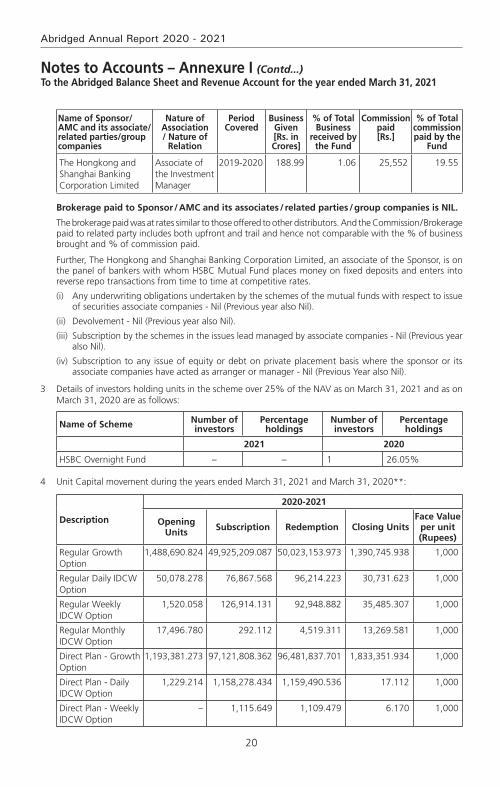
20
Abridged Annual Report 2020 - 2021
Name of Sponsor/AMC and its associate/related parties/group companies
Nature of Association / Nature of
Relation
Period Covered
Business Given [Rs. in Crores]
% of Total Business
received by the Fund
Commission paid [Rs.]
% of Total commission paid by the
Fund
The Hongkong and Shanghai Banking Corporation Limited
Associate of the Investment Manager
2019-2020 188.99 1.06 25,552 19.55
Brokerage paid to Sponsor / AMC and its associates / related parties / group companies is NIL.
The brokerage paid was at rates similar to those offered to other distributors. And the Commission / Brokerage paid to related party includes both upfront and trail and hence not comparable with the % of business brought and % of commission paid.
Further, The Hongkong and Shanghai Banking Corporation Limited, an associate of the Sponsor, is on the panel of bankers with whom HSBC Mutual Fund places money on fixed deposits and enters into reverse repo transactions from time to time at competitive rates.
(i) Any underwriting obligations undertaken by the schemes of the mutual funds with respect to issue of securities associate companies - Nil (Previous year also Nil).
(ii) Devolvement - Nil (Previous year also Nil).
(iii) Subscription by the schemes in the issues lead managed by associate companies - Nil (Previous year also Nil).
(iv) Subscription to any issue of equity or debt on private placement basis where the sponsor or its associate companies have acted as arranger or manager - Nil (Previous Year also Nil).
3 Details of investors holding units in the scheme over 25% of the NAV as on March 31, 2021 and as on March 31, 2020 are as follows:
Name of Scheme Number of investors
Percentage holdings
Number of investors
Percentage holdings
2021 2020
HSBC Overnight Fund – – 1 26.05%
4 Unit Capital movement during the years ended March 31, 2021 and March 31, 2020**:
Description
2020-2021
Opening Units Subscription Redemption Closing Units
Face value per unit (Rupees)
Regular Growth Option
1,488,690.824 49,925,209.087 50,023,153.973 1,390,745.938 1,000
Regular Daily IDCW Option
50,078.278 76,867.568 96,214.223 30,731.623 1,000
Regular Weekly IDCW Option
1,520.058 126,914.131 92,948.882 35,485.307 1,000
Regular Monthly IDCW Option
17,496.780 292.112 4,519.311 13,269.581 1,000
Direct Plan - Growth Option
1,193,381.273 97,121,808.362 96,481,837.701 1,833,351.934 1,000
Direct Plan - Daily IDCW Option
1,229.214 1,158,278.434 1,159,490.536 17.112 1,000
Direct Plan - Weekly IDCW Option
– 1,115.649 1,109.479 6.170 1,000
Notes to Accounts – Annexure I (Contd...)To the Abridged Balance Sheet and Revenue Account for the year ended March 31, 2021
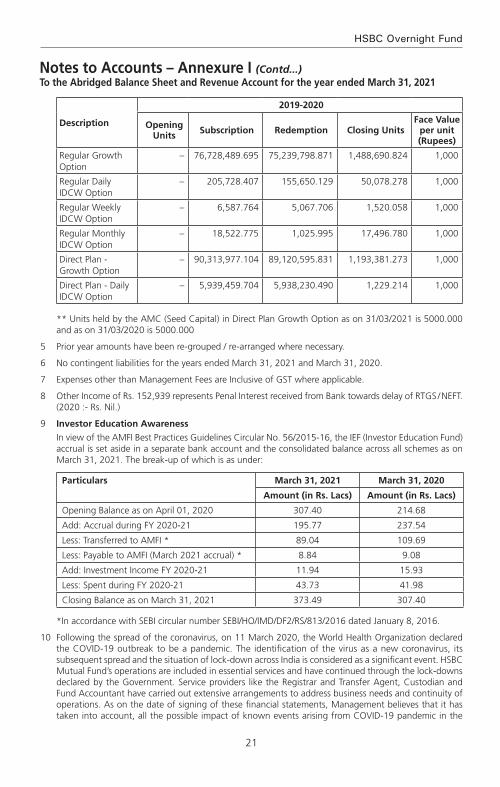
21
HSBC Overnight Fund
Description
2019-2020
Opening Units Subscription Redemption Closing Units
Face value per unit (Rupees)
Regular Growth Option
– 76,728,489.695 75,239,798.871 1,488,690.824 1,000
Regular Daily IDCW Option
– 205,728.407 155,650.129 50,078.278 1,000
Regular Weekly IDCW Option
– 6,587.764 5,067.706 1,520.058 1,000
Regular Monthly IDCW Option
– 18,522.775 1,025.995 17,496.780 1,000
Direct Plan - Growth Option
– 90,313,977.104 89,120,595.831 1,193,381.273 1,000
Direct Plan - Daily IDCW Option
– 5,939,459.704 5,938,230.490 1,229.214 1,000
** Units held by the AMC (Seed Capital) in Direct Plan Growth Option as on 31/03/2021 is 5000.000 and as on 31/03/2020 is 5000.000
5 Prior year amounts have been re-grouped / re-arranged where necessary.
6 No contingent liabilities for the years ended March 31, 2021 and March 31, 2020.
7 Expenses other than Management Fees are Inclusive of GST where applicable.
8 Other Income of Rs. 152,939 represents Penal Interest received from Bank towards delay of RTGS / NEFT. (2020 :- Rs. Nil.)
9 Investor Education Awareness
In view of the AMFI Best Practices Guidelines Circular No. 56/2015-16, the IEF (Investor Education Fund) accrual is set aside in a separate bank account and the consolidated balance across all schemes as on March 31, 2021. The break-up of which is as under:
Particulars March 31, 2021 March 31, 2020
Amount (in Rs. Lacs) Amount (in Rs. Lacs)
Opening Balance as on April 01, 2020 307.40 214.68
Add: Accrual during FY 2020-21 195.77 237.54
Less: Transferred to AMFI * 89.04 109.69
Less: Payable to AMFI (March 2021 accrual) * 8.84 9.08
Add: Investment Income FY 2020-21 11.94 15.93
Less: Spent during FY 2020-21 43.73 41.98
Closing Balance as on March 31, 2021 373.49 307.40
*In accordance with SEBI circular number SEBI/HO/IMD/DF2/RS/813/2016 dated January 8, 2016.
10 Following the spread of the coronavirus, on 11 March 2020, the World Health Organization declared the COVID-19 outbreak to be a pandemic. The identification of the virus as a new coronavirus, its subsequent spread and the situation of lock-down across India is considered as a significant event. HSBC Mutual Fund’s operations are included in essential services and have continued through the lock-downs declared by the Government. Service providers like the Registrar and Transfer Agent, Custodian and Fund Accountant have carried out extensive arrangements to address business needs and continuity of operations. As on the date of signing of these financial statements, Management believes that it has taken into account, all the possible impact of known events arising from COVID-19 pandemic in the
Notes to Accounts – Annexure I (Contd...)To the Abridged Balance Sheet and Revenue Account for the year ended March 31, 2021
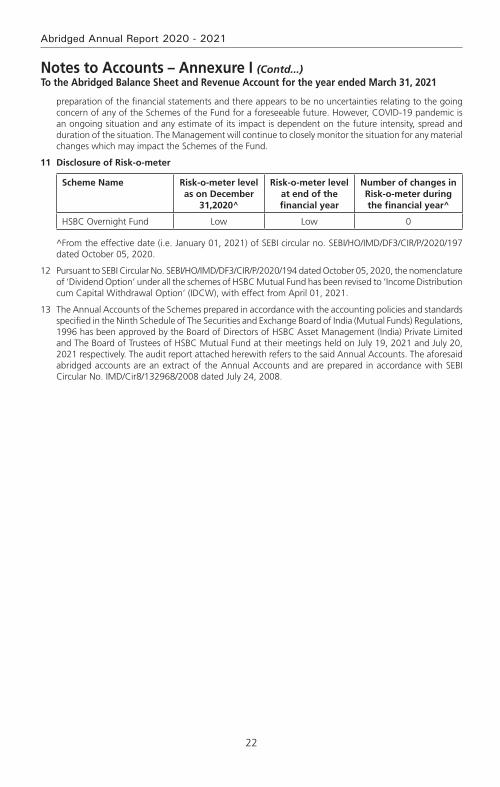
22
Abridged Annual Report 2020 - 2021
preparation of the financial statements and there appears to be no uncertainties relating to the going concern of any of the Schemes of the Fund for a foreseeable future. However, COVID-19 pandemic is an ongoing situation and any estimate of its impact is dependent on the future intensity, spread and duration of the situation. The Management will continue to closely monitor the situation for any material changes which may impact the Schemes of the Fund.
11 Disclosure of Risk-o-meter
Scheme Name Risk-o-meter level as on December
31,2020^
Risk-o-meter level at end of the financial year
Number of changes in Risk-o-meter during the financial year^
HSBC Overnight Fund Low Low 0
^From the effective date (i.e. January 01, 2021) of SEBI circular no. SEBI/HO/IMD/DF3/CIR/P/2020/197 dated October 05, 2020.
12 Pursuant to SEBI Circular No. SEBI/HO/IMD/DF3/CIR/P/2020/194 dated October 05, 2020, the nomenclature of ‘Dividend Option’ under all the schemes of HSBC Mutual Fund has been revised to ‘Income Distribution cum Capital Withdrawal Option’ (IDCW), with effect from April 01, 2021.
13 The Annual Accounts of the Schemes prepared in accordance with the accounting policies and standards specified in the Ninth Schedule of The Securities and Exchange Board of India (Mutual Funds) Regulations, 1996 has been approved by the Board of Directors of HSBC Asset Management (India) Private Limited and The Board of Trustees of HSBC Mutual Fund at their meetings held on July 19, 2021 and July 20, 2021 respectively. The audit report attached herewith refers to the said Annual Accounts. The aforesaid abridged accounts are an extract of the Annual Accounts and are prepared in accordance with SEBI Circular No. IMD/Cir8/132968/2008 dated July 24, 2008.
Notes to Accounts – Annexure I (Contd...)To the Abridged Balance Sheet and Revenue Account for the year ended March 31, 2021

23
HSBC Overnight Fund
voting Policy and Procedures
In view of SEBI guidelines related to “Role of Mutual Funds in Corporate Governance of Public Listed Companies”, HSBC AMC has formulated its “Policy for Proxy Voting in Public Listed Companies”. The said policy is available on our website and the details of actual exercise of proxy votes, the summary of votes casted and the auditor’s certificate for the Financial Year 2020 – 21 is forming part of our full Annual Report for the Financial Year 2020 – 21 which is uploaded on our website at http://www.assetmanagement.hsbc.co.in
24
Abridged Annual Report 2020 - 2021
Statutory Details & Disclaimers
All the returns have been sourced from Mutual Funds India Explorer software. The performance of the schemes and the benchmark is calculated on a total return basis. This document has been prepared by HSBC Asset Management (India) Private Ltd (HSBC) for information purposes only and should not be construed as i) an offer or recommendation to buy or sell securities, commodities, currencies or other investments referred to herein; or ii) an offer to sell or a solicitation or an offer for purchase of any of the funds of HSBC Mutual Fund; or iii) an investment research or investment advice. All information contained in this document (including that sourced from third parties), is obtained from sources HSBC and the third party which HSBC believes to be reliable however, has not independently verified the same. The information and opinions contained within the document are based upon publicly available information and rates of taxation applicable (if any) at the time of publication, which are subject to change from time to time.
Expressions of opinion are those of HSBC only and are subject to change without notice. It does not have regard to specific investment objectives, financial situation and the particular needs of any specific person who may receive this document. Investors should seek personal and independent advice regarding the appropriateness of investing in any of the funds, securities, other investment or investment strategies that may have been discussed or referred herein and should understand that the views regarding future prospects may or may not be realized. In no event shall HSBC Mutual Fund / HSBC Asset management (India) Private Limited and / or its affiliates or any of their directors, trustees, officers and employees be liable for any direct, indirect, special, incidental or consequential damages arising out of the use of information / opinion herein. Neither this document nor the units of HSBC Mutual Fund have been registered in any jurisdiction. The distribution of this document in certain jurisdictions may be restricted or totally prohibited and accordingly, persons who come into possession of this document are required to inform themselves about, and to observe, any such restrictions.
Mutual Fund investments are subject to market risks, read all scheme related documents carefully.
HSBC Regular Savings FundAn open ended hybrid scheme investing predominantly in debt instruments
Abridged Annual Report 2020 - 2021
1
HSBC Regular Savings Fund
Dear Investor,
The beginning of the last financial year now almost seems like a distant memory. COVID-19 was still a relatively unknown enemy and governments across the world were grappling with ways to control and mitigate the risks associated with it. Nationwide lockdowns were the norm and our markets both equity and fixed income reacted negatively leading to significant erosion of wealth. Within a short period of time markets bounced back. This confounded even the most astute market pundits. How is it possible that when GDP growth had slowed down, unemployment had risen, inflation was high could there be such sharp up move in equity indices. Whilst the reasons are well known about easy global liquidity, demand resurgence, cost cutting by corporates etc. perhaps its most important to remember that the markets are not a reflector but a predictor of economic activity.
At all times particularly during such volatile times it is important to go back to the basics. Why do you save, why do you invest, what goals would you like to achieve, how old are you, what is your risk appetite? The replies to these simple questions will help you determine your asset allocation. As an example when equity markets corrected sharply last year, investors who reviewed their asset allocation, stayed invested during the lows of the past year and were able to capture the rebound and have seen prime returns since then. The current market movement in all likelihood would have also led to some imbalances in your asset allocation. Do not ignore that and I strongly recommend that you do review this with your advisor to check whether re-balancing is required.
During this financial year we had three very successful new fund launches. The pandemic showed us a clear trend of dominant players becoming stronger and profit pool getting consolidated within a few companies. To capture this opportunity, we launched the HSBC Focused Equity Fund which garnered close to Rs. 520 crores. During the second half of 2020, in the fixed income space, 3 - 5 year duration range had a favourable investment scenario as RBI’s accommodative policy and surplus liquidity had reduced the returns at the very short end of the yield curve. There was a demand for an actively managed moderate duration strategy with better credit quality which we fulfilled by launching HSBC Corporate Bond Fund. It garnered over 700 crores. Our latest and first of its kind offering, HSBC Global Equity Climate Change Fund of Fund saw a stupendous response with over 8000 investors investing over Rs. 616 crores. This is an investment opportunity which goes beyond the rationale of simply generating investment returns and is the future of responsible investing.
We worked towards augmenting our digital capabilities by launching a few key enhancements to our online transaction platform. Being mindful of the movement restrictions in place, this year we focused on digitizing offline processes so that an investor need not need step out of her home for investing or availing any key services. While our interactive chatbot AskMe, eased service queries, our end-to-end digital KYC module enabled a first time Mutual Fund investor to invest in our funds without any paperwork. We listened to your feedback and digitized consolidation of folios and change of tax status which eliminated the need for you to physically visit our branches.
I am a strong believer in the India story and this story has just begun. The opportunity to invest in this high growth market is a very exciting opportunity. I do hope you share my enthusiasm and I ask that you continue to invest whilst reviewing your asset allocation at all times. As always thank you for your business. Stay safe.
Warm regards,
Ravi MenonChief Executive Officer,
HSBC Asset Management India

2
Abridged Annual Report 2020 - 2021
SPONSOR
HSBC Securities and Capital Markets (India) Private LimitedRegd. Office: 52/60, Mahatma Gandhi Road, Fort, Mumbai - 400 001.
TRUSTEE
Board of TrusteesOffice: 16, Veer Nariman Road, Fort, Mumbai 400 001.
ASSET MANAGEMENT COMPANY
HSBC Asset Management (India) Private LimitedCorp. & Regd. Office: 16, Veer Nariman Road, Fort, Mumbai 400 001.
CUSTODIAN
Standard Chartered Bank (SCB)Corp. & Regd. Office: Crescenzo, Securities Services, 3rd Floor, C-38/39, G-Block,Bandra Kurla Complex, Bandra East, Mumbai – 400051.
AUDITORS TO THE SCHEME
BSR & Co. LLPChartered Accountants
5th Floor, Lodha Excelus, Apollo Mills Compound, N. M. Joshi Marg, Mahalaxmi, Mumbai 400 011.
REGISTRAR & TRANSFER AGENTS
Computer Age Management Services Limited (CAMS)Unit: HSBC Mutual Fund ’C’ Block, 2nd Floor, Hanudev Info Park P. Ltd., SF No. 558/2, Udayampalayam Road, Nava India, Coimbatore - 641 028.
BOARD OF TRUSTEES
Ms. Jasmine Batliwalla - Chairperson
Mr. Nani Javeri - Trustee
Dr. T. C. Nair - Trustee
Mr. Pedro Bastos - Trustee
BOARD OF DIRECTORS
Mr. Dinesh Mittal - Director
Dr. Indu Shahani - Director
Mr. Ravi Menon - Director & Chief Executive Officer
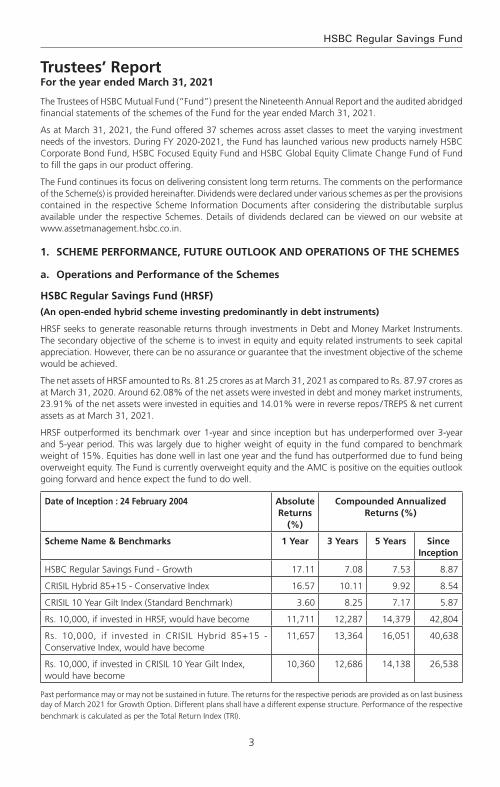
3
HSBC Regular Savings Fund
The Trustees of HSBC Mutual Fund (“Fund”) present the Nineteenth Annual Report and the audited abridged financial statements of the schemes of the Fund for the year ended March 31, 2021.
As at March 31, 2021, the Fund offered 37 schemes across asset classes to meet the varying investment needs of the investors. During FY 2020-2021, the Fund has launched various new products namely HSBC Corporate Bond Fund, HSBC Focused Equity Fund and HSBC Global Equity Climate Change Fund of Fund to fill the gaps in our product offering.
The Fund continues its focus on delivering consistent long term returns. The comments on the performance of the Scheme(s) is provided hereinafter. Dividends were declared under various schemes as per the provisions contained in the respective Scheme Information Documents after considering the distributable surplus available under the respective Schemes. Details of dividends declared can be viewed on our website at www.assetmanagement.hsbc.co.in.
1. Scheme Performance, future outlook and oPerationS of the SchemeS
a. operations and Performance of the Schemes
hSBc regular Savings fund (hrSf)
(an open-ended hybrid scheme investing predominantly in debt instruments)
HRSF seeks to generate reasonable returns through investments in Debt and Money Market Instruments. The secondary objective of the scheme is to invest in equity and equity related instruments to seek capital appreciation. However, there can be no assurance or guarantee that the investment objective of the scheme would be achieved.
The net assets of HRSF amounted to Rs. 81.25 crores as at March 31, 2021 as compared to Rs. 87.97 crores as at March 31, 2020. Around 62.08% of the net assets were invested in debt and money market instruments, 23.91% of the net assets were invested in equities and 14.01% were in reverse repos / TREPS & net current assets as at March 31, 2021.
HRSF outperformed its benchmark over 1-year and since inception but has underperformed over 3-year and 5-year period. This was largely due to higher weight of equity in the fund compared to benchmark weight of 15%. Equities has done well in last one year and the fund has outperformed due to fund being overweight equity. The Fund is currently overweight equity and the AMC is positive on the equities outlook going forward and hence expect the fund to do well.
date of inception : 24 february 2004 absolute returns
(%)
compounded annualized returns (%)
Scheme name & Benchmarks 1 Year 3 Years 5 Years Since inception
HSBC Regular Savings Fund - Growth 17.11 7.08 7.53 8.87
CRISIL Hybrid 85+15 - Conservative Index 16.57 10.11 9.92 8.54
CRISIL 10 Year Gilt Index (Standard Benchmark) 3.60 8.25 7.17 5.87
Rs. 10,000, if invested in HRSF, would have become 11,711 12,287 14,379 42,804
Rs. 10,000, if invested in CRISIL Hybrid 85+15 - Conservative Index, would have become
11,657 13,364 16,051 40,638
Rs. 10,000, if invested in CRISIL 10 Year Gilt Index, would have become
10,360 12,686 14,138 26,538
Past performance may or may not be sustained in future. The returns for the respective periods are provided as on last business day of March 2021 for Growth Option. Different plans shall have a different expense structure. Performance of the respective
benchmark is calculated as per the Total Return Index (TRI).
Trustees’ ReportFor the year ended March 31, 2021

4
Abridged Annual Report 2020 - 2021
b. market overview & outlook (as furnished by hSBc asset management (india) Private limited)
equitY outlook
recap of fY 2020-21:
Fiscal 2020-21 was a rewarding year for equity investors with market indices recording stellar gains from the low base after the COVID correction. Market sentiments steadily improved during the course of the year to deliver positive returns in all four quarters of the year.
We witnessed various legs of market performance during the last fiscal, driven by multiple factors and variables. Initial rebound from the market lows was driven by attractive valuations, then it was on the back of faster than anticipated recovery post lockdown, reopening optimism, swifter than expected vaccine intervention and above all, the unprecedented liquidity. Lastly but importantly, a period of lower cost of capital coupled with low real rates, improved the attractiveness of equity as an asset class, driving the performance.
As a result, the year ended with optimism compared to despair when it began. Corporate India overcame the challenges posed by COVID through significant cost control measures while at the same time showed improvement in their financial position and cash flows.
Commodities also rallied from the lows of the COVID crisis with global crude oil prices surging by 179% during the year. INR appreciated by 3.3% (as India recorded strong net FPI inflows) during the year. MSCI India index outperformed most of key global indices during the past fiscal. MSCI India index (USD) gained 74.8% as compared to 51.8% for MSCI World, 50.5% for Dow Jones, 55.1% for MSCI Emerging Markets, 41.2% for MSCI China and 42% for MSCI Europe*.
At a record USD 37.3 bn of net FPI inflows during the fiscal, the tally was higher than the cumulative net inflows India received from the previous 6 years. DIIs on the other hand saw net outflows of USD 18.4 bn and this was the first fiscal year of net outflows from the segment in 5 years. The net outflows from the segment was driven by USD 16.7 bn of outflows from the MFs while domestic insurers saw a far lower outflow of USD 1.6 bn*.
indices returns (april 1, 2020 to march 31, 2021) 1 Year^
S&P BSE Sensex TR 69.8%
NSE CNX Nifty TR 72.5%
S&P BSE 100 TR 73.5%
S&P BSE 200 TR 76.3%
S&P BSE 500 TR 78.6%
S&P BSE Midcap TR 93.0%
S&P BSE 250 Small-cap TR 117.5%
^Source: Bloomberg (Above table values are for total return indices)
Way forward:
Beginning of the new fiscal, India had to contend with the risk of the second COVID wave, which was more ferocious than the first wave on the human impact. However, as we write this, the second wave has already peaked and there have been a significant fall in number of active cases, case-positivity rate, daily new caseload and deaths. Vaccination drive also has seen acceleration with and is now closer to 6 mn doses per day mark. Also, the impact of the lockdown on economic activity has been significantly lower during the second wave, compared to last year. In most of the states, the unlocking process has already begun in a phased manner and this is leading to improvement in various activity indicators. Mobility indicators are recovering faster while economic indicators (freight, credit off-take, E-way bill generation, power demand etc.) are also witnessing a gradual recovery. The recently concluded earnings season has turned out to be in-line with expectations and despite the concerns of around the second wave, the earnings (Nifty) have seen upgrades for FY22. Market is looking beyond the current quarter (i.e. 1QFY22), which would witness
Trustees’ ReportFor the year ended March 31, 2021 (Contd...)
5
HSBC Regular Savings Fund
an impact due to the second wave. Our baseline assumption is that of a temporary impact from the second wave and the set-back to the recovery process limited to a few months, after which we should see the economic rebound. So far, this is tracking in-line with assumptions.
From a macro perspective, the current estimates for GDP growth in FY22 stand at 9.2%* (after seeing downgrades to factor in the impact of second wave). The downgrade in estimates are pertaining to the first quarter and hence the trajectory of growth from hereon should pick up. The tax collections data for the first two months of FY22 has remained strong, implying that the drawdown of the second wave on the fiscal position is not alarming. Additionally, the impact of fiscal stimulus package announced in FY22 so far is manageable (about 60 bps of GDP) and hence would not lead to any fiscal strain.
After the spectacular rally, market valuations at an overall level are now trending above historical averages on traditional valuation metrics (P/E, P/B). This is true for all market capitalization categories (viz large, mid and small). Typically, the broader market (i.e. mid and small cap segments), trade at a discount to large caps, however this scenario has now reversed after the outperformance from the broader market segments. However, the earnings momentum continues to remain strong (witnessing upgrades so far) and except for a short period due to second wave, the earnings momentum should hold up.
We believe that the risk-reward is balanced for the equity markets in the near term. Higher or sticky inflation expectations globally, higher than historical market valuations on some parameters (i.e. P/E, P/B) and adverse demand impact from the second wave are risk factors to contend with in the near term. However, these are counter balanced by positive commentary from companies, significant decline in COVID cases and acceleration in the vaccination programme. As a result, in the near term markets may see a consolidation phase and could take cues from the upcoming earnings season with more focus on the corporate commentary and the outlook. From a medium to long term perspective, the outlook for equity markets remains positive. The expectation of cyclical revival in the economy brings in a multi-year earnings visibility. This along with a benign cost of capital environment, should support equity performance. However, equity returns are likely to moderate on the back of the relatively high valuations and the strong recovery we have already witnessed from the COVID lows. Equity performance is likely to mirror the earnings growth trends over the medium to long term.
Pace of vaccination, concerns about a third wave, corporate earnings trajectory, inflation trends (both global & domestic), monsoon trends and commodity prices (especially crude oil) are some of the key factors which could influence market performance in the short term.
From a portfolio perspective, we are maintaining a pro-cyclical bias. We expect earnings growth to rebound sharply post the current COVID phase. Earnings growth are expected to sustain in high-teens beyond FY22 on the back of economy witnessing a cyclical recovery due to revival in capex cycle over the next 2-3 years (first by the government followed by private capex). From a sectoral perspective our order of preference is rate sensitives followed by domestic cyclicals, exporters and domestic consumption. Predominantly regulated businesses come last in our pecking order. This preference is dictated by our assessment of sectors / segments leading contribution to the market earnings growth over the next 2-3 years. Our portfolio construction is driven by a bottom up approach to stock selection with a focus on names that can deliver positive earnings surprises. We continue to focus on this theme to identify likely outperformers.
*Source: Bloomberg
deBt outlook
market drivers during the course of the year fY21
The Fixed Income markets started the year with a bout of nervousness that was triggered by the pandemic. While RBI had calmed the markets with its large rate cut action of 75bp cut followed by liquidity supportive measures, the volatility continued until mid-May when government announced its relief package. While it was not fiscally expansive, it touched the right cords in terms of credit flow to desired sectors. This was followed up with RBI’s credit relief measures in terms of moratorium and restructuring of assets that were stressed due to the pandemic. Throughout the course of the year, RBI maintained its accommodative stance along with significant amount of surplus liquidity that was supportive and helped in maintaining stability in the market. However, as the year progressed and pressure on fiscal began to mount yields started seeing a spike towards the last quarter of the fiscal. While borrowing was stepped up to INR 12 trillion from previously budgeted
Trustees’ ReportFor the year ended March 31, 2021 (Contd...)
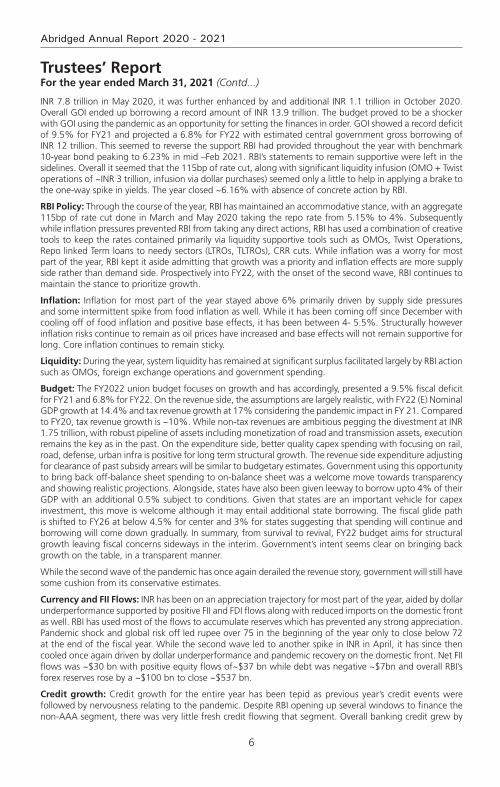
6
Abridged Annual Report 2020 - 2021
INR 7.8 trillion in May 2020, it was further enhanced by and additional INR 1.1 trillion in October 2020. Overall GOI ended up borrowing a record amount of INR 13.9 trillion. The budget proved to be a shocker with GOI using the pandemic as an opportunity for setting the finances in order. GOI showed a record deficit of 9.5% for FY21 and projected a 6.8% for FY22 with estimated central government gross borrowing of INR 12 trillion. This seemed to reverse the support RBI had provided throughout the year with benchmark 10-year bond peaking to 6.23% in mid –Feb 2021. RBI’s statements to remain supportive were left in the sidelines. Overall it seemed that the 115bp of rate cut, along with significant liquidity infusion (OMO + Twist operations of ~INR 3 trillion, infusion via dollar purchases) seemed only a little to help in applying a brake to the one-way spike in yields. The year closed ~6.16% with absence of concrete action by RBI.
rBi Policy: Through the course of the year, RBI has maintained an accommodative stance, with an aggregate 115bp of rate cut done in March and May 2020 taking the repo rate from 5.15% to 4%. Subsequently while inflation pressures prevented RBI from taking any direct actions, RBI has used a combination of creative tools to keep the rates contained primarily via liquidity supportive tools such as OMOs, Twist Operations, Repo linked Term loans to needy sectors (LTROs, TLTROs), CRR cuts. While inflation was a worry for most part of the year, RBI kept it aside admitting that growth was a priority and inflation effects are more supply side rather than demand side. Prospectively into FY22, with the onset of the second wave, RBI continues to maintain the stance to prioritize growth.
inflation: Inflation for most part of the year stayed above 6% primarily driven by supply side pressures and some intermittent spike from food inflation as well. While it has been coming off since December with cooling off of food inflation and positive base effects, it has been between 4- 5.5%. Structurally however inflation risks continue to remain as oil prices have increased and base effects will not remain supportive for long. Core inflation continues to remain sticky.
liquidity: During the year, system liquidity has remained at significant surplus facilitated largely by RBI action such as OMOs, foreign exchange operations and government spending.
Budget: The FY2022 union budget focuses on growth and has accordingly, presented a 9.5% fiscal deficit for FY21 and 6.8% for FY22. On the revenue side, the assumptions are largely realistic, with FY22 (E) Nominal GDP growth at 14.4% and tax revenue growth at 17% considering the pandemic impact in FY 21. Compared to FY20, tax revenue growth is ~10%. While non-tax revenues are ambitious pegging the divestment at INR 1.75 trillion, with robust pipeline of assets including monetization of road and transmission assets, execution remains the key as in the past. On the expenditure side, better quality capex spending with focusing on rail, road, defense, urban infra is positive for long term structural growth. The revenue side expenditure adjusting for clearance of past subsidy arrears will be similar to budgetary estimates. Government using this opportunity to bring back off-balance sheet spending to on-balance sheet was a welcome move towards transparency and showing realistic projections. Alongside, states have also been given leeway to borrow upto 4% of their GDP with an additional 0.5% subject to conditions. Given that states are an important vehicle for capex investment, this move is welcome although it may entail additional state borrowing. The fiscal glide path is shifted to FY26 at below 4.5% for center and 3% for states suggesting that spending will continue and borrowing will come down gradually. In summary, from survival to revival, FY22 budget aims for structural growth leaving fiscal concerns sideways in the interim. Government’s intent seems clear on bringing back growth on the table, in a transparent manner.
While the second wave of the pandemic has once again derailed the revenue story, government will still have some cushion from its conservative estimates.
currency and fii flows: INR has been on an appreciation trajectory for most part of the year, aided by dollar underperformance supported by positive FII and FDI flows along with reduced imports on the domestic front as well. RBI has used most of the flows to accumulate reserves which has prevented any strong appreciation. Pandemic shock and global risk off led rupee over 75 in the beginning of the year only to close below 72 at the end of the fiscal year. While the second wave led to another spike in INR in April, it has since then cooled once again driven by dollar underperformance and pandemic recovery on the domestic front. Net FII flows was ~$30 bn with positive equity flows of~$37 bn while debt was negative ~$7bn and overall RBI’s forex reserves rose by a ~$100 bn to close ~$537 bn.
credit growth: Credit growth for the entire year has been tepid as previous year’s credit events were followed by nervousness relating to the pandemic. Despite RBI opening up several windows to finance the non-AAA segment, there was very little fresh credit flowing that segment. Overall banking credit grew by
Trustees’ ReportFor the year ended March 31, 2021 (Contd...)

7
HSBC Regular Savings Fund
only 6.5%. Risk appetite has however been improving from a complete risk aversion to opening up towards a calculated risk. Prospectively it is expected that once the pandemic risk abates, credit growth will resume primarily driven by government capex spending and demand recovery.
market outlook
The pandemic once again brought the country to a situation similar to last year and debt markets perhaps interpreted the same as a structural rise in rates. In the initial day’s post budget in Feb of 2021, market was expecting a concrete set of actions such as an OMO calendar from RBI, and RBI’s words alone failed to calm the market. The first auction of the fiscal year also saw a devolvement. However, RBI acted in the first policy of the year announcing a bond buyback program akin to QE (quantitative easing) and its subsequent cancellation of auctions wherein yields were perhaps quoted higher than RBI’s comfort levels brought back confidence into the market. Since then we have seen a strong rally with 10-year benchmark trending below 6% and the curve moving alongside. RBI reiteration of priority of growth and also supporting with higher than expected dividend payment stand out as a testimony of its support. While we do not expect RBI to act in terms of rate cuts, we believe that measures such as G-SAP, OMOs will continue until there is visibility of a structural growth. Therefore, the large borrowing program should go without any hiccups.
Furthermore, with the evidence of strong GST numbers until April 2021 (before the 2nd wave), it is expected that growth and therefore fiscal revenues will come back. Government’s conservative budget estimates are supportive. Also, given the fact that compared to last year there has not been a complete shutdown of activity (lockdowns being distributed), the impact on growth will not be similar to last year. Pent up demand will come back to support revenue collection. However, on the flipside, once growth resumes RBI will be forced to withdraw liquidity in a phased manner to prevent asset bubbles. Nevertheless, RBI need not act in terms of rate actions and we believe that a prolonged pause in terms of RBI rates is in the offing.
Net-net therefore while growth is wanting no matter what, it may come at a small price of rise in yields with liquidity withdrawal. That is however expected more in the 2nd half of the year. Lower than expected borrowing numbers, later this year or if not in next year could be a surprise. We may therefore see a range bound rate action in the near term with a rising bias over time. Global rate environment, oil and currency risks are to be watched out for.
2. Brief Background of SPonSorS, Board of truSteeS and aSSet management comPanY
a. Sponsor
HSBC Mutual Fund is sponsored by HSBC Securities and Capital Markets (India) Private Limited (HSCI). The Sponsor is the Settler of the Mutual Fund Trust. The Sponsor has entrusted a sum of Rs. 1,00,000/- (Rupees One Lakh only) to the Trustee as the initial contribution towards the corpus of the Mutual Fund.
HSCI offers integrated investment banking services, securities and corporate finance & advisory. HSCI is a member of the Bombay Stock Exchange Limited and National Stock Exchange (capital and derivative market segments). HSCI holds 100% of the paid up equity share capital of HSBC Asset Management (India) Private Limited.
b. hSBc mutual fund
HSBC Mutual Fund (“the Mutual Fund” or “the Fund”) has been constituted as a Trust in accordance with the provisions of the Indian Trusts Act, 1882 (2 of 1882) vide a Trust Deed dated February 7, 2002 with HSBC Securities and Capital Markets (India) Private Limited, as the Sponsor and the Board of Individual Trustees. The Trustee has entered into an Investment Management Agreement dated February 7, 2002 with HSBC Asset Management (India) Private Limited (AMC) to function as the Investment Manager for all the schemes of the Fund. The Fund was registered with SEBI vide registration number MF/046/02/5 dated May 27, 2002.
The Trust has been formed for the purpose of pooling of capital from the public for collective investment in securities for the purpose of providing facilities for participation by persons as beneficiaries in such investments and in the profits/income arising therefrom.
Trustees’ ReportFor the year ended March 31, 2021 (Contd...)

8
Abridged Annual Report 2020 - 2021
c. Board of trustees (the trustees)
The Board of Trustees is the exclusive owner of the Trust Fund and holds the same in trust for the benefit of the unit holders. The Trustees have been discharging their duties and carrying out the responsibilities as provided in the SEBI (Mutual Funds) Regulations, 1996 and the Trust Deed. The Trustees seek to ensure that the Fund and the schemes floated there under are managed by the AMC in accordance with the Trust Deed, the said Regulations, directions and guidelines issued by the SEBI, the Stock Exchanges, the Association of Mutual Funds in India and other regulatory agencies.
d. asset management company (the amc)
HSBC Asset Management (India) Private Limited (the Investment Manager or the AMC) is a private limited company incorporated under the Companies Act, 1956 on December 12, 2001 having its Registered Office at 16, V. N. Road, Fort, Mumbai 400 001. HSBC Asset Management (India) Private Limited has been appointed as the Asset Management Company of HSBC Mutual Fund by the Trustee vide Investment Management Agreement (IMA) dated February 7, 2002 and executed between the Trustees and the AMC. SEBI approved the AMC to act as the Investment Manager of the Fund vide its letter No. MFD/BC/163/2002 dated May 27, 2002. The paid-up equity share capital of the AMC is Rs. 61.59 crores. The AMC is registered as a Portfolio Manager under the SEBI (Portfolio Managers) Regulations, 1993 vide registration no. INP000001322. The AMC also offers non-binding Advisory services to offshore funds under the mutual fund license.
HSBC Securities and Capital Markets (India) Private Limited holds 100% of the paid up equity share capital of the AMC.
3. inveStment oBjective of the SchemeSThe investment objective of the respective schemes has been provided above under the heading “Scheme Performance, Future Outlook and Operation of the Scheme” (Refer Section 1).
4. Significant accounting PolicieS The Significant Accounting Policies form part of the Notes to the Accounts annexed to the Balance Sheet of the Schemes in the Full Annual Report. The accounting policies are in accordance with Securities Exchange Board of India (Mutual Funds) Regulations 1996.
5. unclaimed dividendS & redemPtionSSummary of number of investors & corresponding amount Scheme-wise as on March 31, 2021
Schemeunclaimed dividend unclaimed redemption
amount (rs.) no. of investors
amount (rs.) no. of investors
HSBC Regular Savings Fund 2,241,537.97 3652 1,177,153.84 34
6. inveStor ServiceS
The number of official points of acceptance of transactions is 204 locations. In addition to the offices of the Registrar & Transfer agents, the AMC has Investor Service Centers in 9 locations at its own offices - namely Mumbai, New Delhi, Kolkata, Bangalore, Pune, Ahmedabad, Hyderabad, Chandigarh and Chennai. With a view to enhance customer convenience, the AMC has the facility of priority based servicing to key distributors through the enhancement of the Interactive Voice Reponses. The AMC has 2 Toll Free numbers (1-800-200-2434 /1-800-258-2434) which can be dialed from anywhere in India and 1 number i.e +91 44 39923900 (Investors calling from abroad). The call center service is being managed by the Registrar and Transfer Agents. Transactions for purchase / redemption of units in the schemes HSBC Mutual Fund can also be made through the online transaction facility on the AMC’s website at https://invest.assetmanagement.hsbc.co.in.
On the distribution front, the number of empaneled distributors was 1069 as on March 31, 2021. During the year, the AMC initiated tie-ups for online distribution of the Mutual Fund’s schemes with several channel partners taking the total number of such tie-ups to 52.
Trustees’ ReportFor the year ended March 31, 2021 (Contd...)

9
HSBC Regular Savings Fund
Trustees’ ReportFor the year ended March 31, 2021 (Contd...)
7. detailS of inveStor grievance redreSSal
The details of the redressal of investor complaints received against HSBC Mutual Fund during April 2020 - March 2021 are as follows:
2020-2021com-plaint code
type of complaint# (a) no. of complaints pending at the begin-ning of the
year
(b) no. of com-
plaints received during
the year
action on (a) and (b)
resolved non action-
able
Pending
Within 30
days
30 - 60 days
60 - 180 days
Beyond 180 days
0 - 3 months
3 - 6 months
6 - 9 months
9 - 12 months
I A Non receipt of Dividend on Units
0 0 0 0 0 0 0 0 0 0 0
I B Interest on delayed payment of Dividend
0 0 0 0 0 0 0 0 0 0 0
I C Non receipt of Redemption Proceeds
0 8 7 0 0 0 0 1 0 0 0
I D Interest on delayed payment of Redemption
0 0 0 0 0 0 0 0 0 0 0
II A Non receipt of Statement of Account / Unit Certificate
0 0 0 0 0 0 0 0 0 0 0
II B Discrepancy in Statement of Account
0 1 1 0 0 0 0 0 0 0 0
II C Data corrections in Investor details **
0 12 12 0 0 0 0 0 0 0 0
II D Non receipt of Annual Report/Abridged Summary
0 0 0 0 0 0 0 0 0 0 0
III A Wrong switch between Schemes
0 0 0 0 0 0 0 0 0 0 0
III B Unauthorized switch between Schemes
0 0 0 0 0 0 0 0 0 0 0
III C Deviation from Scheme attributes
0 0 0 0 0 0 0 0 0 0 0
III D Wrong or excess charges/load
0 0 0 0 0 0 0 0 0 0 0
III E Non updation of changes viz. address, PAN, bank details, nomination, etc
0 6 6 0 0 0 0 0 0 0 0
IV Others 0 15 15 0 0 0 0 0 0 0 0
total 0 42 41 0 0 0 0 1 0 0 0
Summary of complaints for fY 2020-21
Particulars count
Total complaints received 42
Total number of folios 148770
% of complaints against the folio 0.028%
# active folios
** As per AMFI Best Practice Guidelines Circular No. 25/2011-12 for Revisions in the Guidelines on Standardization of Complaints / Grievances Reporting Procedure. If “Others” include a type of complaint which is more than 10% of overall complaints, then such a reason should be provided separately. Hence data corrections in Investor Details is included as a separate category
* Non actionable means the complaint is incomplete / outside the scope of the mutual fund
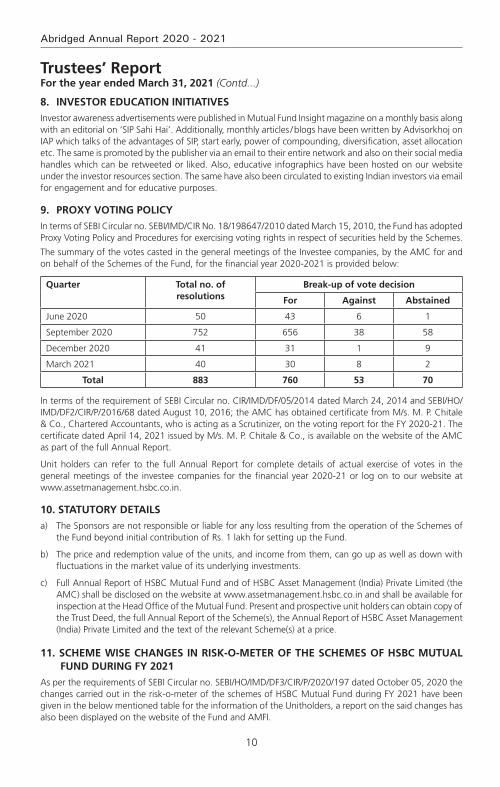
10
Abridged Annual Report 2020 - 2021
Trustees’ ReportFor the year ended March 31, 2021 (Contd...)
8. inveStor education initiativeS
Investor awareness advertisements were published in Mutual Fund Insight magazine on a monthly basis along with an editorial on ‘SIP Sahi Hai’. Additionally, monthly articles / blogs have been written by Advisorkhoj on IAP which talks of the advantages of SIP, start early, power of compounding, diversification, asset allocation etc. The same is promoted by the publisher via an email to their entire network and also on their social media handles which can be retweeted or liked. Also, educative infographics have been hosted on our website under the investor resources section. The same have also been circulated to existing Indian investors via email for engagement and for educative purposes.
9. ProxY voting PolicY
In terms of SEBI Circular no. SEBI/IMD/CIR No. 18/198647/2010 dated March 15, 2010, the Fund has adopted Proxy Voting Policy and Procedures for exercising voting rights in respect of securities held by the Schemes.
The summary of the votes casted in the general meetings of the Investee companies, by the AMC for and on behalf of the Schemes of the Fund, for the financial year 2020-2021 is provided below:
quarter total no. of resolutions
Break-up of vote decision
for against abstained
June 2020 50 43 6 1
September 2020 752 656 38 58
December 2020 41 31 1 9
March 2021 40 30 8 2
total 883 760 53 70
In terms of the requirement of SEBI Circular no. CIR/IMD/DF/05/2014 dated March 24, 2014 and SEBI/HO/IMD/DF2/CIR/P/2016/68 dated August 10, 2016; the AMC has obtained certificate from M/s. M. P. Chitale & Co., Chartered Accountants, who is acting as a Scrutinizer, on the voting report for the FY 2020-21. The certificate dated April 14, 2021 issued by M/s. M. P. Chitale & Co., is available on the website of the AMC as part of the full Annual Report.
Unit holders can refer to the full Annual Report for complete details of actual exercise of votes in the general meetings of the investee companies for the financial year 2020-21 or log on to our website at www.assetmanagement.hsbc.co.in.
10. StatutorY detailS
a) The Sponsors are not responsible or liable for any loss resulting from the operation of the Schemes of the Fund beyond initial contribution of Rs. 1 lakh for setting up the Fund.
b) The price and redemption value of the units, and income from them, can go up as well as down with fluctuations in the market value of its underlying investments.
c) Full Annual Report of HSBC Mutual Fund and of HSBC Asset Management (India) Private Limited (the AMC) shall be disclosed on the website at www.assetmanagement.hsbc.co.in and shall be available for inspection at the Head Office of the Mutual Fund. Present and prospective unit holders can obtain copy of the Trust Deed, the full Annual Report of the Scheme(s), the Annual Report of HSBC Asset Management (India) Private Limited and the text of the relevant Scheme(s) at a price.
11. Scheme WiSe changeS in riSk-o-meter of the SchemeS of hSBc mutual fund during fY 2021
As per the requirements of SEBI Circular no. SEBI/HO/IMD/DF3/CIR/P/2020/197 dated October 05, 2020 the changes carried out in the risk-o-meter of the schemes of HSBC Mutual Fund during FY 2021 have been given in the below mentioned table for the information of the Unitholders, a report on the said changes has also been displayed on the website of the Fund and AMFI.
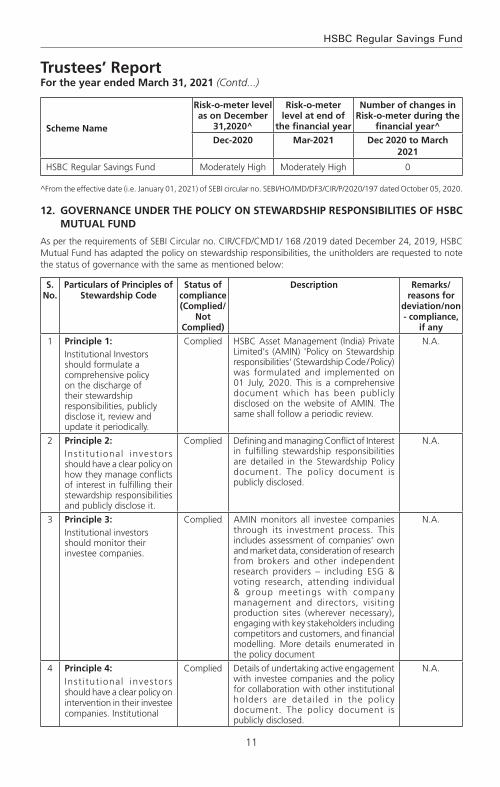
11
HSBC Regular Savings Fund
Trustees’ ReportFor the year ended March 31, 2021 (Contd...)
Scheme name
risk-o-meter level as on december
31,2020^
risk-o-meter level at end of
the financial year
number of changes in risk-o-meter during the
financial year^
dec-2020 mar-2021 dec 2020 to march 2021
HSBC Regular Savings Fund Moderately High Moderately High 0
^From the effective date (i.e. January 01, 2021) of SEBI circular no. SEBI/HO/IMD/DF3/CIR/P/2020/197 dated October 05, 2020.
12. governance under the PolicY on SteWardShiP reSPonSiBilitieS of hSBc mutual fund
As per the requirements of SEBI Circular no. CIR/CFD/CMD1/ 168 /2019 dated December 24, 2019, HSBC Mutual Fund has adapted the policy on stewardship responsibilities, the unitholders are requested to note the status of governance with the same as mentioned below:
S. no.
Particulars of Principles of Stewardship code
Status of compliance (complied/
not complied)
description remarks/reasons for
deviation/non - compliance,
if any
1 Principle 1:Institutional Investors should formulate a comprehensive policy on the discharge of their stewardship responsibilities, publicly disclose it, review and update it periodically.
Complied HSBC Asset Management (India) Private Limited's (AMIN) 'Policy on Stewardship responsibilities' (Stewardship Code / Policy) was formulated and implemented on 01 July, 2020. This is a comprehensive document which has been publicly disclosed on the website of AMIN. The same shall follow a periodic review.
N.A.
2 Principle 2:Inst i tut ional investors should have a clear policy on how they manage conflicts of interest in fulfilling their stewardship responsibilities and publicly disclose it.
Complied Defining and managing Conflict of Interest in fulfilling stewardship responsibilities are detailed in the Stewardship Policy document. The policy document is publicly disclosed.
N.A.
3 Principle 3:Institutional investors should monitor their investee companies.
Complied AMIN monitors all investee companies through its investment process. This includes assessment of companies’ own and market data, consideration of research from brokers and other independent research providers – including ESG & voting research, attending individual & group meetings with company management and directors, visiting production sites (wherever necessary), engaging with key stakeholders including competitors and customers, and financial modelling. More details enumerated in the policy document
N.A.
4 Principle 4:Inst i tut ional investors should have a clear policy on intervention in their investee companies. Institutional
Complied Details of undertaking active engagement with investee companies and the policy for collaboration with other institutional holders are detailed in the policy document. The policy document is publicly disclosed.
N.A.
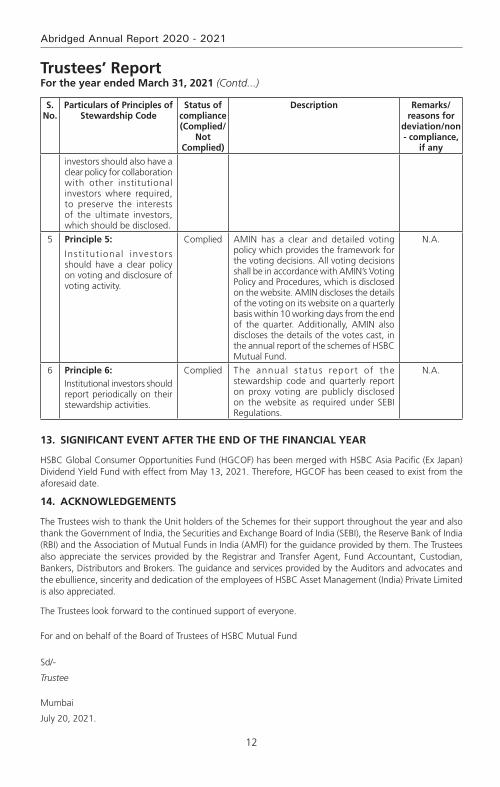
12
Abridged Annual Report 2020 - 2021
S. no.
Particulars of Principles of Stewardship code
Status of compliance (complied/
not complied)
description remarks/reasons for
deviation/non - compliance,
if any
investors should also have a clear policy for collaboration with other institutional investors where required, to preserve the interests of the ultimate investors, which should be disclosed.
5 Principle 5:
Inst i tut ional investors should have a clear policy on voting and disclosure of voting activity.
Complied AMIN has a clear and detailed voting policy which provides the framework for the voting decisions. All voting decisions shall be in accordance with AMIN’s Voting Policy and Procedures, which is disclosed on the website. AMIN discloses the details of the voting on its website on a quarterly basis within 10 working days from the end of the quarter. Additionally, AMIN also discloses the details of the votes cast, in the annual report of the schemes of HSBC Mutual Fund.
N.A.
6 Principle 6:Institutional investors should report periodically on their stewardship activities.
Complied The annual status report of the stewardship code and quarterly report on proxy voting are publicly disclosed on the website as required under SEBI Regulations.
N.A.
13. Significant event after the end of the financial Year
HSBC Global Consumer Opportunities Fund (HGCOF) has been merged with HSBC Asia Pacific (Ex Japan) Dividend Yield Fund with effect from May 13, 2021. Therefore, HGCOF has been ceased to exist from the aforesaid date.
14. acknoWledgementS
The Trustees wish to thank the Unit holders of the Schemes for their support throughout the year and also thank the Government of India, the Securities and Exchange Board of India (SEBI), the Reserve Bank of India (RBI) and the Association of Mutual Funds in India (AMFI) for the guidance provided by them. The Trustees also appreciate the services provided by the Registrar and Transfer Agent, Fund Accountant, Custodian, Bankers, Distributors and Brokers. The guidance and services provided by the Auditors and advocates and the ebullience, sincerity and dedication of the employees of HSBC Asset Management (India) Private Limited is also appreciated.
The Trustees look forward to the continued support of everyone.
For and on behalf of the Board of Trustees of HSBC Mutual Fund
Sd/-
Trustee
Mumbai
July 20, 2021.
Trustees’ ReportFor the year ended March 31, 2021 (Contd...)

13
HSBC Regular Savings Fund
To the Trustees of HSBC Mutual Fund
hSBc regular Savings fund
Report on the Audit of the Financial Statements
OpinionWe have audited the financial statements of HSBC Regular Savings Fund (the ‘Scheme’) of HSBC Mutual Fund, which comprise the balance sheet as at 31 March 2021 and the revenue account for the year then ended, and notes to the financial statements, including a summary of the significant accounting policies.
In our opinion and to the best of our information and according to the explanations given to us, the aforesaid financial statements give a true and fair view in conformity with the accounting principles generally accepted in India, of the state of affairs of the Scheme as at 31 March 2021, its net surplus for the year ended on that date.
Basis for opinionWe conducted our audit in accordance with the Standards on Auditing (‘SAs’) issued by the Institute of Chartered Accountants of India (the ‘ICAI’). Our responsibilities under those SAs are further described in the Auditor’s Responsibilities for the Audit of the Financial Statements section of our report. We are independent of the Scheme in accordance with the Code of Ethics issued by the ICAI, and we have fulfilled our other ethical responsibilities in accordance with the Code of Ethics. We believe that the audit evidence we have obtained is sufficient and appropriate to provide a basis for our opinion.
responsibilities of management and those charged with governance for the financial StatementsThe Scheme’s management, the Board of Directors of HSSBC Mutual Fund (the ‘Trustee’) and the Board of Directors of HSBC Asset Management (India) Private Limited (the ‘AMC’) (collectively referred to as ‘Management’) are responsible for the preparation of these financial statements that give a true and fair view of the state of affairs, results of operations of the Scheme in accordance with the accounting policies and standards specified in the Ninth Schedule of the Securities and Exchange Board of India (Mutual Funds) Regulations, 1996, as amended (the ‘Regulations’) and the accounting principles generally accepted in India. This responsibility includes design, implementation and maintenance of internal control relevant to the preparation and presentation of the financial statements that give a true and fair view and are free from material misstatement, whether due to fraud or error.
In preparing the financial statements, management is responsible for assessing the Scheme’s ability to continue as a going concern, disclosing, as applicable, matters related to going concern and using the going concern basis of accounting unless management either intends to liquidate the Scheme or to cease operations, or has no realistic alternative but to do so.
The management is responsible for overseeing the Scheme’s financial reporting process.
auditor’s responsibilities for the audit of the financial StatementsOur objectives are to obtain reasonable assurance about whether the financial statements as a whole are free from material misstatement, whether due to fraud or error, and to issue an auditor’s report that includes our opinion. Reasonable assurance is a high level of assurance, but is not a guarantee that an audit conducted in accordance with SAs will always detect a material misstatement when it exists. Misstatements can arise from fraud or error and are considered material if, individually or in the aggregate, they could reasonably be expected to influence the economic decisions of users taken on the basis of these financial statements.
As part of an audit in accordance with SAs, we exercise professional judgment and maintain professional skepticism throughout the audit. We also:
• Identifyandassesstherisksofmaterialmisstatementofthefinancialstatements,whetherduetofraudor error, design and perform audit procedures responsive to those risks, and obtain audit evidence that is sufficient and appropriate to provide a basis for our opinion. The risk of not detecting a material misstatement resulting from fraud is higher than for one resulting from error, as fraud may involve collusion, forgery, intentional omissions, misrepresentations, or the override of internal control;
Independent Auditors’ Report
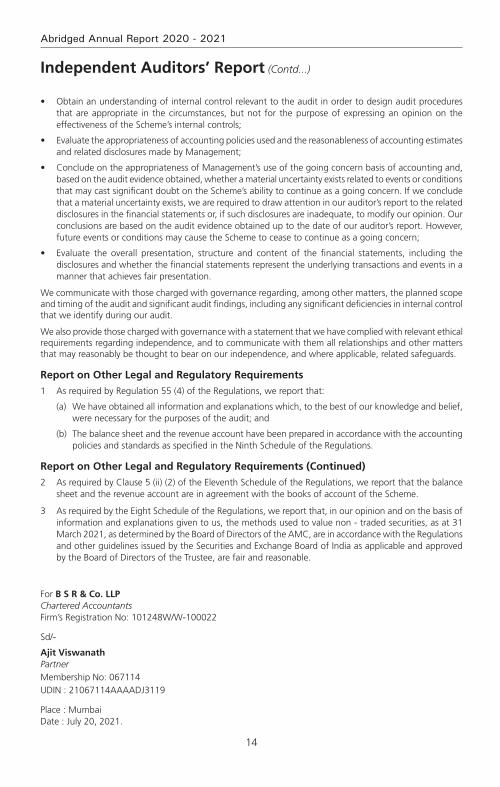
14
Abridged Annual Report 2020 - 2021
Independent Auditors’ Report (Contd...)
• Obtainanunderstandingofinternalcontrolrelevanttotheauditinordertodesignauditproceduresthat are appropriate in the circumstances, but not for the purpose of expressing an opinion on the effectiveness of the Scheme’s internal controls;
• Evaluatetheappropriatenessofaccountingpoliciesusedandthereasonablenessofaccountingestimatesand related disclosures made by Management;
• ConcludeontheappropriatenessofManagement’suseofthegoingconcernbasisofaccountingand,based on the audit evidence obtained, whether a material uncertainty exists related to events or conditions that may cast significant doubt on the Scheme’s ability to continue as a going concern. If we conclude that a material uncertainty exists, we are required to draw attention in our auditor’s report to the related disclosures in the financial statements or, if such disclosures are inadequate, to modify our opinion. Our conclusions are based on the audit evidence obtained up to the date of our auditor’s report. However, future events or conditions may cause the Scheme to cease to continue as a going concern;
• Evaluate the overall presentation, structure and content of the financial statements, including thedisclosures and whether the financial statements represent the underlying transactions and events in a manner that achieves fair presentation.
We communicate with those charged with governance regarding, among other matters, the planned scope and timing of the audit and significant audit findings, including any significant deficiencies in internal control that we identify during our audit.
We also provide those charged with governance with a statement that we have complied with relevant ethical requirements regarding independence, and to communicate with them all relationships and other matters that may reasonably be thought to bear on our independence, and where applicable, related safeguards.
report on other legal and regulatory requirements
1 As required by Regulation 55 (4) of the Regulations, we report that:
(a) We have obtained all information and explanations which, to the best of our knowledge and belief, were necessary for the purposes of the audit; and
(b) The balance sheet and the revenue account have been prepared in accordance with the accounting policies and standards as specified in the Ninth Schedule of the Regulations.
report on other legal and regulatory requirements (continued)
2 As required by Clause 5 (ii) (2) of the Eleventh Schedule of the Regulations, we report that the balance sheet and the revenue account are in agreement with the books of account of the Scheme.
3 As required by the Eight Schedule of the Regulations, we report that, in our opinion and on the basis of information and explanations given to us, the methods used to value non - traded securities, as at 31 March 2021, as determined by the Board of Directors of the AMC, are in accordance with the Regulations and other guidelines issued by the Securities and Exchange Board of India as applicable and approved by the Board of Directors of the Trustee, are fair and reasonable.
For B S R & Co. LLP Chartered Accountants Firm’s Registration No: 101248W/W-100022
Sd/-
Ajit Viswanath PartnerMembership No: 067114UDIN : 21067114AAAADJ3119
Place : Mumbai Date : July 20, 2021.
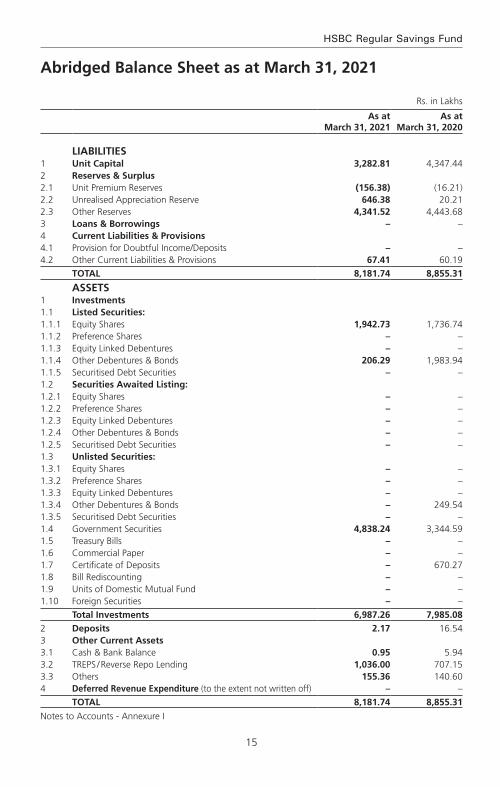
15
HSBC Regular Savings Fund
Rs. in Lakhs
As at March 31, 2021
As at March 31, 2020
LIABILITIES1 Unit Capital 3,282.81 4,347.442 Reserves & Surplus2.1 Unit Premium Reserves (156.38) (16.21)2.2 Unrealised Appreciation Reserve 646.38 20.212.3 Other Reserves 4,341.52 4,443.683 Loans & Borrowings – –4 Current Liabilities & Provisions4.1 Provision for Doubtful Income/Deposits – –4.2 Other Current Liabilities & Provisions 67.41 60.19
TOTAL 8,181.74 8,855.31
ASSETS1 Investments1.1 Listed Securities:1.1.1 Equity Shares 1,942.73 1,736.741.1.2 Preference Shares – –1.1.3 Equity Linked Debentures – –1.1.4 Other Debentures & Bonds 206.29 1,983.941.1.5 Securitised Debt Securities – –1.2 Securities Awaited Listing:1.2.1 Equity Shares – –1.2.2 Preference Shares – –1.2.3 Equity Linked Debentures – –1.2.4 Other Debentures & Bonds – –1.2.5 Securitised Debt Securities – –1.3 Unlisted Securities:1.3.1 Equity Shares – –1.3.2 Preference Shares – –1.3.3 Equity Linked Debentures – –1.3.4 Other Debentures & Bonds – 249.541.3.5 Securitised Debt Securities – –1.4 Government Securities 4,838.24 3,344.591.5 Treasury Bills – –1.6 Commercial Paper – –1.7 Certificate of Deposits – 670.271.8 Bill Rediscounting – –1.9 Units of Domestic Mutual Fund – –1.10 Foreign Securities – –
Total Investments 6,987.26 7,985.082 Deposits 2.17 16.543 Other Current Assets3.1 Cash & Bank Balance 0.95 5.943.2 TREPS / Reverse Repo Lending 1,036.00 707.153.3 Others 155.36 140.604 Deferred Revenue Expenditure (to the extent not written off) – –
TOTAL 8,181.74 8,855.31
Notes to Accounts - Annexure I
Abridged Balance Sheet as at March 31, 2021
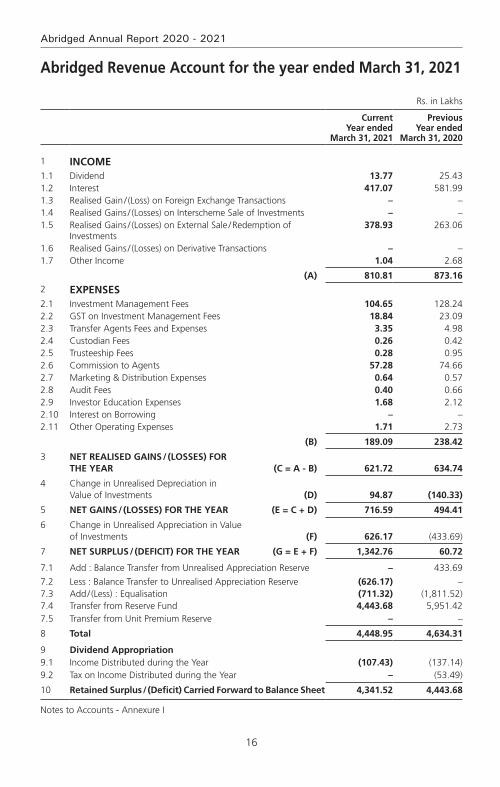
16
Abridged Annual Report 2020 - 2021
Abridged Revenue Account for the year ended March 31, 2021
Rs. in Lakhs
Current Year ended
March 31, 2021
Previous Year ended
March 31, 2020
1 INCOME1.1 Dividend 13.77 25.431.2 Interest 417.07 581.991.3 Realised Gain / (Loss) on Foreign Exchange Transactions – –1.4 Realised Gains / (Losses) on Interscheme Sale of Investments – –1.5 Realised Gains / (Losses) on External Sale / Redemption of
Investments378.93 263.06
1.6 Realised Gains / (Losses) on Derivative Transactions – –1.7 Other Income 1.04 2.68
(A) 810.81 873.162 EXPENSES2.1 Investment Management Fees 104.65 128.242.2 GST on Investment Management Fees 18.84 23.092.3 Transfer Agents Fees and Expenses 3.35 4.982.4 Custodian Fees 0.26 0.422.5 Trusteeship Fees 0.28 0.952.6 Commission to Agents 57.28 74.662.7 Marketing & Distribution Expenses 0.64 0.572.8 Audit Fees 0.40 0.662.9 Investor Education Expenses 1.68 2.122.10 Interest on Borrowing – –2.11 Other Operating Expenses 1.71 2.73
(B) 189.09 238.42
3 NET REALISED GAINS / (LOSSES) FOR THE YEAR (C = A - B) 621.72 634.74
4 Change in Unrealised Depreciation in Value of Investments (D) 94.87 (140.33)
5 NET GAINS / (LOSSES) FOR THE YEAR (E = C + D) 716.59 494.41
6 Change in Unrealised Appreciation in Value of Investments (F) 626.17 (433.69)
7 NET SURPLUS / (DEFICIT) FOR THE YEAR (G = E + F) 1,342.76 60.72
7.1 Add : Balance Transfer from Unrealised Appreciation Reserve – 433.69
7.2 Less : Balance Transfer to Unrealised Appreciation Reserve (626.17) –7.3 Add / (Less) : Equalisation (711.32) (1,811.52)7.4 Transfer from Reserve Fund 4,443.68 5,951.427.5 Transfer from Unit Premium Reserve – –
8 Total 4,448.95 4,634.31
9 Dividend Appropriation9.1 Income Distributed during the Year (107.43) (137.14)9.2 Tax on Income Distributed during the Year – (53.49)
10 Retained Surplus / (Deficit) Carried Forward to Balance Sheet 4,341.52 4,443.68
Notes to Accounts - Annexure I

17
HSBC Regular Savings Fund
Key Statistics for the year ended March 31, 2021
Current Year ended
March 31, 2021
Previous Year ended
March 31, 2020
1. NAV per unit (Rs.):
Open
Growth Option 36.5567 36.6132
Monthly IDCW Option 11.3521 12.2142
Quarterly IDCW Option 13.2757 13.2962
Direct Plan - Growth Option 38.3999 37.8409
Direct Plan - Monthly IDCW Option 14.4354 15.4112
Direct Plan - Quarterly IDCW Option 12.4332 13.2385
High
Growth Option 43.3602 39.3736
Monthly IDCW Option 12.8158 12.3795
Quarterly IDCW Option 15.7464 14.2986
Direct Plan - Growth Option 46.2506 41.2572
Direct Plan - Monthly IDCW Option 16.4204 15.7015
Direct Plan - Quarterly IDCW Option 14.2453 13.5892
Low
Growth Option 36.1089 35.2165
Monthly IDCW Option 11.2131 10.9938
Quarterly IDCW Option 13.1131 12.7890
Direct Plan - Growth Option 37.9357 36.9761
Direct Plan - Monthly IDCW Option 14.2600 13.9797
Direct Plan - Quarterly IDCW Option 12.2821 12.1693
End
Growth Option 42.8122 36.5567
Monthly IDCW Option 12.5333 11.3521
Quarterly IDCW Option 15.5474 13.2757
Direct Plan - Growth Option 45.7562 38.3999
Direct Plan - Monthly IDCW Option 16.0742 14.4354
Direct Plan - Quarterly IDCW Option 13.8736 12.4332
2. Closing Assets Under Management (Rs. in Lakhs)
End 8,125 8,797
Average (AAuM)1 8,424 10,604
3. Gross income as % of AAuM2 9.63% 8.23%
4. Expense Ratio:a. Total Expense as % of AAuM (including GST on
Management fees) (planwise)
Growth Option 2.27% 2.27%
Direct Plan - Growth Option 0.63% 0.72%
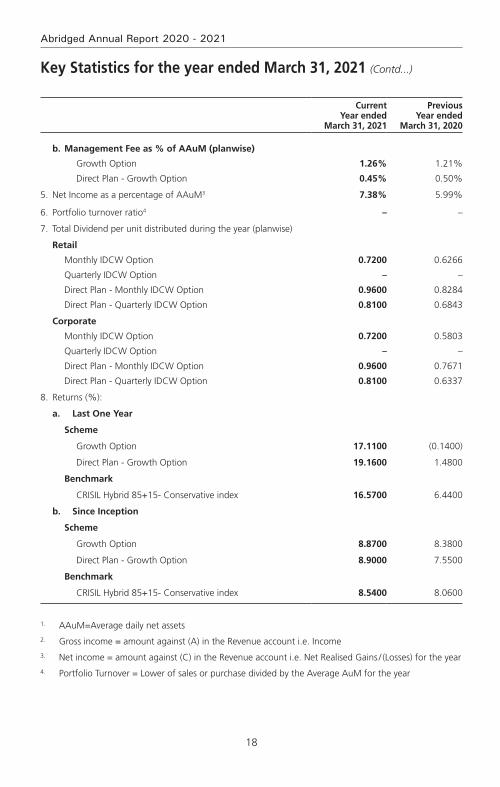
18
Abridged Annual Report 2020 - 2021
Current Year ended
March 31, 2021
Previous Year ended
March 31, 2020
b. Management Fee as % of AAuM (planwise)
Growth Option 1.26% 1.21%
Direct Plan - Growth Option 0.45% 0.50%
5. Net Income as a percentage of AAuM3 7.38% 5.99%
6. Portfolio turnover ratio4 – –
7. Total Dividend per unit distributed during the year (planwise)
Retail
Monthly IDCW Option 0.7200 0.6266
Quarterly IDCW Option – –
Direct Plan - Monthly IDCW Option 0.9600 0.8284
Direct Plan - Quarterly IDCW Option 0.8100 0.6843
Corporate
Monthly IDCW Option 0.7200 0.5803
Quarterly IDCW Option – –
Direct Plan - Monthly IDCW Option 0.9600 0.7671
Direct Plan - Quarterly IDCW Option 0.8100 0.6337
8. Returns (%):
a. Last One Year
Scheme
Growth Option 17.1100 (0.1400)
Direct Plan - Growth Option 19.1600 1.4800
Benchmark
CRISIL Hybrid 85+15- Conservative index 16.5700 6.4400
b. Since Inception
Scheme
Growth Option 8.8700 8.3800
Direct Plan - Growth Option 8.9000 7.5500
Benchmark
CRISIL Hybrid 85+15- Conservative index 8.5400 8.0600
1. AAuM=Average daily net assets2. Gross income = amount against (A) in the Revenue account i.e. Income3. Net income = amount against (C) in the Revenue account i.e. Net Realised Gains / (Losses) for the year4. Portfolio Turnover = Lower of sales or purchase divided by the Average AuM for the year
Key Statistics for the year ended March 31, 2021 (Contd...)
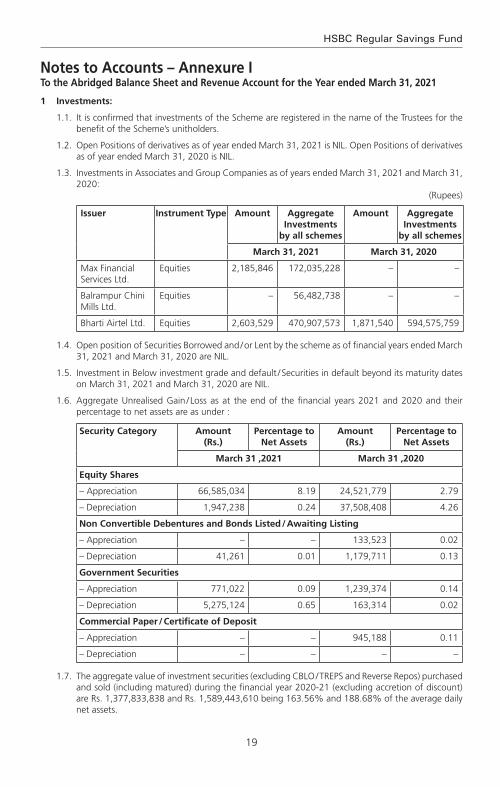
19
HSBC Regular Savings Fund
Notes to Accounts – Annexure ITo the Abridged Balance Sheet and Revenue Account for the Year ended March 31, 2021
1 Investments:
1.1. It is confirmed that investments of the Scheme are registered in the name of the Trustees for the benefit of the Scheme’s unitholders.
1.2. Open Positions of derivatives as of year ended March 31, 2021 is NIL. Open Positions of derivatives as of year ended March 31, 2020 is NIL.
1.3. Investments in Associates and Group Companies as of years ended March 31, 2021 and March 31, 2020:
(Rupees)
Issuer Instrument Type Amount Aggregate Investments
by all schemes
Amount Aggregate Investments
by all schemes
March 31, 2021 March 31, 2020
Max Financial Services Ltd.
Equities 2,185,846 172,035,228 – –
Balrampur Chini Mills Ltd.
Equities – 56,482,738 – –
Bharti Airtel Ltd. Equities 2,603,529 470,907,573 1,871,540 594,575,759
1.4. Open position of Securities Borrowed and / or Lent by the scheme as of financial years ended March 31, 2021 and March 31, 2020 are NIL.
1.5. Investment in Below investment grade and default / Securities in default beyond its maturity dates on March 31, 2021 and March 31, 2020 are NIL.
1.6. Aggregate Unrealised Gain / Loss as at the end of the financial years 2021 and 2020 and their percentage to net assets are as under :
Security Category Amount (Rs.)
Percentage to Net Assets
Amount (Rs.)
Percentage to Net Assets
March 31 ,2021 March 31 ,2020
Equity Shares
– Appreciation 66,585,034 8.19 24,521,779 2.79
– Depreciation 1,947,238 0.24 37,508,408 4.26
Non Convertible Debentures and Bonds Listed / Awaiting Listing
– Appreciation – – 133,523 0.02
– Depreciation 41,261 0.01 1,179,711 0.13
Government Securities
– Appreciation 771,022 0.09 1,239,374 0.14
– Depreciation 5,275,124 0.65 163,314 0.02
Commercial Paper / Certificate of Deposit
– Appreciation – – 945,188 0.11
– Depreciation – – – –
1.7. The aggregate value of investment securities (excluding CBLO / TREPS and Reverse Repos) purchased and sold (including matured) during the financial year 2020-21 (excluding accretion of discount) are Rs. 1,377,833,838 and Rs. 1,589,443,610 being 163.56% and 188.68% of the average daily net assets.
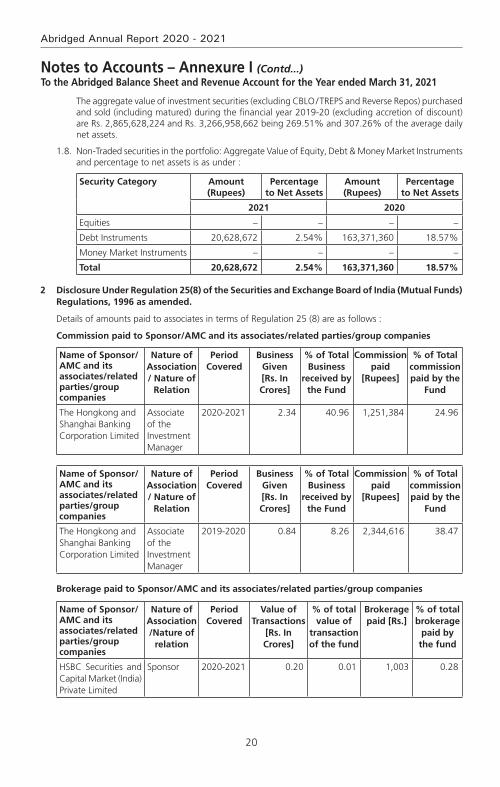
20
Abridged Annual Report 2020 - 2021
The aggregate value of investment securities (excluding CBLO / TREPS and Reverse Repos) purchased and sold (including matured) during the financial year 2019-20 (excluding accretion of discount) are Rs. 2,865,628,224 and Rs. 3,266,958,662 being 269.51% and 307.26% of the average daily net assets.
1.8. Non-Traded securities in the portfolio: Aggregate Value of Equity, Debt & Money Market Instruments and percentage to net assets is as under :
Security Category Amount (Rupees)
Percentage to Net Assets
Amount (Rupees)
Percentage to Net Assets
2021 2020
Equities – – – –
Debt Instruments 20,628,672 2.54% 163,371,360 18.57%
Money Market Instruments – – – –
Total 20,628,672 2.54% 163,371,360 18.57%
2 Disclosure Under Regulation 25(8) of the Securities and Exchange Board of India (Mutual Funds) Regulations, 1996 as amended.
Details of amounts paid to associates in terms of Regulation 25 (8) are as follows :
Commission paid to Sponsor/AMC and its associates/related parties/group companies
Name of Sponsor/AMC and its associates/related parties/group companies
Nature of Association / Nature of
Relation
Period Covered
Business Given [Rs. In Crores]
% of Total Business
received by the Fund
Commission paid
[Rupees]
% of Total commission paid by the
Fund
The Hongkong and Shanghai Banking Corporation Limited
Associate of the Investment Manager
2020-2021 2.34 40.96 1,251,384 24.96
Name of Sponsor/AMC and its associates/related parties/group companies
Nature of Association / Nature of
Relation
Period Covered
Business Given [Rs. In Crores]
% of Total Business
received by the Fund
Commission paid
[Rupees]
% of Total commission paid by the
Fund
The Hongkong and Shanghai Banking Corporation Limited
Associate of the Investment Manager
2019-2020 0.84 8.26 2,344,616 38.47
Brokerage paid to Sponsor/AMC and its associates/related parties/group companies
Name of Sponsor/AMC and its associates/related parties/group companies
Nature of Association /Nature of
relation
Period Covered
Value of Transactions
[Rs. In Crores]
% of total value of
transaction of the fund
Brokerage paid [Rs.]
% of total brokerage
paid by the fund
HSBC Securities and Capital Market (India) Private Limited
Sponsor 2020-2021 0.20 0.01 1,003 0.28
Notes to Accounts – Annexure I (Contd...)To the Abridged Balance Sheet and Revenue Account for the Year ended March 31, 2021
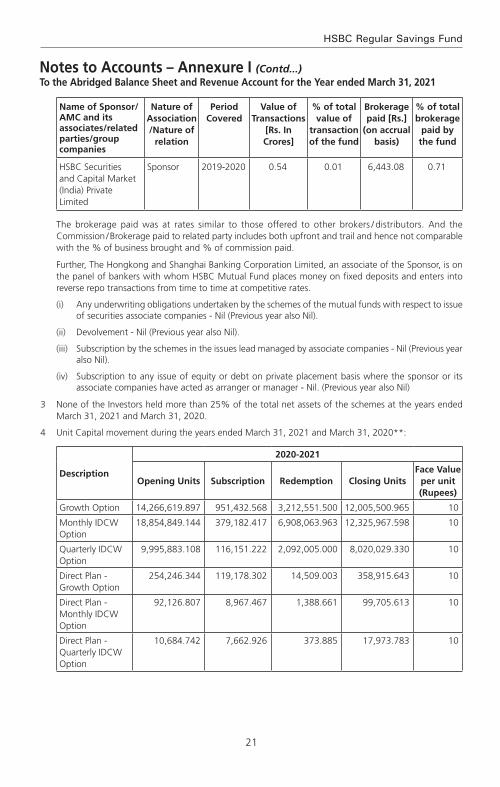
21
HSBC Regular Savings Fund
Name of Sponsor/AMC and its associates/related parties/group companies
Nature of Association /Nature of
relation
Period Covered
Value of Transactions
[Rs. In Crores]
% of total value of
transaction of the fund
Brokerage paid [Rs.]
(on accrual basis)
% of total brokerage
paid by the fund
HSBC Securities and Capital Market (India) Private Limited
Sponsor 2019-2020 0.54 0.01 6,443.08 0.71
The brokerage paid was at rates similar to those offered to other brokers / distributors. And the Commission / Brokerage paid to related party includes both upfront and trail and hence not comparable with the % of business brought and % of commission paid.
Further, The Hongkong and Shanghai Banking Corporation Limited, an associate of the Sponsor, is on the panel of bankers with whom HSBC Mutual Fund places money on fixed deposits and enters into reverse repo transactions from time to time at competitive rates.
(i) Any underwriting obligations undertaken by the schemes of the mutual funds with respect to issue of securities associate companies - Nil (Previous year also Nil).
(ii) Devolvement - Nil (Previous year also Nil).
(iii) Subscription by the schemes in the issues lead managed by associate companies - Nil (Previous year also Nil).
(iv) Subscription to any issue of equity or debt on private placement basis where the sponsor or its associate companies have acted as arranger or manager - Nil. (Previous year also Nil)
3 None of the Investors held more than 25% of the total net assets of the schemes at the years ended March 31, 2021 and March 31, 2020.
4 Unit Capital movement during the years ended March 31, 2021 and March 31, 2020**:
Description
2020-2021
Opening Units Subscription Redemption Closing UnitsFace Value
per unit (Rupees)
Growth Option 14,266,619.897 951,432.568 3,212,551.500 12,005,500.965 10
Monthly IDCW Option
18,854,849.144 379,182.417 6,908,063.963 12,325,967.598 10
Quarterly IDCW Option
9,995,883.108 116,151.222 2,092,005.000 8,020,029.330 10
Direct Plan - Growth Option
254,246.344 119,178.302 14,509.003 358,915.643 10
Direct Plan - Monthly IDCW Option
92,126.807 8,967.467 1,388.661 99,705.613 10
Direct Plan - Quarterly IDCW Option
10,684.742 7,662.926 373.885 17,973.783 10
Notes to Accounts – Annexure I (Contd...)To the Abridged Balance Sheet and Revenue Account for the Year ended March 31, 2021

22
Abridged Annual Report 2020 - 2021
Notes to Accounts – Annexure I (Contd...)To the Abridged Balance Sheet and Revenue Account for the Year ended March 31, 2021
Description
2019-20
Opening Units Subscription Redemption Closing UnitsFace Value
per unit (Rupees)
Growth Option 20,681,264.640 465,456.242 6,880,100.985 14,266,619.897 10
Monthly IDCW Option
26,522,140.591 3,029,185.328 10,696,476.775 18,854,849.144 10
Quarterly IDCW Option
13,747,408.247 9,904.903 3,761,430.042 9,995,883.108 10
Direct Plan - Growth Option
293,432.761 54,235.683 93,422.100 254,246.344 10
Direct Plan - Monthly IDCW Option
128,214.279 12,692.688 48,780.160 92,126.807 10
Direct Plan - Quarterly IDCW Option
11,367.778 373.885 1,056.921 10,684.742 10
** Units held by the AMC (Seed Capital) in Direct Plan Growth Option as on March 31, 2021 is 170,321.192 & as on March 31, 2020 is 170,321.192
5 No contingent liabilities for the years ended March 31, 2021 and March 31, 2020.
6 Expenses other than Management Fees are Inclusive of GST where applicable.
7 Other income: Rs. 103,737/- represents Exit load credited to the scheme & Penal Interest received from Bank towards delay of RTGS / NEFT. (2020: Rs. 267,891/- represents Exit load (net of GST ) credited to the scheme)
8 Investor Education Awareness
In view of the AMFI Best Practices Guidelines Circular No. 56/2015-16, the IEF ( Investor Education Fund) accrual is set aside in a separate bank account and the consolidated balance across all schemes as on March 31, 2021. The break-up of which is as under:
Particulars March 31, 2021 March 31, 2020
Amount (in Rs. Lacs) Amount (in Rs. Lacs)
Opening Balance as on April 01, 2020 307.40 214.68
Add: Accrual during FY 2020-21 195.77 237.54
Less: Transferred to AMFI * 89.04 109.69
Less: Payable to AMFI (March 2021 accrual) * 8.84 9.08
Add: Investment Income FY 2020-21 11.94 15.93
Less: Spent during FY 2020-21 43.73 41.98
Closing Balance as on March 31, 2021 373.49 307.40
*In accordance with SEBI circular number SEBI/HO/IMD/DF2/RS/813/2016 dated January 8, 2016.
9 Garnishee Notice from Income Tax Authorities
During the financial year 2011-12, an Income tax demand of Rs. 32.58 crores was purported to be recovered under garnishee proceedings, by Income Tax Authorities in respect of investments made in Pass through Certificates (PTC) by some of the debt schemes (including matured schemes) of HSBC Mutual Fund (HSBC MF), for A.Y. 2009-2010. The said demand, impacting various mutual fund players in the
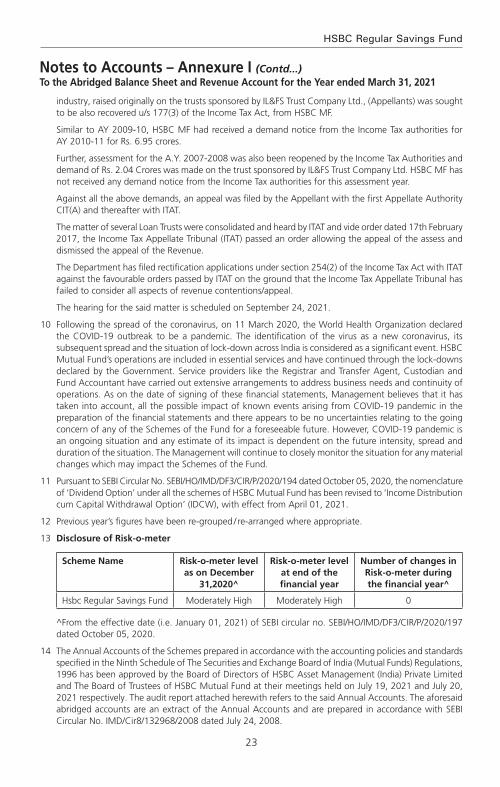
23
HSBC Regular Savings Fund
industry, raised originally on the trusts sponsored by IL&FS Trust Company Ltd., (Appellants) was sought to be also recovered u/s 177(3) of the Income Tax Act, from HSBC MF.
Similar to AY 2009-10, HSBC MF had received a demand notice from the Income Tax authorities for AY 2010-11 for Rs. 6.95 crores.
Further, assessment for the A.Y. 2007-2008 was also been reopened by the Income Tax Authorities and demand of Rs. 2.04 Crores was made on the trust sponsored by IL&FS Trust Company Ltd. HSBC MF has not received any demand notice from the Income Tax authorities for this assessment year.
Against all the above demands, an appeal was filed by the Appellant with the first Appellate Authority CIT(A) and thereafter with ITAT.
The matter of several Loan Trusts were consolidated and heard by ITAT and vide order dated 17th February 2017, the Income Tax Appellate Tribunal (ITAT) passed an order allowing the appeal of the assess and dismissed the appeal of the Revenue.
The Department has filed rectification applications under section 254(2) of the Income Tax Act with ITAT against the favourable orders passed by ITAT on the ground that the Income Tax Appellate Tribunal has failed to consider all aspects of revenue contentions/appeal.
The hearing for the said matter is scheduled on September 24, 2021.
10 Following the spread of the coronavirus, on 11 March 2020, the World Health Organization declared the COVID-19 outbreak to be a pandemic. The identification of the virus as a new coronavirus, its subsequent spread and the situation of lock-down across India is considered as a significant event. HSBC Mutual Fund’s operations are included in essential services and have continued through the lock-downs declared by the Government. Service providers like the Registrar and Transfer Agent, Custodian and Fund Accountant have carried out extensive arrangements to address business needs and continuity of operations. As on the date of signing of these financial statements, Management believes that it has taken into account, all the possible impact of known events arising from COVID-19 pandemic in the preparation of the financial statements and there appears to be no uncertainties relating to the going concern of any of the Schemes of the Fund for a foreseeable future. However, COVID-19 pandemic is an ongoing situation and any estimate of its impact is dependent on the future intensity, spread and duration of the situation. The Management will continue to closely monitor the situation for any material changes which may impact the Schemes of the Fund.
11 Pursuant to SEBI Circular No. SEBI/HO/IMD/DF3/CIR/P/2020/194 dated October 05, 2020, the nomenclature of ‘Dividend Option’ under all the schemes of HSBC Mutual Fund has been revised to ‘Income Distribution cum Capital Withdrawal Option’ (IDCW), with effect from April 01, 2021.
12 Previous year’s figures have been re-grouped / re-arranged where appropriate.
13 Disclosure of Risk-o-meter
Scheme Name Risk-o-meter level as on December
31,2020^
Risk-o-meter level at end of the financial year
Number of changes in Risk-o-meter during the financial year^
Hsbc Regular Savings Fund Moderately High Moderately High 0
^From the effective date (i.e. January 01, 2021) of SEBI circular no. SEBI/HO/IMD/DF3/CIR/P/2020/197 dated October 05, 2020.
14 The Annual Accounts of the Schemes prepared in accordance with the accounting policies and standards specified in the Ninth Schedule of The Securities and Exchange Board of India (Mutual Funds) Regulations, 1996 has been approved by the Board of Directors of HSBC Asset Management (India) Private Limited and The Board of Trustees of HSBC Mutual Fund at their meetings held on July 19, 2021 and July 20, 2021 respectively. The audit report attached herewith refers to the said Annual Accounts. The aforesaid abridged accounts are an extract of the Annual Accounts and are prepared in accordance with SEBI Circular No. IMD/Cir8/132968/2008 dated July 24, 2008.
Notes to Accounts – Annexure I (Contd...)To the Abridged Balance Sheet and Revenue Account for the Year ended March 31, 2021

24
Abridged Annual Report 2020 - 2021
Voting Policy and Procedures
In view of SEBI guidelines related to “Role of Mutual Funds in Corporate Governance of Public Listed Companies”, HSBC AMC has formulated its “Policy for Proxy Voting in Public Listed Companies”. The said policy is available on our website and the details of actual exercise of proxy votes, the summary of votes casted and the auditor’s certificate for the Financial Year 2020 – 21 is forming part of our full Annual Report for the Financial Year 2020 – 21 which is uploaded on our website at http://www.assetmanagement.hsbc.co.in
25
HSBC Regular Savings Fund
Statutory Details & Disclaimers
All the returns have been sourced from Mutual Funds India Explorer software. The performance of the schemes and the benchmark is calculated on a total return basis. This document has been prepared by HSBC Asset Management (India) Private Ltd (HSBC) for information purposes only and should not be construed as i) an offer or recommendation to buy or sell securities, commodities, currencies or other investments referred to herein; or ii) an offer to sell or a solicitation or an offer for purchase of any of the funds of HSBC Mutual Fund; or iii) an investment research or investment advice. All information contained in this document (including that sourced from third parties), is obtained from sources HSBC and the third party which HSBC believes to be reliable however, has not independently verified the same. The information and opinions contained within the document are based upon publicly available information and rates of taxation applicable (if any) at the time of publication, which are subject to change from time to time.
Expressions of opinion are those of HSBC only and are subject to change without notice. It does not have regard to specific investment objectives, financial situation and the particular needs of any specific person who may receive this document. Investors should seek personal and independent advice regarding the appropriateness of investing in any of the funds, securities, other investment or investment strategies that may have been discussed or referred herein and should understand that the views regarding future prospects may or may not be realized. In no event shall HSBC Mutual Fund / HSBC Asset management (India) Private Limited and / or its affiliates or any of their directors, trustees, officers and employees be liable for any direct, indirect, special, incidental or consequential damages arising out of the use of information / opinion herein. Neither this document nor the units of HSBC Mutual Fund have been registered in any jurisdiction. The distribution of this document in certain jurisdictions may be restricted or totally prohibited and accordingly, persons who come into possession of this document are required to inform themselves about, and to observe, any such restrictions.
mutual fund investments are subject to market risks, read all scheme related documents carefully.

HSBC Fixed Term SeriesA close ended income Schemes
Abridged Annual Report 2020 - 2021

1
HSBC Fixed Term Series
Dear Investor,
The beginning of the last financial year now almost seems like a distant memory. COVID-19 was still a relatively unknown enemy and governments across the world were grappling with ways to control and mitigate the risks associated with it. Nationwide lockdowns were the norm and our markets both equity and fixed income reacted negatively leading to significant erosion of wealth. Within a short period of time markets bounced back. This confounded even the most astute market pundits. How is it possible that when GDP growth had slowed down, unemployment had risen, inflation was high could there be such sharp up move in equity indices. Whilst the reasons are well known about easy global liquidity, demand resurgence, cost cutting by corporates etc. perhaps its most important to remember that the markets are not a reflector but a predictor of economic activity.
At all times particularly during such volatile times it is important to go back to the basics. Why do you save, why do you invest, what goals would you like to achieve, how old are you, what is your risk appetite? The replies to these simple questions will help you determine your asset allocation. As an example when equity markets corrected sharply last year, investors who reviewed their asset allocation, stayed invested during the lows of the past year and were able to capture the rebound and have seen prime returns since then. The current market movement in all likelihood would have also led to some imbalances in your asset allocation. Do not ignore that and I strongly recommend that you do review this with your advisor to check whether re-balancing is required.
During this financial year we had three very successful new fund launches. The pandemic showed us a clear trend of dominant players becoming stronger and profit pool getting consolidated within a few companies. To capture this opportunity, we launched the HSBC Focused Equity Fund which garnered close to Rs. 520 crores. During the second half of 2020, in the fixed income space, 3 - 5 year duration range had a favourable investment scenario as RBI’s accommodative policy and surplus liquidity had reduced the returns at the very short end of the yield curve. There was a demand for an actively managed moderate duration strategy with better credit quality which we fulfilled by launching HSBC Corporate Bond Fund. It garnered over 700 crores. Our latest and first of its kind offering, HSBC Global Equity Climate Change Fund of Fund saw a stupendous response with over 8000 investors investing over Rs. 616 crores. This is an investment opportunity which goes beyond the rationale of simply generating investment returns and is the future of responsible investing.
We worked towards augmenting our digital capabilities by launching a few key enhancements to our online transaction platform. Being mindful of the movement restrictions in place, this year we focused on digitizing offline processes so that an investor need not need step out of her home for investing or availing any key services. While our interactive chatbot AskMe, eased service queries, our end-to-end digital KYC module enabled a first time Mutual Fund investor to invest in our funds without any paperwork. We listened to your feedback and digitized consolidation of folios and change of tax status which eliminated the need for you to physically visit our branches.
I am a strong believer in the India story and this story has just begun. The opportunity to invest in this high growth market is a very exciting opportunity. I do hope you share my enthusiasm and I ask that you continue to invest whilst reviewing your asset allocation at all times. As always thank you for your business. Stay safe.
Warm regards,
Ravi MenonChief Executive Officer,
HSBC Asset Management India

2
Abridged Annual Report 2020 - 2021
SPONSOR
HSBC Securities and Capital Markets (India) Private LimitedRegd. Office: 52/60, Mahatma Gandhi Road, Fort, Mumbai - 400 001.
TRUSTEE
Board of TrusteesOffice: 16, Veer Nariman Road, Fort, Mumbai 400 001.
ASSET MANAGEMENT COMPANY
HSBC Asset Management (India) Private LimitedCorp. & Regd. Office: 16, Veer Nariman Road, Fort, Mumbai 400 001.
CUSTODIAN
Standard Chartered Bank (SCB)Corp. & Regd. Office: Crescenzo, Securities Services, 3rd Floor, C-38/39, G-Block,Bandra Kurla Complex, Bandra East, Mumbai – 400051.
AUDITORS TO THE SCHEME
BSR & Co. LLPChartered Accountants
5th Floor, Lodha Excelus, Apollo Mills Compound, N. M. Joshi Marg, Mahalaxmi, Mumbai 400 011.
REGISTRAR & TRANSFER AGENTS
Computer Age Management Services Limited (CAMS)Unit: HSBC Mutual Fund ’C’ Block, 2nd Floor, Hanudev Info Park P. Ltd., SF No. 558/2, Udayampalayam Road, Nava India, Coimbatore - 641 028.
BOARD OF TRUSTEES
Ms. Jasmine Batliwalla - Chairperson
Mr. Nani Javeri - Trustee
Dr. T. C. Nair - Trustee
Mr. Pedro Bastos - Trustee
BOARD OF DIRECTORS
Mr. Dinesh Mittal - Director
Dr. Indu Shahani - Director
Mr. Ravi Menon - Director & Chief Executive Officer
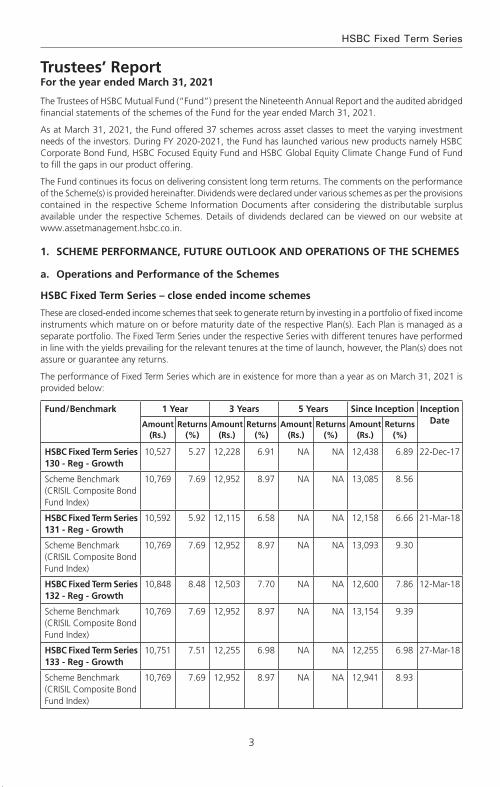
3
HSBC Fixed Term Series
The Trustees of HSBC Mutual Fund (“Fund”) present the Nineteenth Annual Report and the audited abridged financial statements of the schemes of the Fund for the year ended March 31, 2021.
As at March 31, 2021, the Fund offered 37 schemes across asset classes to meet the varying investment needs of the investors. During FY 2020-2021, the Fund has launched various new products namely HSBC Corporate Bond Fund, HSBC Focused Equity Fund and HSBC Global Equity Climate Change Fund of Fund to fill the gaps in our product offering.
The Fund continues its focus on delivering consistent long term returns. The comments on the performance of the Scheme(s) is provided hereinafter. Dividends were declared under various schemes as per the provisions contained in the respective Scheme Information Documents after considering the distributable surplus available under the respective Schemes. Details of dividends declared can be viewed on our website at www.assetmanagement.hsbc.co.in.
1. SCHEME PERFORMANCE, FUTURE OUTLOOk AND OPERATIONS OF THE SCHEMES
a. Operations and Performance of the Schemes
HSBC Fixed Term Series – close ended income schemes
These are closed-ended income schemes that seek to generate return by investing in a portfolio of fixed income instruments which mature on or before maturity date of the respective Plan(s). Each Plan is managed as a separate portfolio. The Fixed Term Series under the respective Series with different tenures have performed in line with the yields prevailing for the relevant tenures at the time of launch, however, the Plan(s) does not assure or guarantee any returns.
The performance of Fixed Term Series which are in existence for more than a year as on March 31, 2021 is provided below:
Fund / Benchmark 1 Year 3 Years 5 Years Since Inception Inception DateAmount
(Rs.)Returns
(%)Amount
(Rs.)Returns
(%)Amount
(Rs.)Returns
(%)Amount
(Rs.)Returns
(%)
HSBC Fixed Term Series 130 - Reg - Growth
10,527 5.27 12,228 6.91 NA NA 12,438 6.89 22-Dec-17
Scheme Benchmark (CRISIL Composite Bond Fund Index)
10,769 7.69 12,952 8.97 NA NA 13,085 8.56
HSBC Fixed Term Series 131 - Reg - Growth
10,592 5.92 12,115 6.58 NA NA 12,158 6.66 21-Mar-18
Scheme Benchmark (CRISIL Composite Bond Fund Index)
10,769 7.69 12,952 8.97 NA NA 13,093 9.30
HSBC Fixed Term Series 132 - Reg - Growth
10,848 8.48 12,503 7.70 NA NA 12,600 7.86 12-Mar-18
Scheme Benchmark (CRISIL Composite Bond Fund Index)
10,769 7.69 12,952 8.97 NA NA 13,154 9.39
HSBC Fixed Term Series 133 - Reg - Growth
10,751 7.51 12,255 6.98 NA NA 12,255 6.98 27-Mar-18
Scheme Benchmark (CRISIL Composite Bond Fund Index)
10,769 7.69 12,952 8.97 NA NA 12,941 8.93
Trustees’ ReportFor the year ended March 31, 2021
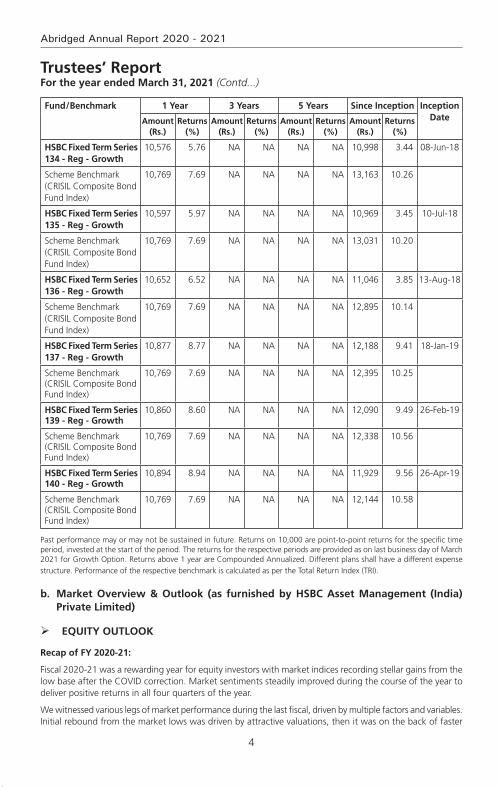
4
Abridged Annual Report 2020 - 2021
Fund / Benchmark 1 Year 3 Years 5 Years Since Inception Inception DateAmount
(Rs.)Returns
(%)Amount
(Rs.)Returns
(%)Amount
(Rs.)Returns
(%)Amount
(Rs.)Returns
(%)
HSBC Fixed Term Series 134 - Reg - Growth
10,576 5.76 NA NA NA NA 10,998 3.44 08-Jun-18
Scheme Benchmark (CRISIL Composite Bond Fund Index)
10,769 7.69 NA NA NA NA 13,163 10.26
HSBC Fixed Term Series 135 - Reg - Growth
10,597 5.97 NA NA NA NA 10,969 3.45 10-Jul-18
Scheme Benchmark (CRISIL Composite Bond Fund Index)
10,769 7.69 NA NA NA NA 13,031 10.20
HSBC Fixed Term Series 136 - Reg - Growth
10,652 6.52 NA NA NA NA 11,046 3.85 13-Aug-18
Scheme Benchmark (CRISIL Composite Bond Fund Index)
10,769 7.69 NA NA NA NA 12,895 10.14
HSBC Fixed Term Series 137 - Reg - Growth
10,877 8.77 NA NA NA NA 12,188 9.41 18-Jan-19
Scheme Benchmark (CRISIL Composite Bond Fund Index)
10,769 7.69 NA NA NA NA 12,395 10.25
HSBC Fixed Term Series 139 - Reg - Growth
10,860 8.60 NA NA NA NA 12,090 9.49 26-Feb-19
Scheme Benchmark (CRISIL Composite Bond Fund Index)
10,769 7.69 NA NA NA NA 12,338 10.56
HSBC Fixed Term Series 140 - Reg - Growth
10,894 8.94 NA NA NA NA 11,929 9.56 26-Apr-19
Scheme Benchmark (CRISIL Composite Bond Fund Index)
10,769 7.69 NA NA NA NA 12,144 10.58
Past performance may or may not be sustained in future. Returns on 10,000 are point-to-point returns for the specific time period, invested at the start of the period. The returns for the respective periods are provided as on last business day of March 2021 for Growth Option. Returns above 1 year are Compounded Annualized. Different plans shall have a different expense structure. Performance of the respective benchmark is calculated as per the Total Return Index (TRI).
b. Market Overview & Outlook (as furnished by HSBC Asset Management (India) Private Limited)
EqUITY OUTLOOk
Recap of FY 2020-21:
Fiscal 2020-21 was a rewarding year for equity investors with market indices recording stellar gains from the low base after the COVID correction. Market sentiments steadily improved during the course of the year to deliver positive returns in all four quarters of the year.
We witnessed various legs of market performance during the last fiscal, driven by multiple factors and variables. Initial rebound from the market lows was driven by attractive valuations, then it was on the back of faster
Trustees’ ReportFor the year ended March 31, 2021 (Contd...)
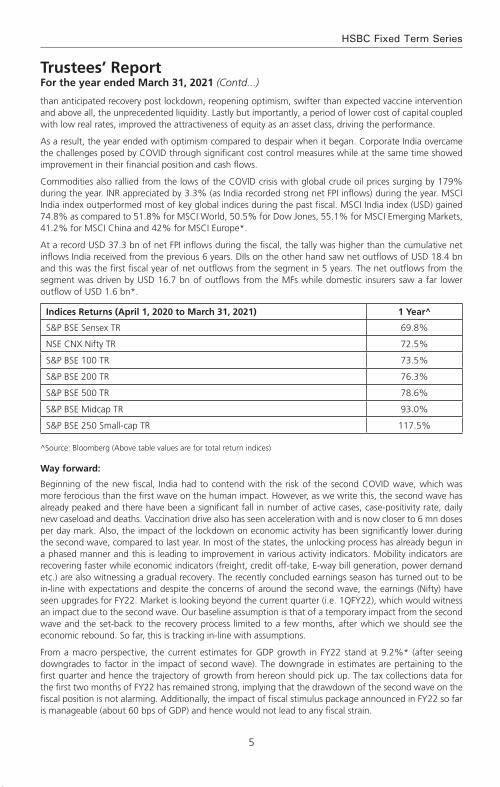
5
HSBC Fixed Term Series
than anticipated recovery post lockdown, reopening optimism, swifter than expected vaccine intervention and above all, the unprecedented liquidity. Lastly but importantly, a period of lower cost of capital coupled with low real rates, improved the attractiveness of equity as an asset class, driving the performance.
As a result, the year ended with optimism compared to despair when it began. Corporate India overcame the challenges posed by COVID through significant cost control measures while at the same time showed improvement in their financial position and cash flows.
Commodities also rallied from the lows of the COVID crisis with global crude oil prices surging by 179% during the year. INR appreciated by 3.3% (as India recorded strong net FPI inflows) during the year. MSCI India index outperformed most of key global indices during the past fiscal. MSCI India index (USD) gained 74.8% as compared to 51.8% for MSCI World, 50.5% for Dow Jones, 55.1% for MSCI Emerging Markets, 41.2% for MSCI China and 42% for MSCI Europe*.
At a record USD 37.3 bn of net FPI inflows during the fiscal, the tally was higher than the cumulative net inflows India received from the previous 6 years. DIIs on the other hand saw net outflows of USD 18.4 bn and this was the first fiscal year of net outflows from the segment in 5 years. The net outflows from the segment was driven by USD 16.7 bn of outflows from the MFs while domestic insurers saw a far lower outflow of USD 1.6 bn*.
Indices Returns (April 1, 2020 to March 31, 2021) 1 Year^
S&P BSE Sensex TR 69.8%
NSE CNX Nifty TR 72.5%
S&P BSE 100 TR 73.5%
S&P BSE 200 TR 76.3%
S&P BSE 500 TR 78.6%
S&P BSE Midcap TR 93.0%
S&P BSE 250 Small-cap TR 117.5%
^Source: Bloomberg (Above table values are for total return indices)
Way forward:
Beginning of the new fiscal, India had to contend with the risk of the second COVID wave, which was more ferocious than the first wave on the human impact. However, as we write this, the second wave has already peaked and there have been a significant fall in number of active cases, case-positivity rate, daily new caseload and deaths. Vaccination drive also has seen acceleration with and is now closer to 6 mn doses per day mark. Also, the impact of the lockdown on economic activity has been significantly lower during the second wave, compared to last year. In most of the states, the unlocking process has already begun in a phased manner and this is leading to improvement in various activity indicators. Mobility indicators are recovering faster while economic indicators (freight, credit off-take, E-way bill generation, power demand etc.) are also witnessing a gradual recovery. The recently concluded earnings season has turned out to be in-line with expectations and despite the concerns of around the second wave, the earnings (Nifty) have seen upgrades for FY22. Market is looking beyond the current quarter (i.e. 1QFY22), which would witness an impact due to the second wave. Our baseline assumption is that of a temporary impact from the second wave and the set-back to the recovery process limited to a few months, after which we should see the economic rebound. So far, this is tracking in-line with assumptions.
From a macro perspective, the current estimates for GDP growth in FY22 stand at 9.2%* (after seeing downgrades to factor in the impact of second wave). The downgrade in estimates are pertaining to the first quarter and hence the trajectory of growth from hereon should pick up. The tax collections data for the first two months of FY22 has remained strong, implying that the drawdown of the second wave on the fiscal position is not alarming. Additionally, the impact of fiscal stimulus package announced in FY22 so far is manageable (about 60 bps of GDP) and hence would not lead to any fiscal strain.
Trustees’ ReportFor the year ended March 31, 2021 (Contd...)

6
Abridged Annual Report 2020 - 2021
After the spectacular rally, market valuations at an overall level are now trending above historical averages on traditional valuation metrics (P/E, P/B). This is true for all market capitalization categories (viz large, mid and small). Typically, the broader market (i.e. mid and small cap segments), trade at a discount to large caps, however this scenario has now reversed after the outperformance from the broader market segments. However, the earnings momentum continues to remain strong (witnessing upgrades so far) and except for a short period due to second wave, the earnings momentum should hold up.
We believe that the risk-reward is balanced for the equity markets in the near term. Higher or sticky inflation expectations globally, higher than historical market valuations on some parameters (i.e. P/E, P/B) and adverse demand impact from the second wave are risk factors to contend with in the near term. However, these are counter balanced by positive commentary from companies, significant decline in COVID cases and acceleration in the vaccination programme. As a result, in the near term markets may see a consolidation phase and could take cues from the upcoming earnings season with more focus on the corporate commentary and the outlook. From a medium to long term perspective, the outlook for equity markets remains positive. The expectation of cyclical revival in the economy brings in a multi-year earnings visibility. This along with a benign cost of capital environment, should support equity performance. However, equity returns are likely to moderate on the back of the relatively high valuations and the strong recovery we have already witnessed from the COVID lows. Equity performance is likely to mirror the earnings growth trends over the medium to long term.
Pace of vaccination, concerns about a third wave, corporate earnings trajectory, inflation trends (both global & domestic), monsoon trends and commodity prices (especially crude oil) are some of the key factors which could influence market performance in the short term.
From a portfolio perspective, we are maintaining a pro-cyclical bias. We expect earnings growth to rebound sharply post the current COVID phase. Earnings growth are expected to sustain in high-teens beyond FY22 on the back of economy witnessing a cyclical recovery due to revival in capex cycle over the next 2-3 years (first by the government followed by private capex). From a sectoral perspective our order of preference is rate sensitives followed by domestic cyclicals, exporters and domestic consumption. Predominantly regulated businesses come last in our pecking order. This preference is dictated by our assessment of sectors / segments leading contribution to the market earnings growth over the next 2-3 years. Our portfolio construction is driven by a bottom up approach to stock selection with a focus on names that can deliver positive earnings surprises. We continue to focus on this theme to identify likely outperformers.
*Source: Bloomberg
DEBT OUTLOOk
Market drivers during the course of the year FY21
The Fixed Income markets started the year with a bout of nervousness that was triggered by the pandemic. While RBI had calmed the markets with its large rate cut action of 75bp cut followed by liquidity supportive measures, the volatility continued until mid-May when government announced its relief package. While it was not fiscally expansive, it touched the right cords in terms of credit flow to desired sectors. This was followed up with RBI’s credit relief measures in terms of moratorium and restructuring of assets that were stressed due to the pandemic. Throughout the course of the year, RBI maintained its accommodative stance along with significant amount of surplus liquidity that was supportive and helped in maintaining stability in the market. However, as the year progressed and pressure on fiscal began to mount yields started seeing a spike towards the last quarter of the fiscal. While borrowing was stepped up to INR 12 trillion from previously budgeted INR 7.8 trillion in May 2020, it was further enhanced by and additional INR 1.1 trillion in October 2020. Overall GOI ended up borrowing a record amount of INR 13.9 trillion. The budget proved to be a shocker with GOI using the pandemic as an opportunity for setting the finances in order. GOI showed a record deficit of 9.5% for FY21 and projected a 6.8% for FY22 with estimated central government gross borrowing of INR 12 trillion. This seemed to reverse the support RBI had provided throughout the year with benchmark 10-year bond peaking to 6.23% in mid –Feb 2021. RBI’s statements to remain supportive were left in the sidelines. Overall it seemed that the 115bp of rate cut, along with significant liquidity infusion (OMO + Twist
Trustees’ ReportFor the year ended March 31, 2021 (Contd...)
7
HSBC Fixed Term Series
operations of ~INR 3 trillion, infusion via dollar purchases) seemed only a little to help in applying a brake to the one-way spike in yields. The year closed ~6.16% with absence of concrete action by RBI.
RBI Policy: Through the course of the year, RBI has maintained an accommodative stance, with an aggregate 115bp of rate cut done in March and May 2020 taking the repo rate from 5.15% to 4%. Subsequently while inflation pressures prevented RBI from taking any direct actions, RBI has used a combination of creative tools to keep the rates contained primarily via liquidity supportive tools such as OMOs, Twist Operations, Repo linked Term loans to needy sectors (LTROs, TLTROs), CRR cuts. While inflation was a worry for most part of the year, RBI kept it aside admitting that growth was a priority and inflation effects are more supply side rather than demand side. Prospectively into FY22, with the onset of the second wave, RBI continues to maintain the stance to prioritize growth.
Inflation: Inflation for most part of the year stayed above 6% primarily driven by supply side pressures and some intermittent spike from food inflation as well. While it has been coming off since December with cooling off of food inflation and positive base effects, it has been between 4- 5.5%. Structurally however inflation risks continue to remain as oil prices have increased and base effects will not remain supportive for long. Core inflation continues to remain sticky.
Liquidity: During the year, system liquidity has remained at significant surplus facilitated largely by RBI action such as OMOs, foreign exchange operations and government spending.
Budget: The FY2022 union budget focuses on growth and has accordingly, presented a 9.5% fiscal deficit for FY21 and 6.8% for FY22. On the revenue side, the assumptions are largely realistic, with FY22 (E) Nominal GDP growth at 14.4% and tax revenue growth at 17% considering the pandemic impact in FY 21. Compared to FY20, tax revenue growth is ~10%. While non-tax revenues are ambitious pegging the divestment at INR 1.75 trillion, with robust pipeline of assets including monetization of road and transmission assets, execution remains the key as in the past. On the expenditure side, better quality capex spending with focusing on rail, road, defense, urban infra is positive for long term structural growth. The revenue side expenditure adjusting for clearance of past subsidy arrears will be similar to budgetary estimates. Government using this opportunity to bring back off-balance sheet spending to on-balance sheet was a welcome move towards transparency and showing realistic projections. Alongside, states have also been given leeway to borrow upto 4% of their GDP with an additional 0.5% subject to conditions. Given that states are an important vehicle for capex investment, this move is welcome although it may entail additional state borrowing. The fiscal glide path is shifted to FY26 at below 4.5% for center and 3% for states suggesting that spending will continue and borrowing will come down gradually. In summary, from survival to revival, FY22 budget aims for structural growth leaving fiscal concerns sideways in the interim. Government’s intent seems clear on bringing back growth on the table, in a transparent manner.
While the second wave of the pandemic has once again derailed the revenue story, government will still have some cushion from its conservative estimates.
Currency and FII Flows: INR has been on an appreciation trajectory for most part of the year, aided by dollar underperformance supported by positive FII and FDI flows along with reduced imports on the domestic front as well. RBI has used most of the flows to accumulate reserves which has prevented any strong appreciation. Pandemic shock and global risk off led rupee over 75 in the beginning of the year only to close below 72 at the end of the fiscal year. While the second wave led to another spike in INR in April, it has since then cooled once again driven by dollar underperformance and pandemic recovery on the domestic front. Net FII flows was ~$30 bn with positive equity flows of~$37 bn while debt was negative ~$7bn and overall RBI’s forex reserves rose by a ~$100 bn to close ~$537 bn.
Credit growth: Credit growth for the entire year has been tepid as previous year’s credit events were followed by nervousness relating to the pandemic. Despite RBI opening up several windows to finance the non-AAA segment, there was very little fresh credit flowing that segment. Overall banking credit grew by only 6.5%. Risk appetite has however been improving from a complete risk aversion to opening up towards a calculated risk. Prospectively it is expected that once the pandemic risk abates, credit growth will resume primarily driven by government capex spending and demand recovery.
Trustees’ ReportFor the year ended March 31, 2021 (Contd...)
8
Abridged Annual Report 2020 - 2021
Market Outlook
The pandemic once again brought the country to a situation similar to last year and debt markets perhaps interpreted the same as a structural rise in rates. In the initial day’s post budget in Feb of 2021, market was expecting a concrete set of actions such as an OMO calendar from RBI, and RBI’s words alone failed to calm the market. The first auction of the fiscal year also saw a devolvement. However, RBI acted in the first policy of the year announcing a bond buyback program akin to QE (quantitative easing) and its subsequent cancellation of auctions wherein yields were perhaps quoted higher than RBI’s comfort levels brought back confidence into the market. Since then we have seen a strong rally with 10-year benchmark trending below 6% and the curve moving alongside. RBI reiteration of priority of growth and also supporting with higher than expected dividend payment stand out as a testimony of its support. While we do not expect RBI to act in terms of rate cuts, we believe that measures such as G-SAP, OMOs will continue until there is visibility of a structural growth. Therefore, the large borrowing program should go without any hiccups.
Furthermore, with the evidence of strong GST numbers until April 2021 (before the 2nd wave), it is expected that growth and therefore fiscal revenues will come back. Government’s conservative budget estimates are supportive. Also, given the fact that compared to last year there has not been a complete shutdown of activity (lockdowns being distributed), the impact on growth will not be similar to last year. Pent up demand will come back to support revenue collection. However, on the flipside, once growth resumes RBI will be forced to withdraw liquidity in a phased manner to prevent asset bubbles. Nevertheless, RBI need not act in terms of rate actions and we believe that a prolonged pause in terms of RBI rates is in the offing.
Net-net therefore while growth is wanting no matter what, it may come at a small price of rise in yields with liquidity withdrawal. That is however expected more in the 2nd half of the year. Lower than expected borrowing numbers, later this year or if not in next year could be a surprise. We may therefore see a range bound rate action in the near term with a rising bias over time. Global rate environment, oil and currency risks are to be watched out for.
2. BRIEF BACkGROUND OF SPONSORS, BOARD OF TRUSTEES AND ASSET MANAGEMENT COMPANY
a. Sponsor
HSBC Mutual Fund is sponsored by HSBC Securities and Capital Markets (India) Private Limited (HSCI). The Sponsor is the Settler of the Mutual Fund Trust. The Sponsor has entrusted a sum of Rs. 1,00,000/- (Rupees One Lakh only) to the Trustee as the initial contribution towards the corpus of the Mutual Fund.
HSCI offers integrated investment banking services, securities and corporate finance & advisory. HSCI is a member of the Bombay Stock Exchange Limited and National Stock Exchange (capital and derivative market segments). HSCI holds 100% of the paid up equity share capital of HSBC Asset Management (India) Private Limited.
b. HSBC Mutual Fund
HSBC Mutual Fund (“the Mutual Fund” or “the Fund”) has been constituted as a Trust in accordance with the provisions of the Indian Trusts Act, 1882 (2 of 1882) vide a Trust Deed dated February 7, 2002 with HSBC Securities and Capital Markets (India) Private Limited, as the Sponsor and the Board of Individual Trustees. The Trustee has entered into an Investment Management Agreement dated February 7, 2002 with HSBC Asset Management (India) Private Limited (AMC) to function as the Investment Manager for all the schemes of the Fund. The Fund was registered with SEBI vide registration number MF/046/02/5 dated May 27, 2002.
The Trust has been formed for the purpose of pooling of capital from the public for collective investment in securities for the purpose of providing facilities for participation by persons as beneficiaries in such investments and in the profits/income arising therefrom.
Trustees’ ReportFor the year ended March 31, 2021 (Contd...)

9
HSBC Fixed Term Series
Trustees’ ReportFor the year ended March 31, 2021 (Contd...)
c. Board of Trustees (the Trustees)
The Board of Trustees is the exclusive owner of the Trust Fund and holds the same in trust for the benefit of the unit holders. The Trustees have been discharging their duties and carrying out the responsibilities as provided in the SEBI (Mutual Funds) Regulations, 1996 and the Trust Deed. The Trustees seek to ensure that the Fund and the schemes floated there under are managed by the AMC in accordance with the Trust Deed, the said Regulations, directions and guidelines issued by the SEBI, the Stock Exchanges, the Association of Mutual Funds in India and other regulatory agencies.
d. Asset Management Company (the AMC)
HSBC Asset Management (India) Private Limited (the Investment Manager or the AMC) is a private limited company incorporated under the Companies Act, 1956 on December 12, 2001 having its Registered Office at 16, V. N. Road, Fort, Mumbai 400 001. HSBC Asset Management (India) Private Limited has been appointed as the Asset Management Company of HSBC Mutual Fund by the Trustee vide Investment Management Agreement (IMA) dated February 7, 2002 and executed between the Trustees and the AMC. SEBI approved the AMC to act as the Investment Manager of the Fund vide its letter No. MFD/BC/163/2002 dated May 27, 2002. The paid-up equity share capital of the AMC is Rs. 61.59 crores. The AMC is registered as a Portfolio Manager under the SEBI (Portfolio Managers) Regulations, 1993 vide registration no. INP000001322. The AMC also offers non-binding Advisory services to offshore funds under the mutual fund license.
HSBC Securities and Capital Markets (India) Private Limited holds 100% of the paid up equity share capital of the AMC.
3. INvESTMENT OBJECTIvE OF THE SCHEMESThe investment objective of the respective schemes has been provided above under the heading “Scheme Performance, Future Outlook and Operation of the Scheme” (Refer Section 1).
4. SIGNIFICANT ACCOUNTING POLICIES The Significant Accounting Policies form part of the Notes to the Accounts annexed to the Balance Sheet of the Schemes in the Full Annual Report. The accounting policies are in accordance with Securities Exchange Board of India (Mutual Funds) Regulations 1996.
5. UNCLAIMED DIvIDENDS & REDEMPTIONSSummary of number of investors & corresponding amount as on March 31, 2021:
Nil.
6. INvESTOR SERvICESThe number of official points of acceptance of transactions is 204 locations. In addition to the offices of the Registrar & Transfer agents, the AMC has Investor Service Centers in 9 locations at its own offices - namely Mumbai, New Delhi, Kolkata, Bangalore, Pune, Ahmedabad, Hyderabad, Chandigarh and Chennai. With a view to enhance customer convenience, the AMC has the facility of priority based servicing to key distributors through the enhancement of the Interactive Voice Reponses. The AMC has 2 Toll Free numbers (1-800-200-2434 /1-800-258-2434) which can be dialed from anywhere in India and 1 number i.e +91 44 39923900 (Investors calling from abroad). The call center service is being managed by the Registrar and Transfer Agents. Transactions for purchase / redemption of units in the schemes HSBC Mutual Fund can also be made through the online transaction facility on the AMC’s website at https://invest.assetmanagement.hsbc.co.in.
On the distribution front, the number of empaneled distributors was 1069 as on March 31, 2021. During the year, the AMC initiated tie-ups for online distribution of the Mutual Fund’s schemes with several channel partners taking the total number of such tie-ups to 52.
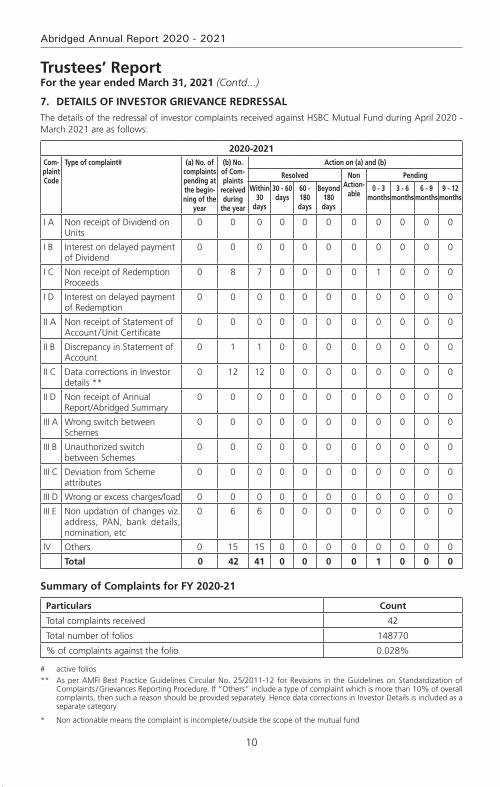
10
Abridged Annual Report 2020 - 2021
7. DETAILS OF INvESTOR GRIEvANCE REDRESSALThe details of the redressal of investor complaints received against HSBC Mutual Fund during April 2020 - March 2021 are as follows:
2020-2021Com-plaint Code
Type of complaint# (a) No. of complaints pending at the begin-ning of the
year
(b) No. of Com-plaints
received during
the year
Action on (a) and (b)
Resolved Non Action-
able
Pending
Within 30
days
30 - 60 days
60 - 180 days
Beyond 180 days
0 - 3 months
3 - 6 months
6 - 9 months
9 - 12 months
I A Non receipt of Dividend on Units
0 0 0 0 0 0 0 0 0 0 0
I B Interest on delayed payment of Dividend
0 0 0 0 0 0 0 0 0 0 0
I C Non receipt of Redemption Proceeds
0 8 7 0 0 0 0 1 0 0 0
I D Interest on delayed payment of Redemption
0 0 0 0 0 0 0 0 0 0 0
II A Non receipt of Statement of Account / Unit Certificate
0 0 0 0 0 0 0 0 0 0 0
II B Discrepancy in Statement of Account
0 1 1 0 0 0 0 0 0 0 0
II C Data corrections in Investor details **
0 12 12 0 0 0 0 0 0 0 0
II D Non receipt of Annual Report/Abridged Summary
0 0 0 0 0 0 0 0 0 0 0
III A Wrong switch between Schemes
0 0 0 0 0 0 0 0 0 0 0
III B Unauthorized switch between Schemes
0 0 0 0 0 0 0 0 0 0 0
III C Deviation from Scheme attributes
0 0 0 0 0 0 0 0 0 0 0
III D Wrong or excess charges/load 0 0 0 0 0 0 0 0 0 0 0
III E Non updation of changes viz. address, PAN, bank details, nomination, etc
0 6 6 0 0 0 0 0 0 0 0
IV Others 0 15 15 0 0 0 0 0 0 0 0
Total 0 42 41 0 0 0 0 1 0 0 0
Summary of Complaints for FY 2020-21
Particulars Count
Total complaints received 42
Total number of folios 148770
% of complaints against the folio 0.028%
# active folios
** As per AMFI Best Practice Guidelines Circular No. 25/2011-12 for Revisions in the Guidelines on Standardization of Complaints / Grievances Reporting Procedure. If “Others” include a type of complaint which is more than 10% of overall complaints, then such a reason should be provided separately. Hence data corrections in Investor Details is included as a separate category
* Non actionable means the complaint is incomplete / outside the scope of the mutual fund
Trustees’ ReportFor the year ended March 31, 2021 (Contd...)
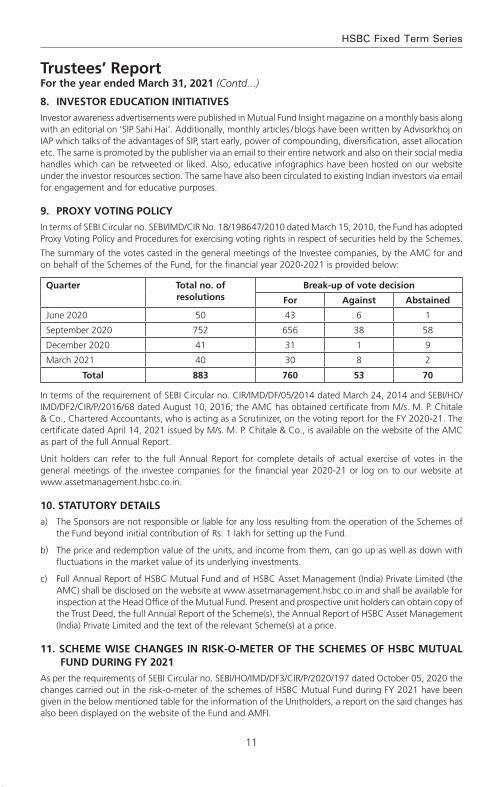
11
HSBC Fixed Term Series
8. INvESTOR EDUCATION INITIATIvES Investor awareness advertisements were published in Mutual Fund Insight magazine on a monthly basis along with an editorial on ‘SIP Sahi Hai’. Additionally, monthly articles / blogs have been written by Advisorkhoj on IAP which talks of the advantages of SIP, start early, power of compounding, diversification, asset allocation etc. The same is promoted by the publisher via an email to their entire network and also on their social media handles which can be retweeted or liked. Also, educative infographics have been hosted on our website under the investor resources section. The same have also been circulated to existing Indian investors via email for engagement and for educative purposes.
9. PROxY vOTING POLICYIn terms of SEBI Circular no. SEBI/IMD/CIR No. 18/198647/2010 dated March 15, 2010, the Fund has adopted Proxy Voting Policy and Procedures for exercising voting rights in respect of securities held by the Schemes.
The summary of the votes casted in the general meetings of the Investee companies, by the AMC for and on behalf of the Schemes of the Fund, for the financial year 2020-2021 is provided below:
quarter Total no. of resolutions
Break-up of vote decision
For Against Abstained
June 2020 50 43 6 1
September 2020 752 656 38 58
December 2020 41 31 1 9
March 2021 40 30 8 2
Total 883 760 53 70
In terms of the requirement of SEBI Circular no. CIR/IMD/DF/05/2014 dated March 24, 2014 and SEBI/HO/IMD/DF2/CIR/P/2016/68 dated August 10, 2016; the AMC has obtained certificate from M/s. M. P. Chitale & Co., Chartered Accountants, who is acting as a Scrutinizer, on the voting report for the FY 2020-21. The certificate dated April 14, 2021 issued by M/s. M. P. Chitale & Co., is available on the website of the AMC as part of the full Annual Report.
Unit holders can refer to the full Annual Report for complete details of actual exercise of votes in the general meetings of the investee companies for the financial year 2020-21 or log on to our website at www.assetmanagement.hsbc.co.in.
10. STATUTORY DETAILSa) The Sponsors are not responsible or liable for any loss resulting from the operation of the Schemes of
the Fund beyond initial contribution of Rs. 1 lakh for setting up the Fund.
b) The price and redemption value of the units, and income from them, can go up as well as down with fluctuations in the market value of its underlying investments.
c) Full Annual Report of HSBC Mutual Fund and of HSBC Asset Management (India) Private Limited (the AMC) shall be disclosed on the website at www.assetmanagement.hsbc.co.in and shall be available for inspection at the Head Office of the Mutual Fund. Present and prospective unit holders can obtain copy of the Trust Deed, the full Annual Report of the Scheme(s), the Annual Report of HSBC Asset Management (India) Private Limited and the text of the relevant Scheme(s) at a price.
11. SCHEME WISE CHANGES IN RISk-O-METER OF THE SCHEMES OF HSBC MUTUAL FUND DURING FY 2021
As per the requirements of SEBI Circular no. SEBI/HO/IMD/DF3/CIR/P/2020/197 dated October 05, 2020 the changes carried out in the risk-o-meter of the schemes of HSBC Mutual Fund during FY 2021 have been given in the below mentioned table for the information of the Unitholders, a report on the said changes has also been displayed on the website of the Fund and AMFI.
Trustees’ ReportFor the year ended March 31, 2021 (Contd...)
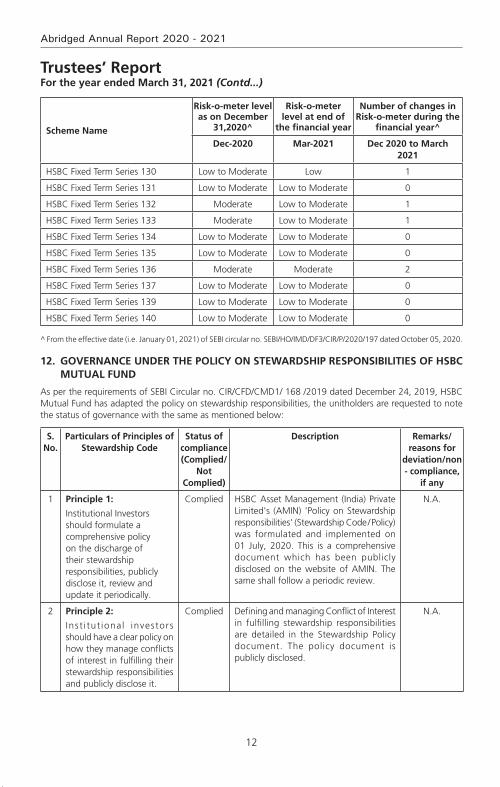
12
Abridged Annual Report 2020 - 2021
Trustees’ ReportFor the year ended March 31, 2021 (Contd...)
Scheme Name
Risk-o-meter level as on December
31,2020^
Risk-o-meter level at end of
the financial year
Number of changes in Risk-o-meter during the
financial year^
Dec-2020 Mar-2021 Dec 2020 to March 2021
HSBC Fixed Term Series 130 Low to Moderate Low 1
HSBC Fixed Term Series 131 Low to Moderate Low to Moderate 0
HSBC Fixed Term Series 132 Moderate Low to Moderate 1
HSBC Fixed Term Series 133 Moderate Low to Moderate 1
HSBC Fixed Term Series 134 Low to Moderate Low to Moderate 0
HSBC Fixed Term Series 135 Low to Moderate Low to Moderate 0
HSBC Fixed Term Series 136 Moderate Moderate 2
HSBC Fixed Term Series 137 Low to Moderate Low to Moderate 0
HSBC Fixed Term Series 139 Low to Moderate Low to Moderate 0
HSBC Fixed Term Series 140 Low to Moderate Low to Moderate 0
^ From the effective date (i.e. January 01, 2021) of SEBI circular no. SEBI/HO/IMD/DF3/CIR/P/2020/197 dated October 05, 2020.
12. GOvERNANCE UNDER THE POLICY ON STEWARDSHIP RESPONSIBILITIES OF HSBC MUTUAL FUND
As per the requirements of SEBI Circular no. CIR/CFD/CMD1/ 168 /2019 dated December 24, 2019, HSBC Mutual Fund has adapted the policy on stewardship responsibilities, the unitholders are requested to note the status of governance with the same as mentioned below:
S. No.
Particulars of Principles of Stewardship Code
Status of compliance (Complied/
Not Complied)
Description Remarks/reasons for
deviation/non - compliance,
if any
1 Principle 1:
Institutional Investors should formulate a comprehensive policy on the discharge of their stewardship responsibilities, publicly disclose it, review and update it periodically.
Complied HSBC Asset Management (India) Private Limited's (AMIN) 'Policy on Stewardship responsibilities' (Stewardship Code / Policy) was formulated and implemented on 01 July, 2020. This is a comprehensive document which has been publicly disclosed on the website of AMIN. The same shall follow a periodic review.
N.A.
2 Principle 2:
Inst i tut ional investors should have a clear policy on how they manage conflicts of interest in fulfilling their stewardship responsibilities and publicly disclose it.
Complied Defining and managing Conflict of Interest in fulfilling stewardship responsibilities are detailed in the Stewardship Policy document. The policy document is publicly disclosed.
N.A.
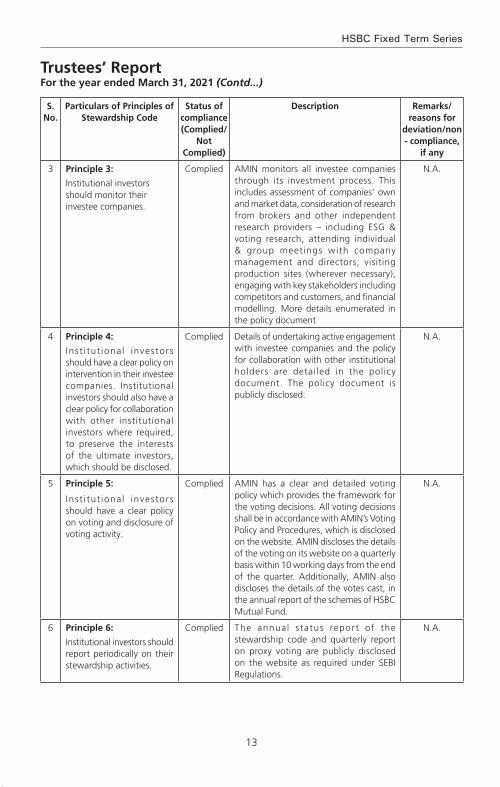
13
HSBC Fixed Term Series
Trustees’ ReportFor the year ended March 31, 2021 (Contd...)
S. No.
Particulars of Principles of Stewardship Code
Status of compliance (Complied/
Not Complied)
Description Remarks/reasons for
deviation/non - compliance,
if any
3 Principle 3:
Institutional investors should monitor their investee companies.
Complied AMIN monitors all investee companies through its investment process. This includes assessment of companies’ own and market data, consideration of research from brokers and other independent research providers – including ESG & voting research, attending individual & group meetings with company management and directors, visiting production sites (wherever necessary), engaging with key stakeholders including competitors and customers, and financial modelling. More details enumerated in the policy document
N.A.
4 Principle 4:
Inst i tut ional investors should have a clear policy on intervention in their investee companies. Institutional investors should also have a clear policy for collaboration with other institutional investors where required, to preserve the interests of the ultimate investors, which should be disclosed.
Complied Details of undertaking active engagement with investee companies and the policy for collaboration with other institutional holders are detailed in the policy document. The policy document is publicly disclosed.
N.A.
5 Principle 5:
Inst i tut ional investors should have a clear policy on voting and disclosure of voting activity.
Complied AMIN has a clear and detailed voting policy which provides the framework for the voting decisions. All voting decisions shall be in accordance with AMIN’s Voting Policy and Procedures, which is disclosed on the website. AMIN discloses the details of the voting on its website on a quarterly basis within 10 working days from the end of the quarter. Additionally, AMIN also discloses the details of the votes cast, in the annual report of the schemes of HSBC Mutual Fund.
N.A.
6 Principle 6:
Institutional investors should report periodically on their stewardship activities.
Complied The annual status report of the stewardship code and quarterly report on proxy voting are publicly disclosed on the website as required under SEBI Regulations.
N.A.

14
Abridged Annual Report 2020 - 2021
13. SIGNIFICANT EvENT AFTER THE END OF THE FINANCIAL YEAR
HSBC Global Consumer Opportunities Fund (HGCOF) has been merged with HSBC Asia Pacific (Ex Japan) Dividend Yield Fund with effect from May 13, 2021. Therefore, HGCOF has been ceased to exist from the aforesaid date.
14. ACkNOWLEDGEMENTS
The Trustees wish to thank the Unit holders of the Schemes for their support throughout the year and also thank the Government of India, the Securities and Exchange Board of India (SEBI), the Reserve Bank of India (RBI) and the Association of Mutual Funds in India (AMFI) for the guidance provided by them. The Trustees also appreciate the services provided by the Registrar and Transfer Agent, Fund Accountant, Custodian, Bankers, Distributors and Brokers. The guidance and services provided by the Auditors and advocates and the ebullience, sincerity and dedication of the employees of HSBC Asset Management (India) Private Limited is also appreciated.
The Trustees look forward to the continued support of everyone.
For and on behalf of the Board of Trustees of HSBC Mutual Fund
Sd/-
Trustee
Mumbai
July 20, 2021.
Trustees’ ReportFor the year ended March 31, 2021 (Contd...)
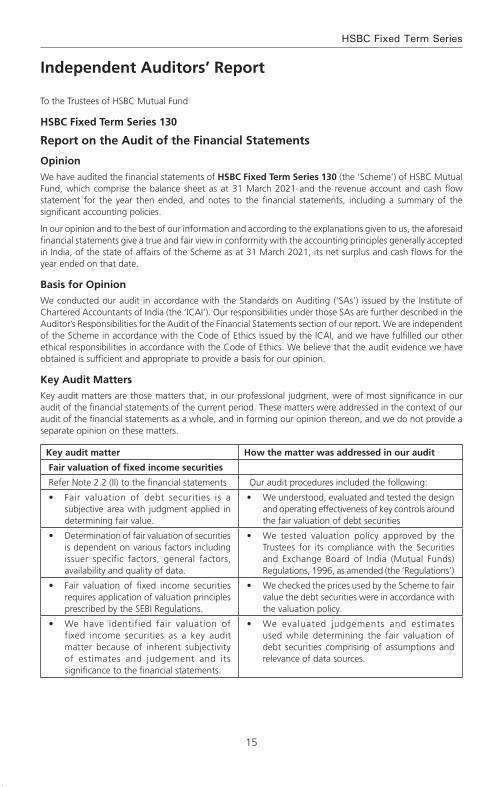
15
HSBC Fixed Term Series
To the Trustees of HSBC Mutual Fund
HSBC Fixed Term Series 130
Report on the Audit of the Financial Statements
OpinionWe have audited the financial statements of HSBC Fixed Term Series 130 (the ‘Scheme’) of HSBC Mutual Fund, which comprise the balance sheet as at 31 March 2021 and the revenue account and cash flow statement for the year then ended, and notes to the financial statements, including a summary of the significant accounting policies.
In our opinion and to the best of our information and according to the explanations given to us, the aforesaid financial statements give a true and fair view in conformity with the accounting principles generally accepted in India, of the state of affairs of the Scheme as at 31 March 2021, its net surplus and cash flows for the year ended on that date.
Basis for OpinionWe conducted our audit in accordance with the Standards on Auditing (‘SAs’) issued by the Institute of Chartered Accountants of India (the ‘ICAI’). Our responsibilities under those SAs are further described in the Auditor’s Responsibilities for the Audit of the Financial Statements section of our report. We are independent of the Scheme in accordance with the Code of Ethics issued by the ICAI, and we have fulfilled our other ethical responsibilities in accordance with the Code of Ethics. We believe that the audit evidence we have obtained is sufficient and appropriate to provide a basis for our opinion.
key Audit MattersKey audit matters are those matters that, in our professional judgment, were of most significance in our audit of the financial statements of the current period. These matters were addressed in the context of our audit of the financial statements as a whole, and in forming our opinion thereon, and we do not provide a separate opinion on these matters.
key audit matter How the matter was addressed in our audit
Fair valuation of fixed income securities
Refer Note 2.2 (II) to the financial statements Our audit procedures included the following:
• Fair valuation of debt securities is a subjective area with judgment applied in determining fair value.
• We understood, evaluated and tested the design and operating effectiveness of key controls around the fair valuation of debt securities
• Determination of fair valuation of securities is dependent on various factors including issuer specific factors, general factors, availability and quality of data.
• We tested valuation policy approved by the Trustees for its compliance with the Securities and Exchange Board of India (Mutual Funds) Regulations, 1996, as amended (the ‘Regulations’)
• Fair valuation of fixed income securities requires application of valuation principles prescribed by the SEBI Regulations.
• We checked the prices used by the Scheme to fair value the debt securities were in accordance with the valuation policy.
• We have identified fair valuation of fixed income securities as a key audit matter because of inherent subjectivity of estimates and judgement and its significance to the financial statements.
• We evaluated judgements and estimates used while determining the fair valuation of debt securities comprising of assumptions and relevance of data sources.
Independent Auditors’ Report

16
Abridged Annual Report 2020 - 2021
Independent Auditors’ Report (Contd...)
Other InformationThe management of HSBC Asset Management (India) Private Limited, is responsible for the other information. The other information comprises the information included in the Annual Report but does not include the financial statements and our auditor’s report thereon.
Our opinion on the financial statements does not cover the other information and we do not express any form of assurance conclusion thereon.
In connection with our audit of the financial statements, our responsibility is to read the other information and, in doing so, consider whether the other information is materially inconsistent with the financial statements or our knowledge obtained in the audit or otherwise appears to be materially misstated. If, based on the work we have performed, we conclude that there is a material misstatement of this other information, we are required to report that fact. We have nothing to report in this regard.
Responsibilities of Management and Those Charged with Governance for the Financial StatementsThe Scheme’s management, the Board of Directors of HSBC Mutual Fund (the ‘Trustees’) and the Board of Directors of HSBC Asset Management (India) Private Limited (the ‘AMC’) (collectively referred to as ‘Management’) are responsible for the preparation of these financial statements that give a true and fair view of the state of affairs, results of operations and cash flows of the Scheme in accordance with the accounting policies and standards specified in the Ninth Schedule of the Regulations and the accounting principles generally accepted in India. This responsibility includes design, implementation and maintenance of internal control relevant to the preparation and presentation of the financial statements that give a true and fair view and are free from material misstatement, whether due to fraud or error.
In preparing the financial statements, management is responsible for assessing the Scheme’s ability to continue as a going concern, disclosing, as applicable, matters related to going concern and using the going concern basis of accounting unless management either intends to liquidate the Scheme or to cease operations, or has no realistic alternative but to do so.
The management is responsible for overseeing the Scheme’s financial reporting process.
Auditor’s Responsibilities for the Audit of the Financial StatementsOur objectives are to obtain reasonable assurance about whether the financial statements as a whole are free from material misstatement, whether due to fraud or error, and to issue an auditor’s report that includes our opinion. Reasonable assurance is a high level of assurance, but is not a guarantee that an audit conducted in accordance with SAs will always detect a material misstatement when it exists. Misstatements can arise from fraud or error and are considered material if, individually or in the aggregate, they could reasonably be expected to influence the economic decisions of users taken on the basis of these financial statements.
As part of an audit in accordance with SAs, we exercise professional judgment and maintain professional skepticism throughout the audit. We also:
• Identify and assess the risks of material misstatement of the financial statements, whether due to fraud or error, design and perform audit procedures responsive to those risks, and obtain audit evidence that is sufficient and appropriate to provide a basis for our opinion. The risk of not detecting a material misstatement resulting from fraud is higher than for one resulting from error, as fraud may involve collusion, forgery, intentional omissions, misrepresentations, or the override of internal control;
• Obtain an understanding of internal control relevant to the audit in order to design audit procedures that are appropriate in the circumstances, but not for the purpose of expressing an opinion on the effectiveness of the Scheme’s internal controls;
• Evaluate the appropriateness of accounting policies used and the reasonableness of accounting estimates and related disclosures made by Management;
• Conclude on the appropriateness of Management’s use of the going concern basis of accounting and, based on the audit evidence obtained, whether a material uncertainty exists related to events or conditions

17
HSBC Fixed Term Series
Independent Auditors’ Report (Contd...)
that may cast significant doubt on the Scheme’s ability to continue as a going concern. If we conclude that a material uncertainty exists, we are required to draw attention in our auditor’s report to the related disclosures in the financial statements or, if such disclosures are inadequate, to modify our opinion. Our conclusions are based on the audit evidence obtained up to the date of our auditor’s report. However, future events or conditions may cause the Scheme to cease to continue as a going concern;
• Evaluate the overall presentation, structure and content of the financial statements, including the disclosures and whether the financial statements represent the underlying transactions and events in a manner that achieves fair presentation.
We communicate with those charged with governance regarding, among other matters, the planned scope and timing of the audit and significant audit findings, including any significant deficiencies in internal control that we identify during our audit.
We also provide those charged with governance with a statement that we have complied with relevant ethical requirements regarding independence, and to communicate with them all relationships and other matters that may reasonably be thought to bear on our independence, and where applicable, related safeguards.
Report on Other Legal and Regulatory Requirements 1 As required by Regulation 55 (4) of the Regulations, we report that:
(a) We have obtained all information and explanations which, to the best of our knowledge and belief, were necessary for the purposes of the audit; and
(b) The balance sheet and the revenue account have been prepared in accordance with the accounting policies and standards as specified in the Ninth Schedule of the Regulations.
2 As required by Clause 5 (ii) (2) of the Eleventh Schedule of the Regulations, we report that the balance sheet and the revenue account are in agreement with the books of account of the Scheme.
3 As required by the Eight Schedule of the Regulations, we report that, in our opinion and on the basis of information and explanations given to us, the methods used to value non - traded securities, as at 31 March 2021, as determined by the Board of Directors of the AMC, are in accordance with the Regulations and other guidelines issued by the Securities and Exchange Board of India as applicable and approved by the Board of Directors of the Trustee, are fair and reasonable.
For B S R & Co. LLP Chartered Accountants Firm’s Registration No: 101248W/W-100022
Sd/-
Ajit viswanath PartnerMembership No: 067114UDIN : 21067114AAAAEL1350
Place : Mumbai Date : July 20, 2021.
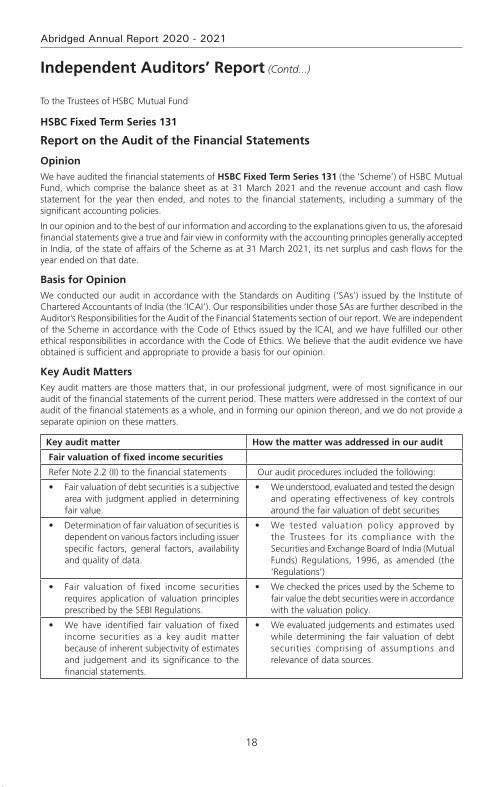
18
Abridged Annual Report 2020 - 2021
Independent Auditors’ Report (Contd...)
To the Trustees of HSBC Mutual Fund
HSBC Fixed Term Series 131
Report on the Audit of the Financial Statements
OpinionWe have audited the financial statements of HSBC Fixed Term Series 131 (the ‘Scheme’) of HSBC Mutual Fund, which comprise the balance sheet as at 31 March 2021 and the revenue account and cash flow statement for the year then ended, and notes to the financial statements, including a summary of the significant accounting policies.
In our opinion and to the best of our information and according to the explanations given to us, the aforesaid financial statements give a true and fair view in conformity with the accounting principles generally accepted in India, of the state of affairs of the Scheme as at 31 March 2021, its net surplus and cash flows for the year ended on that date.
Basis for OpinionWe conducted our audit in accordance with the Standards on Auditing (‘SAs’) issued by the Institute of Chartered Accountants of India (the ‘ICAI’). Our responsibilities under those SAs are further described in the Auditor’s Responsibilities for the Audit of the Financial Statements section of our report. We are independent of the Scheme in accordance with the Code of Ethics issued by the ICAI, and we have fulfilled our other ethical responsibilities in accordance with the Code of Ethics. We believe that the audit evidence we have obtained is sufficient and appropriate to provide a basis for our opinion.
key Audit MattersKey audit matters are those matters that, in our professional judgment, were of most significance in our audit of the financial statements of the current period. These matters were addressed in the context of our audit of the financial statements as a whole, and in forming our opinion thereon, and we do not provide a separate opinion on these matters.
key audit matter How the matter was addressed in our audit
Fair valuation of fixed income securities
Refer Note 2.2 (II) to the financial statements Our audit procedures included the following:
• Fair valuation of debt securities is a subjective area with judgment applied in determining fair value.
• We understood, evaluated and tested the design and operating effectiveness of key controls around the fair valuation of debt securities
• Determination of fair valuation of securities is dependent on various factors including issuer specific factors, general factors, availability and quality of data.
• We tested valuation policy approved by the Trustees for its compliance with the Securities and Exchange Board of India (Mutual Funds) Regulations, 1996, as amended (the ‘Regulations’)
• Fair valuation of fixed income securities requires application of valuation principles prescribed by the SEBI Regulations.
• We checked the prices used by the Scheme to fair value the debt securities were in accordance with the valuation policy.
• We have identified fair valuation of fixed income securities as a key audit matter because of inherent subjectivity of estimates and judgement and its significance to the financial statements.
• We evaluated judgements and estimates used while determining the fair valuation of debt securities comprising of assumptions and relevance of data sources.
19
HSBC Fixed Term Series
Independent Auditors’ Report (Contd...)
Other InformationThe management of HSBC Asset Management (India) Private Limited, is responsible for the other information. The other information comprises the information included in the Annual Report but does not include the financial statements and our auditor’s report thereon.
Our opinion on the financial statements does not cover the other information and we do not express any form of assurance conclusion thereon.
In connection with our audit of the financial statements, our responsibility is to read the other information and, in doing so, consider whether the other information is materially inconsistent with the financial statements or our knowledge obtained in the audit or otherwise appears to be materially misstated. If, based on the work we have performed, we conclude that there is a material misstatement of this other information, we are required to report that fact. We have nothing to report in this regard.
Responsibilities of Management and Those Charged with Governance for the Financial StatementsThe Scheme’s management, the Board of Directors of HSBC Mutual Fund (the ‘Trustees’) and the Board of Directors of HSBC Asset Management (India) Private Limited (the ‘AMC’) (collectively referred to as ‘Management’) are responsible for the preparation of these financial statements that give a true and fair view of the state of affairs, results of operations and cash flows of the Scheme in accordance with the accounting policies and standards specified in the Ninth Schedule of the Regulations and the accounting principles generally accepted in India. This responsibility includes design, implementation and maintenance of internal control relevant to the preparation and presentation of the financial statements that give a true and fair view and are free from material misstatement, whether due to fraud or error.
In preparing the financial statements, management is responsible for assessing the Scheme’s ability to continue as a going concern, disclosing, as applicable, matters related to going concern and using the going concern basis of accounting unless management either intends to liquidate the Scheme or to cease operations, or has no realistic alternative but to do so.
The management is responsible for overseeing the Scheme’s financial reporting process.
Auditor’s Responsibilities for the Audit of the Financial StatementsOur objectives are to obtain reasonable assurance about whether the financial statements as a whole are free from material misstatement, whether due to fraud or error, and to issue an auditor’s report that includes our opinion. Reasonable assurance is a high level of assurance, but is not a guarantee that an audit conducted in accordance with SAs will always detect a material misstatement when it exists. Misstatements can arise from fraud or error and are considered material if, individually or in the aggregate, they could reasonably be expected to influence the economic decisions of users taken on the basis of these financial statements.
As part of an audit in accordance with SAs, we exercise professional judgment and maintain professional skepticism throughout the audit. We also:
• Identify and assess the risks of material misstatement of the financial statements, whether due to fraud or error, design and perform audit procedures responsive to those risks, and obtain audit evidence that is sufficient and appropriate to provide a basis for our opinion. The risk of not detecting a material misstatement resulting from fraud is higher than for one resulting from error, as fraud may involve collusion, forgery, intentional omissions, misrepresentations, or the override of internal control;
• Obtain an understanding of internal control relevant to the audit in order to design audit procedures that are appropriate in the circumstances, but not for the purpose of expressing an opinion on the effectiveness of the Scheme’s internal controls;
• Evaluate the appropriateness of accounting policies used and the reasonableness of accounting estimates and related disclosures made by Management;
• Conclude on the appropriateness of Management’s use of the going concern basis of accounting and, based on the audit evidence obtained, whether a material uncertainty exists related to events or conditions that may cast significant doubt on the Scheme’s ability to continue as a going concern. If we conclude that a material uncertainty exists, we are required to draw attention in our auditor’s report to the related
20
Abridged Annual Report 2020 - 2021
Independent Auditors’ Report (Contd...)
disclosures in the financial statements or, if such disclosures are inadequate, to modify our opinion. Our conclusions are based on the audit evidence obtained up to the date of our auditor’s report. However, future events or conditions may cause the Scheme to cease to continue as a going concern;
• Evaluate the overall presentation, structure and content of the financial statements, including the disclosures and whether the financial statements represent the underlying transactions and events in a manner that achieves fair presentation.
We communicate with those charged with governance regarding, among other matters, the planned scope and timing of the audit and significant audit findings, including any significant deficiencies in internal control that we identify during our audit.
We also provide those charged with governance with a statement that we have complied with relevant ethical requirements regarding independence, and to communicate with them all relationships and other matters that may reasonably be thought to bear on our independence, and where applicable, related safeguards.
Report on Other Legal and Regulatory Requirements 1 As required by Regulation 55 (4) of the Regulations, we report that:
(a) We have obtained all information and explanations which, to the best of our knowledge and belief, were necessary for the purposes of the audit; and
(b) The balance sheet and the revenue account have been prepared in accordance with the accounting policies and standards as specified in the Ninth Schedule of the Regulations.
2 As required by Clause 5 (ii) (2) of the Eleventh Schedule of the Regulations, we report that the balance sheet and the revenue account are in agreement with the books of account of the Scheme.
3 As required by the Eight Schedule of the Regulations, we report that, in our opinion and on the basis of information and explanations given to us, the methods used to value non - traded securities, as at 31 March 2021, as determined by the Board of Directors of the AMC, are in accordance with the Regulations and other guidelines issued by the Securities and Exchange Board of India as applicable and approved by the Board of Directors of the Trustee, are fair and reasonable.
For B S R & Co. LLP Chartered Accountants Firm’s Registration No: 101248W/W-100022
Sd/-
Ajit viswanath PartnerMembership No: 067114UDIN : 21067114AAAAEA4076
Place : Mumbai Date : July 20, 2021.

21
HSBC Fixed Term Series
Independent Auditors’ Report (Contd...)
To the Trustees of HSBC Mutual Fund
HSBC Fixed Term Series 132
Report on the Audit of the Financial Statements
OpinionWe have audited the financial statements of HSBC Fixed Term Series 132 (the ‘Scheme’) of HSBC Mutual Fund, which comprise the balance sheet as at 31 March 2021 and the revenue account and cash flow statement for the year then ended, and notes to the financial statements, including a summary of the significant accounting policies.
In our opinion and to the best of our information and according to the explanations given to us, the aforesaid financial statements give a true and fair view in conformity with the accounting principles generally accepted in India, of the state of affairs of the Scheme as at 31 March 2021, its net surplus and cash flows for the year ended on that date.
Basis for OpinionWe conducted our audit in accordance with the Standards on Auditing (‘SAs’) issued by the Institute of Chartered Accountants of India (the ‘ICAI’). Our responsibilities under those SAs are further described in the Auditor’s Responsibilities for the Audit of the Financial Statements section of our report. We are independent of the Scheme in accordance with the Code of Ethics issued by the ICAI, and we have fulfilled our other ethical responsibilities in accordance with the Code of Ethics. We believe that the audit evidence we have obtained is sufficient and appropriate to provide a basis for our opinion.
key Audit MattersKey audit matters are those matters that, in our professional judgment, were of most significance in our audit of the financial statements of the current period. These matters were addressed in the context of our audit of the financial statements as a whole, and in forming our opinion thereon, and we do not provide a separate opinion on these matters.
key audit matter How the matter was addressed in our audit
Fair valuation of fixed income securities
Refer Note 2.2 (II) to the financial statements Our audit procedures included the following:
• Fair valuation of debt securities is a subjective area with judgment applied in determining fair value.
• We understood, evaluated and tested the design and operating effectiveness of key controls around the fair valuation of debt securities
• Determination of fair valuation of securities is dependent on various factors including issuer specific factors, general factors, availability and quality of data.
• We tested valuation policy approved by the Trustees for its compliance with the Securities and Exchange Board of India (Mutual Funds) Regulations, 1996, as amended (the ‘Regulations’)
• Fair valuation of fixed income securities requires application of valuation principles prescribed by the SEBI Regulations.
• We checked the prices used by the Scheme to fair value the debt securities were in accordance with the valuation policy.
• We have identified fair valuation of fixed income securities as a key audit matter because of inherent subjectivity of estimates and judgement and its significance to the financial statements.
• We evaluated judgements and estimates used while determining the fair valuation of debt securities comprising of assumptions and relevance of data sources.
22
Abridged Annual Report 2020 - 2021
Independent Auditors’ Report (Contd...)
Other InformationThe management of HSBC Asset Management (India) Private Limited, is responsible for the other information. The other information comprises the information included in the Annual Report but does not include the financial statements and our auditor’s report thereon.
Our opinion on the financial statements does not cover the other information and we do not express any form of assurance conclusion thereon.
In connection with our audit of the financial statements, our responsibility is to read the other information and, in doing so, consider whether the other information is materially inconsistent with the financial statements or our knowledge obtained in the audit or otherwise appears to be materially misstated. If, based on the work we have performed, we conclude that there is a material misstatement of this other information, we are required to report that fact. We have nothing to report in this regard.
Responsibilities of Management and Those Charged with Governance for the Financial StatementsThe Scheme’s management, the Board of Directors of HSBC Mutual Fund (the ‘Trustees’) and the Board of Directors of HSBC Asset Management (India) Private Limited (the ‘AMC’) (collectively referred to as ‘Management’) are responsible for the preparation of these financial statements that give a true and fair view of the state of affairs, results of operations and cash flows of the Scheme in accordance with the accounting policies and standards specified in the Ninth Schedule of the Regulations and the accounting principles generally accepted in India. This responsibility includes design, implementation and maintenance of internal control relevant to the preparation and presentation of the financial statements that give a true and fair view and are free from material misstatement, whether due to fraud or error.
In preparing the financial statements, management is responsible for assessing the Scheme’s ability to continue as a going concern, disclosing, as applicable, matters related to going concern and using the going concern basis of accounting unless management either intends to liquidate the Scheme or to cease operations, or has no realistic alternative but to do so.
The management is responsible for overseeing the Scheme’s financial reporting process.
Auditor’s Responsibilities for the Audit of the Financial StatementsOur objectives are to obtain reasonable assurance about whether the financial statements as a whole are free from material misstatement, whether due to fraud or error, and to issue an auditor’s report that includes our opinion. Reasonable assurance is a high level of assurance, but is not a guarantee that an audit conducted in accordance with SAs will always detect a material misstatement when it exists. Misstatements can arise from fraud or error and are considered material if, individually or in the aggregate, they could reasonably be expected to influence the economic decisions of users taken on the basis of these financial statements.
As part of an audit in accordance with SAs, we exercise professional judgment and maintain professional skepticism throughout the audit. We also:
• Identify and assess the risks of material misstatement of the financial statements, whether due to fraud or error, design and perform audit procedures responsive to those risks, and obtain audit evidence that is sufficient and appropriate to provide a basis for our opinion. The risk of not detecting a material misstatement resulting from fraud is higher than for one resulting from error, as fraud may involve collusion, forgery, intentional omissions, misrepresentations, or the override of internal control;
• Obtain an understanding of internal control relevant to the audit in order to design audit procedures that are appropriate in the circumstances, but not for the purpose of expressing an opinion on the effectiveness of the Scheme’s internal controls;
• Evaluate the appropriateness of accounting policies used and the reasonableness of accounting estimates and related disclosures made by Management;
• Conclude on the appropriateness of Management’s use of the going concern basis of accounting and, based on the audit evidence obtained, whether a material uncertainty exists related to events or conditions that may cast significant doubt on the Scheme’s ability to continue as a going concern. If we conclude
23
HSBC Fixed Term Series
Independent Auditors’ Report (Contd...)
that a material uncertainty exists, we are required to draw attention in our auditor’s report to the related disclosures in the financial statements or, if such disclosures are inadequate, to modify our opinion. Our conclusions are based on the audit evidence obtained up to the date of our auditor’s report. However, future events or conditions may cause the Scheme to cease to continue as a going concern;
• Evaluate the overall presentation, structure and content of the financial statements, including the disclosures and whether the financial statements represent the underlying transactions and events in a manner that achieves fair presentation.
We communicate with those charged with governance regarding, among other matters, the planned scope and timing of the audit and significant audit findings, including any significant deficiencies in internal control that we identify during our audit.
We also provide those charged with governance with a statement that we have complied with relevant ethical requirements regarding independence, and to communicate with them all relationships and other matters that may reasonably be thought to bear on our independence, and where applicable, related safeguards.
Report on Other Legal and Regulatory Requirements 1 As required by Regulation 55 (4) of the Regulations, we report that:
(a) We have obtained all information and explanations which, to the best of our knowledge and belief, were necessary for the purposes of the audit; and
(b) The balance sheet and the revenue account have been prepared in accordance with the accounting policies and standards as specified in the Ninth Schedule of the Regulations.
2 As required by Clause 5 (ii) (2) of the Eleventh Schedule of the Regulations, we report that the balance sheet and the revenue account are in agreement with the books of account of the Scheme.
3 As required by the Eight Schedule of the Regulations, we report that, in our opinion and on the basis of information and explanations given to us, the methods used to value non - traded securities, as at 31 March 2021, as determined by the Board of Directors of the AMC, are in accordance with the Regulations and other guidelines issued by the Securities and Exchange Board of India as applicable and approved by the Board of Directors of the Trustee, are fair and reasonable.
For B S R & Co. LLP Chartered Accountants Firm’s Registration No: 101248W/W-100022
Sd/-
Ajit viswanath PartnerMembership No: 067114UDIN : 21067114AAAAEB6527
Place : Mumbai Date : July 20, 2021.
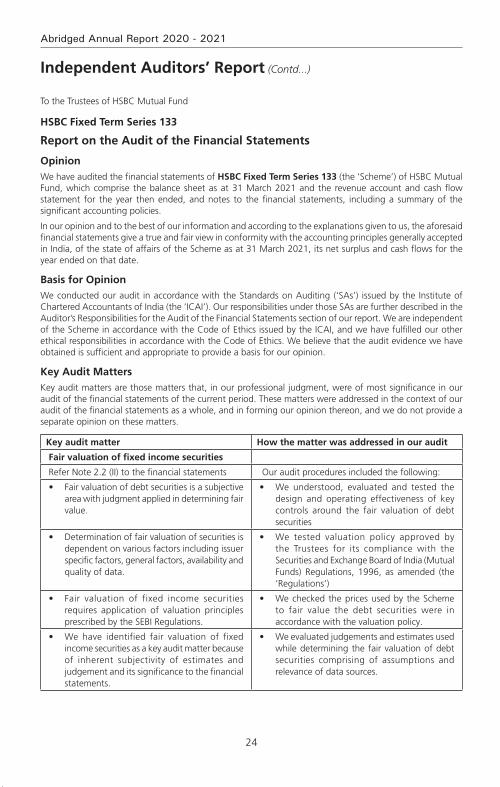
24
Abridged Annual Report 2020 - 2021
Independent Auditors’ Report (Contd...)
To the Trustees of HSBC Mutual Fund
HSBC Fixed Term Series 133
Report on the Audit of the Financial Statements
OpinionWe have audited the financial statements of HSBC Fixed Term Series 133 (the ‘Scheme’) of HSBC Mutual Fund, which comprise the balance sheet as at 31 March 2021 and the revenue account and cash flow statement for the year then ended, and notes to the financial statements, including a summary of the significant accounting policies.
In our opinion and to the best of our information and according to the explanations given to us, the aforesaid financial statements give a true and fair view in conformity with the accounting principles generally accepted in India, of the state of affairs of the Scheme as at 31 March 2021, its net surplus and cash flows for the year ended on that date.
Basis for OpinionWe conducted our audit in accordance with the Standards on Auditing (‘SAs’) issued by the Institute of Chartered Accountants of India (the ‘ICAI’). Our responsibilities under those SAs are further described in the Auditor’s Responsibilities for the Audit of the Financial Statements section of our report. We are independent of the Scheme in accordance with the Code of Ethics issued by the ICAI, and we have fulfilled our other ethical responsibilities in accordance with the Code of Ethics. We believe that the audit evidence we have obtained is sufficient and appropriate to provide a basis for our opinion.
key Audit MattersKey audit matters are those matters that, in our professional judgment, were of most significance in our audit of the financial statements of the current period. These matters were addressed in the context of our audit of the financial statements as a whole, and in forming our opinion thereon, and we do not provide a separate opinion on these matters.
key audit matter How the matter was addressed in our audit
Fair valuation of fixed income securities
Refer Note 2.2 (II) to the financial statements Our audit procedures included the following:
• Fair valuation of debt securities is a subjective area with judgment applied in determining fair value.
• We understood, evaluated and tested the design and operating effectiveness of key controls around the fair valuation of debt securities
• Determination of fair valuation of securities is dependent on various factors including issuer specific factors, general factors, availability and quality of data.
• We tested valuation policy approved by the Trustees for its compliance with the Securities and Exchange Board of India (Mutual Funds) Regulations, 1996, as amended (the ‘Regulations’)
• Fair valuation of fixed income securities requires application of valuation principles prescribed by the SEBI Regulations.
• We checked the prices used by the Scheme to fair value the debt securities were in accordance with the valuation policy.
• We have identified fair valuation of fixed income securities as a key audit matter because of inherent subjectivity of estimates and judgement and its significance to the financial statements.
• We evaluated judgements and estimates used while determining the fair valuation of debt securities comprising of assumptions and relevance of data sources.

25
HSBC Fixed Term Series
Independent Auditors’ Report (Contd...)
Other InformationThe management of HSBC Asset Management (India) Private Limited, is responsible for the other information. The other information comprises the information included in the Annual Report but does not include the financial statements and our auditor’s report thereon.
Our opinion on the financial statements does not cover the other information and we do not express any form of assurance conclusion thereon.
In connection with our audit of the financial statements, our responsibility is to read the other information and, in doing so, consider whether the other information is materially inconsistent with the financial statements or our knowledge obtained in the audit or otherwise appears to be materially misstated. If, based on the work we have performed, we conclude that there is a material misstatement of this other information, we are required to report that fact. We have nothing to report in this regard.
Responsibilities of Management and Those Charged with Governance for the Financial StatementsThe Scheme’s management, the Board of Directors of HSBC Mutual Fund (the ‘Trustees’) and the Board of Directors of HSBC Asset Management (India) Private Limited (the ‘AMC’) (collectively referred to as ‘Management’) are responsible for the preparation of these financial statements that give a true and fair view of the state of affairs, results of operations and cash flows of the Scheme in accordance with the accounting policies and standards specified in the Ninth Schedule of the Regulations and the accounting principles generally accepted in India. This responsibility includes design, implementation and maintenance of internal control relevant to the preparation and presentation of the financial statements that give a true and fair view and are free from material misstatement, whether due to fraud or error.
In preparing the financial statements, management is responsible for assessing the Scheme’s ability to continue as a going concern, disclosing, as applicable, matters related to going concern and using the going concern basis of accounting unless management either intends to liquidate the Scheme or to cease operations, or has no realistic alternative but to do so.
The management is responsible for overseeing the Scheme’s financial reporting process.
Auditor’s Responsibilities for the Audit of the Financial StatementsOur objectives are to obtain reasonable assurance about whether the financial statements as a whole are free from material misstatement, whether due to fraud or error, and to issue an auditor’s report that includes our opinion. Reasonable assurance is a high level of assurance, but is not a guarantee that an audit conducted in accordance with SAs will always detect a material misstatement when it exists. Misstatements can arise from fraud or error and are considered material if, individually or in the aggregate, they could reasonably be expected to influence the economic decisions of users taken on the basis of these financial statements.
As part of an audit in accordance with SAs, we exercise professional judgment and maintain professional skepticism throughout the audit. We also:
• Identify and assess the risks of material misstatement of the financial statements, whether due to fraud or error, design and perform audit procedures responsive to those risks, and obtain audit evidence that is sufficient and appropriate to provide a basis for our opinion. The risk of not detecting a material misstatement resulting from fraud is higher than for one resulting from error, as fraud may involve collusion, forgery, intentional omissions, misrepresentations, or the override of internal control;
• Obtain an understanding of internal control relevant to the audit in order to design audit procedures that are appropriate in the circumstances, but not for the purpose of expressing an opinion on the effectiveness of the Scheme’s internal controls;
• Evaluate the appropriateness of accounting policies used and the reasonableness of accounting estimates and related disclosures made by Management;
• Conclude on the appropriateness of Management’s use of the going concern basis of accounting and, based on the audit evidence obtained, whether a material uncertainty exists related to events or conditions

26
Abridged Annual Report 2020 - 2021
Independent Auditors’ Report (Contd...)
that may cast significant doubt on the Scheme’s ability to continue as a going concern. If we conclude that a material uncertainty exists, we are required to draw attention in our auditor’s report to the related disclosures in the financial statements or, if such disclosures are inadequate, to modify our opinion. Our conclusions are based on the audit evidence obtained up to the date of our auditor’s report. However, future events or conditions may cause the Scheme to cease to continue as a going concern;
• Evaluate the overall presentation, structure and content of the financial statements, including the disclosures and whether the financial statements represent the underlying transactions and events in a manner that achieves fair presentation.
We communicate with those charged with governance regarding, among other matters, the planned scope and timing of the audit and significant audit findings, including any significant deficiencies in internal control that we identify during our audit.
We also provide those charged with governance with a statement that we have complied with relevant ethical requirements regarding independence, and to communicate with them all relationships and other matters that may reasonably be thought to bear on our independence, and where applicable, related safeguards.
Report on Other Legal and Regulatory Requirements 1 As required by Regulation 55 (4) of the Regulations, we report that:
(a) We have obtained all information and explanations which, to the best of our knowledge and belief, were necessary for the purposes of the audit; and
(b) The balance sheet and the revenue account have been prepared in accordance with the accounting policies and standards as specified in the Ninth Schedule of the Regulations.
2 As required by Clause 5 (ii) (2) of the Eleventh Schedule of the Regulations, we report that the balance sheet and the revenue account are in agreement with the books of account of the Scheme.
3 As required by the Eight Schedule of the Regulations, we report that, in our opinion and on the basis of information and explanations given to us, the methods used to value non - traded securities, as at 31 March 2021, as determined by the Board of Directors of the AMC, are in accordance with the Regulations and other guidelines issued by the Securities and Exchange Board of India as applicable and approved by the Board of Directors of the Trustee, are fair and reasonable.
For B S R & Co. LLP Chartered Accountants Firm’s Registration No: 101248W/W-100022
Sd/-
Ajit viswanath PartnerMembership No: 067114UDIN : 21067114AAAAEC6160
Place : Mumbai Date : July 20, 2021.
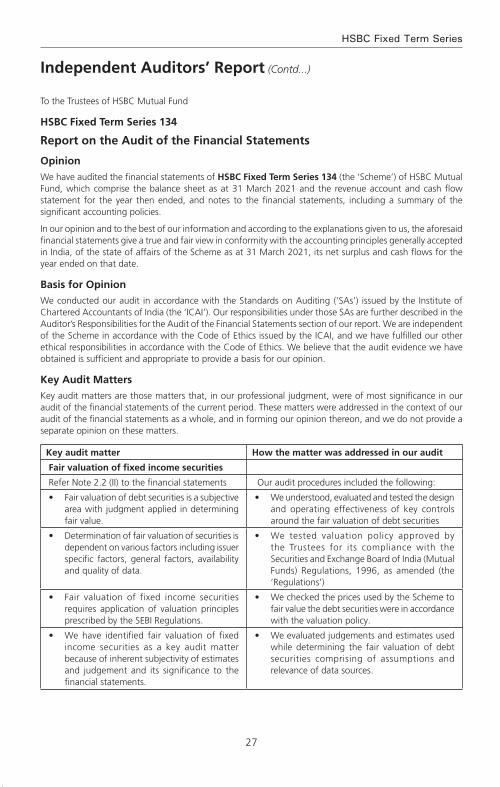
27
HSBC Fixed Term Series
Independent Auditors’ Report (Contd...)
To the Trustees of HSBC Mutual Fund
HSBC Fixed Term Series 134
Report on the Audit of the Financial Statements
OpinionWe have audited the financial statements of HSBC Fixed Term Series 134 (the ‘Scheme’) of HSBC Mutual Fund, which comprise the balance sheet as at 31 March 2021 and the revenue account and cash flow statement for the year then ended, and notes to the financial statements, including a summary of the significant accounting policies.
In our opinion and to the best of our information and according to the explanations given to us, the aforesaid financial statements give a true and fair view in conformity with the accounting principles generally accepted in India, of the state of affairs of the Scheme as at 31 March 2021, its net surplus and cash flows for the year ended on that date.
Basis for OpinionWe conducted our audit in accordance with the Standards on Auditing (‘SAs’) issued by the Institute of Chartered Accountants of India (the ‘ICAI’). Our responsibilities under those SAs are further described in the Auditor’s Responsibilities for the Audit of the Financial Statements section of our report. We are independent of the Scheme in accordance with the Code of Ethics issued by the ICAI, and we have fulfilled our other ethical responsibilities in accordance with the Code of Ethics. We believe that the audit evidence we have obtained is sufficient and appropriate to provide a basis for our opinion.
key Audit MattersKey audit matters are those matters that, in our professional judgment, were of most significance in our audit of the financial statements of the current period. These matters were addressed in the context of our audit of the financial statements as a whole, and in forming our opinion thereon, and we do not provide a separate opinion on these matters.
key audit matter How the matter was addressed in our audit
Fair valuation of fixed income securities
Refer Note 2.2 (II) to the financial statements Our audit procedures included the following:
• Fair valuation of debt securities is a subjective area with judgment applied in determining fair value.
• We understood, evaluated and tested the design and operating effectiveness of key controls around the fair valuation of debt securities
• Determination of fair valuation of securities is dependent on various factors including issuer specific factors, general factors, availability and quality of data.
• We tested valuation policy approved by the Trustees for its compliance with the Securities and Exchange Board of India (Mutual Funds) Regulations, 1996, as amended (the ‘Regulations’)
• Fair valuation of fixed income securities requires application of valuation principles prescribed by the SEBI Regulations.
• We checked the prices used by the Scheme to fair value the debt securities were in accordance with the valuation policy.
• We have identified fair valuation of fixed income securities as a key audit matter because of inherent subjectivity of estimates and judgement and its significance to the financial statements.
• We evaluated judgements and estimates used while determining the fair valuation of debt securities comprising of assumptions and relevance of data sources.

28
Abridged Annual Report 2020 - 2021
Independent Auditors’ Report (Contd...)
Other InformationThe management of HSBC Asset Management (India) Private Limited, is responsible for the other information. The other information comprises the information included in the Annual Report but does not include the financial statements and our auditor’s report thereon.
Our opinion on the financial statements does not cover the other information and we do not express any form of assurance conclusion thereon.
In connection with our audit of the financial statements, our responsibility is to read the other information and, in doing so, consider whether the other information is materially inconsistent with the financial statements or our knowledge obtained in the audit or otherwise appears to be materially misstated. If, based on the work we have performed, we conclude that there is a material misstatement of this other information, we are required to report that fact. We have nothing to report in this regard.
Responsibilities of Management and Those Charged with Governance for the Financial StatementsThe Scheme’s management, the Board of Directors of HSBC Mutual Fund (the ‘Trustees’) and the Board of Directors of HSBC Asset Management (India) Private Limited (the ‘AMC’) (collectively referred to as ‘Management’) are responsible for the preparation of these financial statements that give a true and fair view of the state of affairs, results of operations and cash flows of the Scheme in accordance with the accounting policies and standards specified in the Ninth Schedule of the Regulations and the accounting principles generally accepted in India. This responsibility includes design, implementation and maintenance of internal control relevant to the preparation and presentation of the financial statements that give a true and fair view and are free from material misstatement, whether due to fraud or error.
In preparing the financial statements, management is responsible for assessing the Scheme’s ability to continue as a going concern, disclosing, as applicable, matters related to going concern and using the going concern basis of accounting unless management either intends to liquidate the Scheme or to cease operations, or has no realistic alternative but to do so.
The management is responsible for overseeing the Scheme’s financial reporting process.
Auditor’s Responsibilities for the Audit of the Financial StatementsOur objectives are to obtain reasonable assurance about whether the financial statements as a whole are free from material misstatement, whether due to fraud or error, and to issue an auditor’s report that includes our opinion. Reasonable assurance is a high level of assurance, but is not a guarantee that an audit conducted in accordance with SAs will always detect a material misstatement when it exists. Misstatements can arise from fraud or error and are considered material if, individually or in the aggregate, they could reasonably be expected to influence the economic decisions of users taken on the basis of these financial statements.
As part of an audit in accordance with SAs, we exercise professional judgment and maintain professional skepticism throughout the audit. We also:
• Identify and assess the risks of material misstatement of the financial statements, whether due to fraud or error, design and perform audit procedures responsive to those risks, and obtain audit evidence that is sufficient and appropriate to provide a basis for our opinion. The risk of not detecting a material misstatement resulting from fraud is higher than for one resulting from error, as fraud may involve collusion, forgery, intentional omissions, misrepresentations, or the override of internal control;
• Obtain an understanding of internal control relevant to the audit in order to design audit procedures that are appropriate in the circumstances, but not for the purpose of expressing an opinion on the effectiveness of the Scheme’s internal controls;
• Evaluate the appropriateness of accounting policies used and the reasonableness of accounting estimates and related disclosures made by Management;
• Conclude on the appropriateness of Management’s use of the going concern basis of accounting and, based on the audit evidence obtained, whether a material uncertainty exists related to events or conditions
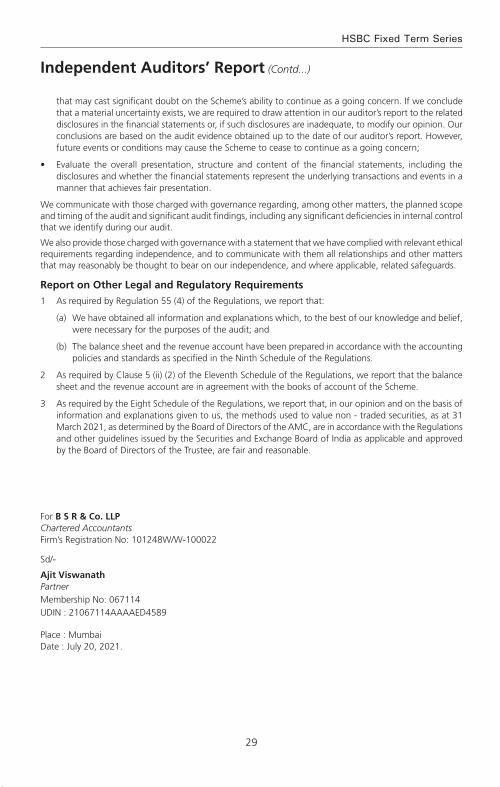
29
HSBC Fixed Term Series
Independent Auditors’ Report (Contd...)
that may cast significant doubt on the Scheme’s ability to continue as a going concern. If we conclude that a material uncertainty exists, we are required to draw attention in our auditor’s report to the related disclosures in the financial statements or, if such disclosures are inadequate, to modify our opinion. Our conclusions are based on the audit evidence obtained up to the date of our auditor’s report. However, future events or conditions may cause the Scheme to cease to continue as a going concern;
• Evaluate the overall presentation, structure and content of the financial statements, including the disclosures and whether the financial statements represent the underlying transactions and events in a manner that achieves fair presentation.
We communicate with those charged with governance regarding, among other matters, the planned scope and timing of the audit and significant audit findings, including any significant deficiencies in internal control that we identify during our audit.
We also provide those charged with governance with a statement that we have complied with relevant ethical requirements regarding independence, and to communicate with them all relationships and other matters that may reasonably be thought to bear on our independence, and where applicable, related safeguards.
Report on Other Legal and Regulatory Requirements 1 As required by Regulation 55 (4) of the Regulations, we report that:
(a) We have obtained all information and explanations which, to the best of our knowledge and belief, were necessary for the purposes of the audit; and
(b) The balance sheet and the revenue account have been prepared in accordance with the accounting policies and standards as specified in the Ninth Schedule of the Regulations.
2 As required by Clause 5 (ii) (2) of the Eleventh Schedule of the Regulations, we report that the balance sheet and the revenue account are in agreement with the books of account of the Scheme.
3 As required by the Eight Schedule of the Regulations, we report that, in our opinion and on the basis of information and explanations given to us, the methods used to value non - traded securities, as at 31 March 2021, as determined by the Board of Directors of the AMC, are in accordance with the Regulations and other guidelines issued by the Securities and Exchange Board of India as applicable and approved by the Board of Directors of the Trustee, are fair and reasonable.
For B S R & Co. LLP Chartered Accountants Firm’s Registration No: 101248W/W-100022
Sd/-
Ajit viswanath PartnerMembership No: 067114UDIN : 21067114AAAAED4589
Place : Mumbai Date : July 20, 2021.
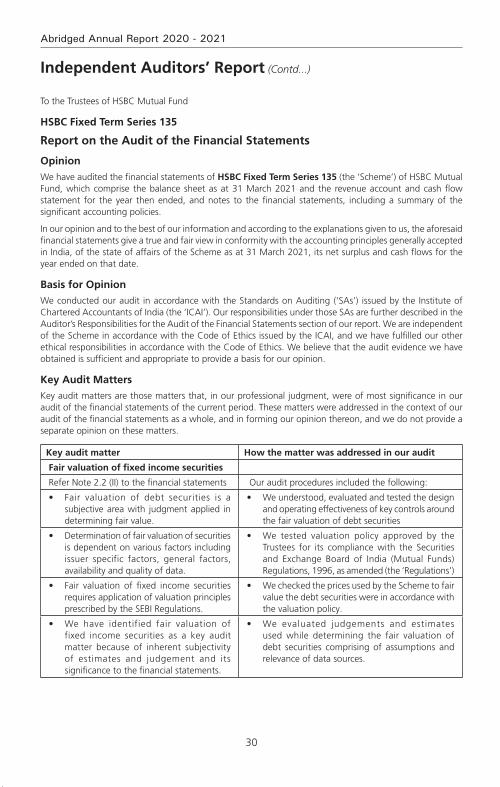
30
Abridged Annual Report 2020 - 2021
Independent Auditors’ Report (Contd...)
To the Trustees of HSBC Mutual Fund
HSBC Fixed Term Series 135
Report on the Audit of the Financial Statements
OpinionWe have audited the financial statements of HSBC Fixed Term Series 135 (the ‘Scheme’) of HSBC Mutual Fund, which comprise the balance sheet as at 31 March 2021 and the revenue account and cash flow statement for the year then ended, and notes to the financial statements, including a summary of the significant accounting policies.
In our opinion and to the best of our information and according to the explanations given to us, the aforesaid financial statements give a true and fair view in conformity with the accounting principles generally accepted in India, of the state of affairs of the Scheme as at 31 March 2021, its net surplus and cash flows for the year ended on that date.
Basis for OpinionWe conducted our audit in accordance with the Standards on Auditing (‘SAs’) issued by the Institute of Chartered Accountants of India (the ‘ICAI’). Our responsibilities under those SAs are further described in the Auditor’s Responsibilities for the Audit of the Financial Statements section of our report. We are independent of the Scheme in accordance with the Code of Ethics issued by the ICAI, and we have fulfilled our other ethical responsibilities in accordance with the Code of Ethics. We believe that the audit evidence we have obtained is sufficient and appropriate to provide a basis for our opinion.
key Audit MattersKey audit matters are those matters that, in our professional judgment, were of most significance in our audit of the financial statements of the current period. These matters were addressed in the context of our audit of the financial statements as a whole, and in forming our opinion thereon, and we do not provide a separate opinion on these matters.
key audit matter How the matter was addressed in our audit
Fair valuation of fixed income securities
Refer Note 2.2 (II) to the financial statements Our audit procedures included the following:
• Fair valuation of debt securities is a subjective area with judgment applied in determining fair value.
• We understood, evaluated and tested the design and operating effectiveness of key controls around the fair valuation of debt securities
• Determination of fair valuation of securities is dependent on various factors including issuer specific factors, general factors, availability and quality of data.
• We tested valuation policy approved by the Trustees for its compliance with the Securities and Exchange Board of India (Mutual Funds) Regulations, 1996, as amended (the ‘Regulations’)
• Fair valuation of fixed income securities requires application of valuation principles prescribed by the SEBI Regulations.
• We checked the prices used by the Scheme to fair value the debt securities were in accordance with the valuation policy.
• We have identified fair valuation of fixed income securities as a key audit matter because of inherent subjectivity of estimates and judgement and its significance to the financial statements.
• We evaluated judgements and estimates used while determining the fair valuation of debt securities comprising of assumptions and relevance of data sources.

31
HSBC Fixed Term Series
Independent Auditors’ Report (Contd...)
Other InformationThe management of HSBC Asset Management (India) Private Limited, is responsible for the other information. The other information comprises the information included in the Annual Report but does not include the financial statements and our auditor’s report thereon.
Our opinion on the financial statements does not cover the other information and we do not express any form of assurance conclusion thereon.
In connection with our audit of the financial statements, our responsibility is to read the other information and, in doing so, consider whether the other information is materially inconsistent with the financial statements or our knowledge obtained in the audit or otherwise appears to be materially misstated. If, based on the work we have performed, we conclude that there is a material misstatement of this other information, we are required to report that fact. We have nothing to report in this regard.
Responsibilities of Management and Those Charged with Governance for the Financial StatementsThe Scheme’s management, the Board of Directors of HSBC Mutual Fund (the ‘Trustees’) and the Board of Directors of HSBC Asset Management (India) Private Limited (the ‘AMC’) (collectively referred to as ‘Management’) are responsible for the preparation of these financial statements that give a true and fair view of the state of affairs, results of operations and cash flows of the Scheme in accordance with the accounting policies and standards specified in the Ninth Schedule of the Regulations and the accounting principles generally accepted in India. This responsibility includes design, implementation and maintenance of internal control relevant to the preparation and presentation of the financial statements that give a true and fair view and are free from material misstatement, whether due to fraud or error.
In preparing the financial statements, management is responsible for assessing the Scheme’s ability to continue as a going concern, disclosing, as applicable, matters related to going concern and using the going concern basis of accounting unless management either intends to liquidate the Scheme or to cease operations, or has no realistic alternative but to do so.
The management is responsible for overseeing the Scheme’s financial reporting process.
Auditor’s Responsibilities for the Audit of the Financial StatementsOur objectives are to obtain reasonable assurance about whether the financial statements as a whole are free from material misstatement, whether due to fraud or error, and to issue an auditor’s report that includes our opinion. Reasonable assurance is a high level of assurance, but is not a guarantee that an audit conducted in accordance with SAs will always detect a material misstatement when it exists. Misstatements can arise from fraud or error and are considered material if, individually or in the aggregate, they could reasonably be expected to influence the economic decisions of users taken on the basis of these financial statements.
As part of an audit in accordance with SAs, we exercise professional judgment and maintain professional skepticism throughout the audit. We also:
• Identify and assess the risks of material misstatement of the financial statements, whether due to fraud or error, design and perform audit procedures responsive to those risks, and obtain audit evidence that is sufficient and appropriate to provide a basis for our opinion. The risk of not detecting a material misstatement resulting from fraud is higher than for one resulting from error, as fraud may involve collusion, forgery, intentional omissions, misrepresentations, or the override of internal control;
• Obtain an understanding of internal control relevant to the audit in order to design audit procedures that are appropriate in the circumstances, but not for the purpose of expressing an opinion on the effectiveness of the Scheme’s internal controls;
• Evaluate the appropriateness of accounting policies used and the reasonableness of accounting estimates and related disclosures made by Management;
• Conclude on the appropriateness of Management’s use of the going concern basis of accounting and, based on the audit evidence obtained, whether a material uncertainty exists related to events or conditions

32
Abridged Annual Report 2020 - 2021
that may cast significant doubt on the Scheme’s ability to continue as a going concern. If we conclude that a material uncertainty exists, we are required to draw attention in our auditor’s report to the related disclosures in the financial statements or, if such disclosures are inadequate, to modify our opinion. Our conclusions are based on the audit evidence obtained up to the date of our auditor’s report. However, future events or conditions may cause the Scheme to cease to continue as a going concern;
• Evaluate the overall presentation, structure and content of the financial statements, including the disclosures and whether the financial statements represent the underlying transactions and events in a manner that achieves fair presentation.
We communicate with those charged with governance regarding, among other matters, the planned scope and timing of the audit and significant audit findings, including any significant deficiencies in internal control that we identify during our audit.
We also provide those charged with governance with a statement that we have complied with relevant ethical requirements regarding independence, and to communicate with them all relationships and other matters that may reasonably be thought to bear on our independence, and where applicable, related safeguards.
Report on Other Legal and Regulatory Requirements 1 As required by Regulation 55 (4) of the Regulations, we report that:
(a) We have obtained all information and explanations which, to the best of our knowledge and belief, were necessary for the purposes of the audit; and
(b) The balance sheet and the revenue account have been prepared in accordance with the accounting policies and standards as specified in the Ninth Schedule of the Regulations.
2 As required by Clause 5 (ii) (2) of the Eleventh Schedule of the Regulations, we report that the balance sheet and the revenue account are in agreement with the books of account of the Scheme.
3 As required by the Eight Schedule of the Regulations, we report that, in our opinion and on the basis of information and explanations given to us, the methods used to value non - traded securities, as at 31 March 2021, as determined by the Board of Directors of the AMC, are in accordance with the Regulations and other guidelines issued by the Securities and Exchange Board of India as applicable and approved by the Board of Directors of the Trustee, are fair and reasonable.
For B S R & Co. LLP Chartered Accountants Firm’s Registration No: 101248W/W-100022
Sd/-
Ajit viswanath PartnerMembership No: 067114UDIN : 21067114AAAAEE9340
Place : Mumbai Date : July 20, 2021.
Independent Auditors’ Report (Contd...)

33
HSBC Fixed Term Series
To the Trustees of HSBC Mutual Fund
HSBC Fixed Term Series 136
Report on the Audit of the Financial Statements
OpinionWe have audited the financial statements of HSBC Fixed Term Series 136 (the ‘Scheme’) of HSBC Mutual Fund, which comprise the balance sheet as at 31 March 2021 and the revenue account and cash flow statement for the year then ended, and notes to the financial statements, including a summary of the significant accounting policies.
In our opinion and to the best of our information and according to the explanations given to us, the aforesaid financial statements give a true and fair view in conformity with the accounting principles generally accepted in India, of the state of affairs of the Scheme as at 31 March 2021, its net surplus and cash flows for the year ended on that date.
Basis for OpinionWe conducted our audit in accordance with the Standards on Auditing (‘SAs’) issued by the Institute of Chartered Accountants of India (the ‘ICAI’). Our responsibilities under those SAs are further described in the Auditor’s Responsibilities for the Audit of the Financial Statements section of our report. We are independent of the Scheme in accordance with the Code of Ethics issued by the ICAI, and we have fulfilled our other ethical responsibilities in accordance with the Code of Ethics. We believe that the audit evidence we have obtained is sufficient and appropriate to provide a basis for our opinion.
key Audit MattersKey audit matters are those matters that, in our professional judgment, were of most significance in our audit of the financial statements of the current period. These matters were addressed in the context of our audit of the financial statements as a whole, and in forming our opinion thereon, and we do not provide a separate opinion on these matters.
key audit matter How the matter was addressed in our audit
Fair valuation of fixed income securities
Refer Note 2.2 (II) to the financial statements Our audit procedures included the following:
• Fair valuation of debt securities is a subjective area with judgment applied in determining fair value.
• We understood, evaluated and tested the design and operating effectiveness of key controls around the fair valuation of debt securities
• Determination of fair valuation of securities is dependent on various factors including issuer specific factors, general factors, availability and quality of data.
• We tested valuation policy approved by the Trustees for its compliance with the Securities and Exchange Board of India (Mutual Funds) Regulations, 1996, as amended (the ‘Regulations’)
• Fair valuation of fixed income securities requires application of valuation principles prescribed by the SEBI Regulations.
• We checked the prices used by the Scheme to fair value the debt securities were in accordance with the valuation policy.
• We have identified fair valuation of fixed income securities as a key audit matter because of inherent subjectivity of estimates and judgement and its significance to the financial statements.
• We evaluated judgements and estimates used while determining the fair valuation of debt securities comprising of assumptions and relevance of data sources.
Independent Auditors’ Report (Contd...)

34
Abridged Annual Report 2020 - 2021
Other InformationThe management of HSBC Asset Management (India) Private Limited, is responsible for the other information. The other information comprises the information included in the Annual Report but does not include the financial statements and our auditor’s report thereon.
Our opinion on the financial statements does not cover the other information and we do not express any form of assurance conclusion thereon.
In connection with our audit of the financial statements, our responsibility is to read the other information and, in doing so, consider whether the other information is materially inconsistent with the financial statements or our knowledge obtained in the audit or otherwise appears to be materially misstated. If, based on the work we have performed, we conclude that there is a material misstatement of this other information, we are required to report that fact. We have nothing to report in this regard.
Responsibilities of Management and Those Charged with Governance for the Financial StatementsThe Scheme’s management, the Board of Directors of HSBC Mutual Fund (the ‘Trustees’) and the Board of Directors of HSBC Asset Management (India) Private Limited (the ‘AMC’) (collectively referred to as ‘Management’) are responsible for the preparation of these financial statements that give a true and fair view of the state of affairs, results of operations and cash flows of the Scheme in accordance with the accounting policies and standards specified in the Ninth Schedule of the Regulations and the accounting principles generally accepted in India. This responsibility includes design, implementation and maintenance of internal control relevant to the preparation and presentation of the financial statements that give a true and fair view and are free from material misstatement, whether due to fraud or error.
In preparing the financial statements, management is responsible for assessing the Scheme’s ability to continue as a going concern, disclosing, as applicable, matters related to going concern and using the going concern basis of accounting unless management either intends to liquidate the Scheme or to cease operations, or has no realistic alternative but to do so.
The management is responsible for overseeing the Scheme’s financial reporting process.
Auditor’s Responsibilities for the Audit of the Financial StatementsOur objectives are to obtain reasonable assurance about whether the financial statements as a whole are free from material misstatement, whether due to fraud or error, and to issue an auditor’s report that includes our opinion. Reasonable assurance is a high level of assurance, but is not a guarantee that an audit conducted in accordance with SAs will always detect a material misstatement when it exists. Misstatements can arise from fraud or error and are considered material if, individually or in the aggregate, they could reasonably be expected to influence the economic decisions of users taken on the basis of these financial statements.
As part of an audit in accordance with SAs, we exercise professional judgment and maintain professional skepticism throughout the audit. We also:
• Identify and assess the risks of material misstatement of the financial statements, whether due to fraud or error, design and perform audit procedures responsive to those risks, and obtain audit evidence that is sufficient and appropriate to provide a basis for our opinion. The risk of not detecting a material misstatement resulting from fraud is higher than for one resulting from error, as fraud may involve collusion, forgery, intentional omissions, misrepresentations, or the override of internal control;
• Obtain an understanding of internal control relevant to the audit in order to design audit procedures that are appropriate in the circumstances, but not for the purpose of expressing an opinion on the effectiveness of the Scheme’s internal controls;
• Evaluate the appropriateness of accounting policies used and the reasonableness of accounting estimates and related disclosures made by Management;
• Conclude on the appropriateness of Management’s use of the going concern basis of accounting and, based on the audit evidence obtained, whether a material uncertainty exists related to events or conditions
Independent Auditors’ Report (Contd...)

35
HSBC Fixed Term Series
that may cast significant doubt on the Scheme’s ability to continue as a going concern. If we conclude that a material uncertainty exists, we are required to draw attention in our auditor’s report to the related disclosures in the financial statements or, if such disclosures are inadequate, to modify our opinion. Our conclusions are based on the audit evidence obtained up to the date of our auditor’s report. However, future events or conditions may cause the Scheme to cease to continue as a going concern;
• Evaluate the overall presentation, structure and content of the financial statements, including the disclosures and whether the financial statements represent the underlying transactions and events in a manner that achieves fair presentation.
We communicate with those charged with governance regarding, among other matters, the planned scope and timing of the audit and significant audit findings, including any significant deficiencies in internal control that we identify during our audit.
We also provide those charged with governance with a statement that we have complied with relevant ethical requirements regarding independence, and to communicate with them all relationships and other matters that may reasonably be thought to bear on our independence, and where applicable, related safeguards.
Report on Other Legal and Regulatory Requirements 1 As required by Regulation 55 (4) of the Regulations, we report that:
(a) We have obtained all information and explanations which, to the best of our knowledge and belief, were necessary for the purposes of the audit; and
(b) The balance sheet and the revenue account have been prepared in accordance with the accounting policies and standards as specified in the Ninth Schedule of the Regulations.
2 As required by Clause 5 (ii) (2) of the Eleventh Schedule of the Regulations, we report that the balance sheet and the revenue account are in agreement with the books of account of the Scheme.
3 As required by the Eight Schedule of the Regulations, we report that, in our opinion and on the basis of information and explanations given to us, the methods used to value non - traded securities, as at 31 March 2021, as determined by the Board of Directors of the AMC, are in accordance with the Regulations and other guidelines issued by the Securities and Exchange Board of India as applicable and approved by the Board of Directors of the Trustee, are fair and reasonable.
For B S R & Co. LLP Chartered Accountants Firm’s Registration No: 101248W/W-100022
Sd/-
Ajit viswanath PartnerMembership No: 067114UDIN : 21067114AAAAEF6612
Place : Mumbai Date : July 20, 2021.
Independent Auditors’ Report (Contd...)

36
Abridged Annual Report 2020 - 2021
To the Trustees of HSBC Mutual Fund
HSBC Fixed Term Series 137
Report on the Audit of the Financial Statements
OpinionWe have audited the financial statements of HSBC Fixed Term Series 137 (the ‘Scheme’) of HSBC Mutual Fund, which comprise the balance sheet as at 31 March 2021 and the revenue account and cash flow statement for the year then ended, and notes to the financial statements, including a summary of the significant accounting policies.
In our opinion and to the best of our information and according to the explanations given to us, the aforesaid financial statements give a true and fair view in conformity with the accounting principles generally accepted in India, of the state of affairs of the Scheme as at 31 March 2021, its net surplus and cash flows for the year ended on that date.
Basis for OpinionWe conducted our audit in accordance with the Standards on Auditing (‘SAs’) issued by the Institute of Chartered Accountants of India (the ‘ICAI’). Our responsibilities under those SAs are further described in the Auditor’s Responsibilities for the Audit of the Financial Statements section of our report. We are independent of the Scheme in accordance with the Code of Ethics issued by the ICAI, and we have fulfilled our other ethical responsibilities in accordance with the Code of Ethics. We believe that the audit evidence we have obtained is sufficient and appropriate to provide a basis for our opinion.
key Audit MattersKey audit matters are those matters that, in our professional judgment, were of most significance in our audit of the financial statements of the current period. These matters were addressed in the context of our audit of the financial statements as a whole, and in forming our opinion thereon, and we do not provide a separate opinion on these matters.
key audit matter How the matter was addressed in our audit
Fair valuation of fixed income securities
Refer Note 2.2 (II) to the financial statements Our audit procedures included the following:
• Fair valuation of debt securities is a subjective area with judgment applied in determining fair value.
• We understood, evaluated and tested the design and operating effectiveness of key controls around the fair valuation of debt securities
• Determination of fair valuation of securities is dependent on various factors including issuer specific factors, general factors, availability and quality of data.
• We tested valuation policy approved by the Trustees for its compliance with the Securities and Exchange Board of India (Mutual Funds) Regulations, 1996, as amended (the ‘Regulations’)
• Fair valuation of fixed income securities requires application of valuation principles prescribed by the SEBI Regulations.
• We checked the prices used by the Scheme to fair value the debt securities were in accordance with the valuation policy.
• We have identified fair valuation of fixed income securities as a key audit matter because of inherent subjectivity of estimates and judgement and its significance to the financial statements.
• We evaluated judgements and estimates used while determining the fair valuation of debt securities comprising of assumptions and relevance of data sources.
Independent Auditors’ Report (Contd...)

37
HSBC Fixed Term Series
Other InformationThe management of HSBC Asset Management (India) Private Limited, is responsible for the other information. The other information comprises the information included in the Annual Report but does not include the financial statements and our auditor’s report thereon.
Our opinion on the financial statements does not cover the other information and we do not express any form of assurance conclusion thereon.
In connection with our audit of the financial statements, our responsibility is to read the other information and, in doing so, consider whether the other information is materially inconsistent with the financial statements or our knowledge obtained in the audit or otherwise appears to be materially misstated. If, based on the work we have performed, we conclude that there is a material misstatement of this other information, we are required to report that fact. We have nothing to report in this regard.
Responsibilities of Management and Those Charged with Governance for the Financial StatementsThe Scheme’s management, the Board of Directors of HSBC Mutual Fund (the ‘Trustees’) and the Board of Directors of HSBC Asset Management (India) Private Limited (the ‘AMC’) (collectively referred to as ‘Management’) are responsible for the preparation of these financial statements that give a true and fair view of the state of affairs, results of operations and cash flows of the Scheme in accordance with the accounting policies and standards specified in the Ninth Schedule of the Regulations and the accounting principles generally accepted in India. This responsibility includes design, implementation and maintenance of internal control relevant to the preparation and presentation of the financial statements that give a true and fair view and are free from material misstatement, whether due to fraud or error.
In preparing the financial statements, management is responsible for assessing the Scheme’s ability to continue as a going concern, disclosing, as applicable, matters related to going concern and using the going concern basis of accounting unless management either intends to liquidate the Scheme or to cease operations, or has no realistic alternative but to do so.
The management is responsible for overseeing the Scheme’s financial reporting process.
Auditor’s Responsibilities for the Audit of the Financial StatementsOur objectives are to obtain reasonable assurance about whether the financial statements as a whole are free from material misstatement, whether due to fraud or error, and to issue an auditor’s report that includes our opinion. Reasonable assurance is a high level of assurance, but is not a guarantee that an audit conducted in accordance with SAs will always detect a material misstatement when it exists. Misstatements can arise from fraud or error and are considered material if, individually or in the aggregate, they could reasonably be expected to influence the economic decisions of users taken on the basis of these financial statements.
As part of an audit in accordance with SAs, we exercise professional judgment and maintain professional skepticism throughout the audit. We also:
• Identify and assess the risks of material misstatement of the financial statements, whether due to fraud or error, design and perform audit procedures responsive to those risks, and obtain audit evidence that is sufficient and appropriate to provide a basis for our opinion. The risk of not detecting a material misstatement resulting from fraud is higher than for one resulting from error, as fraud may involve collusion, forgery, intentional omissions, misrepresentations, or the override of internal control;
• Obtain an understanding of internal control relevant to the audit in order to design audit procedures that are appropriate in the circumstances, but not for the purpose of expressing an opinion on the effectiveness of the Scheme’s internal controls;
• Evaluate the appropriateness of accounting policies used and the reasonableness of accounting estimates and related disclosures made by Management;
• Conclude on the appropriateness of Management’s use of the going concern basis of accounting and, based on the audit evidence obtained, whether a material uncertainty exists related to events or conditions
Independent Auditors’ Report (Contd...)
38
Abridged Annual Report 2020 - 2021
that may cast significant doubt on the Scheme’s ability to continue as a going concern. If we conclude that a material uncertainty exists, we are required to draw attention in our auditor’s report to the related disclosures in the financial statements or, if such disclosures are inadequate, to modify our opinion. Our conclusions are based on the audit evidence obtained up to the date of our auditor’s report. However, future events or conditions may cause the Scheme to cease to continue as a going concern;
• Evaluate the overall presentation, structure and content of the financial statements, including the disclosures and whether the financial statements represent the underlying transactions and events in a manner that achieves fair presentation.
We communicate with those charged with governance regarding, among other matters, the planned scope and timing of the audit and significant audit findings, including any significant deficiencies in internal control that we identify during our audit.
We also provide those charged with governance with a statement that we have complied with relevant ethical requirements regarding independence, and to communicate with them all relationships and other matters that may reasonably be thought to bear on our independence, and where applicable, related safeguards.
Report on Other Legal and Regulatory Requirements 1 As required by Regulation 55 (4) of the Regulations, we report that:
(a) We have obtained all information and explanations which, to the best of our knowledge and belief, were necessary for the purposes of the audit; and
(b) The balance sheet and the revenue account have been prepared in accordance with the accounting policies and standards as specified in the Ninth Schedule of the Regulations.
2 As required by Clause 5 (ii) (2) of the Eleventh Schedule of the Regulations, we report that the balance sheet and the revenue account are in agreement with the books of account of the Scheme.
3 As required by the Eight Schedule of the Regulations, we report that, in our opinion and on the basis of information and explanations given to us, the methods used to value non - traded securities, as at 31 March 2021, as determined by the Board of Directors of the AMC, are in accordance with the Regulations and other guidelines issued by the Securities and Exchange Board of India as applicable and approved by the Board of Directors of the Trustee, are fair and reasonable.
For B S R & Co. LLP Chartered Accountants Firm’s Registration No: 101248W/W-100022
Sd/-
Ajit viswanath PartnerMembership No: 067114UDIN : 21067114AAAAEG6278
Place : Mumbai Date : July 20, 2021.
Independent Auditors’ Report (Contd...)
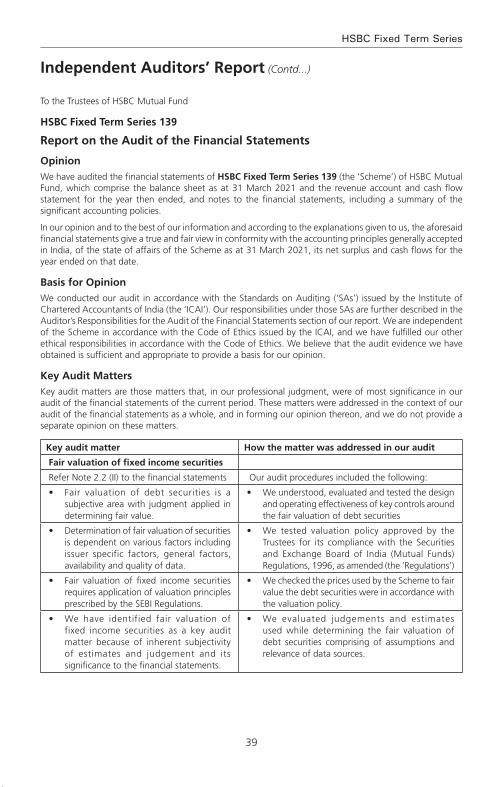
39
HSBC Fixed Term Series
To the Trustees of HSBC Mutual Fund
HSBC Fixed Term Series 139
Report on the Audit of the Financial Statements
OpinionWe have audited the financial statements of HSBC Fixed Term Series 139 (the ‘Scheme’) of HSBC Mutual Fund, which comprise the balance sheet as at 31 March 2021 and the revenue account and cash flow statement for the year then ended, and notes to the financial statements, including a summary of the significant accounting policies.
In our opinion and to the best of our information and according to the explanations given to us, the aforesaid financial statements give a true and fair view in conformity with the accounting principles generally accepted in India, of the state of affairs of the Scheme as at 31 March 2021, its net surplus and cash flows for the year ended on that date.
Basis for OpinionWe conducted our audit in accordance with the Standards on Auditing (‘SAs’) issued by the Institute of Chartered Accountants of India (the ‘ICAI’). Our responsibilities under those SAs are further described in the Auditor’s Responsibilities for the Audit of the Financial Statements section of our report. We are independent of the Scheme in accordance with the Code of Ethics issued by the ICAI, and we have fulfilled our other ethical responsibilities in accordance with the Code of Ethics. We believe that the audit evidence we have obtained is sufficient and appropriate to provide a basis for our opinion.
key Audit MattersKey audit matters are those matters that, in our professional judgment, were of most significance in our audit of the financial statements of the current period. These matters were addressed in the context of our audit of the financial statements as a whole, and in forming our opinion thereon, and we do not provide a separate opinion on these matters.
key audit matter How the matter was addressed in our audit
Fair valuation of fixed income securities
Refer Note 2.2 (II) to the financial statements Our audit procedures included the following:
• Fair valuation of debt securities is a subjective area with judgment applied in determining fair value.
• We understood, evaluated and tested the design and operating effectiveness of key controls around the fair valuation of debt securities
• Determination of fair valuation of securities is dependent on various factors including issuer specific factors, general factors, availability and quality of data.
• We tested valuation policy approved by the Trustees for its compliance with the Securities and Exchange Board of India (Mutual Funds) Regulations, 1996, as amended (the ‘Regulations’)
• Fair valuation of fixed income securities requires application of valuation principles prescribed by the SEBI Regulations.
• We checked the prices used by the Scheme to fair value the debt securities were in accordance with the valuation policy.
• We have identified fair valuation of fixed income securities as a key audit matter because of inherent subjectivity of estimates and judgement and its significance to the financial statements.
• We evaluated judgements and estimates used while determining the fair valuation of debt securities comprising of assumptions and relevance of data sources.
Independent Auditors’ Report (Contd...)
40
Abridged Annual Report 2020 - 2021
Other InformationThe management of HSBC Asset Management (India) Private Limited, is responsible for the other information. The other information comprises the information included in the Annual Report but does not include the financial statements and our auditor’s report thereon.
Our opinion on the financial statements does not cover the other information and we do not express any form of assurance conclusion thereon.
In connection with our audit of the financial statements, our responsibility is to read the other information and, in doing so, consider whether the other information is materially inconsistent with the financial statements or our knowledge obtained in the audit or otherwise appears to be materially misstated. If, based on the work we have performed, we conclude that there is a material misstatement of this other information, we are required to report that fact. We have nothing to report in this regard.
Responsibilities of Management and Those Charged with Governance for the Financial StatementsThe Scheme’s management, the Board of Directors of HSBC Mutual Fund (the ‘Trustees’) and the Board of Directors of HSBC Asset Management (India) Private Limited (the ‘AMC’) (collectively referred to as ‘Management’) are responsible for the preparation of these financial statements that give a true and fair view of the state of affairs, results of operations and cash flows of the Scheme in accordance with the accounting policies and standards specified in the Ninth Schedule of the Regulations and the accounting principles generally accepted in India. This responsibility includes design, implementation and maintenance of internal control relevant to the preparation and presentation of the financial statements that give a true and fair view and are free from material misstatement, whether due to fraud or error.
In preparing the financial statements, management is responsible for assessing the Scheme’s ability to continue as a going concern, disclosing, as applicable, matters related to going concern and using the going concern basis of accounting unless management either intends to liquidate the Scheme or to cease operations, or has no realistic alternative but to do so.
The management is responsible for overseeing the Scheme’s financial reporting process.
Auditor’s Responsibilities for the Audit of the Financial StatementsOur objectives are to obtain reasonable assurance about whether the financial statements as a whole are free from material misstatement, whether due to fraud or error, and to issue an auditor’s report that includes our opinion. Reasonable assurance is a high level of assurance, but is not a guarantee that an audit conducted in accordance with SAs will always detect a material misstatement when it exists. Misstatements can arise from fraud or error and are considered material if, individually or in the aggregate, they could reasonably be expected to influence the economic decisions of users taken on the basis of these financial statements.
As part of an audit in accordance with SAs, we exercise professional judgment and maintain professional skepticism throughout the audit. We also:
• Identify and assess the risks of material misstatement of the financial statements, whether due to fraud or error, design and perform audit procedures responsive to those risks, and obtain audit evidence that is sufficient and appropriate to provide a basis for our opinion. The risk of not detecting a material misstatement resulting from fraud is higher than for one resulting from error, as fraud may involve collusion, forgery, intentional omissions, misrepresentations, or the override of internal control;
• Obtain an understanding of internal control relevant to the audit in order to design audit procedures that are appropriate in the circumstances, but not for the purpose of expressing an opinion on the effectiveness of the Scheme’s internal controls;
• Evaluate the appropriateness of accounting policies used and the reasonableness of accounting estimates and related disclosures made by Management;
• Conclude on the appropriateness of Management’s use of the going concern basis of accounting and, based on the audit evidence obtained, whether a material uncertainty exists related to events or conditions
Independent Auditors’ Report (Contd...)
41
HSBC Fixed Term Series
that may cast significant doubt on the Scheme’s ability to continue as a going concern. If we conclude that a material uncertainty exists, we are required to draw attention in our auditor’s report to the related disclosures in the financial statements or, if such disclosures are inadequate, to modify our opinion. Our conclusions are based on the audit evidence obtained up to the date of our auditor’s report. However, future events or conditions may cause the Scheme to cease to continue as a going concern;
• Evaluate the overall presentation, structure and content of the financial statements, including the disclosures and whether the financial statements represent the underlying transactions and events in a manner that achieves fair presentation.
We communicate with those charged with governance regarding, among other matters, the planned scope and timing of the audit and significant audit findings, including any significant deficiencies in internal control that we identify during our audit.
We also provide those charged with governance with a statement that we have complied with relevant ethical requirements regarding independence, and to communicate with them all relationships and other matters that may reasonably be thought to bear on our independence, and where applicable, related safeguards.
Report on Other Legal and Regulatory Requirements 1 As required by Regulation 55 (4) of the Regulations, we report that:
(a) We have obtained all information and explanations which, to the best of our knowledge and belief, were necessary for the purposes of the audit; and
b) The balance sheet and the revenue account have been prepared in accordance with the accounting policies and standards as specified in the Ninth Schedule of the Regulations.
2 As required by Clause 5 (ii) (2) of the Eleventh Schedule of the Regulations, we report that the balance sheet and the revenue account are in agreement with the books of account of the Scheme.
3 As required by the Eight Schedule of the Regulations, we report that, in our opinion and on the basis of information and explanations given to us, the methods used to value non - traded securities, as at 31 March 2021, as determined by the Board of Directors of the AMC, are in accordance with the Regulations and other guidelines issued by the Securities and Exchange Board of India as applicable and approved by the Board of Directors of the Trustee, are fair and reasonable.
For B S R & Co. LLP Chartered Accountants Firm’s Registration No: 101248W/W-100022
Sd/-
Ajit viswanath PartnerMembership No: 067114UDIN : 21067114AAAAEH9664
Place : Mumbai Date : July 20, 2021.
Independent Auditors’ Report (Contd...)
42
Abridged Annual Report 2020 - 2021
Independent Auditors’ Report (Contd...)
To the Trustees of HSBC Mutual Fund
HSBC Fixed Term Series 140
Report on the Audit of the Financial Statements
OpinionWe have audited the financial statements of HSBC Fixed Term Series 140 (the ‘Scheme’) of HSBC Mutual Fund, which comprise the balance sheet as at 31 March 2021 and the revenue account and cash flow statement for the year then ended, and notes to the financial statements, including a summary of the significant accounting policies.
In our opinion and to the best of our information and according to the explanations given to us, the aforesaid financial statements give a true and fair view in conformity with the accounting principles generally accepted in India, of the state of affairs of the Scheme as at 31 March 2021, its net surplus and cash flows for the year ended on that date.
Basis for OpinionWe conducted our audit in accordance with the Standards on Auditing (‘SAs’) issued by the Institute of Chartered Accountants of India (the ‘ICAI’). Our responsibilities under those SAs are further described in the Auditor’s Responsibilities for the Audit of the Financial Statements section of our report. We are independent of the Scheme in accordance with the Code of Ethics issued by the ICAI, and we have fulfilled our other ethical responsibilities in accordance with the Code of Ethics. We believe that the audit evidence we have obtained is sufficient and appropriate to provide a basis for our opinion.
key Audit MattersKey audit matters are those matters that, in our professional judgment, were of most significance in our audit of the financial statements of the current period. These matters were addressed in the context of our audit of the financial statements as a whole, and in forming our opinion thereon, and we do not provide a separate opinion on these matters.
key audit matter How the matter was addressed in our audit
Fair valuation of fixed income securities
Refer Note 2.2 (II) to the financial statements Our audit procedures included the following:
• Fair valuation of debt securities is a subjective area with judgment applied in determining fair value.
• We understood, evaluated and tested the design and operating effectiveness of key controls around the fair valuation of debt securities
• Determination of fair valuation of securities is dependent on various factors including issuer specific factors, general factors, availability and quality of data.
• We tested valuation policy approved by the Trustees for its compliance with the Securities and Exchange Board of India (Mutual Funds) Regulations, 1996, as amended (the ‘Regulations’)
• Fair valuation of fixed income securities requires application of valuation principles prescribed by the SEBI Regulations.
• We checked the prices used by the Scheme to fair value the debt securities were in accordance with the valuation policy.
• We have identified fair valuation of fixed income securities as a key audit matter because of inherent subjectivity of estimates and judgement and its significance to the financial statements.
• We evaluated judgements and estimates used while determining the fair valuation of debt securities comprising of assumptions and relevance of data sources.
43
HSBC Fixed Term Series
Independent Auditors’ Report (Contd...)
Other InformationThe management of HSBC Asset Management (India) Private Limited, is responsible for the other information. The other information comprises the information included in the Annual Report but does not include the financial statements and our auditor’s report thereon.
Our opinion on the financial statements does not cover the other information and we do not express any form of assurance conclusion thereon.
In connection with our audit of the financial statements, our responsibility is to read the other information and, in doing so, consider whether the other information is materially inconsistent with the financial statements or our knowledge obtained in the audit or otherwise appears to be materially misstated. If, based on the work we have performed, we conclude that there is a material misstatement of this other information, we are required to report that fact. We have nothing to report in this regard.
Responsibilities of Management and Those Charged with Governance for the Financial StatementsThe Scheme’s management, the Board of Directors of HSBC Mutual Fund (the ‘Trustees’) and the Board of Directors of HSBC Asset Management (India) Private Limited (the ‘AMC’) (collectively referred to as ‘Management’) are responsible for the preparation of these financial statements that give a true and fair view of the state of affairs, results of operations and cash flows of the Scheme in accordance with the accounting policies and standards specified in the Ninth Schedule of the Regulations and the accounting principles generally accepted in India. This responsibility includes design, implementation and maintenance of internal control relevant to the preparation and presentation of the financial statements that give a true and fair view and are free from material misstatement, whether due to fraud or error.
In preparing the financial statements, management is responsible for assessing the Scheme’s ability to continue as a going concern, disclosing, as applicable, matters related to going concern and using the going concern basis of accounting unless management either intends to liquidate the Scheme or to cease operations, or has no realistic alternative but to do so.
The management is responsible for overseeing the Scheme’s financial reporting process.
Auditor’s Responsibilities for the Audit of the Financial StatementsOur objectives are to obtain reasonable assurance about whether the financial statements as a whole are free from material misstatement, whether due to fraud or error, and to issue an auditor’s report that includes our opinion. Reasonable assurance is a high level of assurance, but is not a guarantee that an audit conducted in accordance with SAs will always detect a material misstatement when it exists. Misstatements can arise from fraud or error and are considered material if, individually or in the aggregate, they could reasonably be expected to influence the economic decisions of users taken on the basis of these financial statements.
As part of an audit in accordance with SAs, we exercise professional judgment and maintain professional skepticism throughout the audit. We also:
• Identify and assess the risks of material misstatement of the financial statements, whether due to fraud or error, design and perform audit procedures responsive to those risks, and obtain audit evidence that is sufficient and appropriate to provide a basis for our opinion. The risk of not detecting a material misstatement resulting from fraud is higher than for one resulting from error, as fraud may involve collusion, forgery, intentional omissions, misrepresentations, or the override of internal control;
• Obtain an understanding of internal control relevant to the audit in order to design audit procedures that are appropriate in the circumstances, but not for the purpose of expressing an opinion on the effectiveness of the Scheme’s internal controls;
• Evaluate the appropriateness of accounting policies used and the reasonableness of accounting estimates and related disclosures made by Management;
• Conclude on the appropriateness of Management’s use of the going concern basis of accounting and, based on the audit evidence obtained, whether a material uncertainty exists related to events or conditions
44
Abridged Annual Report 2020 - 2021
Independent Auditors’ Report (Contd...)
that may cast significant doubt on the Scheme’s ability to continue as a going concern. If we conclude that a material uncertainty exists, we are required to draw attention in our auditor’s report to the related disclosures in the financial statements or, if such disclosures are inadequate, to modify our opinion. Our conclusions are based on the audit evidence obtained up to the date of our auditor’s report. However, future events or conditions may cause the Scheme to cease to continue as a going concern;
• Evaluate the overall presentation, structure and content of the financial statements, including the disclosures and whether the financial statements represent the underlying transactions and events in a manner that achieves fair presentation.
We communicate with those charged with governance regarding, among other matters, the planned scope and timing of the audit and significant audit findings, including any significant deficiencies in internal control that we identify during our audit.
We also provide those charged with governance with a statement that we have complied with relevant ethical requirements regarding independence, and to communicate with them all relationships and other matters that may reasonably be thought to bear on our independence, and where applicable, related safeguards.
Report on Other Legal and Regulatory Requirements 1 As required by Regulation 55 (4) of the Regulations, we report that:
(a) We have obtained all information and explanations which, to the best of our knowledge and belief, were necessary for the purposes of the audit; and
(b) The balance sheet and the revenue account have been prepared in accordance with the accounting policies and standards as specified in the Ninth Schedule of the Regulations.
2 As required by Clause 5 (ii) (2) of the Eleventh Schedule of the Regulations, we report that the balance sheet and the revenue account are in agreement with the books of account of the Scheme.
3 As required by the Eight Schedule of the Regulations, we report that, in our opinion and on the basis of information and explanations given to us, the methods used to value non - traded securities, as at 31 March 2021, as determined by the Board of Directors of the AMC, are in accordance with the Regulations and other guidelines issued by the Securities and Exchange Board of India as applicable and approved by the Board of Directors of the Trustee, are fair and reasonable.
For B S R & Co. LLP Chartered Accountants Firm’s Registration No: 101248W/W-100022
Sd/-
Ajit viswanath PartnerMembership No: 067114UDIN : 21067114AAAAEI8722
Place : Mumbai Date : July 20, 2021.
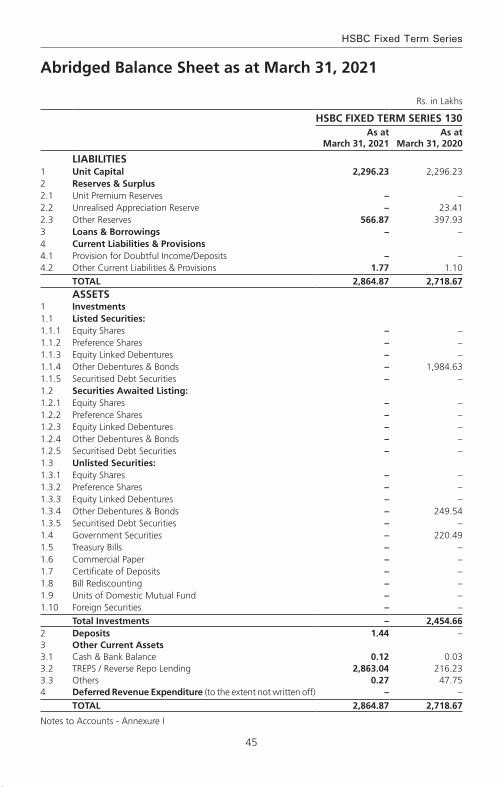
45
HSBC Fixed Term Series
Rs. in Lakhs
HSBC FIxED TERM SERIES 130As at
March 31, 2021As at
March 31, 2020
LIABILITIES1 Unit Capital 2,296.23 2,296.232 Reserves & Surplus2.1 Unit Premium Reserves – –2.2 Unrealised Appreciation Reserve – 23.412.3 Other Reserves 566.87 397.933 Loans & Borrowings – –4 Current Liabilities & Provisions4.1 Provision for Doubtful Income/Deposits – –4.2 Other Current Liabilities & Provisions 1.77 1.10
TOTAL 2,864.87 2,718.67ASSETS
1 Investments1.1 Listed Securities:1.1.1 Equity Shares – –1.1.2 Preference Shares – –1.1.3 Equity Linked Debentures – –1.1.4 Other Debentures & Bonds – 1,984.631.1.5 Securitised Debt Securities – –1.2 Securities Awaited Listing:1.2.1 Equity Shares – –1.2.2 Preference Shares – –1.2.3 Equity Linked Debentures – –1.2.4 Other Debentures & Bonds – –1.2.5 Securitised Debt Securities – –1.3 Unlisted Securities:1.3.1 Equity Shares – –1.3.2 Preference Shares – –1.3.3 Equity Linked Debentures – –1.3.4 Other Debentures & Bonds – 249.541.3.5 Securitised Debt Securities – –1.4 Government Securities – 220.491.5 Treasury Bills – –1.6 Commercial Paper – –1.7 Certificate of Deposits – –1.8 Bill Rediscounting – –1.9 Units of Domestic Mutual Fund – –1.10 Foreign Securities – –
Total Investments – 2,454.662 Deposits 1.44 –3 Other Current Assets3.1 Cash & Bank Balance 0.12 0.033.2 TREPS / Reverse Repo Lending 2,863.04 216.233.3 Others 0.27 47.754 Deferred Revenue Expenditure (to the extent not written off) – –
TOTAL 2,864.87 2,718.67
Notes to Accounts - Annexure I
Abridged Balance Sheet as at March 31, 2021
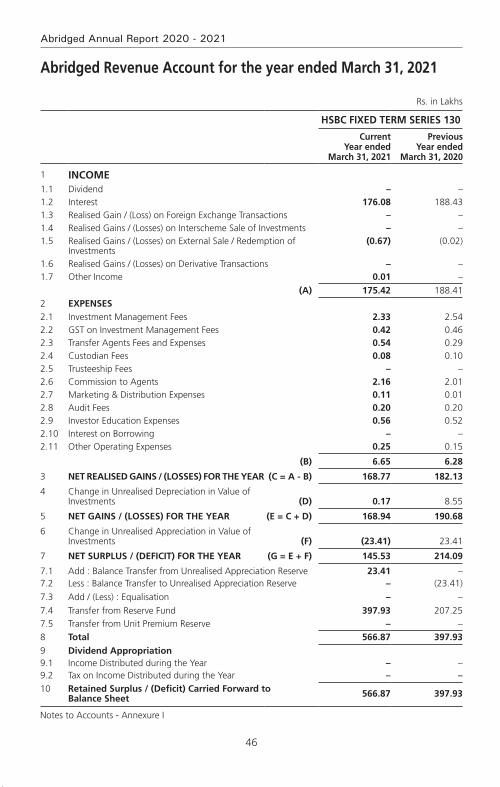
46
Abridged Annual Report 2020 - 2021
Abridged Revenue Account for the year ended March 31, 2021
Rs. in Lakhs
HSBC FIxED TERM SERIES 130
Current Year ended
March 31, 2021
Previous Year ended
March 31, 2020
1 INCOME1.1 Dividend – –1.2 Interest 176.08 188.431.3 Realised Gain / (Loss) on Foreign Exchange Transactions – –1.4 Realised Gains / (Losses) on Interscheme Sale of Investments – –1.5 Realised Gains / (Losses) on External Sale / Redemption of
Investments(0.67) (0.02)
1.6 Realised Gains / (Losses) on Derivative Transactions – –1.7 Other Income 0.01 –
(A) 175.42 188.412 ExPENSES2.1 Investment Management Fees 2.33 2.542.2 GST on Investment Management Fees 0.42 0.462.3 Transfer Agents Fees and Expenses 0.54 0.292.4 Custodian Fees 0.08 0.102.5 Trusteeship Fees – –2.6 Commission to Agents 2.16 2.012.7 Marketing & Distribution Expenses 0.11 0.012.8 Audit Fees 0.20 0.202.9 Investor Education Expenses 0.56 0.522.10 Interest on Borrowing – –2.11 Other Operating Expenses 0.25 0.15
(B) 6.65 6.28
3 NET REALISED GAINS / (LOSSES) FOR THE YEAR (C = A - B) 168.77 182.13
4 Change in Unrealised Depreciation in Value of Investments (D) 0.17 8.55
5 NET GAINS / (LOSSES) FOR THE YEAR (E = C + D) 168.94 190.68
6 Change in Unrealised Appreciation in Value of Investments (F) (23.41) 23.41
7 NET SURPLUS / (DEFICIT) FOR THE YEAR (G = E + F) 145.53 214.09
7.1 Add : Balance Transfer from Unrealised Appreciation Reserve 23.41 –7.2 Less : Balance Transfer to Unrealised Appreciation Reserve – (23.41)7.3 Add / (Less) : Equalisation – –7.4 Transfer from Reserve Fund 397.93 207.257.5 Transfer from Unit Premium Reserve – –8 Total 566.87 397.939 Dividend Appropriation9.1 Income Distributed during the Year – –9.2 Tax on Income Distributed during the Year – –10 Retained Surplus / (Deficit) Carried Forward to
Balance Sheet 566.87 397.93
Notes to Accounts - Annexure I
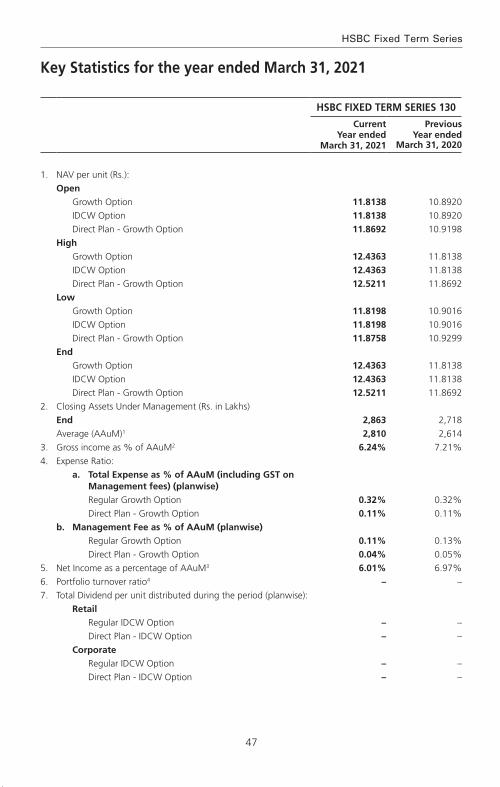
47
HSBC Fixed Term Series
key Statistics for the year ended March 31, 2021
HSBC FIxED TERM SERIES 130
Current Year ended
March 31, 2021
Previous Year ended
March 31, 2020
1. NAV per unit (Rs.):Open
Growth Option 11.8138 10.8920IDCW Option 11.8138 10.8920Direct Plan - Growth Option 11.8692 10.9198
HighGrowth Option 12.4363 11.8138IDCW Option 12.4363 11.8138Direct Plan - Growth Option 12.5211 11.8692
LowGrowth Option 11.8198 10.9016IDCW Option 11.8198 10.9016Direct Plan - Growth Option 11.8758 10.9299
EndGrowth Option 12.4363 11.8138IDCW Option 12.4363 11.8138Direct Plan - Growth Option 12.5211 11.8692
2. Closing Assets Under Management (Rs. in Lakhs)End 2,863 2,718Average (AAuM)1 2,810 2,614
3. Gross income as % of AAuM2 6.24% 7.21%4. Expense Ratio:
a. Total Expense as % of AAuM (including GST on Management fees) (planwise)Regular Growth Option 0.32% 0.32%Direct Plan - Growth Option 0.11% 0.11%
b. Management Fee as % of AAuM (planwise)Regular Growth Option 0.11% 0.13%Direct Plan - Growth Option 0.04% 0.05%
5. Net Income as a percentage of AAuM3 6.01% 6.97%6. Portfolio turnover ratio4 – –7. Total Dividend per unit distributed during the period (planwise):
RetailRegular IDCW Option – –Direct Plan - IDCW Option – –
CorporateRegular IDCW Option – –Direct Plan - IDCW Option – –

48
Abridged Annual Report 2020 - 2021
key Statistics for the year ended March 31, 2021 (Contd...)
HSBC FIxED TERM SERIES 130
Current Year ended
March 31, 2021
Previous Year ended
March 31, 2020
8. Returns (%):a. Last One Year
SchemeRegular Growth Option 5.2700 8.4300Direct Plan - Growth Option 5.4900 8.6600
BenchmarkCRISIL Composite Bond Fund Index 7.6900 12.5700
b. Since InceptionScheme
Regular Growth Option 6.8900 7.6100Direct Plan - Growth Option 7.1100 7.8300
BenchmarkCRISIL Composite Bond Fund Index 8.5600 8.9400
1. AAuM = Average daily net assets
2. Gross income = amount against (A) in the Revenue account i.e. Income
3. Net income = amount against (C) in the Revenue account i.e. Net Realised Gains / (Losses) for the period
4. Portfolio Turnover = Lower of sales or purchase divided by the Average AuM for the period
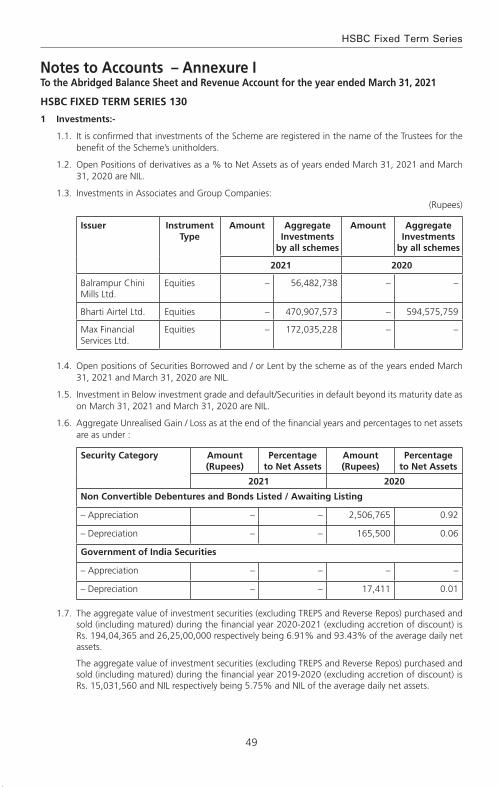
49
HSBC Fixed Term Series
Notes to Accounts – Annexure ITo the Abridged Balance Sheet and Revenue Account for the year ended March 31, 2021
HSBC FIxED TERM SERIES 130
1 Investments:-
1.1. It is confirmed that investments of the Scheme are registered in the name of the Trustees for the benefit of the Scheme’s unitholders.
1.2. Open Positions of derivatives as a % to Net Assets as of years ended March 31, 2021 and March 31, 2020 are NIL.
1.3. Investments in Associates and Group Companies: (Rupees)
Issuer Instrument Type
Amount Aggregate Investments
by all schemes
Amount Aggregate Investments
by all schemes
2021 2020
Balrampur Chini Mills Ltd.
Equities – 56,482,738 – –
Bharti Airtel Ltd. Equities – 470,907,573 – 594,575,759
Max Financial Services Ltd.
Equities – 172,035,228 – –
1.4. Open positions of Securities Borrowed and / or Lent by the scheme as of the years ended March 31, 2021 and March 31, 2020 are NIL.
1.5. Investment in Below investment grade and default/Securities in default beyond its maturity date as on March 31, 2021 and March 31, 2020 are NIL.
1.6. Aggregate Unrealised Gain / Loss as at the end of the financial years and percentages to net assets are as under :
Security Category Amount (Rupees)
Percentage to Net Assets
Amount (Rupees)
Percentage to Net Assets
2021 2020
Non Convertible Debentures and Bonds Listed / Awaiting Listing
– Appreciation – – 2,506,765 0.92
– Depreciation – – 165,500 0.06
Government of India Securities
– Appreciation – – – –
– Depreciation – – 17,411 0.01
1.7. The aggregate value of investment securities (excluding TREPS and Reverse Repos) purchased and sold (including matured) during the financial year 2020-2021 (excluding accretion of discount) is Rs. 194,04,365 and 26,25,00,000 respectively being 6.91% and 93.43% of the average daily net assets.
The aggregate value of investment securities (excluding TREPS and Reverse Repos) purchased and sold (including matured) during the financial year 2019-2020 (excluding accretion of discount) is Rs. 15,031,560 and NIL respectively being 5.75% and NIL of the average daily net assets.
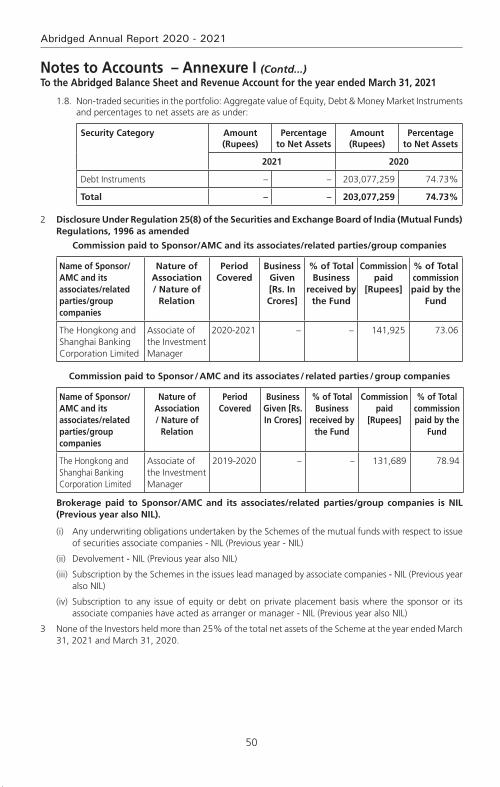
50
Abridged Annual Report 2020 - 2021
Notes to Accounts – Annexure I (Contd...)To the Abridged Balance Sheet and Revenue Account for the year ended March 31, 2021
1.8. Non-traded securities in the portfolio: Aggregate value of Equity, Debt & Money Market Instruments and percentages to net assets are as under:
Security Category Amount (Rupees)
Percentage to Net Assets
Amount (Rupees)
Percentage to Net Assets
2021 2020
Debt Instruments – – 203,077,259 74.73%
Total – – 203,077,259 74.73%
2 Disclosure Under Regulation 25(8) of the Securities and Exchange Board of India (Mutual Funds) Regulations, 1996 as amended
Commission paid to Sponsor/AMC and its associates/related parties/group companies
Name of Sponsor/AMC and its associates/related parties/group companies
Nature of Association / Nature of
Relation
Period Covered
Business Given [Rs. In Crores]
% of Total Business
received by the Fund
Commission paid
[Rupees]
% of Total commission paid by the
Fund
The Hongkong and Shanghai Banking Corporation Limited
Associate of the Investment Manager
2020-2021 – – 141,925 73.06
Commission paid to Sponsor / AMC and its associates / related parties / group companies
Name of Sponsor/AMC and its associates/related parties/group companies
Nature of Association / Nature of
Relation
Period Covered
Business Given [Rs. In Crores]
% of Total Business
received by the Fund
Commission paid
[Rupees]
% of Total commission paid by the
Fund
The Hongkong and Shanghai Banking Corporation Limited
Associate of the Investment Manager
2019-2020 – – 131,689 78.94
Brokerage paid to Sponsor/AMC and its associates/related parties/group companies is NIL (Previous year also NIL).
(i) Any underwriting obligations undertaken by the Schemes of the mutual funds with respect to issue of securities associate companies - NIL (Previous year - NIL)
(ii) Devolvement - NIL (Previous year also NIL)
(iii) Subscription by the Schemes in the issues lead managed by associate companies - NIL (Previous year also NIL)
(iv) Subscription to any issue of equity or debt on private placement basis where the sponsor or its associate companies have acted as arranger or manager - NIL (Previous year also NIL)
3 None of the Investors held more than 25% of the total net assets of the Scheme at the year ended March 31, 2021 and March 31, 2020.
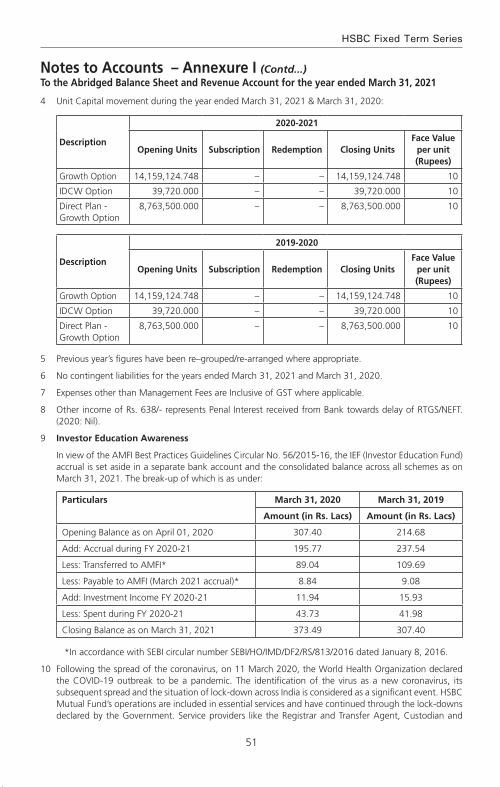
51
HSBC Fixed Term Series
Notes to Accounts – Annexure I (Contd...)To the Abridged Balance Sheet and Revenue Account for the year ended March 31, 2021
4 Unit Capital movement during the year ended March 31, 2021 & March 31, 2020:
Description
2020-2021
Opening Units Subscription Redemption Closing UnitsFace value
per unit (Rupees)
Growth Option 14,159,124.748 – – 14,159,124.748 10
IDCW Option 39,720.000 – – 39,720.000 10
Direct Plan - Growth Option
8,763,500.000 – – 8,763,500.000 10
Description
2019-2020
Opening Units Subscription Redemption Closing UnitsFace value
per unit (Rupees)
Growth Option 14,159,124.748 – – 14,159,124.748 10
IDCW Option 39,720.000 – – 39,720.000 10
Direct Plan - Growth Option
8,763,500.000 – – 8,763,500.000 10
5 Previous year’s figures have been re–grouped/re-arranged where appropriate.
6 No contingent liabilities for the years ended March 31, 2021 and March 31, 2020.
7 Expenses other than Management Fees are Inclusive of GST where applicable.
8 Other income of Rs. 638/- represents Penal Interest received from Bank towards delay of RTGS/NEFT. (2020: Nil).
9 Investor Education Awareness
In view of the AMFI Best Practices Guidelines Circular No. 56/2015-16, the IEF (Investor Education Fund) accrual is set aside in a separate bank account and the consolidated balance across all schemes as on March 31, 2021. The break-up of which is as under:
Particulars March 31, 2020 March 31, 2019
Amount (in Rs. Lacs) Amount (in Rs. Lacs)
Opening Balance as on April 01, 2020 307.40 214.68
Add: Accrual during FY 2020-21 195.77 237.54
Less: Transferred to AMFI* 89.04 109.69
Less: Payable to AMFI (March 2021 accrual)* 8.84 9.08
Add: Investment Income FY 2020-21 11.94 15.93
Less: Spent during FY 2020-21 43.73 41.98
Closing Balance as on March 31, 2021 373.49 307.40
*In accordance with SEBI circular number SEBI/HO/IMD/DF2/RS/813/2016 dated January 8, 2016.
10 Following the spread of the coronavirus, on 11 March 2020, the World Health Organization declared the COVID-19 outbreak to be a pandemic. The identification of the virus as a new coronavirus, its subsequent spread and the situation of lock-down across India is considered as a significant event. HSBC Mutual Fund’s operations are included in essential services and have continued through the lock-downs declared by the Government. Service providers like the Registrar and Transfer Agent, Custodian and
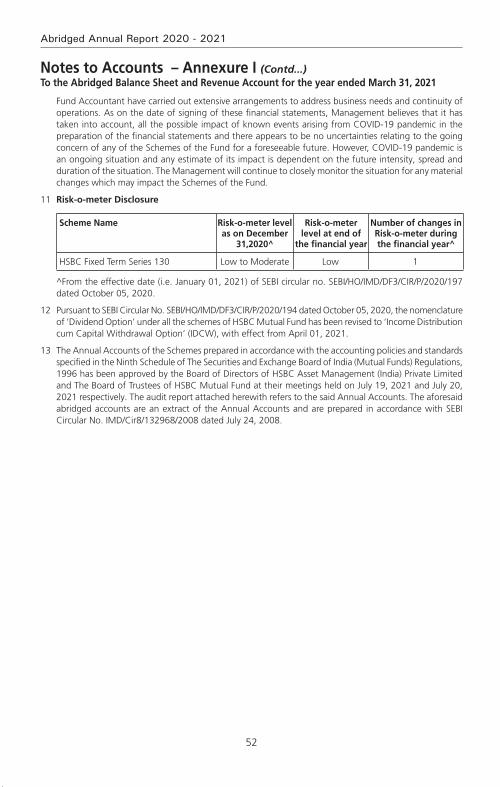
52
Abridged Annual Report 2020 - 2021
Notes to Accounts – Annexure I (Contd...)To the Abridged Balance Sheet and Revenue Account for the year ended March 31, 2021
Fund Accountant have carried out extensive arrangements to address business needs and continuity of operations. As on the date of signing of these financial statements, Management believes that it has taken into account, all the possible impact of known events arising from COVID-19 pandemic in the preparation of the financial statements and there appears to be no uncertainties relating to the going concern of any of the Schemes of the Fund for a foreseeable future. However, COVID-19 pandemic is an ongoing situation and any estimate of its impact is dependent on the future intensity, spread and duration of the situation. The Management will continue to closely monitor the situation for any material changes which may impact the Schemes of the Fund.
11 Risk-o-meter Disclosure
Scheme Name Risk-o-meter level as on December
31,2020^
Risk-o-meter level at end of
the financial year
Number of changes in Risk-o-meter during the financial year^
HSBC Fixed Term Series 130 Low to Moderate Low 1
^From the effective date (i.e. January 01, 2021) of SEBI circular no. SEBI/HO/IMD/DF3/CIR/P/2020/197 dated October 05, 2020.
12 Pursuant to SEBI Circular No. SEBI/HO/IMD/DF3/CIR/P/2020/194 dated October 05, 2020, the nomenclature of ‘Dividend Option’ under all the schemes of HSBC Mutual Fund has been revised to ‘Income Distribution cum Capital Withdrawal Option’ (IDCW), with effect from April 01, 2021.
13 The Annual Accounts of the Schemes prepared in accordance with the accounting policies and standards specified in the Ninth Schedule of The Securities and Exchange Board of India (Mutual Funds) Regulations, 1996 has been approved by the Board of Directors of HSBC Asset Management (India) Private Limited and The Board of Trustees of HSBC Mutual Fund at their meetings held on July 19, 2021 and July 20, 2021 respectively. The audit report attached herewith refers to the said Annual Accounts. The aforesaid abridged accounts are an extract of the Annual Accounts and are prepared in accordance with SEBI Circular No. IMD/Cir8/132968/2008 dated July 24, 2008.

53
HSBC Fixed Term Series
Rs. in Lakhs
HSBC FIxED TERM SERIES 131As at
March 31, 2021As at
March 31, 2020
LIABILITIES1 Unit Capital 4,030.36 4,030.362 Reserves & Surplus2.1 Unit Premium Reserves – –2.2 Unrealised Appreciation Reserve – 24.892.3 Other Reserves 901.34 590.253 Loans & Borrowings – –4 Current Liabilities & Provisions4.1 Provision for Doubtful Income/Deposits – –4.2 Other Current Liabilities & Provisions 1.21 1.10
TOTAL 4,932.91 4,646.60ASSETS
1 Investments1.1 Listed Securities:1.1.1 Equity Shares – –1.1.2 Preference Shares – –1.1.3 Equity Linked Debentures – –1.1.4 Other Debentures & Bonds 2,316.00 3,505.471.1.5 Securitised Debt Securities – –1.2 Securities Awaited Listing:1.2.1 Equity Shares – –1.2.2 Preference Shares – –1.2.3 Equity Linked Debentures – –1.2.4 Other Debentures & Bonds – –1.2.5 Securitised Debt Securities – –1.3 Unlisted Securities:1.3.1 Equity Shares – –1.3.2 Preference Shares – –1.3.3 Equity Linked Debentures – –1.3.4 Other Debentures & Bonds – 401.621.3.5 Securitised Debt Securities – –1.4 Government Securities – 510.331.5 Treasury Bills – –1.6 Commercial Paper – –1.7 Certificate of Deposits 449.16 –1.8 Bill Rediscounting – –1.9 Units of Domestic Mutual Fund – –1.10 Foreign Securities – –
Total Investments 2,765.16 4,417.422 Deposits 0.63 –3 Other Current Assets3.1 Cash & Bank Balance 0.10 0.563.2 TREPS / Reverse Repo Lending 2,069.61 120.783.3 Others 97.41 107.844 Deferred Revenue Expenditure (to the extent not written off) – –
TOTAL 4,932.91 4,646.60
Notes to Accounts - Annexure I
Abridged Balance Sheet as at March 31, 2021

54
Abridged Annual Report 2020 - 2021
Rs. in Lakhs
HSBC FIxED TERM SERIES 131
Current Year ended
March 31, 2021
Previous Year ended
March 31, 2020
1 INCOME1.1 Dividend – –1.2 Interest 343.80 343.891.3 Realised Gain / (Loss) on Foreign Exchange Transactions – –1.4 Realised Gains / (Losses) on Interscheme Sale of Investments – –1.5 Realised Gains / (Losses) on External Sale / Redemption of
Investments(14.62) (82.60)
1.6 Realised Gains / (Losses) on Derivative Transactions – –1.7 Other Income 0.01 –
(A) 329.19 261.292 ExPENSES2.1 Investment Management Fees 1.09 1.312.2 GST on Investment Management Fees 0.20 0.242.3 Transfer Agents Fees and Expenses 0.69 0.492.4 Custodian Fees 0.18 0.172.5 Trusteeship Fees – –2.6 Commission to Agents 1.02 0.952.7 Marketing & Distribution Expenses 0.11 0.012.8 Audit Fees 0.20 0.202.9 Investor Education Expenses 0.97 0.902.10 Interest on Borrowing – –2.11 Other Operating Expenses 0.26 0.14
(B) 4.72 4.41
3 NET REALISED GAINS / (LOSSES) FOR THE YEAR (C = A - B) 324.47 256.88
4 Change in Unrealised Depreciation in Value of Investments (D) (13.38) 31.20
5 NET GAINS / (LOSSES) FOR THE YEAR (E = C + D) 311.09 288.08
6 Change in Unrealised Appreciation in Value of Investments (F) (24.89) 21.40
7 NET SURPLUS / (DEFICIT) FOR THE YEAR (G = E + F) 286.20 309.48
7.1 Add : Balance Transfer from Unrealised Appreciation Reserve 24.89 –7.2 Less : Balance Transfer to Unrealised Appreciation Reserve – (21.40)7.3 Add / (Less) : Equalisation – –7.4 Transfer from Reserve Fund 590.25 302.177.5 Transfer from Unit Premium Reserve – –8 Total 901.34 590.25
9 Dividend Appropriation9.1 Income Distributed during the Year – –9.2 Tax on Income Distributed during the Year – –10 Retained Surplus / (Deficit) Carried Forward to
Balance Sheet 901.34 590.25
Notes to Accounts - Annexure I
Abridged Revenue Account for the year ended March 31, 2021
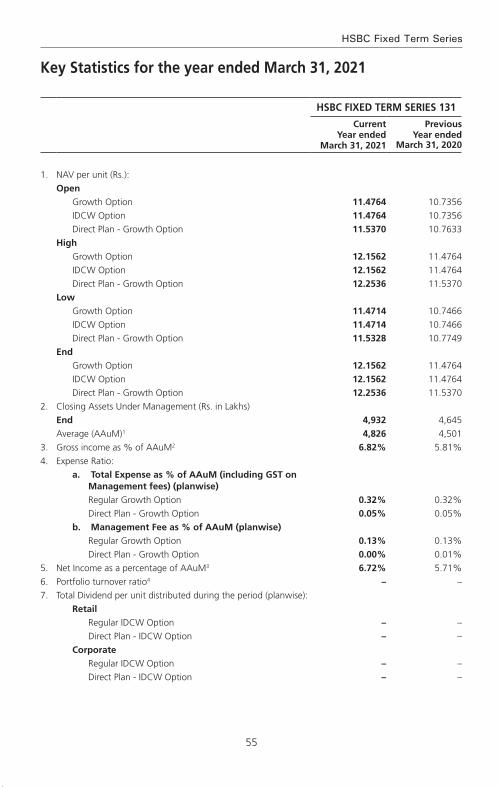
55
HSBC Fixed Term Series
HSBC FIxED TERM SERIES 131
Current Year ended
March 31, 2021
Previous Year ended
March 31, 2020
1. NAV per unit (Rs.):Open
Growth Option 11.4764 10.7356IDCW Option 11.4764 10.7356Direct Plan - Growth Option 11.5370 10.7633
HighGrowth Option 12.1562 11.4764IDCW Option 12.1562 11.4764Direct Plan - Growth Option 12.2536 11.5370
LowGrowth Option 11.4714 10.7466IDCW Option 11.4714 10.7466Direct Plan - Growth Option 11.5328 10.7749
EndGrowth Option 12.1562 11.4764IDCW Option 12.1562 11.4764Direct Plan - Growth Option 12.2536 11.5370
2. Closing Assets Under Management (Rs. in Lakhs)End 4,932 4,645Average (AAuM)1 4,826 4,501
3. Gross income as % of AAuM2 6.82% 5.81%4. Expense Ratio:
a. Total Expense as % of AAuM (including GST on Management fees) (planwise)Regular Growth Option 0.32% 0.32%Direct Plan - Growth Option 0.05% 0.05%
b. Management Fee as % of AAuM (planwise)Regular Growth Option 0.13% 0.13%Direct Plan - Growth Option 0.00% 0.01%
5. Net Income as a percentage of AAuM3 6.72% 5.71%6. Portfolio turnover ratio4 – –7. Total Dividend per unit distributed during the period (planwise):
RetailRegular IDCW Option – –Direct Plan - IDCW Option – –
CorporateRegular IDCW Option – –Direct Plan - IDCW Option – –
key Statistics for the year ended March 31, 2021
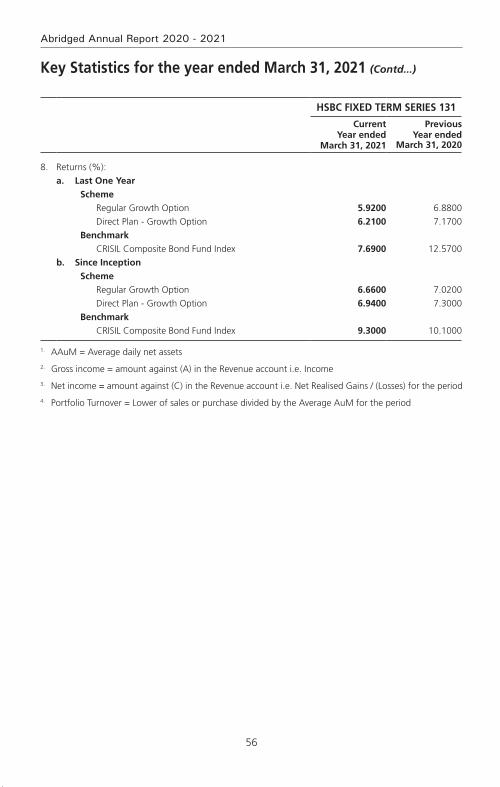
56
Abridged Annual Report 2020 - 2021
HSBC FIxED TERM SERIES 131
Current Year ended
March 31, 2021
Previous Year ended
March 31, 2020
8. Returns (%):a. Last One Year
SchemeRegular Growth Option 5.9200 6.8800Direct Plan - Growth Option 6.2100 7.1700
BenchmarkCRISIL Composite Bond Fund Index 7.6900 12.5700
b. Since InceptionScheme
Regular Growth Option 6.6600 7.0200Direct Plan - Growth Option 6.9400 7.3000
BenchmarkCRISIL Composite Bond Fund Index 9.3000 10.1000
1. AAuM = Average daily net assets
2. Gross income = amount against (A) in the Revenue account i.e. Income
3. Net income = amount against (C) in the Revenue account i.e. Net Realised Gains / (Losses) for the period
4. Portfolio Turnover = Lower of sales or purchase divided by the Average AuM for the period
key Statistics for the year ended March 31, 2021 (Contd...)
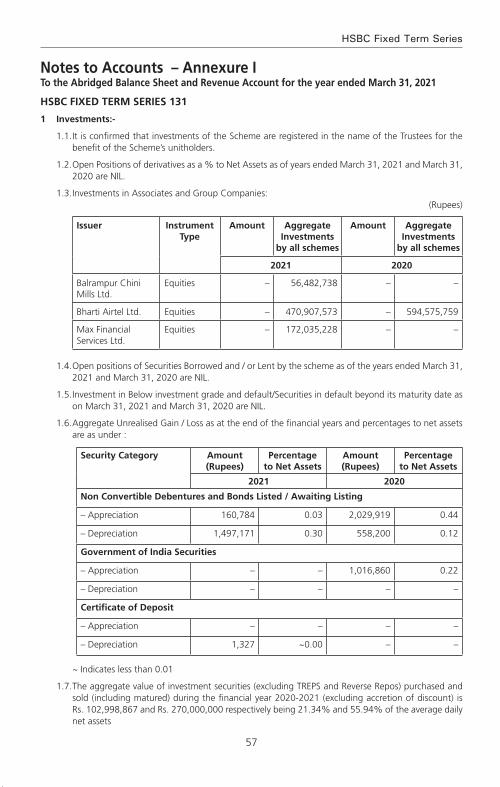
57
HSBC Fixed Term Series
Notes to Accounts – Annexure ITo the Abridged Balance Sheet and Revenue Account for the year ended March 31, 2021
HSBC FIxED TERM SERIES 131
1 Investments:-
1.1. It is confirmed that investments of the Scheme are registered in the name of the Trustees for the benefit of the Scheme’s unitholders.
1.2. Open Positions of derivatives as a % to Net Assets as of years ended March 31, 2021 and March 31, 2020 are NIL.
1.3. Investments in Associates and Group Companies:(Rupees)
Issuer Instrument Type
Amount Aggregate Investments
by all schemes
Amount Aggregate Investments
by all schemes
2021 2020
Balrampur Chini Mills Ltd.
Equities – 56,482,738 – –
Bharti Airtel Ltd. Equities – 470,907,573 – 594,575,759
Max Financial Services Ltd.
Equities – 172,035,228 – –
1.4. Open positions of Securities Borrowed and / or Lent by the scheme as of the years ended March 31, 2021 and March 31, 2020 are NIL.
1.5. Investment in Below investment grade and default/Securities in default beyond its maturity date as on March 31, 2021 and March 31, 2020 are NIL.
1.6. Aggregate Unrealised Gain / Loss as at the end of the financial years and percentages to net assets are as under :
Security Category Amount (Rupees)
Percentage to Net Assets
Amount (Rupees)
Percentage to Net Assets
2021 2020
Non Convertible Debentures and Bonds Listed / Awaiting Listing
– Appreciation 160,784 0.03 2,029,919 0.44
– Depreciation 1,497,171 0.30 558,200 0.12
Government of India Securities
– Appreciation – – 1,016,860 0.22
– Depreciation – – – –
Certificate of Deposit
– Appreciation – – – –
– Depreciation 1,327 ~0.00 – –
~ Indicates less than 0.01
1.7. The aggregate value of investment securities (excluding TREPS and Reverse Repos) purchased and sold (including matured) during the financial year 2020-2021 (excluding accretion of discount) is Rs. 102,998,867 and Rs. 270,000,000 respectively being 21.34% and 55.94% of the average daily net assets
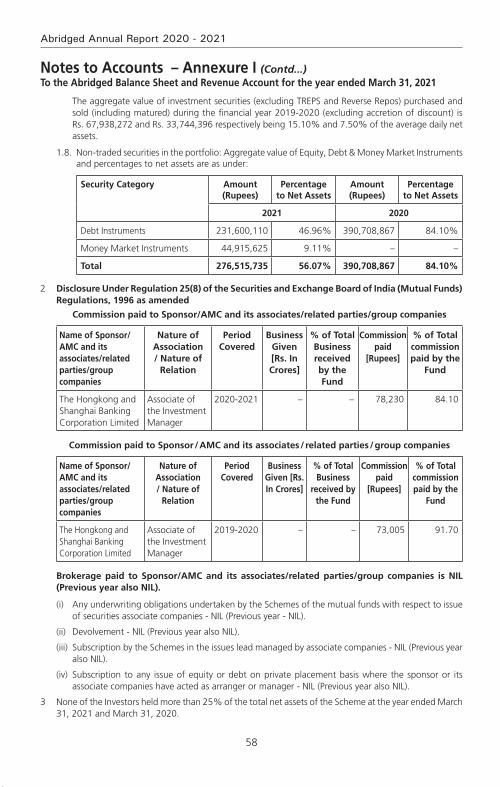
58
Abridged Annual Report 2020 - 2021
Notes to Accounts – Annexure I (Contd...)To the Abridged Balance Sheet and Revenue Account for the year ended March 31, 2021
The aggregate value of investment securities (excluding TREPS and Reverse Repos) purchased and sold (including matured) during the financial year 2019-2020 (excluding accretion of discount) is Rs. 67,938,272 and Rs. 33,744,396 respectively being 15.10% and 7.50% of the average daily net assets.
1.8. Non-traded securities in the portfolio: Aggregate value of Equity, Debt & Money Market Instruments and percentages to net assets are as under:
Security Category Amount (Rupees)
Percentage to Net Assets
Amount (Rupees)
Percentage to Net Assets
2021 2020
Debt Instruments 231,600,110 46.96% 390,708,867 84.10%
Money Market Instruments 44,915,625 9.11% – –
Total 276,515,735 56.07% 390,708,867 84.10%
2 Disclosure Under Regulation 25(8) of the Securities and Exchange Board of India (Mutual Funds) Regulations, 1996 as amended
Commission paid to Sponsor/AMC and its associates/related parties/group companies
Name of Sponsor/AMC and its associates/related parties/group companies
Nature of Association / Nature of
Relation
Period Covered
Business Given [Rs. In Crores]
% of Total Business received by the Fund
Commission paid
[Rupees]
% of Total commission paid by the
Fund
The Hongkong and Shanghai Banking Corporation Limited
Associate of the Investment Manager
2020-2021 – – 78,230 84.10
Commission paid to Sponsor / AMC and its associates / related parties / group companies
Name of Sponsor/AMC and its associates/related parties/group companies
Nature of Association / Nature of
Relation
Period Covered
Business Given [Rs. In Crores]
% of Total Business
received by the Fund
Commission paid
[Rupees]
% of Total commission paid by the
Fund
The Hongkong and Shanghai Banking Corporation Limited
Associate of the Investment Manager
2019-2020 – – 73,005 91.70
Brokerage paid to Sponsor/AMC and its associates/related parties/group companies is NIL (Previous year also NIL).
(i) Any underwriting obligations undertaken by the Schemes of the mutual funds with respect to issue of securities associate companies - NIL (Previous year - NIL).
(ii) Devolvement - NIL (Previous year also NIL).
(iii) Subscription by the Schemes in the issues lead managed by associate companies - NIL (Previous year also NIL).
(iv) Subscription to any issue of equity or debt on private placement basis where the sponsor or its associate companies have acted as arranger or manager - NIL (Previous year also NIL).
3 None of the Investors held more than 25% of the total net assets of the Scheme at the year ended March 31, 2021 and March 31, 2020.
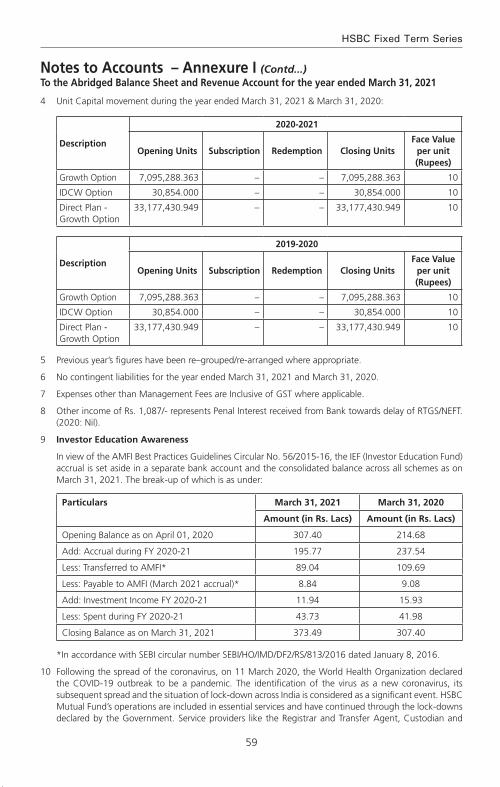
59
HSBC Fixed Term Series
Notes to Accounts – Annexure I (Contd...)To the Abridged Balance Sheet and Revenue Account for the year ended March 31, 2021
4 Unit Capital movement during the year ended March 31, 2021 & March 31, 2020:
Description
2020-2021
Opening Units Subscription Redemption Closing UnitsFace value
per unit (Rupees)
Growth Option 7,095,288.363 – – 7,095,288.363 10
IDCW Option 30,854.000 – – 30,854.000 10
Direct Plan - Growth Option
33,177,430.949 – – 33,177,430.949 10
Description
2019-2020
Opening Units Subscription Redemption Closing UnitsFace value
per unit (Rupees)
Growth Option 7,095,288.363 – – 7,095,288.363 10
IDCW Option 30,854.000 – – 30,854.000 10
Direct Plan - Growth Option
33,177,430.949 – – 33,177,430.949 10
5 Previous year’s figures have been re–grouped/re-arranged where appropriate.
6 No contingent liabilities for the year ended March 31, 2021 and March 31, 2020.
7 Expenses other than Management Fees are Inclusive of GST where applicable.
8 Other income of Rs. 1,087/- represents Penal Interest received from Bank towards delay of RTGS/NEFT. (2020: Nil).
9 Investor Education Awareness
In view of the AMFI Best Practices Guidelines Circular No. 56/2015-16, the IEF (Investor Education Fund) accrual is set aside in a separate bank account and the consolidated balance across all schemes as on March 31, 2021. The break-up of which is as under:
Particulars March 31, 2021 March 31, 2020
Amount (in Rs. Lacs) Amount (in Rs. Lacs)
Opening Balance as on April 01, 2020 307.40 214.68
Add: Accrual during FY 2020-21 195.77 237.54
Less: Transferred to AMFI* 89.04 109.69
Less: Payable to AMFI (March 2021 accrual)* 8.84 9.08
Add: Investment Income FY 2020-21 11.94 15.93
Less: Spent during FY 2020-21 43.73 41.98
Closing Balance as on March 31, 2021 373.49 307.40
*In accordance with SEBI circular number SEBI/HO/IMD/DF2/RS/813/2016 dated January 8, 2016.
10 Following the spread of the coronavirus, on 11 March 2020, the World Health Organization declared the COVID-19 outbreak to be a pandemic. The identification of the virus as a new coronavirus, its subsequent spread and the situation of lock-down across India is considered as a significant event. HSBC Mutual Fund’s operations are included in essential services and have continued through the lock-downs declared by the Government. Service providers like the Registrar and Transfer Agent, Custodian and
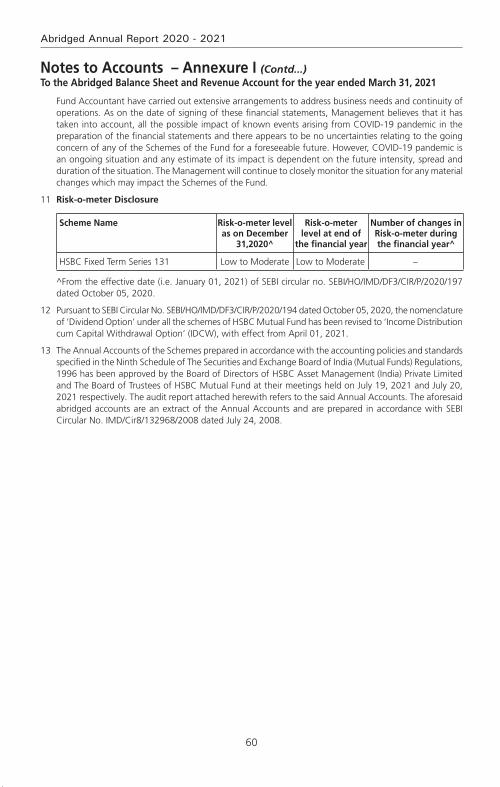
60
Abridged Annual Report 2020 - 2021
Notes to Accounts – Annexure I (Contd...)To the Abridged Balance Sheet and Revenue Account for the year ended March 31, 2021
Fund Accountant have carried out extensive arrangements to address business needs and continuity of operations. As on the date of signing of these financial statements, Management believes that it has taken into account, all the possible impact of known events arising from COVID-19 pandemic in the preparation of the financial statements and there appears to be no uncertainties relating to the going concern of any of the Schemes of the Fund for a foreseeable future. However, COVID-19 pandemic is an ongoing situation and any estimate of its impact is dependent on the future intensity, spread and duration of the situation. The Management will continue to closely monitor the situation for any material changes which may impact the Schemes of the Fund.
11 Risk-o-meter Disclosure
Scheme Name Risk-o-meter level as on December
31,2020^
Risk-o-meter level at end of
the financial year
Number of changes in Risk-o-meter during the financial year^
HSBC Fixed Term Series 131 Low to Moderate Low to Moderate –
^From the effective date (i.e. January 01, 2021) of SEBI circular no. SEBI/HO/IMD/DF3/CIR/P/2020/197 dated October 05, 2020.
12 Pursuant to SEBI Circular No. SEBI/HO/IMD/DF3/CIR/P/2020/194 dated October 05, 2020, the nomenclature of ‘Dividend Option’ under all the schemes of HSBC Mutual Fund has been revised to ‘Income Distribution cum Capital Withdrawal Option’ (IDCW), with effect from April 01, 2021.
13 The Annual Accounts of the Schemes prepared in accordance with the accounting policies and standards specified in the Ninth Schedule of The Securities and Exchange Board of India (Mutual Funds) Regulations, 1996 has been approved by the Board of Directors of HSBC Asset Management (India) Private Limited and The Board of Trustees of HSBC Mutual Fund at their meetings held on July 19, 2021 and July 20, 2021 respectively. The audit report attached herewith refers to the said Annual Accounts. The aforesaid abridged accounts are an extract of the Annual Accounts and are prepared in accordance with SEBI Circular No. IMD/Cir8/132968/2008 dated July 24, 2008.

61
HSBC Fixed Term Series
Rs. in Lakhs
HSBC FIxED TERM SERIES 132As at
March 31, 2021As at
March 31, 2020
LIABILITIES1 Unit Capital 12,322.58 12,322.582 Reserves & Surplus2.1 Unit Premium Reserves – –2.2 Unrealised Appreciation Reserve 0.10 3.032.3 Other Reserves 3,206.69 1,988.963 Loans & Borrowings – –4 Current Liabilities & Provisions4.1 Provision for Doubtful Income/Deposits – –4.2 Other Current Liabilities & Provisions 9.08 7.67
TOTAL 15,538.45 14,322.24
ASSETS1 Investments1.1 Listed Securities:1.1.1 Equity Shares – –1.1.2 Preference Shares – –1.1.3 Equity Linked Debentures – –1.1.4 Other Debentures & Bonds 11,048.65 11,618.661.1.5 Securitised Debt Securities – –1.2 Securities Awaited Listing:1.2.1 Equity Shares – –1.2.2 Preference Shares – –1.2.3 Equity Linked Debentures – –1.2.4 Other Debentures & Bonds – –1.2.5 Securitised Debt Securities – –1.3 Unlisted Securities:1.3.1 Equity Shares – –1.3.2 Preference Shares – –1.3.3 Equity Linked Debentures – –1.3.4 Other Debentures & Bonds – 1,217.411.3.5 Securitised Debt Securities – –1.4 Government Securities – 933.041.5 Treasury Bills 498.83 –1.6 Commercial Paper – –1.7 Certificate of Deposits 1,497.19 –1.8 Bill Rediscounting – –1.9 Units of Domestic Mutual Fund – –1.10 Foreign Securities – –
Total Investments 13,044.67 13,769.112 Deposits 1.94 –3 Other Current Assets3.1 Cash & Bank Balance 0.09 0.023.2 TREPS / Reverse Repo Lending 1,890.17 62.433.3 Others 601.58 490.684 Deferred Revenue Expenditure (to the extent not written off) – –
TOTAL 15,538.45 14,322.24
Notes to Accounts - Annexure I
Abridged Balance Sheet as at March 31, 2021
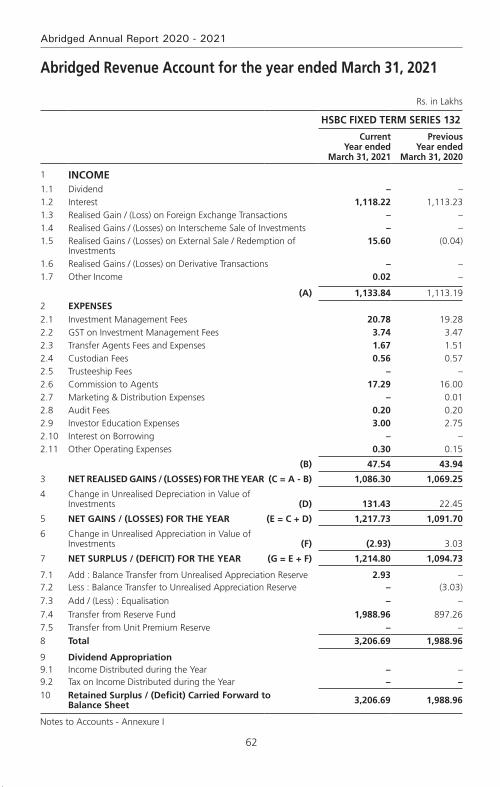
62
Abridged Annual Report 2020 - 2021
Abridged Revenue Account for the year ended March 31, 2021
Rs. in Lakhs
HSBC FIxED TERM SERIES 132
Current Year ended
March 31, 2021
Previous Year ended
March 31, 2020
1 INCOME1.1 Dividend – –1.2 Interest 1,118.22 1,113.231.3 Realised Gain / (Loss) on Foreign Exchange Transactions – –1.4 Realised Gains / (Losses) on Interscheme Sale of Investments – –1.5 Realised Gains / (Losses) on External Sale / Redemption of
Investments15.60 (0.04)
1.6 Realised Gains / (Losses) on Derivative Transactions – –1.7 Other Income 0.02 –
(A) 1,133.84 1,113.192 ExPENSES2.1 Investment Management Fees 20.78 19.282.2 GST on Investment Management Fees 3.74 3.472.3 Transfer Agents Fees and Expenses 1.67 1.512.4 Custodian Fees 0.56 0.572.5 Trusteeship Fees – –2.6 Commission to Agents 17.29 16.002.7 Marketing & Distribution Expenses – 0.012.8 Audit Fees 0.20 0.202.9 Investor Education Expenses 3.00 2.752.10 Interest on Borrowing – –2.11 Other Operating Expenses 0.30 0.15
(B) 47.54 43.94
3 NET REALISED GAINS / (LOSSES) FOR THE YEAR (C = A - B) 1,086.30 1,069.25
4 Change in Unrealised Depreciation in Value of Investments (D) 131.43 22.45
5 NET GAINS / (LOSSES) FOR THE YEAR (E = C + D) 1,217.73 1,091.70
6 Change in Unrealised Appreciation in Value of Investments (F) (2.93) 3.03
7 NET SURPLUS / (DEFICIT) FOR THE YEAR (G = E + F) 1,214.80 1,094.73
7.1 Add : Balance Transfer from Unrealised Appreciation Reserve 2.93 –7.2 Less : Balance Transfer to Unrealised Appreciation Reserve – (3.03)7.3 Add / (Less) : Equalisation – –7.4 Transfer from Reserve Fund 1,988.96 897.267.5 Transfer from Unit Premium Reserve – –8 Total 3,206.69 1,988.96
9 Dividend Appropriation9.1 Income Distributed during the Year – –9.2 Tax on Income Distributed during the Year – –10 Retained Surplus / (Deficit) Carried Forward to
Balance Sheet 3,206.69 1,988.96
Notes to Accounts - Annexure I
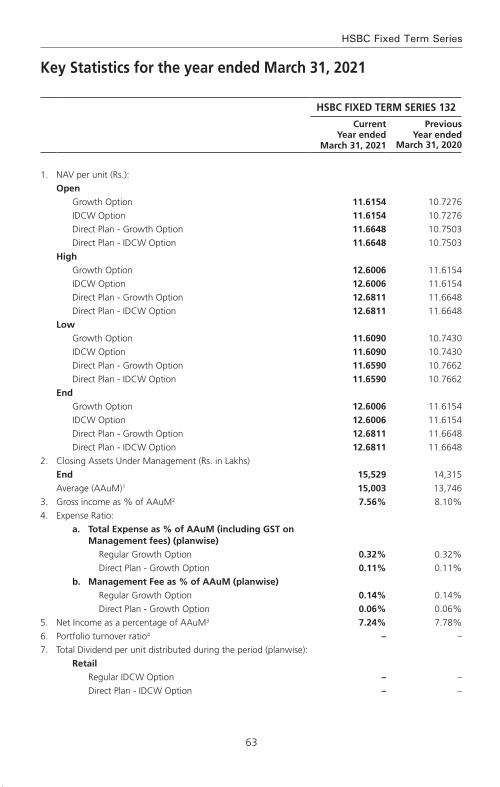
63
HSBC Fixed Term Series
HSBC FIxED TERM SERIES 132
Current Year ended
March 31, 2021
Previous Year ended
March 31, 2020
1. NAV per unit (Rs.):Open
Growth Option 11.6154 10.7276IDCW Option 11.6154 10.7276Direct Plan - Growth Option 11.6648 10.7503Direct Plan - IDCW Option 11.6648 10.7503
HighGrowth Option 12.6006 11.6154IDCW Option 12.6006 11.6154Direct Plan - Growth Option 12.6811 11.6648Direct Plan - IDCW Option 12.6811 11.6648
LowGrowth Option 11.6090 10.7430IDCW Option 11.6090 10.7430Direct Plan - Growth Option 11.6590 10.7662Direct Plan - IDCW Option 11.6590 10.7662
EndGrowth Option 12.6006 11.6154IDCW Option 12.6006 11.6154Direct Plan - Growth Option 12.6811 11.6648Direct Plan - IDCW Option 12.6811 11.6648
2. Closing Assets Under Management (Rs. in Lakhs)End 15,529 14,315Average (AAuM)1 15,003 13,746
3. Gross income as % of AAuM2 7.56% 8.10%4. Expense Ratio:
a. Total Expense as % of AAuM (including GST on Management fees) (planwise)
Regular Growth Option 0.32% 0.32%Direct Plan - Growth Option 0.11% 0.11%
b. Management Fee as % of AAuM (planwise)Regular Growth Option 0.14% 0.14%Direct Plan - Growth Option 0.06% 0.06%
5. Net Income as a percentage of AAuM3 7.24% 7.78%6. Portfolio turnover ratio4 – –7. Total Dividend per unit distributed during the period (planwise):
RetailRegular IDCW Option – –Direct Plan - IDCW Option – –
key Statistics for the year ended March 31, 2021
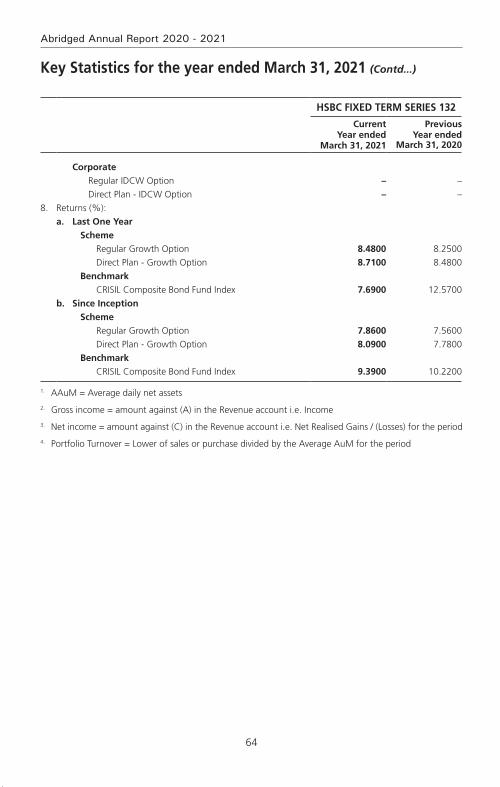
64
Abridged Annual Report 2020 - 2021
HSBC FIxED TERM SERIES 132
Current Year ended
March 31, 2021
Previous Year ended
March 31, 2020
CorporateRegular IDCW Option – –Direct Plan - IDCW Option – –
8. Returns (%):a. Last One Year
SchemeRegular Growth Option 8.4800 8.2500Direct Plan - Growth Option 8.7100 8.4800
BenchmarkCRISIL Composite Bond Fund Index 7.6900 12.5700
b. Since InceptionScheme
Regular Growth Option 7.8600 7.5600Direct Plan - Growth Option 8.0900 7.7800
BenchmarkCRISIL Composite Bond Fund Index 9.3900 10.2200
1. AAuM = Average daily net assets
2. Gross income = amount against (A) in the Revenue account i.e. Income
3. Net income = amount against (C) in the Revenue account i.e. Net Realised Gains / (Losses) for the period
4. Portfolio Turnover = Lower of sales or purchase divided by the Average AuM for the period
key Statistics for the year ended March 31, 2021 (Contd...)