groundwater remediation and alternate energy at white
TRANSCRIPT
Slide 1
National Aeronautics and Space AdministrationWhite Sands Test Facility
1
Groundwater Remediation and Alternate Energy at White Sands
Test Facility
September 2008
Holger FischerFacility Operations
Slide 2
National Aeronautics and Space AdministrationWhite Sands Test Facility
2
• WSTF Core Capabilities• WSTF Groundwater Remediation Program• Alternate Energy Programs
– Wind Energy– Solar Testbed
• Solar • Vehicle Plug-in• Energy Storage
– Utility Size Peak Shaving Solar Generation Plant
Content
Slide 3

National Aeronautics and Space AdministrationWhite Sands Test Facility
3
• WSTF Core Capabilities– Remote Hazardous Testing of Reactive, Explosive,
and Toxic Materials and Fluids – Hypergolic Fluids Materials and Systems Testing – Oxygen Materials and System Testing– Hypervelocity Impact Testing– Flight Hardware Processing – Propulsion Testing
Slide 4
National Aeronautics and Space AdministrationWhite Sands Test Facility
4
Remote Hazardous Testing of Reactive, Explosive, and Toxic
Materials and Fluids
Solid Propellant Te
500 lbs LH2/LO2 Test
2000 lbs LH2/LO2 Test

Slide 5
National Aeronautics and Space AdministrationWhite Sands Test Facility
5
Hypergolic Fluids Materials and Systems Testing
Ignition Test
Evaporation Tank Unit
NASA-STD 6001 Test
Slide 6
National Aeronautics and Space AdministrationWhite Sands Test Facility
6
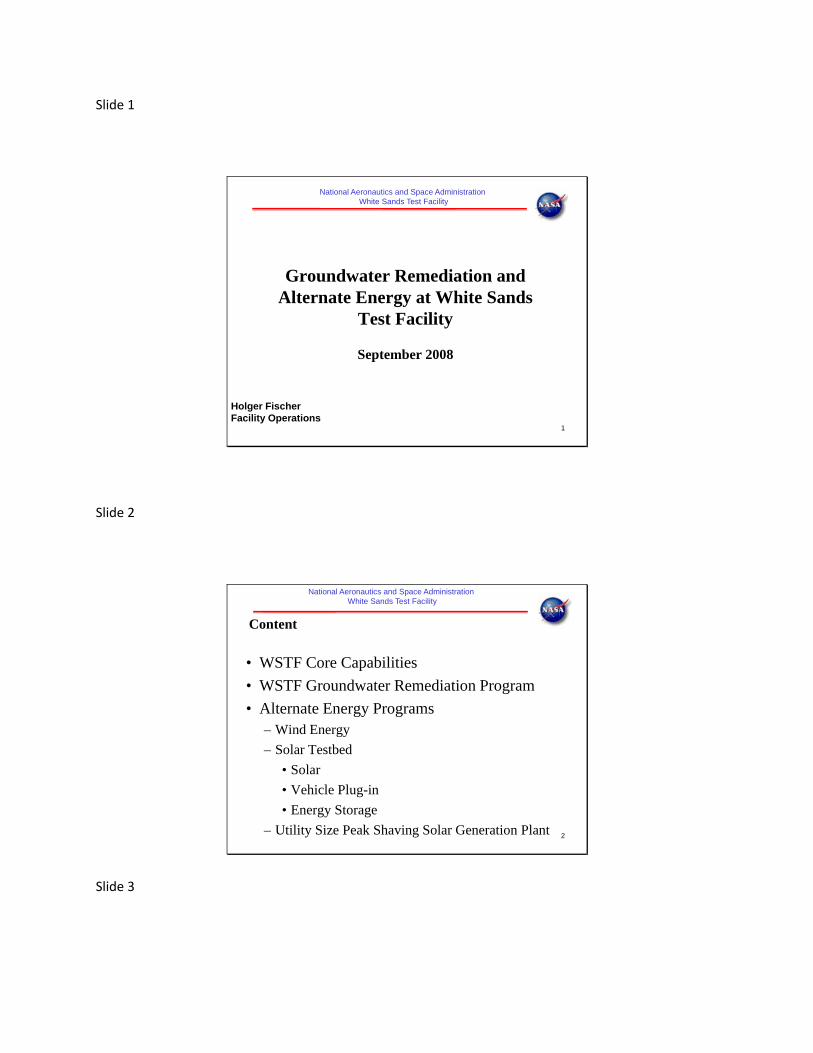
300 Propulsion Testing
Night firing of Shuttle Forward RCS primary and vernier
thrusters
Night firing of ShuttleAft RCS primary and24 lb thrust vernier
engines
Slide 7
National Aeronautics and Space AdministrationWhite Sands Test Facility
7
400 Propulsion Testing
Cassini - Saturn orbitinsertion engine glowsduring 3 hr. 20 min.continuous firing
500 Fuel Treatment Unit
Static firing of DC-Xwith 4 LOX/Hydrogen
RL10-A5 engines
Slide 8
National Aeronautics and Space AdministrationWhite Sands Test Facility
8
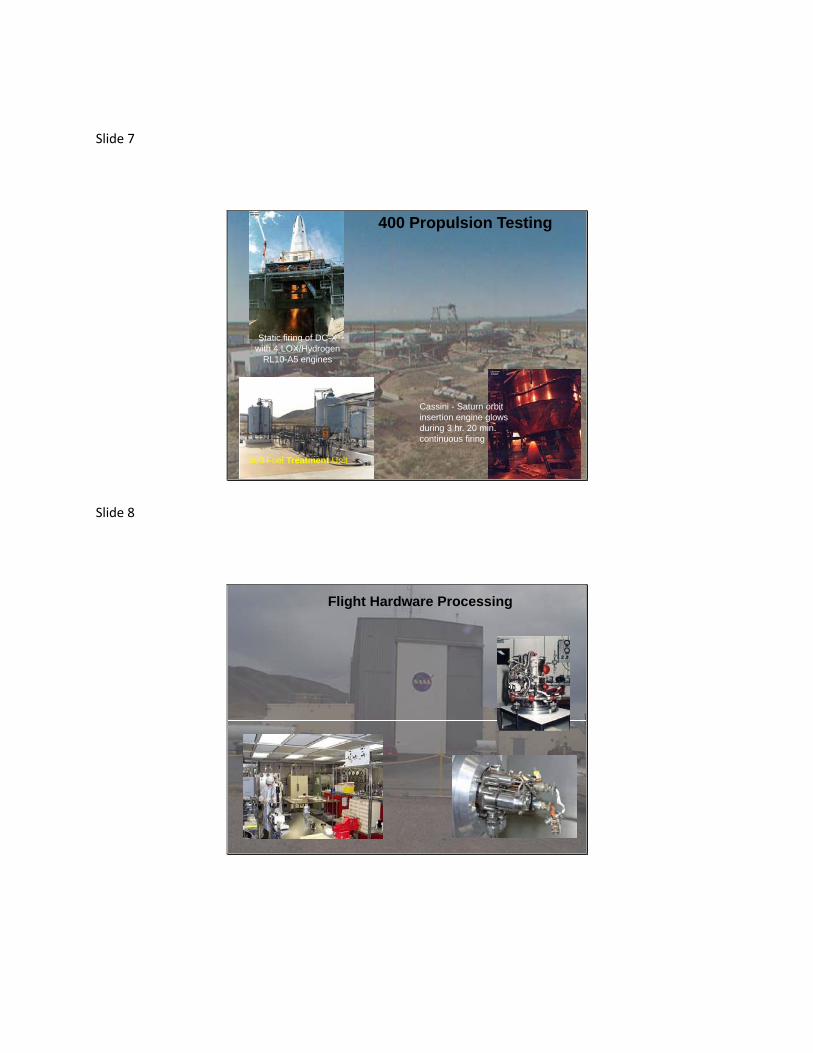
Flight Hardware Processing
Slide 9
National Aeronautics and Space AdministrationWhite Sands Test Facility
9
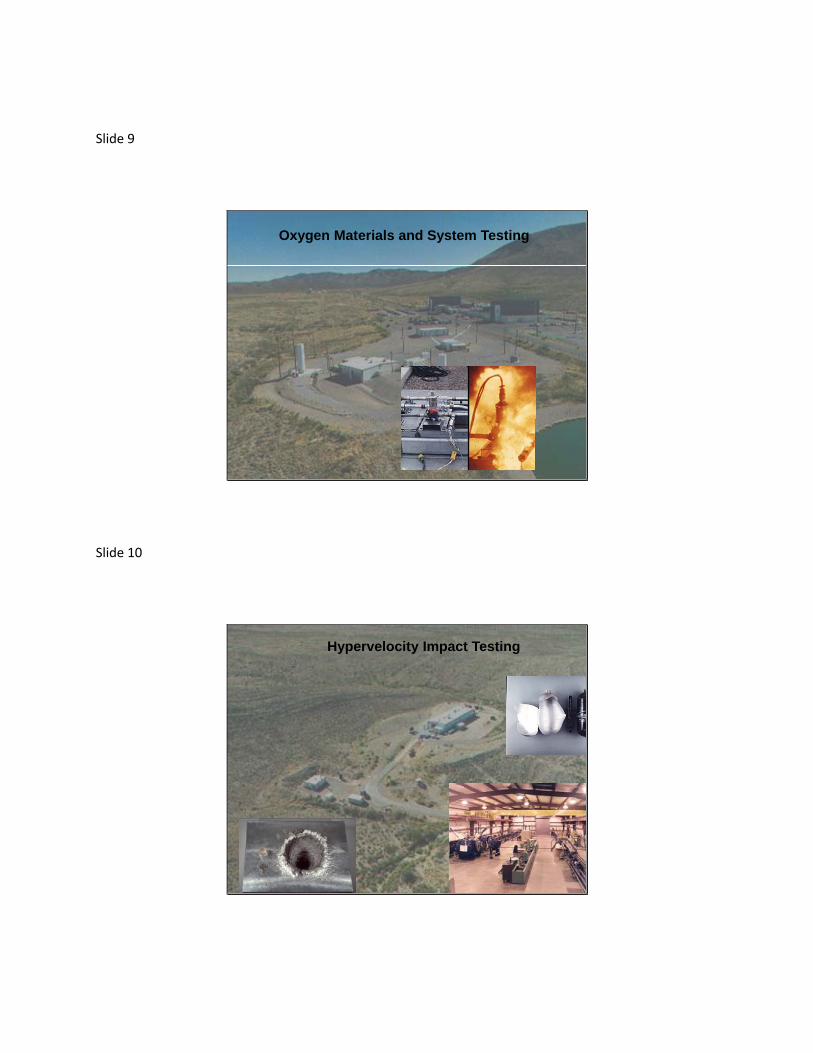
Oxygen Materials and System Testing
Slide 10
National Aeronautics and Space AdministrationWhite Sands Test Facility
10
270/272Hypervelocity Impact Testing
Slide 11
National Aeronautics and Space AdministrationWhite Sands Test Facility
11
Restoration Program
• Historic operations and practices beginning in the 1960’s (through the early 1980’s) resulted in contamination of WSTF’s groundwater.– Propulsion system testing programs:
• N-Nitrosodimethylamine (NDMA)• Dimethylnitramine (DMN)
– Component Servicing and Cleaning Operations:• Trichloroethene (TCE)• Tetrachloroethene (PCE) • Freons: (11, 21, and 113)
• WSTF contaminated ground water is NASA HQ’s greatest liability (estimated at $350M).
Slide 12
National Aeronautics and Space AdministrationWhite Sands Test Facility
12
Restoration Program
• Priority: Protect the public’s health and the health of our workforce.– Containment
• Stop the migration of contaminated groundwater• Greatest health-risk liability pursued initially
– Plume Front– Mid Plume– Source Areas
– Restoration• Clean-up the environment to preexisting conditions
Slide 13
National Aeronautics and Space AdministrationWhite Sands Test Facility
13
Public and Employee Assessment
• There is no impact to any drinking water well– Includes public wells and the NASA supply well.
• There is no public exposure– Groundwater is several hundred feet below ground.– No air or surface water exposure.– Plume is moving very slowly to the west.
• Plume Front Treatment system will stop this westward movement.
• NASA performs on-going monitoring– More than 200 wells and zones are routinely sampled.– ~850 samples are obtained monthly and analyzed for over 300
different hazardous chemicals.
Slide 14
National Aeronautics and Space AdministrationWhite Sands Test Facility
14
Containment and Restoration
• A Staged Approach over ~60 years:– Attack the greatest risk to public health first
• Stabilize the plume front (in progress)
– Stop migration of contaminant into the plume front• Extraction and treatment at the Mid Plume Constriction Area
(~2009)• 60% Review completed, 90% Review Oct 08
– Stop migration into the Mid Plume Constriction Area • Clean up the source areas (~2012-2015)
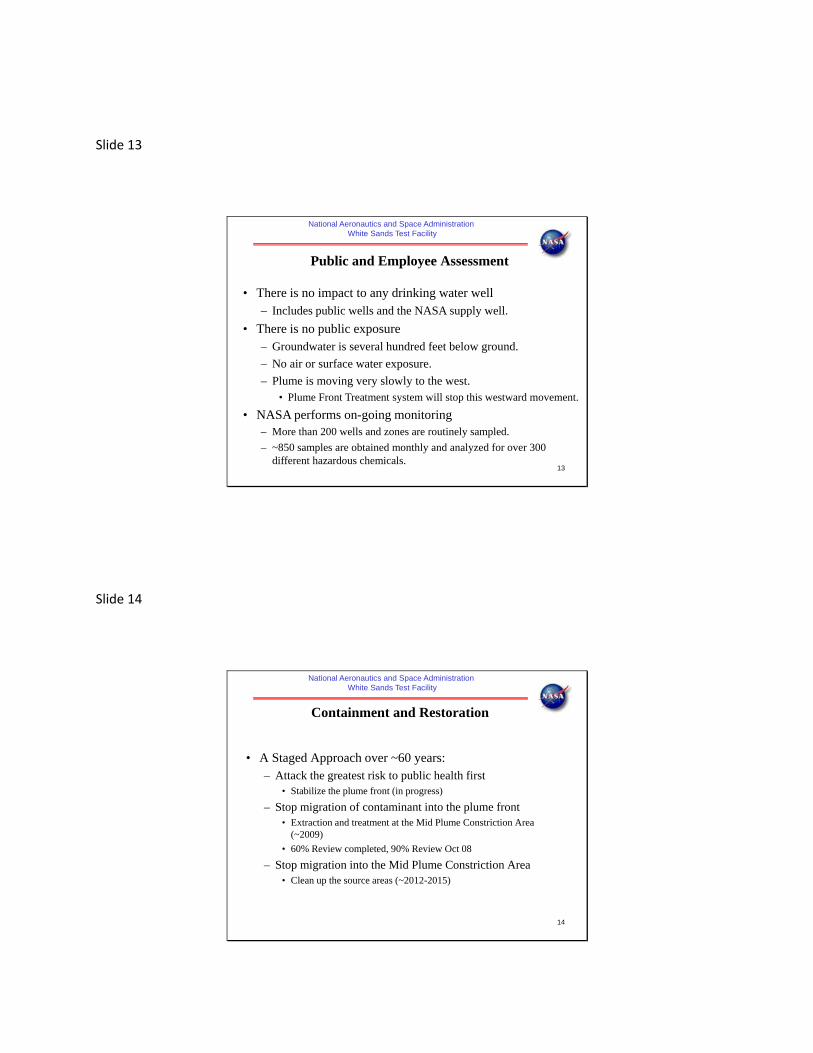
Slide 15
National Aeronautics and Space AdministrationWhite Sands Test Facility
15
Groundwater Plume Map
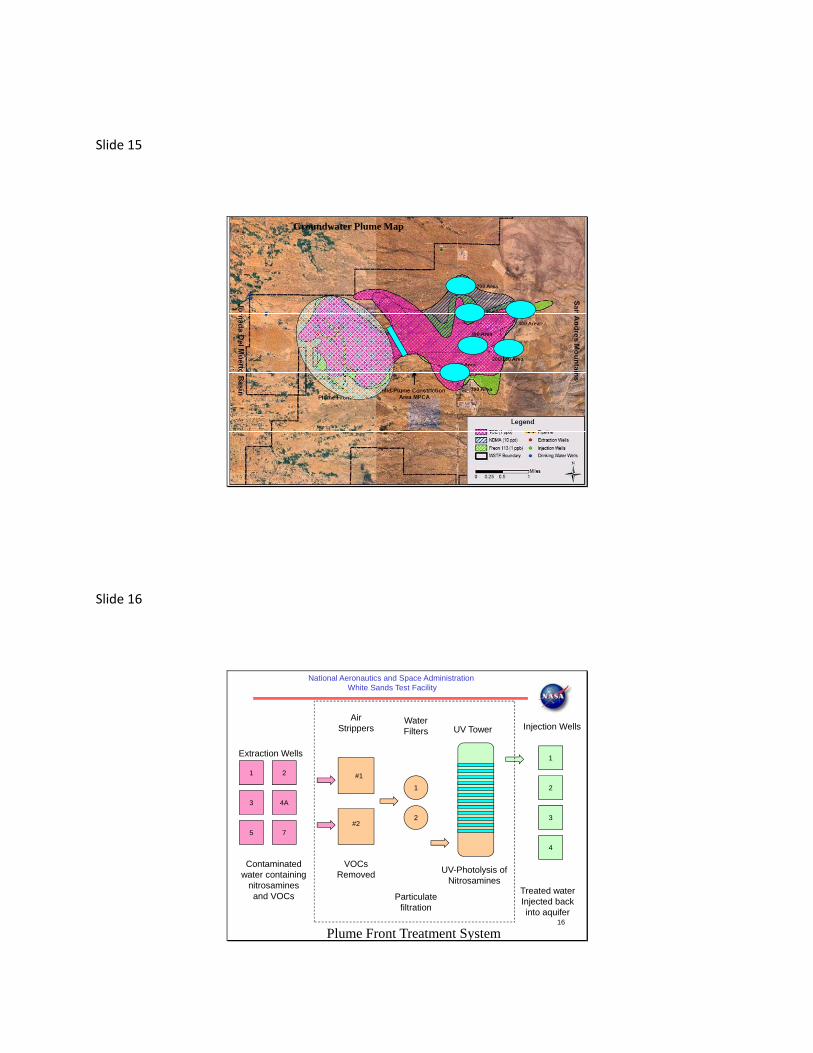
Slide 16
National Aeronautics and Space AdministrationWhite Sands Test Facility
16
1 2
3 4A
5 7
#1
#2
1
2
1
2
3
4
Extraction Wells
Air Strippers
Water Filters Injection WellsUV Tower
Contaminated water containing
nitrosamines and VOCs
VOCs Removed
Particulate filtration
UV-Photolysis of Nitrosamines
Treated water Injected back into aquifer
Plume Front Treatment System

Slide 17
National Aeronautics and Space AdministrationWhite Sands Test Facility
17
Effluent
Influent
UV Lamp Enclosures
Calgon Rayox® Tower UV Reactor in Bldg. 650
Slide 18
National Aeronautics and Space AdministrationWhite Sands Test Facility
18
Alternate Energy
Wind Energy

Slide 19
National Aeronautics and Space AdministrationWhite Sands Test Facility
19
Alternate Energy
• Wind Energy:– Monitored Quartzite Mountain Range since about 2005 – 4 to
5 class wind site– Initial EA performed by WSTF Environmental
• Bat study (Fall 2007/Spring 2009)• Radar issues with WSMR (formed working group with WSMR test
ops)• Cost for road to access planned wind farm area about $ 5 – 6 M
– Developers interested in constructing wind and solar– EPEC interested in future wind project
Slide 20
National Aeronautics and Space AdministrationWhite Sands Test Facility
20
Alternate Energy
20
PV Parking Shade Structure
NMSU Shade Structure
Slide 21
National Aeronautics and Space AdministrationWhite Sands Test Facility
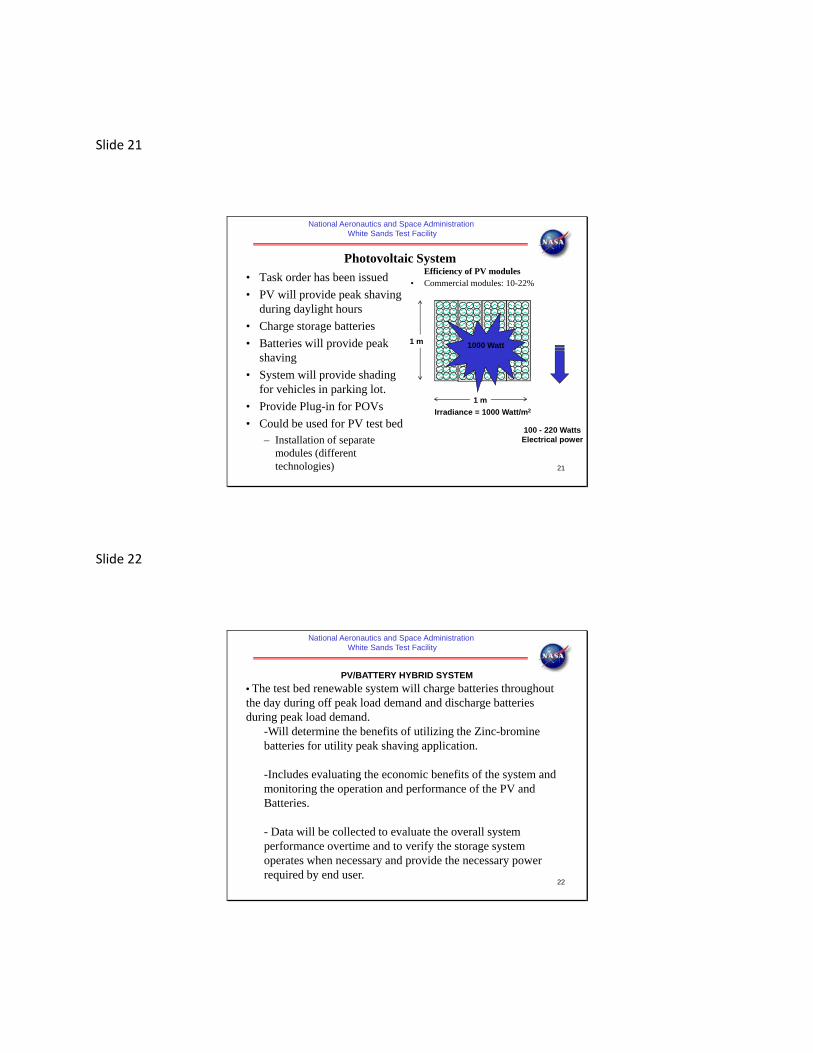
21
Photovoltaic System• Task order has been issued• PV will provide peak shaving
during daylight hours• Charge storage batteries• Batteries will provide peak
shaving • System will provide shading
for vehicles in parking lot.• Provide Plug-in for POVs• Could be used for PV test bed
– Installation of separate modules (different technologies)
Efficiency of PV modules• Commercial modules: 10-22%
Irradiance = 1000 Watt/m2
1 m
1 m
100 - 220 WattsElectrical power
1000 Watt
Slide 22
National Aeronautics and Space AdministrationWhite Sands Test Facility
22
PV/BATTERY HYBRID SYSTEM• The test bed renewable system will charge batteries throughout the day during off peak load demand and discharge batteries during peak load demand.
-Will determine the benefits of utilizing the Zinc-bromine batteries for utility peak shaving application.
-Includes evaluating the economic benefits of the system and monitoring the operation and performance of the PV and Batteries.
- Data will be collected to evaluate the overall system performance overtime and to verify the storage system operates when necessary and provide the necessary power required by end user.

Slide 23
National Aeronautics and Space AdministrationWhite Sands Test Facility
23
Energy Storage Unit
50kWh Zinc Bromine Battery module
Battery Bank
- Two 50kWh battery modules connected electrically in parallel.
- A control system (Power Conversion System (PCS,inverter)- A pair of electrolyte storage tanks. - Electrolyte circulation equipment.
Advantages
- Uses electrodes that do not take part in the reactions consequently there is no material deterioration that would cause long term lossperformance.
- Rapid recharge (two to four hours).- Deep discharge capability (100%). - Built in thermal management system. - Can be used for large scale application.
Slide 24
National Aeronautics and Space AdministrationWhite Sands Test Facility
24
PV/Battery Hybrid System for Energy Storage Use
PV Subarray10kW
50kWp – PV Array
+
PV Subarray10kW
PV Subarray10kW
PV Subarray10kW
PV Subarray10kW
PV ArrayCombiner Box
PV Array DC Disconnect
PCSConverterDC/DC
50 kWHCapacity
50 kWHCapacity
50kw Inverter
30-150VDC
120AC 60HZ
30-150VDC
120AC 60HZ
PCSConverterDC/DC
Integrated Inverter
100kWh/50kW Battery BankZinc-Bromine
Bi-Directional
PV Energy
Battery Energy
RECmeter
Net Power Flow
WSTF Utility Grid
AC Disconnect
AC Disconnect
AC load Panel
Slide 25
National Aeronautics and Space AdministrationWhite Sands Test Facility
25
Shaded PV Structure Plan View
23,293 sq mArea
Available
1200 sq mPV shade
S
N
Slide 26
National Aeronautics and Space AdministrationWhite Sands Test Facility
26
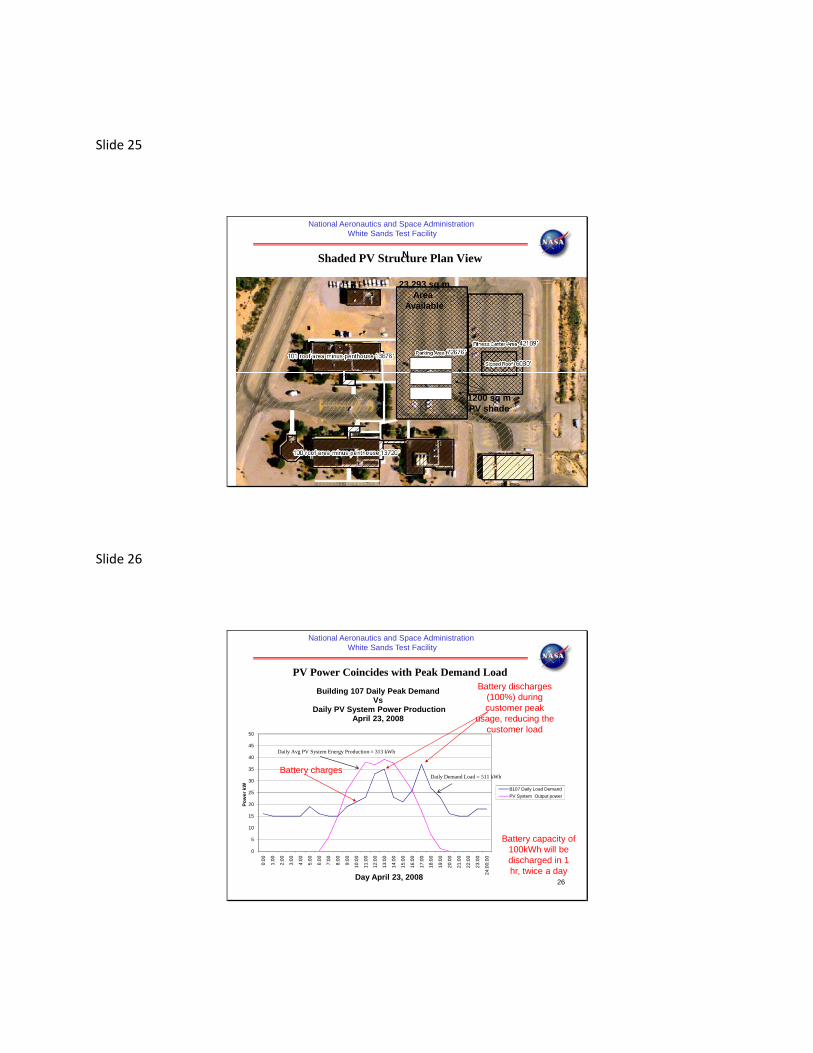
PV Power Coincides with Peak Demand Load
0
5
10
15
20
25
30
35
40
45
50
0:00
1:00
2:00
3:00
4:00
5:00
6:00
7:00
8:00
9:00
10:0
0
11:0
0
12:0
0
13:0
0
14:0
0
15:0
0
16:0
0
17:0
0
18:0
0
19:0
0
20:0
0
21:0
0
22:0
0
23:0
0
24:0
0:00
Pow
er k
W
Day April 23, 2008
Building 107 Daily Peak Demand Vs
Daily PV System Power ProductionApril 23, 2008
B107 Daily Load DemandPV System Output power
Daily Avg PV System Energy Production = 313 kWh
Daily Demand Load = 511 kWh
Battery discharges (100%) during customer peak
usage, reducing the customer load
Battery charges
Battery capacity of 100kWh will be discharged in 1 hr, twice a day

Slide 27
National Aeronautics and Space AdministrationWhite Sands Test Facility
27
System’s Energy Production
0
1000
2000
3000
4000
5000
6000
7000
8000
9000
10000
Jan Feb Mar Apr May Jun Jun Aug Sep Oct Nov Dec
Monthly PV System Energy production kWh
Annual Energy = 94,426 kWh/yr
kWh
Slide 28
National Aeronautics and Space AdministrationWhite Sands Test Facility
28
Alternate Energy
Utility Size Solar Peak Shaving
Nevada Solar One
Slide 29
National Aeronautics and Space AdministrationWhite Sands Test Facility
29
• NASA owns land at White Sands and could be available for a solar power generation plant– Approximately 400 acres– Existing injection and monitoring wells that NASA will
need full access to (including drilling rigs)• Plant will be built and operated by the developer.• Developer is responsible for ALL financing of
design, construction and operation.
Peak Shaving Solar Plant
Slide 30
National Aeronautics and Space AdministrationWhite Sands Test Facility
30
• Current Electrical Power to WSTF– 69kV Transmission line to Apollo Substation from El
Paso Electric Company– 24kV distribution line down to NASA land area– Substation rated for 15MW
• NASA desires power to support site– Currently NASA has a ~5.5MW peak load– DOD Installation on-site is also interested in renewable
energy
Peak Shaving Solar Plant

Slide 31
National Aeronautics and Space AdministrationWhite Sands Test Facility
31
• Preliminary Environmental Assessment (EA) has been completed, but a complete EA is required prior to construction start
• NASA facility-type support is available, but a cost will be associated with this support
Peak Shaving Solar Plant
Slide 32
National Aeronautics and Space AdministrationWhite Sands Test Facility
32
• RFI on GovBiz (14 responses)– Number:2008LUA– Posted Date: May 14, 2008– Response Date: May 27, 2008– 14 responses recieved
• Industry day on Aug 12, 2008– MMA Renewable Ventures, LLC– Abencs/Abengoa– Acciona– International Power America– EverGuard Roofing, LLC– Greenlight Sunstream Holdings, LLC (dba Helios Energy)– Consolidated Solar Technologies– North Wind Inc– Juwi Solar
Peak Shaving Solar Plant
Slide 33
National Aeronautics and Space AdministrationWhite Sands Test Facility
33
• New website for vendors has been generated. We are in the process of posting project information and Q&A
• Working with NREL an NMSU on the RFP (late October)
• Options going forward:– Provide land to EPEC for 92 MW CSP plant (E-Solar)– Sell power to PNM or other NM utilities– Sell power out of state– Use power only behind the meter
(NASA, WSMR, HAFB, Fort Bliss)
Peak Shaving Solar Plant
Slide 34
National Aeronautics and Space AdministrationWhite Sands Test Facility
34
Questions?
Slide 35
National Aeronautics and Space AdministrationWhite Sands Test Facility
35
Backup Slides
Slide 36
National Aeronautics and Space AdministrationWhite Sands Test Facility
36

Slide 37
National Aeronautics and Space AdministrationWhite Sands Test Facility
37
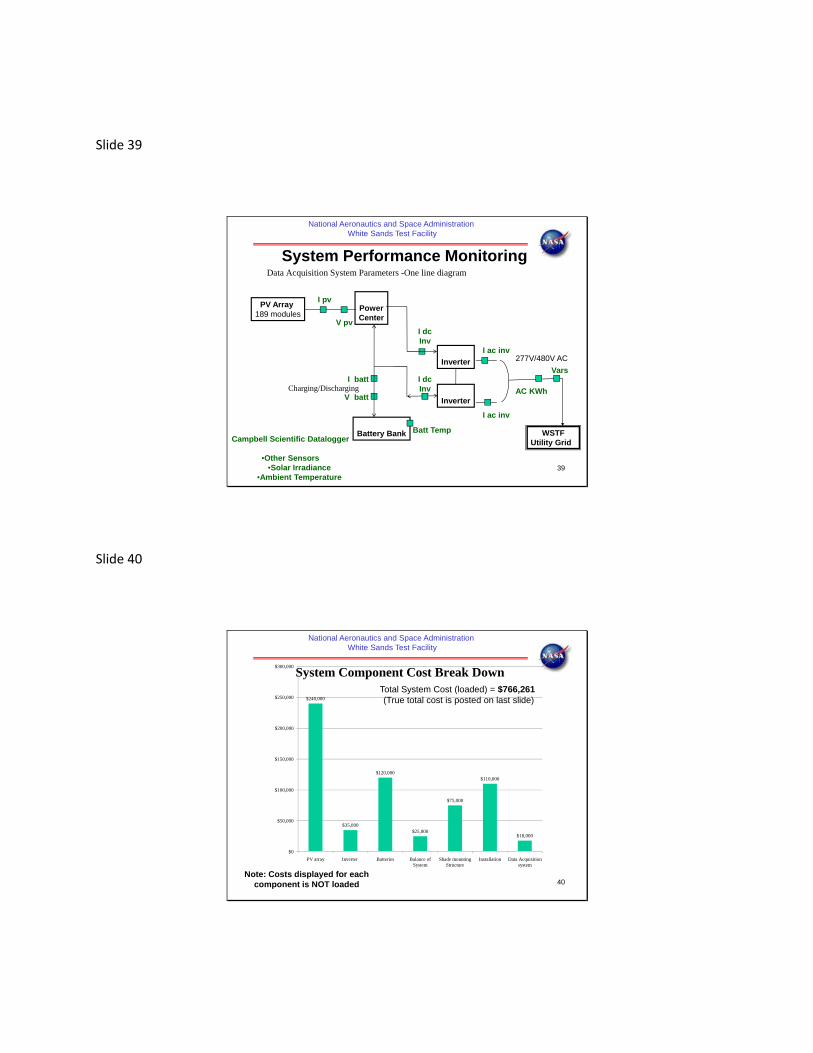
Component Description• PV Solar Modules: 189 total, 265Wp each. Will provide shade for 1,200 m² (~13000 ft²).• Balance of Systems
– 2 Power Conditioning Unit for battery voltage control to manage power delivery bi-directional. Manage the charge and discharge rates of battery and ensure compliance with utility harmonics standards.
• Inverter: Utility Interactive 50kW rating– Zinc Bromine Battery package has integrated utility inverter built in.
• Batteries (Zinc Bromine): 2-50kW battery bank for Total of 100kWh storage capacity. – Batteries will be programmed to discharge during customer peak (weekday)
usage, thereby reducing customer demand charges. • Data Acquisition System
– The DAS system will monitor real-time PV production, customer load, battery State of Charge, Charging and Discharging voltages and currents.
– Campbell Scientific datalogger
Slide 38
National Aeronautics and Space AdministrationWhite Sands Test Facility
38
Energy Production SummaryPV Production
Quantity Value UnitsRated Capacity 50 kWMean Output 294 kWh/dayCapacity Factor 24.5 %Total Production 94426 kWh/year
BatteryQuantity Value UnitsRated Capacity 50 kWUsable Storage Capacity 100 kWDischarging 4 HrEnergy Out 154 kWh/dayRound Trip Efficiency 77 %Battery losses 23 %
Environmental Benefits - EmissionsPollutant Value UnitsCarbon Dioxide 36,557 Kg/yrCarbon Monoxide 0 Kg/yrSulfur dioxide 158 Kg/yrNitrogen Oxide 77.5 Kg/yr
Slide 39
National Aeronautics and Space AdministrationWhite Sands Test Facility
39
Data Acquisition System Parameters -One line diagram
PV Array189 modules
PowerCenter
Battery Bank
Inverter
Inverter
277V/480V AC
WSTFUtility Grid
I pv
I dc Inv
I batt
V batt
Campbell Scientific Datalogger
•Other Sensors•Solar Irradiance
•Ambient Temperature
I ac inv
I ac inv
Batt Temp
AC KWh
V pv
I dcInv
Vars
System Performance Monitoring
Charging/Discharging
Slide 40
National Aeronautics and Space AdministrationWhite Sands Test Facility
40
System Component Cost Break Down
$240,000
$35,000
$120,000
$25,000
$75,000
$110,000
$18,000
$0
$50,000
$100,000
$150,000
$200,000
$250,000
$300,000
PV array Inverter Batteries Balance of System
Shade mounting Structure
Installation Data Acquisition system
Total System Cost (loaded) = $766,261(True total cost is posted on last slide)
Note: Costs displayed for each component is NOT loaded

Slide 41
National Aeronautics and Space AdministrationWhite Sands Test Facility
41
SummarySystem Architecture
Total Area 1,200 m² (~13,000 ft²)
PV Array Rating 50 kW (approx. 189 PV modules of 265Wp)
Battery Bank 100 kWh Capacity (2 – 50kW modules)
Cost Break Down
PV Array Modules $240K
Inverter $35K
Batteries Zinc Bromine $120K
Balance of System $25K (2 power conditioning unit)
Shade Parking Structure$75K (~$20k to $30k per 18kW array)
Installation $110K
Data Acquisition System $18K (hardware only)
Cost Per Watt Installed $12.46/Watt (PV/Battery application--$8/Watt PV only)
Total Loaded Cost of System $766,261
Annual Energy Production
AC Energy Production 94,426 kWH (output of PV/Battery System)
* Capacity Factor 24.0% Levelized Cost of Energy $0.25 kW/H (cost to produce energy kWh)
Slide 42
National Aeronautics and Space AdministrationWhite Sands Test Facility
42
New Technologies
• Implement Renewable Initiatives by combining the best technologies to arrive at most efficient system(s):
– Solar power PV system– Geothermal heat pump systems– Wind generated power– Solar powered thermal system– Hydrogen– Fuel cells– Hybrid systems
Slide 43
National Aeronautics and Space AdministrationWhite Sands Test Facility
43
5 Year Long Term Goals• Develop a Solar Powered PV farm for providing electrical power to
WSTF and sell surplus power to utility companies.• Develop 3MW of wind generated power with wind farm on top of
Quartzite Mt.• Utilize geothermal heat pump systems for WSTF facilities heating and
cooling to greatly reduce utility costs.• Provide renewable energy test beds for supporting future Orion energy
requirements.
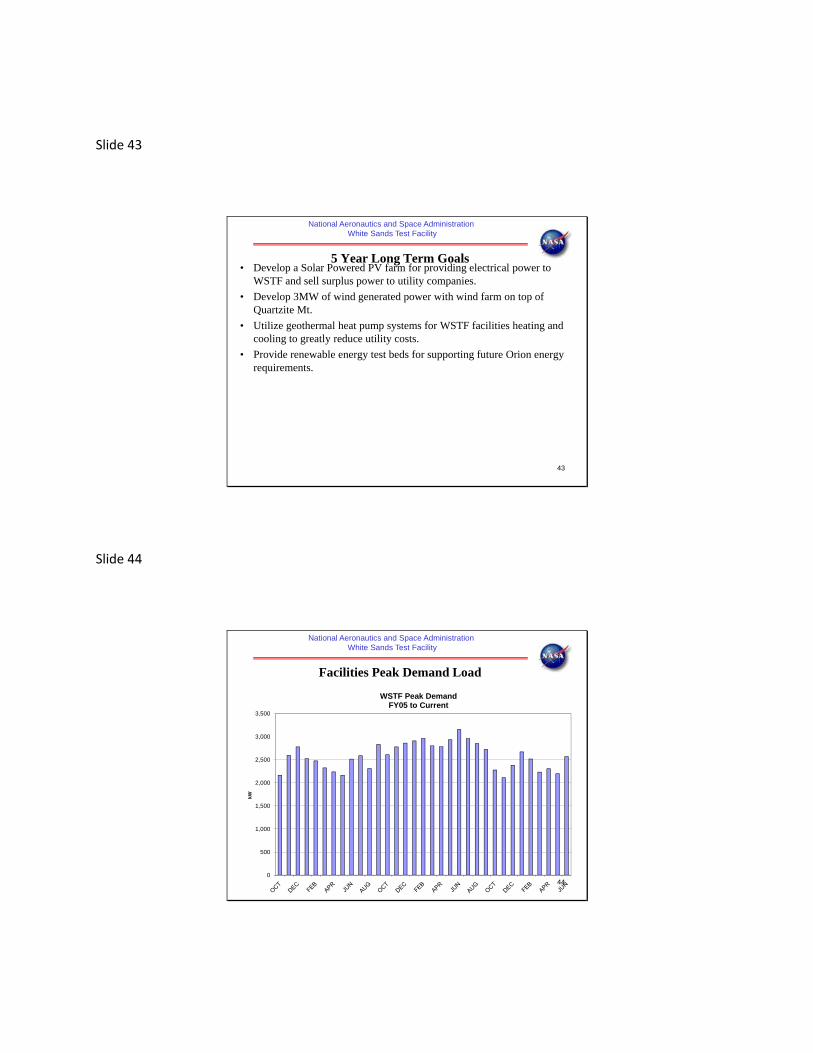
Slide 44
National Aeronautics and Space AdministrationWhite Sands Test Facility
44
Facilities Peak Demand Load
0
500
1,000
1,500
2,000
2,500
3,000
3,500
kW
WSTF Peak DemandFY05 to Current

Slide 45
National Aeronautics and Space AdministrationWhite Sands Test Facility
45
Facility’s Peak Demand and PV System Production
72
9890 90
84 85
117
98 100105
8896 98 95 95
111 109100
71
136
91
77
112
92 92
0 0 0 0 0 0 05.7
14.82
26.2232.3
38 36.8639.1437.6231.92
25.8417.1
7.221.140 0 0 0 00
20
40
60
80
100
120
140
160
Pow
er k
W
Day-April 23, 2008
Day - April 23, 2008PV Power Vs WSTF Peak Demand Load
AC Load Demand kWPV System Output power
WSTF Demand