ground-water hydrology - in.gov · ground-water hydrology, ground-water resources 127 aquifers...
TRANSCRIPT

Ground-water Hydrology, Ground-water Resources 123
GROUND-WATER HYDROLOGY
Ground-water supplies are obtained from aquifers,which are subsurface units of rock and unconsolidat-ed sediments capable of yielding water in usablequantities to wells and springs. The hydrologic char-acteristics of aquifers and natural chemistry of groundwater determine the availability and suitability ofground-water resources for specific uses.
GROUND-WATER RESOURCES
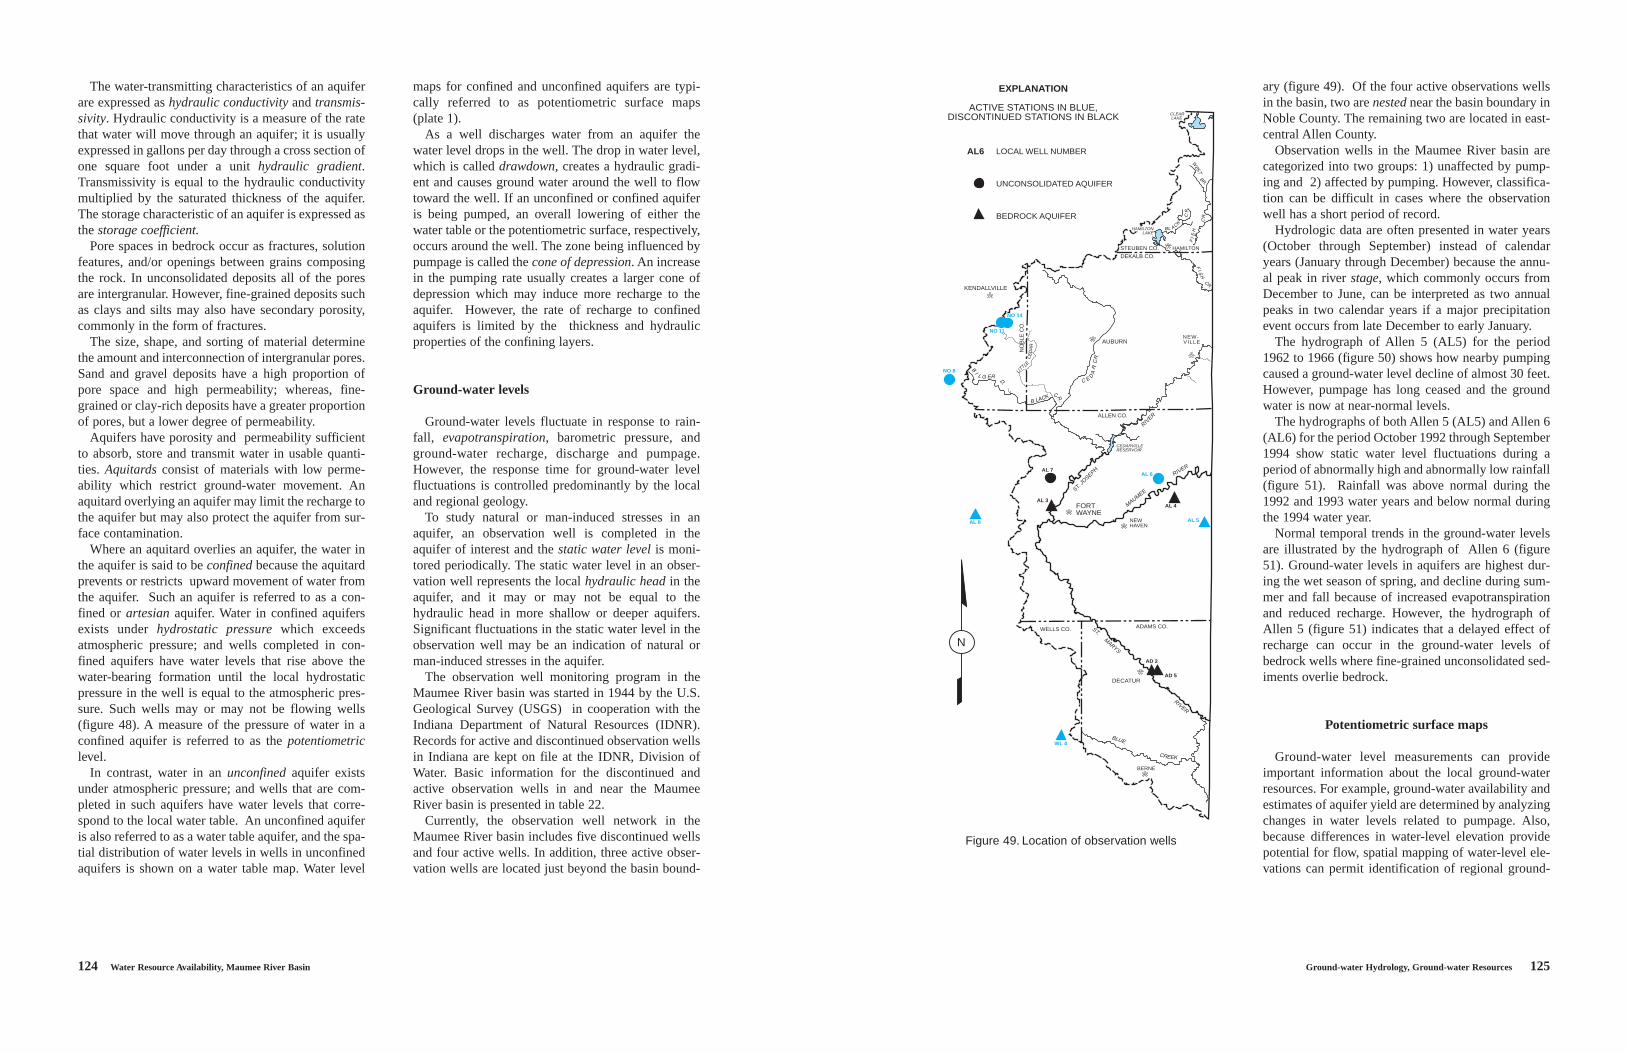
Ground water is the part of precipitation that entersthe ground and percolates downward through uncon-solidated materials and openings in bedrock until itreaches thewater table(figure 48). The water table isthe surface below which all openings in the rock orunconsolidated materials are filled with water. Waterentering this zone of saturation is called recharge.
Ground water, in response to gravity, moves fromareas of recharge to areas of discharge. In a generalway, the configuration of the water table approximatesthe overlying topography (figure 48). In valleys anddepressions where the land surface intersects thewater table, water is discharged from the ground-
water system to become part of the surface-water system.
The interaction between ground water and surfacewater can moderate seasonal water-level fluctuationsin both systems. During dry periods, baseflow orground-water discharge to streams, can help maintainminimum stream flows. Conversely, during floodstages surface water can recharge the ground-watersystem by vertical recharge on the water-coveredflood plain and bank storage through streambed sedi-ments. The net effect of ground-water recharge is areduction in flood peaks and replenishment of avail-able ground-water supplies.
Aquifer properties which affect ground-water avail-ability include aquifer thickness and the size, number,and degree of interconnection of pore spaces withinthe aquifer material. These properties affect the abili-ty of an aquifer to store and transmit ground water.Porosity, the ratio of void space to unit volume of rockor soil, is an index of how much ground water theaquifer can store. The permeability, a property largelycontrolled by size and interconnection of pore spaceswithin the material, affects the fluid-transmittingcapacity of materials.
POTENTIOMETRICSURFACE OF CONFINED AQUIFER
WATER-TABLEWELL
FLOWINGARTESIAN WELL
LAKE
STREAM
ARTESIAN WELL
WATERTABLE
UNCONFINED
UNCONFINED
UNCONFINED
AQUITARD AQUITARD AQUITARD
AQUITARD AQUITARD AQUITARD
BEDROCK AQUIFER
BEDROCK AQUIFER
BEDROCK AQUIFER
RECHARGE OF AQUIFERS BY
PRECIPITATION
CONFINED (ARTESIAN) AQUIFER
CONFINED (ARTESIAN) AQUIFER
CONFINED (ARTESIAN) AQUIFER
AQUIFERAQUIFERAQUIFER
(WATER TABLE)
(WATER TABLE)
(WATER TABLE)
Figure 48. Aquifer types and ground-water movement
124 Water Resource Availability, Maumee River Basin Ground-water Hydrology, Ground-water Resources 125
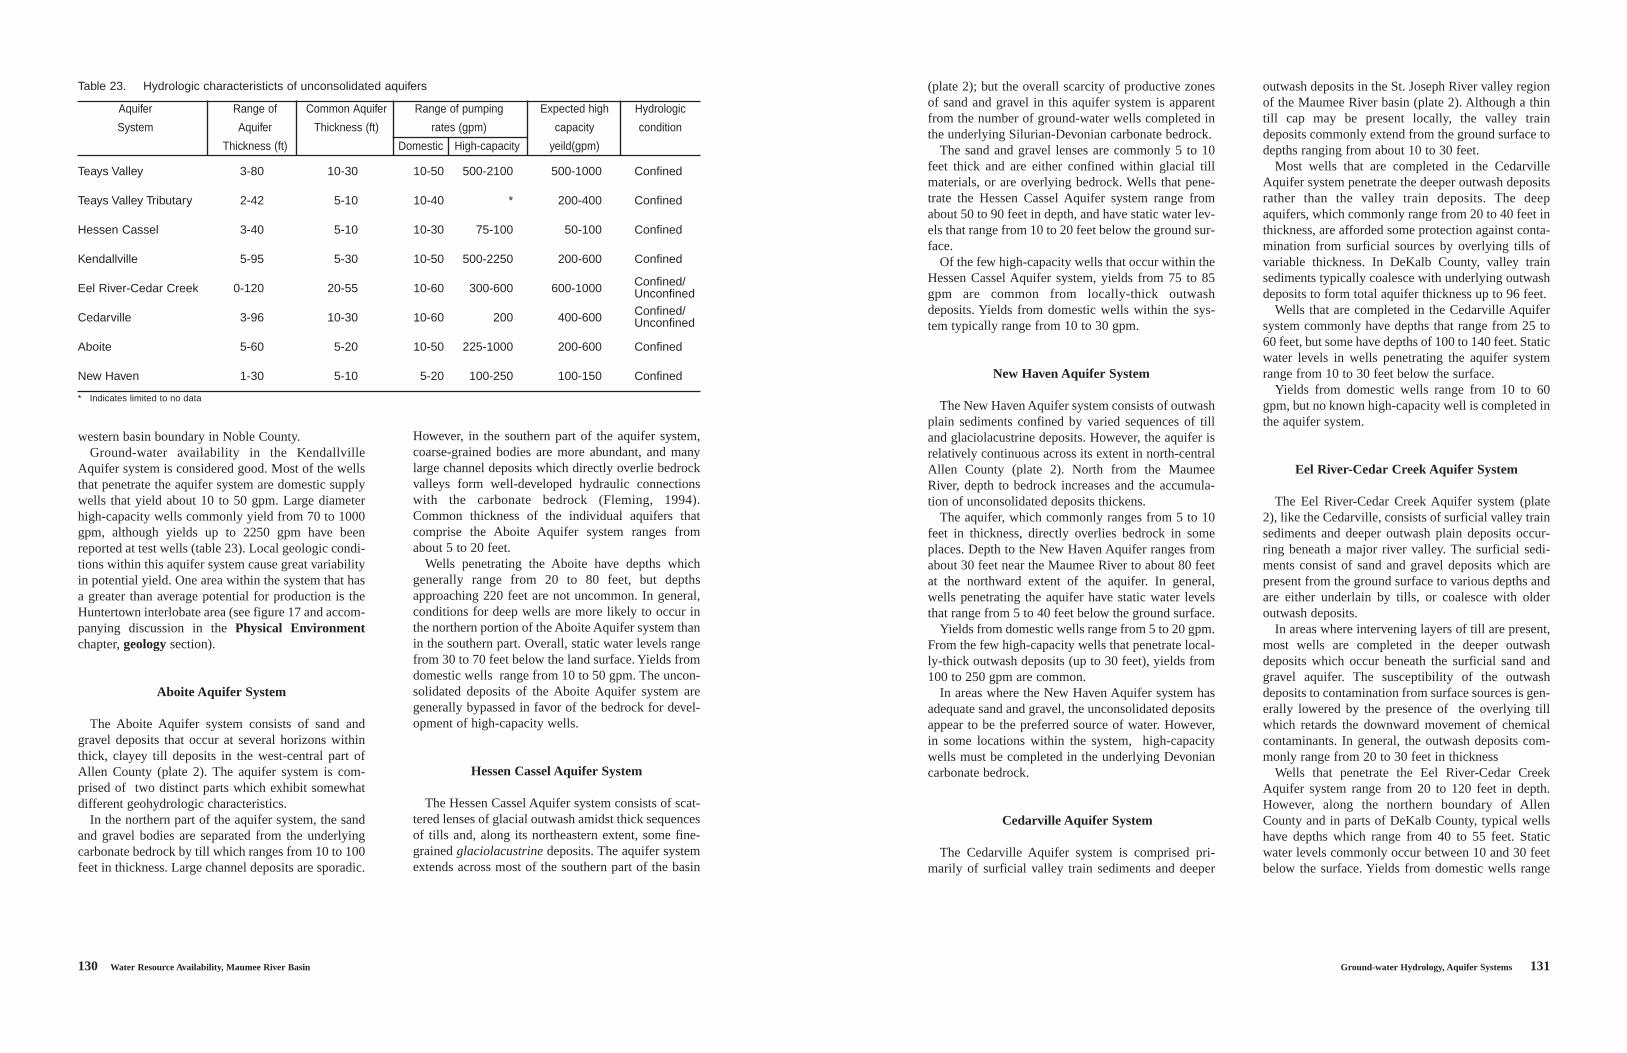
ary (figure 49). Of the four active observations wellsin the basin, two are nestednear the basin boundary inNoble County. The remaining two are located in east-central Allen County.
Observation wells in the Maumee River basin arecategorized into two groups: 1) unaffected by pump-ing and 2) affected by pumping. However, classifica-tion can be difficult in cases where the observationwell has a short period of record.
Hydrologic data are often presented in water years(October through September) instead of calendaryears (January through December) because the annu-al peak in river stage, which commonly occurs fromDecember to June, can be interpreted as two annualpeaks in two calendar years if a major precipitationevent occurs from late December to early January.
The hydrograph of Allen 5 (AL5) for the period1962 to 1966 (figure 50) shows how nearby pumpingcaused a ground-water level decline of almost 30 feet.However, pumpage has long ceased and the groundwater is now at near-normal levels.
The hydrographs of both Allen 5 (AL5) and Allen 6(AL6) for the period October 1992 through September1994 show static water level fluctuations during aperiod of abnormally high and abnormally low rainfall(figure 51). Rainfall was above normal during the1992 and 1993 water years and below normal duringthe 1994 water year.
Normal temporal trends in the ground-water levelsare illustrated by the hydrograph of Allen 6 (figure51). Ground-water levels in aquifers are highest dur-ing the wet season of spring, and decline during sum-mer and fall because of increased evapotranspirationand reduced recharge. However, the hydrograph ofAllen 5 (figure 51) indicates that a delayed effect ofrecharge can occur in the ground-water levels ofbedrock wells where fine-grained unconsolidated sed-iments overlie bedrock.
Potentiometric surface maps
Ground-water level measurements can provideimportant information about the local ground-waterresources. For example, ground-water availability andestimates of aquifer yield are determined by analyzingchanges in water levels related to pumpage. Also,because differences in water-level elevation providepotential for flow, spatial mapping of water-level ele-vations can permit identification of regional ground-
ADAMS CO.
ALLEN CO.
NO
BLE
CO
.
STEUBEN CO.
DEKALB CO.
WELLS CO.
CLEAR LAKE
ST. MARYS
MAUMEE
RIVER
ST. JO
SEPH
RIVER
CEDARVILLERESERVOIR
RIVER
HAMILTONLAKE
AUBURN
FORT WAYNE
NEWHAVEN
HAMILTON
NEW- VILLE
BERNE
DECATUR
KENDALLVILLE
EXPLANATION
ACTIVE STATIONS IN BLUE,DISCONTINUED STATIONS IN BLACK
LOCAL WELL NUMBER
UNCONSOLIDATED AQUIFER
BEDROCK AQUIFER
AL6
NO 14
NO 11
AL 7
AL 3
AL 6
AL 4
AL 5
AD 2
AD 5
WL 4
AL 8
NO 8
N
Figure 49. Location of observation wells
maps for confined and unconfined aquifers are typi-cally referred to as potentiometric surface maps (plate 1).
As a well discharges water from an aquifer thewater level drops in the well. The drop in water level,which is called drawdown,creates a hydraulic gradi-ent and causes ground water around the well to flowtoward the well. If an unconfined or confined aquiferis being pumped, an overall lowering of either thewater table or the potentiometric surface, respectively,occurs around the well. The zone being influenced bypumpage is called the cone of depression. An increasein the pumping rate usually creates a larger cone ofdepression which may induce more recharge to theaquifer. However, the rate of recharge to confinedaquifers is limited by the thickness and hydraulicproperties of the confining layers.
Ground-water levels
Ground-water levels fluctuate in response to rain-fall, evapotranspiration, barometric pressure, andground-water recharge, discharge and pumpage.However, the response time for ground-water levelfluctuations is controlled predominantly by the localand regional geology.
To study natural or man-induced stresses in anaquifer, an observation well is completed in theaquifer of interest and the static water levelis moni-tored periodically. The static water level in an obser-vation well represents the local hydraulic headin theaquifer, and it may or may not be equal to thehydraulic head in more shallow or deeper aquifers.Significant fluctuations in the static water level in theobservation well may be an indication of natural orman-induced stresses in the aquifer.
The observation well monitoring program in theMaumee River basin was started in 1944 by the U.S.Geological Survey (USGS) in cooperation with theIndiana Department of Natural Resources (IDNR).Records for active and discontinued observation wellsin Indiana are kept on file at the IDNR, Division ofWater. Basic information for the discontinued andactive observation wells in and near the MaumeeRiver basin is presented in table 22.
Currently, the observation well network in theMaumee River basin includes five discontinued wellsand four active wells. In addition, three active obser-vation wells are located just beyond the basin bound-
The water-transmitting characteristics of an aquiferare expressed as hydraulic conductivityand transmis-sivity. Hydraulic conductivity is a measure of the ratethat water will move through an aquifer; it is usuallyexpressed in gallons per day through a cross section ofone square foot under a unit hydraulic gradient.Transmissivity is equal to the hydraulic conductivitymultiplied by the saturated thickness of the aquifer.The storage characteristic of an aquifer is expressed asthe storage coefficient.
Pore spaces in bedrock occur as fractures, solutionfeatures, and/or openings between grains composingthe rock. In unconsolidated deposits all of the poresare intergranular. However, fine-grained deposits suchas clays and silts may also have secondary porosity,commonly in the form of fractures.
The size, shape, and sorting of material determinethe amount and interconnection of intergranular pores.Sand and gravel deposits have a high proportion ofpore space and high permeability; whereas, fine-grained or clay-rich deposits have a greater proportionof pores, but a lower degree of permeability.
Aquifers have porosity and permeability sufficientto absorb, store and transmit water in usable quanti-ties. Aquitards consist of materials with low perme-ability which restrict ground-water movement. Anaquitard overlying an aquifer may limit the recharge tothe aquifer but may also protect the aquifer from sur-face contamination.
Where an aquitard overlies an aquifer, the water inthe aquifer is said to be confinedbecause the aquitardprevents or restricts upward movement of water fromthe aquifer. Such an aquifer is referred to as a con-fined or artesianaquifer. Water in confined aquifersexists under hydrostatic pressurewhich exceedsatmospheric pressure; and wells completed in con-fined aquifers have water levels that rise above thewater-bearing formation until the local hydrostaticpressure in the well is equal to the atmospheric pres-sure. Such wells may or may not be flowing wells(figure 48). A measure of the pressure of water in aconfined aquifer is referred to as the potentiometriclevel.
In contrast, water in an unconfinedaquifer existsunder atmospheric pressure; and wells that are com-pleted in such aquifers have water levels that corre-spond to the local water table. An unconfined aquiferis also referred to as a water table aquifer, and the spa-tial distribution of water levels in wells in unconfinedaquifers is shown on a water table map. Water level

126 Water Resource Availability, Maumee River Basin Ground-water Hydrology, Ground-water Resources 127
aquifers generally coincide with the bedrock surfacetopographic highs in southern Adams County (see fig-ure 21).
Regional ground-water flow for both aquifer typesfollows the same general direction as the MaumeeRiver and its major tributaries. Ground-water flow inthe unconsolidated sediments is away from thedrainage divide in the north and west and toward thesouth and east. Regional ground-water flow in thebedrock is primarily from the south and west, toward
tive water-level elevations correspond closely to thetopographic highs of more than 1,100 feet m.s.l. innortheastern Steuben County and the topographiclows of almost 700 feet m.s.l. along the lowest reach-es of the Maumee River.
Ground-water level elevations in the bedrockaquifers range from approximately 825 feet m.s.l. atthe southern tip of the basin to less than 725 feet m.s.l.where the Maumee River leaves the state. Maximumelevations of the ground-water levels in the bedrock
Figure 50. Water-level decline in observation well affected by nearby pumpage
water flow direction, as well as areas of recharge anddischarge.
The potentiometric surface map of the MaumeeRiver basin (plate 1) depicts the elevation to whichwater levels will rise in wells. The map is created byplotting elevations of the static water level and thengenerating contours or lines of equal elevation. Staticwater levels used to develop the potentiometric sur-face map are from wells completed at various depthsand under confined and unconfined conditions.
In general, the composite potentiometric surfacefollows the overlying land-surface topography andintersects the land surface at major streams. Theexpected flow path is downslope or perpendicular tothe potentiometric surface contours. Natural ground-water flow is from areas of recharge toward areas ofdischarge. Depths to the potentiometric surfacedo notrepresent appropriate depths for water wells. Instead,
wells must be completed in the water-yielding forma-tion, with depth into the aquifer based primarily onlocal geologic conditions, such as thickness and later-al extent of the aquifer, in combination with the poten-tiometric surface.
The generalized potentiometric surface map of theMaumee River basin displays contours for two sepa-rate aquifer types, unconsolidated aquifers in thenorth, and bedrock in the south. In Allen County,where both aquifer types are used, overlapping con-tours are displayed. In regions where the unconsoli-dated and bedrock aquifer systems overlap, ground-water levels generally occur at similar elevations.
Ground-water level elevations for unconsolidatedaquifers in the Maumee River basin range from 1050feet m.s.l. (mean sea level datum) near Clear Lake inthe northern tip of the basin to less than 725 feet m.s.l.where the Maumee River enters Ohio. These respec-
Table 22. Summary of active and discontinued observation wells
Well number: U.S. Geological Survey county code and well number. Well locations are shown in figure 49.Period of record: Refers to calender year, whether or not data encompasses entire year.Aquifer system: SD, Silurian-Devonian carbonates; KEN, Kendallville; NH, New HavenAquifer type: LS, limestone; SG, sand and gravel; S, sand.Aquifer classification: A, affected by pumping; UA, unaffected by pumping.
Well Period Aquifer Aquifer Aquifer Well Well Aquifer County number of record System Type Condition Diameter Depth Class
(in.) (ft.)
Adams *AD2 1945-66 SD LS Confined 6 250 A*AD5 1950-66 SD LS Confined 6 144 A
Allen AL5 1962-1 SD LS Confined 4 97 A AL6 1966- NH SG Confined 6 84 UA AL82 1988- SD LS Confined 6 193 A*AL3 1944-66 SD LS Confined 8 400 A *AL4 1962-71 SD LS(?) Confined 4 44 A*AL7 1980-82 KEN S Confined 5 148 UA
Noble NO83 1966-71;74- KEN SG Confined 6 149 UANO11 1987- KEN SG Confined 6 216 UANO14 1987- KEN SG Confined 6 145 UA
Wells WL44 1967-5 SD LS Confined 6 79 UA
* Discontinued wells.1 No record 1972.2 Outside Maumee River basin boundary, approximately 3 miles.3 Outside Maumee River basin boundary approximately 1/2 mile.4 Outside Maumee River basin boundary approximately 1 mile.5 Semi-annual tape-down readings only, September 1971 to December 1981.
Ground-water Hydrology, Ground-water Resources 127
aquifers generally coincide with the bedrock surfacetopographic highs in southern Adams County (see fig-ure 21).
Regional ground-water flow for both aquifer typesfollows the same general direction as the MaumeeRiver and its major tributaries. Ground-water flow inthe unconsolidated sediments is away from thedrainage divide in the north and west and toward thesouth and east. Regional ground-water flow in thebedrock is primarily from the south and west, toward
tive water-level elevations correspond closely to thetopographic highs of more than 1,100 feet m.s.l. innortheastern Steuben County and the topographiclows of almost 700 feet m.s.l. along the lowest reach-es of the Maumee River.
Ground-water level elevations in the bedrockaquifers range from approximately 825 feet m.s.l. atthe southern tip of the basin to less than 725 feet m.s.l.where the Maumee River leaves the state. Maximumelevations of the ground-water levels in the bedrock
Figure 50. Water-level decline in observation well affected by nearby pumpage

128 Water Resource Availability, Maumee River Basin Ground-water Hydrology, Aquifer Systems 129
the north and east.
AQUIFER SYSTEMS
In this report, the ground-water resources of theMaumee River basin are mapped and described asregional aquifer systems (plate 2). Lack of data inmany parts of the basin and complexity of the depositspreclude detailed aquifer mapping. Much of the dis-cussion of general ground-water conditions in theMaumee River basin is adapted from interpretationsmade by Herring (1969); but mapping and discussionof specific aquifer systems are based on additionaldata and interpretation. For Allen County, moredetailed information is available in a report byFleming (1994).
The unconsolidated and bedrock aquifer systems ofthe Maumee River basin form a single but complexgeohydrologic system. Ground-water supplies in thebasin are generally derived from three principalaquifer groups: 1) valley train, outwash plain, anddiscontinuous sand and gravel deposits; 2) bedrock ofSilurian and Devonian age; and 3) sand and graveldeposits in and above buried bedrock valley systems.
The most important aquifes in the northern part ofthe basin, which comprises about 60 percent of thetotal area, consist of valley train, outwash plain, anddiscontinuous sand and gravel deposits of Pleistoceneage. These deposits vary in thickness and extent, butare sufficiently widespread to serve as primaryaquifers. In most of the southern part of the basin,Silurian and Devonian carbonates form the principalaquifer, although sand and gravel deposits in andabove buried bedrock valleys are important in south-ern Adams County.
Seven unconsolidated aquifer systems are definedin this report according to hydrologic characteristicsof the deposits and environments of deposition (plate2). Table 23 summarizes various hydrologic character-istics of the unconsolidated aquifer systems. Bedrockaquifer systems are defined on the basis of hydrologicand lithologic characteristics; however, not all of thebedrock formations are productive aquifers.
Unconsolidated aquifer systems
The primary unconsolidated aquifer systems in theMaumee River basin include the Kendallville, Aboite,
Hessen Cassel, New Haven, Cedarville, Eel River-Cedar Creek and the Teays Valley and TributaryAquifer systems. Sediments that comprise theseaquifer systems were deposited by glaciers and theirmeltwaters during the Ice Age. Boundaries of theaquifer systems are gradational and individualaquifers may extend across aquifer system bound-aries.
In the northern part of the Maumee River basin,unconsolidated aquifer systems are the primary sourceof ground water. Highly productive zones within theunconsolidated aquifer systems are encounteredwhere thick, coarse-grained sand and gravel depositsoccur.
Kendallville Aquifer System
The Kendallville Aquifer system consists of sandand gravel lenses at various depths within a till andmixed drift complex containing appreciable fine-grained sediments. The aquifer system encompasses asignificant part of northeastern Indiana and possiblypart of northwestern Ohio and southern Michigan. InIndiana, the aquifer system extends into most of thenorthern part of the Maumee River basin (plate 2) andparts of southeastern St. Joseph River basin (IndianaDepartment of Natural Resources, Clendenon andBeaty eds., 1987).
Sediments of the till and mixed drift complex weredeposited by distinct glacial advances resulting inlocal accumulations of more than 350 feet in thick-ness. Individual aquifers, consisting of discontinuoussand and gravel bodies, generally thicken northwardwhere local outwash accumulations may attain up to95 feet in thickness. However, the common thicknessof the sand and gravel deposits ranges from 5 to 30feet. Wells that penetrate the Kendallville Aquifer sys-tem vary widely in depth. Although the overall rangein depth is from 26 to 385 feet, well depths between40 and 180 feet are common across most of theaquifer system. Wells commonly exceed 150 feet indepth along the west edge of the basin near thedrainage divide and in north-central Allen County.
Static water levels are highly variable across theaquifer system. Under typical conditions, static waterlevels range from about 10 to 50 feet in depth.Extreme levels range from above ground at flowingartesian wells near the lake areas in the northern partof the basin, to as much as 138 feet deep along the
1992 1993 1994
JAN
FE
BM
AR
AP
RM
AYJU
NE
JULY
AU
GS
EP
TO
CT
NO
VD
EC
JAN
FE
BM
AR
AP
RM
AYJU
NE
JULY
AU
GS
EP
TO
CT
NO
VD
EC
JAN
FE
BM
AR
AP
RM
AYJU
NE
JULY
AU
GS
EP
T
OC
TN
OV
8
9
10
11
12
13
14
15
8
7
6
5
4
3
2
1
PR
EC
IPIT
ATIO
N IN
INC
HE
S (
FT.
WAY
NE
)W
ATE
R L
EV
EL
BE
LOW
GR
OU
ND
SU
RFA
CE
(IN
FE
ET
)
ALLEN 5
ALLEN 6
AVERAGE MONTHLY PRECIPITATION (1961 - 1990)
ACTUAL MONTHLY PRECIPITATION
Figure 51. Comparison of normal and actual monthly precipitation and water-level fluctuations in an unconsolidatedand a bedrock well
130 Water Resource Availability, Maumee River Basin Ground-water Hydrology, Aquifer Systems 131
(plate 2); but the overall scarcity of productive zonesof sand and gravel in this aquifer system is apparentfrom the number of ground-water wells completed inthe underlying Silurian-Devonian carbonate bedrock.
The sand and gravel lenses are commonly 5 to 10feet thick and are either confined within glacial tillmaterials, or are overlying bedrock. Wells that pene-trate the Hessen Cassel Aquifer system range fromabout 50 to 90 feet in depth, and have static water lev-els that range from 10 to 20 feet below the ground sur-face.
Of the few high-capacity wells that occur within theHessen Cassel Aquifer system, yields from 75 to 85gpm are common from locally-thick outwashdeposits. Yields from domestic wells within the sys-tem typically range from 10 to 30 gpm.
New Haven Aquifer System
The New Haven Aquifer system consists of outwashplain sediments confined by varied sequences of tilland glaciolacustrine deposits. However, the aquifer isrelatively continuous across its extent in north-centralAllen County (plate 2). North from the MaumeeRiver, depth to bedrock increases and the accumula-tion of unconsolidated deposits thickens.
The aquifer, which commonly ranges from 5 to 10feet in thickness, directly overlies bedrock in someplaces. Depth to the New Haven Aquifer ranges fromabout 30 feet near the Maumee River to about 80 feetat the northward extent of the aquifer. In general,wells penetrating the aquifer have static water levelsthat range from 5 to 40 feet below the ground surface.
Yields from domestic wells range from 5 to 20 gpm.From the few high-capacity wells that penetrate local-ly-thick outwash deposits (up to 30 feet), yields from100 to 250 gpm are common.
In areas where the New Haven Aquifer system hasadequate sand and gravel, the unconsolidated depositsappear to be the preferred source of water. However,in some locations within the system, high-capacitywells must be completed in the underlying Devoniancarbonate bedrock.
Cedarville Aquifer System
The Cedarville Aquifer system is comprised pri-marily of surficial valley train sediments and deeper
outwash deposits in the St. Joseph River valley regionof the Maumee River basin (plate 2). Although a thintill cap may be present locally, the valley traindeposits commonly extend from the ground surface todepths ranging from about 10 to 30 feet.
Most wells that are completed in the CedarvilleAquifer system penetrate the deeper outwash depositsrather than the valley train deposits. The deepaquifers, which commonly range from 20 to 40 feet inthickness, are afforded some protection against conta-mination from surficial sources by overlying tills ofvariable thickness. In DeKalb County, valley trainsediments typically coalesce with underlying outwashdeposits to form total aquifer thickness up to 96 feet.
Wells that are completed in the Cedarville Aquifersystem commonly have depths that range from 25 to60 feet, but some have depths of 100 to 140 feet. Staticwater levels in wells penetrating the aquifer systemrange from 10 to 30 feet below the surface.
Yields from domestic wells range from 10 to 60gpm, but no known high-capacity well is completed inthe aquifer system.
Eel River-Cedar Creek Aquifer System
The Eel River-Cedar Creek Aquifer system (plate2), like the Cedarville, consists of surficial valley trainsediments and deeper outwash plain deposits occur-ring beneath a major river valley. The surficial sedi-ments consist of sand and gravel deposits which arepresent from the ground surface to various depths andare either underlain by tills, or coalesce with olderoutwash deposits.
In areas where intervening layers of till are present,most wells are completed in the deeper outwashdeposits which occur beneath the surficial sand andgravel aquifer. The susceptibility of the outwashdeposits to contamination from surface sources is gen-erally lowered by the presence of the overlying tillwhich retards the downward movement of chemicalcontaminants. In general, the outwash deposits com-monly range from 20 to 30 feet in thickness
Wells that penetrate the Eel River-Cedar CreekAquifer system range from 20 to 120 feet in depth.However, along the northern boundary of AllenCounty and in parts of DeKalb County, typical wellshave depths which range from 40 to 55 feet. Staticwater levels commonly occur between 10 and 30 feetbelow the surface. Yields from domestic wells range
western basin boundary in Noble County. Ground-water availability in the Kendallville
Aquifer system is considered good. Most of the wellsthat penetrate the aquifer system are domestic supplywells that yield about 10 to 50 gpm. Large diameterhigh-capacity wells commonly yield from 70 to 1000gpm, although yields up to 2250 gpm have beenreported at test wells (table 23). Local geologic condi-tions within this aquifer system cause great variabilityin potential yield. One area within the system that hasa greater than average potential for production is theHuntertown interlobate area (see figure 17 and accom-panying discussion in the Physical Environmentchapter,geologysection).
Aboite Aquifer System
The Aboite Aquifer system consists of sand andgravel deposits that occur at several horizons withinthick, clayey till deposits in the west-central part ofAllen County (plate 2). The aquifer system is com-prised of two distinct parts which exhibit somewhatdifferent geohydrologic characteristics.
In the northern part of the aquifer system, the sandand gravel bodies are separated from the underlyingcarbonate bedrock by till which ranges from 10 to 100feet in thickness. Large channel deposits are sporadic.
However, in the southern part of the aquifer system,coarse-grained bodies are more abundant, and manylarge channel deposits which directly overlie bedrockvalleys form well-developed hydraulic connectionswith the carbonate bedrock (Fleming, 1994).Common thickness of the individual aquifers thatcomprise the Aboite Aquifer system ranges fromabout 5 to 20 feet.
Wells penetrating the Aboite have depths whichgenerally range from 20 to 80 feet, but depthsapproaching 220 feet are not uncommon. In general,conditions for deep wells are more likely to occur inthe northern portion of the Aboite Aquifer system thanin the southern part. Overall, static water levels rangefrom 30 to 70 feet below the land surface. Yields fromdomestic wells range from 10 to 50 gpm. The uncon-solidated deposits of the Aboite Aquifer system aregenerally bypassed in favor of the bedrock for devel-opment of high-capacity wells.
Hessen Cassel Aquifer System
The Hessen Cassel Aquifer system consists of scat-tered lenses of glacial outwash amidst thick sequencesof tills and, along its northeastern extent, some fine-grained glaciolacustrinedeposits. The aquifer systemextends across most of the southern part of the basin
Table 23. Hydrologic characteristicts of unconsolidated aquifers
Aquifer Range of Common Aquifer Range of pumping Expected high Hydrologic
System Aquifer Thickness (ft) rates (gpm) capacity condition
Thickness (ft) Domestic High-capacity yeild(gpm)
Teays Valley 3-80 10-30 10-50 500-2100 500-1000 Confined
Teays Valley Tributary 2-42 5-10 10-40 * 200-400 Confined
Hessen Cassel 3-40 5-10 10-30 75-100 50-100 Confined
Kendallville 5-95 5-30 10-50 500-2250 200-600 Confined
Confined/Eel River-Cedar Creek 0-120 20-55 10-60 300-600 600-1000 UnconfinedConfined/Cedarville 3-96 10-30 10-60 200 400-600 Unconfined
Aboite 5-60 5-20 10-50 225-1000 200-600 Confined
New Haven 1-30 5-10 5-20 100-250 100-150 Confined
* Indicates limited to no data

132 Water Resource Availability, Maumee River Basin Ground-water Hydrology, Aquifer Systems 133
Carbonate Aquifer system occurs in most of the south-ern half of the basin, and the Devonian andMississippian Shale aquifer system is in the north.Hydraulic properties within the two aquifer systemsare highly variable.
In addition to the two bedrock aquifer systems iden-tified on plate 2, other bedrock units capable of trans-mitting water are present in the basin, but the“aquifers” have water quality that is not acceptable formany uses (appendix 5). A brief discussion of some ofthese non potableaquifers is included.
In general, bedrock aquifers are not used in thenorthern half of the Maumee River basin becauseground water is available from the unconsolidatedmaterials overlying the bedrock and because there is apredominance of unproductive shales. In the southernpart of the basin, a thin mantle of unconsolidatedmaterials and the presence of thick, highly productivecarbonate aquifers favor the development of bedrockaquifers.
In places, sand and gravel aquifers are locatedimmediately overlying the bedrock surface. Many ofthese materials are found in association with buriedbedrock valleys but do occur elsewhere along thebedrock surface. Where unconsolidated aquifers are incontact with the carbonate system, the two aquifersare hydraulically linked and have very similarhydraulic gradients.
Silurian-Devonian Carbonates
The carbonate aquifer system of the Maumee Riverbasin is composed of limestone, dolomitic limestone,and dolomite ranging in age from lower and middleSilurian in Adams County to middle Devonian inAllen County (figure 21 and plate 2). Ground-waterflow in this system occurs predominately alongbedrock joints, fractures, and bedding planes as wellas along solutionfeatures (see sidebar,Ground-waterflow and the dissolution of carbonate rocks).
Because ground-water flow through carbonate rockis controlled by the geometry of its joints and frac-tures, the direction of site specific or local flow maydiffer from that of the regional ground-water flowpath. Ground-water flow in these rocks can be com-plex because the type of fracturing and fracture pat-terns in a specific carbonate rock in a specific locationare determined by many factors. In the Maumee Riverbasin, the original fracture patterns in the carbonate
rocks are altered by pre-Pleistocene ground-waterflow; solution features are one result (Fleming, 1994).In addition to complexities introduced by pre-Pleistocene events, Pleistocene erosion, weathering,and deposition have caused additional alterations tothe carbonate aquifer system in the basin. All of thesefactors result in very complex local ground-waterflow.
Water well data indicate that the most productivepart of the carbonate aquifer occurs within the upper100 feet, and in many places, within a few feet of thebedrock surface. However, other zones of relativelyhigh permeability do occur at greater depth. The deep-er zones are most likely to be penetrated by largediameter, high-capacity wells in an attempt to increaseavailable drawdown in the well and obtain maximumyield. Yields of the large-diameter wells generallyrange from 100 to 500 gpm, but higher-yielding wellsmay be possible where several feet of sand and gravelare directly overlying the bedrock surface.
In Adams County, depth to the bedrock ranges from25 to 128 feet below the land surface; and static waterlevels in bedrock wells typically occur at 15 to 50 feetbelow the surface. Domestic water wells, typically 2to 6 inches in diameter, penetrate about 45 feet intothe bedrock and yield from 7 to 63 gpm. High-capac-ity wells, generally 6 to 12 inches in diameter and hav-ing depths of 200 to 400 feet below ground level, havereported yields up to 400 gpm.
In bedrock wells in Allen County, static water levelstypically occur at 10 to 70 feet below the surface.Two- to 6-inch diameter domestic wells, penetratingup to 90 feet of bedrock, have depths that range from60 to 300 feet below land surface and reported yieldsof 10 to 60 gpm. The six- to 12-inch high-capacitybedrock wells, which may penetrate more than 350feet of the bedrock, have depths exceeding 550 feet.
In the northern part of the basin, including northernAllen County, the carbonate aquifer is overlain byshales and is generally not considered a significantground-water source. However, little is known aboutthe ground-water potential for the carbonate aquifersystem in this area. Because the aquifer system occursat great depth and because the overlying unconsoli-dated aquifers provide an adequate ground-water sup-ply, very few water wells are drilled into the bedrocksystem.
As the shale thickens north of its Allen County sub-crop, depth to, and confinement of the carbonate sys-tem generally increase; whereas, the fracturing,
from 10 to 60 gpm. High-capacity wells generallyyield 300 to 600 gpm.
Teays Valley and Tributary Aquifer System
The Teays Valley is a buried pre-glacial bedrockvalley in the southern portion of Adams County.During valley development, layers of bedrock rangingfrom Silurian limestone and dolomite to Ordovicianlimestone and shale were dissected to create anentrenched valley having a width that varies from oneto two miles. Subsequent glacial advances covered thebedrock surface with unconsolidated sediments ofvariable thickness. In some places, the till and out-wash sediments occurring above the buried bedrockvalley may exceed 385 feet in thickness. Outwashdeposits consisting of sand and gravel range from 5 to182 feet in thickness.
Valley development along pre-glacial tributarieswas not as extensive as along the mainstem of theTeays Valley network. However, a significant but nar-row tributary valley was cut into Silurian carbonates.The tributary valley, which entered the Teays main-stem near present-day Berne in Adams County, trendsin a general north-south direction from Allen County(plate 2). Appreciable outwash sediments occur in theglacial deposits overlying the tributary valley.
Wells in the Teays Valley are completed at depthsranging from 65 to 295 feet, although well depthsranging from 135 to 250 feet are most common. Staticwater levels in the wells range from 20 to 40 feetbelow the ground surface. Domestic wells typicallyyield from 10 to 50 gpm; but as reported for the Bernewell field in Adams County, high-capacity wells mayyield as much as 2100 gpm.
The Tributary Valley deposits are penetrated bywells that range from 55 to 245 feet in depth. The sta-tic water levels are also variable, ranging from 15 to70 feet below the surface. Yields from domestic wellsrange from 10 to 40 gpm. No known high-capacitywells tap the tributary valley of the Teays.
Bedrock aquifer systems
The occurrence of bedrock aquifers depends on theoriginal composition of the rocks and subsequentchanges which influence the hydraulic properties.Post depositionalprocesses which promote jointing,
fracturing, and solution activity of exposed bedrockgenerally increase the hydraulic conductivityof theupper portion of bedrock aquifer systems. Becausepermeability is usually greatest near the bedrock sur-face, the upper bedrock units are generally the mostproductive aquifers. In the Maumee River basin, rocktypes exposed at the bedrock surface range fromunproductive shales to highly productive limestonesand dolomites.
Bedrock aquifer systems in the basin are overlain byglacial deposits of varying thickness (see figure 16).South of Fort Wayne, bedrock is generally covered byless than 100 feet of glacial drift. North of theMaumee River, drift thickness increases to a maxi-mum of more than 400 feet in north central DeKalbCounty. Most of the bedrock aquifers in the basin areunder confinedconditions. In other words, the waterlevel (potentiometricsurface) in wells completed inthe aquifer rises above the top of the aquifer.
The yield of a bedrock aquifer depends on itshydraulic characteristics and the nature of the overly-ing deposits. Shale and glacial till act as aquitards,restricting recharge to underlying bedrock aquifers.However, fracturing and/or jointing may occur inaquitards which can increase recharge to the underly-ing aquifers. The shale in the Maumee River basin ismost likely to be fractured where it occurs as a rela-tively thin covering on the carbonate bedrock, a situa-tion that exists near the subcrop of the shale in north-ern and central portions of Allen County. Althoughusually penetrating less than 20 feet below the surface,jointing within till units will increase the bulkhydraulic conductivity of the unit, thus allowingincreased recharge to the underlying strata (Fleming,1994).
In this report, two primary bedrock aquifer systemsare identified for the Maumee River basin based onbedrock surface lithology, the Silurian-DevonianCarbonate Aquifer system and the Devonian andMississippian Shale Aquifer system (plate 2 and fig-ure 21). Ordovician shales, although present at thebedrock surface in a small area at the base of a buriedbedrock valley in southern Adams County (figure 21),are not discussed in this section because they are notaquifers in this area. Although this type of two-dimen-sional mapping is useful, it should be rememberedthat the Silurian-Devonian Carbonate rocks extendbeneath the Devonian and Mississippian ShaleAquifer system (figure 21) and are used as a watersupply within its boundaries. The Silurian-Devonian
134 Water Resource Availability, Maumee River Basin Ground-water Hydrology, Development Potential 135
GROUND-WATER DEVELOPMENT POTENTIAL
The development potential or potential yield of anaquifer depends on aquifer characteristics such ashydraulic conductivity, aquifer thickness, storativity,areal extent, ground-water levels, available draw-down, and recharge. All aquifer properties are impor-tant, but three are particularly useful for basin-wideground-water resource assessment: recharge, storativ-ity, and transmissivity (hydraulic conductivity multi-plied by aquifer thickness). If these properties can bedetermined for aquifer systems, and can be appliedwith a basic understanding of hydrogeology, a quali-tative comparison can be made of ground-water devel-opment potential within a basin and between basins.These three aquifer properties are used in digital andanalytical ground-water models.
Other factors such as water quality, potential conta-mination sources, demand, water rights, well designand well location influence actual ground-waterdevelopment. This section of the report focuses pri-marily on transmissivity and recharge, two aquifercharacteristics important for ground-water develop-ment. Water quality and ground-water protection arediscussed in the Ground-water quality section of thischapter. Demand and water rights are discussed in thechapter titled Water Resource Development.
Transmissivity
Transmissivity is a measure of the water-transmit-ting capability of an aquifer. Expressed as the rate atwhich water flows through a unit width of an aquifer,transmissivity is defined as the product of thehydraulic conductivity and the saturated thickness ofan aquifer. Methods used to compute transmissivityare based upon a mathematical relationship betweenthe pumping rate and the resultant drawdown of thewater level in the aquifer for a given set of well andaquifer conditions.
The most reliable method for estimating transmis-sivity is a graphical approach based on aquifer-testdata. The graphical approach can only be used whenextensive data have been collected from aquifer tests.In most aquifer tests, water levels are recorded simul-taneously at observation wells while the test well isbeing pumped at a constant and controlled rate. Theresponse of an aquifer is monitored over an areal
County and Steuben County. There are no knownwater wells producing from any of these shales, and itis not expected that any of these shales are capable ofproviding significant yields. In this area in the basin,the bedrock is overlain by thick accumulations ofunconsolidated deposits that contain sand and gravelaquifers capable of providing ground-water in usablequantities.
Non Potable Aquifers
Natural water quality within a bedrock aquifer mayvary considerably with increasing depth beneath theland surface. Generally, with increasing depth severalwater-quality parameters degrade resulting in highertotal dissolved solids (TDS) values.
Some bedrock aquifers in the Maumee River basin,because of geologic structure, occur near the land sur-face in part of the basin, but occur at greater depth inother places in the basin (see figures 18 and 19, anddiscussion in chapter on Physical Environment,Bedrock geology). Water quality in the portion of anaquifer located near the surface may be of acceptablequality; whereas, water quality in the same aquifermay be unacceptable in areas where it occurs atgreater depth.
Throughout the basin, bedrock aquifers that occurbeneath the Silurian/Devonian carbonates have natur-al water quality unacceptable for potable water supply(appendix 5). Some of these deep, non potableaquifers are being used for disposal of brine or saltwater, which is a byproduct of petroleum productionin the basin.
The brine, after being pumped to the surface duringoil or gas production, is injected into a deep bedrockunit or formation via a USEPA Class II injection well.Such disposal is regulated by the Department ofNatural Resources, Division of Oil and Gas.
Formations currently used for brine injection/dis-posal in the basin include the Knox Supergroup andBlack River Group (see appendix 5). Disposal of over500,000 gallons of brine was reported to have takenplace at one well in the Knox in 1994. In addition tothe Knox and Black River formations, other forma-tions in the basin have been used for disposal in thepast. However, the deepest aquifer identified in thebasin, the Mount Simon sandstone, has not been usedor tested for brine disposal within the basin.
the bedrock surface are, from oldest to youngest: theAntrim, Ellsworth, Sunbury, and Coldwater Shales(see Physical Environment, Bedrock Geologysec-tion of this report).
Very few wells obtain potableground water fromthe Antrim Shale. Wells that have sufficient yield aregenerally located near the Devonian carbonate/shalecontact at depths ranging from 56 to 135 feet belowground level. Static water levels generally occur at 30to 35 feet below land surface. Domestic wells in theshale, typically 4 to 6 inches in diameter and penetrat-ing 3 to 16 feet into the bedrock, have yields rangingfrom 10 to 15 gpm. Unconsolidated materials thatoverlie the Antrim Shale generally provide sufficientground-water supplies.
The Ellsworth, Sunbury, and Coldwater Shalesoccur at the bedrock surface in northern DeKalb
recharge, and productivity of the carbonate decrease.The thickness of glacial drift also increases in thesame general area; therefore, the depth to the bedrockaquifer system further increases. All of these factorsprovide numerous opportunities to develop unconsol-idated aquifers overlying the carbonates.
Devonian and Mississippian Shales
For approximately the northern half of the MaumeeRiver basin, the bedrock surface is comprised ofDevonian and Mississippian age shales (figure 21).Because these rock units dip to the north toward theMichigan Basin, younger strata appear at the bedrocksurface in a northward direction. The units exposed at
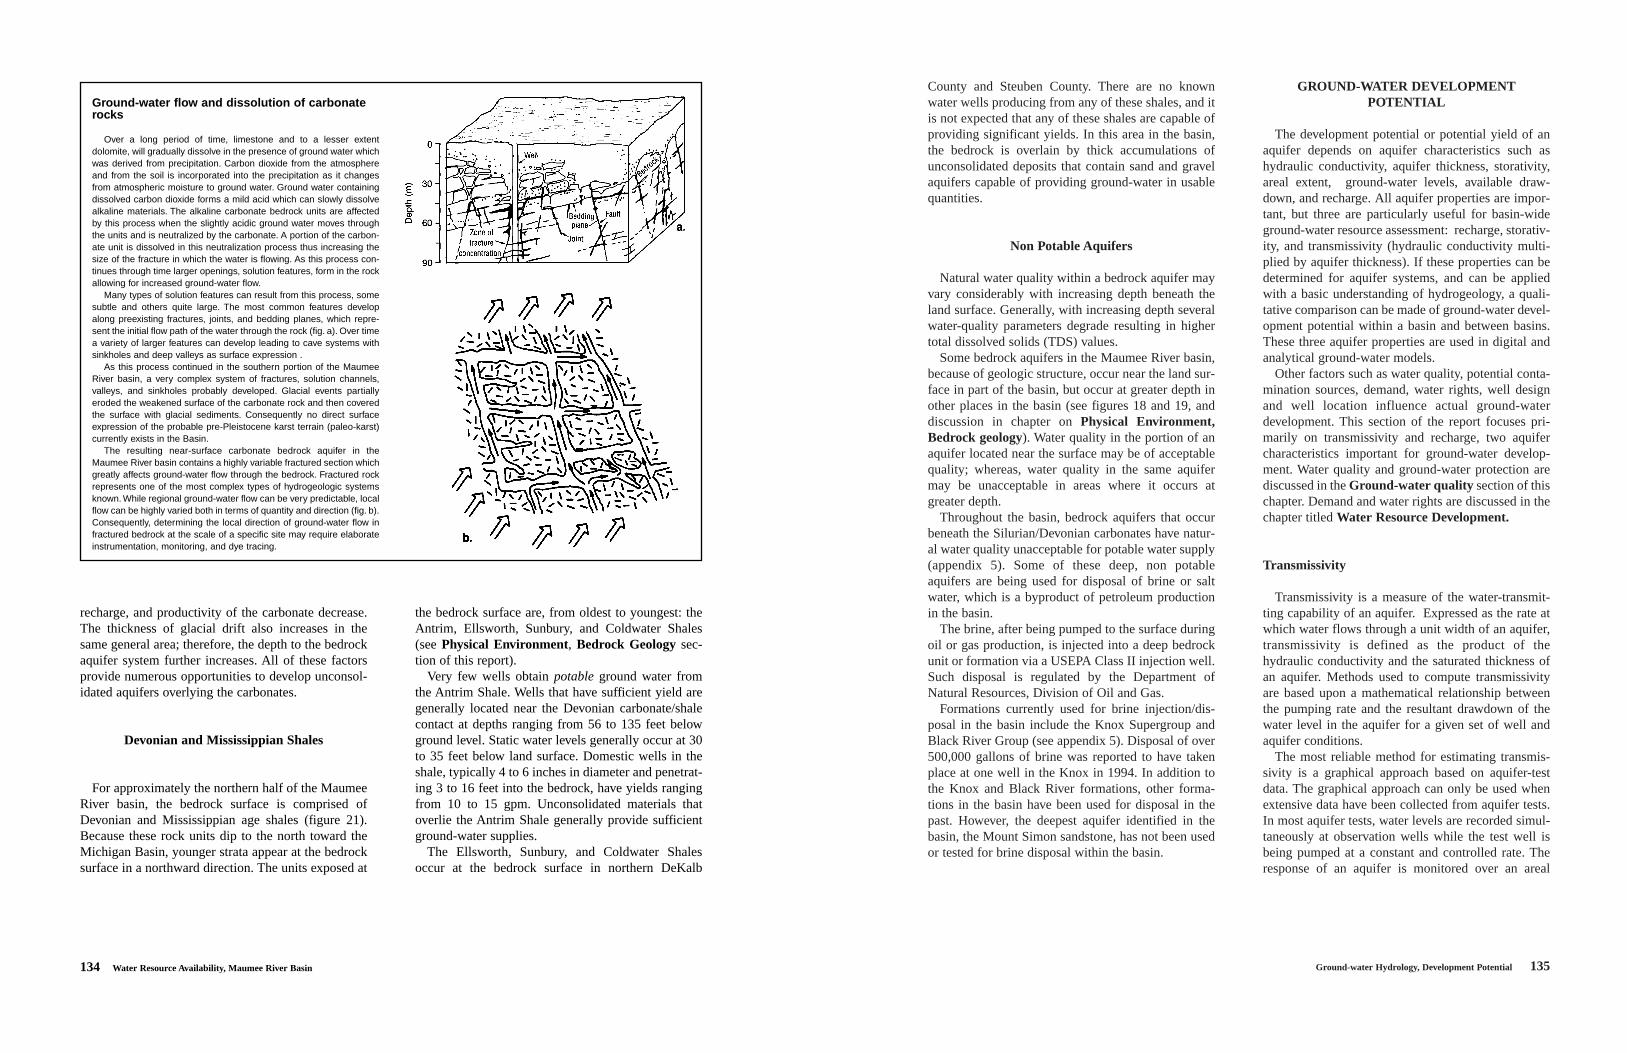
Ground-water flow and dissolution of carbonaterocks
Over a long period of time, limestone and to a lesser extentdolomite, will gradually dissolve in the presence of ground water whichwas derived from precipitation. Carbon dioxide from the atmosphereand from the soil is incorporated into the precipitation as it changesfrom atmospheric moisture to ground water. Ground water containingdissolved carbon dioxide forms a mild acid which can slowly dissolvealkaline materials. The alkaline carbonate bedrock units are affectedby this process when the slightly acidic ground water moves throughthe units and is neutralized by the carbonate. A portion of the carbon-ate unit is dissolved in this neutralization process thus increasing thesize of the fracture in which the water is flowing. As this process con-tinues through time larger openings, solution features, form in the rockallowing for increased ground-water flow.
Many types of solution features can result from this process, somesubtle and others quite large. The most common features developalong preexisting fractures, joints, and bedding planes, which repre-sent the initial flow path of the water through the rock (fig.a).Over timea variety of larger features can develop leading to cave systems withsinkholes and deep valleys as surface expression .
As this process continued in the southern portion of the MaumeeRiver basin, a very complex system of fractures, solution channels,valleys, and sinkholes probably developed. Glacial events partiallyeroded the weakened surface of the carbonate rock and then coveredthe surface with glacial sediments. Consequently no direct surfaceexpression of the probable pre-Pleistocene karst terrain (paleo-karst)currently exists in the Basin.
The resulting near-surface carbonate bedrock aquifer in theMaumee River basin contains a highly variable fractured section whichgreatly affects ground-water flow through the bedrock. Fractured rockrepresents one of the most complex types of hydrogeologic systemsknown.While regional ground-water flow can be very predictable, localflow can be highly varied both in terms of quantity and direction (fig.b).Consequently, determining the local direction of ground-water flow infractured bedrock at the scale of a specific site may require elaborateinstrumentation, monitoring, and dye tracing.
134 Water Resource Availability, Maumee River Basin
the bedrock surface are, from oldest to youngest: theAntrim, Ellsworth, Sunbury, and Coldwater Shales(see Physical Environment, Bedrock Geologysec-tion of this report).
Very few wells obtain potableground water fromthe Antrim Shale. Wells that have sufficient yield aregenerally located near the Devonian carbonate/shalecontact at depths ranging from 56 to 135 feet belowground level. Static water levels generally occur at 30to 35 feet below land surface. Domestic wells in theshale, typically 4 to 6 inches in diameter and penetrat-ing 3 to 16 feet into the bedrock, have yields rangingfrom 10 to 15 gpm. Unconsolidated materials thatoverlie the Antrim Shale generally provide sufficientground-water supplies.
The Ellsworth, Sunbury, and Coldwater Shalesoccur at the bedrock surface in northern DeKalb
recharge, and productivity of the carbonate decrease.The thickness of glacial drift also increases in thesame general area; therefore, the depth to the bedrockaquifer system further increases. All of these factorsprovide numerous opportunities to develop unconsol-idated aquifers overlying the carbonates.
Devonian and Mississippian Shales
For approximately the northern half of the MaumeeRiver basin, the bedrock surface is comprised ofDevonian and Mississippian age shales (figure 21).Because these rock units dip to the north toward theMichigan Basin, younger strata appear at the bedrocksurface in a northward direction. The units exposed at
Ground-water flow and dissolution of carbonaterocks
Over a long period of time, limestone and to a lesser extentdolomite, will gradually dissolve in the presence of ground water whichwas derived from precipitation. Carbon dioxide from the atmosphereand from the soil is incorporated into the precipitation as it changesfrom atmospheric moisture to ground water. Ground water containingdissolved carbon dioxide forms a mild acid which can slowly dissolvealkaline materials. The alkaline carbonate bedrock units are affectedby this process when the slightly acidic ground water moves throughthe units and is neutralized by the carbonate. A portion of the carbon-ate unit is dissolved in this neutralization process thus increasing thesize of the fracture in which the water is flowing. As this process con-tinues through time larger openings, solution features, form in the rockallowing for increased ground-water flow.
Many types of solution features can result from this process, somesubtle and others quite large. The most common features developalong preexisting fractures, joints, and bedding planes, which repre-sent the initial flow path of the water through the rock (fig. a). Over timea variety of larger features can develop leading to cave systems withsinkholes and deep valleys as surface expression .
As this process continued in the southern portion of the MaumeeRiver basin, a very complex system of fractures, solution channels,valleys, and sinkholes probably developed. Glacial events partiallyeroded the weakened surface of the carbonate rock and then coveredthe surface with glacial sediments. Consequently no direct surfaceexpression of the probable pre-Pleistocene karst terrain (paleo-karst)currently exists in the Basin.
The resulting near-surface carbonate bedrock aquifer in theMaumee River basin contains a highly variable fractured section whichgreatly affects ground-water flow through the bedrock. Fractured rockrepresents one of the most complex types of hydrogeologic systemsknown. While regional ground-water flow can be very predictable, localflow can be highly varied both in terms of quantity and direction (fig. b).Consequently, determining the local direction of ground-water flow infractured bedrock at the scale of a specific site may require elaborateinstrumentation, monitoring, and dye tracing.

136 Water Resource Availability, Maumee River Basin
derived from aquifer tests nearby and were found to beconservative although quite variable.
The transmissivity values for the Maumee Riverbasin are highly variable (figure 53). The wide rangein values is probably a result of the heterogeneity ofthe geologic formations and the nature of the dataused to obtain the estimates. Data used in the analysisare from different types of wells, ranging from shal-low, small-diameter domestic wells to deep, large-diameter high-capacity wells. In addition, the geo-graphic distribution of usable data is happenstance;and multiple water-bearing units are represented, evenwithin individual aquifer systems. Furthermore, thereare differences in methods used by drillers to conductand report specific capacity test results. This variabil-ity precludes developing regional transmissivity esti-mates; however, a few general trends are observed.
In general, transmissivity estimates for unconsoli-dated aquifers are less variable and slightly higherthan those for bedrock aquifers (figure 53).Approximately 65 percent of the unconsolidated wellshave values above 10,000 gallons per day per foot(gpd/ft); whereas, approximately 55 percent of thebedrock wells have transmissivity values of less than10,000 gpd/ft. Transmissivity values in the unconsoli-dated aquifer systems range from less than 500 to558,000 gpd/ft; however, values between 4,000 to40,000 gpd/ft. are most common (figure 53).
The most transmissive unconsolidated aquifers gen-erally occur in the northern part of the basin wherelocally-thick outwash deposits are present. In north-ern Allen and most of DeKalb Counties, highly trans-missive zones occur in the valley train and outwashsediments of the Cedarville and the Eel River-CedarCreek Aquifer systems. Another area of high trans-missivity occurs in the extreme northern part of thebasin near Clear Lake in Steuben County, where thickoutwash fan deposits are present (figure 17). Someunconsolidated deposits associated with the TeaysValley and Tributaries system in the southern portionsof the basin also have high transmissivity values.
Within the Kendallville Aquifer system, the WabashMoraine (figure 17) appears to contain the most trans-missive aquifers, having approximately one-third ofthe wells exhibiting transmissivity values greater than50,000 gpd/ft. The Fort Wayne Moraine appears tohave the least transmissive aquifers, having less thanone-fifth of the wells with values greater than 50,000gpd/ft. Much of the variation between these twomoraines may be explained by a general trend of
extent that is determined by the spatial distribution ofthe observation wells. Graphical plots of time versusdrawdown and distance versus drawdown can yieldreliable estimates of the hydraulic parameters of theaquifer. However, unless an extensive well field isbeing developed, an aquifer test is often not warrantedbecause the cost of installing observations wells andconducting the test exceed the immediate benefit.There are only a few aquifer tests available for theMaumee River basin.
A method using specific capacity data based onunadjusted drawdown was used to estimate aquifertransmissivity in the Maumee River basin. Specificcapacity is defined as the rate at which water can bepumped from a well per unit decline of water level inthe well (commonly expressed as gallons per foot) fora specified time period. Specific capacity tests areless expensive than aquifer tests because drawdowntypically is measured only once at the pumped welljust before the pumping is stopped. These tests areconducted by the driller after completion of a well todetermine the potential yield of the well. As thelength of the test increases, continued drawdown inthe well causes a decrease in the specific capacity. Inreconnaissance ground-water investigations, usefulestimates of aquifer transmissivity can be based onspecific capacity data (Walton, 1970).
Estimates of aquifer transmissivity in the MaumeeRiver basin were generated from specific capacitydata of nearly 800 water well logs by using a comput-er program called “TGUESS” (Bradbury andRothschild, 1985) (figure 52). The computer programcan adjust drawdown values from specific capacitytests to accommodate for well loss, partial penetration,and dewatering of the aquifer. In most cases, thesefactors tend to cause lower estimates of specificcapacity (Walton, 1970). However, if a well pene-trates an aquifer of unknown thickness, drawdownfrom specific capacity tests cannot be accuratelyadjusted. In this case, aquifer thickness is assumed tobe equal to the thickness of the aquifer that is pene-trated by the well. The computed transmissivity of theaquifer (referred to as transmissivity based on unad-justed drawdown) can be considered to represent alocal minimum transmissivity for the aquifer. Of theapproximately 10,000 well records on file with theIDNR, Division of Water, fewer than 800 were foundto be sufficiently complete to estimate and plot trans-missivity values. Transmissivity values generated forthe basin using “TGUESS” were compared to values

STA
TE
OF
IN
DIA
NA
DE
PAR
TM
EN
T O
F N
ATU
RA
L R
ES
OU
RC
ES
DIV
ISIO
N O
F W
ATE
R
MA
UM
EE
RIV
ER
BA
SIN
Figure 52.Transmissivity ranges for wells in the Maumee River basin
TG
UE
SS
val
ues
for
794
wel
lsin
tho
usan
ds G
PD
/FTaaaaaaaaaaaaaaaaaa LAKE M
ICH
IGA
N
IND
IAN
A
OH
IO
KE
NT
UC
KY
ILLI
NO
IS
MIC
HIG
AN

Ground-water Hydrology, Water Quality 139
greater drift thickness to the north. However, sand andgravel deposits are also generally more common in theWabash Moraine (see Physical Environment,Geology section). Data indicate that transmissivityvalues for the Morainal Highland are much like thosefor the northern portions of the Wabash Moraine.
Transmissivity values for bedrock aquifers in thebasin range from less than 500 to 663,000 gpd/ft;however, values of 3,000 to 30,000 gpd/ft are mostcommon (figure 53). Data are sparse for the Silurianportion of the carbonate aquifer in Adams County.The Devonian carbonate aquifer appears to be slightlymore transmissive in the western portions of the basinthan in the eastern portions.
Recharge
Aquifer yield is dependent upon aquifer permeabil-ity, saturated thickness; available drawdown, arealextent, and upon the number, spacing, diameter, andpumping rates of the wells that tap the aquifer. Theultimate development potential of an aquifer is oftenequated to the total recharge to the aquifer. However,recharge will vary considerably from year to year dueto climatic variations and may vary somewhat withpumping.
The ground-water development potential of theaquifer systems in the Maumee River basin is basedon the rate of recharge (derived chiefly from infiltra-tion of direct precipitation) and areal extent of theaquifer systems (figure 54). Estimates of natural
recharge rates to the aquifer systems of the basin werebased on several types of analyses. The primary tech-niques used include base-flow separation and flowduration analysis (see Surface-Water Hydrologychapter), aquifer and specific capacity tests to deter-mine the effects of the hydrogeologic and spatial char-acteristics of the deposits overlying the aquifer sys-tems, and the effects of regional climate (mainly pre-cipitation and temperature).
The highest estimated rate of recharge to aquifers inthe Maumee River basin is approximately 500,000gallons per day per square mile (gpd/sq mi) (table 24).However, these high rates occur in the unconfinedparts of both the Cedarville and the Eel River-CedarCreek Aquifer systems (figure 54), which occupy only1.6 percent of the basin area. Infiltration of direct pre-cipitation to these two aquifer systems is high becauseof thinly developed soils on thick, surficial sands.
In contrast to the permeable surficial sedimentsoverlying the Cedarville and the Eel River-CedarCreek Aquifer systems, sediments overlying theKendallville Aquifer system consist of surficial tillsand mixed drift of rugged topography, factors whichpromote surface runoff. The rate of recharge to theKendallville Aquifer system is approximately 250,000gpd/sq mi. (figure 54). However, the KendallvilleAquifer system occupies approximately 49 percent ofthe basin area and thereby accounts for about 62 per-cent of the recharge in the basin.
The southern part of the basin has less ruggedtopography than the north and surficial sediments arepredominantly clay-rich Erie Lobe deposits whichlimit aquifer recharge to approximately 150,000gpd/sq mi or less. The Aboite, Hessen Cassel, NewHaven and the Teays Valley and Tributary Aquifer sys-tems cover almost 50 percent of the total area of thebasin and account for approximately 34 percent of therecharge.
Rates of recharge to bedrock aquifers in theMaumee River basin are low, ranging from less than50,000 to 100,000 gpd/sq mi. (table 24). Local areasof Silurian and Devonian carbonates that are overlainby outwash sand and gravel are expected to have high-er recharge rates than areas of till-covered bedrock.
GROUND-WATER QUALITY
The geochemistry of ground water may influencethe utility of aquifer systems as sources of water. The
perc
ent o
f wel
ls fo
r st
udy
data
bas
e
0
20
40
60
80
100
0 30 60 90 200 350 500 650
transmissivity in 1000gpd/ft
unconsolidated bedrock
Figure 53. Frequency curves for transmissivity valuesof unconsolidated and bedrock wells

Water Resource Availability, Maumee River Basin 141140 Water Resource Availability, Maumee River Basin
water contamination are not evaluated. In cases ofcontamination, chemical conditions are likely to besite-specific and may not represent typical ground-water quality in the basin. Therefore, available datafrom identified sites of ground-water contaminationwere not included in the data sets analyzed for thispublication. Samples collected from softened or oth-erwise treated water were also excluded from theanalysis because the chemistry of the water wasaltered from natural conditions.
Factors in the assessment of ground-water quality
Major dissolved constituents in the ground water ofthe Maumee River basin include calcium, magnesium,sodium, chloride, sulfate and bicarbonate. Less abun-dant constituents include potassium, iron, manganese,strontium, zinc, fluoride and nitrate. Other chemicalcharacteristics discussed in this report include pH,alkalinity, hardness, lead, and total dissolved solids (TDS).
Although the data from well-water samples in theMaumee River basin are treated as if they representthe chemistry of ground water at a distinct point, theyactually represent the average concentration of anunknown volume of water in an aquifer. The extent ofaquifer representation depends on the depth of the
well, hydraulic conductivity of the aquifer, thicknessand areal extent of the aquifer, and rate of pumping.For example, the chemistry of water sampled fromhigh-capacity wells may represent average ground-water quality for a large cone of influence (Sasmanand others, 1981). Also, water collected from deepbedrock wells can be a mixture of water from differ-ent production zones.
The chemistry of original aquifer water may bealtered by contact with plumbing, residence time in apressure tank, method of sampling, and time elapsedbetween sampling and laboratory analysis. Becausethe degree to which these factors alter the originalchemistry of a sample is unknown, ground-wateranalyses may typify the quality of water consumed bythe user rather than composition of in-situ aquiferwater. In spite of these limitations, results of sampleanalyses provide valuable information concerningground-water quality characteristics of aquifer systems.
Analysis of data
Graphical and statistical techniques are used to ana-lyze the available ground-water quality data from theMaumee River basin. Graphical analyses are used todisplay the areal distribution of dissolved constituents
Table 24. Estimated recharge rates for aquifer systems.
Aquifer Recharge Rate Area RechargeSystem (gpd/sq mi) (inches/year) (cfs/sq mi) (sq mi) (MGD)
Teays 150,000 3.15 0.23Teays Tributaries 150,000 3.15 0.23 17* 2.55Hessen Cassel 140,000 2.94 0.22 522 73.08New Haven 140,000 2.94 0.22 76 10.64Aboite 150,000 3.15 0.23 15 2.25 Kendallville 250,000 5.25 0.39 632 158.00Cedarville (St. Joseph R.Valley) 500,000 10.50 0.77 11 5.50Eel River-Cedar Creek 500,000 10.50 0.77 10 5.00
Total 257.02
Ordovician Limestones and Shales <50,000 <1.05 <0.08Silurian-Devonian Carbonates 100,000 2.10 0.15Devonian-Mississippian Shales <50,000 <1.05 <0.08
* includes Teays and Teays Tributaries
types and concentrations of dissolved constituents inthe water of an aquifer system determine whether theresource, without prior treatment, is suitable for drink-ing-water supplies, industrial purposes, irrigation,livestock watering, or other uses. Changes in the con-centrations of certain constituents in the water of anaquifer system, whether because of natural or anthro-pogeniccauses, may alter the suitability of the aquifersystem as a source of water. Assessing ground-waterquality and developing strategies to protect aquifersfrom contamination are necessary aspects of water-resource planning.
Sources of ground-water quality data
The quality of water from the aquifer systemsdefined in the Aquifer Systemssection of this chap-ter is described using selected inorganic chemicalanalyses from 132 wells in the Maumee River basin.Sources of ground-water quality data are: 1) Ninety-five domestic, commercial or livestock-watering wellssampled during a 1988 cooperative effort between theIndiana Department of Natural Resources, Division ofWater (DOW) and the Indiana Geological Survey(IGS); 2) Twenty-four municipal, private, test andobservation wells analyzed by the Indiana State Boardof Health (presently the Indiana State Department ofHealth) and private laboratories between 1979 and1987; and 3) Thirteen private wells in northern AllenCounty sampled by the Indiana Department ofEnvironmental Management (IDEM) during thespring of 1992. The locations of ground-water chem-istry sites used in the analysis are displayed in figure55, and selected water-quality data from individualwells are listed in appendices 13 and 14.
An additional 33 analyses from wells in the adjacentSt. Joseph River basin and Upper Wabash River basinwere used for contour-line control during develop-ment of chemical concentration maps. Data fromthese wells, however, were not included in the statisti-cal analysis of water quality. Water-quality data fromwells in the St. Joseph River basin and Upper WabashRiver basin are available in IDNR Water ResourceAssessment 87-1 (Indiana Department of NaturalResources, 1987) and the IDNR, Division of Waterfiles, respectively.
The intent of the water-quality analysis is to charac-terize the natural ground-water chemistry of theMaumee River basin. Specific instances of ground-
Recharge rates in gallons per day per square mile
500,000
250,000
140,000 -150,000*
* see table 24
Figure 54. Estimated recharge rates ofunconsolidated aquifer systems

142 Water Resource Availability, Maumee River Basin
throughout the basin, and to describe the generalchemical character of the ground water of each aquifersystem. Statistical analyses provide useful generaliza-tions about the water quality of the basin, such as theaverage concentration of a constituent and the expect-ed variability.
Regional trends in ground-water chemistry can be
analyzed by developing trilinear diagrams for theaquifer systems in the Maumee River basin. Trilinearplotting techniques developed by Piper (1944) can beused to classify ground-waters on the basis of chem-istry, and to compare chemical trends among differentaquifer systems (see sidebar titled Chemical classifi-cation of ground waters using trilinear diagrams).
Factors affecting ground-water chemistry
The chemical composition of ground water varies because of manycomplex factors that change with depth and over geographic dis-tances. Ground-water quality can be affected by the composition andsolubility of rock materials in the soil or aquifer, water temperature,partial pressure of carbon dioxide, acid-base reactions,oxidation-reduction reactions, loss or gain of constituents as water per-colates through clay layers, and mixing of ground water from adjacentstrata.The extent of each effect will be determined in part by the resi-dence time of the water within the different subsurface environments.
Rain and snow are the major sources of recharge to ground water.They contain small amounts of dissolved solids and gases such ascarbon dioxide, sulfur dioxide, and oxygen. As precipitation infiltratesthrough the soil, biologically-derived carbon dioxide reacts with thewater to form a weak solution of carbonic acid.The reaction of oxygenwith reduced iron minerals such as pyrite is an additional source ofacidity in ground water.The slightly acidic water dissolves soluble rockmaterial, thereby increasing the concentrations of chemical con-stituents such as calcium, magnesium, chloride, iron, and manganese.As ground water moves slowly through an aquifer the composition ofwater continues to change, usually by the addition of dissolved con-stituents (Freeze and Cherry, 1979). A longer residence time will usu-ally increase concentrations of dissolved solids. Because of short res-idence time, ground water in recharge areas often contains lower con-centrations of dissolved constituents than water occurring deeper inthe same aquifer or in shallow discharge areas.
Dissolved carbon dioxide, bicarbonate, and carbonate are the prin-cipal sources of alkalinity, or the capacity of solutes in water to neu-tralize acid. Carbonate contributors to alkalinity include atmosphericand biologically-produced carbon dioxide, carbonate minerals, andbiologically-mediated sulfate reduction. Noncarbonate contributors toalkalinity include hydroxide, silicate, borate, and organic compounds.Alkalinity helps to buffer natural water so that the pH is not greatlyaltered by addition of acid. The pH of most natural ground waters inIndiana is neutral to slightly alkaline.
Calcium and magnesium are the major constituents responsible forhardness in water. Their presence is the result of dissolution of car-bonate minerals such as calcite and dolomite.
The weathering of feldspar and clay is a source of sodium andpotassium in ground water. Sodium and chloride are produced by thesolution of halite (sodium chloride) which can occur as grains dissem-inated in unconsolidated and bedrock deposits.Chloride also occurs inbedrock cementing material, connate fluid inclusions, and as crystalsdeposited during or after deposition of sediment in sea water. Highsodium and chloride levels can result from upward movement of brinefrom deeper bedrock in areas of high pumpage, from improper brinedisposal from peteroleum wells, and from the use of road salt (Hem,1985).
Cation exchange is often a modifying influence of ground-waterchemistry. The most important cation exchange processes are those
involving sodium-calcium, sodium-magnesium, potassium-calcium,and potassium-magnesium. Cation exchanges occurring in clay-richsemi-confining layers can cause magnesium and calcium reductionswhich result in natural softening.
Concentrations of sulfide, sulfate, iron, and manganese depend ongeology and hydrology of the aquifer system, amount of dissolved oxy-gen, pH, minerals available for solution, amount of organic matter, andmicrobial activity.
Mineral sources of sulfate can include pyrite, gypsum, barite, andcelestite. Sulfide is derived from reduction of sulfate when dissolvedoxygen concentrations are low and anaerobic bacteria are present.Sulfate-reducing bacteria derive energy from oxidation of organic com-pounds and obtain oxygen from sulfate ions (Lehr and others, 1980).
Reducing conditions that produce hydrogen sulfide occur in deepwells completed in carbonate and shale bedrock. Oxygen-deficientconditions are more likely to occur in deep wells than in shallow wellsbecause permeability of the carbonate bedrock decreases with depth,and solution features and joints become smaller and less abundant(Rosenshein and Hunn, 1968; Bergeron, 1981; Basch andFunkhouser, 1985). Deeper portions of the bedrock are therefore notreadily flushed by ground water with high dissolved oxygen. Hydrogensulfide gas, a common reduced form of sulfide, has a distinctive rottenegg odor that can be detected in water containing only a few tenths ofa milligram per liter of sulfide (Hem, 1985).
Oxidation-reduction reactions constitute an important influence onconcentrations of both iron and manganese. High dissolved iron con-centrations can occur in ground water when pyrite is exposed to oxy-genated water or when ferric oxide or hydroxide minerals are in con-tact with reducing substances (Hem, 1985). Sources of manganeseinclude manganese carbonate, dolomite, limestone, and weatheringcrusts of manganese oxide.
Sources of fluoride in bedrock aquifer systems include fluorite,apatite and fluorapatite. These minerals may occur as evaporites ordetrital grains in sedimentary rocks, or as disseminated grains inunconsolidated deposits. Ground waters containing detectable con-centrations of fluoride have been found in a variety of geological set-tings.
Natural concentrations of nitrate-nitrogen in ground water originatefrom the atmosphere and from living and decaying organisms. Highnitrate levels can result from leaching of industrial and agriculturalchemicals or decaying organic matter such as animal waste orsewage.
The chemistry of strontium is similar to that of calcium, but stron-tium is present in ground water in much lower concentrations. Naturalsources of strontium in ground water include strontianite (strontiumcarbonate) and celestite (strontium sulfate). Naturally-occurring bari-um sources include barite (barium sulfate) and witherite (barium car-bonate). Areas associated with deposits of coal, petroleum, naturalgas, oil shale, black shale, and peat may also contain high levels ofbarium.

1
12
13 30
4042
46
50
50
64
71
7274
7882
73
48
6751
10
31
2
23
3
7
911
14 15
17
18
19
21
25
26
27
32
33
38
41
44
47
52
53 55
56
57
58
60
62
66
70
81
43
5
8076
29
36
8
69
16
A
83
84
85
86
88
89
90
91
92
93
94
95
96
97
98
99
101
102
103
104
105
106
109
110
111
112
113
114 11
5
116
119
121
124
125
126
127
130
131
100
108
129
117
132 10
7
122
120
123
87
128
118
49
3435
37
39
45
59
61
63
68
75
77
79
65
STA
TE
OF
IN
DIA
NA
DE
PAR
TM
EN
T O
F N
ATU
RA
L R
ES
OU
RC
ES
DIV
ISIO
N O
F W
ATE
R
MA
UM
EE
RIV
ER
BA
SIN
Figure 55. Locations of ground-water chemistry sites for bedrock andunconsolidated deposits of the Maumee River Basin
WE
LL T
YP
EM
AJO
R D
ATA
SO
UR
CE
1
IGS
ISB
HU
SG
SP
RI-
VA
TE
LAB
Mun
icip
al
Pub
lic s
uppl
y
Indu
stria
l or
com
mer
cial
Irrig
atio
n
Dom
estic
Obs
erva
tion
and
test
1 IGS
, Ind
iana
Geo
logi
cal S
urve
y; IS
BH
, Ind
iana
Sta
te B
oard
of H
ealth
; US
GS
, U.S
. Geo
logi
cal S
urve
y
EX
PLA
NAT
IONaaaaaaaaaaaaaaaaaa LAKE M
ICH
IGA
N
IND
IAN
A
OH
IO
KE
NT
UC
KY
ILLI
NO
IS
MIC
HIG
AN
WE
LL N
UM
BE
RS
(ap
pend
ix 1
3)C
OD
E
A24
2822
206
4
AQ
UIF
ER
TY
PE
UN
CO
NS
OLI
DAT
ED
BE
DR
OC
K
Ground-water Hydrology, Water Quality 145
To graphically represent variation in ground-waterchemistry, box plots (appendix 15) are prepared forselected ground-water constituents. Box plots are use-ful for depicting descriptive statistics, showing thegeneral variability in constituent concentrationsoccurring in an aquifer system, and making generalchemical comparisons among aquifer systems.
Symmetry of a box plot across the median line(appendix 15) can provide insights into the degree ofskewness of chemical concentrations or parametervalues in a data set. A box plot that is almost symmet-rical about the median line may indicate that the dataoriginate from a nearly symmetrical distribution. Incontrast, marked asymmetry across the median linemay indicate a skewed distribution of the data.
The areal distribution of selected chemical con-stituents is mapped according to bedrock or unconsol-idated aquifer system (figures 56 to 65). Several sam-pling and geologic factors complicate the develop-ment of chemical concentration maps for the MaumeeRiver basin. The sampling sites are not evenly distrib-uted in the basin, but are clustered around towns anddeveloped areas (figure 55). Data points are generallyscarce in areas where surface-water sources are usedfor water-supply. Furthermore, lateral and verticalvariations in geology can also influence the chemistryof subsurface water. Therefore, the maps presented inthe following discussion only represent approximateconcentration ranges.
No ground-water quality data are available from anybedrock units north of the Allen/DeKalb County line.Therefore, the chemical concentration maps for thebedrock aquifer systems are not extended north of theAllen/DeKalb County line.
Where applicable, ground-water quality is assessedin the context of National Primary and SecondaryDrinking-Water Standards (see sidebar titled NationalDrinking-water Standards). The secondary standardreferred to in this report is the secondary maximumcontaminant level (SMCL). The SMCLs are recom-mended, non-enforceable standards established toprotect aesthetic properties such as taste, odor, orcolor of drinking water. Some chemical constituents(including fluoride and nitrate) are also considered interms of the maximum contaminant level(MCL). TheMCL is the concentration at which a constituent mayrepresent a threat to human health. Maximum conta-minant levels are legally-enforceable primary drink-ing-water standards that should not be exceeded intreated drinking-water distributed for public supply.
General water-quality criteria for irrigation and live-stock and standards for public supply are given inappendix 9.
Because of data constraints, ground-water qualitycan only be described for selected aquifer systems asdefined in the Aquifer Systemssection of this chap-ter. Aquifer systems analyzed include the unconsoli-dated Kendallville, Hessen Cassel, New Haven, andTeays Valley and Tributary Aquifer systems, and theSilurian-Devonian bedrock aquifer system. There wasonly one ground-water sample analyzed from a wellcompleted in Devonian shale; therefore the analysiswas not included in the set of bedrock wells. However,the results for that well are presented in appendices 13and 14. There were no chemical analyses available forthe Aboite, Cedar Creek-Eel River, or the CedarvilleAquifer systems.
Trilinear-diagram analyses
Ground-water samples from aquifer systems in theMaumee River basin are classified using the trilinearplotting strategy described in the sidebar titledChemical classification of ground water using tri-linear diagrams. Trilinear diagrams developed withthe available ground-water chemistry data are present-ed in appendix 16. Only 112 of the 132 ground-watersamples available for this report are used in the trilin-ear plotting of the data. Not all of the samples couldbe used because some were not analyzed for concen-trations of one or more major ions (appendix 13).
Trilinear analysis indicates that most of the avail-able ground-water samples are chemically dominatedby alkali-earth metals (calcium and magnesium),bicarbonate, and sulfate. Sodium concentrations donot exceed 50 percent of the sum of major cations inany sample, but variations in sodium levels areobserved among samples. Chloride concentrationsaccount for less than 10 percent of the sum of majoranions in most samples.
Trilinear analysis suggests that the ground-watersfrom the Kendallville Aquifer system and the TeaysValley and Tributary Aquifer system belong to distincthydrochemical facies (appendix 16). Most samplesfrom the Kendallville Aquifer system are chemicallydominated by calcium and bicarbonate. Sulfate com-prises less than 10 percent of the sum of major anionsin about two-thirds of all ground-water samples fromthe Kendallville Aquifer system, and only one sample

146 Water Resource Availability, Maumee River Basin Ground-water Hydrology, Water Quality 147
Secondary Maximum Maximum Contaminant
Contaminant Level Level (MCL)
(SMCL) (ppm) Constituent (ppm) Remarks
Total Dissolved 500 * Levels above SMCL can give water a disagreeable taste. Levels above 1000 Solids(TDS) mg/L may cause corrosion of well screens, pumps, and casings.
Iron 0.3 * More than 0.3 ppm can cause staining of clothes and plumbing fixtures, encrustation of well screens, and plugging of pipes. Excessive quantities can stimulate growth of iron bacteria.
Manganese 0.05 * Amounts greater than 0.05 ppm can stain laundry and plumbing fixtures, and may form adark brown or black precipitate that can clog filters.
Chloride 250 * Large amounts in conjunction with high sodium concentrations can impart a salty taste towater. Amounts above 1000 ppm may be physiologically unsafe. High concentrations also increase the corrosiveness of water.
Fluoride 2.0 4.0 Concentration of approximately 1.0 ppm help prevent tooth decay. Amounts above recommended limits increase the severity and occurrence of mottling (discoloration of the teeth). Amounts above 4 ppm can cause adverse skeletal effects (bone sclerosis).
Nitrate** * 10 Concentrations above 20 ppm impart a bitter taste to drinking water. Concentrations greater than 10 ppm may have a toxic effect (methemoglobinemia) on young infants.
Sulfate 250 * Large amounts of sulfate in combination with other ions (especially sodium and magnesium) can impart odors and a bitter taste to water. Amounts above 600 ppm can have a laxative effect. Sulfate in combination with calcium in water forms hard scale in steam boilers.
Sodium NL NL Sodium salts may cause foaming in steam boilers. High concentrations may render water unfit for irrigation. High levels of sodium in water have been associated with cardiovascular problems. A sodium level of less than 20 ppm has been recommended for high risk groups (people who have high blood pressure, people genetically predisposed to high blood pressure, and pregnant women).
Calcium NL NL Calcium and magnesium combine with bicarbonate, carbonate, sulfate and silica to form heat-retarding, pipe-clogging scales in steam boilers. For further information on
Magnesium NL NL calcium and magnesium, see hardness.
Hardness NL NL Principally caused by concentration of calcium and magnesium. Hard water consumes excessive amounts of soap and detergents and forms an insoluble scum or scale.
pH - - USEPA recommends pH range between 6.5 and 8.5 for drinking water.
NL No Limit Recommended.* No MCL or SMCL established by USEPA.** Nitrate concentrations expressed as equivalent amounts of elemental nitrogen (N).(Adapted from U.S. Environmental Protection Agency, 1993)Note: 1 part per million (ppm) = 1 mg/L.
NATIONAL DRINKING-WATER STANDARDS
National Drinking Water Regulations and Health Advisories (U. S.Environmental Protection Agency, 1993) list concentration limits ofspecified inorganic and organic chemicals in order to control amountsof contaminants in drinking water. Primary regulations list maximumcontaminant levels (MCLs) for inorganic constituents considered toxicto humans above certain concentrations.These standards are health-related and legally enforceable. Secondary maximum contaminant
levels (SMCLs) cover constituents that may adversely affect the aes-thetic quality of drinking water. The SMCLs are intended to be guide-lines rather than enforceable standards. Although these regulationsapply only to drinking water at the tap for public supply, they may beused to assess water quality for privately-owned wells.The table belowlists selected inorganic constituents of drinking water covered by theregulations, the significance of each constituent, and their respectiveMCL or SMCL. Fluoride and nitrate are the only constituents listedwhich are covered by the primary regulations.
contains sulfate as the dominant anion. In contrast, allavailable ground-water samples from the Teays Valleyand Tributary Aquifer system can be characterized ascalcium, magnesium and sulfate dominated.
Ground-water samples from the Silurian andDevonian bedrock aquifer appear to originate fromtwo distinct hydrochemical facies. More than 80 per-
cent of all ground-water samples from the Silurian andDevonian bedrock aquifer system are chemicallydominated by calcium, magnesium and sulfate (Ca-Mg-SO4) ions. Whereas, the remaining bedrock wellsamples, less than 20 percent of the total, are charac-terized as calcium-magnesium-bicarbonate (Ca-Mg-HCO3) waters (appendix 16). The bicarbonate domi-
Chemical classification of ground waters usingtrilinear diagrams
Trilinear plotting systems have been used in the study of waterchemistry and quality since as early as 1913 (Hem, 1985).The type oftrilinear diagram used in this report, independently developed by Hill(1940) and Piper (1944), has been used extensively to delineate vari-ability and trends in water-quality. The technique of trilinear analysishas contributed extensively to the understanding of ground-water flow,and geochemistry (Dalton and Upchurch, 1978). On conventional tri-linear diagrams sample values for three cations (calcium, magnesiumand the alkali metals- sodium and potassium) and three anions (bicar-bonate, chloride and sulfate) are plotted relative to each other.Because these ions are generally the most common constituents inunpolluted ground waters, the chemical character of most naturalwaters can be closely approximated by the relative concentration ofthese ions (Hem, 1985; Walton, 1970).
Before values can be plotted on the trilinear diagram the concen-trations of the six ions of interest are converted into milliequivalentsper liter (meq/L), a unit of concentration equal to the concentration inmilligrams per liter divided by the equivalent weight (atomic weightdivided by valence).Each cation value is then plotted, as a percentageof the total concentration (meq/L) of all cations under consideration, inthe lower left triangle of the diagram. Likewise, individual anion valuesare plotted, as percentages of the total concentration of all anionsunder consideration, in the lower right triangle.Sample values are thenprojected into the central diamond-shaped field. Fundamental inter-pretations of the chemical nature of a water sample are based on thelocation of the sample ion values within the central field.
Distinct zones within aquifers having defined water chemistry prop-erties are referred to as hydrochemical facies (Freeze and Cherry,1979). Determining the nature and distribution of hydrochemical faciescan provide insights into how ground-water quality changes within andbetween aquifers. Trilinear diagrams can be used to delineate hydro-chemical facies, because they graphically demonstrate relationshipsbetween the most important dissolved constituents in a set ofground-water samples.
One simple system for describing hydrochemical facies with trilin-ear diagrams is based on the concept of “dominant” cations andanions. The dominant cation of a water sample is the positivelycharged ion whose concentration exceeds 50 percent of the summedconcentrations of major cations in solution.Likewise, the concentrationof the dominant anion exceeds 50 percent of the total anion concen-tration in the water sample. If no single cation or anion in a water sam-ple meets this criterion, the water has no dominant ion in solution. Inmost natural waters, the dominant cation is calcium, magnesium oralkali metals (sodium and potassium), and the dominant anion is chlo-ride, bicarbonate or sulfate (see figure above). Distinct hydrochemicalfacies are defined by specific combinations of dominant cations andanions that plot in certain areas of the central, diamond-shaped part ofthe trilinear diagram. Four basic hydrochemical facies are defined with
these criteria:
1. Combined concentrations of calcium and/or magnesium, andbicarbonate and/or carbonate exceed 50 percent of the total dissolvedconstituent load in meq/L. Such waters are generally considered hardand are often found in limestone aquifers or unconsolidated depositscontaining abundant carbonate minerals.
2. Combined concentrations of sulfate and/or chloride, and magne-sium and/or calcium exceed 50 percent of total meq/L. Waters thathave dissolved gypsum (CaSO4 •2{H2O}) may be classified into thishydrochemical facies.
3. Combined concentrations of alkali metals, sulfate and chlorideare greater then 50 percent of the total meq/L. Very concentratedwaters of this hydrochemical facies may be considered brackish or (inextreme cases) saline.
4. Combined sodium, potassium and bicarbonate concentrationsexceed 50 percent of the total meq/L.These waters generally have lowhardness in proportion to their dissolved solids concentration (Walton,1970).
Additional information on trilinear diagrams and a more detailed dis-cussion of the geochemical classification of ground waters is present-ed in Freeze and Cherry (1979) and Fetter (1988).
146 Water Resource Availability, Maumee River Basin
contains sulfate as the dominant anion. In contrast, allavailable ground-water samples from the Teays Valleyand Tributary Aquifer system can be characterized ascalcium, magnesium and sulfate dominated.
Ground-water samples from the Silurian andDevonian bedrock aquifer appear to originate fromtwo distinct hydrochemical facies. More than 80 per-
cent of all ground-water samples from the Silurian andDevonian bedrock aquifer system are chemicallydominated by calcium, magnesium and sulfate (Ca-Mg-SO4) ions. Whereas, the remaining bedrock wellsamples, less than 20 percent of the total, are charac-terized as calcium-magnesium-bicarbonate (Ca-Mg-HCO3) waters (appendix 16). The bicarbonate domi-
Chemical classification of ground waters usingtrilinear diagrams
Trilinear plotting systems have been used in the study of waterchemistry and quality since as early as 1913 (Hem, 1985). The type oftrilinear diagram used in this report, independently developed by Hill(1940) and Piper (1944), has been used extensively to delineate vari-ability and trends in water-quality. The technique of trilinear analysishas contributed extensively to the understanding of ground-water flow,and geochemistry (Dalton and Upchurch, 1978). On conventional tri-linear diagrams sample values for three cations (calcium, magnesiumand the alkali metals- sodium and potassium) and three anions (bicar-bonate, chloride and sulfate) are plotted relative to each other.Because these ions are generally the most common constituents inunpolluted ground waters, the chemical character of most naturalwaters can be closely approximated by the relative concentration ofthese ions (Hem, 1985; Walton, 1970).
Before values can be plotted on the trilinear diagram the concen-trations of the six ions of interest are converted into milliequivalentsper liter (meq/L), a unit of concentration equal to the concentration inmilligrams per liter divided by the equivalent weight (atomic weightdivided by valence). Each cation value is then plotted, as a percentageof the total concentration (meq/L) of all cations under consideration, inthe lower left triangle of the diagram. Likewise, individual anion valuesare plotted, as percentages of the total concentration of all anionsunder consideration, in the lower right triangle. Sample values are thenprojected into the central diamond-shaped field. Fundamental inter-pretations of the chemical nature of a water sample are based on thelocation of the sample ion values within the central field.
Distinct zones within aquifers having defined water chemistry prop-erties are referred to as hydrochemical facies (Freeze and Cherry,1979). Determining the nature and distribution of hydrochemical faciescan provide insights into how ground-water quality changes within andbetween aquifers. Trilinear diagrams can be used to delineate hydro-chemical facies, because they graphically demonstrate relationshipsbetween the most important dissolved constituents in a set ofground-water samples.
One simple system for describing hydrochemical facies with trilin-ear diagrams is based on the concept of “dominant” cations andanions. The dominant cation of a water sample is the positivelycharged ion whose concentration exceeds 50 percent of the summedconcentrations of major cations in solution. Likewise, the concentrationof the dominant anion exceeds 50 percent of the total anion concen-tration in the water sample. If no single cation or anion in a water sam-ple meets this criterion, the water has no dominant ion in solution. Inmost natural waters, the dominant cation is calcium, magnesium oralkali metals (sodium and potassium), and the dominant anion is chlo-ride, bicarbonate or sulfate (see figure above). Distinct hydrochemicalfacies are defined by specific combinations of dominant cations andanions that plot in certain areas of the central, diamond-shaped part ofthe trilinear diagram. Four basic hydrochemical facies are defined with
these criteria:
1. Combined concentrations of calcium and/or magnesium, andbicarbonate and/or carbonate exceed 50 percent of the total dissolvedconstituent load in meq/L. Such waters are generally considered hardand are often found in limestone aquifers or unconsolidated depositscontaining abundant carbonate minerals.
2. Combined concentrations of sulfate and/or chloride, and magne-sium and/or calcium exceed 50 percent of total meq/L. Waters thathave dissolved gypsum (CaSO4 •2{H2O}) may be classified into thishydrochemical facies.
3. Combined concentrations of alkali metals, sulfate and chlorideare greater then 50 percent of the total meq/L. Very concentratedwaters of this hydrochemical facies may be considered brackish or (inextreme cases) saline.
4. Combined sodium, potassium and bicarbonate concentrationsexceed 50 percent of the total meq/L. These waters generally have lowhardness in proportion to their dissolved solids concentration (Walton,1970).
Additional information on trilinear diagrams and a more detailed dis-cussion of the geochemical classification of ground waters is present-ed in Freeze and Cherry (1979) and Fetter (1988).
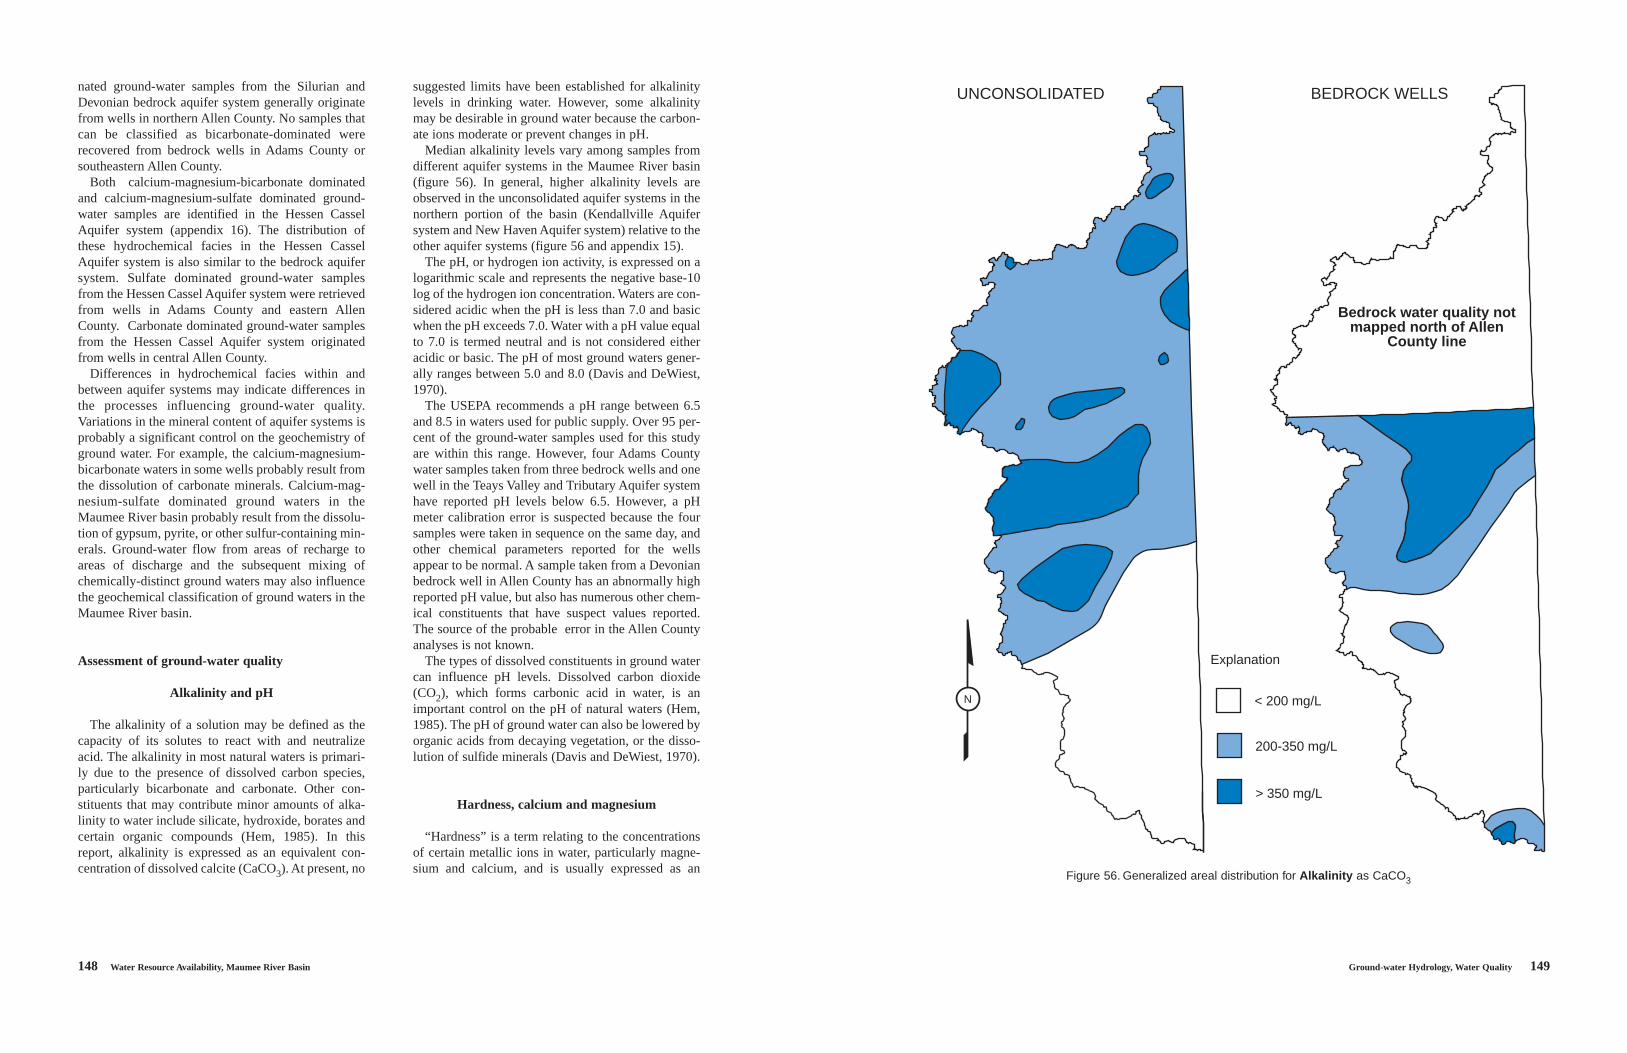
148 Water Resource Availability, Maumee River Basin Ground-water Hydrology, Water Quality 149
Explanation
UNCONSOLIDATED BEDROCK WELLS
< 200 mg/L
200-350 mg/L
> 350 mg/L
N
Bedrock water quality not mapped north of Allen
County line
Figure 56. Generalized areal distribution for Alkalinity as CaCO3
nated ground-water samples from the Silurian andDevonian bedrock aquifer system generally originatefrom wells in northern Allen County. No samples thatcan be classified as bicarbonate-dominated wererecovered from bedrock wells in Adams County orsoutheastern Allen County.
Both calcium-magnesium-bicarbonate dominatedand calcium-magnesium-sulfate dominated ground-water samples are identified in the Hessen CasselAquifer system (appendix 16). The distribution ofthese hydrochemical facies in the Hessen CasselAquifer system is also similar to the bedrock aquifersystem. Sulfate dominated ground-water samplesfrom the Hessen Cassel Aquifer system were retrievedfrom wells in Adams County and eastern AllenCounty. Carbonate dominated ground-water samplesfrom the Hessen Cassel Aquifer system originatedfrom wells in central Allen County.
Differences in hydrochemical facies within andbetween aquifer systems may indicate differences inthe processes influencing ground-water quality.Variations in the mineral content of aquifer systems isprobably a significant control on the geochemistry ofground water. For example, the calcium-magnesium-bicarbonate waters in some wells probably result fromthe dissolution of carbonate minerals. Calcium-mag-nesium-sulfate dominated ground waters in theMaumee River basin probably result from the dissolu-tion of gypsum, pyrite, or other sulfur-containing min-erals. Ground-water flow from areas of recharge toareas of discharge and the subsequent mixing ofchemically-distinct ground waters may also influencethe geochemical classification of ground waters in theMaumee River basin.
Assessment of ground-water quality
Alkalinity and pH
The alkalinity of a solution may be defined as thecapacity of its solutes to react with and neutralizeacid. The alkalinity in most natural waters is primari-ly due to the presence of dissolved carbon species,particularly bicarbonate and carbonate. Other con-stituents that may contribute minor amounts of alka-linity to water include silicate, hydroxide, borates andcertain organic compounds (Hem, 1985). In thisreport, alkalinity is expressed as an equivalent con-centration of dissolved calcite (CaCO3). At present, no
suggested limits have been established for alkalinitylevels in drinking water. However, some alkalinitymay be desirable in ground water because the carbon-ate ions moderate or prevent changes in pH.
Median alkalinity levels vary among samples fromdifferent aquifer systems in the Maumee River basin(figure 56). In general, higher alkalinity levels areobserved in the unconsolidated aquifer systems in thenorthern portion of the basin (Kendallville Aquifersystem and New Haven Aquifer system) relative to theother aquifer systems (figure 56 and appendix 15).
The pH, or hydrogen ion activity, is expressed on alogarithmic scale and represents the negative base-10log of the hydrogen ion concentration. Waters are con-sidered acidic when the pH is less than 7.0 and basicwhen the pH exceeds 7.0. Water with a pH value equalto 7.0 is termed neutral and is not considered eitheracidic or basic. The pH of most ground waters gener-ally ranges between 5.0 and 8.0 (Davis and DeWiest,1970).
The USEPA recommends a pH range between 6.5and 8.5 in waters used for public supply. Over 95 per-cent of the ground-water samples used for this studyare within this range. However, four Adams Countywater samples taken from three bedrock wells and onewell in the Teays Valley and Tributary Aquifer systemhave reported pH levels below 6.5. However, a pHmeter calibration error is suspected because the foursamples were taken in sequence on the same day, andother chemical parameters reported for the wellsappear to be normal. A sample taken from a Devonianbedrock well in Allen County has an abnormally highreported pH value, but also has numerous other chem-ical constituents that have suspect values reported.The source of the probable error in the Allen Countyanalyses is not known.
The types of dissolved constituents in ground watercan influence pH levels. Dissolved carbon dioxide(CO2), which forms carbonic acid in water, is animportant control on the pH of natural waters (Hem,1985). The pH of ground water can also be lowered byorganic acids from decaying vegetation, or the disso-lution of sulfide minerals (Davis and DeWiest, 1970).
Hardness, calcium and magnesium
“Hardness” is a term relating to the concentrationsof certain metallic ions in water, particularly magne-sium and calcium, and is usually expressed as an

150 Water Resource Availability, Maumee River Basin Ground-water Hydrology, Water Quality 151
Explanation
UNCONSOLIDATED BEDROCK WELLS
< 500 mg/L
500-1000mg/L
> 1000 mg/L
Bedrock water quality not mapped north of Allen
County line
N
Figure 57. Generalized areal distribution for Hardness as CaCO3
equivalent concentration of dissolved calcite(CaCO3). In hard water, the metallic ions of concernmay react with soap to produce an insoluble residue.These metallic ions may also react with negatively-charged ions to produce a solid precipitate when hardwater is heated (Freeze and Cherry, 1979). Hardwaters can thus consume excessive quantities of soap,and cause damaging scale in water heaters, boilers,pipes and turbines. Many of the problems associatedwith hard water, however, can be mitigated by usingwater-softening equipment.
Durfor and Becker (1964) developed the followingclassification for water hardness that is useful for dis-cussion purposes: soft water, 0 to 60 mg/L (asCaCO3); moderately hard water, 61 to 120 mg/L; hardwater, 121 to 180 mg/L; and very hard water, over 180mg/L. A hardness level of about 100 mg/L or less isgenerally not a problem in waters used for ordinarydomestic purposes (Hem, 1985). Lower hardness lev-els, however, may be required for waters used forother purposes. For example, Freeze and Cherry(1979) suggest that waters with hardness levels above60-80 mg/L may cause excessive scale formation inboilers.
Ground waters in the Maumee River basin can begenerally characterized as very hard in the Durfor andBecker hardness classification system. The measuredhardness level is below 180 mg/L (as CaCO3) in onlyone ground-water sample. The lowest median hard-ness value is observed in samples from theKendallville Aquifer system. Median hardness levelsexceed 500 mg/L in samples from all other aquifersystems under consideration (appendix 15).
Figure 57 displays the spatial distribution ofground-water hardness levels in the Maumee Riverbasin. In general, ground-water hardness levels arehigher in the southern portion of the Maumee Riverbasin relative to the northern portion of the basin.Because similar spatial trends are observed in sulfateconcentrations (figure 59), it is likely that gypsum(CaSO4 •2{H2O}) dissolution may influence ground-water hardness in some areas of the basin.
Box plots of calcium and magnesium concentra-tions in ground water are presented in appendix 15.Because calcium and magnesium are the major con-stituents responsible for hardness in water, the highestlevels of these ions generally occur in ground waterswith high hardness levels. At the time of this publica-tion, no enforceable or suggested standards have beenestablished for calcium or magnesium.
Chloride, sodium and potassium
Chloride in ground water may originate from vari-ous sources, including the dissolution of halite andrelated minerals, marine water entrapped in sedi-ments, and anthropogenic sources. Although chlorideis often an important dissolved constituent in groundwater, none of the samples from the aquifer systems inthe Maumee River basin are classified as chloridedominated (appendix 15). Median chloride levels areless than 10 mg/L in samples from all of the aquifersystems under consideration. No chloride concentra-tions above 250 mg/L, the SMCL for this ion, aredetected in any of the samples.
Some of the highest chloride concentrations inbasin ground waters are observed in wells sampledfrom bedrock wells in or near urban areas. This mayindicate that anthropogenic processes locally affectchloride concentrations in ground water. Some anthro-pogenic factors commonly cited as influences on chlo-ride levels in water include road salting during thewinter (Hem, 1985; 1993), improper disposal of oil-field brines, contamination from sewage, and contam-ination from various types of industrial wastes (Hem,1993).
The dissolution of table salt or halite (NaCl) issometimes cited as a source of both sodium and chlo-ride in ground waters. A qualitative technique to deter-mine if halite dissolution is an influence on ground-water chemistry is to plot sodium concentrations rela-tive to chloride concentrations. Because sodium andchloride ions enter solution in equal quantity duringthe dissolution of halite, an approximately linear rela-tionship may be observed between these ions (Hem,1985). If the concentrations are plotted in milliequiv-alents per liter, this linear relationship should bedescribed by a line with a slope equal to one.
No clearly-defined linear relationship between con-centrations of chloride and sodium is apparent in theground-water samples under consideration (figure58). This suggests that the concentrations of sodiumand chloride in ground waters of the Maumee Riverbasin are influenced by other factors in addition to thedissolution of halite. Figure 58 and the box plots inappendix 15 indicate that sodium concentrationsexceed chloride concentrations in many of the sam-ples under consideration, suggesting that additionalsources of sodium may be present. For example, cal-cium and magnesium in solution can be replaced bysodium on the surface of certain clays by ion

152 Water Resource Availability, Maumee River Basin Ground-water Hydrology, Water Quality 153
Explanation
UNCONSOLIDATED BEDROCK WELLS
< 100 mg/L
101-250 mg/L
> 400 mg/L
251-400 mg/L
Bedrock water quality not mapped north of Allen
County line
N
Figure 59. Generalized areal distribution for Sulfate
exchange. Another possible source of sodium inground water is the dissolution of silicate minerals inglacial deposits.
Box plots of potassium concentrations in ground-water samples from the aquifer systems under consid-eration are displayed in appendix 15. In many naturalwaters, the concentration of potassium is commonlyless than one-tenth the concentration of sodium (Davisand DeWiest, 1970). Almost 90 percent of the samplesused for this report have potassium concentrations thatare less than one-tenth the concentration of sodium.
Sulfate and sulfide
Sulfate (SO4), an anion formed by oxidation of theelement sulfur, is commonly observed in groundwaters. The established secondary maximum contam-inant levels for sulfate is 250 mg/L. Ground-watersamples with sulfate concentrations above this levelwere collected from each of the aquifer systems underconsideration. However, the relative proportion ofsamples with a sulfate concentration that exceeds theSMCL varies considerably among the aquifer sys-tems. Sulfate concentrations above the SMCL areobserved in approximately 6.5 percent of all ground-water samples from the Kendallville Aquifer system.In contrast, sulfate concentrations above the SMCLare measured in every sample from the Teays Valleyand Tributary Aquifer system. Sulfate concentrationsabove the SMCL occur in more than 50 percent ofground-water samples from all other aquifer systemsanalyzed in this report (appendix 15).
Concentration ranges of sulfate in ground water aremapped in figure 59. Ground-water sulfate levelsabove the SMCL are generally observed in the south-ern portion of the Maumee River basin, particularly inAdams County and areas of Allen County. Lower sul-fate levels, however, are generally observed in groundwaters north of the Allen/DeKalb County line. Over90 percent of the ground-water samples from theKendallville Aquifer system in DeKalb, Noble andSteuben Counties contain sulfate levels less than 100mg/L; and no samples contain sulfate levels above theSMCL of 250 mg/L.
The concentration of sulfate in ground waters maybe influenced by various geochemical processes,sources, and time. One important source is the disso-lution or weathering of sulfur-containing minerals.Two possible mineral sources of sulfate have beenidentified in the aquifers of the Maumee River basin.The first includes evaporite minerals, such as gypsumand anhydrite (CaSO4). Evaporite minerals are knownto occur in both Devonian and, to a lesser extent,Silurian bedrock. Fragments of evaporite-bearingrocks may also have been incorporated into someunconsolidated units during glacial advances. The sec-ond possible mineral source of sulfate is pyrite (FeS2),a mineral present in the Antrim Shale and also inSilurian dolomite as highly localized nodules. Theoxidation of pyrite can release iron and sulfate intosolution. Pyrite oxidation may be a source of sulfur inshallow, unconsolidated aquifers containing frag-ments of the Antrim Shale (Fleming, 1994).
Under reducing, low-oxygen conditions, sulfide (S-2) may be the dominant species of sulfur in groundwater. One of the most important influences on thelevels of sulfide in ground water are the metabolicprocesses of certain types of anaerobic bacteria. Thesebacteria use sulfate reduction in their metabolism oforganic matter, which produces sulfide ions as a by-product (Freeze and Cherry, 1979; Hem, 1985).
A sulfide compound that is commonly consideredundesirable in ground water is hydrogen sulfide (H2S)gas. In sufficient quantities, hydrogen sulfide gas cangive water an unpleasant odor, similar to that of rotteneggs. At present, there is no established SMCL forhydrogen sulfide in drinking water. Hem (1985) notesthat most people can detect a few tenths of a milligramper liter of hydrogen sulfide in solution, and Freezeand Cherry (1979) state that concentrations greaterthan about 1 mg/L may render water unfit for drink-ing. Hydrogen sulfide is also corrosive to metals and,
Figure 58. Sodium vs chloride in ground-watersamples from the Maumee River basin
152 Water Resource Availability, Maumee River Basin
exchange. Another possible source of sodium inground water is the dissolution of silicate minerals inglacial deposits.
Box plots of potassium concentrations in ground-water samples from the aquifer systems under consid-eration are displayed in appendix 15. In many naturalwaters, the concentration of potassium is commonlyless than one-tenth the concentration of sodium (Davisand DeWiest, 1970). Almost 90 percent of the samplesused for this report have potassium concentrations thatare less than one-tenth the concentration of sodium.
Sulfate and sulfide
Sulfate (SO4), an anion formed by oxidation of theelement sulfur, is commonly observed in groundwaters. The established secondary maximum contam-inant levels for sulfate is 250 mg/L. Ground-watersamples with sulfate concentrations above this levelwere collected from each of the aquifer systems underconsideration. However, the relative proportion ofsamples with a sulfate concentration that exceeds theSMCL varies considerably among the aquifer sys-tems. Sulfate concentrations above the SMCL areobserved in approximately 6.5 percent of all ground-water samples from the Kendallville Aquifer system.In contrast, sulfate concentrations above the SMCLare measured in every sample from the Teays Valleyand Tributary Aquifer system. Sulfate concentrationsabove the SMCL occur in more than 50 percent ofground-water samples from all other aquifer systemsanalyzed in this report (appendix 15).
Concentration ranges of sulfate in ground water aremapped in figure 59. Ground-water sulfate levelsabove the SMCL are generally observed in the south-ern portion of the Maumee River basin, particularly inAdams County and areas of Allen County. Lower sul-fate levels, however, are generally observed in groundwaters north of the Allen/DeKalb County line. Over90 percent of the ground-water samples from theKendallville Aquifer system in DeKalb, Noble andSteuben Counties contain sulfate levels less than 100mg/L; and no samples contain sulfate levels above theSMCL of 250 mg/L.
The concentration of sulfate in ground waters maybe influenced by various geochemical processes,sources, and time. One important source is the disso-lution or weathering of sulfur-containing minerals.Two possible mineral sources of sulfate have beenidentified in the aquifers of the Maumee River basin.The first includes evaporite minerals, such as gypsumand anhydrite (CaSO4). Evaporite minerals are knownto occur in both Devonian and, to a lesser extent,Silurian bedrock. Fragments of evaporite-bearingrocks may also have been incorporated into someunconsolidated units during glacial advances. The sec-ond possible mineral source of sulfate is pyrite (FeS2),a mineral present in the Antrim Shale and also inSilurian dolomite as highly localized nodules. Theoxidation of pyrite can release iron and sulfate intosolution. Pyrite oxidation may be a source of sulfur inshallow, unconsolidated aquifers containing frag-ments of the Antrim Shale (Fleming, 1994).
Under reducing, low-oxygen conditions, sulfide (S-2) may be the dominant species of sulfur in groundwater. One of the most important influences on thelevels of sulfide in ground water are the metabolicprocesses of certain types of anaerobic bacteria. Thesebacteria use sulfate reduction in their metabolism oforganic matter, which produces sulfide ions as a by-product (Freeze and Cherry, 1979; Hem, 1985).
A sulfide compound that is commonly consideredundesirable in ground water is hydrogen sulfide (H2S)gas. In sufficient quantities, hydrogen sulfide gas cangive water an unpleasant odor, similar to that of rotteneggs. At present, there is no established SMCL forhydrogen sulfide in drinking water. Hem (1985) notesthat most people can detect a few tenths of a milligramper liter of hydrogen sulfide in solution, and Freezeand Cherry (1979) state that concentrations greaterthan about 1 mg/L may render water unfit for drink-ing. Hydrogen sulfide is also corrosive to metals and,
Figure 58. Sodium vs chloride in ground-watersamples from the Maumee River basin

154 Water Resource Availability, Maumee River Basin Ground-water Hydrology, Water Quality 155
Explanation
Bedrock water quality not mapped north of Allen
County line
UNCONSOLIDATED BEDROCK WELLS
< 0.3 mg/L
0.3-2.0 mg/L
> 2.0 mg/L
N
Figure 60. Generalized areal distribution for Iron
if oxidation to sulfuric acid occurs, concrete pipes.Possible results of hydrogen sulfide-induced corrosioninclude damage to plumbing, and the introduction ofmetals into water supplies (GeoTrans Inc., 1983).
Available data on the occurrence of hydrogen sul-fide in the ground waters of the Maumee River basinare qualitative. Well drillers may note the occurrenceof “sulfur water” or “sulfur odor” on well records.This observation usually indicates the presence ofnoticeable levels of hydrogen sulfide gas in the wellwater. The occurrence of hydrogen sulfide is recordedon a few well records from Adams, Allen and WellsCounties. Scattered incidences of hydrogen sulfide inwells are also noted in Adams County by Watkins andWard (1962) and in central Allen County by Bleuerand Moore (1978). Most of the recorded instances ofdetectable hydrogen sulfide levels examined for thisreport occurred in wells completed in the Silurian andDevonian bedrock aquifer system.
Iron and Manganese
Iron concentrations commonly exceed the SMCL of0.3 mg/L in water samples from the unconsolidatedand the bedrock aquifer systems (figure 60).Calculated median iron concentrations range betweenapproximately 1.6 mg/L and 2.0 mg/L in samplesfrom the aquifer systems. Iron levels equal to or belowthe SMCL are observed in less than 6 percent of allsamples analyzed for this constituent.
Water samples with iron levels below the SMCL areobserved in samples from 7 wells completed in theSilurian and Devonian bedrock aquifer system and 2wells completed in the Kendallville Aquifer system.All of the bedrock ground-water samples with ironlevels below the SMCL originate from wells complet-ed in Devonian carbonates in central Allen County.The low iron concentrations in these samples mayreflect the precipitation of iron minerals by iron-reducing bacteria (Hem, 1985).
Because iron is the second most abundant metallicelement in the Earth’s outer crust (Hem, 1985), iron inground water may originate from a variety of mineralsources. In the Maumee River basin, the mineralpyrite (FeS2) is present in the Antrim Shale. BecauseAntrim Shale fragments are abundant in many uncon-solidated deposits, pyrite oxidation may contributeiron to the unconsolidated aquifer systems. The pres-ence of high iron concentrations in ground waters with
low sulfate levels may reflect siderite (FeCO3) disso-lution or the reduction of sulfate created by pyrite oxi-dation (Hem, 1985). The concentration of iron inground water can also be influenced by oxidation-reduction potentials, organic matter content, and themetabolic activity of bacteria.
Although the geochemistry of manganese is similarto that of iron, the manganese concentration in unpol-luted waters is typically less than half the iron con-centration (Davis and DeWiest, 1970). Manganese hasa low SMCL (0.05 mg/L) relative to many other com-mon constituents in ground water because even smallquantities of manganese can cause objectionable tasteand the deposition of black oxides. Because the detec-tion limit for manganese in the DOW-IGS samples istwice the value of the SMCL, the number of times theSMCL is exceeded in this data set cannot be quanti-fied. However, ground-water samples with manganeseconcentrations equal to or above the detection limitare observed in all of the aquifer systems excludingthe Teays Valley and Tributary Aquifer system (appendix 15).
Manganese in Maumee River basin ground wateroriginates from the weathering of rock fragments inthe unconsolidated deposits and oxidation/dissolutionof the underlying bedrock. The Antrim Shale probablycontains a relatively higher manganese content thanthe Silurian-Devonian carbonates. However, lime-stones and dolomites may also be a minor source ofmanganese, because small amounts of manganesecommonly substitute for calcium in the mineral struc-ture of carbonate rocks (Hem, 1985). Oxides of man-ganese can also accumulate in bog environments or ascoatings on stream sediments (Hem, 1985). Therefore,it is possible that high manganese levels may occur inground waters from wetland environments or buriedstream channels.
Fluoride
Many compounds of fluoride can be characterizedas only slightly soluble in water. Concentrations offluoride in most natural waters generally rangebetween 0.1 mg/L and 10 mg/L (Davis and DeWiest,1970). Hem (1985) noted that fluoride levels general-ly do not exceed 1 mg/L in most natural waters withTDS levels below 1000 mg/L. The beneficial andpotentially detrimental health effects of fluoride indrinking water are outlined in the sidebar titled

156 Water Resource Availability, Maumee River Basin Ground-water Hydrology, Water Quality 157
Explanation
UNCONSOLIDATED BEDROCK WELLS
< 1.0 mg/L
1.0-1.9 mg/L
> 2.0 mg/L
Bedrock water quality not mapped north of Allen
County line
N
Figure 61. Generalized areal distribution for Fluoride
National Drinking-Water Standards.Box plots of fluoride concentrations in ground
water samples from the aquifer systems under consid-eration are displayed in appendix 15. None of the wellsamples analyzed for fluoride contained levels abovethe 4.0 mg/L MCL. Concentrations equal to or abovethe SMCL for fluoride (2.0 mg/L) are detected in 4samples from the bedrock aquifer system, and 1 sam-ple from the Hessen Cassel Aquifer system. All 5 ofthese wells are located in southern Adams Countynear the towns of Decatur and Berne (figure 61).
Fluoride-containing minerals such as fluorite,apatite and fluorapatite commonly occur in clasticsediments (Hem, 1985). The weathering of these min-erals may thus contribute fluoride to ground waters insand and gravel units. The mineral fluorite may alsooccur in limestones or dolomites. Fluoride may alsosubstitute for hydroxide (OH-) in some mineralsbecause the charge and ionic radius of these two ionsare similar (Manahan, 1975; Hem, 1985).
Nitrate
Nitrate (NO3-) is the most frequently detected
drinking-water contaminant in the State (IndianaDepartment of Environmental Management, [1990])as well as the most common form of nitrogen inground waters (Freeze and Cherry, 1979). Madisonand Brunett (1984) developed a concentration criteriato qualitatively determine if nitrate levels (as an equiv-alent amount of nitrogen) in ground water may beinfluenced by anthropogenic sources. Using these cri-teria, nitrate levels of less than 0.2 mg/L are consid-ered to represent natural or background levels.Concentrations ranging from 0.21 to 3.0 mg/L areconsidered transitional, and may or may not representhuman influences. Concentrations between 3.1 and 10mg/L may represent elevated concentrations due tohuman activities.
High concentrations of nitrate are undesirable indrinking waters because of possible health effects. Inparticular, excessive nitrate levels can cause methemo-globinemiaprimarily in infants. The maximum conta-minant level, MCL, for nitrate (measured as N) is 10mg/L.
Ranges of nitrate levels in ground-water samplesfrom the Maumee River basin are plotted in figure 62.Because the detection limit for the DOW-IGS samplesis 1.0 mg/L, the occurrence of “background” levels as
defined by Madison and Brunett (1984) cannot bequantified. However, figure 62 indicates that most ofthe samples contain nitrate concentrations below thelevel interpreted by Madison and Brunett (1984) toindicate possible human influences.
The only sample with a nitrate level equal to theMCL was recovered from a well in central AllenCounty (figure 62). Ground-water samples from twonearby wells also contain elevated (above 3.1 mg/L)nitrate levels. In southern Adams County, a nitrateconcentration of 6.7 mg/L is observed in one sampleobtained from a bedrock well. The nitrate level in asample from a nearby unconsolidated well, however,is below the 1.0 mg/L detection limit. Overall, the dis-tribution of nitrate concentrations in ground waters ofthe Maumee River basin appears to indicate that lev-els generally do not exceed 1.0 mg/L. High concen-trations of nitrate, which may suggest human influ-ences, appear to occur in isolated wells or limitedareas.
In 1987, the Indiana Farm Bureau, in cooperationwith various county and local agencies, began theIndiana Private Well Testing Program. The purpose ofthis program is to assess ground-water quality in ruralareas, and to develop a statewide database containingchemical analysis of well samples. By the end of 1993samples from over 9000 wells, distributed over 68counties, had been collected and analyzed as a part ofthe program (Wallrabenstein and others, 1994). Mostof the ground-water samples collected during thisstudy were analyzed for inorganic nitrogen and somespecific pesticides. The results of the pesticide sam-pling are presented in the section entitledPesticidesin Maumee River basin ground waters.
The techniques used to analyze the samples collect-ed for the Farm Bureau study actually measured thecombined concentrations of nitrate and nitrite(nitrate+nitrite). However, the researchers noted thatnitrite concentrations were generally low. Thus thenitrate+nitrite concentrations were approximatelyequal to the concentrations of nitrate in the sample(Wallrabenstein and others, 1994). The MCL fornitrate+nitrite (as equivalent elemental nitrogen) is 10mg/L.
Ground-water samples analyzed for nitrate+nitritewere collected for the Farm Bureau study from wellsin the following counties which lie partially in theMaumee River basin: Adams (136 samples); Allen(278 samples); Steuben (64 samples) and Wells (42samples). Some samples from each county under con-

158 Water Resource Availability, Maumee River Basin Ground-water Hydrology, Water Quality 159
than 0.2 mg/L of strontium. Of the 95 ground-watersamples analyzed for strontium in this report, howev-er, about 85 percent contained strontium concentra-tions above 1.0 mg/L. Davis and DeWiest (1970)report that concentrations of strontium in most groundwaters generally range between 0.01 and 1.0 mg/L. Incontrast, median strontium concentrations in samplesfrom the unconsolidated and bedrock aquifer systemsare 4.4 mg/L and 9.7 mg/L, respectively.
The lowest median strontium concentration isobserved in the ground-water samples from theKendallville Aquifer system. Median strontium con-centrations in samples from the Hessen Cassel Aquifersystem and the New Haven Aquifer system are almost3 times the median in the Kendallville Aquifer system(appendices 14 and 15). In the unconsolidated aquifersystems, strontium concentrations are generally high-er in ground waters south of the Maumee River com-pared with ground waters north of the river (figure63). However, elevated concentrations of strontiumare apparent in some areas of DeKalb County. Groundwaters in the unconsolidated deposits of AdamsCounty may also contain high strontium concentra-tions. Although only 5 strontium measurements inground-water samples from wells completed inunconsolidated deposits are available for AdamsCounty, the lowest of these concentrations exceeds 80percent of all samples from wells in the unconsolidat-ed deposits.
The median strontium concentration in groundwaters from the Silurian and Devonian bedrockaquifer system is similar to the median concentrationsin samples from the Hessen Cassel Aquifer systemand the New Haven Aquifer system (appendix 15).Foley and others (1973) identified high concentrationsof strontium in ground water from bedrock aquifers insouthern Allen County. Analysis of the available datafrom the Silurian and Devonian bedrock aquifer sys-tem indicates that strontium concentrations are gener-ally higher in bedrock waters from Adams County andsouthern Allen County than in northern Allen County(figure 63).
At the time of this report, no enforceable drinking-water standards have been established for strontium.However, the non-enforceable lifetimehealth adviso-ry for strontium is set at 17.0 mg/L. Only one samplefrom a well completed in the Kendallville Aquifer sys-tem in Steuben County contained a strontium concen-tration in excess of the health advisory (see appendix14).
Sources of strontium in ground waters are generallythe trace amounts of strontium present in rocks. Thestrontium-bearing minerals celestite (SrSO4) andstrontianite (SrCO3) may be disseminated in lime-stone and dolomite. In their study of strontium inAllen County ground waters, Foley and others (1973)suggest that Silurian rocks of several different litholo-gies may be the source of high strontium and sulfateconcentrations in southeastern Allen County.
Because strontium and calcium are chemically sim-ilar, strontium atoms may also be absorbed on clayparticles by ion exchange (Skougstad and Horr, 1963).Ion-exchange processes may, thus reduce strontiumconcentrations in ground waters found in clay-richsediments.
Zinc and copper
Generally, significant dissolved quantities of themetal zinc occur only in low pH or high-temperatureground waters (Davis and DeWiest, 1970).Concentrations of zinc in ground-water samples fromthe Maumee River basin are plotted in figure 64. Ofthe 110 ground-water samples analyzed for zinc, 75(approximately 68.2 percent) contain levels below0.05 mg/L. None of the samples analyzed contain zincin concentrations above the 5 mg/L SMCL establishedfor this constituent (appendix 14).
Samples collected by the DOW-IGS during the1988 survey of ground-water quality in the MaumeeRiver basin were analyzed to determine levels of cop-per in solution. However, none of the samples containcopper levels exceeding the 0.05 mg/L detection limit(appendix 14).
Lead
Naturally-occurring minerals that contain lead arewidely dispersed, but have low solubility in most nat-ural ground water. The coprecipitation of lead withmanganese oxide and the adsorption of lead on organ-ic and inorganic sediment surfaces help to maintainlow lead concentration levels in ground water (Hem,1992). Much of the lead present in tap water maycome from anthropogenic sources, particularly leadsolder used in older plumbing systems. Because nat-ural concentrations of lead are normally low andbecause there are so many uncertainties involved in
sideration contained nitrate+nitrite levels over thereporting limit (0.3 mg/L). The most detections wereobserved in Steuben County, where detectable levelsof nitrate+nitrite were found in over 26 percent of allsamples. Nitrate+nitrite levels above the reportinglimit were found in fewer than 10 percent of all sam-ples collected from wells in Adams, Allen, and WellsCounties.
Nitrate+nitrite concentrations above the MCL wereobserved in samples from 6 wells located in SteubenCounty. All 6 of these samples were collected fromwells in the western half of the county, and do notappear to be located within the Maumee River basin.The exact locations of these wells, however, cannot bedetermined. Data on the owners and exact locations ofthe wells sampled for the Farm Bureau study were notprovided in the report.
A variety of anthropogenic activities can contributenitrate to ground waters, and may increase nitrate con-centrations above the MCL. Because nitrate is animportant plant nutrient, nitrate fertilizers are oftenadded to cultivated soils. Under certain conditions,however, these fertilizers may enter the ground waterthrough normal infiltration or through a poorly-con-structed water well. Nitrate is commonly present indomestic wastewater, and high levels of this con-stituent are often associated with septic systems.Animal manure can also be a source of nitrate inground-water systems, and high nitrate levels aresometimes detected in ground waters down gradientfrom barnyards or feedlots. Because many sources ofnitrate are associated with agriculture, rural areas maybe especially susceptible to nitrate pollution of groundwater. To help farmers and other rural-area residentsassess and minimize the risk of ground-water contam-ination by nitrate and other agricultural chemicals, theAmerican Farm Bureau Federation has developed awater quality self-help checklist specifically for agri-cultural operations (American Farm BureauFederation, 1987).
Strontium
Ground waters in the Maumee River basin may becharacterized as containing high concentrations ofstrontium relative to ground water in other regions.For example, Skougstad and Horr (1963) analyzed175 ground-water samples from throughout theUnited States and noted that 60 percent contained less
Figure 62. Distribution of Nitrate-nitrogenconcentrations for wells sampled in bedrock and
unconsolidated deposits
Bedrock wells in redUnconsolidated wells in blue
<1.0 mg/L
1.0 to 3.0 mg/L
3.1 to 9.9 mg/L
> or = 10 mg/L
samples not analyized

160 Water Resource Availability, Maumee River Basin Ground-water Hydrology, Water Quality 161
collecting and analyzing samples, lead was not ana-lyzed in this study.
Total dissolved solids
Total dissolved solids (TDS) are a measure of thetotal amount of dissolved minerals in water.Essentially, TDS represent the sum of concentrationsof all dissolved constituents in a water sample. In gen-eral, if a ground-water sample has a high TDS level,high concentrations of major constituents will also bepresent in that sample. The secondary maximum con-taminant level for TDS is established at 500 mg/L.Drever (1988), however, defines fresh water (watersufficiently dilute to be potable) as water containingTDS of less than 1000 mg/L.
Many samples collected from wells in the MaumeeRiver basin contain TDS levels that exceed the SMCL.The lowest median TDS level is observed in samplesfrom the Kendallville Aquifer system (figure 65).Nevertheless, TDS levels above the SMCL areobserved in approximately 25 percent of all samplesfrom the Kendallville Aquifer system. Of the uncon-solidated aquifer systems under consideration,ground-water TDS levels are especially high in theTeays Valley and Tributary Aquifer system. Althoughonly three measurements of ground-water TDS areavailable from this aquifer system, all three measure-ments exceed 1000 mg/L.
The median TDS level in ground-water samplesfrom the Silurian and Devonian bedrock aquifer sys-tem exceeds the median level in samples from thethree largest unconsolidated aquifer systems in thebasin (the Kendallville, Hessen Cassel and NewHaven Aquifer systems). Herring (1969) also calculat-ed a higher median TDS level in ground waters frombedrock aquifers relative to sand and gravel aquifersin the Maumee River basin. TDS levels in groundwater are especially high in the bedrock aquifer sys-tems of Adams County, exceeding 1000 mg/L in mostsamples. The high TDS levels in the Silurian andDevonian bedrock aquifer system could reflect longresidence times in the bedrock system, and/or dissolu-tion of evaporite minerals.
Very high total dissolved solids concentrations aregenerally observed in deep bedrock formations. InAllen County for example, TDS levels in three brinesamples collected from oil wells in the Trenton for-mation (Ordovician) range from 33,400 to 84,300
Figure 64. Distribution of Zinc concentrations forwells sampled in bedrock and unconsolidated
deposits
Bedrock wells in redUnconsolidated wells in blue
<0.05 mg/L
0.05 to 0.25 mg/L
>0.25 mg/L
samples not analyized
Explanation
UNCONSOLIDATED BEDROCK WELLS
< 5.0 mg/L
5.0-10.0 mg/L
> 10.0 mg/L
Bedrock water quality not mapped north of Allen
County line
N
Figure 63. Generalized areal distribution for Strontium

162 Water Resource Availability, Maumee River Basin Ground-water Hydrology, Water Quality 163
mg/L (Keller, 1983). The high TDS level is a factorthat prevents deep bedrock formations from beingconsidered practical sources of potable ground waterin the Maumee River basin.
Because of the wide range in solubilities of differ-ent minerals, one of the principal influences on TDSlevels in ground water is the minerals that come intocontact with the water. Water in contact with highly-soluble minerals, such as gypsum and halite, willprobably contain higher TDS levels than water in con-tact with less soluble minerals. The residence time ofground water in an aquifer can also influence TDS,because ground water with long residence times canreach a state of chemical saturation with respect todissolved solutes. Ion-exchange processes in clays canincrease TDS because, in order to maintain electricalcharge balance, two monovalentsodium or potassiumions must enter solution for each divalent ionabsorbed. Total dissolved solids levels may also beinfluenced by ground-water pollution. Road salting,waste disposal, mining, landfills, and runoff fromurban or agricultural areas are some human factorsthat may add dissolved constituents to ground water.
Pesticides
Because agriculture is an important form of land usein Indiana, pesticides are widely used in the state tocontrol weeds and insects. In 1990 for example, areported 28 million pounds of corn and soybean pesti-cides were used throughout the state (Risch, 1994).The widespread use of pesticides has created concernsabout possible adverse affects that these chemicalsmay have on the environment. Among these concernsis the possibility that pesticides may contaminateground-water supplies.
Through a cooperative effort, the U.S. GeologicalSurvey and the Indiana Department of EnvironmentalManagement have developed a statewide computer-ized database containing analyses of pesticides inground-water samples. This database contains theresults of 725 ground-water samples collected during6 statewide and 15 localized studies betweenDecember 1985 and April 1991. Sources of data con-sist of the U.S. Geological Survey, the IndianaDepartment of Environmental Management, theIndiana Department of Natural Resources, and theU.S. Environmental Protection Agency. A comprehen-sive summary of the pesticide database has been writ-
ten by Risch (1994).The pesticide data base includes water sample
analyses from 37 different wells in the Maumee Riverbasin. Thirty-five of the 37 wells were sampled in1988 as a part of a cooperative effort between theIDNR and IDEM. The other two wells include a pub-lic water-supply well in Adams County sampled bythe USEPA and a bedrock well in Allen County sam-pled by the USGS in 1991.
The 35 wells are a subset of 95 wells sampled forinorganics by the DOW-IGS. The inorganic chemicalanalyses from only 34 of the 35 samples are includedin appendices 13 and 14, because one of the watersamples appears to have been treated in a water softener.
Of the 37 wells sampled in the basin for pesticides,3 (8 percent) contained detectable levels of the herbi-cide dicamba. None of these samples, however, con-tained concentrations above the health advisory fordicamba (0.2 mg/L). All of the samples withdetectable dicamba levels were collected from wellscompleted in the Kendallville Aquifer system. Thedepths of these wells ranged from 80 to 260 feet.
In January 1989, the IDEM resampled the wells thatcontained detectable levels of dicamba to verify thecontinued presence of any pesticides at levels abovethe analytical detection limit. None of the new sam-ples contained detectable levels of dicamba or anyother pesticide (Indiana Department of EnvironmentalManagement, [1990]).
A major focus of a recent private well-water testingprogram in Indiana (Wallrabenstein and others, 1994)is to collect information on the presence of triazineherbicide and alachlor in rural water supplies. In theMaumee River basin, data from this program are cur-rently available for wells in Adams, Allen, Steubenand Wells Counties. The private testing program,which is sponsored by the Indiana Farm Bureau, Soiland Water Conservation Districts, County HealthDepartments, Resource Conservation andDevelopment Districts, County Extension Offices, andother local entities, usesimmunoassayanalyses toscreen for triazine herbicides and alachlor. Nitrate lev-els in rural water supplies are also examined, as dis-cussed on the previous pages of this section under theheading of Nitrate .
The triazine immunoassay screen indicates thepresence of one or more of the common triazine her-bicides including atrazine (AAtrex), cyanazine(Bladex), and simazine (Princep), and some triazine
Explanation
UNCONSOLIDATED BEDROCK WELLS
< 500 mg/L
500-1000 mg/L
> 1000 mg/L
Bedrock water quality not mapped north of Allen
County line
N
Figure 65. Generalized areal distribution for Total Dissolved Solids

164 Water Resource Availability, Maumee River Basin Ground-water Hydrology, Water Quality 165
ground-water samples collected in 1949 and 1950.The samples analyzed by Watkins and Ward werecharacterized as having hardness levels above 300mg/L as CaCO3 and TDS levels above 500 mg/L.Concentrations of both iron and sulfate varied by twoorders of magnitude among the samples, but mostsamples contained iron and sulfate concentrations inexcess of their respective SMCLs.
A report on the ground-water resources in theMaumee River basin by Herring (1969) documentedvariations in water quality within the basin. Fifty-oneanalyses of samples from private and public ground-water supplies were used to describe ground-waterquality in the Maumee River basin. Higher levels ofsulfate and hardness were observed in samples fromwells in the bedrock aquifers of the southern part ofthe basin than in samples from wells in unconsolidat-ed sediments. Ground-water samples from sands andgravels in the buried valleys of Adams County, how-ever, were geochemically similar to ground waters inthe bedrock aquifers (Herring, 1969).
Foley and others (1973) studied the influence ofaquifer lithology and ground-water flow on the geo-chemistry of ground water in Allen County. A total of14 samples from wells in glacial deposits were ana-lyzed to describe the chemistry of ground water inunconsolidated aquifers. Ground waters from theglacial deposits were described as having high con-centrations of iron, sulfate and strontium. The authorsalso delineated a general decrease in the ratio of calci-um concentrations to magnesium concentrations fromnorth to south. This decrease may be indicative ofincreasing dolomite content in the glacial deposits(Foley and others, 1973).
Thirty-one ground water samples from wells com-pleted in bedrock were also analyzed by Foley andothers (1973) as part of their geochemical study inAllen County. Ground waters from the bedrockaquifers generally contained lower iron concentra-tions, but higher levels of strontium and sulfate, thanground waters from glacial deposits. The highest con-centrations of strontium, sulfate and TDS wereobserved in samples obtained from Silurian carbon-ates south of the Maumee River.
Ground-water contamination
A ground-water supply, that under natural condi-tions would be acceptable for a variety of uses, can be
adversely affected by contamination from humanactivities. Contamination, as defined by the IndianaDepartment of Environmental Management [1988a],occurs when levels of contaminants are in excess ofpublic drinking-water standards, or health protectionguidance levels promulgated by the USEPA.
Over the past 100 years industrial and agriculturalpractices that accompany development have createdample opportunity for ground-water contamination inthe Maumee River basin. Numerous potential sourcesfor ground-water contamination exist in the MaumeeRiver basin, including sanitary landfills, sewage treat-ment plants, industrial facilities, agricultural opera-tions, septic and underground storage tanks, and road-salt storage facilities.
Some cases of actual ground-water contaminationhave been identified in the basin. The IndianaDepartment of Environmental Management (IDEM),Ground Water Section maintains a database of Indianasites having ‘confirmed’ground-water contamination.To date, 13 sites have been confirmed in the MaumeeRiver basin including 9 sites in Allen County, 3 inDeKalb County, and 1 in Adams County (IDEM,Ground-Water Section, unpublished data, 1996). Oneof these sites has been placed on the USEPA NationalPriorities List (NPL) of Superfund sites and has beenundergoing remediation of soil and ground water.Another site of known ground-water contamination inthe basin is a Defense Environmental RestorationProgram (DERP) site. In addition to the ground-watercontamination sites on the ‘confirmed’ list, there areseveral leaking underground storage tanks in the basin(Indiana Department of Environmental Management,1995; IDEM, Office of Environmental Response,unpub. data, 1996).
Susceptibility of aquifers to surface contamination
Because contaminants can be transmitted to theground-water system by infiltration from the surface,the susceptibility of an aquifer system to contamina-tion from surface sources depends in part on the typeof material that forms the surface layer above theaquifer. In general, sandy surficial sediments can eas-ily transmit water from the surface, but provide negli-gible filtering of contaminants. Clay-rich surficialdeposits, such as glacial till, generally have lower ver-tical hydraulic conductivity than sand and graveldeposits, thereby limiting the movement of contami-
metabolites. The alachlor screen indicates the pres-ence of alachlor (Lasso), metolachlor (Dual), meta-laxyl (Ridomil) or one of the related acetanilideher-bicides. The alachlor screen may also react to variousalachlor metabolites. The immunoassay procedures,thus do not indicate which specific pesticide(s) is (are)present, but will confirm the absence of triazine- oracetanilide-pesticides at concentrations above themethod detection limit (MDL). In the assessment ofdata collected during the private-well screening pro-gram, the researchers used the term “triazine” to referto triazine herbicides and their metabolites, and usedthe term “acetanilide” in reference to alachlor, meto-lachlor and related metabolites (Wallrabenstein andothers, 1994).
The results of the triazine and alachlor screeningwere assessed in terms of two standards; the detectionlimit (DL) and the maximum contaminant level(MCL). The MCLs used for this study were those foratrazine (3.0 µg/L) and alachlor (2.0 µg/L). Sampleswere categorized into one of the following fourgroups: 1) no triazine or acetanilide detected; 2) con-centrations above DL, but less than one-half MCL; 3)concentrations above one-half MCL up to the MCL;4) concentrations above the MCL. The detection lim-its for triazine and acetanilide for this study are report-ed as 0.05 micrograms per liter (µg/L) or parts per bil-lion (ppb) and 0.2 µg/L, respectively. Because of theambiguity in the analysis, well owners whose samplescontained levels of triazine in the range of 3.0 µg/L oracetanilide in the range of 2.0 µg/L were encouragedto have another sample analyzed with gas chromato-graphic methods (Wallrabenstein and others, 1994).
None of the samples from wells in Adams, Allen,Steuben or Wells Counties contained triazine concen-trations above 3.0 µg/L. Levels of triazine above thedetection limit, but less than 1.5 µg/L, were observedin 3 out of 275 samples from Allen County. Detectablelevels of triazine below 1.5 µg/L were also observed in1 of the 137 samples from Adams County, 1 of the 24samples from Steuben County, and 1 of the 42 sam-ples from Wells County.
Acetanilide concentrations ranging from 0.2 µg/L toless than 1.0 µg/L were detected in two samples fromwells in Allen County, 1 sample from a well inSteuben County, and 1 sample from Wells County.Higher concentrations (1.0 µg/L to 2.0 µg/L) were alsodetected in a sample from a well in Allen County andin a single ground-water sample from SteubenCounty. None of the samples from wells in Adams
County contained detectable levels of acetanilide.Concentrations of acetanilide were below 2.0 µg/L inall of the ground-water samples from the wells ana-lyzed in this study.
Throughout the state, over 90 percent of the watersamples analyzed for the Indiana Farm Bureau pesti-cide study contained no detectable amounts of triazineor acetanilide. The MCL for triazine was exceeded inonly 0.1 percent of all samples. Approximately 1.6percent of all samples contained acetanilide levelsabove 2.0 µg/L, however, the majority of acetanilidedetects were believed to be caused by a soil metabo-lite of alachlor (Wallrabenstein and others, 1994). Ingeneral, triazine and acetanilide were most frequentlydetected in shallow (less than 50 feet deep) wells.Furthermore, samples collected from dug or drivenwells contained a higher percentage of detects thansamples collected from drilled wells. The occurrenceof detectable concentrations of triazine and acetanilidein ground water suggests that shallow, poorly-con-structed wells may be especially susceptible to pesti-cide contamination.
Previous ground-water sampling studies
Some of the earliest descriptions of ground-waterquality in areas of the Maumee River basin were pre-pared by the Indiana Department of Conservation(now called the Indiana Department of NaturalResources). The Indiana Department of Conservationdeveloped basic data reports on the ground-waterresources for Noble and Adams Counties. Thesereports contain brief descriptions of the levels ofmajor constituents in well samples from these counties.
Stallman and Klaer (1950) prepared the report onground-water resources in Noble County for theIndiana Department of Conservation. This reportincludes a description of ground-water quality fromseveral municipal well systems, including the town ofAvilla within the basin and the town of Kendallvillenear the basin boundary. Ground water from thesewells was generally characterized as being very hard,and contained iron concentrations sufficient to stainplumbing fixtures. Total dissolved solids concentra-tions exceeded the current SMCL in most of the sam-ples examined.
Watkins and Ward (1962) provided a description ofground-water quality in Adams County based on 33
166 Water Resource Availability, Maumee River Basin Ground-water Hydrology, Water Quality 167
basin bedrock aquifer system, it will be difficult totrack.
Regional estimates of aquifer susceptibility can dif-fer considerably from local reality. Variations withingeologic environments can cause variation in suscep-tibility to surface contamination. Also, man-madestructures such as poorly-constructed water wells,unplugged or improperly-abandoned wells, and openexcavations, can provide contaminant pathways whichbypass the naturally-protective clays. In contrast,man-made structures can also provide ground-waterprotection that would not normally be furnished by thenatural environment. For example, large containmentstructures can inhibit infiltration of both surface waterand contaminants. Current regulations administeredby the IDEM contain provisions for containmentstructures, thereby permitting many operations tooccur that would otherwise provide an increased con-tamination risk to soils and the ground water. Otherregulations administered by the IDNR regulate theproper construction of new wells and sealing (plug-ging) of abandoned wells, whether related to petrole-um or water production.
Protection and management of ground-waterresources
Major ground-water management and protectionactivities in Indiana are administered by the IDEM,IDNR, and the Indiana State Department of Health(ISDH). An expanded cooperative effort in the formof the Inter-Agency Ground-Water Task Forceinvolves representatives of these three agencies aswell as the State Chemist, State Fire Marshal, and
members of local government, labor, and the business,environmental and agricultural communities. TheTask Force was first formed in 1986 to develop a stateground-water quality protection and managementstrategy, and is mandated by the 1989 Ground WaterProtection Act (IC 13-18-17, previously 13-7-26) tocoordinate the implementation of this strategy. Thestrategy is an agenda of state action to prevent, detect,and correct contamination and depletion of groundwater in Indiana (Indiana Department ofEnvironmental Management, 1988c). The 1989 actalso requires the IDEM to maintain a registry of cont-amination sties, operate a clearinghouse for com-plaints and reports of ground-water pollution, andinvestigate incidents of contamination that affect pri-vate supply wells.
Developing a program plan for delineating andmanaging wellhead protection (WHP) areas for publicwater supplies is one priority action designated by thestate ground-water strategy and draft implementationplan (Indiana Department of EnvironmentalManagement, 1988b). The federal Safe DrinkingWater Act Amendments of 1986 established the pro-gram for protection of wellhead areas for public sup-ply systems from contamination, but requires a state tocomplete a program plan in order to be eligible forfederal financial assistance. The Indiana WHP pro-gram plan has been developed and is expected tobecome effective in 1997. The program plan estab-lishes regulations which will become effective inphases based on the number of customers served by apublic supply facility. This program is administeredby the IDEM Office of Water Management, DrinkingWater Branch, Ground Water Section.
nated water. However, the presence of fractures canlocally decrease the effectiveness of a till to protectground water. The differences in basic hydrologicproperties of sands and clays make it possible to usesurficial geology to estimate the potential for ground-water contamination.
The highly complex relationships of the variousglacial deposits in the Maumee River basin precludesite-specific comments about susceptibility of theregional aquifer systems to contamination. However, afew gross generalizations can be made. Detailed map-ping, including mapping for ground-water sensitivityto contamination, is available for Allen County(Fleming, 1994).
The Kendallville Aquifer system, consisting chieflyof intertill lenses of outwash sand and gravel, has lowto moderate susceptibility to surface contamination.Clay-rich Erie Lobe tills, commonly ranging fromabout 10 to 100 feet in thickness, overlie much of theaquifer system and offer some protection to the under-lying aquifers. However, in northeastern DeKalbCounty and many parts of Steuben County, Erie Lobetills are absent and more permeable sediments in theform of ice-contact and mixed-drift deposits occur atthe surface. Thus, the northern extent of theKendallville Aquifer system has a significantly highersusceptibility to surface contamination than otherparts of the system.
Along its northern extent, the Aboite Aquifer sys-tem is moderately susceptible to surface contamina-tion. The aquifer system, comprised of outwash sandand gravel deposits that occur at various horizons, isoverlain by clay-rich Erie Lobe tills in the north. In thesouth, however, the system is highly susceptible tosurface contamination because there is little if any tillpresent, and the thick outwash channel and fandeposits that comprise the water-bearing units in thisarea are poorly confined by heterogenous surficialsediments.
In general, the Hessen Cassel Aquifer system haslow susceptibility to surface contamination. Acrosslarge parts of the southern Maumee River basin, theseldom-used scattered intertill lenses of glacial out-wash that comprise the aquifer system are overlain byabout 20 to 40 feet of clayey basal Erie Lobe tills. Thetill cap contains a well-developed system of near-ver-tical fractures that extend to a depth of 20 to 25 feet(Fleming, 1994). However, the shallow fracture zoneof the Erie Lobe tills does not significantly reduce thehigh degree of confinement of the aquifer system
because the few wells that reach productive zones ofsand and gravel have depths ranging from 50 to 90feet. In the northeastern part of the aquifer system,glaciolacustrinesediments of the Maumee LacustrinePlain appear as a surficial veneer of laminated silt andclay, tills, debris flow deposits and interlayered sandand silt. In some areas of the lacustrine plain wheresurficial deposits are thin, the underlying sand andgravel aquifers are susceptible to surface contamina-tion.
The New Haven Aquifer system has low to moder-ate susceptibility to surface contamination. The north-ern part of the nearly-continuous outwash plaindeposit is moderately susceptible because it is over-lain by an extensive blanket of fine sand. The remain-der of the aquifer system, overlain by tills, debris flowdeposits, and glaciolacustrine sediments, has low sus-ceptibility to surface contamination.
The unconfined portions of the Cedarville and theEel River-Cedar Creek Aquifer systems are highlysusceptible to contamination from surface sourcesbecause the surficial valley train sediments of bothaquifer systems are highly permeable. Although tillsbeneath the surficial valley train deposits may providesome protection to the confined portions of bothaquifer systems, in many places surficial valley traindeposits coalesce with the deeper outwash deposits.Hence, the overall susceptibility of the Cedarville andthe Eel River-Cedar Creek Aquifer systems is consid-ered high.
The Teays Valley and Tributary Aquifer system hasa low susceptibility to surface contamination becauseoutwash sediments within the bedrock valleys are gen-erally overlain by dense tills of the TrafalgarFormation and clayey tills of the Lagro Formation.Although lenses of outwash sand and gravel mayoccur within the tills, the predominance of fine-grained sediments above the bedrock valleys limits themigration of contaminants from surface sources to thedeep aquifers.
The susceptibility of bedrock aquifer systems tosurface contamination is dependant on the nature ofthe overlying sediments, because the bedrockthroughout the basin is overlain by unconsolidateddeposits. Just as recharge for bedrock aquifers cannotexceed that of overlying unconsolidated deposits, sus-ceptibility to surface contamination will not exceedthat of overlying deposits. However, because thebedrock aquifer systems have complex fracturing sys-tems, once a contaminant has been introduced into a