ground improvement - alexandria_20070206014923
TRANSCRIPT
7/25/2019 Ground Improvement - Alexandria_20070206014923
http://slidepdf.com/reader/full/ground-improvement-alexandria20070206014923 1/12
Ref: 132 Wong and Lacazedieu - Page 1 of 12
Dynamic Replacement Ground Improvement – Field
Performance Versus Design Predictions for the Alexandria City Centre Project in Egypt
P.K. Wong, Coffey Geosciences Pty Ltd, Sydney, Australia
M. Lacazedieu, Menard Soltraitement, Nozay, France
AbstractThis paper describes the use of a partially penetrating Dynamic Replacement (DR) ground
improvement solution at a site in Egypt. It presents conventional and numerical analyses
used in the design. Field monitoring results are compared to the analysis results, and material parameters back analysed for calibration of the design model for later stages of the project.
An interesting finding on the ground improvement at this site was that significantly higher
than predicted strength gain was achieved on the soft soils. This beneficial effect is postulated
to be caused by the high lateral stresses produced by the DR installation process.
Project BackgroundA very large shopping centre was constructed on a 220,000m
2 site in Alexandria, Egypt. The
initial earthworks contract required reclamation of part of a lake. Very soft, compressible
organic clay deposits existed up to 9m in places beneath the lakebed. The specificationrequired the site to be raised by 2m above the lake water level. The design criteria was for
post-construction settlement under the specified loads to not cause the site to drop below thedesign level, and for differential settlements to be within design tolerance. In particular,
proposed tiled floors required stringent differential settlement limits of 1 in 1000.
The design column load was 700kN, and columns were to be supported on shallow footings
founded at 1.5m depth below bulk earthworks level. However, as the layout of the buildings
was not finalised at the time of the earthworks design, the challenge was to come up with an
economical earthworks/ground treatment strategy to enable shallow footings to be adopted at
the site, irrespective of the building column locations.
Site ConditionsThe site is situated east of Alexandria on the Cairo Desert Road, on the edge of Lake
Maryout, in the Western Nile deltaic zone of Egypt. A significant part of the site is below the
existing lake level, with an average water depth of 1.5m.
The subsurface profile at the site is characterised by three main units as summarised below:
Unit 1 Very soft clay with organic matter 4m to 9m thick (typically 7m)
Unit 2 Stiff silty clay and clayey silt 5m to 9m thick
Unit 3 Very dense silty sand not penetrated
7/25/2019 Ground Improvement - Alexandria_20070206014923
http://slidepdf.com/reader/full/ground-improvement-alexandria20070206014923 2/12
Ref: 132 Wong and Lacazedieu - Page 2 of 12
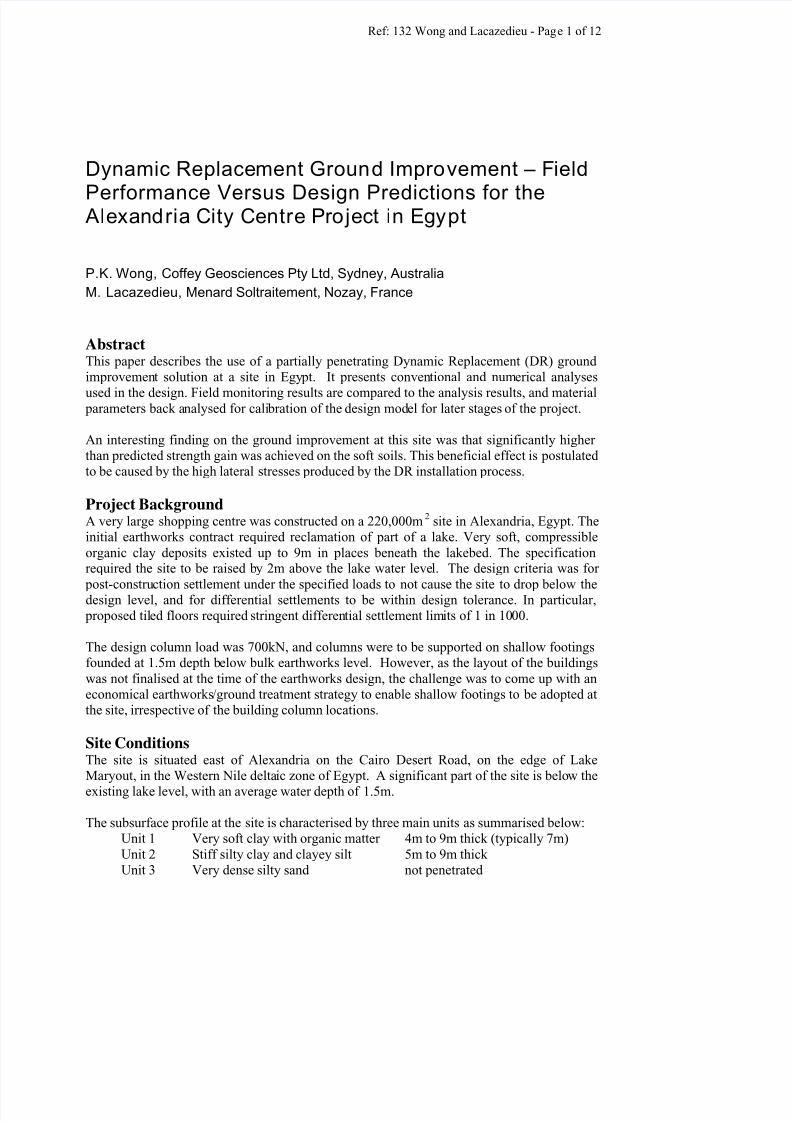
A typical piezocone test result is shown in Figure 1.
Figure 1 – Typical Piezocone Test Results
It was obvious that Unit 1 will control site settlement and will govern the design of ground
improvement works. Based on the laboratory testing results, the following soil properties
were adopted for Unit 1:
Moisture content, Wn 76% to 130%
Liquid Limit, WL 102% to 146%
Plastic Limit, WP 35% to 43%
Plastic Index, IP 67% to 106%
Bulk Unit Weight, γ b 14.5 kN/m3
Vertical Coefficient of Consolidation, cv 2.0 m2/year
Horizontal Coefficient of Consolidation, ch 10.0 m2/year
Modified Compression Index, Cc /(1 + e0) 0.3
Modified Recompression Index, Cr /(1 + e0) 0.03Modified Creep Coefficient, Cα /(1+ e0) 0.015
Design of Dynamic ReplacementFollowing preliminary assessment of a number of ground improvement options which
included vacuum consolidation and rigid inclusion methods, it was decided to adopt Dynamic
Replacement as the ground improvement solution for Phases 1 and 2 of the project (72,000m2
of building area and 50,000m2 of on-grade car parking area) due to its relative speed of
construction and economy.
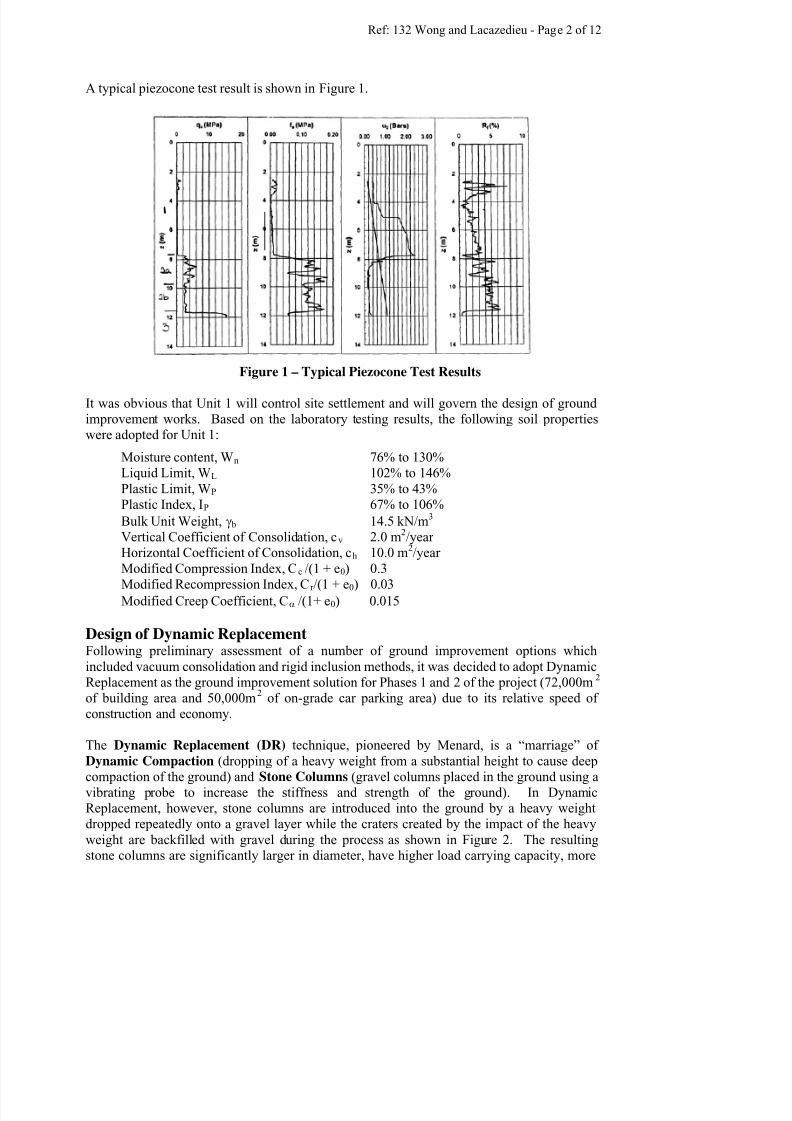
The Dynamic Replacement (DR) technique, pioneered by Menard, is a “marriage” of
Dynamic Compaction (dropping of a heavy weight from a substantial height to cause deep
compaction of the ground) and Stone Columns (gravel columns placed in the ground using a
vibrating probe to increase the stiffness and strength of the ground). In Dynamic
Replacement, however, stone columns are introduced into the ground by a heavy weight
dropped repeatedly onto a gravel layer while the craters created by the impact of the heavy
weight are backfilled with gravel during the process as shown in Figure 2. The resulting
stone columns are significantly larger in diameter, have higher load carrying capacity, more
7/25/2019 Ground Improvement - Alexandria_20070206014923
http://slidepdf.com/reader/full/ground-improvement-alexandria20070206014923 3/12
Ref: 132 Wong and Lacazedieu - Page 3 of 12
rapid to install, and hence more economical compared with the conventional Stone Column
ground treatment method. The disadvantage of Dynamic Replacement, however, is that there
is a limiting depth to which the DR stone columns can be installed, and at which the gravel
near the top of the columns will tend to heave rather than being pushed downwards by the
falling weight. Some previous usage of Dynamic Replacement have been reported by Juillie
and Sherwood (1983), Lee and Lo (1985), and Varaksin et al (1994).
Figure 2 – Dynamic Replacement Installation
To meet the stringent post-construction settlement criteria, it was also necessary to preload
the site. And to meet the limited time programme, prefabricated wick drains were installed to
increase the rate of consolidation even though the DR columns would already facilitate radial
drainage to occur in the soft clay.
The preload and wick drain spacing were designed using conventional one-dimensional andradial drainage theory (Schmertmann (1955), Barron (1948), and as described in Fell, Wong
& Stone (1987)). The design of wick drain spacing took into account soil disturbance and
discharge capacity of the drains using the procedures described by Hansbo et al (1981). The
design solutions are summarised in Table 1 below:
Table 1 – Summary of Design Solutions
Proposed Development Phase 1
Buildings
Phase 2
Car park
Approximate Area 70,012 m2 41,370 m
2
Settlement Limit 13.5mm under uniform live load
of 20kPa;
20mm under 700kN column load;34mm creep over 50 years;
Differential settlement 1:1000
100mm over
50 years
DR Spacing 5.5m 7m
DR Diameter 2.5m at surface 2.5m at surface
Wick Drain Spacing (square grid) 1.1 1.25
7/25/2019 Ground Improvement - Alexandria_20070206014923
http://slidepdf.com/reader/full/ground-improvement-alexandria20070206014923 4/12
Ref: 132 Wong and Lacazedieu - Page 4 of 12
An important aspect of the design was that the DR columns would not be fully penetrating.
After placement of a 1.7m thick working platform to provide access, the maximum depth of
penetration of the DR columns was assessed to be 6.5m, thereby leaving about 2.2m
thickness of the soft clay layer (for a design soft clay thickness of 7m) untreated.
One Dimensional Settlement Analysis
Initial settlement predictions were made using conventional one-dimensional consolidationtheory. Due to the relatively large anticipated settlement, an iterative approach was need to
assess the amount of fill required to bring the site to the required design level, and with
sufficient preload to ensure that the post-construction settlement criteria would be met.
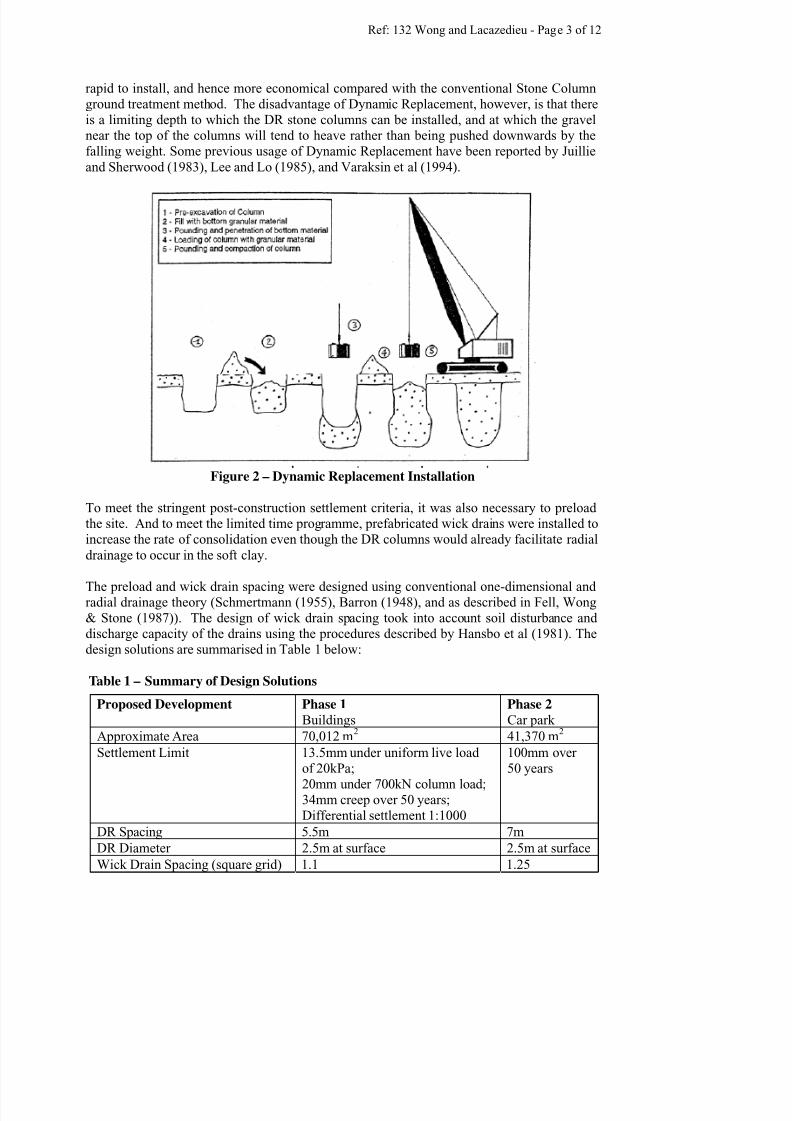
One complication is that the effective stress induced in the soft clay layer due to the filling is
also a function of the settlement, with the final submerged part of the fill exerting only the
buoyant weight. If not taken into account, this effect can produce over-estimation of
settlement. To assess the amount of fill required to bring the site to the required grade level
taking into account settlement and the buoyancy effect below the water level, a spreadsheet
was developed, from which calculated settlement is plotted against applied effective stress,
and the total fill thickness can be read off the diagonal lines that are governed by the unit
weight of the fill as shown in Figure 3.
Figure 3 – Graphical Assessment of Settlement and Required Fill Thickness
-2.0
-1.5
-1.0
-0.5
0.0
0.5
1.0
1.5
2.0
2.5
3.0
3.5
4.0
4.5
5.0
5.5
6.0
0 50 100 150
Applied Pressure (kPa)
E m b a n k m e n t H e i g h t ( m )
T o t a l F i l l T h i c k n e s s R e q u i r e d t o A c h i e v e A
P a r t i c u l a r H e i g h t A b o v e G
r o u n d L e v e l
Water Level for this Example
Assessed Settlement
Diagonal lines representingeffective stresses imposed by thefill depending on unit weight of fill(note “bent” lines below watertable due to buoyancy effect)
7/25/2019 Ground Improvement - Alexandria_20070206014923
http://slidepdf.com/reader/full/ground-improvement-alexandria20070206014923 5/12
Ref: 132 Wong and Lacazedieu - Page 5 of 12
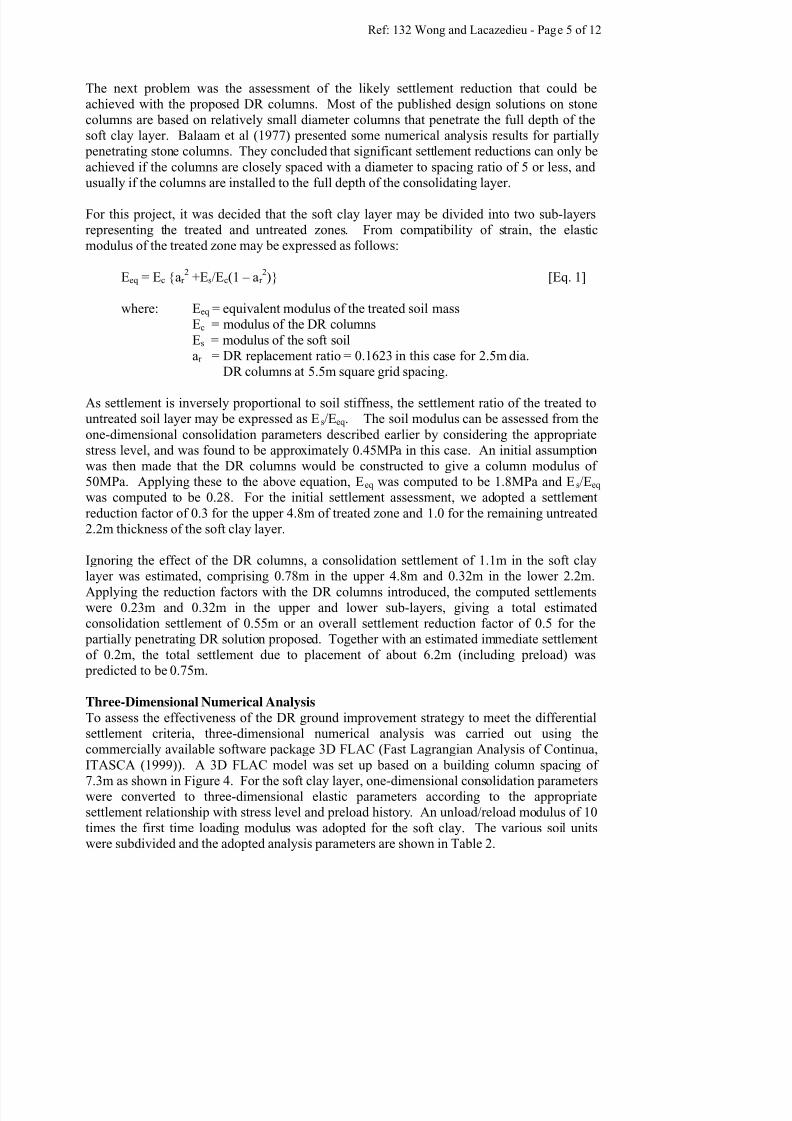
The next problem was the assessment of the likely settlement reduction that could be
achieved with the proposed DR columns. Most of the published design solutions on stone
columns are based on relatively small diameter columns that penetrate the full depth of the
soft clay layer. Balaam et al (1977) presented some numerical analysis results for partially
penetrating stone columns. They concluded that significant settlement reductions can only be
achieved if the columns are closely spaced with a diameter to spacing ratio of 5 or less, and
usually if the columns are installed to the full depth of the consolidating layer.
For this project, it was decided that the soft clay layer may be divided into two sub-layers
representing the treated and untreated zones. From compatibility of strain, the elastic
modulus of the treated zone may be expressed as follows:
Eeq = Ec {ar 2 +Es/Ec(1 – ar
2)} [Eq. 1]
where: Eeq = equivalent modulus of the treated soil mass
Ec = modulus of the DR columns
Es = modulus of the soft soil
ar = DR replacement ratio = 0.1623 in this case for 2.5m dia.
DR columns at 5.5m square grid spacing.
As settlement is inversely proportional to soil stiffness, the settlement ratio of the treated to
untreated soil layer may be expressed as Es/Eeq . The soil modulus can be assessed from the
one-dimensional consolidation parameters described earlier by considering the appropriate
stress level, and was found to be approximately 0.45MPa in this case. An initial assumption
was then made that the DR columns would be constructed to give a column modulus of
50MPa. Applying these to the above equation, Eeq was computed to be 1.8MPa and Es/Eeq
was computed to be 0.28. For the initial settlement assessment, we adopted a settlement
reduction factor of 0.3 for the upper 4.8m of treated zone and 1.0 for the remaining untreated
2.2m thickness of the soft clay layer.
Ignoring the effect of the DR columns, a consolidation settlement of 1.1m in the soft clay
layer was estimated, comprising 0.78m in the upper 4.8m and 0.32m in the lower 2.2m.
Applying the reduction factors with the DR columns introduced, the computed settlementswere 0.23m and 0.32m in the upper and lower sub-layers, giving a total estimated
consolidation settlement of 0.55m or an overall settlement reduction factor of 0.5 for the
partially penetrating DR solution proposed. Together with an estimated immediate settlement
of 0.2m, the total settlement due to placement of about 6.2m (including preload) was
predicted to be 0.75m.
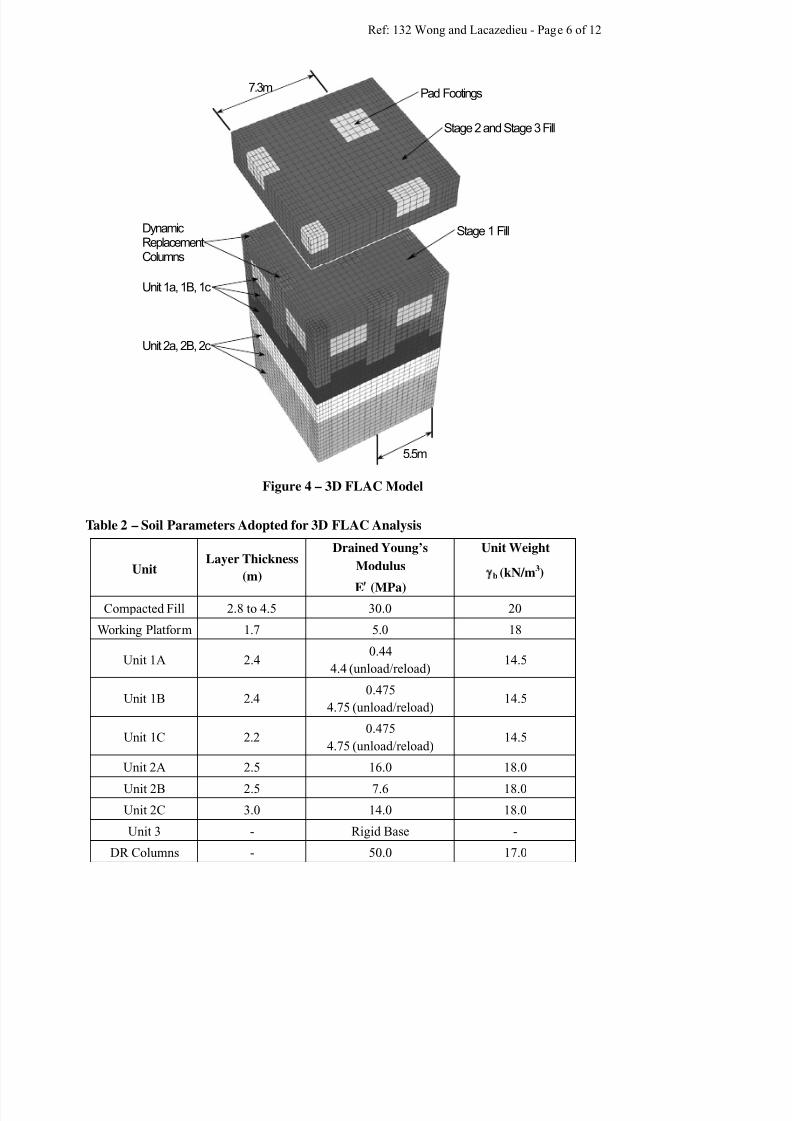
Three-Dimensional Numerical Analysis
To assess the effectiveness of the DR ground improvement strategy to meet the differential
settlement criteria, three-dimensional numerical analysis was carried out using the
commercially available software package 3D FLAC (Fast Lagrangian Analysis of Continua,
ITASCA (1999)). A 3D FLAC model was set up based on a building column spacing of
7.3m as shown in Figure 4. For the soft clay layer, one-dimensional consolidation parameterswere converted to three-dimensional elastic parameters according to the appropriate
settlement relationship with stress level and preload history. An unload/reload modulus of 10
times the first time loading modulus was adopted for the soft clay. The various soil units
were subdivided and the adopted analysis parameters are shown in Table 2.
7/25/2019 Ground Improvement - Alexandria_20070206014923
http://slidepdf.com/reader/full/ground-improvement-alexandria20070206014923 6/12
Ref: 132 Wong and Lacazedieu - Page 6 of 12
Figure 4 – 3D FLAC Model
Table 2 – Soil Parameters Adopted for 3D FLAC Analysis
UnitLayer Thickness
(m)
Drained Young’s
Modulus
E (MPa)
Unit Weight
b (kN/m3)
Compacted Fill 2.8 to 4.5 30.0 20
Working Platform 1.7 5.0 18
Unit 1A 2.40.44
4.4 (unload/reload)14.5
Unit 1B 2.40.475
4.75 (unload/reload)14.5
Unit 1C 2.20.475
4.75 (unload/reload)14.5
Unit 2A 2.5 16.0 18.0
Unit 2B 2.5 7.6 18.0
Unit 2C 3.0 14.0 18.0
Unit 3 - Rigid Base -
DR Columns - 50.0 17.0
Unit 2a, 2B, 2c
Unit 1a, 1B, 1c
DynamicReplacementColumns
Stage 1 Fill
Pad Footings
Stage 2 and Stage 3 Fill
5.5m
7.3m
7/25/2019 Ground Improvement - Alexandria_20070206014923
http://slidepdf.com/reader/full/ground-improvement-alexandria20070206014923 7/12
Ref: 132 Wong and Lacazedieu - Page 7 of 12
A Poisson’s Ratio of 0.3 was adopted for all soil layers.
All vertical boundaries on this model were modelled as symmetrical boundaries to model
repetition of this column loading pattern over an infinite plan area. The DR column and
footing pattern adopted in the model was selected to enable differential settlement to be
assessed, for column loads occurring either directly over the DR columns or between DR
columns.
The results of the 3D analysis indicate the following:
• Calculated settlements from initial filling matched those calculated using one-
dimensional consolidation theory, which confirmed that the equivalent elastic
parameters were appropriately converted from the 1D parameters.
• The design post-construction settlement and differential settlement criteria were met.
• Irrespective of the footing locations relative to the DR columns, the vertical effectivestress increase within any given horizontal plane in the soft clay layer was relatively
uniform laterally, except near the edge of the DR columns, and confirmed the ability
of the DR columns and the overlying compacted fill layer to spread the load and
settlement uniformly to meet the stringent differential settlement criteria.
• At the maximum fill thickness (under maximum preload) of 6.2m including theworking platform, the vertical stress increase in the DR columns was 250kPa
compared to 50kPa in the soft clay sub-layer 1A, indicating a load carrying ratio of
5:1 for the 2.5m diameter DR column at 5.5m spacing.
Sensitivity analyses were also carried out to assess the potential situation where the soft clay
layer was greater than 7m, which would result in a greater thickness of untreated soft clay
(Sub-layer 1C) below the DR columns. The results of the sensitivity analyses indicated that
the post-construction settlement would exceed the design criteria if the soft clay layer is more
than 8.3m for the design preload. To overcome this problem, a detailed program of friction
cone tests was conducted prior to construction, and contigency plans devised for higher
preload and/or closer DR column spacing to be adopted in areas found to have greater clay
thickness than the design value. This contingency plan was to be put into place if the
settlement monitoring results indicated it to be necessary, but was subsequently found during
construction to be not required.
Dynamic Replacement ConstructionDynamic Replacement columns were driven into the soil by pounding with a 15 tonne
pounder dropped from a height of 20m. Each DR column was prepared by a pre-excavation
which was partially filled by crushed limestone. The pounding then forced the material to the
desired depth. Alternative phases of filling and pounding were performed until completion of
DR columns.
At the beginning of the works, preliminary heave tests were carried out to determine the
optimal procedure for Dynamic Replacement; this considered the following aspects:
• Number of blows and impact energy• Stages for filling DR columns
• Suitability of grid and phases of filling and pounding
Heave tests were realised by executing a DR column while recording the following
parameters: (a) diameter of print after each blow; (b) depth of print after each blow; (c) levels
Deleted: {Marc: The paragraph
below is just a sample of what I
have in mind. Please amend as
required.}
7/25/2019 Ground Improvement - Alexandria_20070206014923
http://slidepdf.com/reader/full/ground-improvement-alexandria20070206014923 8/12
Ref: 132 Wong and Lacazedieu - Page 8 of 12
of all benchmarks during the test after two consecutive blows; (d) penetration of the pounder.
Utilising these parameters, the crater volume was computed and corrected considering the
heave volume by plotting effective penetration volume versus the number of blows. The
optimal parameters were those immediately before which the pounding resulted in heave or
volume displacement rather than in effective penetration of the material in the soil.
Two specialised 80 tonne cranes were used for the project. The average production rate
reached was about 15 DR columns per shift per rig, which corresponded to a treated arearanging from 450 m
2 per shift per rig for Phase 1 to 700 m
2 per shift per rig for Phase 2.
Instrumentation and MonitoringTo confirm the design assumptions and to enable decisions to be made on when the preloads
could be removed, detailed testing, instrumentation, and monitoring were carried out as
summarised in Table 3 below:
Table 3 – Summary of Testing and Instrumentation
Type of Testing and Instrumentation Phase 1 Buildings Phase 2 Car Park
Cone Penetration Tests Before Construction 17 7
Vane Shear Tests Before Construction 9 6Boreholes 3 3
Inclinometers 2 -
Surface Settlement Plates 33 15
Downhole Extensometers 6 sets 2 sets
Downhole Pore Pressure Gauges 10 3
Cone Penetration Tests Through DR Columns
After Construction 20 11
Vane Shear Tests After Consolidation 5 4
The testing and monitoring results are discussed in the following subsections.
Cone Penetrometer Testing
Cone penetrometer testing was carried out to better identify the soft clay thickness across the
site. The testing showed the following range of clay thickness:
Phase 1 – 4.8m to 7.4m with an average of 6.2m
Phase 2 – 4.4m to 5.7m with an average of 5.7m
As the testing was carried out after placement of the 1.7m thick working platform, the actual
thickness of the soft clay is probably 0.2m to 0.3m more than that shown by the CPT results
due to punching in of the fill material and/or immediate settlement under the weight of the
working platform. In any case, the assessed soft clay thickness was well within the critical
thickness found during the sensitivity analyses as discussed above.
Laboratory Testing
A number of laboratory consolidation tests were carried out from thin wall tube samples
recovered from the boreholes, and the test results confirmed the earlier findings and adopted
design parameters as summarised in Table 4.
Deleted: Three
Deleted: ???? linear metres of
Deleted: week/day etc
7/25/2019 Ground Improvement - Alexandria_20070206014923
http://slidepdf.com/reader/full/ground-improvement-alexandria20070206014923 9/12
Ref: 132 Wong and Lacazedieu - Page 9 of 12
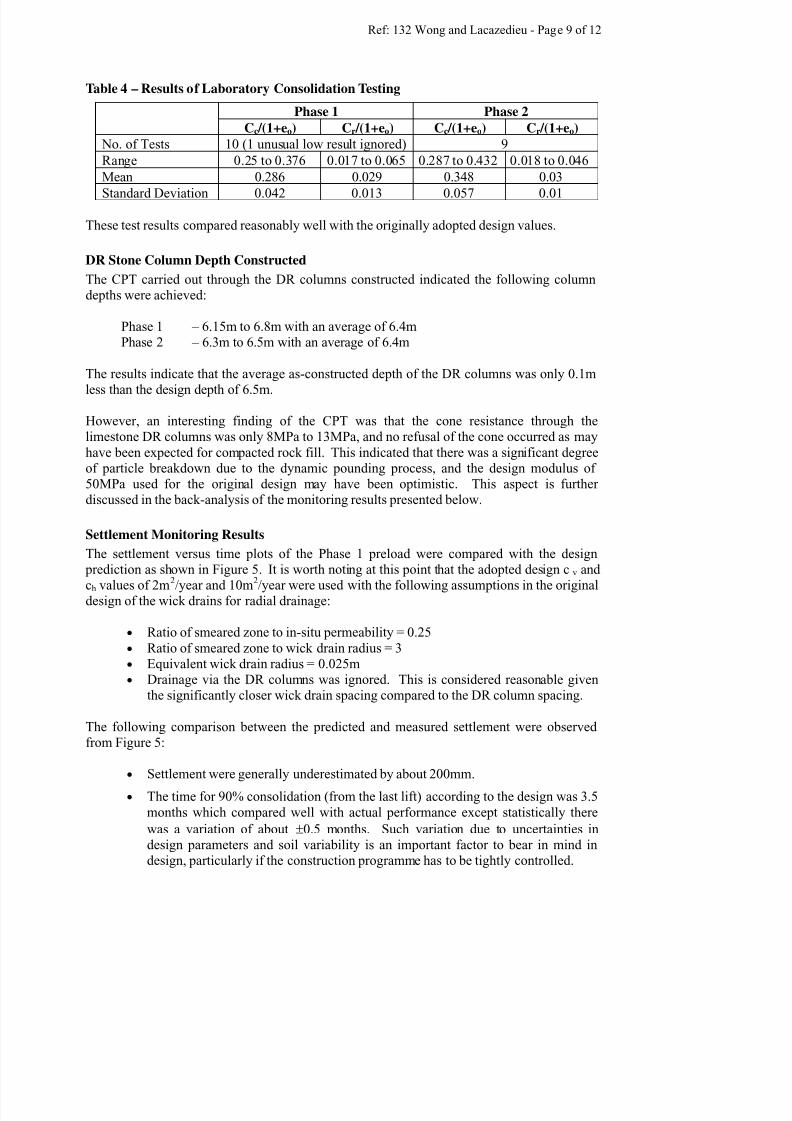
Table 4 – Results of Laboratory Consolidation Testing
Phase 1 Phase 2
Cc /(1+eo) Cr /(1+eo) Cc /(1+eo) Cr /(1+eo)
No. of Tests 10 (1 unusual low result ignored) 9
Range 0.25 to 0.376 0.017 to 0.065 0.287 to 0.432 0.018 to 0.046
Mean 0.286 0.029 0.348 0.03
Standard Deviation 0.042 0.013 0.057 0.01
These test results compared reasonably well with the originally adopted design values.
DR Stone Column Depth Constructed
The CPT carried out through the DR columns constructed indicated the following column
depths were achieved:
Phase 1 – 6.15m to 6.8m with an average of 6.4m
Phase 2 – 6.3m to 6.5m with an average of 6.4m
The results indicate that the average as-constructed depth of the DR columns was only 0.1m
less than the design depth of 6.5m.
However, an interesting finding of the CPT was that the cone resistance through the
limestone DR columns was only 8MPa to 13MPa, and no refusal of the cone occurred as may
have been expected for compacted rock fill. This indicated that there was a significant degree
of particle breakdown due to the dynamic pounding process, and the design modulus of
50MPa used for the original design may have been optimistic. This aspect is further
discussed in the back-analysis of the monitoring results presented below.
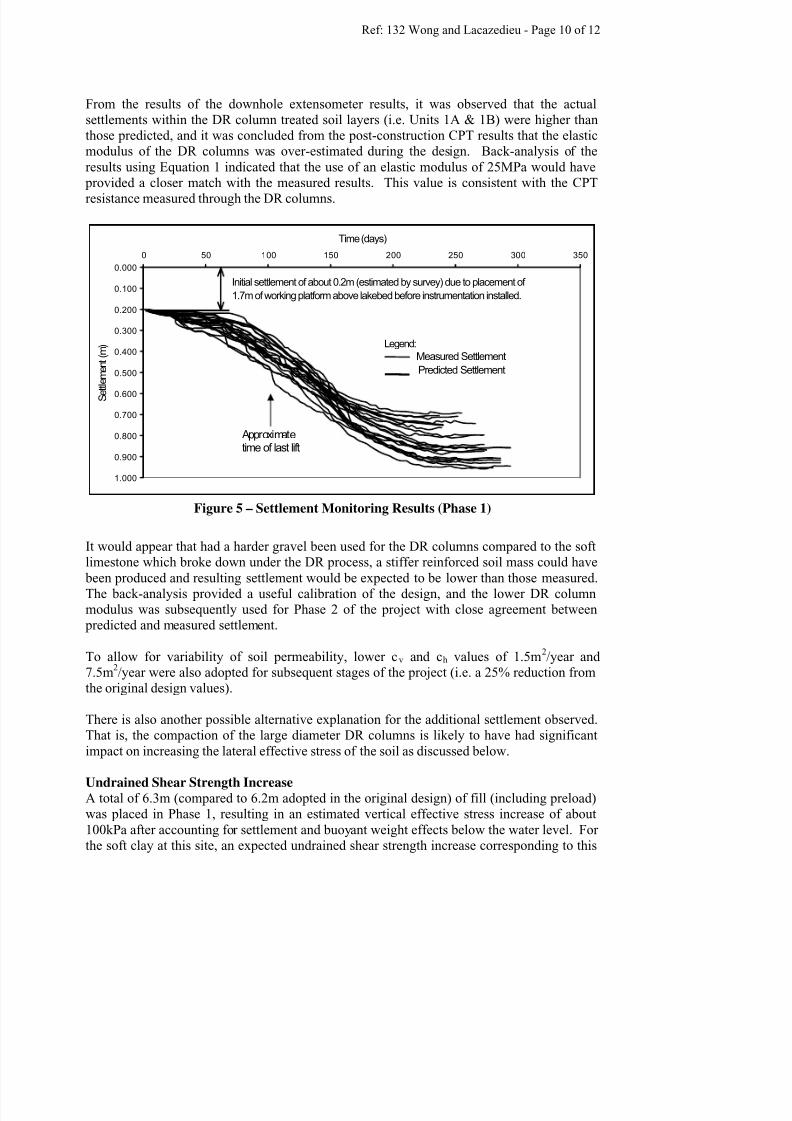
Settlement Monitoring Results
The settlement versus time plots of the Phase 1 preload were compared with the design
prediction as shown in Figure 5. It is worth noting at this point that the adopted design cv and
ch values of 2m2
/year and 10m2
/year were used with the following assumptions in the originaldesign of the wick drains for radial drainage:
• Ratio of smeared zone to in-situ permeability = 0.25
• Ratio of smeared zone to wick drain radius = 3• Equivalent wick drain radius = 0.025m• Drainage via the DR columns was ignored. This is considered reasonable given
the significantly closer wick drain spacing compared to the DR column spacing.
The following comparison between the predicted and measured settlement were observed
from Figure 5:
• Settlement were generally underestimated by about 200mm.
• The time for 90% consolidation (from the last lift) according to the design was 3.5
months which compared well with actual performance except statistically there
was a variation of about ±0.5 months. Such variation due to uncertainties in
design parameters and soil variability is an important factor to bear in mind in
design, particularly if the construction programme has to be tightly controlled.
7/25/2019 Ground Improvement - Alexandria_20070206014923
http://slidepdf.com/reader/full/ground-improvement-alexandria20070206014923 10/12
Ref: 132 Wong and Lacazedieu - Page 10 of 12
From the results of the downhole extensometer results, it was observed that the actual
settlements within the DR column treated soil layers (i.e. Units 1A & 1B) were higher than
those predicted, and it was concluded from the post-construction CPT results that the elastic
modulus of the DR columns was over-estimated during the design. Back-analysis of the
results using Equation 1 indicated that the use of an elastic modulus of 25MPa would have
provided a closer match with the measured results. This value is consistent with the CPT
resistance measured through the DR columns.
0.000
0.100
0.200
0.300
0.400
0.500
0.600
0.700
0.800
0.900
1.000
0 50 100 150 200 250 300 350
Time (days)
S e t t l e m e n t ( m ) Legend:
Measured Settlement
Predicted Settlement
Initial settlement of about 0.2m (estimated by survey) due to placement of
1.7m of working platform above lakebed before instrumentation installed.
Figure 5 – Settlement Monitoring Results (Phase 1)
It would appear that had a harder gravel been used for the DR columns compared to the soft
limestone which broke down under the DR process, a stiffer reinforced soil mass could have
been produced and resulting settlement would be expected to be lower than those measured.
The back-analysis provided a useful calibration of the design, and the lower DR columnmodulus was subsequently used for Phase 2 of the project with close agreement between
predicted and measured settlement.
To allow for variability of soil permeability, lower cv and ch values of 1.5m2/year and
7.5m2/year were also adopted for subsequent stages of the project (i.e. a 25% reduction from
the original design values).
There is also another possible alternative explanation for the additional settlement observed.
That is, the compaction of the large diameter DR columns is likely to have had significant
impact on increasing the lateral effective stress of the soil as discussed below.
Undrained Shear Strength IncreaseA total of 6.3m (compared to 6.2m adopted in the original design) of fill (including preload)
was placed in Phase 1, resulting in an estimated vertical effective stress increase of about
100kPa after accounting for settlement and buoyant weight effects below the water level. For
the soft clay at this site, an expected undrained shear strength increase corresponding to this
Approximatetime of last lift
7/25/2019 Ground Improvement - Alexandria_20070206014923
http://slidepdf.com/reader/full/ground-improvement-alexandria20070206014923 11/12
Ref: 132 Wong and Lacazedieu - Page 11 of 12
vertical effective stress increase would have been about 30kPa using a ratio of su/σv’ = 0.3 for
normally consolidated clay.
However, five field vane tests carried out after the preloading gave surprisingly high shear
strength increases ranging from about 70kPa to 85kPa near the top of the soft clay layer to
about 40kPa at depth. The surprisingly high shear strength increase was discounted during
construction and design refinement for subsequent stages as it was not a critical issue at the
time. On reflection, it is considered that such increase may be due to high lateral effectivestress increase caused by creation of the large diameter DR columns. We believe that there is
a strong possibility that the DR process caused an over-consolidation effect by increasing the
bulk effective stress of the soft soil.
From a theoretical viewpoint, we can assess the equivalent over-consolidation ratio (OCR)
using the following equation developed by Jamiolkowski et al (1985):
(su/σv’)oc = OCR m
. (su/σv’)nc [Eq. 2]
where: (su/σv’)oc = shear strength ratio for over-consolidated soil
(su/σv’)nc = shear strength ratio for normally-consolidated soil
OCR = over-consolidation ratiom = an exponent found by Jamiolkowski et al (1985) to be about 0.8
Using the limited field vane test results and adopting the ratio (su/σv’)nc = 0.3, the equivalent
OCR values for the soil clay at this site after preloading would range from about 2.1 to 3.4.
These are considered to be plausible values and are consistent with the small creep settlement
observed following primary consolidation under the preload.
It should be pointed out that the field measurements were rather limited in this respect, and
one would also expect that, if the above lateral stress increase mechanism were true, then the
stress increase would reduce with distance away from the DR columns. We consider this
aspect to be worthy of further research by both theoretical and field studies, as there are
obvious benefits with respect to higher strength increase and over-consolidation effects in
reducing post-construction settlement.
ConclusionThe building and car park for Phase 1 and Phase 2 of the project were completed successfully
following the Dynamic Replacement (DR) and preload ground treatment at the site. The
shopping centre has extensive tiled floors that are reported by the developer of the project to
be performing to expectation with no obvious signs of settlement or differential settlement.
The following conclusions are drawn from the field performance versus design predictions
for this project:
• Provided appropriate elastic modulus values are chosen at the correct stress levels,
elastic analysis may be used to assess complex soil-structure interaction problems on
soft ground.• The three-dimensional numerical analyses carried out provided the confidence that the
Dynamic Replacement design solution will meet the stringent tolerance on differential
settlement irrespective of the building column locations relative to the DR columns.
7/25/2019 Ground Improvement - Alexandria_20070206014923
http://slidepdf.com/reader/full/ground-improvement-alexandria20070206014923 12/12
Ref: 132 Wong and Lacazedieu - Page 12 of 12
• Good match was found between field performance and the wick drain design
regarding the rate of consolidation, although it was later found to be prudent to allow
for possible soil permeability variations.
• The overall magnitude of settlement was under-predicted by about 25%. The higher
observed settlement compared to those predicted is assessed to be caused by (i) lower
stiffness of the DR column material than originally assumed, and (ii) likely higher
bulk effective stress increase due to installation of the large diameter DR columns.
• The calibration carried out using the field data in Phase 1 was an important success
factor for later stages of the project.
• Dynamic Replacement can be used effectively to strengthen soft grounds to enable
rapid construction of fill platform and preloads.
• It is possible that higher consolidation related strength increase could be achieved in
soft clays using the DR process compared with conventional preload type solutions.
This additional strength increase is thought to be attributable to a significant lateral
effective stress increase associated with the installation of the large diameter DR
columns. This process is also thought to increase the over-consolidation ratio of the
soft soil and has the beneficial effect of reducing post-construction settlement. This
aspect is considered to be worthy of further theoretical and field research.
References:
Balaam, N.P., Booker, J.R. and Poulos, H.G. (1976) Analysis of granular pile behaviour
using finite elements. Proc. Int. Conf. Finite Elements in Eng., 1-13, Adelaide, Australia
Barron, R.A. (1948) Consolidation of fine-grained soils by drain wells. Trans. ASCE, vol
113, 718-754.
Fell, R., Wong, P.K., & Stone, P (1987) Slope instability in soft ground. Proceedings of an
extension course on soil slope instability and stabilisation. (Ed.), Walker, B., and Fell, R.
(Pub.), Balkema 231-278.
Hansbo, S., Jamiolkowski, M. and Kok, L. (1981) Consolidation by vertical drains.
Institution of Civil Engineers, Symp. On Vertical Drains. Geotechnique 31, 45-66.
ITASCA (1999) 3D FLAC – Fast Lagrangian Analysis of Continua. User Manual. ITASCAGroup, USA.
Jamiolkowski, M., Ladd, C.C., Germaine, J. and Lancellotta, R. (1985) New developments in
field and laboratory testing of soils. 11th
ICSMFE.
Juillie, I. and Sherwood, D.E. (1983) Improvement of Sabkhas soil of the Arabian Gulf coast.
Proceedings of the Eighth European Conference on Soil Mechanics and Foundation
Engineering, Helsinki, (Pub.), A.A. Balkema 781 – 785.
Lee, S.L. and Lo, K.W. (1985) Ground improvement by dynamic replacement and mixing.
Third International Geotechnical Seminar on Soil Improvement Methods, Singapore 27-29
November 1985, 19 – 30.
Schmertmann, J.M. (1955) The undisturbed consolidation of clay. Trans. ASCE, Vol. 120,
1201.Varaksin, S., Liausu, P., Berger, P., & Spaulding, C. (1994) Optimisation of dynamic
consolidation and dynamic replacement pillars to limit surface deformations of man made
fills overlaying heterogeneous soft subsoil. Proceedings of seminar organised by the
Geotechnical Division of the Hong Kong Institution of Engineers on “Ground Improvement
Methods” 103 – 116.