ground and space spectral measurements for assessing the ... · ground and space spectral...
TRANSCRIPT
www.elsevier.com/locate/rse
Remote Sensing of Environm
Ground and space spectral measurements for assessing the semi-arid
ecosystem phenology related to CO2 fluxes of biological soil crusts
Jonathan Burgheimera, Burkhard Wilskeb,c, Kadmiel Maseykb, Arnon Karnielia,*,
Eli Zaadyd, Dan Yakirb, Jurgen Kesselmeierc
aRemote Sensing Laboratory, Jacob Blaustein Institute for Desert Research, Ben Gurion University of the Negev, Sede Boker Campus 84990, IsraelbEnvironmental Science and Energy Research, Weizmann Institute of Science, Rehovot, Israel
cMax Planck Institute for Chemistry, Department of Biogeochemistry, Mainz, GermanydDesertification and Restoration Ecology Research Center, Mitrani Department of Desert Ecology, Jacob Blaustein Institute for Desert Research,
Ben-Gurion University of the Negev, Sede Boker Campus, Israel
Received 6 July 2004; received in revised form 18 March 2005; accepted 20 March 2005
Abstract
This paper reports on ranges of carbon dioxide (CO2) activity in biological soil crusts (BSC) correlated with different ranges of the BSC’s
spectral reflectance throughout the phenological cycle of the year. Methodology is based on surface CO2 exchange measurements, ground
spectral measurements, and satellite images interpretation. Thirty-nine field campaigns, each of duration of 3 days, were conducted over the
course of 2 years at a sand dunes and a loess environment of the northwestern Negev desert in Israel, in order to relate the CO2 fluxes and the
spectral signals to the seasonal phenology. The Normalized Difference Vegetation Index (NDVI) was derived from ground measurements of
the BSC’s reflectance and correlated with their CO2 exchange data. A linear mixture model, incorporating the different contributions of the
sites’ ground features, was calculated and compared with SPOT-HRV data. From the ground measurements, fairly good correlations were
found between the NDVI and the CO2 fluxes on a seasonal scale. Hence, the NDVI successfully indicates the potential magnitude and
capacity of the BSC’s assimilation activity. The linear mixture model successfully describes the phenological cycles of the BSC, annual, and
perennial plants and corresponds well to the satellite data. Moreover, the model enables annual changes of the phenology cycle and the
growing season length to be distinguished. Both the linear mixture model and the derived NDVI values recorded the recovery of the BSC at
the beginning of the wet season before annuals had germinated. Finally, it is concluded that a combination of CO2 exchange measurements,
linear mixture model, and NDVI values is suitable for monitoring BSC’s productivity in arid regions.
D 2005 Elsevier Inc. All rights reserved.
Keywords: Biological soil crusts; Phenology; Carbon exchange; Spectral measurements; NDVI; SPOT
1. Introduction
Arid and semi-arid lands throughout the world are
characterized by sparseness or absence of vegetation cover.
Nevertheless, the soil surface is often not lacking of
photoautotrophic life, but is covered by a community of
soil surface covering organisms, able to tolerate dehydration
and thus adapted to aridity. These communities are referred
0034-4257/$ - see front matter D 2005 Elsevier Inc. All rights reserved.
doi:10.1016/j.rse.2005.03.003
* Corresponding author. Tel.: +972 8 6596855; fax: +972 8 6596704.
E-mail address: [email protected] (A. Karnieli).
to as biological soil crusts (BSC), known also as micro-
phytic soil crusts, comprising a complex mosaic of bacteria,
cyanobacteria, green algae, microfungi, lichens, and mosses
(Belnap & Lange, 2001; Warren, 1995; West, 1990).
The various types of organism that make up the BSC
share some unique physiological traits. They are all capable
of drying out and temporarily suspending physiological
activities (dormant state). These types of organism are
referred to as poikilohydric. Most of the species will be
activated even after an erratic rainfall of less than 1 mm.
Furthermore, some species can use high air humidity (e.g.,
fog or dew) to maintain metabolic processes (Lange et al.,
ent 101 (2006) 1 – 12
J. Burgheimer et al. / Remote Sensing of Environment 101 (2006) 1–122
1992; Lange & Meyer, 1990; Lange et al., 1994; Veste et al.,
2001). Hence, BSC are considered to represent an important
carbon sink on sparsely vegetated areas (Beymar &
Klopatek, 1991; Evans & Johansen, 1999; Lange et al.,
1992; Zaady et al., 2000). This carbon contribution provides
energy for microbial soil populations (Evans & Johansen,
1999), thus supporting higher plant growth. Reports of
maximal rates of net photosynthesis (NPmax) under optimal
conditions vary greatly and span the range of two orders of
magnitude, between 0.1 and 11.5 Amol CO2 m�2 s�1. The
latter value is of a similar magnitude to that of higher
vegetation, and indicates the potential importance of crust
organisms in ecosystem carbon dynamics, particularly in
stressed environments (Lange, 2001). As the relative area
covered by the crust communities is often much larger than
that of the higher plants, the biological soil crusts are
considered to contribute substantially to the carbon budget
of arid and semi-arid ecosystems, where vascular plant
production is low.
The vast distribution of microphytes in drylands and their
fast photosynthetic response to wetting have encouraged
several researchers to use spectroscopic and remote sensing
applications for investigating the BSC (Karnieli et al., 2001;
Karnieli & Tsoar, 1995). Karnieli et al., (1999, 1996) have
shown in detail the spectral reflectance of crusts and
emphasize its difference from those of vascular plants and
bare-sand spectra.
The Normalized Difference Vegetation Index (NDVI),
and other vegetation indices, have been intensively used
for monitoring biophysical condition and vegetation cover
from air- and space-borne sensors (e.g., Ichii et al., 2001;
Myneni et al., 1997; Running, 1990; Tucker et al., 1986).
Karnieli et al. (1999) calculated the NDVI from BSC’s
spectra under various wetting conditions and found that
when crusts were dry, the NDVI values were low (0.08–
0.13), a level also typical for dry soil/sand and rock.
However, under wetting conditions, the crusts showed
relatively high NDVI values (0.18–0.3). The biggest
changes in the NDVI values occurred minutes after the
crusts were wetted, while, as the crust dried out, the NDVI
values declined. Karnieli et al. (1999) found that the
chlorophyll content of crusts was much higher after 7 days
of growth after wetting. Moreover, a correlation was found
between the NDVI values and the chlorophyll content.
Furthermore, direct relationships were also found between
NDVI values and organic matter, polysaccharides content,
protein content, and crust thickness. Hence, the NDVI can
serve as an indicator for many physiological and
ecological parameters of the BSC and can help draw
conclusions on crust photosynthesis activity (Karnieli et
al., 1999).
Karnieli et al. (1996) and Karnieli and Tsoar (1995) point
out that high NDVI values in dry lands can lead to false
interpretation of higher vegetation biomass or productivity.
Previous studies have shown that when vegetation cover is
less than 30%, the soil background contributes significantly
to the spectral signal (Huete et al., 1985; Huete & Tucker,
1991). Hence, satellite images that are taken from areas that
are dominated by a wet and hence, active, BSC will exhibit
high NDVI values with dominant contributions by the crusts
and not by higher plants.
Considerable efforts have been spent in investigating
the relationships between NDVI and net primary produc-
tion (NPP), based on empirical results with horizontally
uniform canopies (e.g., Bartlett et al., 1990; Hatfield et al.,
1984; Kumar & Monteith, 1981) and model predictions
(Asrar et al., 1984; Sellers, 1985, 1987; Sellers et al.,
1992). These studies indicate that NDVI is related to
fractional intercepted, or absorbed photosynthetically
active radiation (FIPAR or FAPAR), and thus related to the
net CO2 uptake under non-stressed conditions. However,
despite the extensive research on global NPP and its
distribution, most researchers have failed to consider desert
areas as important contributors to NPP, due to the scattered
higher vegetation and productivity estimates of less than
200 g C m�2 year�1 (Cramer et al., 1999). Although BSC
cover vast areas of dry lands, to the best of our knowledge,
no large-scale research has been conducted to assess their
carbon sequestration potential. These microphytes might
affect the arid ecosystem NPP and should be examined for
their share within desert productivity estimates. Conse-
quently, the objectives of the current study were: (1) to
relate the CO2 exchange of the BSC to ground spectral
measurements throughout the wet season in two semi-arid
ecosystems; and (2) to upscale these plot measurements to
a regional scale, by interpreting space-borne imagery in
terms of NDVI.
2. Study areas
The research was conducted in two different ecosystems
in the northern Negev desert of Israel: the Agure Sand
Field (ASF) and the Sayeret Shaked (SSK) Long-Term
Ecological Research site (Gosz et al., 2000). In both sites,
the BSC are considered to dominate surface characteristics.
However, the substrate of each site is different, comprising
sand dunes and loessial soil in the ASF and SSK,
respectively.
The Agure sand dunes are located along the Israel–
Egypt border, about 40 km southeast of the Mediterranean
coastline (30-45¶N, 34-13¶E). Average annual rainfall in
this area is about 95 mm during the winter (October–
March) (Karnieli et al., 1999). Sandy linear dunes (West–
East direction) characterize the landscape. The upper part
of the dunes (15–20% of the region), which is exposed to
wind erosion, is composed of unconsolidated sand particles
(more than 95%) and it is almost devoid of vegetation. The
dune hill slopes and the interdune corridors, which occupy
80–85% of the area, have a particle size distribution of
about 21% sand, 55% silt, and 24% clay (Zaady et al.,
2000).
J. Burgheimer et al. / Remote Sensing of Environment 101 (2006) 1–12 3
The interdune area and the south facing slopes are almost
completely covered by a cyanobacterial crust (Microcoleus
sociatus, Microcoleus vaginatus, and Phormidium sp.). The
north facing slopes of the dunes contain additional
cyanobacterial species (Nostoc microscopicum, Scytonema
sp., Oscillatoria sp., Schizotrix friesii, and Chroococcidiop-
sis sp.), cyanolichen species, green algae (Chlorococcum
sp., Stichococcus sp.), and two species of moss (Bryum
dunnense and Tortula brevissima) (Karnieli et al., 1999).
Perennial shrubs (e.g., Retama raetam, Thymelaea hirsuta,
Artemisia monosperma) are scattered along the interdunes.
These perennial shrubs indicate habitat stabilization pro-
vided by BSC’s cover and plant succession (Danin, 1991,
1996). Furthermore, the growth of the annual plants (e.g.,
Senecio glaucus, Launaea mucronata, Rostraria cristata),
which appear for a few weeks after strong rain events, also
contributes to the dynamic stability of the sand dunes area
(Danin, 1991; Kadmon & Leschner, 1995).
The Sayeret Shaked Ecological Park (SSK) is located in
the Northern Negev (31-17¶N, 34-37¶E). The site is a
watershed that has been closed off to livestock grazing
since 1987. Rainfall in this area has a long-term annual
average of 200 mm and occurs only in the winter season.
The 200 mm rain isohyet is considered as the transition
between semi-arid and sub-humid climatic zones. The
landscape terrain is slightly hilly and consists of loessial
soil with 14% clay, 27% silt, and 59% sand (Zaady et al.,
2000). The area is characterized by scattered perennial
shrubs (Noaea mucronata, T. hirsuta, Pituranthos tortuo-
sus) and patchy growth of annual plants (Stipa capensis,
Bromus fasciculatus, R. cristata, Avena barbata). The soil
surface is covered with a BSC (about 70%) consisting of
cyanobacteria (M. vaginatus, Nostoc punctiforme, and
Choococcus sp.), cyanophilous lichen (Collema sp.), and,
mainly, two moss species (Aloina bifrons and Crossidium
crassinerve var. loevipilum) (Karnieli et al., 1996; Zaady et
al., 2001).
3. Methodology
Thirty-nine field campaigns, each of duration of 3 days,
were conducted over the course of 2 years at the sand dune
and loess environments of the northwestern Negev desert
in Israel. The gas exchange of the BSC was investigated
by using Teflon bag cuvettes (one empty reference plus
one sample cuvette), designed especially for soil–atmos-
phere studies by the Max Planck Institute for Chemistry,
Mainz, Germany. The cuvettes were topped on settled
plots on a base of acryl glass soil-borne collars ground into
the soil at sites chosen weeks before the measurements.
The empty cuvette was sealed towards the soil surface
with Teflon film. CO2 net exchange between the BSC and
the atmosphere was measured under ambient air flushing
and using an infrared gas analyzer (Licor, Li-7000) in the
differential mode. Measurement protocols included BSC
versus soil, BSC versus empty cuvette, and soil versus
empty cuvette. For details see Wilske et al. (submitted for
publication).
The spectral reflectance measurements of any specific
crust surface were conducted immediately after the CO2
exchange measurements of the BSC, along with spectral
measurements of the annuals, dry annuals, perennials, and
bare soil/sands. These measurements were implemented
with the FieldSpec-HandHeld Spectroradiometer (manufac-
tured by Analytical Spectral Device (ASD), 2000), at
wavelengths of 325–1075 nm with a spectral resolution
of 2 nm. A High Intensity Contact Probe device with a fiber
optic was attached to the spectroradiometer. This device had
an independent light source, which made it feasible to take
measurements under all weather conditions. The contact
probe was attached to the BSC’s surface and measured its
spectral reflectance. Measurements of a white reference
panel (Spectralon plate, Labsphere Inc.) were taken imme-
diately before each spectral measurement.
The percentage cover for each ground feature was
measured separately. The perennials’ aerial cover was
measured, using the McAuliffe method (McAuliffe, 1990),
developed especially for rapid estimation of density and
cover of perennial vegetation in arid environments. In
addition, several random plots of 1 m2 were photographed
with a digital camera for measuring the percentage cover by
BSC, annuals, and dry annuals. These photographs were
used for the supervised classification, using the ERDAS
IMAGINE software (Richards, 1993).
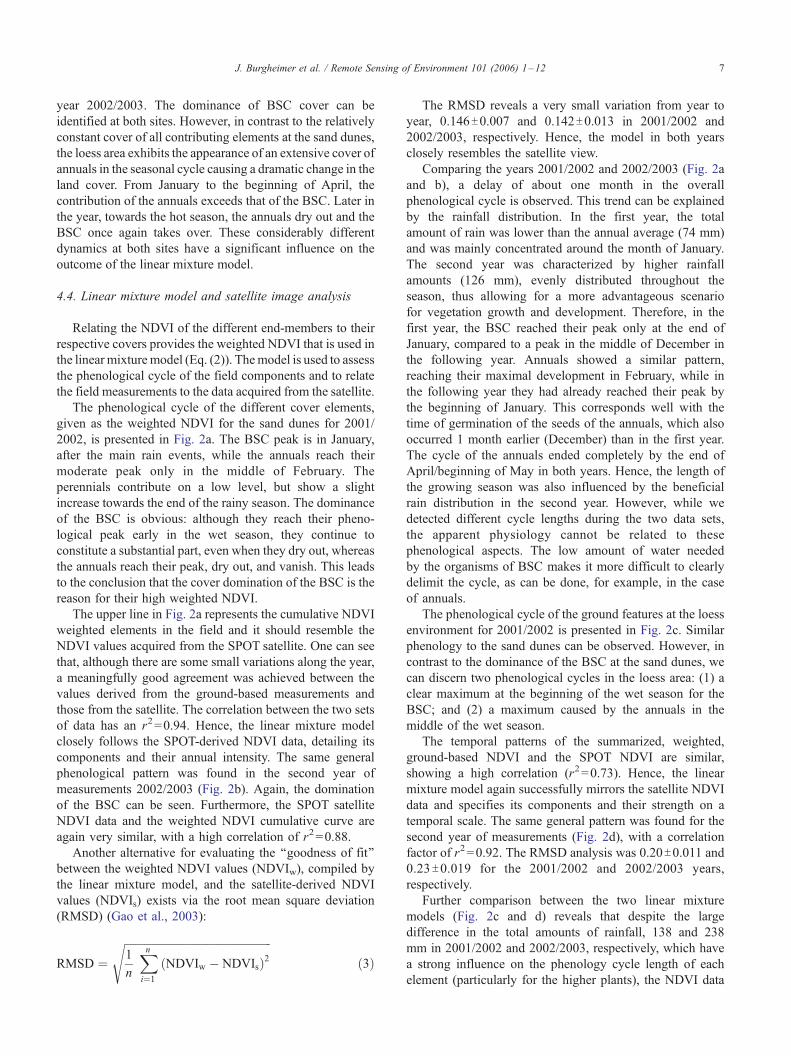
Twenty-eight Satellite Pour l’Observation de la Terra
(SPOT) images of 20 m resolution were acquired over the
course of the 2 years of research, in order to scale up the
field measurements to a regional perspective. These images
were subject to radiometric, atmospheric, and geometric
correction procedures.
NDVI values were calculated, both from the ground
spectral measurements and the satellite images, by using the
following equation (Rouse et al., 1974):
NDVI ¼ qNIR � qRð Þ= qNIR þ qRð Þ ð1Þ
where qNIR and qR are the reflectances in the near
infrared and red bands, respectively, corresponding to
SPOT spectral bands No. 3 (0.79–0.89 Am) and No. 2
(0.61–0.68 Am).
A linear mixture model (Ichoku & Karnieli, 1996; Settle
& Darke, 1993) was applied to the ground data from the two
study sites. In order to assess the weighted NDVI (NDVIw)
from the relative NDVI contribution of each end-member
( j), the commonly used linear mixture model was reformu-
lated as:
NDVIw ¼Xnj¼1
fjTNDVIj� �
ð2Þ
in which the NDVIw is the sum of the products of the
NDVI and the respective percentage areal cover ( f ) for
(a)
0
10
20
30
40
50
60
70
400 500 600 700 800 900
October 2002
Ref
lect
ance
(%
)
Wavelength (nm)
Ref
lect
ance
(%
)
Wavelength (nm)
Ref
lect
ance
(%
)
Wavelength (nm)
Ref
lect
ance
(%
)
Wavelength (nm)
Ref
lect
ance
(%
)
Wavelength (nm)
Ref
lect
ance
(%
)
Wavelength (nm)
Ref
lect
ance
(%
)
Wavelength (nm)
Ref
lect
ance
(%
)
Wavelength (nm)
0
10
20
30
40
50
60
70
400 500 600 700 800 900
November 2002
0
10
20
30
40
50
60
70
400 500 600 700 800 900
December 2002
0
10
20
30
40
50
60
70
400 500 600 700 800 900
January 2003
0
10
20
30
40
50
60
70
400 500 600 700 800 900
February 2003
0
10
20
30
40
50
60
70
400 500 600 700 800 900
March 2003
0
10
20
30
40
50
60
70
400 500 600 700 800 900
April 2003
0
10
20
30
40
50
60
70
400 500 600 700 800 900
May 2003
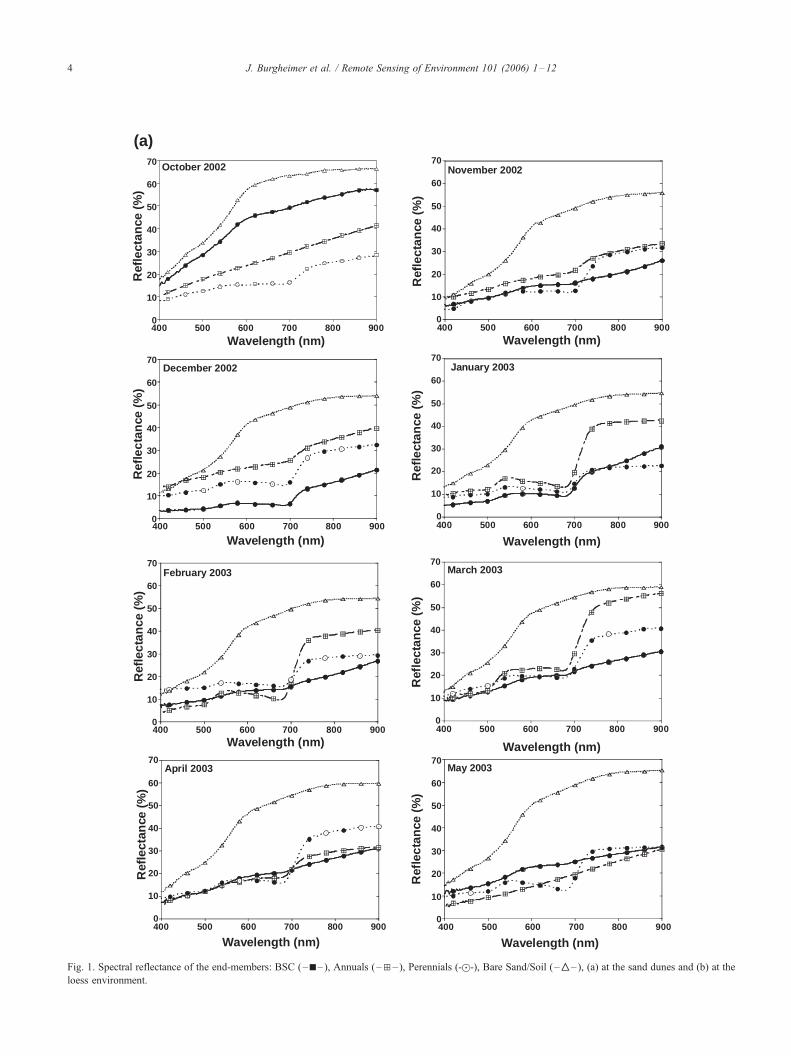
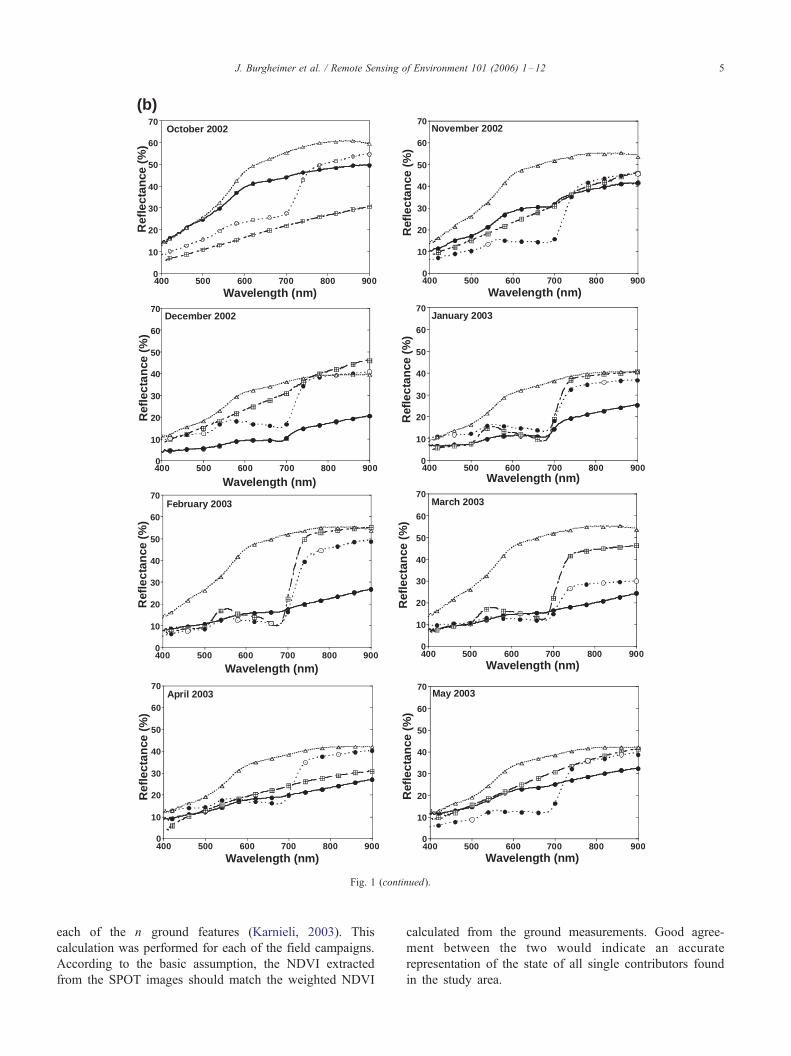
Fig. 1. Spectral reflectance of the end-members: BSC (–h– ), Annuals (–d– ), Perennials (-z-), Bare Sand/Soil ( –‚– ), (a) at the sand dunes and (b) at the
loess environment.
J. Burgheimer et al. / Remote Sensing of Environment 101 (2006) 1–124
0
10
20
30
40
50
60
70
400 500 600 700 800 900
October 2002R
efle
ctan
ce (
%)
Wavelength (nm)
Ref
lect
ance
(%
)
Wavelength (nm)
Ref
lect
ance
(%
)
Wavelength (nm)
Ref
lect
ance
(%
)
Wavelength (nm)
Ref
lect
ance
(%
)
Wavelength (nm)
Ref
lect
ance
(%
)
Wavelength (nm)
Ref
lect
ance
(%
)
Wavelength (nm)
Ref
lect
ance
(%
)
Wavelength (nm)
0
10
20
30
40
50
60
70
400 500 600 700 800 900
November 2002
0
10
20
30
40
50
60
70
400 500 600 700 800 900
December 2002
0
10
20
30
40
50
60
70
400 500 600 700 800 900
January 2003
0
10
20
30
40
50
60
70
400 500 600 700 800 900
February 2003
0
10
20
30
40
50
60
70
400 500 600 700 800 900
March 2003
0
10
20
30
40
50
60
70
400 500 600 700 800 900
April 2003
0
10
20
30
40
50
60
70
400 500 600 700 800 900
May 2003
(b)
Fig. 1 (continued).
J. Burgheimer et al. / Remote Sensing of Environment 101 (2006) 1–12 5
each of the n ground features (Karnieli, 2003). This
calculation was performed for each of the field campaigns.
According to the basic assumption, the NDVI extracted
from the SPOT images should match the weighted NDVI
calculated from the ground measurements. Good agree-
ment between the two would indicate an accurate
representation of the state of all single contributors found
in the study area.
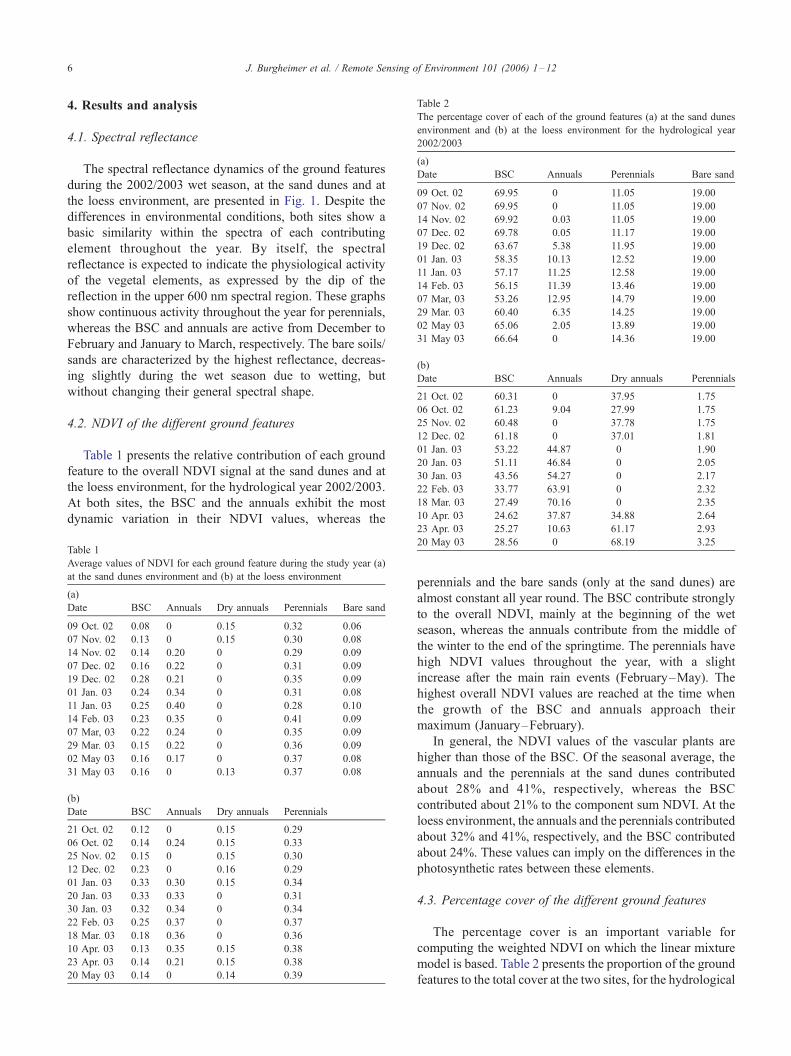
Table 2
The percentage cover of each of the ground features (a) at the sand dunes
environment and (b) at the loess environment for the hydrological year
2002/2003
(a)
Date BSC Annuals Perennials Bare sand
09 Oct. 02 69.95 0 11.05 19.00
07 Nov. 02 69.95 0 11.05 19.00
14 Nov. 02 69.92 0.03 11.05 19.00
07 Dec. 02 69.78 0.05 11.17 19.00
19 Dec. 02 63.67 5.38 11.95 19.00
01 Jan. 03 58.35 10.13 12.52 19.00
11 Jan. 03 57.17 11.25 12.58 19.00
14 Feb. 03 56.15 11.39 13.46 19.00
07 Mar, 03 53.26 12.95 14.79 19.00
29 Mar. 03 60.40 6.35 14.25 19.00
02 May 03 65.06 2.05 13.89 19.00
31 May 03 66.64 0 14.36 19.00
(b)
Date BSC Annuals Dry annuals Perennials
21 Oct. 02 60.31 0 37.95 1.75
06 Oct. 02 61.23 9.04 27.99 1.75
25 Nov. 02 60.48 0 37.78 1.75
12 Dec. 02 61.18 0 37.01 1.81
01 Jan. 03 53.22 44.87 0 1.90
20 Jan. 03 51.11 46.84 0 2.05
30 Jan. 03 43.56 54.27 0 2.17
22 Feb. 03 33.77 63.91 0 2.32
18 Mar. 03 27.49 70.16 0 2.35
10 Apr. 03 24.62 37.87 34.88 2.64
J. Burgheimer et al. / Remote Sensing of Environment 101 (2006) 1–126
4. Results and analysis
4.1. Spectral reflectance
The spectral reflectance dynamics of the ground features
during the 2002/2003 wet season, at the sand dunes and at
the loess environment, are presented in Fig. 1. Despite the
differences in environmental conditions, both sites show a
basic similarity within the spectra of each contributing
element throughout the year. By itself, the spectral
reflectance is expected to indicate the physiological activity
of the vegetal elements, as expressed by the dip of the
reflection in the upper 600 nm spectral region. These graphs
show continuous activity throughout the year for perennials,
whereas the BSC and annuals are active from December to
February and January to March, respectively. The bare soils/
sands are characterized by the highest reflectance, decreas-
ing slightly during the wet season due to wetting, but
without changing their general spectral shape.
4.2. NDVI of the different ground features
Table 1 presents the relative contribution of each ground
feature to the overall NDVI signal at the sand dunes and at
the loess environment, for the hydrological year 2002/2003.
At both sites, the BSC and the annuals exhibit the most
dynamic variation in their NDVI values, whereas the
Table 1
Average values of NDVI for each ground feature during the study year (a)
at the sand dunes environment and (b) at the loess environment
(a)
Date BSC Annuals Dry annuals Perennials Bare sand
09 Oct. 02 0.08 0 0.15 0.32 0.06
07 Nov. 02 0.13 0 0.15 0.30 0.08
14 Nov. 02 0.14 0.20 0 0.29 0.09
07 Dec. 02 0.16 0.22 0 0.31 0.09
19 Dec. 02 0.28 0.21 0 0.35 0.09
01 Jan. 03 0.24 0.34 0 0.31 0.08
11 Jan. 03 0.25 0.40 0 0.28 0.10
14 Feb. 03 0.23 0.35 0 0.41 0.09
07 Mar, 03 0.22 0.24 0 0.35 0.09
29 Mar. 03 0.15 0.22 0 0.36 0.09
02 May 03 0.16 0.17 0 0.37 0.08
31 May 03 0.16 0 0.13 0.37 0.08
(b)
Date BSC Annuals Dry annuals Perennials
21 Oct. 02 0.12 0 0.15 0.29
06 Oct. 02 0.14 0.24 0.15 0.33
25 Nov. 02 0.15 0 0.15 0.30
12 Dec. 02 0.23 0 0.16 0.29
01 Jan. 03 0.33 0.30 0.15 0.34
20 Jan. 03 0.33 0.33 0 0.31
30 Jan. 03 0.32 0.34 0 0.34
22 Feb. 03 0.25 0.37 0 0.37
18 Mar. 03 0.18 0.36 0 0.36
10 Apr. 03 0.13 0.35 0.15 0.38
23 Apr. 03 0.14 0.21 0.15 0.38
20 May 03 0.14 0 0.14 0.39
23 Apr. 03 25.27 10.63 61.17 2.93
20 May 03 28.56 0 68.19 3.25
perennials and the bare sands (only at the sand dunes) are
almost constant all year round. The BSC contribute strongly
to the overall NDVI, mainly at the beginning of the wet
season, whereas the annuals contribute from the middle of
the winter to the end of the springtime. The perennials have
high NDVI values throughout the year, with a slight
increase after the main rain events (February–May). The
highest overall NDVI values are reached at the time when
the growth of the BSC and annuals approach their
maximum (January–February).
In general, the NDVI values of the vascular plants are
higher than those of the BSC. Of the seasonal average, the
annuals and the perennials at the sand dunes contributed
about 28% and 41%, respectively, whereas the BSC
contributed about 21% to the component sum NDVI. At the
loess environment, the annuals and the perennials contributed
about 32% and 41%, respectively, and the BSC contributed
about 24%. These values can imply on the differences in the
photosynthetic rates between these elements.
4.3. Percentage cover of the different ground features
The percentage cover is an important variable for
computing the weighted NDVI on which the linear mixture
model is based. Table 2 presents the proportion of the ground
features to the total cover at the two sites, for the hydrological
J. Burgheimer et al. / Remote Sensing of Environment 101 (2006) 1–12 7
year 2002/2003. The dominance of BSC cover can be
identified at both sites. However, in contrast to the relatively
constant cover of all contributing elements at the sand dunes,
the loess area exhibits the appearance of an extensive cover of
annuals in the seasonal cycle causing a dramatic change in the
land cover. From January to the beginning of April, the
contribution of the annuals exceeds that of the BSC. Later in
the year, towards the hot season, the annuals dry out and the
BSC once again takes over. These considerably different
dynamics at both sites have a significant influence on the
outcome of the linear mixture model.
4.4. Linear mixture model and satellite image analysis
Relating the NDVI of the different end-members to their
respective covers provides the weighted NDVI that is used in
the linear mixture model (Eq. (2)). Themodel is used to assess
the phenological cycle of the field components and to relate
the field measurements to the data acquired from the satellite.
The phenological cycle of the different cover elements,
given as the weighted NDVI for the sand dunes for 2001/
2002, is presented in Fig. 2a. The BSC peak is in January,
after the main rain events, while the annuals reach their
moderate peak only in the middle of February. The
perennials contribute on a low level, but show a slight
increase towards the end of the rainy season. The dominance
of the BSC is obvious: although they reach their pheno-
logical peak early in the wet season, they continue to
constitute a substantial part, even when they dry out, whereas
the annuals reach their peak, dry out, and vanish. This leads
to the conclusion that the cover domination of the BSC is the
reason for their high weighted NDVI.
The upper line in Fig. 2a represents the cumulative NDVI
weighted elements in the field and it should resemble the
NDVI values acquired from the SPOT satellite. One can see
that, although there are some small variations along the year,
a meaningfully good agreement was achieved between the
values derived from the ground-based measurements and
those from the satellite. The correlation between the two sets
of data has an r2=0.94. Hence, the linear mixture model
closely follows the SPOT-derived NDVI data, detailing its
components and their annual intensity. The same general
phenological pattern was found in the second year of
measurements 2002/2003 (Fig. 2b). Again, the domination
of the BSC can be seen. Furthermore, the SPOT satellite
NDVI data and the weighted NDVI cumulative curve are
again very similar, with a high correlation of r2=0.88.
Another alternative for evaluating the ‘‘goodness of fit’’
between the weighted NDVI values (NDVIw), compiled by
the linear mixture model, and the satellite-derived NDVI
values (NDVIs) exists via the root mean square deviation
(RMSD) (Gao et al., 2003):
RMSD ¼ffiffiffiffiffiffiffiffiffiffiffiffiffiffiffiffiffiffiffiffiffiffiffiffiffiffiffiffiffiffiffiffiffiffiffiffiffiffiffiffiffiffiffiffiffiffiffiffiffiffiffiffiffi1
n
Xni¼1
NDVIw � NDVIsð Þ2s
ð3Þ
The RMSD reveals a very small variation from year to
year, 0.146T0.007 and 0.142T0.013 in 2001/2002 and
2002/2003, respectively. Hence, the model in both years
closely resembles the satellite view.
Comparing the years 2001/2002 and 2002/2003 (Fig. 2a
and b), a delay of about one month in the overall
phenological cycle is observed. This trend can be explained
by the rainfall distribution. In the first year, the total
amount of rain was lower than the annual average (74 mm)
and was mainly concentrated around the month of January.
The second year was characterized by higher rainfall
amounts (126 mm), evenly distributed throughout the
season, thus allowing for a more advantageous scenario
for vegetation growth and development. Therefore, in the
first year, the BSC reached their peak only at the end of
January, compared to a peak in the middle of December in
the following year. Annuals showed a similar pattern,
reaching their maximal development in February, while in
the following year they had already reached their peak by
the beginning of January. This corresponds well with the
time of germination of the seeds of the annuals, which also
occurred 1 month earlier (December) than in the first year.
The cycle of the annuals ended completely by the end of
April/beginning of May in both years. Hence, the length of
the growing season was also influenced by the beneficial
rain distribution in the second year. However, while we
detected different cycle lengths during the two data sets,
the apparent physiology cannot be related to these
phenological aspects. The low amount of water needed
by the organisms of BSC makes it more difficult to clearly
delimit the cycle, as can be done, for example, in the case
of annuals.
The phenological cycle of the ground features at the loess
environment for 2001/2002 is presented in Fig. 2c. Similar
phenology to the sand dunes can be observed. However, in
contrast to the dominance of the BSC at the sand dunes, we
can discern two phenological cycles in the loess area: (1) a
clear maximum at the beginning of the wet season for the
BSC; and (2) a maximum caused by the annuals in the
middle of the wet season.
The temporal patterns of the summarized, weighted,
ground-based NDVI and the SPOT NDVI are similar,
showing a high correlation (r2=0.73). Hence, the linear
mixture model again successfully mirrors the satellite NDVI
data and specifies its components and their strength on a
temporal scale. The same general pattern was found for the
second year of measurements (Fig. 2d), with a correlation
factor of r2=0.92. The RMSD analysis was 0.20T0.011 and
0.23T0.019 for the 2001/2002 and 2002/2003 years,
respectively.
Further comparison between the two linear mixture
models (Fig. 2c and d) reveals that despite the large
difference in the total amounts of rainfall, 138 and 238
mm in 2001/2002 and 2002/2003, respectively, which have
a strong influence on the phenology cycle length of each
element (particularly for the higher plants), the NDVI data
(a)
0.05
0.1
0.15
0.2
0.25
2
4
6
8
10W
eig
hte
d N
DV
I
Rai
nfa
ll (m
m)
Months
December January February March April May
0.05
0.1
0.15
0.2
0.25
2
4
6
8
10
12
14
16
Wei
gh
ted
ND
VI
Rai
nfa
ll (m
m)
Months
October November December January Febuary March April May
(b)
0.05
0.1
0.15
0.2
0.25
0.3
0.35
3
6
9
12
15
Wei
gh
ted
ND
VI
Rai
nfa
ll (m
m)
Months
December January February March April May
(c)
0.05
0.1
0.15
0.2
0.25
0.3
0.35
5
10
15
20
25
30
35
40
Wei
gh
ted
ND
VI
Rai
nfa
ll (m
m)
Months
October November December January Febuary March April May
(d)
Fig. 2. NDVI linear mixture model of the end-members: BSC (–h– ), Annuals (–d– ), Bare Sand/Dry annuals (–‚–), Perennials (-z-), Cumulative (–g–), SPOT (0), Precipitation ( )at the sand dunes and
loess environment for the year 2001/2002 (a and c) and 2002/2003 (b and d), respectively.
J.Burgheim
eret
al./Rem
ote
Sensin
gofEnviro
nment101(2006)1–12
8

J. Burgheimer et al. / Remote Sensing of Environment 101 (2006) 1–12 9
derived from the SPOT satellite fits the model well.
Furthermore, a high correlation was found when combining
the data for both years, i.e., the cumulative linear mixture
curves and the SPOT NDVI data (r2=0.86). This finding
substantiates the claim that the linear mixture model is a
good tool for representing the satellite view.
4.5. NDVI and CO2 analysis
In order to get a seasonal overview of the relationships
between the NDVI and the CO2 exchange, the two
variables were averaged over the available data points
per field campaign. Fig. 3 shows the seasonal dynamics
between NDVI and CO2 net fluxes for the BSC at the
sand dunes and at the loess environment. On a seasonal
scale a similar pattern can be observed between the NDVI
and the CO2 exchange. A strong increase of the NDVI at
the beginning of the wet season (December) is observed.
Once the crusts are developed, the NDVI remains
Fig. 3. Seasonal dynamics of the NDVI and the CO2 exchange for the mix BSC (
exchange mean carbon sequestration. (The arrows indicate the main rain events, m
Burgheimer et al. (submitted for publication).
relatively stable at a certain level (about 0.3), and changes
in a way similar to the CO2 fluxes, according to the
availability of moisture (January–March). Hence, if the
rain is well distributed, the crusts grow, develop, and stay
in a good physiological condition during most of the
winter season. The standard deviations for both variables
grow when the physiological activities increase (during
and after rainfall events). This scatter can be related to
rapid changes (within a few days) of photosynthetic
activities, in close accordance with drying out processes
(Burgheimer et al., submitted for publication; Wilske et al.,
submitted for publication). The correlation between the
two variables on this scale of resolution was r2=0.73 and
r2=0.80 for the sand dunes and for the loess area,
respectively.
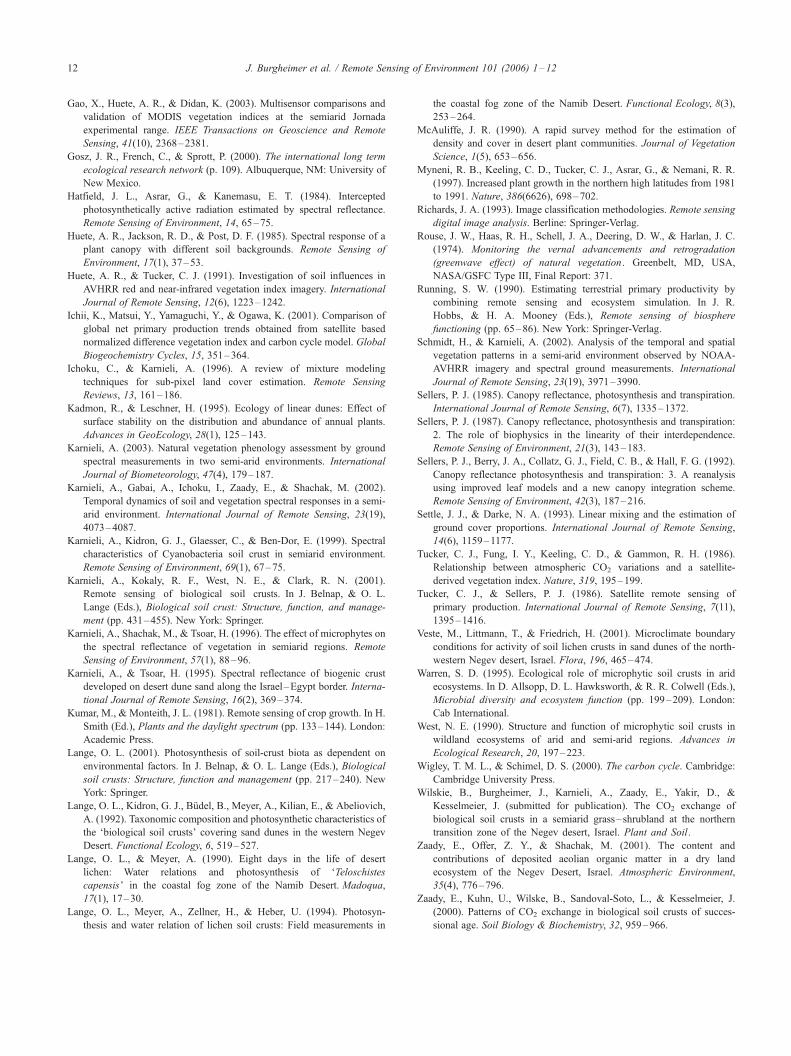
The potential of the NDVI to detect BSC’s photo-
synthetic activity on different time scales have been
addressed by Burgheimer et al. (submitted for publication)
and Wilske et al. (submitted for publication). In Fig. 4, the
a) at the sand dunes and (b) at the loess environments. Positive rate of CO2
ore than 5 mm; the vertical bars indicate standard deviation.) Modified from

(a)
(b)
0.10 0.15 0.20 0.25 0.30 0.35 0.40 0.45 0.50 0.55 0.60-0.50
-0.25
0.00
0.25
0.50
0.75
1.00
1.25
1.50
1.75
2.00
SSK
CO
2 Exc
hang
e R
ate
Ran
ge (µ
mol
m-2 s
-1)
NDVI Range
0.10 0.15 0.20 0.25 0.30 0.35 0.40 0.45 0.50 0.55 0.60-0.50
-0.25
0.00
0.25
0.50
0.75
1.00
1.25
1.50
1.75
2.00
AGR
CO
2 Exc
han
ge R
ate
Ran
ge (µ
mol
m-2 s
-1)
NDVI Range
Fig. 4. Relationship between the NDVI and the BSC’s CO2 exchange (a) at the sand dunes and (b) at the loess environments for the hydrological years
2001–2003.
J. Burgheimer et al. / Remote Sensing of Environment 101 (2006) 1–1210
NDVI data are grouped (time independent) into small
ranges (of 0.05 units) and the CO2 exchange rates
associated with each NDVI value in the narrow range
averaged. For both of the study sites, the increase of the
photosynthetic rate was associated with the increase in
NDVI, but this was also associated with large potential of
CO2 exchange rates. This pattern is due to the nature of
the BSC’s CO2 exchange behavior, which is highly
sensitive to local moisture dynamics, whereas the NDVI
represents an accumulation of simultaneous biophysical
parameters (Running, 1990; Tucker et al., 1986; Tucker
and Sellers, 1986) and responds more slowly to drying-out
process. Including the moisture regime data will help to
obtain more accurate information on the CO2 exchange–
NDVI relationship.
When the two sites are compared, large differences can
be seen at the lower end of the NDVI values, where the CO2
exchange range is larger within the SSK graph. This pattern
is likely to be related to the moisture holding capacity of the
two soil types.
5. Discussion
The ecological function of BSC has been investigated
and discussed in many studies. It was found that these
microphytic soil crusts contribute to the maintenance of
ecosystems and assist in catalyzing the successional level of
a certain area (Warren, 1995; West, 1990; Zaady et al.,
2000). Their contributions are particularly significant in
growth environments that are harsh for vascular plants (i.e.,
arid and semi-arid deserts), where the essential sources for
growth are limited (i.e., water, nutrients, soil) (Belnap &
Harper, 1995; Evans & Johansen, 1999). With respect to
carbon assimilation, BSC were reported to assimilate CO2 at
rates similar to C3 plants (surface to leaf surface) under
optimal conditions (Belnap & Lange, 2001). Taking into
consideration the fact that these BSC organisms cover vast
arid and semi-arid areas around the world (Karnieli et al.,
2001) and that our understanding of the global carbon
budget, concerning the different terrestrial ecosystems, is
insufficient (Wigley & Schimel, 2000), an investigation of
J. Burgheimer et al. / Remote Sensing of Environment 101 (2006) 1–12 11
the contribution of BSC to the global carbon budget is of
particular interest.
A feasible way to investigate BSC on a large scale is by
using remote sensing approaches (i.e., satellite or airborne
images). The first step in establishing a BSC’s NDVI–CO2
exchange relationship, on the basis of ground-based meas-
urements in the western Negev of Israel has been recently
reported (Burgheimer et al., submitted for publication). The
authors found that the NDVI has the potential to roughly
indicate the range of magnitude and capacity of the BSC’s
assimilation activity, which is significantly influenced by
environmental factors (i.e., soil water content and light
intensity) at any particular moment. In addition, the index
was found to be a good tool for representing the BSC’s
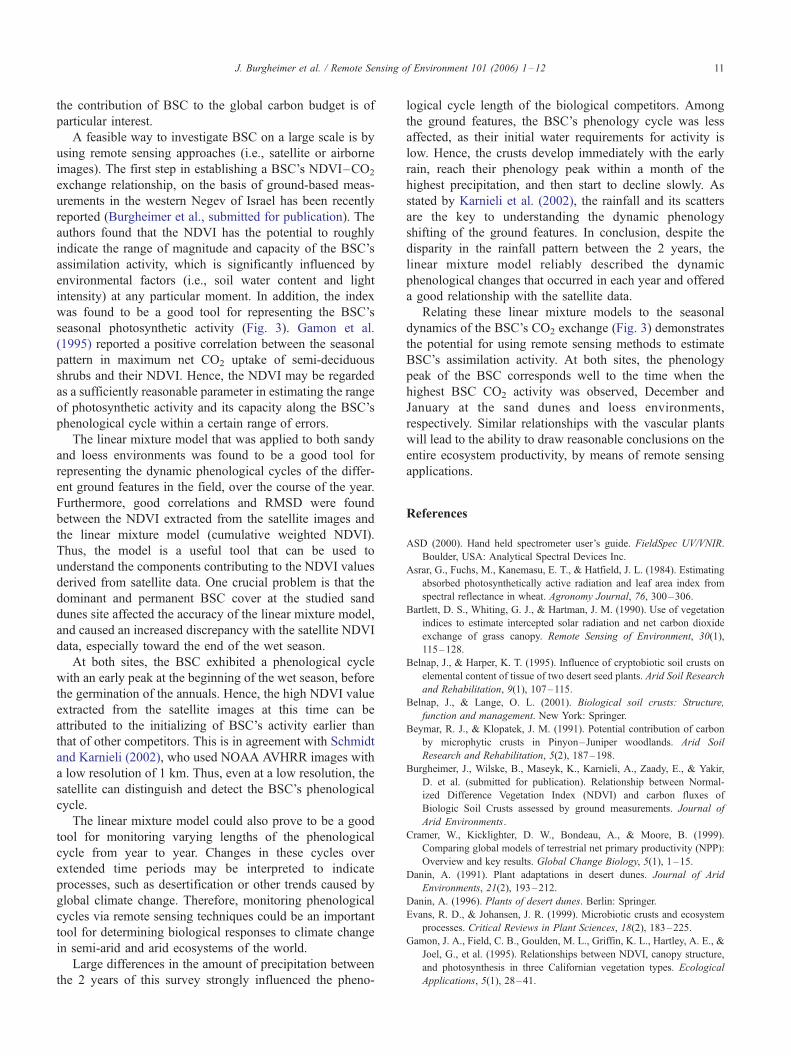
seasonal photosynthetic activity (Fig. 3). Gamon et al.
(1995) reported a positive correlation between the seasonal
pattern in maximum net CO2 uptake of semi-deciduous
shrubs and their NDVI. Hence, the NDVI may be regarded
as a sufficiently reasonable parameter in estimating the range
of photosynthetic activity and its capacity along the BSC’s
phenological cycle within a certain range of errors.
The linear mixture model that was applied to both sandy
and loess environments was found to be a good tool for
representing the dynamic phenological cycles of the differ-
ent ground features in the field, over the course of the year.
Furthermore, good correlations and RMSD were found
between the NDVI extracted from the satellite images and
the linear mixture model (cumulative weighted NDVI).
Thus, the model is a useful tool that can be used to
understand the components contributing to the NDVI values
derived from satellite data. One crucial problem is that the
dominant and permanent BSC cover at the studied sand
dunes site affected the accuracy of the linear mixture model,
and caused an increased discrepancy with the satellite NDVI
data, especially toward the end of the wet season.
At both sites, the BSC exhibited a phenological cycle
with an early peak at the beginning of the wet season, before
the germination of the annuals. Hence, the high NDVI value
extracted from the satellite images at this time can be
attributed to the initializing of BSC’s activity earlier than
that of other competitors. This is in agreement with Schmidt
and Karnieli (2002), who used NOAA AVHRR images with
a low resolution of 1 km. Thus, even at a low resolution, the
satellite can distinguish and detect the BSC’s phenological
cycle.
The linear mixture model could also prove to be a good
tool for monitoring varying lengths of the phenological
cycle from year to year. Changes in these cycles over
extended time periods may be interpreted to indicate
processes, such as desertification or other trends caused by
global climate change. Therefore, monitoring phenological
cycles via remote sensing techniques could be an important
tool for determining biological responses to climate change
in semi-arid and arid ecosystems of the world.
Large differences in the amount of precipitation between
the 2 years of this survey strongly influenced the pheno-
logical cycle length of the biological competitors. Among
the ground features, the BSC’s phenology cycle was less
affected, as their initial water requirements for activity is
low. Hence, the crusts develop immediately with the early
rain, reach their phenology peak within a month of the
highest precipitation, and then start to decline slowly. As
stated by Karnieli et al. (2002), the rainfall and its scatters
are the key to understanding the dynamic phenology
shifting of the ground features. In conclusion, despite the
disparity in the rainfall pattern between the 2 years, the
linear mixture model reliably described the dynamic
phenological changes that occurred in each year and offered
a good relationship with the satellite data.
Relating these linear mixture models to the seasonal
dynamics of the BSC’s CO2 exchange (Fig. 3) demonstrates
the potential for using remote sensing methods to estimate
BSC’s assimilation activity. At both sites, the phenology
peak of the BSC corresponds well to the time when the
highest BSC CO2 activity was observed, December and
January at the sand dunes and loess environments,
respectively. Similar relationships with the vascular plants
will lead to the ability to draw reasonable conclusions on the
entire ecosystem productivity, by means of remote sensing
applications.
References
ASD (2000). Hand held spectrometer user’s guide. FieldSpec UV/VNIR.
Boulder, USA’ Analytical Spectral Devices Inc.
Asrar, G., Fuchs, M., Kanemasu, E. T., & Hatfield, J. L. (1984). Estimating
absorbed photosynthetically active radiation and leaf area index from
spectral reflectance in wheat. Agronomy Journal, 76, 300–306.
Bartlett, D. S., Whiting, G. J., & Hartman, J. M. (1990). Use of vegetation
indices to estimate intercepted solar radiation and net carbon dioxide
exchange of grass canopy. Remote Sensing of Environment, 30(1),
115–128.
Belnap, J., & Harper, K. T. (1995). Influence of cryptobiotic soil crusts on
elemental content of tissue of two desert seed plants. Arid Soil Research
and Rehabilitation, 9(1), 107–115.
Belnap, J., & Lange, O. L. (2001). Biological soil crusts: Structure,
function and management. New York’ Springer.
Beymar, R. J., & Klopatek, J. M. (1991). Potential contribution of carbon
by microphytic crusts in Pinyon–Juniper woodlands. Arid Soil
Research and Rehabilitation, 5(2), 187–198.
Burgheimer, J., Wilske, B., Maseyk, K., Karnieli, A., Zaady, E., & Yakir,
D. et al. (submitted for publication). Relationship between Normal-
ized Difference Vegetation Index (NDVI) and carbon fluxes of
Biologic Soil Crusts assessed by ground measurements. Journal of
Arid Environments.
Cramer, W., Kicklighter, D. W., Bondeau, A., & Moore, B. (1999).
Comparing global models of terrestrial net primary productivity (NPP):
Overview and key results. Global Change Biology, 5(1), 1–15.
Danin, A. (1991). Plant adaptations in desert dunes. Journal of Arid
Environments, 21(2), 193–212.
Danin, A. (1996). Plants of desert dunes. Berlin’ Springer.
Evans, R. D., & Johansen, J. R. (1999). Microbiotic crusts and ecosystem
processes. Critical Reviews in Plant Sciences, 18(2), 183–225.
Gamon, J. A., Field, C. B., Goulden, M. L., Griffin, K. L., Hartley, A. E., &
Joel, G., et al. (1995). Relationships between NDVI, canopy structure,
and photosynthesis in three Californian vegetation types. Ecological
Applications, 5(1), 28–41.
J. Burgheimer et al. / Remote Sensing of Environment 101 (2006) 1–1212
Gao, X., Huete, A. R., & Didan, K. (2003). Multisensor comparisons and
validation of MODIS vegetation indices at the semiarid Jornada
experimental range. IEEE Transactions on Geoscience and Remote
Sensing, 41(10), 2368–2381.
Gosz, J. R., French, C., & Sprott, P. (2000). The international long term
ecological research network (p. 109). Albuquerque, NM’ University of
New Mexico.
Hatfield, J. L., Asrar, G., & Kanemasu, E. T. (1984). Intercepted
photosynthetically active radiation estimated by spectral reflectance.
Remote Sensing of Environment, 14, 65–75.
Huete, A. R., Jackson, R. D., & Post, D. F. (1985). Spectral response of a
plant canopy with different soil backgrounds. Remote Sensing of
Environment, 17(1), 37–53.
Huete, A. R., & Tucker, C. J. (1991). Investigation of soil influences in
AVHRR red and near-infrared vegetation index imagery. International
Journal of Remote Sensing, 12(6), 1223–1242.
Ichii, K., Matsui, Y., Yamaguchi, Y., & Ogawa, K. (2001). Comparison of
global net primary production trends obtained from satellite based
normalized difference vegetation index and carbon cycle model. Global
Biogeochemistry Cycles, 15, 351–364.
Ichoku, C., & Karnieli, A. (1996). A review of mixture modeling
techniques for sub-pixel land cover estimation. Remote Sensing
Reviews, 13, 161–186.
Kadmon, R., & Leschner, H. (1995). Ecology of linear dunes: Effect of
surface stability on the distribution and abundance of annual plants.
Advances in GeoEcology, 28(1), 125–143.
Karnieli, A. (2003). Natural vegetation phenology assessment by ground
spectral measurements in two semi-arid environments. International
Journal of Biometeorology, 47(4), 179–187.
Karnieli, A., Gabai, A., Ichoku, I., Zaady, E., & Shachak, M. (2002).
Temporal dynamics of soil and vegetation spectral responses in a semi-
arid environment. International Journal of Remote Sensing, 23(19),
4073–4087.
Karnieli, A., Kidron, G. J., Glaesser, C., & Ben-Dor, E. (1999). Spectral
characteristics of Cyanobacteria soil crust in semiarid environment.
Remote Sensing of Environment, 69(1), 67–75.
Karnieli, A., Kokaly, R. F., West, N. E., & Clark, R. N. (2001).
Remote sensing of biological soil crusts. In J. Belnap, & O. L.
Lange (Eds.), Biological soil crust: Structure, function, and manage-
ment (pp. 431–455). New York’ Springer.Karnieli, A., Shachak, M., & Tsoar, H. (1996). The effect of microphytes on
the spectral reflectance of vegetation in semiarid regions. Remote
Sensing of Environment, 57(1), 88–96.
Karnieli, A., & Tsoar, H. (1995). Spectral reflectance of biogenic crust
developed on desert dune sand along the Israel–Egypt border. Interna-
tional Journal of Remote Sensing, 16(2), 369–374.
Kumar, M., & Monteith, J. L. (1981). Remote sensing of crop growth. In H.
Smith (Ed.), Plants and the daylight spectrum (pp. 133–144). London’Academic Press.
Lange, O. L. (2001). Photosynthesis of soil-crust biota as dependent on
environmental factors. In J. Belnap, & O. L. Lange (Eds.), Biological
soil crusts: Structure, function and management (pp. 217–240). New
York’ Springer.
Lange, O. L., Kidron, G. J., Budel, B., Meyer, A., Kilian, E., & Abeliovich,
A. (1992). Taxonomic composition and photosynthetic characteristics of
the Fbiological soil crusts_ covering sand dunes in the western Negev
Desert. Functional Ecology, 6, 519–527.
Lange, O. L., & Meyer, A. (1990). Eight days in the life of desert
lichen: Water relations and photosynthesis of FTeloschistescapensis_ in the coastal fog zone of the Namib Desert. Madoqua,
17(1), 17–30.
Lange, O. L., Meyer, A., Zellner, H., & Heber, U. (1994). Photosyn-
thesis and water relation of lichen soil crusts: Field measurements in
the coastal fog zone of the Namib Desert. Functional Ecology, 8(3),
253–264.
McAuliffe, J. R. (1990). A rapid survey method for the estimation of
density and cover in desert plant communities. Journal of Vegetation
Science, 1(5), 653–656.
Myneni, R. B., Keeling, C. D., Tucker, C. J., Asrar, G., & Nemani, R. R.
(1997). Increased plant growth in the northern high latitudes from 1981
to 1991. Nature, 386(6626), 698–702.
Richards, J. A. (1993). Image classification methodologies. Remote sensing
digital image analysis. Berline’ Springer-Verlag.
Rouse, J. W., Haas, R. H., Schell, J. A., Deering, D. W., & Harlan, J. C.
(1974). Monitoring the vernal advancements and retrogradation
(greenwave effect) of natural vegetation. Greenbelt, MD, USA,
NASA/GSFC Type III, Final Report: 371.
Running, S. W. (1990). Estimating terrestrial primary productivity by
combining remote sensing and ecosystem simulation. In J. R.
Hobbs, & H. A. Mooney (Eds.), Remote sensing of biosphere
functioning (pp. 65–86). New York’ Springer-Verlag.Schmidt, H., & Karnieli, A. (2002). Analysis of the temporal and spatial
vegetation patterns in a semi-arid environment observed by NOAA-
AVHRR imagery and spectral ground measurements. International
Journal of Remote Sensing, 23(19), 3971–3990.
Sellers, P. J. (1985). Canopy reflectance, photosynthesis and transpiration.
International Journal of Remote Sensing, 6(7), 1335–1372.
Sellers, P. J. (1987). Canopy reflectance, photosynthesis and transpiration:
2. The role of biophysics in the linearity of their interdependence.
Remote Sensing of Environment, 21(3), 143–183.
Sellers, P. J., Berry, J. A., Collatz, G. J., Field, C. B., & Hall, F. G. (1992).
Canopy reflectance photosynthesis and transpiration: 3. A reanalysis
using improved leaf models and a new canopy integration scheme.
Remote Sensing of Environment, 42(3), 187–216.
Settle, J. J., & Darke, N. A. (1993). Linear mixing and the estimation of
ground cover proportions. International Journal of Remote Sensing,
14(6), 1159–1177.
Tucker, C. J., Fung, I. Y., Keeling, C. D., & Gammon, R. H. (1986).
Relationship between atmospheric CO2 variations and a satellite-
derived vegetation index. Nature, 319, 195–199.
Tucker, C. J., & Sellers, P. J. (1986). Satellite remote sensing of
primary production. International Journal of Remote Sensing, 7(11),
1395–1416.
Veste, M., Littmann, T., & Friedrich, H. (2001). Microclimate boundary
conditions for activity of soil lichen crusts in sand dunes of the north-
western Negev desert, Israel. Flora, 196, 465–474.
Warren, S. D. (1995). Ecological role of microphytic soil crusts in arid
ecosystems. In D. Allsopp, D. L. Hawksworth, & R. R. Colwell (Eds.),
Microbial diversity and ecosystem function (pp. 199–209). London’
Cab International.
West, N. E. (1990). Structure and function of microphytic soil crusts in
wildland ecosystems of arid and semi-arid regions. Advances in
Ecological Research, 20, 197–223.
Wigley, T. M. L., & Schimel, D. S. (2000). The carbon cycle. Cambridge’
Cambridge University Press.
Wilskie, B., Burgheimer, J., Karnieli, A., Zaady, E., Yakir, D., &
Kesselmeier, J. (submitted for publication). The CO2 exchange of
biological soil crusts in a semiarid grass–shrubland at the northern
transition zone of the Negev desert, Israel. Plant and Soil.
Zaady, E., Offer, Z. Y., & Shachak, M. (2001). The content and
contributions of deposited aeolian organic matter in a dry land
ecosystem of the Negev Desert, Israel. Atmospheric Environment,
35(4), 776–796.
Zaady, E., Kuhn, U., Wilske, B., Sandoval-Soto, L., & Kesselmeier, J.
(2000). Patterns of CO2 exchange in biological soil crusts of succes-
sional age. Soil Biology & Biochemistry, 32, 959–966.