object clusters or spectral energy? assessing the relative
TRANSCRIPT

fpsyg-11-01847 July 22, 2020 Time: 17:54 # 1
ORIGINAL RESEARCHpublished: 24 July 2020
doi: 10.3389/fpsyg.2020.01847
Edited by:Branka Spehar,
University of New South Wales,Australia
Reviewed by:Kyoshiro Sasaki,
Kansai University, JapanOlivier Penacchio,
University of St Andrews,United Kingdom
*Correspondence:R. Nathan Pipitone
Specialty section:This article was submitted to
Perception Science,a section of the journalFrontiers in Psychology
Received: 27 May 2020Accepted: 06 July 2020Published: 24 July 2020
Citation:Pipitone RN and DiMattina C
(2020) Object Clusters or SpectralEnergy? Assessing the Relative
Contributions of Image Phaseand Amplitude Spectra
to Trypophobia.Front. Psychol. 11:1847.
doi: 10.3389/fpsyg.2020.01847
Object Clusters or Spectral Energy?Assessing the Relative Contributionsof Image Phase and AmplitudeSpectra to TrypophobiaR. Nathan Pipitone* and Christopher DiMattina
Department of Psychology, Florida Gulf Coast University, Fort Myers, FL, United States
Trypophobia refers to the visual discomfort experienced by some people when viewingclustered patterns (e.g., clusters of holes). Trypophobic images deviate from the 1/famplitude spectra typically characterizing natural images by containing excess energyat mid-range spatial frequencies. While recent work provides partial support for the ideaof excess mid-range spatial frequency energy causing visual discomfort when viewingtrypophobic images, a full factorial manipulation of image phase and amplitude spectrahas yet to be conducted in order to determine whether the phase spectrum (sinusoidalwaveform patterns that comprise image details like edge and texture elements) alsoplays a role in trypophobic discomfort. Here, we independently manipulated the phaseand amplitude spectra of 31 Trypophobic images using a standard Fast FourierTransform (FFT). Participants rated the four different versions of each image for levels ofvisual comfort, and completed the Trypophobia Questionnaire (TQ). Images having theoriginal phase spectra intact (with either original or 1/f amplitude) explained the mostvariance in comfort ratings and were rated lowest in comfort. However, images with theoriginal amplitude spectra but scrambled phase spectra were rated higher in comfort,with a smaller amount of variance in comfort attributed to the amplitude spectrum.Participant TQ scores correlated with comfort ratings only for images having the originalphase spectra intact. There was no correlation between TQ scores and comfort levelswhen participants viewed the original amplitude / phase-scrambled images. Takentogether, the present findings show that the phase spectrum of trypophobic images,which determines the pattern of small clusters of objects, plays a much larger role thanthe amplitude spectrum in determining visual discomfort.
Keywords: trypophobia, visual discomfort, Fourier analysis, phase spectrum, amplitude spectrum
INTRODUCTION
Trypophobia is a recently documented perceptual phenomenon characterized by extreme negativereactions when viewing repetitive clusters of objects, usually holes or bumps (Cole and Wilkins,2013; Le et al., 2015). An example of a trypophobic image is shown in Figure 1A (top left).A small but sizable proportion of individuals qualify as being trypophobic (roughly 15–17%, Coleand Wilkins, 2013; Pipitone et al., 2017), and furthermore, many non-trypophobic individuals
Frontiers in Psychology | www.frontiersin.org 1 July 2020 | Volume 11 | Article 1847

fpsyg-11-01847 July 22, 2020 Time: 17:54 # 2
Pipitone and DiMattina Image Characteristics of Trypophobia
(Cole and Wilkins, 2013; Kupfer and Le, 2017; Pipitone et al.,2017) including children (Can et al., 2017) report experiencingsome level of discomfort when viewing trypophobic images.Since its initial description in the scientific literature (Cole andWilkins, 2013) there has been strong interest in trypophobia inboth the scientific community and the popular media, with theWashington Post recently reporting that the cluster of cameralenses on Apple’s new iPhone 11 may be triggering trypophobia(Shepherd, 2019).
Several theoretical frameworks have been proposed to explaintrypophobia (Cole and Wilkins, 2013; Kupfer and Le, 2017;Sasaki et al., 2017) and suggest that the discomfort elicited bytrypophobic stimuli is an evolved response to help organismsdetect and avoid harmful stimuli. One proposal is that thecharacteristic trypophobic patterns contain excessive energy atmid-range spatial frequencies, as defined in previous work(Sasaki et al., 2017: 2–9 cycles per degree of visual angle(cpd); Fernandez and Wilkins, 2008: 3 cpd ±2 octaves). Thissame spectral energy profile can also be observed in thepatterning of many venomous and/or predatory animals likesnakes and spiders, provided that these stimuli are viewed at theappropriate distance (American Psychiatric Association, 2013).In contrast, an alternative theory proposes that the aversionto clusters of roughly circular shapes represents a responsethat helps organisms avoid parasitism and infectious disease(Kupfer and Le, 2017). Some of the previous work suggeststhat the negative reactions from viewing trypophobic imagesstems from patterns that contain high contrast energy at mid-range spatial frequencies. However, several recent findings raisethe possibility of other interpretations. Using image filteringtechniques, Sasaki et al. (2017) showed that low to mid-rangespatial frequencies in trypophobic images invoked the mostdiscomfort, comparable to the original images, but specificallyfiltering mid-range spatial frequencies did not reduce discomfort.What is more, this study did not account for the image phasespectrum. Le et al. (2015) filtered trypophobic images to havea 1/f natural image spectra, thus removing the excess mid-range energy, and found that those images continued to invokediscomfort. Using a continuous flash suppression technique tomeasure access to early visual awareness, Shirai and Ogawa(2019) recently showed that trypophobic images enter visualawareness earlier than fearful or neutral images, but a secondexperiment in which these images were phase-scrambled (but theoriginal amplitude spectrum was left intact) mitigated the earlyawareness effect.
Another issue with the spectral energy hypothesis oftrypophobia (Cole and Wilkins, 2013) is that image spatialfrequencies shift as image size or viewing distance changes. Forexample, if one doubles viewing distance, an image subtendsroughly half its original angle on the retina, so that its spatialfrequency content approximately doubles. Having protectivereactions (i.e., discomfort) elicited only by specific spatialfrequencies of potentially harmful stimuli (whether disease, orpredatory) might limit their protective ability. These recentfindings coupled with the viewing distance issue suggest thatthe energy spectra of trypophobic images may not be solelyresponsible for evoking trypophobic discomfort.
Present StudyThis study seeks to better understand the relationship betweenthe spectral components of trypophobic images and theirrelation to levels of viewing comfort. Using Fourier analysis,the phase and amplitude spectra of trypophobic images wereindependently manipulated in a factorial design to assess theunique aspects of each on levels of comfort. Based on previouswork that has shown discomfort to trypophobic images evenwith mid-range frequencies experimentally removed, coupledwith the fact that viewing distance plays an important role infrequency parameters, we hypothesized that the phase spectrumof trypophobic images (the sinusoidal waveform patterns thatcomprise fine details like edge and texture elements) also playa role in eliciting trypophobic reactions. Following Sasaki et al.(2017) we then categorized participants into high and lowtrypophobia groups [using the Trypophobia Questionnaire (TQ)]to assessed whether TQ levels impact viewing comfort to thedifferent image categories. Finally, based on previous work (Leet al., 2015; Pipitone et al., 2017) we assessed how viewing comfortchanges as participant’s level of trypophobia changes across thefour image manipulations. In addition to these main issues, wealso tested whether or not subjective image ratings were robust tomonitor properties and were consistent across different instancesof our random phase-scrambling procedure.
MATERIALS AND METHODS
Images and Image ManipulationThis study was approved by the Florida Gulf Coast UniversityInstitutional Review Board (IRB). All methods were carried outin accordance with the IRB’s guidelines and regulations, andinformed consent was obtained from all participants. Thirty-one trypophobic images (T1-T31) were used in this study. Someimages were obtained from websites devoted to trypophobia (e.g.,https://trypophobia.com/), while other images were provided byArnold Wilkins and were used in Cole and Wilkins (2013),Pipitone et al. (2017). All images were cropped to minimize non-trypophobic background imagery, resized to 512 × 512 pixels,converted to grayscale, scaled to 25% RMS contrast, and savedas 8-bit BMP files.
In order to independently manipulate the phase andamplitude spectra of the images, we employed the standard 2-D Fast Fourier Transform (FFT) implemented in MATLAB R©
(R2015a) as fft2.m. Fourier image analysis makes use of themathematical fact that every image can be exactly reconstructedusing a weighted linear sum of sinusoidal plane waves havingvarying orientations, spatial frequencies and phases. The setof weights applied to each plane wave for a given image arecollectively known as the amplitude spectrum, and the phases ofeach plane wave are known as the phase spectrum. Therefore, wecan equivalently characterize an image in either the space domain(pixel values) or the frequency domain (amplitude and phasespectra), using the FFT and the inverse FFT to map between thetwo (Gonzalez and Woods, 2017). The amplitude spectra defineswhich spatial frequencies are present in an image, and the phasespectrum determines where the waves interfere constructively
Frontiers in Psychology | www.frontiersin.org 2 July 2020 | Volume 11 | Article 1847
fpsyg-11-01847 July 22, 2020 Time: 17:54 # 3
Pipitone and DiMattina Image Characteristics of Trypophobia
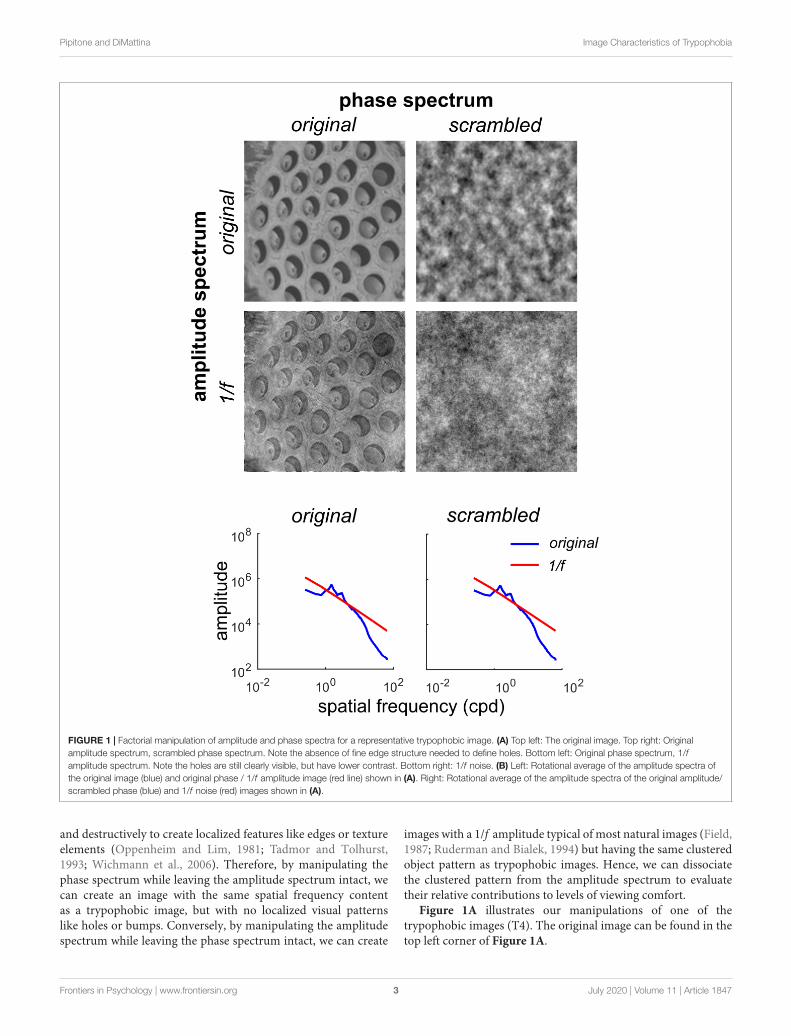
FIGURE 1 | Factorial manipulation of amplitude and phase spectra for a representative trypophobic image. (A) Top left: The original image. Top right: Originalamplitude spectrum, scrambled phase spectrum. Note the absence of fine edge structure needed to define holes. Bottom left: Original phase spectrum, 1/famplitude spectrum. Note the holes are still clearly visible, but have lower contrast. Bottom right: 1/f noise. (B) Left: Rotational average of the amplitude spectra ofthe original image (blue) and original phase / 1/f amplitude image (red line) shown in (A). Right: Rotational average of the amplitude spectra of the original amplitude/scrambled phase (blue) and 1/f noise (red) images shown in (A).
and destructively to create localized features like edges or textureelements (Oppenheim and Lim, 1981; Tadmor and Tolhurst,1993; Wichmann et al., 2006). Therefore, by manipulating thephase spectrum while leaving the amplitude spectrum intact, wecan create an image with the same spatial frequency contentas a trypophobic image, but with no localized visual patternslike holes or bumps. Conversely, by manipulating the amplitudespectrum while leaving the phase spectrum intact, we can create
images with a 1/f amplitude typical of most natural images (Field,1987; Ruderman and Bialek, 1994) but having the same clusteredobject pattern as trypophobic images. Hence, we can dissociatethe clustered pattern from the amplitude spectrum to evaluatetheir relative contributions to levels of viewing comfort.
Figure 1A illustrates our manipulations of one of thetrypophobic images (T4). The original image can be found in thetop left corner of Figure 1A.
Frontiers in Psychology | www.frontiersin.org 3 July 2020 | Volume 11 | Article 1847

fpsyg-11-01847 July 22, 2020 Time: 17:54 # 4
Pipitone and DiMattina Image Characteristics of Trypophobia
By randomizing the phase spectrum (uniform distribution,−180 to +180◦), while preserving the original amplitudespectrum, we produce the phase-scrambled image (Figure 1A,top right). Note that while this image has the same spatial auto-correlation structure as the original, it does not have the fineedge structure which defines the clustered pattern of holes inthe original. As we see in Figure 1B, this phase-scrambled imagehas an identical amplitude spectrum to the original image (bluecurves in both panels), with both images containing an excess ofmid-range spatial frequency energy relative to 1/f (Figure 1B,red curves). Conversely, we can take the original image and setits amplitude spectrum to the 1/f spectrum typical of naturalimages. This produces the image in the lower left of Figure 1A,which contains the fine structure of the original, including theholes, but has a somewhat “washed out” appearance. Finally,as a control stimulus, we also present 1/f noise (Figure 1A,bottom right) which has a naturalistic amplitude spectrum andalso a randomized phase spectrum. Collectively, this set of imagesdefines a 2 × 2 factorial design where the first factor is theamplitude spectrum (original or 1/f ) and the second factor is thephase spectrum (original or scrambled).
In order to verify that the 31 Trypophobic images in ourset contain excess spectral energy (relative to 1/f ) in mid-rangespatial frequencies, for each image we computed the proportionof total stimulus energy in each of the two mid-range spatialfrequency bands defined previously (Sasaki et al., 2017: 2–9 cpd;Fernandez and Wilkins, 2008: 3 cpd±2 octaves, or 0.75–12 cpd).We then computed the proportion of stimulus energy in thesesame frequency ranges for 1/f images, and took a ratio ρ ofthe proportions computed for our trypophobic images to thosecomputed for the 1/f images. A ratio ρ > 1 represents excessivemid-range spatial frequency energy with respect to 1/f.
As we can see from the histograms in Figure 2, for bothdefinitions of mid-range spatial frequencies, the overwhelmingmajority of the images in our set have a greater proportion ofenergy in these ranges than 1/f images. For the 2–9 cpd definition(Sasaki et al., 2017) we see in Figure 2A that 27/31 images have aρ > 1, with median ρ = 1.67 (Q1 = 1.27, Q3 = 1.92) significantlygreater than unity (p < 0.001, Wilcoxon sign-rank test, N = 31).Likewise, for the 3 cpd ±2 octaves (or 0.75–12 cpd) proposed byFernandez and Wilkins (2008) we see in Figure 2B that 24/31images have ρ > 1, with median ρ = 1.40 (Q1 = 1.01, Q3 = 1.75)significantly greater than unity (p < 0.001, Wilcoxon sign-ranktest, N = 31). Across the set of images we find a significantpositive correlation between the values of ρ obtained from thetwo definitions of mid-range spatial frequencies [r(31) = 0.67,p < 0.001], with the value measured using one definitionaccounting for about 45% of the total variance in the valuemeasured with the other definition (r2 = 0.449).
ParticipantsOne hundred and forty seven undergraduate students (34 male,113 female) ranging from 18 to 30 years in age (M = 19.65,SD = 2.15, with 7 not reporting age) were recruited from theinstitution’s General Psychology research pool (Sona-Systems R©)1
1https://www.sona-systems.com/
for class credit or from other classrooms for extra credit. Allparticipants reported having normal or corrected-to-normalvision. A priori power calculations were conducted usingG∗Power 3.1 beforehand to estimate sample sizes needed toachieve 80% power for the most stringent tests. In our study, thetests that had the smallest a-priori sample sizes were the mixedmodel ANOVAs with TRY condition as a between-subjects factorand also the correlations between comfort level and TQ scoresamong high and low TRY individuals. For the mixed modelANOVAs, using a medium effect size and an alpha of 0.05, thecalculated sample size needed to achieve 80% power was 82 (wehad 98). For the tests using Pearson correlation coefficients, weused a large effect size as the determinant based on previousliterature (Le et al., 2015; Pipitone et al., 2017). The most stringenttests were going to be the correlations between comfort levels andTQ scores among high and low TRY participants. In G∗powerusing a large effect size, two-tailed test, and an alpha of 0.05, thesample size needed to achieve 80% power was 29. Our smallesttest has 46 participants [low trypophobia condition (LTRY)]hence we had sufficient power here as well.
ProcedureParticipants used the online survey Checkbox R©2 to answer severaldemographic questions (e.g., history of psychological disorders,any medication, normal vision) and the GAD-7 for generalizedanxiety levels (Spitzer et al., 2006). Then, participants viewed twoalternating trypophobic images on another computer monitor(lotus seedpod and honeycomb) and completed the TQ (Leet al., 2015) which has 17 items assessing various emotionalreactions to the images (e.g., feel nervous, feel sick or nauseous,feel skin crawl) on a five-point Likert scale (ranging from notat all to extremely). Responses to both the GAD-7 (range 0–21, M = 5.86, SD = 4.61) and TQ (range 17–85, M = 21.12,SD = 6.74) were summed to create aggregate levels of anxiety andtrypophobia, respectively. Participants then viewed the originaland three different manipulated versions of 31 trypophobicimages on one computer (four stimuli for each original image:see Figure 1) and were given 7 s for each stimulus to rate theirlevel of comfort on a scale of −5 (extremely uncomfortable)to 5 (extremely comfortable) using Checkbox R© survey softwarerunning on another computer. Since different instantiations ofthe stimuli having randomized phase spectra yield non-identicalimages, the first 20 participants viewed two different versionsof the phase-scrambled and 1/f noise images (Figure 1A, rightcolumn), for a total of six stimuli per original image.
Previous work on trypophobia has used highly variable visualdisplays and has presented images at a variety of spatial scales(Cole and Wilkins, 2013; Le et al., 2015; Sasaki et al., 2017). Giventhe average size and periodicity of the clusters in our images, andthe size of the images on the monitors, viewing distance from themonitors was chosen so that the images subtended four degrees ofvisual angle (dva). This focused the excess spectral energy for eachimage in roughly in the same range (∼3 cpd) described previouslyas inducing discomfort (Fernandez and Wilkins, 2008; Cole andWilkins, 2013; Sasaki et al., 2017). In addition, since previous
2https://www.checkbox.com/
Frontiers in Psychology | www.frontiersin.org 4 July 2020 | Volume 11 | Article 1847

fpsyg-11-01847 July 22, 2020 Time: 17:54 # 5
Pipitone and DiMattina Image Characteristics of Trypophobia
FIGURE 2 | Ratio of the mid-range spatial frequency (SF) energy in our 31 images relative to energy in the same SF range in images with 1/f spectra, for twodifferent definitions of mid-range SF. A ratio greater than unity indicates excess energy in this range relative to 1/f. (A) Mid-range SF defined as 2–9 cycles per degreeof visual angle, as in Sasaki et al. (2017). (B) Mid-range SF defined as 3 cpd, ±2 octaves (0.75–12 cpd), as in Fernandez and Wilkins (2008).
work has not systematically investigated whether monitor gammacalibration affects trypophobic responses, we ran our tests onboth an uncalibrated LCD monitor (91 participants) and twodifferent gamma-corrected CRT monitors (56 participants). Theuncalibrated LCD monitor was a Dell P2213 (22′′, 1680 × 1050),viewed at a distance of 158 cm. Images on this set-up werepresented as a slide-show using PowerPoint R©. Two differentgamma-corrected (gamma = 1.0) monitors driven by a Bits#stimulus processor (Cambridge Research) were employed. Thefirst gamma-corrected setup was a ViewSonic R© Optiquest Q71(17′′, 1024× 768, 75 Hz) with midpoint luminance of 52.2 cd/m2.Images were scaled to 256 × 256 and viewed at a distance of108 cm. The second gamma-corrected setup was a SONY FD-500Trinitron (21′′, 1024 × 768, 75 Hz) having midpoint luminanceof 35.6 cd/m2. Images were scaled to 256 × 256 and viewedat distance of 143 cm. Stimulus presentation for both of thesecalibrated setups was controlled by a custom MATLAB R© scriptemploying PsychToolbox-3 routines (Kleiner et al., 2007).
RESULTS
Data were analyzed using the GLM procedure in SPSS R© version24.0 (IBM). Twenty seven participants (18.4%) reported sufferingfrom a clinical psychological disorder (e.g., depression, anxiety,comorbid depression and anxiety). Of these participants, 13were currently using medication. Exclusion of these participantsdid not change any of the results, thus they were includedin all subsequent analyses. Outliers were established usingZ cutoff values outside of 3.33 standard deviation units(Tabachnick and Fidell, 2007).
Effects of Phase and Amplitude onComfort LevelsFigure 3 shows the average comfort ratings for each of the fourimage conditions (Figure 1A) for all participants. A 2 (phasecondition: original vs. scrambled) × 2 (amplitude condition:
FIGURE 3 | Mean comfort levels across all 31 trypophobic images (and theirthree manipulated versions) for all 146 participants (error bars represent 95%confidence intervals). The main effect of phase explained the most variance incomfort (24.9% variance explained), followed by the main effect of amplitude(9% variance explained), followed by the interaction of phase and amplitude(6.1% variance explained).
original vs. 1/f ) repeated measures factorial ANOVA wasperformed to examine the unique impact of phase and amplitudeon levels of comfort. There was a significant main effect ofthe phase spectrum on comfort, F(1,146) = 48.39, p < 0.001,η2 = 0.249. Participants rated the original-phase images lowerin comfort than the scrambled-phase images. There was also asignificant main effect of the amplitude spectrum on comfort,F(1,146) = 14.51, p < 0.001, η2 = 0.09. As shown in Figure 3,average comfort ratings were lower for the original-amplitudeimages compared to the 1/f amplitude images. There was alsoa significant interaction of the phase and amplitude spectra oncomfort, F(1,146) = 9.54, p = 0.002, η2 = 0.061. Participants gave
Frontiers in Psychology | www.frontiersin.org 5 July 2020 | Volume 11 | Article 1847

fpsyg-11-01847 July 22, 2020 Time: 17:54 # 6
Pipitone and DiMattina Image Characteristics of Trypophobia
slightly lower comfort ratings to the scrambled phase / originalamplitude images than the scrambled phase / 1/f images, butthere was little difference between the ratings given to the originalimages and the original phase / 1/f amplitude images.
One possible consequence of scrambling the phase propertyof images is that it leads them to be more comfortable to viewin general. In order to test this, we ran a separate controlstudy on 45 participants (9 males, 36 females, ages M = 20.3,SD = 2.41). We used 15 non-trypophobic control images of holes(e.g., pictures of a circular window, golf hole, cannon barrel)from Cole and Wilkins (2013) along with their phase-scrambled,original amplitude counterparts. Results showed that scramblingthe phase property of control hole images actually decreasescomfort levels (M = 1.49, SD = 2.44) compared to the originalcontrol images of holes (M = 2.34, SD = 1.92), t(44) = 3.56,p = 0.001, η2 = 0.23. There was no effect of participant levelof trypophobia based on high and low TQ scores and imagecondition, F(1,43) = 0.26, p = 0.613, η2 = 0.01. These resultsshow that phase scrambling images does not increase theircomfort level, in fact it has the opposite effect. Therefore, it isunlikely that the increased comfort level attributed to phase-scrambled trypophobic images was due to scrambling of theirphase properties.
Controls for Noise Instance and GammaCorrectionIn order to assess whether our effects were consistent acrossdifferent instantiations of the random phase spectra used togenerate the scrambled phase and 1/f noise conditions, the first20 participants viewed two different scrambled phase (Figure 1A,top right) and 1/f amplitude (Figure 1A, bottom right) imagesper original trypophobic image (for a total of six stimuli peroriginal image rather than four). Using the images as the levelof analysis (each image was rated by 20 participants), twopaired-sample t-tests showed that levels of comfort were notsignificantly different across all of the first vs. second scrambledphase manipulated images, t(30) = −0.751, p = 0.459, or thefirst vs. second 1/f amplitude images, t(30) = −0.289, p = 0.774.Using the raters as the level of analysis across all 62 imagetypes, paired sample t-tests between all of the 31 first vs. secondscrambled phase and 31 first vs. second 1/f amplitude imagesrevealed only one significant difference in comfort (image T30for first vs. second 1/f amplitude), but this is well within therange of the expected Type I error inflation from running 62 tests.We conclude that no manipulation effects were evident whenconstructing the scrambled phase and 1/f amplitude images,hence the full analysis only used the first generated scrambledphase and 1/f amplitude image.
We also assessed whether responses would change as afunction of monitor gamma correction, an issue that has notbeen explored previously. Using a mixed-model factorial ANOVAwith monitor type as a between-subjects factor, the main effectof monitor type alone did not influence levels of comfort,F(1,145) = 2.193, p = 0.141, η2 = 0.015. The three-way interactionof phase, amplitude, and monitor type on levels of comfort wasalso not significant, nor were the two-way interactions of phase
and monitor type or amplitude and monitor type, all F’s < 1.928,p > 0.167, η2 < 0.013). We conclude that our observed effects ofamplitude and phase spectra on comfort levels are robust to thegamma non-linearity present in standard commercial displays(Lu and Dosher, 2013). Therefore, for all other analyses reportedhere we pooled the data across both gamma calibrated andun-calibrated setups.
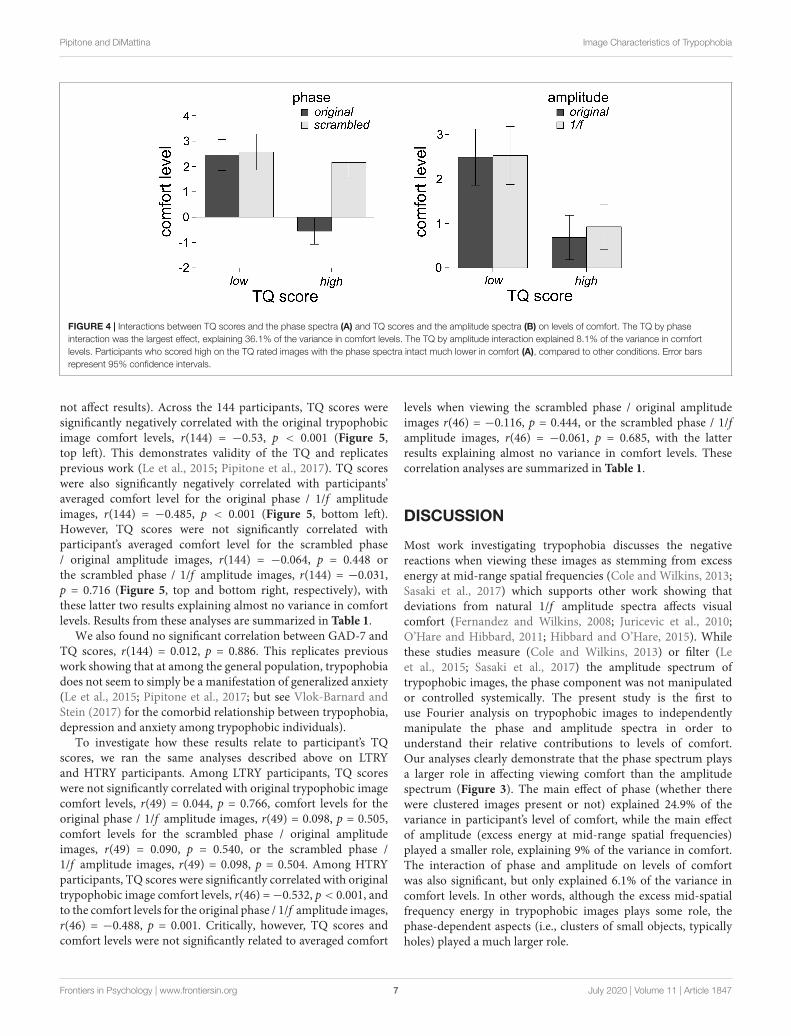
TQ Scores, Phase, and Amplitude onComfort LevelsParticipants filled out the TQ, in order to assess whether levelsof trypophobia would affect ratings of comfort as a functionof image phase and amplitude spectra. Eleven participantshad scores higher than 31 (7.4%) and would be consideredtrypophobic (Le et al., 2015) which is a smaller proportion thanwhat others have reported in their samples (Cole and Wilkins,2013; Pipitone et al., 2017). Following Sasaki et al. (2017) weran analyses on participants who scored in the top and bottomthird (33%) of the TQ. As a result, 49 participants were inthe high trypophobia condition (HTRY) and 49 were in theLTRY. Three participants had outlier raw TQ scores (Z > 3.33),however, their comfort ratings were not outliers, hence theirdata is retained in this analysis (see later analyses for theirexclusion). Using a mixed-model factorial ANOVA with TRYcondition (LTRY and HTRY) as the between-subjects factor, themain effect of TRY condition did influence levels of comfort,F(1,96) = 17.63, p < 0.001, η2 = 0.155. HTRY participants hadlower levels of comfort than LTRY participants, which is to beexpected. The three-way interaction of phase, amplitude andTRY condition was not significant, F(1,96) = 2.89, p = 0.092,η2 = 0.029. However, the two-way interaction of phase and TRYcondition on levels of comfort was significant F(1,96) = 54.17,p < 0.001, η2 = 0.361. As seen in Figure 4A, LTRY participantshad similar comfort scores when viewing original or scrambledphase images, collapsed across the amplitude condition, butHTRY participants had lower comfort levels when viewing theoriginal phase images compared to the scrambled phase images,collapsed across amplitude condition. The two-way interactionof amplitude and TRY condition on levels of discomfort wasalso significant F(1,96) = 8.477, p = 0.004, η2 = 0.081. As seenin Figure 4B, LTRY participants showed similar comfort levelswhen viewing original or 1/f amplitude images, collapsed acrossthe phase condition, but HTRY participants had slightly lowerlevels of comfort when viewing the original amplitude imagescompared to the 1/f amplitude images, collapsed across thephase condition.
Correlations Between TQ Scores andComfort Level Across the Four DifferentImage ConditionsIn order to further investigate the effects of phase and amplitudespectra on levels of comfort, correlation analysis was used toassess the relationship between participant’s TQ scores and theiraveraged level of comfort ratings for all image conditions. Threeparticipants had outlier raw TQ scores (Z > 3.33), and werethus excluded from this analysis to be conservative (this did
Frontiers in Psychology | www.frontiersin.org 6 July 2020 | Volume 11 | Article 1847
fpsyg-11-01847 July 22, 2020 Time: 17:54 # 7
Pipitone and DiMattina Image Characteristics of Trypophobia
FIGURE 4 | Interactions between TQ scores and the phase spectra (A) and TQ scores and the amplitude spectra (B) on levels of comfort. The TQ by phaseinteraction was the largest effect, explaining 36.1% of the variance in comfort levels. The TQ by amplitude interaction explained 8.1% of the variance in comfortlevels. Participants who scored high on the TQ rated images with the phase spectra intact much lower in comfort (A), compared to other conditions. Error barsrepresent 95% confidence intervals.
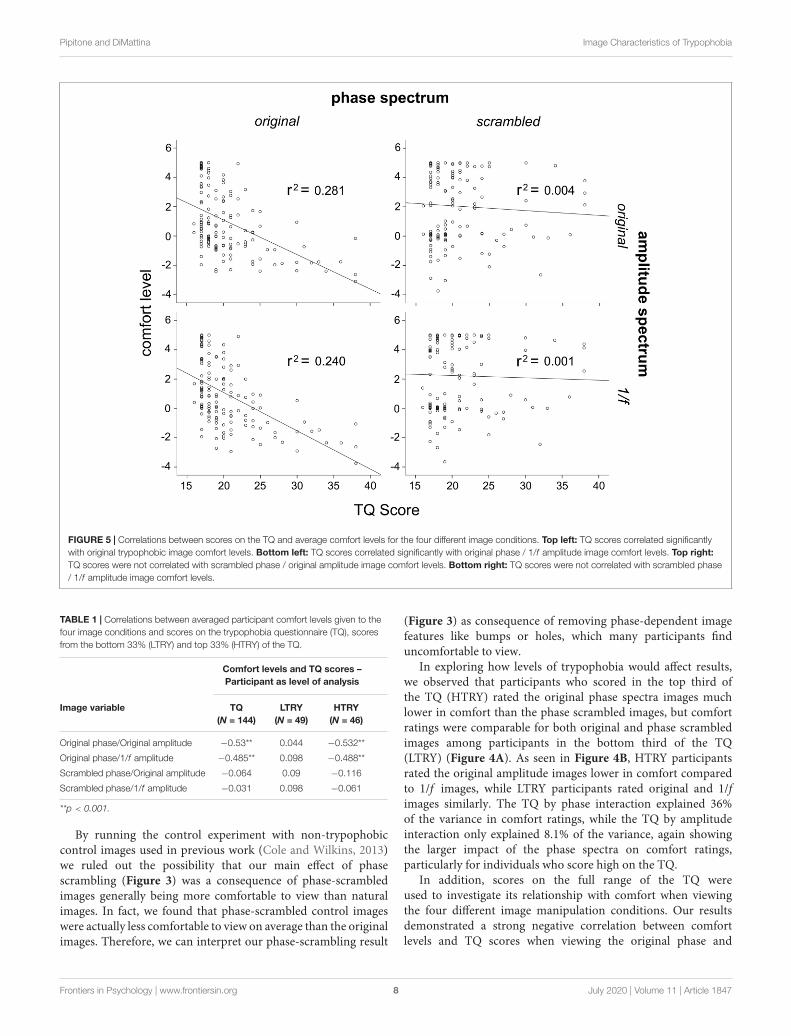
not affect results). Across the 144 participants, TQ scores weresignificantly negatively correlated with the original trypophobicimage comfort levels, r(144) = −0.53, p < 0.001 (Figure 5,top left). This demonstrates validity of the TQ and replicatesprevious work (Le et al., 2015; Pipitone et al., 2017). TQ scoreswere also significantly negatively correlated with participants’averaged comfort level for the original phase / 1/f amplitudeimages, r(144) = −0.485, p < 0.001 (Figure 5, bottom left).However, TQ scores were not significantly correlated withparticipant’s averaged comfort level for the scrambled phase/ original amplitude images, r(144) = −0.064, p = 0.448 orthe scrambled phase / 1/f amplitude images, r(144) = −0.031,p = 0.716 (Figure 5, top and bottom right, respectively), withthese latter two results explaining almost no variance in comfortlevels. Results from these analyses are summarized in Table 1.
We also found no significant correlation between GAD-7 andTQ scores, r(144) = 0.012, p = 0.886. This replicates previouswork showing that at among the general population, trypophobiadoes not seem to simply be a manifestation of generalized anxiety(Le et al., 2015; Pipitone et al., 2017; but see Vlok-Barnard andStein (2017) for the comorbid relationship between trypophobia,depression and anxiety among trypophobic individuals).
To investigate how these results relate to participant’s TQscores, we ran the same analyses described above on LTRYand HTRY participants. Among LTRY participants, TQ scoreswere not significantly correlated with original trypophobic imagecomfort levels, r(49) = 0.044, p = 0.766, comfort levels for theoriginal phase / 1/f amplitude images, r(49) = 0.098, p = 0.505,comfort levels for the scrambled phase / original amplitudeimages, r(49) = 0.090, p = 0.540, or the scrambled phase /1/f amplitude images, r(49) = 0.098, p = 0.504. Among HTRYparticipants, TQ scores were significantly correlated with originaltrypophobic image comfort levels, r(46) =−0.532, p < 0.001, andto the comfort levels for the original phase / 1/f amplitude images,r(46) = −0.488, p = 0.001. Critically, however, TQ scores andcomfort levels were not significantly related to averaged comfort
levels when viewing the scrambled phase / original amplitudeimages r(46) = −0.116, p = 0.444, or the scrambled phase / 1/famplitude images, r(46) = −0.061, p = 0.685, with the latterresults explaining almost no variance in comfort levels. Thesecorrelation analyses are summarized in Table 1.
DISCUSSION
Most work investigating trypophobia discusses the negativereactions when viewing these images as stemming from excessenergy at mid-range spatial frequencies (Cole and Wilkins, 2013;Sasaki et al., 2017) which supports other work showing thatdeviations from natural 1/f amplitude spectra affects visualcomfort (Fernandez and Wilkins, 2008; Juricevic et al., 2010;O’Hare and Hibbard, 2011; Hibbard and O’Hare, 2015). Whilethese studies measure (Cole and Wilkins, 2013) or filter (Leet al., 2015; Sasaki et al., 2017) the amplitude spectrum oftrypophobic images, the phase component was not manipulatedor controlled systemically. The present study is the first touse Fourier analysis on trypophobic images to independentlymanipulate the phase and amplitude spectra in order tounderstand their relative contributions to levels of comfort.Our analyses clearly demonstrate that the phase spectrum playsa larger role in affecting viewing comfort than the amplitudespectrum (Figure 3). The main effect of phase (whether therewere clustered images present or not) explained 24.9% of thevariance in participant’s level of comfort, while the main effectof amplitude (excess energy at mid-range spatial frequencies)played a smaller role, explaining 9% of the variance in comfort.The interaction of phase and amplitude on levels of comfortwas also significant, but only explained 6.1% of the variance incomfort levels. In other words, although the excess mid-spatialfrequency energy in trypophobic images plays some role, thephase-dependent aspects (i.e., clusters of small objects, typicallyholes) played a much larger role.
Frontiers in Psychology | www.frontiersin.org 7 July 2020 | Volume 11 | Article 1847
fpsyg-11-01847 July 22, 2020 Time: 17:54 # 8
Pipitone and DiMattina Image Characteristics of Trypophobia
FIGURE 5 | Correlations between scores on the TQ and average comfort levels for the four different image conditions. Top left: TQ scores correlated significantlywith original trypophobic image comfort levels. Bottom left: TQ scores correlated significantly with original phase / 1/f amplitude image comfort levels. Top right:TQ scores were not correlated with scrambled phase / original amplitude image comfort levels. Bottom right: TQ scores were not correlated with scrambled phase/ 1/f amplitude image comfort levels.
TABLE 1 | Correlations between averaged participant comfort levels given to thefour image conditions and scores on the trypophobia questionnaire (TQ), scoresfrom the bottom 33% (LTRY) and top 33% (HTRY) of the TQ.
Comfort levels and TQ scores –Participant as level of analysis
Image variable TQ(N = 144)
LTRY(N = 49)
HTRY(N = 46)
Original phase/Original amplitude −0.53** 0.044 −0.532**
Original phase/1/f amplitude −0.485** 0.098 −0.488**
Scrambled phase/Original amplitude −0.064 0.09 −0.116
Scrambled phase/1/f amplitude −0.031 0.098 −0.061
**p < 0.001.
By running the control experiment with non-trypophobiccontrol images used in previous work (Cole and Wilkins, 2013)we ruled out the possibility that our main effect of phasescrambling (Figure 3) was a consequence of phase-scrambledimages generally being more comfortable to view than naturalimages. In fact, we found that phase-scrambled control imageswere actually less comfortable to view on average than the originalimages. Therefore, we can interpret our phase-scrambling result
(Figure 3) as consequence of removing phase-dependent imagefeatures like bumps or holes, which many participants finduncomfortable to view.
In exploring how levels of trypophobia would affect results,we observed that participants who scored in the top third ofthe TQ (HTRY) rated the original phase spectra images muchlower in comfort than the phase scrambled images, but comfortratings were comparable for both original and phase scrambledimages among participants in the bottom third of the TQ(LTRY) (Figure 4A). As seen in Figure 4B, HTRY participantsrated the original amplitude images lower in comfort comparedto 1/f images, while LTRY participants rated original and 1/fimages similarly. The TQ by phase interaction explained 36%of the variance in comfort ratings, while the TQ by amplitudeinteraction only explained 8.1% of the variance, again showingthe larger impact of the phase spectra on comfort ratings,particularly for individuals who score high on the TQ.
In addition, scores on the full range of the TQ wereused to investigate its relationship with comfort when viewingthe four different image manipulation conditions. Our resultsdemonstrated a strong negative correlation between comfortlevels and TQ scores when viewing the original phase and
Frontiers in Psychology | www.frontiersin.org 8 July 2020 | Volume 11 | Article 1847
fpsyg-11-01847 July 22, 2020 Time: 17:54 # 9
Pipitone and DiMattina Image Characteristics of Trypophobia
amplitude images and when viewing the original phase / 1/famplitude images (Figure 5, left two panels), both explaining28.1 and 24% of the variance in comfort levels, respectively.However, there was no correlation between comfort levels andTQ scores when participants viewed the phase-scrambled /original amplitude images or phase-scrambled / 1/f amplitudeimages (Figure 5, right two panels), both explaining 0.4 and 0.1%of variance in comfort levels, respectively. What is more, amongLTRY individuals, there was no relationship between TQ scoresand comfort levels in any image condition, with all relationshipsexplaining less than 1% of the variance in comfort levels.Even among HTRY individuals, comfort level variance was onlyexplained by TQ scores when these participants viewed imageswith the phase structure present; TQ scores did not explainany meaningful variance in comfort levels (less than 3%) whenparticipants viewed images comprising the original amplitudebut scrambled phase structure (see Table 1). In summary, thesefindings suggest that even among trypophobic individuals, thosewho score higher on the TQ did not find images with the originalamplitude spectrum intact more uncomfortable to view.
Two current evolutionary frameworks exist to explain themanifestation of trypophobia. One view is that trypophobicimages mimic the patterns found on dangerous animals, suchas snakes and spiders. Thus, having a negative reaction tothose specific patterns may provide a survival advantage (Coleand Wilkins, 2013). This view posits that trypophobia is amisfiring of an otherwise adaptive fear response. The otherviewpoint considers trypophobia as an adverse negative reactionto clustered patterns on the surface of the skin stemming fromparasites and infectious diseases. Thus, trypophobia may bean exaggerated and overgeneralized, albeit adaptive response toavoid contact with diseased individuals (Kupfer and Le, 2017)with this viewpoint positing that trypophobia encompasses moreof a disgust response. Recent work seems to support the latterinfectious disease/disgust response. For example, Imaizumi et al.(2016) show a positive relationship between TQ scores and coredisgust sensitivity. Kupfer and Le (2017) found that trypophobicindividuals reported more disease-relevant pathogen avoidanceremarks in open-ended questions when viewing trypophobicimages. Yamada and Sasaki (2017) also showed that individualswith previous skin-related medical problems reported higherdiscomfort ratings toward trypophobic images compared tothose who have no history of skin disease. Two other recentstudies found greater unpleasantness ratings for faces of humansand animals when a trypophobic image (lotus seedpod) wassuperimposed on them compared to the trypophobic imageviewed in isolation or when viewing the trypophobic image oninverted faces (Furuno et al., 2017, 2018).
Whether the discomfort elicited by trypophobic imagery iscaused by fear or disgust, it is clear from our results that itis not strongly dependent on excess mid-range SF energy. Infact, one serious problem with the spectral energy hypothesisof trypophobia (Cole and Wilkins, 2013) is that as one variesviewing distance or image size, image spatial frequency contentchanges. For instance, if one doubles viewing distance, or halvesimage size, the spatial frequencies in the image approximatelydouble. Therefore, visual discomfort elicited by potentially
harmful stimuli (e.g., disease, or predators) would not be robustto changes in viewing distance or image size, making it apoor protective mechanism from an evolutionary perspective. Incontrast, if the discomfort is cause by the patterns of holes orbumps rather than the SF content (as our results suggest), thiswould provide a more robust protective mechanism.
Some work has manipulated the phase and amplitude spectraof trypophobic images. Le et al. (2015) removed excess energyfrom trypophobic images (giving them 1/f natural image spectrabut kept the original phase spectra intact) and showed thattrypophobic comfort was unaffected compared to the originalimages (even among trypophobic individuals). Shirai and Ogawa(2019) found that trypophobic images enter visual awarenesssooner than fear-related and neutral images, but scrambled phasespectra of the same trypophobic images (leaving the originalamplitude spectrum intact) mitigated the “pre-perceptual”processing effect. However, during “post-perceptual” processing,phase-scrambled images were rated more negatively than otherimage types. This latter result, along with the current findingsseem to suggest that although excessive mid-range spatialfrequency energy may invoke slightly more unpleasantness thanwould otherwise be the case (see Figure 3), the excess energy hasits largest effect on comfort through its interaction with the phasespectrum by enhancing the visibility of the clusters (compareFigure 1A upper and lower left panels). In other words, theamplitude spectrum, in and of itself, does not invoke a strongtrypophobic response (compared to what is seen when the naturalphase spectrum is present).
Despite the modest contribution of the amplitude spectrum tocomfort levels when viewing trypophobic images, more generallyimages having spectral characteristics deviating from the 1/fspectra typical of most natural images have been shown to inducesome visual discomfort (Wilkins et al., 1984; Fernandez andWilkins, 2008; Juricevic et al., 2010; Penacchio and Wilkins,2015). One hypothesis proposed to explain these findings is thatimages which induce visual discomfort elicit over-activity orhyper-metabolism in the visual cortex (Penacchio and Wilkins,2015). This idea is supported by the studies like Wilkins et al.(1984) which demonstrated that the most discomforting gratingshave mid-range spatial frequencies (∼3 cpd ±2 octaves) thatare strongly represented in the primate visual cortex (De Valoiset al., 1982) and to which the human visual system is mostsensitive (Campbell and Robson, 1968). More recent work hasdemonstrated that a biologically plausible model of early visualcortex requires a larger number of active neurons to encodeuncomfortable images than to encode comfortable images, alsoconsistent with the hyper-metabolism hypothesis (Hibbard andO’Hare, 2015). As such, Le et al. (2020) recently showed thattrypophobic images invoke larger hemodynamic responses inrear cortical areas among those who score high on the TQ.Inspired by our current findings with trypophobic imagery,it would be of great interest for researchers more broadly toconsider possible interactions of amplitude and phase spectra indetermining visual discomfort.
Although our study demonstrates a much stronger role forthe phase spectrum than amplitude spectrum in determiningvisual discomfort in trypophobia, it does not tell us whether
Frontiers in Psychology | www.frontiersin.org 9 July 2020 | Volume 11 | Article 1847

fpsyg-11-01847 July 22, 2020 Time: 17:54 # 10
Pipitone and DiMattina Image Characteristics of Trypophobia
this is because the phase spectrum defines the semantic content(clusters of holes), or whether the phase distributions that definetrypophobic images are a subset of a larger class of phasedistributions which elicit visual discomfort. Although there issubstantial literature on the effects of amplitude spectra (Juricevicet al., 2010) and orientation spectra (Ogawa and Motoyoshi,2020) on visual comfort, to our knowledge no studies havesystematically investigated the effects of phase spectra in isolationwhile controlling for other image properties. Our choice of arandom, uniform phase spectrum for the control stimuli wasmeant to eliminate all forms of structure in the image, and thischoice of phase spectrum has been used in a number of previousstudies (e.g., Wichmann et al., 2006; Furuno et al., 2018; Shiraiand Ogawa, 2019). However, this is by no means the only possibleway to manipulate phase spectra, and more general investigationsof the effects of phase structure on visual discomfort are ofinterest for future work.
For the present study, given the ecological relevance of diseaseavoidance, we hypothesize that it is the semantic content oftrypophobic images which is primarily responsible for visualdiscomfort. This hypothesis is supported by recent work showingthat super-imposing trypophobic stimuli onto pictures of uprightfaces induces more discomfort than viewing trypophobic stimuliin isolation or in other contexts (Furuno et al., 2017, 2018). Ingeneral, it is of great interest for future work to better understandthe relative contributions of low-level image statistics and high-level semantic content in determining viewing comfort.
Finally, the contextual features of trypophobic images need tobe further investigated in order to gain a better understanding fortheir specific impact on levels of comfort. For example, Le et al.(2015) showed no differences in comfort levels when viewingconvex or concave images (i.e., bumps vs. holes) and suggestthe “necessary but not sufficient” condition for unnatural imagestatistics to be the leading cause of trypophobia discomfort.Unfortunately, their image manipulations did not tease apart thephase and amplitude spectrum of the images, thus the amplitudeproperties were bound to the phase components. But, thoseimages did have an underlying commonality; all had clusterscomprised of circular objects. Would there be differences incomfort levels if the clusters were of non-circular objects? Thisphase specific aspect of trypophobic imagery might lend furthercredence to the parasitism model of infectious diseases, as manydangerous diseases (e.g., smallpox, typhus) involve clusters of
roughly circular rashes or scabs on the skin (Kupfer and Le, 2017).What is more, the human visual system is sensitive to repetitivevisual patterns (Conlon et al., 1999) thus levels of discomfortstemming from trypophobic images might be a consequence ofrepetitive clusters of roughly circular objects, which invokes anadaptive disgust response.
CONCLUSION
While the current literature indicates excess energy at mid-rangespatial frequencies as the defining feature of trypophobic images,our results suggest otherwise. The phase spectrum (independentof the amplitude spectrum) played a much larger role indetermining comfort levels, compared to the amplitude spectrum(independent of the phase spectrum). While levels of trypophobiaaffected comfort levels attributed to images with the originalphase spectrum intact, it did not play as big of a role in changingcomfort levels as a function of image amplitude spectrum. Thus,the phase spectrum (sinusoidal waveform patterns) that comprisethe image context seem to play a bigger role in the induction oftrypophobic discomfort compared to the amplitude spectrum.
DATA AVAILABILITY STATEMENT
All data will be provided at the request of the reader by contactingthe corresponding author.
ETHICS STATEMENT
The studies involving human participants were reviewed andapproved by the Florida Gulf Coast University InstitutionalReview Board. The patients/participants provided their writteninformed consent to participate in this study.
AUTHOR CONTRIBUTIONS
RP and CD conceived and designed the experiments and wrotethe manuscript. CD manipulated the visual stimuli. RP collectedand analyzed the data. Both authors contributed to the article andapproved the submitted version.
REFERENCESAmerican Psychiatric Association (2013). Diagnostic and Statistical Manual of
Mental Disorders, 5th Edition: DSM-5, 5th Edn, Washington, DC: AmericanPsychiatric Publishing.
Campbell, F. W., and Robson, J. G. (1968). Application of fourier analysis to thevisibility of gratings. J. Physiol. 197:551. doi: 10.1113/jphysiol.1968.sp008574
Can, W., Zhuoran, Z., and Zheng, J. (2017). Is trypophobia a phobia? Psychol. Rep.120, 206–218. doi: 10.1177/0033294116687298
Cole, G. G., and Wilkins, A. J. (2013). Fear of holes. Psychol. Sci. 24, 1980–1985.doi: 10.1177/0956797613484937
Conlon, E. G., Lovegrove, W. J., Chekaluk, E., and Pattison, P. E. (1999). Measuringvisual discomfort. Vis. Cogn. 6, 637–663. doi: 10.1080/135062899394885
De Valois, R. L., Albrecht, D. G., and Thorell, L. G. (1982). Spatial frequencyselectivity of cells in macaque visual cortex. Vis. Res. 22, 545–559. doi: 10.1016/0042-6989(82)90113-4
Fernandez, D., and Wilkins, A. J. (2008). Uncomfortable images in art and nature.Perception 37, 1098–1113. doi: 10.1068/p5814
Field, D. J. (1987). Relations between the statistics of natural images and theresponse properties of cortical cells. J. Opt. Soc. Am. A 4, 2379–2394.
Furuno, M., Imaizumi, S., Maeda, K., Hibino, H., and Koyama, S. (2017). Theinfluence of background objects on unpleasantness evoked by lotus-seed- pods-on-the-living-body images (“Hasu-colla”). Intern. J. Affect. Eng. 16, 221–230.doi: 10.5057/ijae.IJAE-D-16-00045
Furuno, M., Sakurai, Y., Imaizumi, S., and Koyama, S. (2018). Face-inversion effecton disgust evoked by a cluster of dots. i-Perception 9:2041669518784960.
Frontiers in Psychology | www.frontiersin.org 10 July 2020 | Volume 11 | Article 1847

fpsyg-11-01847 July 22, 2020 Time: 17:54 # 11
Pipitone and DiMattina Image Characteristics of Trypophobia
Gonzalez, R. C., and Woods, R. E. (2017). Digital Image Processing, 4th Edn,London: Pearson.
Hibbard, P. B., and O’Hare, L. (2015). Uncomfortable images produce non-sparseresponses in a model of primary visual cortex. R. Soc. Open Sci. 2:140535.doi: 10.1098/rsos.140535
Imaizumi, S., Furuno, M., Hibino, H., and Koyama, S. (2016). Trypophobiais predicted by disgust sensitivity, empathic traits, and visual discomfort.Springerplus 5:1449. doi: 10.1186/s40064-016-3149-3146
Juricevic, I., Land, L., Wilkins, A., and Webster, M. A. (2010). Visualdiscomfort and natural image statistics. Perception 39, 884–899. doi: 10.1068/p6656
Kleiner, M., Brainard, D., and Pelli, D. (2007). What’s New In Psychtoolbox-3? Perception 36:ECVP Abstract Supplement. Available online at: http://www.perceptionweb.com/abstract.cg?i?id=v070821 (accessed December 16, 2013).
Kupfer, T. R., and Le, A. T. D. (2017). Disgusting clusters: trypophobia as anovergeneralised disease avoidance response. Cogn. Emot. 32, 729–741. doi: 10.1080/02699931.2017.1345721
Le, A., Cole, G., and Wilkins, A. (2020). Trypophobia: heart rate, heartratevariability and cortical haemodynamic response. J. Affect. Disord. 274, 1147–1151. doi: 10.1016/j.jad.2020.06.002
Le, A. T. D., Cole, G. G., and Wilkins, A. J. (2015). Assessment of trypophobiaand an analysis of its visual precipitation. Q. J. Exper. Psychol. 68, 2304–2322.doi: 10.1080/17470218.2015.1013970
Lu, Z. L., and Dosher, B. (2013). Visual Psychophysics: From Laboratory To Theory.Cambridge, MA: MIT Press.
Ogawa, N., and Motoyoshi, I. (2020). Differential effects of orientation and spatial-frequency spectra on visual unpleasantness. Front. Psychol. Percept. Sci. 11:1342.doi: 10.3389/fpsyg.2020.01342
O’Hare, L., and Hibbard, P. B. (2011). Spatial frequency and visual discomfort. Vis.Res. 51, 1767–1777. doi: 10.1016/j.visres.2011.06.002
Oppenheim, A. V., and Lim, J. S. (1981). The importance of phase in signals. Proc.IEEE 69, 529–541. doi: 10.1109/proc.1981.12022
Penacchio, O., and Wilkins, A. J. (2015). Visual discomfort and the spatialdistribution of fourier energy. Vis. Res. 108, 1–7. doi: 10.1016/j.visres.2014.12.013
Pipitone, R. N., Gallegos, B., and Walters, D. (2017). Physiological responsesto trypophobic images and further scale validity of the trypophobiaquestionnaire. Pers. Individ. Differ. 108, 66–68. doi: 10.1016/j.paid.2016.11.068
Ruderman, D. L., and Bialek, W. (1994). Statistics of natural images: scaling in thewoods. Phys. Rev. Lett. 73, 814–817. doi: 10.1103/physrevlett.73.814
Sasaki, K., Yamada, Y., Kuroki, D., and Miura, K. (2017). Trypophobic discomfortis spatial-frequency dependent. Adv. Cogn. Psychol. 13, 224–231. doi: 10.5709/acp-0222-2
Shepherd, K. (2019). Does The New Iphone Creep You Out? Scientists Grapple WithWhy Tiny Holes Scare Some People. Washington, DC: The Washington Post.
Shirai, R., and Ogawa, H. (2019). Trypophobic images gain preferential access toearly visual processes. Conscious. Cogn. 67, 56–68. doi: 10.1016/j.concog.2018.11.009
Spitzer, R. L., Kroenke, K., Williams, J. B. W., and Lowe, B. (2006). A brief measurefor assessing generalized anxiety disorder. Arch. Intern. Med. 166, 1092–1097.
Tabachnick, B. L., and Fidell, L. S. (2007). Using Multivariate Statistics, 5th Edn,Boston, MA: Pearson Education Inc.
Tadmor, Y., and Tolhurst, D. J. (1993). Both the phase and the amplitude spectrummay determine the appearance of natural images. Vis. Res. 33, 141–145. doi:10.1016/0042-6989(93)90067-7
Vlok-Barnard, M., and Stein, D. J. (2017). Trypophobia: an investigation of clinicalfeatures. Rev. Brasil. Psiquiatr. 39, 337–341. doi: 10.1590/1516-4446-2016-2079
Wichmann, F. A., Braun, D. I., and Gegenfurtner, K. R. (2006). Phase noise and theclassification of natural images. Vis. Res. 46, 1520–1529. doi: 10.1016/j.visres.2005.11.008
Wilkins, A., Nimmo-Smith, I. A. N., Tait, A., Mcmanus, C., Sala, S. D., Tilley, A.,et al. (1984). A neurological basis for visual discomfort. Brain 107, 989–1017.doi: 10.1093/brain/107.4.989
Yamada, Y., and Sasaki, K. (2017). Involuntary protection against dermatosis: apreliminary observation on trypophobia. BMC Res. Notes 10:658. doi: 10.1186/s13104-017-2953-2956
Conflict of Interest: The authors declare that the research was conducted in theabsence of any commercial or financial relationships that could be construed as apotential conflict of interest.
Copyright © 2020 Pipitone and DiMattina. This is an open-access article distributedunder the terms of the Creative Commons Attribution License (CC BY). The use,distribution or reproduction in other forums is permitted, provided the originalauthor(s) and the copyright owner(s) are credited and that the original publicationin this journal is cited, in accordance with accepted academic practice. No use,distribution or reproduction is permitted which does not comply with these terms.
Frontiers in Psychology | www.frontiersin.org 11 July 2020 | Volume 11 | Article 1847