assessing accuracy of gas-driven permeability measurements: a
TRANSCRIPT

Solid Earth, 5, 1–11, 2014www.solid-earth.net/5/1/2014/doi:10.5194/se-5-1-2014© Author(s) 2014. CC Attribution 3.0 License.
Solid Earth
Open A
ccess
Assessing accuracy of gas-driven permeability measurements: acomparative study of diverse Hassler-cell and probe permeameterdevices
C. M. Filomena1,*, J. Hornung2, and H. Stollhofen1
1GeoZentrum Nordbayern, Friedrich-Alexander-Universität Erlangen-Nürnberg, Erlangen, Germany2Institut für Angewandte Geowissenschaften, Technische Universität Darmstadt, Darmstadt, Germany* current address: Shell Global Solutions B.V., Rijswijk, the Netherlands
Correspondence to:C. M. Filomena ([email protected])
Received: 1 July 2013 – Published in Solid Earth Discuss.: 2 August 2013Revised: 26 November 2013 – Accepted: 27 November 2013 – Published: 2 January 2014
Abstract. Permeability is one of the most important petro-physical parameters to describe the reservoir properties ofsedimentary rocks, pertaining to problems in hydrology,geothermics, and hydrocarbon reservoir analysis. Outcropanalogue studies, well core measurements, and individualsample analysis take advantage of a variety of commerciallyavailable devices for permeability measurements. Very often,permeability data derived from different devices need to bemerged within one study (e.g. outcrop minipermeametry andlab-based core plug measurements). To enhance accuracyof different gas-driven permeability measurements, device-specific aberrations need to be taken into account. The appli-cation of simple one-to-one correlations may draw the wrongpicture of permeability trends. For this purpose, transformequations need to be established.
This study presents a detailed comparison of permeabil-ity data derived from a selection of commonly used Hasslercells and probe permeameters. As a result of individual cross-plots, typical aberrations and transform equations are elabo-rated, which enable corrections for the specific permeame-ters. Permeability measurements of the commercially avail-able ErgoTech gas permeameter and the TinyPerm II probepermeameter are well-comparable over the entire range ofpermeability, withR2
= 0.955. Aberrations are mostly iden-tified in the permeability range< 10 mD, regarding theTinyPerm II and the minipermeameter/Hassler-cell combi-nation at Darmstadt University, which need to be correctedand standardized. Applying standardizations which considerthese aberration intervals strongly improves the comparabil-
ity of permeability data sets and facilitates the combinationof measurement principles. Therefore, the utilization of suchcorrelation tests is highly recommended for all kinds of reser-voir studies using integrated permeability databases.
1 Introduction
Petrophysical properties of sedimentary rocks are decisiveparameters for the quantitative and qualitative evaluation ofreservoir rocks. One of the most important measurement val-ues is permeability, describing the magnitude of fluid flowthrough porous media. Reliable permeability values are aprerequisite for the assessment and modelling of hydrocar-bon, carbon dioxide capture and storage, and geothermalreservoir rocks (Li et al., 1995; Branets et al., 2009; Dezayeset al., 2007; Grant and Bixley, 2011; Hurst, 1993; Laughlin,1982) and their economic and sustainable production (Daviesand Davies, 2001; Dutton et al., 1991). They are also crucialfor hydrological studies (Huysmans et al., 2008; Todd andMays, 2005; Al Ajmi et al., 2013) and underground wastedisposal, including modelling of fluid flow and potential con-taminant spread.
Laboratory-based permeability measurements are com-monly performed on core plug samples from well core mate-rial. Gas-driven permeability measurements have the advan-tage of being quickly performed. They do not contaminatethe sample, and they do not affect for example clay-bearingsamples, which in the case of a fluid might swell and destroy
Published by Copernicus Publications on behalf of the European Geosciences Union.

2 C. M. Filomena: Assessing accuracy of gas-driven permeability measurements
the sample. A standard laboratory device for gas-drivenpermeability measurements is a Hassler cell (e.g. Thomas,1972), allowing permeability measurements of entire coreplug samples under steady-state gas flow. However, the reso-lution of permeability values measured (e.g. in a well coresection) strongly depends on the plug core sampling rate(Goggin, 1993).
During the last decades, non-destructive and cost-efficientminipermeametry (or probe permeametry) has become animportant analytic tool, providing fast and highly resolvingpermeability data for both laboratory and in situ outcrop ap-plications (Davis et al., 1994; Sharp Jr. et al., 1994; Gog-gin, 1988; Dutton and Willis, 1998; Goggin, 1993; Dreyeret al., 1990; Chandler et al., 1989; Hornung and Aigner,2002; Fossen et al., 2011; Rogiers et al., 2011; Iversen etal., 2003; Eijpe and Weber, 1971; Huysmans et al., 2008).Most probe permeameters apply a steady-state or unsteady-state gas injection (e.g. Hurst and Goggin, 1995) with gasflowing from the probe tip through the sample rock vol-ume. However, some devices also apply a vacuum, wherethe gas flows into the probe. Automated laboratory probepermeametry is commonly applied to core slab surfacesoriented perpendicular to sedimentary bedding, referred toas bedding-parallel permeability (Corbett and Jensen, 1992;Robertson and McPhee, 1990). The resulting permeabilitymaps are further enrolled in rock property analysis and reser-voir characterization (Halvorsen and Hurst, 1990; Robertsonand McPhee, 1990; Willis, 1998). Minipermeametry has thepotential to resolve bedding-, deformation- and diagenesis-dependent permeability heterogeneities in stratified sedimen-tary rocks at centimetre-scale (e.g. Huysmans et al., 2008).However, minipermeameter and Hassler-cell-derived perme-ability data are not directly comparable with one another.Meyer and Krause (2001) document almost constantly higherprobe-derived permeability values than those from Has-sler cell measurements. TinyPerm-derived permeabilities ob-tained from the the highly permeable Navajo Sandstone werefound to be 1.8 times higher than plug-derived permeabilityvalues (Fossen et al., 2011; Torabi and Fossen, 2009). Suther-land et al. (1993) discuss not only the advantages but alsolimitations of probe permeametry, emphasizing the need ofstandardized experimental conditions.
The combination of permeability data obtained from dif-ferent approaches (e.g. from a probe permeameter and a Has-sler cell) within one study therefore needs to be treated withcaution. Here, it is of crucial importance to be aware of thescaling of rock heterogeneities and possible discrepanciesbetween the measuring results. In this study, four air-drivenpermeameters are tested for comparability among each other.In order to assess the accuracy of different Hassler cell andminiperm devices, similarities as well as potential discrep-ancies are evaluated. Ultimately, research studies integratingdifferent permeameter devices (e.g. for field and laboratoryanalysis) shall benefit from a much higher accuracy by ap-
plying transfer functions for a standardization of permeame-ter measurements.
2 Samples, methods, and specifications
2.1 Sample material
For this study we used 51 cylindrical and bedding-parallelsandstone sample plugs of a standardized 1-inch (2.54 cm)diameter and 5 cm length. Prior to permeability measure-ments the sample plugs were oven-dried at 60◦C for 3 days,until a constant weight was reached. Permeability measure-ments were performed along the long axis of the core plugsto exclude orientation-related anisotropy effects. The data setpresented here (Table 1) covers a permeability range oversix orders of magnitude, from 10−2 to 103 mD. Sampleswith low and moderate permeabilities of 0.02 to 300 mDare derived from fluvial channel sandstones of the TriassicBuntsandstein (sample numbers 1–13 and 43–48) and Keu-per (sample numbers 14–38) of southern Germany. Highlypermeable samples (600 to> 2700 mD) have been selectedfrom two reservoir rocks: the Lower Cretaceous shallow ma-rine Bentheim sandstone (sample numbers 40–42), whichforms the host rock of a hydrocarbon reservoir in north-west Germany and the Netherlands (cf. Roll, 1972); and theLate Ordovician shallow marine Dibsiyah Formation (sam-ple number 39) of the Wajid Group in the Kingdom of SaudiArabia (Kellogg et al., 1986; Al Ajmi et al., 2013), which ispart of a regional mega-aquifer system (GTZ-DCO, 2007).The three Buntsandstein samples 49–51 also exhibit highpermeabilities of 800–1800 mD.
To provide an almost homogeneous sample material, onlyvery well to well-sorted, fine- to medium-grained, mas-sive sandstones were selected. Quartz is the dominant graintype with rounded to subrounded grains, followed by mi-nor amounts of feldspar (< 15 %). Some low-permeability(10−2–101 mD) Buntsandstein samples additionally contain1–6 % illite, and quartz and carbonate occur as cementingphases. The Keuper samples are mainly kaolinite-cemented,with a minor amount of carbonate cements. They mostly plotwithin the 101 mD permeability range. The remaining sam-ples with permeabilities of> 102 mD are essentially clay-free and are quartz- or carbonate-cemented (Bentheim sand-stone, Dibsiyah Formation, and some Buntsandstein sam-ples). However, it should be stated at this point that the pre-sented samples of the different formations/stratigraphies donot represent the full permeability range of the respective for-mation. In general, the samples have systematically been se-lected, independent of their stratigraphic position or origin,to cover a vast range of permeability magnitudes and to com-pare the different permeameter types properly.
Solid Earth, 5, 1–11, 2014 www.solid-earth.net/5/1/2014/
C. M. Filomena: Assessing accuracy of gas-driven permeability measurements 3
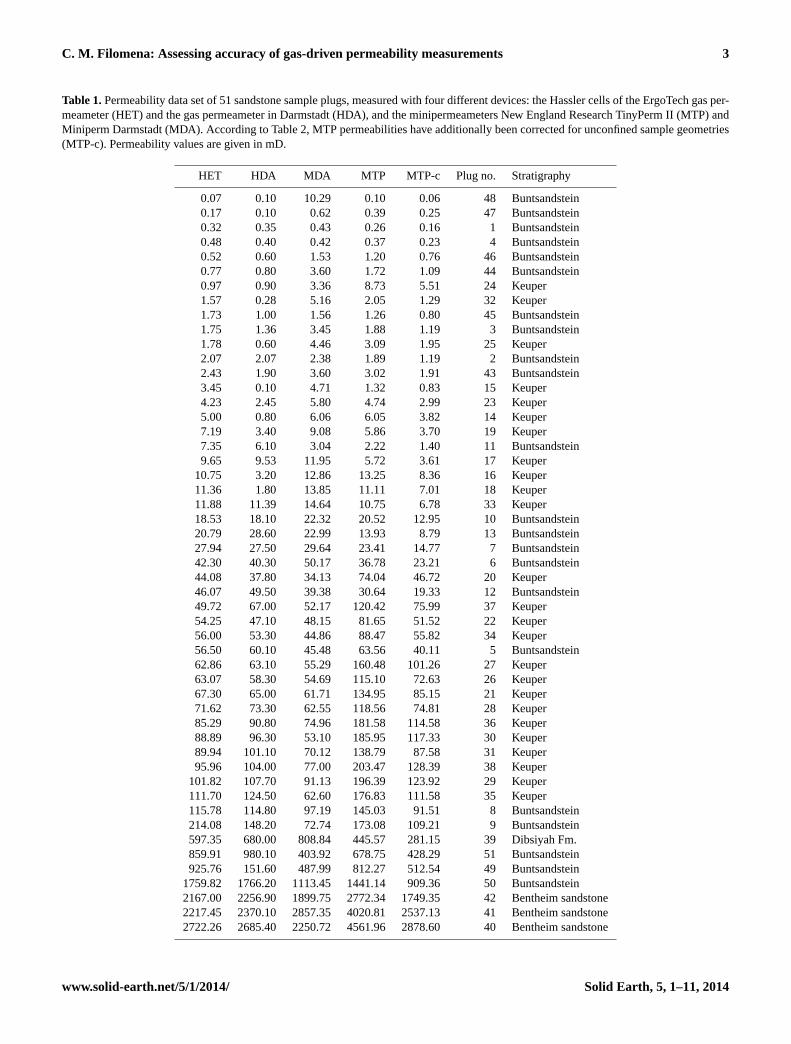
Table 1.Permeability data set of 51 sandstone sample plugs, measured with four different devices: the Hassler cells of the ErgoTech gas per-meameter (HET) and the gas permeameter in Darmstadt (HDA), and the minipermeameters New England Research TinyPerm II (MTP) andMiniperm Darmstadt (MDA). According to Table 2, MTP permeabilities have additionally been corrected for unconfined sample geometries(MTP-c). Permeability values are given in mD.
HET HDA MDA MTP MTP-c Plug no. Stratigraphy
0.07 0.10 10.29 0.10 0.06 48 Buntsandstein0.17 0.10 0.62 0.39 0.25 47 Buntsandstein0.32 0.35 0.43 0.26 0.16 1 Buntsandstein0.48 0.40 0.42 0.37 0.23 4 Buntsandstein0.52 0.60 1.53 1.20 0.76 46 Buntsandstein0.77 0.80 3.60 1.72 1.09 44 Buntsandstein0.97 0.90 3.36 8.73 5.51 24 Keuper1.57 0.28 5.16 2.05 1.29 32 Keuper1.73 1.00 1.56 1.26 0.80 45 Buntsandstein1.75 1.36 3.45 1.88 1.19 3 Buntsandstein1.78 0.60 4.46 3.09 1.95 25 Keuper2.07 2.07 2.38 1.89 1.19 2 Buntsandstein2.43 1.90 3.60 3.02 1.91 43 Buntsandstein3.45 0.10 4.71 1.32 0.83 15 Keuper4.23 2.45 5.80 4.74 2.99 23 Keuper5.00 0.80 6.06 6.05 3.82 14 Keuper7.19 3.40 9.08 5.86 3.70 19 Keuper7.35 6.10 3.04 2.22 1.40 11 Buntsandstein9.65 9.53 11.95 5.72 3.61 17 Keuper
10.75 3.20 12.86 13.25 8.36 16 Keuper11.36 1.80 13.85 11.11 7.01 18 Keuper11.88 11.39 14.64 10.75 6.78 33 Keuper18.53 18.10 22.32 20.52 12.95 10 Buntsandstein20.79 28.60 22.99 13.93 8.79 13 Buntsandstein27.94 27.50 29.64 23.41 14.77 7 Buntsandstein42.30 40.30 50.17 36.78 23.21 6 Buntsandstein44.08 37.80 34.13 74.04 46.72 20 Keuper46.07 49.50 39.38 30.64 19.33 12 Buntsandstein49.72 67.00 52.17 120.42 75.99 37 Keuper54.25 47.10 48.15 81.65 51.52 22 Keuper56.00 53.30 44.86 88.47 55.82 34 Keuper56.50 60.10 45.48 63.56 40.11 5 Buntsandstein62.86 63.10 55.29 160.48 101.26 27 Keuper63.07 58.30 54.69 115.10 72.63 26 Keuper67.30 65.00 61.71 134.95 85.15 21 Keuper71.62 73.30 62.55 118.56 74.81 28 Keuper85.29 90.80 74.96 181.58 114.58 36 Keuper88.89 96.30 53.10 185.95 117.33 30 Keuper89.94 101.10 70.12 138.79 87.58 31 Keuper95.96 104.00 77.00 203.47 128.39 38 Keuper
101.82 107.70 91.13 196.39 123.92 29 Keuper111.70 124.50 62.60 176.83 111.58 35 Keuper115.78 114.80 97.19 145.03 91.51 8 Buntsandstein214.08 148.20 72.74 173.08 109.21 9 Buntsandstein597.35 680.00 808.84 445.57 281.15 39 Dibsiyah Fm.859.91 980.10 403.92 678.75 428.29 51 Buntsandstein925.76 151.60 487.99 812.27 512.54 49 Buntsandstein
1759.82 1766.20 1113.45 1441.14 909.36 50 Buntsandstein2167.00 2256.90 1899.75 2772.34 1749.35 42 Bentheim sandstone2217.45 2370.10 2857.35 4020.81 2537.13 41 Bentheim sandstone2722.26 2685.40 2250.72 4561.96 2878.60 40 Bentheim sandstone
www.solid-earth.net/5/1/2014/ Solid Earth, 5, 1–11, 2014

4 C. M. Filomena: Assessing accuracy of gas-driven permeability measurements
2.2 Methods and devices
Four gas-driven permeameter devices using three differentconcepts for permeability determination have been comparedwithin this study:
(I) two Hassler cells (Fig. 1a),
(II) a minipermeameter (or probe permeameter) using airinjection (Fig. 1b),
(III) a vacuum probe permeameter (Fig. 1c).
2.2.1 Hassler cells
Darcy’s law describes the horizontal, laminar flow of afluid under steady-state conditions in porous media with theknown length and area of the sample. The permeability (K)according to Darcy’s law (Darcy, 1856) is given by
K = QηL/A1P, (1)
with
– K: permeability of the medium in m2 or mD,1 mD = 9.86923× 10⁻¹⁶ m2,
– Q: flow rate, discharge volume per second in m2 s−1,
– η: viscosity of the fluid in Pa× s,
– L: length of the sample in m,
– A: the cross-sectional area of the sample in m2,
– 1P : pressure difference between injection and outflowin Pa.
Gas slippage at low pressures or high-velocity flow effects,such as turbulence, however, are neglected by this equa-tion. Devices facilitating different pressure stages allow theKlinkenberg correction (Klinkenberg, 1941) and determina-tion of an intrinsic permeability. A minimum of three (bet-ter five) subsequent measurements at equal flow rates but atdifferent back-pressure steps and resulting differential pres-sures can be performed with Hassler cell devices. They aredesigned for uni-variant sample geometries, allowing a vari-able core plug length but demanding a constant sample diam-eter. Permeability measurements can only be applied in thelong-axis direction of the sample plug. Therefore, the sam-ple orientation is of basic importance, especially in hetero-geneous rocks, where reservoir qualities are constrained bythose sections with the lowest permeability.
The ErgoTech digital steady-state gas permeameter(Hassler-cellErgo Tech = HET) at the Geological Instituteof RWTH Aachen University is a laboratory-based instru-ment with an attached quick-action Hassler cell, hosting stan-dard rock plugs of 1-inch (2.54 cm) diameter and a length of7.6 cm maximum. The sample is sealed by a rubber sleeve
Fig. 1. Principles of permeability measurements on plug samples:(A) Hassler cell,(B) minipermeameter using air injection, and(C)minipermeameter applying a vacuum. Note the difference in rockvolume and flow trajectories in(A), (B), (C). Likewise, the differ-ence in rock volume needs to be taken into account when conduct-ing outcrop measurements = unconfined rock volume(D).
under a confining oil pressure of 50 bar. The operating gastemperature is measured with 0.1◦C accuracy. The HETis equipped with three mass flow meters of 20, 200, and2000 cm3 min−1 maximum. The applied back-pressure stepsin the HET comprise measurement against atmospheric pres-sure, 20, 25, 30, and 35 psi, resulting in a measuring range of0.01 mD to 10 D.
The gas permeameter at the Institute of Applied Geologyat the Technical University of Darmstadt combines a Hasslercell (Hassler-cellDarmstadt = HDA) with a minipermeame-ter (MDA) in one device. The HDA can be operated withHassler cells of different diameters at a sealing air pressureof 10 bar and with freely selectable back-pressure steps upto 6 bar. Flow rates are sensitive from 0.001 cm3 min−1 upto 2000 cm3 min−1, allowing the measurement of a 1 µD to6 D permeability range at 2.5 cm plug diameter. Measuringtime for medium to highly permeable samples is roughly 5to 10 min. This device can also be used to determine per-meability for different fluids and automatically corrects forviscosity and temperature effects.
Main components of both devices are a downstream con-troller in front of the Hassler cell, gas-flow monitors of dif-ferent ranges behind the Hassler cell, followed by an up-stream controller to realize back pressure. Pressure gradi-ent within the sample is metered by a differential pressuregauge directly at the upstream and downstream sample end-ings by additional non-percolated probes to avoid friction.These parameters are used as a direct input into the Darcyequation, together with temperature- and pressure-correctedair viscosities and volumes.
Solid Earth, 5, 1–11, 2014 www.solid-earth.net/5/1/2014/
C. M. Filomena: Assessing accuracy of gas-driven permeability measurements 5
2.2.2 Probe permeameter gas-flow geometry in rocksamples
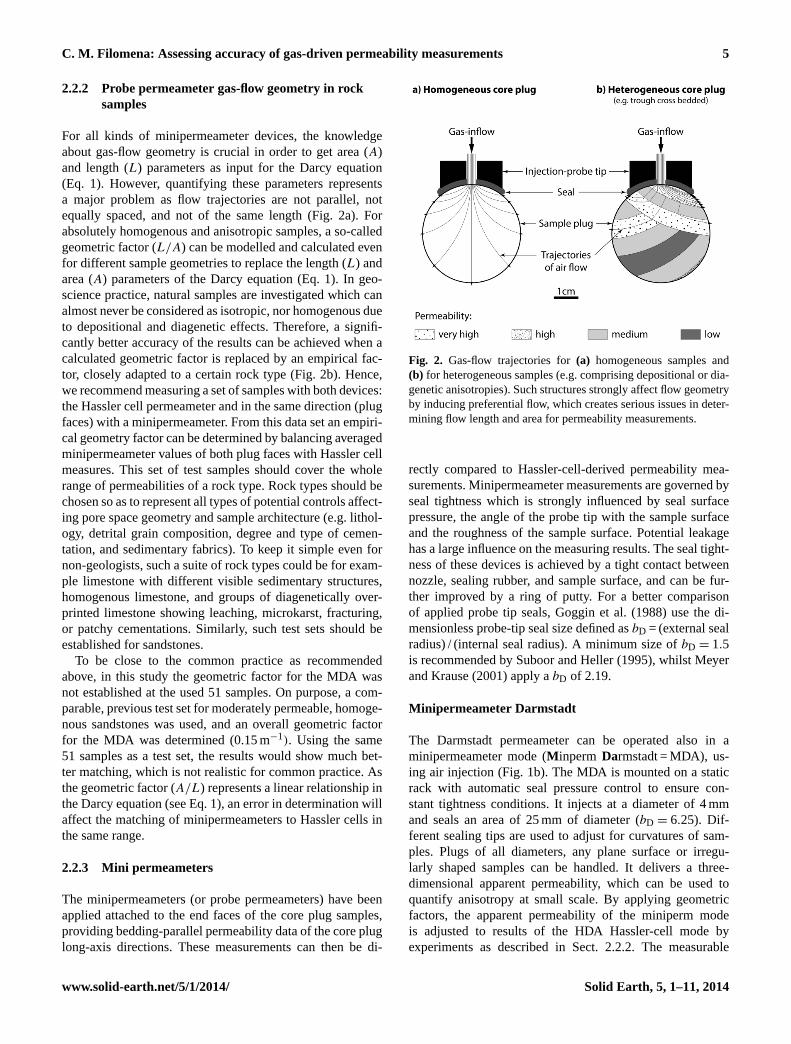
For all kinds of minipermeameter devices, the knowledgeabout gas-flow geometry is crucial in order to get area (A)and length (L) parameters as input for the Darcy equation(Eq. 1). However, quantifying these parameters representsa major problem as flow trajectories are not parallel, notequally spaced, and not of the same length (Fig. 2a). Forabsolutely homogenous and anisotropic samples, a so-calledgeometric factor (L/A) can be modelled and calculated evenfor different sample geometries to replace the length (L) andarea (A) parameters of the Darcy equation (Eq. 1). In geo-science practice, natural samples are investigated which canalmost never be considered as isotropic, nor homogenous dueto depositional and diagenetic effects. Therefore, a signifi-cantly better accuracy of the results can be achieved when acalculated geometric factor is replaced by an empirical fac-tor, closely adapted to a certain rock type (Fig. 2b). Hence,we recommend measuring a set of samples with both devices:the Hassler cell permeameter and in the same direction (plugfaces) with a minipermeameter. From this data set an empiri-cal geometry factor can be determined by balancing averagedminipermeameter values of both plug faces with Hassler cellmeasures. This set of test samples should cover the wholerange of permeabilities of a rock type. Rock types should bechosen so as to represent all types of potential controls affect-ing pore space geometry and sample architecture (e.g. lithol-ogy, detrital grain composition, degree and type of cemen-tation, and sedimentary fabrics). To keep it simple even fornon-geologists, such a suite of rock types could be for exam-ple limestone with different visible sedimentary structures,homogenous limestone, and groups of diagenetically over-printed limestone showing leaching, microkarst, fracturing,or patchy cementations. Similarly, such test sets should beestablished for sandstones.
To be close to the common practice as recommendedabove, in this study the geometric factor for the MDA wasnot established at the used 51 samples. On purpose, a com-parable, previous test set for moderately permeable, homoge-nous sandstones was used, and an overall geometric factorfor the MDA was determined (0.15 m−1). Using the same51 samples as a test set, the results would show much bet-ter matching, which is not realistic for common practice. Asthe geometric factor (A/L) represents a linear relationship inthe Darcy equation (see Eq. 1), an error in determination willaffect the matching of minipermeameters to Hassler cells inthe same range.
2.2.3 Mini permeameters
The minipermeameters (or probe permeameters) have beenapplied attached to the end faces of the core plug samples,providing bedding-parallel permeability data of the core pluglong-axis directions. These measurements can then be di-
Fig. 2. Gas-flow trajectories for(a) homogeneous samples and(b) for heterogeneous samples (e.g. comprising depositional or dia-genetic anisotropies). Such structures strongly affect flow geometryby inducing preferential flow, which creates serious issues in deter-mining flow length and area for permeability measurements.
rectly compared to Hassler-cell-derived permeability mea-surements. Minipermeameter measurements are governed byseal tightness which is strongly influenced by seal surfacepressure, the angle of the probe tip with the sample surfaceand the roughness of the sample surface. Potential leakagehas a large influence on the measuring results. The seal tight-ness of these devices is achieved by a tight contact betweennozzle, sealing rubber, and sample surface, and can be fur-ther improved by a ring of putty. For a better comparisonof applied probe tip seals, Goggin et al. (1988) use the di-mensionless probe-tip seal size defined asbD = (external sealradius) / (internal seal radius). A minimum size ofbD = 1.5is recommended by Suboor and Heller (1995), whilst Meyerand Krause (2001) apply abD of 2.19.
Minipermeameter Darmstadt
The Darmstadt permeameter can be operated also in aminipermeameter mode (M inperm Darmstadt = MDA), us-ing air injection (Fig. 1b). The MDA is mounted on a staticrack with automatic seal pressure control to ensure con-stant tightness conditions. It injects at a diameter of 4 mmand seals an area of 25 mm of diameter (bD = 6.25). Dif-ferent sealing tips are used to adjust for curvatures of sam-ples. Plugs of all diameters, any plane surface or irregu-larly shaped samples can be handled. It delivers a three-dimensional apparent permeability, which can be used toquantify anisotropy at small scale. By applying geometricfactors, the apparent permeability of the miniperm modeis adjusted to results of the HDA Hassler-cell mode byexperiments as described in Sect. 2.2.2. The measurable
www.solid-earth.net/5/1/2014/ Solid Earth, 5, 1–11, 2014

6 C. M. Filomena: Assessing accuracy of gas-driven permeability measurements
permeability range is almost identical to that of the HDA de-vice. A single measurement takes roughly 30 s for mediumto highly permeable samples, and for a complete 3-D survey12 single measurements are recommended.
The same sensors as in Hassler-cell operation mode areused, but as it releases gas into the atmosphere, no back pres-sure can be applied and all parameters have to be measuredin the upstream branch of the device. Parameter correctionsare applied identically to the Hassler-cell operation mode. Totest leakages of the tip seal or in the device, samples whichare considered to have no permeability are measured. In thiscase, an alloy plug in the same dimensions as a core plug wasused. The results were below the sensitivity of the sensors, sowe assume a complete technical tightness. We recommendsuch a test for any other device.
TinyPerm II probe permeameter
The minipermeameter “TinyPerm II” (M iniperm TinyPerm = MTP) of New England Research Inc. was appliedat the GeoZentrum Nordbayern, University of Erlangen-Nürnberg. It is a portable handheld air permeameter (Fig. 1c)which can be used in the laboratory or in the field directly onthe surface of sample plugs, well cores, hand specimens, andplane, cleaned outcrop walls. The MTP probe tip consists ofa 22 mm-sized rubber nozzle with an inlet diameter of 9 mm.To prevent leakage between probe tip and sample surface, thenozzle was additionally equipped with an impermeable ex-panded rubber ring of 9 mm inner diameter (inlet) and 27 mmouter diameter, providing a 9 mm-thick seal around the in-let. The application of this additional seal is highly recom-mended to optimize MTP measurements. As the expandedrubber is very flexible, it tightens the surface roughness ofthe sample, which prevents leaking and forces the air to tres-pass only the rock sample. Here, the probe-tip seal sizebDaccording to Goggin et al. (1988) isbD = 3.0. To providereproducible testing conditions and a uniform contact pres-sure during operation, the MTP device was mounted in anupright static position. The probe nozzle is pressed againstthe rock sample, and subsequently a vacuum is generated inthe inner part of the instrument. According to the manufac-turer (New England Research Inc.), a microcontroller moni-tors the volume of withdrawn air from the rock and the tran-sient vacuum. After the vacuum is dissipated, the microcon-troller computes a characteristic value according to the mea-sured parameters. This TinyPerm II value (T ) is provided af-ter the measurement of one sample and is linked to air per-meability (K) through Eq. (2) (according to the TinyPerm IIoperational manual):
T = −0.8206log10(K) + 12.8737, (2)
whereK is the permeability in millidarcys (mD).This equation needs to be applied to all values provided
by the MTP device after the measurement of one sample, tocalculate the correct permeability in millidarcys. Empirical
Fig. 3. Cross-plot of TinyPerm II value (T ) with needed measuringtime (t) in seconds. Note the asymptotic behaviour of the regressionline with increasing measuring time.
experiments show that the valueT also correlates with mea-suring time (Fig. 3).
The technical tightness of the MTP device was then testedwith a perfectly flat and polished solid aluminium block, sim-ulating a non-permeable sample. In the ideal case, the vac-uum should not dissipate when impermeable materials aremeasured. Over a measuring period of 4 h, the device in-dicates a slow decay of the vacuum. The extrapolation ofthis decay delivers a time span of 10 h and 9 min for the en-tire dissipation of the vacuum. Applying the correlation ofmeasuring time versus TinyPerm value (Fig. 3), a measur-ing time of 10 h and 9 min providesT = 14.08, which equalsan apparent permeability of the solid aluminium block of0.034 mD (calculated using Eq. 2). This technical tightnessdefines the lower measuring boundary of the TinyPerm II,limited to 0.034 mD. Since the TinyPerm II device was orig-inally designed for a handheld field application, the manu-facturer indicates a lower measuring boundary of approxi-mately 10 mD, which is equivalent to a measuring time ofabout 5 min (Fig. 3). Longer measuring times and therebylower permeabilities may only be realized in the laboratorywhere the device can be mounted on a static rack.
The application of different sample sizes additionally in-fluences minipermeameter measuring results. Flow paths insample plugs as illustrated in Figs. 1 and 2 may differfrom those in unconfined samples, such as outcrop walls.The TinyPerm II is the only tested instrument which wasoriginally designed for field application, used in severalfield studies before (e.g. Torabi and Fossen, 2009; Huys-mans et al., 2008). To detect potential discrepancies be-tween TinyPerm outcrop and plug sample measurements,unconfined outcrop measurements were simulated on four10 cm× 10 cm× 10 cm rock blocks, representing permeabil-ity orders of 100, 101, 102, and 103 mD. A 1-inch sampleplug was then drilled from the measuring point on the blockand measured again. As a result, TinyPerm measurements are34–41 % lower on unconfined samples than on plug samples,
Solid Earth, 5, 1–11, 2014 www.solid-earth.net/5/1/2014/

C. M. Filomena: Assessing accuracy of gas-driven permeability measurements 7
Table 2.Comparison of TinyPerm measurements (MTP) from four“unconfined” rock blocks (10× 10× 10 cm) and the corresponding1-inch sample plugs, representing permeability orders of 100, 101,102, and 103 mD. Measured permeabilities are 34–41 % lower onunconfined samples than on plug samples (mean:−36.9 %).
Block Plug Block(MTP) (MTP) vs. plug
Buntsandstein 4.6 7.2 −36 %Buntsandstein 803.2 1369 −41 %Keuper 60.8 92.6 −34 %Bentheim sandstone. 1285 1999 −36 %
Mean −36.9 %
with an average of∼ 37 % (Table 2). The effect of shorterflow trajectories and apparent higher permeabilities in plugsamples can be corrected by reducing MTP plug measure-ments by 37 %. We use this corrected TinyPerm permeability(MTP-c) to compare TinyPerm plug sample with Hassler cellmeasurements properly.
3 Comparison of Hassler cell and minipermeametermeasurements
When permeability measurements from different Hasslercells, different minipermeameters or a mixture of Hasslercell and minipermeameter measurements are integrated inone study, system-immanent discrepancies between the ap-plied devices should be taken into account and, where neces-sary, should be corrected. Therefore, transform equations forthe used devices need to be determined and applied for com-parison. All permeability measurements conducted with thefour devices used in this study are listed in Table 1 and plot-ted in Fig. 4. The results are then cross-plotted to visualizethe correlation of the different permeability devices and, ifnecessary, to receive transform equations for correction andstandardization (Figs. 5 and 6).
3.1 General trends of measuring results
The permeabilities of all 51 core plug samples have beenmeasured with each of the four permeameter devices andare plotted in Fig. 4 for comparison. General permeabil-ity trends and magnitudes, and the aberrations of the re-spective permeability devices are discussed. The most eye-catching aberrations are shown by uncorrected TinyPerm IImeasurements (MTP), which in the majority of cases deter-mine higher permeabilities than all other devices. Markedlyhigher values are recorded in 47 % (24 samples), similar val-ues in 37 % (19 samples), and slightly lower values in 18 %(9 samples) of the cases. TinyPerm measurements have thenbeen corrected for unconfined rock volumes as discussed inSect. 2.2.3 and presented in Tables 1 and 2. The Hassler cellin Darmstadt (HDA) shows pronounced lower permeabilities
Fig. 4. Permeability data derived from 51 core plug samples, mea-sured with four different air permeameters: the Hassler cells ofthe ErgoTech gas permeameter (HET, blue diamonds) and thegas permeameter in Darmstadt (HDA, yellow squares), and theminipermeameters Miniperm Darmstadt (MDA, yellow triangles)and TinyPerm II (MTP, crosses).
www.solid-earth.net/5/1/2014/ Solid Earth, 5, 1–11, 2014

8 C. M. Filomena: Assessing accuracy of gas-driven permeability measurements
Fig. 5. Comparison of different gas permeameters:(A) the Has-sler cell devices ErgoTech gas permeameter (HET) versus the gaspermeameter in Darmstadt (HDA), and(B) the minipermeametersMiniperm Darmstadt (MDA) versus TinyPerm II (MTP). The MTPvalues are corrected by−37 % (MTP-c) to compensate for reducedflow trajectories. The bisectrix (x = y) indicates positive or negativeaberrations of the measuring results, and the dashed line indicatesthe regression line of the resulting transform equations for standard-ization. Note the bi-logarithmic scales.
mostly limited to permeabilities of< 10 mD. Obviously mostaberrations, positive and negative, range on the same order ofmagnitude like the respective measuring results of the otherdevices.
3.2 Individual comparison of permeability devices
The combination of permeability values obtained from dif-ferent approaches requires a profound understanding of po-tential discrepancies between the applied devices. The in-dividual measurement results of all four permeameters arecross-plotted against each other (Figs. 5 and 6) to obtain par-ticular information on their systematic similarities and dis-crepancies.
3.2.1 Hassler cell measurements: HET versus HDA
The Hassler cells (HET and HDA) generate well-correlatedmeasuring results, with a coefficient of determination ofR2 = 0.959 (Fig. 5a). Most of the presented Hassler cell mea-surements are almost identical or very close to each other (36samples = 71 %), plotting near the bisectrix (solid line). Inmost cases, a one-to-one correlation between the two Hasslercells applies very well. However, major deviations have beenobserved in the measuring interval between 1 and 10 mD.Here, the HDA shows markedly lower values than the HET.The permeability values of seven samples deviate as muchas one order of magnitude. Minor aberrations are within thesame order of magnitude.
3.2.2 Minipermeameters: MDA versus MTP-c
The MDA vs. MTP-c cross-plot (Fig. 5b) indicates majoraberrations of the two minipermeameter devices from eachother. In the lower permeability range (< 40 mD), a promi-
Fig. 6. Comparison of Hassler cell versus minipermeameter mea-surements: ErgoTech gas permeameter (HET) versus TinyPerm II(MTP) (A) and Miniperm Darmstadt (MDA)(B), and the gas per-meameter in Darmstadt (HDA) versus TinyPerm II (MTP)(C) andMiniperm Darmstadt (MDA)(D). The MTP values are corrected by−37 % (MTP-c) to compensate for reduced flow trajectories. Thebisectrix (x = y) indicates positive or negative aberrations of themeasuring results, and the dashed line indicates the regression lineof the resulting transform equations for standardization. Note thebi-logarithmic scales. Outcrop and Hassler cell data from Fossen etal. (2011) are additionally shown in(A) (open diamonds, unmodi-fied MTP values).
nent offset identifies systematically higher MDA values, ap-proximately 2.4 times higher than TinyPerm measurements.However, at permeability values> 40 mD, MTP-c and MDAvalues are almost identical. A partial regression line can bedrawn separately for the lower section (< 40 mD) to correctMDA for MTP-c values, and vice versa. In both cases, thecoefficient of determinationR2 of MDA versus MTP is verygood, with 0.968 for the permeability range< 40 mD and0.972 for> 40 mD.
3.2.3 Hassler cell versus minipermeametermeasurements
Figure 6 compares Hassler cell measurements of the Er-goTech (HET) and the Darmstadt (HDA) devices withminipermeameter measurements of the TinyPerm II (MTP-c) and the Darmstadt device (MDA). Both minipermeame-ters show high coefficients of determination (R2) with theHassler cells of the HET device (R2 = 0.955 and 0.964; seeFig. 6a and b) and the HDA device (R2 = 0.924 and 0.939;see Fig. 6c and d). The corrected permeability measure-ments of the MTP (MTP-c) and the HET plot very close
Solid Earth, 5, 1–11, 2014 www.solid-earth.net/5/1/2014/

C. M. Filomena: Assessing accuracy of gas-driven permeability measurements 9
to the bisectrix (Fig. 6a, solid diamonds), showing a closematch of these two permeameters. However, between 1 and40 mD, rock-volume-corrected MTP measurements tend tobe slightly lower than HET data. TinyPerm outcrop andHassler cell data with permeabilities> 1 D from Fossen etal. (2011) are plotted for comparison (Fig. 6a, open dia-monds).
The MDA minipermeameter and the HET Hassler cell ex-hibit some minor aberrations (Fig. 6b). There, the best-fitline is rotated anticlockwise compared to the bisectrix. Be-low ∼ 40 mD, the MDA indicates higher permeabilities thanthe HET device. At∼ 40 mD however, a turn-around pointoccurs, above which the MDA tends to deliver mostly lowerpermeability values than the HET.
Cross-plots of the Darmstadt Hassler cell (HDA) with thetwo minipermeameters indicate high correlation at perme-ability magnitudes> 101 mD (R2 = 0.924 and 0.939), butthey show deviations at the permeability range< 10 mD(Fig. 6c and d). These aberrations are only minor in theHDA vs. MTP-c cross-plot (Fig. 6c) and are much more pro-nounced in the HDA–MDA cross-plot (Fig. 6d). However,this pronounced deviation may be the combined effect of aslight underestimation of permeability by the HDA deviceand an overestimation by the MDA minipermeameter at thesame time (as documented in Fig. 6b).
3.3 Discussion of measuring results
To enhance accuracy of different gas-driven permeabilitymeasurements, device-specific aberrations have been docu-mented from Hassler cell and minipermeameter measure-ments. Permeability over- and underestimations either byminipermeameters or Hassler cells may result from variablefactors.
Sealing quality and surface roughness play an importantrole in leak tightness of minipermeameters. Here, permeabil-ity overestimations of minipermeameter devices (Figs. 4 and6a–d) may be attributed to suboptimal probe tip sealing, es-pecially when sample surfaces are very rough (e.g. coarse-grained sandstones or irregular (non-sawed) surfaces). Dueto shorter flow trajectories and a reduced rock volume, theTinyPerm II device largely overestimates plug sample per-meabilities. Therefore it is proposed correcting them for un-confined rock volumes.
Permeability underestimations, however, require other ex-planations. Covering only a very limited surface, miniper-meameter measurements are susceptible to even small-scalerock heterogeneities. For instance, individual, stronger ce-mented parts may deliver lower permeabilities in punctualminipermeameter measurements. On the other hand, prefer-ential flow in Hassler-cell devices mainly contributes to theoverall permeability of the sample, whereas punctual prefer-ential flow in minipermeametry just contributes as only onehigher value among many lower (= “normal”) ones; there-fore the preferential flow is underrated when multiple mea-
surements are used to average a sample (e.g. MTP, MDA). Atechnical explanation for underestimation of minipermeame-ter versus Hassler recordings could be that a strong contactpressure of the minipermeameter probe may slightly forcethe sealing rubber towards the inner part of the probe tip.This would also narrow the inflow/outflow tube diameter toa certain degree. The effect of a reduced in- or outflow di-ameter then results in an apparent lower permeability. Thesetwo reasons may explain the documented underestimationsof minipermeameter measurements compared to the Hasslercell devices.
Hassler cell measurements provide a permeability valuewhich is integrated over a given rock volume. Individual andspatially limited sections of enhanced cementation withinthis rock volume affect bulk permeability only little, whereasthey have a much more pronounced effect on point measure-ments (Fig. 2b). Cross-plots further indicate that the HDAHassler cell tends to provide slightly lower permeability ata permeability range of< 10 mD compared to the other de-vices (Figs. 5a, 6c, 6d). This is due to the technical speci-fications of all kinds of ultra-low range gas-flow meters. Ingeneral they show a much higher pressure drop compared tomid- or high range sensors, which changes flow conditionsin the sample.
For better comparison and for merging permeability datasets which have been generated with different devices, per-meability measurements need to be standardized for one per-meameter type. The presented cross-plots show that perme-ability measurements from different devices correlate verywell, with coefficients of determination (R2) between 0.924and 0.972. Frequently, they are in good accordance with thebisectrix, indicating that the plotted data sets can roughly becorrelated one to one. However, the good correlation is notequally distributed across the entire range of permeabilities.These aberrations need to be considered when data sets gen-erated by variable measurement devices shall be merged.
One-to-one correlations can generally be applied for rock-volume-corrected TinyPerm II (MTP-c) and ErgoTech Has-sler cell (HET) measurements (see Fig. 6a). However, MTP-cvalues seem to be systematically lower between 1 and 40 mD.The additionally plotted data points of Fossen et al. (2011)indicate significantly higher TinyPerm values at the perme-ability range> 1 D. The explanation might be the effectof differently applied sealing rubber sizes, a lower contactpressure during outcrop measurement, or the higher surfaceroughness of natural outcrops compared to sawed rock sam-ples.
One-to-one correlations can be used only to a limited ex-tend when the HDA Hassler cell is combined with any otherof the devices considered in this study. Restrictions occurin the permeability interval of 1–10 mD, when using theHDA and HET Hassler cells (Fig. 5a), and at permeabilities< 10 mD, when the HDA is combined with the miniperme-ameter MDA (Fig. 6d). As discussed above, the HDA Hasslercell constantly provides lower permeabilities in this range.
www.solid-earth.net/5/1/2014/ Solid Earth, 5, 1–11, 2014

10 C. M. Filomena: Assessing accuracy of gas-driven permeability measurements
The standardization of MDA minipermeameter and HETHassler cell measurements requires a correction across theentire range of permeabilities, applying the respective trans-form equations outlined in Fig. 6b. The standardization ofMDA measurements for HET permeability follows the trans-form equation HET = 0.6096 MDA1.1282, where “MDA” de-scribes the permeability measured with the MDA device. Asa result, the corresponding HET permeability is obtained.Due to the rotation of the best-fit line (Fig. 6b), this transformbecomes more effective in very low permeability classes< 1 mD or at high permeabilities> 1000 mD, and can belargely neglected at a range of 10–100 mD.
In studies where the two minipermeameters MTP andMDA are applied, minor corrections are necessary to stan-dardize for one device. The cross-plot (Fig. 5b) illustratesa very good correlation, but at permeabilities< 40 mD theMTP versus MDA permeability measurements are displacedparallel to the bisectrix towards higher MDA values. There-fore, two different transforms need to be applied for stan-dardization of MTP or MDA measurements (Fig. 5b).
All presented cross-plots demonstrate that it is of crucialimportance to document major aberrations prior to the useof different permeameters within one study. A general rulefor how a specific device will compare to others cannot beestablished and has to be defined by empirical measurements.
The technique to establish empirical equations to makepermeability comparable among different devices can alsobe used to compare gas permeability to water-derived per-meabilities. Examples are given in Jaritz (1999) and Al Ajmiet al. (2013). As a common result intrinsic gas permeabilitiesare found to be 50 % higher than water permeabilities. Asan explanation gas-slippage effects at the rock interface weremade responsible.
4 Conclusions
Permeability data of reservoir rocks mainly derive from coreplug measurements using Hassler cell devices. On the otherhand, probe permeameters have the advantage of provid-ing closely spaced, non-destructive permeability data, whichare mostly suitable to gain 3-D permeability, estimates ofanisotropy effects, and heterogeneity.
In studies where both techniques are applied, it is ofparamount importance to guarantee comparability of the ob-tained data sets. This is particularly important if permeame-ters designed for outcrop application, like the TinyPerm IIdevice, shall be used for laboratory plug measurements. Inthis case, unconfined samples show on average 37 % lowerpermeabilities than plug samples.
Permeability measurements derived from four differentHassler cell and minipermeameter devices have been com-pared to document their correlation. As a result of perme-ability cross-plots, device-typical aberrations and transformequations are elaborated, which enable corrections for spe-
cific Hassler cell or probe permeameter data. The applicationof simple one-to-one correlations is highly critical, as aber-rations and trends may occur across the entire range of per-meabilities or may only be confined to certain permeabilityintervals.
Only in some cases, one-to-one correlations between dif-ferent permeameters can be applied to the entire range ofpermeability. Here, the Hassler cell of the ErgoTech gas per-meameter (HET) and the rock-volume-corrected values ofthe TinyPerm II minipermeameter (MTP-c) show the closestmatch (R2 = 0.955). The combination and standardization ofpermeability data derived from other devices, however, re-quires various corrections.
With this study we demonstrate that variable device-specific aberrations exist between different permeametertypes, and we show a methodology to integrate miniperme-ameter data better with the commonly more widely spacedand more interpolative core plug permeability derived fromHassler cell measurements. Hence, it is possible to benefitfrom the advantages of both concepts.
Acknowledgements.Peter Kukla is highly appreciated for provid-ing access to the ErgoTech gas permeameter of the GeologicalInstitute of RWTH Aachen University, Germany. We are gratefulfor the constructive comments of H. Fossen and a second, anony-mous reviewer, which substantially improved an earlier version ofthis manuscript.
Edited by: P. Papale
References
Al Ajmi, H., Hinderer, M., Hornung, J., Bassis, A., Keller, M.,Rausch, R., and Schüth, C.: Matrix versus fracture permeabil-ity in a regional sandstone aquifer (Wajid sandstone, SW SaudiArabia), Grundwasser, in press, 2013.
Branets, L. V., Ghai, S. S., Lyons, S. L., and Wu, X.-H.: Chal-lenges and technologies in reservoir modeling, Commun. Com-put. Phys., 6, 1–23, 2009.
Chandler, M. A., Goggin, D. J., and Lake, L. W.: A mechanicalfield permeameter for making rapid, non-destructive, permeabil-ity measurements, J. Sediment. Petrol., 59, 613–615, 1989.
Corbett, P. W. M. and Jensen, J. L.: Variation of reservoir statisticsaccording to sample spacing and measurement type for some in-tervals in the lower Brent Group, Log Analyst, 33, 22–41, 1992.
Darcy, H.: Les fontaines publiques de la ville Dijon, Dalmont, Paris,674 pp., 1856.
Davies, J. P. and Davies, D. K.: Stress-dependent permeability:characterization and modeling, SPE J., 6, 224–235, 2001.
Davis, J. M., Wilson, J. L., and Phillips, F. M.: A portable air-minipermeameter for rapid in situ field measurements, GroundWater, 32, 258–266, 1994.
Dezayes, C., Thinon, I., Courrioux, G., Tourlière, B., and Genter,A.: Estimation du potentiel géothermique des réservoirs clas-tiques du Trias dans le Fossé rhénan, Final report, BRGM/RP-55727-FR, 72, 2007.
Solid Earth, 5, 1–11, 2014 www.solid-earth.net/5/1/2014/

C. M. Filomena: Assessing accuracy of gas-driven permeability measurements 11
Dreyer, T., Scheie, A., and Jensen, J. L.: Minipermeameter-basedstudy of permeability trends in channel sand bodies, AAPG Bul-let., 74, 359–374, 1990.
Dutton, S. P. and Willis, B. J.: Comparison of outcrop and subsur-face sandstone permeability distribution, Lower Creataceous FallRiver Formation, South Dakota and Wyoming, J. Sediment. Res.,68, 890–900, 1998.
Dutton, S. P., Laubach, S. E., and Tye, R. S.: Depositional, dia-genetic, and structural controls on reservoir properties of low-permeability sandstone, Travis Peak Formation, East Texas, GulfCoast Assoc. Geol. Soc. T., 41, 209–220, 1991.
Eijpe, R. and Weber, K. J.: Mini-permeameters for consolidatedrock and unconsolidated sand, AAPG Bullet., 55, 307–309,1971.
Fossen, H., Schultz, R. A., and Torabi, A.: Conditions and impli-cations for compaction band formation in the Navajo Sandstone,Utah, J. Structur. Geol., 33, 1477–1490, 2011.
Goggin, D. J.: Geologically sensible modeling of the spatial distri-bution of permeability in eolian deposits: Page Sandstone (Juras-sic), northern Arizona, PhD, The University of Texas at Austin,417 pp., 1988.
Goggin, D. J.: Probe permeametry: is it worth the effort?, Mar.Petrol. Geol., 10, 299–308, 1993.
Goggin, D. J., Thrasher, R. L., and Lake, L. W.: A theoretical andexperimental analysis of minipermeameter response includinggas slippage and high velocity flow effects, In Situ, 12, 79–116,1988.
Grant, M. A. and Bixley, P. F.: Geothermal reservoir engineering,2nd Edn., Academic Press Elsevier Burlington, USA, 2011.
Halvorsen, C. and Hurst, A.: Principles, practice, and applicationsof laboratory minipermeametry, in: Advances in core evaluation:accuracy and precision in reserves estimation, edited by: Wor-thington, P. F., Gordon and Breach, London, 521–549, 1990.
Hornung, J. and Aigner, T.: Reservoir architecture in a terminal al-luvial plain: an outcrop analogue study (Upper Triassic, South-ern Germany). Part 1: Sedimentology and petrophysics, J. Petrol.Geol., 2, 3–30, 2002.
Hurst, A.: Sedimentary flow units in hydrocarbon reservoirs: someshortcomings and a case for high-resolution permeability data,in: The geological modelling of hydrocarbon reservoirs and out-crop analogues, edited by: Flint, S. S. and Bryant, I. D., Spe-cial Publications International Association of Sedimentologists,Blackwell Scientific Publications, 191–204, 1993.
Hurst, A. and Goggin, D. J.: Probe permeametry: An overview andbibliography, AAPG Bullet., 79, 463–473, 1995.
Huysmans, M., Peetersa, L., Moermansa, G., and Dassarguesa, A.:Relating small-scale sedimentary structures and permeability ina cross-bedded aquifer, J. Hydrol., 361, 41–51, 2008.
Iversen, B. V., Moldrup, P., Schjonning, P., and Jacobsen, O. H.:Field application of a portable air permeameter to characterizespatial variability in air and water permeability, Vadose Zone J.,2, 618–626, 2003.
Jaritz, R.: Quantifizierung der Heterogenität einer Sandstein-matrix (Mittlerer Keuper, Württemberg), Tübinger Geowis-senschaftliche Arbeiten (TGA), C48, 1–106, 1999.
Kellogg, K., Janjou, D., Minoux, L., and Fourniguet, J.: Explana-tory Notes to the Geologic Map of the Wadi Tathlith Quadrangle,Sheet 20 G, Kingdom of Saudi Arabia, Ministry of Petroleumand Mineral Ressources, Deputy Ministry of Mineral Resources,27 pp., 1986.
Klinkenberg, L. J.: The permeability of porous media to liquidsand gases, in: API Drilling and Production Practice, AmericanPetroleum Institute, New York, 200–213, 1941.
Laughlin, A. W.: Exploration for geothermal energy, in: Handbookof geothermal energy, edited by: Edwards, L. M., Chilingar, G.V., Rieke, H. H., and Fertl, W. H., Gulf Publishing company,Houston, 1982.
Li, D., Cullick, A. S., and Lake, L. W.: Global scale-up of reser-voir model permeability with local grid refinement, J. Petrol. Sci.Eng., 14, 1–13, 1995.
Meyer, R. and Krause, F. F.: A comparison of plug-derived andprobe-derived permeability in cross-bedded sandstones of theVirgelle Member, Alberta, Canada: The influence of flow direc-tions on probe permeametry, AAPG Bullet., 85, 477–489, 2001.
Robertson, G. M. and McPhee, C. A.: High-resolution probe per-meability: an aid to reservoir description, in: Advances in coreevaluation, volume 1: accuracy and precision in reserves estima-tion, edited by: Worthington, P. F., Gordon and Breach, London,495–520, 1990.
Rogiers, B., Beerten, K., Smeekens, T., and Mallants, D.: Air per-meability measurements on Neogene and Quaternary sedimentsfrom the Campine area: using outcrop analogues for determin-ing hydrodynamic aquifer properties, Belgian Nuclear ResearchCenter, Mol, BelgiumExternal Report SCKCEN-ER-177, 2011.
Roll, A.: Bramberge Field, Federal Republik of Germany: Case His-tories, in: Stratigraphic oil and gas fields – Classification, Ex-ploration Methods, and Case Histories, AAPG Special Volumes,286–296, 1972.
Sharp Jr., J. M., Fu, L., Cortez, P., and Wheeler, E.: An electronicminipermeameter for use in the field and laboratory, Ground Wa-ter, 32, 41–46, 1994.
Suboor, M. A. and Heller, J. P.: Minipermeameter characteristicscritical to its use, In Situ, 19, 225–248, 1995.
Sutherland, W. J., Halvorsen, C., Hurst, A., McPhee, C. A., Robert-son, G., Whattler, P. R., and Worthington, P. F.: Recommendedpractice for probe permeametry, Mar. Petrol. Geol., 10, 309–317,1993.
Thomas, R. D.: Effect of overburden pressure and water saturationon gas permeability of tight sandstone cores, J. Petrol. Technol.,24, 120–124, 1972.
Todd, D. K. and Mays, L. W.: Groundwater Hydrology, 3rd Edn.,Wiley, Hoboken, USA, 636 pp., 2005.
Torabi, A. and Fossen, H.: Spatial variation of microstructure andpetrophysical properties along deformation bands in reservoirsandstones, AAPG Bullet., 93, 919–938, 2009.
Willis, B. J.: Permeability structure of a compound valley fill in theCretaceous Fall River Formation of South Dakota, AAPG Bul-let., 82, 206–227, 1998.
www.solid-earth.net/5/1/2014/ Solid Earth, 5, 1–11, 2014