a protocol for assessing thematic map accuracy using … · ministry of forests forest science...
TRANSCRIPT
T E C H N I C A L R E P O R T 0 2 3
2 0 0 5
Ministry of Forests Forest Science Program
A Protocol for Assessing Thematic Map Accuracy Using Small-area Sampling

Ministry of Forests Forest Science Program
A Protocol for Assessing Thematic Map Accuracy Using Small-area Sampling
David Moon, Dugald Dunlop, Kim Iles, and Nona Phillips

The use of trade, firm, or corporation names in this publication is for the information andconvenience of the reader. Such use does not constitute an official endorsement orapproval by the Government of British Columbia of any product or service to the exclusionof any others that may also be suitable. Contents of this report are presented for discussionpurposes only. Funding assistance does not imply endorsement of any statements or informationcontained herein by the Government of British Columbia.
CitationMoon, D., D. Dunlop, K. Iles, and N. Phillips. 2005. A protocol for assessing thematicmap accuracy using small-area sampling. B.C. Min. For., Res. Br., Victoria, B.C. Tech.Rep. 023. <http://www.for.gov.bc.ca/hfd/pubs/Docs/Tr/Tr023.htm>
Prepared byDavid MoonCDT Core Decision Technologies Inc.Richmond, B.C.andDugald DunlopMeridian Mapping Ltd.Nanaimo, B.C.andKim IlesKim Iles and AssociatesNanaimo, B.C.andNona PhillipsNona Phillips Forestry ConsultingWilliams Lake B.C.
Prepared forB.C. Ministry of ForestsResearch BranchVictoria, B.C.
© 2005 Province of British Columbia
Copies of this report may be obtained, depending upon supply, from:Crown Publications521 Fort Street, Victoria, BC
(250) 386-4636http://www.crownpub.bc.ca
For more information on Forest Science Program publications, visit our Web site at:http://www.for.gov.bc.ca/hfd/pubs/index.htm.
Library and Archives Canada Cataloguing in Publication DataMain entry under title:A protocol for assessing thematic map accuracy using small-area sampling
(Technical report ; 023)
Includes bibliographical references: p. 0-7726-5345-3
1. Ecological mapping - Standards. 2. Biotic communities - Maps - Standards. I. Moon, D. (David), 1947- . II. British Columbia. Forest Science Program. III. Series: Technical report (British Columbia. Forest Science Program) ; 023.
541.5.2676 2005 577'.022'3 2005-960093-4
ABSTRACT
This paper presents a protocol for assessing the predictive accuracy of the-matic maps. Although developed during the Cariboo Predictive EcosystemMapping () pilot, the Canim Lake operational prototype, and theQuesnel to test the accuracy of predictive ecosystem maps, this protocolis applicable to many thematic maps. The Protocol for Accuracy Assessment ofEcosystem Maps (Meidinger 2003) incorporates many of the concepts pre-sented here, but recent work done on the Canim Lake and Quesnel ssuggests that a more detailed operational protocol is needed to ensure the integrity of the data collected. In addition to detailed instructions and speci-fications for data collection, this paper describes a staged sampling protocoldesigned to minimize the sampling cost required to attain a specified level ofconfidence in the assessed accuracy.
We recommend a sampling strategy that is independent of the final mappolygons delineated. The sample entity—a closed, three-side traverse, 500 mon a side—estimates the ability of a map to predict the thematic (e.g., site se-ries) composition of a small area. However, it does not estimate the accuracyof predicting the exact location of site series within the small area. A 60-mcorridor centred on the traverse is about 9 ha and estimates the ability of themap to predict the proportions of thematic units (e.g., site series) withinareas tens of hectares and larger. The accuracy of prediction for areas smallerthan tens of hectares will be lower.
This paper describes the following procedures:
1. A rationale for a small-area sampling protocol versus polygon sampling.2. Detailed field procedures for the collection of traverse data, which will be
the basis for estimating the composition of the small area sampled. 3. Methods for estimating measurement error, which can be used to esti-
mate the upper limit of accuracy possible.4. Calculations of percentage overlap as a measure of map accuracy.5. A staged sampling procedure to minimize the number of samples re-
quired to meet a specified confidence level.
This protocol is not meant to replace the Protocol for Accuracy Assessmentof Ecosystem Maps, but rather to provide more detailed procedures for thecollection of traverse data and the calculation of sample size. This protocol isdesigned for use in training and in the specification of contracts for accuracyassessment.
iii

ACKNOWLEDGEMENTS
The authors gratefully acknowledge the Cariboo Site Productivity Adjust-ment Working Group for their willingness to support unconventionalapproaches to and Accuracy Assessment. Without their support, thisprotocol would not have been developed. In particular we would like to ac-knowledge the contributions of: Charles von Hahn, Slocan Forest ProductsLtd., Quesnel, the original chair of the committee; Tracy Earle - Lignum Ltd.,Williams Lake for her support of the Cariboo Pilot; Al Hicks - Weld-wood of Canada Ltd., 100 Mile House and Lennart Holm - West Fraser MillsLtd., 100 Mile House for their support of the Canim Lake operationalpilot; and Earl Spielman - West Fraser Mills Ltd., Quesnel and Tim Harding- Riverside Forest Products Ltd., Williams Lake for their support of theQuesnel and their active support throughout the entire Cariboo Project.*
The authors would also like to acknowledge the contribution of Del Mei-dinger, Research Branch, Ministry of Forests without whose critical review,support, and encouragement, this protocol would not have been published.
iv
* The affiliations listed are those at the time of their involvement.
TABLE OF CONTENTS
v
Abstract . . . . . . . . . . . . . . . . . . . . . . . . . . . . . . . . . . . . . . . . . . . . . . . . . . . . . . iii
Acknowledgements . . . . . . . . . . . . . . . . . . . . . . . . . . . . . . . . . . . . . . . . . . . . . iv
1 Introduction. . . . . . . . . . . . . . . . . . . . . . . . . . . . . . . . . . . . . . . . . . . . . . . . 11.1 Background . . . . . . . . . . . . . . . . . . . . . . . . . . . . . . . . . . . . . . . . . . . . . 11.2 How to Use This Document . . . . . . . . . . . . . . . . . . . . . . . . . . . . . . . . 21.3 Rationale for Small-area Sampling. . . . . . . . . . . . . . . . . . . . . . . . . . . 2
2 Sample Design . . . . . . . . . . . . . . . . . . . . . . . . . . . . . . . . . . . . . . . . . . . . . . 32.1 Sampling Entity . . . . . . . . . . . . . . . . . . . . . . . . . . . . . . . . . . . . . . . . . . 32.2 Staged Sampling. . . . . . . . . . . . . . . . . . . . . . . . . . . . . . . . . . . . . . . . . . 42.3 Sample Design . . . . . . . . . . . . . . . . . . . . . . . . . . . . . . . . . . . . . . . . . . . 52.4 Measurement Error . . . . . . . . . . . . . . . . . . . . . . . . . . . . . . . . . . . . . . . 5
2.4.1 Kinds of measurement error . . . . . . . . . . . . . . . . . . . . . . . . . . . 52.4.2 Sampling to estimate measurement error . . . . . . . . . . . . . . . . 6
3 Field Procedures . . . . . . . . . . . . . . . . . . . . . . . . . . . . . . . . . . . . . . . . . . . . 63.1 General Procedures . . . . . . . . . . . . . . . . . . . . . . . . . . . . . . . . . . . . . . . 6
3.1.1 Suggested office preparation: traverse package . . . . . . . . . . . . 83.1.2 Starting out: steps to review before beginning the traverse . . 83.1.3 Compassing. . . . . . . . . . . . . . . . . . . . . . . . . . . . . . . . . . . . . . . . . 93.1.4 data collection . . . . . . . . . . . . . . . . . . . . . . . . . . . . . . . . . . 93.1.5 Field location: access notes . . . . . . . . . . . . . . . . . . . . . . . . . . . . 10
3.2 Conducting the Traverse. . . . . . . . . . . . . . . . . . . . . . . . . . . . . . . . . . . 113.2.1 Establishing the traverse. . . . . . . . . . . . . . . . . . . . . . . . . . . . . . . 113.2.2 Collecting the data . . . . . . . . . . . . . . . . . . . . . . . . . . . . . . . . . . . 123.2.3 Example traverse. . . . . . . . . . . . . . . . . . . . . . . . . . . . . . . . . . . . . 143.2.4 Reminders during execution of the traverses. . . . . . . . . . . . . . 163.2.5 Inaccessible samples . . . . . . . . . . . . . . . . . . . . . . . . . . . . . . . . . . 17
3.3 Post Fieldwork . . . . . . . . . . . . . . . . . . . . . . . . . . . . . . . . . . . . . . . . . . . 173.3.1 data processing . . . . . . . . . . . . . . . . . . . . . . . . . . . . . . . . . . 17
3.4 Data Deliverables . . . . . . . . . . . . . . . . . . . . . . . . . . . . . . . . . . . . . 18
4 Data Preparation . . . . . . . . . . . . . . . . . . . . . . . . . . . . . . . . . . . . . . . . . . . . 184.1 Spatial Database of Traverses . . . . . . . . . . . . . . . . . . . . . . . . . . . . . . . 184.2 Small-area Creation . . . . . . . . . . . . . . . . . . . . . . . . . . . . . . . . . . . . . . . 19
5 Data Analysis . . . . . . . . . . . . . . . . . . . . . . . . . . . . . . . . . . . . . . . . . . . . . . . 205.1 Calculation of Percentage Agreement Overlap . . . . . . . . . . . . . . . . . 205.2 Measurement Error . . . . . . . . . . . . . . . . . . . . . . . . . . . . . . . . . . . . . . . 215.3 Determining Required Sample Size . . . . . . . . . . . . . . . . . . . . . . . . . . 21
5.3.1 Sample size for percentage overlap . . . . . . . . . . . . . . . . . . . . . . 215.3.2 Additional sampling . . . . . . . . . . . . . . . . . . . . . . . . . . . . . . . . . . 23
6 Reporting . . . . . . . . . . . . . . . . . . . . . . . . . . . . . . . . . . . . . . . . . . . . . . . . . . 24
References . . . . . . . . . . . . . . . . . . . . . . . . . . . . . . . . . . . . . . . . . . . . . . . . . . . . 31
1 Ecology data field cards . . . . . . . . . . . . . . . . . . . . . . . . . . . . . . . . . . . . . . . 25
2 Non-completion form . . . . . . . . . . . . . . . . . . . . . . . . . . . . . . . . . . . . . . . . 30
vi
1 Classification overlap between map prediction and traverse observation . . . . . . . . . . . . . . . . . . . . . . . . . . . . . . . . . . . . . . . . . . . . . . . . . 21
2 Classification overlap using primary and secondary calls between ecologists . . . . . . . . . . . . . . . . . . . . . . . . . . . . . . . . . . . . . . . . . . . 21
1 Sample entity, a closed traverse. . . . . . . . . . . . . . . . . . . . . . . . . . . . . . . . . 4
2 Traverse Notes data format . . . . . . . . . . . . . . . . . . . . . . . . . . . . . . . . . . . . 7
3 Buffer around traverse to create a 60-m corridor . . . . . . . . . . . . . . . . . . 19
4 Map corridor clipped from the thematic map. . . . . . . . . . . . . . . . . . . . . 20
A1.1 Ecology data field cards . . . . . . . . . . . . . . . . . . . . . . . . . . . . . . . . . . . . . 25

1 INTRODUCTION
This document presents a detailed protocol for determining the predictiveaccuracy of a thematic (e.g., ecosystems) map. The protocol described in thispaper is fully compatible with the current Ministry of Forests () Protocolfor Accuracy Assessment of Ecosystem Maps (Meidinger 2003) and potentiallyoffers a more cost-effective approach to accuracy assessment. It has threeprincipal advantages: (1) sampling is staged to minimize sampling beyondthat required to attain a required level of confidence, (2) sampling can beconducted concurrent with mapping, and (3) the sampling design accom-modates compound/complex mapping units and imprecise boundaries.
The protocol estimates the ability of a map to predict the thematic com-position of arbitrarily, systematically, or randomly chosen areas rather thanpolygons. Based in part on an average sightline of about 30 m, the samplecorridors are about 9 ha and the results can be used to estimate the accuracyof prediction for areas in the tens of hectares and larger. Examples includeforest cover polygons, proposed cutblocks, proposed reserve areas, or exist-ing ecosystem maps. The analytical procedures conform to thoserecommended by the protocol.
The provincial Protocol for Accuracy Assessment of Ecosystem Maps provides awell documented and tested polygon-based method for determining the av-erage predictive accuracy of map polygons and of a map area as a whole. Theprotocol recommended traverse-based sampling methods, developed by theCariboo Predictive Ecosystem Mapping () pilot and the Canim Lake (Moon 2002, 2003), as an alternative to point sampling.
Traverse-based sampling was easily incorporated into the existing proto-col if traverses were located within randomly selected polygons. However,the sampling designs used in the Cariboo pilot and the Canim Lake were developed to sample randomly located small areas rather than existingpolygons, and the traverses generally crossed multiple map polygons. Thispolygon-independent protocol, termed small-area sampling, is accepted bythe for determining base-case eligibility in a Timber Supply Review.
As part of its evaluation of small-area testing for use in base-case determi-nation, the requested that the Canim Lake evaluate the small-area(polygon-independent) sample design method to determine the accuracy ofspecific polygons. This evaluation indicated that small-area sampling was effective for determining the utility of a polygon map for predicting theecosystem composition of arbitrarily defined small areas or of the map as awhole (Moon 2003). However, it was ineffective at determining the accuracyof specific individual polygons (Moon 2003). This was largely due to highwithin-polygon variability, unequal sample sizes within polygons, and un-equal sample numbers for the polygons traversed. Small-area sampling hasnow been approved for base-case acceptance in Timber Supply Review, butshould not be used for determining the accuracy of specific map polygons.
1.1 Background

This document describes the complete process for carrying out an accuracyassessment project.
Section 1 provides a brief background to and the rationale for small-areasampling.
Section 2 describes the sample entity, staged sampling procedure, andsample designs. The section also discusses the critical issue of measurementerror, including types of measurement error and sampling to determinemeasurement error.
Section 3 outlines, in detail, the main activities required to conduct thetraverse. It describes procedures for the location and establishment of sampletraverses, their execution, and detailed instructions for the recording of thetraverse notes. Details of the Ecology field cards are reviewed in Appendix 1.Procedures for inaccessible samples are also in Section 3.
Section 4 describes data preparation, including the incorporation of thetraverses into the spatial database, the generation of the small-area polygons,and the extraction of map estimates of the proportion of site series in thesmall-area polygons.
Section 5 describes the analytical procedures, including calculation of per-centage overlap, determination of measurement error, and determination ofthe sample size required to meet a specified level of confidence.
The intent of this document is to provide adequate detail to support theimplementation of the contract specifications for an accuracy assessmentproject. Examples and detailed explanations were designed to ensure the usability of this protocol as a reference tool.
Notwithstanding the historical debate between continuum and communityecologists, most thematic maps (including soil, bioterrain, ecosystem, andforest cover/Vegetation Resource Inventory [] maps) depict arbitrarypartitioning of land into areas of more or less homogeneous conditions. Inmost cases, the boundaries are imprecisely and (or) subjectively located.Boundaries may be drawn in areas of rapid change and will be relatively dis-crete or they may be drawn at an inferred point in a continuum of changethat is of interpretive importance. At traditional scales of mapping (1: 15 000and smaller), it is frequently impossible to delineate areas composed of a single mapping class (e.g., site series), and mixtures of mapping classes aredelineated. In these cases, the boundary is largely arbitrary and based eitheron a dominance of one mapping class over another or a change in the sub-dominant mapping class occurring in the area being delineated. In eithercase, the location of the boundary is largely subjective and difficult to con-firm in the field. The sampling of polygons, especially small polygons whosemap boundaries are largely subjective and imprecise, is therefore problemat-ic without precise geo-positioning in the field.
A significant body of literature focuses on determining the reliability ofthematic/polygon maps (Steers and Hajek 1979; Forbes et al. 1985; Wilding1985; Moon et al. 1987; Nikiforuk et al. 1993). This literature recognizes theproblem of boundaries arbitrarily dividing continua and the difficulty of de-termining the exact location of a boundary when sampling. Some authorshave recommended excluding boundaries from the sample because proper-ties will be transitional near the boundaries. Forbes et al. (1985) suggested a2-mm (map distance) exclusion buffer around all boundaries to ensure rep-resentative sampling of the polygons. For a typical ecosystem or forest cover
1.3 Rationale forSmall-area Sampling
1.2 How to Use ThisDocument

map at a scale of 1:20 000, the buffer would exclude 40% or more of the areafrom sampling. The authors of this protocol do not support the exclusion ofpolygon boundary buffers from sampling.
Polygon-based maps generated from continuous surface data (interpolat-ed from point data), such as digital elevation models and climate maps, areequally prone to imprecise boundaries because the resolution of the pointdata and the interpolative methods used influence the surface model pro-duced.
The small-area sampling protocol was developed to address these funda-mental characteristics of thematic maps by estimating the ability of a map to predict the thematic composition of any arbitrarily chosen area tens ofhectares or larger.
2 SAMPLE DESIGN
Samples consist of randomly located, closed traverses. The ground surveywill be conducted without the benefit of the site series polygon line work.
This protocol recommends equilateral triangles of 500 m per side. Thetraverse can usually be completed in 1 day. The closed traverse has two ad-vantages: (1) the traverse returns field staff to the point of commencementand therefore minimizes travel time; and (2) the equilateral triangle samplesa relatively small area. A 60-m corridor using the triangle’s sides as the cen-treline is about 9 ha. The choice of a 1500-m closed traverse was based on the following consideration. Map accuracy is evaluated by comparing theproportional length of site series on the traverse to the proportional area predicted by the map for a traverse-centred 60-m corridor. The longer thetraverse, the less spatially explicit and less applicable to small-area planningwill be the results. The choice of a 60-m corridor was based on empirical observation of frequent 30-m or greater discrepancies between Terrain Re-source Information Management ()–determined geo-references andGlobal Positioning System ()–determined geo-references, and on an average sightline of about 30 m.
Figure 1 illustrates a sample entity. Stations depicted by black squaresidentify changes in site series. The traverse is executed clockwise from thePoint of Commencement (). At the first change in site series, read-ings are taken and recorded as Station () 1. The segment from the toStation 1 is described on a Site Series Segment Data Card as Segment 1. coordinates at the end of the first segment will be recorded on the Site SeriesSegment Data Card representing segment 1 and a point entered and labelledin the traverse notes. The segment number will always correspond to the sta-tion number at the end of the segment. Each change in site series along thetraverse is similarly identified and recorded. The attributes recorded for thesegment are discussed in detail later in this paper. Note that the station num-bers correspond to the segment number preceding the Station and that thevertices are not recorded as Stations unless they correspond to a change insite series. The , Corners, and Point of Termination () are recordedas Transect Delineation Points (s) rather than stations unless they marka change in a site series. Detailed coding and recording instructions are pre-sented in Section 3, “Field Procedures.”
2.1 Sampling Entity

An important feature of this protocol is that sampling is staged so that sam-pling can be stopped when the desired level of statistical confidence has beenachieved. The purpose of stage one is to determine the minimum sample sizethat achieves the desired level of confidence. The estimate of minimum sam-ple size is then used to select sample locations for stage 2 sampling. If stage 2sampling does not achieve the desired confidence levels, then a third stagecan be conducted.
The number of samples required to achieve a specified level of confidencewill depend on the variability in the project area’s population. If samplingerror is unknown, an initial estimate can be obtained from about 20 samples.Analyzing after 20 samples has two advantages: (1) it will trap any proceduralerrors in the conduct of the traverses, and (2) it will reasonably estimate thenumber of samples required to achieve the desired level of confidence. Thiswill ensure that stage 2 sampling is not seriously excessive.
Sample locations for each stage must be randomly selected from the entireeligible sampling area. For example, if stage 1 consists of 20 traverses, the 20traverses must be chosen randomly from the entire eligible sampling area. Ifstage 1 suggests an additional 30 traverses, these must also be sampled ran-domly from the entire eligible sampling area. Once the required number oftraverses for a stage has been selected, the traverses may be sampled in anyorder to facilitate logistics and access but the entire set must be sampled. Al-ternatively, if sampling with replacement, sampling may be discontinued assoon as the required level of confidence is attained if the traverses are execut-ed in the order of their initial selection. If you choose this option, be sure torecord the sample identification and the order of sample selection at the timeof selection. There will be a trade-off between logistic efficiency and the pos-sibility of oversampling.
2.2 Staged Sampling
Sample entity, a closed traverse.
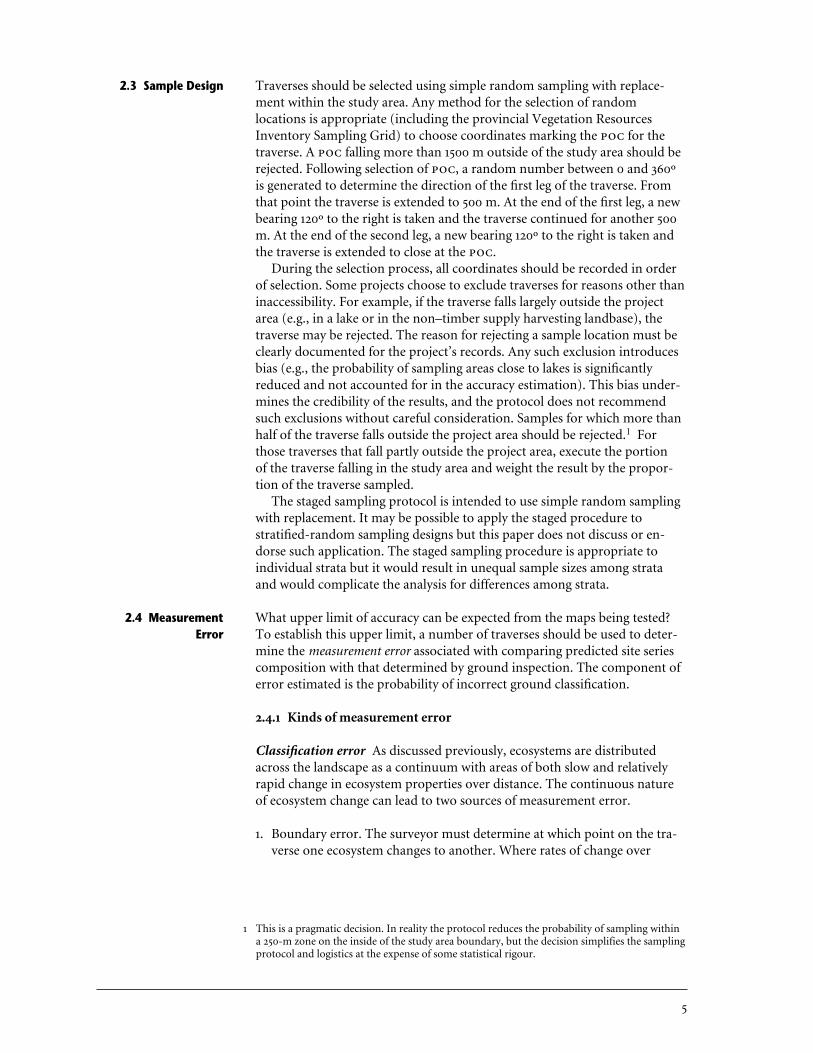
Traverses should be selected using simple random sampling with replace-ment within the study area. Any method for the selection of randomlocations is appropriate (including the provincial Vegetation Resources Inventory Sampling Grid) to choose coordinates marking the for thetraverse. A falling more than 1500 m outside of the study area should berejected. Following selection of , a random number between 0 and 360ºis generated to determine the direction of the first leg of the traverse. Fromthat point the traverse is extended to 500 m. At the end of the first leg, a newbearing 120º to the right is taken and the traverse continued for another 500m. At the end of the second leg, a new bearing 120º to the right is taken andthe traverse is extended to close at the .
During the selection process, all coordinates should be recorded in orderof selection. Some projects choose to exclude traverses for reasons other thaninaccessibility. For example, if the traverse falls largely outside the projectarea (e.g., in a lake or in the non–timber supply harvesting landbase), the traverse may be rejected. The reason for rejecting a sample location must beclearly documented for the project’s records. Any such exclusion introducesbias (e.g., the probability of sampling areas close to lakes is significantly reduced and not accounted for in the accuracy estimation). This bias under-mines the credibility of the results, and the protocol does not recommendsuch exclusions without careful consideration. Samples for which more thanhalf of the traverse falls outside the project area should be rejected.1 Forthose traverses that fall partly outside the project area, execute the portion of the traverse falling in the study area and weight the result by the propor-tion of the traverse sampled.
The staged sampling protocol is intended to use simple random samplingwith replacement. It may be possible to apply the staged procedure tostratified-random sampling designs but this paper does not discuss or en-dorse such application. The staged sampling procedure is appropriate toindividual strata but it would result in unequal sample sizes among strataand would complicate the analysis for differences among strata.
What upper limit of accuracy can be expected from the maps being tested?To establish this upper limit, a number of traverses should be used to deter-mine the measurement error associated with comparing predicted site seriescomposition with that determined by ground inspection. The component oferror estimated is the probability of incorrect ground classification.
2.4.1 Kinds of measurement error
Classification error As discussed previously, ecosystems are distributedacross the landscape as a continuum with areas of both slow and relativelyrapid change in ecosystem properties over distance. The continuous natureof ecosystem change can lead to two sources of measurement error.
1. Boundary error. The surveyor must determine at which point on the tra-verse one ecosystem changes to another. Where rates of change over
2.4 MeasurementError
2.3 Sample Design
1 This is a pragmatic decision. In reality the protocol reduces the probability of sampling withina 250-m zone on the inside of the study area boundary, but the decision simplifies the samplingprotocol and logistics at the expense of some statistical rigour.

distance are high, measurement error will be relatively low; where rates ofchange are low, measurement error will be higher.
2. Classification error. In any classification, some members of the class willbe more similar to some members of another class than to most membersof their own class. This is because ecosystems are defined by comparisonto a central concept of the class and members of a class will vary in the de-gree to which they approximate the central concept. Members at theoutside limit of their class will be much more similar to members at theoutside limit of an adjacent class than to their central concept. The fuzzynature of the multivariate class boundaries is another source of measure-ment error.
True location error Another source of error is error in determining the ac-tual position of the surveyor on the ground. technology has reducedlocation error significantly but less than ideal conditions can make read-ings problematic (Geographic Data BC 2001). Empirical evidence in theCariboo suggests that, even under ideal conditions, discrepancies of atleast 30 m between base map locations and -determined locationsshould be expected. Discrepancies between stream features and readings can be much larger.
2.4.2 Sampling to estimate measurement error Sampling to estimate mea-surement error involves multiple ecologists independently classifying thesame traverses. The ecologists should independently use the traverse proto-col described in Section 3 to classify the same randomly chosen subset oftraverses. Ideally, the regional ecologist responsible for ecosystem correlationshould be one of the classifiers.
To ensure that the ecologists traverse the same ground, the first ecologistto conduct a traverse should flag the traverse so that it can be relocated.However, stations should not be flagged. This will ensure that the subsequentecologists have no knowledge of the stations or classes recorded by the previ-ous ecologists.
Analysis of the traverse data for percentage overlap will follow the sameprocedures and use the same criteria as applied to testing the accuracy of themap.
3 FIELD PROCEDURES
The importance of rigorous data collection and recording procedures can-not be overestimated. Ambiguities in classification, sequence of site series, distances, offsets, or illegible or missing fields can make it difficult if not impossible to use traverse data for accuracy assessment. At $2500 and moreper traverse, legible, complete, unambiguous, and accurate data are essential.The procedures should be followed carefully and completely to ensure theintegrity of the data collected.
There are potential problems with entering hand traverse–style data into a flat file such as Excel because station- (point-) related data such as UniversalTransverse Mercator () coordinates are being combined with segment-(line-) related data such as bearing, distance, and site series on the same line
3.1 GeneralProcedures

in the spreadsheet. To minimize ambiguity, to streamline data compilationand analysis, and to provide a degree of redundancy for use in data integritychecking, two sets of data will be recorded:
1. Traverse data (azimuth, slope distance, % slope, and site series segmentnumber between traverse points), and total slope distance and commentsat traverse points.
2. Ecology data describing the site series segments between stations.
Traverse notes record the sequence of azimuths and distances followedduring the traverse. These data can be used to reconstruct the traverse fromcompass bearings and chain distances. Site Series Segment Data Cards recordinformation about the site series found between stations and record the coordinates of the station terminating the site series segment. Traverse notesmust be synchronized with the Site Series Segment Data Cards.
Section 3.2.3, and Figure 2 illustrate the traverse and Traverse Notes Card.The text of this section leads the reader through the first “leg” of a traverse.Appendix 1 contains an example of the two cards to be completed by theteam’s ecologist, including a full explanation of the fields.
Crews should familiarize themselves with the relevant sections of this pro-tocol before proceeding into the field.
Traverse Notes data format.
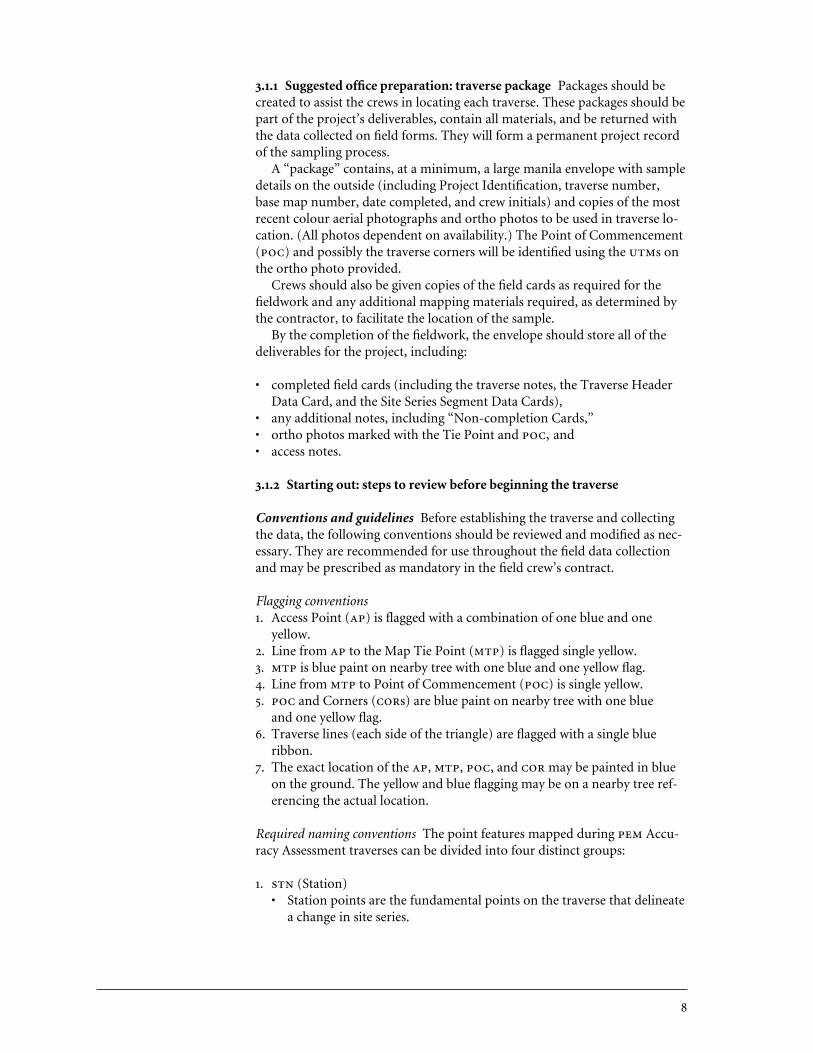
3.1.1 Suggested office preparation: traverse package Packages should becreated to assist the crews in locating each traverse. These packages should bepart of the project’s deliverables, contain all materials, and be returned withthe data collected on field forms. They will form a permanent project recordof the sampling process.
A “package” contains, at a minimum, a large manila envelope with sampledetails on the outside (including Project Identification, traverse number,base map number, date completed, and crew initials) and copies of the mostrecent colour aerial photographs and ortho photos to be used in traverse lo-cation. (All photos dependent on availability.) The Point of Commencement() and possibly the traverse corners will be identified using the s onthe ortho photo provided.
Crews should also be given copies of the field cards as required for thefieldwork and any additional mapping materials required, as determined bythe contractor, to facilitate the location of the sample.
By the completion of the fieldwork, the envelope should store all of thedeliverables for the project, including:
• completed field cards (including the traverse notes, the Traverse HeaderData Card, and the Site Series Segment Data Cards),
• any additional notes, including “Non-completion Cards,”• ortho photos marked with the Tie Point and , and• access notes.
3.1.2 Starting out: steps to review before beginning the traverse
Conventions and guidelines Before establishing the traverse and collectingthe data, the following conventions should be reviewed and modified as nec-essary. They are recommended for use throughout the field data collectionand may be prescribed as mandatory in the field crew’s contract.
Flagging conventions1. Access Point () is flagged with a combination of one blue and one
yellow.2. Line from to the Map Tie Point () is flagged single yellow.3. is blue paint on nearby tree with one blue and one yellow flag.4. Line from to Point of Commencement () is single yellow.5. and Corners (s) are blue paint on nearby tree with one blue
and one yellow flag.6. Traverse lines (each side of the triangle) are flagged with a single blue
ribbon.7. The exact location of the , , , and may be painted in blue
on the ground. The yellow and blue flagging may be on a nearby tree ref-erencing the actual location.
Required naming conventions The point features mapped during Accu-racy Assessment traverses can be divided into four distinct groups:
1. (Station)• Station points are the fundamental points on the traverse that delineate
a change in site series.

• They are numbered consecutively and that number is assigned to thesite series segment that precedes the Station.
• Each Station has a corresponding field Site Series Segment Data Cardwith attribute information related to the segment that precedes the station.
• If a Station happens to correspond with a Transect Delineation Point() such as a corner, then use a feature to map it and note thatit was a corner in the comments field.
2. (Transect Delineation Point)• s are points on the transect that are used in traverse adjust-
ments to control the location and shape of the transect, but do notrepresent a change in site series. Record s in the traverse notes.
• If the point does represent a change in site series then use an in-stead.
• Examples are: – Point of commencement – Point of termination (resurvey of ) – Transect corner – Change of bearing (e.g., to close on the ) – Creek crossing – Road crossing (centreline) – Trail crossing – Other
• s should not be assigned numbers.• A comments field is provided to allow naming (e.g., 2) or describ-
ing (e.g., Power Line).3. (Hand Traverse Point)
• s are used to define points on a segment where there is a significantchange in slope. The azimuth, slope distance (S.D.), and % slope arenoted in the traverse notes. s should not be assigned numbers, do notneed to be surveyed with the , and should not be entered on a SiteSeries Segment Data Card.
4. (Point of Interest)• Points such as s (Map Tie Points) and access points are related to,
but do not define, the location and shape of the transect. Other exam-ples are landing pads and vehicle location.
• s are recorded in the , but are not recorded in the traverse notesor on Site Series Segment Data Cards.
3.1.3 Compassing
1. Check your magnetic declination against the one required in the area youare working.
2. Use the assigned bearing to navigate. Use back sights to help with this work.
3.1.4 data collection This protocol recommends the use of a “mappinggrade” Global Positioning System () receiver rated to sub-metre accuracy(). data need to be differentially corrected using base data from arecognized provider. Examples of suitable receivers are the TrimblePathfinder or GeoXT. Approval to use other receivers should be ob-tained from the agency contracting the project.

Using the in navigation mode enables you to record the straight line distance back to your last change in bearing. Using this technique at eachStation and Transect Delineation Point and recording the distance provides a means of cross-checking the chained distance. This technique can also beused to re-establish chain distance after crossing a waterbody or other fea-ture. Depending on the brand and model of the receiver, differentmethods can be used to accomplish this. Refer to your manual for detailed instructions so that you are comfortable with the technique.
1. Check on your unit to make sure that everything works properly.Make sure spare cables are available. Charge your and data loggerbatteries as required.
2. Configure the Coordinate System as follows:• Coordinate System: • Zone: Enter the zone in which you will be working• Datum: -83
3. Configure the Rover Options as follows:• Logging Interval (for point features): 1 second• Position Mode: Manual 3D• Elevation Mask: 15º• Mask: 6.0• Mask: 8.0These configuration options are given on the back of the field forms foreasy reference.
4. Configure the Units and Display as follows:• Coords: Metres• Distance: Metres
5. Before going out in the field, create waypoints using the coordinatesprovided for the , Corners (s), and any additional points that maybe helpful to access the traverse location. Refer to your manual forcomplete instructions on creating waypoints. Prefix these proposed way-points with a “” and the traverse number (i.e., 27-) so they are easyto differentiate from the actual location the point was established.
6. When navigating it is preferable to use an averaged point at Stationsand Transect Delineation Points rather than a waypoint created from asingle fix. Throughout the Field Procedures section of this protocol,“high significance” data collection means collecting a minimum of 50fixes over a minimum time span of 150 seconds, as determined by theProvincial Standard (see References).
7. Data dictionaries must be identical for all traverses and should use the“Required naming coventions” listed above. Obtain a copy of the datadictionary from the project officer.
8. Allow a longer time at site series changes (s). When recording sitechanges, allow up to 5 minutes to obtain the required fixes. At criticals, such as the or corners, wait up to 15 minutes to obtain a read-ing.
3.1.5 Field location: access notes To aid in relocation of the sample, thecrew will produce access notes for the road (primary access) portion of travelto all traverse locations. These notes shall describe travel from a known loca-tion (population centre or flying pickup location) to the Tie Point () inenough detail to aid relocation by a different crew. This protocol suggests
that, at the project pre-work meeting, an easily recognized marshalling loca-tion should be designated for the project.
The format followed to complete this record should be similar to thatused in growth and yield plots and in the ground sampling procedures(B.C. Ministry of Sustainable Resource Management 2004). Crews unfamil-iar with the process are encouraged to request a sample. A simple field sheetmay be used to record the access notes, and it must be submitted in the pack-age with the ecology data collection cards. The “header” should contain at aminimum:
• traverse number,• field crew, and• sampling date.
Where alternative means of transportation (such as quads) are used, thisrequirement should be recorded in the access notes. Distance should be ap-proximated using key features, time, readings, or a combination of anyof these.
If there is a long traverse from the Access Point () to the Tie Point, in-dicate the general bearing used and approximate distance covered. Flag thes and complete detailed notes. Mark and document navigation points toallow for short-term sample relocation.
Where a helicopter is used, note the ferrying location as a Point of Interest() in the or record a location provided by the helicopter pilot oryour for the landing . Use some flagging at the landing location forfuture relocation.
The flagging convention used to identify , lines from the to the ,s, , Corners, and sides of traverse should be fully documented in theaccess notes. Refer to “Conventions and guidelines,” page 8, above, to verifythe recommended method for these field procedures.
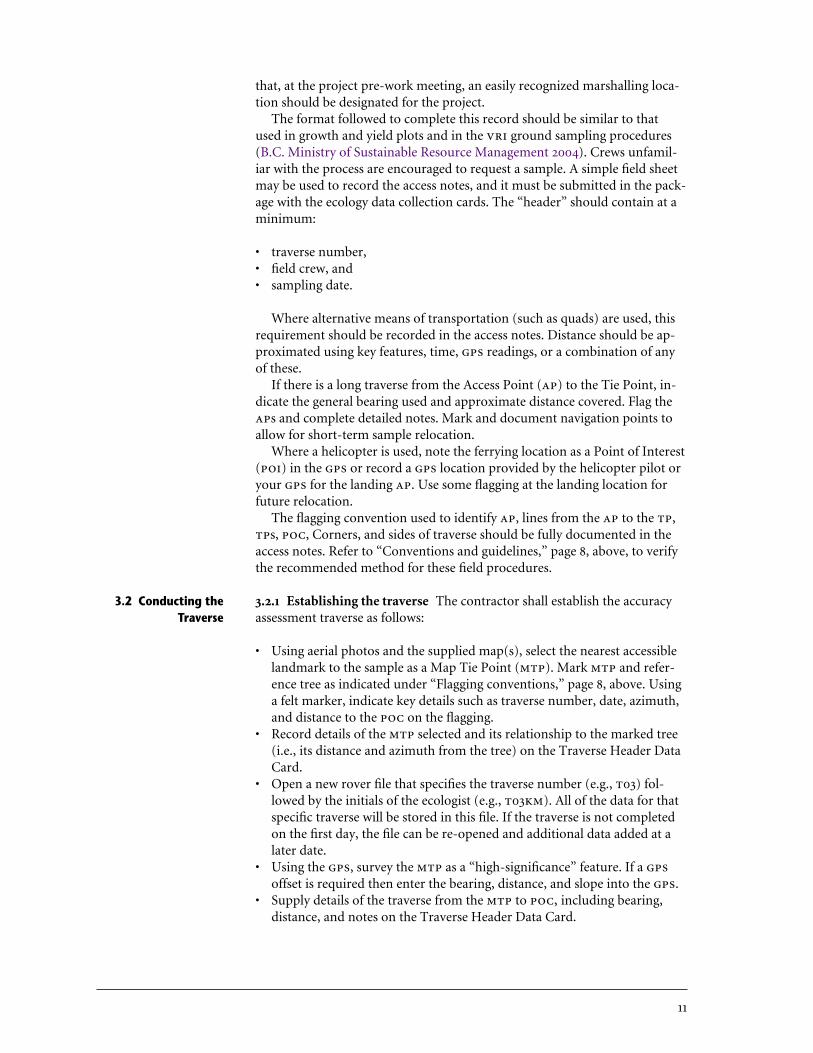
3.2.1 Establishing the traverse The contractor shall establish the accuracyassessment traverse as follows:
• Using aerial photos and the supplied map(s), select the nearest accessiblelandmark to the sample as a Map Tie Point (). Mark and refer-ence tree as indicated under “Flagging conventions,” page 8, above. Usinga felt marker, indicate key details such as traverse number, date, azimuth,and distance to the on the flagging.
• Record details of the selected and its relationship to the marked tree(i.e., its distance and azimuth from the tree) on the Traverse Header DataCard.
• Open a new rover file that specifies the traverse number (e.g., 03) fol-lowed by the initials of the ecologist (e.g., 03). All of the data for thatspecific traverse will be stored in this file. If the traverse is not completedon the first day, the file can be re-opened and additional data added at alater date.
• Using the , survey the as a “high-significance” feature. If a offset is required then enter the bearing, distance, and slope into the .
• Supply details of the traverse from the to , including bearing,distance, and notes on the Traverse Header Data Card.
3.2 Conducting theTraverse

• Except where not safe, establish the as marked on each supplied map.Use the location for the to confirm the location.
Similar to the Tie Point tree, follow the “Flagging conventions” (page 8,above) to mark the reference tree at each corner of the equilateral triangle.Record the location (i.e., traverse X, Corner 1 or 2 – Traverse X), andrecord the distance and azimuth from the tree to the (or corner) on theflagging and on the cards. For the and each corner of the triangle, usethe and record these s as “high-significance” features. Include theses in the traverse notes.
3.2.2 Collecting the data
1. At the , the ecologist will note the site series on Site Series SegmentData Card 1, but will not record data for this point. The compass personwill survey the with the using a - feature, collectingdata to a “high significance” level. All s are also recorded on the Tra-verse Notes Card.
2. Proceed clockwise on the first leg of the traverse. At points where slopehas changed by more than 5%, the compass person will record a HandTraverse Point (). Do not record readings on Site Series SegmentData Cards at s. On the Traverse Notes Card, record (on the preced-ing line) azimuth, slope distance, % slope, and segment number for theportion of the transect just traversed (see “Required naming conven-tions,” page 8, above). Indicate if the slope is positive or negative.
3. At each change of site series, record a , collecting data to a highsignificance level and enter the coordinates and hip chain distanceon the Site Series Segment Data Card. For example, at the location of thefirst ecological change, label the point 1 on the Traverse Notes Card andrecord the Segment Number just completed. The site series SegmentNumber should correspond to the Station () Number. Complete theSite Series Segment Data Card that you began at the . The datarecorded on the Site Series Segment Data Card are the coordinates forStation 1 (the end of the segment being completed).
4. Note the site series of the next segment on Site Series Segment Data Card2. Proceed along the assigned bearing to the next change in site series(). Note that Stations are numbered consecutively around the tra-verse, and all lines between Stations carry the same number as the Stationthat terminates the site series segment.
5. Between Stations, use the to survey Traverse Delineation Points(s) such as corners (s) and change of bearings () as required.These points should be surveyed to high significance standards, and dataentered on the Traverse Notes Card. Also record on the TraverseNotes Card (see #2, above).
6. At each corner add 120º to create an equilateral triangle and record onthe Traverse Notes Card. The operator also needs to remember tochange the navigation target point each time the transect changes bear-ing.
7. Demarcate impassable units such as lakes and wetlands with s,then use waypoint navigation to determine the distance across the unit,and reset the hip-chain at the point of resumption. Complete a Site SeriesSegment Data Card for the unit, recording the mapping entity.
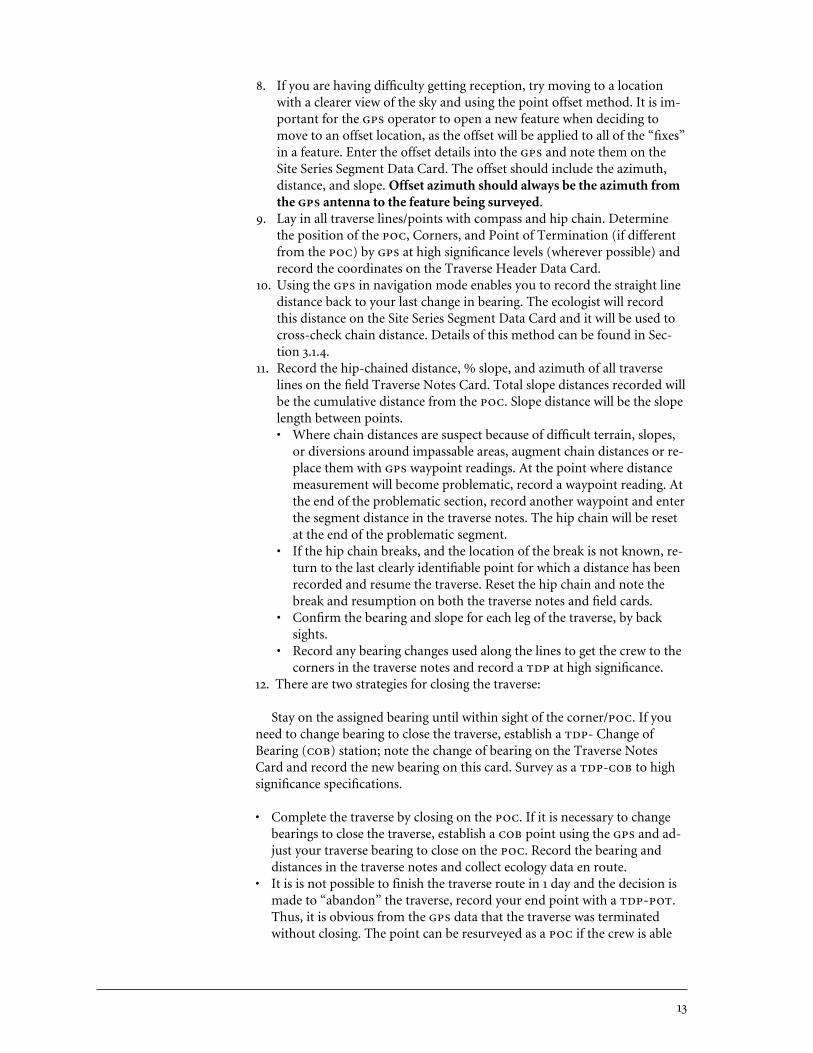
8. If you are having difficulty getting reception, try moving to a locationwith a clearer view of the sky and using the point offset method. It is im-portant for the operator to open a new feature when deciding tomove to an offset location, as the offset will be applied to all of the “fixes”in a feature. Enter the offset details into the and note them on theSite Series Segment Data Card. The offset should include the azimuth,distance, and slope. Offset azimuth should always be the azimuth fromthe antenna to the feature being surveyed.
9. Lay in all traverse lines/points with compass and hip chain. Determinethe position of the , Corners, and Point of Termination (if differentfrom the ) by at high significance levels (wherever possible) andrecord the coordinates on the Traverse Header Data Card.
10. Using the in navigation mode enables you to record the straight linedistance back to your last change in bearing. The ecologist will recordthis distance on the Site Series Segment Data Card and it will be used tocross-check chain distance. Details of this method can be found in Sec-tion 3.1.4.
11. Record the hip-chained distance, % slope, and azimuth of all traverselines on the field Traverse Notes Card. Total slope distances recorded willbe the cumulative distance from the . Slope distance will be the slopelength between points.• Where chain distances are suspect because of difficult terrain, slopes,
or diversions around impassable areas, augment chain distances or re-place them with waypoint readings. At the point where distancemeasurement will become problematic, record a waypoint reading. Atthe end of the problematic section, record another waypoint and enterthe segment distance in the traverse notes. The hip chain will be resetat the end of the problematic segment.
• If the hip chain breaks, and the location of the break is not known, re-turn to the last clearly identifiable point for which a distance has beenrecorded and resume the traverse. Reset the hip chain and note thebreak and resumption on both the traverse notes and field cards.
• Confirm the bearing and slope for each leg of the traverse, by backsights.
• Record any bearing changes used along the lines to get the crew to thecorners in the traverse notes and record a at high significance.
12. There are two strategies for closing the traverse:
Stay on the assigned bearing until within sight of the corner/. If youneed to change bearing to close the traverse, establish a - Change ofBearing () station; note the change of bearing on the Traverse NotesCard and record the new bearing on this card. Survey as a - to highsignificance specifications.
• Complete the traverse by closing on the . If it is necessary to changebearings to close the traverse, establish a point using the and ad-just your traverse bearing to close on the . Record the bearing anddistances in the traverse notes and collect ecology data en route.
• It is is not possible to finish the traverse route in 1 day and the decision ismade to “abandon” the traverse, record your end point with a -.Thus, it is obvious from the data that the traverse was terminatedwithout closing. The point can be resurveyed as a if the crew is able
to return and close the traverse. Mark the nearest tree as you would a cor-ner tree, with notes on cards and on flagging indicating what the point ison the traverse. Take the bearing and distance both to the and to theTie Point. Flag your route out in yellow. The key element in this work isthat you want to provide every opportunity for a crew to return to thispoint so that they could complete the traverse on a future field day.
• All the file-naming conventions relate to transect and segment numbersand are independent of date. Therefore, the crew returning to the transectshould try having the previous rover file with them. They can simply re-open the rover file, the point where the transect was terminated as a, and continue. That way there is one file for the entire transect.You could open a second file at the point where the transect was terminat-ed and then combine it with the first file, but this is more complicated totrack. At the very least, the second crew should be able to navigate to the coordinates of the termination point and continue from there.Wherever possible the same crew should return, since the naming con-ventions are not really set up for multiple ecologists.
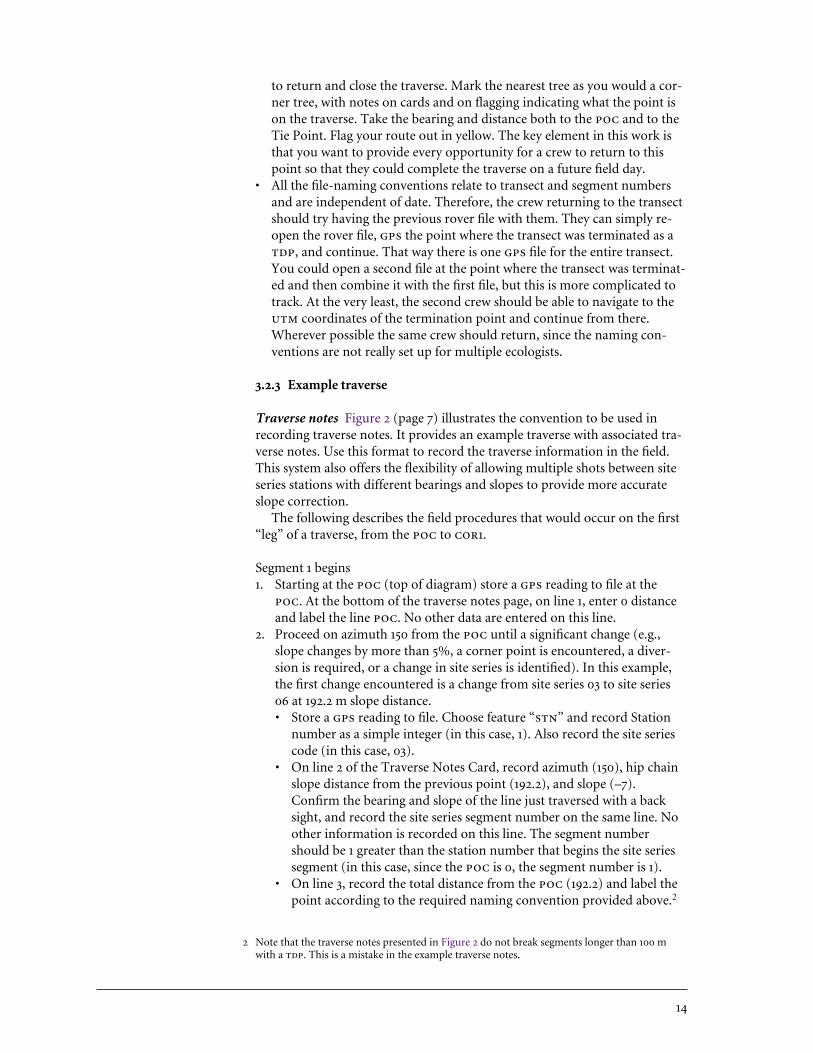
3.2.3 Example traverse
Traverse notes Figure 2 (page 7) illustrates the convention to be used inrecording traverse notes. It provides an example traverse with associated tra-verse notes. Use this format to record the traverse information in the field.This system also offers the flexibility of allowing multiple shots between siteseries stations with different bearings and slopes to provide more accurateslope correction.
The following describes the field procedures that would occur on the first“leg” of a traverse, from the to 1.
Segment 1 begins1. Starting at the (top of diagram) store a reading to file at the
. At the bottom of the traverse notes page, on line 1, enter 0 distanceand label the line . No other data are entered on this line.
2. Proceed on azimuth 150 from the until a significant change (e.g.,slope changes by more than 5%, a corner point is encountered, a diver-sion is required, or a change in site series is identified). In this example,the first change encountered is a change from site series 03 to site series06 at 192.2 m slope distance. • Store a reading to file. Choose feature “” and record Station
number as a simple integer (in this case, 1). Also record the site seriescode (in this case, 03).
• On line 2 of the Traverse Notes Card, record azimuth (150), hip chainslope distance from the previous point (192.2), and slope (–7).Confirm the bearing and slope of the line just traversed with a backsight, and record the site series segment number on the same line. Noother information is recorded on this line. The segment numbershould be 1 greater than the station number that begins the site seriessegment (in this case, since the is 0, the segment number is 1).
• On line 3, record the total distance from the (192.2) and label thepoint according to the required naming convention provided above.2
2 Note that the traverse notes presented in Figure 2 do not break segments longer than 100 mwith a . This is a mistake in the example traverse notes.

The label must correspond to the label stored in the file. In thiscase, the point identifies a change in site series and is therefore a Sta-tion. It is labelled with the simple integer 1.
• As well, since this is a Station, fill out a Site Series Segment Data Card.The segment number recorded on the Site Series Segment Data Cardmust correspond to the segment number it describes and the Stationnumber recorded in the file. It is therefore Station 1.
Every point must have a label.Segment 1 ends/Segment 2 begins3. Proceeding on a bearing of 150º, the traverse crosses a road at 242.5 m
from the . • Store a reading and record the point type () in the file.• On line 4, record the azimuth (150), slope distance (50.3 m), slope (-5),
and segment number (2). • On line 5 of the traverse notes, record the total slope distance to the
point (242.5 m) and record the label - in the comments field.Since this is not a Station, do not fill out a Site Series Segment DataCard.
4. Proceeding on the 150º bearing, the traverse crosses a creek at 300.7 mfrom the . • Store a reading and record the point type (). • On line 6, record the azimuth (150), the distance from the last point
(58.2 m), the slope (–7), the segment number (2). This is still the samesegment number because the site series has not changed.
• On line 7 of the traverse notes, record the total slope distance to thepoint (300.7 m) and label the point as - in the commentsfield. Since this is not a Station, do not fill out a Site Series SegmentData Card.
5. Proceeding on the 150º bearing, the traverse changes from site series 06 tosite series 04 at 356.2 m from the . • Store a reading and record the station number (2) and site series
code (06).• On line 8, record the azimuth (150), the distance from the last point
(55.5 m), the slope (8), and the segment number (2). This is still thesame segment number because it still refers to the same site series.
• On line 9 of the traverse notes, record the total slope distance to thepoint (356.2 m) and label the point as 2 in the comments field.
• Since this is a Station, fill out a Site Series Segment Data Card. Thesegment number recorded on the Site Series Segment Data Card mustcorrespond to the segment number it describes and the station num-ber recorded in the file (in this case, 2).
6. Proceeding on the 150º bearing, the slope changes from 13 to 22% at 445.3 m from the . Since this is only a slope change of more than 5%but the bearing does not change, the point is an .• Since this is not a Station or , do not store a reading. • On line 10, record the azimuth (150), the distance from the last point
(89.1 m), the slope (13), and the segment number (3). • On line 11 of the traverse notes, record the total slope distance to the
point (445.3 m) and label the point in the comments field.• Since this is not a Station, do not fill out a Site Series Segment Data
Card.
7. Proceeding on the 150º bearing, the traverse meets a corner point at 507.6 m slope distance from the . Since this a corner but is not achange in site series, the point is a .• Store a reading and record the point type () in the file.• On line 12, record the azimuth (150), the distance from the last point
(62.3 m), the slope (22), and the segment number (3). • On line 13 of the traverse notes, record the total slope distance to the
point (507.6 m) and label the point - in the comments field.• Since this is not a Station, do not fill out a Site Series Segment Data
Card. 8. At the corner, take a new azimuth of 270º (150º + 120º) and proceed
clockwise around the traverse. Continue to collect data as described inthis example for the next two “legs” of the triangle.
9. If the hip chain should break, return to the last point at which distancedata were recorded, attach and reset the hip chain, and record in the tra-verse notes that the hip chain was reset.
10. If the traverse crosses a feature that cannot be crossed (e.g., a lake),record a station. Move around the feature to the point where the traverseexits the feature and determine the distance across the feature by usingthe waypoint function (see Section 3.1.4).
Site series data cards Synchronize Site Series Segment Data Cards with Tra-verse Note Cards using the following convention.
• The card will be identified with a Seg # corresponding to the segmentnumber recorded for the segment on the Traverse Notes Card.
• Site Series Segment Data Cards are filled out only for segments and arecompleted at the Station that terminates the segment. data recordedon the card are for the Station terminating the site series segment.
3.2.4 Reminders during execution of the traverses The following datachecks should be performed during the traverse.
1. The ecologist is responsible for recording all site series data (see Appendix 1).2. At each site series change, complete the Site Series Segment Data Card, in-
cluding a unit call for the segment just traversed. Each card will havea primary site series call. The level of confidence in the primary call will benoted as High, Medium, or Low. If the confidence is noted as High, no al-ternate site series call will be made. If confidence is Medium or Low, analternate site series call must be present and a confidence level assigned tothe alternate call.
3. Using the field guide as a reference, choose the best site series fit for thearea ahead and note it on the next Site Series Segment Data Card. Makeany additional notes as necessary.
4. Each site series will have enough information and comments recorded tosupport the site series call or explain the ambiguity in Medium to Lowconfidence calls. Discrepancies between recorded information and site se-ries calls must be explained in the notes.
5. All Site Series Segment Data Cards will record the coordinates of thestation at the end of the site series segment.

6. For each corner point, the cumulative chain distance from the will becompared with the distance as determined by the waypoint reading, anddiscrepancies noted and reconciled if possible.
7. If the site series change does not occur for more than 100 m, the ecologistwill work with the compass person, and a should be created. Enterthe point on the Traverse Notes Card. The reference points will help re-solve spatial ambiguities that may arise from hip-chain errors and willbetter show the line walked by the ecologist.
8. Record unclassified areas and other mapping entities (e.g., lakes, wetlands,rock outcrops) in the same way you would record site series changes.
3.2.5 Inaccessible samples Complete the administrative details on the fieldcards for all assigned traverses on the sample list regardless of their successfulestablishment.
If the crew has travelled to the traverse location and abandons the traversefor safety reasons, this information should be recorded on the TraverseHeader Card. The crew will also fill out the Non-completion Card (see Ap-pendix 2). The crew must specify why the traverse cannot be established; forexample:
• access to traverse is too dangerous,• traverse would be located in an unsafe area,• traverse would be located in a river or lake, or• permission is denied to access traverse due to private land.
This information will be summarized and returned to the project manageras a separate deliverable.
Inaccessible samples cannot be replaced. The next traverse on the samplelist will be substituted.
3.3.1 data processing rover files should be downloaded to a com-puter and quality control should be performed to ensure that:
• The traverse is complete.• All points are attributed completely and correctly.• Any unnecessary data are removed from the file.• Any corrections noted in the field notes have been made to the rover file.• Point offset information has been entered correctly.
Once the above steps are completed, the rover file should be differentiallycorrected using data from a recognized base station. Further quality controlshould be performed to ensure that:
• 100% of the fixes have been differentially corrected. If the correction is lessthan 100%, then check the correction report, inspecting each gap to ensurethat no features have been completely lost. It may be necessary to usean alternative base station to get a more complete correction. As a last resort, uncorrected fixes can be included in the output-corrected file toensure that all features are retained.
• Standard deviations are within acceptable levels. High standard deviations(> 5 m) could indicate that the operator was moving while recording thepoint feature, or may be the result of high multipath conditions. Poorfixes can be deleted to improve the standard deviati0n.
3.3 Post Fieldwork

The raw rover file, base files used for differential correction, and thecorrected file should be delivered for traverse geo-coding.
data deliverables should include:
• rover (.ssf) files with edits and complete.• differentially corrected files (.cor) with edits and complete.• base files used for correction.• Differential correction report.• A Readme text file containing any special notes and instructions for the
geocoders (features surveyed as the wrong type, correction problems,etc.).
If the project is using a Trimble , the best procedure is to compress theentire Pathfinder Office Project from the PFData directory into a WinZipfile and include folder names. Thus, the personnel who are geo-coding thedata can reconstruct the project easily. If the project is using another system,the project should develop a comparable protocol.
4 DATA PREPARATION
Create a spatial database () for the project area using the data, handtraverse notes, and Site Series Segment Data Cards. Ensure that coordinatedata are consistent with the base.
1. Enter the traverse notes (azimuth, slope distance, % slope, and com-ments) into a traverse data application such as RoadEng,3 which is wellsuited to this process. Ensure that the Total-SD calculated by the programagrees with the traverse notes. Assign the coordinates to the andexport the hand traverse data to the . Be sure to use the angle of con-vergence to a meridian to convert from the true north grid used withinthe traverse data application to the grid used within the .
2. After completing differential correction and quality control proceduresusing a program, export all data points to the .
3. Reconcile positional discrepancies between Station and locations de-termined using bearing, distance, and slope and those determined with readings.• In the traverse data application, assign coordinates as absolute co-
ordinates to the and corner stations.• In the , buffer all and points by 15 m.• Determine which stations are more than 30 m from the previous
station. Unless there is reason to suspect the quality of the posi-tion, assign the coordinates as absolute coordinates to thosestations in traverse data application. The traverse data applicationshould perform adjustments to distribute error in the hand traversedata evenly between stations that have been assigned absolute coordi-nates.
4.1 Spatial Databaseof Traverses
3.4 GPS DataDeliverables
3 The RoadEng application name will be used in a generic sense for all similar packages that maybe available. The use of the specific application software is not mandatory.
• Re-export the final adjusted traverse from the traverse data applicationto the . As you have now used coordinates as absolute coordi-nates to adjust the traverse, you no longer need to compensate for theangle of convergence to a meridian.
4. Format the adjusted traverse, merging line vertices until there arecontinuous segments between site series stations. These segments shouldcorrespond exactly with the segments in the hand traverse notes. A seg-ment should not be broken by any point other than a Site Series Station.Attribute segments with the traverse number and segment number.
5. Create an associated attribute table with one row for each segment of thetraverse. Record the attributes Traverse#; Seg #; Point Type (, ,); Chain Distance from of Segment; As Mapped Unit, SiteSeries, Confidence, Alternate Site Series, Confidence; Alternate Unit,Site Series, Confidence, Alternate Site Series, Confidence. Ensure that tra-verse notes segment numbers correspond with Site Series Segment DataCard numbers.
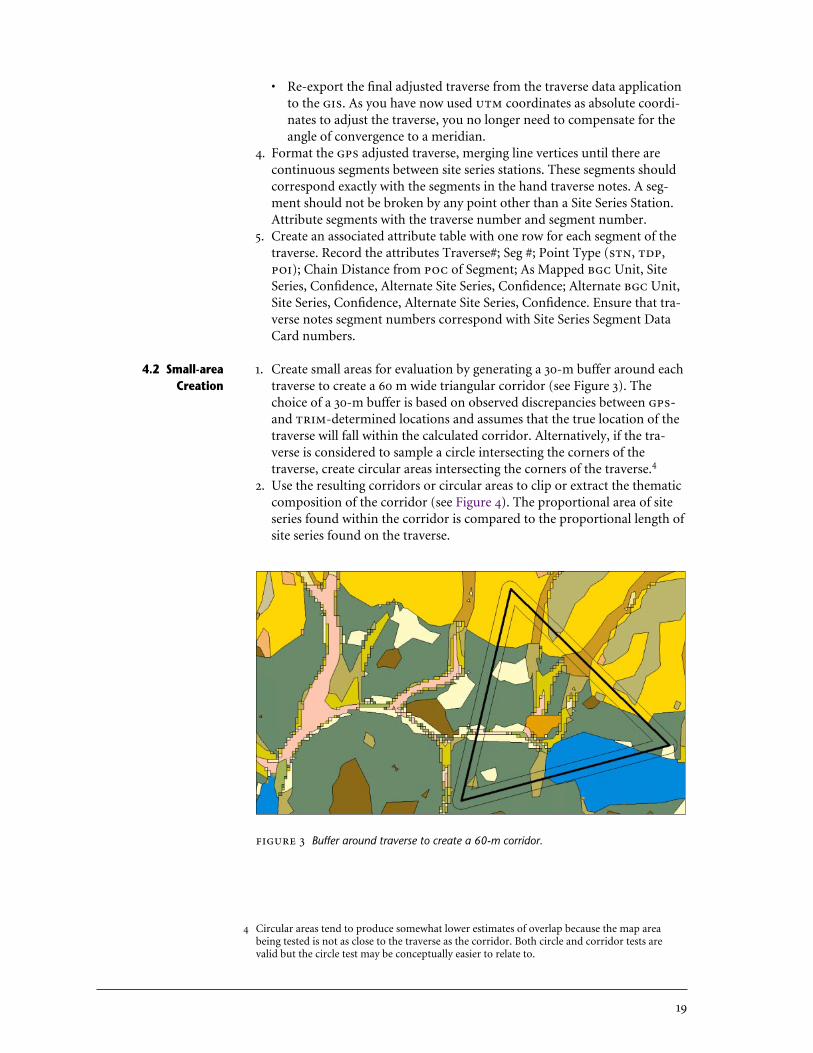
1. Create small areas for evaluation by generating a 30-m buffer around eachtraverse to create a 60 m wide triangular corridor (see Figure 3). Thechoice of a 30-m buffer is based on observed discrepancies between -and -determined locations and assumes that the true location of thetraverse will fall within the calculated corridor. Alternatively, if the tra-verse is considered to sample a circle intersecting the corners of thetraverse, create circular areas intersecting the corners of the traverse.4
2. Use the resulting corridors or circular areas to clip or extract the thematiccomposition of the corridor (see Figure 4). The proportional area of siteseries found within the corridor is compared to the proportional length ofsite series found on the traverse.
4.2 Small-areaCreation
Buffer around traverse to create a 60-m corridor.
4 Circular areas tend to produce somewhat lower estimates of overlap because the map areabeing tested is not as close to the traverse as the corridor. Both circle and corridor tests arevalid but the circle test may be conceptually easier to relate to.

5 DATA ANALYSIS
Thematic accuracy is based on a measure of classification overlap. This isperhaps best explained by example. If the map predicts 40% of site series 01and the traverse estimated 30% of site series 01, the classification overlap is30%. If the map predicts 10% of site series 03 and the traverse estimates 15%, the classification overlap is 10%. The overlap for the sample corridor is thesummed overlap for all site series in the sample corridor.
To calculate overlap for a traverse:
1. Determine the proportional length of each site series on the traverse as thesummed length of each site series (using sample information) divided bythe total length of the traverse.
2. Determine the proportional area of each site series in the corridor as thesummed area of each site series (using map information) divided by thetotal area of the corridor.
3. Site series overlap is the lower proportion for each site series, and theoverlap for the traverse is the summed overlap for the site series.
Calculate two forms of overlap based on the data source. The first type isprimary overlap based on the primary site series call for the As Mapped unit. The second type is alternate overlap and uses the Alternate Site Seriescall for the As Mapped Unit rather than the primary call if it increasesthe degree of overlap. Alternate calls may be used only if the confidence attached to the primary call is Medium or Low. If the primary call is Medi-um, the alternate call must also be Medium. If the primary call is Low, thealternate call may be used.
Table 1 presents an example overlap table for one traverse. Using the primary call, the map overpredicts site series 01 (57% vs. 36%) and underpre-dicts site series 06 (2% vs. 28%) relative to the traverse. Fourteen percent ofthe traverse classified 06 as the primary call was considered Moderate to Lowconfidence and had an alternate site series call of 01. The traverse proportionof site series 01 is therefore increased by 14% and the traverse proportion for
5.1 Calculation ofPercentage Agreement
Overlap
Map corridor clipped from the thematic map.

site series 06 is decreased by 14%. This increases the overlap for site series 01to 50% without reducing the overlap of the 06 site series.
The overlap agreement between ecologists is determined in the same way asoverlap agreement between the map and the traverse data. In this case theoverlap is calculated between traverses conducted by the ecologists. Eachecologist is compared with each other ecologist for each traverse. Table 2shows the data from Table 1 as though comparing traverse data from twoecologists.
The accuracy protocol has two sampling requirements: one for calculat-ing percentage overlap and the other for estimating percentage dominantcorrect.
5.3.1 Sample size for percentage overlap Sample size is a difficult issue be-cause it requires information that you do not have until after the sample iscompleted. The conventional sample size formula can be used to calculate an overall sample size.
(1)
• n is the sample size (in this case, the number of transects).• is the Standard Deviation of the transect “matching lengths.” In this
case it is a percentage, because all the measurements that match aresummarized as a percentage.
n =t2 × SD2
SE2
5.3 DeterminingRequired Sample Size
5.2 MeasurementError
Classification overlap using primary and secondary calls between ecologists
Data Site series % composition TraverseTrans Classification source 01 02 03 04 05 06 07 08 09 99 overlap
T21SB Primary Ecologist 1 57 0 7 21 1 2 11 0 0 1call Ecologist 2 36 0 0 21 0 28 1 4 4 6
% overlap 36 0 0 21 0 2 1 0 0 1 61
Alternate Ecologist 1 57 0 7 21 1 2 11 0 0 1call Ecologist 2 50 0 0 21 0 14 1 3 4 6
% overlap 50 0 0 21 0 2 1 0 0 1 75
Classification overlap between map prediction and traverse observation
Data Site series % composition TraverseTrans Classification source 01 02 03 04 05 06 07 08 09 99 overlap
T21SB Primary Map 57 0 7 21 1 2 11 0 0 1call Traverse % 36 0 0 21 0 28 1 4 4 6
% overlap 36 0 0 21 0 2 1 0 0 1 61
Alternate Map 57 0 7 21 1 2 11 0 0 1call Traverse % 50 0 0 21 0 14 1 3 4 6
% overlap 50 0 0 21 0 2 1 0 0 1 75

• is the Sampling Error chosen for the project (e.g., 5%). This is apercentage, because is a percentage. is a measure of the accuracywith which you know the agreement between the map and groundmeasurements. This is a choice for the project, made by the projectmanager. The will probably review this from time to time.
• t is the value corresponding to the chosen confidence level (1−α) at n – 1 degrees of freedom. An acceptable value for t can be obtainedusing Excel spreadsheet function “tinv.” Alternatively, “solver” in Excelmay be used to find the solution to equation 1.
The Canim Lake conducted 36 accuracy traverses. Data analysis indi-cated that the achieved an overlap of 68.5% with a standard deviation of17%.
Using the standard deviation estimated from the 36 samples, equation 1solves as:
In this study, 33 traverses would have been enough to estimate overlap towithin 5% at a 90% confidence level.
It is unlikely that fewer than 20 samples will meet the requirementfor confidence level; therefore, a stage 1 sample size of 20 should reasonablyestimate with little danger of oversampling.
Calculation of sample size requires an estimate of , which can be calcu-lated using equation 2.
(2)
For example, we might find that a sample of 20 transects produces an esti-mated of 20%, leading to the following solution for equation 1 for %.
Since this does not meet the required 5%, additional transects are re-quired. We can compute the number of additional transects needed bysolving equation 1 as follows:
Since 20 transects have been conducted, 28 additional transects are re-quired. The additional transects must be installed as a valid sample. Theymust be selected at random from the entire eligible sampling area or be cho-sen from the next 28 ordered samples identified during the selection process.Since the initial estimate of was based on only 20 samples, it would be ad-visable to calculate the based on the full 48 samples and confirm that the
n =1.7292 × 20%2
5%2= 48 transects
SE =1.7292 × 20%2
20= 5.5%
SE =t2 × SD2
n
n =1.6912 × 17%2
5%2= 33 transects
5% confidence level has been achieved. If not, calculate the additional tran-sects required and conduct the final sampling.
The following steps summarize the staged sampling procedure:
1. Select, execute, and analyze 20 random traverses from the eligible samplearea.
2. Calculate the of the overlap values.3. Using equation 1, calculate number of transects needed to meet the re-
quired confidence level.4. Select, execute, and analyze the additional transects. These must be chosen
at random from the eligible sample area.5. Repeat steps 2, 3, and, if necessary, 4.
5.3.2 Additional sampling Having established the desired level ofconfidence for accuracy estimates applicable to the entire project area, theremay be other reasons to conduct additional sampling. For example, the clientmay wish to determine the accuracy of specific subzones that may have beenundersampled or to test the accuracy of prediction for specific site series.
Unless sample locations are chosen at random from the entire projectarea, you cannot use these additional samples to augment your project-wideestimates. You can, however, augment the existing samples that fell withinthe subzone or stratum of interest to better define the map accuracy for thatstratum if the samples are chosen at random from within the stratum.
Statistical sampling When augmenting samples for strata, two factors are critical:
1. Every point in each stratum should have an equal probability of being selected.
2. The same sampling protocol must be used for the strata as was used forthe project area.
There are at least two possible statistical approaches to sampling strata.The first is stratified random sampling to evaluate statistical differences inaccuracy between all strata. In this case it will still be possible to use randomsamples taken for the project as a whole but the design must be a rigorousstratified random sampling design. Another approach is to simply augmentestimates for individual strata.
Purposive sampling Purposive sampling refers to a procedure where onlysites that fit a specific set of criteria are sampled. Purposive sampling may beused, for example, to characterize an undersampled site series or to evaluatespecific aspects of a knowledge base. With this methodology, purposive sam-pling can only statistically infer population characteristics for a class if allpossible members of the target class have a known and non-zero probabilityof being sampled.
While partial stratified random or purposive strata-based sampling can beused to augment estimates of accuracy within the sampled strata, no infer-ences are valid for the strata not sampled.

6 REPORTING
The Protocol for Accuracy Assessment of Ecosystem Maps (Meidinger 2003)presents the documentation requirements for Standard submissionsand for acceptance by the for application in Timber Supply Review.This level of reporting should be more than adequate for internal use of thedata for quality control and quality assurance.
APPENDIX 1 Ecology data field cards
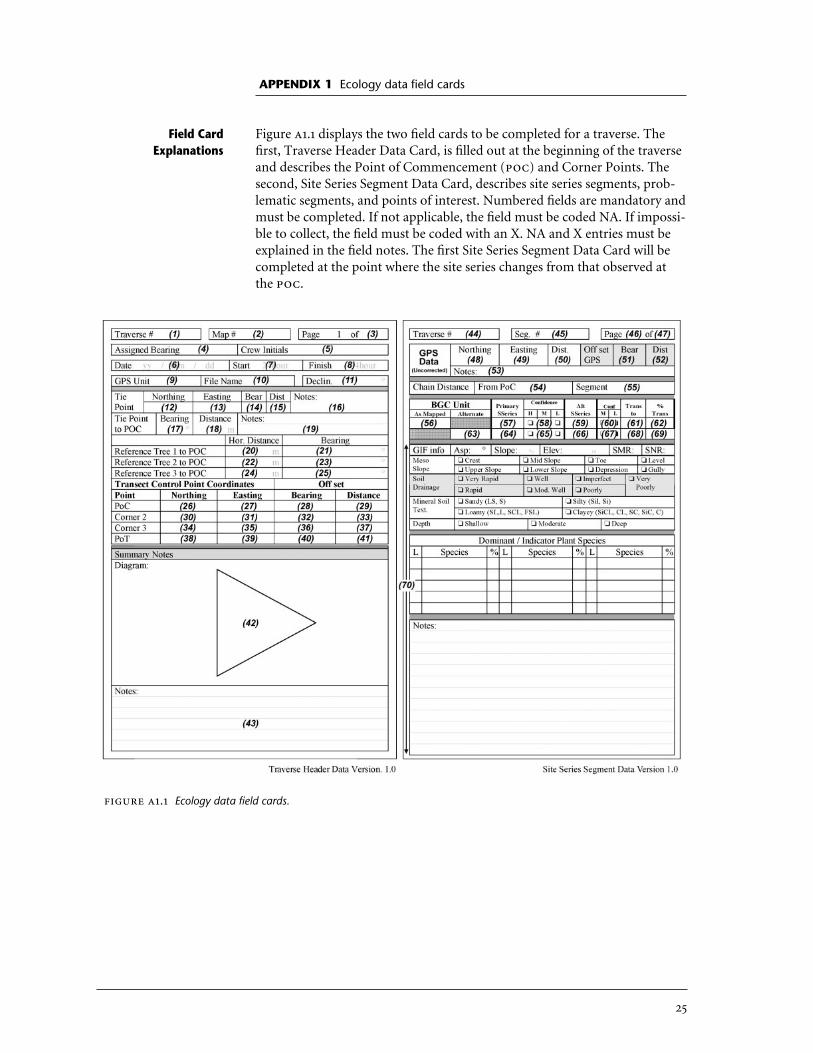
Figure 1.1 displays the two field cards to be completed for a traverse. Thefirst, Traverse Header Data Card, is filled out at the beginning of the traverseand describes the Point of Commencement () and Corner Points. Thesecond, Site Series Segment Data Card, describes site series segments, prob-lematic segments, and points of interest. Numbered fields are mandatory andmust be completed. If not applicable, the field must be coded NA. If impossi-ble to collect, the field must be coded with an X. NA and X entries must beexplained in the field notes. The first Site Series Segment Data Card will becompleted at the point where the site series changes from that observed atthe .
Field CardExplanations
. Ecology data field cards.

Field definitions
Traverse Header Data Card
1. Traverse #: (Mandatory) Traverse number is a concatenation of the se-lection number assigned during the random selection process andthe initials of the ecologist assigned to conduct the traverse. The traversenumber will be written on the envelope of the traverse package.
2. Map #: (Optional) Record the number of the base map included in thetraverse package.
3. Page 1 of: (Mandatory) The total number of segment cards filled out forthe traverse. This number should equal the page number of the last tra-verse. Confirm by counting pages.
4. Assigned Bearing: (Mandatory) This bearing is determined by randomselection during the traverse selection process. It is written on the pack-age envelope.
5. Crew Initials: (Mandatory) The initials of the crew are recorded as thefirst letter of given name and first letter of surname—ecologist first,compass person second—and separated by a dash. For example, Ecolo-gist Joe Jones and Compass person Mary Smith are recorded as -.
6. Date: (Mandatory) The date the traverse was conducted, in the formatyy/mm/dd.
7. Start: (Mandatory) The time of departure from the Tie Point. Use24-hour format.
8. Finish: (Mandatory) The time at traverse closure to or traverse ter-mination. Use 24-hour format.
9. Unit: (Mandatory) The serial number of the unit used.10. File Name: (Mandatory) The file name used to store data for the tra-
verse. The name uses the format traverse number with operator initials(e.g., 03). Traverse numbers less than 10 will be preceded by 0(as in the example) and the file name will be eight characters long.
11. Declin.: (Mandatory) The compass declination for the traverse area,recorded in degrees.
12. Tie Point Northing: (Mandatory) The Northing of the Tie Pointrecorded at high significance.
13. Tie Point Easting: (Mandatory) The Easting of the Tie Point record-ed at high significance.
14. Tie Point Bearing: (Optional)15. Tie Point Distance: (Optional)16. Tie Point Notes: Compass bearing and distance from marked tree or
landmark to the Tie Point if necessary.17. Tie Point to Bearing: (Mandatory) The bearing from the Tie Point
to the Point of Commencement.18. Tie Point to Distance: (Mandatory) The distance from the Tie Point
to the .19. Tie Point to Notes: (Optional) Additional notes appropriate to nav-
igating from the Tie Point to the .20. Reference Tree to Horizontal Distance: (Mandatory) The horizon-
tal distance in metres from the reference tree (see instructions formarking the tree) to the .
21. Reference Tree to Bearing: (Mandatory) The bearing from Refer-ence Tree 1 to the .
22. Reference Tree to Corner 1 Horizontal Distance: (Mandatory) The hori-zontal distance in metres from the reference tree (see instructions formarking the tree) to Corner 1.
23. Reference Tree to Corner 1 Bearing: (Mandatory) The bearing from thereference tree to Corner 1.
24. Reference Tree to Corner 2 Horizontal Distance: (Mandatory) The hori-zontal distance in metres from Reference Tree 1 (see instructions formarking the tree) to Corner 2.
25. Reference Tree to Corner 2 Bearing: (Mandatory) The bearing fromReference Tree 1 to Corner 2.
Transect Control Point Coordinates26. Northing: (Mandatory) The reading for Northing taken at high
significance level for the . The is also Corner 1.27. Easting: (Mandatory) The reading for Easting taken at high
significance level for the .28. Bearing: The bearing in degrees from an offset point to the , if
required.29. Distance: The distance in metres from the offset to the , if re-
quired.30. Corner 1 Northing: (Mandatory) The reading for Northing taken at
high significance level for the for the first corner after the .31. Corner 1 Easting: (Mandatory) The reading for Easting taken at high
significance level for Corner 2, the first corner after the .32. Corner 1 Bearing: The bearing in degrees from an offset point to Corner
2, if required.33. Corner 1 Distance: The distance in metres from the offset to Corner 2, if
required.34. Corner 2 Northing: (Mandatory) The reading for Northing taken at
high significance level for Corner 3.35. Corner 2 Easting: (Mandatory) The reading for Easting taken at high
significance level for Corner 3.36. Corner 2 Bearing: The bearing in degrees from an offset point to Corner
3, if required.37. Corner 2 Distance: The distance in metres from the offset to Corner 3, if
required.38. Northing: (Mandatory) The reading for Northing taken at high
significance level for the (Point of Termination). 39. Easting: (Mandatory) The reading for Easting taken at high
significance level for the . This field is mandatory if the traverse can-not be closed to the .
40. Bearing: The bearing in degrees from an offset point to the , ifrequired.
41. Distance: The distance in metres from the offset to the , if re-quired.
42. Diagram: (Optional) Use the space or the diagram to describe informa-tion relevant to the traverse, features on the traverse, access, etc.
43. Notes: (Optional) Use the space to record relevant notes about the tra-verse, access, features, etc.
Site Series Segment Data Card
44. Traverse #: (Mandatory) Traverse number is a concatenation of the se-lection number assigned during the random selection process andthe initials of the ecologist assigned to conduct the traverse. The traversenumber will be written on the envelope of the traverse package and is re-peated on the Traverse Header Data Card and on the Site Series SegmentData Card.
45. Seg #: (Mandatory) Segment number is the number of the segment,point of interest, or traverse control point being described on the SiteSeries Segment Data Card. If the card is being completed at a Station, theSeg # must correspond to the segment number preceding the station onthe traverse notes. At the first change in site series recorded after leavingthe , the segment from to Station 1 is segment 1.
46. Page x of: (Mandatory) Page number of Site Series Segment Data Card.The first Site Series Segment Data Card filled out is number 2. Pages arenumbered consecutively.
47. Page x of y: (Mandatory) This is the total number of forms filled out forthe traverse. It cannot be completed until the , at which time all datacards should be completed.
data48. Station Northing: (Mandatory) The uncorrected Northing of the
Station in 83 .49. Station Easting: (Mandatory) The uncorrected Easting of the Station
in 83 .50. Distance: Cumulative distance from in metres determined by
Waypoint navigation methods.51. Station Offset Bearing: (Optional) The bearing in degrees from the
offset to the station.52. Station Offset Distance: (Optional) The distance in metres from the
offset to the station.53. Notes: (Optional) Relevant notes about the readings or offset from
the station.54. Chain distance from : (Mandatory) The cumulative horizontal dis-
tance from the to the Station.55. Chain distance Segment: (Mandatory) The horizontal length of the cur-
rent segment.
As mapped56. Unit: (Mandatory) The mapped biogeoclimatic unit (zone subzone vari-
ant) in which the current segment falls.57. Primary SSeries: (Mandatory) The primary call for site series
classification in the mapped unit.58. Confidence: (Mandatory) The classifier’s confidence in the primary site
series call. Check the appropriate box High, Medium, or Low.59. Alt SSeries: (Mandatory) If Field 58 is Medium or Low confidence, you
must provide an alternate site series call for the mapped unit.60. Confidence: (Mandatory) Confidence in the alternate site series call.
61. Trans to: (Optional) If the primary site series is considered transitionalto an adjacent site series, record the site series to which it is consideredtransitional.
62. % Trans: (Optional) The degree to which the site series is consideredtransitional to the alternate.
Alternate63. Unit: (Mandatory) The alternate biogeoclimatic unit (zone subzone vari-
ant) in which the current segment falls.64. Primary SSeries: (Mandatory) The primary call for site series
classification in the alternate unit.65. Confidence: (Mandatory) The classifier’s confidence in the primary site
series call as indicated in #64. Check the appropriate box High, Medium,or Low.
66. Alt SSeries: (Mandatory) If Field 65 is Medium or Low confidence, youmust provide an alternate site series call for the alternate unit.
67. Alt SSeries Confidence: (Mandatory) The classifiers confidence in the al-ternate site series call.
68. Trans to: (Optional) If the primary site series is considered transitionalto an adjacent site series, record the site series to which it is consideredtransitional.
69. % Trans: (Optional) The degree to which the site series is consideredtransitional to the alternate.
70. 5 Info: (Mandatory) The Info section should be filled out using Manual definitions to sufficient extent to confirm the classification.
5 (Ground Inspection Form) data fields should follow definitions in B.C. Ministry of Forestsand B.C. Ministry of Environment, Lands, and Parks. 1998. Field manual for describing terres-trial ecosystems. Victoria, B.C. Land Manage. Handb. 25.

APPENDIX 2 Non-completion form
Accuracy Assessment TraverseRecord of Traverse Non-completion
(To be filled out for any plot that cannot be established)
Reason that plot cannot be established (check all applicable boxes):
■■ Plot is too far, temporarily inaccessible■■ Access to plot is too dangerous■■ Plot would be located in an unsafe area■■ Plot would be located in river or lake■■ Permission denied to access private land■■ Other (specify:_____________________________)
Detailed comments:
Please note: A detailed access card must be completed and submitted for any effort made to establish thetraverse. All materials (photos, maps, field cards, etc.) must be returned for the traverse.
The project manager/co-ordinator should be informed of any crew concerns related to deci-sions about the location and subsequent traverse lines.
Traverse #
Mapsheet
#
Crew
Date
Project

REFERENCES
B.C. Ministry of Environment, Lands and Parks. 2001. British Columbiastandards, specifications and guidelines for resource surveys usingglobal positioning system () technology. Geographic Data BC Release 3.0, March 2001. Victoria, B.C.
B.C. Ministry of Sustainable Resource Management. 2004. Vegetation re-sources inventory ground sampling procedures manual. Version 4.5.Victoria, B.C.
Forbes, T., D. Rossiter, and A. Van Wambeke. 1985. Guidelines for evaluatingthe adequacy of soil resource inventories. U.S. Dep. Agric., Soil Con-servation Service, Soil Management Support Services Tech. Monogr. 4.
Geographic Data BC. 2001 British Columbia standards, specifications andguidelines for resource surveys using global positioning system ()Tech. Release 3.0. Issued on the Internet.
Meidinger, D. 2003. Protocol for accuracy assessment of ecosystem maps.B.C. Min. For., Res. Br., Victoria, B.C. Tech. Rep. 011.
Moon, D.E. 2003. Canim Lake accuracy assessment 2003. Submitted to theCariboo Site Productivity Adjustment Working Group by CoreDecision Technologies Inc.
Moon, D.E., J.W. Hall, and C.J. Selby. 1987. A procedure for determiningground truth reliability for land resource inventories. Version 2. Inter-nal memorandum, Land Resource Research Centre, AgricultureCanada, Central Experimental Farm, Ottawa.
Nikiforuk, W.L., M.D. Fawcett, and R.A. MacMillan. 1993. An evaluation ofalternative methods of soil mapping. Alberta Research Council. Envi-ronment Research and Engineering Department, Edmonton, Alta.Alberta Research Council Open File Rep. 1993–01.
Steers, C.A. and B.F. Hajek. 1979. Determination of map unit composition byrandom selection of transects. Soil Sci. Soc. Am. J. 43:156–160.
Wilding, L.P. 1985. Spatial variability: Its documentation, accommodation,and implications to soil surveys. In Soil spatial variability. D.R. Nielsenand J. Bouma (editors). Pudoc Publishers, Wageningen, Netherlands,pp. 166–189.