greenville technical college · 2018-09-27 · financial report as a discreetly presented component...
TRANSCRIPT


Greenville Technical College Comprehensive Annual Financial Report A Component Unit of the State of South Carolina Fiscal Years Ended June 30, 2018 and June 30, 2017
2018 Comprehensive Annual Financial Report | i
INTRODUCTORY SECTION.................................................................................................... 1
President’s Letter ....................................................................................................................................... 3
List of Area Commissioners and Officers .................................................................................................. 5
Organizational Chart .................................................................................................................................. 7
Letter of Transmittal ................................................................................................................................... 9
Certificate of Achievement ...................................................................................................................... 15
FINANCIAL SECTION ........................................................................................................... 17
Independent Auditor’s Report .................................................................................................................. 19
Management’s Discussion and Analysis ................................................................................................. 23
Basic Financial Statements ..................................................................................................................... 35
Statement of Net Position ............................................................................................................................... 37
Statement of Revenues, Expenses, and Changes in Net Position .................................................................. 38
Statement of Cash Flows ................................................................................................................................ 39
Component Unit Consolidated Statement of Financial Position ...................................................................... 40
Component Unit Consolidated Statement of Activities for Year Ended December 31, 2017 .......................... 41
Component Unit Consolidated Statement of Activities for Year Ended December 31, 2016 .......................... 42
Notes to Financial Statements ........................................................................................................................ 43
Required Supplementary Information .................................................................................................... 101
STATISTICAL SECTION ...................................................................................................... 105
Statistical Section Content Explanation................................................................................................. 107
Financial Trends .................................................................................................................................... 109
Schedule 1: Net Position and Changes in Net Position ...................................................................................... 111
Schedule 2: Operating Expenses by Function ................................................................................................... 112
Chart 1: Expenses by Function for Year Ended June 30, 2018 .................................................................... 114
Chart 2: Ten Year Revenue and Expense Comparison – Auxiliary Enterprises............................................ 114
Chart 3: Ten Year Expense Comparison – Instruction, Academic Support, Student Support ....................... 115
Chart 4: Ten Year Expense Comparison – Other Functional Areas .............................................................. 115
Schedule 3: Expenses by Use ........................................................................................................................... 116
Revenue Capacity ................................................................................................................................. 119
Schedule 4: Ten Year Revenue Comparison by Source .................................................................................... 120
Chart 5: Revenues by Source for Year Ended June 30, 2018 ...................................................................... 122
Chart 6: Ten Year Revenue Comparison by Source ..................................................................................... 123

Greenville Technical College Comprehensive Annual Financial Report A Component Unit of the State of South Carolina Fiscal Years Ended June 30, 2018 and June 30, 2017 (continued)
ii | Greenville Technical College
Chart 7: Ten Year Revenue and Expense Comparison ............................................................................... 123
Schedule 5: Annual Tuition and Fees ................................................................................................................ 124
Schedule 6: Admissions Statistics...................................................................................................................... 126
Schedule 7: Student Fall Enrollment Demographics .......................................................................................... 127
Chart 8: Fall Enrollment Demographics – Gender, Race, and Residency .................................................... 128
Chart 9: Ten Year Comparison – Student Headcount / FTE ......................................................................... 129
Chart 10: Distance Learning Enrollments...................................................................................................... 130
Schedule 8: Continuing Education Division Statistics ........................................................................................ 131
Debt Capacity ........................................................................................................................................ 133
Schedule 9: Ratios of Outstanding Debt ............................................................................................................ 134
Schedule 10: Bond Coverage ........................................................................................................................... 135
Demographic & Economic Information .................................................................................................. 137
Schedule 11: Economic Indicators for Service Area .......................................................................................... 138
Schedule 12: Principal Employers in Service Area ............................................................................................ 139
Operating Information ............................................................................................................................ 141
Schedule 13: Faculty and Staff Statistics ........................................................................................................... 142
Schedule 14: Space Utilization........................................................................................................................... 143
Other Information ................................................................................................................................... 145
Schedule 15: Instructional Programs ................................................................................................................. 146
Schedule 16: College Accreditation and Non-Discrimination Policy ................................................................... 149
SINGLE AUDIT SECTION ................................................................................................... 151
Independent Auditors' Report on Internal Control Over Financial Reporting And On Compliance and Other Matters Based On An Audit Of Financial Statements Performed In Accordance With Government Auditing Standards ................................................................................................................................ 153
Independent Auditors' Report On Compliance For Each Major Program And On Internal Control over Compliance Required by the Uniform Guidance ................................................................................... 155
Schedule of Expenditures of Federal Awards for the Year Ended June 30, 2018 ................................ 158
Notes to Schedule of Expenditures of Federal Awards for the Year Ended June 30, 2018 ................. 160
Summary Schedule of Prior Audit Findings........................................................................................... 161
Schedule of Findings and Questioned Costs ........................................................................................ 162

2018 Comprehensive Annual Financial Report | 1
INTRODUCTORY SECTION
A COMPONENT UNIT OF THE STATE OF SOUTH CAROLINA

2 | Greenville Technical College

2018 Comprehensive Annual Financial Report | 3
President’s Letter
September 19, 2018
Members of the Greenville Technical College Commission and the Community:
This Comprehensive Annual Financial Report includes information on the operations, resources, and expenditures of Greenville Technical College (GTC). Review this report, and you will see that we are fortunate to be in a strong financial position.
Our mission is to transform lives through education as we help the community thrive by building a strong workforce. Partnerships with employers, lawmakers, and other leaders provide the support and resources we need to make the most of opportunities.
This year, for example, we have partnered with the South Carolina Army National Guard to open a shared facility that maximizes use of a building at the South Carolina Technology and Aviation Center as it saves taxpayer dollars. At the new facility, GTC has room to expand enrollment in the Aircraft Maintenance Technology program to better meet needs for aviation employers. Training will also be offered to SC Army National Guard personnel, supporting their need for qualified Airframe and Powerplant (A&P) technicians to work on Lakota helicopters.
Thanks to a partnership with Clemson University, a Vehicle Assembly Center for advanced manufacturing education, research, and workforce development is located at GTC’s Center for Manufacturing Innovation. The center brings together graduate automotive engineering students, undergraduate students, and technicians in training to work with world-class researchers on the latest manufacturing technologies.
Our employer partners across the community continue to ensure that our programs are teaching the skills needed now and in the future and that our instructors have the best tools available to teach those skills. Donations allowed us to purchase more than a million dollars in equipment in 2017-18, ensuring that the hands-on education students gain is relevant to the workplace.
Our progress, as always, is made possible with the support of our community. Partnerships allow us to offer the highest quality education to our students and to impact the economy by giving employers the qualified people they need to grow.
Respectfully,
Keith Miller, Ph.D.
President

4 | Greenville Technical College

2018 Comprehensive Annual Financial Report | 5
GREENVILLE TECHNICAL COLLEGE List of Area Commissioners and Officers
For Year Ended June 30, 2018
AREA COMMISSION MEMBER DISTRICT TERM EXPIRES Mr. Coleman Shouse (Chair) 22 & 24 May 31, 2021 Mr. Ray Lattimore (Vice Chair) 27 & 28 May 31, 2021 Mr. Hunter Howard (Secretary) At-Large May 31, 2020 Mr. Kenneth Southerlin (Treasurer) At-Large May 31, 2021 Mr. Paul Batson 16, 21 & 35 May 31, 2019 Mr. James Blakely 10, 17 & 19 May 31, 2022 Ms. Jo Watson Hackl At-Large May 31, 2019 Mr. Dean Jones At-Large May 31, 2022 Mr. Ray Martin 23 & 25 May 31, 2020 Mr. W. Burke Royster At-Large May 31, 2022 Mr. Keith Smith 18, 20 & 36 May 31, 2019 Mr. David K. Stafford At-Large May 31, 2020 KEY ADMINISTRATIVE STAFF Dr. Keith Miller President Ms. Jacqueline R. DiMaggio Vice President for Finance Dr. Matteel Jones Vice President for Student Services Ms. Lauren Simer Vice President for Institutional Effectiveness Dr. Jermaine Whirl Vice President of Learning and Workforce Development Ms. Ann Wright Vice President for Advancement Ms. Susan M. Jones Associate Vice President for Human Resources
Ms. Wendy Walden Associate Vice President for Executive Affairs
Area Served by the Commission
Greenville County
County Providing Financial Support
Greenville County

6 | Greenville Technical College

2018 Comprehensive Annual Financial Report | 7
GREENVILLE TECHNICAL COLLEGE Organizational Chart
For Year Ended June 30, 2018
State Board for Technical and
Comprehensive Education
Greenville Technical College
Area Commission
Greenville Technical College President
Dr. Keith Miller
VP for Finance
Jacqueline DiMaggio
VP for Learning & Workforce
Development
Jermaine Whirl
VP for Institutional Effectiveness
Lauren Simer
VP for Advancement
Ann Wright
VP for Student Services
Matteel Jones
Associate VP for Human Resources
Susan Jones
Associate VP for Executive Affairs
Wendy Walden

8 | Greenville Technical College

2018 Comprehensive Annual Financial Report | 9
Letter of Transmittal
September 19, 2018
To the Members of the Area Commission for Greenville Technical College:
We are pleased to present the Comprehensive Annual Financial Report (CAFR) of Greenville Technical College for the fiscal year that ended June 30, 2018.
State law, federal guidelines and certain debt covenants require an annual audit of the financial records. Greenville Technical College (the “college”) contracted with the independent certified public accounting firm of Cline, Brandt, Kochenower and Company, P.A. to perform the annual audit of its financial statements and federal assistance programs. The Independent Auditor’s Report is included in the financial section of this CAFR and reflects an unmodified opinion on the basic financial statements. As a recipient of federal financial awards, the college complies with the requirements of the Single Audit Act, and separate single audit reports have been issued, which are included in the Federal Awards section.
The management of the college is responsible for the accuracy of the data presented and the completeness and fairness of the presentation, including all disclosures. To the best of our knowledge and belief, the information presented is accurate in all material respects and is comparable to peer institutions. All disclosures have been included and will provide the reader with a reasonable understanding of the college’s financial activities that support its mission.
The management of the college is responsible for establishing and maintaining the framework of all internal control. In fulfilling this responsibility, estimates and judgments are required to assess the expected benefits and costs of policies and procedures related to the internal control framework. Because the cost of a control should not exceed the benefits to be derived, the objective is to provide reasonable, rather than absolute, assurance that the financial statements are free of any material misstatements. The system of internal control is designed to ensure that certain organizational objectives are met. Accordingly, organizational structure, policies and procedures have been established to safeguard assets; ensure the reliability of accounting data; promote efficient operations; and ensure compliance with established governmental laws, regulations and policies, college policies, and other requirements of those to whom the college is accountable. The Management’s Discussion and Analysis included in the Financial Section provides a detailed explanation of the changes in financial reporting from the prior year and the resulting effects of those changes, and should be read in conjunction with this letter of transmittal.
PROFILE OF THE COLLEGE
Greenville Technical College is one of sixteen technical colleges that comprise the South Carolina Technical College System, which is an agency of the state of South Carolina. The college is a part of the state of South Carolina’s primary government and is included in the state’s Comprehensive Annual Financial Report as a discreetly presented component unit. Greenville Technical College is a comprehensive, public two-year institution that serves Greenville County in the Upstate of South Carolina.
The college has five campuses and two other teaching locations in Greenville County. The college also delivers instruction in various businesses, industries and public schools located in its service area and provides opportunities for students to take classes on the Internet that lead to a degree.
The college’s governing board, the Area Commission (the “commission”), is appointed by the Greenville County Legislative Delegation. There are twelve commissioners appointed to four-year terms. Six are appointed by house district residency seat and six serve at-large. The members representing the Greenville County School Board and Workforce Investment Board serve as ex-officio. However, all twelve members have full voting privileges.

10 | Greenville Technical College
State law mandates Greenville County to provide sufficient funding to build, maintain and operate the college’s physical plant.
Greenville Tech Foundation, Inc. (the “foundation”) was established in 1973 in Greenville, South Carolina as an eleemosynary organization. The primary objective of the foundation is to support the education at Greenville Technical College through financial assistance to the college and its students. During December 2002, the foundation formed a wholly owned subsidiary, GTF McAlister, LLC, which owns and operates the interior portion of the McAlister Square mall. In 2004, the foundation formed a wholly owned subsidiary, GTF Student Housing, LLC. This subsidiary is responsible for the building and maintenance of student housing on Greenville Technical College’s Barton Campus. Student housing opened during Fall Semester 2006. During 2007, the foundation formed a wholly owned subsidiary, Brashier Charter, LLC. This subsidiary is responsible for the construction and operation of the building housing the charter school on the Brashier Campus of Greenville Technical College, which opened in August 2009.
The college’s strategic planning process directly impacts the preparation of the budget. The original operating budget is based on preliminary estimates and is approved by the commission each year. The college maintains controls in line item budgets, budget transfer restrictions, and in the use of an encumbrance accounting system. These budgetary controls ensure compliance with the annual budget adopted by the governing board. As demonstrated by the financial statements and schedules included in the financial section of this report, college management continues to meet its responsibility for sound fiscal administration.
ECONOMIC CONDITION AND OUTLOOK
A primary mission of technical colleges is to support economic development through education and training. Greenville Technical College (GTC), like all public higher education institutions in South Carolina, is linked to the economic condition of the state and is subject to the funding priorities established by the General Assembly. Additionally, because the college’s financial condition is closely connected to the economy in its service area, it is also subject to the priorities of local government.
The college serves Greenville County, the largest county in the state. Greenville is also the center of the largest metropolitan statistical area in South Carolina. The Upstate is located on the I-85 corridor halfway between Charlotte and Atlanta.
Greenville County is the centerpiece of the region considered to be the “economic engine of South Carolina” and the most populous county in the state. Since its beginning as a small farming community in 1786, Greenville County has grown into a large and diverse metropolitan area and one of the Southeast region’s premier areas for business. Over the past 35 years, Greenville has transformed itself from the textile capital of the world to a destination for a diverse industry base that includes corporate offices, manufacturing, and warehousing/distribution operations. Greenville is now home to world-class companies such as Lockheed,
General Electric, and TD Bank.
Businesses are drawn to the Greenville, SC area by our favorable tax rates, market accessibility, and the quality and availability of our workforce. In fact, workforce is often found at the top of the considerations list when companies make a site selection.
Further evidence of our area's strong economic growth is readily available: Greenville County has announced over $1.2 billion in new capital investment and 8,940 new jobs in the last five years, while the SC Department of Commerce indicates that Greenville is home to more corporate headquarters than any other region in SC.
With a wealth of pro-business amenities and a well-diversified existing business and industry base, Greenville, SC is positioned for continued economic growth. Manufacturing, biosciences, and other key industry sectors will find that the region provides an inviting, robust environment that supports their success.
GTC has a long history of providing world-class training to business and Industry. Given the economic climate in the area, the long-standing success of the college and the ongoing attraction of new business and industry, the college and the community are well positioned to continue to grow and prosper.

2018 Comprehensive Annual Financial Report | 11
MAJOR INITIATIVES
As the Center for Manufacturing Innovation (CMI) celebrates its second year of operation, a new Vehicle Assembly Center for advanced manufacturing education has opened in partnership with Clemson University. The center brings together graduate automotive engineering students, undergraduate students, and technicians in training to work with world-class researchers on the latest manufacturing technologies.
Through a partnership with the South Carolina Army National Guard, a shared facility opened at the South Carolina Technology and Aviation Center. The new facility maximizes use of a building with the Guard utilizing space on weekends and the college teaching classes during the week. At the new facility, GTC has room to expand enrollment in the Aircraft Maintenance Technology program to better meet needs for aviation employers, and training will be offered to SC Army National Guard personnel.
A new initiative at GTC allows students to gain the skills to become CNC operators through 80 intensive hours of focused training. Those completing the program go from start to finish in two weeks, leaving them qualified to work in the manufacturing environment as entry-level CNC operators and prepared for the interviews available to them as “80 to Work” completers. After training, students receive an additional six months of mentoring while accessing a clear pathway for them to further their education through an associate degree.
The college received the 2017 Higher Education Excellence in Diversity (HEED) Award from INSIGHT Into Diversity magazine, the oldest and largest diversity-focused publication in higher education. As a recipient of the 2017 HEED award, GTC joined 79 other recipients nationwide. Only three colleges in South Carolina were recognized in 2017 – Greenville Technical College, Clemson University, and the University of South Carolina.
GTC is proud to serve one of the largest veteran and active military student populations in South Carolina and is a designated Military Friendly® institution. As part of a new initiative to increase and improve services to this population, the college celebrated the opening of three new Student Veterans Centers on the Barton, Benson and Northwest campuses. The Barton Campus is actually a reopening as the center is now located in the Student Center.
MISSION STATEMENT
VISION
Greenville Technical College is recognized as a world-class learning institution where students from all backgrounds and life stages find flexible career and educational opportunities of the highest quality and value. By collaborating with community and business leaders, the college is a primary driver of economic growth through workforce development.
MISSION
Greenville Technical College transforms students’ lives and helps our community thrive by providing a world-class, affordable education to students and building an educated, engaged workforce committed to life-long learning.
ROLE AND SCOPE
Greenville Technical College is one of the largest public two-year colleges in South Carolina. The college provides exceptional learning opportunities primarily to the residents of Greenville County.
Curricular offerings include (1) certificates, diplomas and associate degrees in business, computer technology, health sciences, engineering technologies, industrial technologies, and public service; and (2) university transfer courses and associate degrees.
The college also provides an extensive offering of continuing education courses for occupational advancement and personal interest, as well as economic development services that encourage business and industrial growth in a diverse economic community.

12 | Greenville Technical College
In addition, transitional courses serve under-prepared students seeking to enter a program of study. Upon completion of their educational goals, the majority of graduates either are employed in fields related to their programs of study or transfer to four-year colleges and universities.
Since the college is an open admission institution, students come from diverse socioeconomic and educational backgrounds. Affordable education is provided through traditional and electronic means at times and locations convenient to students. Faculty and staff are student-centered, flexible, and recognized in their fields. Various educational support services are provided to facilitate the teaching/learning process and to enhance the academic and personal development of the student, including an emphasis on articulation with local high schools and other colleges and universities.
VALUES
Greenville Technical College is committed to the following values:
Learning: We are committed to providing transformative learning opportunities that enable
individual and community achievement and that are affordable and accessible for all members of our community and promote a culture of life-long learning.
Integrity: We believe trust is an essential element in a safe and effective learning
environment, so we promote and foster openness, honesty, respect, and fairness.
Diversity: We recognize and celebrate diversity, so we value and support considerate,
meaningful communication and inclusiveness in collaborative decision-making processes.
Cooperation: We value collaboration and teamwork, so we foster caring, professional
relationships among students, employees, and our community in an effort to expand partnerships.
Excellence: We value continuous improvement, so we encourage innovation, creative
problem-solving and responsible risk-taking as we act courageously, deliberately, and systematically to enhance and enrich our learning environment and our community.
Accountability: We value students, faculty, and staff, so we recognize their contributions,
encourage their professional development, and regularly evaluate performance to improve learning outcomes, programs, processes, and services.
STRATEGIC IMPERATIVES
Greenville Technical College has identified the following strategic imperatives as critical to our future success:
Teaching and Learning
Student Access and Success
Employee Development
Operational Excellence and Accountability
Community Engagement
CERTIFICATE OF ACHIEVEMENT FOR EXCELLENCE IN FINANCIAL REPORTING
The Government Finance Officers Association of the United States and Canada (GFOA) awarded a Certificate of Achievement for Excellence in Financial Reporting to Greenville Technical College for its comprehensive annual financial report for the fiscal year that ended June 30, 2017. In order to be awarded a Certificate of Achievement, a government unit must publish an easily readable and efficiently organized comprehensive annual financial report. This report must satisfy both generally accepted accounting principles and applicable legal requirements.
A Certificate of Achievement is valid for a period of one year only. We believe that our current comprehensive annual financial report continues to meet the Certificate of Achievement Program’s requirements and we are submitting it to the GFOA to determine its eligibility for another certificate.

2018 Comprehensive Annual Financial Report | 13
ACKNOWLEDGEMENTS
It is incumbent upon us to thank the Greenville Technical College Area Commission and the president of the college for their interest and support in conducting the fiscal affairs of the college in a highly responsible and professional manner. The preparation of this report on a timely basis could not have been accomplished without the efficient and dedicated services of the entire Financial Affairs staff and other departments and individuals who assisted in the preparation of this report. Our appreciation is also expressed to our independent auditors, Cline, Brandt, Kochenower and Company, for the timely completion of the audit.
Sincerely,
Jacqueline R. DiMaggio Vice President for Finance

14 | Greenville Technical College

2018 Comprehensive Annual Financial Report | 15
Certificate of Achievement

16 | Greenville Technical College

2018 Comprehensive Annual Financial Report | 17
FINANCIAL SECTION
A COMPONENT UNIT OF THE STATE OF SOUTH CAROLINA

18 | Greenville Technical College

2018 Comprehensive Annual Financial Report | 19
Independent Auditor’s Report

20 | Greenville Technical College

2018 Comprehensive Annual Financial Report | 21

22 | Greenville Technical College

2018 Comprehensive Annual Financial Report | 23
Management’s Discussion and Analysis
Greenville Technical College (the “college”) is pleased to present its financial report and management’s discussion and analysis of the college’s financial performance for the fiscal year ended June 30, 2018. This report is a narrative overview and analysis of the financial activities of the college. It focuses on current activities, resulting change and currently known facts, and provides a comparison with the prior fiscal year. This discussion should be read in conjunction with the financial statements and the accompanying notes which follow this section.
OVERVIEW OF THE FINANCIAL STATEMENTS
This report consists of a series of financial statements, prepared in accordance with the Governmental Accounting Standards Board (GASB) in Statement No. 34, Basic Financial Statements and Management’s Discussion and Analysis – for State and Local Governments and Statement No. 35, Basic Financial Statements – and Management’s Discussion and Analysis – for Colleges and Universities.
The college is engaged only in Business-Type Activities (BTA) that are financed in part by fees charged to students for educational services. Accordingly, its activities are reported using the three financial statements required for proprietary funds: the Statement of Net Position; the Statement of Revenues, Expenses and Changes in Net Position; and the Statement of Cash Flows. These statements present financial information in a format similar to that used by the private sector.
In accordance with GASB Statement No. 39, Determining Whether Certain Organizations are Component Units, the college has included the Greenville Tech Foundation, Inc. and Subsidiaries (the “foundation”) and the Greenville Technical College Enterprise Campus Authority (the “authority”) in its financial statements. The college reports the foundation as a discreetly presented non-governmental component unit, and its Consolidated Statement of Financial Position, Statement of Activities and Statement of Cash Flows are presented along with the college’s basic financial statements. The governing body of the authority is essentially the same Board as that of the college and it provides services that benefit the college, although it does not provide services directly to the college; therefore the authority is reported as a blended component unit and the activity is included in the financial statements of the college.
STATEMENT OF NET POSITION
The Statement of Net Position presents the financial position of the college at the end of the fiscal year and classifies assets and liabilities into current and non-current categories. The Statement of Net Position is a “point in time” financial statement, which presents to the reader a snapshot of the end of the year financial data. Assets are property owned by the college. Liabilities are what the college owes to others. Current assets are generally expected to be converted into cash, sold or consumed within a year. Current liabilities are obligations that are due to be paid within the year. Noncurrent assets and liabilities are those that are longer term in nature.
Net position represents the difference between total assets and total liabilities. Net financial position is displayed in three broad categories: net investment in capital assets, restricted and unrestricted. Net position is one indicator of the current financial condition of the college, while the change in net position is an indicator that the overall financial condition has improved or deteriorated during the year.
In fiscal year 2018, the college’s net position decreased significantly as a result of the implementation of GASB Statement No. 75, Accounting and Financial Reporting for Postemployment Benefits Other Than Pensions. The prior year’s net position was restated for consistency, the resulting decrease in the college’s
24 | Greenville Technical College
net position is not indicative of a deterioration of the financial condition of the college. For additional information see Note 10.
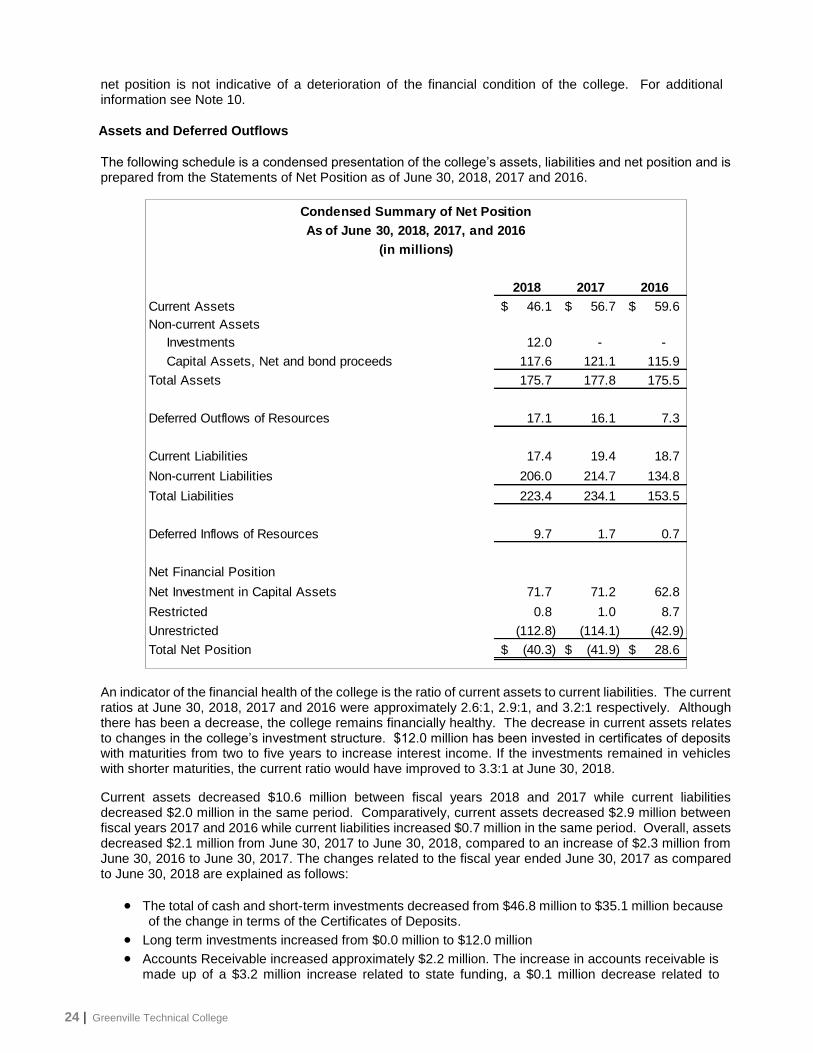
Assets and Deferred Outflows
The following schedule is a condensed presentation of the college’s assets, liabilities and net position and is prepared from the Statements of Net Position as of June 30, 2018, 2017 and 2016.
An indicator of the financial health of the college is the ratio of current assets to current liabilities. The current ratios at June 30, 2018, 2017 and 2016 were approximately 2.6:1, 2.9:1, and 3.2:1 respectively. Although there has been a decrease, the college remains financially healthy. The decrease in current assets relates to changes in the college’s investment structure. $12.0 million has been invested in certificates of deposits with maturities from two to five years to increase interest income. If the investments remained in vehicles with shorter maturities, the current ratio would have improved to 3.3:1 at June 30, 2018.
Current assets decreased $10.6 million between fiscal years 2018 and 2017 while current liabilities decreased $2.0 million in the same period. Comparatively, current assets decreased $2.9 million between fiscal years 2017 and 2016 while current liabilities increased $0.7 million in the same period. Overall, assets decreased $2.1 million from June 30, 2017 to June 30, 2018, compared to an increase of $2.3 million from June 30, 2016 to June 30, 2017. The changes related to the fiscal year ended June 30, 2017 as compared to June 30, 2018 are explained as follows:
The total of cash and short-term investments decreased from $46.8 million to $35.1 million because of the change in terms of the Certificates of Deposits.
Long term investments increased from $0.0 million to $12.0 million
Accounts Receivable increased approximately $2.2 million. The increase in accounts receivable is made up of a $3.2 million increase related to state funding, a $0.1 million decrease related to
2018 2017 2016
Current Assets 46.1$ 56.7$ 59.6$
Non-current Assets
Investments 12.0 - -
Capital Assets, Net and bond proceeds 117.6 121.1 115.9
Total Assets 175.7 177.8 175.5
Deferred Outflows of Resources 17.1 16.1 7.3
Current Liabilities 17.4 19.4 18.7
Non-current Liabilities 206.0 214.7 134.8
Total Liabilities 223.4 234.1 153.5
Deferred Inflows of Resources 9.7 1.7 0.7
Net Financial Position
Net Investment in Capital Assets 71.7 71.2 62.8
Restricted 0.8 1.0 8.7
Unrestricted (112.8) (114.1) (42.9)
Total Net Position (40.3)$ (41.9)$ 28.6$
Condensed Summary of Net Position
As of June 30, 2018, 2017, and 2016
(in millions)

2018 Comprehensive Annual Financial Report | 25
receivables from the students and $0.9 million decrease from the Greenville Tech Foundation. The college decreased its allowance for doubtful account balance approximately $0.7 million. The allowance decreased to $4.1 million at June 30, 2018 from $4.8 million for the prior year. This decrease was the result of lower student receivables, improved collection results and improvements in Financial Aid processes ensuring eligible students have completed the financial aid process prior to the start of classes. The college determined that current level is adequate. (See Note 4 for additional information).
Bond proceeds receivables decreased $1.3 million. This is related to the General Obligation Bonds issued by Greenville County for the college. The bond issue was $25.0 million. The funds were drawn down as they were expended to construct the Center for Manufacturing Innovation. The building officially opened in August of 2016. Additional work on the gateway project and collaboration space were completed in fiscal year 2018.
The changes related to the fiscal year ended June 30, 2017 as compared to June 30, 2016 are explained as follows:
The total of cash and investments increased from $46.0 million to $46.8 million.
Accounts Receivable decreased approximately $1.4 million. The decrease in accounts receivable is made up of a $3.5 million decrease related to federal grantors, a $0.1 million decrease related to receivables from the students, a $1.2 million increase from the state and $0.9 million increase from the Greenville Tech Foundation. The college decreased its allowance for doubtful account balance approximately $0.4 million. The allowance decreased to $4.9 million at June 30, 2017 from $5.3 million for the prior year. This decrease was the result of lower student receivables, improved collection results and improvements in Financial Aid processes ensuring eligible students have completed the financial aid process prior to the start of classes. The college determined that current level is adequate. (See Note 4 for additional information).
Bond proceeds receivables decreased $1.9 million. This is related to the General Obligation Bonds issued by Greenville County for the college. The bond issue was $25.0 million. The funds were drawn down as they were expended to construct the Center for Manufacturing Innovation. The building officially opened in August of 2016. Additional work on the gateway project and collaboration space was nearing completion.
Contributing factors to the changes in non-current assets from June 30, 2017 to June 30, 2018 were:
Construction in progress decreased $25.6 million primarily because of the capitalization of the Center for Manufacturing Innovation.
Machinery & equipment increased $0.5 million. This was the net result of purchases of equipment primarily for the Aviation Training Center.
Depreciation expense was $5.5 million and $0.1 million was eliminated. See Note 8 for additional information. Accumulated depreciation increased $5.4 million as a net result of the depreciation expense and the retirement of fully depreciated equipment.
Contributing factors to the changes in non-current assets from June 30, 2016 to June 30, 2017 were:
Construction in progress increased $7.5 million primarily because of the construction of the Center for Manufacturing Innovation.
Machinery & equipment increased $2.2 million. This was the net result of purchases of equipment primarily for the Center for Manufacturing Innovation and transfers of equipment to sub-recipients of U.S. Department of Labor's Trade Adjustment Assistance Community College and Career Training (TAACCCT) grant program grant which was required at the close of the grant.
Depreciation expense was $5.3 million and $0.7 million was eliminated. See Note 8 for additional information. Accumulated depreciation increased $4.6 million as a net result of the depreciation expense and retirements of assets.

26 | Greenville Technical College
Liabilities and Deferred Inflows
Total liabilities decreased $10.7 million between fiscal years 2018 and 2017, from $234.1 million to $223.4 million. Comparatively, liabilities increased $80.6 million between fiscal years 2017 and 2016, from $153.5 million to $234.1 million. Current liabilities at June 30, 2018 decreased by $2.0 million from June 30, 2017 primarily as a result of decreases in unearned revenue and accrued payroll liabilities. Current liabilities at June 30, 2017 increased by $0.7 million from June 30, 2016 primarily as a result of increases in unearned revenue and funds held for others. These increases were partially offset by decreases in accounts payable.
Non-current liabilities decreased $8.7 million from June 30, 2017 as compared to June 30, 2018, as a result of a decrease in the newly recorded net other post-employment benefits liability (see Note 10 for additional information) of $4.9 million. Fiscal year 2017 was restated and the restatement included a net other post-employment benefits liability of $76.6 million. In addition to the decrease in the net other post-employment benefits liability were decreases in bonds and capital leases payable of $5.1 million and compensated absences payable of $0.7 million.
Non-current liabilities increased $79.9 million from June 30, 2016 as compared to June 30, 2017, as a result of an increase in the net pension liability of $8.3 million and the addition of the net other post-employment benefits liability of $76.6 million. This was partially offset by decreases in bonds and capital leases payable. At June 30, 2015, $73.2 million resulted from the implementation of GASB Statement No. 68 Accounting and Financial Reporting for Pensions. GASB Statement No. 68 affects reporting requirements for employers participating in the pension plans and was effective for fiscal periods beginning after June 15, 2014. This standard changes the way participating employers, including the college, report the cost of and liability for employee pension benefits in their financial statements. Greenville Technical College implemented these changes beginning with their financial statements for the fiscal year ended June 30, 2015.
At June 30, 2018, the liability of $71.7 million was a result of the implementation of GASB Statement No. 75, Accounting and Financial Reporting for Postemployment Benefits Other Than Pensions. A liability of $76.6 million is shown in the prior year. This prior year restatement is for comparison only. GASB Statement No. 75 affects reporting requirements for employers offering post-employment benefits and was effective for fiscal periods beginning after June 15, 2018. This standard changes the way participating employers, including the college, report the cost of and liability for postemployment benefits. The state provides post-employment health and dental and long-term disability benefits to retired state employees and their covered dependents. Greenville Technical College implemented these changes beginning with their financial statements for the fiscal year ended June 30, 2018. For additional information see Note 10.
2018 2017 2016
Land and Land Improvements 22.2$ 19.6$ 19.6$
Buildings and Improvements 158.9 134.8 134.8
Machinery and Equipment 19.8 19.3 17.1
Vehicles 2.7 2.5 2.4
Construction in Progress 6.1 31.6 24.1
209.7 207.8 198.0
Less: Accumulated Depreciation (92.1) (86.7) (82.1)
Net Capital Assets 117.6$ 121.1$ 115.9$
Analysis of Capital Assets
As of June 30, 2018, 2017, and 2016
(in millions)

2018 Comprehensive Annual Financial Report | 27
Net Position
The net position at June 30, 2018 was negative $40.3 million, an increase of $1.6 million from the prior fiscal year balance of negative $41.9 million, a 3.8 percent increase. The net position at June 30, 2017 was negative $41.9 million, a decrease of $70.5 million from the prior fiscal year balance of $28.6 million, a 246.5 percent decrease. Investment in capital assets at June 30, 2018 and June 30, 2017, were $71.7 million and $71.2 million, respectively, a $0.5 million increase as compared to an $8.4 million increase from the June 30, 2016 balance of $62.8 million. Restricted net position decreased by $ 0.2 million at June 30, 2018 as a result of the completion or near completion of construction and renovation projects. Restricted net position decreased by $7.7 million at June 30, 2017 as a result of the completion or near completion of construction and renovation projects. Unrestricted net position as of June 30, 2018 increased $1.3 million to negative $112.8 million from the prior fiscal year balance of negative $114.1 million. Planned uses for unrestricted net position as of June 30, 2018 can be found in Note 11. The negative $114.1 million total for unrestricted net position at June 30, 2017 decreased $71.2 million from the June 30, 2016 balance of negative $42.9 million. Net investment in capital assets increased $0.5 million to $71.7 million in fiscal year 2018 and increased $8.4 million to $71.2 million in fiscal year 2017. This was due to the net effect of payments on bonds, depreciation expense and the addition and retirement of other assets. An analysis of net assets for fiscal years ended June 30, 2018, 2017, and 2016 follows:
Restricted net position decreased $0.2 million in fiscal year 2018 as a result of the decrease in construction commitments related to the Aviation Center. Restricted net position decreased $7.7 million in fiscal year 2017 from the June 30, 2016 balance of $8.7 million as a result of decrease in construction commitments related to the Center for Manufacturing Innovation.
Net Position 2018 2017 2016
Net Investment in Capital Assets 71.7$ 71.2$ 62.8$
Restricted 0.8 1.0 8.7
Unrestricted (112.8) (114.1) (42.9)
Total (40.3)$ (41.9)$ 28.6$
Analysis of Net Position
Fiscal Years Ended June 30, 2018, 2017 and 2016
(in millions)
Net Investment in Capital
AssetsRestricted Unrestricted
2018 71.7 0.8 (112.8)
2017 71.2 1.0 (114.1)
2016 62.8 8.7 (42.9)
71.7
0.8
(112.8)
71.2
1.0
(114.1)
62.8
8.7
(42.9)
(150.0)
(100.0)
(50.0)
-
50.0
100.0
Comparative Net PositionFiscal Years 2018, 2017 and 2016
(in millions)
2018 2017 2016

28 | Greenville Technical College
For the fiscal year ending June 30, 2015, as a result of the implementation of GASB Statement No. 68, Accounting and Financial Reporting for Pensions, the college was required to recognize a portion of the unfunded net pension liability of the cost sharing plan. Recognition of this liability had a material impact on the college’s unrestricted net position. Additionally, for the fiscal year ending June 30, 2018, as a result of the implementation of GASB Statement No. 75, Accounting and Financial Reporting for Postemployment Benefits Other Than Pensions, the college was required to recognize a portion of the unfunded net liability for post-employment health and dental and long-term disability benefits to retired state employees and their covered dependents. Recognition of this liability had an additional another material impact on the college’s overall net position.
.
STATEMENT OF REVENUES, EXPENSES AND CHANGES IN NET POSITION
The purpose of the Statement of Revenues, Expenses and Changes in Net Position is to provide an entity- wide perspective on revenues and expenses, which are categorized as operating and non-operating and are reported by natural classification. A public institution’s reliance on state and local appropriations results in operating losses as GASB requires classification of appropriations as non-operating revenues. As a result, the college will always reflect an operating deficit due to this reliance on state and local funding.
Operating Results
The following schedules summarize the college’s operating results for fiscal year ended June 30, 2018 with comparative data for fiscal years ended June 30, 2017 and June 30, 2016.
2018 2017 2016
Operating Revenues
Tuition and Fees 24.5$ 26.8$ 26.4$
Federal Grants and Contracts 3.9 4.2 6.6
State and Local Grants and Contracts 15.8 15.3 13.5
Auxiliary 4.2 4.5 4.9
Other 3.1 2.5 2.3
Total 51.5 53.3 53.7
Less Operating Expenses 103.7 107.4 104.7
Net Operating Loss (52.2) (54.1) (51.0)
Non-Operating Revenues (expenses)
State Appropriations 18.6 19.6 17.8
State and Local Grants and Contracts 0.7 0.6 0.8
Federal Grants and Contracts 20.9 20.3 22.2
County Appropriations 12.7 12.0 12.0
Gain/(loss) on disposal of fixed assets 0.1 - -
Interest Expense (1.1) (1.2) (1.2)
Interest Income 0.6 0.4 0.3
Total 52.5 51.7 51.9
State Capital Appropriations 1.3 6.4 1.1
Capital Donations and transfers - (0.1) -
Increase in Net Position 1.6 3.9 2.0
Net Position (beginning of year) (41.9) 28.6 26.6
Cumulative Effect of GASB 75 (74.4)
Net Position (end of year) (40.3) (41.9) 28.6
Total Revenues 106.3 112.5 107.9
Operating Results for the Years Ended
June 30, 2018, 2017, and 2016
(in millions)

2018 Comprehensive Annual Financial Report | 29
Revenue
Total revenue decreased $6.2 million, or 5.5 percent, between fiscal years 2017 and 2018, from $112.5 million to $106.3 million. Total revenue increased $4.6 million, or 4.3 percent, between fiscal years 2016 and 2017, from $107.9 million to $112.5 million.
Operating revenue decreased $1.8 million during fiscal year 2018. Decreases in tuition and fees, state appropriations and auxiliary enterprises were partially offset by increases in federal and state grants and contracts, sales and service of educational departments and other operating revenues. Operating revenue in fiscal year 2017 decreased 0.7 percent from $53.7 million to $53.3 million. Decreases in federal grants and contracts and auxiliary enterprises were partially offset by increases in student tuition and fees, state appropriations, sales and service of educational departments and other operating revenues. Net tuition and fees increased $0.4 million in fiscal year 2017 and decreased $2.3 million in fiscal year 2018. Net tuition and fees is tuition and fee revenue decreased by scholarship allowances and bad debt expense. Scholarship allowances represent the amount of students’ tuition and fees that are paid by grants from federal, state, and other sources. (See Note 19 for additional information).
Net auxiliary services revenue decreased $0.3 million in fiscal year 2018 and $0.4 million in fiscal year 2017, this is primarily bookstore sales net of scholarship allowances and bad debt expense. (See Note 19 for additional information).
Non-operating revenue increased by $0.8 million or 1.5 percent during the 2018 fiscal year, while non-operating revenue decreased by $0.2 million or 0.4 percent during the 2017 fiscal year. Federal grants and contracts increased in 2018 as a result of Pell grants being available in the summer term. Federal grants decreased in 2017 as a result of decreases in the number of students eligible and the amount available to students for the Pell grant award. Pell grants increased $0.6 million in fiscal year 2018 and decreased $1.9 million in fiscal year 2017. The increase in federal grants in 2018 was offset by a $1.0 million decrease in state appropriations. The college saw an increase in state appropriations of $1.8 million in fiscal year 2017.
0.0
5.0
10.0
15.0
20.0
25.0
30.0
Tuition and Fees StateAppropriations
LocalAppropriations
FederalGrants/Contracts
StateGrants/Contracts
24.5
18.6
12.7
24.8
16.5
26.8
19.6
12.0
24.5
15.9
26.4
17.8
12.0
28.8
14.3
Major Revenuesfor 2018, 2017 and 2016
(in millions)
2018 2017 2016

30 | Greenville Technical College
State capital appropriations of $1.3 million decreased $5.1 million from 2017 and increased $5.3 million in 2017. The increase in appropriations in 2017 was the result of a special appropriation for equipment for the Center for Manufacturing Innovation. The remainder of the appropriation is for the debt service on the former McAlister Square Mall and operating expenses related to the University Center of Greenville. The costs (debt service and utilities) associated with these appropriations are fixed and recurring while the appropriations are dwindling. This is creating an additional financial strain on the college’s funds. Local appropriations from Greenville County helped to offset some of these decreases. In fiscal year 2018, county appropriations increased $0.7 million to $12.7 million, in fiscal year 2017, county appropriations remained stable at $12.0 million.
Expenses
In fiscal year 2018, operating expenses were $103.7 million, a decrease of $3.7 million or 3.4 percent over fiscal year 2017. In fiscal year 2017, operating expenses $107.4 million, an increase of $2.7 million or 2.6 percent over fiscal year 2016.
Salaries and benefits increased $2.0 million or 3.1 percent during fiscal year 2018. Salaries and benefits increased $1.8 million, or 2.8 percent during fiscal year 2017. The $1.8 million increase in 2017 was related entirely to benefits while salaries remained constant. State mandated increases in contributions to the State Pension fund, increases in the employer share of health insurance and the impact of the implementation of the GASB 68 and GASB 75 are driving the increases in benefit expenses. As a result of the implementation of GASB 68, pension expenses increased $2.4 million in 2018 and $2.6 million in 2017. These were non-cash transactions. The new standard requires a change in the way the plan calculates the net pension liability (NPL) for financial reporting purposes. The GASB requirement of determining the value of assets on hand to cover benefits is tied to “fair market value,” and, because of the inherent volatility of investment market values, may result in more frequent and larger fluctuations in the amount of the pension plan’s NPL for accounting and financial reporting purposes. This $2.4 million current expense and $2.6 million prior year expense is in addition to the $72.1 million liability recorded in fiscal year 2015. Based on the calculation of “fair market value”, the college will see increases or decreases in current year expense that are not related to actual expenditures of cash.
As a result of the implementation of GASB 75 in fiscal year 2018, the college recorded a liability of $71.7 million and additional current year non-cash expenses of $1.9 million in employee benefits for fiscal year 2018. This new standard also requires a change in the way the plan calculates the net liability for other postemployment benefits for financial reporting purposes. The GASB requirement of determining the value of assets on hand to cover benefits is tied to “fair market value,” and, because of the inherent volatility of investment market values, may result in more frequent and larger fluctuations in the amount of the postemployment benefits’ NPL for accounting and financial reporting purposes. This $1.9 million current expense is in addition to the $71.7 million liability recorded in fiscal year 2018. Based on the calculation of “fair market value”, the college will see increases or decreases in current year expenses for employee benefits that are not related to actual expenditures of cash.
Scholarships to students decreased by approximately $1.0 million or 8.3 percent in fiscal year 2018 and $1.5 million or 11.1 percent in fiscal year 2017. The majority of the decreases were related to the changes to awards and eligibility for Pell grants.
Utilities remained stable at $3.0 million in fiscal year 2018 after increasing $0.1 million during fiscal year 2017. The increase is primarily due to the Center for Manufacturing Innovation opening in 2017.
Supplies and other services decreased by $5.0 million or 22.8 percent in fiscal year 2018. In fiscal year 2017, supplies and other services increased by $1.9 million or 9.5 percent. Expenditures in this area increased in 2017 as a result of expenses related to opening the Center for Manufacturing Innovation. There were also several roof and maintenance projects completed in fiscal year 2017. Several new projects are underway and expenditures are expected to increase in fiscal year 2019.
Depreciation expense increased by approximately $0.3 million in fiscal year 2018 after increasing $0.4 million in fiscal year 2017. Depreciation expense increased in fiscal year 2017 when a significant amount of equipment for the Center for Manufacturing Innovation was capitalized. Increases in 2018 were related to the capitalization of the Center for Manufacturing Innovation.

2018 Comprehensive Annual Financial Report | 31
The following charts depict operating expenses by function for fiscal year ended June 30, 2018, 2017 and 2016.
2018 2017 2016
Operating Expenses
Salaries 46.5$ 46.9$ 46.9$
Benefits 20.8 18.4 16.6
Scholarships 11.0 12.0 13.5
Utilities 3.0 3.0 2.9
Supplies and Other Services 16.9 21.9 20.0
Depreciation 5.5 5.2 4.8
103.7$ 107.4$ 104.7$
Operating Expenses
Fiscal Years Ended June 30, 2018, 2017, and 2016
(in millions)
-
5.0
10.0
15.0
20.0
25.0
30.0
35.0
40.0
45.0
50.0
Salaries Benefits Scholarships Utilities Suppliesand OtherServices
Depreciation
46.5
20.8
11.0
3.0
16.9
5.5
46.9
18.4
12.0
3.0
21.9
5.2
46.9
16.6
13.5
2.9
20.0
4.8
Comparison of Operating Expenses Fiscal Years 2018, 2017 and 2016
(in millions)
2018 2017 2016

32 | Greenville Technical College
STATEMENT OF CASH FLOWS
The Statement of Cash Flows is the final statement to be presented. It presents detailed information about the cash activity of the college during the year and provides the reader with the sources and uses of cash by the major categories of operating, non-capital financing, capital and related financing, and investing activities. This statement will always show a net use of cash in the section “Cash Flows from Operating Activities” due to the college’s dependence on state and local appropriations.
The statement is divided into five parts. The first section reflects the operating cash flows and shows the net cash used by the operating activities of the college. The second section reflects cash flows from non-operating financing activities. This section shows the cash received and spent for non-operating, non-investing, and non-capital financing activities. The third section reflects cash flows from capital and related financing activities and shows the cash used for the acquisition and construction of capital and related items. The fourth section reflects the cash flows from investing activities and shows the purchases, proceeds, and interest received from investing activities. The final section reconciles the net cash used to the operating loss reflected on the Statement of Revenues, Expenses and Changes in Net Assets.
In fiscal year 2018, cash decreased by approximately $16.2 million. The net cash used by operating activities in fiscal year 2018 increased by $2.6 million resulting from decreases in tuition and fees and grants and contracts and the timing and amounts of refunds for Federal student loans to students as well as increases in payments to employees. This was offset by decreases in payments to vendors. Cash for fiscal year 2017 increased by approximately $0.7 million. The net cash used by operating activities increased by $2.4 million resulting decreases in tuition and fees, grants and contracts and the timing and amounts of refunds for Federal student loans to students as well as decreases in payments to employees.
Cash flows from non-capital financing activity decreased by $1.1 million in fiscal year 2018 and decreased $0.3 million in fiscal year 2017. The changes in fiscal year 2018 are the result of decreases in funds received from state appropriations and non-operating grants, gifts and contracts partially offset by increases in cash received for county appropriations. The decrease in fiscal year 2017 resulted from decreases in funds received from non-operating grants, gifts and contracts partially offset by increases in cash received for state appropriations.
Cash flows from capital and related financing activities shows the impact on cash related to the revenues and expenditures associated with the acquisition of capital assets and debt service payments. The decrease of $2.9 million in fiscal year 2018 was the net result of a decrease in state appropriations for the Center for Manufacturing Innovation, a decrease in expenditures for capital assets, a decrease in the proceeds used from a debt issuance and an increase in donated funds. The decrease of $0.2 million in fiscal year 2017 was the net result of an increase in state appropriations for the Center for Manufacturing Innovation, a decrease in expenditures for capital assets and a decrease in the proceeds used from a debt issuance.
Net cash used by investing activities during the fiscal year of 2018 was $15.9 million. This was the result of a change in the investing activities where some funds were invested in a Certificates of Deposit with longer term maturities in order to increase interest income. Net cash used by investing activities in fiscal year 2017 increased $0.1 million.
2018 2017 2016
Net cash flow used by operating activities (47.5)$ (44.9)$ (42.5)$
Net cash flow provided by noncapital financing activities 52.5 53.6 53.9
Net cash used by capital and related financing activities (5.3) (8.2) (8.4)
Net cash provided (used) by investing activities (15.9) 0.2 0.1
Net increase (decrease) in cash (16.2) 0.7 3.1
Cash - beginning of year 32.8 32.1 29.0
Cash - end of year 16.6$ 32.8$ 32.1$
Summary of Cash Flows
As of June 30, 2018, 2017 and 2016
(in millions)

2018 Comprehensive Annual Financial Report | 33
Debt Administration
At June 30, 2017 and 2018 the college’s financial statements reflect $39.2 million and $36.4 million respectively in (general obligation) bonds payable. These bonds are general obligation bonds of the state backed by the full faith, credit and taxing power of the County of Greenville. Greenville County appropriates funds to service the debt of the general obligation bonds. The decreases in 2017 and 2018 were reductions in principal resulting from debt service payments.
Also outstanding at June 30, 2017 and 2018 are three capital leases payable totaling $11.9 million and $9.5 million, respectively, for the purchase of the McAlister Square Mall, the construction of the first buildings on each of the Benson and Brashier Campuses and Brashier Middle College. State appropriations were designated to cover the debt service on the McAlister Square Mall but reductions in the appropriations have resulted in a shortfall that the college is currently funding. Rental income from the Middle College covers approximately 50 percent of the payments for that lease. For additional information on debt administration, please refer to Notes 15 and 16.
Economic Factors
South Carolina’s General Fund revenue collections increased $548.4 million or 6.4% in fiscal year 2018. The general fund growth rate for the state for fiscal year 2017 was 4.1%. While this news is encouraging, there is no expectation of significant increases in state appropriations in the near future.
In fiscal year 2018 appropriations from the state to the college for operations decreased by 5.2 percent, while appropriations increased by 9.5 percent in fiscal year 2017. State appropriations for capital expenditures were $1.2 million in fiscal year 2018, a decrease of $5.1 million from the previous year. The decrease was the result of a one-time appropriation for equipment for the Center for Manufacturing Innovation in fiscal year 2017.
State funding for college operations is expected to decrease in for the 2019 fiscal year. The college anticipates an increase in funding for benefits that will help to offset the 1.0 percent increase in the contribution to the state retirement fund. While it is encouraging, the increase in state funding may not be sufficient to cover the mandatory cost increases for state employees’ benefits. Going forward the college expects decreases in state appropriations as a result of changes in the funding formula that allocates funds to the individual colleges from the System Office.
While the college makes every effort to keep tuition costs to a minimum, state appropriations comprise a lower percent of the college’s operating budget than they have been in the past making the college more dependent on tuition revenues from students. As a result, federal and state financial aid programs are an increasingly important factor in the financial well-being of the college.
The college continues to operate on a fiscally sound basis and is conservative in planning and budgeting. The current financial position is stable and current appropriations and tuition revenues are adequate to fund the operations for the next year.
Component Unit
It has been determined that the Greenville Tech Foundation is a component unit of Greenville Technical College. The foundation’s financial statements are included in this report and supplemental information is included in Note 25. Additional information regarding the foundation can be obtained by mailing a request to Greenville Tech Foundation, Inc. PO Box 5616, Greenville, SC 29606-5616.
Section 59-53-2410 of the South Carolina code of Laws creates the Greenville Technical College Enterprise Campus Authority (the “authority”). For accounting purposes, the authority is considered a component unit of Greenville Technical College. The legislation establishing the authority requires that the members of the college’s Area Commission also constitute the Board of the authority. The authority’s financial activity is blended in the financial statements of the college. The college commonly refers to the authority as the Center for Manufacturing Innovation.

34 | Greenville Technical College
Acknowledgements The preparation of this report on a timely basis could not have been accomplished without the efficient and dedicated services of the entire staff. I would like to express appreciation to all the employees who assisted in the timely closing of the college's financial records and the preparation of this report. In addition, I would like to express my appreciation to the other departments and individuals who assisted in the preparation of this report. Finally, I would like to thank the dedicated staff of our external auditors Cline, Brandt and Kochenower for their guidance.

2018 Comprehensive Annual Financial Report | 35
FINANCIAL SECTION:
Basic Financial Statements
A COMPONENT UNIT OF THE STATE OF SOUTH CAROLINA

36 | Greenville Technical College

SEE NOTES TO FINANCIAL STATEMENTS 2018 Comprehensive Annual Financial Report | 37
GREENVILLE TECHNICAL COLLEGE
Statement of Net Position June 30, 2018 and June 30, 2017
ASSETS 2018 2017
CURRENT ASSETS
Cash and Cash Equivalents 16,636,507$ 32,769,509$
Investments 18,476,196 14,019,273
Accounts Receivable, Net 6,132,601 3,924,766
Bond Proceeds Receivable - 1,269,237
Inventories 2,585,951 2,773,658
Other Assets 2,316,041 2,001,596
Total Current Assets 46,147,296 56,758,039
NONCURRENT ASSETS
Investments 12,000,000 -
Capital Assets, Net of Accumulated Depreciation 117,589,568 121,088,600
Total Noncurrent Assets 129,589,568 121,088,600
Total Assets 175,736,864 177,846,639
DEFERRED OUTFLOWS OF RESOURCES 17,101,419 16,082,521
LIABILITIES
CURRENT LIABILITIES
Accounts Payable 2,218,126 2,512,097
Accrued Payroll and Related Liabilities 1,780,822 2,134,476
Long Term Liabilities - Current Portion 5,315,578 5,764,335
Unearned Revenue 7,624,661 8,390,693
Funds Held for Others 475,990 584,412
Total Current Liabilities 17,415,177 19,386,013
NONCURRENT LIABILITIES
Bonds Payable 33,874,941 36,410,907
Capital Leases Payable 6,990,000 9,480,000
Compensated Absences Payable 3,089,766 3,811,754
Net Pension Liability 90,333,197 88,409,197
Net Other Post Employment Benefits 71,702,963 76,588,947
Total Noncurrent Liabilities 205,990,867 214,700,805
Total Liabilities 223,406,044 234,086,818
DEFERRED INFLOWS OF RESOURCES 9,739,560 1,712,465
NET POSITION
Net Investment in Capital Assets 71,698,662 71,218,446
Restricted For:
Expendable:
Capital Projects 767,159 1,026,436
Loans - -
Unrestricted (note 11) (112,773,142) (114,115,005)
Total Net Position (40,307,321)$ (41,870,123)$

38 | Greenville Technical College SEE NOTES TO FINANCIAL STATEMENTS
GREENVILLE TECHNICAL COLLEGE
Statement of Revenues, Expenses, and Changes in Net Position For the Years Ended June 30, 2018 and June 30, 2017
REVENUES 2018 2017
OPERATING REVENUES
Student Tuition and Fees (Net) 24,546,247$ 26,805,391$
Federal Grants and Contracts 3,881,802 4,176,398
State Grants and Contracts 15,810,843 15,311,732
Sales and Services of Educational Departments 606,070 626,660
Auxiliary Enterprises (Net) 4,153,177 4,511,004
Other Operating Revenues 2,485,369 1,823,198
Total Operating Revenues 51,483,508 53,254,383
EXPENSES
OPERATING EXPENSES
Salaries 46,536,709 46,880,379
Benefits 20,840,026 18,402,610
Scholarships and Fellowships 10,962,370 12,014,463
Utilities 2,946,018 2,963,151
Supplies and Other Services 16,944,637 21,934,540
Depreciation 5,479,476 5,254,629
Total Operating Expenses 103,709,236 107,449,772
Operating Income (Loss) (52,225,728) (54,195,389)
NONOPERATING REVENUES (EXPENSES)
State Appropriations 18,581,382 19,599,193
County Appropriations 12,746,627 12,039,129
Interest Income 599,628 379,154
Gain (Loss) on Disposal of Capital Assets 82,978 -
Interest Expense on Capital Asset Related Debt (1,093,772) (1,157,146)
Federal Grants and Contracts 20,909,400 20,322,041
State and Local Grants and Contracts 714,937 634,247
Net Nonoperating Revenues 52,541,180 51,816,618
Income (Loss) Before Other Revenues, Expenses,
Gains or Losses 315,452 (2,378,771)
State Capital Appropriations 1,247,350 6,369,531
Capital Donation - 1,000,000
Capital Assets Donated - 101,000
Grant-Funded Capital Assets Transfers - (1,205,506)
Increase (Decrease) in Net Position 1,562,802 3,886,254
NET POSITION
Net Position - Beginning of Year (41,870,123) 28,628,628
Cumulative Effect of GASB 75 - (74,385,005)
Net Position - Beginning of Year (Restated) - (45,756,377)
Net Position - End of Year (40,307,321)$ (41,870,123)$

SEE NOTES TO FINANCIAL STATEMENTS 2018 Comprehensive Annual Financial Report | 39
GREENVILLE TECHNICAL COLLEGE
Statement of Cash Flows For the Years Ended June 30, 2018 and June 30, 2017
CASH FLOWS FROM OPERATING ACTIVITIES 2018 2017
Tuition and Fees 23,004,522$ 23,758,812$
Federal, State and Local Grants and Contracts 18,395,534 20,229,004
Federal Student Loan Proceeds 21,026,078 26,253,017
Sales and Services of Educational Departments 616,854 629,755
Auxiliary Enterprise Charges 4,340,883 5,028,821
Other Receipts 2,274,943 1,777,454
Federal Student Loans Disbursed (21,186,343) (24,906,293)
Payments to Vendors (48,039,314) (52,444,996)
Payments to Employees (47,873,340) (45,231,912)
Net Cash Provided (Used) by Operating Activities (47,440,183) (44,906,338)
CASH FLOWS FROM NONCAPITAL FINANCING ACTIVITIES
State Appropriations 18,581,382 19,599,193
County Appropriations 12,286,286 11,883,382
State, Local and Federal Grants, Gifts and Contracts - Non Operating 21,634,649 22,083,627
Net Cash Flows Provided by Noncapital Financing Activities 52,502,317 53,566,202
CASH FLOWS FROM CAPITAL AND RELATED FINANCING ACTIVITIES
State Appropriations 594,390 7,622,407
Donation 1,000,000 101,000
Purchase of Capital Assets (1,300,304) (10,971,727)
Expenditure of bond proceeds held by county 1,280,719 1,955,109
Principal Paid on Capital Debt (5,248,484) (5,130,115)
Interest Paid on Capital Debt (1,616,267) (1,748,783)
Net Cash Provided by Capital and Related Financing Activities (5,289,946) (8,172,109)
CASH FLOWS FROM INVESTING ACTIVITIES
Proceeds from Sales and Maturities of Investments 15,467,837 14,019,273
Interest on Investments 360,455 187,208
Purchase of Investments (31,733,482) (14,019,273)
Net Cash Flows Provided (Used) by Investing Activities (15,905,190) 187,208
Net Increase (Decrease) in Cash (16,133,002) 674,963
Cash - Beginning of Year 32,769,509 32,094,546
Cash - End of Year 16,636,507$ 32,769,509$
Reconciliation of Net Operating Revenue (Expenses) to Net Cash
Provided (Used) by Operating Activities:
Operating Income (Loss) (52,225,728)$ (54,195,388)$
Adjustments to Reconcile Net Income (Loss) to Net Cash Provided (Used) by Operating Activities
Depreciation Expense 5,479,476 5,254,629
Change in Assets and Liabilities
Receivables, Net (3,727,823) 1,003,533
Inventories 187,706 517,817
Deferred Charges and Prepaid Expenses 37,801 (95,913)
Accounts Payable (656,421) 101,713
Compensated Absences (948,226) 334,548
Net Pension Liability & Deferred Inflows/Outflows 3,931,366 2,632,957
Unearned Revenue 588,288 (461,364)
Deposits Held for Others (106,622) 1,130
Net Cash Provided (Used) by Operating Activities (47,440,183)$ (44,906,338)$

40 | Greenville Technical College SEE NOTES TO FINANCIAL STATEMENTS
COMPONENT UNIT OF GREENVILLE TECHNICAL COLLEGE
GREENVILLE TECH FOUNDATION, INC. AND SUBSIDARIES
Component Unit Consolidated Statement of Financial Position for the Years Ended December 31, 2017 and December 31, 2016
ASSETS
Unrestricted cash and cash equivalents $ 1,181,553 $ 731,134
Restricted cash and cash equivalents 3,326,332 3,232,289
Pledges reveivable, net 1,163,058 2,726,465
Student loans receivable 755 400
Accounts receivable, net 120,334 113,425
Interest receivable 2,091 2,091
Prepaid expenses 63,875 65,864
Investments 11,937,890 9,270,335
Notes receivable 404,780 404,780
Property and equipment, net 24,393,517 24,989,026
Cash surrender value of life insurance 49,781 46,608
Charitable remainder trusts receivables 124,559 102,737
Total assets $ 42,768,525 $ 41,685,154
LIABILITIES
Accounts payable and accrued expenses $ 180,983 $ 425,745
Deferred rental income 96,402 83,127
Due to related party - security deposit 400,000 400,000
Customer deposits 82,545 66,815
Bonds payable 7,050,445 7,224,125
Notes payable 10,067,005 10,530,393
Interest rate swaps 2,108,869 2,379,999
Total liabilities 19,986,249 21,110,204
NET ASSETS
Unrestricted 4,708,818 3,580,620
Unrestricted - board designated 2,261,425 1,942,616
Total unrestricted 6,970,243 5,523,236
Temporarily restricted 6,093,622 6,128,125
Permanently restricted 9,718,411 8,923,589
Total net assets 22,782,276 20,574,950
Total liabilities and net assets $ 42,768,525 $ 41,685,154
20162017

SEE NOTES TO FINANCIAL STATEMENTS 2018 Comprehensive Annual Financial Report | 41
COMPONENT UNIT OF GREENVILLE TECHNICAL COLLEGE
GREENVILLE TECH FOUNDATION, INC. AND SUBSIDARIES
Component Unit Consolidated Statement of Activities for Year Ended December 31, 2017
Support and revenue
Contributions $ 74,699 $ 1,448,112 $ 319,504 $ 1,842,315
Property and equipment donations 475,445 42,786 - 518,231
Change in reserve for uncollectible accounts (842) (1,140) (19,221) (21,203)
Charitable trusts, change in value 21,822 - - 21,822
Interest and dividend income 172,511 210,869 - 383,380
Management fee income 110,000 - - 110,000
Rental income 4,531,917 - - 4,531,917
Realized and unrealized gains on investments 306,803 1,063,218 - 1,370,021
Interest rate swaps - change in market value 271,131 - - 271,131
Gain (loss) on sale of property 158 - - 158
Miscellaneous 42,784 - - 42,784
6,006,428 2,763,845 300,283 9,070,556
Transfers 194,132 (688,671) 494,539 -
Net assets released from restrictions 2,109,677 (2,109,677) - -
Total support and revenue 8,310,237 (34,503) 794,822 9,070,556
Expenses
College support:
Scholarships 262,744 - - 262,744
Student programs 66,981 - - 66,981
College faculty/staff development 13,895 - - 13,895
College departmental supplies and activities 204,309 - - 204,309
College support - building improvements/equipment 1,278,392 1,278,392
Equipment purchases/gifts in kind 518,231 - - 518,231
Professional services and other fees 96,675 - - 96,675
Other college support 181,802 - - 181,802
GTF Brashier Charter School 12,045 - - 12,045
GTF Student Housing 911,682 - - 911,682
Depreciation 679,438 - - 679,438
Interest expense 780,779 - - 780,779
Uncollectible student loans 400 - - 400
Total program expenses - college support 5,007,373 - - 5,007,373
Operations:
Building and grounds upkeep 514,559 - - 514,559
Compensation 322,625 - - 322,625
Depreciation 354,369 - - 354,369
Insurance 29,648 - - 29,648
Investment management fees 82,905 - - 82,905
Liability, employee bond 9,646 - - 9,646
Miscellaneous expense 16,214 - - 16,214
Office expenses and supplies 47,057 - - 47,057
Professional and other fees 161,886 - - 161,886
Property and other miscellaneous taxes 60,437 - - 60,437
Software updates/maintenance fee 22,828 - - 22,828
Telecommunications/user fees 30,231 - - 30,231
Utilities 157,139 - - 157,139
Total management and general - operations 1,809,544 - - 1,809,544
Fundraising expenses 46,313 - - 46,313
Total expenses 6,863,230 - - 6,863,230
Change in net assets 1,447,007 (34,503) 794,822 2,207,326
Net assets, beginning of year 5,523,236 6,128,125 8,923,589 20,574,950
Net assets, end of year $ 6,970,243 $ 6,093,622 $ 9,718,411 $ 22,782,276
RestrictedUnrestricted Total
Temporarily Permanently
Restricted

42 | Greenville Technical College SEE NOTES TO FINANCIAL STATEMENTS
COMPONENT UNIT OF GREENVILLE TECHNICAL COLLEGE
GREENVILLE TECH FOUNDATION, INC. AND SUBSIDARIES
Component Unit Consolidated Statement of Activities for Year Ended December 31, 2016
Support and revenue
Contributions $ 57,342 $ 1,304,380 $ 2,333,852 $ 3,695,574
Property and equipment donations 658,665 42,669 - 701,334
Change in reserve for uncollectible accounts (3,213) (3,406) (925) (7,544)
Charitable trusts, change in value 38,072 - - 38,072
Interest and dividend income 42,786 158,812 - 201,598
Management fee income 214,000 - - 214,000
Rental income 4,398,022 - - 4,398,022
Realized and unrealized gains on investments 10,677 100,187 - 110,864
Interest rate swaps - change in market value 502,755 - - 502,755
Miscellaneous 158,434 - - 158,434
6,077,540 1,602,642 2,332,927 10,013,109
Transfers 93,914 (185,012) 91,098 -
Net assets released from restrictions 231,596 (231,596) - -
Total support and revenue 6,403,050 1,186,034 2,424,025 10,013,109
Expenses
College support:
Scholarships 308,458 - - 308,458
Student programs 47,933 - - 47,933
College faculty/staff development 31,394 - - 31,394
College departmental supplies and activities 170,834 - - 170,834
Equipment purchases/gifts in kind 1,042,730 - - 1,042,730
Professional services and other fees 53,935 - - 53,935
Other college support 168,003 - - 168,003
GTF Brashier Charter School 12,206 - - 12,206
GTF Student Housing 913,067 - - 913,067
Depreciation 664,611 - - 664,611
Interest expense 820,331 - - 820,331
Uncollectible student loans 900 - - 900
Total program expenses - college support 4,234,402 - - 4,234,402
Operations:
Building and grounds upkeep 530,513 - - 530,513
Compensation 336,506 - - 336,506
Depreciation 334,948 - - 334,948
Insurance 29,394 - - 29,394
Investment management fees 85,279 - - 85,279
Liability, employee bond 9,820 - - 9,820
Miscellaneous expense 17,365 - - 17,365
Office expenses and supplies 47,534 - - 47,534
Professional and other fees 146,603 - - 146,603
Property and other miscellaneous taxes 59,342 - - 59,342
Software updates/maintenance fee 16,508 - - 16,508
Telecommunications/user fees 23,385 - - 23,385
Interest expense 35 - - 35
Utilities 159,578 - - 159,578
Total management and general - operations 1,796,810 - - 1,796,810
Fundraising expenses 74,059 - - 74,059
Total expenses 6,105,271 - - 6,105,271
Change in net assets 297,779 1,186,034 2,424,025 3,907,838
Net assets, beginning of year 5,225,457 4,942,091 6,499,564 16,667,112
Net assets, end of year $ 5,523,236 $ 6,128,125 $ 8,923,589 $ 20,574,950
Temporarily Permanently
Unrestricted Restricted Restricted Total

GREENVILLE TECHNICAL COLLEGE Notes to Financial Statements
June 30, 2018 and June 30, 2017
2018 Comprehensive Annual Financial Report | 43
Notes to Financial Statements
NOTE 1 - SUMMARY OF SIGNIFICANT ACCOUNTING POLICIES
A. Nature of Operations: Greenville Technical College (the “college”), a member institution of the South Carolina Technical College System, provides a range of educational programs to meet the needs of the adult population of Greenville County. Included in this range of programs are technical and occupational associate degree, diploma and certificate curricula that are consistent with the needs of employers in the college’s service area. As an integral part of this mission, the college provides a program of continuing education designed to satisfy the occupational demands of employers through retraining and upgrading the skills of individual employees. The college also provides a variety of developmental education programs, support services and offerings to assist students in meeting their personal and professional educational objectives.
B. Reporting Entity: The financial reporting entity, as defined by the Governmental Accounting Standards Board (GASB) consists of the primary government, organizations for which the primary government is financially accountable and other organizations for which the nature and significance of their relationship with the primary government are such that exclusion could cause the financial statements to be misleading or incomplete. Accordingly, the financial statements include the accounts of Greenville Technical College, as the primary government, Greenville Technical College Enterprise Campus Authority (the “Authority”) and the accounts of Greenville Tech Foundation, Inc. (the “Foundation”), its component units.
During fiscal year 2012-13, the State of South Carolina implemented GASB Statement No. 61, The Financial Reporting Entity: Omnibus an amendment of GASB Statements No. 14 and No. 34. As a result of this implementation, the college will now be reported as a discretely presented component unit on the State of South Carolina’s Comprehensive Annual Financial Report. Discrete presentation entails reporting component unit financial data in one or more columns separate from the financial data of the primary government instead of blending the college’s financial information into the state’s financial information.
Section 59-53-2410 of the South Carolina Code of Laws creates the Greenville Technical College Enterprise Campus Authority (Authority). For accounting purposes, the Authority is considered a component unit of Greenville Technical College. The legislation establishing the Authority requires that the members of the college’s Area Commission also constitute the Board of the Authority. The Authority’s financial activity is blended in the financial statements of the college. The college commonly refers to the Authority as the Center for Manufacturing Innovation.
The Foundation is a legally separate, tax-exempt component unit of the college. The Foundation acts primarily as a fund-raising organization to supplement the resources that are available to the college in support of its programs. The 35-member Board of the Foundation is self-perpetuating and consists of community leaders, friends of the college, and graduates. Although the college does not control the timing or amount of receipts from the Foundation, the majority of resources or income thereon, which the Foundation holds and invests are restricted to the activities of the college by the donors. Because these restricted resources held by the Foundation can only be used by, or for the benefit of, the college, the Foundation is considered a component unit of the college. The Foundation is reported in separate financial statements because of the difference in its reporting model, as further described below.
The Foundation is a private not-for-profit organization that reports its financial results under Financial Accounting Standards Board (FASB) Statements. Most significant to the Foundation’s operations and reporting model are FASB Statement No. 116, Accounting for Contributions Received and Contributions Made, and FASB Statement No. 117, Financial Reporting for Not-for-Profit Organizations. As such, certain revenue recognition criteria and presentation features are different from GASB revenue recognition criteria and presentation features. No modifications have been made to the Foundation’s financial information in the college’s financial reporting entity for these differences. However, significant note disclosures to the Foundation’s financial statements have been incorporated into the college’s notes to the financial statements. (See Note R within this Summary of Significant Accounting Policies and Note 25.)
Financial statements for the Foundation can be obtained by mailing a request to Greenville Tech Foundation, Inc. PO Box 5616, MS 6002, Greenville, SC 29606-5616.

GREENVILLE TECHNICAL COLLEGE Notes to Financial Statements
June 30, 2018 and June 30, 2017
44 | Greenville Technical College
NOTE 1 - SUMMARY OF SIGNIFICANT ACCOUNTING POLICIES, continued
C. Financial Statements: The financial statements are presented in accordance with Governmental Accounting Standards Board (GASB) Statement No. 34, Basic Financial Statements and Management’s Discussion and Analysis for State and Local Governments, and GASB Statement No. 35, Basic Financial Statements and Management’s Discussion and Analysis for Public Colleges and Universities. The financial statement presentation required by GASB Statements No. 34 and No. 35 provides a comprehensive, entity-wide perspective of the college’s assets, liabilities, net assets, revenues, expenses, changes in net assets and cash flows that replaces the fund-group perspective previously required. As of June 30, 2013, the college adopted accounting guidance, GASB Statement No. 63, Financial Reporting of Deferred Outflows of Resources, Deferred Inflows of Resources, and Net Position.
The college implemented GASB Statement No. 63, Financial Reporting of Deferred Outflows of Resources, Deferred Inflows of Resources, and Net Position in the financial statements for the fiscal year ended June 30, 2013. This statement amends the net asset reporting requirements in Statement No. 34, Basic Financial Statements – and Management’s Discussion and Analysis – for State and Local Governments, and other pronouncements by incorporating deferred outflows of resources and deferred inflows of resources into the definitions of the required components of the residual measure and by renaming that measure as net position rather than net assets. This statement had no significant impact on the college for the fiscal year ended June 30, 2013.
During the fiscal year ending June 30, 2014 Greenville Technical College implemented GASB Statement No. 65, Items Previously Reported as Assets and Liabilities. Statement No. 65 establishes accounting and financial reporting standards that reclassify, as deferred outflows of resources or deferred inflows of resources, certain items that were previously reported as assets and liabilities and recognizes, as outflows of resources or inflows of resources, certain items that were previously reported as assets and liabilities. This Statement also provides other financial reporting guidance related to the impact of the financial statement elements deferred outflows of resources and deferred inflows of resources, such as changes in the determination of the major fund calculations and limiting the use of the term deferred in financial statement presentations. Greenville Technical College implemented retroactively to July 1, 2011 for purposes of management discussion and analysis and all statements illustrated.
Prior to the implementation of Statement No. 65 Greenville Technical College amortized bond issuance costs over the life of the bond. Upon implementation of Statement No. 65 Greenville Technical College eliminated any bond issuance costs associated with prior year bond issues and expensed bond issuance costs in the year which they occurred. For refunding bond issues resulting in the defeasance of debt the difference between the reacquisition price and the net carrying amount of the old debt is now reported as a deferred outflow of resources.
Effective for the fiscal year ending June 30, 2015, the college adopted GASB Statement No. 68, Accounting and Financial Reporting for Pensions an amendment of GASB Statement No. 27. The college will now report its proportionate share of the State of South Carolina’s net pension liability. Changes in net pension liability not included in pension expense are reported as deferred outflows of resources or deferred inflows of resources. Employer contributions subsequent to the measurement date of the net pension liability are reported as deferred outflows of resources. See note 9 for further discussion of this change.
Effective for the fiscal year ending June 30, 2018, the college adopted GASB Statement No. 75, Accounting and Financial Reporting for Postemployment Benefits Other Than Pensions. The college will now report its proportionate share of the State of South Carolina’s net OPEB liability. Changes in net OPEB liability not included in pension expense are reported as deferred outflows of resources or deferred inflows of resources. Employer contributions subsequent to the measurement date of the net pension liability are reported as deferred outflows of resources. See note 10 for further discussion of this change.
In addition to assets, the statement of net position will sometimes report a separate section for deferred outflows of resources. This separate financial statement element represents a consumption of net position that applies to a future period(s) and so will not be recognized as an outflow of resources until that time.

GREENVILLE TECHNICAL COLLEGE Notes to Financial Statements
June 30, 2018 and June 30, 2017
2018 Comprehensive Annual Financial Report | 45
NOTE 1 - SUMMARY OF SIGNIFICANT ACCOUNTING POLICIES, continued
C. Financial Statements, continued
For the years ended June 30, 2017 and June 30, 2018, Deferred Outflows of Resources are $16,082,522 and $17,101,419, respectively, and impact the college as follows:
D. Basis of Accounting: For financial reporting purposes, the college is considered a special-purpose government entity engaged only in business-type activities. Accordingly, the college’s financial statements have been presented using the economic resources measurement focus and the accrual basis of accounting. Under the accrual basis, revenues are recognized when earned, and expenses are recorded when an obligation has been incurred. Student tuition and auxiliary enterprise fees are presented net of scholarships and fellowships applied to student accounts, while stipends and other payments made directly are presented as scholarship expenses. All significant intra-institutional transactions have been eliminated.
E. Cash and Cash Equivalents: For purposes of the statement of cash flows, the college considers all highly liquid investments with an original maturity of three months or less to be cash equivalents. Funds held in a Capital Project Fund through the State of South Carolina State Treasurer’s Office are considered cash equivalents.
F. Investments: Deposits and investments for the college are governed by the South Carolina Code of Laws, Section 11-9-660 “Investment of Funds” GASB Statement No. 40, Deposits and Investment Risk Disclosures – an amendment to GASB Statement No. 3, requires disclosures related to deposit risks, such as custodial credit risk, and investment risks, such as credit risk (including custodial credit risk and concentrations of credit risks) and interest rate risk. The college accounts for its investments at fair value in accordance with GASB Statement No. 31, Accounting and Financial Reporting for Certain Investments and for External Investment Pools. Changes in unrealized gain (loss) on the fair value of investments are reported as a component of investment income in the statement of revenues, expenses and changes in net position. The college’s investments include funds in the State Treasurer’s local government investment pool and fully collateralized certificates of deposit.
G. Accounts Receivable: Accounts receivable consists of tuition and fee charges to students, gift pledges and auxiliary enterprise services provided to students, faculty and staff. Accounts receivable also include amounts due from the Federal government, state and local governments, or private sources, in connection with reimbursement of allowable expenditures made pursuant to the college’s grants and contracts. Accounts receivable are recorded net of estimated uncollectible amounts.
H. Inventories: Inventories for internal use are valued at cost. Inventories for resale are carried at the lower of cost or market on the first-in, first-out ("FIFO") basis.
I. Capital Assets: Capital assets are recorded at cost at the date of acquisition or fair market value at the date of donation in the case of gifts. Currently the college does not participate in any service concession arrangements however, if the college did receive any donated capital assets, donated works of art or similar items in a service concession arrangement they would be reported at acquisition value. The college follows capitalization guidelines established by the State of South Carolina. All land is capitalized, regardless of cost. Qualifying improvements
FY 2017
Deferred
Outflows
Amount
FY 2017
Amortized
Portion of
Deferred
Outflows
FY 2018
Deferred
Outflows
Amount
FY 2018
Amortized
Portion of
Deferred
Outflows
Certificate of Participation Refinance 48,000$ 96,000$ 48,000$ 48,000
2014A GOB Refinance 3,089 33,982 3,090$ 30,892
2015 COP Refinance 34,975 69,950 34,975$ 34,975
2016 GOB Refinance 28,782 431,738 28,783$ 402,955
Contributions to Pension Plan (6,727,987) 13,246,910 (758,974)$ 14,005,884
Other Post Employment Benefits - 2,203,942 (374,771)$ 2,578,713
(6,613,141)$ 16,082,522$ (1,018,897)$ 17,101,419$

GREENVILLE TECHNICAL COLLEGE Notes to Financial Statements
June 30, 2018 and June 30, 2017
46 | Greenville Technical College
NOTE 1 - SUMMARY OF SIGNIFICANT ACCOUNTING POLICIES, continued
I. Capital Assets, continued
that rest in or on the land itself are recorded as depreciable land improvements. Major additions, renovations and other improvements that add to the usable space, prepare existing buildings for new uses, or extend the useful life of an existing building are capitalized. The college capitalizes movable personal property with a unit value in excess of $5,000 and a useful life in excess of two years and depreciable land improvements, buildings and improvements, and intangible assets costing in excess of $100,000. Routine repairs and maintenance and library materials, except individual items costing in excess of $5,000, are charged to operating expenses in the year in which the expense was incurred.
Depreciation is computed using the straight-line method over the estimated useful lives of the assets, generally 15 to 50 years for buildings and improvements and land improvements and 2 to 25 years for machinery, equipment, and vehicles. Effective July 1, 2011 the college adopted a monthly depreciation convention for the straight-line method consistent with the policy of the State of South Carolina.
In fiscal year 2017 the U.S. Department of Labor Trade Adjustment Assistance Community College and Career Training grant (TAACCCT) ended. Greenville Technical College transferred title of equipment that was being held in the custody of the other colleges in the consortium to those colleges according to the terms of the grant. The equipment that was transferred had a total cost of $1,678,693 and $473,187 in related depreciation. In accordance with grant guidelines of U.S. Department of Labor, the College as fiscal agent purchased the equipment and therefore tracked, capitalized and depreciated the assets in accordance with the college’s capitalization policy. However, title was vested with the U.S. Department of Labor until the end of the grant period.
J. Unearned Revenues and Deposits: Unearned revenues include amounts received for tuition and fees and certain auxiliary activities prior to the end of the fiscal year but related to the subsequent accounting period. Unearned revenues also include prepaid rent for the college’s broadband licenses that will be recognized over the life of the lease. Unearned revenues also include amounts received from grant and contract sponsors that have not yet been earned.
Deposits represent student fee refunds and other miscellaneous deposits. Student deposits are recognized as revenue during the semester for which the fee is applicable and earned when the deposit is nonrefundable to the student under the forfeit terms of the agreement.
K. Compensated Absences: Employee vacation pay expense is accrued at year-end for financial statement purposes. The liability and expense incurred are recorded at year-end as a component of long-term liabilities in the statement of net position and as a component of benefit expenses in the statement of revenues, expenses, and changes in net position.
L. Net Position: The college’s net position is classified as follows:
Net Investment in Capital Assets: This represents the college’s total investment in capital assets, net of outstanding debt obligations related to those capital assets. To the extent debt has been incurred but not yet expended for capital assets, such amounts are not included as a component of net investment in capital assets.
Restricted net position - expendable: Restricted expendable net position includes resources in which the college is legally or contractually obligated to spend resources in accordance with restrictions imposed by external third parties.
Unrestricted net position: Unrestricted net position represents resources derived from student tuition and fees, appropriations, and sales and services of educational departments and auxiliary enterprises. These resources are used for transactions relating to the educational and general operations of the college, and may be used at the discretion of the governing board to meet current expenses for any purpose. These resources also include auxiliary enterprises, which are substantially self-supporting activities that provide services for students, faculty and staff.
The college policy for applying expenses that can use both restricted and unrestricted resources is delegated to the departmental administrative level. General practice is to first apply the expense to restricted resources and then to unrestricted resources.
M. Income Taxes: The college is exempt from income taxes under the Internal Revenue Code.

GREENVILLE TECHNICAL COLLEGE Notes to Financial Statements
June 30, 2018 and June 30, 2017
2018 Comprehensive Annual Financial Report | 47
NOTE 1 - SUMMARY OF SIGNIFICANT ACCOUNTING POLICIES, continued
N. Classification of Revenues and Expenses: The college has classified its revenues and expenses as either operating or non-operating according to the following criteria:
Operating revenues and expenses: Operating revenues generally result from exchange transactions to provide goods or services related to the college’s principal ongoing operations. These revenues include:
(1) student tuition and fees received in exchange for providing educational services and other related services to students; (2) receipts for scholarships where the provider has identified the student recipients; (3) fees received from organizations and individuals in exchange for miscellaneous goods and services provided by the college; and (4) grants and contracts that are essentially the same as contracts for services that finance programs the college would not otherwise undertake. Operating expenses include all expense transactions, incurred other than those related to investing, non-capital or non-capital financing activities.
Non-operating revenues and expenses: Non-operating revenues include activities that have the characteristics of non-exchange transactions. These revenues include gifts and contributions, appropriations, investment income, and any grants and contracts that are not classified as operating revenue or restricted by the grantor to be used exclusively for capital purposes. Due to the administrative involvement with Pell grant requirements and because Pell grants are non-exchange transactions, Pell grant receipts are recorded as non-operating revenues.
O. Sales and Services of Educational and Other Activities: Revenues from sales and services of educational and other activities generally consist of amounts received from instructional activities that incidentally create goods and services which may be sold to students, faculty, staff, and the general public. The college receives such revenues primarily from Child Care Center operations.
P. Auxiliary Enterprises and Internal Service Activities: Auxiliary enterprise revenues primarily represent revenues generated by bookstore and food services. Revenues of internal service and auxiliary enterprise activities and the related expenditures of college departments have been eliminated.
Q. Capitalized Interest: The college capitalizes as a component of construction in progress interest cost in excess of earnings on debt associated with capital projects that will be capitalized in the applicable capital asset categories upon completion. In the fiscal year ended June 30, 2018, the college incurred $1,725,528 of interest expense, of which $1,093,772 was charged to expense, $597,162 was capitalized, and $34,594 was booked to reflect a decrease in bond interest payable. In the financial year ended June 30, 2017, the college incurred $1,858,044 of interest expense, of which $1,157,146 was charged to expense, $699,164 was capitalized, and $1,734 was booked to reflect a decrease in bond interest payable.
R. Component Unit: The Foundation maintains its accounts in accordance with the principles and practices of fund accounting. Fund accounting is the procedure by which resources for various purposes are classified for accounting purposes in accordance with activities or objectives specified by donors. Accordingly, net assets and changes therein are classified as follows:
Permanently Restricted Net Assets: Permanently Restricted Net Assets are subject to donor-imposed stipulations that require them to be maintained permanently by the Foundation. Generally, the donors of these assets permit the Foundation to use all or part of the income earned on related investments for general or specific purposes.
Temporarily Restricted Net Assets: Temporarily Restricted Net Assets are subject to donor-imposed stipulations that will be met by actions of the Foundation and/or passage of time.
Unrestricted Undesignated Net Assets: Unrestricted Undesignated Net Assets are not subject to donor-imposed stipulations that will be met by actions of the foundation and/or passage of time.
Unrestricted Designated Net Assets: Unrestricted Designated Net Assets are not subject to donor-imposed restrictions but subject to Foundation Board imposed stipulations.
Revenues are reported as increases in unrestricted net assets classification unless use of the related assets is limited by donor-imposed restrictions. Contributions, including unconditional promises to give, are recognized as revenue in the period received. Conditional promises to give are not recognized as revenue until the conditions on which they

GREENVILLE TECHNICAL COLLEGE Notes to Financial Statements
June 30, 2018 and June 30, 2017
48 | Greenville Technical College
NOTE 1 - SUMMARY OF SIGNIFICANT ACCOUNTING POLICIES, continued
R. Component Unit, continued
depend are substantially met. Contributions for in-kind gifts from outside sources are not recorded in the Foundation’s financial records, but are accounted for and acknowledged separately.
Expenses are reported as decreases in unrestricted undesignated or unrestricted designated net assets as appropriate. Gains and losses on investments and other assets or liabilities are reported as increases or decreases in unrestricted undesignated or unrestricted designated net assets unless their use is restricted by explicit donor stipulation or by law.
Investments are reported at fair value based upon quoted market prices.
NOTE 2 - STATE APPROPRIATIONS
NOTE 3 – CASH, DEPOSITS AND INVESTMENTS
DEPOSITS:
State Law requires that a bank or savings and loan association receiving state funds must secure the deposits by deposit insurance, surety bonds, collateral securities, or letters of credit to protect the state against any loss.
Custodial Credit Risk
Custodial credit risk for deposits is the risk that a government will not be able to recover deposits if the depository financial institution fails to recover the value of collateral securities that are in the possession of an outside party if the counterparty to the deposit transaction fails.
Greenville Technical College’s policy is to invest all available funds in accounts that will provide maximum return on investment with the least possible risk. Funds will only be deposited with financial institutions that are insured and guaranteed by FDIC, or other Federal or State Regulatory Agencies. There have not been any violations of these policies.
The deposits for Greenville Technical College at June 30, 2018, were $17,879,739. Of these, $0 was exposed to custodial credit risk as uninsured and uncollateralized. The balance of $17,879,739 was fully collateralized with securities held by the pledging institution in the college’s name. The deposits for Greenville Technical College at June 30, 2017, were $34,335,620. Of these, $0 was exposed to custodial credit risk as uninsured and
Non-Capital Appropriations 2018 2017
Current Years Appropriations:
Per Annual Appropriations Act $17,534,970 $17,616,017
STEM Equipment/Repair 475,790 1,251,829
SC Education Lottery Technology Funds 570,622 731,347
Total Non-Capital Appropriations Recorded as Current Year Revenue $18,581,382 $19,599,193
Capital Appropriations
Current Years Appropriations:
Per Annual Appropriations Act University Center $ 594,390 $ 594,390
Per Annual Appropriations Enterprise Campus - -
Per Annual Appropriations CMI Equipment 652,960 5,747,124
Per Annual Appropriations Act Deferred Maintenance - 28,017
Total Capital Appropriations Recorded as Current Year Revenue $ 1,247,350 $ 6,369,531

GREENVILLE TECHNICAL COLLEGE Notes to Financial Statements
June 30, 2018 and June 30, 2017
2018 Comprehensive Annual Financial Report | 49
NOTE 3 – CASH, DEPOSITS AND INVESTMENTS, continued
Custodial Credit Risk, continued
uncollateralized. The balance of $34,335,620 was fully collateralized with securities held by the pledging institution in the college’s name.
Foreign Currency Risk
Foreign currency risk is the risk that changes in exchange rates will adversely affect the fair value of an investment. Greenville Technical College does not maintain deposits that are denominated in a currency other than the United States dollar; therefore, the college is not exposed to this risk.
INVESTMENTS
The college is authorized, by the South Carolina Code of Laws, Section 11-9-660, to invest in obligations of the United States and its agencies, obligations of the State of South Carolina and its political subdivisions, collateralized or federally insured certificates of deposit, and collateralized repurchase agreements. In addition, South Carolina state statutes authorize the college to invest in the South Carolina Local Government Investment Pool (SCLGIP). The SCLGIP is an investment trust fund created pursuant to Section 6-6-10 of the South Carolina Code of Laws and administered by the State Treasurer, in which public monies under the custody of any political subdivision in excess of current needs may be deposited. The SCLGIP is permitted to purchase obligations of the United States, its agencies and instrumentalities, and any corporation within the United States if such obligations bear any of the three highest ratings of at least two nationally recognized ratings services. The SCLGIP is a 2a7- like pool, which is not registered with the Securities and Exchange Commission (SEC) as an investment company but has a policy that it will operate in a manner consistent with the SEC’s rule 2a7 of the Investment Company Act of 1940.
The college’s investments at June 30, 2018 which are not with the State Treasurer’s Office are presented below. All investments are certificates of deposit maturing between August 2018 and May 2019 and are backed by an irrevocable letter of credit or securities pledged in the college’s name.
The college’s investments at June 30, 2017 which are not with the State Treasurer’s Office are presented below. All investments are certificates of deposit maturing between August 2017 and May 2018 and are backed by an irrevocable letter of credit or securities pledged in the college’s name.
Investment Type
Fair Value
Amount Less than 1 1-5 6-10
More
than 10
Certificates of Deposit backed by :
Federal Home Loan Bank 15,000,000$ 3,000,000$ 12,000,000$ -$ -$
15,000,000$ 3,000,000$ 12,000,000$ -$ -$
Greenville Technical College Investments
Investment Maturities (in years)
Investment Type
Fair Value
Amount Less than 1 1-5 6-10
More
than 10
Certificates of Deposit backed by :
Federal Home Loan Bank 14,019,273$ 14,019,273$ -$ -$ -$
14,019,273$ 14,019,273$ -$ -$ -$
Greenville Technical College Investments
Investment Maturities (in years)

GREENVILLE TECHNICAL COLLEGE Notes to Financial Statements
June 30, 2018 and June 30, 2017
50 | Greenville Technical College
NOTE 3 – CASH, DEPOSITS AND INVESTMENTS, continued
INVESTMENTS, continued
Custodial Credit Risk Custodial credit risk for investments is the risk that, in the event of a failure of the counterparty to a transaction, the college will not be able to recover the investments value or collateral securities that are in the possession of an outside party.
The college’s policy concerning custodial credit risk is to invest all available funds in accounts that will provide maximum return on investment with the least possible risk. Funds will only be deposited with financial institutions that are insured and guaranteed by FDIC, or other Federal or State Regulatory Agencies. There have not been any violations of these policies.
At June 30, 2018, the investments not with the State Treasurer’s office for Greenville Technical College were $15,000,000. Of these, $0 was exposed to custodial credit risk as uninsured and uncollateralized. The balance of $15,000,000 was collateralized with securities held by the pledging institution in the college’s name, or supported by an irrevocable letter of credit. At June 30, 2017, the investments for Greenville Technical College were $14,019,273. Of these, $0 was exposed to custodial credit risk as uninsured and uncollateralized. The balance of $14,019,273 was collateralized with securities held by the pledging institution in the college’s name, or supported by an irrevocable letter of credit. The college recognized no losses due to the default by counterparts to investment transactions.
Credit Risk
Credit risk is the risk that an insurer or other counterparty to an investment will not fulfill its obligations.
The college’s policy concerning custodial credit risk is to invest all available funds in accounts that will provide maximum return on investment with the least possible risk. Funds will only be deposited with financial institutions that are insured and guaranteed by FDIC, or other Federal or State Regulatory Agencies. There have not been any violations of these policies.
The college’s rated debt investment as of June 30, 2018 and June 30, 2017 were rated by Moody’s Investors Service and are listed below using the Moody’s Investors Service rating scale.
Concentration of credit risk is the risk of loss attributed to the magnitude of a government’s investment in a single issuer. The college does not have a policy on concentration of credit risk.
At June 30, 2018 the college had all of its investments in fully collateralized certificates of deposits and the State Treasurer’s Local Government Investment Pool. At June 30, 2017, the college had all of its investments in fully collateralized certificates of deposit.
Interest Rate Risk
Interest rate risk is the risk that changes in interest rates of debt investments will adversely affect the fair value of an investment. It occurs because potential purchasers of debt securities will not agree to pay face value for those securities if interest rates subsequently increase, thereby affording potential purchasers more favorable rates on essentially equivalent securities. The college does not have a policy concerning interest rate risk.
For the years ended June 30, 2018 and June 30, 2017, the previous tables show the investments by the specific method.
Rated Debt Investments Fair Value
AAA AA A A1 Unrated
2018 U.S. Agencies.......... $ 15,000,000 -$ -$ -$ $ 15,000,000 -$
2017 U.S. Agencies.......... $ 14,019,273 -$ -$ -$ $ 14,019,273 -$
Greenville Technical College Rated Debt Investments at June 30, 2018 and 2017
Quality Ratings

GREENVILLE TECHNICAL COLLEGE Notes to Financial Statements
June 30, 2018 and June 30, 2017
2018 Comprehensive Annual Financial Report | 51
NOTE 3 – CASH, DEPOSITS AND INVESTMENTS, continued
Foreign Currency Risk
Foreign currency risk is the risk that changes in exchange rates will adversely affect the fair value of an investment. Greenville Technical College does not maintain investments that are denominated in a currency other than the United States dollar; therefore, the college is not exposed to this risk.
The following schedule reconciles cash and investments as reported on the Statement of Net Position to footnote disclosure provided for deposits and investments.
NOTE 4 - ACCOUNTS RECEIVABLE
Accounts receivable as of June 30, 2018 and June 30, 2017, are summarized as follows::
Allowances for losses for student accounts receivable are established based upon actual losses experienced in prior years and evaluations of the current account portfolio. At June 30, 2018, the allowance for uncollectible
Statement of Net Position: 2018 2017
Cash and Cash Equivalents:
Unrestricted 16,636,507$ 32,769,509$
Restricted - -
Total Cash and Cash Equivalents 16,636,507$ 32,769,509$
Investments:
Held by State Treasurer 15,476,196$ -$
Certificates of Deposit 15,000,000 14,019,273
Total Investments 30,476,196$ 14,019,273$
Disclosure, Deposits and Investments:
Cash and Cash Equivalents
Demand Deposit Accounts 16,335,213$ 32,472,762$
Held by State Treasurer 293,544 288,997
Cash on Hand 7,750 7,750
Total Cash and Cash Equivalents 16,636,507$ 32,769,509$
Investments:
Held by State Treasurer 15,476,196$ -$
Certificates of Deposit 15,000,000 14,019,273
Total Investments 30,476,196$ 14,019,273$
2018 2017
Student Accounts Net $ 132,384 $ 214,744
Other Federal Grantors 989,499 1,008,629
Due from State 4,578,577 1,411,419
Accrued interest 108,082 71,669
Greenville Tech Foundation 236,451 1,163,895
Other 87,608 54,410
Net Accounts Receivable $ 6,132,601 $ 3,924,766

GREENVILLE TECHNICAL COLLEGE Notes to Financial Statements
June 30, 2018 and June 30, 2017
52 | Greenville Technical College
NOTE 4 - ACCOUNTS RECEIVABLE, continued
student accounts is valued at $4,090,031. At June 30, 2017, the allowance for uncollectible student accounts is valued at $4,837,767.
NOTE 5 – BOND PROCEEDS RECEIVABLE
At June 30, 2018, the college had no outstanding bond proceeds receivable. The Series 2014 Greenville County General Obligation Bonds were issued on March 11, 2014 to finance the costs of acquisition, construction, renovation, installation and equipping of the Center for Manufacturing Innovation (CMI). This project was completed during the fiscal year ended June 30, 2018. The bond proceeds were on deposit with the Greenville County Treasurer’s Office and were drawn down as expenditures were made on the construction project. Interest earned on the escrow account totaled $11,482 for the fiscal year ended June 30, 2018. During the fiscal year ended June 30, 2018, project expenditures totaling $209,609 were drawn from the proceeds and the remaining proceeds of $851,772 were transferred to the debt service fund at the completion of the project.
At June 30, 2017, bond proceeds receivable of $1,269,237 relate to the proceeds of the Series 2014 Greenville County General Obligation Bonds. These bonds were issued on March 11, 2014 to finance the costs of acquisition, construction, renovation, installation and equipping of the Center for Manufacturing Innovation (CMI). The bond proceeds are on deposit with the Greenville County Treasurer’s Office and are drawn down as expenditures are made on the construction project. Interest earned on the escrow account totaled $63,798 for the fiscal year ended June 30, 2017. During the year ended June 30, 2017, project expenditures totaling $3,862,923 were drawn from the proceeds.
For more information on the bond, refer to Note 15.
NOTE 6 - PLEDGES RECEIVABLE
The college has no pledges receivable during the years ended June 30, 2018 or June 30, 2017.
NOTE 7 - LOANS RECEIVABLE
At June 30, 2018 and June 30, 2017, the college has no loans receivable.

GREENVILLE TECHNICAL COLLEGE Notes to Financial Statements
June 30, 2018 and June 30, 2017
2018 Comprehensive Annual Financial Report | 53
NOTE 8—CAPITAL ASSETS
The activity in the college’s capital assets for the fiscal year ended June 30, 2018 is as follows:
The activity in the college’s capital assets for the fiscal year ended June 30, 2017 is as follows
Beginning Ending
Balance Balance
30-Jun-17 Increases Transfers Decreases 30-Jun-18
Capital assets not being depreciated:
Land 11,459,033$ -$ -$ -$ 11,459,033$
Land Improvements 5,168,077 - - (17,022) 5,151,055
Construction in progress 31,646,354 1,217,023 (26,754,805) (23,092) 6,085,480
Total capital assets not being depreciated 48,273,464 1,217,023 (26,754,805) (40,114) 22,695,568
Other capital assets:
Buildings and improvements 134,837,809 - 24,047,190 - 158,884,999
Machinery, equipment, and other 19,257,016 570,208 - (54,237) 19,772,987
Depreciable Land Improvements 2,930,627 - 2,707,615 - 5,638,241
Vehicles 2,479,333 233,327 - (27,457) 2,685,203
Total other capital assets at historical cost 159,504,785 803,535 26,754,805 (81,694) 186,981,430
Less accumulated depreciation for:
Buildings and improvements (68,681,497) (3,749,197) - - (72,430,694)
Machinery, equipment, and other (13,895,541) (1,448,847) - 54,237 (15,290,151)
Depreciable Land Improvements (1,793,398) (241,937) - - (2,035,335)
Vehicles (2,319,213) (39,495) - 27,457 (2,331,251)
Total accumulated depreciation (86,689,649) (5,479,475) - 81,694 (92,087,431)
Capital Assets, Net 121,088,600$ (3,458,917)$ 0$ (40,114)$ 117,589,568$
The Gain (Loss) on Disposal of Assets consisted of the following:
Gain on sale of asset 82,978$
Loss on Disposal -
Net Gain (Loss) on Disposals 82,978$
Beginning Ending
Balance Balance
30-Jun-16 Increases Transfers Decreases 30-Jun-17
Capital assets not being depreciated:
Land 11,459,033$ -$ -$ -$ 11,459,033$
Land Improvements 5,168,077 - - - 5,168,077
Construction in progress 24,119,897 7,526,457 - - 31,646,354
Total capital assets not being depreciated 40,747,007 7,526,457 - - 48,273,464
Other capital assets:
Buildings and improvements 134,837,809 - - - 134,837,809
Machinery, equipment, and other 17,103,116 4,036,139 (1,678,693) (203,547) 19,257,016
Depreciable Land Improvements 2,930,627 - - - 2,930,627
Vehicles 2,386,038 108,295 - (15,000) 2,479,333
Total other capital assets at historical cost 157,257,590 4,144,434 (1,678,693) (218,547) 159,504,785
Less accumulated depreciation for:
Buildings and improvements (65,079,997) (3,601,500) - - (68,681,497)
Machinery, equipment, and other (13,070,706) (1,501,569) 473,187 203,547 (13,895,541)
Depreciable Land Improvements (1,657,831) (135,567) - - (1,793,398)
Vehicles (2,318,220) (15,993) - 15,000 (2,319,213)
Total accumulated depreciation (82,126,754) (5,254,629) 473,187 218,547 (86,689,649)
Capital Assets, Net 115,877,843$ 6,416,262$ (1,205,505)$ -$ 121,088,600$

GREENVILLE TECHNICAL COLLEGE Notes to Financial Statements
June 30, 2018 and June 30, 2017
54 | Greenville Technical College
NOTE 9 - PENSION PLAN(S)
The majority of employees of Greenville Technical College are covered by a retirement plan through the South Carolina Retirement System (SCRS), a cost-sharing multiple-employer defined benefit pension plan administered by the Retirement Division of the South Carolina Public Employee Benefit Authority (PEBA), a public employee retirement system. Generally, all full-time or part-time equivalent state employees in a permanent position are required to participate in and contribute to the SCRS as a condition of employment unless exempted by law as provided in Section 9-1-480 of the South Carolina Code of Laws, as amended, or are eligible and elect to participate in the State Optional Retirement Program (ORP). This SCRS plan provides lifetime monthly retirement annuity benefits to members as well as disability, survivor options, annual benefit adjustments, death benefits, and incidental benefits to eligible employees and retired members.
GASB Statement No. 67, Financial Reporting for Pension Plans, replaces the requirements of Statement No. 25 and Statement No. 50, and is effective for fiscal periods beginning after June 15, 2013. This statement affects the reporting requirements for pension plans that administer benefits. The South Carolina Public Employee Benefit Authority (PEBA) implemented the changes required by this standard in the South Carolina Retirement Systems’ financial statements issued for the fiscal year ended June 30, 2014. This statement has no direct impact on the reporting requirements of employers participating in the plans, as such including these financial statements of Greenville Technical College.
GASB Statement No. 68, Accounting and Financial Reporting for Pensions, replaces the requirements of Statement No. 27, and is effective for fiscal period years beginning after June 15, 2014. This statement establishes standards for measuring and recognizing liabilities, deferred outflows of resources, deferred inflows of resources, and expense/expenditures.
The Retirement Division maintains five independent defined benefit plans and issues its own publicly available Comprehensive Annual Financial Report (CAFR) which includes financial statements and required supplementary information. A copy of the separately issued CAFR may be obtained by writing to the South Carolina Public Employee Benefit Authority, P.O. Box 11960, Columbia, South Carolina 29211-1960. Furthermore, the Division and the five pension plans are included in the State of South Carolina’s CAFR.
A plan’s Net Pension Liability (NPL) is determined by reducing its total pension liability by its fiduciary net position. Total pension liability is defined by the Governmental Accounting Standards Board (GASB) as the portion of the actuarial present value of projected benefit payments that is attributed to past periods of member service in conformity with the requirements of GASB 67. Total pension liability may be impacted annually by the cost of service accrued by participants, interest accrued on the liability, the impact of benefit and assumption changes, the cost of benefit payments, and the difference between expected and actual plan experience. The most significant impact on a plan’s fiduciary net position relates to the rate of return on its investments. Consequently, significant fluctuations in the market value of investments substantially affect the fiduciary net position component of the NPL calculation, and as a result, cause a direct change in the NPL.
South Carolina Retirement System (SCRS) and Police Officers’ Retirement System (PORS) are in a net cash outflow flow position with benefit payments exceeding contributions; therefore, investment performance must make up this gap before fiduciary net position can grow. Investments earned negative 0.39 percent during the plan year ended June 30, 2016, and thus the market value of SCRS and PORS investments decreased. Consequently, both plans experienced an overall decrease in plan fiduciary net position for the fiscal year ended June 30, 2016. This change, coupled with the annual increase in the total pension liability, led to a $2.39 billion and $357 million increase in the NPL for SCRS and PORS, respectively, for the measurement period ended June 30, 2016. For the plan year ended June 30, 2017, investments earned 11.88 percent. Coupled with the annual increase in the total pension liability, this led to a $1.15 billion and $203 million increase in the NPL for SCRS and PORS, respectively, for the measurement period ended June 30, 2017.
As previously communicated by PEBA, the financial reporting changes required by GASB 68 are likely to result in increased volatility in an employers’ reported proportionate share of the NPL from one year to the next. Regardless of the NPL reported on the employer’s financial statements, the employer is responsible only for making the contributions required by state law during any given year. Employers cannot pay down or pay off their proportionate share of the NPL because SCRS and PORS are multiple employer, cost-sharing defined benefit plans.

GREENVILLE TECHNICAL COLLEGE Notes to Financial Statements
June 30, 2018 and June 30, 2017
2018 Comprehensive Annual Financial Report | 55
NOTE 9 - PENSION PLAN(S), continued
Under the SCRS, Class II members are eligible for a full service retirement annuity upon reaching age 65 or completion of 28 years of credited service regardless of age. Employees who first became members of the System after June 30, 2012 are considered Class III members and are eligible for a full service retirement annuity upon reaching age 65 or upon meeting the rule of 90 requirement (i.e., the members age plus the years of service add up to a total of at least 90). The benefit formula for full benefits effective since July 1, 1989 for the SCRS is 1.82 percent of an employee’s average final compensation (AFC) multiplied by the number of years of credited service. For Class II members, AFC is the average annual earnable compensation during 12 consecutive quarters and includes an amount for up to 45 days termination pay at retirement for unused annual leave. For Class III members, AFC is the average annual earnable compensation during 20 consecutive quarters and termination pay for unused annual leave at retirement is not included. Early retirement options with reduced benefits are available as early as age 55 for Class II members and age 60 for Class III members. Class II members are vested for a deferred annuity after five years of earned service. Class III members are vested for a deferred annuity after eight years of earned service. Members qualify for a survivor’s benefit upon completion of 15 years of credited service (five years effective January 1, 2002).
Disability annuity benefits are payable to Class II members if they have permanent incapacity to perform regular duties of the member’s job and they have at least 5 years of earned service (this requirement does not apply if the disability is a result of a job related injury). Class III members qualify for disability annuity benefits provided they have a minimum of eight years of credited service. An incidental death benefit equal to an employee’s annual rate of compensation is payable upon the death of an active employee with a minimum of one year of credited service or to a working retired contributing member. There is no service requirement for death resulting from actual performance of duties for an active member. For eligible retired members, a lump-sum payment is made to the retiree’s beneficiary of up to $6,000 based on years of service at retirement. TERI participants and retired contributing members are eligible for the increased death benefit equal to their annual salary in lieu of the standard retired member benefit.
Effective January 1, 2001, Section 9-1-2210 of the South Carolina Code of Laws allows employees eligible for service retirement to participate in the Teacher and Employee Retention Incentive (TERI) Program. TERI participants may retire and begin accumulating retirement benefits on a deferred basis without terminating employment for up to five years. Upon termination of employment or at the end of the TERI period, whichever is earlier, participants will begin receiving monthly service retirement benefits which will include any cost of living adjustments granted during the TERI period. Because participants are considered retired during the TERI period, they do not earn service credit, and are ineligible to receive group life insurance benefits or disability retirement benefits. The TERI program ended June 30, 2018.
Effective July 1, 2017, employees participating in the SCRS were required to contribute 9.00% of all earnable compensation. The employer contribution rate for SCRS was 19.06%, actuarially determined as an amount that, when combined with employee contributions, is expected to finance the costs of benefits earned by employees during the year, with an additional amount to finance any unfunded accrued liability. Included in the total SCRS employer contribution rate is a base retirement contribution of 13.41%, .15% for the incidental death program and a 5.50% surcharge that will fund retiree health and dental insurance coverage. Employer contributions for State ORP include a 8.41% employer retirement contribution, 5.50% retiree insurance surcharge and .15% incidental death benefit. Greenville Technical College’s actual contributions to the SCRS for the years ended June 30, 2018, 2017, and 2016 were approximately $4,698,678, $3,977,149, and $3,772,901, respectively, and equaled the base required retirement contribution rate, excluding surcharge, of 13.41% for 2018, 11.41% for 2017, and 10.91% for 2016. Also, the college paid employer incidental death program contributions of approximately $52,558, $52,285, and $51,873, at the rate of .15% of compensation for the current fiscal years ended June 30, 2018, 2017, and 2016 respectively.
At June 30, 2018, Greenville Technical College reported a pension liability of $89,697,728 for SCRS. The net pension liability was measured as of June 30, 2017, and the total pension liability used to calculate the net pension liability was determined by an actuarial valuation as of that date. At June 30, 2017, Greenville Technical College reported a pension liability of $87,825,732 for SCRS. The college’s proportion of the net pension liability was based on a projection of the college’s long-term share of contributions to the pension plan relative to the projected contributions of all participating agencies, actuarially determined. At June 30, 2017, the college’s proportion of

GREENVILLE TECHNICAL COLLEGE Notes to Financial Statements
June 30, 2018 and June 30, 2017
56 | Greenville Technical College
NOTE 9 - PENSION PLAN(S), continued
SCRS was .398451%, which was a decrease of .012721% from its proportion measured as of June 30, 2016 of .411172%.
For the year ended June 30, 2018, Greenville Technical College recognized pension expense of $7,912,018 for SCRS. At June 30, 2018, the college reported deferred outflows of resources and deferred inflows of resources related to those pensions from the following sources:
$5,595,230 reported as deferred outflows of resources related to pensions resulting from Greenville Technical College SCRS contributions subsequent to the measurement date will be recognized as a reduction of the net pension liability in the year ended June 30, 2019. Other amounts reported as deferred outflows or resources and deferred inflows of resources related to pensions will be recognized in pension expense as follows:
For the year ended June 30, 2017, Greenville Technical College recognized pension expense of $7,246,948 for SCRS. At June 30, 2017, the college reported deferred outflows of resources and deferred inflows of resources related to those pensions from the following sources:
Deferred Outflows
of Resources
Deferred Inflows of
Resources
Liability Experience 399,872$ 49,716$
Assumption Changes 5,250,839 -
Investment 2,503,940 -
Chagnes in proportion and difference between
Greenville Technical College contributions and
proportionate share of plan contributions - 2,910,650
Greenville Technical College contributions
subsequent to the measurement date 5,595,230 -
Total 13,749,881$ 2,960,366$
2019 1,273,233
2020 2,761,120
2021 1,897,264
2022 (737,333)
Year ended June 30:
Deferred Outflows
of Resources
Deferred Inflows of
Resources
Liability Experience 910,417$ 95,379$
Investment Experience 7,388,966 -
Changes in proportion and difference between
Greenville Technical College contributions
and proportionate share of plan contributions - 1,617,086
Greenville Technical College contributions
subsequent to the measurement date 4,650,556 -
Total 12,949,939$ 1,712,465$
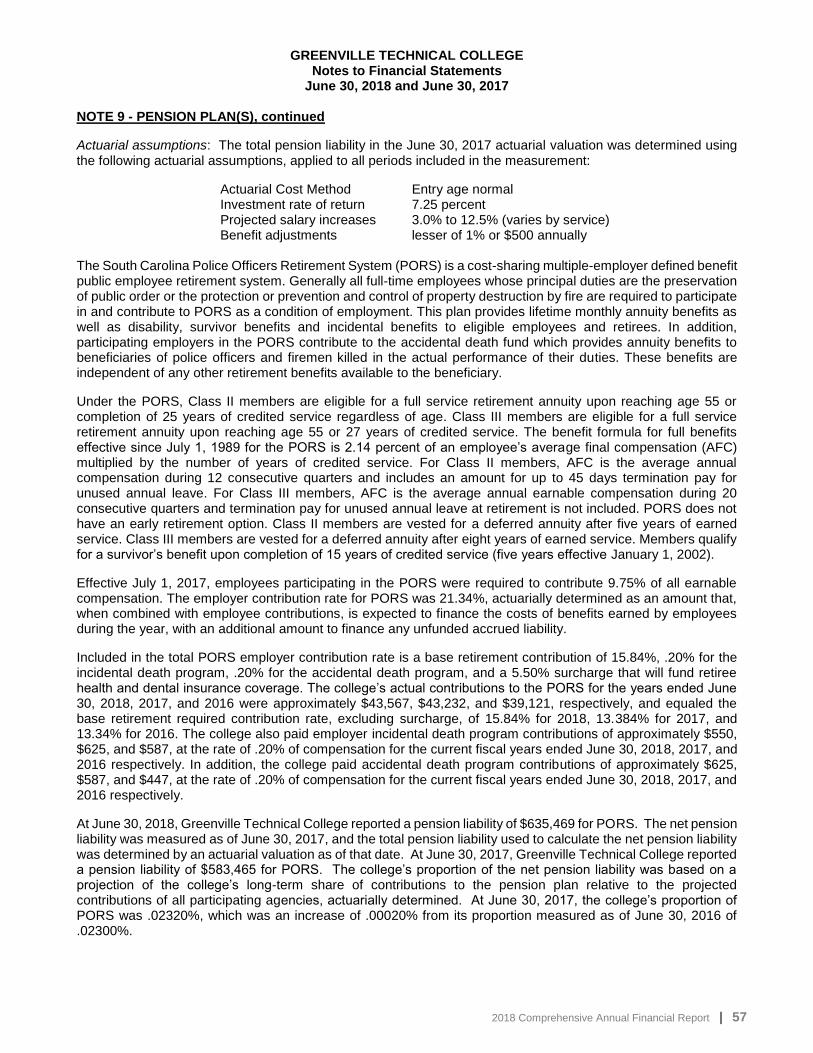
GREENVILLE TECHNICAL COLLEGE Notes to Financial Statements
June 30, 2018 and June 30, 2017
2018 Comprehensive Annual Financial Report | 57
NOTE 9 - PENSION PLAN(S), continued
Actuarial assumptions: The total pension liability in the June 30, 2017 actuarial valuation was determined using the following actuarial assumptions, applied to all periods included in the measurement:
Actuarial Cost Method Entry age normal Investment rate of return 7.25 percent Projected salary increases 3.0% to 12.5% (varies by service) Benefit adjustments lesser of 1% or $500 annually The South Carolina Police Officers Retirement System (PORS) is a cost-sharing multiple-employer defined benefit public employee retirement system. Generally all full-time employees whose principal duties are the preservation of public order or the protection or prevention and control of property destruction by fire are required to participate in and contribute to PORS as a condition of employment. This plan provides lifetime monthly annuity benefits as well as disability, survivor benefits and incidental benefits to eligible employees and retirees. In addition, participating employers in the PORS contribute to the accidental death fund which provides annuity benefits to beneficiaries of police officers and firemen killed in the actual performance of their duties. These benefits are independent of any other retirement benefits available to the beneficiary.
Under the PORS, Class II members are eligible for a full service retirement annuity upon reaching age 55 or completion of 25 years of credited service regardless of age. Class III members are eligible for a full service retirement annuity upon reaching age 55 or 27 years of credited service. The benefit formula for full benefits effective since July 1, 1989 for the PORS is 2.14 percent of an employee’s average final compensation (AFC) multiplied by the number of years of credited service. For Class II members, AFC is the average annual compensation during 12 consecutive quarters and includes an amount for up to 45 days termination pay for unused annual leave. For Class III members, AFC is the average annual earnable compensation during 20 consecutive quarters and termination pay for unused annual leave at retirement is not included. PORS does not have an early retirement option. Class II members are vested for a deferred annuity after five years of earned service. Class III members are vested for a deferred annuity after eight years of earned service. Members qualify for a survivor’s benefit upon completion of 15 years of credited service (five years effective January 1, 2002).
Effective July 1, 2017, employees participating in the PORS were required to contribute 9.75% of all earnable compensation. The employer contribution rate for PORS was 21.34%, actuarially determined as an amount that, when combined with employee contributions, is expected to finance the costs of benefits earned by employees during the year, with an additional amount to finance any unfunded accrued liability.
Included in the total PORS employer contribution rate is a base retirement contribution of 15.84%, .20% for the incidental death program, .20% for the accidental death program, and a 5.50% surcharge that will fund retiree health and dental insurance coverage. The college’s actual contributions to the PORS for the years ended June 30, 2018, 2017, and 2016 were approximately $43,567, $43,232, and $39,121, respectively, and equaled the base retirement required contribution rate, excluding surcharge, of 15.84% for 2018, 13.384% for 2017, and 13.34% for 2016. The college also paid employer incidental death program contributions of approximately $550, $625, and $587, at the rate of .20% of compensation for the current fiscal years ended June 30, 2018, 2017, and 2016 respectively. In addition, the college paid accidental death program contributions of approximately $625, $587, and $447, at the rate of .20% of compensation for the current fiscal years ended June 30, 2018, 2017, and 2016 respectively.
At June 30, 2018, Greenville Technical College reported a pension liability of $635,469 for PORS. The net pension liability was measured as of June 30, 2017, and the total pension liability used to calculate the net pension liability was determined by an actuarial valuation as of that date. At June 30, 2017, Greenville Technical College reported a pension liability of $583,465 for PORS. The college’s proportion of the net pension liability was based on a projection of the college’s long-term share of contributions to the pension plan relative to the projected contributions of all participating agencies, actuarially determined. At June 30, 2017, the college’s proportion of PORS was .02320%, which was an increase of .00020% from its proportion measured as of June 30, 2016 of .02300%.

GREENVILLE TECHNICAL COLLEGE Notes to Financial Statements
June 30, 2018 and June 30, 2017
58 | Greenville Technical College
NOTE 9 - PENSION PLAN(S), continued
For the year ended June 30, 2018, Greenville Technical College recognized pension expense of $137,713 for PORS. At June 30, 2018, the college reported deferred outflows of resources and deferred inflows of resources related to those pensions from the following sources:
$44,117 reported as deferred outflows of resources related to pensions resulting from Greenville Technical College PORS contributions subsequent to the measurement date will be recognized as a reduction of the net pension liability in the year ended June 30, 2019. Other amounts reported as deferred outflows or resources and deferred inflows of resources related to pensions will be recognized in pension expense as follows:
For the year ended June 30, 2017, Greenville Technical College recognized pension expense of $121,347 for PORS. At June 30, 2017, the college reported deferred outflows of resources and deferred inflows of resources related to those pensions from the following sources:
Deferred Outflows
of Resources
Deferred Inflows of
Resources
Liability Experience 5,667$ -$
Assumption Changes 60,312 -
Investment 22,644 -
Chagnes in proportion and difference between
Greenville Technical College contributions and
proportionate share of plan contributions 123,263 -
Greenville Technical College contributions
subsequent to the measurement date 44,117 -
Total 256,003$ -$
Deferred Outflows
of Resources
Deferred Inflows of
Resources
Liability Experience 8,658$ -$
Investment Experience 66,160 -
Changes in proportion and difference between
Greenville Technical College contributions
and proportionate share of plan contributions 178,296 -
Greenville Technical College contributions
subsequent to the measurement date 43,857 -
Total 296,971$ -$

GREENVILLE TECHNICAL COLLEGE Notes to Financial Statements
June 30, 2018 and June 30, 2017
2018 Comprehensive Annual Financial Report | 59
NOTE 9 - PENSION PLAN(S), continued
Actuarial assumptions: The total pension liability in the June 30, 2017 actuarial valuation was determined using the following actuarial assumptions, applied to all periods included in the measurement:
Actuarial Cost Method Entry age normal Investment rate of return 7.5 percent Projected salary increases 3.5% to 9.5% (varies by service) Benefit adjustments lesser of 1% or $500 annually As an alternative to membership to SCRS, newly hired state and school district employees may elect to participate in the State Optional Retirement Program (ORP), a defined contribution plan. The ORP was established in 1987 under Title 9, Chapter 20, of the South Carolina Code of Laws. State ORP participants direct the investment of their funds into a plan administered by one of four investment providers. The state assumes no liability for State ORP plan other than for payment of contributions to designated companies. To elect participation in the ORP, eligible employees must elect membership within their first 30 days of employment. Under State law, contributions to the ORP are required at the same rates as for the SCRS, 13.56% plus the retiree surcharge of 5.50% from the employer in fiscal year 2018. Of the 13.56% employer retirement contribution rate, the employer remits 5.00% directly to the participant’s ORP account and the remaining 8.41% and .15% incidental death program contribution amounts are remitted to SCRS.
For fiscal year 2018, total contributions requirements to the ORP were approximately $1,322,193 (excluding the surcharge) from Greenville Technical College as employer and approximately $887,219 from its employees as plan members.
The amounts paid by the college for pension, incidental death program, and accidental death program contributions are reported as employer contribution expenditures within the applicable functional expenditure categories to which the related salaries are charged. Article X, Section 16, of the South Carolina Constitution requires that all state-operated retirement systems be funded on a sound actuarial basis. Title 9 of the South Carolina Code of Laws of 1976, as amended, prescribes requirements relating to membership, benefits, and employee/employer contributions for each retirement system. Employee and employer contribution rates for the SCRS and PORS are actuarially determined. The surcharges to fund retiree health and dental insurance are not part of the actuarially established rates.
The post-retiree mortality assumption is dependent upon the member’s job category and gender. The base mortality assumptions, the 2016 Public Retirees of South Carolina Mortality table (2016 PRSC), was developed using the Systems’ mortality experience. These base rates are adjusted for future improvement in mortality using published Scale AA projected from the year 2016.
Assumptions used in the determination of the June 30, 2017, TPL are as follows:
South Carolina state statute requires that an actuarial experience study be completed at least once in each five-year period. An experience report on the Systems was most recently issued as of July 1, 2015. The June 30, 2016 total pension liability, net pension liability, and sensitivity information were determined by the Systems consulting actuary and are based on July 1, 2015 actuarial valuations, as adopted by the PEBA Board and SFAA which utilized membership data as of July 1, 2015. The total pension liability was rolled-forward from the valuation date to the Systems’ fiscal year ended June 30, 2016, using generally accepted actuarial principles.
Former Job Class Males Females
Educators 2016 PRSC Males multiplied by 92% 2016 PRSC Females multiplied by 98%
General Employees and Members of
the General Assembly2016 PRSC Males multiplied by 100% 2016 PRSC Females multiplied by 111%
Public Safety and Firefighters 2016 PRSC Males multiplied by 125% 2016 PRSC Females multiplied by 111%

GREENVILLE TECHNICAL COLLEGE Notes to Financial Statements
June 30, 2018 and June 30, 2017
60 | Greenville Technical College
NOTE 9 - PENSION PLAN(S), continued
The long-term expected rate of return on pension plan investments was determined using a building-block method in which best estimates of arithmetic real rates of return (expected returns, net of pension plan investment expense and inflation) are developed for each major asset class. These rates are combined to produce the long-term expected rate of return by weighting the expected future real rates of return by the target asset allocation percentage and by adding expected inflation. The target allocation and best estimates of arithmetic real rates of return for each major asset class are summarized in the following table:
The discount rate used to measure the total pension liability was 7.25 percent. The projection of cash flows used to determine the discount rate assumed that contributions from employee contributions in SCRS and PORS will be made at the current contribution rate and that contributions from participating employers will be made at contractually required rates, actuarially determined. Based on those assumptions, the pension plan’s fiduciary net position was projected to be available to make all projected future benefit payments of current active and inactive employees. Therefore, the long-term expected rate of return on pension plan investments was applied to all periods of projected benefit payments to determine the total pension liability.
Asset ClassTarget Asset
Allocation
Expected
Arithmetic Real
Rate of Return
Long Term
Expected
Portfolio Real
Rate of Return
Global Equity 45.00%
Global Public Equity 31.00% 6.72% 2.08%
Private Equity 9.00% 9.60% 0.86%
Equity Options Strategies 5.00% 5.91% 0.30%
Real Assets 8.00%
Real Estate (Private) 5.00% 4.32% 0.22%
Real Estate (REITs) 2.00% 6.33% 0.13%
Infrastructure 1.00% 6.26% 0.06%
Opportunistic 17.00%
GTAA/Risk Parity 10.00% 4.16% 0.42%
Hedge Funds (non-PA) 4.00% 3.82% 0.15%
Other Oppurtunistic Strategies 3.00% 4.16% 0.12%
Diviersified Credit 18.00%
Mixed Credit 6.00% 3.92% 0.24%
Emerging Markets Debt 5.00% 5.01% 0.25%
Private Debt 7.00% 4.37% 0.31%
Conservative Fixed Income 12.00%
Core Fixed Income 10.00% 1.60% 0.16%
Cash and Short Duration (net) 2.00% 0.92% 0.02%
Total Expected Real Return 100.00% 5.31%
Inflation for Actuarial Purposes 2.25%
Total Expected Nominal Return 7.56%

GREENVILLE TECHNICAL COLLEGE Notes to Financial Statements
June 30, 2018 and June 30, 2017
2018 Comprehensive Annual Financial Report | 61
NOTE 9 - PENSION PLAN(S), continued
The following presents Greenville Technical College’s proportionate share of the net pension liabilities calculated using the discount rate of 7.25 percent, as well as what the college’s proportionate share of the net pension liabilities would be if they were calculated using a discount rate that is 1.00 percent lower (6.50 percent) or 1.00 percent higher (8.50 percent) than the current rate.
NOTE 10 - POSTEMPLOYMENT AND OTHER EMPLOYEE BENEFITS
Plan Description
In accordance with the South Carolina Code of Laws and the annual Appropriations Act, the state provides post-employment health and dental and long-term disability benefits to retired state and employees and their covered dependents. Greenville Technical College contributes to the South Carolina Retiree Health Insurance Trust Fund (SCRHITF) and the South Carolina Long-Term Disability Insurance Trust Fund (SCLTDITF), cost-sharing multiple employer defined benefit post-employment healthcare and long-term disability plans administered by the Insurance Benefits Division (IB) of the South Carolina Public Employee Benefit Authority (PEBA).
Generally, retirees are eligible for the health and dental benefits if they have established at least ten years of retirement service credit. For new hires beginning employment May 2, 2008 and after, retirees are eligible for benefits if they have established 25 years of service for 100% employer funding and 15 through 24 years of service for 50% employer funding.
Benefits become effective when the former employee retires under a state retirement system. Basic Long-Term Disability (BLTD) benefits are provided to active state, public school district, and participating local government employees approved for disability.
Funding Policies
Section 1-11-710 of the South Carolina Code of Laws of 1976, as amended, requires these post-employment and long-term disability benefits be funded through annual appropriations by the General Assembly for active employees to the IB and participating retirees to the PEBA, except for the portion funded through the pension surcharge and provided from the other applicable sources of the IB, for its active employees who are not funded by State General Fund appropriations. Employers participating in the RMP are mandated by state statute to contribute at a rate assessed each year by the Office of the State Budget, 5.50% and 5.33% of annual covered payroll for the fiscal years ended June 30, 2018 and 2017, respectively. The IB sets the employer contribution rate based on a pay-as-you-go basis. Greenville Technical College paid approximately $2,484,538 and $2,379,173 applicable to the surcharge included with the employer contribution for retirement benefits for the fiscal years ended June 30, 2018 and 2017, respectively. BLTD benefits are funded through a person’s premium charged to state agencies, public school districts, and other participating local governments. The monthly premium per active employee paid to IB was $3.22 for the fiscal years ended June 30, 2018 and 2017. Greenville Technical College recorded employer contributions expenses applicable to these insurance benefits for active employees in the amount of approximately $24,913 and $24,846 for the years ended June 30, 2018 and 2017, respectively.
Effective May 1, 2008 the state established two trust funds through Act 195 for the purpose of funding and accounting for the employer costs of retiree health and dental insurance benefits and long-term disability insurance benefits. The SCRHITF is primarily funded through the payroll surcharge. Other sources of funding include additional state appropriated dollars, accumulated IB reserves, and income generated from investments. The SCLTDITF is primarily funded through investment income and employer contributions.
Greenville Technical
College proportional
share of net pension
liability
1.00% Decrease
(6.25%)
Current Discount
Rate (7.25%)
1.00% Increase
(8.25%)
SCRS 115,608,050$ 89,697,728$ 73,976,251$
PORS 858,003$ 635,469$ 460,181$

GREENVILLE TECHNICAL COLLEGE Notes to Financial Statements
June 30, 2018 and June 30, 2017
62 | Greenville Technical College
NOTE 10 - POSTEMPLOYMENT AND OTHER EMPLOYEE BENEFITS, continued
Funding Policies, continued A copy of the separately issued financial statements for the benefit plans and the trust funds may be obtained by writing to the South Carolina Public Employee Benefit Authority – Insurance Benefits Division, P.O. Box 11960, Columbia, South Carolina 29211-1960. Deferred Outflows of Resources and Deferred Inflows of Resources related to Post-Employment Benefits Other Than Pensions Greenville Technical College reported an OPEB (Other Post-Employment Benefits) liability of for Retiree Health Insurance $71,696,611 at June 30, 2018 and $76,586,515 at June 30, 2017. The net OPEB liability was measured as of June 30, 2017, and June 30, 2016, respectively, and the total OPEB liability used to calculate the net OPEB liability was determined by an actuarial valuation as of those dates. At June 30, 2017, the college’s proportion of the OPEB Health Liability was .529328%, the same as it’s proportion as of June 30, 2016.
For the year ended June 30, 2018, Greenville Technical College recognized OPEB Health expense of $4,363,732 for OPEB Health. At June 30, 2018, the college reported deferred outflows of resources and deferred inflows of resources related to Post-Employment Benefits Other Than Pensions (OPEB) for South Carolina Retiree Health Insurance Trust Fund (SCRHITF) from the following sources:
$2,427,544 reported as deferred outflows of resources related to pensions resulting from Greenville Technical College OPEB Health Insurance contributions subsequent to the measurement date will be recognized as a reduction of the net OPEB liability in the year ended June 30, 2019. Other amounts reported as deferred outflows or resources and deferred inflows of resources related to OPEB Health will be recognized in OPEB expense as follows:
Greenville Technical College reported an OPEB liability for Long-Term Disability Insurance of $6,353 at June 30, 2018 and $2,432 at June 30, 2017. The net OPEB liability was measured as of June 30, 2017, and June 30, 2016, respectively, and the total OPEB liability used to calculate the net OPEB liability was determined by an
Deferred Outflows
of Resources
Deferred Inflows
of Resources
Liability Experience -$ 31,117$
Assumption Changes - 6,746,318
Investment Experience 123,195 -
Outstanding balance between Greenville
Technical College contributions and
proportionate share of plan contributions - 1,026
Greenville Technical College contributions
subsequent to the measurement date 2,427,544 -
Total 2,550,739$ 6,778,461$

GREENVILLE TECHNICAL COLLEGE Notes to Financial Statements
June 30, 2018 and June 30, 2017
2018 Comprehensive Annual Financial Report | 63
NOTE 10 - POSTEMPLOYMENT AND OTHER EMPLOYEE BENEFITS, continued
Deferred Outflows of Resources and Deferred Inflows of Resources related to Post-Employment Benefits Other Than Pensions, continued actuarial valuation as of that date. At June 30, 2017, the college’s proportion of the OPEB Long-Term Disability Liability was .350400%, the same as it’s proportion as of June 30, 2016.
For the year ended June 30, 2018, Greenville Technical College recognized OPEB Long-Term Disability expense of $28,359 for OPEB Long-Term Disability. At June 30, 2018, the college reported deferred outflows of resources and deferred inflows of resources related to Post-Employment Benefits Other Than Pensions (OPEB) for South Carolina Long-Term Disability Insurance Trust Fund (SCLTDITF) from the following sources:
$24,913 reported as deferred outflows of resources related to pensions resulting from Greenville Technical College OPEB Long-Term Disability Insurance contributions subsequent to the measurement date will be recognized as a reduction of the net OPEB liability in the year ended June 30, 2019. Other amounts reported as deferred outflows or resources and deferred inflows of resources related to OPEB Long-Term Disability will be recognized in OPEB expense as follows:
Actuarial Assumptions and Methods Actuarial valuations involve estimates of the value of reported amounts and assumptions about the probability of occurrence of events far into the future. Examples include assumptions about future employment, mortality, and the healthcare cost trend. Actuarially determined amounts are subject to continual revision as actual results are compared with past expectations and new estimates are made about the future. The actuarial methods and assumptions used include techniques that are designed to reduce the effects of short-term volatility in actuarial accrued liabilities and the actuarial value of assets, consistent with the long-term perspective of the calculations.
Deferred Outflows
of Resources
Deferred Inflows
of Resources
Liability Experience -$ -$
Assumption Changes - 576
Investment Experience 3,061 -
Outstanding balance between Greenville
Technical College contributions and
proportionate share of plan contributions - 157
Greenville Technical College contributions
subsequent to the measurement date 24,913 -
Total 27,974$ 733$

GREENVILLE TECHNICAL COLLEGE Notes to Financial Statements
June 30, 2018 and June 30, 2017
64 | Greenville Technical College
NOTE 10 - POSTEMPLOYMENT AND OTHER EMPLOYEE BENEFITS, continued
Actuarial Assumptions and Methods, continued
The following table provides a summary of the actuarial assumptions and methods used in the June 30, 2017 actuarial valuation for SCRHITF:
Actuarial Assumptions: SCRHITF
Valuation date June 30, 2016
Actuarial cost method Entry age normal
Inflation 2.25%
Investment rate of return4.00, net of OPEB Plan investment expense;
including inflation
Single discount rate 3.56% as of June 30, 2017
Demographic assumptionsBased on the experience study performed for
the South Carolina Retirement Systems for
the 5-year period ending June 30, 2015
Healthcare trend rateInitial trend starting at 7.00% and gradually
decreasing to an ultimate trend rate of 4.15%
over a period of 15 years
Aging factors Based on plan specific experience
Expenses
The investment return assumption is net of
the investment expenses; Administrative
expenses related to the health care benefits
are included in the age-adjusted claims
costs
Notes
There were no benefit changes during the
year. The discount rate changed from 2.92%
as of June 30, 2016 to 3.56% as of June 30,
2017

GREENVILLE TECHNICAL COLLEGE Notes to Financial Statements
June 30, 2018 and June 30, 2017
2018 Comprehensive Annual Financial Report | 65
NOTE 10 - POSTEMPLOYMENT AND OTHER EMPLOYEE BENEFITS, continued
Actuarial Assumptions and Methods, continued
The following table provides a summary of the actuarial assumptions and methods used in the June 30, 2017 actuarial valuation for SCLTDITF:
Single Discount Rate The Single Discount Rate of 3.56% was used to measure the total OPEB liability for the SCRHITF. The accounting policy for this plan is to set the Single Discount Rate equal to the prevailing municipal bond rate. Due to the plan’s investment and funding policies, the difference between a blended discount rate and the municipal bond rate would be less than several basis points (several hundredths of one percent).
A Single Discount Rate of 3.87% was used to measure the total OPEB liability for the SCLTDITF. This Single Discount Rate was based on an expected rate of return on plan investments of 4.00% and a municipal bond rate 3.56%. The projection of cash flows to determine this Single Discount Rate assumed that employer contributions will remain $38.64 per year for each covered active employee. Based on these assumptions, the plan’s Fiduciary Net Position and future contributions were sufficient to finance the benefit payments through the year 2037. As a
Actuarial Assumptions: SCLTDITF
Valuation date June 30, 2016
Actuarial cost method Entry age normal
Inflation 2.25%
Investment rate of return4.00, net of Plan investment expense;
including inflation
Single discount rate 3.87% as of June 30, 2017
Salary, Termination, and
Retirement Rates
Based on the experience study performed for
the South Carolina Retirement Systems for
the 5-year period ending June 30, 2015
Disability Incidence
The disability incidence rates used in the
LTD valuaition are based on the rates
developed for the pension plans.
Disability Recovery
For participants in payment, 1987 CGDT
Group Disability; for active employees, 60%
were assumed to recover after the first year
and 92% were assumed to recover after the
first two years
Offsets
40% are assumed to be eligible for Social
Security benefits; assumed percentage who
will be eligible for a pension plan offset varies
based on employee group
Expenses
Investment expenses are net of the
investment returns; Third party administrative
expenses are included in the benefit
projections.
Notes
There were no benefit changes during the
year. The discount rate changed from 3.74%
as of June 30, 2016 to 3.87% as of June 30,
2017

GREENVILLE TECHNICAL COLLEGE Notes to Financial Statements
June 30, 2018 and June 30, 2017
66 | Greenville Technical College
NOTE 10 - POSTEMPLOYMENT AND OTHER EMPLOYEE BENEFITS, continued
Single Discount Rate, continued result, the long-term expected rate of return on plan investments was applied to project benefit payments through the year 2037, and the municipal bond rate was applied to all benefit payments after that date.
Long Term Expected Rate of Return
For the SCRHITF and the SCLTDITF, the annual money-weighted rate of return on the plan investments were 1.36% and 1.00%, respectively.
Sensitivity Analysis The following table presents the College’s proportionate share of the SCRHITF net other postemployment benefits (OPEB) liability calculated using the discount rate of 3.56 percent, as well as what the college’s proportionate share of the net OPEB liability would be if it were calculated using a discount rate that is 1 percentage point lower (2.56 percent) or 1 percentage point higher (4.56 percent) than the current rate:
Regarding the sensitivity of the SCRHITF’s net OPEB liability to changes in the healthcare cost trend rates, the following table presents the plan’s net OPEB liability, calculated using the assumed trend rates as well as what the plan’s net OPEB liability would be if it were calculated using a trend rate that is 1 percentage point lower or 1 percentage point higher than the current rate:
The following table presents the college’s proportionate share of the SCLTDITF net OPEB liability calculated using the discount rate of 3.87 percent, as well as what the college’s proportionate share of the net OPEB liability would

GREENVILLE TECHNICAL COLLEGE Notes to Financial Statements
June 30, 2018 and June 30, 2017
2018 Comprehensive Annual Financial Report | 67
NOTE 10 - POSTEMPLOYMENT AND OTHER EMPLOYEE BENEFITS, continued
Sensitivity Analysis, continued be if it were calculated using a discount rate that is 1 percentage point lower (2.87 percent) or 1 percentage point higher (4.87 percent) than the current rate:
NOTE 11 - CONTINGENCIES, LITIGATION, AND PROJECT COMMITMENTS
The college is party to various lawsuits arising out of the normal conduct of its operations. In the opinion of college management, there are no material claims or lawsuits against the college that are not covered by insurance or whose settlement would materially affect the college’s financial position.
The college participates in certain Federal grant programs. These programs are subject to financial and compliance audits by the grantor or its representative. Such audits could lead to requests for reimbursement to the grantor agency for expenditures disallowed under terms of the grant. Management believes disallowances, if any, will not be material.
In 2018 the college completed construction of the Center Manufacturing Innovation (CMI), for which funding was secured in fiscal year 2014. The college also continued construction in 2018 on the Greenville Readiness Center. This new facility is a joint use building between the South Carolina Army National Guard and the college with funding shared by both entities. This project is expected to be completed before the end of calendar year 2018. In 2018 the college began a building renovation project to locate a bookstore on the Barton campus. This renovation is expected to be completed during the first quarter of fiscal year 2019. At June 30, 2018 and June 30, 2017, the college had remaining commitment balances of approximately $767,159 and $1,026,436 respectively on original contracts of $6,605,019 and $31,338,001, respectively with architects, and construction contractors. Other projects, which are not to be capitalized when completed, are for replacements, repairs, and/or renovations to existing facilities. The college anticipates funding these projects out of current resources, current and future bond issues, federal grants, private gifts, student fees, and state capital improvement bond proceeds.
Unrestricted Net Position
Planned Uses of Unrestricted Net Position are as follows:
6/30/2018 6/30/2017
Operating Reserve 14,109,562$ 14,116,849$
Operating Contingency 1,500,000 1,500,000
Encumbrances 298,784 445,536
Inventories 2,585,951 2,773,658
Other Construction Project Costs 30,768,721 32,047,096
Effect of GASB 68 Net Pension Liability (90,333,197) (88,409,197)
Effect of GASB 75 Net OPEB Liability (71,702,963) (76,588,947)
Total (112,773,142)$ (114,115,005)$

GREENVILLE TECHNICAL COLLEGE Notes to Financial Statements
June 30, 2018 and June 30, 2017
68 | Greenville Technical College
NOTE 12 - LEASE OBLIGATIONS
Capital Leases
Certificates of Participation
On October 8, 2010 the 1995/1998 Certificate of Participation was refunded by Greenville County and replaced with the Series 2010 Refunding Certificate of Participation. This refunding reduced the yearly payments by approximately $140,000 and resulted in a reduction of $1.2 million in total future payments.
Lease payments made under this agreement in the year ending June 30, 2018 were $1,049,410. Lease payments for the remainder of the lease are as follows:
Lease payments made under this agreement in the year ending June 30, 2017 were $1,048,200. Lease payments for the remainder of the lease are as follows:
In August, 1999 Greenville County entered into an obligation for the lease-purchase of a portion of a retail shopping center in Greenville and issued Certificates of Participation to cover the purchase price of Greenville Technical College’s portion of the purchase. The remainder of the facility was purchased by the Greenville Tech Foundation, Inc. at fair market value. Upon completion of renovations in December, 2000, the Greenville University Center was relocated to this new facility from other premises owned by the college, and subleases the renovated space. The state appropriated funds in the capital bond bill to cover the renovation costs. The State Legislature included in the budget appropriated funds for a portion of the sublease payments for the University Center, which are, in turn, used to pay a portion of the lease payments for the Certificates of Participation and a portion of the operation and maintenance of the portion of the facility subleased by the University Center. The college accounts for this lease as a capital lease.
These Certificates of Participation were partially refunded by Greenville County on February 23, 2005, with the refunded portion of the Series 1999 being replaced by Series 2005. With this transaction, the combined outstanding principle of the lease was increased by $720,000, and the total future payments under the lease were reduced by $1,167,084.
2010 Refunding Certificate of Participation
Capital Leases
Year Ended June 30 With External Parties
2019 $ 1,050,010
Total Minimum Payments 1,050,010
Less: Interest and Executory Costs 25,010
Present Value of Net Minimum Lease Payments $ 1,025,000
2010 Refunding Certificate of Participation
Capital Leases
Year Ended June 30 With External Parties
2018 $ 1,049,410
2019 1,050,010
Total Minimum Payments 2,099,420
Less: Interest and Executory Costs 74,420
Present Value of Net Minimum Lease Payments $ 2,025,000

GREENVILLE TECHNICAL COLLEGE Notes to Financial Statements
June 30, 2018 and June 30, 2017
2018 Comprehensive Annual Financial Report | 69
NOTE 12 - LEASE OBLIGATIONS, continued
Capital Leases, continued
In 2015, Greenville County issued Certificates of Participation to refund the 2005 Certificates of Participation. The governmental purpose for the issuance of the 2015 Certificate and refunding the Refunded Certificates was to achieve a savings. The outstanding principle of the lease increased by $140,000, and the total future payments under the lease were reduced by $195,457.
Lease payments made under this agreement in the year ending June 30, 2018 amounted to $1,299,528. Lease payments for the remainder of the lease are as follows:
Lease payments made under this agreement in the year ending June 30, 2017 amounted to $1,296,176. Lease payments for the remainder of the lease are as follows:
The carrying value of the property associated with the leases is:
2015 Refunding Certificates of Participation
Capital Leases
Year Ended June 30 With External Parties
2019 1,297,440$
Total Minimum Payments 1,297,440
Less: Interest and Executory Costs 22,440
Present Value of Net Minimum Lease Payments 1,275,000$
2015 Refunding Certificates of Participation
Capital Leases
Year Ended June 30 With External Parties
2018 1,299,528$
2019 1,297,440
Total Minimum Payments 2,596,968
Less: Interest and Executory Costs 66,968
Present Value of Net Minimum Lease Payments 2,530,000$
2018 2017
Capital Leases With
External Parties
Capital Leases With
External Parties
Assets acquired under capital leases
Land and improvements $ 5,151,055 $ 5,168,077
Buildings and improvements 26,100,338 26,100,338
Assets acquired under capital leases
before accumulated depreciation 31,251,393 31,268,415
Less: accumulated depreciation (13,804,709) (13,141,702)
Assets acquired under capital leases, net $ 17,446,684 $ 18,126,713
Carrying Value of Assets under Capital Leases

GREENVILLE TECHNICAL COLLEGE Notes to Financial Statements
June 30, 2018 and June 30, 2017
70 | Greenville Technical College
NOTE 12 - LEASE OBLIGATIONS, continued
Capital Leases, continued
On May 13, 2008 Greenville Technical College entered into a capital lease with the Brashier Middle College, LLC, a wholly owned subsidiary of the Greenville Tech Foundation. The lease began July 1, 2009. The lease is for a 53,000 square foot building which was constructed by the Brashier Middle College, LLC and financed with Jobs- Economic Development Authority Revenue Bonds. The term of the lease is 30 years; the lease payments will be equal to the debt service of the bonds. At the end of the lease, the building will become the property of the college. The related operating leases are discussed below.
During the fiscal year ending June 30, 2018, lease payments in the amount of $573,398 were made to Brashier Middle College, LLC. During the fiscal year ending June 30, 2017, lease payments in the amount of $573,398 were made to Brashier Middle College, LLC.
Lease payments for the remainder of the lease are estimated as follows:
Operating Leases
Greenville Technical College entered into two operating lease agreements on May 13, 2008 related to the construction of the Brashier Middle College building on the Brashier Campus. The first was a ground lease with the Brashier Charter, LLC, a wholly owned subsidiary of the Greenville Tech Foundation (LLC). The LLC leased approximately 5 acres of land on the college’s Brashier Campus. The lease payment is $1.00 per year for the 31 year term. The LLC secured an $8.4 million Jobs-Economic Development Authority Revenue Bonds to build a
2018
Brashier Middle College Lease Capital Leases
Estimated Payments With Component Unit
Year Ended June 30
2019 549,000$
2020 549,500
2021 549,500
2022 549,000
2023 548,000
2024-2028 2,726,750
2029-2033 2,717,500
2034-2038 2,701,750
2039-2040 1,092,250
Total Minimum Payments 11,983,250$
Less: Interest and Executory Costs 4,803,250
Present Value of Net Minimum Lease Payments 7,180,000$
2018 2017
Capital Leases With
Component Units
Capital Leases With
Component Units
Assets acquired under capital leases
Buildings and improvements $ 8,410,000 $ 8,410,000
Assets acquired under capital leases
before accumulated depreciation 8,410,000 8,410,000
Less: accumulated depreciation (2,523,000) (2,242,666)
Assets acquired under capital leases, net $ 5,887,000 $ 6,167,334
Carrying Value of Assets under Capital Leases
with Component Units

GREENVILLE TECHNICAL COLLEGE Notes to Financial Statements
June 30, 2018 and June 30, 2017
2018 Comprehensive Annual Financial Report | 71
NOTE 12 - LEASE OBLIGATIONS, continued
Operating Leases, continued
building on the site. The building will be jointly used by the college and Brashier Middle College, a Charter High School that is currently located on the campus. The lease between the Brashier Middle College, LLC and the college is discussed in Capital Leases above.
The second operating lease is the corresponding sublease with the Brashier Middle College Charter High School to operate and use the facilities for approximately 35 hours per week. The lease payments by Brashier Middle College will be directly related to the debt service. The cost is currently 50 percent of the debt service. The lease payment will be renegotiated yearly based on a prorated share of the debt service based on the usage of the building.
On May 13, 2008, the college entered into a ground lease with Greenville County Recreation District for 19.49 acres at the college’s Northwest campus for a term of 20 years. The county built soccer and baseball fields on the site for use by the community and the college. The annual rent for the land is $1.00
On August 31, 2010, the college, as a licensee of Educational Broadband Service Channels, entered into a long-term lease agreement to lease the excess capacity of the G channel group to Clearwire Spectrum Holdings, III, LLC. This lease was approved by the Federal Communication Commission on September 17, 2010 and became effective October 13, 2010. The college recognized $34,054 in revenue from this lease during the year ended June 30, 2018, as included in the other non-operating revenues in the Statement of Revenues, Expenses, and Changes in Net Position. The college recognized $34,054 in revenue from this lease during the year ended June 30, 2017, as included in the other non-operating revenues in the Statement of Revenues, Expenses, and Changes in Net Position. The total anticipated revenue to the college is $1,280,044, based on renewal options and escalation clauses over the maximum 30 year term of the lease.
On August 31, 2010, the college, as a licensee of Educational Broadband Service Channels, entered into a long-term lease agreement to lease the excess capacity of the D channel group to Independent Spectrum Greenville, LLC. This lease was approved by the Federal Communication Commission on November 10, 2010 and became effective December 29, 2010. The college recognized $145,828 in revenue from this lease during the year ended June 30, 2018, as included in the other non-operating revenues in the Statement of Revenues, Expenses, and Changes in Net Position. The college recognized $145,828 in revenue from this lease during the year ended June 30, 2017, as included in the other non-operating revenues in the Statement of Revenues, Expenses, and Changes in Net Position. The total anticipated revenue to the college is $6,508,673, based on renewal options and escalation clauses over the maximum 30 year term of the lease.
There were no lease payments to other state agencies or blended component units.
Operating Leases with external parties
At June 30, 2018, liabilities for future years are as follows:
Operating Leases with
Year Ended June 30 External Parties
2019 331,185$
2020 331,185
2021 331,185 2022 -
Total 993,556$

GREENVILLE TECHNICAL COLLEGE Notes to Financial Statements
June 30, 2018 and June 30, 2017
72 | Greenville Technical College
NOTE 12 - LEASE OBLIGATIONS, continued
Operating Leases with external parties, continued
At June 30, 2017, liabilities for future years are as follows:
Facilities Leased to Others at June 30, 2018
Facilities Leased to Others at June 30, 2017
Operating Leases with
Year Ended June 30 External Parties
2018 333,876$
2019 325,041
2020 325,041
2021 325,041
Total 1,309,001$
Operating leases with
discretely presented
component units
Operating leases with
external parties
Land and improvements $ 89,740 $ 325,072
Buildings and improvements - 9,493,477
Less: Accumulated Depreciation - (3,286,022)
Total Carrying Value $ 89,740 $ 6,532,527
Operating leases with
discretely presented
component units
Operating leases with
external parties
Land and improvements $ 89,740 $ 325,071
Buildings and improvements - 9,493,477
Less: Accumulated Depreciation - (2,978,603)
Total Carrying Value $ 89,740 $ 6,839,945

GREENVILLE TECHNICAL COLLEGE Notes to Financial Statements
June 30, 2018 and June 30, 2017
2018 Comprehensive Annual Financial Report | 73
NOTE 12 - LEASE OBLIGATIONS, continued
Operating Leases with external parties, continued
Future minimum payments to be received:
Operating Lease Revenue at June 30, 2018
Future minimum payments to be received:
Operating Lease Revenue at June 30, 2017
NOTE 13 - SHORT-TERM DEBT
The college had no short-term debt during the year ended June 30, 2018 or the year ended June 30, 2017.
Year Ended June 30
Operating leases with
discretely presented
component units
Operating leases
with external parties
2019 2 653,837$
2020 2 474,889
2021 2 494,638
2022 2 512,665
2023 2 512,665
2024-2028 10 2,683,506
2029-2033 10 2,913,839
2034-2038 6 3,435,754
2039-2043 - 1,427,072
Total 36 $ 13,108,865
Year Ended June 30
Operating leases with
discretely presented
component units
Operating leases
with external parties
2018 2 646,086$
2019 2 526,213
2020 2 474,888
2021 2 494,637
2022 2 512,664
2023-2027 10 2,637,433
2028-2032 10 2,867,768
2033-2037 7 3,277,913
2038-2042 1 2,189,701
Total 38 $ 13,627,303

GREENVILLE TECHNICAL COLLEGE Notes to Financial Statements
June 30, 2018 and June 30, 2017
74 | Greenville Technical College
NOTE 14 – ACCOUNTS PAYABLE
Accounts payable as of June 30, 2018 and June 30, 2017, are summarized as follows:
NOTE 15 – BONDS AND NOTES PAYABLE
Bonds Payable
Bonds payable consisted of the following at June 30, 2018:
Bonds payable consisted of the following at June 30, 2017:
Payables: 2018 2017
Accounts Payable Trade 1,801,687$ 2,109,861$
Student Refunds 111,407 61,007
Accrued bond interest payable 299,552 334,146
Indirect Costs Payable 5,480 7,083
Total Accounts Payable 2,218,126$ 2,512,097$
State Retirement withholding payable 925,845 6,054
Other withholdings 854,977 2,128,421
Total Payroll Liabilities 1,780,822$ 2,134,475$
Rates Dates Original Debt Balance
General Obligation Bonds
Series 2011A 2.5% to 4.1% 4/1/2032 $ 5,615,000 $ 755,000
Series 2012 2.0% to 3.0% 4/1/2026 7,770,000 5,875,000
Series 2013A 1.0% to 2.8% 4/1/2024 4,558,802 2,275,906
Series 2014 2.8% to 4.0% 4/1/2034 25,000,000 21,245,000
Series 2014A 2.0% to 4.0% 4/1/2028 2,565,000 2,510,000
Series 2016A 2.0% to 4.0% 4/1/2032 3,800,000 3,750,000
Total Bonds Payable $ 49,308,802 36,410,906$
Rates Dates Original Debt Balance
General Obligation Bonds
Series 2007 4.0% to 4.5% 4/1/2028 $ 4,200,000 $ 200,000
Series 2011A 2.5% to 4.1% 4/1/2032 5,615,000 990,000
Series 2012 2.0% to 3.0% 4/1/2026 7,770,000 6,520,000
Series 2013A 1.0% to 2.8% 4/1/2024 4,558,802 2,989,391
Series 2014 2.8% to 4.0% 4/1/2034 25,000,000 22,230,000
Series 2014A 2.0% to 4.0% 4/1/2028 2,565,000 2,525,000
Series 2016A 2.0% to 4.0% 4/1/2032 3,800,000 3,770,000
Total Bonds Payable $ 53,508,802 39,224,391$

GREENVILLE TECHNICAL COLLEGE Notes to Financial Statements
June 30, 2018 and June 30, 2017
2018 Comprehensive Annual Financial Report | 75
NOTE 15 – BONDS AND NOTES PAYABLE, continued
Bonds Payable, continued
On April 15, 2016, Greenville County issued General Obligation Bond Series 2016A in the amount of $3,800,000 to partially refund the Series 2011A Debt Service. The principal amount of the combined debt service post refunding increased by $245,000. The combined principal and interest payments decreased by $110,249.
On December 16, 2014, Greenville County issued General Obligation Bonds Series 2014A in the amount of $2,565,000 to partially refund the Series 2007 Debt Service. The principal amount of the combined debt service post refunding increased by $30,000. The combined principal and interest payments decreased by $133,525. On March 11, 2014, Greenville County issued General Obligation Bonds Series 2014 in the amount of $25,000,000 to provide funding for the costs of acquisition, construction, renovation, installation and equipping of the Center for Manufacturing Innovation (CMI). On April 3, 2013 Greenville County refinance a portion of the Series 2005A General Obligation Bonds with General Obligation Bonds Series 2013A in the amount of $4,558,802. The par value of the refunded bonds was $4,255,000. The refunding of the bonds resulted in present value savings of $243,993 or 5.734%.
On March 20, 2012 Greenville County refinanced a portion of the Series 2005 General Obligation Bonds with General Obligation Refunding Bonds Series 2012 in the amount of $7,770,000. The par value of the refunded bonds was $7,320,000. The refunding of the bonds resulted in present value savings of $328,384 or 4.486%.
As part of the refinancing of the Series 2005 General Obligation Bonds $919,804, representing interest which the college was scheduled to pay on the original debt, was placed in an escrow account to pay the interest on the remaining debt from October 2012 through April 2015. Interest in the amount of $95,441 will be earned on the escrowed securities resulting in a net effect of $824,362 which the college recognized and will record as interest expense on the payment due dates between October 2012 and April 2015.
On July 26, 2011 Greenville County issued General Obligation Bonds Series 2011A in the amount of $5,615,000 to provide funding for the costs of the acquisition, construction, renovation, installation, furnishing and equipping of a building to house Information Technology and Logistics Operations (IT/Logistics building) on the Barton Campus. The IT/Logistics building was completed in the fall of 2011 and capitalized in the same fiscal year.
The Series 2005 bonds were used for the construction of a building on its Northwest Campus that was partially funded by a $2,000,000 grant from the Economic Development Administration (EDA). As a condition of the grant, the college entered into a twenty year mortgage agreement on the property with the EDA. The mortgage creates a contingent liability that would be imposed in the event that Greenville Technical College acted in a manner prohibited by the award. According to the agreement, the college may not transfer or convey, including leasing the property, without the written consent of the EDA. The college must maintain insurance coverage and must keep the property in good condition. The possibility of this mortgage resulting in a liability for the college is remote. Therefore, the contingent liability is not reflected in the college’s financial statements.

GREENVILLE TECHNICAL COLLEGE Notes to Financial Statements
June 30, 2018 and June 30, 2017
76 | Greenville Technical College
NOTE 15 – BONDS AND NOTES PAYABLE, continued
Bonds Payable, continued
The deferred outflows are amortized over the remaining life of the bonds. The book value of these costs at June 30, 2018 is as follows
The deferred outflows are amortized over the remaining life of the bonds. The book value of these costs at June 30, 2017 is as follows:
The college recognizes a liability for prepaid interest and premiums resulting from bond issues. The revenue is recognized annually over the life of the bond.
A summary of the activity for the fiscal year ended June 30, 2018 is as follows:
Expense
Deferred Outflows June 30, 2017 Additions Amortized 2018 June 30, 2018
Certification of Participation Refinance 96,000$ -$ 48,000$ 48,000$
2015 Certification of Participation Refinance 69,950 - 34,975 34,975
Partial Refunding of 2007 General
Obligation Bonds - Series 2014A 33,982 - 3,089 30,892
Partial Refunding of 2011A General
Obligation Bonds - Series 2016A 431,738 - 28,783 402,955
Total Bond Issue and Refinance Costs 631,670$ -$ 114,847$ 516,822$
Expense
Deferred Outflows June 30, 2016 Additions Amortized 2017 June 30, 2017
Certification of Participation Refinance 144,000$ -$ 48,000$ 96,000$
2015 Certification of Participation Refinance 104,925 - 34,975 69,950
Partial Refunding of 2007 General
Obligation Bonds - Series 2014A 37,071 - 3,089 33,982
Partial Refunding of 2011A General
Obligation Bonds - Series 2016A 460,520 - 28,782 431,738
Total Bond Issue and Refinance Costs 746,516$ -$ 114,846$ 631,670$
Interest
Revenue from Bond Issuance June 30, 2017 Additions Amortized 2018 June 30, 2018
Unearned Revenue Northwest 748$ -$ 748$ 0$
2011A General Obligation Bond Premium 100,981 - 25,245 75,736
2012 General Obligation Bond Premium 348,069 - 38,675 309,394
2013A General Obligation Bond Premium 38,943 - 5,563 33,380
2014 General Obligation Bond Premium 99,512 - 5,854 93,658
2014A General Obligation Bond Premium 226,015 - 20,547 205,468
2016A General Obligation Bond Premium 259,888 - 17,326 242,562
1,074,156$ -$ 113,958$ 960,198$

GREENVILLE TECHNICAL COLLEGE Notes to Financial Statements
June 30, 2018 and June 30, 2017
2018 Comprehensive Annual Financial Report | 77
NOTE 15 – BONDS AND NOTES PAYABLE, continued
Bonds Payable, continued
A summary of the activity for the fiscal year ended June 30, 2017 is as follows:
Greenville County bonds are general obligation bonds of the county and are backed by the full faith, credit and taxing power of the county. The county supports the operations of the college with annual appropriations sufficient to meet the annual debt service requirements of the bonds.
The scheduled maturities of the bonds payable by type at June 30, 2018 are as follows:
The scheduled maturities of the bonds payable by type at June 30, 2017 are as follows:
Notes Payable
The college had no notes payable at the year ended June 30, 2018 or the year ended June 30, 2017.
Interest
Revenue from Bond Issuance June 30, 2016 Additions Amortized 2017 June 30, 2017
Unearned Revenue Northwest 1,496$ -$ 748$ 748$
2011A General Obligation Bond Premium 126,226 - 25,245 100,981
2012 General Obligation Bond Premium 386,744 - 38,675 348,069
2013A General Obligation Bond Premium 44,506 - 5,563 38,943
2014 General Obligation Bond Premium 105,366 - 5,854 99,512
2014A General Obligation Bond Premium 246,562 - 20,547 226,015
2016A General Obligation Bond Premium 277,214 - 17,326 259,888
1,188,114$ -$ 113,958$ 1,074,156$
Greenville County Bonds Interest Payments
2019 2,535,965$ 1,150,757$ 3,686,722$
2020 2,610,000 1,063,188 3,673,188
2021 2,700,000 972,938 3,672,938
2022 2,761,242 884,287 3,645,529
2023 2,851,246 787,699 3,638,945
2024 - 2028 12,232,453 2,575,891 14,808,345
2029 - 2033 9,030,000 982,325 10,012,325
2034 1,690,000 46,475 1,736,475
Total 36,410,906$ 8,463,560$ 44,874,467$
Greenville County Bonds Interest Payments
2018 2,813,484$ 1,242,645$ 4,056,129$
2019 2,535,965 1,150,757 3,686,722
2020 2,610,000 1,063,188 3,673,188
2021 2,700,000 972,938 3,672,938
2022 2,761,242 884,287 3,645,529
2023 - 2027 13,063,699 3,002,703 16,066,402
2028 - 2032 9,420,000 1,251,913 10,671,913
2033 - 2034 3,320,000 137,775 3,457,775
Total 39,224,390$ 9,706,206$ 48,930,596$
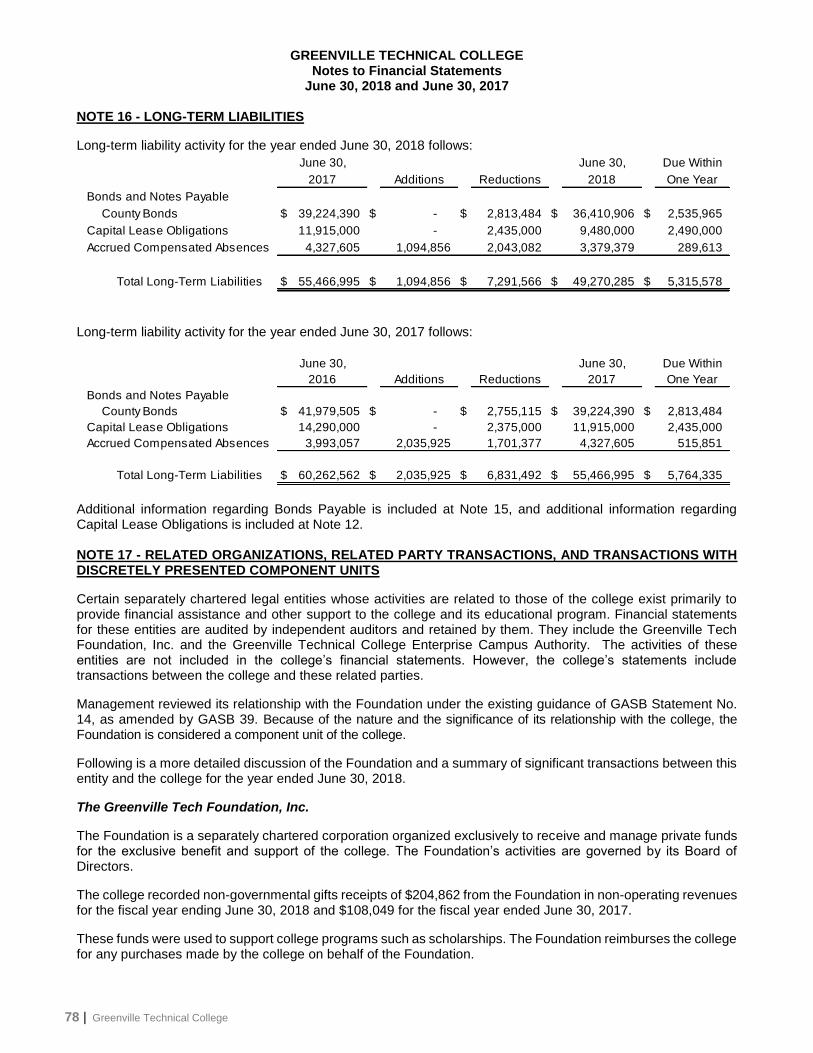
GREENVILLE TECHNICAL COLLEGE Notes to Financial Statements
June 30, 2018 and June 30, 2017
78 | Greenville Technical College
NOTE 16 - LONG-TERM LIABILITIES
Long-term liability activity for the year ended June 30, 2018 follows:
Long-term liability activity for the year ended June 30, 2017 follows:
Additional information regarding Bonds Payable is included at Note 15, and additional information regarding Capital Lease Obligations is included at Note 12. NOTE 17 - RELATED ORGANIZATIONS, RELATED PARTY TRANSACTIONS, AND TRANSACTIONS WITH DISCRETELY PRESENTED COMPONENT UNITS
Certain separately chartered legal entities whose activities are related to those of the college exist primarily to provide financial assistance and other support to the college and its educational program. Financial statements for these entities are audited by independent auditors and retained by them. They include the Greenville Tech Foundation, Inc. and the Greenville Technical College Enterprise Campus Authority. The activities of these entities are not included in the college’s financial statements. However, the college’s statements include transactions between the college and these related parties.
Management reviewed its relationship with the Foundation under the existing guidance of GASB Statement No. 14, as amended by GASB 39. Because of the nature and the significance of its relationship with the college, the Foundation is considered a component unit of the college.
Following is a more detailed discussion of the Foundation and a summary of significant transactions between this entity and the college for the year ended June 30, 2018.
The Greenville Tech Foundation, Inc.
The Foundation is a separately chartered corporation organized exclusively to receive and manage private funds for the exclusive benefit and support of the college. The Foundation’s activities are governed by its Board of Directors.
The college recorded non-governmental gifts receipts of $204,862 from the Foundation in non-operating revenues for the fiscal year ending June 30, 2018 and $108,049 for the fiscal year ended June 30, 2017.
These funds were used to support college programs such as scholarships. The Foundation reimburses the college for any purchases made by the college on behalf of the Foundation.
June 30, Due Within
Additions Reductions 2018 One Year
Bonds and Notes Payable
County Bonds $ 39,224,390 $ - $ 2,813,484 $ 36,410,906 $ 2,535,965
Capital Lease Obligations 11,915,000 - 2,435,000 9,480,000 2,490,000
Accrued Compensated Absences 4,327,605 1,094,856 2,043,082 3,379,379 289,613
Total Long-Term Liabilities $ 55,466,995 $ 1,094,856 $ 7,291,566 $ 49,270,285 $ 5,315,578
2017
June 30,
June 30, Due Within
Additions Reductions 2017 One Year
Bonds and Notes Payable
County Bonds $ 41,979,505 $ - $ 2,755,115 $ 39,224,390 $ 2,813,484
Capital Lease Obligations 14,290,000 - 2,375,000 11,915,000 2,435,000
Accrued Compensated Absences 3,993,057 2,035,925 1,701,377 4,327,605 515,851
Total Long-Term Liabilities $ 60,262,562 $ 2,035,925 $ 6,831,492 $ 55,466,995 $ 5,764,335
June 30,
2016

GREENVILLE TECHNICAL COLLEGE Notes to Financial Statements
June 30, 2018 and June 30, 2017
2018 Comprehensive Annual Financial Report | 79
NOTE 17 - RELATED ORGANIZATIONS, RELATED PARTY TRANSACTIONS, AND TRANSACTIONS WITH DISCRETELY PRESENTED COMPONENT UNITS, continued
The Foundation’s net assets as of December 31, 2017 were $22,782,276. The Foundation’s net assets as of December 31, 2016 were $20,574,950.
Related party receivables and payables as of June 30, 2018 and June 30, 2017 are as follows
The Greenville Technical College Enterprise Campus Authority
The Greenville Technical College Enterprise Campus Authority (Authority), as described in Note 1, is a blended component unit and balances for the Authority are incorporated into these financial statements.
Highlights of the Enterprise Campus Authority:
NOTE 18 - RISK MANAGEMENT
The college is exposed to various risks of loss and maintains state or commercial insurance coverage for each of those risks. Management believes such coverage is sufficient to preclude any significant uninsured losses for the covered risks. Settlement claims have not exceeded this coverage in any of the past three years.
The State of South Carolina believes it is more economical to manage certain risks internally and set aside assets for claim settlement. Several state funds accumulate assets and the state itself assumes substantially all the risk for the following claims of covered employees:
Unemployment compensation benefits Worker’s compensation benefits for job-related illnesses or injuries Health and dental insurance benefits Long-term disability and group-life insurance benefits
June 30, 2018 June 30, 2017
Due from the Foundation $ 236,451 $ 1,096,555
Due to the Foundation $ 54,638 $ 4,170
REVENUES 2018 2017
OPERATING REVENUES
Other Operating Revenues $ 61,208 $ 41,150
Total Operating Revenues 61,208 41,150
EXPENSES
OPERATING EXPENSES
Salaries 21,295 14,994
Benefits 7,177 4,874
Supplies and Other Services 18,871 5,893
Total Operating Expenses 47,343 25,761
Operating Income (Loss) $ 13,865 $ 15,389

GREENVILLE TECHNICAL COLLEGE Notes to Financial Statements
June 30, 2018 and June 30, 2017
80 | Greenville Technical College
NOTE 18 - RISK MANAGEMENT, continued
Employees elect health insurance coverage through either a health maintenance organization or through the state’s self-insured plan.
The college and other entities pay premiums to the state’s Insurance Reserve Fund (IRF), which issues policies, accumulates assets to cover the risk of loss, and pays claims incurred for covered losses relating to the following activities:
Theft, damage to, or destruction of assets Real property, its contents, and other equipment Motor vehicles and watercraft Torts Natural disasters Medical malpractice claims against the Infirmary
The IRF is a self-insurer and purchases reinsurance to obtain certain services and to limit losses in certain areas. The IRF’s rates are determined actuarially.
The college obtains coverage through a commercial insurer for employee fidelity bond insurance for all employees for losses arising from theft or misappropriation.
NOTE 19 – REVENUES
Revenues for tuition and fees and auxiliary enterprise services are shown in the statement of Revenues, Expenses and Changes in Net Position, net of scholarship allowances and bad debt expense. The detail is as follows:
2018 2017
Total Student Tuition and Fees 51,431,256$ 51,405,561$
Less: Scholarship Allowance (27,516,570) (24,729,297)
Less: Bad Debt Expense 631,561 129,127
Student Tuition and Fees, net 24,546,247$ 26,805,391$
Auxiliary Enterprises Revenue 5,813,446$ 6,207,149$
Less: Scholarship Allowance (1,730,781) (1,711,544)
Less: Bad Debt Expense 70,512 15,399
Auxiliary Enterprises, net 4,153,177$ 4,511,004$

GREENVILLE TECHNICAL COLLEGE Notes to Financial Statements
June 30, 2018 and June 30, 2017
2018 Comprehensive Annual Financial Report | 81
NOTE 20 - OPERATING EXPENSES BY FUNCTION
Operating expenses by functional classification for the year ended June 30, 2018 are summarized as follows:
Operating expenses by functional classification for the year ended June 30, 2017 are summarized as follows:
NOTE 21 – STATEMENT OF ACTIVITIES
Supplies
and Other
Benefits Scholarships Utilities Services Depreciation Total
Instruction $ 29,306,829 $ 13,168,555 $ - $ - $ 4,261,712 $ - $ 46,737,096
Academic Support 4,753,774 1,952,957 - - 1,207,790 - 7,914,521
Student Services 4,272,781 1,771,752 - - 1,285,867 - 7,330,400
Operation and
Maintenance of Plant 3,326,998 1,587,127 - 2,946,018 2,437,610 - 10,297,753
Institutional Support 4,584,476 2,235,325 - - 2,591,015 - 9,410,816
Scholarships & Fellowships - - 10,962,370 - - - 10,962,370
Auxiliary Enterprises 291,851 124,310 - - 5,160,643 - 5,576,804
Depreciation - - - - - 5,479,476 5,479,476
Total Operating Expenses$ 46,536,709 $ 20,840,026 $ 10,962,370 $ 2,946,018 $ 16,944,637 $ 5,479,476 $ 103,709,236
Salaries
Supplies
and Other
Benefits Scholarships Utilities Services Depreciation Total
Instruction $ 29,647,769 $ 11,506,827 $ - $ - $ 5,162,247 $ - $ 46,316,843
Academic Support 5,143,241 1,961,248 - - 1,452,865 - 8,557,354
Student Services 4,312,250 1,769,827 - - 1,386,209 - 7,468,286
Operation and
Maintenance of Plant 3,384,878 1,388,603 - 2,963,151 5,020,147 - 12,756,779
Institutional Support 4,101,683 1,668,892 - - 3,419,723 - 9,190,298
Scholarships & Fellowships - - 12,014,463 - - - 12,014,463
Auxiliary Enterprises 290,558 107,213 - - 5,493,349 - 5,891,120
Depreciation - - - - - 5,254,629 5,254,629
Total Operating Expenses$ 46,880,379 $ 18,402,610 $ 12,014,463 $ 2,963,151 $ 21,934,540 $ 5,254,629 $ 107,449,772
Salaries
Increase/
2018 2017 (Decrease)
Charges for services 48,998,139$ 51,431,185$ (2,433,046)$
Operating grants and contributions 34,970,592 33,374,571 1,596,021
Other Operation Revenue 2,485,369 1,823,198 662,171
Capital grants and contributions - 1,101,000 (1,101,000)
Less: expenses (104,720,030) (108,606,917) 3,886,887
Net program revenue (expense) (18,265,930) (20,876,963) 2,611,033
Transfers:
State appropriations 18,581,382 19,599,193 (1,017,811)
State capital appropriations 1,247,350 6,369,531 (5,122,181)
Other transfers in from state agencies/ funds - (1,205,506) 1,205,506
Total general revenue and transfers 19,828,732 24,763,218 (4,934,486)
Change in net position 1,562,802 3,886,255 (2,323,453)
Net position beginning of year (41,870,123) 28,628,627 (70,498,750)
Effect of GASB 75 - (74,385,005) 74,385,005
Net position beginning of year (Restated) (41,870,123) (45,756,378) 3,886,255
Net position-ending (40,307,321)$ (41,870,123)$ 1,562,802$
REQUIRED INFORMATION ON BUSINESS - TYPE ACTIVITIES
FOR INCLUSION IN STATE GOVERNMENT-WIDE STATEMENT OF ACTIVITIES
FISCAL YEAR ENDING JUNE 30, 2018

GREENVILLE TECHNICAL COLLEGE Notes to Financial Statements
June 30, 2018 and June 30, 2017
82 | Greenville Technical College
NOTE 22 – TRANSACTIONS WITH OTHER AGENCIES
The college had significant transactions with the State of South Carolina and various agencies.
Services received at no cost from state agencies include maintenance of certain accounting records by the Comptroller General; check preparation, banking, bond trustee, and investment services from the State Treasurer; and legal services from the Attorney General.
Other services received at no cost from the various offices of the State Budget and Control Board include pension plan administration, insurance plans administration, grant services, personnel management, assistance in the preparation of the State Budget, review and approval of certain budget amendments, procurement services, and other centralized functions.
NOTE 23 – TAX ABATEMENT DISCLOSURES
GASB Statement No. 77, Tax Abatement Disclosures (GASB 77) requires governments that enter into tax abatement agreements to disclose information including brief descriptive information, such as the tax being abated, the authority under which tax abatements are provided, eligibility criteria, the mechanism by which taxes are abated, provisions for recapturing abated taxes, and the types of commitments made by abatement recipients, the gross dollar amount of taxes abated during the period, and commitments made by a government, other than to abate taxes, as part of a tax abatement agreement.
For the fiscal year ended June 30, 2018, the county had 234 FILOT agreements with 95 separate companies providing abated property taxes totaling $431,859 under this program.
For the fiscal year ended June 30, 2017, the county had 221 FILOT agreements with 92 separate companies providing abated property taxes totaling $391,952 under this program.
Note 24 – PRIOR PERIOD ADJUSTMENT
In fiscal year 2018 GASB Statement No. 75, Accounting and Financial Reporting for Postemployment Benefits Other Than Pensions was implemented. Greenville Technical College recognized the cumulative effect of negative $74,385,005 on the Statement of Revenues, Expenses and Changes in Net Position for fiscal year 2017 resulting in a restatement of the Net Position – End of Year from $32,514,882 to $ negative $41,870,123. This implementation also resulted in a restatement of the Statement of Net Position for fiscal year 2017 as detailed below. There was no impact to the Statement of Cash Flows for the fiscal year ended 2017.
The restatement of the Statement of Net Position for fiscal year 2017 resulted in an increase of $2,703,942 in Deferred Outflows of Resources from $13,878,579 to $16,082,521. The Net Other Post Employment Benefits liability of $76,588,947 was recognized increasing the Total Noncurrent liabilities from $138,111,858 to 214,700,805 and the Total Liabilities from $157,497,871 to $234,086,818. The Unrestricted Net Position decreased $74,385,005 from negative $39,730,000 to negative $114,115,005. The Total Net Position decreased by $74,385,005 from $32,514,882 to negative $41,870,123.
Greenville County partially refinanced general obligation bond series 2011A during fiscal year 2016 with general obligation bond series 2016A. Greenville Technical College recognized this refinance by restating fiscal year 2016 Statement of Net Position, the Statement of Revenues, Expenses, and Changes in Net Position and the Statement of Cash Flows as outlined below.
The previously stated Statement of Net Position for fiscal year 2016 was restated resulting in an increase in Total Current Assets of $460,520. This was a result of an increase in Other Assets from $1,858,588 to $2,319,108.This was due to bond interest costs which will be amortized over the life of the bond. Total Current Liabilities increased by $274,274. This was a result of a decrease in accounts payable of $32,940 from $3,762,006 to $3,729,066. The Current Portion of Long Term Liabilities increased by $30,000 from $5,512,997 to $5,542,997. Unearned Revenue increased by $277,214 from $7,698,398 to $7,975.612.Total Noncurrent Liabilities increased by $214,999. This was a result of an increase in Bonds Payable of $214,999 from $39,009,391 to $39,224,390. The increase in Net Position reduced correspondingly from $28,657,381 to $28,628,627.

GREENVILLE TECHNICAL COLLEGE Notes to Financial Statements
June 30, 2018 and June 30, 2017
2018 Comprehensive Annual Financial Report | 83
Note 24 – PRIOR PERIOD ADJUSTMENT, continued
The fiscal year 2016 Statement of Revenue, Expenses, and Changes in Net Position was restated also. This resulted in an increase in Total Operating Expenses of $61,694 from $104,611,961 to $104,673,655, increasing the Operating Loss from $50,962,879 to $51,024,573. Net Non-operating Revenues increased by $32,940 from $51,922,064 to $51,955,004. The above resulted in a reduction of our increase in Net Position by $28,754 from $2,071,735 to $2,042,981.
The restated Statement of Cash Flows for fiscal year 2016 resulted in an increase of $61,694 in Net Cash Provided (Used) by Operating Activities from $42,496,145 to $42,557,839. This resulted in a corresponding decrease in Net Cash Provided by Capital and Related Financing Activities from $8,453,531 to $8,391,837.
NOTE 25 – COMPONENT UNIT INFORMATION – GREENVILLE TECH FOUNDATION
The college’s component unit, Greenville Tech Foundation, Inc. is a separate legal entity. The foundation issues its own audited financial statements. The consolidated statements of financial position and the consolidated statement of activities are shown on pages 40 and 41-42, respectively. Following are the footnotes associated with those statements.
A. SUMMARY OF SIGNIFICANT ACCOUNTING POLICIES
Nature of organization
Greenville Tech Foundation, Inc. (the “Foundation”) was founded in 1973 in Greenville, South Carolina as an
eleemosynary organization. The primary objective of the Foundation is to support education at Greenville
Technical College (the “college”) through financial assistance to the college and its students. During December
2002, the Foundation formed a wholly owned subsidiary, GTF McAlister, LLC, to manage the daily operations of
the McAlister Square facility. In 2004, the Foundation formed a wholly owned subsidiary, GTF Student Housing,
LLC. This subsidiary is responsible for the building and maintenance of student housing on the Greenville
Technical College campus. Student housing opened during the fall semester of 2006. During 2008, the
Foundation formed a wholly owned subsidiary, Brashier Charter, LLC. This subsidiary is responsible for the
construction of a classroom building and gymnasium on the Brashier Campus of Greenville Technical College.
Construction began on this project in the fall of 2008, and the building opened in August 2009. During 2012, the
Foundation formed a wholly owned subsidiary, GTF Pleasantburg, LLC. This subsidiary was created to purchase
land and manage the property thereafter.
Basis of accounting and presentation
The financial statements of the Foundation have been prepared on the accrual basis of accounting and
accordingly reflect all significant receivables, payables, and other liabilities. Revenues are recognized when
earned and expenditures are recognized when incurred.
Income taxes The Foundation is exempt from federal income taxes under Section 501(c)(3) of the Internal Revenue Code (“IRC”). However, any income from activities not directly related to the Foundation’s tax-exempt purpose would be subject to taxation as unrelated business income. In addition, the Foundation qualifies for the charitable contribution deduction under Section 170(b)(1)(A). In February 2014, the IRS determined the Foundation meets the requirements for classification as a public charity as described in Sections 509(a)(1) and 170(b)(1)(A)(vi) and updated the Foundation to public charity status to reflect that the Foundation is not a supporting organization. The Foundation meets the public support test under this new classification. Prior to February 2014, the Foundation was classified by the Internal Revenue Service as a Section 509(a)(3) functionally integrated Type III supporting organization due to the fact that the Foundation’s sole reason for existence was as a support organization for Greenville Technical College.
Management has evaluated the tax positions of the Foundation and does not believe that any uncertain tax positions or unrecognized tax benefits exist for the years ended December 31, 2017 and 2016, respectively. The Foundation’s policy is to report accrued interest related to unrecognized tax benefits, when applicable, as interest expense and to report penalties as other expense.

GREENVILLE TECHNICAL COLLEGE Notes to Financial Statements
June 30, 2018 and June 30, 2017
84 | Greenville Technical College
NOTE 25 – COMPONENT UNIT INFORMATION – GREENVILLE TECH FOUNDATION, continued
A. SUMMARY OF SIGNIFICANT ACCOUNTING POLICIES, continued
Principles of consolidation
The consolidated financial statements include the accounts of the Foundation and its wholly owned subsidiaries,
GTF McAlister, LLC; GTF Student Housing, LLC; Brashier Charter, LLC; and GTF Pleasantburg, LLC. All material
intra-entity accounts and transactions have been eliminated.
Financial Statement Presentation
Financial statement presentation follows the requirements of FASB ASC 958-205, Not-for-Profit Presentation of
Financial Statements and FASB ASC 958-605, Accounting for Contributions Received and Contributions Made.
Under FASB ASC 958-205, net assets and revenues, expenses, gains, and losses are classified based on the
existence or absence of donor-imposed restrictions. Accordingly, net assets of the Foundation and changes
therein are classified and reported as follows:
Unrestricted net assets – Net assets that are not subject to donor-imposed stipulations. In addition, the Foundation board has designated certain funds to provide additional security for
their endowments and other purposes.
Temporarily restricted net assets – Net assets subject to donor-imposed stipulations that will
be met either by action of the Foundation and/or passage of time.
Permanently restricted net assets – Net assets required by the donor to be held in perpetuity.
Revenues are reported as increases in unrestricted net assets unless use of the related assets is limited by donor-
imposed restrictions. Expenses are reported as decreases in unrestricted net assets. Gains and losses on
investments and other assets or liabilities are reported as increases or decreases in unrestricted net assets unless
their use is restricted by explicit donor stipulation or by law.
Support that is restricted by the donor is reported as an increase in unrestricted net assets if the restriction expires
in the reporting period in which the support is recognized. All other donor restricted support is reported as an
increase in temporarily or permanently restricted net assets, depending on the nature of the restriction. When a
restriction expires (when the stipulated time restriction ends or the purpose of the restriction is accomplished),
temporarily restricted net assets are reclassified to unrestricted net assets and reported in the consolidated
statements of activities as net assets released from restrictions. The Foundation considers temporarily restricted
amounts spent first when both temporarily restricted and unrestricted funds are available, unless legally or
contractually prohibited. Contributions, including unconditional promises to give, are recognized as revenues in
the period received. Conditional promises to give are not recognized until they become unconditional, that is,
when the conditions on which they depend are substantially met.
Contributions of assets and equipment other than cash are recorded at their estimated fair value.
The Foundation received noncash equipment and supplies donations of $518,231 and $701,334 during the years
ended December 31, 2017 and 2016, respectively. During the years ended December 31, 2017 and 2016, the
Foundation did not capitalize any donations of equipment received. The noncash equipment contributions were
in turn used by Greenville Technical College and are reported as equipment purchases/gifts-in-kind in the
accompanying consolidated statements of activities. No noncash donation of real property was received during
the years ended December 31, 2017 or 2016.
Cash and cash equivalents
For purposes of the statements of cash flows, the Foundation considers cash accounts which are not subject to
withdrawal restrictions or penalties, money market accounts and certificates of deposit with original maturities of
90 days or less to be cash and cash equivalents.

GREENVILLE TECHNICAL COLLEGE Notes to Financial Statements
June 30, 2018 and June 30, 2017
2018 Comprehensive Annual Financial Report | 85
NOTE 25 – COMPONENT UNIT INFORMATION – GREENVILLE TECH FOUNDATION, continued
A. SUMMARY OF SIGNIFICANT ACCOUNTING POLICIES, continued
Investments The Foundation records investments at fair value. Realized and unrealized gains and losses are reported on the consolidated statements of activities. See Note U for discussion of fair value measurements. Accounts receivable Management considers GTF McAlister, LLC’s accounts receivable to be fully collectible; accordingly, no allowance for doubtful accounts has been established. If accounts become uncollectible, they will be charged to operations when that determination is made. GTF Student Housing, LLC leases housing units to students of Greenville Technical College. The subsidiary’s accounts receivable are due from the students and are uncollateralized. Management closely monitors outstanding accounts receivable and establishes an allowance for doubtful accounts for any balances that are determined to be uncollectible. As of December 31, 2017 and 2016, the subsidiary established an allowance for doubtful accounts in the amount of approximately $39,600 and $33,000, respectively.
Pledges receivable Pledges receivable are recorded when the donor makes a promise to give. In management’s opinion, no allowance for uncollectible pledges receivable is necessary. Pledges expected to be collected within one year are recorded as support and a receivable at net realizable value. Pledges expected to be collected in future years are recorded as support and a receivable at the net present value of the expected future cash flows. Amortization of discounts is included in contribution revenue.
Charitable remainder trusts receivable Charitable remainder trusts represent assets that are currently held in trust for the benefit of designated income beneficiaries. Upon the death of the beneficiaries or designation by the agreement, the assets held in trust will be distributed to the Foundation based upon the provisions of the trust, principally for unrestricted use. The value of assets and liabilities of the charitable remainder trusts is estimated using a discount rate for each individual trust. Under these trusts, the Foundation is not the trustee. Therefore, a receivable is recorded based on the current fair value of the assets in the trust in the year in which the Foundation is notified of the gift’s existence. The receivable is adjusted to the net present value based on expected growth, payouts and discount rate over the expected lives of the creators.
Property and equipment The Foundation follows the practice of capitalizing all purchases for land, building and equipment in excess of $1,000. The fair value of any donated land and buildings is similarly capitalized. Donations of equipment used in the maintenance programs at the college are generally not capitalized due to the nature and use of these items. Instead, the parts are recorded as college support expense. The cost of buildings, leasehold improvements and equipment is depreciated over the estimated useful lives of the related assets. Depreciation is computed using the straight-line method as follows: Buildings and leasehold improvements 40 years Furniture, fixtures and equipment 3 – 10 years Donations of property and equipment are recorded as support at their estimated fair values on the date of donation. Such donations are reported as unrestricted support unless the donor has restricted the donated asset to a specific purpose. Assets donated with explicit restrictions regarding their use and contributions of cash that must be used to acquire property and equipment are reported as restricted support. Absent donor stipulations regarding how long those donated assets must be maintained, the Foundation reports expirations of donor restrictions when the donated or acquired assets are placed in service as instructed by the donor. The Foundation reclassifies temporarily restricted net assets to unrestricted net assets at that time. The Foundation reviews long-lived assets for impairment whenever events or changes in circumstances indicate that the carrying amount of an asset may not be recoverable. Recoverability of assets is measured by a comparison of the carrying amount of the asset to undiscounted future net cash flows expected to be generated by the asset. If such assets are considered to be impaired, the impairment to be recognized is measured by the amount by which the carrying amounts of the assets exceeds the fair value of the assets.

GREENVILLE TECHNICAL COLLEGE Notes to Financial Statements
June 30, 2018 and June 30, 2017
86 | Greenville Technical College
NOTE 25 – COMPONENT UNIT INFORMATION – GREENVILLE TECH FOUNDATION, continued A. SUMMARY OF SIGNIFICANT ACCOUNTING POLICIES, continued
Debt issuance costs Costs associated with obtaining financing have been capitalized and are being amortized using a method that approximates the interest method over the terms of the related debt.
Transfers Transfers primarily consist of changes received from donors as to donor-imposed stipulations and contribution reclassification for establishment of endowments when contributed amounts meet the endowment criteria for required funding levels.
Use of estimates The preparation of the financial statements in conformity with accounting principles generally accepted in the United States of America requires management to make estimates and assumptions that affect the reported amount of assets and liabilities and disclosures of contingent assets and liabilities at the date of the financial statements. Estimates also affect the reported amounts of revenues and expenses during the reporting period. Actual results could differ from those estimates.
New pronouncements In 2017, the Foundation retroactively adopted the requirements in FASB ASC 835-30 to present debt issuance costs as a reduction of the carrying amount of the debt rather than as an asset. Unamortized loan costs associated with the note payable to a bank and unamortized bond issuance costs associated with the Economic Development bonds were previously reported on the consolidated statement of financial position as an asset. Amortization of the debt issuance costs is reported as interest expense in the statement of activities.
B. RESTRICTED CASH
GTF Student Housing, LLC’s restricted cash includes funds received as security deposits paid by tenants totaling $27,645 and $30,101 at December 31, 2017 and 2016, respectively. In relation to the Brashier Charter, LLC Economic Development Revenue Bonds (Note 14), the financial institution required the Foundation to maintain a debt service account to cover the minimum debt service payments on the bonds. At December 31, 2017 and 2016, cash restricted for this purpose totaled $95,803 and $90,788, respectively. The Foundation is holding cash balances restricted by donors in the amount of $3,197,845 and $3,111,400 as of December 31, 2017 and 2016, respectively.
C. CONCENTRATION OF CREDIT RISK
The Foundation maintains cash balances at several financial institutions. Interest bearing accounts are insured by the Federal Deposit Insurance Corporation (FDIC) up to $250,000, plus an unlimited amount on non-interest bearing accounts. The cash balances held in broker accounts are insured by the Securities Investor Protection Corporation to a maximum of $100,000. At times the Foundation’s cash balances on deposit at these financial institutions are in excess of the federally insured limits.
D. PLEDGES RECEIVABLE
The pledges receivable are unconditional and due over five years. Uncollectible promises are expected to be insignificant. Pledges are discounted using a net present value calculation and an effective rate of 3.25 percent.

GREENVILLE TECHNICAL COLLEGE Notes to Financial Statements
June 30, 2018 and June 30, 2017
2018 Comprehensive Annual Financial Report | 87
NOTE 25 – COMPONENT UNIT INFORMATION – GREENVILLE TECH FOUNDATION, continued D. PLEDGES RECEIVABLE, continued
Unconditional promises to give as of December 31, 2017 and 2016 are:
E. ACCOUNTS RECEIVABLE
Accounts receivable consisted of the following as of December 31, 2017 and 2016:
F. CASH SURRENDER VALUE OF LIFE INSURANCE
The Foundation is the owner and beneficiary of several life insurance policies with aggregate cash surrender values
of approximately $50,000 and $47,000 at December 31, 2017 and 2016, respectively.
G. CHARITABLE REMAINDER TRUSTS RECEIVABLE
The Foundation is the beneficiary of a charitable remainder trust valued at approximately $124,600 and $102,700 at
December 31, 2017 and 2016, respectively.
H. INVESTMENTS
Investments of the Foundation are recorded at fair value as determined by quoted market prices. The fair values and
respective cost basis of investments at December 31, 2017 and 2016 are as follows:
Receivable due in the less than one year $ 710,595 $ 1,723,373
Receivable due in one to five years 516,917 1,149,523
1,227,512 2,872,896
Less: discount to net present value (64,454) (146,431)
Pledges receivable, net $ 1,163,058 $ 2,726,465
2017 2016
Accounts receivable, trade $ 32,520 $ 46,791
Related party receivable 4,450 6,378
Student housing leases receivable 116,125 78,499
Other receivable 6,839 14,868
159,934 146,536
Less: allowance for doubtful accounts (39,600) (33,111)
Accounts receivable, net $ 120,334 $ 113,425
2017 2016
US Government securities $ 1,191,675 $ 1,202,913 $ (11,238) $ 1,287,500 $ 1,289,129 $ (1,629)
Mutual funds 2,094,790 2,056,166 38,624 1,546,658 1,727,049 (180,391)
Corporate bonds 1,538,891 1,544,935 (6,044) 1,362,431 1,377,212 (14,781)
Common stocks 7,112,534 5,885,568 1,226,966 5,073,746 4,663,530 410,216
$ 11,937,890 $ 10,689,582 $ 1,248,308 $ 9,270,335 $ 9,056,920 $ 213,415
2017 2016
Fair Value Fair ValueCost (Depreciation)
Appreciation
Unrealized
Cost (Depreciation)
Appreciation
Unrealized

GREENVILLE TECHNICAL COLLEGE Notes to Financial Statements
June 30, 2018 and June 30, 2017
88 | Greenville Technical College
NOTE 25 – COMPONENT UNIT INFORMATION – GREENVILLE TECH FOUNDATION, continued H. INVESTMENTS, continued
The composition of the investment return for the years ended December 31, 2017 and 2016:
I. ENDOWMENT
The Foundation’s endowment funds consist of approximately 130 individual funds established for a variety of purposes.
The endowment includes both donor-restricted endowment funds and funds designated by the Board of Directors to function as endowments. As required by accounting principles generally accepted in the United States of America, net assets associated with endowment funds, including funds designated by the Board of Directors to function as endowments, are classified and reported based on the existence or absence of donor-imposed restrictions.
Interpretation of relevant law During 2008 the South Carolina Legislature enacted the South Carolina Uniform Prudent Management of Institutional Funds Act. The Board of Directors has interpreted this act as requiring the preservation of the fair value of the original gift as of the gift date of donor-restricted endowment funds absent explicit donor stipulations to the contrary. As a result of this interpretation, Greenville Tech Foundation, Inc. classifies as permanently restricted net assets (a) the original value of gifts donated to the permanent endowment, (b) the original value of subsequent gifts to the permanent endowment, and (c) accumulations to the permanent endowment made in accordance with the direction of the applicable donor gift instrument at the time the accumulation is added to the fund.
The remaining portion of the donor-restricted endowment fund that is not classified in permanently restricted net assets is classified as temporarily restricted net assets until those amounts are appropriated for expenditure by the organization in a manner consistent with the standard of prudence prescribed by the South Carolina Uniform Prudent Management of Institutional Funds Act. In accordance with this act, the organization considers the following facts in making a determination to appropriate or accumulate donor-restricted endowment funds:
1) The duration and preservation of the fund 2) The purposes of Greenville Tech Foundation, Inc. and the donor-restricted endowment fund 3) General economic conditions 4) The possible effect of inflation and deflation 5) The expected total return from income and the appreciation of investments 6) Other resources of the organization 7) The investment policies of the organization
Return objectives and risk parameters The Foundation has adopted investment and spending policies for endowment assets that attempt to provide a predictable stream of funding to programs supported by its endowment while seeking to maintain the purchasing power of the endowment assets. Endowment assets include those assets of donor-restricted funds that the Foundation must hold in perpetuity or for a donor-specified period as well as board designated funds. Under this policy, as approved by the Board of Directors, the endowment assets are invested in a manner that is intended to produce results that achieve a target rate of return of 5 percent net of fees.
Strategies employed for achieving objectives To satisfy its long-term rate-of-return objectives, the Foundation relies on a total return strategy in which investment returns are achieved through both capital appreciation (realized and unrealized) and current yield
Interest and dividends $ 383,380 $ 201,598
Fees (93,292) (85,279)
Unrealized/realized gains (losses) 1,370,021 110,864
$ 1,660,109 $ 227,183
2017 2016

GREENVILLE TECHNICAL COLLEGE Notes to Financial Statements
June 30, 2018 and June 30, 2017
2018 Comprehensive Annual Financial Report | 89
NOTE 25 – COMPONENT UNIT INFORMATION – GREENVILLE TECH FOUNDATION, continued I. ENDOWMENT, continued
(interest and dividends). The Foundation targets a diversified asset allocation that seeks to achieve its long-term return objectives within prudent risk constraints.
Spending policy and how the investment objectives relate to spending policy The objective of the Foundation’s spending policy is to maintain the purchasing power of the endowment assets held in perpetuity for a specified term as well as provide additional real growth principally through new gifts. The policy, as amended on August 8, 2016, allows for withdrawals determined as follows: (a) use of a 10-year average of quarter-end balances of endowed funds or an average of quarter-end balances for the life of the fund if the fund has not been in existence for 10 years; (b) a 4 % withdrawal rate; and (c) a 90% floor for withdrawal of endowed funds. The administrative fee paid to the Foundation from the endowment was changed from 1% to .5%.
Endowment net asset composition by type of fund as of December 31, 2017:
Endowment net asset composition by type of fund as of December 31, 2016:
Endowment funds $ - $ 2,261,426 $ 624,022 $ 9,718,411
Permanently
Designated
Board
Restricted
Temporarily
Corpus
Restricted -
Unrestricted
Unrestricted
Endowment funds $ - $ 1,942,616 $ 30,158 $ 8,923,589
Unrestricted
Permanently
Designated
Board
Restricted
Temporarily
Corpus
Restricted -
Unrestricted

GREENVILLE TECHNICAL COLLEGE Notes to Financial Statements
June 30, 2018 and June 30, 2017
90 | Greenville Technical College
NOTE 25 – COMPONENT UNIT INFORMATION – GREENVILLE TECH FOUNDATION, continued I. ENDOWMENT, continued
Changes in endowment net assets for the years ended December 31, 2017 and 2016, respectively:
J. PROPERTY AND EQUIPMENT
The following is a summary of property and equipment at December 31, 2017:
Board
Endowment net assets, January 1, 2016 $ - $ 2,163,367 $ 48,281 $ 6,499,564 $ 8,711,212
Reclassification of endowment restrictions - (320,000) 493 - (319,507)
Investment return: -
Investment income, net - 11,446 64,360 - 75,806
Change in value of CSV and CRUTs - 38,072 (569) - 37,503
Net appreciation realized and unrealized - 3,846 55,875 - 59,721
Contributions - 54 - 2,333,852 2,333,906
Change in reserve for uncollectible -
contributions - - - (925) (925)
Transfers - 45,831 - 91,098 136,929
Appropriations of endowment assets for -
expenditure (138,282) - - - (138,282)
Net assets released from restrictions 138,282 - (138,282) - -
Endowment net assets, December 31, 2016 - 1,942,616 30,158 8,923,589 10,896,363
Reclassification of endowment restrictions - - - - -
Investment return: -
Investment income, net - 25,436 106,787 - 132,223
Change in value of CSV and CRUTs - 21,822 (229) - 21,593
Net appreciation realized and unrealized - 163,443 672,359 - 835,802
Contributions - 3,109 - 319,504 322,613
Change in reserve for uncollectible -
contributions - - - (19,221) (19,221)
Transfers - 105,000 - 494,539 599,539
Appropriations of endowment assets for -
expenditure (185,053) - - - (185,053)
Net assets released from restrictions 185,053 - (185,053) - -
Endowment net assets, December 31, 2017 $ - $ 2,261,426 $ 624,022 $ 9,718,411 $ 12,603,859
Unrestricted Corpus Total
Unrestricted -
Designated
Temporarily
Restricted
Permanently
Restricted -
Furniture and fixtures $ - $ - $ 1,247,084 $ - $ - $ 1,247,084
Equipment - 153,207 - - - 153,207
Buildings - 2,198,633 15,381,007 8,280,396 - 25,860,036
Leasehold improvements - 7,337,055 - - - 7,337,055
Land 1,328,535 - - - 246,154 1,574,689
1,328,535 9,688,895 16,628,091 8,280,396 246,154 36,172,071
Less: accumulated
depreciation - 4,802,968 5,251,677 1,723,909 - 11,778,554
$ 1,328,535 $ 4,885,927 $ 11,376,414 $ 6,556,487 $ 246,154 $ 24,393,517
Inc.
Housing,
LLC LLC
GTF
Pleasantburg,
Greenville GTF
Student
Consolidated
Tech
Foundation,
GTF
LLC
McAlister,
Brashier
Charter,
LLC

GREENVILLE TECHNICAL COLLEGE Notes to Financial Statements
June 30, 2018 and June 30, 2017
2018 Comprehensive Annual Financial Report | 91
NOTE 25 – COMPONENT UNIT INFORMATION – GREENVILLE TECH FOUNDATION, continued J. PROPERTY AND EQUIPMENT, continued
The following is a summary of property and equipment at December 31, 2016:
Depreciation expense for the years ending December 31, 2017 and 2016 was $1,033,807 and $999,559, respectively. K. NOTES RECEIVABLE
In May 2014, the Foundation entered into a loan agreement with a developer for the Richmond Towne Center on Faris Road. The Foundation loaned approximately $810,000 from its endowment to the developer at 6 percent interest (payable monthly) plus additional interest payments based on performance of the shopping center or its sale. The loan matures in ten years and is secured by a second mortgage on the property. The Foundation’s approval is required for various transactions involving the shopping center. The Foundation also executed a commitment to fund advances to the first mortgage lender up to approximately $1,100,000 under certain defined circumstances with those advances also secured by the second mortgage and loan agreement. The principal of the note is payable when a sale of the property or a refinancing occurs. All outstanding principal is due and payable in May 2024. On September 30, 2014, a portion of the shopping center was sold. As a result, the commitment to fund agreement with the first mortgage lender reduced the Foundation’s commitment amount to a maximum of $833,500. A portion of the proceeds from the sale was used to repay a portion of the principal amount to the Foundation. At December 31, 2017 and 2016 the remaining amount due on the note receivable totaled $404,780.
L. LINE OF CREDIT
At December 31, 2016, the Foundation had an unsecured line of credit with a financial institution which provided for maximum borrowings up to $500,000. The Foundation had $0 outstanding on the line of credit at December 31, 2016. The line of credit matured in May 2017 and was not renewed.
M. NOTES PAYABLE
Furniture and fixtures $ - $ - $ 1,142,386 $ - $ - $ 1,142,386
Equipment - 152,212 - - - 152,212
Buildings - 2,198,633 15,377,598 8,280,396 - 25,856,627
Leasehold improvements - 7,007,859 - - - 7,007,859
Land 1,328,535 - - - 246,154 1,574,689
1,328,535 9,358,704 16,519,984 8,280,396 246,154 35,733,773
Less: accumulated
depreciation - 4,448,600 4,779,248 1,516,899 - 10,744,747
$ 1,328,535 $ 4,910,104 $ 11,740,736 $ 6,763,497 $ 246,154 $ 24,989,026
Consolidated
Tech
Foundation,
GTF
LLC
McAlister,
Brashier
Charter,
LLCInc.
Housing,
LLC LLC
GTF
Pleasantburg,
Greenville GTF
Student
Note payable to a bank by GTF Student Housing, LLC; due in monthly
installments of principal plus interest at 75 percent of [1-month
LIBOR plus 1.25 percent] (approximately 1.4 percent at December 31, 2016
and 1.12 percent at December 31, 2015); matures August 2034;
secured by property and substantially all assets of GTF.
Student Housing, LLC and GTF McAlister, LLC $ 10,170,000 $ 10,640,000
2017 2016

GREENVILLE TECHNICAL COLLEGE Notes to Financial Statements
June 30, 2018 and June 30, 2017
92 | Greenville Technical College
NOTE 25 – COMPONENT UNIT INFORMATION – GREENVILLE TECH FOUNDATION, continued M. NOTES PAYABLE, continued
Loan costs related to the note in the amount of $137,157 were capitalized and are being amortized over the life of the
note. The unamortized cost is presented as a reduction in the carrying amount of the debt. Amortization of the debt
issuance cost of $6,612 per year until the note maturity is reported as interest expense in the statement of activities.
Accumulated amortization was $34,162 and $27,550 at December 31, 2017 and 2016, respectively.
Provisions of the above bank debt agreements require the Foundation to maintain certain financial ratios such as debt
service ratios, and certain other covenants which require or restrict other actions.
The future maturities of principal are as follows for years ending December 31:
Interest expense recorded in connection with Note Payable for the years ended December 31, 2017 and 2016 totaled
$430,790 and $457,225, respectively.
N. BONDS PAYABLE
Economic Development Revenue Bonds of $8,410,000 were issued to the Foundation through Brashier Charter, LLC by the South Carolina Jobs – Economic Development Authority (JEDA) to construct a classroom building and gymnasium on one of the Greenville Tech College campuses. The bonds bear interest at a variable weekly rate determined by the issuing bank’s remarketing agent. The interest rate was 0.08 and 0.09 percent at December 31,
2017 and 2016, respectively. The agreement requires annual sinking fund payments of principal ranging from
$130,000 to $530,000 plus interest, which began July 7, 2010, when the amount deposited into the capitalized interest
account was depleted. Payments for the years ended December 31, 2017 and 2016 totaled $400,666 and $432,709,
respectively. Sinking fund payments will continue through maturity on December 1, 2038. As disclosed in Note 16,
the Foundation was required to obtain an irrevocable letter of credit in connection with the issuance of the bonds as
security for payment of principal and interest on the bonds. The balance of these bonds payable totaled $7,180,000
and $7,360,000 as of December 31, 2017 and 2016, respectively.
Bond issue costs in the amount of $189,600 were reimbursed by the bond proceeds and are being amortized over the life of the bonds. The unamortized cost is presented as a reduction in the carrying amount of the debt. Amortization of the issuance cost of $6,320 per year until the bonds mature is reported as interest expense in the statement of
activities. Accumulated amortization was $60,045 and $53,725 at December 31, 2017 and 2016, respectively.
2018 $ 493,000
2019 506,000
2020 530,000
2021 554,000
2022 578,000
Thereafter 7,509,000
$ 10,170,000

GREENVILLE TECHNICAL COLLEGE Notes to Financial Statements
June 30, 2018 and June 30, 2017
2018 Comprehensive Annual Financial Report | 93
NOTE 25 – COMPONENT UNIT INFORMATION – GREENVILLE TECH FOUNDATION, continued N. BONDS PAYABLE, continued
The future maturities of principal are as follows for years ending December 31:
Interest expense recorded in connection with Bonds Payable for the years ended December 31, 2017 and 2016
totaled $349,989 and $363,106, respectively.
O. LETTERS OF CREDIT
The Foundation, through its subsidiary, Brashier Charter, LLC, had available an irrevocable letter of credit from a
financial institution in the amount of $8,000,000. This letter of credit was obtained as part of the issuance of the
Economic Development Revenue Bonds discussed in Note 14. The letter of credit provides security for the payment
of principal and interest on the bonds. The amount supporting principal is $7,695,000 and the amount supporting an
interest component of up to forty days is $72,220. The letter of credit was collateralized by the building constructed by
the bond proceeds. The letter expires on July 10, 2018.
Provisions of the letter of credit agreement require the Foundation to maintain certain financial ratios such as debt
service ratios, and certain other covenants which require or restrict other actions.
P. SWAP AGREEMENTS
The Foundation through GTF Student Housing, LLC and Brashier Charter, LLC subsidiaries used variable-rate debt to finance the 2005 Economic Development Revenue Bonds for the construction of student housing on the Greenville Tech College campus and to finance the 2008 Economic Development Revenue Bonds for the construction of the classroom building and gymnasium on the Greenville Tech College Brashier campus (see Notes 13 and 14). The debt obligations expose the Foundation to variability in interest payments due to changes in interest rates. Management believes it is prudent to limit the variability of its interest payments. To meet this objective, management entered into interest rate swap agreements to manage fluctuations in cash flows resulting from interest rate risk.
These swaps changed the variable-rate cash flows exposure on the debt obligations to fixed-cash flows. Under the terms of the interest rate swaps, the Foundation receives variable interest rate payments and makes fixed interest rate payments, thereby creating the equivalent of fixed-rate debt.
By using a derivative financial instrument to hedge its exposure to changes in interest rates, the Foundation exposes itself to credit risk and market risk. Credit risk is the failure of the counterparty to perform under the terms of the derivative contract. When the fair value of a derivative contract is positive, the counterparty owes the Foundation, which creates credit risk for the Foundation. When the fair value of the derivative contract is negative, the Foundation owes the counterparty and, therefore, it does not possess credit risk. The Foundation minimizes the credit risk in derivative instruments by entering into transactions with high-quality counterparties.
2018 $ 190,000
2019 200,000
2020 210,000
2021 220,000
2022 230,000
Thereafter 6,130,000
$ 7,180,000

GREENVILLE TECHNICAL COLLEGE Notes to Financial Statements
June 30, 2018 and June 30, 2017
94 | Greenville Technical College
NOTE 25 – COMPONENT UNIT INFORMATION – GREENVILLE TECH FOUNDATION, continued P. SWAP AGREEMENTS, continued
Market risk is the adverse effect on the value of a financial instrument that results from a change in interest rates. The market risk associated with interest-rate contracts is managed by establishing the monitoring parameters that limit the types and degree of market risk that may be undertaken.
The Foundation entered into an interest rate swap agreement (“Swap 1”) associated with the GTF Student Housing, LLC loan with a maturity date of November 7, 2022. The Foundation pays TD Bank a fixed rate of 2.95 percent and in return, TD Bank pays the Foundation a variable rate equal to 75 percent of one month USD-LIBOR plus 1.25 percent. The variable rate was 1.02 and 0.46 percent at December 31, 2017 and 2016, respectively. The original notional amount of the contract was $13,248,000. The notional amounts at December 31, 2017 and 2016 were $11,035,000 and $11,505,000, respectively. The difference between interest earned and the interest obligation accrued is received or paid the first day of each month and is recorded as interest expense.
On July 10, 2008, the Foundation entered into an $8,410,000 U. S. Dollar Swap Transaction (“Swap 2”) with an effective date of July 10, 2008, and a termination date of December 1, 2038. The swap was executed with the purpose of fixing the rate on the bonds issued by the South Carolina Jobs – Economic Development Authority (JEDA). Under the terms of the agreement, the Foundation pays a fixed rate of 3.89 percent per annum to SunTrust Bank on a monthly basis and in return, SunTrust Bank pays the Foundation a variable rate equal to the USD-SIFMA Municipal Swap Index (Formerly USD-BMA Municipal Swap Index) plus 0.06 percent per annum. The variable rate was 1.37 and 0.73 percent at December 31, 2017 and 2016, respectively. At December 31, 2017 and 2016, the swap contract had an original notional amount of $8,410,000 and current notional amounts of $7,180,000 and $7,360,000, respectively. The difference between interest earned and the interest obligation accrued is received or paid the first day of each month and is recorded as interest expense.
The Foundation has recorded the following activity related to interest rate swap activity in the accompanying consolidated financial statements as of and for the year ending December 31:
See Note U for the fair value information regarding the interest rate swaps.
Q. MCALISTER SQUARE OPERATIONS
On August 3, 1999, the Foundation purchased the common area, inner stores and main vehicle entrance of McAlister Square Mall in Greenville, South Carolina and Greenville Technical College purchased the three large department store areas and the parking lot. The Foundation and the college renovated certain portions of the property which house student support services, governmental offices, non-profits, and local businesses. Daily management and leasing arrangements are handled for the Foundation through its wholly owned subsidiary, GTF McAlister, LLC. On July 31, 2004, GTF McAlister, LLC contracted with Carolina Holdings, Inc., a property management company, to perform day-to-day management functions. The original operating agreement between the Foundation and the college expired in October, 2014 and was amended and extended through July 31, 2029.
Fair market value $ 617,218 $ 859,118
Swap 1 1,491,651 1,520,881
Swap 2 $ 2,108,869 $ 2,379,999
Total
Change in market value of interest rate swaps
Swap 1 $ (241,900) $ (231,868)
Swap 2 (29,230) (270,887)
Total $ (271,130) $ (502,755)
2017 2016

GREENVILLE TECHNICAL COLLEGE Notes to Financial Statements
June 30, 2018 and June 30, 2017
2018 Comprehensive Annual Financial Report | 95
NOTE 25 – COMPONENT UNIT INFORMATION – GREENVILLE TECH FOUNDATION, continued Q. MCALISTER SQUARE OPERATIONS, continued
The agreement provides for the Foundation to be paid monthly support payments. Under the revised agreement, the college was required to pay a security deposit of $400,000 that may be used periodically to pay for expenses of the property until such time as the college’s reimbursement for the expenses is received.
GTF McAlister, LLC leases space to tenants under operating leases which generally range from one to ten years. GTF McAlister, LLC is responsible for property taxes, maintenance and repairs. Substantially all leases include a charge for common area maintenance which is used to offset repair and maintenance costs incurred in common areas.
Minimum future lease receipts under operating leases are as follows:
R. RELATED PARTY TRANSACTIONS
The Foundation pays Greenville Technical College $24,000 annually for equipment rental and communication
services.
GTF McAlister, LLC, a subsidiary of the Foundation, manages Greenville Technical College’s portion of the McAlister
Square Mall for a management fee of $15,333 per month for the period January 1, 2016 through June 30, 2017, and
$3,000 per month for July through December 2017. For the years ended December 31, 2017 and 2016, management
fees paid to the Foundation by the college totaled $110,000 and $214,000, respectively. During 2014, the college
remitted a security deposit in the amount of $400,000 to GTF McAlister, LLC that is to be repaid at the end of the
operating agreement (Note 17).
The college also reimbursed GTF McAlister, LLC for approximately two-thirds of common area maintenance (CAM)
related expenses. At December 31, 2017 and 2016, GTF McAlister, LLC had a receivable due from the college for
CAM expenses of $32,520 and $30,591, respectively, which are included in accounts receivable on the accompanying
consolidated statements of financial position. The college also pays approximately two-thirds of capital repairs and
improvements. During the periods ended December 31, 2017 and 2016 the college paid expenses to GTF McAlister,
LLC in the amount of $267,577 and $247,326, respectively.
The Foundation, through GTF Pleasantburg, LLC, leases land to Greenville Technical College for $1 monthly. The
initial term of the lease commenced November 1, 2012 and extended for six months. However, the lease renews
automatically every six months until termination of the lease by either party.
The Foundation, through GTF Student Housing, LLC, leases land from Greenville Technical College for $1 annually.
The initial term of this lease commenced on January 1, 2005 and extends for 30 years, ending December 31, 2034.
The college pays certain expenses on behalf of the Foundation and its subsidiaries and is subsequently reimbursed by them. At December 31, 2017 and 2016, GTF Student Housing, LLC and the Foundation owed $9,332 and $155,223
to the college for reimbursement of these expenses which are included in accounts payable on the accompanying
consolidated statement of activities. The Foundation had a receivable of $0 and $6,378 due from the college at
December 31, 2017 and 2016, which is included in accounts receivable on the accompanying consolidated balance
2018 $ 962,778
2019 702,804
2020 389,590
2021 254,872
2022 172,705
$ 2,482,749

GREENVILLE TECHNICAL COLLEGE Notes to Financial Statements
June 30, 2018 and June 30, 2017
96 | Greenville Technical College
NOTE 25 – COMPONENT UNIT INFORMATION – GREENVILLE TECH FOUNDATION, continued R. RELATED PARTY TRANSACTIONS, continued
sheet.
The Foundation, through Brashier Charter, LLC, leases land from Greenville Technical College for $1 annually and
the college leases from the Foundation, through Brashier Charter, LLC, an educational facility. The initial term of this
lease commenced May 13, 2008 and extends for 30 years, ending December 31, 2038.
Base rent for this educational facility under this lease is an amount equal to the debt service payments owed by
Brashier Charter, LLC for the development/construction financing obtained by Brashier Charter, LLC plus additional
amounts required by the lender under such financing, in its loan documents, to create and maintain certain reserves,
and a debt service coverage ratio.
In February 2012, SunTrust notified the Foundation that additional collateral would be required on the GTF Student
Housing, LLC note. The Foundation loaned GTF McAlister, LLC $2,250,000 from its endowment to pay off its loan
with Wells Fargo. The payoff of this loan allowed the Foundation to pledge the GTF McAlister, LLC building and assets
as collateral on the GTF Student Housing, LLC loan. In November 2012, the loan was refinanced with TD Bank. GTF
McAlister, LLC’s note to the Foundation is due on demand and is being paid in monthly installments ranging from
$20,000 to $25,000 of principal plus interest, which accrues at an annual rate of 6 percent. The balance of this note,
which is eliminated upon consolidation, was $890,000 and $994,950 at December 31, 2017 and 2016, respectively.
Interest income and expense eliminated upon consolidation totaled $58,150 and $64,425 for the years ended
December 31, 2017 and 2016, respectively.
S. NET ASSETS RELEASED FROM RESTRICTIONS
Net assets released from restrictions consisted of the following support transferred out of restricted funds for payment
by unrestricted funds.
T. NET ASSETS
Temporarily restricted net assets consist of the following at:
Building improvements $ 1,278,383 $ -
Scholarships 262,744 160,708
Student programs 66,981 1,876
College faculty/staff development 13,895 -
College departmental supplies and activities 204,309 46,772
Equipment purchases/gifts-in-kind - 22,240
Professional services 96,675 -
Miscellaneous expenses 186,690 -
Total net assets released from restrictions $ 2,109,677 $ 231,596
2017 2016
Various College programs $ 5,469,600 $ 6,097,967
Accumulated endowment fund earnings 624,022 30,158
$ 6,093,622 $ 6,128,125
2017 2016

GREENVILLE TECHNICAL COLLEGE Notes to Financial Statements
June 30, 2018 and June 30, 2017
2018 Comprehensive Annual Financial Report | 97
NOTE 25 – COMPONENT UNIT INFORMATION – GREENVILLE TECH FOUNDATION, continued T. NET ASSETS, continued
The income from these endowment funds is expendable for scholarships and college programs.
U. FAIR VALUE MEASUREMENTS
Fair value measurements should be based on assumptions market participants would use when pricing the asset or
liability and establishes a fair value hierarchy which requires an entity to maximize the use of observable inputs and
minimize the use of unobservable inputs when measuring fair value. The fair value hierarchy consists of three broad
levels, and gives the highest priority to unadjusted quoted prices in active markets for identical assets or liabilities
(Level 1 measurements), and the lowest priority to unobservable inputs (Level 3 measurements). The three levels of
the fair value hierarchy are described as follows:
Level 1: Inputs to the valuation methodology are unadjusted quoted prices for identical assets or
liabilities in active markets.
Level 2: Inputs to the valuation methodology include:
Quoted prices for similar assets or liabilities in active markets;
Quoted prices for identical or similar assets or liabilities in inactive markets;
Inputs other than quoted prices that are observable for the asset or liability;
Inputs that are derived principally from or corroborated by observable market data
by correlation or other means.
If the asset or liability has a specified (contractual) term, the Level 2 input must be
observable for substantially the full term of the asset or liability.
Level 3: Inputs to the valuation methodology are unobservable and significant to the fair value
measurement.
The asset or liability’s fair value measurement level within the fair value hierarchy is based on the lowest level of any
input that is significant to the fair value measurement. Valuation techniques used need to maximize the use of
observable inputs and minimize the use of unobservable inputs.
Following is a description of the valuation methodologies used for assets and liabilities measured at fair value:
Investments: valued based on information provided by external investment managers or
comparison to quoted market values.
Charitable remainder trusts receivable: valued using the income approach based on calculating
the present value of the future distributions expected to be received, using published life
expectancy tables and an appropriate discount rate.
Cash value of life insurance: valued at the cash surrender value of the life insurance policy, as
determined by the issuer of the insurance policy, which approximates fair value.
Permanently restricted net assets consist of the following at:
Endowment funds - portion required to be retained
permanently by explicit donor stipulation $ 9,718,411 $ 8,923,589
2017 2016

GREENVILLE TECHNICAL COLLEGE Notes to Financial Statements
June 30, 2018 and June 30, 2017
98 | Greenville Technical College
NOTE 25 – COMPONENT UNIT INFORMATION – GREENVILLE TECH FOUNDATION, continued
U. FAIR VALUE MEASUREMENTS, continued
Interest rate swap: valued using observable current market information as of the reporting date
and is included in long term liabilities on the accompanying statement of financial
position.
Fair values of assets and liabilities measured on a recurring basis at December 31, 2017 and 2016 were as follows:
December 31, 2017:
Assets:
Financials $ 801,430 $ 801,430 $ - $ -
1,342,383 1,342,383 - -
Health care 603,306 603,306 - -
Consumer discretionary 695,176 695,176 - -
Energy 231,757 231,757 - -
460,407 460,407 - -
Consumer supplies 333,246 333,246 - -
23,297 23,297 - -
Materials 271,787 271,787 - -
Utilities 149,458 149,458 - -
279,064 279,064 - -
International equities 1,921,223 1,921,223 - -
Equity securities - mutual funds 956,401 956,401 - -
Fixed income securities
1,191,675 - 1,191,675 -
Corporate debt securities 1,538,891 - 1,538,891 -
Mutual funds 502,696 502,696 - -
635,693 635,693 - -
Total investments 11,937,890 9,207,324 2,730,566 -
124,559 - - 124,559
Cash value of life insurance 49,781 - 49,781 -
Total assets at fair value $ 12,112,230 $ 9,207,324 $ 2,780,347 $ 124,559
Liabilities:
Interest rate swaps $ 2,108,868 $ - $ 2,108,868 $ -
Assets/Liabilities at Fair Value
Real estate
Level 3
Telecommunication services
Level 2
Charitable remainder trust receivable
Total Level 1
Investments:
Equity securities - common stock
Information technology
Industrials
Alternative strategies mutual funds
US Government debt securities

GREENVILLE TECHNICAL COLLEGE Notes to Financial Statements
June 30, 2018 and June 30, 2017
2018 Comprehensive Annual Financial Report | 99
NOTE 25 – COMPONENT UNIT INFORMATION – GREENVILLE TECH FOUNDATION, continued
U. FAIR VALUE MEASUREMENTS, continued
The following table represents a summary of changes of the Foundation’s Level 3 assets for the years ended December 31, 2017 and 2016:
December 31, 2016:
Assets:
Financials $ 828,106 $ 828,106 $ - $ -
1,126,020 1,126,020 - -
Health care 722,142 722,142 - -
Consumer discretionary 577,915 577,915 - -
Energy 331,897 331,897 - -
369,017 369,017 - -
Consumer supplies 381,254 381,254 - -
203,488 203,488 - -
Materials 151,131 151,131 - -
Utilities 194,138 194,138 - -
188,638 188,638 - -
Equity securities - mutual funds 342,662 342,662 - -
Fixed income securities
1,287,500 - 1,287,500 -
Corporate debt securities 1,362,431 - 1,362,431 -
Mutual funds 431,726 431,726 - -
628,918 628,918 - -
Broad commodities mutual funds 143,352 143,352
Total investments 9,270,335 6,620,404 2,649,931 -
102,737 - - 102,737
Cash value of life insurance 46,608 - 46,608 -
$ 9,419,680 $ 6,620,404 $ 2,696,539 $ 102,737
Liabilities:
Interest rate swaps $ 2,379,999 $ - $ 2,379,999 $ -
Assets/Liabilities at Fair Value
Real estate
Level 3
Telecommunication services
Level 2
Charitable remainder trust receivable
Total Level 1
Investments:
Equity securities - common stock
Information technology
Industrials
Alternative strategies mutual funds
US Government debt securities
Balance December 31, 2015 $ 285,161
Distribution (220,495)
Total realized/unrealized gains included in change in net assets 38,071
Balance December 31, 2016 102,737
Total realized/unrealized gains included in change in net assets 21,822
Balance December 31, 2017 $ 124,559
Charitable
Remainder
Trust
Receivables

GREENVILLE TECHNICAL COLLEGE Notes to Financial Statements
June 30, 2018 and June 30, 2017
100 | Greenville Technical College
NOTE 25 – COMPONENT UNIT INFORMATION – GREENVILLE TECH FOUNDATION, continued
U. FAIR VALUE MEASUREMENTS, continued
Total realized and unrealized gains on charitable remainder trust receivables measured using Level 3 inputs are reported in the Foundation’s statements of activities.
V. FUNCTIONAL EXPENSES
Expenses incurred were classified in the following categories for the years ended December 31, 2017 and 2016:
W. SUBSEQUENT EVENTS
Subsequent events have been evaluated through the date of the auditor’s report, which is the date the financial statements were available to be issued.
Program expenses
College operations $ 278,877 $ 222,838
Scholarships 262,744 308,458
Student programs 66,981 47,933
College faculty/staff development 13,895 31,394
College departmental supplies and activities 204,309 170,834
College support - building improvements/equipment 1,278,392 -
Equipment purchases/gifts in kind 518,231 1,042,730
GTF Brashier Charter School 569,043 582,322
GTF Student Housing 1,814,901 1,827,893
5,007,373 4,234,402
General and administrative 1,809,544 1,796,810
Fundraising 46,313 74,059
Total expenses $ 6,863,230 $ 6,105,271
2017 2016

GREENVILLE TECHNICAL COLLEGE Required Supplementary Information for Financial Statements
June 30, 2018 and June 30, 2017
2018 Comprehensive Annual Financial Report | 101
Required Supplementary Information
This schedule is presented to illustrate the requirement to show information for 10 years; however, until a full 10-year trend is complied, this presentation will only include information for those years for which information is available.
FY 2018 FY 2017 FY 2016 FY 2015
College's proportion of the 0.398% 0.411% 0.420% 0.424%
net pension liability
College's proportionate share of the $89,697,728 $87,825,732 $79,647,249 $72,991,685
net pension liability
College's covered-employee payroll $44,325,021 $44,017,909 $43,465,411 $42,438,999
College's proportionate share of the
net pension liability
as a percentage of its covered- 202.36% 199.52% 183.24% 171.99%
employee payroll
Plan fiduciary net position as a
percentage of the total
pension liability 53.30% 52.91% 57.00% 59.92%
FY 2018 FY 2017 FY 2016 FY 2015
College's proportion of the net 0.023% 0.023% 0.019% 0.010%
pension liability
College's proportionate share of the $ 635,469 $ 583,465 $ 416,959 $ 186,561
net pension liability
College's covered-employee payroll $ 312,369 $ 293,261 $ 223,255 $ 117,209
College's proportionate share of the
net pension liability
as a percentage of its covered- 203.44% 198.96% 186.76% 159.17%
employee payroll
Plan fiduciary net position as a
percentage of the total
pension liability 60.90% 60.44% 64.60% 67.55%
Schedule of Proportionate Share of the Net Pension Liability
South Carolina Retirement System
Schedule of Proportionate Share of the Net Pension Liability
Police Officer's Retirement System

GREENVILLE TECHNICAL COLLEGE Required Supplementary Information for Financial Statements
June 30, 2018 and June 30, 2017
102 | Greenville Technical College
This schedule is presented to illustrate the requirement to show information for 10 years; however, until a full 10-year trend is complied, this presentation will only include information for those years for which information is available.
FY 2018 FY 2017 FY 2016 FY 2015
Contractually required contribution $ 5,595,230 $ 4,650,556 $ 4,396,588 $ 4,287,729
Contribution in relation to the
contractually required contribution $ (5,595,230) $ (4,650,556) $ (4,396,588) $ (4,287,729)
Contribution deficiency (excess) - - - -
College's covered-employee payroll $44,898,363 $44,325,021 $44,017,909 $43,465,411
Contributions as a portion of covered
employee payroll 12.46% 10.49% 9.99% 9.86%
FY 2018 FY 2017 FY 2016 FY 2015
Contractually required contribution $ 44,117 $ 43,857 $ 39,708 $ 29,492
Contribution in relation to the
contractually required contribution $ (44,117) $ (43,857) $ (39,708) $ (29,492)
Contribution deficiency (excess) - - - -
College's covered-employee payroll $ 275,046 $ 312,369 $ 293,261 $ 223,255
Contributions as a portion of covered
employee payroll 16.04% 14.04% 13.54% 13.21%
Schedule of College Contributions
Police Officer's Retirement System
Schedule of College Contributions
South Carolina Retirement System

GREENVILLE TECHNICAL COLLEGE Required Supplementary Information for Financial Statements
June 30, 2018 and June 30, 2017
2018 Comprehensive Annual Financial Report | 103
This schedule is presented to illustrate the requirement to show information for 10 years; however, until a full 10-year trend is complied, this presentation will only include information for those years for which information is available.
FY 2018 FY 2017
College's proportion of the net OPEB
liability 0.529% 0.529%
College's proportionate share of the
net OPEB liability $71,696,611 $76,586,515
College's covered-employee payroll $44,637,391 $44,311,170
College's proportionate share of the
net OPEB liability as a percentage
of its covered-employee payroll 160.62% 172.84%
Plan fiduciary net position as a
percentage of the total OPEB
liability 53.30% 52.91%
FY 2018 FY 2017
College's proportion of the net OPEB
liability 0.350% 0.350%
College's proportionate share of the
net OPEB liability $ 6,353 $ 2,432
College's covered-employee payroll $44,637,391 $44,311,170
College's proportionate share of the
net OPEB liability as a percentage
of its covered-employee payroll 0.01% 0.01%
Plan fiduciary net position as a
percentage of the total OPEB
liability 60.90% 60.44%
Schedule of Proportionate Share of the Net OPEB Liability
South Carolina Retiree Health Insurance Trust Fund
Schedule of Proportionate Share of the Net OPEB Liability
South Carolina Long-Term Disability Insurance Trust Fund

GREENVILLE TECHNICAL COLLEGE Required Supplementary Information for Financial Statements
June 30, 2018 and June 30, 2017
104 | Greenville Technical College
This schedule is presented to illustrate the requirement to show information for 10 years; however, until a full 10-year trend is complied, this presentation will only include information for those years for which information is available.
FY 2018 FY 2017
Contractually required contribution $ 2,484,538 $ 2,379,173
Implicit Subsidy $ (56,994) $ (200,595)
Total Contribution $ 2,427,544 $ 2,178,578
Contribution in relation to the
contractually required contribution $ (2,484,538) $ (2,379,173)
Contribution deficiency (excess) - -
College's covered-employee payroll $45,173,409 $44,637,391
Contributions as a portion of covered
employee payroll 5.37% 4.88%
FY 2018 FY 2017
Contractually required contribution $ 24,913 $ 24,846
Contribution in relation to the
contractually required contribution $ (24,913) $ (24,846)
Contribution deficiency (excess) - -
College's covered-employee payroll $45,173,409 $44,637,391
Contributions as a portion of covered
employee payroll 0.06% 0.06%
Schedule of College Contributions
South Carolina Retiree Health Insurance Trust Fund
Schedule of College Contributions
South Carolina Long-Term Disability Insurance Trust Fund

2018 Comprehensive Annual Financial Report | 105
STATISTICAL SECTION
A COMPONENT UNIT OF THE STATE OF SOUTH CAROLINA

106 | Greenville Technical College

2018 Comprehensive Annual Financial Report | 107
Statistical Section Content Explanation
This section of the Greenville Technical College Comprehensive Annual Financial Report presents information that will assist in understanding the information in the financial statements, note disclosures, and the supplementary information about the overall financial health of the college.
CONTENTS SCHEDULES Financial Trends 1-3
The schedules in this section contain trend information to assist in understanding how the college’s financial performance and well-being have changed over time.
Revenue Capacity 4-8
The schedules in this section contain information to assess the college’s most significant revenue sources.
Debt Capacity 9-10
The schedules in this section contain information to assess the college’s outstanding debt obligations.
Demographic and Economic Indicators 11-12
The schedules in this section offer demographic and economic indicators to assist in understanding the environment within the college’s financial activities it performs.
Operating Information 13-14
The schedules in this section contain service and infrastructure data to assist in understanding how the information in the college’s financial report relates to the services it provides and the activities it performs.
Other Information 15-16
The schedules in this section are additional information that is not required by GASB 44 Statement but is of interest to those reading the report.

108 | Greenville Technical College

2018 Comprehensive Annual Financial Report | 109
STATISTICAL SECTION:
Financial Trends
A COMPONENT UNIT OF THE STATE OF SOUTH CAROLINA

110 | Greenville Technical College
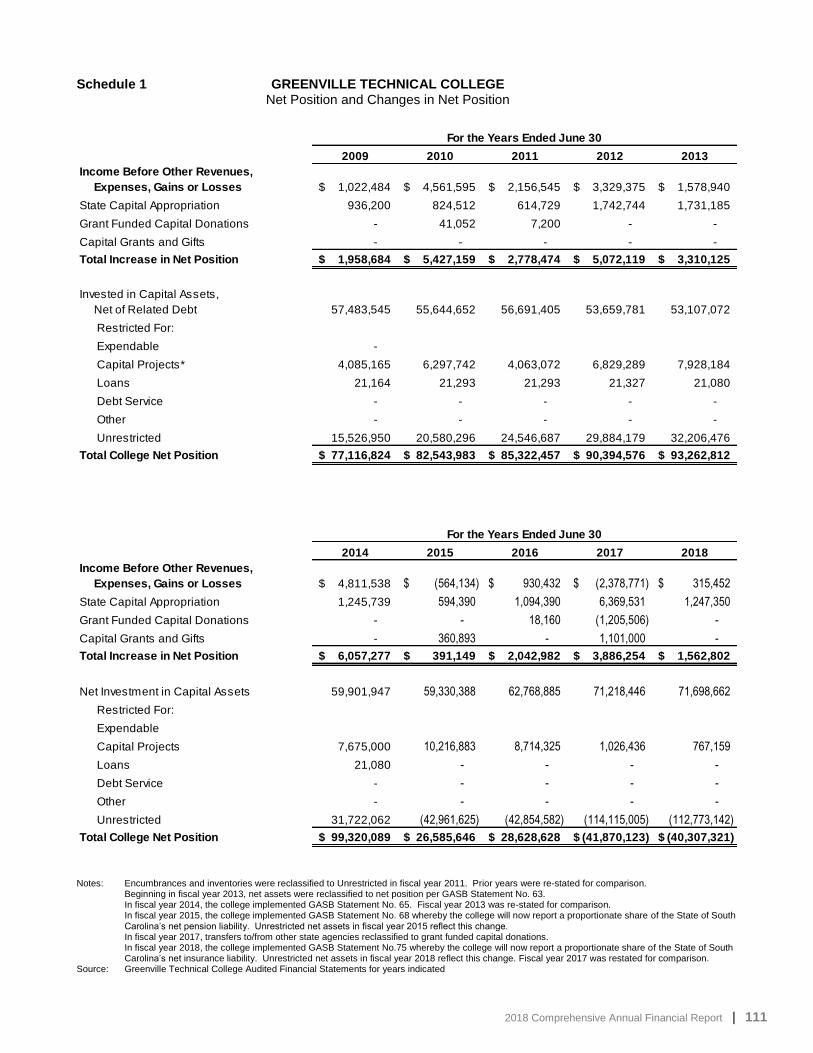
2018 Comprehensive Annual Financial Report | 111
Schedule 1 GREENVILLE TECHNICAL COLLEGE Net Position and Changes in Net Position
Schedule 1: Net Position and Changes in Net Position
Notes: Encumbrances and inventories were reclassified to Unrestricted in fiscal year 2011. Prior years were re-stated for comparison. Beginning in fiscal year 2013, net assets were reclassified to net position per GASB Statement No. 63. In fiscal year 2014, the college implemented GASB Statement No. 65. Fiscal year 2013 was re-stated for comparison. In fiscal year 2015, the college implemented GASB Statement No. 68 whereby the college will now report a proportionate share of the State of South
Carolina’s net pension liability. Unrestricted net assets in fiscal year 2015 reflect this change. In fiscal year 2017, transfers to/from other state agencies reclassified to grant funded capital donations. In fiscal year 2018, the college implemented GASB Statement No.75 whereby the college will now report a proportionate share of the State of South
Carolina’s net insurance liability. Unrestricted net assets in fiscal year 2018 reflect this change. Fiscal year 2017 was restated for comparison. Source: Greenville Technical College Audited Financial Statements for years indicated
2009 2010 2011 2012 2013
Income Before Other Revenues,
Expenses, Gains or Losses 1,022,484$ 4,561,595$ 2,156,545$ 3,329,375$ 1,578,940$
State Capital Appropriation 936,200 824,512 614,729 1,742,744 1,731,185
Grant Funded Capital Donations - 41,052 7,200 - -
Capital Grants and Gifts - - - - -
Total Increase in Net Position 1,958,684$ 5,427,159$ 2,778,474$ 5,072,119$ 3,310,125$
Invested in Capital Assets,
Net of Related Debt 57,483,545 55,644,652 56,691,405 53,659,781 53,107,072
Restricted For:
Expendable -
Capital Projects* 4,085,165 6,297,742 4,063,072 6,829,289 7,928,184
Loans 21,164 21,293 21,293 21,327 21,080
Debt Service - - - - -
Other - - - - -
Unrestricted 15,526,950 20,580,296 24,546,687 29,884,179 32,206,476
Total College Net Position 77,116,824$ 82,543,983$ 85,322,457$ 90,394,576$ 93,262,812$
2014 2015 2016 2017 2018
Income Before Other Revenues,
Expenses, Gains or Losses 4,811,538$ (564,134)$ 930,432$ (2,378,771)$ 315,452$
State Capital Appropriation 1,245,739 594,390 1,094,390 6,369,531 1,247,350
Grant Funded Capital Donations - - 18,160 (1,205,506) -
Capital Grants and Gifts - 360,893 - 1,101,000 -
Total Increase in Net Position 6,057,277$ 391,149$ 2,042,982$ 3,886,254$ 1,562,802$
Net Investment in Capital Assets 59,901,947 59,330,388 62,768,885 71,218,446 71,698,662
Restricted For:
Expendable
Capital Projects 7,675,000 10,216,883 8,714,325 1,026,436 767,159
Loans 21,080 - - - -
Debt Service - - - - -
Other - - - - -
Unrestricted 31,722,062 (42,961,625) (42,854,582) (114,115,005) (112,773,142)
Total College Net Position 99,320,089$ 26,585,646$ 28,628,628$ (41,870,123)$ (40,307,321)$
For the Years Ended June 30
For the Years Ended June 30

112 | Greenville Technical College Continued on Next Page
GREENVILLE TECHNICAL COLLEGE Schedule 2 Operating Expenses by Function
Last Ten Fiscal Years
Schedule 2: Operating Expenses by Function
2009 2010 2011 2012 2013
Instruction $43,036,617 $ 43,240,090 $ 45,586,216 $ 45,179,977 $ 44,933,704
Academic Support $11,691,171 $ 11,861,907 $ 10,691,933 $ 10,029,086 $ 10,552,156
Student Support $ 5,915,363 $ 6,740,121 $ 7,106,668 $ 6,672,249 $ 6,550,777
Maint/Operations $10,060,545 $ 9,970,797 $ 11,188,394 $ 11,141,199 $ 10,599,078
Institutional Support $ 5,487,748 $ 5,379,401 $ 7,569,812 $ 6,215,513 $ 5,501,535
Scholarships $12,002,989 $ 19,405,001 $ 20,936,713 $ 19,654,204 $ 18,612,902
Auxiliary Enterprises $ 6,608,349 $ 7,526,264 $ 7,819,553 $ 7,384,518 $ 6,946,418
Depreciation $ 4,436,707 $ 4,908,497 $ 5,853,045 $ 4,792,751 $ 4,728,514
Total Expenses $99,239,489 $109,032,078 $116,752,334 $111,069,497 $108,425,084
2009 2010 2011 2012 2013
Instruction 43.37% 39.67% 39.05% 40.68% 41.44%
Academic Support 11.78% 10.88% 9.16% 9.03% 9.73%
Student Support 5.96% 6.18% 6.09% 6.01% 6.04%
Maint/Operations 10.14% 9.14% 9.58% 10.03% 9.78%
Institutional Support 5.53% 4.93% 6.48% 5.60% 5.07%
Scholarships 12.09% 17.80% 17.93% 17.70% 17.17%
Auxiliary Enterprises 6.66% 6.90% 6.70% 6.64% 6.41%
Depreciation 4.47% 4.50% 5.01% 4.31% 4.36%
Total Expenses 100.00% 100.00% 100.00% 100.00% 100.00%
(Percent of Total)
Continued on Next Page

2018 Comprehensive Annual Financial Report | 113
Schedule 2 GREENVILLE TECHNICAL COLLEGE (continued) Operating Expenses by Function
Last Ten Fiscal Years
Source: Greenville Technical College Audited Financial Statements
2014 2015 2016 2017 2018
Instruction $ 42,509,055 $ 44,625,817 $ 44,393,954 $ 46,316,842 $ 46,737,096
Academic Support $ 14,110,382 $ 12,868,513 $ 10,337,835 $ 8,557,354 $ 7,914,521
Student Support $ 6,546,229 $ 7,478,863 $ 7,543,145 $ 7,468,286 $ 7,330,400
Maint/Operations $ 9,412,202 $ 9,089,730 $ 10,468,347 $ 12,756,779 $ 10,297,753
Institutional Support $ 5,603,242 $ 7,058,272 $ 7,482,398 $ 9,190,298 $ 9,410,816
Scholarships $ 16,306,996 $ 15,533,288 $ 13,461,864 $ 12,014,463 $ 10,962,370
Auxiliary Enterprises $ 6,700,780 $ 6,212,683 $ 6,198,594 $ 5,891,120 $ 5,576,804
Depreciation $ 4,604,244 $ 4,901,028 $ 4,787,517 $ 5,254,629 $ 5,479,476
Total Expenses $105,793,130 $107,768,194 $104,673,654 $107,449,771 $103,709,236
2014 2015 2016 2017 2018
Instruction 40.18% 41.41% 42.41% 43.12% 45.08%
Academic Support 13.34% 11.94% 9.88% 7.96% 7.63%
Student Support 6.19% 6.94% 7.21% 6.95% 7.07%
Maint/Operations 8.90% 8.43% 10.00% 11.87% 9.93%
Institutional Support 5.30% 6.55% 7.15% 8.55% 9.07%
Scholarships 15.41% 14.41% 12.86% 11.18% 10.57%
Auxiliary Enterprises 6.33% 5.76% 5.92% 5.48% 5.38%
Depreciation 4.35% 4.56% 4.57% 4.89% 5.27%
Total Expenses 100.00% 100.00% 100.00% 100.00% 100.00%
(Percent of Total)

114 | Greenville Technical College Continued on Next Page
GREENVILLE TECHNICAL COLLEGE Charts 1 & 2
Expenses by Function For the Year Ended June 30, 2018
Chart 1: Expenses by Function for Year Ended June 30, 2018
Chart 1: Expenses by Function for Year Ended June 30, 2018 Chart 1
Auxiliary Enterprises Revenue/Expense Comparison, Last 10 Years Ended June 30, 2018
Chart 2: Ten Year Revenue and Expense Comparison – Auxiliary Enterprises
Chart 2
45.08%
7.63%
7.07%9.93%
9.07%
10.57%
5.38%
5.27%
Instruction Academic Support Student Support Maint/Operations
Institutional Support Scholarships Auxiliary Enterprises Depreciation
$-
$1,000,000
$2,000,000
$3,000,000
$4,000,000
$5,000,000
$6,000,000
$7,000,000
$8,000,000
$9,000,000
$10,000,000
Auxiliary Revenues Auxiliary Expenses

2018 Comprehensive Annual Financial Report | 115
Charts 3 & 4 GREENVILLE TECHNICAL COLLEGE
Ten Year Expense Comparison Instruction, Academic Support, Student Support
Ended June 30, 2018 Chart 3: Ten Year Expense Comparison – Instruction, Academic Support, Student Support
Chart 3
Ten Year Expense Comparison
Other Functional Areas Ended June 30, 2018 Chart 4: Ten Year Expense Comparison – Other Functional Areas
Chart 4
$-
$5,000,000
$10,000,000
$15,000,000
$20,000,000
$25,000,000
$30,000,000
$35,000,000
$40,000,000
$45,000,000
$50,000,000
Instruction Academic Support Student Support
$-
$5,000,000
$10,000,000
$15,000,000
$20,000,000
$25,000,000
Maint/Operations Institutional Support Scholarships Auxiliary Enterprises Depreciation

116 | Greenville Technical College
GREENVILLE TECHNICAL COLLEGE Schedule 3 Expenses by Use
Schedule 3: Expenses by Use
Expenses: 2009 2010 2011 2012 2013
Salaries 46,289,280$ 47,238,522$ 47,875,256$ 48,210,417$ 48,829,931$
Benefits 11,663,225 11,924,571 12,607,130 13,062,761 14,009,887
Scholarships 12,002,989 19,405,001 20,936,713 19,654,204 18,612,902
Utilities 2,529,831 2,730,827 2,842,110 2,934,408 2,827,177
Supplies and Other Services 22,317,457 22,824,660 26,638,080 22,414,956 19,432,118
Depreciation 4,436,707 4,908,497 5,853,045 4,792,751 4,728,514
Total Operating Expenses 99,239,489$ 109,032,078$ 116,752,334$ 111,069,497$ 108,440,529$
Loss on Disposal of Fixed Assets 2,290 401,314 - - 8,873
Interest Expense on
Capital Asset Related Debt 1,743,834 2,196,495 1,738,675 2,008,894 1,759,205
Total Expenses 100,985,613$ 111,629,887$ 118,491,009$ 113,078,391$ 110,208,607$
Expenses: 2009 2010 2011 2012 2013
Salaries 45.83% 42.31% 40.39% 42.63% 44.31%
Benefits 11.55% 10.68% 10.64% 11.55% 12.71%
Scholarships 11.89% 17.38% 17.67% 17.38% 16.89%
Utilities 2.51% 2.45% 2.40% 2.60% 2.57%
Supplies and Other Services 22.10% 20.45% 22.48% 19.82% 17.63%
Depreciation 4.39% 4.40% 4.95% 4.24% 4.28%
Total Operating Expenses 98.27% 97.67% 98.53% 98.22% 98.39%
Loss on Disposal of Fixed Assets 0.00% 0.36% 0.00% 0.00% 0.01%
Interest Expense on
Capital Asset Related Debt 1.73% 1.97% 1.47% 1.78% 1.60%
Total Expenses 100.00% 100.00% 100.00% 100.00% 100.00%
(Percent of Total)
Continued on Next Page

2018 Comprehensive Annual Financial Report | 117
Schedule 3 GREENVILLE TECHNICAL COLLEGE
(continued) Expenses by Use
Schedule 3: Expenses by U
se Source: Greenville Technical College Audited Financial Statements
Expenses: 2014 2015 2016 2017 2018
Salaries 48,334,643$ 48,120,014$ 46,891,197$ 46,880,379$ 46,536,709$
Benefits 14,585,224 16,029,490 16,587,636 18,402,610 20,840,026
Scholarships 16,306,996 15,533,288 13,461,864 12,014,463 10,962,370
Utilities 2,961,593 2,942,115 2,913,927 2,963,151 2,946,018
Supplies and Other Services 19,000,430 20,242,259 20,031,513 21,934,540 16,944,637
Depreciation 4,604,244 4,901,028 4,787,517 5,254,629 5,479,476
Total Operating Expenses 105,793,130$ 107,768,194$ 104,673,654$ 107,449,772$ 103,709,236$
Loss on Disposal of Fixed Assets 171,821 - - 1,205,506 -
Interest Expense on
Capital Asset Related Debt 1,567,181 1,517,691 1,270,100 1,157,146 1,093,772
Total Expenses 107,532,132$ 109,285,885$ 105,943,754$ 109,812,424$ 104,803,008$
Expenses: 2014 2015 2016 2017 2018
Salaries 44.95% 44.03% 44.28% 42.69% 44.40%
Benefits 13.56% 14.67% 15.66% 16.76% 19.89%
Scholarships 15.16% 14.21% 12.71% 10.94% 10.46%
Utilities 2.75% 2.69% 2.75% 2.70% 2.81%
Supplies and Other Services 17.67% 18.52% 18.91% 19.97% 16.17%
Depreciation 4.29% 4.49% 4.52% 4.79% 5.23%
Total Operating Expenses 98.38% 98.61% 98.83% 97.85% 98.96%
Loss on Disposal of Fixed Assets 0.16% 0.00% 0.00% 1.10% 0.00%
Interest Expense on
Capital Asset Related Debt 1.46% 1.39% 1.17% 1.05% 1.04%
Total Expenses 100.00% 100.00% 100.00% 100.00% 100.00%
(Percent of Total)

118 | Greenville Technical College

2018 Comprehensive Annual Financial Report | 119
STATISTICAL SECTION:
Revenue Capacity
A COMPONENT UNIT OF THE STATE OF SOUTH CAROLINA

120 | Greenville Technical College
Schedule 4 GREENVILLE TECHNICAL COLLEGE Schedule of Revenue by Source
Last Ten Fiscal Years
Schedule 4: Ten Year Revenue Comparison by Source
2009 2010 2011 2012 2013
Tuition and Fees $ 27,577,132 $ 30,307,515 $ 29,025,781 $ 31,405,195 $ 30,112,506
Federal Grants/Contracts 22,470,535 6,227,075 5,593,759 4,769,158 4,799,920
State Grants/Contracts 13,353,739 12,538,718 12,262,899 12,010,898 12,714,728
Sales/Serv. Of Educ. Depts. 576,514 639,379 646,839 612,583 680,739
Auxiliary Enterprises 5,441,532 5,948,067 5,766,792 5,988,750 5,569,743
Other 677,893 927,181 1,059,622 1,209,979 1,400,820
Total Operating Revenue $ 70,097,345 $ 56,587,935 $ 54,355,692 $ 55,996,563 $ 55,278,456
State Appropriations $ 19,380,516 $ 17,595,128 $ 15,033,690 $ 15,314,378 $ 15,962,461
Local Appropriations 9,942,413 10,009,941 10,547,851 10,515,010 10,720,917
Investment Income 489,158 218,871 294,276 89,621 118,678
Gain on Disposal of Capital Assets - - 1,448 - -
Federal Grants/Contracts 784,918 30,734,132 39,650,020 33,609,133 28,846,140
State Grants/Contracts 1,313,747 1,045,475 764,577 883,061 860,895
Total Nonoperating Revenue $ 31,910,752 $ 59,603,547 $ 66,291,862 $ 60,411,203 $ 56,509,091
State Capital Appropriation $ 936,200 $ 824,512 $ 614,729 $ 1,742,744 $ 1,731,185
Grant-Funded Capital Assets
Donated - 41,052 7,200 - -
Capital Grants and Gifts - - - - -
Total Revenues $102,944,297 $117,057,046 $121,269,483 $118,150,510 $113,518,732
2009 2010 2011 2012 2013
Tuition and Fees 26.79% 25.89% 23.93% 26.58% 26.53%
Federal Grants/Contracts 21.83% 5.32% 4.61% 4.04% 4.23%
State Grants/Contracts 12.97% 10.71% 10.11% 10.17% 11.20%
Sales/Serv. Of Educ. Depts. 0.56% 0.55% 0.53% 0.52% 0.60%
Auxiliary Enterprises 5.29% 5.08% 4.76% 5.07% 4.91%
Other 0.65% 0.79% 0.88% 1.01% 1.23%
Total Operating Revenue 68.09% 48.34% 44.82% 47.39% 48.70%
State Appropriations 18.83% 15.03% 12.40% 12.96% 14.06%
Local Appropriations 9.66% 8.55% 8.70% 8.90% 9.44%
Investment Income 0.48% 0.19% 0.24% 0.07% 0.10%
Gain on Disposal of Capital Assets 0.00% 0.00% 0.00% 0.00% 0.00%
Federal Grants/Contracts 0.76% 26.26% 32.70% 28.45% 25.41%
State Grants/Contracts 1.27% 0.89% 0.62% 0.75% 0.76%
Total Nonoperating Revenue 31.00% 50.92% 54.66% 51.13% 49.77%
State Capital Appropriation 0.91% 0.70% 0.51% 1.48% 1.53%
Grant-Funded Capital Assets
Donated 0.00% 0.04% 0.01% 0.00% 0.00%
Capital Grants and Gifts 0.00% 0.00% 0.00% 0.00% 0.00%
Total Revenues 100.00% 100.00% 100.00% 100.00% 100.00%
(Percent of Total)
Continued on Next Page

2018 Comprehensive Annual Financial Report | 121
Schedule 4
GREENVILLE TECHNICAL COLLEGE Schedule 4 Schedule of Revenue by Source (continued)
Last Ten Fiscal Years
Source: Greenville Technical College Audited Financial Statements. Note: Pell was reclassified from operating to non-operating revenue in the year ended June 30, 2010. In fiscal year 2017, transfers to/from other state agencies reclassified to grant funded capital donations.
2014 2015 2016 2017 2018
Tuition and Fees $ 28,466,428 $ 28,306,907 $ 26,390,115 $ 26,805,391 $ 24,546,247
Federal Grants/Contracts 9,410,829 8,221,947 6,576,908 4,176,398 3,881,802
State Grants/Contracts 12,589,868 12,101,577 13,522,823 15,311,732 15,810,843
Sales/Serv. Of Educ. Depts. 643,827 599,605 630,280 626,660 606,070
Auxiliary Enterprises 5,231,081 5,138,739 4,891,989 4,511,004 4,153,177
Other 1,510,084 1,435,052 1,636,967 1,823,198 2,485,369
Total Operating Revenue $ 57,852,117 $ 55,803,827 $ 53,649,082 $ 53,254,383 $ 51,483,508
State Appropriations $ 16,696,570 $ 16,943,392 $ 17,841,748 $ 19,599,193 $ 18,581,382
Local Appropriations 11,107,712 11,341,851 11,971,900 12,039,129 12,746,627
Investment Income 123,070 268,596 327,898 379,154 599,628
Gain on Disposal of Capital Assets - - - - 82,978
Federal Grants/Contracts 25,691,963 23,581,574 22,218,173 20,322,041 20,909,400
State Grants/Contracts 872,238 782,511 832,445 634,247 714,937
Total Nonoperating Revenue $ 54,491,553 $ 52,917,924 $ 53,192,164 $ 52,973,764 $ 53,634,952
State Capital Appropriation $ 1,245,739 $ 594,390 $ 1,094,390 $ 6,369,531 $ 1,247,350
Grant-Funded Capital Assets
Donated - - 18,160
Capital Grants and Gifts - 360,893 - 1,101,000 -
Total Revenues $113,589,409 $109,677,034 $107,953,796 $113,698,678 $106,365,810
2014 2015 2016 2017 2018
Tuition and Fees 25.06% 25.81% 24.45% 23.83% 23.08%
Federal Grants/Contracts 8.28% 7.50% 6.09% 3.71% 3.65%
State Grants/Contracts 11.08% 11.03% 12.53% 13.61% 14.86%
Sales/Serv. Of Educ. Depts. 0.57% 0.55% 0.58% 0.56% 0.57%
Auxiliary Enterprises 4.61% 4.69% 4.53% 4.01% 3.90%
Other 1.33% 1.31% 1.52% 1.62% 2.34%
Total Operating Revenue 50.93% 50.89% 49.70% 47.34% 48.40%
State Appropriations 14.70% 15.45% 16.53% 17.42% 17.47%
Local Appropriations 9.77% 10.34% 11.09% 10.70% 11.98%
Investment Income 0.11% 0.24% 0.30% 0.34% 0.56%
Gain on Disposal of Capital Assets 0.00% 0.00% 0.00% 0.00% 0.08%
Federal Grants/Contracts 22.62% 21.50% 20.58% 18.07% 19.66%
State Grants/Contracts 0.77% 0.71% 0.77% 0.56% 0.67%
Total Nonoperating Revenue 47.97% 48.24% 49.27% 47.09% 50.42%
State Capital Appropriation 1.10% 0.54% 1.01% 5.66% 1.18%
Grant-Funded Capital Assets
Donated 0.00% 0.00% 0.02% -1.07% 0.00%
Capital Grants and Gifts 0.00% 0.33% 0.00% 0.98% 0.00%
Total Revenues 100.00% 100.00% 100.00% 100.00% 100.00%
(Percent of Total)
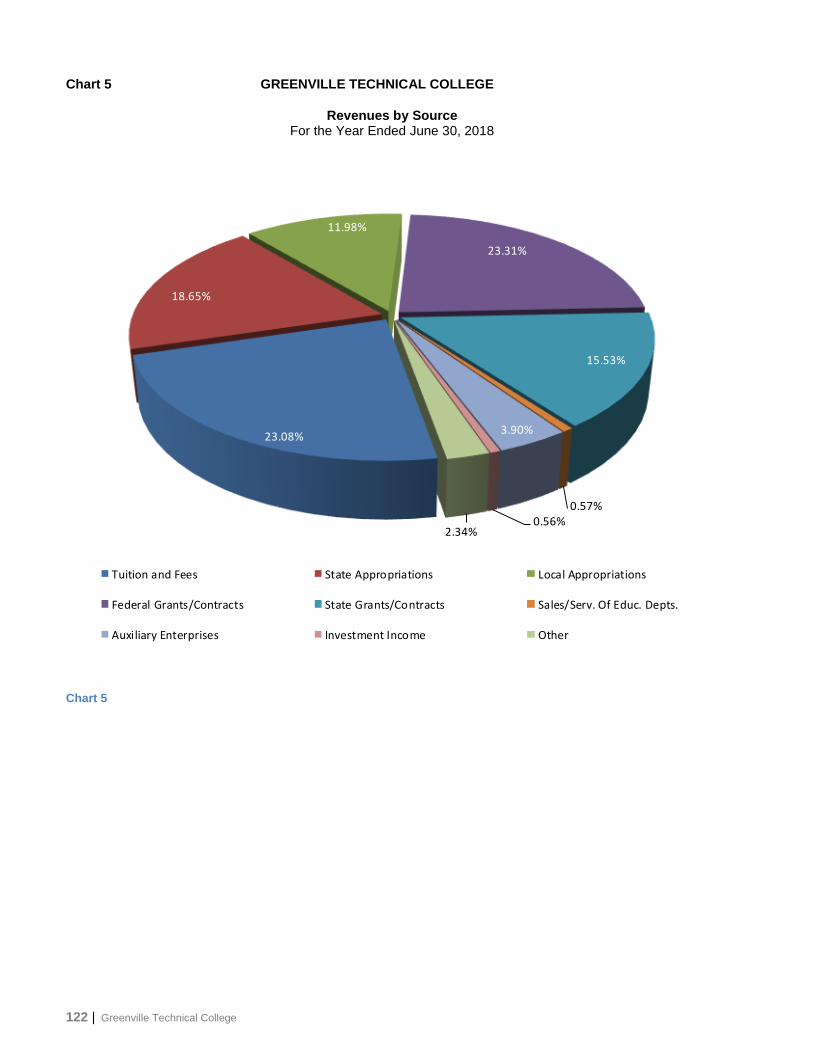
122 | Greenville Technical College
Chart 5 GREENVILLE TECHNICAL COLLEGE
Revenues by Source For the Year Ended June 30, 2018
Chart 5: Revenues by Source for Year Ended June 30, 2018
Chart 5
23.08%
18.65%
11.98%
23.31%
15.53%
0.57%
3.90%
0.56%2.34%
Tuition and Fees State Appropriations Local Appropriations
Federal Grants/Contracts State Grants/Contracts Sales/Serv. Of Educ. Depts.
Auxiliary Enterprises Investment Income Other

2018 Comprehensive Annual Financial Report | 123
GREENVILLE TECHNICAL COLLEGE Charts 6 & 7
Revenues by Source For the Year Ended June 30, 2018
Chart 6: Ten Year Revenue Comparison by Source
Chart 6
Chart 7: Ten Year Revenue and Expense Comparison
Total Revenue/Expense Comparison, Last Ten Fiscal Years Ended June 30, 2018
Chart 7
$-
$5,000,000
$10,000,000
$15,000,000
$20,000,000
$25,000,000
$30,000,000
$35,000,000
$40,000,000
$45,000,000
$50,000,000
Tuition and Fees State Appropriations Local Appropriations Federal Grants/Contracts
$-
$20,000,000.00
$40,000,000.00
$60,000,000.00
$80,000,000.00
$100,000,000.00
$120,000,000.00
$140,000,000.00
Total Revenues Total Expenses

124 | Greenville Technical College
Schedule 5 GREENVILLE TECHNICAL COLLEGE Annual Tuition and Fees
Last Ten Years
Schedule 5: Annual Tuition and Fees
Continued on Next Page

2018 Comprehensive Annual Financial Report | 125
GREENVILLE TECHNICAL COLLEGE Schedule 5 Annual Tuition and Fees (continued)
Last Ten Years
Source: South Carolina Commission on Higher Education

126 | Greenville Technical College
Schedule 6 GREENVILLE TECHNICAL COLLEGE Admissions Statistics For Academic Years 2007-2017
Schedule 6: Admissions Statistics
Source: Greenville Technical College Office of Quality and Planning

2018 Comprehensive Annual Financial Report | 127
GREENVILLE TECHNICAL COLLEGE Schedule 7 Student Fall Enrollment Demographics
Last Ten Years
Schedule 7: Student Fall Enrollment Demographics
Note(s): All data presented is for fall term except Degrees Awarded which includes the entire fiscal year (July – June) (*) FTE’s are calculated by the total number of credit hours divided by 15, as published by CHE
Source: Greenville Technical College Office of Quality and Planning
Gender 2008 2009 2010 2011 2012 2013 2014 2015 2016 2017
Female 8,702 8,948 8,974 8,856 8,368 7,862 7,322 7,150 7,070 7,027
Male 5,880 6,161 5,911 5,608 5,606 5,595 5,264 5,162 4,860 4,763
Total 14,582 15,109 14,885 14,464 13,974 13,457 12,586 12,312 11,930 11,790
Race 2008 2009 2010 2011 2012 2013 2014 2015 2016 2017
Black 3,528 3,358 3,569 3,486 3,381 3,065 2,757 2,669 2,590 2,538
White 9,761 9,324 10,018 9,133 8,769 8,241 7,734 7,479 7,280 7,061
Other 1,293 2,427 1,298 1,845 1,797 2,151 2,095 2,164 2,060 2,191
Total 14,582 15,109 14,885 14,464 13,947 13,457 12,586 12,312 11,930 11,790
Residency 2008 2009 2010 2011 2012 2013 2014 2015 2016 2017
In-County 9,552 9,938 9,936 9,668 9,428 9,228 8,659 8,331 8,010 7,860
Out-of-County 4,575 4,720 4,539 4,451 4,219 3,829 3,441 3,543 3,412 3,444
Out-of-State/Foreign 455 451 410 345 327 400 486 438 508 486
Total 14,582 15,109 14,885 14,464 13,974 13,457 12,586 12,312 11,930 11,790
Headcount 2008 2009 2010 2011 2012 2013 2014 2015 2016 2017
Full-time 6,284 6,910 6,985 6,265 5,922 5,448 4,873 4,784 4,823 4,785
Part-time 8,298 8,199 7,900 8,199 8,052 8,009 7,713 7,528 7,107 7,005
Total 14,582 15,109 14,885 14,464 13,974 13,457 12,586 12,312 11,930 11,790
FTE's * 2008 2009 2010 2011 2012 2013 2014 2015 2016 2017
9,208.0 9,838.0 9,820.3 9,237.8 8,902.6 8,411.0 7,731.2 7,576.0 7,400.0 7,358.0
Ratio FTE/HC 2008 2009 2010 2011 2012 2013 2014 2015 2016 2017
0.63 0.65 0.66 0.64 0.64 0.63 0.61 0.62 0.62 0.62
Average Credits 2008 2009 2010 2011 2012 2013 2014 2015 2016 2017
9.47 9.77 9.90 9.58 9.56 9.38 9.21 9.23 9.30 9.36
Average Age 2008 2009 2010 2011 2012 2013 2014 2015 2016 2017
27 27 27 27 26.6 26 26 25 25 25
Degrees Awarded 2008 2009 2010 2011 2012 2013 2014 2015 2016 2017
Associate Degrees 965 1,050 1,194 1,223 1,157 1,210 1,214 1,374 1,236 1,336
Diplomas 233 226 290 246 207 111 95 81 74 62
Certif icates 1,259 1,255 1,475 1,355 1,029 933 1,002 961 730 686
Total 2,457 2,531 2,959 2,824 2,393 2,254 2,311 2,416 2,040 2,084

128 | Greenville Technical College
Chart 8 GREENVILLE TECHNICAL COLLEGE Student Fall Enrollment Demographics – Gender, Race, and Residency
Chart 8: Fall Enrollment Demographics – Gender, Race, and Residency
Gender
Race
Residency

2018 Comprehensive Annual Financial Report | 129
GREENVILLE TECHNICAL COLLEGE Chart 9 Ten Year Comparison – Student Headcount / FTE Chart 9: Ten Year Comparison – Student Headcount / F
TE
Chart 9: Ten Year Comparison – Student Headcount / FTE
-
2,000.00
4,000.00
6,000.00
8,000.00
10,000.00
12,000.00
14,000.00
16,000.00
Headcount FTE's

130 | Greenville Technical College
Chart 10 GREENVILLE TECHNICAL COLLEGE Distance Learning Enrollments
Chart 10: Distance Learning Enrollments
Note(s): Online enrollment includes GTC enrollments and students who were enrolled in online courses taught by other technical colleges.
In 2010, the names for each of the distance learning formats changed from prior editions of the CAFR to reflect the most current terminology.
Source: Greenville Technical College Office of Information Technology
Fall 2008 Fall 2009 Fall 2010 Fall 2011 Fall 2012 Fall 2013 Fall 2014 Fall 2015 Fall 2016 Fall 2017
Online 6,637 8,368 8,300 8,867 7,090 6,726 6,516 7,247 7,540 8,137
Teleclass 437 250 - - - - - - - -
Telecourse 49 41 55 - - - - - - -
7,123 8,659 8,355 8,867 7,090 6,726 6,516 7,247 7,540 8,137
0.00
1,000.00
2,000.00
3,000.00
4,000.00
5,000.00
6,000.00
7,000.00
8,000.00
9,000.00
Online Teleclass Telecourse

2018 Comprehensive Annual Financial Report | 131
GREENVILLE TECHNICAL COLLEGE Schedule 8 Economic Development and Corporate Training Division Statistics
Schedule 8: Continuing Education Division Statistics
Note: (*) Change in Ezone reporting requirements starting in 2017 (**) Preliminary numbers as of Sepember 2018 Source: Greenville Technical College Economic Development and Corporate Training for years 2017 - 2018.
Greenville Technical College Corporate and Career Development Division for years 2009 - 2016. Corporate and Career Development Division renamed to Economic Development and Corporate Training in June 2016
Audit Year 2009 2010 2011 2012 2013 2014 2015 2016 2017* 2018**
Contact Hours 589,058 574,942 501,869 432,461 434,518 365,057 406,025 449,138 313,762 304,863
Audit Year 2009 2010 2011 2012 2013 2014 2015 2016 2017* 2018**
Headcount 21,958 32,188 25,293 22,946 19,316 17,046 19,385 17,431 10,029 8,903
Audit Year 2009 2010 2011 2012 2013 2014 2015 2016 2017* 2018**
Program Funding CEUs 58,907 57,494 50,187 43,246 43,451 36,505 40,602 44,913 30,276 29,850
Continuing Education Programs
American Heart Association CPR
Asbestos Training
Audiometric Technician Training
Building Operator Certification
Central Sterile Processing Technician
Certified Production Technician
CNC Machine Operator
Defensive Driving
Dental Professionals Safety Techniques
Electrical Training
Emergency Response Training
Energy & Environmental Management
Floral Design
Forklift
Hazardous Materials / HAZWOPER
Healthy Homes
HIPAA Privacy Training
Human Resources
HVAC/R Certifications
Indoor Air Quality / Mold Remediation
Lead-Based Paint Safety
Leadership
Lean Six Sigma
Lean Training
Lifeguard Certification
Medical Coding
Medical Interpreter
Medical Physician Practice Clerk
Medical Scribe
Medical Terminology
Motorcycle Safety
National Medicare Training
NCCER Core Introductory to Craft Skills
Nurse Professional Development
Nurse Refresher and Re-licensure Program
Nursing Assistant
Ophthalmic Medical Assistant
OSHA Guidelines
OSHA Training and Safety
Phlebotomy
Photography
Project Management
Pulmonary Function Testing
Quality Standards, Tools & Methods
Real Estate
ServSafe Food Safety
Sleep Technician (Polysomnography)
Supply Chain (APICS)
Tax Return Professional Training
TESOL Certification
Wedding Planner
Welding Refresher
Writing and Illustrating Children's Books

132 | Greenville Technical College

2018 Comprehensive Annual Financial Report | 133
STATISTICAL SECTION:
Debt Capacity
A COMPONENT UNIT OF THE STATE OF SOUTH CAROLINA

134 | Greenville Technical College
GREENVILLE TECHNICAL COLLEGE Schedule 9 Ratios of Outstanding Debt
Schedule 9: Ratios of Outstanding Debt
Source: Greenville Technical College Audited Financial Statements for years indicated and Greenville Technical College Office of Institutional Effectiveness
Total Outstanding Debt 2009 2010 2011 2012 2013
Bonds Payable 21,955,000$ 20,840,000$ 19,680,000$ 24,545,000$ 23,423,802$
Notes Payable - - - - -
Capital Leases Payable 20,065,000 26,800,000 24,720,000 22,750,000 20,715,000
Total Outstanding Debt 42,020,000$ 47,640,000$ 44,400,000$ 47,295,000$ 44,138,802$
Outstanding debt per FTE 4,563 4,842 4,521 5,120 4,958
Full-time Equivalent Students 9,208 9,838 9,820 9,238 8,903
Total Outstanding Debt 2014 2015 2016 2017 2018
Bonds Payable 46,864,920$ 44,379,644$ 41,979,505$ 39,224,390$ 36,410,906$
Notes Payable - - - - -
Capital Leases Payable 18,620,000 16,600,000 14,290,000 11,915,000 9,480,000
Total Outstanding Debt 65,484,920$ 60,979,644$ 56,269,505$ 51,139,390$ 45,890,906$
Outstanding debt per FTE 7,786 7,250 7,427 6,911 6,237
Full-time Equivalent Students 8,411 7,731 7,576 7,400 7,358

2018 Comprehensive Annual Financial Report | 135
Schedule 10 GREENVILLE TECHNICAL COLLEGE Bond Coverage
Schedule 10: Bond Coverage
Note(s): Greenville County supports the operations of the college with annual appropriations to meet the annual debt service requirements of the college’s general obligation bonds. The State of South Carolina appropriates funds to assist with other debt service on the college’s certificate of participation that was issued to allow the college to acquire a portion of the McAlister Square Mall Complex. The state also appropriates capital funds to the college to assist with other projects including capital projects and maintenance projects. The college receives capital fees from students as part of their tuition and fee payment. These funds are used to service debt and provide funding for capital projects. These funds are listed above along with all
the long term debt obligations including capital leases payable.
Source: Greenville Technical College Finance Division and Ellucian Colleague
Fiscal Year
Ended June 30
Capital Fees
Revenue
County
Appropriations
State
Appropriations Principal Interest Fees Total
Capital Fees
Coverage Ratio
Total
Coverage
Ratio
2018 1,704,511$ 3,106,509$ 1,247,350$ 2,813,484$ 1,242,646$ -$ 4,056,130$ 0.42 1.49
2017 1,799,918$ 2,951,802$ 6,369,531$ 2,755,115$ 1,315,270$ -$ 4,070,385$ 0.44 2.73
2016 1,961,977$ 2,935,264$ 1,094,390$ 2,645,139$ 1,397,955$ -$ 4,043,094$ 0.49 1.48
2015 2,068,244$ 2,781,050$ 594,390$ 2,515,276$ 1,548,238$ -$ 4,063,514$ 0.51 1.34
2014 2,205,890$ 2,693,048$ 1,245,739$ 1,558,882$ 729,948$ -$ 2,288,830$ 0.96 2.68
2013 2,226,125$ 2,628,846$ 1,731,185$ 1,425,000$ 880,661$ -$ 2,305,661$ 0.97 2.86
2012 2,533,857$ 2,578,403$ 1,742,744$ 1,200,000$ 940,740$ -$ 2,140,740$ 1.18 3.20
2011 2,652,875$ 2,586,478$ 614,729$ 1,160,000$ 847,707$ 500$ 2,008,207$ 1.32 2.92
2010 2,703,379$ 2,454,664$ 824,512$ 1,115,000$ 890,850$ 1,254$ 2,007,104$ 1.35 2.98
2009 2,410,430$ 2,437,878$ 936,200$ 1,080,000$ 930,434$ 2,031$ 2,012,465$ 1.20 2.87
Debt Service Requirements

136 | Greenville Technical College

2018 Comprehensive Annual Financial Report | 137
STATISTICAL SECTION:
Demographic & Economic Information
A COMPONENT UNIT OF THE STATE OF SOUTH CAROLINA

138 | Greenville Technical College
Schedule 11 GREENVILLE TECHNICAL COLLEGE Economic Indicators for Service Area
Schedule 11: Economic Indicators for Service Area Source(s): U.S. Department of Commerce, Bureau of Economic Analysis; U.S. Department of Commerce, Census Bureau; U.S.
Department of Labor, Bureau of Labor Statistics; Greenville Area Development Corporation
Note(s): * Population estimate as of July 1, 2017 provided by the US Census Bureau. Economic indicators from prior years have
updated to reflect the most current figures.
Total Personal Income 2008 2009 2010 2011 2012
Greenville 16,138,158 15,288,231 15,913,386 17,014,659 18,341,108
South Carolina 148,898,634 145,201,638 149,093,360 157,952,965 157,952,965
United States 12,492,705,000 12,079,444,000 12,459,613,000 13,233,436,000 13,233,436,000
2013 2014 2015 2016 2017
Greenville 18,591,809 20,054,720 21,427,856 22,094,260 N/A
South Carolina 168,267,898 178,719,703 189,836,135 196,049,325 203,087,627
United States 14,068,960,000 14,811,388,000 15,547,661,000 15,912,777,000 16,413,550,863
Per Capita Personal Income 2008 2009 2010 2011 2012
Greenville 36,783 34,228 35,144 37,061 39,322
South Carolina 32,877 31,635 32,161 33,803 35,261
United States 41,082 39,376 40,278 42,463 44,283
2013 2014 2015 2016 2017
Greenville 39,269 41,637 43,671 44,298 N/A
South Carolina 35,307 37,042 38,802 39,527 40,421
United States 44,489 46,486 48,429 49,204 50,392
Population of Service Area 2008 2009 2010 2011 2012
Greenville County 438,742 446,655 452,803 459,101 466,431
2013 2014 2015 2016 2017
Greenville County 473,442 481,657 490,661 498,766 506,837*
Unemployment 2008 2009 2010 2011 2012
Greenville County 5.5% 9.8% 9.6% 8.6% 7.4%
South Carolina 6.8% 11.2% 11.2% 10.6% 9.2%
United States 5.8% 9.3% 9.6% 8.9% 8.1%
2013 2014 2015 2016 2017
Greenville County 6.1% 5.3% 4.9% 4.2% 3.7%
South Carolina 7.6% 6.5% 6.0% 5.0% 4.3%
United States 7.4% 6.2% 5.3% 4.9% 4.4%
Announced Job Creation 2008 2009 2010 2011 2012
Greenville County 1,556 909 2,083 3,092 1,454
2013 2014 2015 2016 2017
Greenville County 1,001 1,317 2,118 2,693 1,789

2018 Comprehensive Annual Financial Report | 139
GREENVILLE TECHNICAL COLLEGE Schedule 12 Principal Employers in Service Area
Schedule 12: Principal Employers in Service Area
Source: Current Top 10 Rankings reported by EZ Select and the Greenville Area Development Corporation. Greenville County Total Employment
reported through June 2018 by the South Carolina Department of Employment and Workforce. Historic Top 10 Rankings provided by the Greenville Area Development Corporation and Greenville County Total Employment provided by the South Carolina Employment Security Commission.
Company Name Employment
Percent of Total
County Employment
Greenville Health Systems15,055
6.23%
Greenville County School District11,000
4.55%
Michelin North America Inc5,700
2.36%
Bon Secours St. Francis Health System4,355
1.80%
GE Power & Water3,400
1.41%
Fluor Corporation2,555
1.06%
State of South Carolina2,552
1.06%
Greenville County Government2,104
0.87%
US Government1,758
0.73%
Synnex Corporation1,700
0.70%
Top 10 Total Employment 50,179 20.77%
Greenville County Total Employment 241,607 100.00%
2018
Company Name Employment
Percent of Total
County Employment
School District of Greenville County9,138
3.92%
Greenville Hospital System7,207
3.09%
Michelin North America Inc4,000
1.72%
General Electric Co.3,100
1.33%
Fluor Corporation2,700
1.16%
SC State Government2,524
1.08%
Bon Secours St. Francis Health System2,400
1.03%
Bob Jones University1,795
0.77%
Greenville County Government1,627
0.70%
Sealed Air Corp - Cryovac Division1,400
0.60%
Top 10 Total Employment 35,891 15.40%
Greenville County Total Employment 226,210 97.04%
2009

140 | Greenville Technical College

2018 Comprehensive Annual Financial Report | 141
STATISTICAL SECTION:
Operating Information
A COMPONENT UNIT OF THE STATE OF SOUTH CAROLINA

142 | Greenville Technical College
GREENVILLE TECHNICAL COLLEGE Schedule 13 Faculty and Staff Statistics
Schedule 13: Faculty and Staff Statistics
Source(s): Greenville Technical College Office of Quality and Planning & South Carolina Commission on Higher Education
Faculty 2008 2009 2010 2011 2012 2013 2014 2015 2016 2017
Full-Time 330 330 347 337 349 347 346 336 324 329
Part-Time 480 441 445 457 434 431 402 486 483 490
Total Faculty 810 771 792 794 783 778 748 822 807 819
Staff 2008 2009 2010 2011 2012 2013 2014 2015 2016 2017
Full-Time 336 333 343 353 352 376 394 387 382 363
Part-Time 285 308 312 300 311 311 269 226 198 232
Total Staff 621 641 655 653 663 687 663 613 580 595
Combined 2008 2009 2010 2011 2012 2013 2014 2015 2016 2017
Full-Time 666 663 690 690 701 723 740 723 706 692
Part-Time 765 749 757 757 745 742 671 712 681 722
Total Employees 1,431 1,412 1,447 1,447 1,446 1,465 1,411 1,435 1,387 1,414
Average Annual Faculty Salary 2008 2009 2010 2011 2012 2013 2014 2015 2016 2017
45,493 45,258 45,812 46,145 48,012 47,421 63,523 47,195 48,072 47,696

2018 Comprehensive Annual Financial Report | 143
Schedule 14 GREENVILLE TECHNICAL COLLEGE Space Utilization
Schedule 14: Space Utilization
Source: Greenville Technical College CHEMIS reports for years presented and Greenville Technical College Campus Police.
Instruction 2008 2009 2010 2011 2012 2013 2014 2015 2016 2017
Assignable Square Feet 651,727 652,447 731,684 731,684 733,590 732,521 733,483 741,364 742,002 740,070
Percentage of Total 83.0% 83.3% 81.7% 80.2% 81.3% 81.2% 81.3% 81.5% 81.6% 81.5%
Public Service 2008 2009 2010 2011 2012 2013 2014 2015 2016 2017
Assignable Square Feet 3,090 3,090 12,668 12,668 12,668 12,668 12,668 12,668 12,668 12,668
Percentage of Total 0.4% 0.4% 1.4% 1.4% 1.4% 1.4% 1.4% 1.4% 1.4% 1.4%
Academic Support 2008 2009 2010 2011 2012 2013 2014 2015 2016 2017
Assignable Square Feet 33,003 33,003 29,811 30,436 30,387 30,387 30,171 30,171 30,171 30,171
Percentage of Total 4.2% 4.2% 3.3% 3.3% 3.4% 3.4% 3.3% 3.3% 3.3% 3.3%
Student Services 2008 2009 2010 2011 2012 2013 2014 2015 2016 2017
Assignable Square Feet 31,908 31,908 26,761 27,335 27,335 27,335 27,408 27,144 27,628 27,628
Percentage of Total 4.1% 4.1% 3.0% 3.0% 3.0% 3.0% 3.0% 3.0% 3.0% 3.0%
Institutional Support 2008 2009 2010 2011 2012 2013 2014 2015 2016 2017
Assignable Square Feet 24,420 21,749 26,631 27,251 31,225 31,460 31,064 31,064 29,970 29,970
Percentage of Total 3.1% 2.8% 3.0% 3.0% 3.5% 3.5% 3.4% 3.4% 3.3% 3.3%
Plant Operations and
Maintenance 2008 2009 2010 2011 2012 2013 2014 2015 2016 2017
Assignable Square Feet 14,291 14,291 7,145 7,115 7,115 7,115 7,115 6,977 6,977 6,977
Percentage of Total 1.8% 1.8% 0.8% 0.8% 0.8% 0.8% 0.8% 0.8% 0.8% 0.8%
Auxiliary Enterprises 2008 2009 2010 2011 2012 2013 2014 2015 2016 2017
Assignable Square Feet 11,556 11,556 3,108 3,108 3,108 3,108 3,108 3,108 3,108 3,108
Percentage of Total 1.5% 1.5% 0.3% 0.3% 0.3% 0.3% 0.3% 0.3% 0.3% 0.3%
Independent Operations 2008 2009 2010 2011 2012 2013 2014 2015 2016 2017
Assignable Square Feet 12,081 12,081 57,243 56,993 56,993 56,993 56,993 56,993 56,624 56,624
Percentage of Total 1.5% 1.5% 6.4% 6.2% 6.3% 6.3% 6.3% 6.3% 6.2% 6.2%
Unassigned 2008 2009 2010 2011 2012 2013 2014 2015 2016 2017
Unassigned Square Feet 2,771 2,771 376 376 376 376 376 376 376 376
Percentage of Total 0.4% 0.4% 0.0% 0.0% 0.0% 0.0% 0.0% 0.0% 0.0% 0.0%
Total Square Footage 2008 2009 2010 2011 2012 2013 2014 2015 2016 2017
Total Square Feet 784,847 782,896 895,427 912,559 902,797 901,963 902,386 909,865 909,524 907,592
Parking Facilities 2008 2009 2010 2011 2012 2013 2014 2015 2016 2017
Parking Spaces Available 6,194 6,505 6,418 6,600 6,600 6,495 6,495 6,482 6,482 6,776
Number of Employees 1,431 1,412 1,447 1,447 1,446 1,465 1,411 1,435 1,387 1,414
Number of Students 14,582 15,109 14,885 14,464 13,947 13,457 12,586 12,312 11,930 11,790

144 | Greenville Technical College

2018 Comprehensive Annual Financial Report | 145
STATISTICAL SECTION:
Other Information
A COMPONENT UNIT OF THE STATE OF SOUTH CAROLINA

146 | Greenville Technical College
Schedule 15 GREENVILLE TECHNICAL COLLEGE Instructional Programs
Schedule 15: Instructional Programs
Associates Degrees
Local Code Program Title Program Code
Arts and Science
45600 Associate in Arts AA.ART
45600 Associate in Arts-Art Education AA.ART.EDUC
45600 Associate in Arts-Fine Arts AA.ART.FINE
45600 Associate in Arts-Graphic Design AA.ART.GRAP
45600 Associate in Arts-Photography AA.ART.PHOTO
45600 Associate in Arts-Theatre AA.ART.THE
45600 Associate in Arts-Web Site Design AA.ART.WEBD
55600 Associate in Science AS.SCI
55600 Associate in Science-Chemical Engineering AS.SCI.CHEM
55600 Associate in Science-Civil Engineering AS.SCI.CIVL
55600 Associate in Science-Computer Engineering AS.SCI.COMP
55600 Associate in Science-Electrical Engineering AS.SCI.EENG
55600 Associate in Science-Mechanical Engineering AS.SCI.METT
35505 Criminal Justice Technology AAS.CRJ
35508 Early Care and Education AAS.ECE
35501 Human Services AAS.HUS
35520 Paralegal AAS.LEG
35520 Paralegal-Advanced Placement AAS.LEG.APLA
Health and Wellness
35017 Culinary Arts Technology AAS.CUL
35203 Dental Hygiene AAS.DHG
35218 Diagnostic Medical Sonography AAS.DMS
35299 Emergency Medical Technology AAS.EMT
35502 Fire Science Technology AAS.FST
35213 Health Information Management AAS.HIM
35205 Medical Laboratory Technology AAS.MLT
35208 Nursing AAS.NUR
35221 Occupational Therapy Assistant AAS.OTA
35219 Physical Therapist Assistant AAS.PTA
35207 Radiologic Technology AAS.RAD
35215 Respiratory Care AAS.RES
Business and Technology
35002 Accounting AAS.ACC
35007 Administrative Office Technology AAS.AOT
35007 Administrative Office Technology-Medical AAS.AOT.MED
35302 Aircraft Maintenance Technology AAS.AMT
35304 Architectural Engineering Technology AAS.AET
35376 Auto Body Repair AAS.ABR
35306 Automotive Technology AAS.AUT
35373 Computer Numerical Control (CNC) Programming and Operations AAS.CNC
35104 Computer Technology AAS.CPT
35308 Construction Engineering Technology AAS.CET
35308 Construction Engineering Technology-Const. Science Mgt. AAS.CET.CSM
35310 Electronics Engineering Technology AAS.EET
35307 Engineering Design Technology AAS.EDT
Continued on Next Page

2018 Comprehensive Annual Financial Report | 147
GREENVILLE TECHNICAL COLLEGE Schedule 15 Instructional Programs (continued)
Continued on Next Page
Associates Degrees (continued)
Local Code Program Title Program Code
Business and Technology (continued)
35318 General Technology AAS.GTE
35370 Machine Tool Technology AAS.MTT
35030 Management AAS.MGT
35004 Marketing AAS.MKT
35315 Mechanical Engineering Technology AAS.MET
35371 Mechatronics Technology AAS.MEC
35006 Supply Chain Management AAS.SCM
Certificates
Local Code Program Title Program Code
Arts and Science
70867 Fine Arts CA.FAR7
70551 Child Care Management CAS.CCM7
70237 Early Childhood Development CAS.ECD7
71053 Early Childhood Special Education CAS.ECSE7
70868 Graphic Design CA.GRD7
70871 Photography CA.PHO7
70986 Web Site Design CA.WSD7
Health and Wellness
70917 Baking and Pastry Arts CAS.BPA7
71323 Cancer Data Management CAS.CDM7
60618 Computed Tomography CAS.CTO6
60551 Culinary Education CAS.CED7
61073 Emergency Medical Technician CAS.EMT7
60902 Esthetics CAS.ESTH6
70969 Fire Service Technology CAS.FST7
70543 Magnetic Resonance Imaging CAS.MRI7
60575 Massage Therapy CAS.MT6
60634 Patient Care Technician CAS.PCT6
70870 Personal Trainer CAS.PT7
71143 Pharmacy Technician CAS.PHAR7
60858 Professional Grooming and Animal Care CAS.SAC6
60951 Sterile Processing CAS.SP6
71309 Sustainable Agriculture CAS.SAG7
70963 Veterinary Assistant CAS.VET7
Business and Technology
60865 3-D Modeling CAD Design CAS.CCD6
61041 Advanced CNC Programmer CAS.ACNC6
70330 Air Conditioning/Refrigeration Technician CAS.ACR7
70475 Auto Body Repair CAS.ABR7
71347 Automotive Medium & Light Repair CAS.AMLR7
70892 Aviation Airframe Structure/Systems CAS.AAS7
60789 Aviation Fundamentals CAS.AVF6
70893 Aviation Pow erplant Theory/Systems CAS.APT7

148 | Greenville Technical College
Schedule 15 GREENVILLE TECHNICAL COLLEGE (continued) Instructional Programs
Source: Greenville Technical College Office of Academic Compliance and Review
Certificates (continued)
Local Code Program Title Program Code
Business and Technology (continued)
71279 Avionics Maintenance Technology CAS.AVIO7
60489 Basic Machine Operations CAS.BMO6
60308 Beginning Electricity & Refrigeration CAS.BER6
70176 Building Construction Technology CAS.CAR7
60832 Cisco Routing/Netw ork Configuration CAS.CRN6
60019 CNC Machine Operator CAS.CN6
60201 CNC Programmer CAS.CNC7
61068 Diesel Engine Performance CAS.DEP6
70476 Diesel Equipment Technology CAS.DEM7
60511 Drafting & CAD Design Fundamentals CAS.DCF6
61125 Enterprise Resource Planning CAS.ERP6
71286 Heavy Equipment Auxiliary Systems CAS.HEAS7
71285 Heavy Equipment Chassis Systems CAS.HECS7
71011 Human Resource Management CAS.HUM7
70151 Industrial Electricity CAS.ELT7
60766 Marketing Communications CAS.MKC7
60970 Marketing in the Non-Profit Sector CAS.MNPS6
71003 Masonry CAS.MSY6
71126 Mechatronics I CAS.MECA7
71142 Mechatronics II CAS.MECB7
70356 Medical Clerical CAS.MC7
70957 Microsoft Netw ork Technician CAS.MNA7
60856 Motorsports Performance Engines CAS.MSP6
60767 Physician Practice Specialist CAS.PPS6
60901 Plumbing CAS.PLB6
61040 Production Technology Associate I CAS.PTCA6
60857 Race Chassis Building & Setup CAS.RCB6
60555 Robotic Welding Fundamentals CAS.WF7
60574 Small Business Accounting CAS.SBA6
70873 Small Business Management/Entrepreneurship CAS.SBE7
71221 Solar Technician CAS.SOL7
60091 Specialized Welding CAS.SWL6
60005 Truck Driver Training CAS.TDR6
70113 Welding CAS.WLD7
Diplomas
Local Code Program Title Program Code
Health and Wellness
15202 Expanded Duty Dental Assisting DAS.EDD1
15203 Pharmacy Technician DAS.PHM1
15211 Surgical Technology DAS.SUR1
15006 Cosmetology DAS.COS1
Business and Technology
15390 Air Conditioning/Refrigeration Technology DAS.ACR1
15392 Building Construction Technology DAS.CAR1

2018 Comprehensive Annual Financial Report | 149
GREENVILLE TECHNICAL COLLEGE Schedule 16 College Accreditation and Non-Discrimination Policy
Schedule 16: College Accreditation and Non-Discrimination Policy
Greenville Technical College is accredited by the Southern Association of Colleges and Schools Commission on Colleges (1866 Southern Lane, Decatur, Georgia 30033-4097; telephone number (404) 679-4500) to award associate degrees, diplomas and certificates. Greenville Technical College was first accredited by SACSCOC in 1968. GTC received decennial accreditation from SACSCOC in 2013, reaffirming the college’s accreditation through 2023. GTC will submit a Fifth-Year Interim Report in 2018.
Program Accrediting Agencies
Engineering Technology Accreditation Commission of ABET 415 North Charles Street Baltimore, MD 21202 (410) 347-7700
Commission on Accreditation in Physical Therapy Education APTA Headquarters Accreditation Department 1111 North Fairfax Street Alexandria, VA 22314 (703) 706-3241
Accreditation Commission for Education in Nursing, Inc. 3343 Peachtree Road, NE, Suite 850 Atlanta, GA 30326 (404) 975-5000 www.acenursing.org
Commission on Accreditation of Allied Health Education Programs (CAAHEP) 25400 U.S. Highway 19 North, Suite 158 Clearwater, FL 33763 (727) 210-2350 Fax: (727) 210-2354 www.caahep.org
Accreditation Council for Occupational Therapy Education c/o Accreditation Department American Occupational Therapy Association 4720 Montgomery Lane, Suite 200 Bethesda, MD 20814-3449 (301) 652-2862
Committee on Accreditation for Respiratory Care (CoARC) 1248 Harwood Road Bedford, TX 76201-4244 (817) 283-2835 www.coarc.com
Accreditation Review Committee on Education in Surgical Technology 6 West Dry Creek Circle, Suite 110 Littleton, CO 80120 (303) 694-9262 Fax: (303) 741-3655
Committee on Accreditation of Educational Programs for the EMS Professions (CoAEMSP) 8301 Lakeview Parkway, Suites 111-312 Rowlett, TX 75088 (214) 703-8445
American Bar Association Standing Committee on Paralegals Approval Commission 321 N. Clarks Street Chicago, IL 60654-7598 (800) 285-2221
Commission on Dental Accreditation American Dental Association 211 East Chicago Avenue Chicago, IL 60611-2678 (312) 440-4653
American Culinary Federation Education Foundation, Inc. Accrediting Commission 180 Center Place Way St. Augustine, FL 32095 (800) 624-9458
Federal Aviation Administration Flight Standards District Office FAA/FSD0-13 125B Summer Lake Drive West Columbia, SC 29170 (803) 765-5931
American Society of Health System Pharmacists Accreditation Services Division 7272 Wisconsin Avenue Bethesda, MD 20814 (301) 657-3000
HVAC Excellence PO Box 491 Mount Prospect, IL 60056 (800) 394-5268
Accreditation Council for Business Schools & Programs (ACBSP) 11520 West 119th Street Overland Park, KS 66213 (913) 339-9356
Joint Review Committee on Education in Diagnostic Medical Sonography 6021 University Blvd., Suite 500 Elliot City, MD 21043 (443) 973-3251
Commission on Accreditation for Health Informatics and Information Management Education (CAHIIM) Accreditation Services c/o AHIMA 233 N. Michigan Avenue, Suite 2150 Chicago, IL 60601-5800 (312) 233-1100
Joint Review Committee on Education in Radiologic Technology 20 North Wacker Avenue, Suite 2850 Chicago, IL 60606-3182 (312) 704-5300

150 | Greenville Technical College
Schedule 16 GREENVILLE TECHNICAL COLLEGE (continued) College Accreditation and Non-Discrimination Policy
Program Accrediting Agencies (continued)
National Accrediting Agency for Clinical Laboratory Sciences 5600 N. River Road, Suite 720 Rosemont, IL 60018 (773) 714-8880
National Center for Construction Education and Research (NCCER) 13614 Progress Blvd. Alachua, FL 32615 (386) 518-6500
National Association for the Education of Young Children (NAEYC) 1313 L Street, Suite 500 NW Washington, DC 20005-4101 (202) 232-8777 (800) 424-2460
South Carolina Department of Health and Human Services Nurse Aide Training Program (NATP) PO Box 8206 Columbia SC 29202 (803) 315-1366
National Automotive Technicians’ Educational Foundation (NATEF) 101 Blue Seal Drive SE, Suite 101 Leesburg, VA 20175 (703) 669-6650
South Carolina Department of Labor, Licensing and Regulation South Carolina Board of Cosmetology Synergy Business Park; Kingstree Building 110 Centerview Drive Columbia, SC 29210 (803) 896-4300
National Board for Certification in Occupational Therapy 12 South Summit Avenue, Suite 100 Gaithersburg, MD 20877 (301) 990-7979
South Carolina Department of Labor, Licensing and Regulation Board of Nursing Kingstree Building, Suite 202 110 Centerview Drive Columbia, SC 29211-1329 (803) 896-4550
National Cancer Registrars Association Formal Education Review Committee 1330 Braddock Place, Suite 520 Alexandria, VA 22314
South Carolina Department of Public Safety Driver Improvement Division - DMV P.O. Box 1498 Columbia, SC 29216
Source: Greenville Technical College 2017-2018 Catalog and Student Handbook
Non-Discrimination Policy: Greenville Technical College provides equal opportunity and affirmative action in education and employment for all qualified persons regardless of race, color, religion, sex, national origin, age, disability, sexual orientation, or veteran status. The college complies with the provisions of Titles VI and VII of the Civil Rights Act of 1964, as amended; Title IX of the Education Amendments of 1972 and the Higher Education Amendments of 1986; Sections 503 and 504 of the Rehabilitation Act of 1973, as amended; the South Carolina Human Affairs Law of 1972; and with the Americans with Disabilities Act (ADA) of 1990 as well as the ADA Amendments of 2008 (ADAA). For additional information on nondiscrimination policies, students should contact Sharon Bellwood, Student Disability Services director, who also coordinates Title II of the ADA/ADAA, Section 504. She may be reached at (864) 250-8408 v/TTY or via email at [email protected]. For additional information about Title IX policies, students contact Michael Chasteen at (864) 250-8144.

2018 Comprehensive Annual Financial Report | 151
Single Audit Section
A COMPONENT UNIT OF THE STATE OF SOUTH CAROLINA

152 | Greenville Technical College

2018 Comprehensive Annual Financial Report | 153
Independent Auditors' Report on Internal Control Ov
er Financial Reporting And On Compliance and Other Matters Based On An Audit Of Financial Statements Performed In Accordance With Government Auditing Standards

154 | Greenville Technical College

2018 Comprehensive Annual Financial Report | 155
Independent Auditors' Report On Compliance For Each Major Program And On Internal Control over Compliance Required by the Uniform Guidance

156 | Greenville Technical College
2018 Comprehensive Annual Financial Report | 157

GREENVILLE TECHNICAL COLLEGE Schedule of Expenditures of Federal Awards
For the Year Ended June 30, 2018
158 | Greenville Technical College
Schedule of Expenditures of Federal Awards for the Year Ended June 30, 2018
Schedule of Expenditures of Federal Awards for the Year Ended June 30, 2017
Federal or
Federal Pass-Through Deferred Accrued Deferred
DIRECT FEDERAL GRANTOR Program CFDA Grantor's Rev enues Rev enue Total Rev enues
Pass-Through Grantor/Program Title Period Number Number 6/30/2017 Federal Ex pended 6/30/2018
U.S. DEPARTMENT OF EDUCATION
STUDENT FINANCIAL ASSISTANCE CLUSTER
Federal Pell Grant Program 14-15 84.063 N/A (60) (60)
Federal Pell Grant Program 16-17 84.063 N/A 185,691 185,691
Federal Pell Grant Program 17-18 84.063 N/A 19,938,186 19,938,186
Federal Work-Study Program 17-18 84.033 N/A 176,726 176,726
Federal Supplemental Education Opportunity Grant 16-17 84.007 N/A 67,807 67,807
Federal Supplemental Education Opportunity Grant 17-18 84.007 N/A 468,112 468,112
Federal Direct Student Loans 15-16 84.268 N/A (1,288) (1,288)
Federal Direct Student Loans 16-17 84.268 N/A 236,212 236,212
Federal Direct Student Loans 17-18 84.268 N/A 20,213,642 20,213,642
Total Student Financial Assistance Cluster 41,285,028 41,285,028
TRIO CLUSTER
Trio_Student Support Serv ices 17-18 84.042 N/A 391,568 391,568
Trio_Upw ard Bound 17-18 84.047 N/A 236,072 236,072
Total TRIO Cluster 627,640 627,640
Passed through State Department of Education
Career and Technical Education - Basic Grants to States 16-17 84.048 17VA407 12,021 12,021
Career and Technical Education - Basic Grants to States 17-18 84.048 18VA407 573,581 573,581
Passed through State Department of Social Serv ices
Child Care and Dev elopment Block Grant 17-18 93.575 18 TE 407 611,419 611,419
Social Serv ices Block Grant 17-18 93.667 18 TE 407 174,164 174,164
Total U.S. Department of Education 43,283,853 43,283,853
U.S. DEPARTMENT OF LABOR
Passed Through South Carolina Technical College Sy stem
WIA / WIOA Adult Program 17-18 17.258 14,707 14,707
H-1B Job Training Grants 17-18 17.268 192,947 192,947
Total U.S. Department of Labor 207,654 207,654
APPALACHIAN REGIONAL COMMISSION
Passed Through South Carolina Technical College Sy stem
Appalachian Research, Technical Assistance, and 17-18 23.011 SC-18423-16 32,928 32,928
Demonstration Projects
Total Appalachian Regional Commission 32,928 32,928
U.S. DEPARTMENT OF AGRICULTURE
Passed Through SC Department of Social Serv ices
Child and Adult Care Food Program 17-18 10.558 5SC300329 14,014 14,014
Total U.S. Department of Agriculture 14,014 14,014
Continued on Next Page

GREENVILLE TECHNICAL COLLEGE Schedule of Expenditures of Federal Awards
For the Year Ended June 30, 2018
2018 Comprehensive Annual Financial Report | 159
(continued)
Federal or
Federal Pass-Through Deferred Accrued Deferred
DIRECT FEDERAL GRANTOR Program CFDA Grantor's Rev enues Rev enue Total Rev enues
Pass-Through Grantor/Program Title Period Number Number 6/30/2017 Federal Ex pended 6/30/2018
NATIONAL SCIENCE FOUNDATION
RESEARCH AND DEVELOPMENT CLUSTER
Passed Through Clemson Univ ersity
Education and Human Resources 17-18 47.076 1861-206-2010539 96,726 96,726
Total Research and Dev elopment Cluster 96,726 96,726
Total National Science Foundation 96,726 96,726
U.S. DEPARTMENT OF VETERAN AFFAIRS
Post - 9/11 Veterans Educational Assistance 17-18 64.028 1,604,593 1,604,593
Total U.S. Department of Veteran Affairs 1,604,593 1,604,593
TOTAL FEDERAL AWARDS 45,239,768 45,239,768

GREENVILLE TECHNICAL COLLEGE Notes to Schedule of Expenditures of Federal Awards
For the Year Ended June 30, 2018
160 | Greenville Technical College
Notes to Schedule of Expenditures of Federal Awards for the Year Ended June 30, 2018
1. GENERAL
The accompanying Schedule of Expenditures of Federal Awards presents the activity of all federal awards of Greenville Technical College. The reporting entity is defined in Note 1 of the college's financial statements. The information in the schedule is presented in accordance with the requirements of Title 2 U.S. Code of Federal Regulations Part 200, Uniform Administrative Requirements, Cost Principles, and Audit Requirements for Federal Awards (Uniform Guidance).
2. BASIS OF ACCOUNTING
The accompanying Schedule of Expenditures of Federal Awards is presented using the accrual basis of accounting, which is described in Note 1 of the college's financial statements. Greenville Technical College elected not to use the 10-percent de minimis cost rate as allowed under the Uniform Guidance.
3. FEDERAL LOAN PROGRAMS
The college has students who have approved loans which were received by those students during the current year. The college is not the lender, it only processes them for the lender the student chooses. The totals and types of loans received for the current fiscal year are:
Plus Loans $ 643,016
Stafford / Federal Direct Loans - Subsidized 8,323,244
Stafford / Federal Direct Loans - Unsubsidized 11,482,306
$ 20,448,566

2018 Comprehensive Annual Financial Report | 161
Summary Schedule of Prior Audit Findings

162 | Greenville Technical College
Schedule of Findings and Questioned Costs

2018 Comprehensive Annual Financial Report | 163