‘green’ solventless infrared oil and grease...
TRANSCRIPT

1
‘Green’ Solventless InfraredOil and Grease Method
Orono Spectral Solutions
Tyler Martin, Ph. D. Dean SmithSenior Research Engineer VP for Engineering
Tom Schwarz Eric Roy, Ph. D.Research Technician Research Scientist
Presentation at ASTM – D19.06June 2009
Email: [email protected]: www.ossmaine.com
ACS Green Chemistry – June 2009

2
Oil and Grease Method Evolution
EPA 413.2 (Freon Extraction - Infrared)
‘dirty’ water
Freon extract
Extract in
Cuvette
Cuvette in Spectrometer
0
.1
.2
.3
.4
.5
.6
.7
3050 3000 2950 2900 2850 2800 2750
Abso
rban
ce (a
.u.)
Wavenumber (cm-1)
Peak height corresponds to hydrocarbon concentration
LLE

3
Oil and Grease Method Evolution
EPA 1664
‘dirty’ water
Hexane extract
Extract in
drying pan
Evaporate Hexane
Mass corresponds to
concentration of extractables
LLE
n-Hexane use introduces four issues:
1. Flammable solvent (flammables hood required)
2. Known neurotoxin
3. Analytical time increased significantly
4. Large amount of solvent for disposal to atmosphere or hazardous waste
Total Hexane Usage:~ 1+ Million Liters/year

4
Oil and Grease Method Evolution
EPA 1664A
‘dirty’ water
Hexane extract
Extract in
drying pan
Evaporate Hexane
Mass corresponds to
concentration of extractables
LLE SPE
Extract in
drying pan
1. Sample run through SPE disk
2. Disk Extracted with Hexane
Evaporate Hexane

5
Oil and Grease Method Evolution
New OSS Method: ASTM WK 23240 – Standard Test Method for Solvent-Free Membrane Recoverable Oil and Grease by Infrared Determination
0
.1
.2
.3
.4
.5
.6
.7
3050 3000 2950 2900 2850 2800 2750
Abso
rban
ce (a
.u.)
Wavenumber (cm-1)
Peak height corresponds to
hydrocarbon concentration
Sample run throughnew IR-amenable
oil and grease Extractor
created by OSS
Extractor placed in spectrometer

6
Method
Real Sample-acidified-cooled
Shake Vigorously,may use
mechanical shake(1-20 minutes)
Fill Sterile Disposable Syringe
7
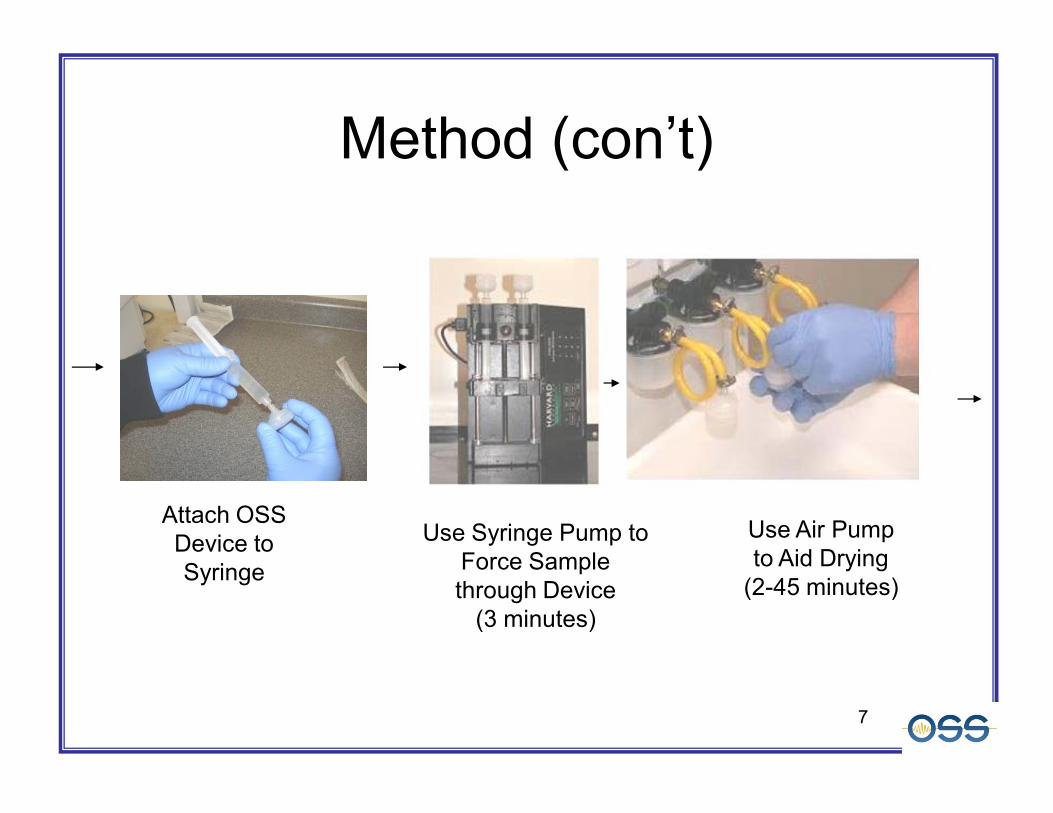
Method (con’t)
Attach OSS Device to Syringe
Use Syringe Pump to Force Sample through Device
(3 minutes)
Use Air Pump to Aid Drying
(2-45 minutes)

8
Method (con’t)
Examine with IR Spectrometer(1 minute)
Process Spectrum with Software…
(instantaneous - 1 minute)
…To Determine Oil and Grease Content = 101 mg/L
0
.1
.2
.3
.4
.5
.6
.7
3050 3000 2950 2900 2850 2800 2750
Abso
rban
ce (a
.u.)
Wavenumber (cm-1)

9
Calibration of InstrumentCalibration of infrared instrumentation performed with ‘Standard Devices’, which contain a known amount of material

10
MatricesTested During Development
Set 1 Set 2 Set 3 Set 4Gulf A Stormwater Runoff Cleaning Co. POTW
Gulf B Food Processor A Bakery DairyFood Processor Food Processor B Prison Fish Processor
Prison Food Processor C Hospital A Auto SalvagePOTW - Primary
EffluentPOTW - Primary
Effluent Hospital B Auto Garage
Paper Mill Prison Hospital C Machinist
Paper Mill Hospital D Gunsmith
Hospital E
GunsmithStormwater Runoff
(Tested by OSS, compared to 1664A, LLE and/or SPE)

11
Comparison to 1664A
Line represents the 1:1 correlation line between the two methods; Not a best fit line
(OSS method tested by OSS, 1664A tested at independent lab)

12
New Method Detection Limit (IR)OSS
Operator 1OSS
Operator 2Independent Lab
Operator 1Independent Lab
Operator 2
Recovery 101% 97% 89% 110%
MDL 1.4 mg/L 1.4 mg/L 1.6 mg/L 1.3 mg/L
ML5 mg/L
(4.6 mg/L)5 mg/L
(4.4 mg/L)6 mg/L
(5.1 mg/L)5 mg/L
(4.1 mg/L)
Testing performed on oil and grease in reagent water(50% hexadecane, 50% stearic acid)

13
Single Lab Validation• Recently Completed Single Lab Validation• Performed at independent lab• Two key purposes
– Method Comparability– Single Lab QC Parameters
• Compared Results of New Method to 1664• Balloting soon for an ASTM Single-Lab
Validated Method

14
Single Lab Validation -Preliminary Data
Measured Result in mg/L for Real-World Matrices
Replicate # Publicly Owned Treatment Works Gunsmith
1 31.3 76.12 29.2 73.33 24.7 75.34 30.7 78.35 34.1 74.56 29.7 91.27 27.4 89.4
Average Recovery (mg/L) 29.6 79.7Average Recovery by EPA 1664 (mg/L) 32.2 78.9
Average Recovery as % of EPA 1664 92% 101%Standard Deviation (mg/L) 3.0 7.4Relative Standard Deviation as % 10% 9.3%Matrix Spike Recovery % 102% 69%

15
Single Lab Validation -Preliminary Data
* Below recommended reporting limit** Below MDL
Measured Result mg/L as Oil and Grease
Replicate # Auto Garage Dairy Machine
ShopAuto Salvage
YardFish
Processor1 21.0 89.5 74.0 5.8 50.52 19.9 91.4 69.9 4.8* 54.13 18.4 103.8 98.4 5.8 50.9
Average Recovery (mg/L) 19.8 94.9 80.8 5.5 51.8
Average Recovery by EPA 1664 (mg/L) 21.1 108.8 89.4 6.6 54
Average Recovery as % of EPA 1664 94% 87% 90% 84% 96%Standard Deviation (mg/L) 1.3 7.8 15.4 0.6 2.0
Relative Standard Deviation as % 6.7% 8.2% 19% 10% 3.8%
Matrix Spike Recovery % 101% ** 96% 94% 94%

16
Single Lab Validation -Preliminary Data
Seven samples of one matrix: POTWMeasured Result mg/L as Oil and Grease
Replicate # Day 1 Day 2 Day 3 Day 4 Day 5 Day 6 Day 71 22.6 25.6 21.7 23.2 19.6 28.8 1.1**2 19.5 29.9 14.8 20.8 19.5 25.7 1.3*3 23.7 28.6 21.2 25.1 25.9 22.6 0.9**
Average Recovery (mg/L) 21.9 28.0 19.3 23.0 21.7 25.7 1.1**Average Recovery by EPA 1664 (mg/L) 17.0 28.9 20.9 22.9 30.0 29.8 1.2**
Average Recovery as % of EPA 1664 129% 97% 92% 101% 72% 86% N/A***
Standard Deviation (mg/L) 2.2 2.2 3.8 2.1 3.7 3.1 N/A***
Relative Standard Deviation, % 10% 8% 20% 9% 17% 12% N/A***
Matrix Spike Recovery % 96% 96% 88% **** **** **** 110%* Below recommended reporting limit** Below MDL*** These recoveries and precision are not calculated b/c of data below the recommended reporting limit.

17
Multi-Lab Validation• Multi-Lab Validation planned; pending
laboratory selection
• Designed according to ASTM D2777
• Youden Pair analyses of three matrices– Youden pairs created through dilution (not
spiking)– POTW ~ 10 mg/L– Bilge Water ~ 40 mg/L– Food Processor ~ 110 mg/L

18
Method Contrast
•Danger of serious health damage•Irritating to skin, eyes, lungs•Risk of impaired fertility•Toxic to aquatic organisms
Hexane Issues:
Hazardous Materials Transport / Disposal:
OSS METHOD:
NO SOLVENTS
NO TOXIC SUBSTANCES
DISPOSABLE
FAST, EASY PROCESS
CURRENT EPA 1664 METHOD:
Millions of Liters/Year of Hexane evaporated
into atmosphere
Pollution:

19
Summary• New Method for Determining Oil and Grease
– Solventless – eliminates all the issues with n-Hexane– Infrared-Based– Fast– Precise– Disposable– Non-Hazardous Materials– No Clean-up Required
• Single lab validation complete– Balloting Soon for ASTM ~ July
• Multi-lab validation planned soon


21
Backup Slides

22
Holding Time Data
• Some concerns raised re: Holding Time– Does recovery decrease with holding time?– For limited matrices tested so far: No
Initial After Holding ChangeMatrix↓ Units→ mg/L mg/L %
POTW 22.7 24.4 +7.6%Gunsmith 85.2 85.2 0%
Fish Processor 51 55 +7.8%

23
Spectral AnalysisInfrared spectral analysis may provide the ability to get more useful information if desired
For Example: Potential for ‘Grease’ quantification w/o extra sample prep

24
Example Spectra
-.5
0
.5
1
1.5
2
3000 2800 2600 2400 2200 2000 1800 1600 1400
Food Processor – 96 ppm
Paper Mill – 12 ppm
Prison Waste Water – 49 ppm
POTW / Primary Eff. – 17 ppm
Abs
orba
nce
(a.u
.)
Wavenumber (cm-1)

25
0
.05
.1
2980 2960 2940 2920 2900 2880 2860 2840 2820
Example of Spiked Sample RepeatabilityA
bsor
banc
e (a
.u.)
Wavenumber (cm-1)
16 ppmHexadecane/Stearic Acid in
Distilled Water11% RSD

26
Drying
.5
1
1.5
3200 3000 2800 2600 2400 2200 2000 1800 1600
• Sample must be dried of water to do IR measurement
• Drying time varies with sample, drying method (manual or compressed air/inert gas)
• Once dried of water, extra drying does notreduce hydrocarbon measurement
Abs
orba
nce
(a.u
.)
Wavenumber (cm-1)
0 min
12 min
In this example, the sample was dry after ~ 6 minutes on a compressed air line, but drying for an extra 6 min. had no affect on the hydrocarbon measurement
4 min
6 min
Prison Wastewater, 49 ppm

27
983 Stillwater Avenue ~ Old Town ME 04468
Tel: 866-269-8007 Fax: 866-660-4759 Email: [email protected] Web: www.ossmaine.com
• Incorporated 2004
• Spun out of University of Maine
• DoD Contractor (CBD‐Army) for Chem/Bio Detection
• Actively Pursuing Commercial Opportunities