laboratory grease analysis with grease thief sampling...
TRANSCRIPT
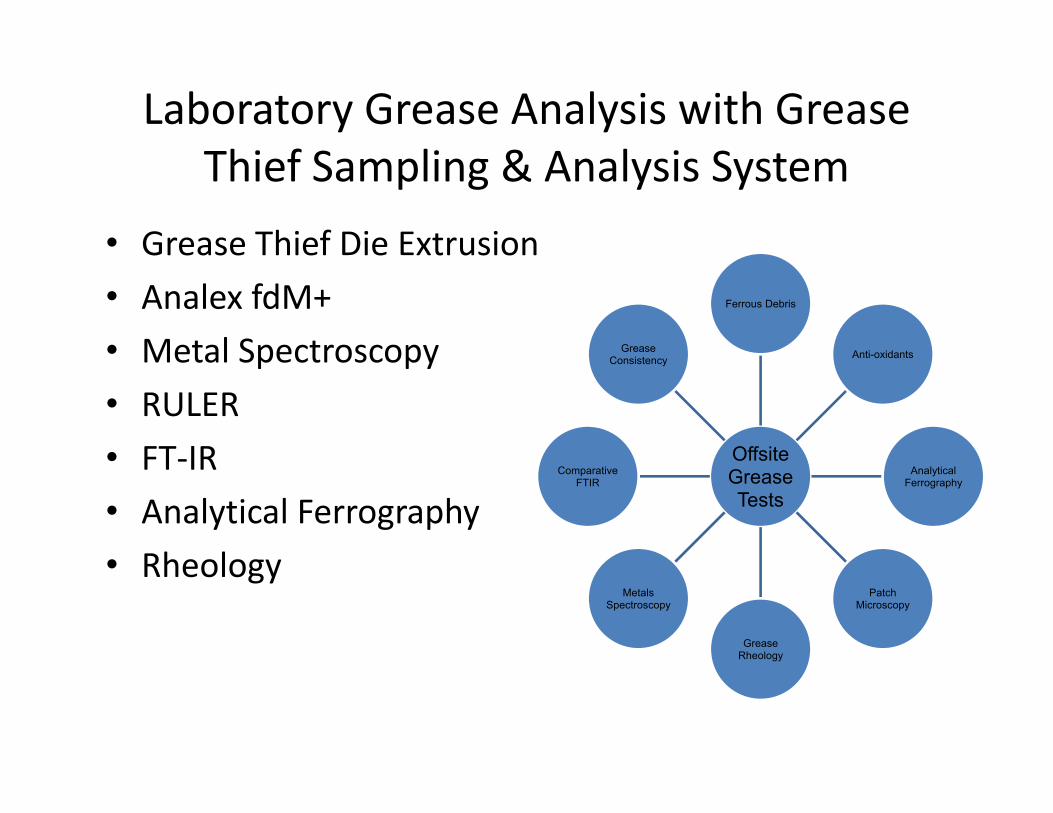
Laboratory Grease Analysis with Grease Thief Sampling & Analysis System
• Grease Thief Die Extrusion• Analex fdM+• Metal Spectroscopy• RULER• FT‐IR• Analytical Ferrography• Rheology
Offsite Grease Tests
Ferrous Debris
Anti-oxidants
AnalyticalFerrography
Patch Microscopy
Grease Rheology
Metals Spectroscopy
Comparative FTIR
Grease Consistency
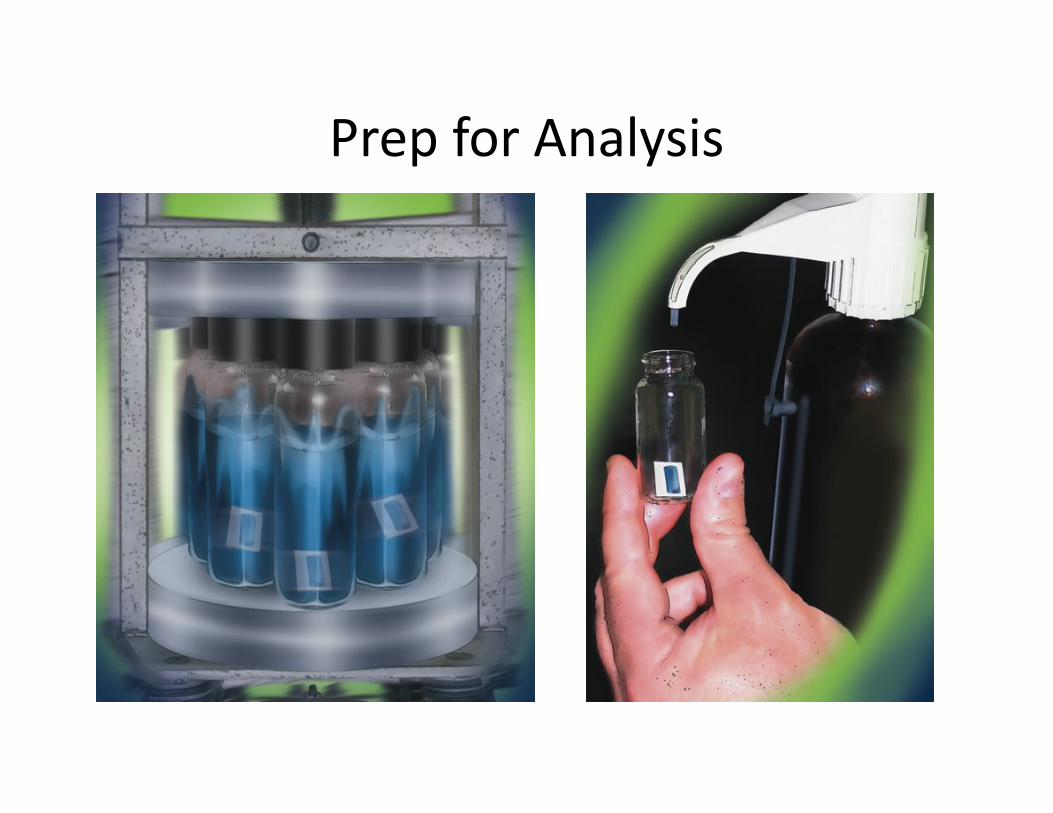
Prep for Analysis
• When grease is tested for consistency, it can be extruded onto sample substrates:– IR Card for FTIR– Substrate for weighing and dissolution in RULER vial
– Substrate for weighing and dissolution for spectroscopy; same dissolved grease can be used for Ferrography/MicroPatch
Sample Handling and Preservation
• Sampling Procedures: ASTM Standard Practice D7718
• Use proper PPE • Instrumentation
– Wipe down between runs– Do not reuse Extrusion Dies or Grease Thieves (GT)
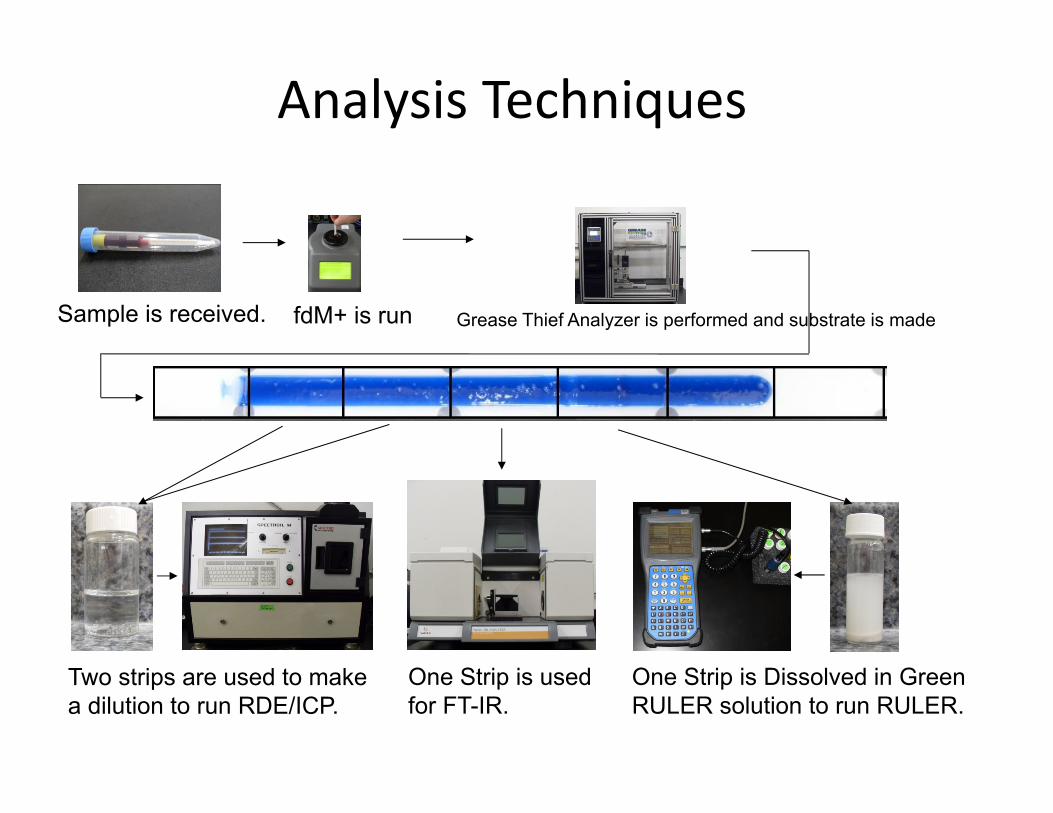
Analysis Techniques
Sample is received. fdM+ is run Grease Thief Analyzer is performed and substrate is made
Two strips are used to make a dilution to run RDE/ICP.
One Strip is used for FT-IR.
One Strip is Dissolved in Green RULER solution to run RULER.
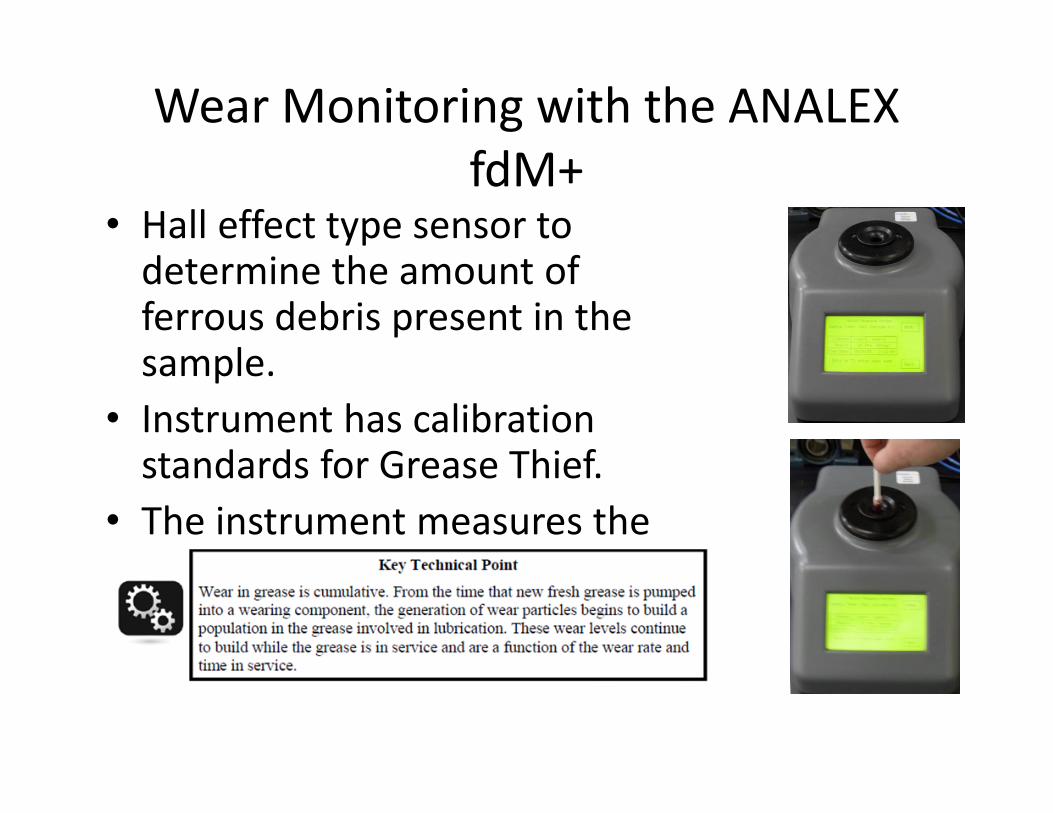
Wear Monitoring with the ANALEX fdM+
• Hall effect type sensor to determine the amount of ferrous debris present in the sample.
• Instrument has calibration standards for Grease Thief.
• The instrument measures the entire sample which is important due to the non‐homogenous nature of grease.
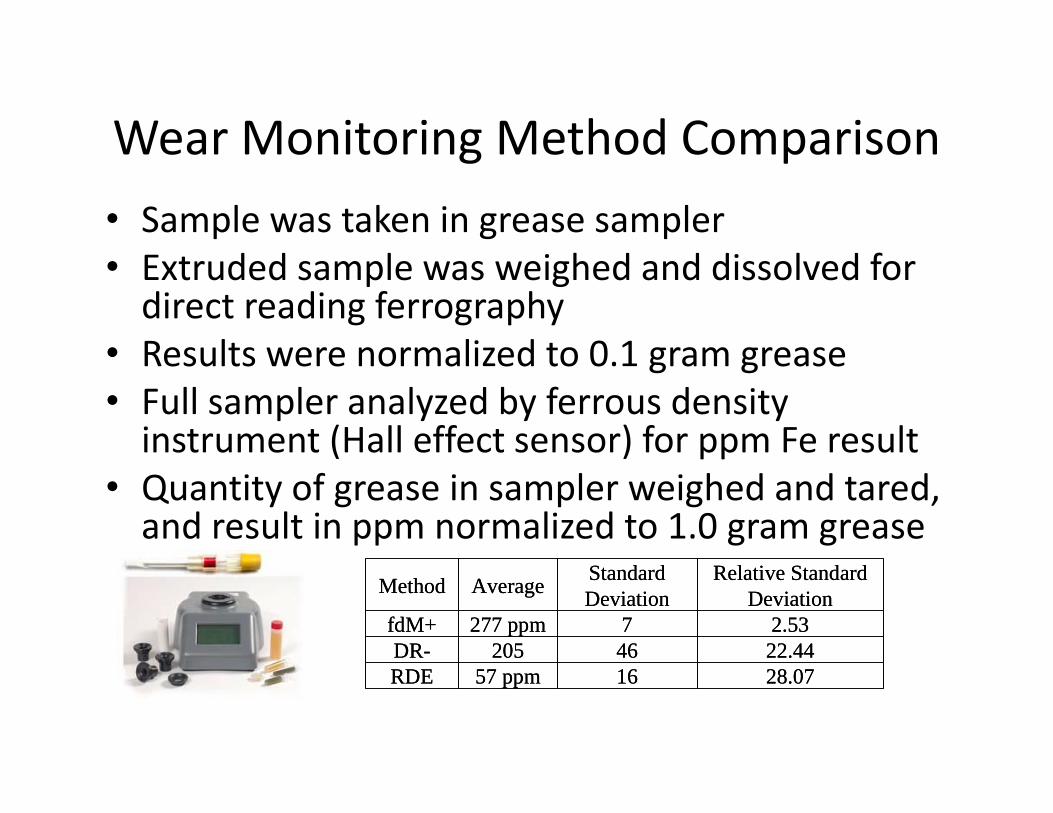
Wear Monitoring Method Comparison• Sample was taken in grease sampler• Extruded sample was weighed and dissolved for direct reading ferrography
• Results were normalized to 0.1 gram grease• Full sampler analyzed by ferrous density instrument (Hall effect sensor) for ppm Fe result
• Quantity of grease in sampler weighed and tared, and result in ppm normalized to 1.0 gram grease
Method Average Standard Deviation
Relative Standard Deviation
fdM+ 277 ppm 7 2.53DR- 205 46 22.44RDE 57 ppm 16 28.07
Method Average Standard Deviation
Relative Standard Deviation
fdM+ 277 ppm 7 2.53DR- 205 46 22.44RDE 57 ppm 16 28.07
Grease Thief Die Extrusion Test
• This instrument detects changes in the consistency of a grease.
• It is sensitive to the presence of hard particles, seen as spikes in the data, and hardened chunks of grease, seen as broad peaks in the graph.
• This test only requires one gram of grease. • Grease Thief Index (GTI) calculates the deviation in
percent of the force of the sample compared to that of the baseline. A GTI of 100 shows a perfect match to the baseline.
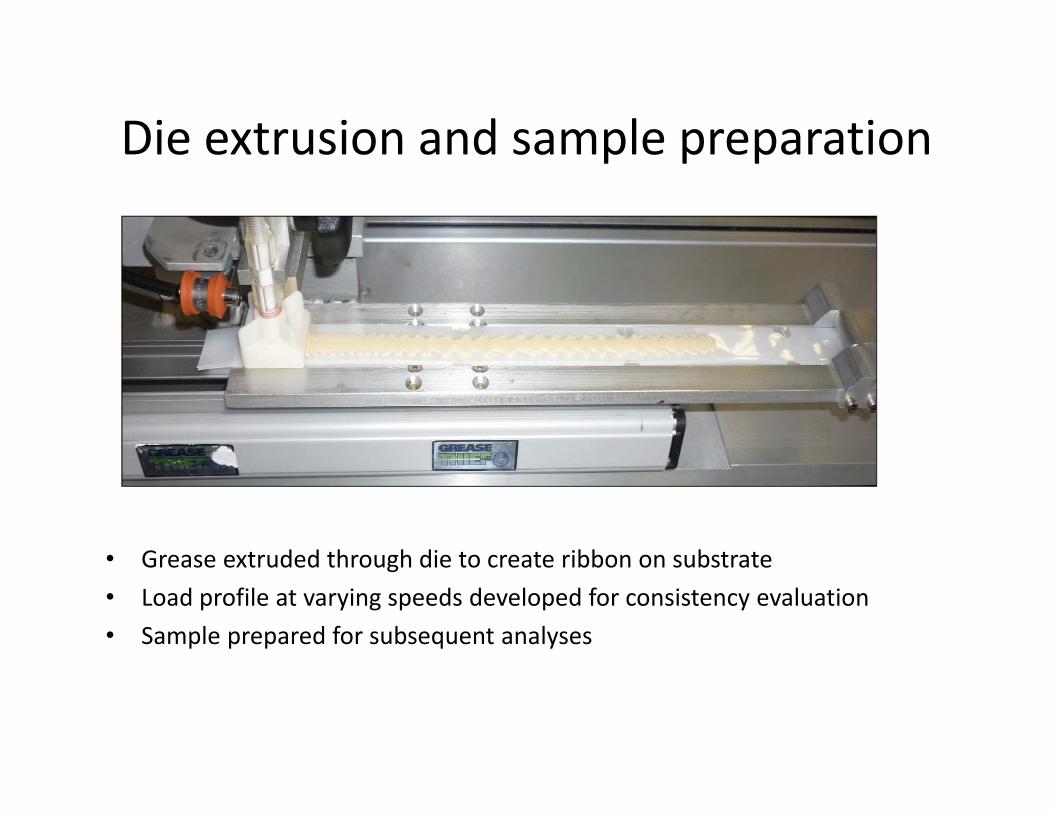
Die extrusion and sample preparation
• Grease extruded through die to create ribbon on substrate• Load profile at varying speeds developed for consistency evaluation• Sample prepared for subsequent analyses
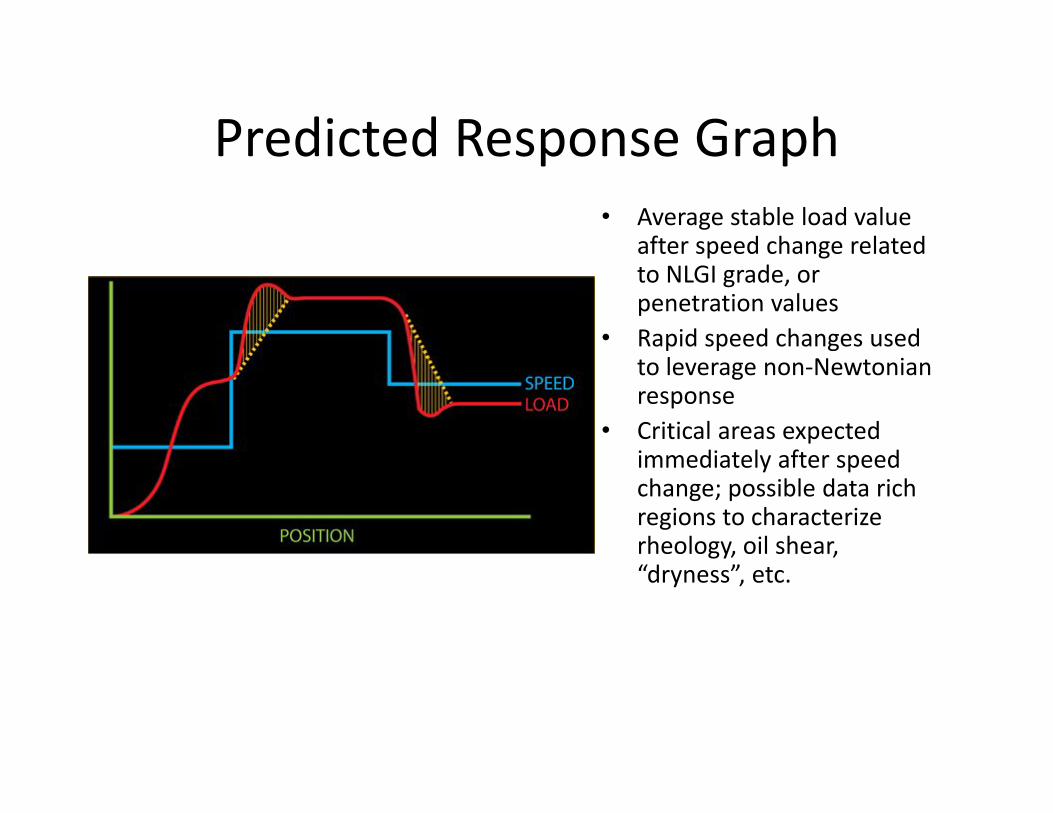
Predicted Response Graph• Average stable load value
after speed change related to NLGI grade, or penetration values
• Rapid speed changes used to leverage non‐Newtonian response
• Critical areas expected immediately after speed change; possible data rich regions to characterize rheology, oil shear, “dryness”, etc.
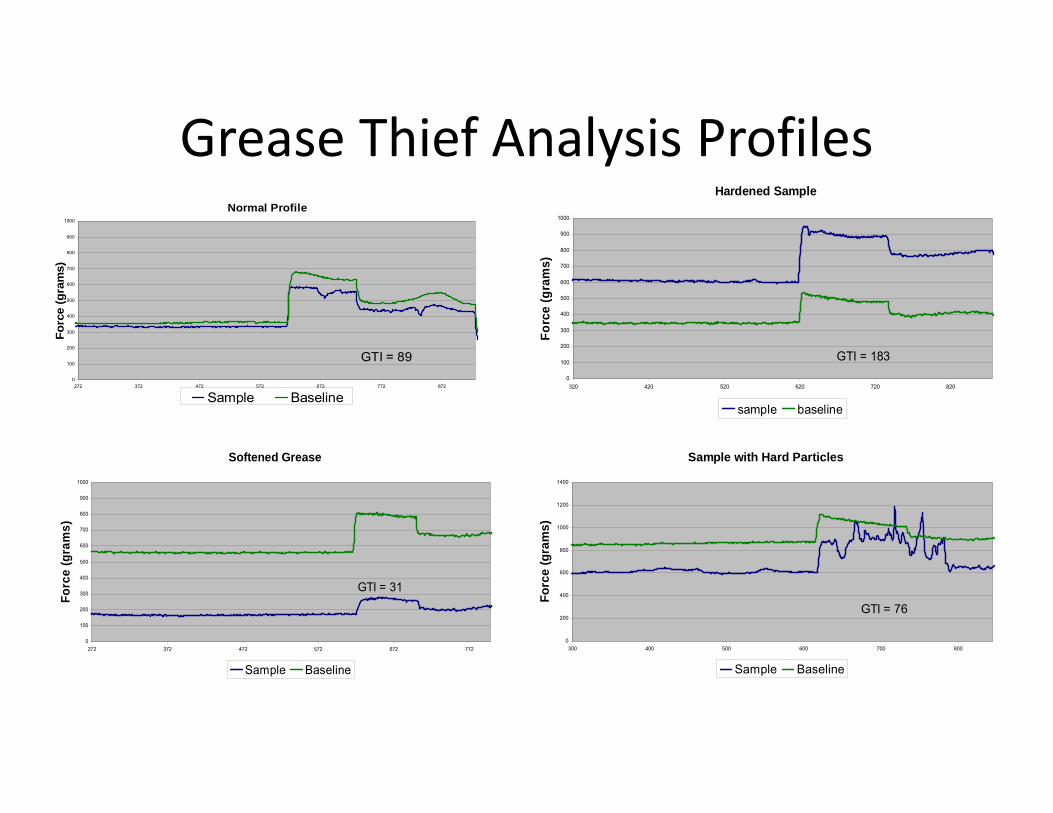
Grease Thief Analysis ProfilesNormal Profile
0
100
200
300
400
500
600
700
800
900
1000
272 372 472 572 672 772 872
Forc
e (g
ram
s)
Sample Baseline
GTI = 89
Hardened Sample
0
100
200
300
400
500
600
700
800
900
1000
320 420 520 620 720 820
Forc
e (g
ram
s)
sample baseline
GTI = 183
Sample with Hard Particles
0
200
400
600
800
1000
1200
1400
300 400 500 600 700 800
Forc
e (g
ram
s)
Sample Baseline
GTI = 76
Softened Grease
0
100
200
300
400
500
600
700
800
900
1000
272 372 472 572 672 772
Forc
e (g
ram
s)
Sample Baseline
GTI = 31
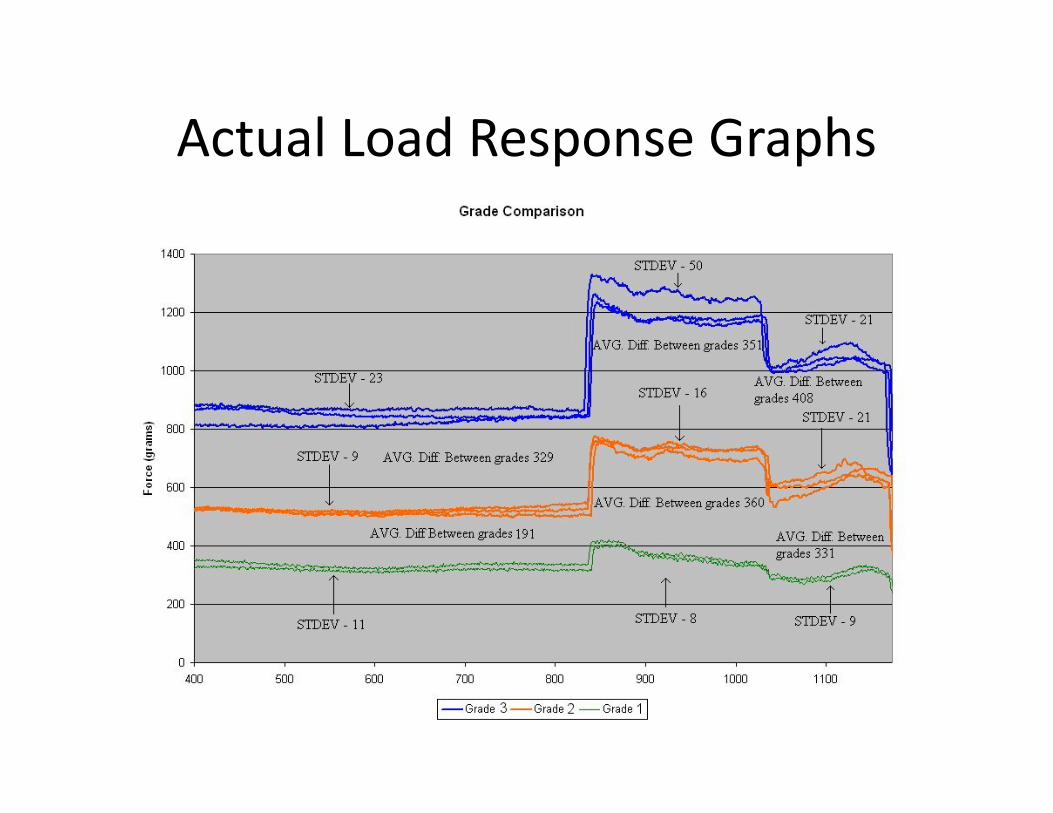
Actual Load Response Graphs
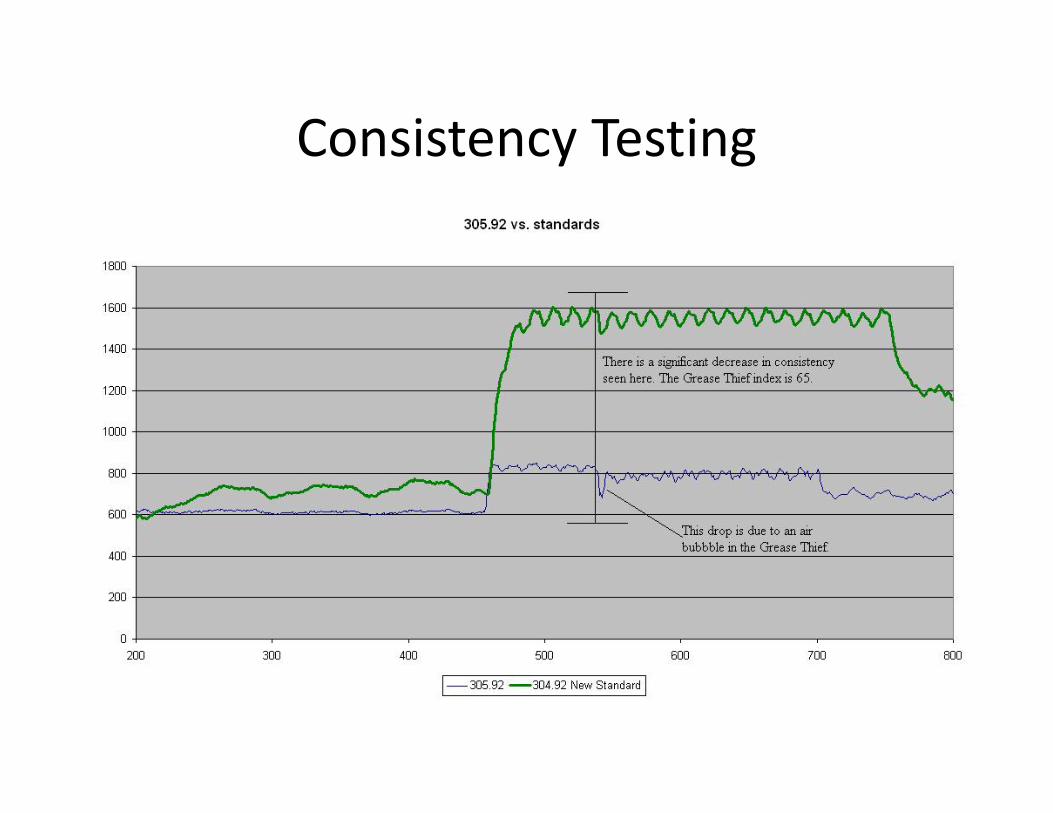
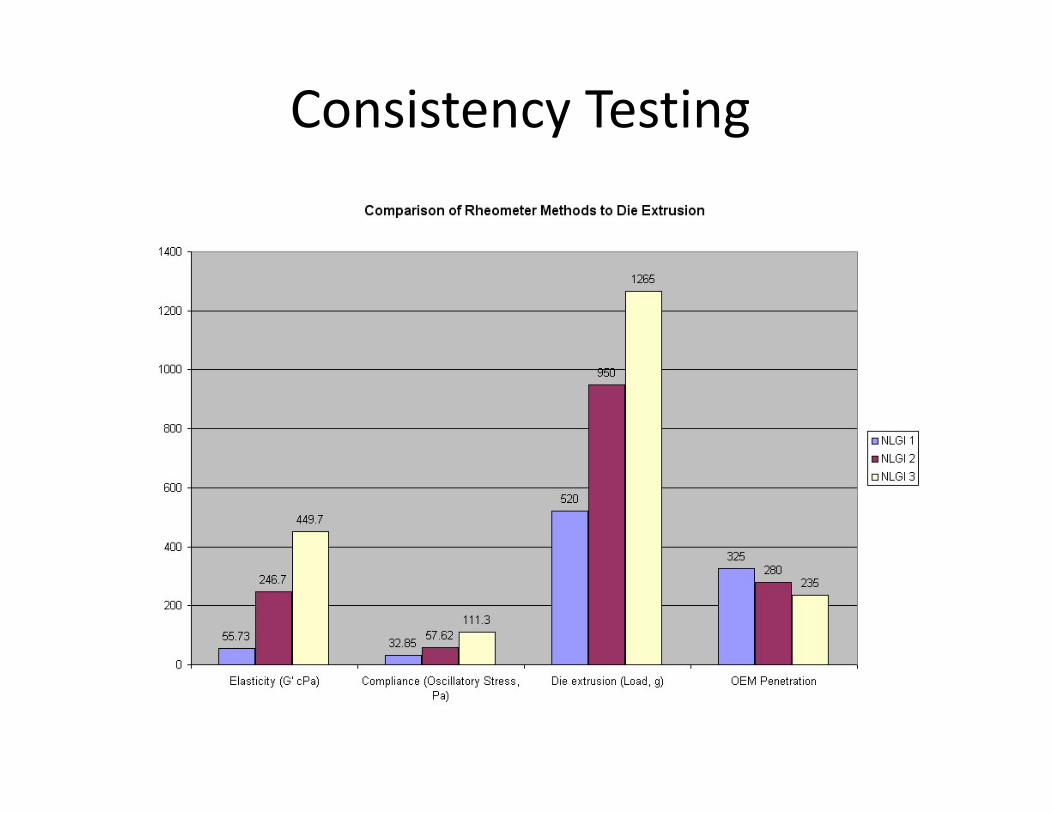
Consistency Testing
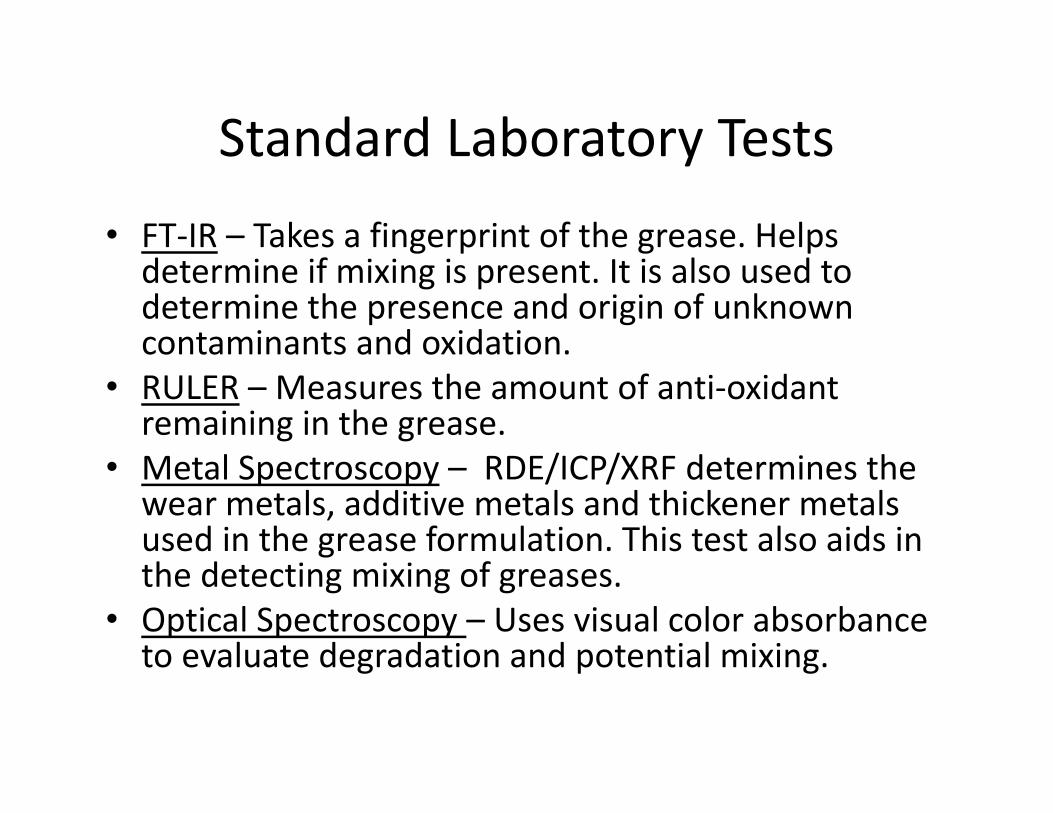
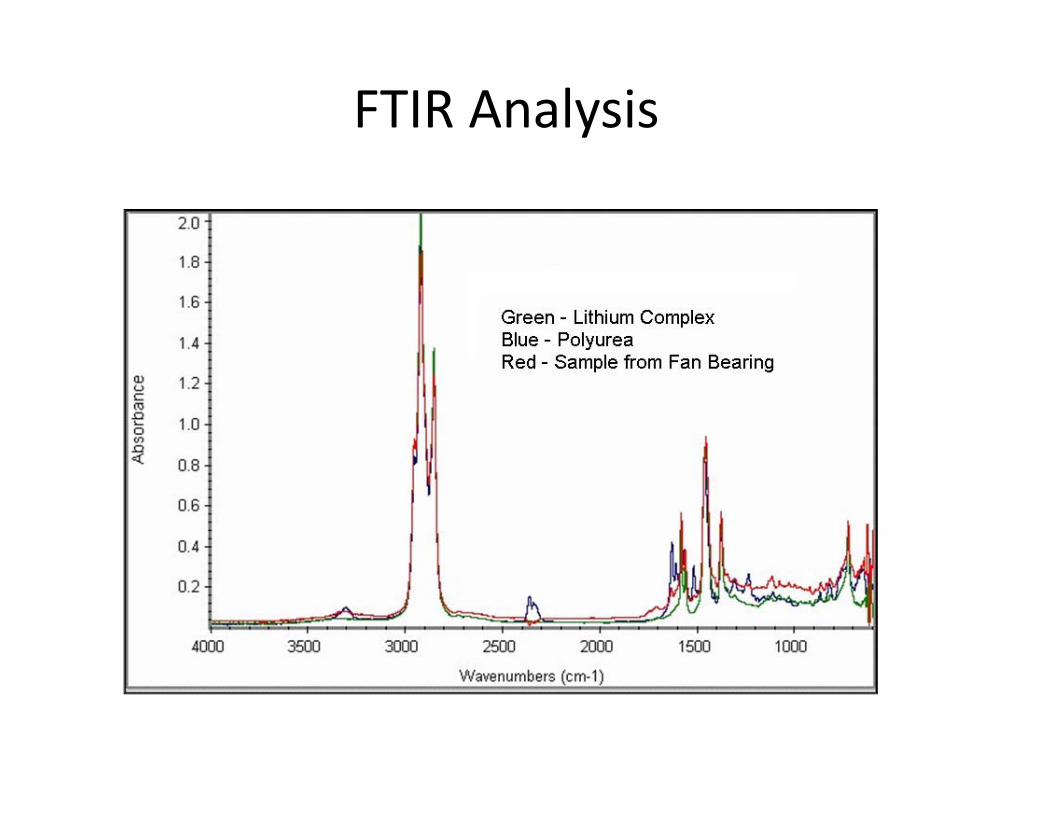
Standard Laboratory Tests• FT‐IR – Takes a fingerprint of the grease. Helps determine if mixing is present. It is also used to determine the presence and origin of unknown contaminants and oxidation.
• RULER – Measures the amount of anti‐oxidant remaining in the grease.
• Metal Spectroscopy – RDE/ICP/XRF determines the wear metals, additive metals and thickener metals used in the grease formulation. This test also aids in the detecting mixing of greases.
• Optical Spectroscopy – Uses visual color absorbance to evaluate degradation and potential mixing.
FTIR Analysis
Prep for Analysis
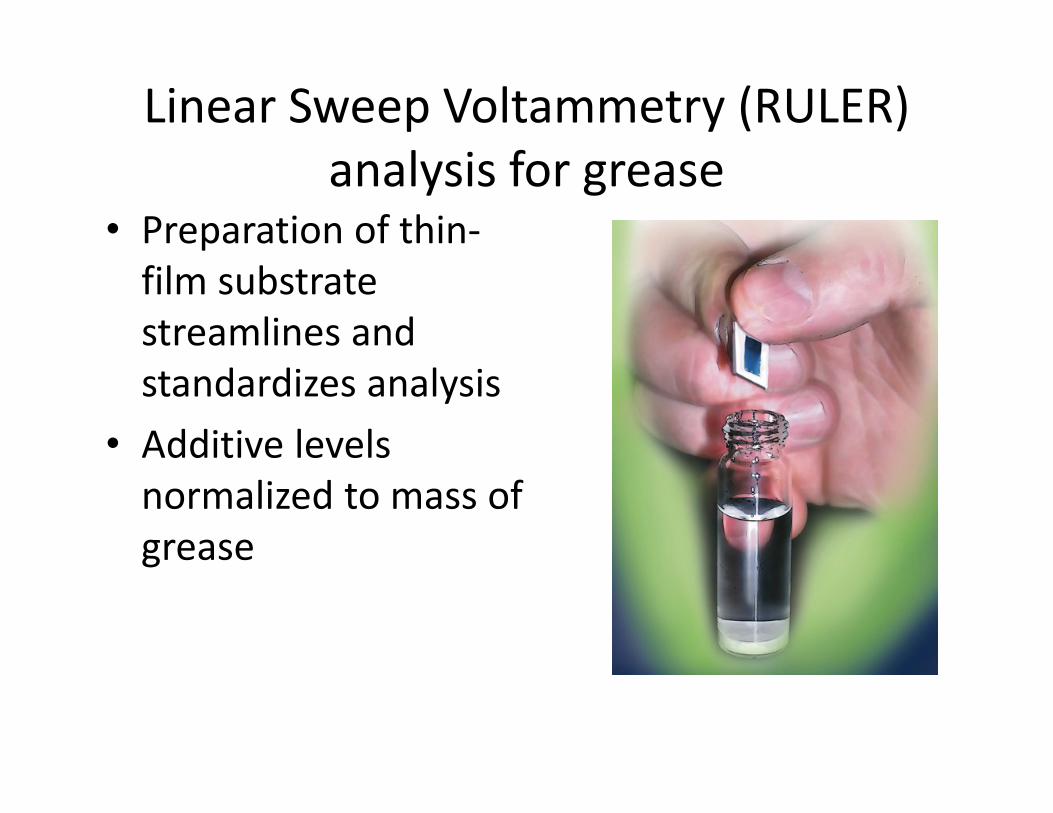
Linear Sweep Voltammetry (RULER) analysis for grease
• Preparation of thin‐film substrate streamlines and standardizes analysis
• Additive levels normalized to mass of grease
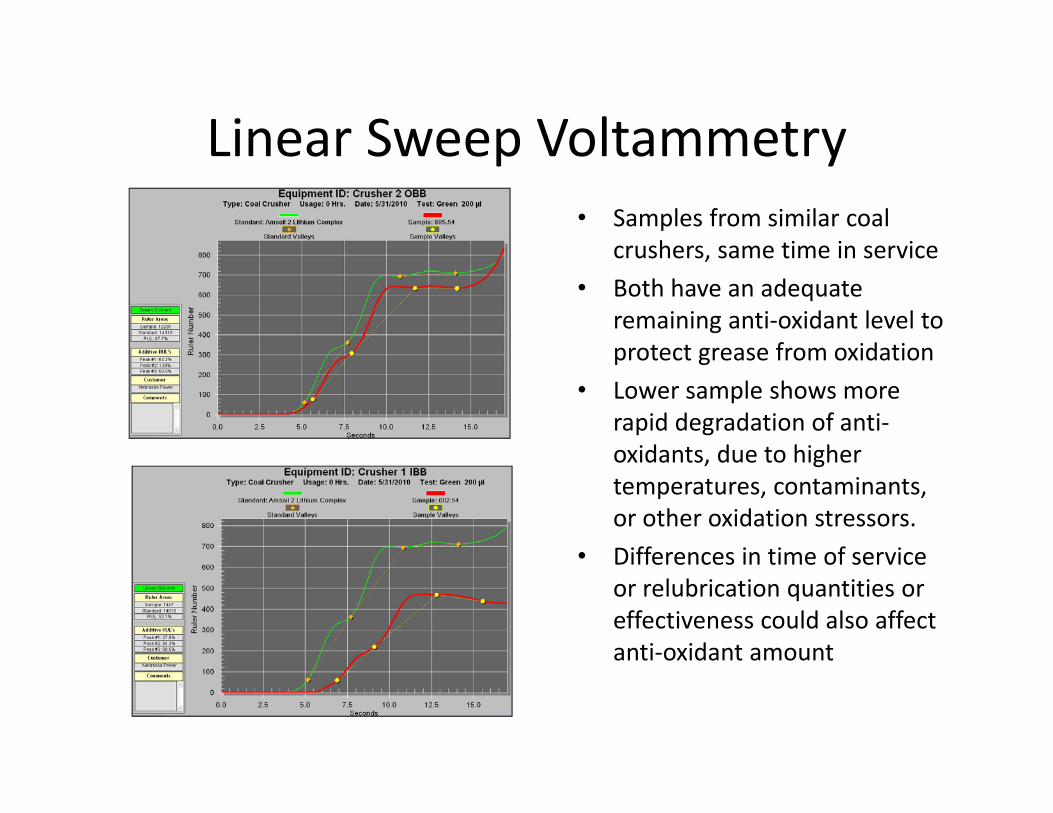
Linear Sweep Voltammetry• Samples from similar coal
crushers, same time in service• Both have an adequate
remaining anti‐oxidant level to protect grease from oxidation
• Lower sample shows more rapid degradation of anti‐oxidants, due to higher temperatures, contaminants, or other oxidation stressors.
• Differences in time of service or relubrication quantities or effectiveness could also affect anti‐oxidant amount
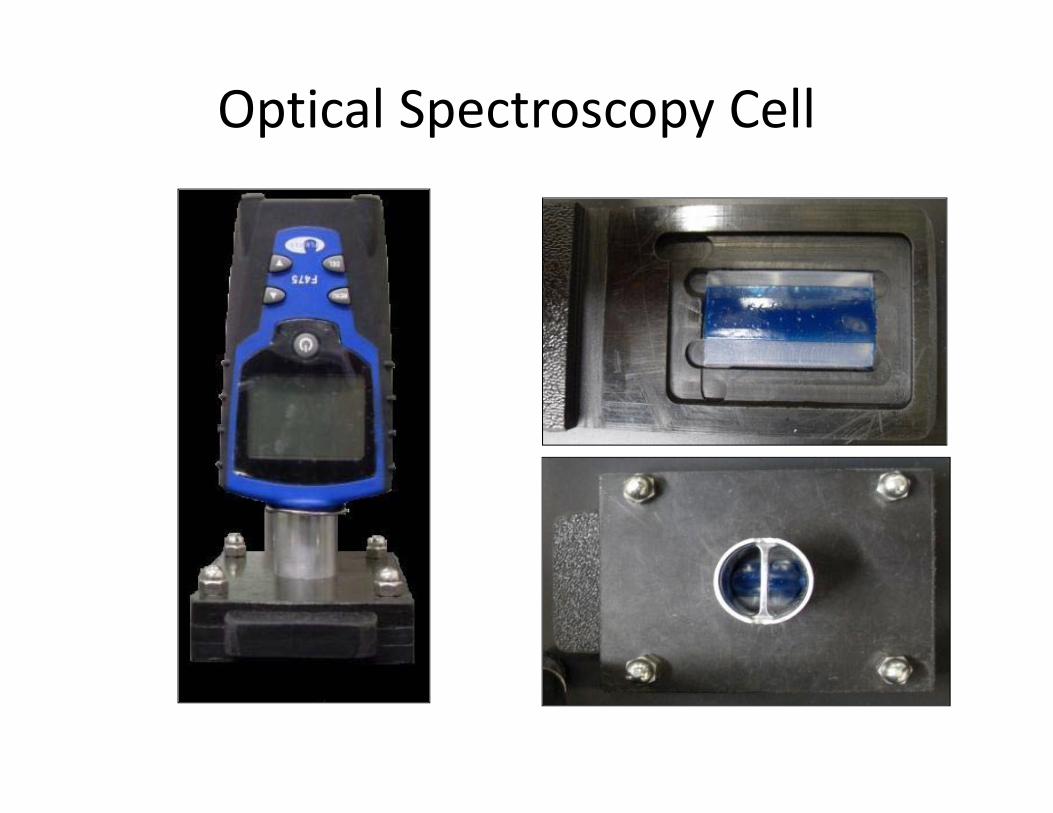
Optical Spectroscopy Cell
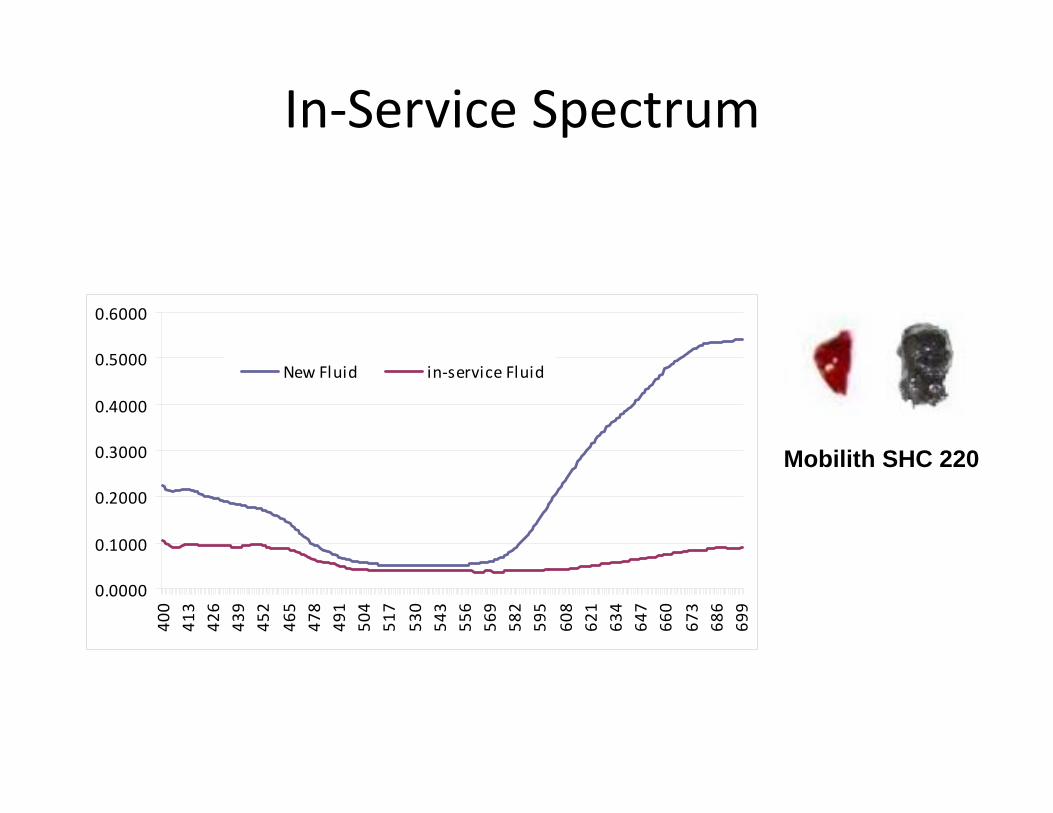
In‐Service Spectrum
0.0000
0.1000
0.2000
0.3000
0.4000
0.5000
0.6000
400
413
426
439
452
465
478
491
504
517
530
543
556
569
582
595
608
621
634
647
660
673
686
699
New Fluid in‐service Fluid
Mobilith SHC 220
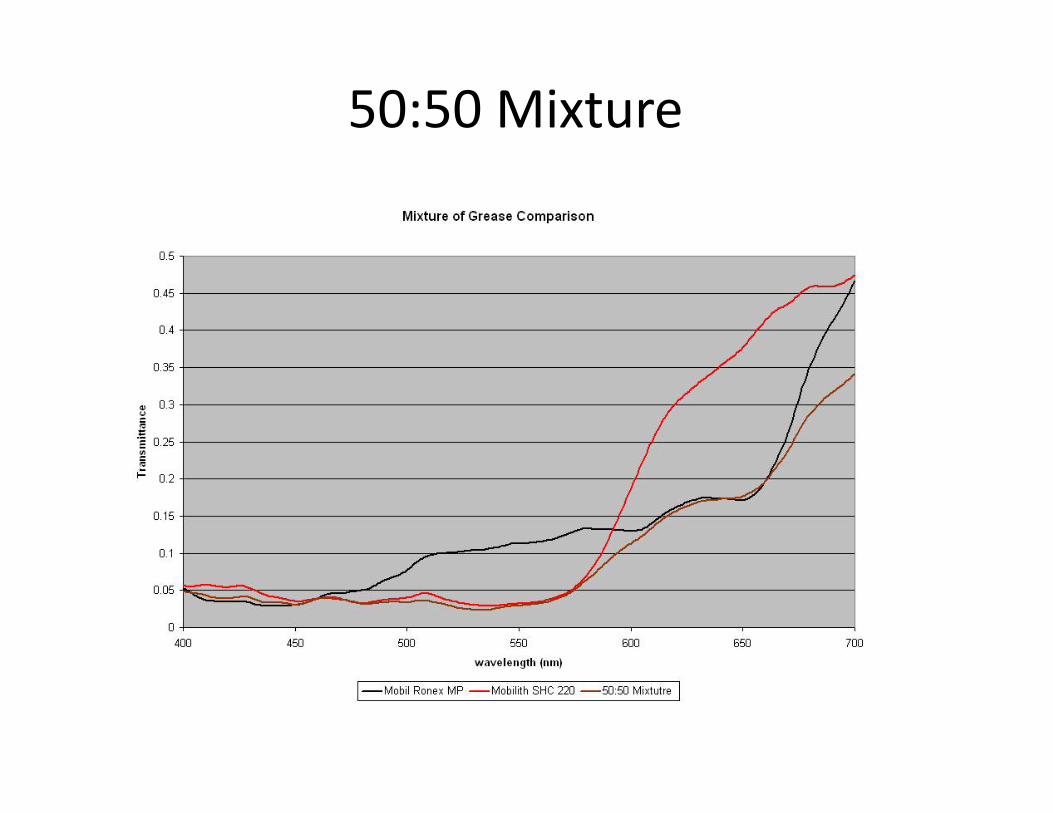
50:50 Mixture
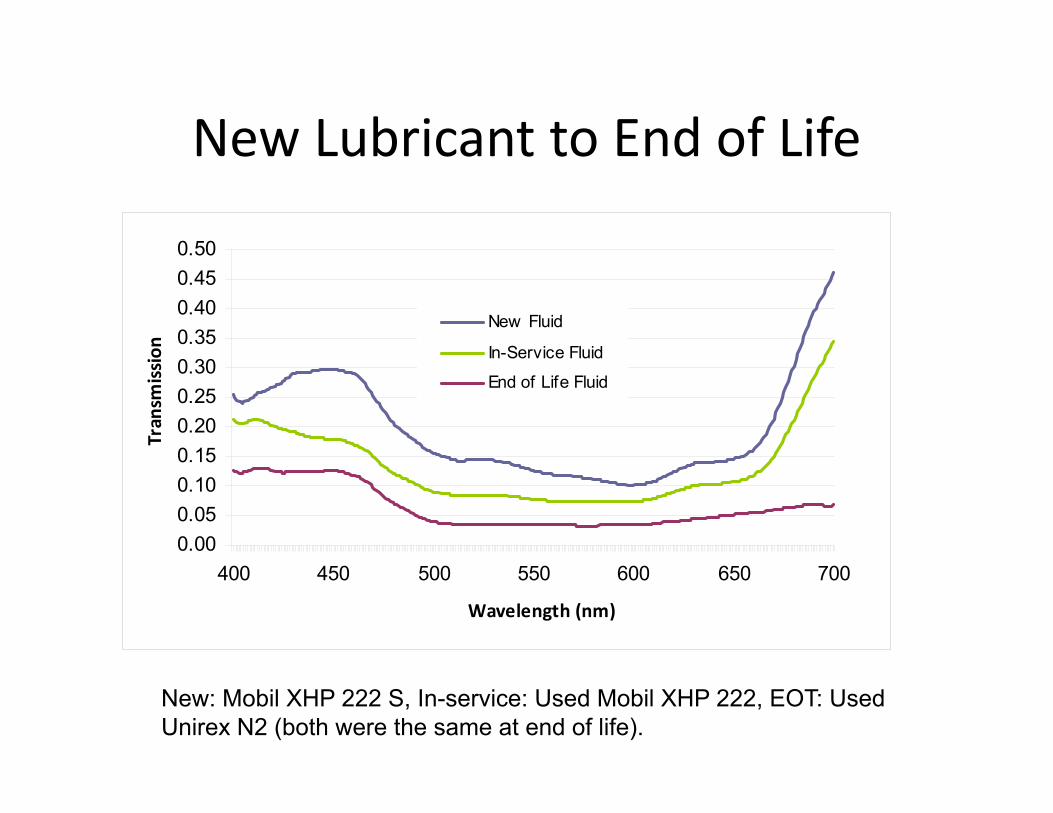
New Lubricant to End of Life
0.000.050.100.150.200.250.300.350.400.450.50
400 450 500 550 600 650 700
Wavelength (nm)
Transm
ission
New Fluid
In-Service Fluid
End of Life Fluid
New: Mobil XHP 222 S, In-service: Used Mobil XHP 222, EOT: Used Unirex N2 (both were the same at end of life).
Chemometric Techniques
• Evaluate particulate contamination of new and in‐service greases
• Coal dust, other known and common contaminants• Establishing contaminant level targets
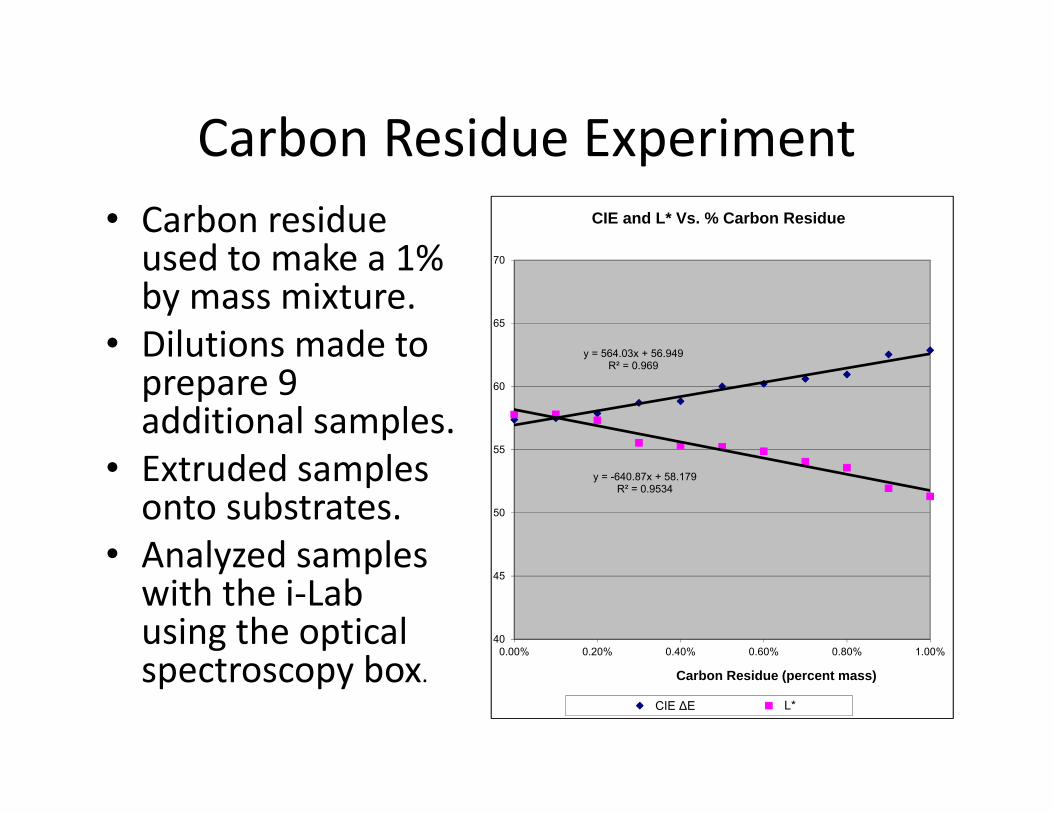
Carbon Residue Experiment• Carbon residue used to make a 1% by mass mixture.
• Dilutions made to prepare 9 additional samples.
• Extruded samples onto substrates.
• Analyzed samples with the i‐Lab using the optical spectroscopy box.
y = 564.03x + 56.949R² = 0.969
y = -640.87x + 58.179R² = 0.9534
40
45
50
55
60
65
70
0.00% 0.20% 0.40% 0.60% 0.80% 1.00%
Carbon Residue (percent mass)
CIE and L* Vs. % Carbon Residue
CIE ∆E L*
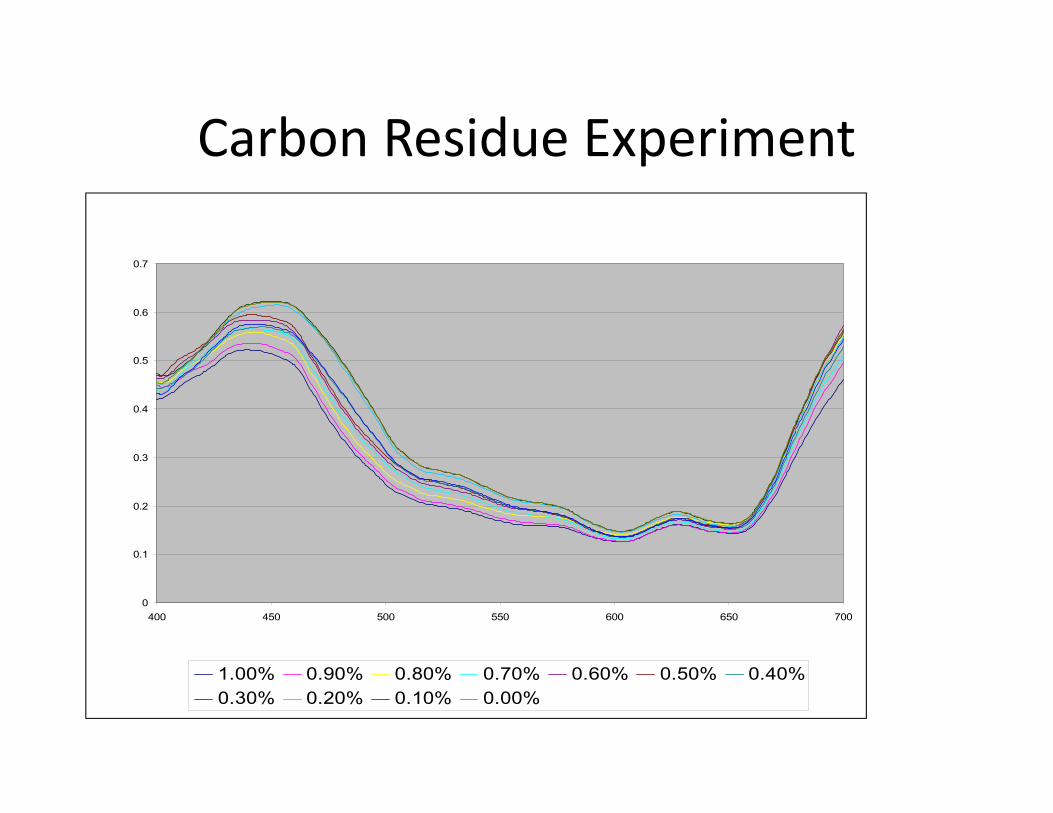
Carbon Residue ExperimentCarbon Residue Experiment 2 Visual Spectra Comparison
0
0.1
0.2
0.3
0.4
0.5
0.6
0.7
400 450 500 550 600 650 700
wavelength (nm)
Tran
smitt
ance
1.00% 0.90% 0.80% 0.70% 0.60% 0.50% 0.40%0.30% 0.20% 0.10% 0.00%
Advanced Laboratory Testing
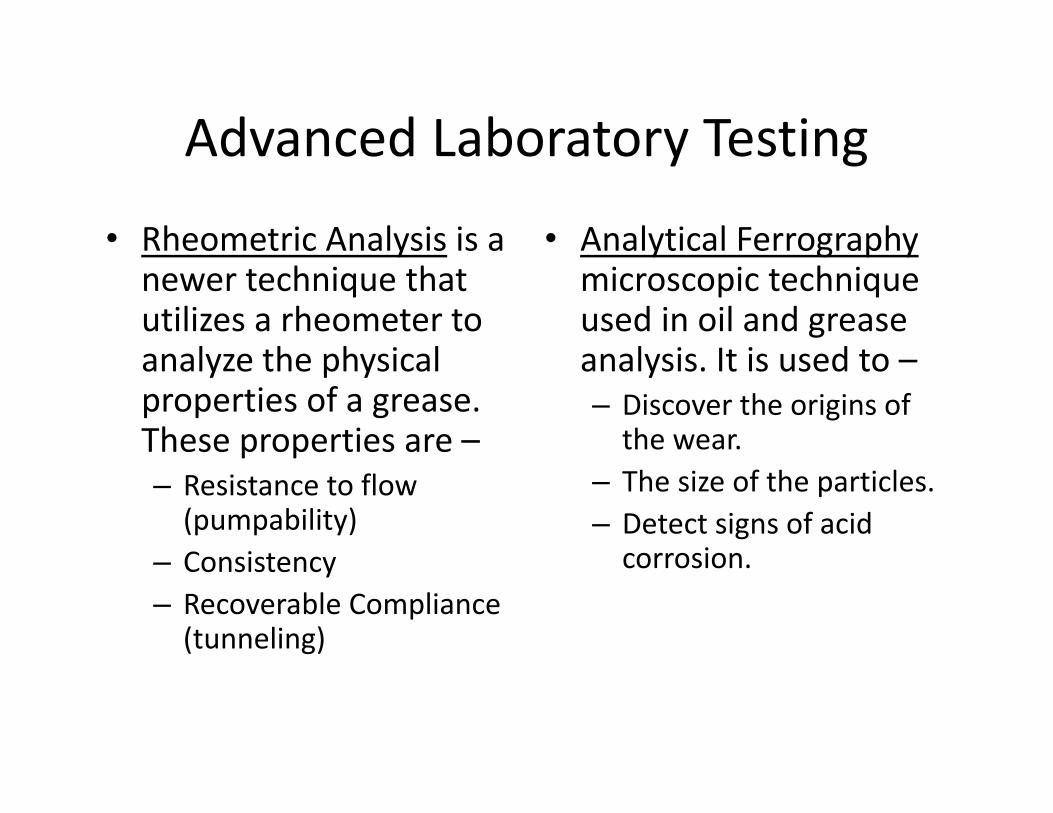
• Rheometric Analysis is a newer technique that utilizes a rheometer to analyze the physical properties of a grease. These properties are –– Resistance to flow (pumpability)
– Consistency– Recoverable Compliance (tunneling)
• Analytical Ferrographymicroscopic technique used in oil and grease analysis. It is used to –– Discover the origins of the wear.
– The size of the particles.– Detect signs of acid corrosion.
Rheometer testing
• Work by Nolan and Sivik to evaluate grease properties with rheometer
• Bryan Johnson published method for correlating penetration to rheometer
• German DIN draft method• Yield stress point and equilibrium recoverable compliance
• Measuring flow point and elastic recoil
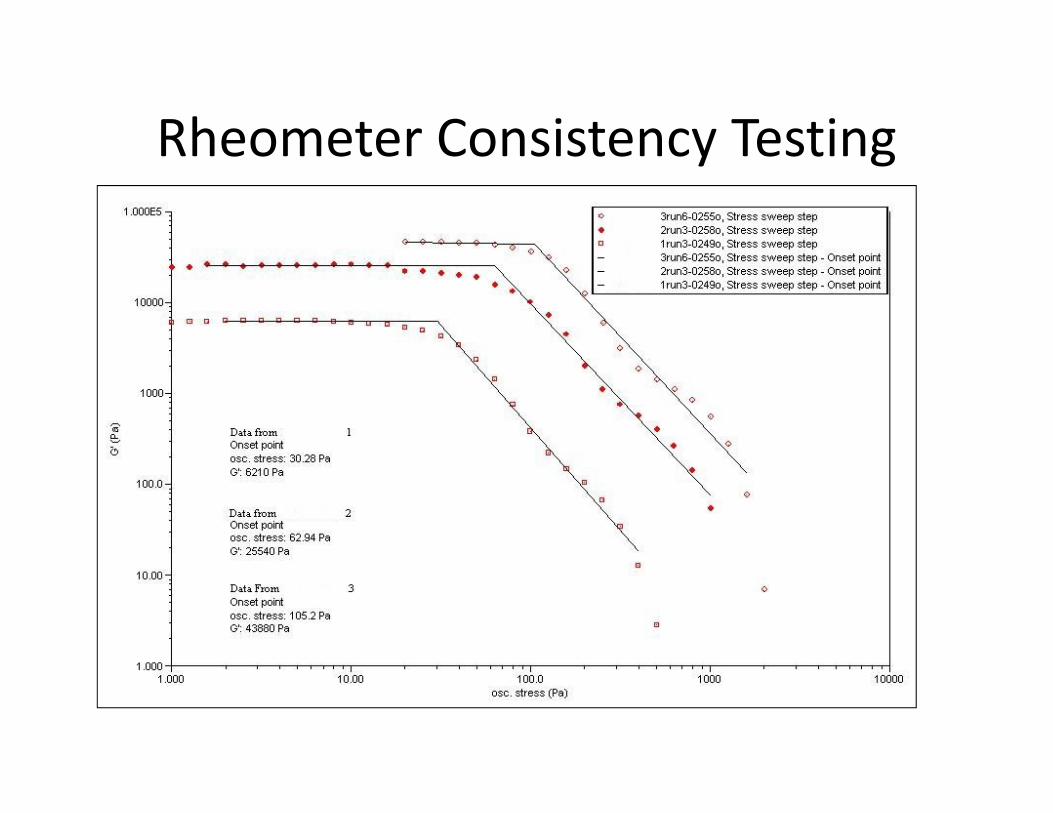
Rheometer Consistency Testing
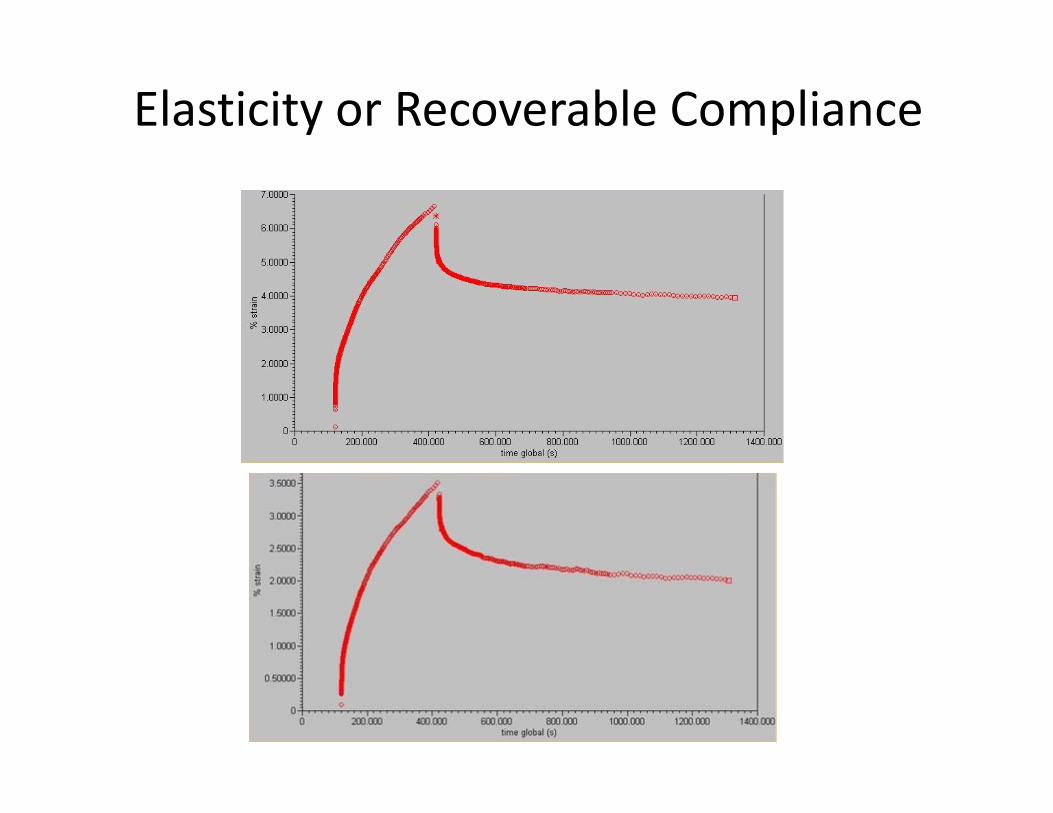
Elasticity or Recoverable Compliance
Consistency Testing
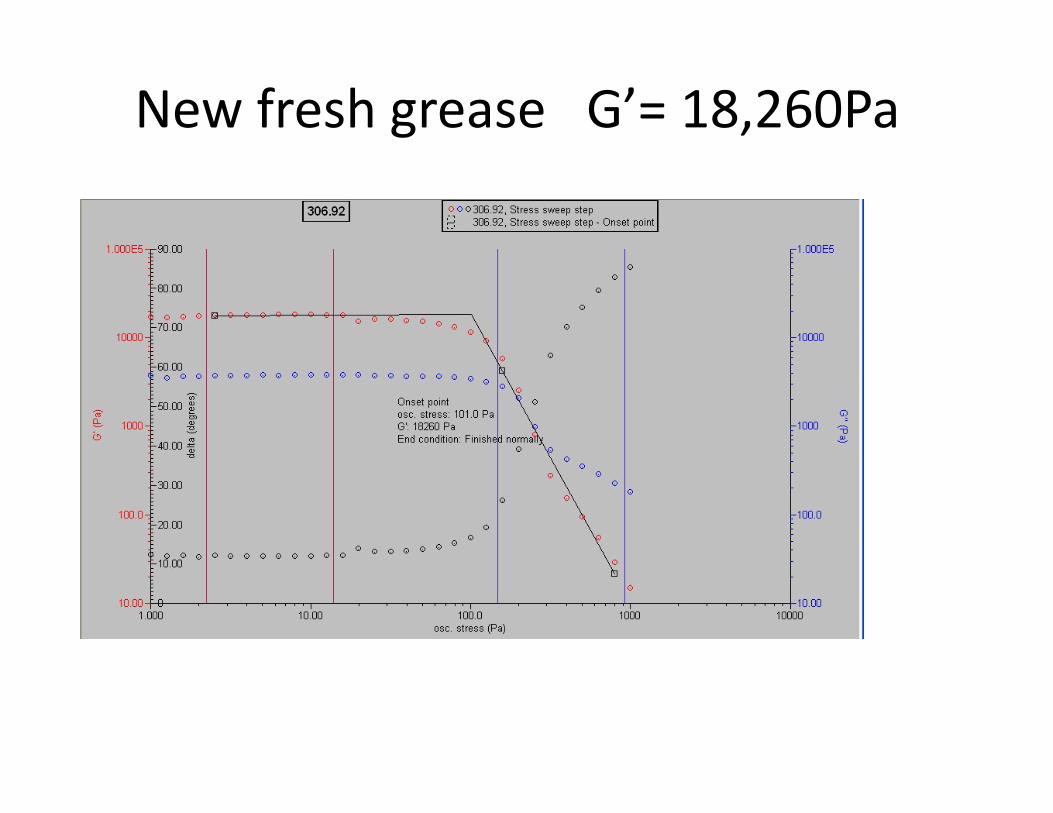
New fresh grease G’= 18,260Pa
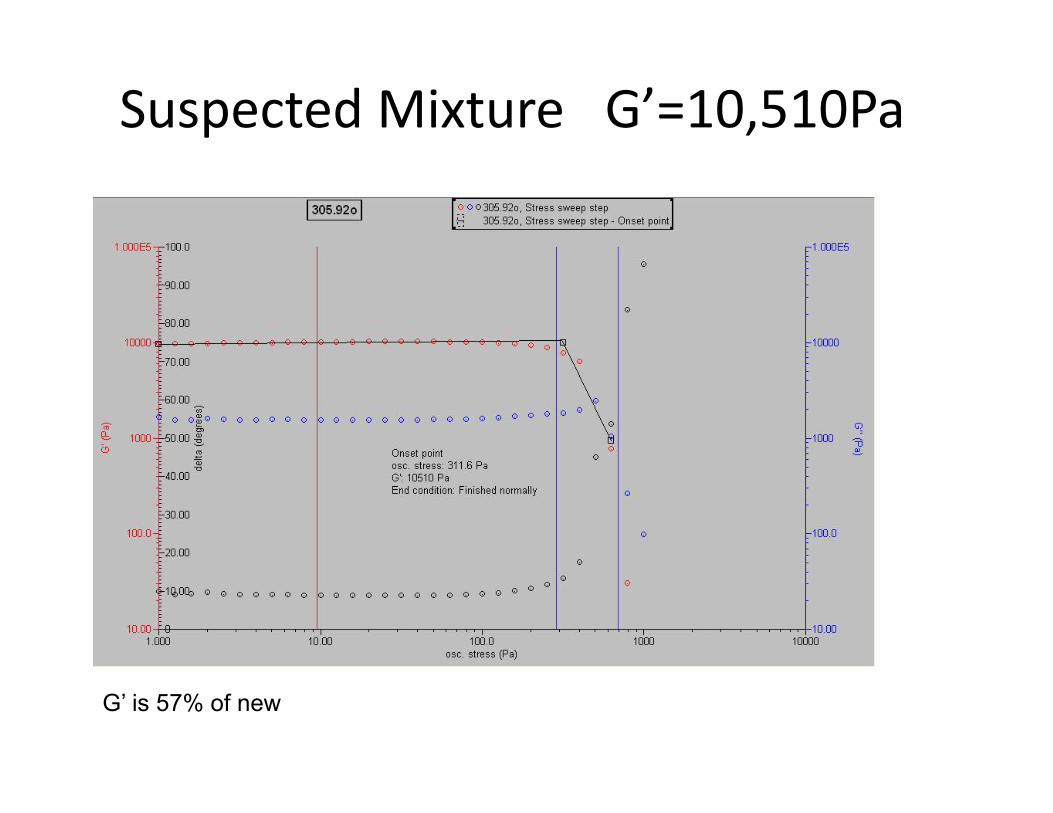
Suspected Mixture G’=10,510Pa
G’ is 57% of new
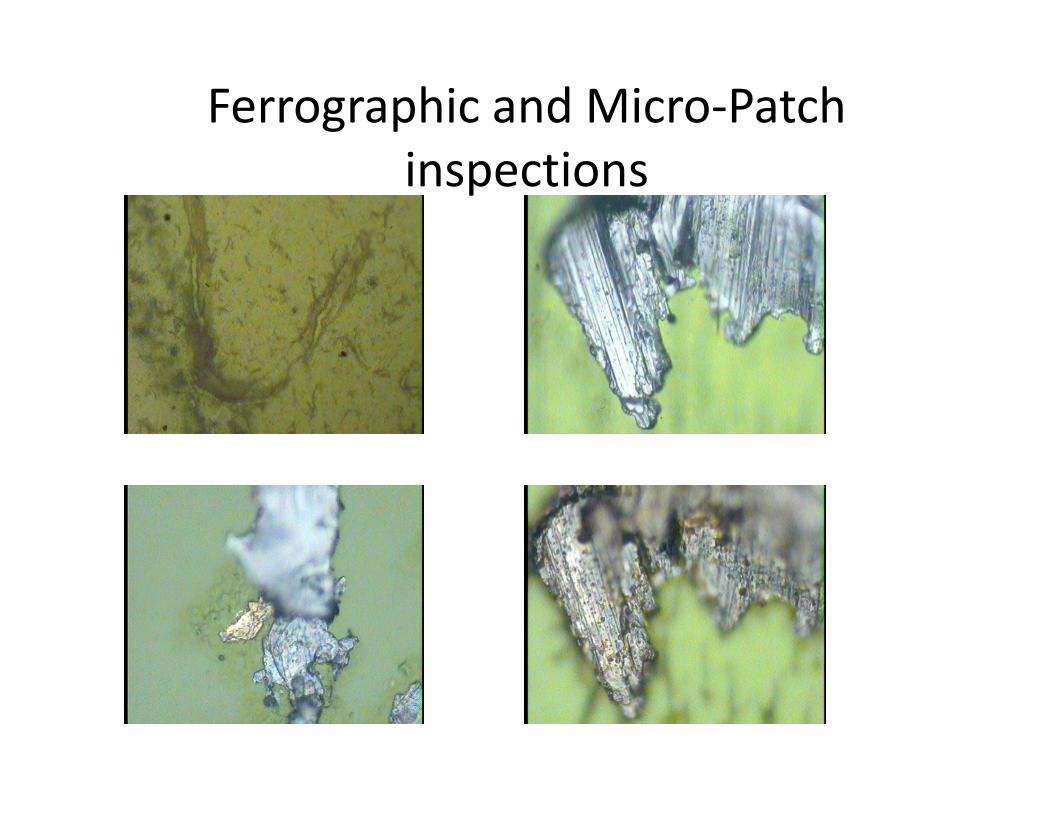
Ferrographic and Micro‐Patch inspections
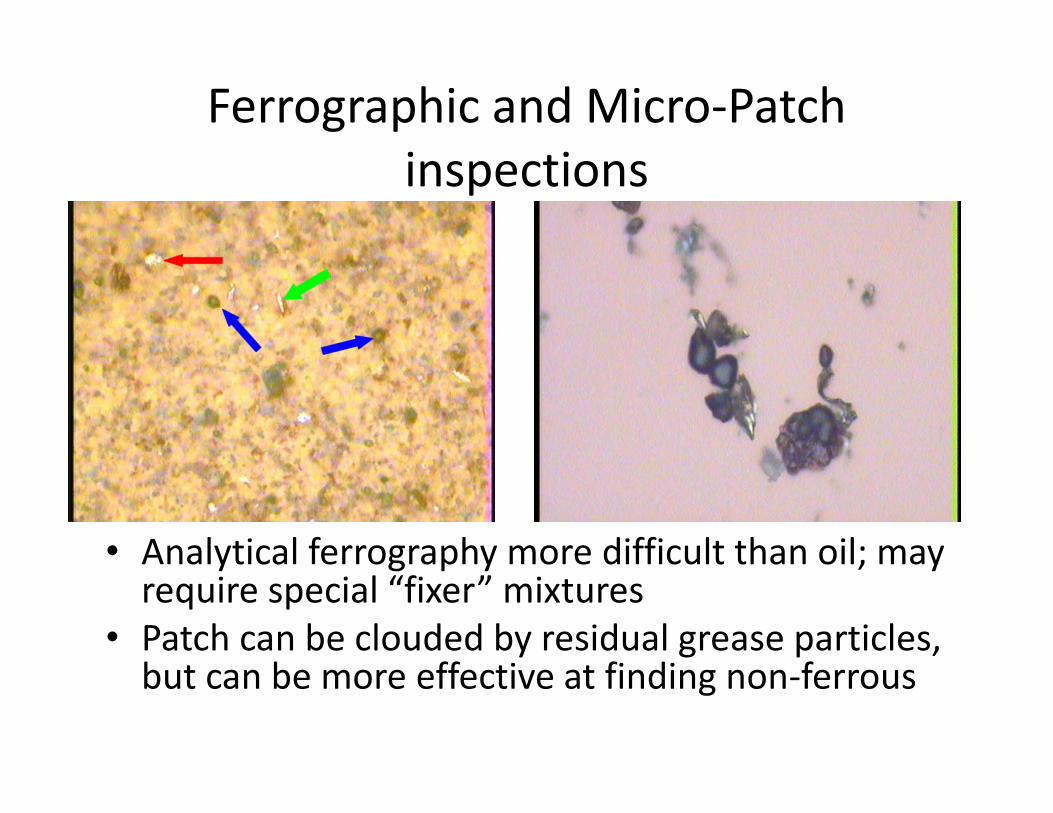
Ferrographic and Micro‐Patch inspections
• Analytical ferrography more difficult than oil; may require special “fixer” mixtures
• Patch can be clouded by residual grease particles, but can be more effective at finding non‐ferrous
Wind Turbine grease sampling and analysis
• 2‐year project conducted with DONG Energy and Vattenfall, two largest offshore wind operators in the world
• Dr. Kim Esbensen, internationally recognized expert in Theory of Sampling (TOS), Denmark
• Rich Wurzbach, MRG Labs, inventor of Grease Thief• Systematic evaluation of grease heterogeneity, sampling methodology, and analysis validity and repeatability for wind turbine main bearings in on‐shore and off‐shore applications
• Results published at OilDoc, LUBMAT, and AWEA
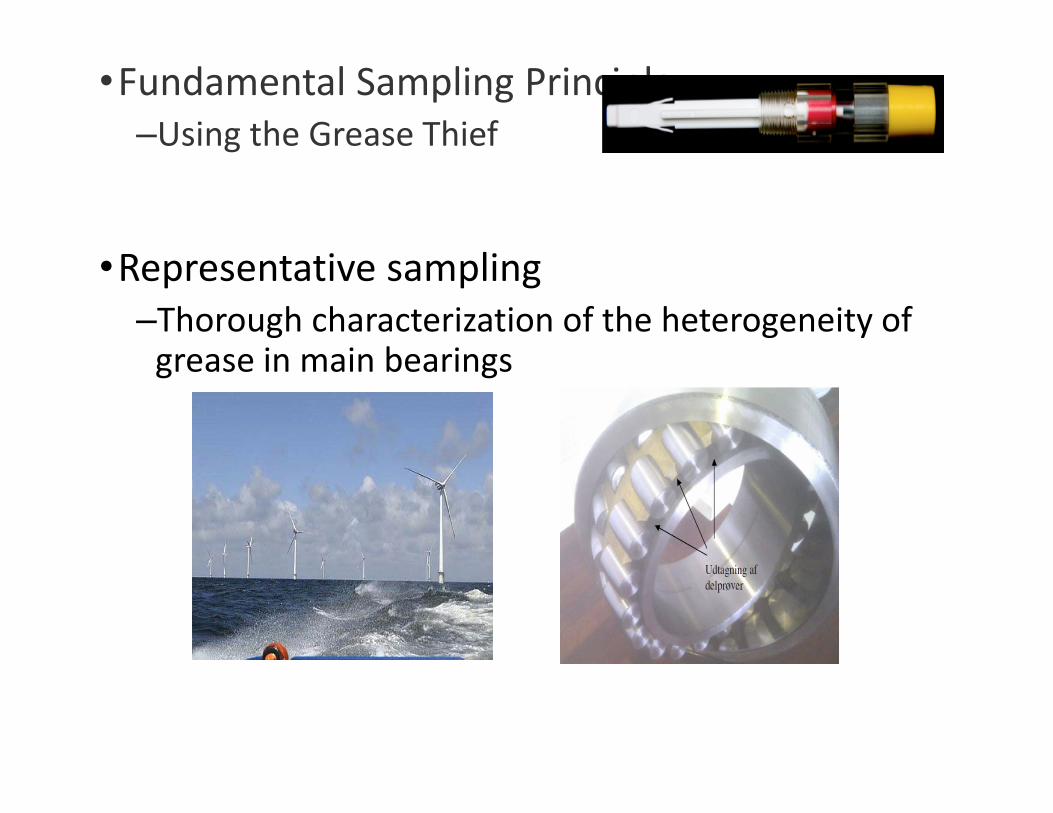
•Fundamental Sampling Principle–Using the Grease Thief
•Representative sampling–Thorough characterization of the heterogeneity of grease in main bearings
Test parameters of Grease
•For the heterogeneity characterization of grease in main bearings of wind turbines the following parameters were used:
–Consistency and flow characteristics–Ferromagnetic iron (Hall‐effect sensor)–Wear metals–Particle characterization (size & distribution)–Residual oil in grease–Antioxidants
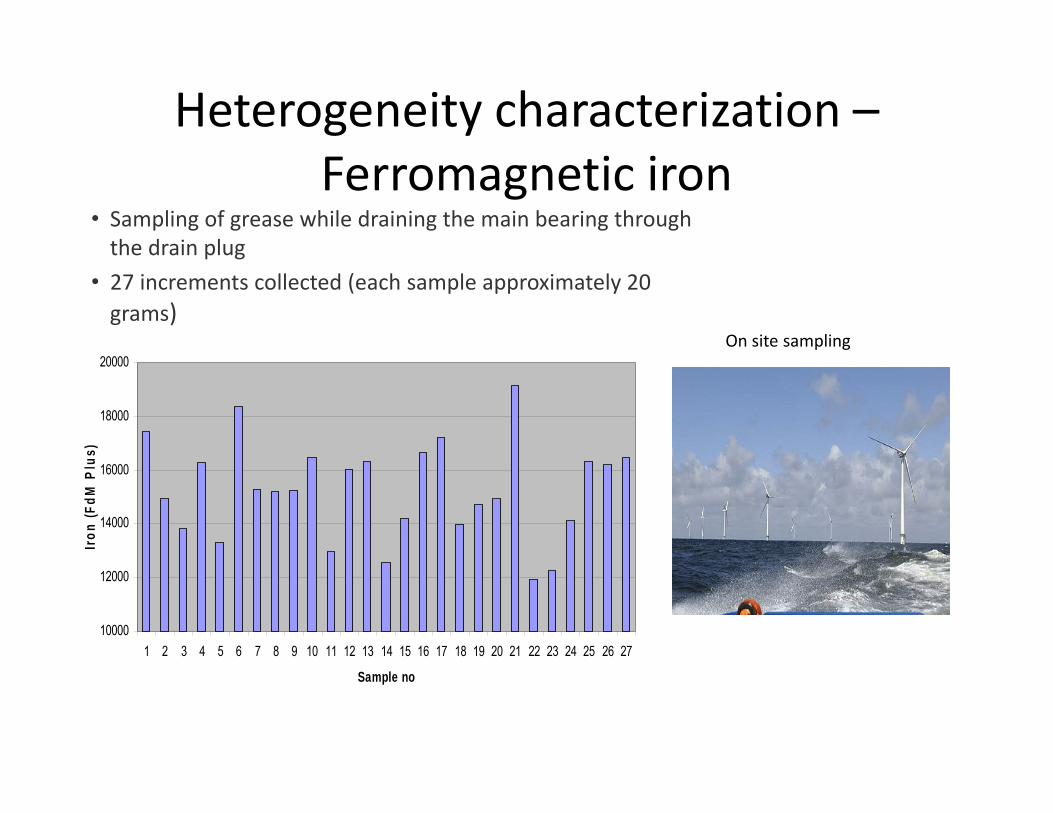
Heterogeneity characterization –Ferromagnetic iron
• Sampling of grease while draining the main bearing through the drain plug
• 27 increments collected (each sample approximately 20 grams)
On site sampling
10000
12000
14000
16000
18000
20000
1 2 3 4 5 6 7 8 9 10 11 12 13 14 15 16 17 18 19 20 21 22 23 24 25 26 27
Sample no
Iron
(FdM
Plu
s)