green infrastructure solutions to buffalo's sewer overflow challenge
DESCRIPTION
RIVERKEEPER has prepared a Green Infrastructure Solutions Plan that outlines how this solution would eliminate stormwater flow into the combined sewer system, thereby effectively preventing contaminated urban stormwater runoff from flowing directly into Scajaquada Creek while also reducing Buffalo Sewer Authority project costs.Raw sewage from combined sewer overflows creates a health risk for those who might come into contact with our local waterways while also reducing oxygen levels for fish. By including green infrastructure measures, the project would also provide the benefit of adding desirable complete street components that include bike and pedestrian enhancements, neighborhood beautification and traffic calming benefits. The plan will be featured in The Buffalo News and promoted via various means over the coming weeks.TRANSCRIPT

Green Infrastructure Solutions 1pg/
SUBMITTED TO The Residents of WNY and The Buffalo Sewer Authority
New York State Department of Environmental ConservationUnited States Environmental Protection Agency
BY BUFFALO NIAGARA RIVERKEEPER
WITH FUNDING PROVIDED BY The Community Foundation of Greater Buffalo
and the John R. Oishei Foundation
GreenInfrastructure
SolutionsTO BUFFALO’S
SEWER OVERFLOWCHALLENGE
Draft Feasibility Study March 31, 2011

Green Infrastructure Solutions 2pg/
This report was made possible through funding provided by the John R. Oishei Foundation and the Community Foundation of Greater Buffalo.
Special gratitude is owed to our Technical Advisory Committee who helped shape all of the recommendations in this report, refined our methodology,
and provided invaluable assistance in data collection and approach. This report would not have been possible without the many hours they donated to the project.
Bruce L. Fisher, Director, Center for Economic and Policy Studies, Buffalo State College
Robert Galucci, P.E.
Dharma Iyer, P.E.
Joy Kuebler, R.L.A., A.S.L.A.
Dave Majewski, Premium Landscape
Sean Myers, NBT Salutions
Lynda Schneekloth, A.S.L.A., Professor of Landscape Architecture, University of Buffalo
1250 Niagara Street, Buffalo, NY 14213 . TEL 716.852.7483 . FAX 716.885.0765 . Email [email protected]
Buffalo Niagara RIVERKEEPER

Green Infrastructure Solutions 3pg/
EXECUTIVE SUMMARY
Buffalo is blessed with an abundance of one of the world’s most important natural resources: fresh water. Our location on the Great Lakes places us in the midst of approximately one fifth’s of the world’s fresh water
supply.
Revitalization of the City’s waterfront has been a community priority for decades – growing in importance as the City reclaims former industrial lands for new purposes. Much more than an economic engine, the City’s waterways nourish its people with food, opportunities for active recreation, and aesthetic inspiration.
Unfortunately, two of the City of Buffalo’s principal waterways - the Niagara and Buffalo Rivers, have suffered such substantial degradation that they were identified as Areas of Concern by the International Joint Commission that governs the Great Lakes. In addition to legacy contamination and habitat loss issues, both the Niagara and Buffalo Rivers face ongoing pollution from both sewage and stormwater outfalls. Raw sewage from combined sewer overflows creates a health risk for those who might come into contact with our local waterways while also reducing oxygen levels for fish. Stormwater flow carries a full suite of problematic chemicals and sediment while also causing flood conditions and bank erosion degradation.
The traditional or conventional approach to addressing sewer overflow conditions is typically to separate the sanitary sewer system from the storm sewer and/or to expand sewage storage and treatment capacity. We call this approach a “grey infrastructure” method. With traditional storm and sewer separation, untreated stormwater will either be sent directly into our waterways or a separate treatment system will need to be installed that will address the stormwater contaminants before discharge into our waterways.
Faced with this same dilemma, other communities with combined sewer overflow systems, including Philadelphia,
Onondaga County and Kansas City have chosen to utilize “green infrastructure” to solve a significant portion of their combined sewer overflow problems. Green infrastructure, in contrast with grey infrastructure, seeks to mimic natural stormwater management and keeps stormwater out of the sewer system entirely. These communities have entered into legal agreements, with both the United States Environmental Protection Agency and their respective state authorities, which satisfy the Combined Sewer Overflow abatement requirements of their Clean Water Act State Permitted Discharge Elimination System Permit. In these agreements, green infrastructure measures were included in the abatement strategies. Regulated communities, in general, agreed to:
1. Develop a detailed model of their sewer system that accurately predicts how reductions in stormwater inputs or adjustments to the sewer conveyance structures will impact overflows to the receiving water bodies.
2. Establish a high percentage target rate (95-98%) for the capture and treatment of combined sewer flows.
3. Change local zoning, building or utility regulations to require that redevelopment and new development capture and allow the first inch of rain to infiltrate the ground within their parcel footprint (with some exceptions).
4. Change local sewer pricing structures to reflect stormwater flow generated by individual parcels/customers.
5. Implement an initial series of green infrastructure projects or incentive programs including green streets, parking lots, and roofs, rain gardens and downspout disconnection along with measuring and documenting results.
6. Actively engage the community in the water quality management process.
Proposed Green Roofs in Buffalo, NY
Source: Buffalo Niagara RIVERKEEPER
Buffalo Niagara RIVERKEEPER

Green Infrastructure Solutions 4pg/
<1> Interviews included: City of Buffalo Department of Public Works, Buffalo Public Schools Joint Schools Construction Board and Facilities Management, Buffalo Municipal Housing Authority, Erie County Industrial Development Agency, Erie Canal Harbor Redevelopment Corporation, Buffalo Niagara Medical Campus, University at Buffalo, Buffalo State College, Elmwood Village Association, Old First Ward Neighborhood Association, Valley Community Center, CAO Environmental Justice Center and others.
<2> Potential funding sources include local, state and federal transportation funds, economic development funds, Dormitory Authority funds, Department of Health funds, Department of Education and funds dedicated to vacant land management, energy conservation, and housing and urban redevelopment.
7. Prepare a long term control plan that prioritizes the reduction of stormwater flow into the combined sewer system utilizing green infrastructure, and adding grey infrastructure solutions only as needed once source flow has been reduced.
8. Implement the long term control plan over an extended time horizon (25 years).
9. Utilize adaptive management to adjust the sewer abatement strategy based upon actual results.
10. Participate or lead watershed management planning efforts that are designed to address regional water quality problems.
Buffalo Niagara RIVERKEEPER is recommending that the City of Buffalo Sewer Authority, in partnership with the City of Buffalo, should propose a similar approach (including all of the above elements) to the New York State Department of Environmental Conservation and United States Environmental Protection Agency as a means to satisfy the Combined Sewer Overflow abatement conditions of Buffalo’s Clean Water Act State Permitted Discharge Elimination System Permit.
With funding support from the Community Foundation of Greater Buffalo and the John R. Oishei Foundation, Buffalo Niagara RIVERKEEPER has examined the potential for reducing combined sewer overflow events and stormwater pollution within the Buffalo Sewer Authority system through the use of green infrastructure. According to our analysis, if the Buffalo Sewer Authority partners with the City of Buffalo to aggressively employ a green infrastructure approach, they could:
Reduce stormwater flow to the combined sewer system by at least 45% and eliminate all of the City’s combined sewer overflows for 95% of rain events.
Completely capture and infiltrate that percentage of flow in all seasons, preventing the introduction of new, untreated stormwater directly running into the City’s waterways through a sewer separation project, and
Free up at least an estimated 157 million gallons per day of treatment capacity at the Bird Island Treatment plant which would allow the City to accept new flow from suburban communities and thereby expand its revenue base.
To ground truth to this analysis, RIVERKEEPER partnered with EDR Companies to examine the feasibility and cost competitiveness of implementing a green infrastructure approach in lieu of the planned sewer separation at Sewer Patrol Point 240 (CSO60). This analysis determined that the green infrastructure project would immediately be able to capture 100% of the site’s stormwater flow. This green infrastructure solution would eliminate stormwater flow into the combined sewer system, thereby effectively preventing contaminated urban stormwater runoff from flowing directly into Scajaquada Creek while also
reducing Buffalo Sewer Authority project costs. Moreover, by including these green infrastructure measures, the project would also provide the benefit of adding desirable complete street components that include pedestrian enhancements, neighborhood beautification and traffic calming benefits.
RIVERKEEPER has confidence, that if the City employs a green infrastructure approach, it might creatively access several additional funding sources to resolve its sewer overflow challenge; funding sources that typically would not be available for traditional separation, system storage or sewage treatment capacity expansions. In particular, our interviews with several large public agencies and institutions1 revealed that these institutions had significant interest in stormwater capture through green infrastructure. These organizations helped us generate a substantial list of potential projects that could readily incorporate green infrastructure. This list includes potential projects that are funded through state or federal funding sources2. In many cases, these projects would simply employ cost neutral design specification changes.
It is our strong belief that the City of Buffalo has the necessary resources to join the other innovative communities who have negotiated Clean Water Act compliance agreements that prioritize the substantial implementation of green infrastructure techniques over grey approaches. In fact, we have outlined several specific projects where the Buffalo Sewer Authority can demonstrate its commitment to a green sewer solution in 2011 with minimal investment.
While a much more detailed green infrastructure plan would be required for full implementation, it is our strong hope that this memo provides the Buffalo Sewer Authority, the City of Buffalo, the United States Environmental Protection Agency and the New York Department of Environmental Conservation with sufficient information to negotiate a consent decree comparable in scope and detail to the recent Onondaga and Kansas City agreements.
Buffalo Niagara RIVERKEEPER

Green Infrastructure Solutions 5pg/
EXECUTIVE SUMMARY
I. Introduction
II. Impact of Combined Sewer Overflows on the Niagara River Watershed
Overview
The Niagara River Watershed
Niagara River Emerald Channel Drinking Water Source
Niagara River along Squaw Island
Niagara River at Cornelius Creek
Black Rock Canal
Scajaquada Creek
Cazenovia Creek
Buffalo Creek
Buffalo River Area of Concern
III. Buffalo’s Long Term Control Plan & the Regulatory Environment
IV. The Effects of Stormwater on Buffalo’s Wastewater Treatment Capacity
V. Recommended Green Infrastructure Program Components
Green Streets
Green Schools
Residential Downspout Disconnection
Green Public Facilities & Campuses
Commercial & Industrial Site greening
Green Open Spaces & Public Park
Vacant Lot Management
Green Roofs
Development Ordinances & Code Changes
VI. Green Infrastructure Demonstration Project Candidates
VII. Additional Long Term Control Plan Recommendations
Modeling Recommendations
Employing an Adaptive Management Approach
Public Engagement
Watershed Planning
VIII. Buffalo Sewer Authority Financing
IX. Summary of Recommendations
TABLE OF CONTENTS
Buffalo Niagara RIVERKEEPER

Green Infrastructure Solutions 6pg/
The impact of combined sewage discharge on the health of our local Buffalo Niagara waterways has been well documented for generations. The issue was discussed in many Erie Niagara Regional Planning Board documents
as well as in the first generation of Buffalo and Niagara River Remedial Action Plans and in the Scajaquada Creek Watershed Management Plan.
In 2004 the Buffalo Sewer Authority submitted their most recent draft Long Term Control Plan for Agency review. The Buffalo Sewer Authority did not receive comments back on the document for nearly three years.
In the interim, the Buffalo Sewer Authority began implementation of a series of first generation projects that were outlined in the draft Long Term Control Plan. These projects included the installation of flow modification devices, plant capacity upgrades, sewer separations and the implementation of aeration and floatable control mechanisms at the Hamburg Drain. The Buffalo Sewer Authority has reported that these projects have reduced combined sewer overflow events at specific outfalls, expanded overall treatment capacity and improved the quality of some of the outfall flows. As the regulatory agency negotiations resumed, the Buffalo Sewer Authority invested in an update and refinement of its system model which was scheduled for completion in late 2010.
RIVERKEEPER’s goal has been to introduce the Buffalo Sewer Authority to local green infrastructure opportunities. Our comments on the 2004 Long Term Control Plan identified several existing models for usage of green infrastructure. We also arranged a tour for Buffalo Sewer Authority officials of Toronto’s Green Infrastructure facilities in 2008 and Rochester’s green infrastructure projects in 2010. We have collaborated with the Buffalo Sewer Authority on green infrastructure project opportunities within the Olmsted Parks. In addition, since the spring of 2010, the Buffalo Sewer Authority has been actively working with Buffalo Niagara RIVERKEEPER to implement a pilot downspout disconnection and rain barrel distribution program in two of the City’s neighborhoods. Starting in late 2010, the BSA committed to implementing a green streets demonstration project in the SPP 240/ CSO 60 sewershed. As a measure of our strong collaboration, the Buffalo Sewer Authority provided a letter of support for our funding applications for this project.
Throughout these efforts Buffalo Sewer Authority (BSA) representatives have kept an open mind and maintained their commitment to an evaluation of green infrastructure opportunities based upon their technical merits. RIVERKEEPER met weekly with long standing BSA staff members to ensure we had an accurate understanding of Buffalo’s highly complex combined sewer piping system. Buffalo Sewer Authority consultants provided technical assistance with GIS data as well.
In addition to Buffalo Sewer Authority staff, representatives from City of Buffalo Department of Public Works, Office of Strategic Planning, the Planning Board and Environmental Management Council have been extremely cooperative during our green infrastructure feasibility study. Despite looming deadlines, staff members worked diligently to convene a group of technical experts to determine if green street techniques could be incorporated into ongoing projects, many on the eve of project construction. Furthermore, Office of Strategic Planning representatives have worked to include green infrastructure elements in the City’s recent South Buffalo Brownfield Opportunity Area program and have identified stormwater management as an objective of City’s upcoming zoning code update.
It is on this foundation of cooperation that we rest this report.
INTRODUCTION1The Buffalo Sewer Authority and the Overflow Abatement Process
Buffalo Niagara RIVERKEEPER

Green Infrastructure Solutions 7pg/
Graphic by Buffalo Niagara RIVERKEEPER
OVERVIEW
Currently, municipal sewer overflow discharges represent one of our watershed’s greatest ongoing sources of water pollution. With almost every rain event, the City of Buffalo’s Combined Sewer Overflow system gets overwhelmed by rain water flow into the system which results in the dumping of millions of gallons of raw sewage into our local waterways. These sewer discharges have real impacts on the western New York region, severely undermining both quality of life and the economic development potential of the region.
These impacts are not distributed equally among the Western New York region. Poor urban neighborhoods bear a disproportionate share of the Buffalo’s sewage pollution impacts. Often located in the shadow of former industrial sites, these poorer neighborhoods feature small, narrow residential lots with minimal public open space and few, if any, recreational facilities. These residents rely upon the waterways for passive recreation such as sitting near the water, picnicking and walking as well as for boating, fishing and swimming. Individuals regularly swim in both the Buffalo River and the Black Rock Canal despite the pollution, the absence of bathing beach facilities and adequate safety precautions. Interviews with local anglers indicate that many are unaware about fish consumption advisories and to discharge warning signs, which inform anglers not to fish directly over combined sewer outfall pipes. Specific consequences to our ongoing CSO problem include:
Although it is the third most popular freshwater fishery in the US, the Niagara River’s fish populations are inedible and continue to decline due to poor water quality.
The combined sewer overflow at the Hamburg Drain deposits raw sewage into the heart of the historic Erie Canal District’s newly constructed Commercial Slip which must be manually cleaned daily in order to minimize negative impacts on tourism.
Sewage overflows into Scajaquada Creek result in a horrendous stench which limits use of both the Creek and of Olmsted’s Delaware Park.
Overflows to Black Rock Canal undermine paddling and rowing activities – threatening the health of water sport enthusiasts who utilize the City’s multi-million investment into the new Frank Lloyd Wright boathouse.
River clean up volunteers and neighborhood residents that venture into the water to retrieve trash are rewarded with
gastrointestinal illnesses and physical rashes due to water exposure.
Dog owners report intestinal illnesses after pets swim in local waterways.
For decades, local, state, federal and binational projects have targeted the improvement of our rivers. These project success stories include remediation of many inactive hazardous waste sites, implementation of the State Permitted Discharge Elimination System, the Niagara River Toxic Management Plan, Niagara River Remedial Action Plan, Regional Municipality of Niagara’s Niagara Water Quality Protection Strategy, the Niagara River Habitat Inventory, Niagara Robert Moses Hydropower
Facility Relicensing Agreement, the Niagara River Greenway Plan and several significant habitat restoration projects.
In 1987, the United States-Canada Great Lakes Water Quality Agreement (Annex 2 of the 1987 Protocol) identified both the Niagara River and one of its largest tributaries, the Buffalo River, as two of forty-three Great Lakes Areas of Concern (AOC). These trouble spot AOC’s fail to meet the environmental objectives of the Agreement and suffer unacceptable impairments of natural integrity and beneficial human uses.
About one-fourth of the river miles in the Niagara River/Lake Erie Basin (approximately 1,216 miles) are areas that are listed on the NYS Department of Environmental Conservation’s (NYSDEC) Priority Water bodies List. These areas are listed for either not supporting beneficial uses or for having minor impacts or threats to water quality. All of the Buffalo Sewer Authority receiving water bodies are categorized on this DEC list as impaired. The list identifies storm (urban runoff) and/or combined sewer overflows as pollution sources for each receiving water body. Meeting our goal of swimmable, drinkable, fishable waters will require that we eliminate combined sewer overflows into our local waterways.
II THE IMPACT OF CSO’S ON THE NIAGARA RIVER WATERSHED
Buffalo Niagara RIVERKEEPER

Green Infrastructure Solutions 8pg/
THE NIAGARA RIVER WATERSHED
The Niagara River links the United States with Canada as she travels the thirty-seven miles of her route from Lake Erie to Lake Ontario. The Niagara carries an average flow of 212,300 cubic feet per second (cfs), comprising 83% of Lake Ontario’s tributary flow. As the outlet for four of the five Great Lakes, the Niagara watershed drains approximately 264,000 square miles (684,000 kilometers) of the Niagara region, on both sides of the river; the equivalent to the size of Texas (266,000 miles).
Locally, the Niagara River watershed in the United States has a drainage area of approximately 1,225 square miles which includes five counties and 1.5 million residents. Its principle tributaries are the Buffalo River (including Cazenovia, Buffalo and Cayuga Creeks), Tonawanda Creek, Scajaquada Creek, Cayuga Creek and Smokes Creek.
NIAGARA RIVER EMERALD
CHANNEL DRINKING WATER SOURCE
Two municipal water supply agencies draw their water from Eastern Lake Erie and/or the Niagara River in Erie County:
The Buffalo Water Authority, which draws the City’s water from the mouth of the Niagara at the Emerald Channel, and
The Erie County Water Authority Van DeWater Treatment Facility in Tonawanda, which lies approximately one and one half miles downstream from the City of Buffalo’s largest combined sewer overflow discharge at Cornelius Creek.
NIAGARA RIVER ALONG
SQUAW ISLAND
As Lake Erie narrows to form the Niagara River just southwest of the Peace Bridge, the full 200,000 cubic feet per second flow of the upper four Great Lakes is channeled into one of the system’s narrowest points, forming the headwaters of the Niagara River at a mere 1,500 feet across. As these headwaters are also very shallow in this stretch of the River (a mere seventeen foot deep,) water flowing past the Peace Bridge can attain a speed of 8.18 miles per hour. As the River moves past the Peace Bridge and the historic “Black Rock” ledge, the river deepens to as much as 44 feet at it passes the Buffalo Sewer Authority Sewage Treatment Plant on Squaw Island.
Within this stretch of River, currents are strong and feature several dangerous undercurrents that have resulted in numerous drowning incidents that have caused the closure of swimming beaches on the Canadian shoreline opposite the Buffalo Sewer Authority treatment plant on Squaw Island. However, here in Buffalo, youth still continue to swim on the western side of the Bird Island Pier and Squaw Island – hoping to coast on the River’s current on warm summer days.
Niagara River Watershed
Source: Buffalo Niagara RIVERKEEPER
View of Buffalo’s Inner Harbor and Lake Erie
Source: Buffalo Niagara RIVERKEEPER
View of Emerald Channel
Source: Buffalo Niagara RIVERKEEPER
Buffalo Niagara RIVERKEEPER

Green Infrastructure Solutions 9pg/
THE NIAGARA RIVER WATERSHED
Boating in this section of the River has historically been reserved to motorized craft including motor boats, speed boats and personal watercraft. Increasingly however, experienced white water kayakers have been using the channel in appreciation of its wave action and high energy environment.
Shoreline angling is also popular within this area of the River. A full list of fish species for this section of the Niagara was assembled by the Peace Bridge Authority and has been provided in the Appendix. Most local anglers, particularly those who fish in this stretch, consume their catch, despite all Niagara River fish consumption warnings. Efforts are being made by local non for profits to educate the local anglers of problem and safer consumption methods.
NIAGARA RIVER AT CORNELIUS CREEK
As the Niagara River passes the North End of Squaw Island, the
channel quickly triples in width in the area immediately adjacent the City of Buffalo’s outfall at Cornelius Creek. The River again grows shallow with depths in the low teens, except for the Black Rock Canal Channel which is maintained at a depth of 22 feet. As the River continues towards Tonawanda and Grand Island, the River’s unique and isolated islands provide critical habitat for large groups of colonial water birds including heron and egrets as well as eagles and osprey.
The Niagara River is actively used for motorized boating in this corridor, with several small marinas located in the protected inlets along the shoreline. The City’s only free boat launch site is located here at the Black Rock Canal Park. This site has been the focus of a revitalization effort that would include expanded habitat areas, improved boating, and waterfront recreation facilities. Paddling and windsurfing are also on the rise within
this corridor. Unfortunately, odors, trash and visible sewage from the City’s largest combined sewer overflow outfall have severely undermined the use and revitalization of this important public waterfront access site. Adjacent marina operators have expressed frustration that they must clean boats after rain events as the result of sewage discharge.
Local members of the Black Rock Canal Park planning committee are also frustrated with lack of clear progress in resolving the Cornelius Creek CSO issue. In fact, Black Rock Canal Park advocates have explored options in hope for somehow hiding this outfall at a cost in excess of $4 million until its resolution.
BLACK ROCK CANAL
The Black Rock Canal, which consists of the Black Rock Channel and Lock, is a protected waterway for shipping and recreational vessels in the upstream portion of the Niagara River This canal enables non-motorized boats and large freighters to avoid the strong currents in the River’s main channel.
According to the US Army Corps of Engineers, a major portion of the Black Rock Canal’s flow originates from the Buffalo River as a result of the construction of break-walls in the Buffalo Harbor. Water quality problems in the channel are further exacerbated by the flow from fourteen combined sewer overflow points including three of the largest volume discharge outfalls.
Burmese Refugees fish the Niagara River.
Location: Squaw Island Sewer Treatment Plant
Source: Newell Nussbaumer, Buffalo Rising
Ontario St. Boat Launch
Source: Buffalo Niagara RIVERKEEPER
Proposed new facility at Black Rock Canal Park
Source: Erie County
Buffalo Niagara RIVERKEEPER

Green Infrastructure Solutions 10pg/
Of particular concern are bacteria and turbidity levels. Buffalo Niagara RIVERKEEPER’s bacteria data indicate that E. coli levels in the Black Rock Canal periodically violate USEPA standards for primary contact by more than eight times, especially after storm events.
Urban runoff is identified by NYSDEC as a suspected source of pollutants to the upper Niagara River’s main stem from Lake Erie to the northern Erie County border at Tonawanda Creek, including the Black Rock Canal but not the Chippewa (west) Channel of the River around Grand Island. Priority organic compounds (including PCBs) are the known major pollutants that have impaired fish consumption and are suspected to have stressed aquatic life in the river and canal. NYSDOH Health Advisories for these waters restrict consumption of Carp due to PCB contamination. Non-priority organics, including PAHs, are also considered possible pollutants.
Due to the configuration of the Bird Island Pier breakwall, the Buffalo Harbor Marina and the Black Rock locks, combined sewage flows into the Black Rock Canal have a longer residency period than flows into the Niagara River’s main channel. Lower velocities in the canal also allow sediment deposition to occur. Sediments in Buffalo Harbor and the Black Rock Canal contain levels of contamination that exceed the levels established by USEPA and NYSDEC.
Despite these water quality concerns, this area is actively used by Niagara River Globally Significant Bird communities. The channel supports a large community of diving ducks, cormorants, terns and gulls. Increasingly, colonial water birds including heron and egrets are using the limited stretch of natural shoreline on the canal adjacent to the sewage treatment plant for fishing.
There is also substantial community water access along the Black Rock Canal including the Erie Basin Marina, LaSalle Park, Buffalo Yacht Club, the recently constructed Frank Lloyd Wright Rowing Boathouse, West Side Rowing Club, Bird Island Pier, Broderick Park and Squaw Island Park. While no formal swimming “beach” is located on the channel, Erie Basin residents, local park users and rowers often use the channel for swimming.
Erie Basin Marina residents, rowers, paddlers, and Yacht Club members are regularly plagued by the odor, bacteria levels, trash, debris and oily surface slicks that soil boats from the combined sewer outfalls.
Frank Llyod Wright Boat Launch
Source: Buffalo Niagara RIVERKEEPER
Active boaters in the Black Rock canal
Source: Buffalo Niagara RIVERKEEPER
Black Rock Canal, Brodrick Park
Source: Buffalo Niagara RIVERKEEPER
Buffalo Niagara RIVERKEEPER

Green Infrastructure Solutions 11pg/
Outfalls also cause problems for tourism. Both the Broderick Park Underground Railroad Heritage Site and the Frank Lloyd Wright Boathouse actively host bus tours filled with tourists from around the globe. Tour operators from both sites have reported that the smell from sewage overflows and treatment operations has a major negative impact on tour visitor experiences.
Throughout the Niagara River Greenway Plan development process, additional water access was proposed for the Black Rock Canal city-side wall. Park improvements, including additional public water access at both LaSalle Park and Broderick Park have also been funded by the New York State Department of State Division of Coastal Resources and the City of Buffalo.
In addition to recreational improvements, Buffalo Niagara RIVERKEEPER is working with the US Army Corps of Engineers, City of Buffalo officials and community members to identify opportunities to naturalize, stabilize, and improve habitat throughout the canal shoreline along areas that are currently bulk-headed for most of their length.
Proposed LaSalle Park Shoreline Naturalization Source: City of Buffalo
Black Rock Canal, Brodrick Park
Source: Buffalo Niagara RIVERKEEPER
Buffalo Niagara RIVERKEEPER

Green Infrastructure Solutions 12pg/
SCAJAQUADA CREEK
Scajaquada Creek’s remaining above ground segments serve as the central water features of many local parks including the Cheektowaga Town Park, Schiller Park, the historic Forest Lawn Cemetery and Frederick Law Olmsted’s Delaware Park.
Scajaquada Creek is used for wading and hiking and supports wildlife in its upper reaches. As it expands downstream the Creek provides both angling and paddling opportunities within the City of Buffalo. The creek is actively used by ducks, local colonial water birds (including three species of heron and egrets,) beaver, mink and various amphibians.
Forest Lawn Cemetery, Buffalo Olmsted Parks Conservancy, Black Rock Riverside Good Neighbors Planning Alliance members and Buffalo Niagara RIVERKEEPER are collaborating to improve wildlife habitat along the lower reaches of the Scajaquada including shoreline stabilization and buffer enhancements, the construction of wetlands in accordance with the Olmsted conservancy’s, Twenty Year Master Plan, and possible alterations to the Finger Dam trash rack to facilitate fish and paddling passage.
After several years of restricted physical access, paddling has returned in force to the Scajaquada Creek with the re-introduction of boating on Delaware Park’s Hoyt Lake and the establishment of the Scajaquada Creek Canoe Club. Additional paddling access points have been proposed as components of the NYSDOT’s Scajaquada Creek corridor downgrading project and the Rock Harbor brownfield redevelopment project.
Canoeing at Scajaquada Creek
Source: Buffalo Niagara RIVERKEEPER
Proposed improvements to Delaware Park
Source: Olmsted 2020
(Below) Proposed new development along Scajaquada Creek
Source: Ed Hogel, EB IronArt
Buffalo Niagara RIVERKEEPER

Green Infrastructure Solutions 13pg/
Combined sewage overflows and their accompanying odors, bacteria levels, trash, debris and oily slicks are well documented problems within Forest Lawn Cemetery (at the Creek’s overflow into Hoyt Lake in Delaware Park), at the Buffalo and Erie County Historical Society (where sediment deposition has created a large mound of foul smelling sludge), at the Scajaquada Creek trash rack and at the Creek’s outfall at the Black Rock Canal.
Six CSOs discharge directly into Scajaquada Creek. Known pollutants of concern include aesthetics (odor and floatables), reduced dissolved oxygen/elevated oxygen demand and pathogens. Nutrients and priority organics (PCBs) are suspected and salt is possible. These contaminants have led to the known impairment of public bathing, aquatic life and recreation, and the stress of aesthetics. RIVERKEEPER’s bacteria data show E. coli levels in Scajaquada Creek violate USEPA standards for primary contact by more than eight times for nearly every test, regardless of storm events.
Urban runoff and storm sewers are identified by the NYSDEC as known and suspected factors (respectively) contributing to the pollution of lower Scajaquada Creek from Forest Lawn Cemetery to the mouth at Black Rock Canal. Dissolved oxygen/oxygen demand, pathogens and silt/sediment are known pollutants; nutrients and priority organic compounds are suspected pollutants; and salts are possible pollutants. Along with severe Combined Sewer Overflow pollution and historic contamination, runoff leads to the known impairment of public bathing, aquatic life and recreation, as well as the stressing of aesthetics.
Delaware Park Pond, also known as Hoyt Lake, suffers from suspected urban runoff as a source for priority organics pollution. Fish consumption is also known to be impaired in the water body. NYSDOH restricts consumption of Carp from these waters.
(Below) Scajaquada Creek Historical Society adjacent to Delaware Park in Buffalo, NY
Source: Buffalo Niagara RIVERKEEPER
Grant St. “Finger Dam”
Source: Buffalo Niagara RIVERKEEPER
E.Coli testing results
Source: Buffalo Niagara RIVERKEEPER
Buffalo Niagara RIVERKEEPER

Green Infrastructure Solutions 14pg/
A SPECIAL NOTE ON BOTULISM
OUTBREAKS ON THE LOWER
SCAJAQUADA CREEK.
History: Outbreaks of botulism in wildlife, mainly mallard ducks, on Scajaquada Creek, have been reported since the early 1970’s. The files contain information from 1977, 1991, 1993, 1999 and 2001 specifically, that are related to the stretch of Scajaquada Creek between the last bridge within Forest Lawn Cemetery and the trash rack further down near Hoyt Lake. A memo from Ken Roblee to John Spagnoli (Aug., 18, 1993) refers to this portion of Scajaquada Creek as “a hot-spot for botulism.” A DEC press release states: “As of August 2, 1991, over 400 ducks had died of type C botulism at Scajaquada Creek, Forest Lawn Cemetery and Delaware Park Lake” just that year.
Cause: Reports from state pathologist Ward Stone on July 18, 1991, and again August 23, 1993, indicate that the birds he analyzed died of poisoning from Clostridium botulinum. Stone wrote: “ The sewage contamination …described from the creeks should once again provide an excellent medium for anaerobic bacterial growth and the potential production of the botulism toxin. The ducks indicate the need, in my opinion, to prevent further sewage contamination of the creek.” Test results indicated that type C botulism was the culprit.
Type C Botulism 101: According to Michigan Department of Natural Resources type C botulism “occurs principally in waterfowl and other birds living in an aquatic environment and causes tremendous losses… Type C toxin occurs in the carcasses of dead invertebrates, in the flesh of birds dying of botulism, and in maggots feeding on toxic carcasses. In a type C botulism outbreak the sequence of events are: aquatic invertebrates ingest the bacterium when feeding and a lowering of water levels or an increase in water temperature causes large numbers of the invertebrates to die. The carcasses of the invertebrates provide a good medium for growth of the bacterium with subsequent production of toxin. Ducks feeding on the toxic dead invertebrates found in the bottom sediments become poisoned and die. Maggots infesting the duck carcasses become toxic and are eaten by ducks and other species of birds, thus increasing bird mortality in an explosive manner. Large-scale outbreaks of type C botulism often are associated with periods of hot weather, high water temperature, low water levels, or changing water levels. Outbreaks of botulism are initiated by die-offs of water invertebrates; therefore stabilization of water levels and temperatures in late summer would reduce the potential for an outbreak.”
According to authors Tonie E. Rocke and Milton Friend “Numerous outbreaks of avian botulism have been associated with sewage and other wastewater discharges into marshes. This relationship is not presently understood, but outbreaks have occurred often enough that wetland managers should discourage the discharges of these effluents when many waterfowl or shorebirds are using the area or are likely to use an area during warm weather.
Buffalo Sewer Authority: On Nov. 19, 1993, DEC Permit
Administrator Steven Doleski issued an “Emergency Authorization for Scajaquada Creek Cleaning” to David Comerford, General Manager of the Buffalo Sewer Authority. The emergency action called for the BSA to remove 10,000 cu. yards of sediment from a 3,000-foot section of the Scajaquada Creek (“from a point adjacent to Mirror Lake, to the head of the Hoyt Lake bypass conduit”) as “the sediment is believed to harbor the botulism organism that has recently caused the death of many water fowl on the stream”. Sediment was to be removed by truck to either the Waste Water Treatment Plant or the CDF #4. A plan for this work was to begin within 60 days, with removal commencing in the Spring 1994. A 7/15/96 memo from Ken Roblee stated that planning was begun, but the work never done: “I believe the reason was that removal was too costly.” According to the same memo: “Storm flows from the CSOs in the Town of Cheektowaga and the City of Buffalo have left the sediments of the creek highly contaminated with sewage.
Next Steps: Based upon this initial review of DEC documents and research regarding the potential relationship between botulism and combined sewer overflows on Scajaquada, RIVERKEEPER would like to highlight the need to further investigate the potential connection between combined sewer overflows and botulism. In particular, there is a need to determine to what extent type C botulism is occurring in historic sedimentation areas and sewage flows, under what conditions does type C botulism become problematic and, if there is a link to the sewer system, what management options can be employed to prevent further outbreaks.
Buffalo Niagara RIVERKEEPER

Green Infrastructure Solutions 15pg/
CAZENOVIA CREEK
Within the City of Buffalo, Cazenovia Creek is largely protected as it winds through the Frederick Law Olmsted designed Cazenovia Park on its route to the Buffalo River. This Creek is actively used for hiking, wading, paddling and fishing by local residents and park users. Historically, the creek was dammed to create a large lake that was used for small row boats.
As part of its Twenty Year Master Plan, the Buffalo Olmsted Parks Conservancy is advocating for the reintroduction of wetlands along the Creek’s floodplain. In addition to providing attractive recreational and habitat features, these constructed wetland areas could help “polish” untreated stormwater entering the Creek from areas where separate sewer systems have been installed.
Fishing at Base of Cazenovia Creek CSO
Source: Buffalo Niagara RIVERKEEPER
Cazenovia Creek in Cazenovia Park Source: Buffalo Niagara RIVERKEEPER
Proposed improvements to Cazenovia Creek Park. Source: Olmsted conservancy 2020 Master Plan
Buffalo Niagara RIVERKEEPER
Green Infrastructure Solutions 16pg/
BUFFALO CREEK
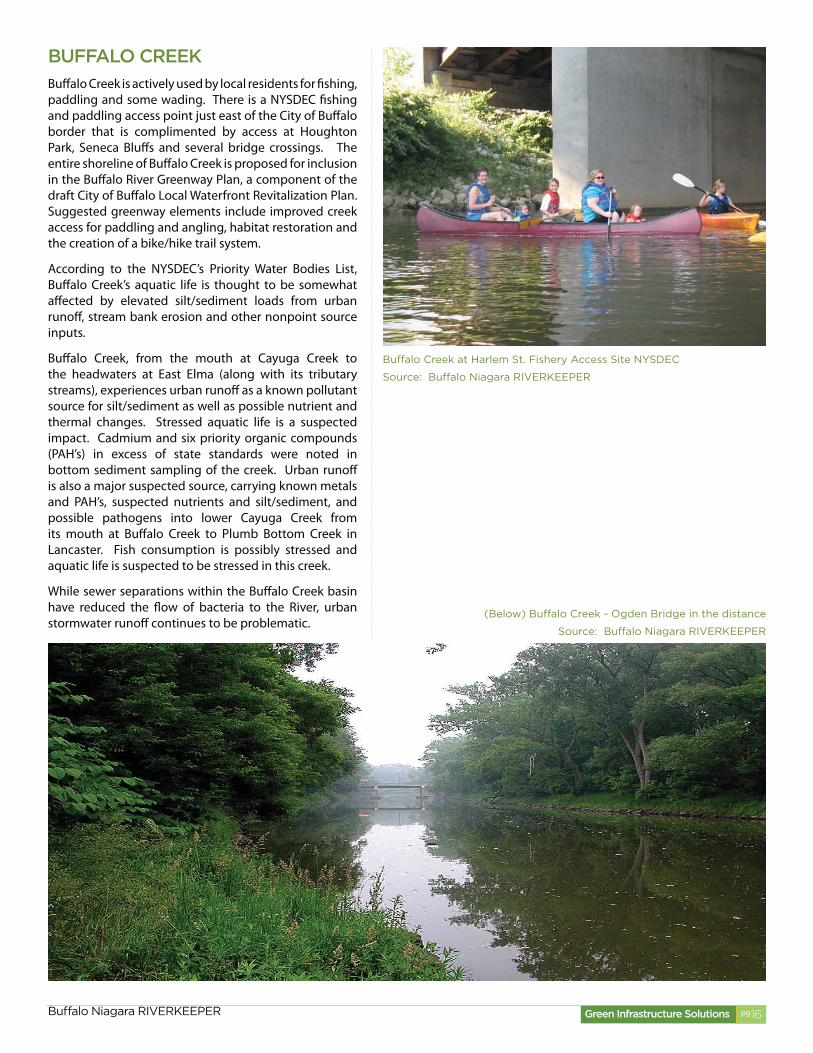
Buffalo Creek is actively used by local residents for fishing, paddling and some wading. There is a NYSDEC fishing and paddling access point just east of the City of Buffalo border that is complimented by access at Houghton Park, Seneca Bluffs and several bridge crossings. The entire shoreline of Buffalo Creek is proposed for inclusion in the Buffalo River Greenway Plan, a component of the draft City of Buffalo Local Waterfront Revitalization Plan. Suggested greenway elements include improved creek access for paddling and angling, habitat restoration and the creation of a bike/hike trail system.
According to the NYSDEC’s Priority Water Bodies List, Buffalo Creek’s aquatic life is thought to be somewhat affected by elevated silt/sediment loads from urban runoff, stream bank erosion and other nonpoint source inputs.
Buffalo Creek, from the mouth at Cayuga Creek to the headwaters at East Elma (along with its tributary streams), experiences urban runoff as a known pollutant source for silt/sediment as well as possible nutrient and thermal changes. Stressed aquatic life is a suspected impact. Cadmium and six priority organic compounds (PAH’s) in excess of state standards were noted in bottom sediment sampling of the creek. Urban runoff is also a major suspected source, carrying known metals and PAH’s, suspected nutrients and silt/sediment, and possible pathogens into lower Cayuga Creek from its mouth at Buffalo Creek to Plumb Bottom Creek in Lancaster. Fish consumption is possibly stressed and aquatic life is suspected to be stressed in this creek.
While sewer separations within the Buffalo Creek basin have reduced the flow of bacteria to the River, urban stormwater runoff continues to be problematic.
Buffalo Creek at Harlem St. Fishery Access Site NYSDEC
Source: Buffalo Niagara RIVERKEEPER
(Below) Buffalo Creek - Ogden Bridge in the distance
Source: Buffalo Niagara RIVERKEEPER
Buffalo Niagara RIVERKEEPER

Green Infrastructure Solutions 17pg/
BUFFALO RIVER AREA OF CONCERN
In 1987, the International Joint Commission designated the lower 6.1 miles of the Buffalo River as a Great Lakes Area of Concern. Known impacts include impaired fish consumption and stressed recreational potential with the suspected impact being stressed aquatic life. Pollutants of concern include known priority organics (PCBs), suspected reduced dissolved oxygen/elevated oxygen demand and pathogens. NYSDOH advisories for these waters restrict consumption of Carp due to PCB contamination.
Both the Buffalo River main stem and the major tributary, Cazenovia Creek, have a combined total of 39 CSOs, nearly 60% of the City’s total. RIVERKEEPER’s bacteria data show E. coli levels in the Buffalo River and Cazenovia Creek routinely violate USEPA standards for primary contact by more than eight times, especially after storm events.
Urban runoff is a known pollutant source contributing to the impacts to the Buffalo River, including known impaired fish consumption and stressed recreational potential as well as suspected stressed aquatic life. Storm sewers from portions of the watershed with separated sewer systems are considered a possible pollutant source. Pollutants of concern include known priority organics (PCBs). NYSDOH Health Advisories for these waters restrict consumption of Carp due to PCB contamination.
Through the Buffalo River Remedial Action Planning process, significant work has been completed to restore the Buffalo River. Today, while the majority of the shoreline remains armored, hundreds of acres of land have been remediated and restored to open space for habitat and recreational uses. In summer 2011, work will commence on a large scale sediment remediation effort. That project will be followed by significant habitat restoration work throughout both the River channel and its upland buffer area.
Canoeing in the Buffalo River
Source: Buffalo Niagara RIVERKEEPER
Children swimming in the Buffalo River
Source: Buffalo Niagara RIVERKEEPER
Buffalo Niagara RIVERKEEPER

Green Infrastructure Solutions 18pg/
In addition, several projects are underway to increase community access to the River for water based recreation. These sites however, are located alongside numerous CSO locations. NYSDEC fishing and paddling access sites were created at Bailey Avenue, Smith Street (CSO # 26) and Ohio Street (CSO # 23-64). A new rowing boat house, adjacent to the Ohio Street site, (CSO # 23-64) opened in spring 2010, which facilitates both youth and adult rowing. The New York Power Authority is creating a pocket park at Hamburg Street (CSO # 25) which is set to open in 2010 with a new paddling launch and angling facilities. Buffalo Riverfest Park, slated for construction in summer 2010, will create additional shoreline access with a kayak livery, dock space and fishing access.
West of the Michigan Avenue Bridge, the NYS Erie Canal Harbor Development Corporation is investing more than $300 million to revitalize the City’s downtown shoreline – including the restoration of the historic Commercial Slip (Hamburg Drain CSO # 17), the construction of new community dock space, operation of a paddling livery and outdoor park space.
Since the recreation of the Commercial Slip, combined sewer outfall problems have received tremendous amounts of public attention as CSO # 17’s outfall odors, floatables and debris plague both land-side and boating visitors at this very visible destination location. Less visible, but just as detrimental, elevated bacteria levels continue to pose a threat to the site’s paddling visitors.
Ohio St. Boat Launch
Source: Buffalo Niagara RIVERKEEPER
Proposed Buffalo River Public Space
Source: ECHDC
(Above) Commercial Slip
Source: Buffalo Niagara RIVERKEEPER
Buffalo Niagara RIVERKEEPER

Green Infrastructure Solutions 19pg/
III
Buffalo’s Draft Long Term Control Plan (2004), proposes three main types of strategies for solving its combined sewer overflow (CSO) situation:
Increasing the size of pipes and either increasing or creating newer, larger, underground storage tanks that are able to store water until such a time as the combined system is able to handle the flows;
Changing the weirs and other flow regulating/monitoring devices;
Separating the sanitary lines from the storm lines and running the resulting separated stormwater directly into a receiving body of water.
These types of engineering solutions are commonly referred to as “grey infrastructure.” While these approaches may result in fewer combined sewer overflow events, there are significant problems with implementing grey infrastructure solutions in stormwater management.
Sewer separation is problematic because it solves one wa-ter quality problem (sanitary waste) by generating another (stormwater or urban runoff). According to DEC’s Priority Wa-ter bodies List – BOTH sanitary waste and stormwater waste (urban runoff) are a source of pollution for Buffalo Sewer Au-thority receiving water bodies. Sewer separation sends more untreated storm water to local waterways than the combined sewer system – increasing nonpoint source pollution, erosion and flood potential.
Land Use Pollutant Concentration(mg/L)
% RemovalEffluent
Concentration(mg/L)
Runoff Volume
(gal)
Pollutant Load(lbs)
Paved Parking Lot
w/treatmentTSS 130 707.89 26 25,800 5.6
Meadow TSS 125 0 25 1,600 0.34
From “Managing Wet Weather with Green Infrastructure Municipal Hanbook” EPA, December 2008, pg4
“Traditional stormwater controls have focused almost exclusively on reducing pollution without addressing the increased vol-ume of stormwater discharged from urbanized areas. The benefits gained from removing pollutants are often overshadowed by the magnitude of runoff volume. Even with storm water controls and high rates of pollutant removal, absent volume reductions, urban areas will contribute more pollution than pre-development conditions making it difficult to achieve water quality standards. Table 1 highlights this condition with the familiar example of the runoff from a one-acre meadow and a one-acre parking lot after a one-inch of rain.”
BUFFALO’S LONG TERM CONTROL PLAN AND THE REGULATORY ENVIRONMENT
EPA TABLE 1: RUNOFF VOLUME AND POLLUTANT LOAD FROM ONE-ACRE PARKING LOT WITH TREATMENT AND MEADOW FOR A ONE-INCH RAIN EVENT
Increasing system storage and treatment capacity also faces challenges. In particular, this approach:
Is highly inefficient on dry days;
Does not work during wet weather when the designtarget is a ten year event;
Takes clean rainwater, pollutes it through the stormwater runoff and conveyance system and then fails to clean it back to’clean rainwater’ standards;
is expensive to build,
Does not provide any visable benefit to the local community in terms of above ground infrastructure. As Milwaukee’s Mayor Barret stated, “You can’t have a picnic on ann underground storage tank”;
Does not provide any of the collateral environmental or economical benefits associated with green infrastructure;
Buffalo Niagara RIVERKEEPER

Green Infrastructure Solutions 20pg/
Source: Buffalo Niagara RIVERKEEPER
Source: Buffalo Niagara RIVERKEEPER
Green infrastructure, seeks to introduce built systems that mimic natural systems by capturing clean rainwater and maximize the extent it soaks into the ground water table. This can be accomplished through the introduction of pervious areas such as rain gardens, large and small scale bioretention areas, brick and cobblestone streets, catchment basins, reconstructed wetlands, forested zones, green roofs, and community gardens. These areas can then hold rainwater that would otherwise be channeled into the City’s combined sewer system.
In this way, Green Infrastructure works to:
rainwater overwhelms system capacity;
otherwise clean rain water;
helping to maintain lake levels.
Buffalo Niagara RIVERKEEPER

Green Infrastructure Solutions 21pg/
AffordableAdaptable to Project ScaleReduces CSO EventsMeets Watershed-Based Planning GoalsCreates Jobs Reduces Social Cost Enhances Quality of LifeReduces Effects of Excessive HeatImproves Air QualitySaves Energy Tangibility of Benefits
Complet
e
Sewer
Sep
arat
ion
Larg
e Sc
ale
Stor
age (T
unne
ls)
Plan
t Exp
ansio
n
(Sat
ellite
Trea
tmen
t)
Green
Infra
stru
ctur
e
with
Trad
ition
al
Infra
stru
ctur
e
Comparison of Benefitsof Sewer Approaches
GREY VS. GREEN INFRASTRUCTURE
Source: Buffalo Niagara RIVERKEEPER, adapted from EPA report (Managing Wet Weather with Green Infrastructure)
The effectiveness and benefits of green infrastructure as a stormwater management and combined sewer abatement tool have been extensively studied and are widely accepted as a viable water management approach. Several Great Lakes and northeastern U.S. communities including Toronto, Chicago, Milwaukee, Cleveland, Boston, and other communities have begun implementation of green infrastructure programs.
According to national water experts, green infrastructure also has the potential to impact the economic dimension of sewer abatement in three ways asit can:
EPA’s report Reducing Stormwater Costs through Low Impact Development Strategies and Practices, green infrastructure solutions can be less expensive than traditional grey infrastructure because they are implemented above ground, are smaller scale, have lower health and safety precautions, and demand less advanced engineering.
on sewer abatement. According to the National Highway Administration Job Decoder, the construction of $500 million in new grey sewer infrastructure would create approximately 17,280 jobs. Rehabilitating existing infrastructure would create 18,800 jobs. The same size investment in green infrastructure would create 20,480 jobs.
These include effective vacant land management, Olmsted park restoration, neighborhood revitalization, Great Lakes recharge, energy conservation, community gardens, food production, and forestry.
Buffalo Niagara RIVERKEEPER

Green Infrastructure Solutions 22pg/
The U.S. Environmental Protection Agency and the New York State Department of Environmental Conservation have each demonstrated their willingness to utilize green infrastructure solutions for sewer abatement. Within EPA Region 2, both Philadelphia and Onondaga County have prepared Long Term Control Plans and negotiated Consent Decrees with substantial green infrastructure elements. This year, the US EPA finalized a consent decree with Kansas City with similar green infrastructure elements.
In these agreements, some or all of the regulated communities have agreed to:
Develop a detailed model of their sewer system that accurately predicts how reductions in stormwater inputs or adjustments to the sewer conveyance structures will impact overflows to the receiving water bodies;
Establish very high percentage targets (95% - 98%) for the capture and treatment of combined sewer flows;
Change local zoning, building, or utility regulations to require that both redevelopment and new development capture and allow the first inch of rain to infiltrate the ground within their parcel footprint (with some exceptions);
Change local sewer pricing structures to reflect stormwater flow generated by individual parcels/customers;
Implement an initial series of green infrastructure projects or incentive programs including green streets, parking lots, roofs, and downspout disconnection, and measure the results of these projects;
Actively engage the community in the water quality management process;
Prepare a Long Term Control Plan that prioritizes the reduction of stormwater flow into the combined sewer system through green infrastructure with grey infrastructure solutions as needed once source flow has been reduced;
Implement the Long Term Control plan over an extended time horizon (25 years);
Utilize adaptive management to adjust the sewer abatement strategy based upon actual results;
Participate in or lead watershed management planning efforts designed to address regional water quality problems.
In addition to taking issue with the 2004 Draft Long Term Control Plan’s exclusive reliance on grey infrastructure, another issue with that Plan is its reliance on using the “presumptive approach” as the CSO control alternative.
Under the presumption approach, the permittee, (in this case the BSA) must develop CSO control alternatives that either:
Limit the overflow events that do not receive at least minimum treatment to 4 - 6 events per year;
Capture, for minimum treatment, at least 85% by volume of combined sewage collected, or
Remove the mass of pollutants that have been identified as causing water quality impairment.
RIVERKEEPER strongly questions the effectiveness of using this approach. Using the figures prepared for a one inch rain event, RIVERKEEPER estimates that the Buffalo Sewer Authority should currently be able to capture 600 million gallons, or 80%, of its
total combined storm and wastewater flow.
Essentially, this level of capture is not nearly enough to prevent pollution in our local waterways. In addition to the polluted flow received from the upper watershed, there are several possible reasons for this disconnect.
First, the calculation is prepared for the entire City of Buffalo sewage flow and does not reflect the localized impacts of specific discharges on individual receiving water bodies. Second, the specific geographic conditions of each waterbody may prevent the dilution and movement of pollution away from the near shore areas. For example, sewage outfalls into the Black Rock Canal are much more likely to have longer resident times due to reduced flow at the Canal locks than discharges west of Squaw Island which flow into the high volume Niagara River. Finally, urban runoff, whether carried either in the City’s separated sewer system, or in its direct connections to local waterways, will deposit untreated stormwater into local water bodies.
While much research has been prepared regarding the significant influence of the upper Buffalo River watershed flow on City of Buffalo’s water quality, it is important to keep this data in perspective. In particular:
developed for Scajaquada Creek;
actions with many upper basin communities;
Canal are not driven by upper watershed conditions;
gallons of combined sewage flow to the Niagara River and its tributaries, creating substantial localized and near shore impacts.
The alternative to the presumptive approach is called the “demonstrative approach” and it focuses on the actual Water Quality Standards (WQS) of the receiving water bodies by requiring permittees to protect designated uses and ensure that any CSO discharges remaining after implementation of planned control programs will not preclude the attainment of WQS or designated uses or contribute to impairment.
RIVERKEEPER strongly advocates for use of the demonstrative approach in creating and evaluating the Buffalo Sewer Authority’s Long Term Control Plan.
Scajaquada Creek at Delaware Park
Source: Buffalo Niagara RIVERKEEPER
Buffalo Niagara RIVERKEEPER

Green Infrastructure Solutions 23pg/
THE EFFECTS OF STORM WATER ON BUFFALO’S WASTEWATER TREATMENT CAPACITYIV
According to the Buffalo Sewer Authority’s Draft Long Term Control Plan and discussions with Authority engineers, the BSA has the capacity to treat up to 240 million gallons of wastewater per day during dry weather. Based upon City Stat reports, approximately 150 million gallons of wastewater currently enters the system for processing each day. Thus, on a dry day, the BSA actually has significant excess treatment capacity.
However, during rainy weather or snowmelt, the picture changes dramatically. For instance, RIVERKEEPER has estimated that a one inch rain event (95% of all rain events in Buffalo are 1.1” or less) generates over 590 million gallons of stormwater into our combined sewer system. This stormwater mixed with the wastewater already in the system equals nearly 750 million gallons of combined sewage surging through the system.
150 MGD SanitarySewage Average
(Dry Flow)
590.5 MGD Wet Weather (1 inch Event)
740.5 MGD During Wet Weather
(1 inch Event)
+
Sewer Shed Name
Road Surface Area (SF)
Road Surface Area
(Acres)
Total Parcel Area Acres
Impermeable Parcel
Coverage
Total Impermeable
Coverage With Roads
Gallons of Runoff
(1 inch event)
Albany Street 6,512,596.06 149.51 707.89 64% 70% 16,296,360
South Central 75,967,450.78 1,743.97 11,355.33 53% 60% 213,980,021
Hertel 25,577,726.68 587.18 3,751.26 55% 60% 70,681,738
Scajaquada 100,344,253.17 2,303.59 14,451.56 53% 60% 273,704,431
Ontario 4,774,507.37 109.61 445.68 54% 63% 9,452,565
Parish 1,927,174.30 44.24 352.50 53% 60% 6,414,414
Totals 215,103,708.36 4,938.10 31,064.21 590,529,530
Stormwater Calculations After a 1” Rain Event
Source: Buffalo Niagara RIVERKEEPER
Buffalo’s CSO Analysis Source: Buffalo Niagara RIVERKEEPER
Buffalo Niagara RIVERKEEPER

Green Infrastructure Solutions 24pg/
Normal Mode:
Primary Bypass Mode:
Partial Treatment Mode:
During Dry Weather
During Wet Weather: Senario 1
During Wet Weather: Senario 2
WWTPInfluent
Preliminary Treatment
Secondary Treatment
Primary Treatment
WWTPEffluent
WWTPInfluent
Preliminary Treatment
Secondary Treatment
Primary Treatment
WWTPEffluent
Primary Bypass
WWTPInfluent
Preliminary Treatment
Secondary Treatment
Primary Treatment
WWTPEffluent
Primary Bypass
Partially Treated Discharge to Niagara
River
203 MGD (DiMascio) increasing to 240 MGD with grit chamber upgrades
240MGD (Primary + Secondary)+ 360 MGD (Bypass to Secondary)
600 MGD Total Treatment
240 MGD Primary & Chlorine > River (Outfall 001)
360 MGD (Bypass to Secondary)
Sewage Treatment Capacity
Source: BSA (Draft) LTCP (2004)
This amount of stormwater obviously far exceeds the capacity of the treatment plant to provide full primary and secondary treatment. For the first 600 million gallons of combined flow, however, the BSA can provide at least a minimal level of treatment.
Every gallon of combined flow over 600 million gallons, however, never makes it to the treatment plant for any level of treatment. Rather, it overflows – raw sewage and all – into our local water bodies at one of our over 60 combined sewage outfalls.
Buffalo Niagara RIVERKEEPER

Green Infrastructure Solutions 25pg/
As stormwater is the culprit behind the CSO problem, the most direct way to solve the problem is to keep the stormwater out of the system in the first place. Using the stormwater run-off data we generated for each sewershed, we have estimated that by pursuing an aggressive green infrastructure program, the Buffalo Sewer Authority could reduce stormwater flow into the system by up to 45% during 95% of wet weather events.
This would take total combined flow during a one inch rain even down from the current 740 million gallons, to 450 million gallons, ensuring that ALL flow into the system would receive at least some level of treatment at the water treatment plant.
45% Flow Reduction During
95% of Wet Weather Events
60% residential downspout disconnect
70% reduction from commercial & industrial
60% green streets
90% schools/parks
POTENTIAL FLOW REDUCTION
UTILIZING AGGRESSIVE GREEN
INFRASTRUCTURE OVER 20 YEARS
Sewer Shed Road Surface Surface Area Total Parcel Parcel Coverage Gallons of Over 20 Years Name Area (SF) (Acres) Area Acres Coverage With Roads Runoff (Aggressive Approach)
Albany Street 6,512,596.06 149.51 707.89 64% 70% 16,296,360 (8,534,331)
South Central 75,967,450.78 1,743.97 11,355.33 53% 60% 213,980,021 (93,272,426)
Hertel 25,577,726.68 587.18 3,751.26 55% 60% 70,681,738 (36,934,462)
Scajaquada 100,344,253.17 2,303.59 14,451.56 53% 60% 273,704,431 (119,403,555)
Ontario 4,774,507.37 109.61 445.68 54% 63% 9,452,565 (36,934,462)
Parish 1,927,174.30 44.24 352.50 53% 60% 6,414,414 (2,450,121)
Totals 215,103,708.36 4,938.10 31,064.21 590,529,530 (297,529,357)
Buffalo Sewershed Analysis
Source: Buffalo Niagara RIVERKEEPER
This level of capture would be achieved by implementing an aggressive green infrastructure campaign, including acheiving 60% downspout disconnection in residential properties a 70% reduction of flow from commercial and industrial properties, having 90% of schools manage their stormwater on-site, and converting 60% of our streets to green streets. We have applied these numbers to each sewershed and aggregated them for the total flow numbers for the City.
The complete methodology behind our predicted stormwater run-off can be found in Appendix 3: Methodology. By targeting our programs by sewershed, we are able to more accurately predict rainfall amounts and tailor solutions to specific problem areas. The tables summarizing the predicted run-off reduction per 1” rainfall event for each sewershed, along with the maps of surface level impermeability are as follow:
Source: Buffalo Niagara RIVERKEEPER
Buffalo Niagara RIVERKEEPER

Green Infrastructure Solutions 26pg/
SOUTH CENTRAL SEWER SHED
SOUTH CENTRAL SEWER SHED Runoff
Long-Term Effort Impermeable Green Infrastructure Impervious Area Impervious Area Assumed Capture Reduction
Land use/Impervious Coverage (5) Acres Surface Acres Project/Program Type Managed (%) Managed (Acres) Volume (Inches) (Gal/1” Event)
Residential (55%) 2,958.65 1,627.26 Downspout Disconnect 60% 967.35 1.00 48,330,167.41
Industrial (75%) 767.40 575.55 Rate incentives 70% 402.88 1.00 12,535,587.09
Commercial (95%) 2,898,20 2,278.20 Rate Incentives 70% 1594.74 1.00 39,173,505.48
Rail (25%) 1,682.40 420.60 Rate Incentives 0% 0.00 1.00 27,482,384.23
Outdoor Pools, Closed Quarries (25%) 9.70 2.42 50% 1.21 1.00 158,435.36
Park/Vacant Land (5%) 3,396.23 169.81 Disconnections in Parks 90% 152.83 1.00 55,478,184.61
Inactive Rail (10%) 124.36 12.44 Greenway Trails Network 70% 8.71 1.00 2,031,481.38
Schools (35%) 18.49 6.47 School Greening 90% 5.83 1.00 302.087.33
Streets (100%) 1,400.28 1,400.28 Green Streets 60% 840.17 1.00 22,873,890.27
Sidewalks (100%) 280.06 280.06 60% 168.04 1.00 4,574,843.39
Total 212,940,566.56
PU
BLIC
PR
OP
ER
TY
P
RIV
AT
E P
RO
PE
RT
Y

Green Infrastructure Solutions 27pg/
ALBANY STREET SEWER SHED
ALBANY SEWER SHED Runoff
Long-Term Effort Impermeable Green Infrastructure Impervious Area Impervious Area Assumed Capture Reduction
Land use/Impervious Coverage (5) Acres Surface Acres Project/Program Type Managed (%) Managed (Acres) Volume (Inches) (Gal/1” Event)
Residential (55%) 417.09 229.401 Downspout Disconnect 60% 137.64 1.00 11,325,835.34
Industrial (75%) 12.59 9.446 Rate incentives 70% 6.61 1.00 341.981.07
Commercial (95%) 217.32 206.454 Rate Incentives 70% 144.52 1.00 5,901,169.37
Rail (25%) 0.00 0.00 Rate Incentives 0% 0.00 1.00
Outdoor Pools, Closed Quarries (25%) 0.84 0.209 50% 0.10 1.00 5,901,169.37
Park/Vacant Land (5%) 52.99 2.649 Disconnections in Parks 90% 2.38 1.00 1,438,796.98
Inactive Rail (10%) 0.00 0.000 Greenway Trails Network 70% 0.00 1.00
Schools (35%) 7.07 2.473 School Greening 90% 2.23 1.00 191,845.03
Streets (100%) 120.84 120.840 Green Streets 60% 72.50 1.00 3,281.323.89
Sidewalks (100%) 224.17 24.170 60% 14.50 1.00 656,391.09
Total 16,210,837.26
PU
BLIC
PR
OP
ER
TY
P
RIV
AT
E P
RO
PE
RT
Y

Green Infrastructure Solutions 28pg/
SCAJAQUADA SEWER SHED
SCAJAQUADA SEWER SHED Runoff
Long-Term Effort Impermeable Green Infrastructure Impervious Area Impervious Area Assumed Capture Reduction
Land use/Impervious Coverage (5) Acres Surface Acres Project/Program Type Managed (%) Managed (Acres) Volume (Inches) (Gal/1” Event)
Residential (55%) 2,529.45 1,391.20 Downspout Disconnect 60% 834.72 1.00 68,685,408.00
Industrial (75%) 777.57 583.18 Rate incentives 70% 408.22 1.00 21,114,357.94
Commercial (95%) 529.57 503.09 Rate Incentives 70% 352.16 1.00 14,380,095.08
Rail (25%) 1,899.82 474.96 Rate Incentives 0% 0.00 1.00 51,588,309.39
Outdoor Pools, Closed Quarries (25%) 4.04 1.01 50% 0.51 1.00 109,703.31
Park/Vacant Land (5%) 1,276.06 63.80 Disconnections in Parks 90% 57.42 1.00 34,650,497.83
Inactive Rail (10%) 183.79 18.38 Greenway Trails Network 70% 12.87 1.00 4,990,686.17
Schools (35%) 364.37 127..53 School Greening 90% 114.78 1.00 9,894,207.09
Streets (100%) 823.46 823.46 Green Streets 60% 494.08 1.00 22,360,468.11
Sidewalks (100%) 164.69 164.69 60% 98.81 1.00 4,472,039.31
Total 139,714,994.30
PU
BLIC
PR
OP
ER
TY
P
RIV
AT
E P
RO
PE
RT
Y

Green Infrastructure Solutions 29pg/
HERTEL SEWER SHED
HERTEL CENTRAL SEWER SHED Runoff
Long-Term Effort Impermeable Green Infrastructure Impervious Area Impervious Area Assumed Capture Reduction
Land use/Impervious Coverage (5) Acres Surface Acres Project/Program Type Managed (%) Managed (Acres) Volume (Inches) (Gal/1” Event)
Residential (55%) 1747.41 961.08 Downspout Disconnect 60% 576.65 1.00 47,449,670.40
Industrial (75%) 213.13 159.85 Rate incentives 70% 111.89 1.00 5,787,392.91
Commercial (95%) 816.41 775.59 Rate Incentives 70% 542.91 1.00 22,169,030.40
Rail (25%) 78.48 19.62 Rate Incentives 0% 0.00 1.00 2,131,014.03
Outdoor Pools, Closed Quarries (25%) 5.99 1.50 50% .75 1.00 162,654.17
Park/Vacant Land (5%) 694.61 34.73 Disconnections in Parks 90% 31.26 1.00 18,861,638.40
Inactive Rail (10%) 19.60 1.96 Greenway Trails Network 70% 1.37 1.00 532,224.00
Schools (35%) 175.64 61.47 School Greening 90% 55.33 1.00 4,769,378.74
Streets (100%) 461.63 461.63 Green Streets 60% 276.98 1.00 12,535,232.91
Sidewalks (100%) 92.33 92.33 60% 55.40 1.00 2,507,155.20
Total 70,140,587.84
PU
BLIC
PR
OP
ER
TY
P
RIV
AT
E P
RO
PE
RT
Y

Green Infrastructure Solutions 30pg/
ONTARIO SEWER SHED
ONTARIO SEWER SHED Runoff
Long-Term Effort Impermeable Green Infrastructure Impervious Area Impervious Area Assumed Capture Reduction
Land use/Impervious Coverage (5) Acres Surface Acres Project/Program Type Managed (%) Managed (Acres) Volume (Inches) (Gal/1” Event)
Residential (55%) 246.13 135.37 Downspout Disconnect 60% 81.22 1.00 6,683,484.34
Industrial (75%) 71.06 53.30 Rate incentives 70% 37.31 1.00 1,929,583.54
Commercial (95%) 48.11 45.70 Rate Incentives 70% 31.99 1.00 1,306,392.69
Rail (25%) 0.00 0.00 Rate Incentives 0% 0.00 1.00 -
Outdoor Pools, Closed Quarries (25%) 0.00 0.00 50% 0.00 1.00 -
Park/Vacant Land (5%) 80.01 4.00 Disconnections in Parks 90% 3.60 1.00 2,172,614.40
Inactive Rail (10%) 0.00 0.00 Greenway Trails Network 70% 0.00 1.00 -
Schools (35%) 0.38 0.13 School Greening 90% 0.12 1.00 10,318.63
Streets (100%) 85.86 85.86 Green Streets 60% 51.52 1.00 2,331,466.97
Sidewalks (100%) 17.17 17.17 60% 10.30 1.00 466,239.09
Total 9,340,832.60
PU
BLIC
PR
OP
ER
TY
P
RIV
AT
E P
RO
PE
RT
Y

Green Infrastructure Solutions 31pg/
PARISH SEWER SHED
PARISH SEWER SHED Runoff
Long-Term Effort Impermeable Green Infrastructure Impervious Area Impervious Area Assumed Capture Reduction
Land use/Impervious Coverage (5) Acres Surface Acres Project/Program Type Managed (%) Managed (Acres) Volume (Inches) (Gal/1” Event)
Residential (55%) 69.94 38.47 Downspout Disconnect 60% 23.08 1.00 1,899,143.59
Industrial (75%) 8.27 6.20 Rate incentives 70% 4.34 1.00 224,565.94
Commercial (95%) 73.56 69.88 Rate Incentives 70% 48.92 1.00 1,997,469.26
Rail (25%) 84.07 21.02 Rate Incentives 0% 0.00 1.00 2,282,752.18
Outdoor Pools, Closed Quarries (25%) 0.00 0.00 50% 0.00 1.00 -
Park/Vacant Land (5%) 106.15 5.31 Disconnections in Parks 90% 4.78 1.00 2,882,427.43
Inactive Rail (10%) 10.51 1.05 Greenway Trails Network 70% 0.74 1.00 285,391.54
Schools (35%) 0.00 0.00 School Greening 90% 0.00 1.00 -
Streets (100%) 37.64 37.64 Green Streets 60% 22.58 1.00 1,022,087.31
Sidewalks (100%) 7.53 7.53 60% 4.52 1.00 204,471.77
Total 6,429,388.44
PU
BLIC
PR
OP
ER
TY
P
RIV
AT
E P
RO
PE
RT
Y

Green Infrastructure Solutions 42pg/
In order to most effectively utilize green infrastructure technologies on a city-wide basis, we recommend implementing a set of green infrastructure programs at specific target levels for each sewer district and the top CSO districts. The overall programs we are recommending are summarized below.
It should be noted that implementing a large-scale green infrastructure program will require a high degree of inter-departmental and inter-agency collaboration and partnership. As such, it will require strong leadership from the highest levels, but will also result in the ability to bring a real working relationship to other issues that confront our region.
GREEN STREETS PROGRAM
Streets and highways are public lands and they make up approximately twenty percent of the impervious land coverage in the BSA service area. Streets contain high levels of contamination, leading to heavily polluted stormwater runoff. Additionally, much work has already been done to create green technologies that handle roadway generated run-off. These technologies have been tried and tested in cities all over the country including Rochester, Syracuse, Minneapolis, Milwaukee, Philadelphia, Seattle, and Portland. For these reasons, streets are ideal candidates for a comprehensive long-term strategy for reducing stormwater into the combined sewer system.
Green streets are essentially streets that have been designed (or redesigned as will often be the case in Buffalo) to manage all of their own run-off to at least 1” of rainfall. Depending on the site conditions, some green streets may also be designed to accept run-off from sidewalks and driveways as well. Measures used to create these conditions are porous pavements, infiltration wells, bioretention and bioinfiltration cells, tree pits and trenches containing structural soil, and stormwater planters.
While a street, due to its relatively narrow shape, may not seem like the easiest space to retrofit in a manner that slows and treats stormwater, it is a space completely within public control and public maintenance. Therefore, it is an ideal space upon which to begin to develop a public program. Numerous entities are currently partnering to develop Complete Street Design Guidelines for the City of Buffalo. These guidelines are being developed through an inter-agency, inter-organization collaboration that will overlap with green infrastructure implementation and land use and zoning developments. Not willing to wait until the guidelines are complete, this committee is poised to begin influencing street design immediately to ensure that projects within the City begin to incorporate green infrastructure measures along with all or many of the other components that comprise a “Green and Complete Street.”
For each of these street types, developing design standards will be critical to securing effective implementation. We are suggesting that the BSA, in collaboration with the City of Buffalo Department of Public Works and other pertinent agencies, should develop standard details, perhaps through the Complete Streets Program, that will meet the collective stormwater management goals. In the interim, the BSA should be at the table early during street design planning, in order to effectively incorporate site specific green infrastructure into these projects.
Our primary recommendation is that as streets are programmed, their scope should include green infrastructure measures to handle most, if not all, of their own runoff.
Overall Recommendation: 60% of streets (7,755 acres) should be retrofitted for stormwater management.
Predicted Run-off Reduction: 38.14 MG
RECOMMENDED GREEN INFRASTRUCTURE PROGRAM COMPONENTSV
Bioretention area alongside tradtional tree lawn.
Source: Kevin Robert Perry, City of Portland
Buffalo Niagara RIVERKEEPER

Green Infrastructure Solutions 43pg/
Source: Buffalo Niagara RIVERKEEPER
Buffalo Niagara RIVERKEEPER

Green Infrastructure Solutions 44pg/
GREEN SCHOOLS PROGRAM
As the Joint Schools Construction Board continues its massive investment into our schools, these projects represent an important opportunity to influence the design process in a manner that incorporates stormwater management into the school reconstruction projects without adding unduly to the local funding burden. The State of New York also pays for a significant percentage of the maintenance component of schools, so this may represent an additional funding opportunity.
Schools make up a relatively small amount of the land area in the BSA service area, but as major community education centers, their value as prototype projects should be emphasized. Additionally, there are schools that have issues with sewage back-ups, which could potentially be solved with better stormwater management. Finally, within specific CSO districts, a large school site may be a significant contributor of stormwater.
Approaches that are appropriate for schools include rain gardens, green roofs, rain barrels and cisterns, and the use of porous pavements and tree planters on both parking and recreational facilities. As much as possible, redesigning school yards with an increase in garden and lawn spaces should be encouraged.
As school parking lots and playgrounds undergo routine maintenance, we would recommend that they be retrofitted with green infrastructure to meet these stormwater management goals.
Overall Recommendation: 90% of schools be retrofitted for stormwater capture (114 acres)
Predicted Runoff Reduction: 2.481 MG
Mount Tabor Middle School, Portland, Oregon
Source: Buffalo Niagara RIVERKEEPER
Buffalo Niagara RIVERKEEPER

Green Infrastructure Solutions 45pg/
DOWNSPOUT DISCONNECTION
Disconnection refers to the practice of breaking the direct link between impervious areas such as roofs or paved surfaces and the sewer system. Downspout disconnections can reduce instances of combined sewer overflows while promoting recharge of the groundwater which helps to restore the natural hydrologic cycle.
Downspout disconnections can incorporate rain gardens, flow-through planters, flow-away trenches, dry wells, rain barrels, or cisterns or any combination of these methods.
The Buffalo Sewer Authority and the City of Buffalo are already showing strong leadership in this area. The City of Buffalo recently revised its building codes to allow for downspout disconnection among City residents and business owners. The Buffalo Sewer Authority is studying a downspout disconnection program in the 1st Ward, with which it hopes to quantify the benefits and then extend the program to other parts of the City.
Most communities have found that a combination of incentives and compliance assistance have been effective in implementing these types of programs. In Portland, Oregon for instance, property owners with disconnected downspouts are able to apply for fee discounts if they allow the water district to disconnect their downspouts. If the property owners undertake the disconnection themselves, they receive a further reimbursement.
The Portland program, as well as others in different cities, has a mandatory component that requires downspout disconnection by a specified date, in some areas of their communities where critical overflow issues exist. By providing the incentives ahead of the implementation of the regulation, a high level of compliance has been achieved.
The Portland program has resulted in over 50,000 downspout disconnections, essentially removing 1.5 billion gallons of stormwater annually from the combined sewer system1.
Overall Recommendation: 60% of residential downspouts be disconnected (3,694 acres)
Predicted Run-Off Reduction: 58.527 MG
<1> Managing Wet Weather with Green Infrastructure EPA pg. 9
Downspout Disconnection
Source: Buffalo Niagara RIVERKEEPER
Buffalo Niagara RIVERKEEPER

Green Infrastructure Solutions 46pg/
GREEN PUBLIC FACILITIESAND CAMPUSES
As large, publicly controlled spaces, our urban campuses represent an important opportunity for better stormwater management. While each campus has unique characteristics, each campus also has numerous opportunities to effectively implement green infrastructure measures to reduce and eliminate stormwater runoff. These measures will most often be implemented in highly visible locations that have public educational potential.
These urban campuses include: ECMCBuffalo State CollegeUB South CampusBuffalo Municipal Housing AuthorityBuffalo Niagara Medical CampusOverall Recommendation: 495 acresPredicted Run-Off Reduction (MG): 12.244
COMMERCIAL AND INDUSTRIALSITE GREENING
Commercial and Industrial sites are second only to streets in their percentage of impervious cover, estimated at 95% and 75% coverage respectively. If we are to solve the problem of combined sewer overflows, we will need to improve stormwater management on these sites.
The primary difficulty in retrofitting these sites is that they are private. However, site design of private facilities can be influenced with two methods:
1. As parking lot and site projects are submitted to the planning board, they could be required to manage their own stormwater on site.
2. Second, rates could be re-structured to provide an incentive for private property owners to change the way they manage stormwater on site.
Overall Recommendation: 3,445 acres
Predicted Run-Off Reduction (MG): 74,844
GREEN OPEN SPACE AND PUBLIC PARKS
Where appropriate, parks should be used for wetland creation/restoration and stream restoration. Particular attention should be paid to the Olmsted 2020 plan, which calls for creating and/or enhancing historic wetlands in Delaware and Cazenovia Parks.
Public plazas and other paved gathering spaces should incorporate permeable paving, stormwater planters and continuous tree-pits.
In addition all parks, public plazas, bikeways and trails should be designed to create zero stormwater discharge.
Overall Recommendation: 1,394 acres
Predicted Run-Off Reduction (MG): 1.362 MG
Niagara University
Source: Buffalo Niagara RIVERKEEPER
HSBC Plaza in Buffalo, NY
Source: Buffalo Niagara RIVERKEEPER
Niagara University
Source: Buffalo Niagara RIVERKEEPER
Buffalo Niagara RIVERKEEPER

Green Infrastructure Solutions 47pg/
VACANT LOT MANAGEMENT
The City of Buffalo has a rapidly growing number of vacant parcels being generated through demolition of abandoned housing. These vacant properties present an opportunity to create new green spaces that can help with stormwater management and can also be used as temporary stormwater storage. When redevelopment occurs, that land would be subject to the new ordinances requiring that stormwater be managed on-site.
To help mitigate costs for these kinds of programs as well as provide a fund for future maintenance of the re-greened lots, different cities have developed different mechanisms. In Maryland, developers who want to develop within the critical area of the Chesapeake Bay watershed and do not have enough land area to meet open space requirements are allowed to buy vacant, abandoned properties in other parts of the community where they remove impermeable paving, revegetate the site, and return it to its natural hydrologic function within the watershed.1 The lot is then maintained in a perpetual easement.Overall Recommendation: 2,731 acresPredicted Run-Off Reduction (MG): 2.669
GREEN ROOFS
Because they have a much longer useful life, green roofs have been shown to be good investments in terms of cost for the long run. However, they are significantly more expensive to install, so many building owners are hesitant to make investments into a technology that is relatively new in terms of larger scale use. Green roofs, however are highly marketable and significantly contribute to the appeal of a structure. Much can be done to incentivize building owners to explore this technology, including education and collaboration with green roof design professionals who can present the numerous systems available for our climate.Overall Recommendation: 3,445 acresPredicted Run-Off Reduction: 2.669 MG
<1> Managing Wet Weather with Green Infrastructure, EPA, Pg. 18
DEVELOPMENT ORDINANCES
RIVERKEEPER applauds the City of Buffalo for re-inventing its zoning code as a Green Code with an eye toward making future land use and development projects sustainable and environmentally healing. RIVERKEEPER strongly advocates that the Buffalo Sewer Authority engage directly in this process and we advocate that the following policy be adopted as part of this zoning update:
The new green code should ensure that all public infrastructure projects along with new development and re-development will incorporate best management practices that minimize or eliminate stormwater discharge into the City’s Combined Sewer Overflow system, including:
Mandating that all future transportation projects be implemented as “Complete Green Streets.”
Ensuring that all public parks, plazas and other public venues be built to integrate stormwater management seamlessly into their design in a manner that enhances total quality of life.
Requiring all new development projects, including parking lots and facilities, provide for 100% on-site stormwater management for up to 2” events through the use of green infrastructure including measures such as bioswales, rain gardens, flow-through trenches, green roofs/walls, etc.
Ensuring that all future demolitions will incorporate stormwater management features on the resulting vacant lots that will include site grading and fill requirements, green infrastructure and, where appropriate, possible use as collective receiving sites for adjacent multi-property downspout disconnections.
Vancant Home, City of Buffalo
Source: Buffalo Niagara RIVERKEEPER
Green Roof, Fox Tire, City of Buffalo
Source: Buffalo Niagara RIVERKEEPER
Buffalo Niagara RIVERKEEPER

Green Infrastructure Solutions 48pg/
VACANT LOT MANAGEMENT DIAGRAMS
Source: Buffalo Niagara RIVERKEEPER
Buffalo Niagara RIVERKEEPER

Buffalo Niagara RIVERKEEPER is proposing that the City of Buffalo and the Buffalo Sewer Authority embark on a series of Green Infrastructure Demonstration Projects. These pilot projects would be implemented as part of
the Agreement and they would showcase site-specific green infrastructure measures that capture and detain a minimum of the first inch of stormwater within the project site. The implementation of these demonstration projects allows the agencies involved to monitor and document these introduced stormwater management measures and also provides an opportunity for the public at large to familiarize themselves with this approach.
Concurrent with this recommendation, Buffalo Niagara RIVERKEEPER is collaborating with numerous City-wide agencies and organizations in the development of a Complete Green Streets Program that will formalize the process of eventually developing all street projects as “complete and green streets” that
incorporate stormwater capture as a routine measure. These first BSA demonstration green infrastructure projects may be able to dovetail with those of the Complete Green Streets Program, thereby sharing outside funding sources, agency resources and consultant design time.
The City of Buffalo Department of Public Works has just proposed that the Niagara Street Gateway Project be developed as the City’s first Complete Green Street Demonstration Project.
Green Infrastructure Solutions 32pg/
VIGREEN INFRASTRUCTURE DEMONSTRATION PROJECT CANDIDATES
Buffalo Niagara RIVERKEEPER

Green Infrastructure Solutions 33pg/
CURENTLY PLANNED PROJECTS THAT COULD BE DESIGNED TO INCORPORATE GREEN INFRASTRUCTURE
Project Location Type of GI CSO Basin Completion Estimated Estimated Capture (MG) Project Costs
School 65 - Roosevelt Early Childhood 249 Skillen Street Green Schools Type 1 55 0.037
School 18 Hampshire and Fargo (75 School) Green Schools Type 1 12 0.035
CSO 60
SPP 240 Separation Alternative Bird Avenue Sewershed Green Street Type 1 4, 5, 6 Summer 2010 1.800
School 61 - Early Childhood Center 453 Leroy Avenue Green Schools Type 1 53 0.017
School 53 - Community School Wohlers & Glenwood (300 Wohlers) Green Schools Type 2 53 0.033
ECMC 1825 Fillmore 53 1.634
Elmwood Avenue Forest to 198 60 0.033
Niagara Street - Traffic Calming Virginia to Ontario Green Streets Prototype 1 4, 5, 6, 7, 8, 9, 10, 11, 12 0.537 $2,929,000.00
Scajaquada (198) Downgrade 59, 60 0.666
UB South Campus Main St 53 1.331
BSC Campus Investment 59 1.081
Tonawanda Street BOA Brownfield Parish 57, 58 4.324
McKinley High School (#305) Elmwood Avenue (1500 Elmwood) Green Schools Type 2 55 0.104
Kenmore Avenue Green Streets Prototype 1 55 0.321 $7,512,000.00
1st Ward Rain Barrel Project 8 Properties Downspout Disconnect Type 1 0.005
Erie Canal Harbor Streets Phase II Inner Harbor 17 0.111 $3,798,000.00 Lloyd, Prime, Perry, Hanover
BNMC Parking Lot Main and Carlton Parking Lot 15 0.015
Allen Street Extension/BNMC Phase III Main to Ellicott “Green Steets ?” 15 2013 0.011 $6,803,000.00
Harvey Austin School 1393 Sycamore Green Schools Type 2 26 0.107
Commodore Perry Project Thruway - River (Old 1st ward) 23 0.663 Redevelopment
190/Skyway (Under Elevated Sections) Under Skyway, near former Aud site Parking Lot 16, 17 0.103 $1,044,000.00Parking Lots
Fillmore Avenue MLK Park to East Ferry 15 0.055 $1,351,000.00
Niagara Street Gateway Elmwood to Virginia Green Streets Prototype 1 13 0.042 $2,801,000.00
Niagara Street - Traffic Calming Virginia to Ontario Green Streets Prototype 1 4, 5, 6, 7, 8, 9, 10, 11, 12 0.537
Fruit Belt Streetscape High Street, Carlton 15 0.084 $1,962,000.00
Frank Lloyd Wright Boathouse Parking Lot 63 0.015
South Buffalo BOA Brownfield 28, 29 2.223
Buffalo River BOA Brownfield 22, 23, 64, 25, 26, 27, 29 5.189
UB Medical Campus 22 0.324
Cars on Main Street 15 0.032 $12,369,000.00600 Block to Chippewa
Erie Canal Harbor Streets Phase III Lower Terrace to Marine Dr 17 0.013 $1,341,000.00
Source: Buffalo Niagara RIVERKEEPER
Buffalo Niagara RIVERKEEPER

Green Infrastructure Solutions 34pg/
GI DEMONSTRATION PROGRAM CANDIDATE LIST
Source: Buffalo Niagara RIVERKEEPER
Buffalo Niagara RIVERKEEPER

Green Infrastructure Solutions 35pg/
GI DEMONSTRATION PROGRAM PROJECTS IN DESIGN
Source: Buffalo Niagara RIVERKEEPER
Buffalo Niagara RIVERKEEPER

Green Infrastructure Solutions 36pg/
Source: Buffalo Niagara RIVERKEEPER
Source: Buffalo Niagara RIVERKEEPER
Buffalo Niagara RIVERKEEPER
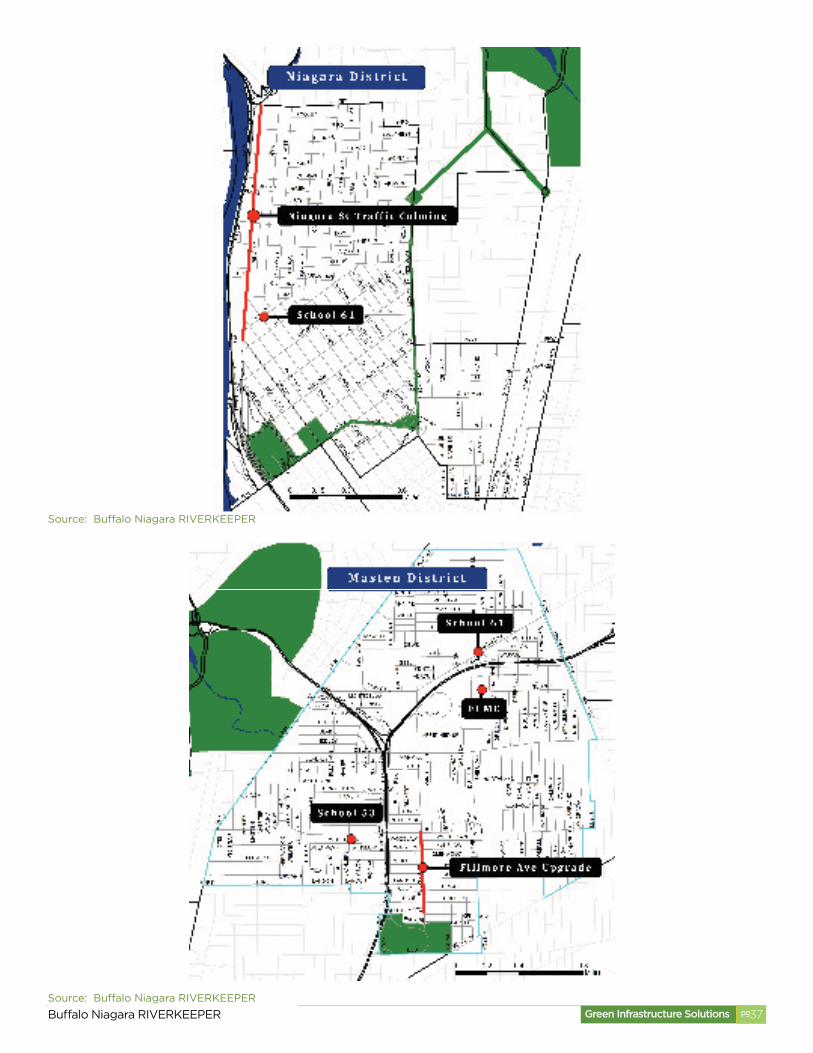
Green Infrastructure Solutions 37pg/
Source: Buffalo Niagara RIVERKEEPER
Source: Buffalo Niagara RIVERKEEPER
Buffalo Niagara RIVERKEEPER

Green Infrastructure Solutions 38pg/
Source: Buffalo Niagara RIVERKEEPER
Source: Buffalo Niagara RIVERKEEPER
Buffalo Niagara RIVERKEEPER

Green Infrastructure Solutions 39pg/
VII ADDITIONAL LONG TERM CONTROL PLAN RECOMMENDATIONS
MODELING RECOMMENDATIONS
RIVERKEEPER has provided the BSA with preliminary estimates for the amount of runoff that could be eliminated with strategically placed green infrastructure projects. We are confident in the numbers that were produced for this study, however, we recognize that the full impact of green infrastructure cannot be realized until its impact on increasing the capacity of the entire system is fully realized.
To better understand the impact of green infrastructure on the capacity of the combined sewer system, RIVERKEEPER recommends that the BSA conduct a comprehensive modeling and analysis of the system that considers green infrastructure as a key input to the model (i.e. as input it estimates storm water runoff). An empirical analysis such as this would help determine the impact of green infrastructure, its ability to increase capacity, and to support the cost-benefit debate about the value of using green infrastructure. SWMM (Storm Water Management Model) is capable of performing the analysis we are recommending, however BAS could use models that it is more familiar with or has already partially developed.
To support the modeling effort, the BSA has several data sets at its disposal including the following:
Sewer GIS Database – the BSA has recently developed a comprehensive GIS database that represents the sewer assets in the City of Buffalo. RIVERKEEPER used this database extensively as part of this project and found it to be relatively complete, accurate, and quite suitable for modeling purposes. With some skeletonization of the data, the GIS data could be readily used by commonly used sewer/storm water modeling programs such as SWIMM.
Flow Data – there are several places in the system where flow data is being measured. These data could be used as estimates of existing flow and/or used to calibrate modeling scenarios. The flow data could be assigned to specific nodes in the model.
Household Consumption Data – Over the past several years, the City of Buffalo water system has been managed by a private firm that has invested in the implementation of better water metering systems. In theory this data could be readily extracted, assigned to specific parcels or customer locations, aggregated, and used as input flows to the model.
Land Use/Impervious Surface Estimates – RIVERKEEPER has created a city-wide land use and impervious surface GIS data set that it will make available to the BSA for estimating storm water flows.
RIVERKEEPER understands that there are several variables that affect system capacity including weather conditions, ground water levels, and infiltration/inflow. In order to understand the relative impact of green infrastructure we recommend that the BSA establish control areas as part of the modeling effort. These control areas would be locations within the City where no green infrastructure is planned - more or less areas where no action is taken. By comparing an area where green infrastructure is planned versus a control area, these other variables would remain constant giving the BSA a good, relative comparison of the effects that green infrastructure has on increasing system capacity.
In conclusion, RIVERKEEPER recommends that the BSA consider green infrastructure in any future modeling that is performed. There is a significant amount of readily available data that could support the modeling effort with minimal efforts to compile and prepare the data. Finally, we recommend the use of control areas to allow relative comparisons of the affect of green infrastructure on system capacity.
EMPLOYING AN ADAPTIVE MANAGEMENT APPROACH
Despite a growing body of evidence regarding the effectiveness of green infrastructure technologies, there remains some uncertainty on behalf of both regulators and implementing agencies as to the specific impacts and effectiveness of specific techniques within any given infrastructure system and ecosystem.
Adaptive management recognizes this uncertainty and creates a mechanism for re-evaluating a course of action based upon information gathered as combined sewer abatement projects are implemented. In the case of Kansas City model, the consent agreement provides a clear process for mechanism for the local water agency to propose changes to the long term control plan based upon such information.
This mechanism would address several concerns raised by Buffalo Sewer Authority officials in discussions around green infrastructure and will be further fleshed out in preparation for the final report.
Buffalo Niagara RIVERKEEPER

Green Infrastructure Solutions 40pg/
PUBLIC ENGAGEMENT
The Philadelphia Long Term Control Plan project invested heavily in public outreach activities – actively engaging the community in decisions regarding water quality objectives and solutions
Over the longer term, RIVERKEEPER recommends that the BSA mimic many of the outreach techniques employed by the Philadelphia plan including:
�� Road Show at Summer Festivals – especially Garden Walk
�� Online Survey
�� Voting for neighborhood GI demos
�� Watershed Information Center with timely water quality data posting
�� Public Outreach efforts surrounding individual pilot projects.
More specific outreach recommendations will be forwarded under separate cover in the near term.
WATERSHED PLANNING
Because water does not conform to governmental boundaries, watershed management and inter-municipal planning can be the most effective way to successfully manage for water quality and quantity.
Currently the New York State Department of Environmental Conservation (DEC) manages the implementation of the Niagara River Remedial Action Plan (RAP). At least four of the Niagara River RAP objectives relate directly to the Buffalo Sewer Authority, including:
Maintain Controls on Municipal and Industrial Wastewater Facilities.
Remediate Other Nonpoint Sources as Necessary.
Improve Combined Sewer Overflow Systems.
Restore Fish and Wildlife Habitat.
Within the Niagara River’s local watershed, sub-basin watershed management plans have either been prepared or are in process for the Buffalo River Area of Concern (Remedial Action Plan), Cazenovia Creek, Scajaquada Creek, Cayuga Creek in Niagara County and Tonawanda Creek.
In addition, a number of communities in Western New York have joined together to develop a stormwater management program to protect our waterways and enhance our quality of life. The goal of the WNY Stormwater Coalition is to utilize regional collaboration to identify existing resources and develop programs to reduce the negative impacts of stormwater pollution.
HEALTHY NIAGARA
In 2010, Buffalo Niagara RIVERKEEPER and its partners began work on Healthy Niagara – a watershed management plan for the Niagara River-US watershed with funding support from the US Army Corps of Engineers and the NYS Department of State, Division of Coastal Resources. The Healthy Niagara Project is focused on positioning the WNY community to effectively access resources, strategically implement projects, and jointly collaborate with our Canadian partners to improve the health of the entire Niagara River watershed.
The Healthy Niagara project will knit the various tributary projects together by identifying similarities, opportunities for collaboration and gaps in watershed management.
Specifically, the project will generate three products:
Healthy Niagara Atlas – An atlas of current information available on the Niagara River system.
Healthy Niagara Report Card – A report that benchmarks the status and condition of the watershed in relation to a list of clear community goals and performance criteria for the health of the Niagara River watershed.
Healthy Niagara Strategic Plan – A clear roadmap for future project priorities (including collaborative bi-national efforts) and funding applications including timelines and funding sources.
RECOMMENDATIONS
The Healthy Niagara and other projects mentioned above require strong participation from interested stakeholders like the Buffalo Sewer Authority for success. In light of the impact of watershed activities on water quality in the City of Buffalo, we recommend that Buffalo Sewer Authority become actively involved with each of these projects. In particular, we suggest the BSA immediately consider taking a leadership role on one or more of the watershed planning stakeholder committees and provide technical support on key issues impacting its receiving waters and assistance with outreach to the Buffalo Sewer Authority customers.
Buffalo Niagara RIVERKEEPER

Green Infrastructure Solutions 41pg/
BUFFALO SEWER AUTHORITY FINANCINGVIII
The City’s negotiations regarding the CSO Long Term Control Plan with state and federal agencies are mentioned briefly in the City’s 2009 Comprehensive Annual Financial Statement.
While the final cost of CSO compliance efforts will be determined as a result of long term control plan negotiations, RIVERKEEPER has prepared the following analysis of financing opportunities to help gauge local capacity for sewer infrastructure changes.
The following opportunities exist for implementing combined sewer infrastructure changes and will be further defined in preparation for the final report document:
1. Buffalo Sewer Authority sourcesunrestricted, undesignated fund resources of $4.5 millionfive year capital plan funding currently estimated at $45 million over five yearstransfers to the City of Buffalo general fund of $2.9 million per yearrate restructuring rate increasescontract renegotiations with suburban customers
2. City of Buffalo collaboration sourcesAllocation of some of the City’s 2010 surplusdepartment of public works funding for green streets and park site disconnectionsdepartment of inspections funding for demolitions and vacant land managementBuffalo Municipal Housing Authority funding for stormwater managementOffice of Strategic Planning Zoning Code ChangesBuffalo Public Schools Joint Schools Construction and facilities management funding
3. Other collaborating local, state and federal agency partnerships
Housing and Urban DevelopmentTransportationEmpire State Development including Erie Canal HarborDormitory FundDepartment of Health Department of EducationDepartment of Environmental Conservation brownfields and environmental protection fund Department of State Coastal Resources Local Waterfront Revitalization Program and Brownfield Opportunity Area Office of Parks and Historic Preservation
Buffalo Niagara RIVERKEEPER

Green Infrastructure Solutions 49pg/
BUFFALO NIAGARA RIVERKEEPER
Terms of Understanding with Buffalo Sewer Authority (BSA)
On Intended Green Approach to CSO Abatement (revised 1/17/2011)
It is the recognized goal of both RIVERKEEPER and the Buffalo Sewer Authority to pursue significant reductions in combined sewer overflow events and increases in overall water quality using an approach that is the most cost-effective and beneficial to the people of the City of Buffalo. To that end, over the last year, the BSA and RIVERKEEPER have worked collaboratively to fashion an approach to the Long Term Control Plan that meets all of our objectives.
Overall, our approach can be divided into three distinct phases, which are detailed below.
PHASE 1:
NEAR TERM ACTIONS, 2011-2012
a. The BSA will install a High Rate Infiltration (HRI) device that will increase its plant capacity to 600 million gallons for full treatment prior to discharge and will increase overall system capacity to 860 million gallons. It is anticipated that this device will reduce overflow events at the Cornelius Creek overflow site to approximately eight events per year. Substantial overflow reductions are also expected for Scajaquada Creek. Engineering and design is anticipated for projects in 2011, with construction in 2012-2013.
b. Green Infrastructure Pilot Projects
i. Continue to partner with RIVERKEEPER on the Downspout Disconnection program in the First Ward, and explore opportunities to expand this program to other parts of the City, possibly including Hamlin Park;
ii. CSO 60 Green Streets Pilot Project will go forward in 2011 whether or not the BSA receives its grant from EFC;
iii. The Vacant Lot/Demolition demonstration projects as described in the RIVERKEEPER report will go forward;
iv. The funding originally set aside for improvements to Front Park ($999,000) will be re-assigned to assist in the implementation of these Green Infrastructure demonstration programs;
v. The Swan Trunk project will be evaluated for green infrastructure options.
vi. The Buffalo Sewer Authority will work with the City of Buffalo Office of Strategic Planning to recommend stormwater management performance criteria to be included in the City’s GREEN CODE master plan and zoning revisions.
c. All projects outlined in the Phase I list which have not been bid, constructed or discussed above will be held off until Phase 2 to be able to evaluate the effects of the High Rate Infiltration device and the green infrastructure programs.
d. Signage. CSO signage will be altered and re-installed as
necessary to give a better explanation to the public of the risks posed by existing CSO locations.
The BSA will launch its Community Outreach plan implementation by March 2011;
f. The BSA will study the existing sewer pricing structure and examine opportunities to improve equity among users based upon stormwater inputs to the system and incentivize private stormwater management efforts among commercial and industrial users;
g. BSA will request that, to the maximum extent possible, that penalties exacted by the State and Federal enforcement officials should be placed with the Community Foundation of Greater Buffalo as a restricted fund to be disbursed annually on a competitive basis for green infrastructure and stormwater management technical assistance and financial incentive programs. Projects will be evaluated based upon their stormwater management benefits and cost effectiveness.
h. BSA will participate in the Healthy Niagara Watershed Management planning project.
PHASE 2: 2014 – 2016
implemented green infrastructure projects to determine their overall performance of the system and capacity issues as well as overall effectiveness; Specifically, the City will model the results of the various stormwater management pilot programs to determine the optimal mix of stormwater management programs to achieve the maximum results at minimum cost.
Proposals to expand sewage treatment capacity through either additional plant upgrades or system storage will be compared to green infrastructure proposals and compared on cost, groundwater recharge, effectiveness on E coli, nutrients, turbidity and organics. The results of this comparison will be presented to a community based steering community and at public meetings for public feedback.
Phase 1, either as GI projects or as originally planned, depending on results of above analysis. These projects include CSO 53, as well as 6,7,8,9, and 10.
based upon the information above by December 31, 2014.
PHASE 3: 2017 AND BEYOND:
solutions implemented in Phases 1 and 2, the BSA will implement the rest of its needed projects as either green infrastructure projects or in-system storage projects.
SUMMARY OF RECOMMENDATIONSIX
Buffalo Niagara RIVERKEEPER

Green Infrastructure Solutions 50pg/
APENDIX ONEX
METHODOLOGY
Stormwater flow was essentially determined to be equal to the level of perviousness of a particular parcel times the depth of rainfall. More specifically, the calculator reflects:
Pervious surface area x depth of water x square feet per acre x gallons per cubic foot
Depth of water was calculated assuming a 1” storm and a 91% capture rate as defined in the New York State Stormwater Design Manual.
Land coverage (the level of impermeability) was determined though the visual grouping together of similar looking land coverages using Google Earth and then using GIS. The NYS Property Class codes were then used to find the designated codes of those selected parcels from GIS and to group those similar land coverage together by percentage of land coverage. A statistical sample of randomly selected addresses was created using a property class list generated through GIS and then were directly measured using the measure tool in Google Earth.
Seven different categories of permeability were chosen to visually display the percentage of the land covered by a built structure or parking area, 5%, 10%, 25%, 35%, 55%, 75% and 95%.
Residential parcels were directly measured to arrive at median driveway widths, the median of homes that have driveways and those that also have ancillary buildings such as detached garages that may directly drain into the driveways and eventually the street.
PERMEABILITY CATEGORIES
95% land coverage – commercial buildings, restaurants, stores, parking lots, office buildings, malls, parking garages, apartment buildings with parking lots.
75% land coverage – Industrial buildings and active industrial complexes.
55% land coverage – Predominantly residential 1, 2, 3 family homes and residential with limited commercial and some public schools.
35% land coverage – College campuses and public schools.
25% land coverage – Outdoor pools, closed quarry.
10% land coverage – Inactive rail corridors that are overgrown/out of use.
5% land coverage – This layer contains parks and vacant lands that contain minimal levels of development. Junk yards, landfill sites and other minimally paved areas that contain a high level of permeability. These sites are usually found near industrial
areas and may contain contaminated soils.
Railroad corridors – Are assumed to have a 25% land coverage due to rail lines, paving adjacent to tracks and compacted soil. (These are not classified as roads and lie within the parcel data layer. There are also significant data errors within this layer with multiple copies of railroad parcels) To arrive at the actual railroad corridor coverage within the parcel data layer and also to prevent double or triple counts of the actual land area a subtractive method was used to arrive at the railroad coverage. The total parcel data for each sewer district was calculated using GIS, any unassigned land value after all of the percent coverages were calculated were assigned to the railroad layer.
Roads – Are assumed to have complete coverage and are calculated at a 100% surface runoff. There are three separate categories, commercial streets, residential roads and highways.
FINDINGS
The BSA service area comprises 97.8 square miles of parcels (both public and private land) and 12.6 square miles of roadways and highways.
Total parcel area in the BSA service area = (62,609 acres or 97.83 square miles)
Total road area in the BSA service area = (8,063 acres or 12.60 square miles)
Total acres in the BSA service area (parcels + road) = (70,673 acres total or 110.43 square miles)
Commercial usage (95% land coverage) = 9,147 acres (15% of total parcel)
Industrial usage (75% land coverage) = approximately 2,500 acres (4% of total parcel)
1, 2 and 3 family residential (55% land coverage) = 21,589 acres (34% of total parcel)
Schools (35% land coverage) = 810 acres (1% of total parcel)
Vacant Land (5% land coverage) total 19,759 acres (31% of total parcel)
Buffalo Niagara RIVERKEEPER

Green Infrastructure Solutions 51pg/
STUDY AREA FOR THIS REPORT
The BSA study area is confined only to those parts of the City of Buffalo that are currently served by the BSA sewage system. The BSA has sewage basins that extend beyond the city’s border far into Cheektowaga (Scajaquada Sewage Basin). For the purposes of the study, the Scajaquada Sewer Basin has been curtailed at the Buffalo border. This has significantly shrunk the total area for the BSA Sewer Basins. Adjacent towns such as Tonawanda, Lancaster and contracts with other entities within Erie County feed into the BSA sewer system but are not included in the study as most of those contracts are for sewage alone and not stormwater. Parts of the outer harbor along Lake Erie are not served along with several rail corridors adjacent to South Park.
THE ROAD AREA DATA DIFFERENCES
There is a small error due to the under counting of road lengths when clipping smaller areas (sewer sheds) from the macro level data. Incomplete road lengths were not included in the road length total if they do not fully lie within a specific sewer district.
THE SIDEWALK CONUNDRUM
The sidewalk surface area is correct but the stormwater parcel model isn’t fully developed to subtract the sidewalk area from the parcel area. In effect, we tacked on the sidewalk area to the parcel area by ADDING in the total area for sidewalks instead of adding in the sidewalk impermeability to the parcel ‘percent coverage area’ for the total lot area. Doing this we inadvertently added several tens to several hundreds of acres of additional area to our parcel files. This is something that would require a full study to address as each lot/property classification type would have different levels of impact from the sidewalk factor.
The recommendation is to list sidewalks as a separate category and make a note of it that they should not be ignored in future studies because sidewalks are a part of the public right of way but we should NOT include their area when calculating out the impermeable surface area for parcels. The percent impermeability in this report has been adjusted to correspond with the correct values.
DATA DISCREPANCIES
The total area for parcels in the City of Buffalo is 19,906.94 acres vs 20,775.06 when you add all of the individual sewer sheds together. The data errors are due to small amounts of double counts at the borders of each individual sewer shed where the border for individual parcels lie between both borders for the sewer shed and are thus counted as being a part of both sewer sheds. The amount is small enough to ignore for the purposes
of this report as small scale data analysis will not be affected by macro level errors in the data.
Buffalo Niagara RIVERKEEPER

Green Infrastructure Solutions 52pg/
APENDIX TWOXI
Buffalo Niagara RIVERKEEPER

Green Infrastructure Solutions 53pg/Buffalo Niagara RIVERKEEPER

Green Infrastructure Solutions 54pg/
FISH CONSUMPTION ADVISORY DATA(FROM GLRI FISHING CONSUMPTION GRANT)
The Buffalo and Niagara Rivers have been impaired by more than a century of heavy industrial pollution. Their toxin-laden sediment, containing PCBs, PAH, industrial organics and heavy metals from industrial sources resulted in the EPA designating both Rivers as Areas of Concern in 1987. In addition to these legacy contaminants, Buffalo’s waterways are severely degraded by polluted runoff from urban nonpoint sources flowing through combined and separated sewer overflows. The resulting bacterial levels, trash, and odors in the Buffalo and Niagara Rivers make local waterways unswimmable, unattractive and dangerous to recreational users, fish, and wildlife alike.
Buffalo faces higher hurdles than other cities; nearly thirty percent of its residents live in poverty, a rate surpassed only by Detroit among the nation’s largest cities. Often, the only available recreational space within the impoverished areas of the city are local rivers and creeks. Many of the less contaminated fishing areas on the Buffalo and Niagara Rivers are only accessible by boat, excluding most socioeconomically disadvantaged anglers. As a result, these anglers are relegated to riverbanks and thereby exposed to unsafe levels of bacteria from contact with water or from the consumption of fish contaminated with industrial toxins.
A major beneficial use impairment (BUI) of the Buffalo and Niagara River Areas of Concern is fish consumption. According to the US EPA, consumption advisories were established for these rivers based on significant anomalies in fish (87% in bull head and 45% in panfish) and benthic deformities (20 – 25%). The majority of citizens are not actively engaged in the care of the water itself and are often uninformed about the potential health risks resulting from exposure to contaminants via the degraded waterway and its fish. Consequently, awareness and compliance with sport fish consumption advisories have not necessarily been high, despite substantial governmental investment into health advisories designed to inform the population of the dangers of consuming locally caught fish.
The New York State Department of Health created these consumption advisories to empower the public to protect themselves from harmful environmental contaminants by providing information intended to influence their perception of risk and subsequent behavior. Nevertheless, risk avoidance strategies are historically ineffective, as they are often a temporary substitute until remediation goals for fish are met. However, total remediation of this BUI is far from complete, as toxic sediment and polluted groundwater create longstanding issues within the water column. Immediate action is essential.
FISH CONSUMPTION ADVISORIES :
The New York State Department of Health (NYSDOH) issues fish consumption advisories based on fish sampling data collected by the New York State Department of Environmental Conservation (NYSDEC). Concentrations of chemicals found in the fish are compared to the U.S. Food and Drug Administration’s (FDA) allowable tolerance levels for food and to New York State criteria for the protection of human health. When high levels of contaminants are found, consumption advisories are issued by the NYSDOH to alert fishermen to the potential adverse health impacts of eating contaminated fish. Restrictions on fish consumption have been identified as primarily caused by PCBs, chlordane, mirex and dioxin contamination. The sources contributing to this restriction include upstream industrial discharges, inactive hazardous waste sites, contaminated sediments, air deposition and inflow from Lake Erie. Based on data quantifying contaminant levels in fish tissue, specific fish consumption advisories have been issued in the Buffalo River, Niagara River and their tributaries. The fish species that are listed for these waters have contaminant levels that exceed federal food standards or state human health criteria.
PCB’S
PCBs (polychlorinated biphenyls) are a family of man-made chemicals that were used in many commercial and electrical products until their manufacture was banned in the mid-1970s. PCBs are persistent in the environment and accumulate in the fat of fish and other animals. Thus, PCBs still remain a fish contaminant.
Health concerns: Studies of women and their children show a link between elevated levels of PCBs in their bodies and slight effects on their children’s birth weight, short-term memory and learning ability. A study of older adults (49-86 years old) who ate fish containing PCBs suggest that higher PCB exposure is associated with decreased memory and learning. Other studies have suggested a link between increased PCB exposure and effects on the human reproductive system, including changes in sperm quality, time to pregnancy and menstrual cycles. These studies suggest that the effects were caused by PCBs, but other factors may have played a role too. Studies of workers exposed to PCBs raise concerns that these chemicals can cause cancer in people, but the information is not adequate to prove that this is the case.
(New York State Department of Health)
APENDIX THREEXII
Buffalo Niagara RIVERKEEPER

Green Infrastructure Solutions 55pg/
2010 URBAN ANGLER SURVEY
With a small grant from the Great Lake’s Research Consortium, Buffalo Niagara RIVERKEEPER’s Environmental Justice program developed an Urban Angler outreach survey to gain information about urban anglers’ perceptions regarding risks associated with eating locally caught fish. Between May and August of 2010, RIVERKEEPER staff and interns interviewed 136 local anglers at fishing access sites and fishing derbies. These areas included: Broderick Park, Squaw Island, Lake Kristy, and Buffalo’s Outer Harbor.
QUICK FACTS
Out of 136 people surveyed:
62% - reported eating the fish they catch.
48% - of those surveyed did NOT know about consumption advisories or warnings for eating fish caught in the waterways around Buffalo (around Buffalo means Lake Ontario, Lake Erie, Buffalo River, Niagara River, and connecting streams and waterways.
80% - of those surveyed did NOT know what a combined sewer overflow was.
Of the 88 people surveyed fishing, specifically at Broderick Park and Squaw Island:
72% - reported eating the fish they catch.
59% - of those surveyed did NOT know about consumption advisories or warnings for eating fish caught in the waterways around Buffalo (around Buffalo means Lake Ontario, Lake Erie, Buffalo River, Niagara River, and connecting streams and waterways.
83% - of those surveyed did NOT know what a combined sewer overflow was.
Twenty-seven of the eighty-eight people surveyed at Broderick Park and Squaw Island were refugees from Burma who utilize this area for subsistence fishing. (Buffalo Niagara Riverkeeper hired a translator from Jericho Road Ministries Refugee Services to give these interviews.)
Buffalo Niagara RIVERKEEPER

Buff alo Niagara RIVERKEEPER1250 Niagara StreetBuff alo, New York 14213
TEL 716.852.7483FAX 716.885.0765E-MAIL [email protected]