grams no fax 22665966 7 lines i...grams:"naperol"mumbai fax:22665966 telephone no....
TRANSCRIPT

GRAMS: "NAPEROL" MUMBAIFAX:22665966
TELEPHONE NO.22618071 (7 LINES)
I
e
Registered Office:NEVILLE.HOUSE, J. N. HEREDIA MARG, BALLARD ESTATE,
MUMBAI - 400 001.CIN : L24299MH1954PLC009254
Website : www.naperol.com
PER(A)/M-4
BSE Ltd.Phiroze Jeejeebhoy TowersDalai StreetMUMBAI - 400 001.
August 3, 2018
Kind Attn: Department of Corporate Services(Scrip Code - 500298)
Dear Sirs,
Sub: Submission of Annual Report pursuant to Regulation 34(1) of the SEBI (ListingObligations and Disclosure Requirements) Regulations, 2015
We refer to the Regulation 34(1) of the SEBI (Listing Obligations and DisclosureRequirements) Regulations, 2015 in this regard please find enclose herewith the AnnualReport of the Company for the financial year ended March 31, 2018. Please note that thesame has been approved and adopted at the Annual General Meeting of the Companyheld on August 2, 2018.
Further, the Annual Report of the Company for the financial year ended March 31, 2018can also be downloaded from the Company’s website www.naperol.com.
Kindly take the same on record.
Thanking you,
Yours faithfully,For NATjpT^AL PEROXIDE LIMITED
(Jj*NY SHAH)COMPANY SECRETARY
Enel: As above
All correspondence to be addressed to:Head Office:C-1,Wadia International Centre Pandurang Budhkar Marg,Worli,Mumbai - 400 025.Tel.:022-66620000 •Fax :022-66193421 •Email:[email protected]

ANNUAL REPORT 2017-2018
National Peroxide Limited
Annual Report 2017-2018
(Registered – 16th March, 1954 )
DIRECTORSNESS N. WADIA (Chairman)
R. BATRA
N. P. GHANEKAR
S. RAGOTHAMAN
DR. (MRS.) MINNIE BODHANWALA
SURESH KHURANA (Chief Executive Officer & Director)
CHIEF FINANCIAL OFFICERSHAILESH CHAUHAN
BANKERSSTATE BANK OF INDIA
CANARA BANK
THE HONGKONG & SHANGHAI BANKING CORPORATION LIMITED
SOLICITORS AND ADVOCATESCRAWFORD BAYLEY & CO.
AUDITORSPRICE WATERHOUSE CHARTERED ACCOUNTANTS LLP
REGISTERED OFFICENEVILLE HOUSE,J. N. HEREDIA MARG,BALLARD ESTATE,MUMBAI- 400 001.
HEAD OFFICE C-1, WADIA INTERNATIONAL CENTRE,PANDURANG BUDHKAR MARG,WORLI, MUMBAI- 400 025.
FACTORYN. R. C. ROAD, P. O. ATALI,VIA MOHONE, KALYAN – 421 102,DIST. THANE, MAHARASHTRA.
REGISTRAR & SHARE TRANSFER AGENTSSHAREX DYNAMIC (INDIA) PVT. LTD.
UNIT : NATIONAL PEROXIDE LTD.UNIT NO. 1 , LUTHRA INDUSTRIAL PREMISES,ANDHERI-KURLA ROAD, SAFED POOL,ANDHERI (E), MUMBAI – 400 072. TEL : 2851 5644 / 2851 5606
CONTENTSNotice
Directors’ Report
Annexures to Directors’ Report :
1. Management Discussion & Analysis Report
2. Corporate Governance Report
3. Corporate Social Responsibility Report
4. MGT-9 - Extract of Annual Return
5. Secretarial Audit Report
6. Details of Remuneration of Directors, KMPs and Employees
7. Details of Conservation of Energy, Technology Absorption, Foreign Exchange Earnings and Outgo
Standalone Auditors’ Report
Standalone Financial Statements
Consolidated Auditors’ Report
Consolidated Financial Statements
Form AOC-1
2
10
15
17
29
30
39
42
43
45
50
88
92
135

2
NOTICERegistered Office:Neville House, J. N. Heredia Marg, Ballard Estate, Mumbai-400001.
Head Office:C-1, Wadia International Centre,Pandurang Budhkar Marg, Worli, Mumbai 400 025.(CIN: L24299MH1954PLC009254)Email: [email protected]: www.naperol.comPhone: 022-66620000Fax: 022-66193421
NOTICE is hereby given that the Sixty-Fourth Annual General Meeting of the Members of NATIONAL PEROXIDE LIMITED will be held at Sunville Banquet & Conference Rooms, 9, Dr. Annie Besant Road, Near Worli Flyover, Worli, Mumbai 400 018 on Thursday, 2nd August, 2018 at 4.00 p.m. to transact the following business:
Ordinary Business:1. To receive, consider and adopt:
a. the Audited Standalone Financial Statements of the Company for the financial year ended 31st March, 2018, together with the Reports of the Board of Directors and Auditors thereon; and
b. the Audited Consolidated Financial Statements of the Company for the financial year ended 31st March, 2018, together with the Report of the Auditors thereon.
2. To declare a Dividend on Equity Shares for the financial year ended 31st March, 2018.
3. To appoint a Director in place of Dr. (Mrs.) Minnie Bodhanwala (DIN: 00422067), who retires by rotation in terms of Section 152(6) of the Companies Act, 2013 and being eligible, offers herself for re-appointment.
Special Business:4. To consider and if thought fit, to pass the following resolution
as an Ordinary Resolution:
“RESOLVED THAT, pursuant to the provisions of Section 148 and all other applicable provisions, if any, of the Companies Act, 2013 and the Companies (Audit and Auditors) Rules, 2014, (including any statutory modification(s) or re-enactment(s) thereof, for the time being in force), M/s. D.C. Dave & Co., Cost Accountants, Mumbai, the Cost Auditors appointed by the Board of Directors of the Company, to conduct the audit of the cost records of organic and inorganic chemicals and industrial gases of the Company for the financial year ending 31st March, 2019, be paid remuneration of ` 4,00,000/- plus applicable taxes and reimbursement of travelling and out-of-pocket expenses incurred by them for the purpose of Audit.”
“RESOLVED FURTHER THAT any one of the Directors, Chief Financial Officer and Company Secretary of the Company, be and are hereby severally authorized to do all necessary acts, deeds, matters and things as may be considered necessary and desirable to give effect to this Resolution.”
5. To consider and if thought fit, to pass the following resolution as an Ordinary Resolution:
“RESOLVED THAT Mr. Suresh Khurana (DIN: 06677496), who was appointed as an Additional Director of the Company by the Board of Directors on 15th December, 2017, and who holds office up to the date of this Annual General Meeting of the Company in terms of Section 161 of the Companies Act, 2013 (“the Act”) and is eligible for appointment and in respect of whom the Company has received a notice in writing under Section 160 of the Act, be and is hereby appointed as Director of the Company.”
“RESOLVED FURTHER THAT, in accordance with the provisions of Sections 196, 197, 198, 203, Schedule V and other applicable provisions, if any, of the Companies Act, 2013 (“the Act”) read with the Companies (Appointment & Remuneration of Managerial Personnel) Rules, 2014 (“the Rules”), including any statutory modification(s) or any amendment(s) thereto or any substitution(s) or any re-enactment(s) thereof for the time being in force and pursuant to recommendation of the Nomination and Remuneration Committee and approval of the Board of Directors vide resolution dated 15th December, 2017, the consent of the members be and is hereby accorded for the appointment of Mr. Suresh Khurana, as the Whole-Time Director of the Company to be designated as the “Chief Executive Officer and Director” of the Company for a period of 3 (three) years, commencing from 15th December, 2017, upon and subject to the terms and conditions as agreed and contained in the Agreement proposed to be entered into with him and on the broad terms & conditions as set out in the Explanatory Statement annexed to this Notice, with liberty to the Board of Directors to add, alter and vary the terms and conditions of the said appointment and/or remuneration and/or agreement, or any amendments thereto as may be agreed to, between the Board and Mr. Suresh Khurana, subject to such other approvals of applicable authority(ies), if any, including that of the Central Government, as may be required under the applicable laws to such appointment / alteration(s) / variation(s) / amendment(s).”
“RESOLVED FURTHER THAT the Board be and is hereby authorized to enter into an Agreement on behalf of Company with Mr. Suresh Khurana on the broad terms and conditions as set out in the Explanatory Statement annexed to this Notice.”
“RESOLVED FURTHER THAT any one of the Directors, Chief Financial Officer and Company Secretary of the Company, be and are hereby severally authorized to do all necessary acts, deeds, matters and things as may be considered necessary and desirable to give effect to this Resolution.”
By Order of the Board of DirectorsFor NATIONAL PEROXIDE LIMITED
SURESH KHURANAChief Executive Officer & Director
(DIN: 06677496)
Mumbai, 24th May, 2018

3
Annual Report 2017-2018
NOTES:a) A MEMBER ENTITLED TO ATTEND AND VOTE AT
THE MEETING IS ENTITLED TO APPOINT ONE OR MORE PROXIES TO ATTEND AND VOTE INSTEAD OF HIMSELF/ HERSELF AND SUCH PROXIES NEED NOT BE MEMBER(S). IN ORDER TO BE VALID, PROXY FORMS DULY COMPLETE IN ALL RESPECTS, SHOULD BE LODGED WITH THE COMPANY AT ITS REGISTERED OFFICE NOT LATER THAN FORTY-EIGHT HOURS BEFORE THE COMMENCEMENT OF THE MEETING.
A person can act as a proxy on behalf of members not exceeding Fifty and holding in the aggregate not more than ten percent of the total share capital of the Company carrying voting rights. A member holding more than ten percent of the total share capital of the Company carrying voting rights may appoint a single person as proxy and such person shall not act as a proxy for any other person or shareholder.
b) Explanatory Statement pursuant to Section 102 of the Companies Act, 2013, in respect of the Special Business as set out in the Notice is annexed hereto as ‘Annexure I’.
c) Corporate members intending to send their authorized representatives to attend the Meeting are requested to send to the Company a certified true copy of the Board Resolution authorizing their representative to attend and vote on their behalf at the meeting.
d) A brief resume of the Director(s) proposed to be appointed / re-appointed, nature of expertise in functional areas, names of companies in which they hold directorships and memberships/chairmanships of Board Committees, shareholding and relationships between directors inter-se as stipulated under Regulation 36 of the SEBI (Listing Obligations and Disclosure Requirements) Regulations, 2015, and other details as required by the Secretarial Standards is annexed hereto as ‘Annexure II’.
e) The Register of Members and the Share Transfer Books of the Company will remain closed from Friday, 20th July, 2018 to Thursday, 2nd August, 2018 (both days inclusive) for the purpose of determining eligibility of members entitled to dividend.
f) The dividend as recommended by the Board of Directors, if approved by the members at this Annual General Meeting, shall be paid on or after Friday, 3rd August, 2018, to those members whose names appear:
(i) as Beneficial Owners as at the close of the business hours on Thursday, 19th July, 2018, as per the details to be furnished by the National Securities Depository Limited and the Central Depository Services (India) Limited in respect of shares held in electronic form; and
(ii) as members in the Register of Members of the Company after giving effect to valid share transfers in physical form lodged with the Company on or before Thursday, 19th July, 2018. Transfer documents received after Thursday, 19th July, 2018, will not be considered for the aforesaid purpose.
g) Members are requested to notify immediately any change of address:
(i) to their Depository Participants (DPs) in respect of their electronic share accounts; and
(ii) to the Company’s Registrar & Share Transfer Agents, Sharex Dynamic (India) Pvt. Ltd., at Unit No. 1, Luthra Industrial Premises, Andheri-Kurla Road, Safed Pool, Andheri (E), Mumbai – 400 072, (Tel: 022-28515644 / 022-28515606) in respect of their physical share folios, if any, quoting their folio numbers.
h) The National Automated Clearing House (NACH) facility should mandatorily be used by companies for the distribution of dividend to its members. In order to avail the facility of NACH, members holding shares in physical form are requested to provide bank account details to the Company or its Registrar and Share Transfer Agents (RTA).
Members holding shares in electronic form are hereby informed that bank particulars registered against their respective depository accounts will be used by the Company for payment of dividend. The Company or its RTA cannot act on any request received directly from the Members holding shares in electronic form for any change of bank particulars or bank mandates. Such changes are to be advised only to the Depository Participant of the Members.
i) Pursuant to the provisions of Section 124(5) of the Companies Act, 2013, dividends for the financial year ended March 31, 2011 and thereafter, which remain unpaid or unclaimed for a period of 7 years from the respective dates of transfer to the unpaid dividend account of the Company are due for transfer to the Investor Education & Protection Fund (IEPF) on the dates given in the table below:
Financial Year
Date of Declaration of
Dividend
Due Date for Transfer to IEPF
2010-11 08.08.2011 08.09.20182011-12 09.08.2012 09.09.20192012-13 14.08.2013 15.09.20202013-14 11.08.2014 11.09.20212014-15 11.08.2015 13.09.20222015-16 11.08.2016 11.09.20232016-17 09.08.2017 11.09.2024
Members who have so far not encashed the Dividend Warrants for the above years are advised to submit their claim to Sharex Dynamic (India) Pvt. Ltd. (RTA), at the address given above, quoting their folio numbers/ DP ID & Client ID.
Pursuant to the provisions of Section 124(6) of the Companies Act, 2013 (“Act”) read with Investor Education and Protection Fund (IEPF) Authority (Accounting, Audit, Transfer and Refund) Rules, 2016 (“the Rules”), as amended from time to time, the Company is required
4
to transfer all shares in respect of which dividend has not been paid or claimed for a period of seven consecutive years to the Demat Account of the IEPF Authority.
In compliance with the said Rules, the Company has communicated individually to the concerned shareholders whose shares are liable to be transferred / credited to the Demat Account of the IEPF Authority. The Company has uploaded on the website of the Company www.naperol.com under Investor Section, the details of such shareholders whose shares are to be transferred /credited to the Demat Account of the IEPF Authority.
Shareholders may note that both, the unclaimed dividend amount transferred to IEPF and the shares transferred to the Demat Account of the IEPF Authority including all benefits accruing on such shares, if any, can be claimed back by the shareholders from the IEPF Authority after following the procedure prescribed in the Rules.
j) Members holding shares in physical form may avail themselves of the facility of nomination in terms of Section 72 of the Companies Act, 2013 by nominating in the prescribed form a person to whom their shares in the Company shall vest in the event of their death. The prescribed form can be obtained from the Company’s RTA mentioned above.
k) Pursuant to Section 101 of the Companies Act, 2013 read with the Companies (Management and Administration) Rules, 2014 and Section 136 of the Companies Act, 2013 read with the Companies (Accounts) Rules, 2014, the Company can serve notice of general meeting and financial statements through electronic mode to those members who have registered their e-mail address with the depository or the Company. The members, who hold shares in dematerialized form, are requested to register/update their e-mail address with the depository. The members holding shares in physical form may also opt to receive notices/financial statements by registering their e-mail address with the Company’s RTA at [email protected].
l) Members intending to require information about the Financial Statements, to be explained at the Meeting are requested to inform the Company at least 10 days prior to the date of Meeting so that the requisite information can be readily made available at the Meeting.
m) Members/Proxies should bring the attendance slip duly filled in and signed for attending the Meeting and handover the same at the entrance of the Hall.
n) Members are requested to bring their copy of the Annual Report to the Meeting.
o) The Securities and Exchange Board of India (SEBI) has mandated the submission of Permanent Account Number (PAN) by every participant in securities market. Members holding shares in electronic form are, therefore, requested to submit the PAN to their Depository Participants with whom they are maintaining their demat accounts. Members holding shares in physical form can submit their PAN card copy to the Company.
p) Members may also note that the Notice of the 64th Annual General Meeting will also be available on the website of the Company www.naperol.com and website of Central Depository Services (India) Limited (CDSL) www.evotingindia.com. The copies of the aforesaid documents will also be available at the Company’s Head Office in Mumbai for inspection during normal business hours on all working days except Saturdays, Sundays and Public Holidays. Even after registering for e-communication, members are entitled to receive such communication in physical form, upon making a request for the same.
q) Voting through Electronic Means:
I. In compliance with the provisions of Section 108 of the Companies Act, 2013 and Rule 20 of the Companies (Management and Administration) Rules, 2014; and Regulation 44 of the SEBI (Listing Obligations and Disclosure Requirements) Regulations, 2015, the Company has provided ‘remote e-voting’ [e-voting from a place other than venue of the AGM] facility through Central Depository Services (India) Limited (CDSL) as an alternative, for all members of the Company to enable them to cast their votes electronically, on the resolutions mentioned in the Notice of the 64th AGM of the Company, dated 24th May, 2018.
II. The facility for voting through ballot paper shall also be made available at the venue of the AGM. The members attending the meeting, who have not cast their vote through remote e-voting shall be able to exercise their voting rights at the meeting. The members who have already cast their vote through remote e-voting may attend the meeting but shall not be entitled to cast their vote again at the AGM.
III. The remote e-voting period commences on 30th July, 2018 (9.00 a.m.) and ends on 1st August, 2018 (5.00 p.m.). During this period, members of the Company, holding shares either in physical form or in dematerialized form, as on the cut-off date of 26th July, 2018, may cast their vote by remote e-voting. A person who is not a member as on the cut-off date should treat this Notice for information purpose only.
The remote e-voting module shall be disabled by CDSL for voting thereafter. Once the vote on a resolution is cast by the member, the member shall not be allowed to change it subsequently. The remote e-voting module shall be disabled by CDSL for voting after 5.00 p.m. on Wednesday, 1st August, 2018.
IV. The process and manner for remote e-voting are as under:
i. Log on to the e-voting website www.evotingindia.com
ii. Click on “Shareholders/Members”.
iii. Now Enter your User ID
a. For CDSL: 16 digits beneficiary ID;
b. For NSDL: 8 Character DP ID followed by 8 Digits Client ID;
c. Members holding shares in Physical Form should enter Folio Number registered with the Company.
5
Annual Report 2017-2018
iv. Enter the Image Verification as displayed and Click on Login.
V. If you are holding shares in demat form and had logged on to www.evotingindia.com and voted on an earlier voting of any company, then your existing password is to be used.
VI. If you are a first-time user, follow the steps given below:
For Members holding shares in Demat Form and Physical Form
PAN Enter your 10 digit alpha-numeric PAN issued by Income Tax Department (Applicable for both demat shareholders as well as physical shareholders).
Members who have not updated their PAN with the Company/Depository Participant are requested to use the first two letters of their name and the last 8 digits of the sequence number in the PAN field.
In case the sequence number is less than 8 digits enter the applicable number of 0’s before the number after the first two characters of the name in CAPITAL letters. Eg. If your name is Ramesh Kumar with sequence number 1 then enter RA00000001 in the PAN field.
Dividend Bank Details OR Date of Birth (DOB)
Enter the Dividend Bank Details or Date of Birth (in dd/mm/yyyy format) as recorded in your demat account or in the company records in order to login.
[If both the details are not recorded with the depository or company, please enter the member id / folio number in the Dividend Bank details field as mentioned in instruction IV(iii).]
VII. After entering these details appropriately, click on “SUBMIT” tab.
VIII. Members holding shares in physical form will then reach directly the Company selection screen. However, members holding shares in demat form will now reach ‘Password Creation’ menu wherein they are required to mandatorily enter their login password in the new password field. Kindly note that this password is to be also used by the demat holders for voting for resolutions of any other company on which they are eligible to vote, provided that company opts for e-voting through CDSL platform. It is strongly recommended not to share your password with any other person and take utmost care to keep your password confidential.
IX. For Members holding shares in physical form, the details can be used only for e-voting on the resolutions contained in this Notice.
X. Click on the EVSN of National Peroxide Limited.
XI. On the voting page, you will see “RESOLUTION DESCRIPTION” and against the same the option “YES/NO” for voting. Select the option YES or NO as desired. Option YES implies that you assent to the Resolution and option NO implies that you dissent to the Resolution.
XII. Click on the “RESOLUTIONS FILE LINK” if you wish to view the entire Resolution details.
XIII. After selecting the resolution you have decided to vote on, click on “SUBMIT”. A confirmation box will be displayed. If you wish to confirm your vote, click on “OK”, else to change your vote, click on “CANCEL” and accordingly modify your vote.
XIV. Once you “CONFIRM” your vote on the resolution, you will not be allowed to modify your vote.
XV. You can also take out print of the voting done by you by clicking on “Click here to print” option on the Voting page.
XVI. If Demat account holder has forgotten the changed login password, then enter the User ID and the image verification code and click on “Forgot Password” & enter the details as prompted by the system.
XVII. Shareholders can also cast their vote using CDSL’s mobile app m-Voting available for android based mobiles. The m-Voting app can be downloaded from Google Play Store. iPhone and Windows phone users can download the app from the App Store and the Windows Phone Store respectively. Please follow the instructions as prompted by the mobile app while voting on your mobile.
XVIII. Note for Non – Individual Shareholders and Custodians;
Non – Individual shareholders (i.e. other than Individuals, HUF, NRI etc.) and Custodian are required to log on to www.evotingindia.com and register themselves as Corporates.
They should submit a scanned copy of the Registration Form bearing the stamp and sign of the entity to [email protected].
After receiving the login details, a Compliance User should be created using the admin login and password. The Compliance user would be able to link the account(s) for which they wish to vote on.
The list of accounts linked in the login should be mailed to [email protected] and on approval of the accounts they would be able to cast their vote.
They should upload a scanned copy of the Board Resolution and Power of Attorney (POA) which they have issued in favour of the Custodian, if any, in PDF format in the system for the scrutinizer to verify the same.

6
XIX. In case you have any queries or issues regarding e-voting, you may refer the Frequently Asked Questions (“FAQs”) and e-voting manual available at www.evotingindia.com under help section or write an email to [email protected].
r) Mr. Nilesh Shah of Nilesh Shah & Associates, Practicing Company Secretary, (Membership No: FCS 4554) has been appointed as the Scrutinizer to scrutinize the e-voting process in a fair and transparent manner.
s) The Scrutinizer shall after the conclusion of the e-voting period unblock the votes in the presence of at least two witnesses not in the employment of the Company and make a Scrutinizer’s Report of the votes cast in favour or against, if any, forthwith to the Chairman of the Company.
t) The Results declared alongwith the Scrutinizer’s Report shall be placed on the Company’s website www.naperol.com and on the website of CDSL e-voting by 4th August, 2018 and communicated to BSE Limited.
u) MEMBERS HOLDING EQUITY SHARES IN ELECTRONIC FORM, AND PROXIES THEREOF, ARE REQUESTED TO BRING THEIR DP ID AND CLIENT ID FOR IDENTIFICATION.
By Order of the Board of DirectorsFor NATIONAL PEROXIDE LIMITED
SURESH KHURANAChief Executive Officer & Director
(DIN: 06677496)
Mumbai, 24th May, 2018
ANNEXURE I TO THE NOTICE
EXPLANATORY STATEMENT IN RESPECT OF THE SPECIAL BUSINESS PURSUANT TO SECTION 102 OF THE COMPANIES ACT, 2013
Item No. 4The Board of Directors, on the recommendation of the Audit Committee, approved the appointment of M/s. D. C. Dave & Co., Cost Accountants, Mumbai, as Cost Auditors to conduct the audit of the cost records of organic and inorganic chemicals and industrial gases of the Company at a remuneration of ` 4,00,000/- plus applicable taxes and reimbursement of travelling and out-of-pocket expenses incurred by them for the financial year ending 31st March, 2019. In terms of the provisions of Section 148(3) of the Companies Act, 2013 read with the Companies (Audit and Auditors) Rules, 2014, the remuneration payable to the Cost Auditor as recommended by the Audit Committee and approved by the Board of Directors, has to be ratified by the Members of the Company.
A certificate issued by the above firm regarding their eligibility for appointment as Cost Auditors will be available for inspection at the Head Office of the Company on all working days except Saturdays, Sundays and Public Holidays between 11.00 a.m. to 1.00 p.m. upto and including the date of the Annual General Meeting.
Accordingly, consent of the shareholders is sought for passing an Ordinary Resolution as set out at Item No. 4 of the Notice for ratification of the remuneration payable to the Cost Auditors for the financial year ending 31st March, 2019.
None of the Directors and Key Managerial Personnel of the Company or their relatives are, in any way, concerned or interested, financially or otherwise, in the resolution set out at Item No. 4 of the Notice.
The Board of Directors commends the Ordinary Resolution set out at Item No. 4 of the accompanying Notice for approval of the Members.
Item No. 5The Board of Directors at its meeting held on 15th December, 2017, appointed Mr. Suresh Khurana as an Additional Director of the Company to hold office upto the date of this Annual General Meeting. He was also appointed as a Whole-Time Director of the Company to be designated as the “Chief Executive Officer and Director” for a period of 3 (three) years, commencing from 15th
December, 2017, subject to the approval of the shareholders at the ensuing Annual General Meeting, pursuant to sections 196, 197, 198 and 203, read with Schedule V and other applicable provisions, if any, of the Companies Act, 2013, on such terms and conditions including remuneration, as recommended by the Nomination and Remuneration Committee and approved by the Board of Directors of the Company and set out in the draft Agreement to be entered into between the Company and Mr. Khurana.
Mr. Khurana is currently also designated as Chief Executive Officer of the Polyester Staple Fibre division of The Bombay Dyeing & Mfg. Co. Ltd., part of the Wadia Group of Companies. However, he has not been appointed as a Key Managerial Personnel (KMP) under section 203 of the Companies Act, 2013, in The Bombay Dyeing & Mfg. Co. Ltd.
The Company and its Solicitors are of the view that an employee of one company (not being a KMP in that company) could be appointed as KMP of another company (Section 203 of the Act does not restrict such appointment). Further, the Company has no objection to his association with The Bombay Dyeing & Mfg. Co. Ltd., since Mr. Khurana is in a position to devote sufficient time and attention to the Company to enable him to discharge his duties and responsibilities of the Company.

7
Annual Report 2017-2018
The broad terms and conditions of appointment of Mr. Suresh Khurana as Chief Executive Officer (CEO) and Director are as follows:
1. TENURE
Period of three (3) years from 15th December, 2017.
2. REMUNERATION AND PERQUISITES
(i) Basic salary upto a maximum of ̀ 25,00,000 per month with increments each year as may be approved by the Board on the recommendation of the Nomination and Remuneration Committee.
(ii) Benefits and perquisites and allowances as may be recommended by the Nomination and Remuneration Committee and approved by the Board of the Company from time to time, or as may be applicable in accordance with the rules and policies of the Company, upto a maximum of ` 25,00,000 per month.
(iii) Reimbursement of actual medical expenses incurred on self and spouse.
(iv) Reimbursement of all actual expenses including travelling, entertainment / business promotion and other actual out of pocket expenses incurred by him in connection with or in relation to the business of the Company.
(v) Bonus and/or Commission, as may be approved by the Board of the Company, upon the recommendations of the Nomination and Remuneration Committee based on the performance criteria formulated by the Board / Nomination and Remuneration Committee.
(vi) Contribution to Provident Fund, Superannuation Fund and Gratuity Fund shall be made by the Company in accordance with the rules / policy formulated by the Company.
(vii) Group medical and other insurance for which the payment of premium would be made by the Company.
(viii) Leave in accordance with the rules framed by the Company.
3. GENERAL
(i) Mr. Khurana shall exercise such powers and perform duties as the Board shall, from time to time, determine and subject to and directions and restrictions, from time to time, given and imposed by the Board.
(ii) Subject to the superintendence control and direction of the Board of the Company, Mr. Khurana shall be in charge of the general conduct and management of the whole business and affairs of the Company and shall carry out such functions, exercise and such powers and perform such duties as the Board of the Company shall determine and entrust to him.
(iii) Mr. Khurana shall throughout the said term, devote his sufficient time, attention and abilities to the business of the Company and shall carry out the orders, from time to time, of the Board and in all respect conform to and comply with the directions and regulations made by the Board, and shall faithfully serve the Company and shall promote the interests of the Company.
(iv) Mr. Khurana shall adhere to the Company’s Code of Conduct and ensure there is no conflict of interest with the Company and further ensure maintenance of required confidentiality.
(v) The office of Mr. Khurana may be terminated by the Company or by him by giving the other 6 (six) months prior notice in writing.
Your Directors consider the aforesaid remuneration commensurate with the duties and responsibilities of Mr. Khurana.
The Company has received notice under Section 160 of the Companies Act, 2013 signifying his candidature as a Director of the Company.
Mr. Khurana satisfies all the conditions set out in Part-I of Schedule V of the Companies Act, 2013 as also the conditions set out under Section 196(3) of the Act for being eligible for his appointment. He is not disqualified from being appointed as Director in terms of Section 164 of the Companies Act, 2013.
The draft Agreement to be entered into by the Company with Mr. Khurana is available for inspection by the Members at the Head Office of the Company on any working day (except Saturdays, Sundays and public holidays) upto the date of the Annual General Meeting.
The above may be treated as an abstract of the terms of the Agreement between the Company and Mr. Khurana and a written memorandum setting out terms of reappointment of Mr. Khurana under Section 190 of the Companies Act, 2013.
The Directors, therefore, commend the Ordinary Resolution at Item No. 5 for approval by the Members. None of the Directors / Key Managerial Personnel / their relatives are in a way concerned with or interested financially or otherwise in the Resolution, except Mr. Khurana, as it relates to his appointment as Chief Executive Officer and Director and the remuneration payable to him.
By Order of the Board of Directors For NATIONAL PEROXIDE LIMITED
SURESH KHURANAChief Executive Officer & Director
(DIN: 06677496)
Mumbai, 24th May, 2018

8
ANNEXURE II TO THE NOTICE
Brief Resume of Director(s) proposed to be appointed / re-appointed
1. Dr. (Mrs). Minnie Bodhanwala
Dr. (Mrs). Minnie Bodhanwala, 55, is presently the Chief Executive Officer at Nowrosjee Wadia Maternity Hospital and Bai Jerbai Wadia Hospital for Children, Parel, Mumbai.
Under her mantle, the Wadia Hospitals have won 21 prestigious awards in a span of one year. Dr. Bodhanwala was honoured with more than 40 awards, which include various prestigious awards like the “International Award in Healthcare” by the Thai Chamber of Commerce, Bangkok; “Global Award for Sustainable Healthcare Models with Revenue Turnover”, Dubai; “Leading Business Women of the Year” by iiGlobal, Mumbai; Life Time Achievement Award in Healthcare by National Excellence Awards 2015.
She is highly-motivated, pro-active passionate individual holding a rich enormous experience of over 30 years with exceptional liaison, teamwork, leadership, & organizational abilities to thrive in a fast-paced, results-oriented business environment. With an entrepreneurial spirit to foresee potential growth with a strong background of crisis management in Healthcare for Brownfield and Greenfield projects and also a Six Sigma Black Belt Expert.
She holds the following qualifications:
BDS, MBA, MHA, TQM, FCR, PGQMAHO; FISQUA
Black Belt – Six Sigma;
Principal Assessor, NABH ISO Auditor 9001, 14001
Dr. Bodhanwala’s vast experience in management and administration would be of immense benefit to the Company.
Date of first appointment on the Board: 1st October, 2015. Number of Board Meetings attended during the year: Nine (9).
Outside Directorship: The Bombay Dyeing and Mfg. Co. Ltd.; The Bombay Burmah Trading Corporation Ltd.; and Axel Polymers Limited.
Committee Membership: Stakeholders’ Relationship Committee and Nomination & Remuneration Committee of Axel Polymers Limited.
Dr. Bodhanwala is not related to any of the other Directors. She does not hold any shares of the Company.
2. Mr. Suresh Khurana
Mr. Suresh Khurana, 64, is an Associate Member of the Institute of Cost Accountants of India, Institute of Company Secretaries of India and Indian Institute of Bankers, besides Bachelor of Laws and Bachelor of Commerce (Hons) from Delhi University. Mr. Khurana is also qualified in Mechanical Engineering from BIET, Mumbai.
Mr. Khurana has vast experience of over 45 years, in India, Indonesia and Singapore, in diverse manufacturing industries like, polyester, polyamide, textiles, shoes and light engineering products and also in services sector like banking and insurance brokerage.
Presently, Mr. Khurana is Chief Executive Officer of The Bombay Dyeing and Manufacturing Co. Ltd and has been responsible for its Polyester Division for the last 5 years. Prior to this, he was associated for 23 years with Shinta Group, an Indonesian conglomerate with interest in polyester, polyamide, textiles, shoes and services sectors like Banking, insurance brokerage and forex brokerage, where he held several positions such as Chief Operating Officer, Marketing Director, Financial Adviser and Executive Adviser Banking.
Mr. Khurana spent 12 years with Bank of India in Singapore and India holding different positions and responsibilities. In the initial years of his career, he worked with companies like Avery India Ltd., and The Jay Engineering Works Ltd., in technical and commercial functions.
Mr. Khurana has been active in industry organizations and currently is Executive Committee Member of Association of Synthetic Fibre Industry in India. In the past he was Secretary General of Asian Chemical Fibre Industries Federation and Executive Member of Indonesian Synthetic Fibre Industries Association.
Date of first appointment on the Board: 15th December, 2017. Number of Board Meetings attended for part of the year: Three (3).
Outside Directorship: Naperol Investments Ltd.; and Association of Synthetic Fibre Industry.
Committee Membership: Stakeholders’ Relationship Committee of National Peroxide Ltd.
Mr. Khurana is not related to any of the other Directors. He does not hold any shares of the Company.
By Order of the Board of DirectorsFor NATIONAL PEROXIDE LIMITED
SURESH KHURANAChief Executive Officer & Director
(DIN: 06677496)
Registered Office:
Neville House, J. N. Heredia Marg,Ballard Estate, Mumbai 400 001Phone: 022-66620000Fax: 022-66193421CIN: L24299MH1954PLC009254Website: www.naperol.com
Mumbai, 24th May, 2018

9
Annual Report 2017-2018
ROUTE MAP FOR THE SIXTY-FOURTH ANNUAL GENERAL MEETING OF THE MEMBERS OF NATIONAL PEROXIDE LIMITED TO BE HELD AT SUNVILLE BANQUET & CONFERENCE ROOMS, 9, DR. ANNIE BESANT ROAD, NEAR WORLI FLYOVER, WORLI, MUMBAI 400 018 ON THURSDAY 2ND AUGUST, 2018 AT 4.00 P.M.
Route Map to reach the Meeting Hall from Elphinstone and Mahalaxmi Railway Stations.
Landmark: Near Worli Flyover.

10
DIRECTORS’ REPORT TO THE MEMBERSThe Directors take pleasure in presenting their Sixty-Fourth Annual Report on the business and operations of the Company and the Audited Financial Statements for the year ended 31st March, 2018.
1. FINANCIAL RESULTS (` in lacs)
Particulars
Financial Year Ended
Standalone Consolidated
31/03/2018 31/03/2017 31/03/2018 31/03/2017
Revenue from Operations (Gross of Excise) and Other Income 32,056.69 26,776.20 32,132.42 26,854.89
Profit before tax and exceptional items 14,516.69 6,473.41 14,591.55 6,551.23
Exceptional Items (105.92) 768.94 (105.92) 768.94
Profit before tax after exceptional items 14,622.61 5,704.47 14,697.47 5,782.29
Tax 5,110.94 1,916.21 5,113.76 1,918.78
Net Profit after Tax 9,511.67 3,788.26 9,583.71 3,863.51
Dividend paid on Equity Shares (` 34 Per Share for FY 2016-17 and ` 10 Per Share for FY 2015-16) 1,953.98 574.70 1,953.98 574.70
Dividend Distribution Tax 397.79 117.01 397.79 117.01
Note: The financial results for the year ended 31st March, 2018, are in compliance with the Indian Accounting Standards (Ind AS) and accordingly, the results for the previous year ended 31st March, 2017 have been restated.
2. DIVIDEND Your Directors have recommended a dividend of ` 65/- per equity share of ` 10/- each for the Financial Year 2017-18, to be
paid, if declared by the members at the Annual General Meeting to be held on 2nd August, 2018.
3. TRANSFER TO RESERVES During the current financial year, no transfers were made to reserves.
4. STATE OF COMPANY’S AFFAIRS The gross sales and other income for the year under review were ` 32,056.69 lacs as against ` 26,776.20 lacs for the previous
year, registering increase of 19.72%. The profit before tax was ` 14,622.61 lacs (after interest and depreciation charges of ` 969.75 lacs) and the profit after tax was ` 9,511.67 lacs for the year under review as against ` 5,704.47 lacs and ` 3,788.26 lacs respectively, for the previous year, registering increase of 156.34% and 151.08% respectively.
The Company produced 1,03,059 MT of Hydrogen Peroxide, during the year under review, as compared to 93,564 MT during the previous year. The production was higher during the year due to improved plant efficiency.
The Company sold 1,00,365 MT of Hydrogen Peroxide during the year under review, as against 96,195 MT during the previous year. The Company continues to maintain its prime position in the market and held 39% market share during the year as compared to 38% during the previous year.
1.16 Million Cubic Meters (MCM) of Hydrogen Gas were also sold during the year as against 1.26 MCM during the previous year.
During the financial year, the Company’s management has identified instances of embezzlement of its funds by certain employees of the Company, including senior management employees, whose services have since been terminated. Based on the management’s scrutiny and the forensic investigation, the Company has initiated criminal proceedings against these employees including filing of FIR and application for other appropriate action with the Joint Commissioner of Police, Economic Offences Wing.
In view of embezzlement that has occurred, systems and controls have been further strengthened.
5. CHANGE(S) IN THE NATURE OF BUSINESS, IF ANY There is no change in the nature of business carried on by the Company and its subsidiary. The Company has not changed the
class of business in which the Company has an interest.
6. MATERIAL CHANGES AND COMMITMENTS There have been no material changes and commitments, affecting the financial position of the Company which have occurred
between the end of the financial year of the Company to which the financial statements relate and the date of the report.

11
Annual Report 2017-2018
7. SAFETY & ENVIRONMENT The Company continues to maintain a good safety and environmental record. There was no lost time injury during the Financial
Year 2017-18. It has worked for 791 days without Lost Time Injury as on 31st March, 2018.
8. INSURANCE All the properties of the Company, including buildings, plant and machinery, stocks and materials have been adequately insured.
The Company also has a public liability insurance policy as per the Public Liability Insurance Act, 1991.
9. FIXED DEPOSITS The Company does not accept fresh deposits at present, and as such, no amount on account of principal or interest on public
deposits was outstanding as on the date of the balance sheet.
10. DETAILS OF SUBSIDIARIES, JOINT VENTURES, ASSOCIATE COMPANIES AND HOLDING COMPANY Naperol Investments Limited (Naperol) is the only subsidiary of the Company. There were no joint ventures and associate
companies.
Pursuant to Section 129(3) of the Companies Act, 2013, read with Rule 5 of the Companies (Accounts) Rules, 2014, the statement containing salient features of the financial statements of Naperol (in Form AOC-1) forms part of the Consolidated Financial Statements. Pursuant to Section 136 of the Companies Act, 2013, the Company is exempted from attaching to its Annual Report, the Annual Report of Naperol.
The Audited Financial Statements of the subsidiary company are kept open for inspection by the Members at the Head Office of the Company. The Company shall provide free of cost, a copy of the financial statements of its subsidiary company to the Members upon their request. The statements are also available on the website of the Company at www.naperol.com.
Pursuant to the scheme of arrangement sanctioned by National Company Law Tribunal vide its order dated 22nd June, 2017, and filed with Registrar of Companies on 2nd August, 2017, N.W. Exports Limited and Sunflower Investments and Textiles Limited, both having investment in Macrofil Investments Limited, has been amalgamated into Nowrosjee Wadia and Sons Limited (“NWS”). Post merger, NWS became the holding company of Macrofil Investments Limited which holds 33.38% shareholding in the Company. Accordingly, NWS has become the holding Company of the Company w.e.f. 2nd August, 2017.
11. PERFORMANCE AND FINANCIAL POSITION OF SUBSIDIARY COMPANY, NAPEROL INVESTMENTS LIMITED
Naperol Investments Limited was incorporated on 6th May, 1980 and is registered as a Non-Banking Financial Company as provided by Section 45-IA of the Reserve Bank of India Act, 1934. The Company is engaged in the business of long term investment. During the year under review, the Company earned a profit after tax of ` 72.04 lacs as against ` 75.25 lacs in the previous year.
12. CONSOLIDATED FINANCIAL STATEMENTS
The Company has prepared Consolidated Financial Statements (CFS) in accordance with the applicable Accounting Standards as prescribed under the Companies (Accounts) Rules, 2014, of the Companies Act, 2013. The Consolidated Financial Results reflect the results of the Company and its subsidiary. As required under Regulation 34 of the SEBI (Listing Obligations and Disclosure Requirements) Regulations, 2015, the Audited CFS together with the Independent Auditors’ Report thereon are annexed and form part of this Report. The summarized Consolidated Financial Results are provided above at point no. 1 of this Report.
13. MANAGEMENT DISCUSSION AND ANALYSIS REPORT The Management Discussion and Analysis Report for the year under review, as stipulated under Regulation 34 of the SEBI
(Listing Obligations and Disclosure Requirements) Regulations, 2015, is appended as Annexure I.
14. CORPORATE GOVERNANCE Your Company has taken adequate steps to ensure that all mandatory provisions of Corporate Governance in terms of Regulation
34 of the SEBI (Listing Obligations and Disclosure Requirements) Regulations, 2015 have been complied with.
A separate report on Corporate Governance along with a Certificate from a Practicing Company Secretary, regarding compliance of the conditions of Corporate Governance, is appended as Annexure II.
15. CORPORATE SOCIAL RESPONSIBILITY The Company has spent ` 80,00,000/- towards its Corporate Social Responsibility (CSR) activities during the Financial Year 2017-18
as per the provisions of the Companies Act, 2013.

12
The CSR Policy of the Company and the details about the development of CSR Policy and initiatives taken by the Company on Corporate Social Responsibility during the year as per the Companies (Corporate Social Responsibility Policy) Rules, 2014 are appended as Annexure III.
16. DETAILS OF BOARD MEETINGS During the year, 9 Board Meetings were held, details of which are provided in the Corporate Governance Report.
17. EXTRACT OF ANNUAL RETURN Pursuant to Section 92(3) of the Companies Act, 2013 and Rule 12(1) of the Companies (Management and Administration)
Rules, 2014, an extract of Annual Return in Form MGT-9 is appended as Annexure IV.
18. DIRECTORS’ RESPONSIBILITY STATEMENT Pursuant to Section 134(5) of the Companies Act, 2013, the Board of Directors, to the best of their knowledge and ability confirm that:
1. in the preparation of the annual accounts, the applicable accounting standards have been followed and that there are no material departures;
2. they have selected such accounting policies and applied them consistently and made judgements and estimates that are reasonable and prudent so as to give a true and fair view of the state of affairs of the Company as at the end of the financial year and of the profit of the Company for that period;
3. they have taken proper and sufficient care for the maintenance of adequate accounting records in accordance with the provisions of this Act for safeguarding the assets of the Company and for preventing and detecting fraud and other irregularities;
4. they have prepared the Annual Accounts on a ‘going concern’ basis;
5. they have laid down internal financial controls to be followed by the Company and that such internal controls are adequate and were operating effectively; and
6. they have devised proper systems to ensure compliance with the provisions of all applicable laws and that such systems were adequate and were operating effectively.
19. ADEQUACY OF INTERNAL FINANCIAL CONTROLS Internal Audit plays a key role in providing an assurance to the Board of Directors with respect to the Company having adequate Internal
Control Systems. The Internal Control Systems provide, among other things, reasonable assurance of recording the transactions of its operations in all material respects and of providing protection against significant misuse or loss of Company’s assets. The details about the adequacy of Internal Financial Controls are provided in the Management Discussion and Analysis Report.
20. STATUTORY AUDITORS M/s. S. B. Billimoria & Co., Chartered Accountants (ICAI Registration No. 101496W), Statutory Auditors of the Company, ceased
to hold office on the conclusion of the Annual General Meeting (AGM) held on 9th August, 2017, as required by mandatory rotation of the Auditors under the Companies Act, 2013.
M/s. Price Waterhouse Chartered Accountants LLP (PW) (FRN. 012754N/N500016), have been appointed as the Statutory Auditors of the Company, from the conclusion of the AGM held on 9th August, 2017, upto the conclusion of the AGM to be held in the financial year 2022-23 subject to ratification of their appointment at every AGM. However, pursuant to the Companies (Amendment) Act, 2017, which was notified on 7th May, 2018, the provision related to ratification of appointment of auditors by Members at every AGM has been done away with.
There are no qualifications, reservations or adverse remarks made in the Statutory Auditors’ Report.
21. COST AUDIT Pursuant to Section 148 of the Companies Act, 2013, read with Rule 14 of the Companies (Cost Records and Audit) Amendment
Rules, 2014, the cost records of the Company are required to be audited. The Board of Directors, on the recommendation of the Audit Committee, appointed M/s. D. C. Dave & Co., Cost Accountants, to audit the cost records of the Company for the financial year ending 31st March, 2018, on a remuneration of ` 4,00,000/- plus applicable taxes and reimbursement of travelling and out-of-pocket expenses as incurred by them for the purpose of Audit. The remuneration payable to the Cost Auditor is required to be ratified by the shareholders at this AGM.
22. SECRETARIAL AUDIT REPORT
In terms of Section 204 of the Companies Act, 2013, and the Companies (Appointment and Remuneration of Managerial Personnel) Rules, 2014, M/s. Parikh & Associates, Practicing Company Secretaries, have been appointed as Secretarial Auditors of the Company to carry out Secretarial Audit. The Report of the Secretarial Auditors is appended as Annexure V.

13
Annual Report 2017-2018
The Company has complied with Secretarial Standards issued by the Institute of Company Secretaries of India on Board and General Meetings.
There are no qualifications, reservations or adverse remarks made in the Secretarial Auditors’ Report. The observations made by the Secretarial Auditors are self-explanatory.
23. RELATED PARTY TRANSACTIONS
The Company’s policy on dealing with Related Party Transactions is disclosed on the Company’s website (weblink: http://www.naperol.com/pdf/boardpolicies/RPT_Policy.pdf). All transactions entered into with Related Parties as defined under the Companies Act, 2013 and Regulation 23 of the SEBI (Listing Obligations and Disclosure Requirements) Regulations, 2015 during the financial year were in the ordinary course of business and on an arms length basis and do not attract the provisions of Section 188 of the Companies Act, 2013.
During the year, the Company had not entered into any contract/ arrangement /transactions with related parties which could be considered as material. The related party transactions are disclosed under Note No. 41 of the Notes to Standalone Financial Statements for the year 2017-18.
24. AUDIT COMMITTEE The Audit Committee of the Company comprises of 3 Independent Directors. The details are provided in the Corporate
Governance Report.
Pursuant to the requirements of the Companies Act, 2013, the Company has established vigil mechanism through the Audit Committee for directors and employees to report genuine concerns about unethical behaviour, actual or suspected fraud or violation of the Company’s Code of Conduct or Ethics Policy.
The vigil mechanism provides for adequate safeguards against victimisation of persons who use such mechanism and make provision for direct access to the Chairman of the Audit Committee in appropriate or exceptional cases.
The details of establishment of such mechanism is also disclosed on the Company’s website (weblink: http://naperol.com/pdf/boardpolicies/Whistle-Blower-policy.pdf).
25. RISK MANAGEMENT POLICY The Company has formulated a Risk Assessment & Management Policy. The details of Risk Management are covered in the
Corporate Governance Report.
26. DIRECTORS AND KEY MANAGERIAL PERSONNEL In accordance with the provisions of Section 152 of the Companies Act, 2013 and the Articles of Association of the Company,
Dr. (Mrs.) Minnie Bodhanwala, Director, retires by rotation at the ensuing Annual General Meeting (AGM) and being eligible, offers herself for re-appointment.
Mr. S. R. Lohokare was re-appointed as Managing Director of the Company for a term of five years with effect from 1st May, 2013, by the Members, at the AGM held on 14th August, 2013. His services were terminated by the Board of Directors w.e.f. 15th December, 2017.
Mr. Suresh Khurana was appointed as an Additional Director of the Company to hold office upto the date of this Annual General Meeting. He was also appointed as Whole-Time Director of the Company to be designated as Chief Executive Officer and Director for a period of three years w.e.f. 15th December, 2017.
Necessary resolutions for the re-appointment of Dr. (Mrs.) Minnie Bodhanwala and appointment of Mr. Suresh Khurana have been included in the Notice convening the ensuing AGM and requisite details have been provided in the explanatory statement to the Notice. Your Directors commend their appointment.
All the Independent Directors have given a declaration under Section 149(7) of the Companies Act, 2013 (“Act”) that they meet the criteria of independence as laid down under Section 149(6) of the Act and Regulation 16 of the SEBI (Listing Obligations and Disclosure Requirements) Regulations, 2015.
Key Managerial Personnel Ms. Seema Jagnani resigned as Company Secretary & Compliance Officer, w.e.f. 13th November, 2017. Mr. Jitendra Prasad was
appointed as Company Secretary & Compliance Officer w.e.f. 14th November, 2017. He resigned w.e.f. 28th December, 2017. The Company is in the process of appointing a Company Secretary & Compliance Officer who is expected to join in due course.

14
27. NOMINATION AND REMUNERATION POLICY The Board has adopted, on the recommendation of the Nomination & Remuneration Committee, a policy for selection and
appointment of Directors, Senior Management and their remuneration. A brief detail of the policy is given in the Corporate Governance Report and also posted on the Company’s website (weblink: http://www.naperol.com/pdf/boardpolicies/Nomination_Policy.pdf).
28. BOARD EVALUATION Pursuant to the provisions of the Companies Act, 2013 and SEBI (Listing Obligations and Disclosure Requirements) Regulations,
2015, the Board has carried out annual performance evaluation of its own performance, the Directors individually and all Committees of the Board The manner in which the evaluation has been carried out has been explained in the Corporate Governance Report.
29. PARTICULARS OF EMPLOYEES The information in terms of provisions of Section 197(12) of the Companies Act, 2013, read with Rule 5(1) of the Companies
(Appointment and Remuneration of Managerial Personnel) Rules, 2014, which forms part of this Report, is appended as Annexure VI.
However, as per the provisions of Section 136 of the Companies Act, 2013, the report and accounts are being sent to the Members and others entitled thereto, excluding the information on employees’ particulars as required under Rule 5(2) and 5(3) of the Companies (Appointment and Remuneration of Managerial Personnel) Rules, 2014, which is available for inspection by the Members at the Head Office of the Company during business hours on working days of the Company upto the date of the ensuing Annual General Meeting. If any Member is interested in obtaining a copy thereof, such Member may write to the Company Secretary in this regard.
30. PARTICULARS OF LOANS, GUARANTEES OR INVESTMENTS Details of Loans, Guarantees and Investments covered under the provisions of Section 186 of the Companies Act, 2013, are
given in Note No. 13 of the Notes to the Standalone Financial Statements.
31. SIGNIFICANT AND MATERIAL ORDERS PASSED BY THE REGULATORS OR COURTS OR TRIBUNALS There have been no significant and material orders passed by the regulators, courts and tribunals impacting the going concern
status and the Company’s operations in future.
32. CONSERVATION OF ENERGY, TECHNOLOGY ABSORPTION, FOREIGN EXCHANGE EARNINGS AND OUTGO The information on conservation of energy, technology absorption and foreign exchange earnings and outgo stipulated under
Section 134(3) of the Companies Act, 2013, read with Rule 8(3) of the Companies (Accounts) Rules, 2014, is appended as Annexure VII.
33. DIVIDEND DISTRIBUTION POLICY The Dividend Distribution Policy is currently not applicable to the Company, since the Company does not fall under the top five
hundred listed entities as on 31st March, 2018. However, this Policy has been adopted on a voluntary basis, as recommended under Regulation 43A of the SEBI (Listing Obligations and Disclosure Requirements) Regulations, 2015. The Policy is posted on the Company’s website (weblink: http://naperol.com/pdf/boardpolicies/Dividend_Distribution_Policy.pdf).
34. ACKNOWLEDGEMENTS Your Directors would like to express their sincere appreciation to the Customers, Vendors, Bankers, Shareholders, Central and
State Governments and Regulatory Authorities for their continued co-operation and support.
Your Directors also take this opportunity to acknowledge the dedicated efforts made by employees for their contribution to the success achieved by the Company.
Mumbai, 24th May, 2018
On behalf of the Board of Directors
NESS N. WADIAChairman
(DIN: 00036049)
15
Annual Report 2017-2018
INDUSTRY STRUCTURE AND DEVELOPMENTSNational Peroxide Limited (NPL) is the largest producer of Hydrogen Peroxide in the country. There are two other producers in the country. During the financial year ended 31st March, 2018, total production of all the three producers in India is estimated at 2,00,000 MT. NPL is a pioneer in Hydrogen Peroxide industry in India and has been at the forefront in development of technology, brand image and market share in the country.
Due to the eco-friendly nature of product, growing awareness of public towards the environment and increase in stringent environmental regulations, the domestic market has significantly developed over the years. The domestic demand is expected to grow by 5-6% during 2018-19. NPL has a market share of 39% in the domestic market. Due to mismatch in demand/supply within the country and surplus in other Asian countries, there has been continuing import of significant volume.
Both the key players in the domestic market (including NPL) are in the process of setting up additional capacities totaling to 78,000 MTPA, both of which are expected to be commissioned during the FY 2018-19. Two new producers have announced setting up new plants adding up to 80,000 MTPA. These capacities are also expected to be operational during the year 2018-19. This would lead to surplus capacity within the country in 2019-20 and restrict imports.
OPPORTUNITIES AND THREATSPositive Outlook for User Industry of Hydrogen Peroxide – An Opportunity:Pulp and Paper: The Indian paper industry is growing on the back of strong economic growth. The demand drivers and growth triggers have come from a combination of factors like rising income levels, growing per capita expenditure and rapid urbanization. The demand is expected to be led by the packaging board segment with the increasing demand from the e-commerce industry. There is enormous potential for the paper industry as demand will be fueled by the increasing proportion of earning population in the country. The overall paper demand growing at a CAGR of around 7% is likely to touch 18.5 million MT in 2018-19.
The threat of import of paper and dependence on imported raw material and wood chips is an issue faced by the paper industry. The Indian paper industry benefitted as a result of Chinese Government banning the import of several varieties of waste paper, which is the primary raw material for finished paper. The production of finished paper is expected to be hampered in China which in turn would ease the availability of waste paper for the domestic industry as also curb cheap imports.
Textiles: Growth in domestic textile industry and Government of India’s focus to further develop this sector multifold in next 7 years bodes well for the Hydrogen Peroxide demand in India.
Emerging Customer for Hydrogen Peroxide – Environmental Applications
Demand for Hydrogen Peroxide from oil refineries for effluent treatment has been developing and will continue to grow with growth in the volume of crude oil being processed by existing and upcoming refineries in the country.
Key Raw Material – Natural Gas – Input for Production of Hydrogen Peroxide
Import Dependency and Price Volatility – A Threat:
One of the key inputs in production of Hydrogen Peroxide is Hydrogen Gas. NPL produces this by steam reforming of Natural Gas, which becomes a key raw material for production of Hydrogen Peroxide.
India imports close to 50% of its requirement of Natural Gas. Price of Natural Gas to a very great extent depends on the crude oil price and US$ exchange rate versus Indian Rupee. This makes the price of Natural Gas subject to increased volatility. Also, Natural Gas does not fall under GST regime and input credit is not available for VAT paid.
NPL procures its Natural Gas requirement under a long-term contract with GAIL (India) Limited and therefore, continuity of supply is fairly assured.
OUTLOOKThe outlook for industry in the near term can only be viewed with cautious optimism. Significant imports continued to take place from Thailand, Bangladesh and South Korea during the FY 2017-18. These imports have been at low prices due to surplus capacities in originating countries. Government of India has imposed Anti-dumping Duty on imports from Bangladesh, Taiwan, Korea RP, Pakistan and Thailand. Imposition of these duties combined with increasing production for expansion and new capacities in the country bodes well for the outlook for Hydrogen Peroxide industry in the near to medium term.
RISKS & CONCERNSThe additional capacities being built by competitors along with the proposed capacity expansion of NPL will alter the demand-supply situation in the country significantly. The custom duty on imports of Hydrogen Peroxide being Zero from some of ASEAN countries distorts the market dynamics. As a result, the margin may come under pressure particularly during periods of higher Gas prices.
INTERNAL CONTROLS SYSTEMS The Company has an Internal Control System, commensurate with the size, scale and complexity of its operations.
During the financial year 2017-18, the Company’s management has identified instances of embezzlement of its funds by certain
ANNEXURE I TO THE DIRECTORS’ REPORT
MANAGEMENT DISCUSSION AND ANALYSIS REPORT

16
employees of the Company, including senior management employees, whose services have since been terminated. Based on the management’s scrutiny and the forensic investigation, the Company has initiated criminal proceedings against these employees including filing of FIR and application for other appropriate action with the Joint Commissioner of Police, Economic Offences Wing.
The Board and its Audit Committee evaluated the performance of M/s. Mahajan & Aibara, Internal Auditors, especially in the light of fraud that took place in the Company and were of the view that the Auditors had failed to perform its obligations and had undertaken the assignment in a cavalier manner. As a consequence of which the services of M/s. Mahajan & Aibara, Internal Auditors were terminated w.e.f. 3rd February, 2018.
M/s Ernst & Young, Chartered Accountants, were appointed as the Internal Auditors of the Company for Quarter 3 & 4 of Financial Year 2017-18 and for Financial Year 2018-19. The Internal Auditors monitor and evaluate the efficacy and adequacy of internal control systems in the Company, its compliance with the operating systems, accounting procedures and policies. Based on the report of internal audit function, process owners undertake corrective action and thereby strengthen the controls. The significant observations and findings of the internal auditors and the internal control system are periodically reviewed by the Audit Committee of the Board of Directors.
The internal system and controls have been further strengthened such that the same are adequate and can be operated effectively so as to safeguard the assets of the Company and for preventing fraud and other irregularities.
FINANCIAL PERFORMANCEDiscussion on financial performance, has been dealt with in the Directors’ Report which should be treated as forming part of this Management Discussion and Analysis Report.
HUMAN RESOURCESThe Company has been maintaining cordial relations with employees at all levels. The long-term settlement with the recognized Union, Maharashtra General Kamgar Union (MGKU) was renewed in March 2018. The Company is implementing employee engagement programs to promote a motivated work force.
The Company provided in-house technical and leadership training to different level of employees for upgrading their technical and leadership skills. Few of our employees were also sent to attend technical programs conducted by the Indian Chemical Council. Various safety trainings were also given to majority of the employees to enhance their awareness about the plant safety.
The employee strength on the permanent rolls of the Company was 113, as on 31st March, 2018.
RESOURCES AND LIQUIDITYThe Company finances its working capital requirements by sourcing credit lines placed at its disposal by a consortium of banks led by State Bank of India.
CAUTIONARY STATEMENT:Statements in this Management Discussion and Analysis Report describing the Company’s objectives, projections, estimates, expectations or predictions may be “forward-looking statements” within the meaning of applicable securities laws and regulations. Actual results could differ materially from those expressed or implied. Important factors that could make a difference to the Company’s operations include raw material availability and prices, cyclical demand and pricing in the Company’s principal markets, changes in Government regulations, tax regimes, economic developments within India and the countries in which the Company conducts business and other incidental factors.
Mumbai, 24th May, 2018

17
Annual Report 2017-2018
ANNEXURE II TO THE DIRECTORS’ REPORT
REPORT ON CORPORATE GOVERNANCEThe Company’s Report on Corporate Governance pursuant to Regulation 34 read with Schedule V of the SEBI (Listing Obligations and Disclosure Requirements) Regulations 2015, (hereinafter referred to as “Listing Regulations”) for the year ended 31st March, 2018, is given below:
1. COMPANY’S PHILOSOPHY ON CODE OF GOVERNANCE
Your Company is committed to bring about good corporate governance practices. The Company’s policy on Corporate Governance is to make it a way of life by, inter alia, adopting the standard Corporate Governance practices through continual improvement of internal systems and satisfaction of customers and shareholders. It strongly believes in attaining transparency, accountability and equity, in all its operations, and in its interactions with stakeholders including shareholders, customers, vendors, employees, government and lenders.
2. BOARD OF DIRECTORS
(a) Composition of the Board
The Board is headed by Mr. Ness N. Wadia, Non-Executive Chairman and is comprised of eminent persons with considerable professional experience in varied fields. The composition of the Board of Directors meets the requirement of Regulation 17 of the Listing Regulations as detailed in the table at item 2(c) below.
(b) Board Meetings and Annual General Meeting
During the year under review, nine Board Meetings were held. The dates on which the meetings were held are: 23rd May, 2017; 9th August, 2017; 18th September, 2017; 7th November, 2017; 8th December, 2017; 15th December, 2017; 3rd February, 2018; 13th February, 2018 and 27th March, 2018. The Annual General Meeting (AGM) was held on 9th August, 2017.
(c) Membership, Attendance and Other Directorships:
Name of DirectorDirector
Identification Number
Category@ Designation
Number of Board Meetings Attended
Whether attended last AGM
No. of other Directorships
held#
No. of Chairmanship /Membership in other Board Committees*
Chairman Member Chairman Member
Mr. Ness N. Wadia 00036049 NI & NED Chairman 8 Yes - 5 - 3
Mr. Rajesh Batra 00020764 I & NED Director 9 Yes 2 3 - 1
Mr. N. P. Ghanekar 00009725 I & NED Director 9 Yes - 3 3 -
Mr. S. Ragothaman 00042395 I & NED Director 8 Yes - 8 3 3
Dr. (Mrs.) Minnie Bodhanwala 00422067 NI & NED Director 9 Yes - 3 - 1
Mr. S. R. Lohokare$ 00254816 ED MD 5 Yes - - - -
Mr. Suresh Khurana^ 06677496 ED CEO & Director 3 N.A. - 2 - -
@ I: Independent; NED: Non-Executive Director; ED: Executive Director;
NI: Non-Independent; MD: Managing Director; CEO: Chief Executive Director
# Excludes Directorship in foreign companies, private companies and companies governed by Section 8 of the Companies Act, 2013.
* In Audit Committee and Stakeholders’ Relationship Committee of Indian Public Limited Companies.
$ The services of Mr. S. R. Lohokare, Managing Director, were terminated by the Board, w.e.f. 15th December, 2017.
^ Mr. Suresh Khurana was appointed as an Additional Director, designated as Chief Executive Officer and Director w.e.f. 15th December, 2017.

18
3. BOARD COMMITTEES:
The Board has constituted the following Committees of the Directors:
(a) Audit Committee:
The Audit Committee is constituted as per the provisions of Section 177 of the Companies Act, 2013, read with Regulation 18 of the Listing Regulations. The Committee comprises of members who possess financial and accounting expertise/exposure.
The Chief Executive Officer & Director, Vice-President (Commercial & Finance), Chief Financial Officer, Statutory Auditors, Internal Auditors and Cost Auditors are regular invitees to the Audit Committee Meetings. The Company Secretary acts as the Secretary to the Audit Committee.
The Company had adopted a revised Audit Committee Charter, containing the terms of reference, w.e.f. 1st October, 2014, in accordance with the Companies Act, 2013 and Clause 49 of the erstwhile Listing Agreement. The Charter was suitably amended to incorporate the requirements under the SEBI (Prohibition of Insider Trading) Regulations, 2015 which came into effect from 14th May, 2015.
The role of the Audit Committee flows directly from the Board of Directors’ overview function on corporate governance, which holds the Management accountable to the Board and the Board accountable to the stakeholders. The term of reference of the Audit Committee broadly includes acting as a catalyst, in helping the organization achieve its objectives. The Audit Committee’s primary role is to review the Company’s financial statements, internal financial reporting process, internal financial controls, the audit process, adequacy, reliability and effectiveness of the internal control systems and risk management process, vigil mechanism, related party transactions, monitoring process for compliance with laws and regulations and the code of conduct. The Audit Committee also reviews various reports and presentations and the responses thereto by the management.
Composition and Attendance: During the year under review, the Committee met seven times. The dates on which the Committee Meetings were held are:
23rd May, 2017; 9th August, 2017; 18th October, 2017; 8th December, 2017; 3rd February, 2018; 13th February, 2018 and 27th March, 2018.
Sr. No. Name of the Director Designation Category* No. of Meetings Attended
1 Mr. N. P. Ghanekar Chairman I & NED 7
2 Mr. Rajesh Batra Member I & NED 7
3 Mr. S. Ragothaman Member I & NED 6
* I: Independent; NED: Non-Executive Director
Internal Audit and Control:
During the financial year 2017-18, the services of M/s. Mahajan & Aibara, Internal Auditors, were terminated w.e.f. 3rd February, 2018, especially in the light of fraud that took place in the Company.
Subsequently, M/s. Ernst & Young, Chartered Accountants, were appointed as the new Internal Auditors of the Company for Quarter 3 & 4 of Financial Year 2017-18 and for Financial Year 2018-19. Their Internal audit plan and remuneration is approved by the Audit Committee. The reports and findings of the Internal Auditors and the internal control system are periodically reviewed by the Audit Committee.
(b) Nomination and Remuneration Committee:
The Nomination and Remuneration Committee is constituted as per the provisions of Section 178 of the Companies Act, 2013 and Regulation 19 of the Listing Regulations.

19
Annual Report 2017-2018
Composition and Attendance:
The Committee comprises of the following Non-Executive Directors, majority of whom are Independent Directors. During the year under review, the Committee met four times. The dates on which the Committee Meetings were held are: 23rd May, 2017; 9th August, 2017; 15th December, 2017 and 27th March, 2018.
Sr. No. Name of the Director Designation Category* No. of Meetings Attended
1 Mr. Rajesh Batra Chairman I & NED 4
2 Mr. N. P. Ghanekar Member I & NED 4
3 Mr. Ness N. Wadia Member NI & NED 4
* I: Independent; NI: Non-Independent; NED: Non-Executive Director
The remuneration policy of the Company is performance driven and structured to motivate the employees, recognize their merits and achievements and promote excellence in their performance. The broad terms of reference of the Nomination and Remuneration Committee include:
Setup and Composition of the Board, its Committees and the leadership team of the Company comprising of Key Managerial Personnel (KMP) and Executive Team.
Evaluation of performance of the Board, its Committees and individual Directors.
Remuneration for Directors, KMPs, Executive Team and other employees.
Oversight of the familiarisation programme of Directors.
Oversight of the HR Philosophy, HR and People strategy and Key HR practices.
Remuneration Policy: Payment of remuneration to the Managing Director / CEO & Director is governed by the agreement executed / to be executed
with the Company. The Board has approved the agreement for appointment of the CEO & Director. This Agreement is to be approved by the Members at the ensuing Annual General Meeting. The criteria adopted by the Committee to determine the remuneration of the Managing Director / CEO & Director is the performance of the Company and the industry benchmarks. The remuneration structure comprises salary, incentive allowance, commission linked to profits, perquisites and allowance, contribution to provident fund and superannuation fund.
The Non-Executive Directors do not draw any remuneration from the Company. The Non-Executive Directors are paid sitting fees for their commitment towards attending the meetings of the Board/Committees and commission on the basis of their performance as may be determined by the Board from time to time. The commission payable to them is distributed broadly on the basis of their attendance, contributions at Board/Committee Meetings and Chairmanship of Committees of the Board.
A. Details of remuneration paid to the Managing Director and Whole-Time Director during 2017-18 and their shareholding in the Company:
(Amount in `)
Name of the Director Salary Benefits* Commission# Total Total no. of shares held
Mr. S. R. Lohokare$ 96,00,000 83,81,152 60,00,000 2,39,81,152 Nil
Mr. Suresh Khurana^ - - - - Nil
$ Remuneration paid upto 14th December, 2017
^ w.e.f. 15th December, 2017. The Company has made a provision of ` 70.01 Lac in respect of his remuneration for the financial year 2017-2018
* Also includes Company’s contribution to Provident and Superannuation Funds, amounting to ` 33,12,000/-.
# Commission of ` 60,00,000/- paid for F.Y. 2016-17 shown on the basis of year of payment.

20
B. Details of payments made to Non-Executive Directors during the year 2017-18 and their Shareholding in the Company, as on 31st March, 2018:
(Amount in `)
Name of the Director Commission@ Sitting Fees Total Total no. of shares held
Mr. Ness N. Wadia 29,33,000 2,80,000 32,13,000 Nil
Mr. Rajesh Batra 12,54,000 4,90,000 17,44,000 Nil
Mr. N. P. Ghanekar 13,98,000 4,90,000 18,88,000 Nil
Mr. S. Ragothaman 5,73,000 3,20,000 8,93,000 Nil
Dr. (Mrs.) Minnie Bodhanwala 3,58,000 1,80,000 5,38,000 Nil
@ Shown on the basis of year of payment.
Apart from the above, there are no other pecuniary relationships of or transactions by the Non-Executive Directors with the Company.
None of the Directors are related to each other in any manner.
During 2017-18, a provision of ` 149 lacs is made in the books of accounts, for payment of commission to Non-Executive Directors, under Section 197 and 198 of the Companies Act, 2013. The individual amounts will be shown in the year of payment.
Presently, the Company does not have a scheme for grant of stock options either to the Directors or to the employees.
Details of Service Contracts, Notice Period, etc. of all the Directors for the financial year ended 31st March, 2018:
Directors Contract Period (Tenure) Service Contract
Notice Period & Severance Fees
Managing Director * 5 years from 1st May, 2013 to 30th April, 2018. Yes Six months’ notice or six months’ salary, in lieu thereof.
CEO & Director 3 years from 15th December, 2017 to 14th December, 2020 Yes Six months’ notice or six
months’ salary, in lieu thereof.
Non-Executive, Non- Independent Director
None. The Non-Executive Directors, liable to retire by rotation, get re-appointed as per the provisions of Articles of Association of the Company and the Companies Act, 2013.
No None
Non–Executive, Independent Director
None. The Non-Executive Independent Directors are appointed for a fixed term of 5 years.
No None
* The services of the Managing Director were terminated by the Board w.e.f. 15th December, 2017.
(c) Stakeholders’ Relationship Committee:
The Committee’s constitution and terms of reference are in compliance with the provisions of Section 178(5)&(6) of the Companies Act, 2013 and Regulation 20 of the Listing Regulations.
Terms of Reference:
The broad terms of reference of the Committee are as follows:
i. To look into the redressal of grievances such as transfer/ transmission of security, non-receipt of annual reports, dividends, interest etc. of various stakeholders of the Company viz. shareholders, debenture holders, fixed deposit holders and other security holders.

21
Annual Report 2017-2018
ii. To monitor transfers, transmission, splitting, consolidation, dematerialisation, rematerialisation of securities issued by the Company and issue of duplicate share certificates.
Composition and Attendance:
During the year under review, the Committee met once on 23rd May, 2017.
Sr. No. Name of Director Designation Category* No. of Meetings Attended
1 Mr. N. P. Ghanekar Chairman I & NED 1
2 Mr. S. R. Lohokare** Member MD 1
3 Mr. Rajesh Batra Member I & NED 1
4 Mr. Suresh Khurana# Member ED N.A.
* I: Independent; NED: Non-Executive Director; MD: Managing Director; ED: Executive Director
** Mr. S. R. Lohokare ceased to be a Member of the Committee w.e.f. 15th December, 2017.
# Mr. S. Khurana was appointed as a Member of the Committee w.e.f. 15th December, 2017.
Name and Designation of Compliance Officer:
Ms. Seema Jagnani resigned as Company Secretary & Compliance Officer, w.e.f. 13th November, 2017. Mr. Jitendra Prasad was appointed as Company Secretary & Compliance Officer w.e.f. 14th November, 2017. He resigned w.e.f. 28th December, 2017. The Company is in the process of appointing a Company Secretary & Compliance Officer who is expected to join in due course.
No. of shareholders’ complaints received during the year : 2
No. of complaints not solved to the satisfaction of shareholders : Nil
No. of pending complaints : Nil
(d) Corporate Social Responsibility (CSR) Committee:
The Committee’s constitution and terms of reference are in compliance with the provisions of Section 135 of the Companies Act, 2013.
Terms of Reference:
The broad terms of reference of the Committee include:
(i) Review of the existing CSR Policy from time to time and the activities to be undertaken by the Company towards CSR activities;
(ii) Recommend the project/programme to be undertaken, amount of expenditure to be incurred, roles and responsibilities of various stakeholders, etc. in respect of CSR activities; and
(iii) Monitoring implementation of the projects/programmes undertaken or the end use of the amount spent by the Company towards CSR activities.
Composition and Attendance:
During the year under review, the Committee met twice. The dates on which the Committee Meetings were held are: 23rd May, 2017 and 27th March, 2018.
Sr. No. Name of Director Designation Category* No. of Meetings Attended
1 Mr. Ness N. Wadia Chairman NI & NED 2
2 Mr. Rajesh Batra Member I & NED 2
3 Mr. N. P. Ghanekar Member I & NED 2
* NI: Non-Independent; I: Independent; NED: Non-Executive Director

22
(e) Finance Committee:
Terms of Reference:
The terms of reference of the Finance Committee include:
(a) Liability Management - to meet the funding requirements of the Company;
(b) Foreign Exchange Management;
(c) Investment Management - to deploy short-term / long-term surpluses of the Company. The Committee is also authorized to lend / place Inter-Corporate Deposits with other Companies.
Composition and Attendance:
During the year under review, the Committee met twice. The dates on which the Committee Meetings were held are: 23rd May, 2017 and 27th March, 2018.
Sr. No. Name of Director Designation Category* No. of Meetings Attended
1 Mr. N. P. Ghanekar Chairman I & NED 2
2 Mr. Rajesh Batra Member I & NED 2
3 Mr. S. Ragothaman Member I & NED 2
* I: Independent; NED: Non-Executive Director
Communication was also undertaken by way of e-mails and discussions were held, as and when required, among the Committee members and decisions taken in matters coming within the Committee’s purview.
4. INDEPENDENT DIRECTORS’ MEETING:
During the year under review, the Independent Directors met on 27th March, 2018, inter alia, to discuss:
Evaluation of the performance of the Board as a whole;
Evaluation of performance of the Non-Independent, Non-Executive Directors and the Board Chairman.
To assess the quality, quantity and timelines of flow of information between the Company Management and the Board that is necessary for the Board to effectively and reasonably perform its duties.
All the Independent Directors were present at the meeting.
Familiarization Programme for Independent Directors:
The Board Members are provided with necessary documents/brochures and reports to enable them to familiarize themselves with the Company’s procedures and practices. Periodic presentations are made at the Board and Board Committee Meetings, on business and performance updates of the Company, business strategy and risks involved.
Updates on relevant statutory changes and landmark judicial pronouncements encompassing important laws are regularly circulated to the Directors.
The details of familiarization programmes for Independent Directors have been posted on the Company’s website (weblink: http://www.naperol.com/pdf/boardpolicies/Familiarization_Programme.pdf).
Performance Evaluation:
Pursuant to the provisions of the Companies Act, 2013 (“Act”) and the Corporate Governance requirements as prescribed by the Listing Regulations, the Board of Directors (“Board”) has carried out an annual evaluation of its own performance and that of its Committees and individual Directors.
The performance of the Board and individual Directors was evaluated by the Board seeking inputs from all the Directors. The performance of the Committees was evaluated by the Board seeking inputs from the Committee Members. The Nomination and Remuneration Committee (“NRC”) reviewed the performance of the individual Directors. A separate meeting of the Independent Directors was also held to review the performance of Non-Independent Directors; performance of the Board as a whole and performance of the Chairman of the Company, taking into account the views of Executive Directors and Non-Executive Directors. This was followed by a Board Meeting that discussed the performance of the Board, its Committees and individual Directors.

23
Annual Report 2017-2018
The criteria for performance evaluation of the Board included aspects like Board composition and structure; effectiveness of Board processes, information and functioning etc. The criteria for performance evaluation of Committees of the Board included aspects like composition of Committees, effectiveness of Committee Meetings etc. The criteria for performance evaluation of the individual Directors included aspects on contribution to the Board and Committee Meetings like preparedness on the issues to be discussed, meaningful and constructive contribution and inputs in meetings etc. In addition, the Chairman was also evaluated on the key aspects of his role.
5. GENERAL BODY MEETINGS:
(a) Location and time, where last three years’ General Meetings were held:
Location Date TimeNo. of Special Resolutions set out at the AGM
Business Transacted
Sunville Banquet & Conference Rooms, 9, Dr. Annie Besant Road, Near Worli Flyover, Worli, Mumbai - 400 018.
9th August, 2017 4.00 p.m. Nil Nil
Sunville Banquet & Conference Rooms, 9, Dr. Annie Besant Road, Near Worli Flyover, Worli, Mumbai - 400 018.
11th August, 2016 4.00 p.m. Nil Nil
Sunville Banquet & Conference Rooms, 9, Dr. Annie Besant Road, Near Worli Flyover, Worli, Mumbai - 400 018.
11th August, 2015 4.00 p.m. 1
Maintenance of Register of Members and other Statutory Registers at the Head Office.
(b) Whether Special Resolutions were passed through postal ballot last year and details of voting pattern: Nil
(c) Person who conducted the postal ballot exercise: Not Applicable
(d) Whether any Special Resolution is proposed to be passed through postal ballot this year (2018-19): During the current year, if Special Resolutions are proposed to be passed through postal ballot, those will be taken up at the appropriate time.
(e) Procedure for Postal Ballot:
The procedure for conducting the postal ballot exercise would be as per Section 110 of the Companies Act, 2013, read with the Companies (Management and Administration) Rules, 2014, as amended from time to time.
6. OTHER DISCLOSURES:
(a) Related Party Transactions:
All transactions entered into with Related Parties as defined under the Companies Act, 2013 and Regulation 23 of the Listing Regulations during the financial year were in the ordinary course of business and on an arm’s length pricing basis and do not attract the provisions of Section 188 of the Companies Act, 2013. There were no materially significant transactions with related parties during the financial year which were in conflict with the interest of the Company. Suitable disclosure as required by the Indian Accounting Standards (Ind-AS) has been made in the notes to the Financial Statements.
As required under Regulation 23(1) of the Listing Regulations, the Company has formulated a Policy on Related Party Transactions, which has been posted on the Company’s website (weblink: http://www.naperol.com/pdf/boardpolicies/RPT_Policy.pdf).
(b) Disclosure of Accounting Treatment:
In the preparation of financial statements, the Company has followed the Accounting Standards issued by the Institute of Chartered Accountants of India to the extent applicable and notified under the Companies Act, 2013.
(c) Risk Management:
A detailed review of business risks and the Company’s plan to mitigate them is presented to the Board. The Company has been taking steps to mitigate foreseeable business risks. Business risk evaluation and management is an ongoing and continuous process within the Company and regularly updated to the Board.

24
The Company has formulated a Risk Assessment & Management Policy (“Policy”), establishing the philosophy of the Company towards risk identification, analysis and prioritization of risks, development of risk mitigation plans which is reported to the Board periodically. The Policy would be applicable to all the functions and departments of the Company. The Policy is being implemented through the Risk Management Committee which is accountable to the Board of Directors. The Committee comprises of CEO & Director, Vice President – Commercial & Finance, Vice President – Operations & QA, Vice President – Technical & Projects, Chief Financial Officer and Head – Marketing.
(d) Code of Conduct
The Board of Directors has adopted the Code of Ethics and Business Principles for the Non-Executive Directors as also for the employees including the Executive Director and other Members of Senior Management. The said Code has been communicated to all the Directors and Members of the Senior Management. The Code has also been posted on the Company’s website www.naperol.com
(e) Vigil Mechanism / Whistle Blower Policy:
The Company believes in the conduct of the affairs of its constituents in a fair and transparent manner by adoption of highest standards of professionalism, honesty, integrity and ethical behaviour. Towards this end, the Company has implemented a Whistle Blower Policy, with a view to provide a mechanism for employees and Directors of the Company to approach the Ethics Counsellor or the Chairman of the Audit Committee of the Company to report instances of violations of laws, rules and regulations, unethical behaviour, actual or suspected, fraud or violation of the Company’s Code of Conduct or Ethics Policy. The vigil mechanism also provides adequate safeguards against victimisation of persons who use such mechanisms and also to ensure direct access to the Ethics Counsellor or the Chairman of the Audit Committee in appropriate or exceptional cases.
The Company has posted the Whistle Blower Policy on Company’s website (weblink: http://www.naperol.com/pdf/boardpolicies/Whistle-Blower-Policy.pdf).
(f) Prevention of Insider Trading Code:
The Company has adopted a Code of Conduct to regulate, monitor and report trading by insiders and code of practices and procedures for fair disclosures of unpublished price sensitive information in terms of Regulations 8(1), 9(1) and 9(2) of SEBI (Prohibition of Insider Trading) Regulations, 2015.
All the Directors, employees at senior management level and other employees who could have access to unpublished price sensitive information of the Company are governed by this code.
(g) Details of non-compliance by the Company, penalties and strictures imposed on the Company by Stock Exchange or SEBI or any statutory authority, on any matter related to capital markets, during the last three years: None
(h) Policy for Prevention of Sexual Harassment in the Company:
The Company values the dignity of individuals and strives to provide a safe and respectable work environment to all its employees. The Company is committed to providing an environment, which is free of discrimination, intimidation and abuse. Pursuant to the Sexual Harassment of Women at Workplace (Prohibition, Prevention and Redressal) Act, 2013 and rules made thereunder, the Company has a Policy for prevention of Sexual Harassment in the Company. All employees (permanent, contractual, temporary and trainees) are covered under this policy. Further, the Company has set up an Internal Complaints Committee for providing a redressal mechanism pertaining to sexual harassment of the employees at workplace.
Your Directors further state that during the year under review, there were no cases filed pursuant to the Sexual Harassment of Women at Workplace (Prohibition, Prevention and Redressal) Act, 2013.
7. CEO / CFO Certification
Mr. Suresh Khurana, Chief Executive Officer & Director and Mr. Shailesh Chauhan, Chief Financial Officer, have certified to the Board in accordance with Regulation 17(8) of the Listing Regulations, pertaining to CEO/ CFO certification for the financial year ended 31st March, 2018.
8. Means of Communication:
(a) Quarterly Results: The unaudited quarterly results are announced within 45 days from the end of the quarter and the audited annual results within 60 days from the end of the last quarter, as stipulated under the Listing Regulations.

25
Annual Report 2017-2018
(b) Newspapers wherein results normally published: Business Standard (English) and Mumbai Lakshadeep (Marathi, the regional language).
(c) Any Website, where displayed: www.naperol.com and www.bseindia.com
(d) Whether Website also displays official news releases: No
(e) Whether presentations made to institutional investors or to analysts: No
9. General Shareholder Information:
(a) Annual General Meeting : Thursday, 2nd August, 2018 at 4.00 p.m. at Sunville Banquet & Conference Rooms, 9, Dr. Annie Besant Road, Near Worli Flyover, Worli, Mumbai – 400 018.
(b) Financial Year : The financial year is from 1st April to 31st March.Tentative Schedule :Results for quarter ending 30th June, 2018 : By 14th August, 2018Results for quarter ending 30th September, 2018 : By 14th November, 2018Results for quarter ending 31st December, 2018 : By 14th February, 2019Results for year ending 31st March, 2019 : By 30th May, 2019AGM for year ending 31st March, 2019 : By August 2019
(c) Date of Book Closure : Friday, 20th July, 2018 to Thursday, 2nd August, 2018 (both days inclusive)
(d) Dividend Payment Date : On or after Friday, 3rd August, 2018
(e) Listing on Stock Exchange : The Company’s shares are listed on BSE Ltd. The Company has paid applicable listing fees to BSE Ltd., for Financial Year 2018-19.
(f) Stock Code
Demat Code : 500298
Demat ISIN Number for NSDL & CDSL : INE585A01020
Scrip ID (on the BSE website- www.bseindia.com) : NATPEROX
Corporate Identification Number : L24299MH1954PLC009254
(g) Stock Market Data (for face value of ` 10/- per share):
Month High (`) Low (`) No. of Shares No. of Trades Net Turnover (`)April 2017 1,070.00 966.00 84,692 3,593 8,68,79,098May 2017 1,311.00 1,005.00 2,29,097 9,110 27,52,36,893June 2017 1,475.00 1,261.50 1,93,434 6,971 26,55,28,869July 2017 1,535.40 1,309.05 1,10,743 5,863 16,10,47,840August 2017 1,842.00 1,386.00 1,22,741 7,261 19,77,64,996September 2017 1,941.95 1,700.00 90,301 5,557 16,70,33,304October 2017 2,898.00 1,790.00 2,20,338 16,323 52,53,78,440November 2017 2,639.90 1,971.00 1,44,471 13,570 31,48,84,394December 2017 2,388.00 1,980.00 79,934 6,960 17,33,31,339January 2018 2,499.00 2,050.00 1,12,341 9,278 26,33,83,856February 2018 2,550.00 1,800.00 1,07,917 9,692 24,50,75,306March 2018 2,629.00 2,200.00 1,80,491 6,405 42,57,50,032
Data based on BSE website: “http://www.bseindia.com/hisdata/stockprc2.asp”

26
(h) Stock Performance:
Data based on BSE website: “http://www.bseindia.com/hisdata/stockprc2.asp” & “http://www.bseindia.com/hisdata/hindices2.asp”
(i) Registrar and Transfer Agents: Sharex Dynamic (India) Private Limited
Unit No. 1, Luthra Industrial Premises, Andheri Kurla Road, Safed Pool, Andheri (E), Mumbai – 400 072. Tel: 022-2851 5644 / 2851 5606. E-mail ID: [email protected].
(j) Share Transfer System: Share transfers in physical form are processed within the prescribed period of 15 days from the date of receipt, in case documents
are complete in all respects.
(k) (i) Distribution of Shareholding as on 31st March, 2018:
Group of shares No. of shareholders No. of shares held % to total shares1 to 50 6,581 1,22,443 2.13
51 to 100 1,332 1,14,008 1.98101 to 250 2,416 3,63,708 6.33251 to 500 435 1,69,693 2.95501 to 1,000 194 1,46,265 2.55
1,001 to 5,000 165 3,46,194 6.025,001 to 10,000 20 1,41,794 2.47
10,001 and above 19 43,42,895 75.57Total 11,162 57,47,000 100.00
(ii) Category of Shareholders as on 31st March, 2018:
Category No. of shares held % to total sharesIndian Promoters 40,05,309 69.69Foreign Promoters 56,750 0.99Banks 575 0.01Private Corporate Bodies 2,06,746 3.60Indian Public 14,31,252 24.90NRI / OCB / Foreign Portfolio Investors 35,526 0.62Clearing Members 10,842 0.19Total 57,47,000 100.00
29000
30000
31000
32000
33000
34000
35000
36000
37000
38000
0
500
1000
1500
2000
2500
3000
3500
BSE Sensex
Na�o
nal P
erox
ide L
imite
d
Share Price Performance (April, 2017 to March, 2018)
NPL SENSEX

27
Annual Report 2017-2018
(l) Dematerialisation of Shares and Liquidity:
98% of the outstanding Equity Shares have been dematerialised upto 31st March, 2018. Trading in Equity Shares of the Company is permitted only in dematerialised form w.e.f. 28th May, 2001, as per notification issued by the Securities and Exchange Board of India (SEBI). The trading / liquidity details are given at item 9(g) above.
(m) Share Capital Audit: As stipulated by SEBI, a qualified practicing Company Secretary carries out the Share Capital Audit to reconcile the total
admitted capital with National Securities Depository Limited (NSDL) and Central Depository Services (India) Limited (CDSL) and shares held in physical form as per the register of members vis-à-vis the total issued and listed capital. This audit is carried out every quarter. The report is submitted to BSE Ltd. and is also placed before the Board of Directors.
(n) Outstanding GDRs / ADRs / Warrants or any Convertible Instruments, conversion date and likely impact on Equity: None
(o) In terms of Section 124(5) of the Companies Act, 2013 read with the Rules made thereunder, the Company has credited during the year ended 31st March, 2018, a sum of ` 3,97,420/-, being unclaimed dividend, to the Investor Education and Protection Fund (IEPF). The Company has, during the year, transferred 19,388 Equity shares of the Company to IEPF Authority pursuant to Section 124(6) of the Companies Act, 2013 read with the Rules made thereunder.
(p) Plant Location : N.R.C. Road, P.O. Atali, Via Mohone, Kalyan - 421 102, District Thane, Maharashtra.
(q) Address for Correspondence:
For Shares held in Physical Form : Sharex Dynamic (India) Pvt. Ltd. at the address given at item 9(i) above.For Shares held in Demat Form : To the Depository Participant.For any query on Annual Report / Dividend / Investors’ Assistance
: The Company Secretary,National Peroxide Ltd., C-1, Wadia International Centre, Pandurang Budhkar Marg, Worli, Mumbai 400 025. Tel: 022-66620000; Fax: 022-66193421 E-mail: [email protected]
(r) As required in terms of Regulation 13 of the Listing Regulations, the Company has designated an e-mail ID exclusively for the purpose of registering complaints by investors. The e-mail ID is [email protected]
10. Non-Mandatory Requirements:(a) Office of the Chairman of the Board:
The Company partly defrays the expenses of the Chairman’s Office.
(b) Shareholder Rights: The Company’s half-yearly results are furnished to the Stock Exchange and also published in the newspapers and therefore not
sent to the shareholders.
Adoption of other non–mandatory requirements under Regulation 34 of the Listing Regulations is being reviewed by the Board from time to time.
Mumbai, 24th May, 2018
DECLARATION
As required under the SEBI (Listing Obligations and Disclosure Requirements) Regulations, 2015, this is to confirm that all the Members of the Board and the Senior Management have affirmed compliance with the Code of Conduct for the year ended 31st March, 2018.
For NATIONAL PEROXIDE LIMITED
SURESH KHURANAChief Executive Officer & Director
(DIN: 06677496)Mumbai, 24th May, 2018
28
CERTIFICATE ON CORPORATE GOVERNANCE
TO THE MEMBERS OFNATIONAL PEROXIDE LIMITED
We have examined the compliance of conditions of Corporate Governance by NATIONAL PEROXIDE LIMITED (the ‘Company’), for
the financial year ended on 31st March, 2018, as stipulated in Regulation 34(3) read with Schedule V of the Securities and ExchangeBoard of India (Listing Obligations and Disclosure Requirements) Regulations, 2015 (‘SEBI Listing Regulations’).
The compliance with conditions of Corporate Governance is the responsibility of the management. Our examination was limited to the procedures and implementation thereof adopted by the Company for ensuring the compliance of the conditions of the CorporateGovernance. It is neither an audit nor an expression of opinion on the financial statements of the Company.
In our opinion and to the best of our information and according to the explanations given to us and the representations made by themanagement, we certify that the Company has complied with the conditions of Corporate Governance as stipulated in the above mentioned SEBI Listing Regulations.
We further state that such compliance is neither an assurance as to the future viability of the Company nor the efficiency or effectivenesswith which the management has conducted the affairs of the Company.
For NILESH SHAH & ASSOCIATESCompany Secretaries
Place: MumbaiDate: 24th May, 2018.
Nilesh ShahPartner (FCS - 4554)
C. P. No: 2631

29
Annual Report 2017-2018
[As prescribed under Section 135 of the Companies Act, 2013 and Companies (Corporate Social Responsibility Policy) Rules, 2014]
1. A brief outline of the Company’s CSR policy, including overview of projects or programs proposed to be undertaken and a reference to the weblink to the CSR policy and projects or programmes
: The Company has contributed towards the project for upgradation and renovation of the existing infrastructure and heritage building of Nowrosjee Wadia Maternity Hospital, Parel, Mumbai and Setting-up of Biology / Botany / Zoology Laboratory in Patil Bal Mandir School, Mohone, Kalyan. Kindly refer the CSR policy on the Company’s website.Weblink: http://www.naperol.com/pdf/boardpolicies/NPL_CSR_Policy.pdf
2. Composition of the CSR Committee : Mr. Ness N. Wadia (Chairman, Non-Independent, Non-Executive Director)Mr. Rajesh Batra (Independent Director)Mr. N. P. Ghanekar (Independent Director)
3. Average net profit of the Company for last three financial years
: ` 39,92,66,007/-
4. Prescribed CSR Expenditure (two per cent of the amount as in item 3 above)
: ` 79,85,320/-
5. Details of CSR spent during the financial year :
a) Total amount spent for the financial year : ` 80,00,000/-b) Amount unspent, if any : NIL
c) Manner in which the amount spent during the financial year is detailed below:(1) (2) (3) (4) (5) (6) (7) (8)Sr. No.
CSR Project or Activity identified
Sector in which the project is covered
Projects or programmes
[1] Local area or other
[2] Specify the state and district where projects or programmes were
undertaken.
Amount outlay(Budget) projects or programmes
wise (`)
Amount spent on the projects or programmes
Cumulative expenditure
up to the reporting period (`)
Amount spent: directly
or through implementing agency* (`)
Direct expenditure on programmes or
projects (`)
Over-heads
(`)
1. Upgradation of the existing infrastructure and heritage building of Nowrosjee Wadia Maternity Hospital (NWMH)
Promoting preventative health care
State: MaharashtraDistrict: Mumbai
72,00,000 72,00,000 - 72,00,000 72,00,000Implementing
Agency*
2. Setting-up of Biology Laboratory in Patil Bal Mandir School
Promotion of Education
State: MaharashtraDistrict: Kalyan
8,00,000 8,00,000 - 8,00,000 8,00,000Implementing
Agency*80,00,000 80,00,000 - 80,00,000 80,00,000
* Implementing Agency - Sir Ness Wadia Foundation.
6. The CSR Committee of the Company hereby confirms that the implementation and monitoring of CSR Policy, is in compliance with CSR objectives and policy of the Company.
For National Peroxide Limited
Ness N. WadiaChairman of the Board(DIN: 0036049)
Mumbai, 24th May, 2018
For and on behalf of theCorporate Social Responsibility Committee of
National Peroxide Limited
Ness N. WadiaChairman
Corporate Social Responsibility Committee(DIN: 0036049)
ANNEXURE III TO THE DIRECTORS’ REPORT
ANNUAL REPORT ON CORPORATE SOCIAL RESPONSIBILITY ACTIVITIES

30
FORM NO. MGT-9EXTRACT OF ANNUAL RETURN
As on financial year ended 31-03-2018
[Pursuant to Section 92(3) of the Companies Act, 2013 and Rule 12(1) of the Companies (Management and Administration) Rules, 2014]
A. REGISTRATION AND OTHER DETAILS
CIN L24299MH1954PLC009254
Registration Date 16th March, 1954
Name of the Company National Peroxide Limited
Category / Sub-Category of the Company Company Limited by Shares / Indian Non-Government Company
Address of the Registered office and contact details Neville House, J.N. Heredia Marg,Ballard Estate, Mumbai-400 001Tel: 022-66620000 Fax: 022-66193421
Whether Listed Company Yes
Name, Address and Contact Details of Registrar and Transfer Agent, if any Sharex Dynamic (India) Pvt. Ltd.Unit No. 1, Luthra Industrial Premises, Andheri-Kurla Road, Safed Pool, Andheri (E), Mumbai-400072.Tel: 022-28515644 / 022-28515606
B. PRINCIPAL BUSINESS ACTIVITIES OF THE COMPANY
Sr. No. Name and Description of main products / services NIC Code of the
product / service% to total turnover of the
companya. Hydrogen Peroxide 20297 98.35
b. Peracetic Acid 20299 0.95
c. Hydrogen Gas 20111 0.70
C. PARTICULARS OF HOLDING, SUBSIDIARY AND ASSOCIATE COMPANIES
Sr. No.
Name and Address of the Company CIN / GLN Holding / Subsidiary /
Associate % of shares held Applicable Section
a. Nowrosjee Wadia and Sons LimitedNeville House, J. N. Heredia Marg, Ballard Estate, Mumbai - 400 001.
U51900MH1944PLC004225 Holding 50.09% 2(46)
b. Naperol Investments Limited Neville House, J. N. Heredia Marg, Ballard Estate, Mumbai - 400 001.
U65990MH1980PLC022589 Subsidiary 100% 2(87)
D. SHARE HOLDING PATTERNi. Category-wise Share Holding
Category of Shareholders
No. of Shares held at the beginning of the year 01-04-2017
No. of Shares held at the end of the year 31-03-2018
% Change during the
yearDemat Physical Total % of Total
Shares Demat Physical Total % of Total Shares
A. Promoters
1) Indian
(a) Individual 16,325 0 16,325 0.284 16,325 0 16,325 0.284 0.000
(b) Central Govt. 0 0 0 0 0 0 0 0.000 0.000
(c) State Govt(s). 0 0 0 0 0 0 0 0.000 0.000
(d) Bodies Corporate 39,88,984 0 39,88,984 69.410 39,88,984 0 39,88,984 69.410 0.000
(e) FI / Banks. 0 0 0 0 0 0 0 0.000 0.000
(f) Any Other 0 0 0 0 0 0 0 0.000 0.000
Sub-total (A) (1):- 40,05,309 0 40,05,309 69.694 40,05,309 0 40,05,309 69.694 0.000
ANNEXURE IV TO THE DIRECTORS’ REPORT

31
Annual Report 2017-2018
Category of Shareholders
No. of Shares held at the beginning of the year 01-04-2017
No. of Shares held at the end of the year 31-03-2018
% Change during the
yearDemat Physical Total % of Total
Shares Demat Physical Total % of Total Shares
2) Foreign
(a) Individual-NRI 5,250 0 5,250 0.091 5,250 0 5,250 0.091 0.000
(b) Other Individual 0 0 0 0 0 0 0 0.000 0.000
(c) Bodies Corporate 51,500 0 51,500 0.896 51,500 0 51,500 0.896 0.000
(d) Banks / FII 0 0 0 0 0 0 0 0.000 0.000
(e) Qualified Foreign Investor 0 0 0 0 0 0 0 0.000 0.000
(f) Any Other Specify 0 0 0 0 0 0 0 0.000 0.000
Sub-total (A) (2):- 56,750 0 56,750 0.987 56,750 0 56,750 0.987 0.000
Total shareholding of Promoter (A) = (A (1)+(A)(2) 40,62,059 0 40,62,059 70.681 40,62,059 0 40,62,059 70.681 0.000
B. Public Shareholding
1) Institutions(a) Mutual Funds 0 0 0 0 0 0 0 0.000 0.000
(b) Banks / FI 450 250 700 0.012 450 0 450 0.008 -0.004
(c) Central Govt. 0 0 0 0 0 0 0 0.000 0.000
(d) State Govt. 125 0 125 0.002 19,513 0 19,513 0.340 0.338
(e) Venture Capital Funds 0 0 0 0 0 0 0 0.000 0.000
(f) Insurance Companies 0 0 0 0 0 0 0 0.000 0.000
(g) FIIs 0 0 0 0 0 0 0 0.000 0.000
(h) Foreign Venture Capital Funds 0 0 0 0 0 0 0 0.000 0.000
(i) Others (specify) 0 0 0 0 0 0 0 0.000 0.000
Sub-total (B)(1):- 575 250 825 0.014 19,963 0 19,963 0.348 0.334
2) Non-Institutions
(a) Bodies Corporate
i. Indian 2,21,253 655 2,21,908 3.861 2,06,341 405 2,06,746 3.597 -0.264
ii. Overseas 0 0 0 0 0 0 0 0.000 0.000
(b) Individuals 0 0 0 0 0 0 0 0.000 0.000
i. Individual shareholders holding nominal share capital upto `1 lakh
10,35,140 1,19,142 11,54,282 20.086 11,56,714 93,977 12,50,691 21.763 1.394
ii Individual shareholders holding nominal share capital in excess of `1 lakh
2,42,529 0 2,42,529 4.220 1,61,173 0 1,61,173 2.804 -1.132
(c) Other (specify)
Non Resident Indians 29,100 125 29,225 0.509 32,859 125 32,984 0.574 0.065
Overseas Corporate Bodies 0 0 0 0 2,542 0 2,542 0.044 0.044
Foreign Nationals 0 0 0 0 0 0 0 0.000 0.000
Clearing Members 36,172 0 36,172 0.629 10,842 0 10,842 0.189 -0.440
Trusts 0 0 0 0 0 0 0 0.000 0.000
Foreign Boodies - DR 0 0 0 0 0 0 0 0.000 0.000
Sub-total (B)(2):- 15,64,194 1,19,922 16,84,116 29.305 15,70,471 94,507 16,64,978 28.971 -0.334
Total Public Shareholding (B)=(B)(1)+ (B)(2) 15,64,769 1,20,172 16,84,941 29.319 15,90,434 94,507 16,84,941 29.319 0.000
C. Shares held by Custodian for GDRs & ADRs 0 0 0 0.000 0 0 0 0.000 0.000
Grand Total (A+B+C) 56,26,828 1,20,172 57,47,000 100.00 56,52,493 94,507 57,47,000 100.00 0.000

32
ii. Shareholding of Promoters
Sr.No
Shareholder’s Name Shareholding at thebeginning of the year 01-04-2017
Shareholding at theend of the year 31-03-2018
% changes in share holding
during the year
No.of Shares
% of total Shares of the
company
% of shares Pledged/
encumbered to total shares
No.of Shares
% of total Shares of the
company
% of shares Pledged/
encumbered to total shares
1. Macrofil Investments Ltd. 19,18,109 33.376 1.914 19,18,109 33.376 1.914 0.000
2. Sunflower Investments and Textiles Ltd. 8,500 0.148 0 0 0 0 -0.148
3. Nowrosjee Wadia and Sons Ltd. 16,53,325 28.768 0 17,69,125 30.783 0 2.015
4. Archway Investment Company Ltd. 2,85,000 4.959 0 0 0 0 -4.959
5. The Bombay Dyeing and Mfg., Co., Ltd. 0 0 0 2,85,000 4.959 0 4.959
6. N. W. Exports Ltd. 1,07,300 1.867 0 0 0 0 -1.867
7. Ben Nevis Investments Ltd. 51,500 0.896 0 51,500 0.896 0 0.000
8. Varnilam Investments & Trading Company Ltd. 16,750 0.291 0 16,750 0.291 0 0.000
9. Nusli Wadia 16,325 0.284 0 16,325 0.284 0 0.000
10. Dina Neville Wadia 5,250 0.091 0 5,250 0.091 0 0.000
Total 40,62,059 70.681 1.914 40,62,059 70.681 1.914 0.000
iii. Change in Promoter’s Shareholding (Please specify,if there is no change)
Sr.No.
Shareholder’s Name
Shareholding at thebeginning of the year
01-04-2017
Date Increase / Decrease in Shareholding
Reason Shareholding at theend of the year
31-03-2018
No.of Shares
% of total Shares of the
company
No.of Shares
% of total Shares of the
company
1. The Bombay Dyeing and Mfg., Co., Ltd. 0 0 01-04-2017
25-09-2017 2,85,000 Merger 2,85,000 4.959
- Closing Balance 31-03-2018 2,85,000 4.959
2. Sunflower Investments and Textiles Ltd. 8,500 0.148 01-04-2017
23-02-2018 8,500 Amalgamation 0 0
- Closing Balance 31-03-2018 0 0
3. Nowrosjee Wadia and Sons Ltd. 16,53,325 28.768 01-04-2017
23-02-2018 1,15,800 Amalgamation 17,69,125 30.783
- Closing Balance 31-03-2018 17,69,125 30.783
4. Archway Investment Company Ltd. 2,85,000 4.959 01-04-2017
25-09-2017 -2,85,000 Merger 0 0
- Closing Balance 31-03-2018 0 0
5. N W Exports Ltd. 1,07,300 1.867 01-04-2017
23-02-2018 -1,07,300 Amalgamation 0 0
- Closing Balance 31-03-2018 0 0
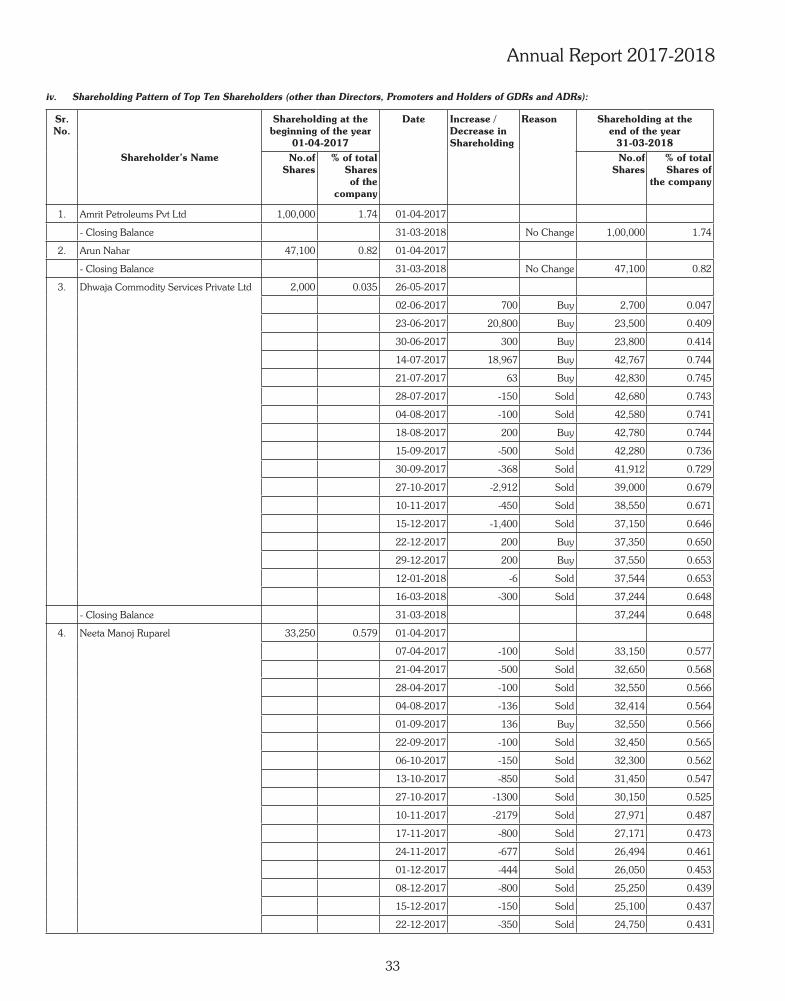
33
Annual Report 2017-2018
iv. Shareholding Pattern of Top Ten Shareholders (other than Directors, Promoters and Holders of GDRs and ADRs):
Sr.No.
Shareholder’s Name
Shareholding at thebeginning of the year
01-04-2017
Date Increase / Decrease in Shareholding
Reason Shareholding at theend of the year
31-03-2018No.of
Shares% of total
Shares of the
company
No.ofShares
% of total Shares of
the company
1. Amrit Petroleums Pvt Ltd 1,00,000 1.74 01-04-2017
- Closing Balance 31-03-2018 No Change 1,00,000 1.74
2. Arun Nahar 47,100 0.82 01-04-2017
- Closing Balance 31-03-2018 No Change 47,100 0.82
3. Dhwaja Commodity Services Private Ltd 2,000 0.035 26-05-2017
02-06-2017 700 Buy 2,700 0.047
23-06-2017 20,800 Buy 23,500 0.409
30-06-2017 300 Buy 23,800 0.414
14-07-2017 18,967 Buy 42,767 0.744
21-07-2017 63 Buy 42,830 0.745
28-07-2017 -150 Sold 42,680 0.743
04-08-2017 -100 Sold 42,580 0.741
18-08-2017 200 Buy 42,780 0.744
15-09-2017 -500 Sold 42,280 0.736
30-09-2017 -368 Sold 41,912 0.729
27-10-2017 -2,912 Sold 39,000 0.679
10-11-2017 -450 Sold 38,550 0.671
15-12-2017 -1,400 Sold 37,150 0.646
22-12-2017 200 Buy 37,350 0.650
29-12-2017 200 Buy 37,550 0.653
12-01-2018 -6 Sold 37,544 0.653
16-03-2018 -300 Sold 37,244 0.648
- Closing Balance 31-03-2018 37,244 0.648
4. Neeta Manoj Ruparel 33,250 0.579 01-04-2017
07-04-2017 -100 Sold 33,150 0.577
21-04-2017 -500 Sold 32,650 0.568
28-04-2017 -100 Sold 32,550 0.566
04-08-2017 -136 Sold 32,414 0.564
01-09-2017 136 Buy 32,550 0.566
22-09-2017 -100 Sold 32,450 0.565
06-10-2017 -150 Sold 32,300 0.562
13-10-2017 -850 Sold 31,450 0.547
27-10-2017 -1300 Sold 30,150 0.525
10-11-2017 -2179 Sold 27,971 0.487
17-11-2017 -800 Sold 27,171 0.473
24-11-2017 -677 Sold 26,494 0.461
01-12-2017 -444 Sold 26,050 0.453
08-12-2017 -800 Sold 25,250 0.439
15-12-2017 -150 Sold 25,100 0.437
22-12-2017 -350 Sold 24,750 0.431

34
Sr.No
Shareholder’s Name
Shareholding at thebeginning of the year
01-04-2017
Date Increase / Decrease in Shareholding
Reason Shareholding at theend of the year
31-03-2018No.of
Shares% of total
Shares of the
company
No.of Shares % of total Shares of
the company
05-01-2018 -450 Sold 24,300 0.423
19-01-2018 -100 Sold 24,200 0.421
02-02-2018 -750 Sold 23,450 0.408
09-02-2018 -100 Sold 23,350 0.406
16-02-2018 -150 Sold 23,200 0.404
09-03-2018 -1519 Sold 21,681 0.377
16-03-2018 -1500 Sold 20,181 0.351
- Closing Balance 31-03-2018 -31 Sold 20,150 0.351
5. Shreekant Varun Phumbhra HUF 10,000 0.174 01-04-2017
02-06-2017 2500 Buy 12,500 0.218
18-08-2017 2500 Buy 15,000 0.261
27-10-2017 5000 Buy 20,000 0.348
- Closing Balance 31-03-2018 20,000 0.348
6. Investor Education And Protection Fund (IEPF) Authority, Ministry of Corporate Affairs
0 0.000 01-04-2017
08-12-2017 19,388 Transfer to IEPF 19,388 0.337
- Closing Balance 31-03-2018 19,388 0.337
7. Mr. Sanjoy Bhattacharyya 15,000 0.261 09-06-2017
- Closing Balance 31-03-2018 No Change 15,000 0.261
8. Cyrus Jamshed Guzder 13,650 0.238 01-04-2017
- Closing Balance 31-03-2018 No Change 13,650 0.238
9. Darshana Jignesh Kothari 26,802 0.466 01-04-2017
07-04-2017 -52 Sold 26,750 0.465
21-04-2017 -750 Sold 26,000 0.452
04-08-2017 -136 Sold 25,864 0.45
18-08-2017 136 Buy 26,000 0.452
30-09-2017 -14 Sold 25,986 0.452
06-10-2017 -136 Sold 25,850 0.45
13-10-2017 -950 Sold 24,900 0.433
27-10-2017 -1300 Sold 23,600 0.411
10-11-2017 -2070 Sold 21,530 0.375
17-11-2017 -900 Sold 20,630 0.359
24-11-2017 -730 Sold 19,900 0.346
01-12-2017 -450 Sold 19,450 0.338
08-12-2017 -825 Sold 18,625 0.324
15-12-2017 -25 Sold 18,600 0.324
22-12-2017 -300 Sold 18,300 0.318
05-01-2018 -456 Sold 17,844 0.31
19-01-2018 -144 Sold 17,700 0.308
02-02-2018 -700 Sold 17,000 0.296
09-02-2018 -100 Sold 16,900 0.294
16-02-2018 -100 Sold 16,800 0.292
iv. Shareholding Pattern of Top Ten Shareholders (other than Directors, Promoters and Holders of GDRs and ADRs): Contd.

35
Annual Report 2017-2018
Sr.No
Shareholder’s Name
Shareholding at thebeginning of the year
01-04-2017
Date Increase / Decrease in Shareholding
Reason Shareholding at theend of the year
31-03-2018No.of
Shares% of total
Shares of the
company
No.of Shares % of total Shares of
the company
09-03-2018 -1,658 Sold 15,142 0.263
16-03-2018 -1,529 Sold 13,613 0.237
- Closing Balance 31-03-2018 13,613 0.237
10. C Ramasamy Anandakrishnan 5,374 0.094 16-02-2018
23-02-2018 2,683 Buy 8,057 0.14
02-03-2018 2,903 Buy 10,960 0.191
- Closing Balance 31-03-2018 10,960 0.191
11. Ami Shripalbhai Morakhia 10,300 0.179 01-04-2017
- Closing Balance 31-03-2018 No Change 10,300 0.179
12. Hridaynath Consultancy Private Limited 85,932 1.495 01-04-2017
28-04-2017 2,420 Buy 88,352 1.537
12-05-2017 -11,926 Sold 76,426 1.33
19-05-2017 -589 Sold 75,837 1.32
26-05-2017 -2,232 Sold 73,605 1.281
02-06-2017 -28,818 Sold 44,787 0.779
09-06-2017 -9,161 Sold 35,626 0.62
07-07-2017 -34,407 Sold 1,219 0.021
11-08-2017 -1,169 Sold 50 0.001
13-10-2017 -50 Sold 0 0
- Closing Balance 31-03-2018 0 0
13. Ruchit Bharat Patel 47,686 0.83 01-04-2017
07-04-2017 -4,432 Sold 43,254 0.753
21-04-2017 -6,216 Sold 37,038 0.644
28-04-2017 -1,285 Sold 35,753 0.622
05-05-2017 -2,438 Sold 33,315 0.58
12-05-2017 -10,300 Sold 23,015 0.4
18-08-2017 -3,915 Sold 19,100 0.332
25-08-2017 -1,310 Sold 17,790 0.31
01-09-2017 -4,444 Sold 13,346 0.232
08-09-2017 -2,351 Sold 10,995 0.191
15-09-2017 -6,673 Sold 4,322 0.075
22-09-2017 -3,037 Sold 1,285 0.022
13-10-2017 -1,285 Sold 0 0
- Closing Balance 31-03-2018 0 0
14. Hardik Bharat Patel 47,416 0.825 01-04-2017
07-04-2017 -1,325 Sold 46,091 0.802
21-04-2017 -3,977 Sold 42,114 0.733
05-05-2017 -9,798 Sold 32,316 0.562
12-05-2017 -5,250 Sold 27,066 0.471
16-06-2017 -3,020 Sold 24,046 0.418
07-07-2017 -85 Sold 23,961 0.417
14-07-2017 -16,120 Sold 7,841 0.136
13-10-2017 -7,841 Sold 0 0
- Closing Balance 31-03-2018 0 0
iv. Shareholding Pattern of Top Ten Shareholders (other than Directors, Promoters and Holders of GDRs and ADRs): Contd.

36
v. Shareholding of Directors and Key Managerial Personnel:
Sr.No
Shareholder’s Name
Shareholding at thebeginning of the year
01-04-2017
Date Increase / Decrease in Shareholding
Reason Shareholding at theend of the year
31-03-2018No.of
Shares% of total
Shares of the
company
No.of Shares % of total Shares of
the company
NIL
E. INDEBTEDNESS Indebtedness of the Company including interest outstanding / accrued but not due for payment:
(` in lacs)
Secured Loansexcluding deposits
UnsecuredLoans Deposits Total
Indebtedness
Indebtedness at the beginning of the financial year
i) Principal Amount 1,105.33 - - 1,105.33
ii) Interest due but not paid - - - -
iii) Interest accrued but not due 0.28 - - 0.28
Total (i+ii+iii) 1,105.61 - - 1,105.61
Change in Indebtedness during the financial year -
- - - -
1,105.61 - - 1,105.61
Net Change -1,105.61 - - -1,105.61
Indebtedness at the end of the financial year -
i) Principal Amount - - - -
ii) Interest due but not paid - - - -
iii) Interest accrued but not due - - - -
Total (i+ii+iii) - - - -
F. REMUNERATION OF DIRECTORS AND KEY MANAGERIAL PERSONNELA. Remuneration to Managing Director, Whole-time Directors and/or Manager:
Sr. No.
Particulars of Remuneration Amount in `
Mr. S. R. Lohokare(Remuneration paid to Managing Director upto 14th December 2017)
1 Gross salary
(a) Salary as per provisions contained in section 17(1) of the Income-tax Act, 1961 1,79,81,152
(b) Value of perquisites u/s 17(2) Income-tax Act, 1961 -
(c) Profits in lieu of salary under section 17(3) Income-tax Act, 1961 -
2 Stock Option -
3 Sweat Equity -
4 Commission 60,00,000
- as % of profit -
- others, specify -
5 Others, please specify -
Total (A) 2,39,81,152
Ceiling as per the Act 7,44,75,000

37
Annual Report 2017-2018
B. Remuneration to other Directors:
(Amount in `)
Sr.No. Particulars of Remuneration Names of Directors Total
1. Independent Directors Mr. Rajesh Batra
Mr. N. P. Ghanekar
Mr. S. Ragothaman
4,90,000 4,90,000 3,20,000 13,00,000 12,54,000 13,98,000 5,73,000 32,25,000
- - - -Total (1) 17,44,000 18,88,000 8,93,000 45,25,000
2. Other Non-Executive Directors Mr. Ness N. Wadia
Dr. (Mrs.) Minnie
Bodhanwala 2,80,000 1,80,000 460,000
29,33,000 3,58,000 32,91,000 - - -
Total (2) 32,13,000 5,38,000 37,51,000 Total (B)=(1+2) 49,57,000 24,26,000 8,93,000 82,76,000 Total Managerial Remuneration *3,22,57,152 Overall Ceiling as per the Act 16,38,45,000*Total Remuneration to Managing Director and other Directors (being the total of A and B)
C. Remuneration to Key Managerial Personnel other than MD / Manager / WTD:(Amount in `)
Sr No. Particulars of Remuneration Key Managerial Personnel
Mr. Shailesh Chauhan Chief Financial Officer
Ms. Seema JagnaniCompany Secretary(upto 13.11.2017)
Mr. Jitendra PrasadCompany Secretary(w.e.f. 14.11.2017 upto 28.12.2017)
Total
1 Gross salary (a) Salary as per provisions contained in section 17(1) of the Income-tax Act, 1961
39,05,166 13,89,958 4,41,881 57,37,225
(b) Value of perquisites u/s 17(2) Income-tax Act, 1961 - - - -
(c) Profits in lieu of salary under section 17(3) Income- tax Act, 1961 - - - -
2 Stock Option - - - -3 Sweat Equity - - - -4 Commission
- as % of profit - - - -
- others, specify - - - -Others, please specify - - - -
Total 39,05,166 13,89,958 4,41,881 57,37,225

38
G. PENALTIES / PUNISHMENT/ COMPOUNDING OF OFFENCES:
Type Section of the Companies
Act
Brief Description
Details of Penalty / Punishment /
Compounding fees imposed
Authority [RD / NCLT /
COURT]
Authority [RD / NCLT/ COURT]
A. COMPANYPenalty
NILPunishmentCompounding
B. DIRECTORSPenalty
NILPunishmentCompounding
C. OTHER OFFICERS IN DEFAULTPenalty
NILPunishmentCompounding
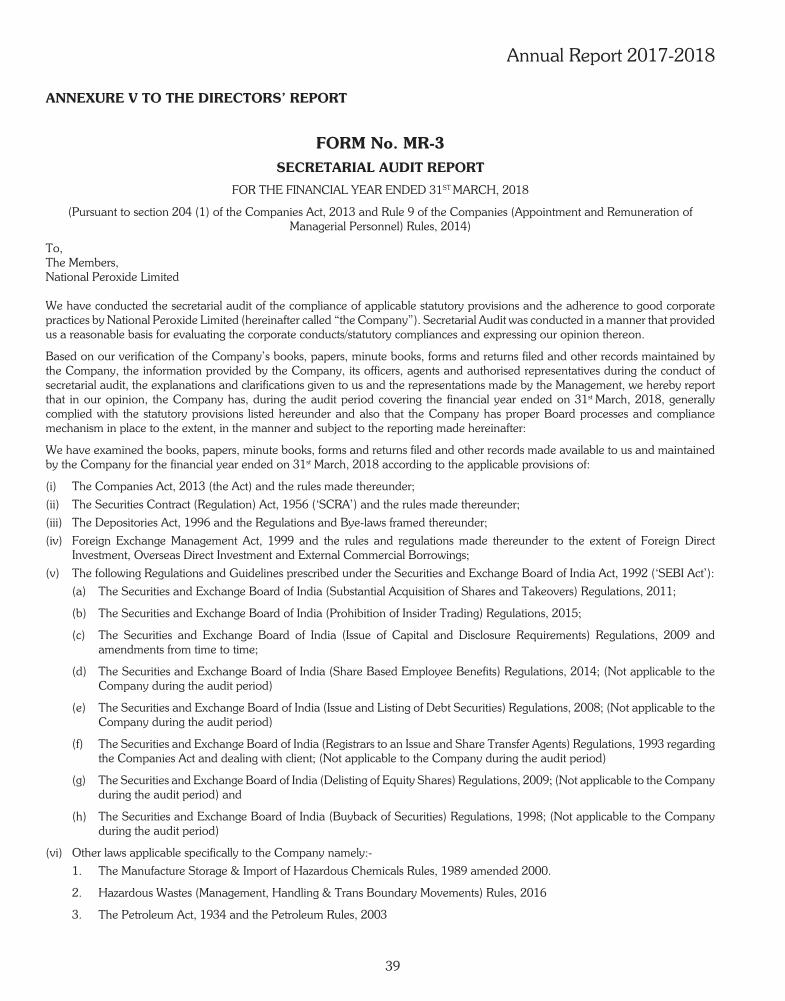
39
Annual Report 2017-2018
ANNEXURE V TO THE DIRECTORS’ REPORT
FORM No. MR-3SECRETARIAL AUDIT REPORT
FOR THE FINANCIAL YEAR ENDED 31ST MARCH, 2018
(Pursuant to section 204 (1) of the Companies Act, 2013 and Rule 9 of the Companies (Appointment and Remuneration of Managerial Personnel) Rules, 2014)
To,The Members,National Peroxide Limited
We have conducted the secretarial audit of the compliance of applicable statutory provisions and the adherence to good corporate practices by National Peroxide Limited (hereinafter called “the Company”). Secretarial Audit was conducted in a manner that provided us a reasonable basis for evaluating the corporate conducts/statutory compliances and expressing our opinion thereon.
Based on our verification of the Company’s books, papers, minute books, forms and returns filed and other records maintained by the Company, the information provided by the Company, its officers, agents and authorised representatives during the conduct of secretarial audit, the explanations and clarifications given to us and the representations made by the Management, we hereby report that in our opinion, the Company has, during the audit period covering the financial year ended on 31st March, 2018, generally complied with the statutory provisions listed hereunder and also that the Company has proper Board processes and compliance mechanism in place to the extent, in the manner and subject to the reporting made hereinafter:
We have examined the books, papers, minute books, forms and returns filed and other records made available to us and maintained by the Company for the financial year ended on 31st March, 2018 according to the applicable provisions of:
(i) The Companies Act, 2013 (the Act) and the rules made thereunder;
(ii) The Securities Contract (Regulation) Act, 1956 (‘SCRA’) and the rules made thereunder;
(iii) The Depositories Act, 1996 and the Regulations and Bye-laws framed thereunder;
(iv) Foreign Exchange Management Act, 1999 and the rules and regulations made thereunder to the extent of Foreign Direct Investment, Overseas Direct Investment and External Commercial Borrowings;
(v) The following Regulations and Guidelines prescribed under the Securities and Exchange Board of India Act, 1992 (‘SEBI Act’):
(a) The Securities and Exchange Board of India (Substantial Acquisition of Shares and Takeovers) Regulations, 2011;
(b) The Securities and Exchange Board of India (Prohibition of Insider Trading) Regulations, 2015;
(c) The Securities and Exchange Board of India (Issue of Capital and Disclosure Requirements) Regulations, 2009 and amendments from time to time;
(d) The Securities and Exchange Board of India (Share Based Employee Benefits) Regulations, 2014; (Not applicable to the Company during the audit period)
(e) The Securities and Exchange Board of India (Issue and Listing of Debt Securities) Regulations, 2008; (Not applicable to the Company during the audit period)
(f) The Securities and Exchange Board of India (Registrars to an Issue and Share Transfer Agents) Regulations, 1993 regarding the Companies Act and dealing with client; (Not applicable to the Company during the audit period)
(g) The Securities and Exchange Board of India (Delisting of Equity Shares) Regulations, 2009; (Not applicable to the Company during the audit period) and
(h) The Securities and Exchange Board of India (Buyback of Securities) Regulations, 1998; (Not applicable to the Company during the audit period)
(vi) Other laws applicable specifically to the Company namely:-
1. The Manufacture Storage & Import of Hazardous Chemicals Rules, 1989 amended 2000.
2. Hazardous Wastes (Management, Handling & Trans Boundary Movements) Rules, 2016
3. The Petroleum Act, 1934 and the Petroleum Rules, 2003

40
4. The Indian Boilers Act, 1923
5. Indian Boiler Regulations 1950 and amendment thereof
6. Explosives Act, 1884 & Rules, 1981 & Static and Mobile Pressure Vessel (Unfired) Rules, 1981
7. Motor Vehicles Act, 1988
8. The Solvent Raffinate and Slop (Acquisition, Sale, Storage and Prevention of Use in Automobiles) Amendment Order, 2009
9. Chemical Accidents (Emergency Planning, Preparedness and Response) Rules, 1996
We have also examined compliance with the applicable clauses of the following which have been generally complied:
(i) Secretarial Standards issued by The Institute of Company Secretaries of India with respect to Board and General meetings.
(ii) The Listing Agreements entered into by the Company with BSE Limited read with the SEBI (Listing Obligations and Disclosure Requirements) Regulations, 2015.
During the period under review, the Company has complied with the provisions of the Act, Rules, Regulations, Guidelines, Standards etc., as mentioned above except filing of Form MR-1 for appointment of Whole-Time Director which was filed subsequently.
We further report that:
The Board of Directors of the Company is duly constituted with proper balance of Executive Directors, Non-Executive Directors and Independent Directors. The changes in the composition of the Board of Directors that took place during the period under review were carried out in compliance with the provisions of the Act.
Adequate notice was given to all directors to schedule the Board Meetings, agenda and detailed notes on agenda were sent at least seven days in advance for meetings other than those held at shorter notice, and a system exists for seeking and obtaining further information and clarifications on the agenda items before the meeting and for meaningful participation at the meeting.
Decisions at the Board Meetings were taken unanimously.
We further report that there are systems and processes in the Company commensurate with the size and operations of the Company to monitor and ensure compliance with applicable laws, rules, regulations and guidelines etc. We further report that during the audit period the Company had following events which had bearing on the Company’s affairs in pursuance of the above referred laws, rules, regulations, guidelines, standards etc.:-
During the financial year 2017-18, the Company’s management has identified instances of embezzlement of its funds by certain employees of the Company, including senior management employees, whose services have since been terminated. Based on the management’s scrutiny and the forensic investigation, the Company has initiated criminal proceedings against these employees including filing of FIR and application for other appropriate action with the Joint Commissioner of Police, Economic Offences Wing.
For Parikh & AssociatesCompany Secretaries
Shalini Bhat Place: Mumbai PartnerDate :24th May, 2018 FCS No: 6484 CP No: 6994
This Report is to be read with our letter of even date which is annexed as Annexure A and Forms an integral part of this report.

41
Annual Report 2017-2018
‘Annexure A’To,The MembersNational Peroxide Limited
Our report of even date is to be read along with this letter.
1. Maintenance of secretarial record is the responsibility of the management of the Company. Our responsibility is to express an opinion on these secretarial records based on our audit.
2. We have followed the audit practices and process as were appropriate to obtain reasonable assurance about the correctness of the contents of the secretarial records. The verification was done on test basis to ensure that correct facts are reflected in secretarial records. We believe that the process and practices, we followed provide a reasonable basis for our opinion.
3. We have not verified the correctness and appropriateness of financial records and Books of Accounts of the Company.
4. Where ever required, we have obtained the Management Representation about the Compliance of laws, rules and regulations and happening of events etc.
5. The Compliance of the provisions of Corporate and other applicable laws, rules, regulations, standards is the responsibility of management. Our examination was limited to the verification of procedure on test basis.
6. The Secretarial Audit report is neither an assurance as to the future viability of the Company nor of the efficacy or effectiveness with which the management has conducted the affairs of the Company.
For Parikh & AssociatesCompany Secretaries
Shalini Bhat Place: Mumbai PartnerDate :24th May, 2018 FCS No: 6484 CP No: 6994

42
ANNEXURE VI TO THE DIRECTORS’ REPORT
DETAILS OF THE REMUNERATION OF DIRECTORS, KMPs AND EMPLOYEES [Pursuant to Section 197(12) of the Companies Act, 2013 read with Rule 5(1) of the Companies
(Appointment and Remuneration of Managerial Personnel) Rules, 2014]
i) The percentage increase in remuneration of Executive Director, Chief Financial Officer and Company Secretary during the financial year 2017-18 and ratio of the remuneration of each Executive Director to the median remuneration of the employees of the Company for the financial year 2017-18 are as under:
Sr. No.
Name of Director/KMP and Designation Remuneration of Director/KMP for the
F.Y. 2017-18 (` In lakhs)
% increase in Remuneration
in the F.Y. 2017-18
Ratio of remuneration of
each Director/KMP to median remuneration of
employees
1. Mr. Suresh Khurana, Chief Executive Officer & Director * - - -
2. Mr. S.R. Lohokare, Managing Director ** 239.81 - -
3. Mr. Shailesh J. Chauhan, Chief Financial Officer *** 39.05 *** 4.89:1
4. Ms. Seema Jagnani, Company Secretary# (upto 13.11.2017)
13.90 # -
5. Mr. Jitendra Prasad, Company Secretary$ (upto 28.12.2017)
04.42 $ -
* Details not given for Mr. Suresh Khurana, as he was employed only for part of the financial year 2017-18 i.e. Designated as Chief Executive Officer & Director w.e.f. 15th December, 2017.
** Details not given for Mr. S. R. Lohokare, as he was employed only for part of the financial year 2017-18 i.e. upto 15th December, 2017.
*** % increase not given for Mr. Shailesh J. Chauhan, as he was employed only for part of the financial year 2016-17 i.e. Designated as CFO & KMP w.e.f. 11th November 2016.
# Details not given for Ms. Seema Jagnani, as she was employed only for part of the financial year 2017-18 i.e. upto 13th November, 2017.
$ Details not given for Mr. Jitendra Prasad, as he was employed only for part of the financial year 2017-18 i.e. upto 28th December, 2017.
ii) The median remuneration of employees of the Company during the financial year was `7.98 lakhs. In the financial year 2017-18, there was an increase of 4.31% in the median remuneration of employees.
iii) The number of permanent employees on the rolls of the Company as on 31st March 2018 was 113.
iv) Average percentage increase made in the salaries of employees other than the managerial personnel in the last financial year i.e. 2017-18, and comparison with the increase in the managerial remuneration for the same financial year.
(Amount in `)
Remuneration paid to
employees (excluding
managerial personnel) for
the FY 2016-17
Remuneration paid to
employees (excluding
managerial personnel) for
the FY 2017-18
(%) change in remuneration
paid to employees (excluding
managerial personnel)
Remuneration paid to
managerial personnel for
the FY 2016-17
Remuneration paid to
managerial personnel for
the FY 2017-18
(%) change in remuneration
paid to managerial
personnel
3,66,01,719 3,79,78,916 3.76 6,91,65,957 7,46,90,965 7.99
The figures for FY 2016-17 are not comparable to the figures mentioned in Annual report for the financial year end 31st March 2017 as the mix of employees between FY 2016-17 and FY 2017-18 is not similar to FY 2015-16 and FY 2016-17.
v) It is affirmed that the remuneration paid is as per the Nomination and Remuneration policy of the Company.

43
Annual Report 2017-2018
ANNEXURE VII TO THE DIRECTORS’ REPORT
CONSERVATION OF ENERGY, TECHNOLOGY ABSORPTION, FOREIGN EXCHANGE EARNINGS AND OUTGO
[Pursuant to Section 134(3)(m) of the Companies Act, 2013, read with Rule 8(3) of the Companies (Accounts) Rules, 2014]
The details of conservation of energy, technology absorption, foreign exchange earnings and outgo are as follows:A. Conservation of energy:
(a) The steps taken or impact on conservation of energy: Several measures for conservation of energy were undertaken during the year. Some of the key measures are highlighted as under:
Installed Ventilators on the roof of Workshop shed, pilot plant, warehouse and reduced day lighting power consumption.Replaced old Motors with new IE4 Energy efficient motors for DMW pumps and reduced the power consumption.Replaced old street light fittings in plant peripheral area with energy efficient LED light fittings/Lamps.
These measures, along with the measures taken during the last year, have resulted in significant reduction in energy consumption.
Total energy consumption & energy consumption per unit of production:
A. POWER AND FUEL CONSUMPTION
2017-18 2016-171. Electricity
a. Purchased:Units (KWH) 3,50,84,000 3,31,18,576Total Amount (` lacs) 2,581.13 2,399.61Rate/Unit (`/KWH) 7.36 7.25
b. Own Generation:(i) Through diesel generator Units (KWH) 26,200 56,572 Units/litre of diesel oil (KWH) 2.94 3.01 Cost of diesel /Unit (`/KWH) 17.19 16.81(ii) Through steam turbine/ generator Not Applicable
2. Coal Not Applicable3. Fuel
a. Furnace OilQuantity (MT) 0.00 49.95Total amount (` lacs) 0.00 14.04Average rate (`/MT) 0.00 28,096.87
b. Natural GasQuantity (MMBTU) 10,371.00 84,682.00Total amount (` lacs) 76.07 525.00Average rate (`/MMBTU) 733.50 619.97
4. Other / Internal Generation Not Applicable
B. CONSUMPTION PER UNIT OF PRODUCTION
2017-18 2016-17
1. Electricity (KWH/MT) 337.15 351.51
2. Fuel
a. Furnace Oil (KG/MT)* 0.00 0.53
b. Natural Gas (MMBTU/MT)* 0.10 0.91
* The Boiler was operated partly on Furnace Oil and partly on Natural Gas. The consumption for each fuel is calculated on the basis of annual production. The equivalent fuel oil specific consumption on gross calorific value basis for 2014-15, 2015-16, 2016-17 and 2017-18 works out to 30.24 kg of Fuel Oil/MT, 23.02 kg of Fuel Oil/MT, 22.72 kg of Fuel Oil/MT and 2.47 of Fuel Oil/MT respectively.
(b) The steps taken by the Company for utilising alternate sources of energy: The Solar based power plant and the purchase of Open Access power as alternate sources of energy were evaluated. They were not found viable at this time.

44
(c) The capital investment on energy conservation equipment: No capital investment was incurred during the year on various energy conservation measures.
B. TECHNOLOGY ABSORPTION:(a) Efforts made towards technology absorption:
Engineering and Process Design of equipment for expansion of Hydrogen and Hydrogen Peroxide Plant.The Hydrogen plant capacity increase trials were conducted to ascertain further requirements for capacity increase with Technology supplier UOP and with M/s. Johnson Matthey.Streamlined and stabilised Process Heat Recovery System to reduce steam consumption in the Plant.Streamlined operation of Sewage Treatment Plant (STP).Installed organic waste convertor (OWC) for treatment of waste food from canteen and converted into compost.Operating the boiler with Economiser for optimum usage of fuel.
(b) Benefits derived like product improvement, cost reduction, product development or import substitution:
Stable operation of the Plant at high capacity with trained man power.Established requirements to debottleneck Hydrogen plant capacity at low capital cost.Reduced plant steam consumption & Enhanced Energy efficiency with Heat Recovery System.Established on-line monitoring of effluent treatment plant to maintain the quality of final discharge effluent as per MPCB norms.Reduced environment impact and used compost internally for plantation.Better economy, reduction in emission and clean operation.
(c) In case of imported technology (imported during the last three years reckoned from the beginning of the financial year):
The details of technology imported : Process Heat Recovery System to reduce Steam Consumption in the Plant
The year of import : 2016-17
Whether the technology been fully absorbed : Yes
If not fully absorbed, areas where absorption has not taken : N.A place, and the reasons thereof
(d) The expenditure incurred on Research and Development:Capital expenditure : NIL
Recurring expenditure : NIL
Total expenses : NIL
Total as % of turnover : NIL
C. FOREIGN EXCHANGE EARNING AND OUTGO: The foreign Exchange earned in terms of actual inflows and the foreign outgo in terms of actual outflows, during the year, are as follows:
( ` in Lacs)
Particulars 2017-18 2016-17
Foreign exchange earned Nil Nil
Foreign exchange used 619.18 1,063.56
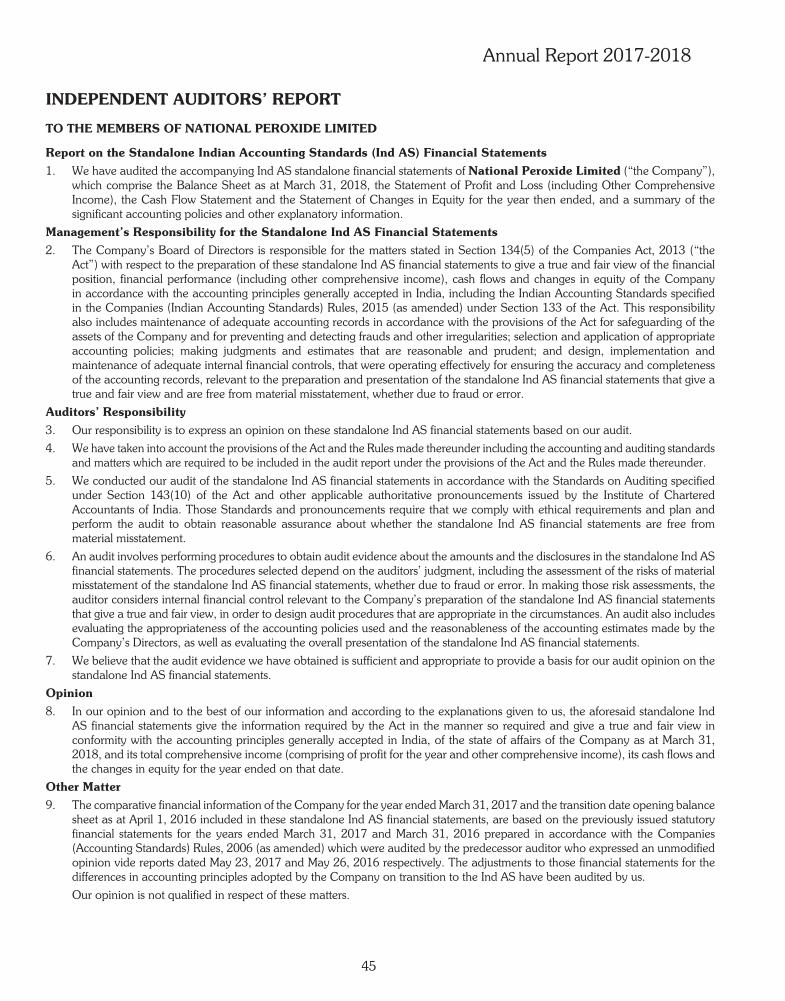
45
Annual Report 2017-2018
INDEPENDENT AUDITORS’ REPORT
TO THE MEMBERS OF NATIONAL PEROXIDE LIMITED
Report on the Standalone Indian Accounting Standards (Ind AS) Financial Statements1. We have audited the accompanying Ind AS standalone financial statements of National Peroxide Limited (“the Company”),
which comprise the Balance Sheet as at March 31, 2018, the Statement of Profit and Loss (including Other Comprehensive Income), the Cash Flow Statement and the Statement of Changes in Equity for the year then ended, and a summary of the significant accounting policies and other explanatory information.
Management’s Responsibility for the Standalone Ind AS Financial Statements2. The Company’s Board of Directors is responsible for the matters stated in Section 134(5) of the Companies Act, 2013 (“the
Act”) with respect to the preparation of these standalone Ind AS financial statements to give a true and fair view of the financial position, financial performance (including other comprehensive income), cash flows and changes in equity of the Company in accordance with the accounting principles generally accepted in India, including the Indian Accounting Standards specified in the Companies (Indian Accounting Standards) Rules, 2015 (as amended) under Section 133 of the Act. This responsibility also includes maintenance of adequate accounting records in accordance with the provisions of the Act for safeguarding of the assets of the Company and for preventing and detecting frauds and other irregularities; selection and application of appropriate accounting policies; making judgments and estimates that are reasonable and prudent; and design, implementation and maintenance of adequate internal financial controls, that were operating effectively for ensuring the accuracy and completeness of the accounting records, relevant to the preparation and presentation of the standalone Ind AS financial statements that give a true and fair view and are free from material misstatement, whether due to fraud or error.
Auditors’ Responsibility3. Our responsibility is to express an opinion on these standalone Ind AS financial statements based on our audit.
4. We have taken into account the provisions of the Act and the Rules made thereunder including the accounting and auditing standards and matters which are required to be included in the audit report under the provisions of the Act and the Rules made thereunder.
5. We conducted our audit of the standalone Ind AS financial statements in accordance with the Standards on Auditing specified under Section 143(10) of the Act and other applicable authoritative pronouncements issued by the Institute of Chartered Accountants of India. Those Standards and pronouncements require that we comply with ethical requirements and plan and perform the audit to obtain reasonable assurance about whether the standalone Ind AS financial statements are free from material misstatement.
6. An audit involves performing procedures to obtain audit evidence about the amounts and the disclosures in the standalone Ind AS financial statements. The procedures selected depend on the auditors’ judgment, including the assessment of the risks of material misstatement of the standalone Ind AS financial statements, whether due to fraud or error. In making those risk assessments, the auditor considers internal financial control relevant to the Company’s preparation of the standalone Ind AS financial statements that give a true and fair view, in order to design audit procedures that are appropriate in the circumstances. An audit also includes evaluating the appropriateness of the accounting policies used and the reasonableness of the accounting estimates made by the Company’s Directors, as well as evaluating the overall presentation of the standalone Ind AS financial statements.
7. We believe that the audit evidence we have obtained is sufficient and appropriate to provide a basis for our audit opinion on the standalone Ind AS financial statements.
Opinion8. In our opinion and to the best of our information and according to the explanations given to us, the aforesaid standalone Ind
AS financial statements give the information required by the Act in the manner so required and give a true and fair view in conformity with the accounting principles generally accepted in India, of the state of affairs of the Company as at March 31, 2018, and its total comprehensive income (comprising of profit for the year and other comprehensive income), its cash flows and the changes in equity for the year ended on that date.
Other Matter9. The comparative financial information of the Company for the year ended March 31, 2017 and the transition date opening balance
sheet as at April 1, 2016 included in these standalone Ind AS financial statements, are based on the previously issued statutory financial statements for the years ended March 31, 2017 and March 31, 2016 prepared in accordance with the Companies (Accounting Standards) Rules, 2006 (as amended) which were audited by the predecessor auditor who expressed an unmodified opinion vide reports dated May 23, 2017 and May 26, 2016 respectively. The adjustments to those financial statements for the differences in accounting principles adopted by the Company on transition to the Ind AS have been audited by us.
Our opinion is not qualified in respect of these matters.

46
Report on Other Legal and Regulatory Requirements
10. As required by the Companies (Auditor’s Report) Order, 2016, issued by the Central Government of India in terms of sub-section (11) of section 143 of the Act (“the Order”), and on the basis of such checks of the books and records of the Company as we considered appropriate and according to the information and explanations given to us, we give in the Annexure B a statement on the matters specified in paragraphs 3 and 4 of the Order.
11. As required by Section 143 (3) of the Act, we report that:
(a) We have sought and obtained all the information and explanations which to the best of our knowledge and belief were necessary for the purposes of our audit.
(b) In our opinion, proper books of account as required by law have been kept by the Company so far as it appears from our examination of those books.
(c) The Balance Sheet, the Statement of Profit and Loss (including other comprehensive income), the Cash Flow Statement and the Statement of Changes in Equity dealt with by this Report are in agreement with the books of account.
(d) In our opinion, the aforesaid standalone Ind AS financial statements comply with the Indian Accounting Standards specified under Section 133 of the Act.
(e) On the basis of the written representations received from the directors as on March 31, 2018 taken on record by the Board of Directors, none of the directors is disqualified as on March 31, 2018 from being appointed as a director in terms of Section 164 (2) of the Act.
(f) With respect to the adequacy of the internal financial controls with reference to financial statements of the Company and the operating effectiveness of such controls, refer to our separate Report in Annexure A.
(g) With respect to the other matters to be included in the Auditors’ Report in accordance with Rule 11 of the Companies (Audit and Auditors) Rules, 2014, in our opinion and to the best of our knowledge and belief and according to the information and explanations given to us:
i The Company has disclosed the impact, if any, of pending litigations as at March 31, 2018 on its financial position in its standalone Ind AS financial statements – Refer Note 39;
ii The Company has long-term contracts as at March 31, 2018 for which there were no material foreseeable losses. The Company did not have any derivative contracts as at March 31, 2018.
iii There has been no delay in transferring amounts, required to be transferred, to the Investor Education and Protection Fund by the Company during the year ended March 31, 2018.
iv The reporting on disclosures relating to Specified Bank Notes is not applicable to the Company for the year ended March 31, 2018.
For Price Waterhouse Chartered Accountants LLPFirm Registration Number: 012754N/N500016
Asha Ramanathan
Partner
Membership Number: 202660Mumbai, 24th May, 2018

47
Annual Report 2017-2018
Annexure “A” to Independent Auditors’ ReportReferred to in paragraph 11(f) of the Independent Auditors’ Report of even date to the members of National Peroxide Limited on the standalone financial statements for the year ended March 31, 2018Report on the Internal Financial Controls with reference to financial statements under Clause (i) of Sub-section 3 of Section 143 of the Act1. We have audited the internal financial controls with reference to financial statements of National Peroxide Limited (“the
Company”) as of March 31, 2018 in conjunction with our audit of the standalone financial statements of the Company for the year ended on that date.
Management’s Responsibility for Internal Financial Controls2. The Company’s management is responsible for establishing and maintaining internal financial controls based on the internal
control over financial reporting criteria established by the Company considering the essential components of internal control stated in the Guidance Note on Audit of Internal Financial Controls Over Financial Reporting issued by the Institute of Chartered Accountants of India (ICAI). These responsibilities include the design, implementation and maintenance of adequate internal financial controls that were operating effectively for ensuring the orderly and efficient conduct of its business, including adherence to company’s policies, the safeguarding of its assets, the prevention and detection of frauds and errors, the accuracy and completeness of the accounting records, and the timely preparation of reliable financial information, as required under the Act.
Auditors’ Responsibility3. Our responsibility is to express an opinion on the Company’s internal financial controls with reference to financial statements
based on our audit. We conducted our audit in accordance with the Guidance Note on Audit of Internal Financial Controls Over Financial Reporting (the “Guidance Note”) and the Standards on Auditing deemed to be prescribed under section 143(10) of the Act to the extent applicable to an audit of internal financial controls, both applicable to an audit of internal financial controls and both issued by the ICAI. Those Standards and the Guidance Note require that we comply with ethical requirements and plan and perform the audit to obtain reasonable assurance about whether adequate internal financial controls with reference to financial statements was established and maintained and if such controls operated effectively in all material respects.
4. Our audit involves performing procedures to obtain audit evidence about the adequacy of the internal financial controls system with reference to financial statements and their operating effectiveness. Our audit of internal financial controls with reference to financial statements included obtaining an understanding of internal financial controls with reference to financial statements, assessing the risk that a material weakness exists, and testing and evaluating the design and operating effectiveness of internal control based on the assessed risk. The procedures selected depend on the auditor’s judgement, including the assessment of the risks of material misstatement of the financial statements, whether due to fraud or error.
5. We believe that the audit evidence we have obtained is sufficient and appropriate to provide a basis for our audit opinion on the Company’s internal financial controls system with reference to financial statements.
Meaning of Internal Financial Controls with reference to financial statements6. A company’s internal financial control with reference to financial statements is a process designed to provide reasonable assurance
regarding the reliability of financial reporting and the preparation of financial statements for external purposes in accordance with generally accepted accounting principles. A company’s internal financial control with reference to financial statements includes those policies and procedures that (1) pertain to the maintenance of records that, in reasonable detail, accurately and fairly reflect the transactions and dispositions of the assets of the company; (2) provide reasonable assurance that transactions are recorded as necessary to permit preparation of financial statements in accordance with generally accepted accounting principles, and that receipts and expenditures of the company are being made only in accordance with authorisations of management and directors of the company; and (3) provide reasonable assurance regarding prevention or timely detection of unauthorised acquisition, use, or disposition of the company’s assets that could have a material effect on the financial statements.
Inherent Limitations of Internal Financial Controls with reference to financial statements7. Because of the inherent limitations of internal financial controls with reference to financial statements, including the possibility
of collusion or improper management override of controls, material misstatements due to error or fraud may occur and not be detected. Also, projections of any evaluation of the internal financial controls with reference to financial statements to future periods are subject to the risk that the internal financial control with reference to financial statements may become inadequate because of changes in conditions, or that the degree of compliance with the policies or procedures may deteriorate.
Opinion8. In our opinion, the Company has, in all material respects, an adequate internal financial controls system with reference to
financial statements and such internal financial controls with reference to the financial statements were operating effectively as at March 31, 2018, based on the internal control over financial reporting criteria established by the Company considering the essential components of internal control stated in the Guidance Note on Audit of Internal Financial Controls Over Financial Reporting issued by the Institute of Chartered Accountants of India.
For Price Waterhouse Chartered Accountants LLP
Firm Registration Number: 012754N/N500016
Asha RamanathanPartner
Membership Number: 202660Mumbai, 24th May, 2018

48
Annexure “B” to Independent Auditors’ Report(Referred to in paragraph 10 of the Independent Auditors’ Report of even date to the members of National Peroxide Limited on the standalone financial statements as of and for the year ended March 31, 2018)
i. (a) The Company is maintaining proper records showing full particulars, including quantitative details and situation, of fixed assets.
(b) The fixed assets are physically verified by the Management according to a phased programme designed to cover all the items over a period of 3 years which, in our opinion, is reasonable having regard to the size of the Company and the nature of its assets. Pursuant to the programme, a portion of the fixed assets has been physically verified by the Management during the year and no material discrepancies have been noticed on such verification.
(c) The title deeds of immovable properties, as disclosed in Note 3 on fixed assets to the financial statements, are held in the name of the Company.
ii. The physical verification of inventory have been conducted at reasonable intervals by the Management during the year. The discrepancies noticed on physical verification of inventory as compared to book records were not material.
iii. The Company has not granted any loans, secured or unsecured, to companies, firms, Limited Liability Partnerships or other parties covered in the register maintained under Section 189 of the Act. Therefore, the provisions of Clause 3(iii), (iii)(a), (iii)(b) and (iii)(c) of the said Order are not applicable to the Company.
iv. The Company has not granted any loans to the parties covered under section 185. In our opinion, and according to the information and explanations given to us, the Company has complied with the provisions of Section 186 of the Companies Act, 2013 in respect of the investments made by it.
v. The Company has not accepted any deposits from the public within the meaning of Sections 73, 74, 75 and 76 of the Act and the Rules framed there under to the extent notified.
vi. Pursuant to the rules made by the Central Government of India, the Company is required to maintain cost records as specified under Section 148(1) of the Act in respect of its products. We have broadly reviewed the same, and are of the opinion that, prima facie, the prescribed accounts and records have been made and maintained. We have not, however, made a detailed examination of the records with a view to determine whether they are accurate or complete.
vii. (a) According to the information and explanations given to us and the records of the Company examined by us, in our opinion, the Company is generally regular in depositing undisputed statutory dues in respect of goods and service tax with effect from July 1, 2017, though there has been a slight delay in a few cases, and is regular in depositing undisputed statutory dues, including provident fund, employees’ state insurance, sales tax, income tax, service tax, duty of customs, duty of excise, value added tax, cess and other material statutory dues, as applicable, with the appropriate authorities.
(b) According to the information and explanations given to us and the records of the Company examined by us, the particulars of dues of value added tax, sales tax and income tax as at March 31, 2018, which have not been deposited on account of a dispute, are as follows:
Name of the statute Nature of dues Amount(` In
Lakhs)
Period to which the amount relates
Forum where the dispute is pending
Maharashtra Value Added Tax Act, 2002
Value Added Tax 42.59* FY 2009-10 Deputy Commissioner of Sales Tax
Central Sales Tax Act, 1956
Sales Tax 205.69** FY 2009-10 Joint Commissioner of Sales tax
Central Sales Tax Act, 1956
Sales Tax 38.90 FY 2012-13 Joint Commissioner of Sales tax
Income Tax Act, 1961 Income Tax 4.58 AY 2013-14 Assistant Commissioner of Income Tax, Mumbai
* net of ` 3 lakhs paid as deposit
** net of ` 0.99 lakhs paid as deposit
viii. According to the records of the Company examined by us and the information and explanation given to us, the Company has not defaulted in repayment of borrowings to any bank as at the balance sheet date.
ix. The Company has not raised any moneys by way of initial public offer of further public offer (including debt instruments) and term loans. Accordingly, the provisions of Clause 3(ix) of the Order are not applicable to the Company.

49
Annual Report 2017-2018
x. During the course of our examination of the books and records of the Company, carried out in accordance with the generally accepted auditing practices in India, and according to the information and explanations given to us, except for a fraud on the Company by certain employees of the Company, including senior management employees, for which the Board has taken appropriate steps as described in Note 32 to the financial statements, we have neither come across any other instance of a material fraud by the Company or on the Company by its officers or employees, noticed or reported during the year, nor have we been informed of any such case by the Management.
xi. The Company has paid/ provided for managerial remuneration in accordance with the requisite approvals mandated by the provisions of Section 197 read with Schedule V to the Act.
xii. As the Company is not a Nidhi Company and the Nidhi Rules, 2014 are not applicable to it, the provisions of Clause 3(xii) of the Order are not applicable to the Company.
xiii. The Company has entered into transactions with related parties in compliance with the provisions of Sections 177 and 188 of the Act. The details of such related party transactions have been disclosed in the financial statements as required under Indian Accounting Standard (Ind AS) 24, Related Party Disclosures specified under Section 133 of the Act.
xiv. The Company has not made any preferential allotment or private placement of shares or fully or partly convertible debentures during the year under review. Accordingly, the provisions of Clause 3(xiv) of the Order are not applicable to the Company.
xv. The Company has not entered into any non cash transactions with its directors or persons connected with him within the meaning of section 192 of the Act. Accordingly, the provisions of Clause 3(xv) of the Order are not applicable to the Company.
xvi. The Company is not required to be registered under Section 45-IA of the Reserve Bank of India Act, 1934. Accordingly, the provisions of Clause 3(xvi) of the Order are not applicable to the Company.
For Price Waterhouse Chartered Accountants LLP
Firm Registration Number: 012754N/N500016
Asha Ramanathan
Partner
Membership Number: 202660
Mumbai, 24th May, 2018

50
Balance Sheet as at March 31, 2018Rup` in Lakhs
Notes As at March 31, 2018
As at March 31, 2017
As at April 1, 2016
ASSETS
Non-current assetsProperty, Plant and Equipment 3 16,965.25 17,848.07 17,966.89 Capital work-in-progress 563.98 168.19 308.89 Financial assets
(i) Investments 4 18,305.49 11,992.66 5,361.08 (ii) Loans 5 40.35 40.90 242.48
Current tax assets (net) 6 297.92 272.70 254.55 Other non-current assets 7 1,316.67 776.37 720.36 Total non-current assets 37,489.66 31,098.89 24,854.25 Current assets Inventories 8 1,472.70 1,110.72 1,411.05 Financial assets
(i) Investments 9 7,037.21 5,026.17 578.75 (ii) Trade receivables 10 5,325.04 3,316.78 3,266.01 (iii) Cash and cash equivalents 11 317.53 4.38 32.90 (iv) Bank balances other than (iii) above 12 49.23 38.40 38.53 (v) Loans 13 6,524.34 3,028.62 4,431.91 (vi) Other financial assets 14 41.63 93.69 16.21
Other current assets 15 196.76 269.21 418.08 Total current assets 20,964.44 12,887.97 10,193.44 Total assets 58,454.10 43,986.86 35,047.69
EQUITY AND LIABILITIESEquityEquity share capital 16 574.70 574.70 574.70 Other equity 17 50,310.13 36,845.97 27,089.92 Total equity 50,884.83 37,420.67 27,664.62
LiabilitiesNon-current liabilitiesFinancial liabilities
(i) Borrowings 18 - - 999.30 Deferred tax liabilities (net) 6 3,375.27 2,451.58 2,006.18 Provisions 19 254.79 279.02 199.04 Total non-current liabilities 3,630.06 2,730.60 3,204.52 Current liabilitiesFinancial liabilities
(i) Borrowings 20 - 105.33 33.10 (ii) Trade payables 21 2,026.17 1,922.97 1,632.40 (iii) Other financial liabilities 22 69.23 1,065.69 2,073.80
Other current liabilities 23 1,269.00 373.19 223.60 Provisions 24 217.80 237.96 215.65 Current tax liabilities (net) 6 357.01 130.45 - Total current liabilities 3,939.21 3,835.59 4,178.55 Total Liabilities 7,569.27 6,566.19 7,383.07 Total equity and liabilities 58,454.10 43,986.86 35,047.69
Basis of Preparation and Significant accounting policies 2 The above Balance Sheet should be read in conjunction with the accompanying notes.
As per our report of even date attached For and on behalf of the Board of Directors
For Price Waterhouse Chartered Accountants LLPChartered Accountants Firm Registration Number: 012754N/N500016
SURESH KHURANA Chief Executive Officer & DirectorDIN:06677496
NESS N. WADIADIN: 00036049
Chairman
R. BATRADIN: 00020764
N. P. GHANEKARDIN: 00009725
MINNIE BODHANWALADIN: 00422067
} Directors
Asha RamanathanPartnerMembership No. 202660
SHAILESH CHAUHANChief Financial Officer
Mumbai, May 24, 2018 Mumbai, May 24, 2018

51
Annual Report 2017-2018
Statement of Profit and Loss for the Year ended March 31, 2018
Rup` in Lakhs
Notes Year ended March 31, 2018
Year ended March 31, 2017
Income
Revenue from operations 25 31,043.00 26,157.53
Other income 26 1,013.69 618.67
Total income 32,056.69 26,776.20
Expenses
Cost of materials consumed 27 6,858.40 5,609.25
Changes in inventories of finished goods 28 (331.40) 510.81
Excise duty 855.17 2,927.00
Employee benefit expenses 29 2,255.10 2,348.50
Finance costs 30 50.59 221.04
Depreciation 3 919.16 892.73
Other expenses 31 6,932.98 7,793.46
Total expenses 17,540.00 20,302.79
Profit before exceptional items and tax 14,516.69 6,473.41
Exceptional items Charge / (Credit) 32 (105.92) 768.94
Profit before tax 14,622.61 5,704.47
Income tax expense 6
Current tax 4,212.71 1,468.46
Deferred tax 898.23 447.75
Total tax expense 5,110.94 1,916.21 Profit for the year 9,511.67 3,788.26 Other comprehensive incomeItems that will not be reclassified to profit or loss
Remeasurements of the defined benefit obligations 15.92 42.66
Changes in fair value of FVOCI equity instruments 6,312.82 6,631.60
Income tax relating to these items (24.48) (14.76)
Other comprehensive income for the year, net of tax 6,304.26 6,659.50 Total comprehensive income for the year 15,815.93 10,447.76
Earnings per equity shareBasic and diluted earnings per share 37 165.51 65.92
Basis of Preparation and Significant accounting policies 2
The above statement of Profit and Loss should be read in conjunction with the accompanying notes.As per our report of even date attached For and on behalf of the Board of Directors
For Price Waterhouse Chartered Accountants LLPChartered Accountants Firm Registration Number: 012754N/N500016
SURESH KHURANA Chief Executive Officer & DirectorDIN:06677496
NESS N. WADIADIN: 00036049
Chairman
R. BATRADIN: 00020764
N. P. GHANEKARDIN: 00009725
MINNIE BODHANWALADIN: 00422067
} Directors
Asha RamanathanPartnerMembership No. 202660
SHAILESH CHAUHANChief Financial Officer
Mumbai, May 24, 2018 Mumbai, May 24, 2018

52
Statement of changes in Equity for the Year ended March 31, 2018
A. Equity share capital (Refer note 16) Rup` in Lakhs
As at April 1, 2016 574.70
Changes in equity share capital -
As at March 31, 2017 574.70
Changes in equity share capital -
As at March 31, 2018 574.70
Rup` in Lakhs
B. Other Equity Notes Reserves and surplus Other reserves Total other equity
Generalreserve
Retained earnings
FVOCI - Equity instruments
Balance at April 1, 2016 17 3,284.50 18,571.67 5,233.75 27,089.92
Profit for the year - 3,788.26 - 3,788.26
Other comprehensive income for the year - 27.90 6,631.60 6,659.50
Total comprehensive income for the year - 3,816.16 6,631.60 10,447.76
Transactions with owners in their capacity as owners:
Dividend paid 35b - (574.70) - (574.70)
Dividend distribution tax 35b - (117.01) - (117.01)
Balance at March 31, 2017 3,284.50 21,696.12 11,865.35 36,845.97
Balance at April 1, 2017 17 3,284.50 21,696.12 11,865.35 36,845.97
Profit for the year - 9,511.67 - 9,511.67
Other comprehensive income for the year - 10.36 6,293.90 6,304.26
Total comprehensive income for the year - 9,522.03 6,293.90 15,815.93
Transactions with owners in their capacity as owners:
Dividend paid 35b - (1,953.98) - (1,953.98)
Dividend distribution tax 35b - (397.79) - (397.79)
Balance at March 31, 2018 3,284.50 28,866.38 18,159.25 50,310.13
The above statement of changes in equity should be read in conjunction with the accompanying notes.
As per our report of even date attached For and on behalf of the Board of Directors
For Price Waterhouse Chartered Accountants LLPChartered Accountants Firm Registration Number: 012754N/N500016
SURESH KHURANA Chief Executive Officer & DirectorDIN:06677496
NESS N. WADIADIN: 00036049
Chairman
R. BATRADIN: 00020764
N. P. GHANEKARDIN: 00009725
MINNIE BODHANWALADIN: 00422067
} Directors
Asha RamanathanPartnerMembership No. 202660
SHAILESH CHAUHANChief Financial Officer
Mumbai, May 24, 2018 Mumbai, May 24, 2018

53
Annual Report 2017-2018
Statement of Cash Flow for the Year ended March 31, 2018Rup` in Lakhs
Year ended March 31, 2018
Year ended March 31, 2017
Cash flow from operating activitiesProfit before income tax 14,622.61 5,704.47 Adjustments for:
Provision for expected loss on reduction in net realisable value of Capital work-in-progress - 20.86 Loss on account of embezzlement of funds - 1,162.27 Depreciation 919.16 892.73 Loss / (Gain) on disposal of Property, plant and equipment 2.63 (0.16)Finance costs 50.59 221.04 Interest income classified as investing cash flows (712.90) (468.53)Dividend income classified as investing cash flows (102.79) (121.49)Gain on sale of investments (65.67) (6.08)Gain on changes in fair value of financial assets at FVTPL (110.94) (15.25)Provision for doubtful trade receivables 38.15 -
Operating profit before working capital changes 14,640.84 7,389.86
Change in operating assets and liabilities Increase in trade receivables (2,046.41) (50.77)(Increase) / decrease in inventories (361.98) 300.33 Decrease in non-current financial asset 0.55 201.58 Decrease in current financial asset 4.28 3.29 Decrease / (increase) in other non-current assets 95.96 (1,219.72)Decrease / (increase) in other financial assets 56.24 (56.26)Decrease in other current assets 72.45 148.87 Increase in trade payable 103.20 290.57 (Decrease) / increase in provision (28.46) 145.10 Increase in other liabilities 895.81 149.59
Cash generated from operations 13,432.48 7,302.44 Income taxes paid (net) (4,010.39) (1,373.26)
Net cash inflow by operating activities 9,422.09 5,929.18
Cash flows from investing activitiesPayment for purchase of investments (21,154.45) (20,296.60)Proceeds from sale of investments 19,320.02 15,870.50 Interest received 708.73 447.31 Dividend received 102.77 121.49 Payments for Property, plant and equipment (including capital work-in-progress and advances) (1,095.11) (677.16)Proceeds from sale of Property, plant and equipment 41.38 0.42 Intercorporate deposits given to related party (3,500.00) - Refund of intercorporate deposits from other Company - 1,400.00 Movement in bank balances which are not considered as cash and cash equivalents (10.83) -
Net cash outflow from investing activities (5,587.49) (3,134.04)
Cash flows from financing activitiesProceeds from / (Repayment of) short term borrowings (105.33) 72.23 Repayment of borrowings (1,000.00) (2,000.00)Dividend paid to company shareholders (including DDT) (2,340.94) (691.84)Interest paid (75.18) (204.05)
Net cash outflow from financing activities (3,521.45) (2,823.66)
Net increase / (decrease) in cash and cash equivalents 313.15 (28.52)Cash and cash equivalents at the beginning of the year 4.38 32.90 Cash and cash equivalents at the end of the year 317.53 4.38
The above Cash Flow statement should be read in conjunction with the accompanying notes.
As per our report of even date attached For and on behalf of the Board of Directors
For Price Waterhouse Chartered Accountants LLPChartered Accountants Firm Registration Number: 012754N/N500016
SURESH KHURANA Chief Executive Officer & DirectorDIN:06677496
NESS N. WADIADIN: 00036049
Chairman
R. BATRADIN: 00020764
N. P. GHANEKARDIN: 00009725
MINNIE BODHANWALADIN: 00422067
} Directors
Asha RamanathanPartnerMembership No. 202660
SHAILESH CHAUHANChief Financial Officer
Mumbai, May 24, 2018 Mumbai, May 24, 2018

54
1) General information: National Peroxide Limited (“NPL”, “Company”) is a public limited Company established in 1954 and is listed on BSE Limited,
Mumbai. NPL a pioneer in India for peroxygen chemicals is the largest manufacturer of Hydrogen Peroxide in India, with an installed capacity of 95 KTPA on 50% w/w. basis. Company’s registered office is situated at Neville House, J. N. Heredia Marg, Ballard Estate, Mumbai - 400 001.
2) Significant accounting policies and critical estimate and judgments:2.1 Basis of preparation, measurement and significant accounting policies The principal accounting policies applied in the preparation of these financial statements are set out below. These policies
have been consistently applied to all the years presented, unless otherwise stated.
(a) Basis of preparation(i) Compliance with Ind AS The financial statements comply in all material aspects with Indian Accounting Standards (Ind AS) notified under
Section 133 of the Companies Act, 2013 (the Act) [Companies (Indian Accounting Standards) Rules, 2015] and other relevant provisions of the Act.
The financial statements up to year ended March 31, 2017 were prepared in accordance with the accounting standards notified under Companies (Accounting Standard) Rules, 2006 (as amended) and other relevant provisions of the Act.
These financial statements are the first financial statements of the company under Ind AS. Refer note 43 for an explanation on how the transition from previous GAAP to Ind AS has effected the company’s financial position, financial performance and Cash flows.
(ii) Historical cost convention The financial statements have been prepared on historical cost basis, except for the following:
(iii) Amended standards adopted by the Company The amendments to Ind AS 7 require disclosure of changes in liabilities arising from financing activities, see note 18.(iv) Standards issued but not effective Ind AS 115 – Revenue from Contracts from Customers
On March 28, 2018, the Ministry of Corporate Affairs issued Companies (Indian Accounting Standards) Amendment Rules, 2018, notifying Ind AS 115 – Revenue from Contracts with Customers. The accounting standard is applicable to the Company from April 1, 2018. This will replace (i) Ind AS 18 which covers contracts for goods and services, (ii) Ind AS 11 which covers construction contracts, and (iii) Guidance Note on Accounting for Real Estate Transactions which covers revenue recognition for property development projects.
The effective date for adoption of Ind AS 115 is financial periods beginning on or after April 1, 2018. Appendix B to Ind AS 21 - Foreign currency transactions and advance consideration
The appendix clarifies how to determine the date of transaction for the exchange rate to be used on initial recognition of a related asset, expense or income where an entity pays or receives consideration in advance for foreign currency-denominated contracts. For a single payment or receipt, the date of the transaction should be the date on which the entity initially recognises the non-monetary asset or liability arising from the advance consideration (the prepayment or deferred income/contract liability). If there are multiple payments or receipts for one item, date of transaction should be determined as above for each payment or receipt, the effective date for adoption of Ind AS 21 is financial periods beginning on or after April 1, 2018.
Ind AS 12 - Income taxes regarding recognition of deferred tax assets on unrealised losses
The amendments clarify the accounting for deferred taxes where an asset is measured at fair value and that fair value is below the asset’s tax base.
(v) Current vis-à-vis non-current classification The assets and liabilities reported in the balance sheet are classified on a “current / non-current basis”, with separate
reporting of assets held for sale and liabilities. Current assets, which include cash and cash equivalents, are assets that are intended to be realized, sold or consumed during the normal operating cycle of the Company or in the 12 months following the balance sheet date; current liabilities are liabilities that are expected to be settled during the normal operating cycle of the Company or within the 12 months following the close of the financial year. The deferred tax assets and liabilities are classified as non-current assets and liabilities.

55
Annual Report 2017-2018
(b) Segment reporting: Operating segments are reported in a manner consistent with the internal reporting provided to the Chief Operating Decision-
Maker (CODM). The Chief Executive Officer and Director of National Peroxide Limited has been identified as CODM and he is responsible
for allocating resources, assess the financial performance of the company and make strategic decisions. The Company has identified one reportable segment ‘manufacturing of peroxygens’ based on information reviewed by the CODM.
(c) Foreign currency translation;
(i) Functional and presentation currency Items included in the financial statements of the Company are measured using the currency of the primary economic
environment in which the Company operates (‘the functional currency’). The financial statements are presented in ‘Indian Rupees’ (INR), which is the Company’s functional and presentation currency.
(ii) Transactions and balances Foreign currency transactions are translated into the functional currency using the exchange rates at the dates of
the transactions. Foreign exchange gains and losses resulting from the settlement of such transactions and from the translation of monetary assets and liabilities denominated in foreign currencies at year end exchange rates are generally recognized in profit or loss.
Non monetary items that are measured at fair value in a foreign currency are translated using the exchange rates at the date when the fair value was determined. Translation differences on assets and liabilities carried at fair value are reported as part of the fair value gain or loss. For example, translation differences on non monetary assets and liabilities such as equity instruments held at fair value through profit or loss are recognized in profit or loss as part of the fair value gain or loss and translation differences on nonmonetary assets such as equity investments classified as FVOCI are recognized in other comprehensive income.
(d) Revenue recognition: Revenue is measured at the fair value of the consideration received or receivable. Revenue is inclusive of excise duty and
net of trade discounts, rebates, state value added tax, service tax and goods and service tax (GST). With regard to sale of products, income is reported when practically all risks and rewards connected with the ownership have been transferred to the buyer. This usually occurs upon dispatch, after the price has been determined and collection of the receivable is reasonably certain.
(e) Income tax: The income tax expense or credit for the period is the tax payable on the current period’s taxable income based on the
applicable income tax rate for each jurisdiction adjusted by changes in deferred tax assets and liabilities attributable to temporary differences and to unused tax losses.
The current income tax charge is calculated on the basis of the tax laws enacted or substantively enacted at the end of the reporting period in the countries where the Company operates and generates taxable income. Management periodically evaluates positions taken in tax returns with respect to situations in which applicable tax regulation is subject to interpretation. It establishes provisions where appropriate on the basis of amounts expected to be paid to the tax authorities.
Deferred income tax is provided in full, using the liability method, on temporary differences arising between the tax base of assets and liabilities and their carrying amounts in the financial statements. Deferred income tax is also not accounted for if it arises from initial recognition of an asset or liability in a transaction other than a business combination that at the time of the transaction affects neither accounting profit nor taxable profit (tax loss). Deferred income tax is determined using tax rates (and laws) that have been enacted or substantially enacted by the end of the reporting period and are expected to apply when the related deferred income tax asset is realised or the deferred income tax liability is settled.
Deferred tax assets are recognised for all deductible temporary differences and unused tax losses only if it is probable that future taxable amounts will be available to utilise those temporary differences and losses.
Deferred tax assets and liabilities are offset when there is a legally enforceable right to offset current tax assets and liabilities and when the deferred tax balances relate to the same taxation authority. Current tax assets and tax liabilities are offset where the entity has a legally enforceable right to offset and intends either to settle on a net basis or to realise the asset and settle the liability simultaneously.
Current and deferred tax is recognised in Profit or Loss, except to the extent that it relates to items recognised in other comprehensive income or directly in equity. In this case, the tax is also recognized in other comprehensive income or directly in equity, respectively.
(f) Leases Leases in which a significant portion of the risks and rewards of ownership are not transferred to the Company, as lessee,
are classified as operating leases. Payments made under operating leases (net of any incentives received from the lessor) are charged to profit or loss on a straight-line basis over the period of the lease unless, the payments are structured to

56
increase in line with expected general inflation, to compensate for the lessor’s expected inflationary cost increases.(g) Impairment of non-financial assets: Assets are tested for impairment, wherever events or changes in circumstances indicate that the carrying amount may
not be recoverable. An impairment loss is recognised for the amount by which the asset’s carrying amount exceeds its recoverable amount. The recoverable amount is the higher of an asset’s fair value less costs of disposal and value in use. For the purposes of assessing impairment, assets are grouped at the lowest levels for which there are separately identifiable cash inflows which are largely independent of the cash inflows from other assets or groups of assets (cash-generating units). Non-financial assets that suffered an impairment are reviewed for possible reversal of the impairment at the end of each reporting period.
(h) Cash and Cash Equivalents : Cash and cash equivalents includes cash on hand, deposits held at call with financial institutions, other short term, highly
liquid investments with original maturities of three months or less that are readily convertible to known amounts of cash and which are subject to an insignificant risk of changes in value, and bank overdrafts. Bank overdrafts are shown within borrowings in current liabilities in the Balance sheet.
(i) Trade Receivables: Trade receivables are recognised initially at fair value and subsequently measured at amortised cost using the effective
interest method, less provision for impairment.(j) Inventories: Inventories are valued at lower of cost and net realisable value. In the case of raw materials, packing materials and stores
and spares parts, cost is determined in accordance with the moving weighted average principle. Costs include the purchase price, non – refundable taxes and delivery and handling costs. Cost of finished goods and work in-progress include all costs of purchases, direct materials, direct labour and appropriate proportion of variable and fixed overheads expenditure. Cost of inventories also include all other costs incurred in bringing the inventories to their present location and condition. The net realisable value is the estimated selling price in the ordinary course of business less the estimated costs of completion and estimated costs necessary to make the sale.
(k) Investments and other financial assets:(i) Classification The Company classifies its financial assets in the following measurement categories:
or loss) and
The classification depends on the entity’s business model for managing the financial assets and the contractual terms of the cash flows.
For assets measured at fair value, gains and losses will either be recorded in profit or loss or other comprehensive income. For investments in equity instruments, this will depend on whether the Company has made an irrevocable election at the time of initial recognition to account for the equity investment at fair value through other comprehensive income.
(ii) Measurement At initial recognition, the Company measures financial assets at its fair value plus, in the case of financial assets not at
fair value through profit or loss, transaction costs that are directly attributable to the acquisition of the financial assets. Transaction costs of financial assets carried at fair value through profit or loss are expensed in the Statement of Profit or Loss.
Equity instruments The Company subsequently measures all equity investments at fair value. The Company’s management has elected
to present fair value gains and losses on equity investments in Other Comprehensive Income, there is no subsequent reclassification of fair value gains and losses to profit or loss. Dividend from such investments are recognised in the Statement of Profit and Loss as other income when the Company’s right to receive payments is established.
Changes in fair value of financial assets at fair value through profit or loss are recognized in other gain / (losses) in the statement of profit and loss. Impairment losses (and reversal of impairment losses), if any on equity investments measured at FVOCI are recognised in statement of profit and loss. Investment in subsidiary is carried at cost less impairment loss, if any.
Transition to Ind AS: On transition to Ind AS, the Company has elected to use the previous GAAP carrying amount of its investment in subsidiary on the date of transition as its deemed cost on that date.
(iii) Impairment of financial assets The Company assesses on a forward looking basis the expected credit losses associated with its assets carried at
amortised cost. The impairment methodology applied depends on whether there has been a significant increase in credit risk.

57
Annual Report 2017-2018
For trade receivables only, the Company applies the simplified approach permitted by Ind AS 109- ‘Financial Instruments’, which requires expected lifetime losses to be recognised from initial recognition of the receivables.
(iv) Derecognition of financial assets A financial asset is derecognised only when:
pay the cash flows to one or more recipients. Where the entity has transferred an asset, the Company evaluates whether it has transferred substantially all risks and
rewards of ownership of the financial asset. In such cases, the financial asset is derecognised. Where the entity has not transferred substantially all risks and rewards of ownership of the financial asset, the financial asset is not derecognised.
Where the entity has neither transferred a financial asset nor retains substantially all risks and rewards of ownership of the financial asset, the financial asset is derecognised if the Company has not retained control of the financial asset. Where the Company retains control of the financial asset, the asset is continued to be recognised to the extent of continuing involvement in the financial asset.
(l) Income recognition: Interest income Interest income from debt instruments is recognised using the effective interest rate method. The effective interest rate is the
rate that exactly discounts estimated future cash receipts through the expected life of the financial asset to the gross carrying amount of a financial asset. When calculating the effective interest rate, the Company estimates the expected cash flows by considering all the contractual terms of the financial instrument (for example prepayment, extension, call and similar options) but does not consider the expected credit losses.
Dividend Dividend are recognised in profit or loss only when the right to receive payment is established, it is probable that the
economic benefits associated with the dividend will flow to the Company, and the amount of the dividend can be measured reliably.
(m) Offsetting Financial Instruments: Financial assets and liabilities are offset and the net amount reported in the balance sheet when there is a legally enforceable
right to offset the recognised amounts and there is an intention to settle on a net basis or realise the asset and settle the liability simultaneously. The legally enforceable right must not be contingent on future events and must be enforceable in the normal course of business and in the event of default, insolvency or bankruptcy of the Company or the counterparty.
(n) Property, plant and equipment: Freehold land is carried at historical cost. All other items of property, plant and equipment are stated at historical cost less
depreciation and impairment, if any. Historical cost includes expenditure that is directly attributable to the acquisition of the items.
Subsequent costs are included in the asset’s carrying amount or recognised as a separate asset, as appropriate, only when it is probable that future economic benefits associated with the item will flow to the Company and the cost of the item can be measured reliably. The carrying amount of any component accounted for as a separate asset is derecognised when replaced. All other repairs and maintenance are charged to profit or loss during the reporting period in which they are incurred.
Transition to Ind AS: On transition to Ind AS, the Company has elected to continue with carrying value of all of its property, plant and equipment
recognized as at April 1, 2016 measured as per the provisions of previous GAAP and use that carrying value as demand cost of property, plant and equipment.
Depreciation methods, estimated useful lives and residual value: Depreciation is calculated using Straight Line Method (SLM) to allocate their cost, net of their residual values, over their
estimated useful lives prescribed in Schedule II to the Companies Act, 2013. An asset’s carrying amount is written down immediately to its recoverable amount if the asset’s carrying amount is greater
than its estimated recoverable amount. Gains and losses on disposals are determined by comparing proceeds with carrying amount. These are included in profit or
loss within other gains / (losses).(o) Trade and other payables: These amounts represent liabilities for goods and services provided to the Company prior to the end of financial year which
are unpaid. Trade and other payables are presented as current liabilities unless the payment is not due within 12 months of reporting period. Trade and other payables are initially recognized at fair value and subsequently measured at amortised cost using the effective interest method.

58
(p) Borrowings: Borrowings are initially recognised at fair value, net of transaction costs incurred. Borrowings are subsequently measured at
amortised cost. Any difference between the proceeds (net of transaction costs) and the redemption amount is recognised in profit or loss over the period of borrowings using the effective interest method.
Borrowings are removed from the Balance Sheet when the obligation specified in the contract is discharged, cancelled or expired. The difference between the carrying amount of a financial liability that has been extinguished or transferred to another party and the consideration paid, including any non-cash assets transferred or liabilities assumed, is recognised in profit or loss as other gains / (losses).
Borrowings are classified as current liabilities unless the Company has an unconditional right to defer settlement of the liability for at least 12 months after the reporting period.
(q) Borrowing costs: General and specific borrowing costs that are directly attributable to the acquisition, construction or production of a
qualifying asset are capitalised during the period of time that is required to complete and prepare the asset for its intended use or sale. Qualifying assets are assets that necessarily take a substantial period of time to get ready for their intended use or sale. Other borrowing costs are expensed in the period in which they are incurred.
(r) Provisions and Contingent Liabilities : Provisions Provisions are recognised when the Company has a present legal or constructive obligation as a result of past events; it is
probable that an outflow of resources will be required to settle the obligation; and the amount has been reliably estimated. Provisions are measured at the present value of management’s best estimate of the expenditure required to settle the
present obligation at the end of the reporting period. The discount rate used to determine the present value is a pre-tax rate that reflects current market assessments of the time value of money and the risks specific to the liability. The increase in the provision due to the passage of time is recognised as interest expense.
Contingent liabilities Contingent liabilities are disclosed when there is a possible obligation arising from past events, the existence of which will be
confirmed only by the occurrence or non-occurrence of one or more uncertain future events not wholly within the control of the Company. A present obligation that arises from past events where it is either not probable that an outflow of resources will be required to settle or reliable estimate of the amount cannot be made, is termed as contingent liability.
(s) Employee benefits:(i) Short-term obligations Liabilities for wages and salaries, including non-monetary benefits that are expected to be settled wholly within 12
months after the end of the period in which the employees render the related service are recognised in respect of employees’ services up to the end of the reporting period and are measured at the amounts expected to be paid when the liabilities are settled. The liabilities are presented as current employee benefit obligations in the balance sheet.
(ii) Post employee obligations The Company operates the following post-employment schemes: - defined benefit plans such as gratuity, pension and provident fund contributions made to a trust in case of certain
employees - defined contribution plans such as provident fund and superannuation fund. Pension and gratuity obligations
The liability or asset recognised in the balance sheet in respect of defined benefit pension and gratuity plans is the present value of the defined benefit obligation at the end of the reporting period less the fair value of plan assets. The defined benefit obligation is calculated annually by actuaries using the projected unit credit method.
The present value of the defined benefit obligation is determined by discounting the estimated future cash outflows by reference to market yields at the end of the reporting period on government bonds that have terms approximating to the terms of the related obligation.
The net interest cost is calculated by applying the discount rate to the net balance of the defined benefit obligation and the fair value of plan assets. This cost is included in employee benefit expense in the Statement of Profit and Loss.
Remeasurement gains and losses arising from experience adjustments and changes in actuarial assumptions are recognised in the period in which they occur, directly in Other Comprehensive Income. They are included in Retained Earnings in the Statement of Changes in Equity and in the Balance Sheet.
Changes in the present value of the defined benefit obligation resulting from plan amendments or curtailments are recognised immediately in profit or loss as past service cost.
Provident fund contributions made to a trust administered by the Company In respect of certain employees, provident fund contributions are made to a trust administered by the Company. The
interest rate payable to the members of the trust shall not be lower than the statutory rate of interest declared by the

59
Annual Report 2017-2018
Central Government under the Employees Provident Funds and Miscellaneous Provisions Act, 1952 and shortfall, if any, shall be made good by the Company. The liability in respect of the shortfall of the interest earnings of the fund is determined on the basis of actuarial valuation.
Defined contribution plans The Company pays provident fund contributions to publicly administered provident funds as per local regulations and
superannuation contributions to superannuation fund. The Company has no further payment obligations once the contributions have been paid. The contributions are accounted for as defined contribution plans and the contributions are recognised as employee benefit expense when they are due. Further the obligations liability or asset recognised in the balance sheet in respect of defined benefit pension and gratuity plans is the present value of the defined benefit obligation at the end of the reporting period less the fair value of plan assets. The defined benefit obligation is calculated annually by actuaries using the projected unit credit method.
(iii) Other long-term employee benefit obligations The liabilities for earned leave and sick leave are not expected to be settled wholly within 12 months after the end
of the period in which the employees render the related service. They are therefore measured as the present value of expected future payments to be made in respect of services provided by employees up to the end of the reporting period using the projected unit credit method. The benefits are discounted using the market yields at the end of the reporting period that have terms approximating to the terms of the related obligation. Remeasurements as a result of experience adjustments and changes in actuarial assumptions are recognised in Statement of Profit or Loss.
The obligations are presented as current liabilities in the balance sheet if the entity does not have an unconditional right to defer settlement for at least twelve months after the reporting period, regardless of when the actual settlement is expected to occur.
(t) Contributed equity: Equity shares are classified as equity. Incremental costs directly attributable to the issue of new shares or options are shown in equity as a deduction, net of tax
from the proceeds.(u) Dividend: Provision is made for the amount of any dividend declared, being appropriately authorised and no longer at the discretion
of the entity, on or before the end of the reporting period but not distributed at the end of the reporting period.(v) Earnings per share: Basic earnings per share Basic earnings per share is calculated by dividing:. - the profit attributable to owners of the Company - by the weighted average number of equity shares outstanding during the financial year. Diluted earnings per share Diluted earnings per share adjusts the figures used in the determination of basic earnings per share to take into account: - the after income tax effect of interest and other financing costs associated with dilutive potential equity shares, and - the weighted average number of additional equity shares that would have been outstanding assuming the conversion of
all dilutive potential equity shares.(w) Rounding of Amounts: All amounts disclosed in financial statements and notes have been rounded off to the nearest lakhs as per the requirement
of Schedule III, unless otherwise stated.2.2 Critical accounting estimates and judgements: The preparation of financial statements requires the use of accounting estimates which, by definition, will seldom equal the
actual results. Management also needs to exercise judgement in applying the group’s accounting policies. This note provides an overview of the areas that involved a higher degree of judgement or complexity, and of items which
are more likely to be materially adjusted due to estimates and assumptions turning out to be different than those originally assessed. Detailed information about each of these estimates and judgements is included in relevant notes with information about the basis of calculation for each affected line item in the financial statements.
The areas involving critical estimates or judgements are:

60
Notes to the Financial Statements for the Year ended March 31, 2018 Note 3 : Property, plant and equipment
Rup` in Lakhs
Freehold land
Freehold Building
Plant and equipment
Furniture and fixtures
Office equipment Vehicles Total
Year ended March 31, 2017
Gross carrying amount Deemed cost as at April 1, 2016 5.89 337.53 17,562.75 52.52 8.20 - 17,966.89 Additions - - 767.08 - 7.09 - 774.17 Disposals - - - - (0.50) - (0.50)Balance as at March 31, 2017 5.89 337.53 18,329.83 52.52 14.79 - 18,740.56
Accumulated depreciationDepreciation charge during the year - 41.19 841.52 6.09 3.93 - 892.73 On disposal - - - - (0.24) - (0.24)Balance as at March 31, 2017 - 41.19 841.52 6.09 3.69 - 892.49 Net carrying amount as on March 31, 2017 5.89 296.34 17,488.31 46.43 11.10 - 17,848.07
Year ended March 31, 2018
Gross carrying amount Opening Gross carrying amount 5.89 337.53 18,329.83 52.52 14.79 - 18,740.56 Additions - - 20.91 0.11 29.73 29.61 80.36 Disposals - - (48.22) - - - (48.22)Balance as at March 31, 2018 5.89 337.53 18,302.52 52.63 44.52 29.61 18,772.70 Accumulated depreciationBalance as at April 1, 2017 - 41.19 841.52 6.09 3.69 - 892.49 Depreciation charge during the year - 38.89 866.17 6.20 7.53 0.37 919.16 On disposal - - (4.20) - - - (4.20)Balance as at March 31, 2018 - 80.08 1,703.49 12.29 11.22 0.37 1,807.45
Net carrying amount 5.89 257.45 16,599.03 40.34 33.30 29.24 16,965.25
i) The Company has availed the deemed cost exemption in relation to the Property, plant and equipment on the date of transition and hence the net block carrying amount has been considered as the gross block carrying on that date. Refer below for the gross block value and the accumulated depreciation on April 1, 2016 under the previous GAAP.
Property, plant and equipment Gross Block Accumulated Depreciation Net Block
Freehold land 5.89 - 5.89
Freehold Building 725.89 388.36 337.53
Plant and equipment 31,349.09 13,786.34 17,562.75
Furniture and fixtures 130.15 77.63 52.52
Office equipment 71.97 63.77 8.20
Vehicles - - -
Total 32,282.99 14,316.10 17,966.89
ii) Refer note 39 for disclosure of contratual commitment for acquisition of Property, plant and equipment

61
Annual Report 2017-2018
Notes to the Financial Statements for the Year ended March 31, 2018 (Contd.)` in Lakhs
As at March 31, 2018
As at March 31, 2017
As at April 1, 2016
Note 4: Non-current financial assets - InvestmentsInvestments in equity instruments (fully paid up)Investments in subsidiary (unquoted Investments - cost)25,500 (March 31, 2017: 25,500, April 1, 2016: 25,500) equity shares of Naperol Investments Limited of ` 100 each 25.50 25.50 25.50
Others (Quoted Investments) - FVOCI
1,489,700 (March 31, 2017: 1,489,700, April 1, 2016: 1,489,700) equity shares of The Bombay Dyeing & Manufacturing Company Limited of ` 2 each
3,561.13 1,236.45 709.10
1,252,200 (March 31, 2017: 1,252,200, April 1, 2016: 1,252,200) equity shares of The Bombay Burmah Trading Corporation Limited of ` 2 each
14,660.76 10,685.64 4,593.06
600 (March 31, 2017: 600, April 1, 2016: 600) equity shares of Housing Development Finance Corporation Limited of ` 2 each 10.95 9.01 6.64
2,500 (March 31, 2017: 2,500, April 1, 2016: 2,500) equity shares of HDFC Bank Limited of ` 2 each 47.15 36.06 26.78
Total 18,305.49 11,992.66 5,361.08 Aggregate amount of quoted investments 18,279.99 11,967.16 5,335.58 Aggregate market value of quoted investments 18,279.99 11,967.16 5,335.58 Aggregate amount of unquoted investments 25.50 25.50 25.50 Aggregate amount of impairment in the value of investments - - -
Note 5: Non-current financial assets - Loans (Unsecured, considered good)Security Deposits 40.35 40.90 242.48 Total 40.35 40.90 242.48
` in LakhsYear ended
March 31, 2018Year ended
March 31, 2017Note 6 : Income tax expenseThe major components of income tax expense for the years ended March 31, 2018 and March 31, 2017 are as under:
(a) Income tax recognised in statement of profit and lossIncome tax expense
(i) Current tax expense 4,212.71 1,468.46 Total current tax expense 4,212.71 1,468.46
(ii) Deferred tax expenseDecrease / (increase) in deferred tax assets 689.88 246.95
(Decrease) / increase in deferred tax liabilities 208.35 200.80 Total deferred tax expense 898.23 447.75
Total Income tax expense 5,110.94 1,916.21 (b) Income tax recognised in other comprehensive income(i) Current tax benefit
Remeasurement of defined benefit obligation 0.98 (17.10)Total current tax benefit 0.98 (17.10)

62
Notes to the Financial Statements for the Year ended March 31, 2018 (Contd.)` in Lakhs
Income tax expense Year ended March 31, 2018
Year ended March 31, 2017
(ii) Deferred tax expenseRemeasurement of defined benefit obligation (6.55) 2.34 Financial asset measured at FVOCI (18.91) -
Total deferred tax expense (25.46) 2.34
Total Income tax expense (24.48) (14.76)
(c) Reconciliation of effective tax rate: Profit before tax 14,622.61 5,704.47 Tax at the Indian tax rate of 34.61% 5,060.59 1,974.20 Tax effect of amounts which are not deductible / (taxable) in calculating taxable income:
Expenses that are not deductible in determining taxable profit 14.78 17.65 Income exempt from income tax (35.57) (42.05)Change in income tax rates 32.25 - Others 38.89 (33.59)
Income tax expense 5,110.94 1,916.21
(d) Tax assets As atMarch 31, 2018
As at March 31, 2017
Opening balance 142.25 254.55 Add: Taxes paid 4,010.39 1,373.26 Less: Current tax payable for the year 4,211.73 1,485.56 Closing balance (59.09) 142.25
Current tax assets 297.92 272.70 Current tax liabilities (357.01) (130.45)
(e) Significant estimatesIn calculating the tax expense for the current year, the Company has treated certain expenditures as being deductible for tax purposes. Also refer note 32.
` in Lakhs
(f) Movement in deferred tax liabilitiesAs at
March 31, 2018As at
March 31, 2017As at
April 1, 2016
Deferred tax liabilities 3,526.96 3,299.70 3,098.90 Less: Deferred tax assets 151.69 848.12 1,092.72 Deferred tax liability (net) 3,375.27 2,451.58 2,006.18
Movement of deferred tax balances
` in Lakhs
March 31, 2018 Net balance April 1, 2017
Recognised in profit and loss
Recognised in OCI
Net deferred tax liabilities
Property, plant and equipment 3,294.08 169.77 - 3,463.85 Financial asset measured at FVTPL 5.38 38.82 - 44.20 Financial asset measured at FVOCI - - 18.91 18.91 Measurement of borrowings at amortised cost 0.24 (0.24) - -
Total deferred tax liabilities 3,299.70 208.35 18.91 3,526.96
Provision for post retirement benefits and other employee benefits 153.01 (8.10) (6.55) 138.36
Provision for doubtful debts - 13.33 - 13.33 Other provisions 38.89 (38.89) - - Loss on account of embezzlement of funds 656.22 (656.22) - -
Total deferred tax assets 848.12 (689.88) (6.55) 151.69
Deferred tax liability (net) 2,451.58 898.23 25.46 3,375.27

63
Annual Report 2017-2018
Notes to the Financial Statements for the Year ended March 31, 2018 (Contd.)Movement of deferred tax balances ` in Lakhs
March 31, 2017 Net balance April 1, 2016
Recognised in profit and loss
Recognised in OCI
Net deferred tax liabilities
Property, plant and equipment 3,095.94 198.14 - 3,294.08 Financial asset measured at FVTPL 0.11 5.27 - 5.38 Financial asset measured at FVOCI - - - - Measurement of borrowings at amortised cost 2.85 (2.61) - 0.24 Total deferred tax liabilities 3,098.90 200.80 - 3,299.70 Provision for post retirement benefits and other employee benefits 114.89 35.78 2.34 153.01
Provision for doubtful debts 34.86 (34.86) - - Other provisions - 38.89 - 38.89 Loss on account of embezzlement of funds 374.17 282.04 - 656.22 MAT credit entitlement 568.80 (568.80) - - Total deferred tax assets 1,092.72 (246.95) 2.34 848.12
Net deferred tax liability (net) 2,006.18 447.75 (2.34) 2,451.58
` in LakhsAs at
March 31, 2018As at
March 31, 2017As at
April 1, 2016Note 7: Other non-current assets(Unsecured, considered good)Balances with government authorities 674.04 762.30 703.73 Prepayments 6.37 14.07 15.19 Capital Advances 636.26 - 1.44 Total 1,316.67 776.37 720.36
Note 8: InventoriesRaw materials 387.19 387.53 280.13 Finished goods 399.37 67.97 578.78 Stores and spares and packing materials 686.14 655.22 552.14 Total 1,472.70 1,110.72 1,411.05
Note 9: Current financial assets - InvestmentsInvestments in Mutual Funds (Unquoted Investments - FVTPL)
Nil (March 31, 2017: 10,073,425.22, April 1, 2016: Nil) units of Kotak Treasury Advantage Fund - Direct Plan - Daily Dividend of ` 10 each - 1,015.45 -
Nil (March 31, 2017: 122,656.85, April 1, 2016: Nil) units of SBI Premier Liquid Fund - Regular Plan - Daily Dividend of ` 1,000 each - 1,230.55 -
22,751,160.73 (March 31, 2017: 8,105,559.00, April 1, 2016: 5,768,071.46) units of JM Money Manager Fund - Super Plus Plan (Direct) - Daily Dividend (479) of ` 10 each
2,300.92 819.30 578.75
7,521,691.33 (March 31, 2017: 3,649,700.88, April 1, 2016: Nil) units of HDFC Floating Rate Income Fund - Short Term Plan - Wholesale Option - Growth of ` 10 each
2,285.26 1,035.04 -
711,987.35 (March 31, 2017: 289,221.35, April 1, 2016: Nil) units of Aditya Birla Sunlife Saving Fund - Growth - Direct Plan of ` 100 each 2,451.03 925.83 -
Total 7,037.21 5,026.17 578.75 Aggregate amount of quoted investments - - - Aggregate market value of quoted investments - - - Aggregate amount of unquoted investments 7,037.21 5,026.17 578.75 Aggregate amount of impairment in the value of investments - - -

64
Notes to the Financial Statements for the Year ended March 31, 2018 (Contd.)` in Lakhs
As at March 31, 2018
As at March 31, 2017
As at April 1, 2016
Note 10: Trade receivablesUnsecured, considered good 5,325.04 3,316.78 3,266.01 Doubtful 38.15 - 100.73 Less: Allowance for doubtful debts (38.15) - (100.73)Total 5,325.04 3,316.78 3,266.01
Note 11: Cash and cash equivalentsCash on hand 2.01 2.46 1.26 Balances with banks in current account 315.52 1.92 31.64 Total 317.53 4.38 32.90
Note 12: Bank balances other than cash and cash equivalentsUnpaid dividend accounts 49.23 38.40 38.53 Total 49.23 38.40 38.53
Note 13: Current financial assets - Loans (Unsecured, considered good)Security deposits 24.34 28.62 31.91 Intercorporate deposits to related party (Refer note 41)# 6,500.00 3,000.00 3,000.00 Intercorporate deposits to other companies - 1,400.00 Total 6,524.34 3,028.62 4,431.91 #[The Company has, during the year, given Intercorporate Deposit (ICD) for general business purposes to Nowrosjee Wadia and Sons Ltd. `3,000 Lakhs (Previous year Nil) and Wadia Techno - Engineering Services Ltd. ` 500 Lakhs ( Previous Year Nil). The interest rate of the said ICDs is 12.50% p.a. and these are repayable on demand.]
Note 14: Other financial assets (Unsecured, considered good)Interest accrued but not due on deposits 41.61 37.43 16.21 Other receivables 0.02 56.26 - Total 41.63 93.69 16.21
Note 15: Other current assets (Unsecured, considered good)Advance to gratuity fund 7.42 - 21.86 Advances for expenses 42.15 61.87 31.47 Balances with government authorities 49.81 91.02 280.92 Prepayments 64.95 66.64 51.69 Advances to suppliers 32.43 49.18 31.89 Advance to employees - 0.50 0.25 Total 196.76 269.21 418.08
Note 16: Equity share capitalAuthorised25,000,000 (March 31, 2017: 25,000,000, April 1, 2016: 25,000,000) Equity shares of ` 10 each 2,500.00 2,500.00 2,500.00
Issued, subscribed and fully paid5,747,000 (March 31, 2017: 5,747,000, April 1, 2016: 5,747,000) Equity shares of ` 10 each 574.70 574.70 574.70
Total 574.70 574.70 574.70

65
Annual Report 2017-2018
Notes to the Financial Statements for the Year ended March 31, 2018 (Contd.)` in Lakhs
As at March 31, 2018 As at March 31, 2017 As at April 1, 2016
Reconciliation of the number of shares Number of shares Amount Number of
shares Amount Number of shares Amount
Balance at the beginning of the year 5,747,000 574.70 5,747,000 574.70 5,747,000 574.70
Issued during the year - - - - - -
Balance at the end of the year 5,747,000 574.70 5,747,000 574.70 5,747,000 574.70
Rights, preferences and restrictions attached to equity sharesThe Company has one class of equity share having a par value of ` 10 per share. Each shareholder is eligible for one vote per share held. The dividend proposed by the Board of Directors is subject to the approval of the shareholders in the ensuing annual general meeting, except in case of interim dividend.
In the event of liquidation of the Company, the equity shareholders are eligible to receive the remaining assets of the Company, after distribution of all preferential amounts, in proportion to their shareholdings.
Details of shares held by the holding company, ultimate holding company and subsidiary of holding company:
As at March 31, 2018 As at March 31, 2017 As at April 1, 2016
Name of shareholder Number of shares % Number
of shares % Number of shares %
Ben Nevis Investments Limited, British Virgin Island, ultimate holding company
51,500 0.90 - - - -
Nowrosjee Wadia and Sons Limited, holding company 1,769,125 30.78 - - - - Macrofil Investments Limited, subsidiary of holding company 1,918,109 33.38 - - - -
Details of shareholders holding more than 5% shares in the Company:
As at March 31, 2018 As at March 31, 2017 As at April 1, 2016
Name of shareholder Number of shares % Number
of shares % Number of shares %
Nowrosjee Wadia and Sons Limited 1,769,125 30.78 1,653,325 28.77 - - Macrofil Investments Limited 1,918,109 33.38 1,918,109 33.38 1,908,668 33.21Solvay S A, Belgium - - - - 1,442,500 25.10
Pursuant to the scheme of arrangement sanctioned by National Company Law Tribunal vide its order dated June 22, 2017, and filed with the Registrar of Companies on August 2, 2017, N.W. Exports Limited and Sunflower Investments and Textiles Limited, both having investment in Macrofil Investments Limited, has been amalgamated into Nowrosjee Wadia and Sons Limited ("NWS"). Post merger, NWS became the holding company of Macrofil Investments Limited which holds 33.38% shareholding in the Company. Accordingly, NWS became the holding Company of the Company and Ben Nevis Investments Limited became the ultimate holding company of the Company.
` in Lakhs
As at March 31, 2018
As at March 31, 2017
As at April 1, 2016
Note 17: Other equityGeneral reserve 3,284.50 3,284.50 3,284.50 Retained earnings 28,866.38 21,696.12 18,571.67 FVOCI - Equity instruments 18,159.25 11,865.35 5,233.75 Total 50,310.13 36,845.97 27,089.92

66
Notes to the Financial Statements for the Year ended March 31, 2018 (Contd.)
Nature and purpose of reservesGeneral reserve The Company has transferred a portion of the net profit of the Company before declaring dividend to general reserve pursuant to the earlier provisions of the Companies Act, 1956. Mandatory transfer to general reserve is not required under the Companies Act, 2013.
Retained earningsRetained earnings are the profits that the Company has earned till date, less any transfers to general reserve, dividends or other distributions paid to shareholders. Further, it also includes the impact of remeasurements of the defined benefit obligations, net of tax.
FVOCI - Equity instruments The Company has elected to recognise changes in the fair value of certain investments in equity securities in other comprehensive income. These changes are accumulated within the FVOCI equity investments reserves within equity. The Company transfers amounts from this reserve to retained earnings when the relevant equity securities are derecognised.
` in LakhsNote 18: Non-current financial liabilities - Borrowings As at
March 31, 2018As at
March 31, 2017As at
April 1,2016SecuredTerm loan from Bank - - 999.30 Total - - 999.30
Terms of repaymentRepayable in 10 quarterly instalments of ` 500 lakhs beginning from April 15, 2015 and carrying an interest rate of 10.25% per annum payable on monthly basis. The current maturity amount as at March 31, 2018 is ` NIL (March 31, 2017 `1,000 lakhs and April 1, 2016 ` 3,000 lakhs) of the loan has been shown under note 22 - Other current financial liabilities.
Nature of securitySecured by a first charge by way of Hypothecation of plant and machinery and other movables and second charge on industrial land at Kalyan and building thereon by way of mortgage.
` in Lakhs
Net debt reconciliation As at March 31, 2018
As at March 31, 2017
Non-current borrowings - - Current borrowings - 1,104.63
Non-current borrowings
Current borrowings Total
Net debt as at April 1, 2017 999.30 105.33 1,104.63 Cash flow (1,000.00) (105.33) (1,105.33)Interest accrued 0.29 - 0.29 Interest expenses 17.27 0.30 17.57 Interest paid (16.86) (0.30) (17.16)Net debt as at March 31, 2018 - - -
` in Lakhs
Note 19: Non-current - Provisions As at March 31, 2018
As at March 31, 2017
As at April 1, 2016
For employee benefits (Refer note 40)Leave encashment and compensated absence 199.16 207.69 137.90 Pension 55.63 71.33 61.14 Total 254.79 279.02 199.04
Note 20: Current financial liabilities - BorrowingsSecuredCash credit 105.33 33.10 Total - 105.33 33.10

67
Annual Report 2017-2018
Terms of repaymentRepayable on demand.
Nature of securityi) Primary Security:
First pari passu charge by way of hypothecation over the Company's entire stocks of inventory and receivables along with other working capital banks under consortium.
ii) CollateralSecond pari passu charge on the entire fixed assets of the Company including land located at NRC Road, P.O. Atali, via Mohone, Kalyan, Dist. Thane.
` in LakhsNote 21: Trade payables As at
March 31, 2018As at
March 31, 2017As at
April 1, 2016Dues to micro and small enterprises - 0.06 0.06
Dues to others 2,026.17 1,922.91 1,632.34
Total 2,026.17 1,922.97 1,632.40
Disclosure of amounts payable to vendors as defined under the “Micro, Small and Medium Enterprise Development Act, 2006” is based on the information available with the Company regarding the status of registration of such vendors under the said Act. There are no overdue principal amounts / interest payable amounts for delayed payments to such vendors at the Balance Sheet date. There are no delays in payment made to such suppliers during the year or for any earlier years and accordingly, there is no interest paid or outstanding interest in this regard in respect of payments made during the year or brought forward from previous years.
Note 22: Other current financial liabilities
Current maturities of long term borrowings - 999.30 1,992.46
Interest accrued but not due on borrowings - 0.29 0.84
Deposits received from customers 2.70 2.70 2.70
Capital creditors 17.30 - 24.27
Interest accrued on others - 25.00 15.00
Unpaid dividend 49.23 38.40 38.53
Total 69.23 1,065.69 2,073.80
Note 23: Other current liabilities
Advances received from customers 3.96 3.12 5.43 Statutory dues (including provident fund, tax deducted at source and others) 693.67 48.88 38.44
Payable to employees 571.37 321.19 179.73
Total 1,269.00 373.19 223.60
Note 24: Current - Provisions
For employee benefits (Refer note 40)
Gratuity 76.65 74.89 82.75
Leave encashment and compensated absence 130.41 153.71 119.58
Pension 10.74 9.36 13.32
Total 217.80 237.96 215.65
Notes to the Financial Statements for the Year ended March 31, 2018 (Contd.)

68
Notes to the Financial Statements for the Year ended March 31, 2018 (Contd.)
` in LakhsYear ended
March 31, 2018Year ended
March 31, 2017Note 25: Revenue from operationsSale of goods (including excise duty) 31,032.33 26,143.87 Other operating revenues
Scrap sales 10.67 13.66
Total 31,043.00 26,157.53
Note 26: Other incomeInterest income on financial assets at amortised cost
Interest income on inter-corporate deposits 703.77 459.74 Other interest income 9.13 8.79
Dividend income from equity investments designated at FVOCI (Refer below) 23.34 20.31 Dividend income from other investments measured at FVTPL 79.45 101.18 Fair value gain on investments measured at FVTPL 110.94 15.25 Gain on sale of investments 65.67 6.08 Net gain on disposal of Property, plant and equipment - 0.16 Net foreign exchange gain 15.42 7.16 Other miscellaneous income 5.97 - Total 1,013.69 618.67
All dividends from equity investments designated at FVOCI relate to investments held at the end of the reporting period. There was no dividend income relating to investments derecognised during the reporting period.
Note 27: Cost of materials consumedOpening balance of raw materials 387.53 280.13 Add: Purchases made during the year 6,858.06 5,716.65 Less: Closing balance of raw materials (387.19) (387.53)Total 6,858.40 5,609.25
Note 28: Changes in inventories of finished goodsHydrogen peroxide
Opening balance 67.97 578.78 Closing balance (399.37) (67.97)
Total (331.40) 510.81
Note 29: Employee benefit expensesSalaries, wages and bonus 1,775.65 1,808.33 Contribution to provident fund, gratuity, pension and other funds (Refer note 40) 231.54 262.86 Workmen and staff welfare expenses 247.91 277.31 Total 2,255.10 2,348.50
Note 30: Finance costsInterest expenses on financial liability not at FVTPL 16.86 186.79
Other interest expense 33.03 26.71
Unwinding of interest on financial liability measured at amortised cost 0.70 7.54 Total 50.59 221.04

69
Annual Report 2017-2018
Notes to the Financial Statements for the Year ended March 31, 2018 (Contd.)
` in LakhsYear ended
March 31, 2018Year ended
March 31, 2017Note 31 : Other expensesConsumption of stores and spares 408.43 669.81 Repairs and maintenance
Plant and machinery 502.31 704.80 Buildings 2.62 4.29
Power, fuel and water 2,711.74 3,020.10 Rent 54.31 44.92 Rates and taxes 35.51 37.11 Legal and professional fees 293.32 332.20 Excise duty (10.55) (66.30)Insurance 61.39 40.45 Commission expenses 4.65 9.35 Packing and container expenses 1,704.02 1,962.34 Payment to auditors
Statutory audit fees 32.75 10.05 Others 4.50 8.54 Reimbursement of out of pocket expenses 0.09 -
Allowance for doubtful debts 38.15 - Corporate social responsibility expenditure (Refer below) 80.00 74.05 Commission to non executive Directors 149.00 55.15 Directors sitting fees 18.01 16.27 Miscellaneous expenses 840.10 870.33 Net loss on disposal of Property, plant and equipment 2.63 - Total 6,932.98 7,793.46
Expenditure on corporate social responsibility:
Contribution to Sir Ness Wadia Foundation(i) Contribution to Nowrosjee Wadia Maternity Hospital* 72.00 66.64 (ii) Contribution to Patil Bal Mandir School, Kalyan, Maharashtra 8.00 7.41 Total 80.00 74.05
Amount required to be spent as per section 135 of the Act 79.85 74.05Amount spent during the year on:(i) Construction / Acquisition of an asset 8.00 7.41 (ii) On purposes other than (i) above 72.00 66.64
Total 80.00 74.05
*Amount has been spent directly by contribution to Nowrosjee Wadia Maternity Hospital in the previous year.
Note 32: Exceptional itemsRefund received from Maharashtra State Electricity Distribution Company Limited towards tariff difference between continuous supply and non-continuous supply (105.92) (414.19)
Provision for expected loss on reduction in net realisable value of Capital work-in-progress - 20.86
Loss on account of embezzlement of funds (Refer note below) - 1,162.27
Total (105.92) 768.94

70
Notes to the Financial Statements for the Year ended March 31, 2018 (Contd.)
(i) Embezzlement of funds of the Company 1. During the current financial year, the Company’s management has identified instances of embezzlement of its funds by certain employees of the Company, including senior management employees, whose services have since been terminated. Based on the management’s scrutiny and the forensic investigation report, the amount of the embezzlement is `3,702.98 lakhs. The Company has initiated criminal proceedings against these employees including filing of FIR and application for other appropriate action with the Joint Commissioner of Police, Economic Offences Wing. Pending the recovery procedures, the financial statements have been adjusted to give effect to the above embezzlement. The total amount of such embezzlement is ` 3,702.98 lakhs, pertaining entirely to the period upto March 31, 2017. Of these, `1,459.54 lakhs were accounted as cost of materials consumed and other expenses prior to the Ind AS transition date of April 1, 2016 and ` 347.32 lakhs, during the previous financial year ended March 31, 2017. The balance amount of ` 1,896.12 lakhs, which were shown as recoverable under the head “Balance with Excise, Customs, Sales Tax etc.” has now been debited to equity for `1,081.17 lakhs as on the Ind AS transition date of April 1, 2016 and to Exceptional Items “Loss on account of embezzlement of funds” for `814.95 lakhs during the previous financial year ended March 31, 2017. The net impact after considering the tax effect of the above adjustments now effected is `706.99 lakhs as at the Ind AS transition date of April 1, 2016 and `532.92 lakhs in the previous financial year ended March 31, 2017. Further the Company has reclassified `347.32 lakhs charged to the Statement of Profit and Loss during the previous financial year ended March 31, 2017 as exceptional items, “Loss on account of Embezzlement of funds”.
2. The Board has appointed Mr. Suresh Khurana as CEO and Director of the Company and Mr. S. Raja as Vice President - Commercial and Finance of the Company on December 15, 2017, immediately on termination of the earlier senior management team. The Board also appointed new internal auditors. The new Management, from January 2018, commenced by focusing on addressing gaps in entity level controls; identifying mitigating compensating controls for system gaps, revisiting the Chart of Authority, reviewing all the identified gaps in business processes, instituting new / compensating controls and maker checker controls more specifically in areas like review and approval of bank payments, journal entries, cost of goods sold ledger, reconciliation of direct and indirect taxes, re-performance of inventory valuation etc., and ensured design of controls was in place and gaps were remediated as at the beginning of January 2018. The new Management, assisted by the internal auditors subsequently tested all the controls for adequacy and operating effectiveness as on March 31, 2018.
3. Additionally, the new management has re-performed several procedures viz., reviewing sales and purchase price, analyzing customer / vendor wise sales / purchase price, reviewing scrap sales, reviewing key contracts entered into etc., to ensure that there were no transactions / account balances during the year ended and as at March 31, 2018 that were impacted by the embezzlement.
Note 33 : Fair Value Measurement
(a) Financial Instruments by Category` in Lakhs
ParticularsAs at March 31, 2018 As at March 31, 2017 As at April 1, 2016
FVTPL FVOCI# Amortisedcost FVTPL FVOCI# Amortised
cost FVTPL FVOCI# Amortised cost
Financial assets
Investment
-Equity instruments - 18,279.99 - - 11,967.16 - - 5,335.58 -
-Mutual funds 7,037.21 - - 5,026.17 - - 578.75 - -
Trade receivables - - 5,325.04 - - 3,316.78 - - 3,266.01
Cash and cash equivalents - - 317.53 - - 4.38 - - 32.90
Bank balances other than cash and cash equivalents - - 49.23 - - 38.40 - - 38.53
Security deposits - - 64.69 - - 69.52 - - 274.39
Inter corporate deposits## - - 6,541.61 - - 3,037.43 - - 4,416.21
Other financial assets - - 0.02 - - 56.26 - - -
Total financial assets 7,037.21 18,279.99 12,298.12 5,026.17 11,967.16 6,522.77 578.75 5,335.58 8,028.04
Financial liabilitiesBorrowing - - - - - 1,104.92 - - 3,025.70
Trade payable - - 2,026.17 - - 1,922.97 - - 1,632.40
Other financial liabilities - - 69.23 - - 66.10 - - 80.50
Total financial liabilities - - 2,095.40 - - 3,093.99 - - 4,738.60

71
Annual Report 2017-2018
Notes to the Financial Statements for the Year ended March 31, 2018 (Contd.)
# These are investment in equity securities which are not held for trading, and for which the Company has made an irrevocable election at initial recognition to recognise changes in fair value through other comprehensive income rather than profit or loss as these are strategic investments and the Company considered this to be more relevant.
## Inter corporate deposits include interest accrued till the year end, whereas the same has been classified under other financial assets in the financial statements.
(b) Fair value hierarchy This section explains the judgments and estimates made in determining the fair values of the financial instruments that are (a) recognised and measured at fair value and (b) measured at amortised cost and for which fair values are disclosed in the financial statements. To provide an indication about the reliability of the inputs used in determining fair value, the Company has classified its financial instruments into the three levels prescribed under the accounting standard. An explanation of each level follows underneath the table.
` in LakhsFinancial assets and liabilities measured at fair value - recurring fair value measurements as at March 31, 2018 Level 1 Level 2 Level 3 Total
Financial assetsInvestment in equity instruments (at FVOCI) 18,279.99 - - 18,279.99 Investment in mutual funds (at FVTPL) 7,037.21 - - 7,037.21 Total financial assets 25,317.20 - - 25,317.20
Assets and liabilities which are measured at amortised cost for which fair values are disclosed as at March 31, 2018 Level 1 Level 2 Level 3 Total
Financial assetsSecurity deposits - - 40.35 40.35
Total financial assets - - 40.35 40.35
Financial liabilities - - - - Total financial liabilities - - - -
Financial assets and liabilities measured at fair value - recurring fair value measurements as at March 31, 2017 Level 1 Level 2 Level 3 Total
Financial assetsInvestment in equity instruments (at FVOCI) 11,967.16 - - 11,967.16 Investment in mutual funds (at FVTPL) 5,026.17 - - 5,026.17
Total financial assets 16,993.33 - - 16,993.33
Assets and liabilities which are measured at amortised cost for which fair values are disclosed as at March 31, 2017 Level 1 Level 2 Level 3 Total
Financial assetsSecurity deposits - - 40.90 40.90 Total financial assets - - 40.90 40.90
Financial liabilities - - - - Total financial liabilities - - - -
Financial assets and liabilities measured at fair value - recurring fair value measurements as at April 1, 2016 Level 1 Level 2 Level 3 Total
Financial assetsInvestment in equity instruments (at FVOCI) 5,335.58 - - 5,335.58 Investment in mutual funds (at FVTPL) 578.75 - - 578.75 Total financial assets 5,914.33 - - 5,914.33
Assets and liabilities which are measured at amortised cost for which fair values are disclosed as at April 1, 2016 Level 1 Level 2 Level 3 Total
Financial assetsSecurity deposits - - 242.48 242.48 Total financial assets - - 242.48 242.48
Financial liabilities
Borrowing - - 999.30 999.30 Total financial liabilities - - 999.30 999.30

72
Notes to the Financial Statements for the Year ended March 31, 2018 (Contd.)
Note: Level 1: Level 1 hierarchy includes financial instruments measured using quoted prices.
Level 2: The fair value of financial instruments that are not traded in an active market is determined using valuation techniques which maximise the use of observable market data and rely as little as possible on entity-specific estimates. If all significant inputs required to fair value an instrument are observable, the instrument is included in level 2.
Level 3: If one or more of the significant inputs is not based on observable market data, the instrument is included in level 3.
There are no transfers between any levels during the year.
(c) Fair value of financial assets and liabilities measured at amortised cost
` in LakhsAs at March 31, 2018 As at March 31, 2017 As at April 1, 2016
Carrying amount Fair value Carrying
amount Fair value Carrying amount Fair value
Financial assetsSecurity deposits 40.35 40.35 40.90 40.90 242.48 242.48 Total financial assets 40.35 40.35 40.90 40.90 242.48 242.48 Financial LiabilitiesBorrowing - - - - 999.30 999.30 Total financial liabilities - - - - 999.30 999.30 The carrying amounts of cash and cash equivalents, other bank balances, trade receivables, inter corporate deposits, other financial assets, current financial liabilities- borrowings, trade payables and other current financial liabilities are considered to be the same as their fair values due to their short term nature.
Note 34: Financial risk management The Company’s business activities expose it to a variety of financial risks, namely liquidity risk, market risks and credit risk.
Risk Exposure arising from Measurement Management
Credit Risk Cash and cash equivalents, trade receivables, financial assets measured at amortised cost, investments in mutual funds
Aging analysis Credit limits, timely review, diversification of deposits
Liquidity Risk Borrowings and other liabilities Rolling cash flow forecasts
Surplus cash parking in liquid funds
Market risk – foreign exchange
Recognised financial liabilities not denominated in Indian rupee (INR)
Sensitivity analysis Limited exposure, unhedged
Market risk - price risk Investment in equity instruments Sensitivity analysis Strategic investment, diversification of portfolio
(a) Credit risk The Company is exposed to credit risk, which is the risk that counterparty will default on its contractual obligation resulting in a financial
loss to the Company. Credit risk arises from cash and cash equivalents, financial assets carried at amortised cost and investments in mutual funds, as well as credit exposures to trade customers including outstanding receivables.
Credit risk management
Credit risk is the risk that a counterparty will not meet its obligations under a financial instrument or customer contract, leading to a financial loss.
The Company’s credit risk arises from accounts receivable balances on sale of hydrogen peroxide. The credit risk is very low as the sale of hydrogen peroxide is based on purchase order / agreement with customer and at rates approved by Managing Director / CEO of the Company. Company has a credit risk policy in place to ensure that sales are made to customers only after an appropriate credit

73
Annual Report 2017-2018
risk assessment and credit line allocation process. Procedures are standardized within a customer credit risk policy and supported by the information technology system by limiting the credit exposure to each customer and allowing an average credit period of 30-60 days. The Company has adopted a policy of only dealing with creditworthy counterparties.
The Company has made a provision of ` 38.15 lakhs for the year ended March 31, 2018 for expected credit loss on Trade receivable.
For banks and financial institutions, only highly rated banks / institutions are accepted. Generally all policies surrounding credit risk have been managed at Company level.
(b) Liquidity risk
Liquidity risk is the risk that the Company will fail in meeting its obligations to pay its financial liabilities. The Company’s approach to managing liquidity is to ensure that it will have sufficient funds to meet its liabilities when due without incurring unacceptable losses.
Prudent liquidity risk management implies maintaining sufficient cash and marketable securities and the availability of funding through an adequate amount of committed credit facilities to meet obligations when due and to close out market positions. In respect of its existing operations, the Company funds its activities primarily through cash generated in operations.
Management monitors the Company’s liquidity position and cash and cash equivalents on the basis of expected cash flows. The Company maintained a positive cash balance throughout the year. Internal accruals provides the funds to service the financial liabilities on a day-to-day basis. Cash which is not needed in the operating activities of the Company is invested in marketable liquid funds.
(i) Maturities of financial liabilities
The amounts disclosed below are the contractual undiscounted cash flows. Balances due within 12 months equal their carrying balances as the impact of discounting is not significant.
` in Lakhs
March 31, 2018 Less than 1 year
Between 1 year and 5
years
More than 5 years Total
Financial liabilities
Trade payables 2,026.17 - - 2,026.17
Other financial liabilities 69.23 - - 69.23
Total financial liabilities 2,095.40 - - 2,095.40
March 31, 2017
Financial liabilities
Borrowings (including interest accrued thereon) 1,122.04 - - 1,122.04
Trade payables 1,922.97 - - 1,922.97
Other financial liabilities 66.10 - - 66.10
Total financial liabilities 3,111.11 - - 3,111.11
April 1, 2016
Financial liabilities
Borrowings (including interest accrued thereon) 2,220.11 1,016.71 - 3,236.82
Trade payables 1,632.40 - - 1,632.40
Other financial liabilities 80.50 - - 80.50
Total financial liabilities 3,933.01 1,016.71 - 4,949.72
(c) Market riskMarket risk is the risk that the fair values of future cash flows of a financial instrument will fluctuate because of volatility of prices in the financial markets. Market risk can be further segregated as: i) Foreign currency risk and ii) Other price risk.
Notes to the Financial Statements for the Year ended March 31, 2018 (Contd.)

74
(i) Foreign currency risk
Foreign currency risk is the risk that the fair value or future cash flows of a financial instrument will fluctuate because of changes in foreign exchange rates. Foreign exchange risks arise from recognized assets and liabilities, when they are denominated in a currency other than functional currency of the Company. To a limited extent, the Company imports certain raw materials and spare parts used in manufacturing and therefore is exposed to foreign exchange risks arising from various currency exposures, primarily with respect to the Pound (“GBP”) and the US-dollar (“USD”). Company’s exposure to foreign currency risk is very limited and it always ensures that the such exposure is within the approved limit for which Company does not require to hedge through derivatives.
The Company’s exposure to foreign currency risk at the end of the reporting period expressed in Rupees, are as follows.
` in LakhsAs at
March 31, 2018As at
March 31, 2017As at
April 1, 2016
Financial liabilities
Payable (Trade payable) - In USD - 139.20 -
Payable (Other payable) - In GBP - 9.71 -
Net exposure to foreign currency risk (liabilities) - 148.91 -
Sensitivity The sensitivity of profit or loss to changes in the exchange rates arises mainly from foreign currency denominated financial instruments.
p` in Lakhs
Impact on profit before tax
Year ended March 31, 2018
Year ended March 31, 2017
FX rate – increase by 6% on closing rate on reporting date* - (8.93)FX rate– decrease by 6% on closing rate on reporting date * - 8.93
* Holding all other variables constant
The above amounts have been disclosed based on the accounting policy for exchange differences.
In management’s opinion, the above sensitivity analysis is not representative of the inherent foreign exchange risk because the exposure at the end of the reporting period does not reflect the exposure during the year.
(ii) Other price risksThe Company is exposed to equity price risks arising from equity investments. These investments are subject to changes in the market price of securities. Equity investments are held for strategic purpose rather than for trading purposes. The Company does not actively trade in these investments.
Sensitivity
If equity prices had been 10% higher / lower, other comprehensive income for the year ended March 31, 2018 would increase / decrease by ` 1,828 lakhs (Year ended March 31, 2017: increase / decrease by ` 1,196.72 lakhs) as a result of the changes in fair value of shares measured at FVOCI.
Note 35: Capital Management
(a) Risk Management The Company’s objectives when managing capital are to safeguard the Company’s ability to continue as a going concern in order to provide returns for shareholders and benefits for other stakeholders and to maintain an optimal capital structure to reduce the cost of capital. In order to maintain or adjust the capital structure, the Company may adjust the amount of dividends paid to shareholders, return capital to shareholders, issue new shares or sell assets to reduce debt.
Notes to the Financial Statements for the Year ended March 31, 2018 (Contd.)

75
Annual Report 2017-2018
The capital structure of the Company consists of equity of the Company (comprising issued capital and internal accruals). The Company is not subject to any external imposed capital requirements. The Company is a zero debt company with no long-term borrowings as at March 31, 2018.
(b) Dividend ` in Lakhs
As at March 31, 2018
As at March 31, 2017
(i) Equity shares 1,953.98 574.70
Final dividend for the year ended March 31, 2017 of ` 34 (March 31, 2016 - ` 10) per fully paid share
Dividend distribution tax (DDT) on final dividend 397.79 117.01
(ii) Dividend not recognised at the end of the reporting period 3,735.55 1,953.98
In addition to the above dividend, since year end the directors have recommended the payment of a final dividend of ` 65 per fully paid equity share (March 31, 2017 - ` 34). This proposed dividend is subject to the approval of shareholders in the ensuing annual general meeting.
Dividend distribution tax (DDT) on proposed dividend 760.50 397.79
Note 36 : Leases
Operating lease arrangements
The Company has entered into non-cancellable operating lease arrangements for certain motor vehicles for a period of four years. Total rental expenses relating to operating leases recognised in statement of profit and loss is ` 54.31 lakhs (Previous year: ` 44.92 lakhs).
` in Lakhs
Non-cancellable operating lease commitments As at March 31, 2018
As at March 31, 2017
As at April 1, 2016
Within one year 16.21 18.19 17.34 Later than one year and not later than 5 years 31.39 14.30 21.93 Later than 5 years - - -
Note 37 : Earning per share
` in Lakhs
March 31, 2018 March 31, 2017
Basic and diluted earnings per shareProfit for the year (Rupees in lakhs) 9,511.67 3,788.26 Weighted average number of equity shares 5,747,000 5,747,000 Basic and diluted earnings per share (`) 165.51 65.92 Face value per share (`) 10.00 10.00
Note 38 : Segment reportingThe CEO reviews the Company’s performance. Presently, the Company is engaged in only one segment viz ‘Manufacturing of peroxygens’ and as such there is no separate reportable segment as per Ind AS 108 ‘Operating Segments’. Presently, the Company’s operations are predominantly confined in India.
Information about major customers Revenue for the year ended March 31, 2018 and March 31, 2017 were from customers located in India. Customers include private distribution entities. No single customer of the Company account for 10% or more of total revenue.
Notes to the Financial Statements for the Year ended March 31, 2018 (Contd.)
76
` in Lakhs
March 31, 2018 March 31, 2017 April 1, 2016
Note 39: Contingent liabilities and commitments
(a) Contingent liabilities :Claims against the Company not acknowledged as debt:Income tax matters - - 128.32 Sales tax demand 287.18 287.18 -
(b) Commitments:(i) Estimated amount of contracts remaining unexecuted on capital account (net of advances paid) and not provided for `4,918.62
lakhs (March 31, 2017 ` Nil; April 1, 2016 ` 2.10 lakhs).
(ii) Other commitment:
The Company has entered into a long term agreement with GAIL (India) Limited (GAIL) for purchase of Natural Gas. The agreement is valid till April 30, 2028. As per the said agreement, the Company under ‘Take or Pay obligation’ clause has to make payment for a fixed quantity of gas on an annual basis, whether used or not. GAIL has the discretion to waive off the Take or Pay charges. A request for supply of Make Up gas can be made by the Company corresponding to Take or Pay deficiencies which are outstanding and for which the Company would pay to GAIL at the time of annual program.
(iii) For lease commitment, refer note 36.
Note 40 : Employee benefit obligationsThe Company has classified various employee benefits as under:
(a) Leave Obligations
The leave obligations cover the Company’s liability for sick and privileged leave
` in Lakhs
Provision for leave encashment As at March 31, 2018
As at March 31, 2017
As at April 1, 2016
Current 130.41 153.71 119.58 Non-current 199.16 207.69 137.90
(b) Defined Contribution Plan(i) Provident fund - - -(ii) Superannuation fund - - -
The Company has recognised the following amounts in the Statement of Profit and Loss for the year:
` in LakhsYear ended
March 31, 2018Year ended
March 31, 2017
(i) Contribution to provident fund 95.29 94.11
(ii) Contribution to superannuation fund 47.71 51.16
(c) Post employment obligations
Gratuity The Company has a defined benefit plan, governed by the Payment of Gratuity Act, 1972. The plan entitles an employee, who has rendered at least five years of continuous service, to gratuity at the rate of fifteen days basic salary for every completed years of services or part thereof in excess of six months, based on the rate of basic salary last drawn by the employee concerned.
Notes to the Financial Statements for the Year ended March 31, 2018 (Contd.)

77
Annual Report 2017-2018
(i) Significant estimates: actuarial assumptions Valuations in respect of gratuity have been carried out by an independent actuary, as at the Balance Sheet date
` in Lakhs
As at March 31, 2018
As at March 31, 2017
As at April 1, 2016
Discount rate (per annum) 7.65% 7.10% 7.75%Salary escalation rate
-For management employees 10.00% 9.00% 9.00%-For other employees 7.00% 6.00% 6.00%
Mortality rate
Indian Assured Lives Mortality (2006-08) Ult
table
Indian Assured Lives Mortality (2006-08) Ult
table
Indian Assured Lives Mortality (2006-08) Ult
table
The estimates of salary escalation rate considered in actuarial valuation, takes into account inflation, seniority, promotion and other relevant factors including supply and demand in the employment market.
(ii) Gratuity Plan The amounts recognised in the Balance Sheet and the movements in the net defined benefit obligation over the year are as follows:
` in Lakhs
Present value of obligation
Fair value of plan assets Net amount
As at April 1, 2016 847.16 (764.41) 82.75
Current service cost 35.54 - 35.54
Interest expense / (income) 54.70 (53.39) 1.31
Total amount recognised in profit and loss 90.24 (53.39) 36.85
Remeasurements
Return on plan assets, excluding amount included in interest expense / (income) - (20.35) (20.35)
(Gain) / loss from change in financial assumptions 25.62 - 25.62
(Gain) / loss from change in demographic assumptions - - -
Experience (gains) / losses 32.77 - 32.77
Total amount recognised in other comprehensive income 58.39 (20.35) 38.04
Employer contributions - (82.75) (82.75)
Benefits payments (8.41) 8.41 -
As at March 31, 2017 987.38 (912.49) 74.89
As at April 1, 2017 987.38 (912.49) 74.89
Current service cost 36.08 - 36.08
Past service cost 38.15 - 38.15
Interest expense / (income) 57.43 (57.79) (0.36)
Total amount recognised in profit and loss 131.66 (57.79) 73.87
Notes to the Financial Statements for the Year ended March 31, 2018 (Contd.)

78
` in Lakhs
Present value of obligation
Fair value of plan assets Net amount
Remeasurements
Return on plan assets, excluding amount included in interest expense / (income) - (26.24) (26.24)
(Gain) / loss from change in financial assumptions 16.48 - 16.48
(Gain) / loss from change in demographic assumptions (23.35) - (23.35)
Experience (gains) / losses 35.89 - 35.89
Total amount recognised in other comprehensive income 29.02 (26.24) 2.78
Employer contributions - (74.89) (74.89)
Benefits payments (16.30) 16.30 -
As at March 31, 2018 1,131.76 (1,055.11) 76.65
The net liability disclosed above relates to funded plans are as follows:
` in lakhsAs at
March 31, 2018As at
March 31, 2017As at
April 1, 2016
Present value of funded obligations 1,131.76 987.38 847.16 Fair value of plan assets (1,055.11) (912.49) (764.41)Deficit of gratuity plan 76.65 74.89 82.75 Current portion 76.65 74.89 82.75 Non-current portion - - -
(iii) Sensitivity analysis Significant estimates: Sensitivity of actuarial assumptions The sensitivity of the provision for defined benefit obligation to changes in the weighted principal assumptions is:
Impact on defined benefit obligation
Change in assumption Increase in assumption Decrease in assumption
March 31,2018
March 31,2017
March 31,2018
March 31,2017
March 31,2018
March 31,2017
Discount rate 0.50% 0.50% -1.64% -2.01% 1.72% 2.11%
Salary escalation rate 0.50% 0.50% 1.69% 1.81% -1.63% -1.77%
The above sensitivity analysis are based on a change in an assumption while holding all other assumptions constant. In practice, this is unlikely to occur, and changes in some of the assumptions may be correlated. While calculating the sensitivity of the defined benefit obligation to significant actuarial assumptions the same method (present value of the defined benefit obligation calculated with the projected unit credit method at the end of the reporting period) has been applied as when calculating the defined benefit liability recognised in the balance sheet. The methods and types of assumptions used in preparing the sensitivity analysis did not change compared to the prior period.
(iv) The above defined benefit gratuity plan was administrated 100% by a trust as at March 31, 2018, March 31, 2017 as well as April 1, 2016.
(v) Defined benefit liability and employer contributions
The Company will pay demand raised by the trust towards gratuity liability on time to time basis to eliminate the deficit in defined benefit plan.
The weighted average duration of the defined benefit obligation is 4.25 years (March 31, 2017 – 4.12 years).
Notes to the Financial Statements for the Year ended March 31, 2018 (Contd.)

79
Annual Report 2017-2018
(vi) Risk exposure Aforesaid post-employement benefit plans typically expose the Company to actuarial risk such as : Invesment risk, interest rate
risk and salary risk
Investment risk : The present value of the defined benefit liability is calculated using discount rate which is determined by reference to market yields at the end of the reporting period on government bonds. If the return on plan asset is below this rate, it will create a plan deficit. Currently, for the plan in India, it has a relatively balanced mix of Investments in government securities and other debt instruments.
Interest Risk : A fall in the discount rate which is linked to the G-sec. rate will increase the present value of the liability requiring higher provision. A fall in the discount rate generally increase the mark to market value of the assets depending on the duration of assets.
Salary risk : The present value of the defined benefit liability is calculated by reference to the future salaries of plan participants. As such, an increase in salary of the plan participants will increase the plan’s liability.
(vii) Category of plan asset
` in LakhsAs at
March 31, 2018As at
March 31, 2017As at
April 1, 2016
Amount % Amount % Amount %
Government debt instruments 322.45 31 282.83 31 126.56 17
Other debt instruments 658.99 62 569.31 62 622.49 81
Insurer managed funds - 0 23.86 3 7.55 1
Others 73.67 7 36.49 4 7.81 1
Total 1,055.11 100 912.49 100 764.41 100
(viii) Projected cash flow
` in LakhsAs at
March 31, 2018As at
March 31, 2017As at
April 1, 2016Less than a year 431.28 356.89 282.61
Between 1-2 years 154.29 22.34 54.98
Between 2-5 years 357.08 357.26 337.64
Between 5-9 years 351.25 342.80 283.64
10 years and above 286.14 339.69 343.99
Pension The Company operates a defined benefit pension plan. The pension benefits payable to the employees are based on the employee’s service and last drawn salary at the time of leaving. The employees do not contribute towards this plan and the full cost of providing these benefits are met by the Company. The Company does not contribute annually to any trust or a fund towards the liability under the plan, this plan is unfunded.
(i) Significant estimates: actuarial assumptions Valuations in respect of pension have been carried out by an independent actuary, as at the Balance Sheet date
As at March 31, 2018
As at March 31, 2017
As at April 1, 2016
Discount rate (per annum) 7.65% 7.10% 7.75%Salary escalation rate 7.00% 6.00% 6.00%Pension increase rate 0.00% 0.00% 0.00%
Notes to the Financial Statements for the Year ended March 31, 2018 (Contd.)

80
(ii) Pension Plan ` in Lakhs
Present value of obligation
As at April 1, 2016 74.46 Current service cost 2.14 Interest on net defined benefit liability / assets 5.25 Total amount recognised in profit and loss 7.39
Remeasurements(Gain) / loss from change in financial assumptions 2.71 (Gain) / loss from change in demographic assumptions - Experience (gains) / losses 4.05
Total amount recognised in other comprehensive income 6.76 Benefits payment (7.92)As at March 31, 2017 80.69
As at April 1, 2017 80.69 Current service cost 9.06 Interest expense / (income) 5.40 Total amount recognised in profit and loss 14.46
Remeasurements(Gain) / loss from change in financial assumptions (1.67)(Gain) / loss from change in demographic assumptions (11.91)Experience (gains) / losses (5.12)
Total amount recognised in other comprehensive income (18.70)Benefits payment (10.08)As at March 31, 2018 66.37
The net liability disclosed above relates to funded plans are as follows:
` in Lakhs
As at March 31, 2018
As at March 31, 2017
As at April 1, 2016
Present value of funded obligations 66.37 80.69 74.46
Deficit of pension plan 66.37 80.69 74.46
Current portion 10.74 9.36 13.32
Non-current portion 55.63 71.33 61.14
(iii) Sensitivity analysis The sensitivity of the provision for defined benefit obligation to changes in the weighted principal assumptions is:
Impact on defined benefit obligation
Change in assumption Increase in assumption Decrease in assumption
March 31,2018
March 31,2017
March 31,2018
March 31,2017
March 31,2018
March 31,2017
Discount rate 0.50% 0.50% -2.17% -2.60% 2.28% 2.74%
The above sensitivity analysis is based on a change in an assumption while holding all other assumptions constant. In practice, this is unlikely to occur, and changes in some of the assumptions may be correlated. While calculating the sensitivity of the defined benefit obligation to significant actuarial assumptions the same method (present value of the defined benefit obligation calculated with the projected unit credit method at the end of the reporting period) has been applied as when calculating the defined benefit liability recognised in the balance sheet. The methods and types of assumptions used in preparing the sensitivity analysis did not change compared to the prior period.
Notes to the Financial Statements for the Year ended March 31, 2018 (Contd.)

81
Annual Report 2017-2018
(iv) Risk exposure Aforesaid post-employment benefit plans typically expose the Company to acturial risks such as: Investment risk, interest rate
risk, and salary risk.
Investment risk: The present value of the defined benefit liability is calculated using a discount rate which is determined by reference to market yields at the end of the reporting period on government bonds.If the return on plan asset is below this rate, it will create a plan deficit. Currently, for the plan in india, it has a relatively balanced mix of investments in govenment securities, and other debt instruments.
Interest risk: A fall in the discount rate which is linked to the G. Sec. Rate will increase the present value of the liability requiring higher provision. A fall in the discount rate generally increase the mark to market value of the assets depending on the duration of asset.
Salary risk: The present value of the defined benefit liability is calculated by reference to the future salaries of plan participants. As such, an increase in salary of the plan participants will increase the plan's liability.
(v) Defined benefit liability and employer contributions
The weighted average duration of the defined benefit obligation is 4.45 years (March 31, 2017 – 5.34 years).
(vi) Projected cash flow ` in Lakhs
As at March 31, 2018
As at March 31, 2017
As at April 1, 2016
Less than a year 10.74 9.36 13.32 Between 1-2 years 8.64 10.65 9.07 Between 2-5 years 24.23 25.90 24.25 Between 5-9 years 25.29 30.81 20.55 10 years and above 32.71 51.71 20.55
Provident Fund In respect of certain employees, provident fund contributions are made to a trust administered by the Company. The interest rate payable to the members of the trust shall not be lower than the statutory rate of interest declared by the Central Government under the Employees Provident Funds and Miscellaneous Provisions Act, 1952 and shortfall, if any, shall be made good by the Company. The liability in respect of the shortfall of interest earnings of the Fund is determined on the basis of an actuarial valuation.
Company measures its liability towards provident fund through actuarial valuation using ‘projected credit unit method’. In case of net assets, assets are recognised to the extent of liability only.
(i) Significant estimates: actuarial assumptions Valuations in respect of provident fund have been carried out by an independent actuary, as at the Balance Sheet date
As at March 31, 2018
As at March 31, 2017
As at April 1, 2016
Discount rate (per annum) 7.65% 7.10% 7.75%
(ii) Provident fund plan
` in LakhsPresent value of obligation
Fair value of plan assets Net amount
As at April 1, 2016 447.25 (447.25) -
Current service cost 23.05 - 23.05
Interest on net defined benefit liability / assets 36.45 (36.45) -
Interest on net defined benefit liability / assets 59.50 (36.45) 23.05
Notes to the Financial Statements for the Year ended March 31, 2018 (Contd.)

82
` in Lakhs
Present value of obligation
Fair value of plan assets Net amount
Remeasurements
Return on plan assets, excluding amount included in interest expense / (income) - (0.82) (0.82)
(Gain) / loss from change in financial assumptions - - -
(Gain) / loss from change in demographic assumptions - - -
Experience (gains) / losses 0.82 - 0.82
Total amount recognised in other comprehensive income 0.82 (0.82) -
Employer’s contributions - (23.05) (23.05)
Employee’s contributions 23.95 (23.95) -
Benefits payment - - -
As at March 31, 2017 531.52 (531.52) -
As at April 1, 2017 531.52 (531.52) -
Current service cost 19.51 - 19.51
Interest expense / (income) 37.87 (37.87) -
Interest on net defined benefit liability / assets 57.38 (37.87) 19.51
Remeasurements
Return on plan assets, excluding amount included in interest expense / (income) - (2.95) (2.95)
(Gain) / loss from change in financial assumptions - - -
(Gain) / loss from change in demographic assumptions - - -
Experience (gains) / losses 2.95 - 2.95
Total amount recognised in other comprehensive income 2.95 (2.95) -
Employer’s contributions - (19.51) (19.51)
Employee’s contributions 20.23 (20.23) -
Benefits payment (35.33) 35.33 -
As at March 31, 2018 576.75 (576.75) -
The net liability disclosed above relates to funded plans are as follows:
` in LakhsAs at
March 31, 2018As at
March 31, 2017As at
April 1, 2016Present value of funded obligations 576.75 531.52 447.25
Fair value of plan assets (576.75) (531.52) (447.25)
Deficit of provident fund plan - - -
Current portion - - -
Non-current portion - - -
Notes to the Financial Statements for the Year ended March 31, 2018 (Contd.)

83
Annual Report 2017-2018
(iii) Sensitivity analysis
The sensitivity of the provision for defined benefit obligation to changes in the weighted principal assumptions is
Impact on defined benefit obligation
Change in assumption Increase in assumption Decrease in assumption
March 31,2018
March 31,2017
March 31,2018
March 31,2017
March 31,2018
March 31,2017
Discount rate 0.50% 0.50% 2.85% 0.00% -1.18% 0.00%
The above sensitivity analysis is based on a change in an assumption while holding all other assumptions constant. In practice, this is unlikely to occur, and changes in some of the assumptions may be correlated. While calculating the sensitivity of the defined benefit obligation to significant actuarial assumptions the same method (present value of the defined benefit obligation calculated with the projected unit credit method at the end of the reporting period) has been applied as when calculating the defined benefit liability recognised in the balance sheet.
The methods and types of assumptions used in preparing the sensitivity analysis did not change compared to the prior period.
(iv) The above defined benefit plan was administrated 100% by a trust as at March 31, 2018, March 31, 2017 as well as April 1, 2016.
(v) Defined benefit liability and employer contributions
The Company will pay demand raised by the trust towards provident fund liability on time to time basis to eliminate the deficit in defined benefit plan.
The weighted average duration to payment is 7.90 years (March 31, 2017 – 6.73 years).
(vi) The plan liabilities are calculated using a discount rate set with reference to bond yields; if plan assets under perform this yield, this will create a deficit.
(vii) Category of plan asset ` in Lakhs
As at March 31, 2018
As at March 31, 2017
As at April 1, 2016
Amount % Amount % Amount %
Government debt instruments 206.15 36 150.85 28 89.35 20
Other debt instruments 312.71 54 315.86 60 315.48 71
Entity's own equity instruments 14.31 2 21.74 4 14.31 3
Others 43.58 8 43.07 8 28.11 6
Total 576.75 100 531.52 100 447.25 100
Note 41: Related party transactions
As per Indian Accounting Standard 24 (Ind AS 24) ‘Related Party Transactions’ as prescribed by Companies (Indian Accounting Standards) Rules, 2015, the Group’s related parties and transactions are disclosed below:
(A) Enterprises exercising control Ultimate holding entity - Ben Nevis Investments Limited (Refer note 16)
Parent entity - Nowrosjee Wadia and Sons Limited (Refer note 16)*
* w.e.f. March 28, 2017, the entity was exercising significant influence over the Company.
(B) Enterprises where control exists Subsidiary company - Naperol Investments Limited
(C) Key management personnel Mr. S. R. Lohokare, Managing Director (upto December 15, 2017) Mr. Suresh Khurana, Chief Executive Officer and Director (w.e.f. December 15, 2017)
Notes to the Financial Statements for the Year ended March 31, 2018 (Contd.)

84
Non-Executive Directors Mr. Ness N. Wadia - Chairman Dr. (Mrs.) Minnie Bodhanwala
Independent Directors Mr. R. Batra Mr. N. P. Ghanekar Mr. S. Ragothaman (D) Enterprises controlled by the parent entity and with whom transactions were carried out during the year.
Wadia Techno-Engineering Services Limited
Macrofil Investments Limited (Refer Note 16)** **The entity was excercising significant influence over the company till August 2, 2017. (E) Employee benefits plans and with whom transactions were carried out during the year.
National Peroxide Limited Employees’ Provident Fund National Peroxide Limited Employees’ Gratuity Fund(F) Enterprises over which key managerial personnel have significant influence and with whom transactions were carried
out during the year.
Sir Ness Wadia Foundation
(G) Details of transactions during the year: ` in LakhsYear ended
March 31, 2018Year ended
March 31, 2017Intercorporate deposit givenNowrosjee Wadia and Sons Limited 3,000.00 -
Wadia Techno-Engineering Services Limited 500.00 -
Interest income on intercorporate depositNowrosjee Wadia and Sons Limited 282.53 -
Wadia Techno-Engineering Services Limited 46.23 - Macrofil Investments Limited 375.00 374.23
Miscellaneous expensesNowrosjee Wadia and Sons Limited 114.67 21.17
Reimbursement of expenses Nowrosjee Wadia and Sons Limited 78.77 25.92
Expenditure on Corporate Social ResponsibilitySir Ness Wadia Foundation 80.00 7.41
(H) Compensation to key managerial personnelMr. S. R. Lohokare
Short term employee benefits 186.93 248.88Post employement benefits* 27.38 36.61Long term employee benefits* - -
Mr. Suresh KhuranaShort term employee benefits 65.32 -Post employement benefits* 4.69 -Long term employee benefits* - -
* As the liabilities for defined benefit plans are provided on actuarial basis for the Company, the amounts pertaining to Key Management Personnel are not included.
(I) Commission to Non-Executive Directors 149.00 65.16
(J) Director Sitting fees to Non-Executive Directors 17.60 12.20
Notes to the Financial Statements for the Year ended March 31, 2018 (Contd.)

85
Annual Report 2017-2018
` in LakhsYear ended
March 31, 2018Year ended
March 31, 2017(K) Contribution to employee benefit plans
National Peroxide Limited Employees' Provident Fund (employer's contribution only) 19.51 23.05 National Peroxide Limited Employees' Gratuity Fund 74.89 82.75
` in LakhsAs at
March 31, 2018As at
March 31, 2017(L) Balances with related parties as at the year end:
Intercorporate deposits to related party Nowrosjee Wadia and Sons Limited 3,000.00 -
Wadia Techno-Engineering Services Limited 500.00 - Macrofil Investments Limited 3,000.00 3,000.00
Interest accrued but not due on deposits Wadia Techno-Engineering Services Limited 41.61 -
Trade PayablesNowrosjee Wadia and Sons Limited 61.40 25.92
National Peroxide Limited Employees' Provident Fund 576.75 531.52 National Peroxide Limited Employees' Gratuity Fund 1,055.11 912.49
Note 42: Specified bank notes i. The reporting on disclosures relating to Specified Bank Notes is not applicable to the Company for the year ended March 31, 2018.ii. Following are the details of holdings as well as dealings in Specified Bank Notes for the previous year ended March 31, 2017.
` in Lakhs
Particulars SBNs Other denomination notes Total
Closing cash in hand as on November 8, 2016 3.99 0.36 4.35 Permitted receipts 0.20 10.40 10.60 Permitted payments - 7.76 7.76 Amount deposited in Banks 4.19 - 4.19 Closing cash in hand as on December 30, 2016 - 3.00 3.00
Note 43: First-time adoption of Ind AS These are the Company’s first financial statements prepared in accordance with Ind AS. The accounting policies set out in note 2 have been applied in preparing the financial statements for the year ended March 31, 2018, the comparative information presented in these financial statements for the year ended March 31, 2017 and in the preparation of an opening Ind AS balance sheet at April 1, 2016 (the Company’s date of transition). In preparing its opening Ind AS balance sheet, the Company has adjusted the amounts reported previously in financial statements prepared in accordance with the accounting standards notified under Companies (Accounting Standards) Rules, 2006 (as amended) and other relevant provisions of the Act (previous GAAP or Indian GAAP). An explanation of how the transition from previous GAAP to Ind AS has affected the Company’s financial position, financial performance and cash flows is set out in the following tables and notes.
A. Exemptions and exceptions availed
Set out below are the applicable Ind AS 101 optional exemptions and mandatory exceptions applied in the transition from previous GAAP to Ind AS.
A.1 Ind AS optional exemptions
A.1.1 Deemed cost
Ind AS 101 permits a first-time adopter to elect to continue with the carrying value for all of its property, plant and equipment as recognised in the financial statements as at the date of transition to Ind AS, measured as per the previous GAAP and use that as its deemed cost as at the date of transition.
Accordingly, the Company has elected to measure all of its property, plant and equipment at their previous GAAP carrying value.
Notes to the Financial Statements for the Year ended March 31, 2018 (Contd.)

86
A.1.2 Designation of previously recognised financial instrumentsInd AS 101 allows an entity to designate investments in equity instruments at FVOCI on the basis of the facts and circumstances at the date of transition to Ind AS.
The Company has elected to apply this exemption for its investment in equity instruments.
A.1.3 Investments in subsidiary
Under previous GAAP, investment in subsidiary is carried at cost less impairment loss, if any in the Financial Statements. On transition to Ind AS, the Company has elected to use the previous GAAP carrying amount on its investment in subsidiary on the date of transition as its deemed cost on that date, in its Financial Statements
A.2 Ind AS mandatory exceptionsA.2.1 Estimates
The entity’s estimates in accordance with Ind AS at the date of transition shall be consistent with estimates made for the same date in accordance with previous GAAP (after adjustments to reflect any difference in accounting policies), unless there is objective evidence that those estimates were in error.
Ind AS estimates as at April 1, 2016 are consistent with the estimates as at the same date made in conformity with previous GAAP. The Company has made estimate relating to investment in equity instruments carried at FVOCI in accordance with Ind AS at the date of transition as these were not required under prevous GAAP:
B. Reconciliations between previous GAAP and Ind AS Ind AS 101 requires an entity to reconcile equity, total comprehensive income and cash flows for prior periods. The following tables represent the reconciliation from previous GAAP to Ind AS.
B.1 Reconciliation of equity as at March 31, 2017 and April 1, 2016
` in LakhsNotes to first time adoption March 31, 2017 April 1, 2016
Total equity (shareholder's funds) as per previous GAAP 26,784.60 21,999.76 Effect of adjustment of embezzlement (net of taxes) G (1,239.91) (706.99)Restated total equity under previous GAAP 25,544.69 21,292.77 Adjustments:Adjustment of excess provision for tax written back in previous year H - 440.80 Fair valuation of investments in equity instruments A 11,865.35 5,233.75 Fair valuation of investments in mutual funds B 15.56 0.31 Borrowings - transaction cost adjustment C 0.70 8.24 Proposed dividend D - 691.71 Tax effects of adjustments F (5.63) (2.96)Total adjustments 11,875.98 6,371.85 Total equity as per Ind AS 37,420.67 27,664.62
B.2 Reconciliation of total comprehensive income for the year ended March 31, 2017` in Lakhs
Notes to first time adoption March 31, 2017
Profit after tax as reported under previous GAAP 4,784.84 Effect of adjustment of embezzlement (net of taxes) G (532.92)Restated profit under previous GAAP 4,251.92 Adjustments:Adjustment of excess provision for tax written back in previous year H (440.80)Remeasurement of post-employment benefit obligations (net of taxes) E (27.90)Fair valuation of investments in mutual funds B 15.25 Borrowings - transaction cost adjustment C (7.54)Tax effects of adjustments F (2.67)Total adjustments (463.66)
Notes to the Financial Statements for the Year ended March 31, 2018 (Contd.)

87
Annual Report 2017-2018
` in LakhsNotes to first time adoption March 31, 2017
Profit after tax as per Ind AS 3,788.26 Other comprehensive income A & E 6,659.50 Total comprehensive income as per Ind AS 10,447.76
B.3 Impact of Ind AS adoption on the statements of cash flows for the year ended March 31, 2017The transition from previous GAAP to Ind AS do not have a material impact on the statement of cash flows.
Notes
A. Under the previous GAAP, investments in equity instruments were classified as long-term investments based on the intended holding period and realisability. Long-term investments were carried at cost less provision for other than temporary decline in the value of such investments. Fair value changes with respect to investments in equity instruments designated as at FVOCI have been recognised in FVOCI - Equity investments reserve as at the date of transition and subsequently in the other comprehensive income for the year ended March 31, 2017. This has resulted in an increase in reserves of `5,233.75 lakhs and `11,865.35 lakhs as at April 1, 2016 and March 31, 2017 respectively and increase in other comprehensive income by `6,631.60 lakhs for the year ended March 31, 2017.
B. Under the previous GAAP, investment in mutual funds were classified as current investments based on the intended holding period and realisability and current investments were carried at lower of cost and fair value. Under Ind AS, same are required to be fair valued and subsequently, measured at fair value through profit and loss as on the reporting date. This has resulted in an increase in retained earnings of `0.31 lakhs and `15.56 lakhs as at April 1, 2016 and March 31, 2017 respectively and increase in profit by `15.25 lakhs for the year ended March 31, 2017.
C. Ind AS 109 requires transaction costs incurred towards origination of borrowings to be deducted from the carrying amount of borrowings on initial recognition. These costs are recognised in the profit or loss over the tenure of the borrowing as part of the interest expense by applying the effective interest rate method. This has resulted in an increase in retained earnings of `8.24 lakhs and `0.70 lakhs as at April 1, 2016 and March 31, 2017 respectively and decrease in profit by `7.54 lakhs for the year ended March 31, 2017.
D. Under the previous GAAP, dividend proposed by the board of directors after the balance sheet date but before the approval of the financial statements were considered as adjusting events. Accordingly, provision for proposed dividend (including dividend distribution tax) was recognised as a liability. Under Ind AS, such dividend are recognised when the same is approved by the shareholders in the general meeting. This has resulted in an increase in retained earnings of `691.71 lakhs as at April 1, 2016.
E. Under Ind AS, remeasurements i.e. actuarial gains or losses are recognised in other comprehensive income instead of profit or loss. Under the Previous GAAP, these remeasurements were forming part of the profit or loss for the year. This has resulted into decrease in profit by `27.90 lakhs (net of tax) and corresponding increase in other comprehensive income for the year ended March 31, 2017.
F. Deferred tax asset / liability has been recognized on all temporary differences, arising on account of the aforesaid adjustments and on account of temporary differences between the carrying amount of an asset or liability in the balance sheet and its tax base. This has resulted in decrease in retained earnings by `2.96 lakhs and `5.63 lakhs as at April 1, 2016 and March 31, 2017 respectively and decrease in profit by `2.67 lakhs for the year ended March 31, 2017.
G. Refer note 32 on exceptional items.H. Under previous GAAP, adjustment entry relating to excess provision for tax of prior year was considered in financial year ended March
31, 2017. Under Ind AS, excess provision for tax being a material amount, the impact of the same was considered in April 1, 2016.Note 44: Appointment of Company Secretary
The Company was having a whole time secretary during the year as required under the Companies Act, 2013 who has resigned on December 28, 2017. The Company is under the process of appointing a Whole time Company Secretary. The Company appoints external consultants for compliance of Companies Act on need basis.
Notes to the Financial Statements for the Year ended March 31, 2018 (Contd.)
As per our report of even date attached For and on behalf of the Board of Directors
For Price Waterhouse Chartered Accountants LLPChartered Accountants Firm Registration Number: 012754N/N500016
SURESH KHURANA Chief Executive Officer & DirectorDIN:06677496
NESS N. WADIADIN: 00036049
Chairman
R. BATRADIN: 00020764
N. P. GHANEKARDIN: 00009725
MINNIE BODHANWALADIN: 00422067
} Directors
Asha RamanathanPartnerMembership No. 202660
SHAILESH CHAUHANChief Financial Officer
Mumbai, May 24, 2018 Mumbai, May 24, 2018

88
INDEPENDENT AUDITORS’ REPORT TO THE MEMBERS OF NATIONAL PEROXIDE LIMITED
Report on the Consolidated Indian Accounting Standards (Ind AS) Financial Statements
1. We have audited the accompanying consolidated Ind AS financial statements of National Peroxide Limited (“hereinafter referred to as the Holding Company”) and its subsidiary (the Holding Company and its subsidiary together referred to as “the Group”), (refer Note 2.1 [b] to the attached consolidated financial statements), comprising of the consolidated Balance Sheet as at March 31, 2018, the consolidated Statement of Profit and Loss (including Other Comprehensive Income), the consolidated Cash Flow Statement for the year then ended and the Statement of Changes in Equity for the year then ended, and a summary of significant accounting policies and other explanatory information prepared based on the relevant records (hereinafter referred to as “the Consolidated Ind AS Financial Statements”).
Management’s Responsibility for the Consolidated Ind AS Financial Statements
2. The Holding Company’s Board of Directors is responsible for the preparation of these consolidated Ind AS financial statements in terms of the requirements of the Companies Act, 2013 (hereinafter referred to as “the Act”) that give a true and fair view of the consolidated financial position, consolidated financial performance, consolidated cash flows and changes in equity of the Group in accordance with accounting principles generally accepted in India including the Indian Accounting Standards specified in the Companies (Indian Accounting Standards) Rules, 2015 (as amended) under Section 133 of the Act. The Holding Company’s Board of Directors is also responsible for ensuring accuracy of records including financial information considered necessary for the preparation of consolidated Ind AS financial statements. The respective Board of Directors of the companies included in the Group are responsible for maintenance of adequate accounting records in accordance with the provisions of the Act for safeguarding the assets of the Group and for preventing and detecting frauds and other irregularities; the selection and application of appropriate accounting policies; making judgements and estimates that are reasonable and prudent; and the design, implementation and maintenance of adequate internal financial controls, that were operating effectively for ensuring the accuracy and completeness of the accounting records, relevant to the preparation and presentation of the financial statements that give a true and fair view and are free from material misstatement, whether due to fraud or error, which has been used for the purpose of preparation of the consolidated Ind AS financial statements by the Directors of the Holding Company, as aforesaid.
Auditors’ Responsibility
3. Our responsibility is to express an opinion on these consolidated Ind AS financial statements based on our audit. While conducting the audit, we have taken into account the provisions of the Act and the Rules made thereunder including the accounting standards and matters which are required to be included in the audit report.
4. We conducted our audit of the consolidated Ind AS financial statements in accordance with the Standards on Auditing specified under Section 143(10) of the Act and other applicable authoritative pronouncements issued by the Institute of Chartered Accountants of India. Those Standards and pronouncements require that we comply with ethical requirements and plan and perform the audit to obtain reasonable assurance about whether the consolidated Ind AS financial statements are free from material misstatement.
5. An audit involves performing procedures to obtain audit evidence about the amounts and disclosures in the consolidated Ind AS financial statements. The procedures selected depend on the auditors’ judgement, including the assessment of the risks of material misstatement of the consolidated Ind AS financial statements, whether due to fraud or error. In making those risk assessments, the auditor considers internal financial control relevant to the Holding Company’s preparation of the consolidated Ind AS financial statements that give a true and fair view, in order to design audit procedures that are appropriate in the circumstances. An audit also includes evaluating the appropriateness of the accounting policies used and the reasonableness of the accounting estimates made by the Holding Company’s Board of Directors, as well as evaluating the overall presentation of the consolidated Ind AS financial statements.
6. We believe that the audit evidence obtained by us and the audit evidence obtained by the other auditors in terms of their reports referred to in sub-paragraph 8 of the Other Matters paragraph below, is sufficient and appropriate to provide a basis for our audit opinion on the consolidated Ind AS financial statements.
Opinion 7. In our opinion and to the best of our information and according to the explanations given to us, the aforesaid consolidated
Ind AS financial statements give the information required by the Act in the manner so required and give a true and fair view in conformity with the accounting principles generally accepted in India of the consolidated state of affairs of the Group as at March 31, 2018, and their consolidated total comprehensive income (comprising of consolidated profit and consolidated other comprehensive income), their consolidated cash flows and consolidated changes in equity for the year ended on that date.
Other Matter
8. We did not audit the financial statements of one subsidiary whose financial statements reflect total assets of ̀ 50,848.56 lakhs and net assets of ` 50,826.35 lakhs as at March 31, 2018, total revenue of ` 75.73 lakhs, total comprehensive income (comprising of profit and other comprehensive income) of ` 14,062.68 lakhs and net cash flows amounting to ` (0.34) lakhs for the year ended on that date, as considered in the consolidated Ind AS financial statements. These financial statements have been audited by

89
Annual Report 2017-2018
other auditor whose reports have been furnished to us by the Management, and our opinion on the consolidated Ind AS financial statements insofar as it relates to the amounts and disclosures included in respect of the subsidiary company and our report in terms of sub-section (3) of Section 143 of the Act insofar as it relates to the aforesaid subsidiary, is based solely on the reports of the other auditors.
9. Our opinion on the consolidated Ind AS financial statements and our report on Other Legal and Regulatory Requirements below, is not modified in respect of the above matters with respect to our reliance on the work done and the reports of the other auditors.
10. The comparative financial information of the Group for the year ended March 31, 2017 and the transition date opening balance sheet as at April 1, 2016 included in these consolidated Ind AS financial statements, are based on the previously issued statutory financial statements for the years ended March 31, 2017 and March 31, 2016 prepared in accordance with the Companies (Accounting Standards) Rules, 2006 (as amended) which were audited by the predecessor auditor, who expressed an unmodified opinion vide reports dated May 23, 2017 and May 26, 2016 respectively. The adjustments to those financial statements for the differences in accounting principles adopted by the Group on transition to the Ind AS have been audited by us.
Our opinion is not qualified in respect of these matters.Report on Other Legal and Regulatory Requirements
As required by Section 143 (3) of the Act, we report, to the extent applicable, that:
(a) We have sought and obtained all the information and explanations which to the best of our knowledge and belief were necessary for the purposes of our audit of the aforesaid consolidated Ind AS financial statements.
(b) In our opinion, proper books of account as required by law maintained by the Holding Company, its subsidiary included in the Group, incorporated in India including relevant records relating to preparation of the aforesaid consolidated Ind AS financial statements have been kept so far as it appears from our examination of those books and records of the Holding Company and the reports of the other auditors.
(c) The Consolidated Balance Sheet, the Consolidated Statement of Profit and Loss (including other comprehensive income), Consolidated Cash Flow Statement and the Consolidated Statement of Changes in Equity dealt with by this Report are in agreement with the relevant books of account maintained by the Holding Company, its subsidiary included in the Group, incorporated in India including relevant records relating to the preparation of the consolidated Ind AS financial statements.
(d) In our opinion, the aforesaid consolidated Ind AS financial statements comply with the Indian Accounting Standards specified under Section 133 of the Act.
(e) On the basis of the written representations received from the directors of the Holding Company as on March 31, 2018 taken on record by the Board of Directors of the Holding Company and the reports of the statutory auditors of its subsidiary company, incorporated in India, none of the directors of the Group companies is disqualified as on March 31, 2018 from being appointed as a director in terms of Section 164 (2) of the Act.
(f) With respect to the adequacy of the internal financial controls with reference to financial statements of the Holding Company, its subsidiary company incorporated in India, and the operating effectiveness of such controls, refer to our separate Report in Annexure A.
(g) With respect to the other matters to be included in the Auditors’ Report in accordance with Rule 11 of the Companies (Audit and Auditors) Rules, 2014, in our opinion and to the best of our information and according to the explanations given to us:
i. The consolidated Ind AS financial statements disclose the impact, if any, of pending litigations as at March 31, 2018 on the consolidated financial position of the Group – Refer Note 39 to the consolidated Ind AS financial statements.
ii. The group has long-term contracts as at March 31, 2018 for which there were no material foreseeable losses. The group did not have any derivative contracts as at March 31, 2018.
iii. There has been no delay in transferring amounts, required to be transferred, to the Investor Education and Protection Fund by the Holding Company during the year ended March 31, 2018. There were no amounts which were required to be transferred to the Investor Education and Protection Fund by the subsidiary company incorporated in India during the year ended March 31, 2018.
iv. The reporting on disclosures relating to Specified Bank Notes is not applicable to the group for the year ended March 31, 2018.
For Price Waterhouse Chartered Accountants LLP
Firm Registration Number: 012754N/N500016
Asha Ramanathan
Partner
Membership Number: 202660
Mumbai, 24th May, 2018

90
Annexure “A” to Independent Auditors’ ReportReferred to in paragraph 10(f) of the Independent Auditors’ Report of even date to the members of National Peroxide Limited on the consolidated financial statements for the year ended March 31, 2018
Report on the Internal Financial Controls under Clause (i) of Sub-section 3 of Section 143 of the Act
1. In conjunction with our audit of the consolidated financial statements of the Company as of and for the year ended March 31, 2018, we have audited the internal financial controls over financial reporting of National Peroxide Limited (hereinafter referred to as “the Holding Company”) and its subsidiary company, which are companies incorporated in India, as of that date.
Management’s Responsibility for Internal Financial Controls
2. The respective Board of Directors of the Holding company, its subsidiary company, to whom reporting under clause (i) of sub section 3 of Section 143 of the Act in respect of the adequacy of the internal financial controls over financial reporting is applicable, which are companies incorporated in India, are responsible for establishing and maintaining internal financial controls based on internal control over financial reporting criteria established by the Company considering the essential components of internal control stated in the Guidance Note on Audit of Internal Financial Controls Over Financial Reporting issued by the Institute of Chartered Accountants of India (ICAI). These responsibilities include the design, implementation and maintenance of adequate internal financial controls that were operating effectively for ensuring the orderly and efficient conduct of its business, including adherence to the respective company’s policies, the safeguarding of its assets, the prevention and detection of frauds and errors, the accuracy and completeness of the accounting records, and the timely preparation of reliable financial information, as required under the Act.
Auditor’s Responsibility
3. Our responsibility is to express an opinion on the Company’s internal financial controls over financial reporting based on our audit. We conducted our audit in accordance with the Guidance Note on Audit of Internal Financial Controls Over Financial Reporting (the “Guidance Note”) issued by the ICAI and the Standards on Auditing deemed to be prescribed under section 143(10) of the Companies Act, 2013, to the extent applicable to an audit of internal financial controls, both applicable to an audit of internal financial controls and both issued by the ICAI. Those Standards and the Guidance Note require that we comply with ethical requirements and plan and perform the audit to obtain reasonable assurance about whether adequate internal financial controls over financial reporting was established and maintained and if such controls operated effectively in all material respects.
4. Our audit involves performing procedures to obtain audit evidence about the adequacy of the internal financial controls system over financial reporting and their operating effectiveness. Our audit of internal financial controls over financial reporting included obtaining an understanding of internal financial controls over financial reporting, assessing the risk that a material weakness exists, and testing and evaluating the design and operating effectiveness of internal control based on the assessed risk. The procedures selected depend on the auditor’s judgement, including the assessment of the risks of material misstatement of the financial statements, whether due to fraud or error.
5. We believe that the audit evidence we have obtained and the audit evidence obtained by the other auditors in terms of their reports referred to in the Other Matters paragraph below, is sufficient and appropriate to provide a basis for our audit opinion on the Company’s internal financial controls system over financial reporting.
Meaning of Internal Financial Controls Over Financial Reporting
6. A company’s internal financial control over financial reporting is a process designed to provide reasonable assurance regarding the reliability of financial reporting and the preparation of financial statements for external purposes in accordance with generally accepted accounting principles. A company’s internal financial control over financial reporting includes those policies and procedures that (1) pertain to the maintenance of records that, in reasonable detail, accurately and fairly reflect the transactions and dispositions of the assets of the company; (2) provide reasonable assurance that transactions are recorded as necessary to permit preparation of financial statements in accordance with generally accepted accounting principles, and that receipts and expenditures of the company are being made only in accordance with authorisations of management and directors of the company; and (3) provide reasonable assurance regarding prevention or timely detection of unauthorised acquisition, use, or disposition of the company’s assets that could have a material effect on the financial statements.
Inherent Limitations of Internal Financial Controls Over Financial Reporting
7. Because of the inherent limitations of internal financial controls over financial reporting, including the possibility of collusion or improper management override of controls, material misstatements due to error or fraud may occur and not be detected. Also, projections of any evaluation of the internal financial controls over financial reporting to future periods are subject to the risk that the internal financial control over financial reporting may become inadequate because of changes in conditions, or that the degree of compliance with the policies or procedures may deteriorate.

91
Annual Report 2017-2018
Opinion
8. In our opinion, the Holding Company, its subsidiary company, which are companies incorporated in India, have in all material respects, an adequate internal financial controls system over financial reporting and such internal financial controls over financial reporting were operating effectively as at March 31, 2018 based on the internal control over financial reporting criteria established by the Company considering the essential components of internal control stated in the Guidance Note on Audit of Internal Financial Controls Over Financial Reporting issued by the Institute of Chartered Accountants of India.
Other Matters
9. Our aforesaid reports under Section 143(3)(i) of the Act on the adequacy and operating effectiveness of the internal financial controls over financial reporting insofar as it relates to one subsidiary company, which is company incorporated in India, is based on the corresponding reports of the auditor of such company incorporated in India. Our opinion is not qualified in respect of this matter.
For Price Waterhouse Chartered Accountants LLP
Firm Registration Number: 012754N/N500016
Asha Ramanathan
Partner
Membership Number: 202660
Mumbai, 24th May, 2018

92
Consolidated Balance Sheet as at March 31, 2018` in Lakhs
Notes As at March 31, 2018
As at March 31, 2017
As at April 1, 2016
ASSETS
Non-current assetsProperty, plant and equipment 3 16,965.25 17,848.07 17,966.89 Capital work-in-progress 563.98 168.19 308.89 Financial assets
(i) Investments 4 69,124.68 48,741.04 21,318.29 (ii) Loans 5 40.35 40.90 242.48
Current tax assets (net) 6 298.38 273.12 254.55 Other non-current assets 7 1,316.67 776.37 720.36 Total non-current assets 88,309.31 67,847.69 40,811.46
Current assets Inventories 8 1,472.70 1,110.72 1,411.05 Financial assets
(i) Investments 9 7,037.21 5,026.17 578.75 (ii) Trade receivables 10 5,325.04 3,316.78 3,266.01 (iii) Cash and cash equivalents 11 320.95 8.13 126.99 (iv) Bank balances other than (iii) above 12 49.23 38.40 38.53 (v) Loans 13 6,524.34 3,028.62 4,431.91 (vi) Other financial assets 14 41.63 93.69 17.66
Other current assets 15 196.76 269.21 418.08
Total current assets 20,967.86 12,891.72 10,288.98 Total assets 109,277.17 80,739.41 51,100.44
EQUITY AND LIABILITIES
EquityEquity share capital 16 574.70 574.70 574.70 Other equity 17 101,110.99 73,584.15 43,130.37 Total equity 101,685.69 74,158.85 43,705.07
LiabilitiesNon-current liabilitiesFinancial liabilities
(i) Borrowings 18 - - 999.30 Deferred tax liabilities (net) 6 3,396.57 2,465.46 2,016.72 Provisions 19 254.79 279.02 199.04 Total non-current liabilities 3,651.36 2,744.48 3,215.06 Current liabilitiesFinancial liabilities
(i) Borrowings 20 - 105.33 33.10 (ii) Trade payables 21 2,027.03 1,923.46 1,632.85 (iii) Other financial liabilities 22 69.23 1,065.69 2,073.80
Other current liabilities 23 1,269.05 373.19 223.71 Provisions 24 217.80 237.96 215.65 Current tax liabilities (net) 6 357.01 130.45 1.20 Total current liabilities 3,940.12 3,836.08 4,180.31 Total Liabilities 7,591.48 6,580.56 7,395.37 Total equity and liabilities 109,277.17 80,739.41 51,100.44
Basis of Preparation and Significant accounting policies 2
The above consolidated Balance Sheet should be read in conjunction with the accompanying notes.
As per our report of even date attached For and on behalf of the Board of Directors
For Price Waterhouse Chartered Accountants LLPChartered Accountants Firm Registration Number: 012754N/N500016
SURESH KHURANA Chief Executive Officer & DirectorDIN:06677496
NESS N. WADIADIN: 00036049
Chairman
R. BATRADIN: 00020764
N. P. GHANEKARDIN: 00009725
MINNIE BODHANWALADIN: 00422067
} Directors
Asha RamanathanPartnerMembership No. 202660
SHAILESH CHAUHANChief Financial Officer
Mumbai, May 24, 2018 Mumbai, May 24, 2018

93
Annual Report 2017-2018
Consolidated Statement of Profit and Loss for the Year ended March 31, 2018
` in Lakhs
Notes Year ended March 31, 2018
Year ended March 31, 2017
Income
Revenue from operations 25 31,118.73 26,236.03
Other income 26 1,013.69 618.86
Total income 32,132.42 26,854.89
Expenses
Cost of materials consumed 27 6,858.40 5,609.25
Changes in inventories of finished goods 28 (331.40) 510.81
Excise duty 855.17 2,927.00
Employee benefit expenses 29 2,255.10 2,348.50
Finance costs 30 50.59 221.04
Depreciation 3 919.16 892.73
Other expenses 31 6,933.85 7,794.33
Total expenses 17,540.87 20,303.66
Profit before exceptional items and tax 14,591.55 6,551.23
Exceptional items 32 (105.92) 768.94
Profit before tax 14,697.47 5,782.29
Income tax expense 6
Current tax 4,212.71 1,467.69
Deferred tax 901.05 451.09
Total tax expense 5,113.76 1,918.78
Profit for the year 9,583.71 3,863.51
Other comprehensive income
Items that will not be reclassified to profit or loss
Remeasurements of the defined benefit obligations 15.92 42.66
Changes in fair value of FVOCI equity instruments 20,308.07 27,254.07
Income tax relating to these items (29.08) (14.76)
Other comprehensive income for the year, net of tax 20,294.91 27,281.97
Total comprehensive income for the year 29,878.62 31,145.48
Earnings per equity share
Basic and diluted earnings per share 37 166.76 67.23
Basis of Preparation and Significant accounting policies 2
The above consolidated statement of Profit and Loss should be read in conjunction with the accompanying notes.
As per our report of even date attached For and on behalf of the Board of Directors
For Price Waterhouse Chartered Accountants LLPChartered Accountants Firm Registration Number: 012754N/N500016
SURESH KHURANA Chief Executive Officer & DirectorDIN:06677496
NESS N. WADIADIN: 00036049
Chairman
R. BATRADIN: 00020764
N. P. GHANEKARDIN: 00009725
MINNIE BODHANWALADIN: 00422067
} Directors
Asha RamanathanPartnerMembership No. 202660
SHAILESH CHAUHANChief Financial Officer
Mumbai, May 24, 2018 Mumbai, May 24, 2018

94
Consolidated Statement of Changes in Equity for the Year ended March 31, 2018
A. Equity share capital (Refer note 16) ` in Lakhs
As at April 1, 2016 574.70
Changes in equity share capital -
As at March 31, 2017 574.70
Changes in equity share capital -
As at March 31, 2018 574.70
B. Other equity ` in Lakhs
Reserves and surplus Other reserves
Notes General reserve
Capital redemption
reserve
Special reserve under section 45IC of RBI Act, 1934
Retained earnings
FVOCI - Equity instruments
Total other equity
Balance at April 1, 2016 17 3,357.86 0.02 125.43 18,826.33 20,820.73 43,130.37
Profit for the year - - - 3,863.51 - 3,863.51
Other comprehensive income for the year - - - 27.90 27,254.07 27,281.97
Total comprehensive income for the year - - - 3,891.41 27,254.07 31,145.48
Transactions with owners in their capacity as owners:
Transfer from retained earnings 4.54 - 9.07 (13.61) - -
Dividend paid 35b - - - (574.70) - (574.70)
Dividend distribution tax 35b - - - (117.01) - (117.01)
Balance at March 31, 2017 3,362.40 0.02 134.50 22,012.43 48,074.80 73,584.15
Balance at April 1, 2017 17 3,362.40 0.02 134.50 22,012.43 48,074.80 73,584.15
Profit for the year - - - 9,583.71 - 9,583.71
Other comprehensive income for the year - - - 10.36 20,284.55 20,294.91
Total comprehensive income for the year - - - 9,594.07 20,284.55 29,878.62
Transactions with owners in their capacity as owners:
Transfer from retained earnings 4.90 - 9.80 (14.70) - -
Dividend paid 35b - - - (1,953.98) - (1,953.98)
Dividend distribution tax 35b - - - (397.79) - (397.79)
Balance at March 31, 2018 3,367.30 0.02 144.30 29,240.02 68,359.35 101,110.99
The above consolidated statement of changes in equity should be read in conjunction with the accompanying notes.
As per our report of even date attached For and on behalf of the Board of Directors
For Price Waterhouse Chartered Accountants LLPChartered Accountants Firm Registration Number: 012754N/N500016
SURESH KHURANA Chief Executive Officer & DirectorDIN:06677496
NESS N. WADIADIN: 00036049
Chairman
R. BATRADIN: 00020764
N. P. GHANEKARDIN: 00009725
MINNIE BODHANWALADIN: 00422067
} Directors
Asha RamanathanPartnerMembership No. 202660
SHAILESH CHAUHANChief Financial Officer
Mumbai, May 24, 2018 Mumbai, May 24, 2018

95
Annual Report 2017-2018
Consolidated Statement of Cash Flow for the Year ended March 31, 2018
` in Lakhs
Year ended March 31, 2018
Year ended March 31, 2017
Cash flow from operating activitiesProfit before income tax 14,697.47 5,782.29 Adjustments for:
Provision for expected loss on reduction in net realisable value of Capital work-in-progress - 20.86 Loss on account of embezzlement of funds - 1,162.27 Depreciation 919.16 892.73 Loss / (Gain) on disposal of Property, plant and equipment 2.63 (0.16)Finance costs 50.59 221.04 Interest income classified as investing cash flows (712.90) (468.72)Dividend income classified as investing cash flows (102.79) (121.49)Gain on sale of investments (65.67) (6.08)Gain on changes in fair value of financial assets at FVTPL (136.79) (47.71)Provision for doubtful trade receivables 38.15 -
Operating profit before working capital changes 14,689.85 7,435.03
Change in operating assets and liabilities Increase in trade receivables (2,046.41) (50.77)(Increase) / decrease in inventories (361.98) 300.33 Decrease in non-current financial asset 0.55 201.58 Decrease in current financial asset 4.28 3.29 Decrease / (increase) in other non-current assets 95.96 (1,219.72)Decrease / (increase) in other financial assets 56.24 (56.26)Decrease in other current assets 72.45 148.87 Increase in trade payable 103.57 290.61 (Decrease) / increase in provision (28.46) 145.07 Increase in other liabilities 895.86 149.48
Cash generated from operations 13,481.91 7,347.51 Income taxes paid (net) (4,010.43) (1,374.11)
Net cash inflow by operating activities 9,471.48 5,973.40
Cash flows from investing activitiesPayment for purchase of investments (21,204.20) (20,523.21)Proceeds from sale of investments 19,320.02 15,960.91 Interest received 708.73 448.95 Dividend received 102.79 121.49 Payments for Property, plant and equipment (including capital work-in-progress and advances) (1,095.11) (677.16)Proceeds from sale of Property, plant and equipment 41.38 0.42 Intercorporate deposits given to related party (3,500.00) - Refund of intercorporate deposits from other Company - 1,400.00 Movement in bank balances which are not considered as cash and cash equivalents (10.83) -
Net cash outflow from investing activities (5,637.21) (3,268.60)
Cash flows from financing activitiesProceeds from / (Repayment of) short term borrowings (105.33) 72.23 Repayment of borrowings (1,000.00) (2,000.00)Dividend paid to company shareholders (including DDT) (2,340.94) (691.84)Interest paid (75.18) (204.05)
Net cash outflow from financing activities (3,521.45) (2,823.66)
Net Increase / (Decrease) in cash and cash equivalents 312.82 (118.86)Cash and cash equivalents at the beginning of the year 8.13 126.99 Cash and cash equivalents at the end of the year 320.95 8.13
The above consolidated Cash Flow statement should be read in conjunction with the accompanying notes.
As per our report of even date attached For and on behalf of the Board of Directors
For Price Waterhouse Chartered Accountants LLPChartered Accountants Firm Registration Number: 012754N/N500016
SURESH KHURANA Chief Executive Officer & DirectorDIN:06677496
NESS N. WADIADIN: 00036049
Chairman
R. BATRADIN: 00020764
N. P. GHANEKARDIN: 00009725
MINNIE BODHANWALADIN: 00422067
} Directors
Asha RamanathanPartnerMembership No. 202660
SHAILESH CHAUHANChief Financial Officer
Mumbai, May 24, 2018 Mumbai, May 24, 2018

96
1) General information: National Peroxide Limited (“NPL”, “Company”) and its subsidiary company comprise the Group. National Peroxide Limited
is a public limited Company established in 1954 and is listed on BSE Limited, Mumbai. NPL a pioneer in India for peroxygen chemicals is the largest manufacturer of Hydrogen Peroxide in India, with an installed capacity of 95 KTPA on 50% w/w. basis. Company’s registered office is situated at Neville House, J. N. Heredia Marg, Ballard Estate, Mumbai - 400 001.
2) Significant accounting policies and critical estimate and judgments:2.1 Basis of preparation, measurement and significant accounting policies
The principal accounting policies applied in the preparation of these consolidated financial statements are set out below. These policies have been consistently applied to all the years presented, unless otherwise stated. The financial statements are for the group consisting of National Peroxide Limited (the Company), its subsidiary.
(a) Basis of preparation(i) Compliance with Ind AS
The consolidated financial statements comply in all material aspects with Indian Accounting Standards (Ind AS) notified under Section 133 of the Companies Act, 2013 (the Act) [Companies (Indian Accounting Standards) Rules, 2015] and other relevant provisions of the Act.
The financial statements up to year ended March 31, 2017 were prepared in accordance with the accounting standards notifies under Companies (Accounting Standard) Rules, 2006 (as amended) and other relevant provisions of the Act.
These financial statements are the first financial statements of the group under Ind AS. Refer note 43 for an explanation of how the transition from previous GAAP to Ind AS has effected the group’s financial position, financial performance and cash flows.
(ii) Historical cost convention
The financial statements have been prepared on historical cost basis, except for the following:
(iii) Amended standards adopted by the group
The amendments to Ind AS 7 require disclosure of changes in liabilities arising from financing activities, see note 18.
(iv) Standards issued but not effective
Ind AS 115 – Revenue from Contracts from Customers
On March 28, 2018, the Ministry of Corporate Affairs issued Companies (Indian Accounting Standards) Amendment Rules, 2018, notifying Ind AS 115 – Revenue from Contracts with Customers. The accounting standard is applicable to the Company from April 1, 2018. This will replace (i) Ind AS 18 which covers contracts for goods and services, (ii) Ind AS 11 which covers construction contracts, and (iii) Guidance Note on Accounting for Real Estate Transactions which covers revenue recognition for property development projects.
The effective date for adoption of Ind AS 115 is financial periods beginning on or after April 1, 2018.
Appendix B to Ind AS 21 - Foreign currency transactions and advance consideration
The appendix clarifies how to determine the date of transaction for the exchange rate to be used on initial recognition of a related asset, expense or income where an entity pays or receives consideration in advance for foreign currency-denominated contracts. For a single payment or receipt, the date of the transaction should be the date on which the entity initially recognises the non-monetary asset or liability arising from the advance consideration (the prepayment or deferred income/contract liability). If there are multiple payments or receipts for one item, date of transaction should be determined as above for each payment or receipt.
The effective date for adoption of Ind AS 21 is financial periods beginning on or after April 1, 2018.
Ind AS 12 - Income taxes regarding recognition of deferred tax assets on unrealised losses
The amendments clarify the accounting for deferred taxes where an asset is measured at fair value and that fair value is below the asset’s tax base.

97
Annual Report 2017-2018
(v) Current vis-à-vis non-current classification
The assets and liabilities reported in the balance sheet are classified on a “current / non-current basis”, with separate reporting of assets held for sale and liabilities. Current assets, which include cash and cash equivalents, are assets that are intended to be realized, sold or consumed during the normal operating cycle of the group or in the 12 months following the balance sheet date; current liabilities are liabilities that are expected to be settled during the normal operating cycle of the group or within the 12 months following the close of the financial year. The deferred tax assets and liabilities are classified as non-current assets and liabilities.
(b) Principles of consolidation (i) Subsidiary is the entity over which the group has control. The group controls an entity when the group is exposed to, or has
rights to, variable returns from its involvement with the entity and has the ability to affect those returns through its power to direct the relevant activities of the entity. Subsidiary is fully consolidated from the date on which control is transferred to the group. They are deconsolidated from the date that control ceases.
(ii) The group combines the financial statements of the parent and its subsidiary line by line adding together like items of assets, liabilities, equity, income and expenses. Intercompany transactions, balances and unrealised gains on transactions between group companies are eliminated. Unrealised losses are also eliminated unless the transaction provides evidence of an impairment of the transferred asset. Accounting policies of subsidiary have been changed where necessary to ensure consistency with the policies adopted by the group.
(iii) The financial statements of the subsidiary used in consolidation is drawn up to the same reporting date as that of the parent company i.e. year ended March 31, 2018.
(iv) Following Subsidiary has been considered in the preparation of consolidated financial statements:
Name of the Company Country of Incorporation % of Holding and voting power either directly or indirectly through subsidi-ary as at 31.03.2018 and 31.03.2017 100%Naperol Investments Limited India
(c) Segment reporting: Operating segments are reported in a manner consistent with the internal reporting provided to the Chief Operating Decision-
Maker (CODM). The Chief Executive Officer and Director of National Peroxide Limited has been identified as CODM and he is responsible for
allocating resources, assess the financial performance of the group and make strategic decisions. The group has identified one reportable segment ‘manufacturing of peroxygens’ based on information reviewed by the CODM.(d) Foreign currency translation:
(i) Functional and presentation currency
Items included in the financial statements of each of the group entities are measured using the currency of the primary economic environment in which the entity operates (‘the functional currency’). The consolidated financial statements are presented in ‘Indian Rupees’ (INR), which is the group’s functional and presentation currency.
(ii) Transactions and balances
Foreign currency transactions are translated into the functional currency using the exchange rates at the dates of the transactions. Foreign exchange gains and losses resulting from the settlement of such transactions and from the translation of monetary assets and liabilities denominated in foreign currencies at year end exchange rates are generally recognized in profit or loss.
Non monetary items that are measured at fair value in a foreign currency are translated using the exchange rates at the date when the fair value was determined. Translation differences on assets and liabilities carried at fair value are reported as part of the fair value gain or loss. For example, translation differences on non monetary assets and liabilities such as equity instruments held at fair value through profit or loss are recognized in profit or loss as part of the fair value gain or loss and translation differences on nonmonetary assets such as equity investments classified as FVOCI are recognized in other comprehensive income.
(e) Revenue recognition and other income recognition: Revenue is measured at the fair value of the consideration received or receivable. Revenue is inclusive of excise duty and net
of trade discounts, rebates, state value added tax, service tax and goods and service tax (GST). With regard to sale of products, income is reported when practically all risks and rewards connected with the ownership have been transferred to the buyer. This usually occurs upon dispatch, after the price has been determined and collection of the receivable is reasonably certain.

98
Interest income
Interest income from debt instruments is recognised using the effective interest rate method. The effective interest rate is the rate that exactly discounts estimated future cash receipts through the expected life of the financial asset to the gross carrying amount of a financial asset. When calculating the effective interest rate, the group estimates the expected cash flows by considering all the contractual terms of the financial instrument (for example prepayment, extension, call and similar options) but does not consider the expected credit losses.
Dividend
Dividend are recognised in profit or loss only when the right to receive payment is established, it is probable that the economic benefits associated with the dividend will flow to the group, and the amount of the dividend can be measured reliably.
(f) Income tax: The income tax expense or credit for the period is the tax payable on the current period’s taxable income based on the applicable
income tax rate for each jurisdiction adjusted by changes in deferred tax assets and liabilities attributable to temporary differences and to unused tax losses.
The current income tax charge is calculated on the basis of the tax laws enacted or substantively enacted at the end of the reporting period in the countries where the Company and its subsidiary operates and generates taxable income. Management periodically evaluates positions taken in tax returns with respect to situations in which applicable tax regulation is subject to interpretation. It establishes provisions where appropriate on the basis of amounts expected to be paid to the tax authorities.
Deferred income tax is provided in full, using the liability method, on temporary differences arising between the tax base of assets and liabilities and their carrying amounts in the consolidated financial statements. Deferred income tax is also not accounted for if it arises from initial recognition of an asset or liability in a transaction other than a business combination that at the time of the transaction affects neither accounting profit nor taxable profit (tax loss). Deferred income tax is determined using tax rates (and laws) that have been enacted or substantially enacted by the end of the reporting period and are expected to apply when the related deferred income tax asset is realised or the deferred income tax liability is settled.
Deferred tax assets are recognised for all deductible temporary differences and unused tax losses only if it is probable that future taxable amounts will be available to utilise those temporary differences and losses.
Deferred tax liabilities are not recognised for temporary differences between the carrying amount and tax bases of investments in subsidiaries, where the group is able to control the timing of the reversal of the temporary differences and it is probable that the differences will not reverse in the foreseeable future.
Deferred tax assets are not recognised for temporary differences between the carrying amount and tax bases of investments in subsidiaries, where it is not probable that the differences will reverse in the foreseeable future and taxable profit will not be available against which the temporary difference can be utilised.
Deferred tax assets and liabilities are offset when there is a legally enforceable right to offset current tax assets and liabilities and when the deferred tax balances relate to the same taxation authority. Current tax assets and tax liabilities are offset where the entity has a legally enforceable right to offset and intends either to settle on a net basis or to realise the asset and settle the liability simultaneously.
Current and deferred tax is recognised in Profit or Loss, except to the extent that it relates to items recognised in other comprehensive income or directly in equity. In this case, the tax is also recognized in other comprehensive income or directly in equity, respectively.
(g) Leases Leases in which a significant portion of the risks and rewards of ownership are not transferred to the group, as lessee, are
classified as operating leases. Payments made under operating leases (net of any incentives received from the lessor) are charged to profit or loss on a straight-line basis over the period of the lease unless, the payments are structured to increase in line with expected general inflation, to compensate for the lessor’s expected inflationary cost increases.
(h) Impairment of non-financial assets: Assets are tested for impairment, wherever events or changes in circumstances indicate that the carrying amount may not be
recoverable. An impairment loss is recognised for the amount by which the asset’s carrying amount exceeds its recoverable amount. The recoverable amount is the higher of an asset’s fair value less costs of disposal and value in use. For the purposes of assessing impairment, assets are grouped at the lowest levels for which there are separately identifiable cash inflows which are largely independent of the cash inflows from other assets or groups of assets (cash-generating units). Non-financial assets that suffered an impairment are reviewed for possible reversal of the impairment at the end of each reporting period.

99
Annual Report 2017-2018
(i) Cash and Cash Equivalents : Cash and cash equivalents includes cash on hand, deposits held at call with financial institutions, other short term, highly liquid
investments with original maturities of three months or less that are readily convertible to known amounts of cash and which are subject to an insignificant risk of changes in value, and bank overdrafts. Bank overdrafts are shown within borrowings in current liabilities in the Balance sheet.
(j) Trade Receivables: Trade receivables are recognised initially at fair value and subsequently measured at amortised cost using the effective interest
method, less provision for impairment.
(k) Inventories: Inventories are valued at lower of cost and net realisable value. In the case of raw materials, packing materials and stores and
spares parts, cost is determined in accordance with the moving weighted average principle. Costs include the purchase price, non – refundable taxes and delivery and handling costs. Cost of finished goods and work in-progress include all costs of purchases, direct materials, direct labour and appropriate proportion of variable and fixed overheads expenditure. Cost of inventories also include all other costs incurred in bringing the inventories to their present location and condition. The net realisable value is the estimated selling price in the ordinary course of business less the estimated costs of completion and estimated costs necessary to make the sale.
(l) Investments and other financial assets:(i) Classification
The group classifies its financial assets in the following measurement categories:
those to be measured subsequently at fair value (either through Other Comprehensive Income or through profit or loss) and
The classification depends on the entity’s business model for managing the financial assets and the contractual terms of the cash flows.
For assets measured at fair value, gains and losses will either be recorded in profit or loss or other comprehensive income. For investments in equity instruments, this will depend on whether the group has made an irrevocable election at the time of initial recognition to account for the equity investment at fair value through other comprehensive income.
(ii) Measurement
At initial recognition, the group measures financial assets at its fair value plus, in the case of financial assets not at fair value through profit or loss, transaction costs that are directly attributable to the acquisition of the financial assets. Transaction costs of financial assets carried at fair value through profit or loss are expensed in the Statement of Profit or Loss.
Equity instruments
The group subsequently measures all equity investments at fair value. The group’s management has elected to present fair value gains and losses on equity investments in Other Comprehensive Income, there is no subsequent reclassification of fair value gains and losses to profit or loss. Dividend from such investments are recognised in the Statement of Profit and Loss as other income when the group’s right to receive payments is established.
Changes in fair value of financial assets at fair value through profit or loss are recognized in other gain / (losses) in the statement of profit and loss. Impairment losses (and reversal of impairment losses), if any on equity investments measured at FVOCI are recognised in statement of profit and loss.
(iii) Impairment of financial assets
The group assesses on a forward looking basis the expected credit losses associated with its assets carried at amortised cost. The impairment methodology applied depends on whether there has been a significant increase in credit risk.
For trade receivables only, the group applies the simplified approach permitted by Ind AS 109- ‘Financial Instruments’, which requires expected lifetime losses to be recognised from initial recognition of the receivables.
(iv) Derecognition of financial assets
A financial asset is derecognised only when:
retains the contractual rights to receive the cash flows of the financial asset, but assumes a contractual obligation to pay the cash flows to one or more recipients.

100
Where the entity has transferred an asset, the group evaluates whether it has transferred substantially all risks and rewards of ownership of the financial asset. In such cases, the financial asset is derecognised. Where the entity has not transferred substantially all risks and rewards of ownership of the financial asset, the financial asset is not derecognised.
Where the entity has neither transferred a financial asset nor retains substantially all risks and rewards of ownership of the financial asset, the financial asset is derecognised if the group has not retained control of the financial asset. Where the group retains control of the financial asset, the asset is continued to be recognised to the extent of continuing involvement in the financial asset.
(m) Offsetting Financial Instruments: Financial assets and liabilities are offset and the net amount reported in the balance sheet when there is a legally enforceable
right to offset the recognised amounts and there is an intention to settle on a net basis or realise the asset and settle the liability simultaneously. The legally enforceable right must not be contingent on future events and must be enforceable in the normal course of business and in the event of default, insolvency or bankruptcy of the group or the counterparty.
(n) Property, plant and equipment: Freehold land is carried at historical cost. All other items of property, plant and equipment are stated at historical cost less
depreciation and impairment, if any. Historical cost includes expenditure that is directly attributable to the acquisition of the items.
Subsequent costs are included in the asset’s carrying amount or recognised as a separate asset, as appropriate, only when it is probable that future economic benefits associated with the item will flow to the group and the cost of the item can be measured reliably. The carrying amount of any component accounted for as a separate asset is derecognised when replaced. All other repairs and maintenance are charged to profit or loss during the reporting period in which they are incurred.
Transition to Ind AS: On transition to Ind AS, the group has elected to continue with carrying value of all of its property, plant and equipment
recognized as at April 1, 2016 measured as per the provisions of previous GAAP and use that carrying value as demand cost of property, plant and equipment.
Depreciation methods, estimated useful lives and residual value: Depreciation is calculated using Straight Line Method (SLM) to allocate their cost, net of their residual values, over their estimated
useful lives prescribed in Schedule II to the Companies Act, 2013.
An asset’s carrying amount is written down immediately to its recoverable amount if the asset’s carrying amount is greater than its estimated recoverable amount.
Gains and losses on disposals are determined by comparing proceeds with carrying amount. These are included in profit or loss within other gains / (losses).
(o) Trade and other payables: These amounts represent liabilities for goods and services provided to the group prior to the end of financial year which are unpaid.
Trade and other payables are presented as current liabilities unless the payment is not due within 12 months of reporting period. Trade and other payables are initially recognized at fair value and subsequently measured at amortised cost using the effective interest method.
(p) Borrowings: Borrowings are initially recognised at fair value, net of transaction costs incurred. Borrowings are subsequently measured at
amortised cost. Any difference between the proceeds (net of transaction costs) and the redemption amount is recognised in profit or loss over the period of borrowings using the effective interest method.
Borrowings are removed from the Balance Sheet when the obligation specified in the contract is discharged, cancelled or expired. The difference between the carrying amount of a financial liability that has been extinguished or transferred to another party and the consideration paid, including any non-cash assets transferred or liabilities assumed, is recognised in profit or loss as other gains / (losses).
Borrowings are classified as current liabilities unless the group has an unconditional right to defer settlement of the liability for at least 12 months after the reporting period.
(q) Borrowing costs: General and specific borrowing costs that are directly attributable to the acquisition, construction or production of a qualifying
asset are capitalised during the period of time that is required to complete and prepare the asset for its intended use or sale. Qualifying assets are assets that necessarily take a substantial period of time to get ready for their intended use or sale.
Other borrowing costs are expensed in the period in which they are incurred.

101
Annual Report 2017-2018
(r) Provisions and Contingent Liabilities :Provisions
Provisions are recognised when the group has a present legal or constructive obligation as a result of past events; it is probable that an outflow of resources will be required to settle the obligation; and the amount has been reliably estimated.
Provisions are measured at the present value of management’s best estimate of the expenditure required to settle the present obligation at the end of the reporting period. The discount rate used to determine the present value is a pre-tax rate that reflects current market assessments of the time value of money and the risks specific to the liability. The increase in the provision due to the passage of time is recognised as interest expense.
Contingent liabilities
Contingent liabilities are disclosed when there is a possible obligation arising from past events, the existence of which will be confirmed only by the occurrence or non-occurrence of one or more uncertain future events not wholly within the control of the group. A present obligation that arises from past events where it is either not probable that an outflow of resources will be required to settle or reliable estimate of the amount cannot be made, is termed as contingent liability.
(s) Employee benefits:(i) Short-term obligations
Liabilities for wages and salaries, including non-monetary benefits that are expected to be settled wholly within 12 months after the end of the period in which the employees render the related service are recognised in respect of employees’ services up to the end of the reporting period and are measured at the amounts expected to be paid when the liabilities are settled. The liabilities are presented as current employee benefit obligations in the balance sheet.
(ii) Post employee obligations
The group operates the following post-employment schemes:
- defined benefit plans such as gratuity, pension and provident fund contributions made to a trust in case of certain employees
- defined contribution plans such as provident fund and superannuation fund. Pension and gratuity obligations
The liability or asset recognised in the balance sheet in respect of defined benefit pension and gratuity plans is the present value of the defined benefit obligation at the end of the reporting period less the fair value of plan assets. The defined benefit obligation is calculated annually by actuaries using the projected unit credit method.
The present value of the defined benefit obligation is determined by discounting the estimated future cash outflows by reference to market yields at the end of the reporting period on government bonds that have terms approximating to the terms of the related obligation.
The net interest cost is calculated by applying the discount rate to the net balance of the defined benefit obligation and the fair value of plan assets. This cost is included in employee benefit expense in the Statement of Profit and Loss.
Remeasurement gains and losses arising from experience adjustments and changes in actuarial assumptions are recognised in the period in which they occur, directly in Other Comprehensive Income. They are included in Retained Earnings in the Statement of Changes in Equity and in the Balance Sheet.
Changes in the present value of the defined benefit obligation resulting from plan amendments or curtailments are recognised immediately in profit or loss as past service cost.
Provident fund contributions made to a trust administered by the Company
In respect of certain employees, provident fund contributions are made to a trust administered by the Company. The interest rate payable to the members of the trust shall not be lower than the statutory rate of interest declared by the Central Government under the Employees Provident Funds and Miscellaneous Provisions Act, 1952 and shortfall, if any, shall be made good by the Company. The liability in respect of the shortfall of the interest earnings of the fund is determined on the basis of actuarial valuation.
Defined contribution plans
The group pays provident fund contributions to publicly administered provident funds as per local regulations and superannuation contributions to superannuation fund. The group has no further payment obligations once the contributions have been paid. The contributions are accounted for as defined contribution plans and the contributions are recognised as employee benefit expense when they are due. Further the obligations liability or asset recognised in the balance sheet in

102
respect of defined benefit pension and gratuity plans is the present value of the defined benefit obligation at the end of the reporting period less the fair value of plan assets. The defined benefit obligation is calculated annually by actuaries using the projected unit credit method.
(iii) Other long-term employee benefit obligations
The liabilities for earned leave and sick leave are not expected to be settled wholly within 12 months after the end of the period in which the employees render the related service. They are therefore measured as the present value of expected future payments to be made in respect of services provided by employees up to the end of the reporting period using the projected unit credit method. The benefits are discounted using the market yields at the end of the reporting period that have terms approximating to the terms of the related obligation. Remeasurements as a result of experience adjustments and changes in actuarial assumptions are recognised in Statement of Profit or Loss.
The obligations are presented as current liabilities in the balance sheet if the entity does not have an unconditional right to defer settlement for at least twelve months after the reporting period, regardless of when the actual settlement is expected to occur.
(t) Contributed equity: Equity shares are classified as equity.
Incremental costs directly attributable to the issue of new shares or options are shown in equity as a deduction, net of tax from the proceeds.
(u) Dividend: Provision is made for the amount of any dividend declared, being appropriately authorised and no longer at the discretion of the
entity, on or before the end of the reporting period but not distributed at the end of the reporting period.
(v) Earnings per share:Basic earnings per share
Basic earnings per share is calculated by dividing: - the profit attributable to owners of the group - by the weighted average number of equity shares outstanding during the financial year.
Diluted earnings per share
Diluted earnings per share adjusts the figures used in the determination of basic earnings per share to take into account:
- the after income tax effect of interest and other financing costs associated with dilutive potential equity shares, and - the weighted average number of additional equity shares that would have been outstanding assuming the conversion of all
dilutive potential equity shares.(w) Rounding of Amounts: All amounts disclosed in financial statements and notes have been rounded off to the nearest lakhs as per the requirement of
Schedule III, unless otherwise stated.
2.2 Critical accounting estimates and judgements:
The preparation of financial statements requires the use of accounting estimates which, by definition, will seldom equal the actual results. Management also needs to exercise judgement in applying the group’s accounting policies.
This note provides an overview of the areas that involved a higher degree of judgement or complexity, and of items which are more likely to be materially adjusted due to estimates and assumptions turning out to be different than those originally assessed. Detailed information about each of these estimates and judgements is included in relevant notes with information about the basis of calculation for each affected line item in the financial statements.
The areas involving critical estimates or judgements are:

103
Annual Report 2017-2018
Note 3 : Property, plant and equipment
` in Lakhs
Freehold land
Freehold Building
Plant and equipment
Furniture and fixtures
Office equipment Vehicles Total
Year ended March 31, 2017
Gross carrying amount Deemed cost as at April 1, 2016 5.89 337.53 17,562.75 52.52 8.20 - 17,966.89 Additions - - 767.08 - 7.09 - 774.17 Disposals - - - - (0.50) - (0.50)Balance as at March 31, 2017 5.89 337.53 18,329.83 52.52 14.79 - 18,740.56
Accumulated depreciationDepreciation charge during the year - 41.19 841.52 6.09 3.93 - 892.73 On disposal - - - - (0.24) - (0.24)Balance as at March 31, 2017 - 41.19 841.52 6.09 3.69 - 892.49 Net carrying amount as on March 31, 2017 5.89 296.34 17,488.31 46.43 11.10 - 17,848.07
Year ended March 31, 2018
Gross carrying amount Opening Gross carrying amount 5.89 337.53 18,329.83 52.52 14.79 - 18,740.56 Additions - - 20.91 0.11 29.73 29.61 80.36 Disposals - - (48.22) - - - (48.22)Balance as at March 31, 2018 5.89 337.53 18,302.52 52.63 44.52 29.61 18,772.70
Accumulated depreciationBalance as at April 1, 2017 - 41.19 841.52 6.09 3.69 - 892.49 Depreciation charge during the year - 38.89 866.17 6.20 7.53 0.37 919.16 On disposal - - (4.20) - - - (4.20)Balance as at March 31, 2018 - 80.08 1,703.49 12.29 11.22 0.37 1,807.45 Net carrying amount 5.89 257.45 16,599.03 40.34 33.30 29.24 16,965.25
i) The Group has availed the deemed cost exemption in relation to the Property, plant and equipment on the date of transition and hence the net block carrying amount has been considered as the gross block carrying on that date. Refer below for the gross block value and the accumulated depreciation on April 1, 2016 under the previous GAAP.
` in Lakhs
Property, plant and equipment Gross Block Accumulated Depreciation Net Block
Freehold land 5.89 - 5.89 Freehold Building 725.89 388.36 337.53 Plant and equipment 31,349.09 13,786.34 17,562.75 Furniture and fixtures 130.15 77.63 52.52 Office equipment 71.97 63.77 8.20 Vehicles - - - Total 32,282.99 14,316.10 17,966.89
ii) Refer note 39 for disclosure of contractual commitments for acquisition of property, plant and equipment.
Notes to the Consolidated Financial Statements for the Year ended March 31, 2018

104
Notes to the Consolidated Financial Statements for the Year ended March 31, 2018 (Contd.)
` in Lakhs
As at March 31, 2018
As at March 31, 2017
As at April 1, 2016
Note 4: Non-current financial assets - Investments
Investments in equity instruments (fully paid up)
Others (Quoted Investments) - FVOCI
1,895,900 (March 31, 2017: 1,895,900, April 1, 2016: 1,895,900) equity shares of The Bombay Dyeing & Manufacturing Company Limited of ` 2 each 4,532.15 1,573.60 902.45
5,460,600 (March 31, 2017: 5,460,600, April 1, 2016: 5,460,600) equity shares of The Bombay Burmah Trading Corporation Limited of ` 2 each 63,932.70 46,598.03 20,029.47
600 (March 31, 2017: 600, April 1, 2016: 600) equity shares of Housing Development Finance Corporation Limited of ` 2 each 10.95 9.01 6.64
2,500 (March 31, 2017: 2,500, April 1, 2016: 2,500) equity shares of HDFC Bank Limited of ` 2 each 47.15 36.06 26.78
18 (March 31, 2017: 12, April 1, 2016: 12) equity share of Larsen Toubro Limited of `2 each 0.16 0.19 0.15
3,000 (March 31, 2017: 3,000, April 1, 2016: 3,000) equity share of Technojet Consultants Limited of `10 each 1.60 1.60 1.60
60 (March 31, 2017: 60, April 1, 2016: 60) equity share of ABB Limited of ` 2 each 0.78 0.77 0.77
56 (March 31, 2017: 56, April 1, 2016: 56) equity share of Tata Chemicals Limited of `10 each 0.38 0.34 0.21
50 (March 31, 2017: 50, April 1, 2016: 50) equity share of Finolex Cables Limited of `2 each 0.34 0.26 0.14
300 (March 31, 2017: 300, April 1, 2016: 300) equity share of ACC Limited of `10 each 4.52 4.34 4.15
132 (March 31, 2017: 132, April 1, 2016: 132) equity share of Colgate Palmolive India Limited of Re.1 each 1.40 1.31 1.10
233 (March 31, 2017: 233, April 1, 2016: 233) equity share of Jaykay Enterprises Limited of Re.1 each 0.01 0.02 0.01
7 (31 March 2017: 7, 1 April 2016: 7) equity share of ORG Infomatics Limited of `10/- each - - -
46 (March 31, 2017: 46, April 1, 2016: 46) equity share of J.K.Cement Limited of `10 each 0.47 0.43 0.31
5,131 (March 31, 2017: 4,665, April 1, 2016: 4,665) equity share of ICICI BANK Limited of `2 each 14.28 12.92 11.04
12 (March 31, 2017: 12, April 1, 2016: 12) equity share of GE Power India Limited (formerly known as Alstom Projects India Limited) of `10 each 0.11 0.07 0.07
1 (March 31, 2017: 1, April 1, 2016: 1) equity share of UltraTech Cement Limited of `10 each 0.04 0.04 0.03

105
Annual Report 2017-2018
` in Lakhs
As at March 31, 2018
As at March 31, 2017
As at April 1, 2016
Others (Unquoted Investments) - FVOCI
1,000 (March 31, 2017: 1,000, April 1, 2016: 1,000 ) equity share of B. R. T. Limited of `100 each 14.64 14.64 14.64
393 (March 31, 2017: 393, April 1, 2016: 393) units of 0% Unsecured Fully Convertible Debentures of Nowrosjee Wadia and Sons Limited, of ` 100 each* 42.84 42.84 42.84
Investments in mutual funds (Unquoted Investments - FVTPL)
71,667.61 (March 31, 2017: 71,667.61, April 1, 2016: 71,667.61) units of Kotak Bond Scheme Plan A - Growth 34.09 33.18 30.13
903,524.21 (March 31, 2017: 903,524.21, April 1, 2016: 9,03,524.21) units of DHFL Pramerica Short Maturity Fund Regular Plan Growth 287.48 269.20 245.76
507,378.49 (March 31, 2017: 507,378.49, April 1, 2016: nil) units of Kotak Income Opportunity Fund Direct Plan-Growth 101.85 94.72 -
349,782.42 (March 31, 2017: 325,456.93, April 1, 2016: nil) units of ICICI Equity Arbitrage Fund 50.52 47.47 -
4,606.86 (March 31, 2017: nil, April 1, 2016: nil) units of SBI Premier Liquid Fund Direct Plan DDR 46.22 - -
Total 69,124.68 48,741.04 21,318.29 Aggregate amount of quoted investments 68,547.04 48,238.99 20,984.92 Aggregate market value of quoted investments 68,547.04 48,238.99 20,984.92 Aggregate amount of unquoted investments 577.64 502.05 333.37 Aggregate amount of impairment in the value of investments - - -
*The Group held these investments in 'Sunflower Investments and Textiles Limited' (Sunflower). Pursuant to the merger of Sunflower into Nowrosjee Wadia and Sons Limited (NWS), these debentures in Sunflower is cancelled and NWS has issued debentures to the Group.
Note 5: Non-current financial assets - Loans (Unsecured, considered good)Security Deposits 40.35 40.90 242.48 Total 40.35 40.90 242.48
` in LakhsYear ended
March 31, 2018Year ended
March 31, 2017Note 6 : Income tax expenseThe major components of income tax expense for the years ended March 31, 2018 and March 31, 2017 are as under:
(a) Income tax recognised in statement of profit and loss
Income tax expense
(i) Current tax expense 4,212.71 1,467.69 Total current tax expense 4,212.71 1,467.69
(ii) Deferred tax expenseDecrease / (increase) in defered tax assets 689.88 246.95 (Decrease) / increase in deferred tax liabilities 211.17 204.14 Total deferred tax expense 901.05 451.09 Total Income tax expense 5,113.76 1,918.78
Notes to the Consolidated Financial Statements for the Year ended March 31, 2018 (Contd.)

106
` in LakhsYear ended
March 31, 2018Year ended
March 31, 2017(b) Income tax recognised in other comprehensive income(i) Current tax benefitRemeasurement of defined benefit obligation 0.98 (17.10)Total current tax benefit 0.98 (17.10)
(ii) Deferred tax expenseRemeasurment of defined benefit obligation (6.55) 2.34 Financial asset measured at FVOCI (23.51) - Total deferred tax expense (30.06) 2.34
Total Income tax expense (29.08) (14.76)
(c) Reconciliation of effective tax rate: Profit before tax 14,697.47 5,782.29 Tax at the applicable Indian tax rate 5,080.06 1,997.45 Tax effect of amounts which are not deductible / (taxable) in calculating taxable income: Expenses that are not deductible in determining taxable profit 14.78 17.65 Income exempt from income tax (48.32) (55.55) Change in income tax rates 32.34 - Others 34.90 (40.77)Income tax expense 5,113.76 1,918.78
` in Lakhs
(d) Tax assets As at March 31, 2018
As at March 31, 2017
Opening balance 142.67 253.35 Add: Taxes paid 4,010.43 1,374.11 Less: Current tax payable for the year 4,211.73 1,484.79 Closing balance (58.63) 142.67
Current tax assets 298.38 273.12 Current tax liabilities (357.01) (130.45)
(e) Significant estimates
In calculating the tax expense for the current year, the Group has treated certain expenditures as being deductible for tax purposes. Also refer note 32.
` in Lakhs
(f) Movement in deferred tax liabilities As at March 31, 2018
As at March 31, 2017
As at April 1, 2016
Deferred tax liabilities 3,548.26 3,313.58 3,109.44 Less: deferred tax assets 151.69 848.12 1,092.72 Deferred tax liability (net) 3,396.57 2,465.46 2,016.72
Movement of deferred tax balances` in Lakhs
March 31, 2018 Net balance April 1, 2017
Recognised in profit and loss
Recognised in OCI
Net deferred tax liabilities
Property, Plant and Equipment 3,294.08 169.77 - 3,463.85 Financial asset measured at FVTPL 19.26 41.64 - 60.90 Financial asset measured at FVOCI - - 23.51 23.51 Measurement of borrowings at amortised cost 0.24 (0.24) - - Total deferred tax liabilities 3,313.58 211.17 23.51 3,548.26
Notes to the Consolidated Financial Statements for the Year ended March 31, 2018 (Contd.)

107
Annual Report 2017-2018
Notes to the Consolidated Financial Statements for the Year ended March 31, 2018 (Contd.)
` in Lakhs
Net balance April 1, 2017
Recognised in profit and loss
Recognised in OCI
Net deferred tax liabilities
Provision for post retirement benefits and other employee benefits 153.01 (8.10) (6.55) 138.36
Provision for doubtful debts - 13.33 - 13.33 Other provisions 38.89 (38.89) - - Loss on account of embezzlement of funds 656.22 (656.22) - - Total deferred tax assets 848.12 (689.88) (6.55) 151.69
Deferred tax liability (net) 2,465.46 901.05 30.06 3,396.57
` in Lakhs
March 31, 2017 Net balance April 1, 2016
Recognised in profit and loss
Recognised in OCI
Net deferred tax liabilities
Property, plant and equipment 3,095.94 198.14 - 3,294.08
Financial asset measured at FVTPL 10.65 8.61 - 19.26
Financial asset measured at FVOCI - - - -
Measurement of borrowings at amortised cost 2.85 (2.61) - 0.24
Total deferred tax liabilities 3,109.44 204.14 - 3,313.58
Provision for post retirement benefits and other employee benefits 114.89 35.78 2.34 153.01
Provision for doubtful debts 34.86 (34.86) - -
Other provisions - 38.89 - 38.89
Loss on account of embezzlement of funds 374.17 282.04 - 656.22
MAT credit entitlement 568.80 (568.80) - -
Total deferred tax assets 1,092.72 (246.95) 2.34 848.12
Net deferred tax liability (net) 2,016.72 451.09 (2.34) 2,465.46
` in Lakhs
As at March 31, 2018
As at March 31, 2017
As at April 1, 2016
Note 7: Other non-current assets(Unsecured, considered good)Balances with government authorities 674.04 762.30 703.73 Prepayments 6.37 14.07 15.19 Capital Advances 636.26 - 1.44 Total 1,316.67 776.37 720.36
Note 8: InventoriesRaw materials 387.19 387.53 280.13 Finished goods 399.37 67.97 578.78 Stores and spares and packing materials 686.14 655.22 552.14 Total 1,472.70 1,110.72 1,411.05

108
` in Lakhs
As at March 31, 2018
As at March 31, 2017
As at April 1, 2016
Note 9: Current financial assets - InvestmentsInvestments in Mutual Funds (Unquoted Investments - FVTPL)
Nil (March 31, 2017: 10,073,425.22, April 1, 2016: Nil) units of Kotak Treasury Advantage Fund - Direct Plan - Daily Dividend of ` 10 each - 1,015.45 -
Nil (March 31, 2017: 122,656.85, April 1, 2016: Nil) units of SBI Pre-mier Liquid Fund -Regular Plan - Daily Dividend of ` 1,000 each - 1,230.55 -
22,751,160.73 (March 31, 2017: 8,105,559.00, April 1, 2016: 5,768,071.46) units of JM Money Manager Fund - Super Plus Plan (Direct) - Daily Dividend (479) of ` 10 each
2,300.92 819.30 578.75
7,521,691.33 (March 31, 2017: 3,649,700.88, April 1, 2016: Nil) units of HDFC Floating Rate Income Fund - Short Term Plan - Wholesale Option - Growth of ` 10 each
2,285.26 1,035.04 -
711,987.35 (March 31, 2017: 289,221.35, April 1, 2016: Nil) units of Aditya Birla Sunlife Saving Fund - Growth - Direct Plan of ` 100 each 2,451.03 925.83 -
Total 7,037.21 5,026.17 578.75
Aggregate amount of quoted investments - - -
Aggregate market value of quoted investments - - -
Aggregate amount of unquoted investments 7,037.21 5,026.17 578.75
Aggregate amount of impairment in the value of investments - - -
Note 10: Trade receivablesUnsecured, considered good 5,325.04 3,316.78 3,266.01 Doubtful 38.15 - 100.73 Less: Allowance for doubtful debts (38.15) - (100.73)Total 5,325.04 3,316.78 3,266.01
Note 11: Cash and cash equivalentsCash on hand 2.27 2.75 1.33 Balances with banks in current account 318.68 5.38 36.18 Deposits with maturity of less than three months - - 89.48 Total 320.95 8.13 126.99
Note 12: Bank balances other than cash and cash equivalentsUnpaid dividend accounts 49.23 38.40 38.53 Total 49.23 38.40 38.53
Note 13: Current financial assets - Loans (Unsecured, considered good)Security deposits 24.34 28.62 31.91 Intercorporate deposits to related party (Refer note 41)# 6,500.00 3,000.00 3,000.00 Intercorporate deposits to other companies - - 1,400.00 Total 6,524.34 3,028.62 4,431.91
#[The Company has, during the year, given Intercorporate Deposit (ICD) for general business purposes to Nowrosjee Wadia and Sons Ltd. `3,000 Lakhs (Previous year Nil) and Wadia Techno - Engineering Services Ltd. ` 500 Lakhs ( Previous Year Nil). The interest rate of the said ICDs is 12.50% p.a. and these are repayable on demand.]
Notes to the Consolidated Financial Statements for the Year ended March 31, 2018 (Contd.)

109
Annual Report 2017-2018
` in LakhsAs at
March 31, 2018As at
March 31, 2017As at
April 1, 2016Note 14: Other financial assets (Unsecured, considered good)Interest accrued but not due on deposits 41.61 37.43 17.66 Other receivables 0.02 56.26 - Total 41.63 93.69 17.66
Note 15: Other current assets (Unsecured, considered good)Advance to gratuity fund 7.42 - 21.86 Advances for expenses 42.15 61.87 31.47 Balances with government authorities 49.81 91.02 280.92 Prepayments 64.95 66.64 51.69 Advances to suppliers 32.43 49.18 31.89 Advance to employees - 0.50 0.25 Total 196.76 269.21 418.08
Note 16: Equity share capitalAuthorised25,000,000 (March 31, 2017: 25,000,000, April 1, 2016: 25,000,000) Equity shares of ` 10 each 2,500.00 2,500.00 2,500.00
Issued, subscribed and fully paid
5,747,000 (March 31, 2017: 5,747,000, April 1, 2016: 5,747,000) Equity shares of ` 10 each 574.70 574.70 574.70
Total 574.70 574.70 574.70
` in LakhsAs at March 31, 2018 As at March 31, 2017 As at April 1, 2016
Reconciliation of the number of shares Number of shares Amount Number
of shares Amount Number of shares Amount
Balance at the beginning of the year 5,747,000 574.70 5,747,000 574.70 5,747,000 574.70 Issued during the year - - - - - - Balance at the end of the year 5,747,000 574.70 5,747,000 574.70 5,747,000 574.70
Rights, preferences and restrictions attached to equity sharesThe Group has one class of equity share having a par value of ` 10 per share. Each shareholder is eligible for one vote per share held. The dividend proposed by the Board of Directors is subject to the approval of the shareholders in the ensuing annual general meeting, except in case of interim dividend.
In the event of liquidation of the Company, the equity shareholders are eligible to receive the remaining assets of the Company, after distribution of all preferential amounts, in proportion to their shareholdings.
Details of shares held by the holding company, ultimate holding company and subsidiary of holding company:` in Lakhs
As at March 31, 2018 As at March 31, 2017 As at April 1, 2016
Name of shareholder Number of shares % Number
of shares % Number of shares %
Ben Nevis Investments Limited, British Virgin Island, ultimate holding company 51,500 0.90 - - - -
Nowrosjee Wadia and Sons Limited, holding company 1,769,125 30.78 - - - -
Macrofil Investments Limited, subsidiary of holding company 1,918,109 33.38 - - - -
Notes to the Consolidated Financial Statements for the Year ended March 31, 2018 (Contd.)

110
Details of shareholders holding more than 5% shares in the Group:
As at March 31, 2018 As at March 31, 2017 As at April 1, 2016
Name of shareholder Number of shares % Number of
shares % Number of shares %
Nowrosjee Wadia and Sons Limited 1,769,125 30.78 1,653,325 28.77 - -
Macrofil Investments Limited 1,918,109 33.38 1,918,109 33.38 1,908,668 33.21
Solvay S A, Belgium - - - - 1,442,500 25.10 Pursuant to the scheme of arrangement sanctioned by National Company Law Tribunal vide its order dated June 22, 2017 and filed with the Registrar of Companies on August 2, 2017, N.W. Exports Limited and Sunflower Investments and Textiles Limited, both having investment in Macrofil Investments Limited, has been amalgamated into Nowrosjee Wadia and Sons Limited (“NWS”).Post merger, NWS became the holding company of Macrofil Investments Limited which holds 33.38% shareholding in the National Peroxide Limited (NPL). Accordingly, NWS became the holding Company of the group and Ben Nevis Investments Limited has became the ultimate holding company of the group.
Note 17: Other equity
` in LakhsAs at
March 31, 2018As at
March 31, 2017As at
April 1, 2016
General reserve 3,367.30 3,362.40 3,357.86
Capital redemption reserve 0.02 0.02 0.02
Special reserve under section 45IC of RBI Act, 1934 144.30 134.50 125.43
Retained earnings 29,240.02 22,012.43 18,826.33
FVOCI - Equity instruments 68,359.35 48,074.80 20,820.73
Total 101,110.99 73,584.15 43,130.37
Nature and purpose of reserves General reserve The Group has transferred a portion of the net profit of the Group before declaring dividend to general reserve pursuant to the earlier provisions of Companies Act, 1956. Mandatory transfer to general reserve is not required under the Companies Act, 2013.
Capital redemption reserve As per the provisions of Companies Act, Capital redemption reserve is created out of the general reserve for the amount of share capital reduction / buyback in earlier years.
Special reserve under section 45IC of RBI Act, 1934Under section 45 (IC) of Reserve Bank of India Act, 1934, every Non-Banking Financial Company shall create a reserve fund and transfer therein a sum based on the provisions of the said Act.
Retained earnings Retained earnings are the profits that the Group has earned till date, less any transfers to general reserve, dividends or other distributions paid to shareholders. Further, it also includes the impact of remeasurements of the defined benefit obligations, net of tax.
FVOCI - Equity instruments
The Group has elected to recognise changes in the fair value of certain investments in equity securities in other comprehensive income. These changes are accumulated within the FVOCI equity investments reserves within equity. The Group transfers amounts from this reserve to retained earnings when the relevant equity securities are derecognised.
Notes to the Consolidated Financial Statements for the Year ended March 31, 2018 (Contd.)
111
Annual Report 2017-2018
Terms of repayment Repayable on demand.
Nature of security i) Primary Security:
First pari passu charge by way of hypothecation over the Parent Company’s entire stocks of inventory and receivables along with other working capital banks under consortium.
ii) Collateral: Second pari passu charge on the entire fixed assets of the Parent Company including land located at NRC Road, P.O. Atali, via Mohone, Kalyan, Dist. Thane.
` in LakhsAs at
March 31, 2018As at
March 31, 2017As at
April 1, 2016Note 18: Non-current financial liabilities - BorrowingsSecuredTerm loan from Bank - - 999.30 Total - - 999.30
Terms of repayment Repayable in 10 quarterly instalments of ` 500 lakhs beginning from April 15, 2015 and carrying an interest rate of 10.25% per annum payable on monthly basis. The current maturity amount as at March 31, 2018 is ` NIL (March 31, 2017 `1,000 lakhs and April 1, 2016 ` 3,000 lakhs) of the loan has been shown under note 22 - Other current financial liabilities.
Nature of securitySecured by a first charge by way of Hypothecation of plant and machinery and other movables and second charge on industrial land at Kalyan and building thereon by way of mortgage.
` in Lakhs
Net debt reconciliation As at March 31, 2018
As at March 31, 2017
Non-current borrowings - - Current borrowings - 1,104.63
Non-current borrowings
Current borrowings Total
Net debt as at April 1, 2017 999.30 105.33 1,104.63 Cash flow (1,000.00) (105.33) (1,105.33)Interest accrued 0.29 - 0.29 Interest expenses 17.27 0.30 17.57 Interest paid (16.86) (0.30) (17.16)Net debt as at March 31, 2018 - - -
Note 19: Non-current - Provisions
` in LakhsAs at
March 31, 2018As at
March 31, 2017As at
April 1, 2016For employee benefits (Refer note 40)Leave encashment and compensated absence 199.16 207.69 137.90 Pension 55.63 71.33 61.14 Total 254.79 279.02 199.04
Note 20: Current financial liabilities - Borrowings
SecuredCash credit - 105.33 33.10 Total - 105.33 33.10
Notes to the Consolidated Financial Statements for the Year ended March 31, 2018 (Contd.)

112
` in Lakhs
As at March 31, 2018
As at March 31, 2017
As at April 1, 2016
Note 21: Trade payables
Dues to micro and small enterprises - 0.06 0.06
Dues to others 2,027.03 1,923.40 1,632.79
Total 2,027.03 1,923.46 1,632.85
Disclosure of amounts payable to vendors as defined under the “Micro, Small and Medium Enterprise Development Act, 2006” is based on the information available with the Group regarding the status of registration of such vendors under the said Act. There are no overdue principal amounts / interest payable amounts for delayed payments to such vendors at the Balance Sheet date. There are no delays in payment made to such suppliers during the year or for any earlier years and accordingly, there is no interest paid or outstanding interest in this regard in respect of payments made during the year or brought forward from previous years.
Note 22: Other current financial liabilities
Current maturities of long term borrowings - 999.30 1,992.46
Interest accrued but not due on borrowings - 0.29 0.84
Deposits received from customers 2.70 2.70 2.70
Capital creditors 17.30 - 24.27
Interest accrued on others - 25.00 15.00
Unpaid dividend 49.23 38.40 38.53
Total 69.23 1,065.69 2,073.80
Note 23: Other current liabilities
Advance received from customer 3.96 3.12 5.43
Statutory dues (including provident fund, tax deducted at source and others) 693.72 48.88 38.55
Payable to employees 571.37 321.19 179.73
Total 1,269.05 373.19 223.71
Note 24: Current - Provisions
For employee benefits (Refer note 40)
Gratuity 76.65 74.89 82.75
Leave encashment and compensated absence 130.41 153.71 119.58
Pension 10.74 9.36 13.32
Total 217.80 237.96 215.65
Notes to the Consolidated Financial Statements for the Year ended March 31, 2018 (Contd.)

113
Annual Report 2017-2018
` in LakhsYear ended
March 31, 2018Year ended
March 31, 2017Note 25: Revenue from operationsSale of goods (including excise duty) 31,032.33 26,143.87 Dividend income from investments measured at FVTPL (on investing operation) 49.88 46.04 Fair value gain on investments measured at FVTPL (on investing operation) 25.85 32.46 Other operating revenues Scrap sales 10.67 13.66
Total 31,118.73 26,236.03
Note 26: Other incomeInterest income on financial assets at amortised cost Interest income on inter-corporate deposits 703.77 459.74 Other interest income 9.13 8.98 Dividend income from equity investments designated at FVOCI (Refer below) 23.34 20.31 Dividend income from other investments measured at FVTPL 79.45 101.18 Fair value gain on investments measured at FVTPL 110.94 15.25 Gain on sale of investments 65.67 6.08 Net gain on disposal of Property, plant and equipment - 0.16 Net foreign exchange gain 15.42 7.16 Other miscellaneous income 5.97 - Total 1,013.69 618.86
All dividends from equity investments designated at FVOCI relate to investments held at the end of the reporting period. There was no dividend income relating to investments derecognised during the reporting period.
Note 27: Cost of materials consumedOpening balance of raw materials 387.53 280.13 Add: Purchases made during the year 6,858.06 5,716.65 Less: Closing balance of raw materials (387.19) (387.53)Total 6,858.40 5,609.25
Note 28: Changes in inventories of finished goodsHydrogen peroxide Opening balance 67.97 578.78 Closing balance (399.37) (67.97)Total (331.40) 510.81
Note 29: Employee benefit expensesSalaries, wages and bonus 1,775.65 1,808.33 Contribution to provident fund, gratuity, pension and other funds (Refer note 40) 231.54 262.86 Workmen and staff welfare expenses 247.91 277.31 Total 2,255.10 2,348.50
Note 30: Finance costsInterest expenses on financial liability not at FVTPL 16.86 186.79 Other interest expense 33.03 26.71 Unwinding of interest on financial liability measured at amortised cost 0.70 7.54 Total 50.59 221.04
Notes to the Consolidated Financial Statements for the Year ended March 31, 2018 (Contd.)

114
` in LakhsYear ended
March 31, 2018Year ended
March 31, 2017Note 31 : Other expensesConsumption of stores and spares 408.43 669.81 Repairs and maintenance
Plant and machinery 502.31 704.80 Buildings 2.62 4.29
Power, fuel and water 2,711.74 3,020.10 Rent 54.31 44.92 Rates and taxes 35.51 37.11 Legal and professional fees 294.10 332.80 Excise duty (10.55) (66.30)Insurance 61.39 40.45 Commission expenses 4.65 9.35 Packing and container expenses 1,704.02 1,962.34 Payment to auditors
Statutory audit fees 32.75 10.05 Others 4.50 8.54 Reimbursement of out of pocket expenses 0.09 -
Allowance for doubtful debts 38.15 - Corporate social responsibility expenditure (Refer below) 80.00 74.05 Commission to non executive Directors 149.00 55.15 Directors sitting fees 18.01 16.27 Miscellaneous expenses 840.19 870.60 Net loss on disposal of Property, plant and equipment 2.63 - Total 6,933.85 7,794.33
Expenditure on corporate social responsibility:
Contribution to Sir Ness Wadia Foundation(i) Contribution to Nowrosjee Wadia Maternity Hospital* 72.00 66.64 (ii) Contribution to Patil Bal Mandir School, Kalyan, Maharashtra 8.00 7.41
Total 80.00 74.05 Amount required to be spent as per section 135 of the Act 79.85 74.05 Amount spent during the year on:i) Construction/Acquisition of an asset 8.00 7.41 ii) On purposes other than (i) above 72.00 66.64 Total 80.00 74.05 *Amount has been spent directly by contribution to Nowrosjee Wadia Maternity Hospital in the previous year.
Note 32: Exceptional items
Refund received from Maharashtra State Electricity Distribution Company Limited towards tariff difference between continuous supply and non-continuous supply (105.92) (414.19)
Provision for expected loss on reduction in net realisable value of Capital work-in-progress - 20.86
Loss on account of embezzlement of funds (Refer note below) - 1,162.27 Total (105.92) 768.94
Notes to the Consolidated Financial Statements for the Year ended March 31, 2018 (Contd.)

115
Annual Report 2017-2018
(i) Embezzlement of funds of the Parent Company1. During the current financial year, the Parent Company’s management has identified instances of embezzlement of its funds by certain employees of the Parent Company, including senior management employees, whose services have since been terminated. Based on the management’s scrutiny and the forensic investigation report, the amount of the embezzlement is `3,702.98 lakhs. The Parent Company has initiated criminal proceedings against these employees including filing of FIR and application for other appropriate action with the Joint Commissioner of Police, Economic Offences Wing. Pending the recovery procedures, the financial statements have been adjusted to give effect to the above embezzlement. The total amount of such embezzlement is `3,702.98 lakhs, pertaining entirely to the period upto March 31, 2017. Of these, `1,459.54 lakhs were accounted as cost of materials consumed and other expenses prior to the Ind AS transition date of April 1, 2016 and `347.32 lakhs, during the previous financial year ended March 31, 2017. The balance amount of `1,896.12 lakhs, which were shown as recoverable under the head “Balance with Excise, Customs, Sales Tax etc.” has now been debited to equity for ̀ 1,081.17 lakhs as on the Ind AS transition date of April 1, 2016 and to Exceptional Items “Loss on account of embezzlement of funds” for `814.95 lakhs during the previous financial year ended March 31, 2017. The net impact after considering the tax effect of the above adjustments now effected is `706.99 lakhs as at the Ind AS transition date of April 1, 2016 and ` 532.92 lakhs in the previous financial year ended March 31, 2017. Further the Parent Company has reclassified `347.32 lakhs charged to the Statement of Profit and Loss during the previous financial year ended March 31, 2017 as exceptional items, “Loss on account of Embezzlement of funds”.
2. The Board has appointed Mr. Suresh Khurana as CEO and Director of the Parent Company and Mr. S. Raja as Vice President - Commercial and Finance of the Parent Company on December 15, 2017, immediately on termination of the earlier senior management team. The Board also appointed new internal auditors. The new Management, from January 2018, commenced by focusing on addressing gaps in entity level controls; identifying mitigating compensating controls for system gaps, revisiting the Chart of Authority, reviewing all the identified gaps in business processes, instituting new / compensating controls and maker checker controls more specifically in areas like review and approval of bank payments, journal entries, cost of goods sold ledger, reconciliation of direct and indirect taxes, re-performance of inventory valuation etc., and ensured design of controls was in place and gaps were remediated as at the beginning of January 2018. The new Management, assisted by the internal auditors subsequently tested all the controls for adequacy and operating effectiveness as on March 31, 2018.
3. Additionally, the new management has re-performed several procedures viz., reviewing sales and purchase price, analyzing customer / vendor wise sales / purchase price, reviewing scrap sales, reviewing key contracts entered into etc., to ensure that there were no transactions / account balances during the year ended and as at March 31, 2018 that were impacted by the embezzlement.
Note 33: Fair value measurements(a) Financial instruments by category
` in Lakhs
ParticularsAs at March 31, 2018 As at March 31, 2017 As at April 1, 2016
FVTPL FVOCI# Amortised cost FVTPL FVOCI# Amortised
cost FVTPL FVOCI# Amortised cost
Financial assetsInvestment
-Equity instruments - 68,561.68 - - 48,253.63 - - 20,999.56 -
-Mutual funds 7,557.37 - - 5,470.74 - - 854.64 - -
-Convertible instruments - 42.84 - - 42.84 - - 42.84 -
Trade receivables - - 5,325.04 - - 3,316.78 - - 3,266.01
Cash and cash equivalents - - 320.95 - - 8.13 - - 126.99
Bank balances other than cash and cash equivalents - - 49.23 - - 38.40 - - 38.53
Security deposits - - 64.69 - - 69.52 - - 274.39
Inter corporate deposits## - - 6,541.61 - - 3,037.43 - - 4,416.21
Other financial assets - - 0.02 - - 56.26 - - 1.45
Total financial assets 7,557.37 68,604.52 12,301.54 5,470.74 48,296.47 6,526.52 854.64 21,042.40 8,123.58
Financial liabilitiesBorrowing - - - - - 1,104.92 - - 3,025.70
Trade payable - - 2,027.07 - - 1,923.42 - - 1,632.85
Other financial liabilities - - 69.23 - - 66.10 - - 80.50
Total financial liabilities - - 2,096.30 - - 3,094.44 - - 4,739.05
Notes to the Consolidated Financial Statements for the Year ended March 31, 2018 (Contd.)

116
(b) Fair value hierarchyThis section explains the judgements and estimates made in determining the fair values of the financial instruments that are (a) recognised and measured at fair value and (b) measured at amortised cost and for which fair values are disclosed in the financial statements. To provide an indication about the reliability of the inputs used in determining fair value, the Group has classified its financial instruments into the three levels prescribed under the accounting standard. An explanation of each level follows underneath the table.
` in Lakhs
Financial assets and liabilities measured at fair value - recurring fair value measurements as at March 31, 2018 Level 1 Level 2 Level 3 Total
Financial assets
Investment in equity instruments (at FVOCI) 68,547.04 14.64 - 68,561.68
Investment in mutual funds (at FVTPL) 7,557.37 - - 7,557.37
Investment in convertible instruments (at FVOCI) - 42.84 - 42.84
Total financial assets 76,104.41 57.48 - 76,161.89
Assets and liabilities which are measured at amortised cost for which fair values are disclosed as at March 31, 2018
Level 1 Level 2 Level 3 Total
Financial assets
Security deposits - - 40.35 40.35
Total financial assets - - 40.35 40.35
Financial liabilities - - - -
Total financial liabilities - - - -
Financial assets and liabilities measured at fair value - recurring fair value measurements as at March 31, 2017
Level 1 Level 2 Level 3 Total
Financial assets
Investment in equity instruments (at FVOCI) 48,238.99 14.64 - 48,253.63
Investment in mutual funds (at FVTPL) 5,470.74 - - 5,470.74
Investment in convertible instruments (at FVTPL) - 42.84 - 42.84
Total financial assets 53,709.73 57.48 - 53,767.21
Assets and liabilities which are measured at amortised cost for which fair values are disclosed as at March 31, 2017
Level 1 Level 2 Level 3 Total
Financial assets
Security deposits - - 40.90 40.90
Total financial assets - - 40.90 40.90
Financial liabilities - - - -
Total financial liabilities - - - -
# These are investment in equity securities which are not held for trading, and for which the group has made an irrevocable election at initial recognition to recognise changes in fair value through other comprehensive income rather than profit or loss as these are strategic investments and the Group considered this to be more relevant.
## Inter corporate deposits include interest accrued till the year end, whereas the same has been classified under other financial assets in the financial statements.
Notes to the Consolidated Financial Statements for the Year ended March 31, 2018 (Contd.)

117
Annual Report 2017-2018
` in Lakhs
Financial assets and liabilities measured at fair value - recurring fair value measurements as at April 1, 2016
Level 1 Level 2 Level 3 Total
Financial assets
Investment in equity instruments (at FVOCI) 20,984.92 14.64 - 20,999.56
Investment in mutual funds (at FVTPL) 854.64 - - 854.64
Investment in convertible instruments (at FVTPL) - 42.84 - 42.84
Total financial assets 21,839.56 57.48 - 21,897.04
Assets and liabilities which are measured at amortised cost for which fair values are disclosed as at April 1, 2016
Level 1 Level 2 Level 3 Total
Financial assets
Security deposits - - 242.48 242.48
Total financial assets - - 242.48 242.48
Financial liabilities
Borrowing - - 999.30 999.30
Total financial liabilities - - 999.30 999.30
Note:
Level 1: Level 1 hierarchy includes financial instruments measured using quoted prices.
Level 2: The fair value of financial instruments that are not traded in an active market is determined using valuation techniques which maximise the use of observable market data and rely as little as possible on entity-specific estimates. If all significant inputs required to fair value an instrument are observable, the instrument is included in level 2.
Level 3: If one or more of the significant inputs is not based on observable market data, the instrument is included in level 3.
There are no transfers between any levels during the year.
(c) Fair value of financial assets and liabilities measured at amortised cost` in Lakhs
Particulars As at March 31, 2018
As at March 31, 2017
As at April 1, 2016
Carrying amount
Fair value
Carrying amount
Fair value
Carrying amount Fair Value
Financial assets
Security deposits 40.35 40.35 40.90 40.90 242.48 242.48
Total financial assets 40.35 40.35 40.90 40.90 242.48 242.48
Financial Liabilities
Borrowing - - - - 999.30 999.30
Total financial liabilities - - - - 999.30 999.30
The carrying amounts of cash and cash equivalents, other bank balances, trade receivables, inter corporate deposits, other financial assets, current financial liabilities- borrowings, trade payables and other current financial liabilities are considered to be the same as their fair values due to their short term nature.
Notes to the Consolidated Financial Statements for the Year ended March 31, 2018 (Contd.)

118
Note 34: Financial risk managementThe Group’s business activities expose it to a variety of financial risks, namely liquidity risk, market risks and credit risk.
Risk Exposure arising from Measurement Management
Credit Risk Cash and cash equivalents, trade receivables, financial assets measured at amortised cost, investments in mutual funds
Aging analysis Credit limits, timely review, diversification of deposits
Liquidity Risk Borrowings and other liabilities Rolling cash flow forecasts Surplus cash parking in liquid funds
Market risk-foreign exchange
Recognised financial liabilities not denominated in Indian rupee (INR)
Sensitivity analysis Limited exposure, unhedged
Market risk - price risk Investment in equity instruments Sensitivity analysis Strategic investment, diversifiction of portfolio
(a) Credit risk The Group is exposed to credit risk, which is the risk that counterparty will default on its contractual obligation resulting in a financial loss to the group. Credit risk arises from cash and cash equivalents, financial assets carried at amortised cost and investments in mutual funds, as well as credit exposures to trade customers including outstanding receivables.
Credit risk management
Credit risk is the risk that a counterparty will not meet its obligations under a financial instrument or customer contract, leading to a financial loss.
The Group credit risk arises from accounts receivable balances on sale of hydrogen peroxide. The credit risk is very low as the sale of hydrogen peroxide is based on purchase order / agreement with customer and at rates approved by Managing Director / CEO of the Group. Group has a credit risk policy in place to ensure that sales are made to customers only after an appropriate credit risk assessment and credit line allocation process. Procedures are standardized within a customer credit risk policy and supported by the information technology system by limiting the credit exposure to each customer and allowing an average credit period of 30-60 days. The Group has adopted a policy of only dealing with creditworthy counterparties.
The Group has made a provision of ̀ 38.15 lakhs for the year ended March 31, 2018 for expected credit loss on Trade receivable.
For banks and financial institutions, only highly rated banks / institutions are accepted. Generally all policies surrounding credit risk have been managed at Group level.
(b) Liquidity riskLiquidity risk is the risk that the Group will fail in meeting its obligations to pay its financial liabilities. The Group’s approach to managing liquidity is to ensure that it will have sufficient funds to meet its liabilities when due without incurring unacceptable losses.
Prudent liquidity risk management implies maintaining sufficient cash and marketable securities and the availability of funding through an adequate amount of committed credit facilities to meet obligations when due and to close out market positions. In respect of its existing operations, the Group funds its activities primarily through cash generated in operations.
Management monitors the Group’s liquidity position and cash and cash equivalents on the basis of expected cash flows. The Group maintained a positive cash balance throughout the year. Internal accruals provides the funds to service the financial liabilities on a day-to-day basis. Cash which is not needed in the operating activities of the Group is invested in interest bearing securities and marketable liquid funds.
(i) Maturities of financial liabilities The amounts disclosed below are the contractual undiscounted cash flows. Balances due within 12 months equal their
carrying balances as the impact of discounting is not significant.
Notes to the Consolidated Financial Statements for the Year ended March 31, 2018 (Contd.)

119
Annual Report 2017-2018
` in Lakhs
March 31, 2018 Less than 1year
Between 1 year and 5 years
More than 5 years Total
Financial liabilities
Trade payables 2,027.07 - - 2,027.07
Other financial liabilities 69.23 - - 69.23
Total financial liabilities 2,096.30 - - 2,096.30
March 31, 2017
Financial liabilities
Borrowings (including interest accrued thereon) 1,122.04 - - 1,122.04
Trade payables 1,923.42 - - 1,923.42
Other financial liabilities 66.10 - - 66.10
Total financial liabilities 3,111.56 - - 3,111.56
April 1, 2016
Financial liabilities
Borrowings (including interest accrued thereon) 2,220.11 1,016.71 - 3,236.82
Trade payables 1,632.85 - - 1,632.85
Other financial liabilities 80.50 - - 80.50
Total financial liabilities 3,933.46 1,016.71 - 4,950.17
(c) Market riskMarket risk is the risk that the fair values of future cash flows of a financial instrument will fluctuate because of volatility of prices in the financial markets. Market risk can be further segregated as: i) Foreign currency risk and ii) Other price risk.
(i) Foreign currency risk Foreign currency risk is the risk that the fair value or future cash flows of a financial instrument will fluctuate because
of changes in foreign exchange rates. Foreign exchange risks arise from recognized assets and liabilities, when they are denominated in a currency other than functional currency of the Group. To a limited extent, the Group imports certain raw materials and spare parts used in manufacturing and therefore is exposed to foreign exchange risks arising from various currency exposures, primarily with respect to the Pound (“GBP”) and the US-dollar (“USD”). Group exposure to foreign currency risk is very limited and it always ensures that such exposure is within the approved limit for which Group does not require to hedge through derivatives.
The Group’s exposure to foreign currency risk at the end of the reporting period expressed in Rupees, are as follows.
` in Lakhs
As at March 31, 2018
As at March 31, 2017
As at April 1, 2016
Financial liabilities
Payable (Trade payable) - In USD - 139.20 -
Payable (Other payable) - In GBP - 9.71 -
Net exposure to foreign currency risk (liabilities) - 148.91 -
Notes to the Consolidated Financial Statements for the Year ended March 31, 2018 (Contd.)

120
SensitivityThe sensitivity of profit or loss to changes in the exchange rates arises mainly from foreign currency denominated financial instruments.
` in Lakhs
Impact on profit before tax
Year endedMarch 31, 2018
Year endedMarch 31, 2017
FX rate – increase by 6% on closing rate on reporting date* - (8.93)
FX rate– decrease by 6% on closing rate on reporting date * - 8.93
* Holding all other variables constant
The above amounts have been disclosed based on the accounting policy for exchange differences.
In management’s opinion, the above sensitivity analysis is not representative of the inherent foreign exchange risk because the exposure at the end of the reporting period does not reflect the exposure during the year.
(ii) Other price risksThe Group is exposed to equity price risks arising from equity investments. These investments are subject to changes in the market price of securities. Equity investments are held for strategic purpose rather than for trading purposes. The Group does not actively trade in these investments.
Sensitivity If equity prices had been 10% higher / lower, other comprehensive income for the year ended March 31, 2018 would increase / decrease by ` 6,856.17 lakhs (Year ended March 31, 2017: increase / decrease by ` 4,825.36 lakhs) as a result of the changes in fair value of shares measured at FVOCI.
Note 35: Capital Management
(a) Risk ManagementThe Group’s objectives when managing capital are to safeguard the Group’s ability to continue as a going concern in order to provide returns for shareholders and benefits for other stakeholders and to maintain an optimal capital structure to reduce the cost of capital. In order to maintain or adjust the capital structure, the Group may adjust the amount of dividends paid to shareholders, return capital to shareholders, issue new shares or sell assets to reduce debt.
The capital structure of the Group consists of equity of the Group (comprising issued capital and internal accruals). The Group is not subject to any external imposed capital requirements. The subsidary is subject to certain capital requirements NBFC rules under RBI Act, 1934. The group is a zero debt group with no long-term borrowings as at March 31, 2018.
(b) Dividend
` in Lakhs
As at March 31, 2018
As at March 31, 2017
(i) Equity shares 1,953.98 574.70
Final dividend for the year ended March 31, 2017 of ` 34 (March 31, 2016 - ` 10) per fully paid share
Dividend distribution tax (DDT) on final dividend 397.79 117.01
(ii) Dividend not recognised at the end of the reporting period 3,735.55 1,953.98
In addition to the above dividends, since year end the directors have recommended the payment of a final dividend of ` 65 per fully paid equity share (March 31, 2017 - ` 34). This proposed dividend is subject to the approval of shareholders in the ensuing annual general meeting.
Dividend distribution tax (DDT) on proposed dividend 760.50 397.79
Notes to the Consolidated Financial Statements for the Year ended March 31, 2018 (Contd.)

121
Annual Report 2017-2018
Note 36 : Leases
Operating lease arrangements The Group has entered into non-cancellable operating lease arrangements for certain motor vehicles for a period of four years. Total rental expenses relating to operating leases recognised in statement of profit and loss is ` 54.31 lakhs (Previous year: ` 44.92 lakhs).
` in Lakhs
Non-cancellable operating lease commitments As at March 31, 2018
As at March 31, 2017
As at April 1, 2016
Within one year 16.21 18.19 17.34
Later than one year and not later than 5 years 31.39 14.30 21.93
Later than 5 years - - -
Note 37 : Earning per share
` in LakhsBasic and diluted earnings per share March 31, 2018 March 31, 2017Profit for the year (` in lakhs) 9,583.71 3,863.51 Weighted average number of equity shares 5,747,000 5,747,000 Basic and diluted earnings per share (`) 166.76 67.23 Face value per share (`) 10.00 10.00
Note 38 : Segment reporting
The CEO reviews the Group performance. Presently, the Group is engaged in only one segment viz ‘Manufacturing of peroxygens’ and as such there is no separate reportable segment as per Ind AS 108 ‘Operating Segments’. Presently, the Group operations are predominantly confined in India.
Information about major customersRevenue for the year ended March 31, 2018 and March 31, 2017 were from customers located in India. Customers include private distribution entities. No single customer of the Group account for 10% or more of total revenue.
Note 39: Contingent liabilities and commitments
` in LakhsMarch 31, 2018 March 31, 2017 April 1, 2016
(a) Contingent liabilities : Claims against the Group not acknowledged as debt: Income tax matters - - 128.32 Sales tax demand 287.18 287.18 -
(b) Commitments:
(i) Estimated amount of contracts remaining unexecuted on capital account (net of advances paid) and not provided for `4,918.62 lakhs (March 31, 2017 ` Nil; April 1, 2016 ` 2.10 lakhs).
(ii) Other commitment: The Group has entered into a long term agreement with GAIL (India) Limited (GAIL) for purchase of Natural Gas. The
agreement is valid till 30th April, 2028. As per the said agreement, the Group under ‘Take or Pay obligation’ clause has to make payment for a fixed quantity of gas on an annual basis, whether used or not. GAIL has the discretion to waive off the Take or Pay charges. A request for supply of Make Up gas can be made by the Group corresponding to Take or Pay deficiencies which are outstanding and for which the Group would pay to GAIL at the time of annual program.”
(iii) For lease commitment, refer note 36.
Notes to the Consolidated Financial Statements for the Year ended March 31, 2018 (Contd.)

122
Note 40 : Employee benefit obligations
The Group has classified various employee benefits as under:
(a) Leave ObligationsThe leave obligations cover the Company’s liability for sick and privileged leave
` in Lakhs
As at March 31, 2018
As at March 31, 2017
As at April 1, 2016
Provision for leave encashment
Current 130.41 153.71 119.58
Non-current 199.16 207.69 137.90
(b) Defined Contribution Plan
(i) Provident fund - - -
(ii) Superannuation fund - - -
The Group has recognised the following amounts in the Statement of Profit and Loss for the year:
` in Lakhs
Year ended March 31, 2018
Year ended March 31, 2017
(i) Contribution to provident fund 95.29 94.11
(ii) Contribution to superannuation fund 47.71 51.16
(c) Post employment obligations
GratuityThe Group has a defined benefit plan, governed by the Payment of Gratuity Act, 1972. The plan entitles an employee, who has rendered at least five years of continuous service, to gratuity at the rate of fifteen days basic salary for every completed years of services or part thereof in excess of six months, based on the rate of basic salary last drawn by the employee concerned.
(i) Significant estimates: actuarial assumptions
Valuations in respect of gratuity have been carried out by an independent actuary, as at the Balance Sheet date
` in Lakhs
As at March 31, 2018
As at March 31, 2017
As at April 1, 2016
Discount rate (per annum) 7.65% 7.10% 7.75%
Salary escalation rate
-For management employees 9.00% 9.00%
-For other employees 7.00% 6.00% 6.00%
Mortality rate Indian Assured Lives Mortality (2006-08)
Ult table
Indian Assured Lives Mortality (2006-08)
Ult table
Indian Assured Lives Mortality (2006-08)
Ult table
The estimates of salary escalation rate considered in actuarial valuation, takes into account inflation, seniority, promotion and other relevant factors including supply and demand in the employment market.
Notes to the Consolidated Financial Statements for the Year ended March 31, 2018 (Contd.)

123
Annual Report 2017-2018
(ii) Gratuity PlanThe amounts recognised in the Balance Sheet and the movements in the net defined benefit obligation over the year are as follows:
` in Lakhs
Present value of obligation
Fair value of plan assets Net amount
As at April 1, 2016 847.16 (764.41) 82.75
Current service cost 35.54 - 35.54
Interest expense / (income) 54.70 (53.39) 1.31
Total amount recognised in profit and loss 90.24 (53.39) 36.85
Remeasurements
Return on plan assets, excluding amount included in interest expense / (income)
- (20.35) (20.35)
(Gain) / loss from change in financial assumptions 25.62 - 25.62
(Gain) / loss from change in demographic assumptions - - -
Experience (gains) / losses 32.77 - 32.77
Total amount recognised in other comprehensive income 58.39 (20.35) 38.04
Employer contributions - (82.75) (82.75)
Benefits payments (8.41) 8.41 -
As at March 31, 2017 987.38 (912.49) 74.89
As at April 1, 2017 987.38 (912.49) 74.89
Current service cost 36.08 - 36.08
Past service cost 38.15 - 38.15
Interest expense / (income) 57.43 (57.79) (0.36)
Total amount recognised in profit and loss 131.66 (57.79) 73.87
Remeasurements
Return on plan assets, excluding amount included in interest expense / (income)
- (26.24) (26.24)
(Gain) / loss from change in financial assumptions 16.48 - 16.48
(Gain) / loss from change in demographic assumptions (23.35) - (23.35)
Experience (gains) / losses 35.89 - 35.89
Total amount recognised in other comprehensive income 29.02 (26.24) 2.78
Employer contributions - (74.89) (74.89)
Benefits payments (16.30) 16.30 -
As at March 31, 2018 1,131.76 (1,055.11) 76.65
Notes to the Consolidated Financial Statements for the Year ended March 31, 2018 (Contd.)

124
The net liability disclosed above relates to funded plans are as follows: ` in Lakhs
As at March 31, 2018
As at March 31, 2017
As at April 1, 2016
Present value of funded obligations 1,131.76 987.38 847.16
Fair value of plan assets (1,055.11) (912.49) (764.41)
Deficit of gratuity plan 76.65 74.89 82.75
Current portion 76.65 74.89 82.75
Non-current portion - - -
(iii) Sensitivity analysis Significant estimates: Sensitivity of actuarial assumptions
The sensitivity of the provision for defined benefit obligation to changes in the weighted principal assumptions is:
Impact on defined benefit obligation
Change in assumption Increase in assumption Decrease in assumption
March 31, 2018
March 31,2017
March 31, 2018
March 31,2017
March 31, 2018
March 31,2017
Discount rate 0.50% 0.50% -1.64% -2.01% 1.72% 2.11%
Salary escalation rate 0.50% 0.50% 1.69% 1.81% -1.63% -1.77%
The above sensitivity analysis are based on a change in an assumption while holding all other assumptions constant. In practice, this is unlikely to occur, and changes in some of the assumptions may be correlated. While calculating the sensitivity of the defined benefit obligation to significant actuarial assumptions the same method (present value of the defined benefit obligation calculated with the projected unit credit method at the end of the reporting period) has been applied as when calculating the defined benefit liability recognised in the balance sheet.
The methods and types of assumptions used in preparing the sensitivity analysis did not change compared to the prior period.
(iv) The above defined benefit gratuity plan was administrated 100% by a trust as at March 31, 2018, March 31, 2017 as well as April 1, 2016.
(v) Defined benefit liability and employer contributions
The Group will pay demand raised by the trust towards gratuity liability on time to time basis to eliminate the deficit in defined benefit plan.
The weighted average duration of the defined benefit obligation is 4.25 years (March 31, 2017 – 4.12 years).
(vi) Risk exposure
Aforesaid post-employment benefit plans typically expose the Group to acturial risks such as: Investment risk, interest rate risk and salary risk.
Investment risk: The present value of the defined benefit liability is calculated using a discount rate which is determined by reference to market yields at the end of the reporting period on government bonds. If the return on plan asset is below this rate, it will create a plan deficit. Currently, for the plan in india, it has a relatively balanced mix of investments in govenment securities, and other debt instruments.
Interest risk: A fall in the discount rate which is linked to the G. Sec. Rate will increase the present value of the liability requiring higher provision. A fall in the discount rate generally increase the mark to market value of the assets depending on the duration of asset.
Salary risk: The present value of the defined benefit liability is calculated by reference to the future salaries of plan participants. As such, an increase in salary of the plan participants will increase the plan's liability.
Notes to the Consolidated Financial Statements for the Year ended March 31, 2018 (Contd.)

125
Annual Report 2017-2018
(vii) Category of plan asset
` in Lakhs
Particulars As at March 31, 2018
As at March 31, 2017
As at April 1, 2016
Amount % Amount % Amount %
Government debt instruments 322.45 31 282.83 31 126.56 17
Other debt instruments 658.99 62 569.31 62 622.49 81
Insurer managed funds - 0 23.86 3 7.55 1
Others 73.67 7 36.49 4 7.81 1
Total 1,055.11 100 912.49 100 764.41 100
(viii) Projected cash flow
` in LakhsAs at
March 31, 2018As at
March 31, 2017As at
April 1, 2016Less than a year 431.28 356.89 282.61 Between 1-2 years 154.29 22.34 54.98 Between 2-5 years 357.08 357.26 337.64 Between 5-9 years 351.25 342.80 283.64 10 years and above 286.14 339.69 343.99
Pension
The Group operates a defined benefit pension plan. The pension benefits payable to the employees are based on the employee’s service and last drawn salary at the time of leaving. The employees do not contribute towards this plan and the full cost of providing these benefits are met by the Group. The Group does not contribute annually to any trust or a fund towards the liability under the plan, this plan is unfunded.
(i) Significant estimates: actuarial assumptionsValuations in respect of pension have been carried out by an independent actuary, as at the Balance Sheet date
As at March 31, 2018
As at March 31, 2017
As at April 1, 2016
Discount rate (per annum) 7.65% 7.10% 7.75%Salary escalation rate 7.00% 6.00% 6.00%Pension increase rate 0.00% 0.00% 0.00%
(ii) Pension Plan
` in LakhsPresent value of obligation
As at April 1, 2016 74.46 Current service cost 2.14 Interest on net defined benefit liability / assets 5.25 Total amount recognised in profit and loss 7.39
Remeasurements(Gain) / loss from change in financial assumptions 2.71 (Gain) / loss from change in demographic assumptions - Experience (gains) / losses 4.05
Total amount recognised in other comprehensive income 6.76 Benefits payment (7.92)As at March 31, 2017 80.69
Notes to the Consolidated Financial Statements for the Year ended March 31, 2018 (Contd.)

126
` in Lakhs
Present value of obligation
As at April 1, 2017 80.69 Current service cost 9.06
Interest expense / (income) 5.40
Total amount recognised in profit and loss 14.46
Remeasurements
(Gain) / loss from change in financial assumptions (1.67)
(Gain) / loss from change in demographic assumptions (11.91)
Experience (gains) / losses (5.12)
Total amount recognised in other comprehensive income (18.70)Benefits payment (10.08)
As at March 31, 2018 66.37
The net liability disclosed above relates to funded plans are as follows:
` in Lakhs
As at March 31, 2018
As at March 31, 2017
As at April 1, 2016
Present value of funded obligations 66.37 80.69 74.46
Deficit of pension plan 66.37 80.69 74.46
Current portion 10.74 9.36 13.32
Non-current portion 55.63 71.33 61.14
(iii) Sensitivity analysisThe sensitivity of the provision for defined benefit obligation to changes in the weighted principal assumptions is:
Impact on defined benefit obligation
Change in assumptions Increase in assumptions Decrease in assumptions
March 31, 2018
March 31,2017
March 31, 2018
March 31,2017
March 31, 2018
March 31,2017
Discount rate 0.50% 0.50% -2.17% -2.60% 2.28% 2.74%
The above sensitivity analysis is based on a change in an assumption while holding all other assumptions constant. In practice, this is unlikely to occur, and changes in some of the assumptions may be correlated. While calculating the sensitivity of the defined benefit obligation to significant actuarial assumptions the same method (present value of the defined benefit obligation calculated with the projected unit credit method at the end of the reporting period) has been applied as when calculating the defined benefit liability recognised in the balance sheet.
The methods and types of assumptions used in preparing the sensitivity analysis did not change compared to the prior period.
(vi) Risk exposure
Aforesaid post-employment benefit plans typically expose the Group to acturial risks such as: Investment risk, interest rate risk, and salary risk.
Interest risk: A fall in the discount rate which is linked to the G. Sec. Rate will increase the present value of the liability requiring higher provision. A fall in the discount rate generally increase the mark to market value of the assets depending on the duration of asset.
Salary risk: The present value of the defined benefit liability is calculated by reference to the future salaries of plan participants. As such, an increase in salary of the plan participants will increase the plan’s liability.
Notes to the Consolidated Financial Statements for the Year ended March 31, 2018 (Contd.)

127
Annual Report 2017-2018
(v) Defined benefit liability and employer contributions The weighted average duration of the defined benefit obligation is 4.45 years (March 31, 2017 – 5.34 years).
(vi) Projected cash flow
` in LakhsAs at
March 31, 2018As at
March 31, 2017As at
April 1, 2016Less than a year 10.74 9.36 13.32
Between 1-2 years 8.64 10.65 9.07
Between 2-5 years 24.23 25.90 24.25
Between 5-9 years 25.29 30.81 20.55
10 years and above 32.71 51.71 20.55
Provident FundIn respect of certain employees, provident fund contributions are made to a trust administered by the Group. The interest rate payable to the members of the trust shall not be lower than the statutory rate of interest declared by the Central Government under the Employees Provident Funds and Miscellaneous Provisions Act, 1952 and shortfall, if any, shall be made good by the Group. The liability in respect of the shortfall of interest earnings of the Fund is determined on the basis of an actuarial valuation.
Group measures its liability towards provident fund through actuarial valuation using ‘projected credit unit method’. In case of net assets, assets are recognised to the extent of liability only.
(i) Significant estimates: actuarial assumptions
Valuations in respect of provident fund have been carried out by an independent actuary, as at the Balance Sheet date
As at March 31, 2018
As at March 31, 2017
As at April 1, 2016
Discount rate (per annum) 7.65% 7.10% 7.75%
(ii) Provident fund plan
` in LakhsPresent value of obligation
Fair value of plan assets Net amount
As at April 1, 2016 447.25 (447.25) -
Current service cost 23.05 - 23.05
Interest on net defined benefit liability / assets 36.45 (36.45) -
Interest on net defined benefit liability / assets 59.50 (36.45) 23.05
RemeasurementsReturn on plan assets, excluding amount included in interest expense / (income) - (0.82) (0.82)
(Gain) / loss from change in financial assumptions - - -
(Gain) / loss from change in demographic assumptions - - -
Experience (gains) / losses 0.82 - 0.82
Total amount recognised in other comprehensive income 0.82 (0.82) -
Employer’s contributions - (23.05) (23.05)
Employee’s contributions 23.95 (23.95) -
Benefits payment - - -
As at March 31, 2017 531.52 (531.52) -
Notes to the Consolidated Financial Statements for the Year ended March 31, 2018 (Contd.)

128
` in Lakhs
Present value of obligation
Fair value of plan assets Net amount
As at April 1, 2017 531.52 (531.52) -
Current service cost 19.51 - 19.51
Interest expense / (income) 37.87 (37.87) -
Interest on net defined benefit liability / assets 57.38 (37.87) 19.51
Remeasurements
Return on plan assets, excluding amount included in interest expense / (income) - (2.95) (2.95)
(Gain) / loss from change in financial assumptions - - -
(Gain) / loss from change in demographic assumptions - - -
Experience (gains) / losses 2.95 - 2.95
Total amount recognised in other comprehensive income 2.95 (2.95) -
Employer’s contributions - (19.51) (19.51)
Employee’s contributions 20.23 (20.23) -
Benefits payment (35.33) 35.33 -
As at March 31, 2018 576.75 (576.75) -
The net liability disclosed above relates to funded plans are as follows:
` in Lakhs
As at March 31, 2018
As at March 31, 2017
As at April 1, 2016
Present value of funded obligations 576.75 531.52 447.25
Fair value of plan assets (576.75) (531.52) (447.25)
Deficit of provident fund plan
Current portion - - -
Non-current portion - - -
(iii) Sensitivity analysis The sensitivity of the provision for defined benefit obligation to changes in the weighted principal assumptions is
Impact on defined benefit obligationChange in
assumptionsIncrease in
assumptionsDecrease in assumptions
March 31, 2018
March 31,2017
March 31, 2018
March 31,2017
March 31, 2018
March 31,2017
Discount rate 0.50% 0.50% 2.85% 0.00% -1.18% 0.00%
The above sensitivity analysis is based on a change in an assumption while holding all other assumptions constant. In practice, this is unlikely to occur, and changes in some of the assumptions may be correlated. While calculating the sensitivity of the defined benefit obligation to significant actuarial assumptions the same method (present value of the defined benefit obligation calculated with the projected unit credit method at the end of the reporting period) has been applied as when calculating the defined benefit liability recognised in the balance sheet.
The methods and types of assumptions used in preparing the sensitivity analysis did not change compared to the prior period.
Notes to the Consolidated Financial Statements for the Year ended March 31, 2018 (Contd.)

129
Annual Report 2017-2018
(iv) The above defined benefit plan was administrated 100% by a trust as at March 31, 2018, March 31, 2017 as well as April 1, 2016
(v) Defined benefit liability and employer contributions
The Group will pay demand raised by the trust towards provident fund liability on time to time basis to eliminate the deficit in defined benefit plan.
The weighted average duration to payment is 7.90 years (March 31, 2017 – 6.73 years).
(vi) Risk exposure
Aforesaid post-employment benefit plans typically expose the Company to acturial risks such as: Investment risk, interest rate risk, and salary risk.
Investment risk: The present value of the defined benefit liability is calculated using a discount rate which is determined by reference to market yields at the end of the reporting period on government bonds.If the return on plan asset is below this rate, it will create a plan deficit. Currently, for the plan in india, it has a relatively balanced mix of investments in govenment securities, and other debt instruments.
Interest risk: A fall in the discount rate which is linked to the G. Sec. Rate will increase the present value of the liability requiring higher provision. A fall in the discount rate generally increase the mark to market value of the assets depending on the duration of asset.
Salary risk: The present value of the defined benefit liability is calculated by reference to the future salaries of plan participants. As such, an increase in salary of the plan participants will increase the plan's liability.
(vii) Category of plan asset` in Lakhs
As at March 31, 2018
As at March 31, 2017
As at April 1, 2016
Amount % Amount % Amount %Government debt instruments 206.15 36 150.85 28 89.35 20
Other debt instruments 312.71 54 315.86 60 315.48 71
Entity's own equity instruments 14.31 2 21.74 4 14.31 3
Others 43.58 8 43.07 8 28.11 6
Total 576.75 100 531.52 100 447.25 100
Note 41: Related party transactions As per Indian Accounting Standard 24 (Ind AS 24) ‘Related Party Transactions’ as prescribed by Companies (Indian Accounting Standards) Rules, 2015, the Group’s related parties and transactions are disclosed below:
(A) Enterprises exercising control Ultimate holding entity - Ben Nevis Investments Limited (Refer note 16)
Parent entity - Nowrosjee Wadia and Sons Limited (Refer note 16)*
* w.e.f. March 28, 2017, the entity was exercising significant inflience over the Company.
(B) Enterprises where control exists Subsidiary company - Naperol Investments Limited
(C) Key management personnel Mr. S. R. Lohokare, Managing Director (upto December 15, 2017) Mr. Suresh Khurana, Chief Executive Officer and Director (w.e.f. December 15, 2017) Non-Executive Directors Mr. Ness N. Wadia - Chairman Dr. (Mrs.) Minnie Bodhanwala
Independent Directors Mr. R. Batra Mr. N. P. Ghanekar Mr. S. Ragothaman
Notes to the Consolidated Financial Statements for the Year ended March 31, 2018 (Contd.)
130
(D) Enterprises controlled by the parent entity and with whom transactions were carried out during the year.Wadia Techno-Engineering Services Limited
Macrofil Investments Limited (Refer Note 16)**
**The entity was excercising significant influence over the company till August 2, 2017.
(E) Employee benefits plans and with whom transactions were carried out during the year.National Peroxide Limited Employees’ Provident Fund
National Peroxide Limited Employees’ Gratuity Fund
(F) Enterprises over which key managerial personnel have significant influence and with whom transactions were carried out during the year.
Sir Ness Wadia Foundation
(G) Details of transactions during the year:
` in Lakhs
Year endedMarch 31, 2018
Year endedApril 1, 2017
Intercorporate deposit given
Nowrosjee Wadia and Sons Limited 3,000.00 -
Wadia Techno-Engineering Services Limited 500.00 -
Interest income on intercorporate deposit
Nowrosjee Wadia and Sons Limited 282.53 -
Wadia Techno-Engineering Services Limited 46.23 -
Macrofil Investments Limited 375.00 374.23
Miscellaneous expenses
License fee paid for brand equity
Nowrosjee Wadia and Sons Limited 114.67 21.17
Reimbursement of expenses
Nowrosjee Wadia and Sons Limited 78.77 25.92
Expenditure on Corporate Social Responsibility
Sir Ness Wadia Foundation 80.00 7.41
(H) Compensation to key managerial personnel
Mr. S. R. Lohokare
Short term employee benefits 186.93 248.88
Post employement benefits* 27.38 36.61
Long term employee benefits* - -
Mr. Suresh Khurana
Short term employee benefits 65.32 -
Post employement benefits* 4.69 -
Long term employee benefits* - -
* As the liabilities for defined benefit plans are provided on actuarial basis for the parent Company, the amounts pertaining to Key Management Personnel are not included.
Notes to the Consolidated Financial Statements for the Year ended March 31, 2018 (Contd.)

131
Annual Report 2017-2018
` in LakhsYear ended
March 31, 2018Year ended
April 1, 2017
(I) Commission to Non-Executive Directors 149.00 65.16
(J) Director Sitting fees to Non-Executive Directors 17.60 12.20
(K) Contribution to employee benefit plans
National Peroxide Limited Employees' Provident Fund (employer's contribution only) 19.51 23.05
National Peroxide Limited Employees' Gratuity Fund 74.89 82.75
(L) Balances with related parties as at the year end:
Intercorporate deposits to related party
Nowrosjee Wadia and Sons Limited 3,000.00 -
Wadia Techno-Engineering Services Limited 500.00 -
Macrofil Investments Limited 3,000.00 3,000.00
Interest accrued but not due on deposits
Wadia Techno-Engineering Services Limited 41.61 -
Trade Payables
Nowrosjee Wadia and Sons Limited 61.40 25.92
National Peroxide Limited Employees' Provident Fund 576.75 531.52
National Peroxide Limited Employees' Gratuity Fund 1,055.11 912.49
Note 42: Specified bank notes i. The reporting on disclosures relating to Specified Bank Notes is not applicable to the Group for the year ended March 31, 2018.
ii. Following are the details of holdings as well as dealings in Specified Bank Notes for the previous year ended March 31, 2017.
` in Lakhs
Particulars SBNs Other denomination notes Total
Closing cash in hand as on November 8, 2016 4.01 0.37 4.38
Permitted receipts 0.20 10.70 10.90
Permitted payments - 7.77 7.77
Amount deposited in Banks 4.21 - 4.21
Closing cash in hand as on December 30, 2016 - 3.30 3.30
Note 43: First-time adoption of Ind AS These are the Group first financial statements prepared in accordance with Ind AS. The accounting policies set out in note 2 have been applied in preparing the financial statements for the year ended March 31, 2018, the comparative information presented in these financial statements for the year ended March 31, 2017 and in the preparation of an opening Ind AS Balance Sheet at April 1, 2016 (the Group’s date of transition). In preparing its opening Ind AS balance sheet, the Group has adjusted the amounts reported previously in financial statements prepared in accordance with the accounting standards notified under Companies (Accounting Standards) Rules, 2006 (as amended) and other relevant provisions of the Act (previous GAAP or Indian GAAP). An explanation of how the transition from previous GAAP to Ind AS has affected the Group financial position, financial performance and cash flows is set out in the following tables and notes.
Notes to the Consolidated Financial Statements for the Year ended March 31, 2018 (Contd.)

132
A. Exemptions and exceptions availed Set out below are the applicable Ind AS 101 optional exemptions and mandatory exceptions applied in the transition from previous GAAP to Ind AS.
A.1 Ind AS optional exemptions
A.1.1 Deemed cost
Ind AS 101 permits a first-time adopter to elect to continue with the carrying value for all of its Property, plant and equipment as recognised in the financial statements as at the date of transition to Ind AS, measured as per the previous GAAP and use that as its deemed cost as at the date of transition.
Accordingly, the Group has elected to measure all of its Property, plant and equipment at their previous GAAP carrying value.
A.1.2 Designation of previously recognised financial instruments
Ind AS 101 allows an entity to designate investments in equity instruments at FVOCI on the basis of the facts and circumstances at the date of transition to Ind AS.
The Group has elected to apply this exemption for its investment in equity instruments.
A.2 Ind AS mandatory exceptions
A.2.1 Estimates
The entity’s estimates in accordance with Ind AS at the date of transition shall be consistent with estimates made for the same date in accordance with previous GAAP (after adjustments to reflect any difference in accounting policies), unless there is objective evidence that those estimates were in error.
Ind AS estimates as at April 1, 2016 are consistent with the estimates as at the same date made in conformity with previous GAAP. The Group has made estimate relating to investment in equity instruments carried at FVOCI in accordance with Ind AS at the date of transition as these were not required under prevous GAAP:
B. Reconciliations between previous GAAP and Ind AS Ind AS 101 requires an entity to reconcile equity, total comprehensive income and cash flows for prior periods. The following tables represent the reconciliation from previous GAAP to Ind AS.
` in Lakhs
Notes to first-time adoption March 31, 2017 April 1, 2016
Total equity (shareholder's funds) as per previous GAAP 27,230.52 22,399.54
Effect of adjustment of embezzlement (net of taxes) G (1,239.91) (706.99)
Restated total equity under previous GAAP 25,990.61 21,692.55
Adjustments:
Adjustment of excess provision for tax written back in previous year H - 440.80
Fair valuation of investments in equity instruments A 48,079.15 20,825.06
Fair valuation of investments in mutual funds B 107.92 60.21
Borrowings - transaction cost adjustment C 0.70 8.24
Proposed dividend D - 691.71
Tax effects of adjustments F (19.53) (13.50)
Total adjustments 48,168.24 22,012.52
Total equity as per Ind AS 74,158.85 43,705.07
Notes to the Consolidated Financial Statements for the Year ended March 31, 2018 (Contd.)

133
Annual Report 2017-2018
B.2 Reconciliation of total comprehensive income for the year ended March 31, 2017
` in Lakhs
Notes to first-time adoption April 1, 2017
Profit after tax as reported under previous GAAP 4,830.97
Effect of adjustment of embezzlement (net of taxes) G (532.92)
Restated profit under previous GAAP 4,298.05
Adjustments:
Adjustment of excess provision for tax written back in previous year H (440.80)
Remeasurement of post-employment benefit obligations E (27.90)
Fair valuation of investments in mutual funds B 47.71
Borrowings - transaction cost adjustment C (7.54)
Tax effects of adjustments F (6.01)
Total adjustments (434.54)
Profit after tax as per Ind AS 3,863.51
Other comprehensive income A & E 27,281.97
Total comprehensive income as per Ind AS 31,145.48
B.3 Impact of Ind AS adoption on the statements of cash flows for the year ended March 31, 2017
The transition from previous GAAP to Ind AS do not have a material impact on the statement of cash flows.
Notes
A. Under the previous GAAP, investments in equity instruments were classified as long-term investments based on the intended holding period and realisability. Long-term investments were carried at cost less provision for other than temporary decline in the value of such investments. Fair value changes with respect to investments in equity instruments designated as at FVOCI have been recognised in FVOCI - Equity investments reserve as at the date of transition and subsequently in the other comprehensive income for the year ended March 31, 2017. This has resulted in an increase in reserves of ` 20,825.06 lakhs and `48,079.15 lakhs as at April 1, 2016 and March 31, 2017 respectively and increase in other comprehensive income by ` 27,254.07 lakhs for the year ended March 31, 2017.
B. Under the previous GAAP, investment in mutual funds were classified as current investments based on the intended holding period and realisability and current investments were carried at lower of cost and fair value. Under Ind AS, same are required to be fair valued and subsequently, measured at fair value through profit and loss as on the reporting date. This has resulted in an increase in retained earnings of `60.31 lakhs and `111.26 lakhs as at April 1, 2016 and March 31, 2017 respectively and increase in profit by `47.71 lakhs for the year ended March 31, 2017.
C. Ind AS 109 requires transaction costs incurred towards origination of borrowings to be deducted from the carrying amount of borrowings on initial recognition. These costs are recognised in the profit or loss over the tenure of the borrowing as part of the interest expense by applying the effective interest rate method. This has resulted in an increase in retained earnings of ̀ 8.24 lakhs and ` 0.70 lakhs as at April 1, 2016 and March 31, 2017 respectively and decrease in profit by `7.54 lakhs for the year ended March 31, 2017.
D. Under the previous GAAP, dividends proposed by the board of directors after the Balance Sheet date but before the approval of the financial statements were considered as adjusting events. Accordingly, provision for proposed dividend was recognised as a liability. Under Ind AS, such dividends are recognised when the same is approved by the shareholders in the general meeting. This has resulted in an increase in retained earnings of `691.71 lakhs as at April 1, 2016.
E. Under Ind AS, remeasurements i.e. actuarial gains or losses are recognised in other comprehensive income instead of profit or loss. Under the Previous GAAP, these remeasurements were forming part of the profit or loss for the year. This has resulted into decrease in profit by `27.90 lakhs (net of tax) and corresponding increase in other comprehensive income for the year ended March 31, 2017.
Notes to the Consolidated Financial Statements for the Year ended March 31, 2018 (Contd.)

134
F. Deferred tax asset / liability has been recognized on all temporary differences, arising on account of the aforesaid adjustments and on account of temporary differences between the carrying amount of an asset or liability in the balance sheet and its tax base. This has resulted in decrease in retained earnings by ̀ 13.50 lakhs and ̀ 19.53 lakhs as at April 1, 2016 and March 31, 2017 respectively and decrease in profit by ` 6.01 lakhs for the year ended March 31, 2017.
G. Refer note 32 on exceptional items.
H. Under previous GAAP, adjustment entry relating to excess provision for tax of prior year was considered in financial year ended March 31, 2017. Under Ind AS, excess provision for tax being a material amount, the impact of the same was considered in April 1, 2016.
Note 44: Appointment of Company Secretary
The Group was having a whole time secretary during the year as required under the Companies Act, 2013 who has resigned on December 28, 2017. The Group is under the process of appointing a Whole time Company Secretary. The Group appoints external consultants for compliance of Companies Act on need basis.
Note 45: Additional information required by Schedule III
Name of the entity
Net assets (total assets minus total liabilities)
Share of profit or (loss)
Share in other
comprehensive income
Share in total
comprehensive income
As % ofconsolidated
net assets
Amount (` in
Lakhs)
As % of consolidated
profit orloss
Amount (` in
Lakhs)
As % of consolidated
other comprehensive income
Amount (` in
Lakhs)
As % of consolidated
total comprehensive income
Amount (` in
Lakhs)
Parent
National Peroxide Limited
31 March 2018 50.04% 50,884.83 99.25% 9,511.67 31.06% 6,304.26 52.93% 15,815.93
31 March 2017 50.46% 37,420.67 98.05% 3,788.26 24.41% 6,659.50 33.55% 10,447.76
Subsidiary
Naperol Investments Limited
31 March 2018 49.96% 50,800.86 0.75% 72.04 68.94% 13,990.65 47.07% 14,062.69
31 March 2017 49.54% 36,738.18 1.95% 75.25 75.59% 20,622.47 66.45% 20,697.72
Notes to the Consolidated Financial Statements for the Year ended March 31, 2018 (Contd.)
As per our report of even date attached For and on behalf of the Board of Directors
For Price Waterhouse Chartered Accountants LLPChartered Accountants Firm Registration Number: 012754N/N500016
SURESH KHURANA Chief Executive Officer & DirectorDIN:06677496
NESS N. WADIADIN: 00036049
Chairman
R. BATRADIN: 00020764
N. P. GHANEKARDIN: 00009725
MINNIE BODHANWALADIN: 00422067
} Directors
Asha RamanathanPartnerMembership No. 202660
SHAILESH CHAUHANChief Financial Officer
Mumbai, May 24, 2018 Mumbai, May 24, 2018

135
Annual Report 2017-2018
Form AOC-I(Pursuant to first proviso to sub-section (3) of section 129 read with rule 5 of Companies (Accounts) Rules, 2014)
Statement containing salient features of the financial statement of subsidiaries or associate companies or joint ventures
Part “A”: Subsidiaries ( ` in Lakhs)
1. Name of the subsidiary Naperol Investments Limited, wholly owned subsidiary
2. The date since when subsidiary was acquired May 6, 1980
3. Reporting period for the subsidiary concerned, if different from the holding company’s reporting period
Reporting period of Naperol Investments Limited is same as that of its Holding Company, National Peroxide Limited, i.e. 1st April, 2017 to 31st March, 2018
4.Reporting currency and Exchange rate as on the last date of the relevant Financial year in the case of foreign subsidiaries.
N.A.
5. Share capital 25.50
6. Reserves & surplus 50,800.86
7. Total assets 50,848.57
8. Total Liabilities (Excluding Share Capital and Reserves and Surplus) 22.21
9. Investments 50,844.69
10. Turnover 75.73
11. Profit before taxation 74.86
12. Provision for taxation 2.82
13. Profit after taxation 72.04
14. Proposed Dividend -
15. % of shareholding 100%
Notes:
1. There is no subsidiary which is yet to commence operations.2. There is no subsidiary which has been liquidated or sold during the year.
Part “B” : Associates and Joint Ventures : Not Applicable
For and on behalf of the Board of Directors
SURESH KHURANA Chief Executive Officer & DirectorDIN:06677496
NESS N. WADIADIN: 00036049
Chairman
R. BATRADIN: 00020764
N. P. GHANEKARDIN: 00009725
MINNIE BODHANWALADIN: 00422067
} Directors
SHAILESH CHAUHANChief Financial Officer
Mumbai, May 24, 2018

136
TEN YEAR STANDALONE FINANCIAL STATISTICS
(` in Lakhs)
As at / Year ended 31st March 2008-09 2009-10 2010-11 2011-12 2012-13 2013-14 2014-15 2015-16 2016-17 2017-18(IND-AS)
Assets Employed
Fixed Assets less Depreciation & CWIP 8820.20 8416.42 10275.99 12040.29 11356.33 15754.51 19134.48 18275.78 18016.25 17529.23
Investments 127.33 127.33 2177.42 2398.01 5860.87 1029.44 958.59 705.77 5137.94 25342.70
Net Current Assets 944.60 761.57 2544.18 2332.92 1611.85 4747.48 8138.38 6558.58 6922.70 9988.02
Miscellaneous Expenditure 18.49 9.17 2.07 - - - - - - -
Loans & Advances (Net) - - - 157.40 785.43 1285.49 712.53 438.92 (84.79) 1400.15
Financed by
Share Capital 574.70 574.70 574.70 574.70 574.70 574.70 574.70 574.70 574.70 574.70
Reserves & Surplus 6342.72 7290.45 12301.29 14252.14 17230.44 20083.71 20319.68 21425.06 26209.90 50310.13
Loan Funds 1649.41 144.84 885.17 526.43 102.65 403.79 5299.44 1033.10 105.33 -
Deferred Tax Liability 1343.79 1304.50 1238.50 1575.35 1706.69 1754.72 2750.16 2946.19 3102.17 3375.27
Profits & appropriations
Sales & other Income 13602.64 12250.66 18487.70 15616.72 21731.46 24062.71 20266.14 24161.23 26149.06 32056.69
Manufacturing Expenses 9366.14 8886.62 8976.64 10685.44 14552.51 17229.76 17435.73 19857.08 18488.45 16464.33
Interest 300.22 127.40 75.84 40.75 34.72 21.65 468.40 538.50 213.49 50.59
Depreciation 820.73 830.83 840.96 1002.19 1100.23 973.44 721.31 895.60 892.73 919.16
Profit Before Tax 3115.55 2405.81 8594.26 3888.34 6044.00 5837.86 1640.70 2870.05 6554.39 14622.61
Taxation 1050.97 785.71 2801.99 1140.22 2063.34 1976.03 1017.21 1072.97 1769.55 5110.94
Profit After Tax 2064.58 1620.10 5792.27 2748.12 3980.66 3861.83 623.49 1797.08 4784.84 9511.67
Dividend :
- Amount 574.70 574.70 689.64 689.64 862.05 862.05 287.35 574.70 1953.98 *3735.55
- Percentage 100% 100% 120% 120% 150% 150% 50% 100% 340% *650%
Earning Per Share (EPS)(`) 35.92 28.19 100.79 47.82 69.26 67.20 10.85 31.27 83.26 165.51
Notes :
1. Reserves & Surplus includes revaluation reserve.
2. Sales and other Income include excise duty, sale of Assets etc.
3. Dividend amount does not include Dividend Distribution Tax.
* Proposed Dividend

Registered Office: Neville House, J. N. Heredia Marg, Ballard Estate, Mumbai-400 001 Head Office: C-1, Wadia International Centre, Pandurang Budhkar Marg, Worli, Mumbai-400 025
(CIN: L24299MH1954PLC009254)
(FORM NO. MGT-11)
PROXY FORM[
Name of the Member(s) : ___________________________________________________________________________
Registered Address : ___________________________________________________________________________
___________________________________________________________________________
___________________________________________________________________________
Email ID : ___________________________________________________________________________
Company, hereby appoint:
1. Name : ____________________________________________________________________________________________________
Address : __________________________________________________________________________________________________
2. Name : ____________________________________________________________________________________________________
Address : __________________________________________________________________________________________________
Address : __________________________________________________________________________________________________
Email ID : ______________________________________Signature____________________________________________________
th Annual General Meeting of the Company to be held on Thursday, 2nd August, 2018 at 4.00 p.m. at Sunville Banquet & Conference Rooms, 9, Dr. Annie Besant Road, Near
of this page:

Resolution No. Resolutions Optional*
Ordinary Business For Against
1
Adoption of the Audited Standalone Financial Statements and Audited Consolidated Financial Statements for the financial year ended on 31st March, 2018, and the Reports of the Board of Directors and Auditors thereon
2 Declaration of Dividend for the financial year ended 31st March, 2018
3Appointment of a Director in place of Dr. (Mrs.) Minnie Bodhanwala (DIN: 00422067), who retires by rotation and being eligible, offers herself for re-appointment
Special Business
4 Ratification of the Remuneration of the Cost Auditors, M/s. D. C. Dave & Co.
5Appointment of Mr. Suresh Khurana (DIN: 06677496), as the Whole-Time Director of the Company to be designated as the “Chief Executive Officer and Director”
Signed this______________ day of July, 2018.
Signature of Member Signature of Proxy
Notes:
(1) This form of proxy in order to be effective should be duly completed and deposited at the Registered Office of the Company not less than 48 hours before the commencement of meeting.
*(2) This is only optional. Please put a ‘X’ in the appropriate column against the resolutions indicated in the Box. If you leave the ‘For’ or ‘Against’ column blank against any or all the resolutions, your Proxy holder may vote either for or against the resolution.
Affix
Revenue
Stamp

NOTES

NOTES
The Group has scaled great heights in innovation and entrepreneurship, inspired by the
centuries-old legacy of goodwill and trust. The British Coat of Arms, granted to Nowrosjee Wadia,
symbolises this legacy and the Wadia Group’s commitment to advancement and innovation.
The crest is a representation of the Group, its philosophy, beliefs and businesses.
The crest and base of the shield represent the family origins in the shipbuilding industry
during the 1700s. The middle and upper parts of the shield depict the Group’s interests in
cotton growing and its links with England in the form of the Lancastrian rose. The hand holding
the hammer atop the shield signifies industriousness, together with workmanship and skill.
The sun that surrounds the hand stands for global recognition and merit.
The motto, IN DEO FIDE ET PERSEVERANTIA means ‘Trust in God and Perseverance’.
National Peroxide Limited
Registered Office: Neville House, J. N. Heredia Marg, Ballard Estate, Mumbai - 400 001.
www.wadiagroup.com