grain size distribution of the yba 2cu 3o 7-x high
TRANSCRIPT

Grain size distribution of the YBa_2Cu_3O_7-x hightemperature superconducting compound
Kunstelj, Drago
Source / Izvornik: Fizika A, 1994, 3, 35 - 46
Journal article, Published versionRad u časopisu, Objavljena verzija rada (izdavačev PDF)
Permanent link / Trajna poveznica: https://urn.nsk.hr/urn:nbn:hr:217:446479
Rights / Prava: In copyright
Download date / Datum preuzimanja: 2021-11-16
Repository / Repozitorij:
Repository of Faculty of Science - University of Zagreb

ISSN1330–0008
CODENFIZAE4
GRAIN SIZE DISTRIBUTION OF THE YBa2Cu3O7−x HIGHTEMPERATURE SUPERCONDUCTING COMPOUND
DRAGO KUNSTELJ
Department of Physics, Faculty of Science, University of Zagreb, POBox 162, 41001Zagreb, Croatia
Received 22 April 1994
UDC 538.91
PACS 74.72.Bk
The grain size distributions of three YBa2Cu3O7−x ceramic samples, annealed at960 ◦C for different times (t = 7, 70 and 700 hours, respectively), have beeninvestigated. Both the average grain size (r) and that in the longest dimensionof the grain (l) have been measured. The ratio l/r (reflecting the deviation fromthe spherical shape) initially increases with the annealing time (t) but tends todecrease at elevated t. An approximate t1/2 increase of l probably reflects a plate-like shape of grains. For all samples the distributions of r and l are fitted best withthe log-normal (Gauss) grain size distribution. The correlation between the grainsize and critical current distributions is briefly discussed.
1. Introduction
The variation of critical currents and their distributions with thickness has beeninvestigated for YBa2Cu3O7−x samples with different grain sizes (10 µm and 30µm) in the temperature range from 78 K to 90 K in the magnetic fields up to 5mT [1]. The critical current density initially increased in the samples with smallergrains, but later on leveled off on reducing of the thickness of the samples, whereasfor the samples with bigger grains, it remained essentially unchanged even after a
FIZIKA A 3 (1994) 1, 35–46 35

kunstelj: grain size distribution of the YBa2Cu3O7−x . . .
three-fold reduction in thickness. Since other parameters did not change on reducingthe thickness of the samples, the variation of the critical currents are interpretedin terms of the thickness and grain size dependent self-field effects [1].
The critical current distribution functions of the samples were quite similar [1]and could be fitted rather well by the log-normal distribution [2].
In this work, the analysis of the grain size distributions as functions of thethermal pre-experiment treatments is presented. Various approaches to the mea-surements and analysis are discussed. The histograms are fitted by some of the mostcommon types of the grain size distribution functions. The results are comparedto those obtained from the transport property measurements on the same samples[1-3].
2. Experimental procedures
2.1. Preparation of the samples for the measurements
After the standard preparation procedure of the ceramic HTS [1], the pellets ofYBa2Cu3O7−x were subjected to different thermal treatments of annealing at 1233K (960 ◦C) in the pure oxygen atmosphere:a) for t0 = 7 hours (sample NOZ 1-I),b) t2 = 70 hours (NOZ 1-II), andc) for t3 = 700 hours (NOZ 1-III).
Samples prepared for the electrical measurements in the form of rectangularrods cut out from the pellets [1] were also used for the grain size and the shapeanalysis. For the metallographic inspection the rods were embedded in the poly-merized plastic and polished with a diamond paste with nominal particle sizes from20 µm to 2 µm. Polished samples were etched for a few seconds (5 to 10 s) in amild aqueous solution of HCl (3 drops of concentrated HCl in 50 ml of distilledwater). The prepared samples were examined in a metallurgical microscope usingunpolarized white illumination.
Photographs of the revealed structures were taken along the rods (i.e. along thedirection of current in the electrical measurements), and in the cross section per-pendicular to that direction. For illustration, a choice of photographs are presentedin Figs. 1 to 5. Upper and lower edges of the micrographs are parallel to currentdirection in the electrical measurements.
36 FIZIKA A 3 (1994) 1, 35–46

kunstelj: grain size distribution of the YBa2Cu3O7−x . . .
Fig. 1. Optical micrograph of the YBa2Cu3O7−x ceramic, sample NOZ 1-I (agedfor 7 hours at 960 ◦C), polished with diamond paste and etched for 5 seconds in amild solution of HCl in distilled water.
Fig. 2. Optical micrograph of the YBa2Cu3O7−x ceramic, sample NOZ 1-II (agedfor 70 hours at 960 ◦C), polished with diamond paste and etched for 5 seconds ina mild solution of HCl in distilled water.
FIZIKA A 3 (1994) 1, 35–46 37
kunstelj: grain size distribution of the YBa2Cu3O7−x . . .
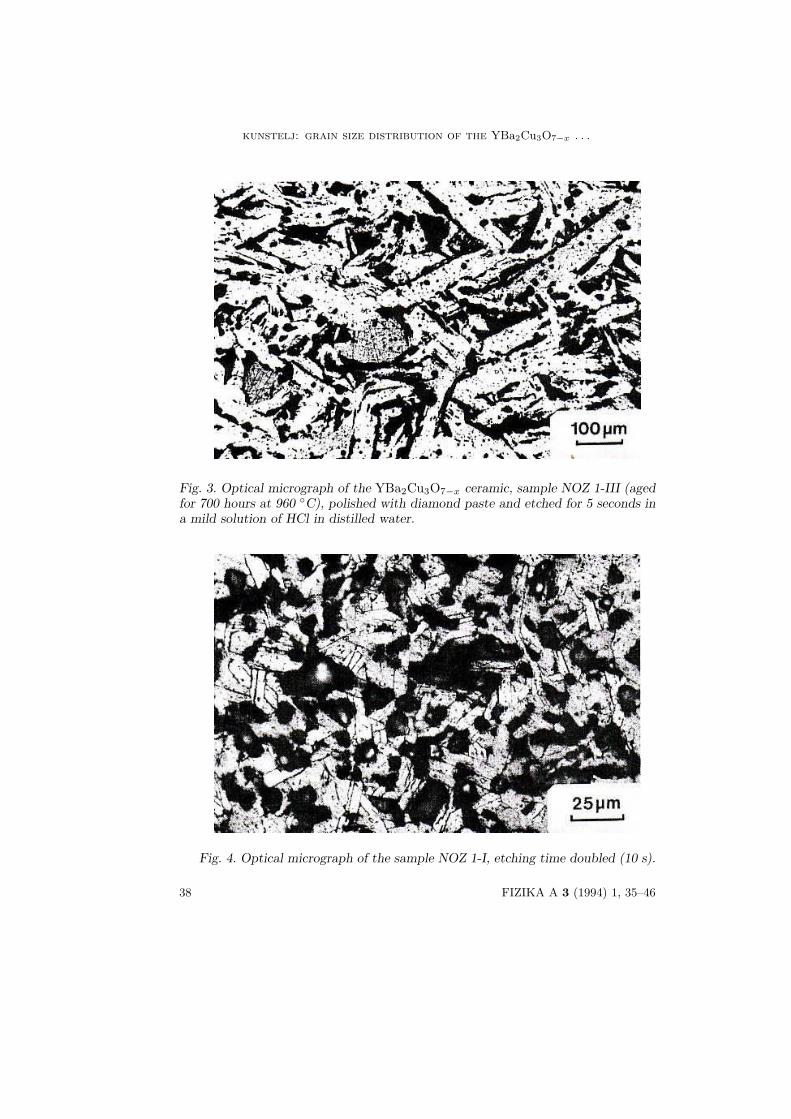
Fig. 3. Optical micrograph of the YBa2Cu3O7−x ceramic, sample NOZ 1-III (agedfor 700 hours at 960 ◦C), polished with diamond paste and etched for 5 seconds ina mild solution of HCl in distilled water.
Fig. 4. Optical micrograph of the sample NOZ 1-I, etching time doubled (10 s).
38 FIZIKA A 3 (1994) 1, 35–46

kunstelj: grain size distribution of the YBa2Cu3O7−x . . .
Fig. 5. Optical micrograph of NOZ 1-III, etching time 10 seconds.
We should note that dark irregular areas on all photographs represent dimplesin the polished area left out from the porosity of the YBa2Cu3O7−x and caused bycrushing the crystals by hard diamond particles.
Figs. 4 and 5 illustrate the effects of preparation of the samples on details onthe surfaces, as seen in metallographic investigations. E.g., changing the etchingtime from 5 to 10 seconds revealed grain boundaries more clearly, but increased thenumber and the size of etch pits inside the grains.
Inspection of all photographs, from Fig. 1 to Fig. 5, shows that the grains arepredominantly elongated and occasionally rounded. This may be explained by thefact that the easy-growth directions in this compound lies in the (001) planes, i.e.in the Cu-O planes. The crystals appear as ”needles” if the [001] direction is closelyparallel to the sample surface, or as irregular ”plates” if the [001] direction is nearlyperpendicular to the surface of the investigated sample. Note that the ”needle like”appearance of grains is dominant.
2.2. Principles of the measurements, analysis and calculations
Dimensions of the crystallites were measured in two different ways, with the aimto obtain information about the volume of crystallites in the course of the aging pro-cess and their dimensions along the conducting Cu-O planes. The linear-interceptmethod (measurements of grain sizes parallel to the current flow in electrical mea-surements) was applied in the first case (we shall call it the ”sphere approxima-tion”), and randomly oriented lines across the grains but along their long axis (weshall call it the ”plate” or ”needle” approximation), in the second case. These twosets of measurements give us the information of what we shall call the ”elipticity”(e). It is defined as the ratio of average of the long axis of the grains (l) and the”radius of the sphere” (r), that is the average of grain sizes as measured by the
FIZIKA A 3 (1994) 1, 35–46 39

kunstelj: grain size distribution of the YBa2Cu3O7−x . . .
line-intercept method: e = l/r. The ”elipticity” (e) we measured and calculated asthe function of the annealing time, is telling us about the possible preferred growthof grains along the conductive (001) Cu-O planes.
The samples were also investigated in two cross sections, parallel to the directionof the current measurements and in the cross section perpendicular to it. The aimwas to obtain information about the possible existence of texture. In each caselinear dimensions of over four hundred grains have been measured from the samearea of the sample.
3. Results and discusssion
Fig. 6. Plots of grain size distributions in the ”sphere” and ”needle” approximationof the samples NOZ 1-I,II and III.
Results of the measurements are presented in Fig. 6. From the plots (the fre-quencies of histograms are connected with lines and dots in an attempt to distin-guish the data for different samples) the following conclusions can be made:
a) The volumes of crystals grow during the annealing process. (Plots for NOZ1-I (⊙), NOZ 1-II (⊓) and NOZ 1-III (+), in the ”sphere” representation.)
b) There exists, a slightly, preferred orientation of crystals in the plane par-alell to the current measurements (△) relative to the plane perpendicular to thatdirection (▽), as revealed from a slight translation of the related plots.
c) The plots for the ”needles” are considerably broader than those for the”spheres”, that is, the distribution of the long axes of the crystals is much widerthen that of their average radii. This shows a clearly preferred crystallographicallydetermined grain growth in selected crystallographic directions (and planes).
40 FIZIKA A 3 (1994) 1, 35–46

kunstelj: grain size distribution of the YBa2Cu3O7−x . . .
d) The plots in the ”needle” approximation show a shift to larger values in rela-tion to the plots in the ”sphere” approximation. This allows defining and calculationof the ”elipticity” of grains (e).
e) All plots show a ”hump” at their tails. The humps are particularly pronouncedin the samples annealed for a longer time. This may be explained by an anoma-lous grain growth in the annealing process. However, such ”anomalous” grains, forexample in the NOZ 1-III samples, may serve as secondary crystallization nuclei.
The results of the standard statistical analysis of the experimental data aregiven in Table 1. It has to be noted that the average sizes of crystals and standarddeviations were calculated on the basis of log-normal (Gauss) distribution function.
TABLE 1.
Results of grain-size analysis of YBa2Cu3O7−x ceramic samples.
Sample t(h)/T (◦C) Diameter of the Growth Anneling
”sphere” r(µm) ratio (r/r0) time ratio (t/t0)
NOZ 1-I 7/960 8±3 1 1
NOZ 1-II 70/960 16±4 2 10
NOZ 1-III 700/960 87±9 11 100
Sample t(h)/T (◦C) ”Needle” Growth ”Elipticity”
l (µm) ratio (l/l0) (e = l/r)
NOZ 1-I 7/960 14±4 1 1.8
NOZ 1-II 70/960 47±7 3.4 3
NOZ 1-III 700/960 143±12 10 1.6
The results in Table 1. show that when the annealing time was increased from 7to 700 hours, the linear dimensions of the crystals increased by a factor of about ten,and the sizes are approximately proportional to the square root of the annealingtime (r/r0 and l/l0 ∼ (t/t0)
1/2). We note that the square root law is better obeyedfor the long dimension of the grains. This was be expected since for the plate-likegrain, with the growth rate of the thickness considerably lower than that for theother two dimensions, the volume increases in proportion with the surface area (l2).Therefore the volumes of the grains seem to increase linearly with the annealingtime for the explored time periods.
”Elipticity”, e = l/r, ranging from 1.6 to 3 in the early stage of the an-neal (7h/960 ◦C - 70h/960 ◦C), rises to approximately twice of its initial value,and decreases to its starting value (and somewhat lower) on prolonged annealing(700h/960 ◦C). This may be tentatively explained as follows. In the first stage ofthe anneal (7h/960 ◦C) crystals are elongated as the ”easy” axis of recrystalliza-tion advances at the expense of ”slow” directions (The ”easy” axes are in (001), i.e.Cu-O planes.). In the second stage (70h/960 ◦C) of this type of recrystallization,bigger grains consume its surrounding until they reach each other making a ”net”of elongated crystals. This ”touching” inhibits further growth in the easy-grow di-rection, so the bigger grains must consume smaller ones by the side-way growth.That lowers the ”elipticity” from e = 3 to approximately the starting value of 1.8.So, this may be the end of growing (big) crystals in this type of thermal treatment.
FIZIKA A 3 (1994) 1, 35–46 41

kunstelj: grain size distribution of the YBa2Cu3O7−x . . .
In addition to this analysis of the results of the experiments, some importantconclusions can be deduced. Table 1. shows that the average crystallization ratescan be calculated for the time intervals given by the experiment. The results canbe separated into two groups:
a) The average grain ”radius” growth rate (”sphere” approximation):(∆r/∆t)I−II = 8/63 = 0.127 µm/hour; (∆r/∆t)II−III = 71/630 = 0.113µm/hour; and (∆r/∆t)I−III = 0.114 µm/hour. This shows that the rate of in-creasing of the ”radius”, and so of the volume, of the crystals is approximatelyconstant.
b) The average growth rate of the long axis of the crystals (”needle” approx.):(∆l/∆t)I−II = 33/63 = 0.524 µm/hour; (∆l/∆t)II−III = 0.1524 µm/hour, and(of minor importance):(∆l/∆t)I−III = 129/693 = 0.186 µm/hour. These numberssupport our earlier discussion on the ”elipticity” behaviour.
The experimental data were fitted by theoretical distributions. Various dis-tributions were tried: the Poisson distribution, the log-normal (Gauss) and theΓ(Gamma) distribution.
Fig. 7. Plots of data for the NOZ 1-I,II and III samples in reduced coordinates.
Fig. 7. shows the collected data for all investigated samples in the reduced (nor-malized) coordinates: xi/x1 (sizes of grains reduced to the first class) and pi/pmax
(frequencies normalized to the maximal frequency). Full lines are connecting pointsin the plots for NOZ 1-I (⊙), NOZ 1-II (⊓), and NOZ 1-III (△) samples obtained inthe ”sphere” approach, and the dashed lines for the same samples in the ”needle”approach. Main features of the histograms are as follows:1. Plots obtained in the ”sphere” approach are quite narrow (most of the grainshave radii in first ten classes), showing a normal grain volume growth.2. Plots showing the grain size distribution as measured along their long axis (the
42 FIZIKA A 3 (1994) 1, 35–46

kunstelj: grain size distribution of the YBa2Cu3O7−x . . .
”needle” approximation) are broader, showing larger dispersion of the ”needle”sizes. They are also shifted to the right, showing the ”elipticity” (see Table 1.). Atthe same time the shift of maxima of the three plots shows how the ”elipticity” ofgrains increases and then decreases in the growth process.
Fig. 8. Fitting of the theoretical distributions to the averaged plots of the NOZ1-I,II and III samples (”sphere”).
The plots for the ”sphere” approximation in Fig. 7. show a common behaviour.They were chosen for the demonstration of fitting of some of the theoretical distri-butions (Fig. 8.). Averaged frequencies are connected with the broken line. Theo-retical frequencies were calculated for the Poisson distribution function (dash-dotline), gamma (Γ) distribution function (full line) and the log-normal (Gauss) dis-tribution function (dotted line), using standard expressions [4]. The log-normal(Gauss) distribution function fits best to the experimental data. The experimentaldata were renormalized in order to minimize the summ of squares of differencesbetween experimental and the theoretical frequencies (χ2 test). The test resultedin χ2 = 0.02, substantially lower than 0.05, the limiting value of means that the hy-pothesis is acceptable and that the distribution of grain sizes in our samples is thelog-normal (Gauss) distribution. Test of goodnes of fit was also made by lineariza-tion of experimental frequencies assuming the log-normal (Gauss) distribution. Astraight line can be drawn between the experimental points using the least-squaresmethod, as seen in Fig. 9. This line fits the experimental data well. That was alsochecked by the linear regression calculation, which gives the correlation coefficientr = −0.95. Finally it has to be pointed out that the same type of distribution(log-normal) holds for the grains measured in the ”sphere” and in the ”needle”approximation.
FIZIKA A 3 (1994) 1, 35–46 43

kunstelj: grain size distribution of the YBa2Cu3O7−x . . .
Fig. 9. Check of the goodness of fit of the log-normal (Gauss) distribution data ofthe samples NOZ 1-I,II and III in the ”sphere” approximation.
4. Conclusions
The investigation of the grain sizes in the YBa2Cu3O7−x ceramic annealed inan oxygen atmosphere at 960 ◦C for varying times (up to 700 hours) shows that thegrains grow according to an approximate ”t1/2 law” (see data in Table 1). This canbe explained in terms of the plate-like shape of the grains and unequal growth ratesfor two crystallographic directions, [100] and [001], respectively. Our data indicatethat the initial rate of the grain growth along its lenght, (∆l/∆t)I−II , is about fourtimes larger than the average one, (∆r/∆t)I−II .
The rate of grain growth along its length varies with time, being slowed-downin later stages of the anneal by the long axis ”collision” effect, as calculated in the”needle” approach. The grain growth rate calculated in the ”sphere” approximationis nearly constant. The pronounced needle-like appearance of the grains in the laterstages of annealing indicates that the crystallographic c-direction is mostly in theplane of the surface of the sample and thus in the plane of the current flow in thestudies of the transport properties. This probably explains the fact that prolongedannealing of the samples did not cause any improvement of the critical currentdensities [1-3]. Indeed, large improvement in the critical current density has onlybeen obtained for the bulk samples with densely packed plate-like grains havingc-axis perpendicular to the current direction [5].
44 FIZIKA A 3 (1994) 1, 35–46

kunstelj: grain size distribution of the YBa2Cu3O7−x . . .
The distribution of grain sizes fit best the log-normal (Gauss) distribution func-tion. Fit of the gamma distribution is reasonable and Poisson diverges too much.Therefore, the grain size distributions of the investigated samples seem to obey thesame statistic as the distributions of their critical currents [1-3] deduced from theV − I characteristics [6]. This is consistent with the fact that critical current densi-ties in ceramic HTS samples are limited by the quality of the inter-grain boundaries[7], indicating that this parameter has the same distribution as the grain size.
Acknowledgements
The author wishes to express thanks to E. Babic for many fruitfull discussionsduring the work and comments on the manuscript, and to M.Prester for kindlysupplying the samples for the measurements.
References
1) E. Babic, M. Prester, D. Drobac, Z. Marohnic, P. Nozar, P. Stastny and F. Matacotta,Phys. Rev. B 43 (l992) 913;
2) M. Prester, Ph.D. Thesis, University of Zagreb, 1993., unpublished;
3) E. Babic, M. Prester and N. Biskup, SSC 77 (1991) 849;
4) I. Pavlic, Statisticka teorija i primjena, Tehnicka knjiga, Zagreb, 1985;
5) S. Jin, R. C. Sherwood, E. M. Sherwood, E. M. Gyorgy, T. H. Tiefel, R. B. van Dover,S. Nakahara, L. F. Schneemayer, R. A. Fastnacht and M. E. Davis, Appl. Phys. Lett.54 (1989) 584;
6) J. Baixeras and G. Fournet, J. Phys. Chem. Sol. 28 (1967) 1541;
7) E. Babic, M. Prester, D. Babic, Z. Marohnic and D. Drobac, Fizika A 1 (1992) 67.
FIZIKA A 3 (1994) 1, 35–46 45

kunstelj: grain size distribution of the YBa2Cu3O7−x . . .
ANALIZA RASPODJELE VELICINE ZRNA VISOKOTEMPERATURNOGSUPRAVODLJIVOG SPOJA YBa2Cu3O7−x
DRAGO KUNSTELJ
Fizicki odjel, Prirodoslovno-matematicki fakultet Sveucilista u Zagrebu, p.p. 162,Bijenicka c. 32, 41001 Zagreb, Hrvatska
UDK 538.91
PACS 74.72.Bk
Istrazivane su raspodjele velicine zrna (kristalita) u uzorcima YBa2Cu3O7−x
keramike koji su bili dozrijevani na 960 ◦C 7 sati, 70 sati i 700 sati. Mjerena jeprosjecna velicina zrna (r) i njihova najveca duzina (l). Omjer l/r, koji odrazavaodstupanje zrna od sfericnosti, u pocetku raste s vremenom dozrijevanja (t), teopada za duza vremena. Priblizna t1/2 proporcionalnost s l po svoj prilici odrazavaplosni oblik zrna. U svim ispitivanim uzorcima raspodjele za r i l najbolje opisujelog-normalna (Gaussova) distribucija. Povezanost raspodjele velicine zrna i raspod-jele kriticnih struja za iste uzorke ukratko je diskutirana.
46 FIZIKA A 3 (1994) 1, 35–46