determining the critical temperature of a yba cu o...
TRANSCRIPT

Determining the Critical Temperature of a YBa2Cu3O7 Superconductor at Varying Currents Using a Four-Point Probe
Roger Klein
Physics Department, The College of Wooster, Wooster, Ohio 44691, USA May 3rd, 2010
Superconductors are materials that allow for the flow of electrons with zero resistance when the
temperature of the material drops below a critical temperature. This experiment sought to determine the critical temperature of the YBa2Cu3O7 ceramic superconductor when subject to a current of 100 mA and 480 mA. The resistance across the superconductor was measured using a four-point probe as it was slowly heated from 77 K. It was found that the critical temperature of the probe was approximately 105 ± 2 K at 480 mA and 102.7 ± 0.3 at 100 mA, indicating that increased current results in a decrease in critical temperature, a trend consistant with previous observations [Colorado Superconductor, Inc. Instruction Manual for Superconductor Demonstrations. 1991.]. Previously, the value for critical temperature has been reported to be 93 K [Wu, M. Phys. Rev. Lett. 58 908-910 (1987)]. This difference can be attributed in part to the natural upwards drift of critical temperature in a Type-II superconductor with time, and in part the method used to measure the temperature values themselves.
I. INTRODUCTION
Superconductivity was discovered as an accidental byproduct of experimentation with liquid helium in 1911 by H. Kamerlingh-Onnes. It was observed that, at temperatures of approximately 4 K, the resistance across samples of common metals such as lead and copper drop to zero when a current is applied [1]. Unfortunately, the low temperature required created financial and logistical barriers towards widespread study and implementation. However, in 1986, a research lab in Switzerland discovered that a certain class of ceramics known as perovskites could also function effectively as superconductors. In the following decade, the critical temperature of known superconducting materials rose to approximately 139 K. The ability to use liquid nitrogen to cool superconductors below their critical temperature was a major breakthrough, as it is significantly cheaper and easier to produce. These ceramic superconductors are also known as Type-II superconductors, named as such because they lack an abrupt transition from conducting electricity normally to acting as a superconductor [1].
Today, ceramic superconductors are being manufactured with a variety of different formulas. Generally, these ceramics are metal oxides that have a chemical formula consisting of two metal atoms for every three oxygen atoms. Copper, bismuth, barium, and mercury are all common metals used in the production of superconductors [2]. Most modern superconductors represent a combination of metals. For example, the superconductor used in this experiment, the YBa2Cu3O7 superconductor, uses a combination of yttrium, barium, and copper. Interestingly, the number of oxygen atoms is two
fewer than predicted by the 2:3 ratio rule, the reasons for which are unknown.
Currently, work is being performed to find more practical applications for the superconductor, including high-current power lines, ultrastrong electromagnets, and electric motors. However, the limitations of current superconductors make the achievement of some of these goals difficult. For example, ceramics are brittle and prone to breaking, thus making them poor candidates for long wires that cannot remain completely rigid.
II. THEORY
Electricity is conducted when lone electrons move through a conducting medium, such as a metal. However, as these electrons move, they are subject to interference as they collide with the nuclei and other ions present in the lattice structure of the conductor. Thus, the moving electrons are scattered, resulting in a resistance to the flow of current, as described by the relation
R = V/I (1) which states that the resistance, R, is equal to the voltage (V) divided by the current, I. Similarly, the power loss can be calculated as
€
Pdissipated = I2R
It is this power loss that makes the transmission of electrical current over long distances using conventional conducting mediums inefficient.

FIG 1: Schematic of the four-point probe. Adapted from reference [1].
Superconductors operate differently. Instead of lone electrons carrying a current through a conducting medium, traditional superconductors involve the movement of electron pairs, known as Cooper pairs. At low temperatures, these pairs of electrons act as a superfluid, allowing the electrons to flow freely through the ionic lattice [2].
Although this theory applies to Type-1 superconductors, high-temperature ceramic superconductors are known to function in a completely different manner. In a high-temperature, Type-II superconductor, the transition from normal conductivity to superconductivity is more gradual, as an intermediate mixed state results when external magnetic fields and borderline temperatures alter the superfluidity of the electron fluid. Small vortexes created in the electron fluid cause a small, but detectable, resistance. However, if the temperature is lowered further, these vortexes disappear, and the resistance drops to completely zero. Thus, in effect, a Type-II superconductor has two critical temperatures, Tc1 and Tc2. However, the difference between these two critical temperatures is indistinguishably small using the methods in this experiment. Thus, the value of the critical temperature will be determined visually based on the point at which the resistance transitions from above zero to zero, as in Reference [5].
III. METHODS
A. Setup of Four-Point Probe
To monitor the resistance across the superconductor, a four-point probe, manufactured by Colorado Superconductor, Inc., is used in conjunction with a YBa2Cu3O7 ceramic superconductor. This probe is shown schematically in Fig. 1 and the circuit diagram for the four-point probe is pictured in Fig. 2. The four-point probe measures the potential drop across the resistor (2 and 3) while current is delivered from the DC power supply through two more probes (1 and 4). This setup eliminates the
FIG 2: Circuit diagram of the four point probe. In place of a separate ammeter and voltmeter, a multichannel Keithley multimeter was used, with each pair of probes wired into a different channel. Figure adapted from Reference 1.
contact resistance that, while traditionally insignficant, becomes substantial relative to the low resistance values measured in this experiment. The probe was then wired into a digital multimeter (Keithley 2000) and a power supply (Kepco Current Regulator.)
B. Cooling the Probe The superconductor was fully immersed in liquid nitrogen, where it was left until all boiling ceased. The superconductor was then raised slightly above the surface of the liquid, and the top of the container was covered to slow the temperature increase, and maximize the number of data points around the transition temperature. Data was collected until the temperature of the probe reached 120 K, after which it was removed and dried After three trials were performed with a current of 100 mA, the current was raised to 480 mA and three more trials were conducted.
The data from the multimeter was aquired using the LabView software (Version 8, file name SupercondK200_LV8.llb, and was imported to Igor for analysis. Once the resistance was graphed as a function of temperature, the data was visually examined to determine the critical temperature of the superconductor. Because the transition took place over a range of 4 K, the beginning of the transition from classical resistance to zero was taken to be the critical temperature.
Calculating the Temperature In order to report a temperature value, a
thermocouple measures the potential difference across two different metals. The metals are chosen
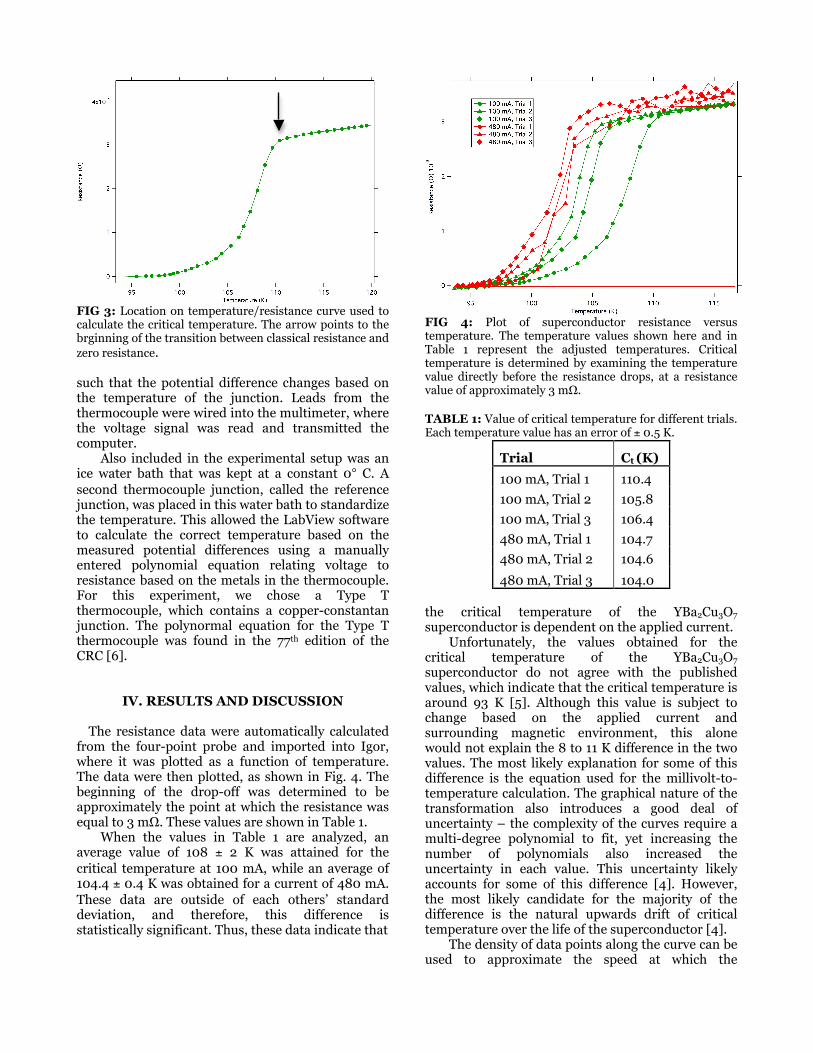
FIG 3: Location on temperature/resistance curve used to calculate the critical temperature. The arrow points to the brginning of the transition between classical resistance and zero resistance. such that the potential difference changes based on the temperature of the junction. Leads from the thermocouple were wired into the multimeter, where the voltage signal was read and transmitted the computer.
Also included in the experimental setup was an ice water bath that was kept at a constant 0° C. A second thermocouple junction, called the reference junction, was placed in this water bath to standardize the temperature. This allowed the LabView software to calculate the correct temperature based on the measured potential differences using a manually entered polynomial equation relating voltage to resistance based on the metals in the thermocouple. For this experiment, we chose a Type T thermocouple, which contains a copper-constantan junction. The polynormal equation for the Type T thermocouple was found in the 77th edition of the CRC [6].
IV. RESULTS AND DISCUSSION
The resistance data were automatically calculated from the four-point probe and imported into Igor, where it was plotted as a function of temperature. The data were then plotted, as shown in Fig. 4. The beginning of the drop-off was determined to be approximately the point at which the resistance was equal to 3 mΩ. These values are shown in Table 1.
When the values in Table 1 are analyzed, an average value of 108 ± 2 K was attained for the critical temperature at 100 mA, while an average of 104.4 ± 0.4 K was obtained for a current of 480 mA. These data are outside of each others’ standard deviation, and therefore, this difference is statistically significant. Thus, these data indicate that
FIG 4: Plot of superconductor resistance versus temperature. The temperature values shown here and in Table 1 represent the adjusted temperatures. Critical temperature is determined by examining the temperature value directly before the resistance drops, at a resistance value of approximately 3 mΩ. TABLE 1: Value of critical temperature for different trials. Each temperature value has an error of ± 0.5 K.
Trial Ct (K) 100 mA, Trial 1 110.4
100 mA, Trial 2 105.8
100 mA, Trial 3 106.4
480 mA, Trial 1 104.7
480 mA, Trial 2 104.6
480 mA, Trial 3 104.0 the critical temperature of the YBa2Cu3O7 superconductor is dependent on the applied current.
Unfortunately, the values obtained for the critical temperature of the YBa2Cu3O7
superconductor do not agree with the published values, which indicate that the critical temperature is around 93 K [5]. Although this value is subject to change based on the applied current and surrounding magnetic environment, this alone would not explain the 8 to 11 K difference in the two values. The most likely explanation for some of this difference is the equation used for the millivolt-to-temperature calculation. The graphical nature of the transformation also introduces a good deal of uncertainty – the complexity of the curves require a multi-degree polynomial to fit, yet increasing the number of polynomials also increased the uncertainty in each value. This uncertainty likely accounts for some of this difference [4]. However, the most likely candidate for the majority of the difference is the natural upwards drift of critical temperature over the life of the superconductor [4].
The density of data points along the curve can be used to approximate the speed at which the

temperature of the superconductor was raised (with the exception of Trial 1 at 480 mA, which has an artificially low number of data points resulting from an error in the multimeter.) It can be seen that Trial 1 at 100 mA has more points during the transition between classical and superconductivity resistance, indicating slower warming. This is also the run with the highest critical temperature. Thus, these data seem to indicate there is a small correlation between this speed and the critical temperature. If one wanted to study the effect of warming speed on critical temperature, experiments would have to be performed with a sophisticated insulation apparatus to more tightly control the rate of temperature ascent, and more data points would have to be obtained to lower the uncertainty.
V. CONCLUSION
These data clearly indicate that varying the current through the superconductor affects the
critical temperature of the YBa2Cu3O7. The value of the critical temperature at 480 mA was found to be 108 ± 2 K, while the value at 100 mA was found to be 104.4 ± 0.4 K. Differences between these values and the reported value of 93 K can be attributed to uncertainty in the voltage-temperature conversion of the thermocouple as well as the drift of the superconductor’s critical temperature that occurs naturally with age. Another possibility that could explain the difference is a current higher than the value used to calculate the 93 K value, which was not listed [5]. In the future, further study could be conducted to determine the effect of the rate of temperature increase on the critical temperature. To do this, improved insulation of the probe would be necessary to slow the temperature increase and enable us to obtain more data points to decrease experimental uncertainty. Additionally, the effects of an external magnetic field on the critical temperature could be examined if rare earth magnets of varying strength were added to the probe assembly.
REFERENCES
[1] Colorado Superconductor, Inc. Instruction Manual for Superconductor Demonstrations. 1991. [2] “Type-II Superconductor,” Wikipedia. <http://en.wikipedia.org/wiki/Type_II_superconductor> Accessed on 2 February 2010. [3] “Superconductivity,” Wikipedia <http://en.wikipedia.org/wiki/Superconductivity> Accessed on 2 February 2010. [4] Personal Communication with Dr. Susan Lehman
[5] Wu, M. K, Ashburn, J. R., Torng, C. J. Hor, P.H., Meng, R. L., Gao, L, Huang, Z. L., Wang, Y. Q., and Chu, C. W. “Superconductivity at 93K in a New Mixed-Phase Y-Ba-Cu-O Compound System at Ambient Pressure.” Phys. Review Letters. 58:9 908-910 (1987) [6] Handbook of Chemistry and Physics,77th Edition, edited by David R. Lide. (The Chemical Rubber Company, Cleveland, OH 1996), p15-9.