graduating senior survey report · graduating senior survey report ... summer 2003 fall 2003 winter...
TRANSCRIPT
Graduating Senior Survey ReportC l a s s o f 2 0 0 3 - 2 0 0 4
Graduates from
Summer 2003Fall 2003Winter 2004Spring 2004
PublishedDecember 2005
CALIFORNIA STATE UNIVERSITY, STANISLAUSOffice of Institutional Research • 801 West Monte Vista Avenue • Turlock, California 95382
Graduating Senior Survey Report, Class of 2003-2004 Office of Institutional Research, December 2005
i
Table of Contents
Table of Contents .......................................................................................................... i University Report Background ................................................................................................................... 1 Methodology ................................................................................................................. 2 Executive Summary ....................................................................................................... 3 Data Tables .................................................................................................................... Table 1: Quality of Overall University ....................................................................... 7 Table 2a: Preparation/Availability of the General Education Courses....................... 8
Table 2b: Preparation/Availability of the General Education Courses (by college) . 9 Table 3a: General Education Courses Academic Perceptions.................................... 10 Table 3b: General Education Courses Academic Perceptions (by college) .............. 11 Table 4a: Perception of Major Department ................................................................ 12 Table 4b: Perception of Major Department (by college) ............................................ 13 Table 5: Recommendation of the University .............................................................. 14 Table 6: Immediate Employment Plans...................................................................... 15 Table 7: Salary Increase Due to Graduation ............................................................... 16 Table 8: Job Field........................................................................................................ 17 Table 9: Employment Sector ...................................................................................... 18 Table 10: Annual Income............................................................................................ 19 Table 11: Degree Goals .............................................................................................. 20 Table 12: Institution Will Attend After Graduation ................................................... 21 Table 13: Program/Major Will Enroll in After Graduation........................................ 22 Table 14: Library Services (number of times used).................................................... 23 Table 15: Library Services (facilities used) ................................................................ 24 Table 16: Library Services (preference of library instruction) ................................... 25 Table 17a1: Satisfaction of Services (Enrollment Services)....................................... 26 Table 17a2: Satisfaction of Services (Enrollment Services) (by college) ................. 27 Table 17b1: Satisfaction of Services (Career Guidance & Counseling)..................... 28
Table 17b2: Satisfaction of Services (Career Guidance & Counseling) (by college) 29 Table 17c1: Satisfaction of Academic Support .......................................................... 30 Table 17c2: Satisfaction of Academic Support (by college) ...................................... 31 Table 17d1: Satisfaction of Computer Support .......................................................... 32 Table 17d2: Satisfaction of Computer Support (by college) ...................................... 33 Table 17e1: Satisfaction of Campus Facilities............................................................ 34 Table 17e2: Satisfaction of Campus Facilities (by college) ....................................... 35 Table 17f1: Satisfaction of Student Activities ............................................................ 36 Table 17f2: Satisfaction of Student Activities (by college) ....................................... 37 Table 18a: Academic/ Social Climate of the University (Academic)......................... 38 Table 18b: Academic/ Social Climate of the University (Social)............................... 41 Table 19: High School ................................................................................................ 44 Table 20: Parents Graduated from College................................................................. 45
Graduating Senior Survey Report, Class of 2003-2004 Office of Institutional Research, December 2005
ii
Table of Contents Table 21: Campus Activities Participation ................................................................. 46 Table 22: High School Class Size............................................................................... 47 Table 23: Siblings Graduated from College ............................................................... 48 Table 24: Community Service/Internship Participation ............................................. 49 Appendix A Demographics of All Graduates and Respondents ........................................................ 50 Appendix B Graduating Senior Survey, 2003-2004 .......................................................................... 53 Appendix C Comments ...................................................................................................................... 57

University Report

Graduating Senior Survey Report, Class of 2003-2004 Office of Institutional Research, December 2005
Page 1
Background The Office of Institutional Research began administering the Graduating Senior Survey with the class of 2002-2003 – graduates of the summer 2002, fall 2002, winter 2003, and spring 2003 terms. Surveys are mailed to graduates the summer of their commencement; see Methodology section for details. Institutional Research tabulates responses and prepares a report which includes an executive summary and data summary tables in the aggregate. College level frequency tables and verbatim comments are provided to the three college deans (College of Arts, Letters, and Sciences, College of Business Administration, and College of Education) for review and assessment purposes. The degree program/major level frequency tables are provided to department chairs/self-study coordinators prior to undergoing the seven-year program review process and for other assessment-related activities. Data is presented in a format so that individual students cannot be identified. Degree program/major level frequency tables are not available for degree programs with no or low response rates from their respective graduates.

Graduating Senior Survey Report, Class of 2003-2004 Office of Institutional Research, December 2005
Page 2
Methodology All students on the graduation list are initially invited to participate in the Graduating Senior Survey. The surveys are imprinted with a code associated with the students’ identification numbers. This is necessary in order to determine response rates and capture demographic data. All individual responses are confidential. First contact: Potential graduates are mailed a letter inviting them to participate in the Graduating Senior Survey, along with a Graduating Senior Survey instrument, and a self-addressed, postage-paid reply envelope. Second contact: Approximately three weeks after the first contact, non-respondents who completed their graduation requirements are mailed a follow-up letter, encouraging them to participate. Third contact: Several weeks following the initial contact, non-respondents are mailed a postcard reminder. Fourth contact: Approximately three months following the first contact, non-respondents are mailed a follow-up letter, along with Graduating Senior Survey, and a self-addressed, postage-paid reply envelope. The Institutional Research staff is responsible for all aspects of the data collection including mailing surveys to graduates, collecting and scanning completed surveys, tracking respondents, conducting follow-ups with non-respondents, and verifying data accuracy. The Office of Institutional Research conducted four mailings of the 2003-2004 Graduating Senior Survey.

Graduating Senior Survey Report, Class of 2003-2004 Office of Institutional Research, December 2005
Page 3
Executive Summary A survey of graduating seniors from the 2003-2004 class was undertaken as part of a larger program aimed at strengthening the university’s knowledge of students’ perceptions of the university. The survey obtained information on the career and educational objectives of graduating seniors, perceptions of preparation for graduate study, preparation for job responsibilities, and the overall satisfaction of California State University, Stanislaus’ programs and services. (A copy of the survey instrument is provided as Appendix B.) A comparison of demographic characteristics of survey participants (2003-2004 baccalaureate graduates) provided in Appendix A shows there is little response bias – women and white students were more likely to respond to the survey. This mail survey achieved a final participation rate of 44.8% (n=603). This is slightly higher than the rate that was achieved for the 2002-2003 graduating class, which was 43.4%.
Original Sample Undeliverable
Addresses Adjusted Sample
Survey Respondents Response Rate
Total No. % No. Total Total 1,368 23 1.7 1,345 603 44.8
PART A: EVALUATION OF EDUCATIONAL EXPERIENCES
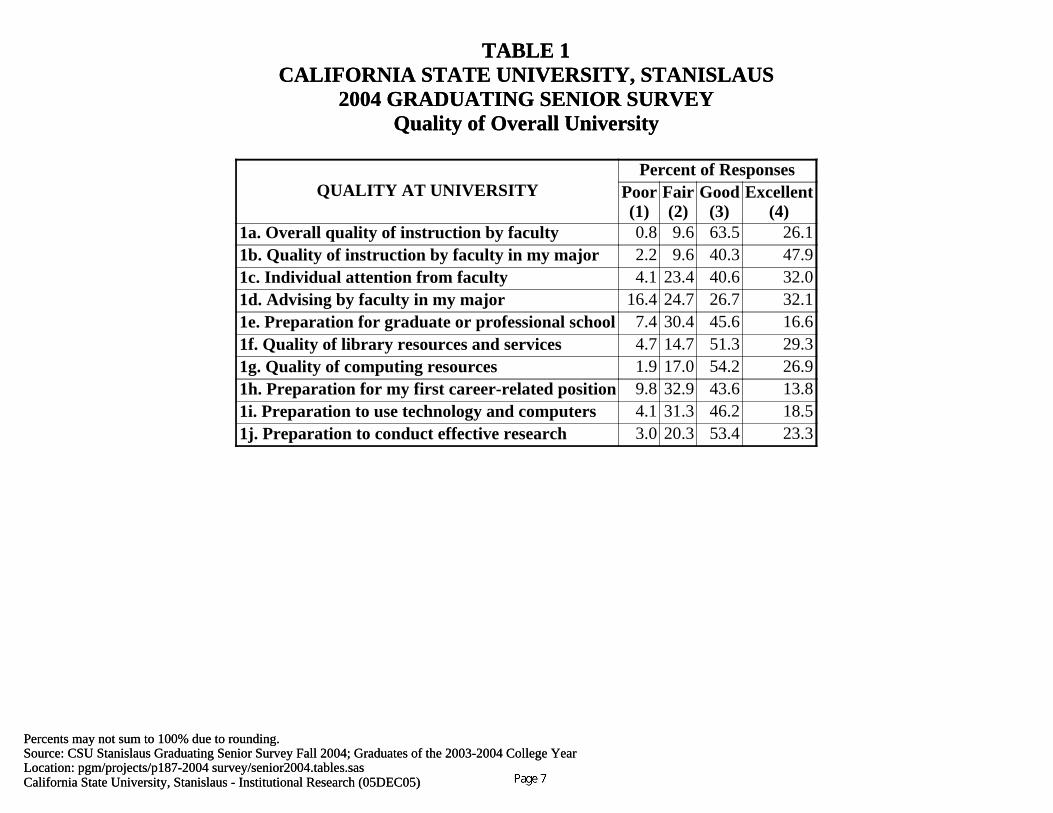
• The overall quality of instruction by faculty was rated as either good or excellent by 89.6% of survey respondents. Individual attention received from faculty was rated as good or excellent according to 72.6% of respondents. (Table 1)
• Over 88% of respondents rated the quality of instruction by faculty in their major as good
or excellent. Faculty advising was rated as good or excellent according to 58.8% of respondents. (Table 1)
• The majority of respondents rated their preparation for graduate or professional school
(62.2%) and preparation for their first career-related position (57.4%) as good or excellent. (Table 1)
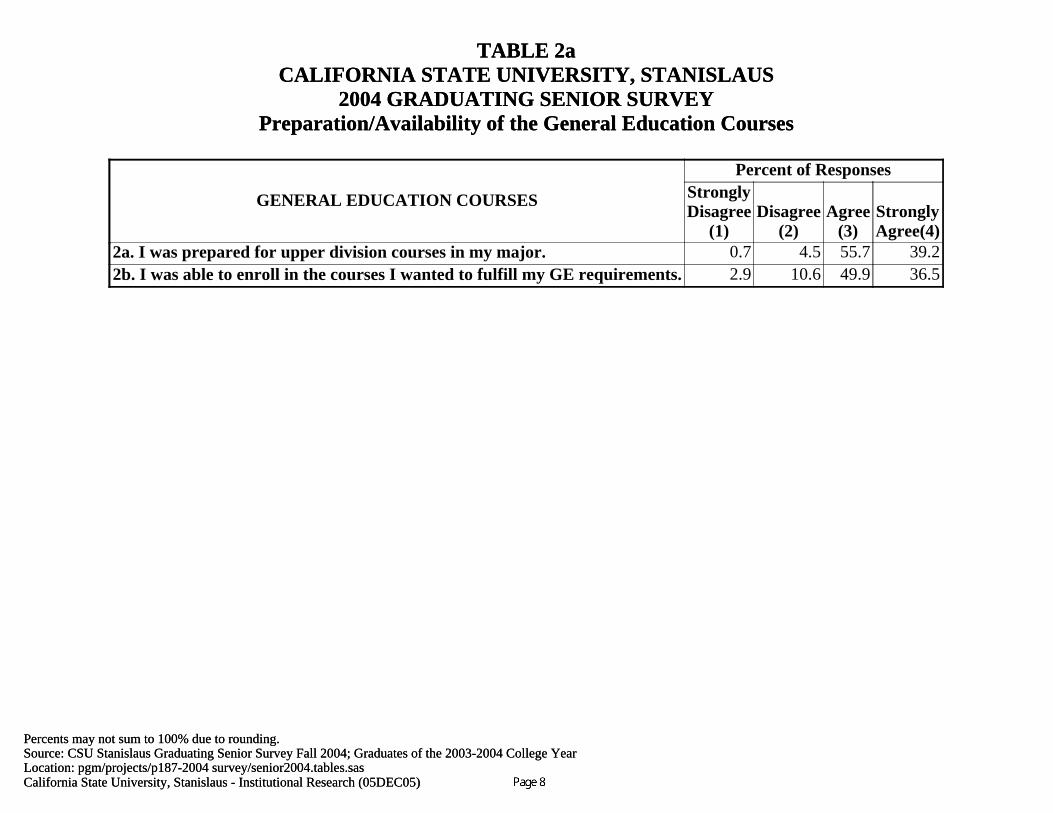
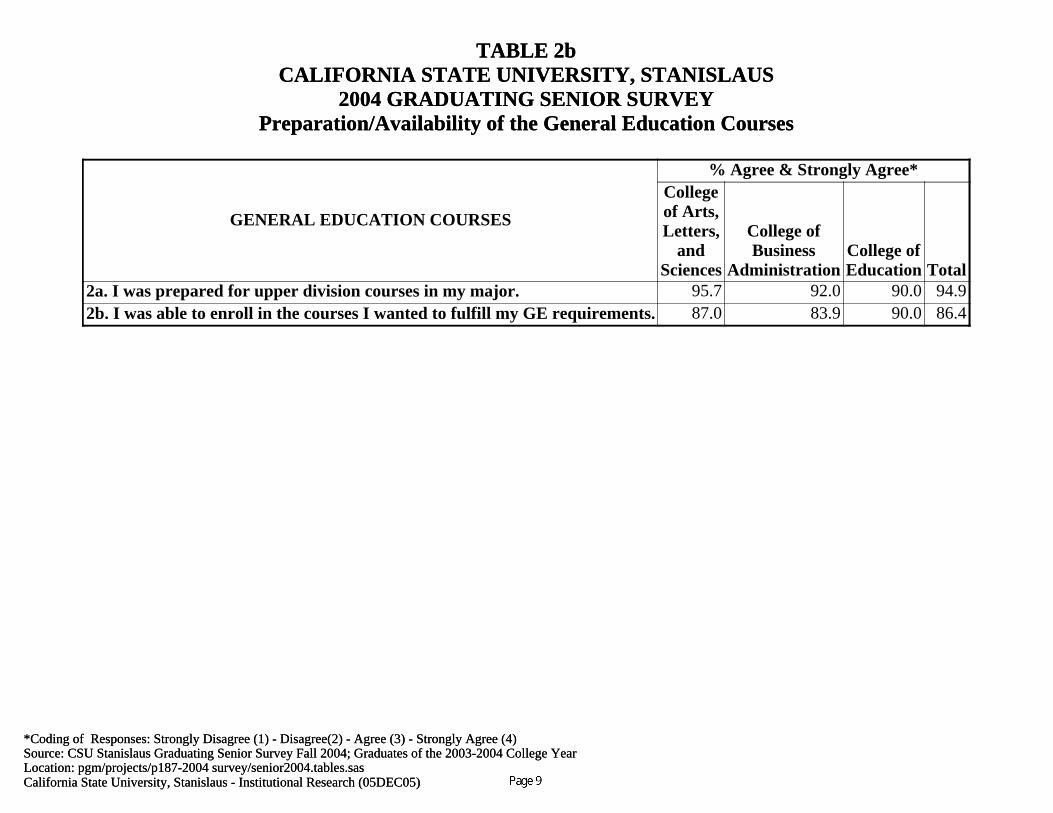
• Most graduating seniors (94.9%) agreed that general education courses prepared them for
upper division courses in their major, and they were able to enroll in the courses they wanted in order to fulfill their GE requirements (86.4%). (Table 2a)
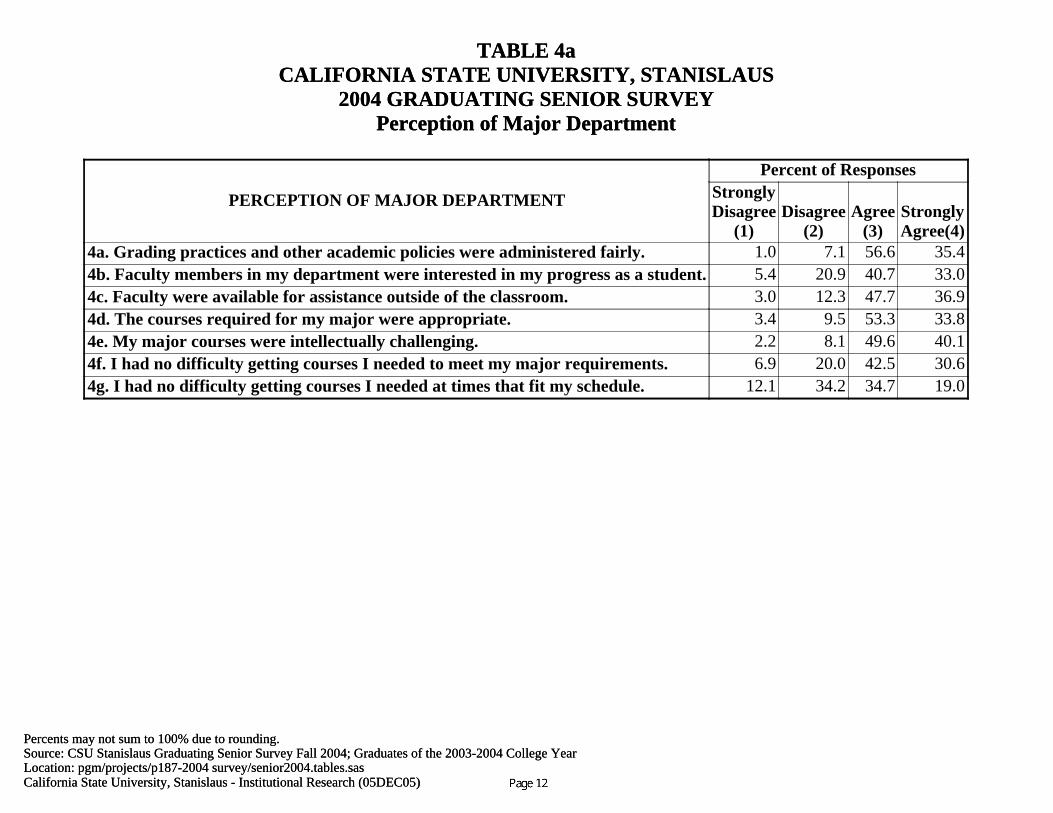
• Nearly ninety percent of graduating seniors agreed that their major courses were
intellectually challenging. (Table 4a) • Eight out of ten respondents would recommend CSU Stanislaus to another student.
(Table 5)
Graduating Senior Survey Report, Class of 2003-2004 Office of Institutional Research, December 2005
Page 4
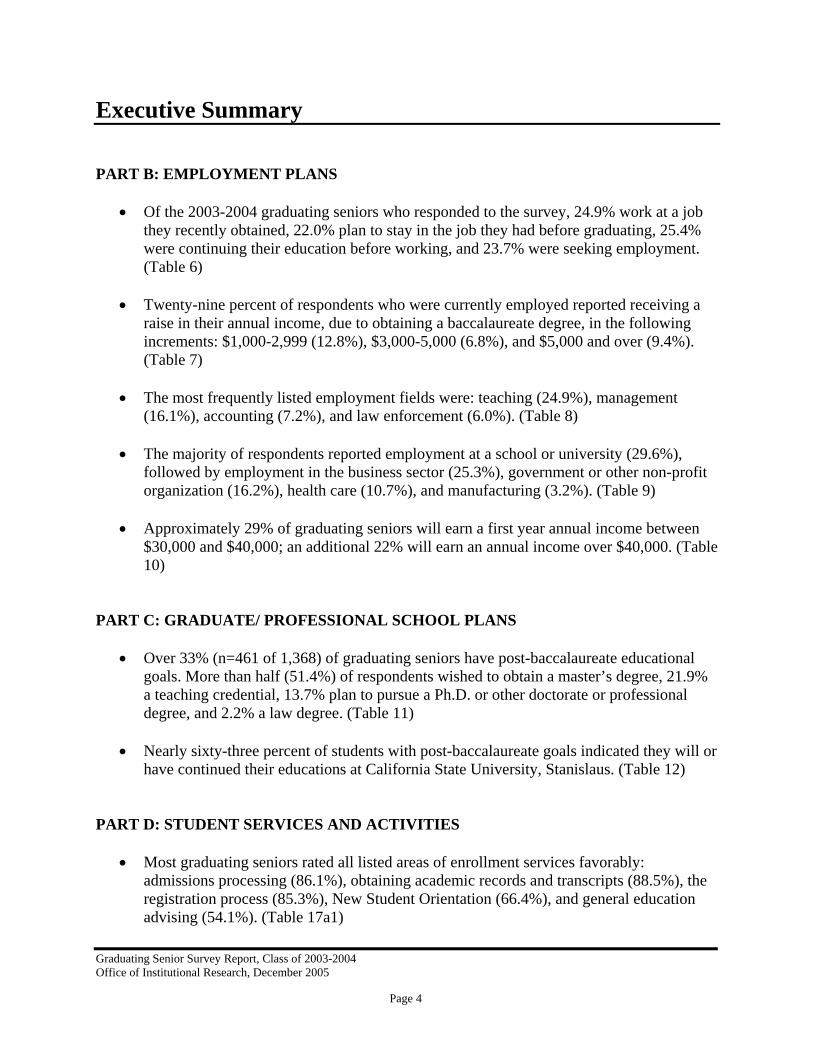
Executive Summary PART B: EMPLOYMENT PLANS
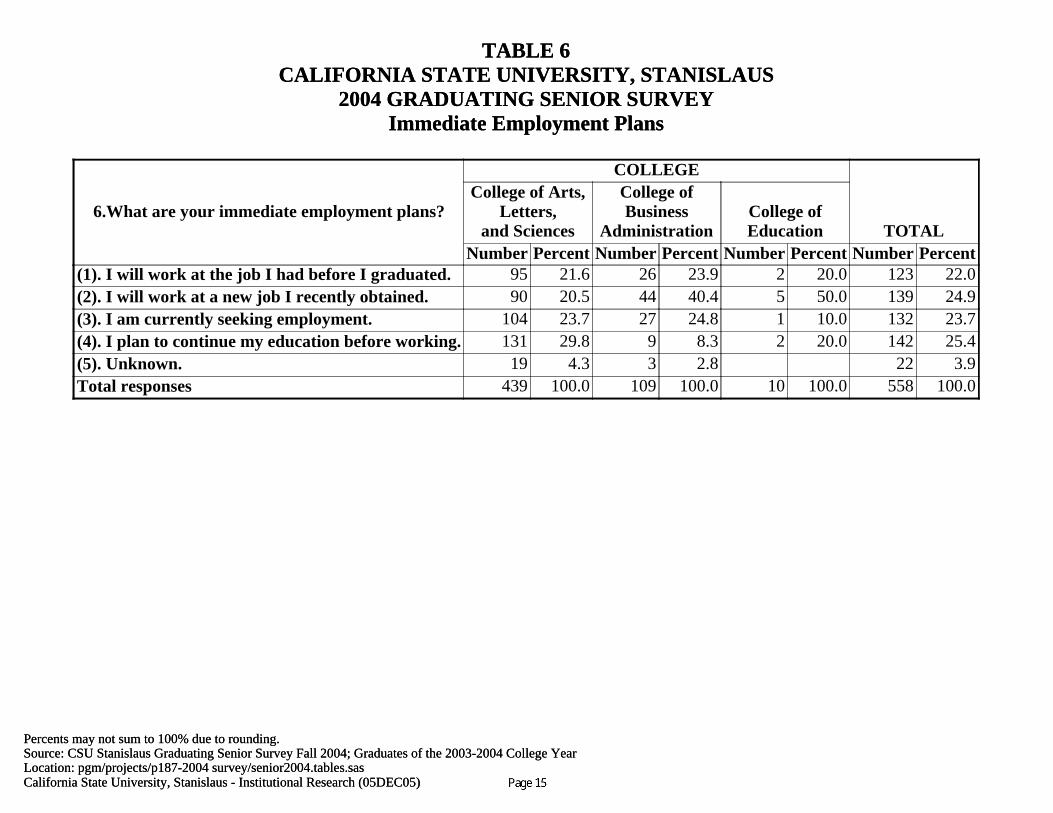
• Of the 2003-2004 graduating seniors who responded to the survey, 24.9% work at a job they recently obtained, 22.0% plan to stay in the job they had before graduating, 25.4%
were continuing their education before working, and 23.7% were seeking employment. (Table 6)
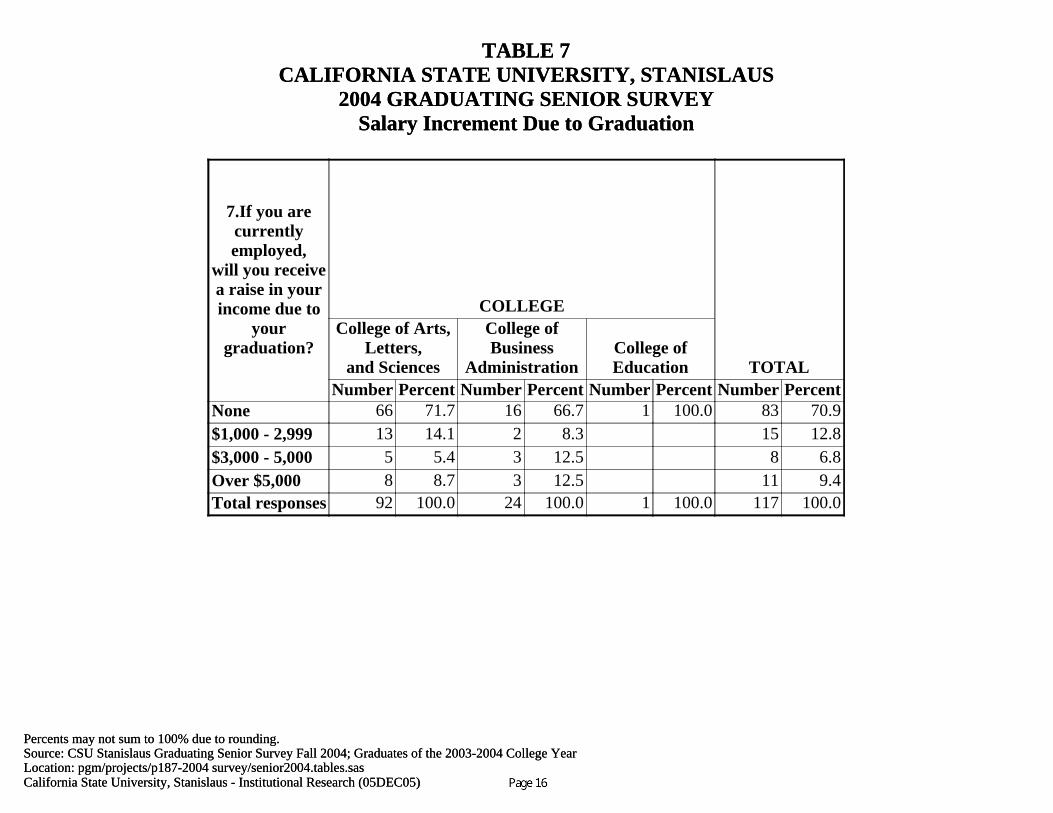
• Twenty-nine percent of respondents who were currently employed reported receiving a
raise in their annual income, due to obtaining a baccalaureate degree, in the following increments: $1,000-2,999 (12.8%), $3,000-5,000 (6.8%), and $5,000 and over (9.4%). (Table 7)
• The most frequently listed employment fields were: teaching (24.9%), management
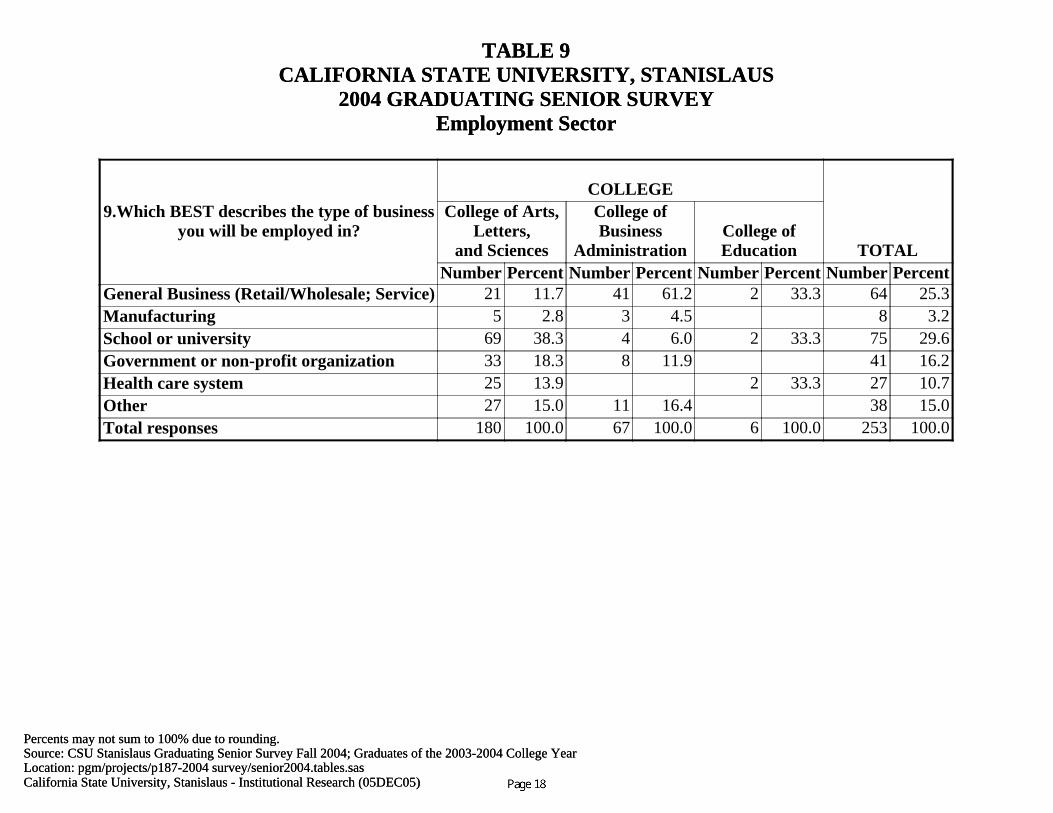
(16.1%), accounting (7.2%), and law enforcement (6.0%). (Table 8) • The majority of respondents reported employment at a school or university (29.6%),
followed by employment in the business sector (25.3%), government or other non-profit organization (16.2%), health care (10.7%), and manufacturing (3.2%). (Table 9)
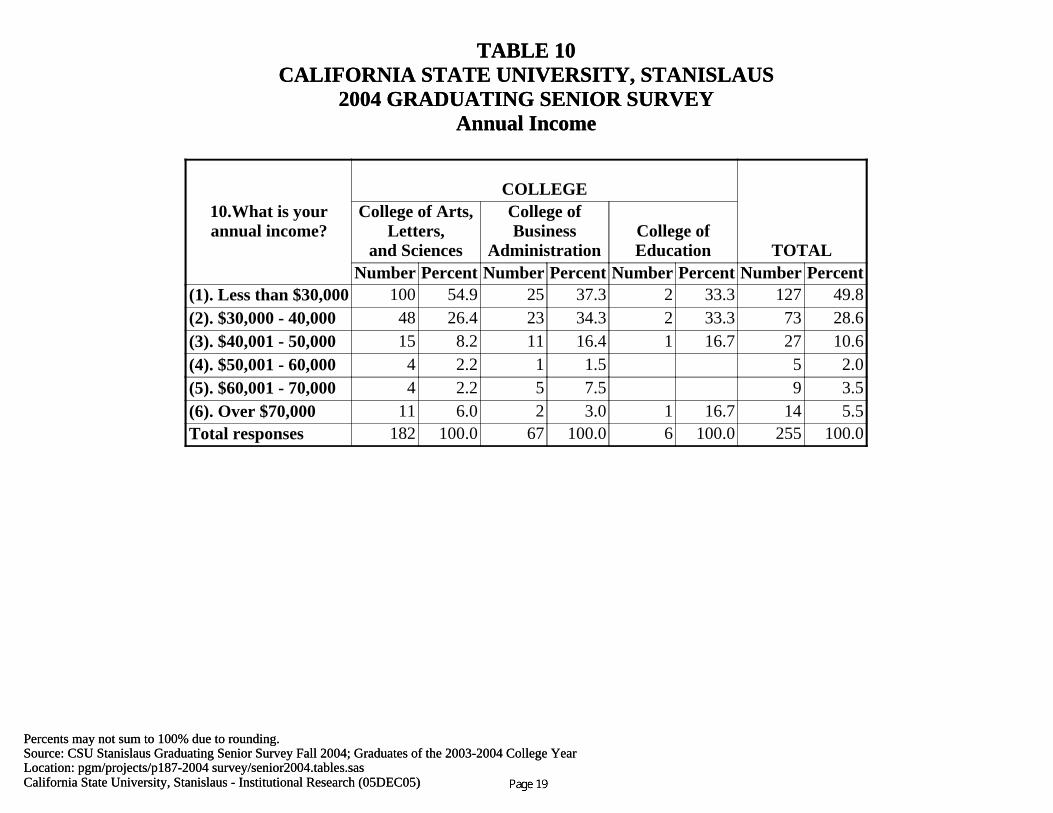
• Approximately 29% of graduating seniors will earn a first year annual income between
$30,000 and $40,000; an additional 22% will earn an annual income over $40,000. (Table 10)
PART C: GRADUATE/ PROFESSIONAL SCHOOL PLANS
• Over 33% (n=461 of 1,368) of graduating seniors have post-baccalaureate educational goals. More than half (51.4%) of respondents wished to obtain a master’s degree, 21.9% a teaching credential, 13.7% plan to pursue a Ph.D. or other doctorate or professional degree, and 2.2% a law degree. (Table 11)
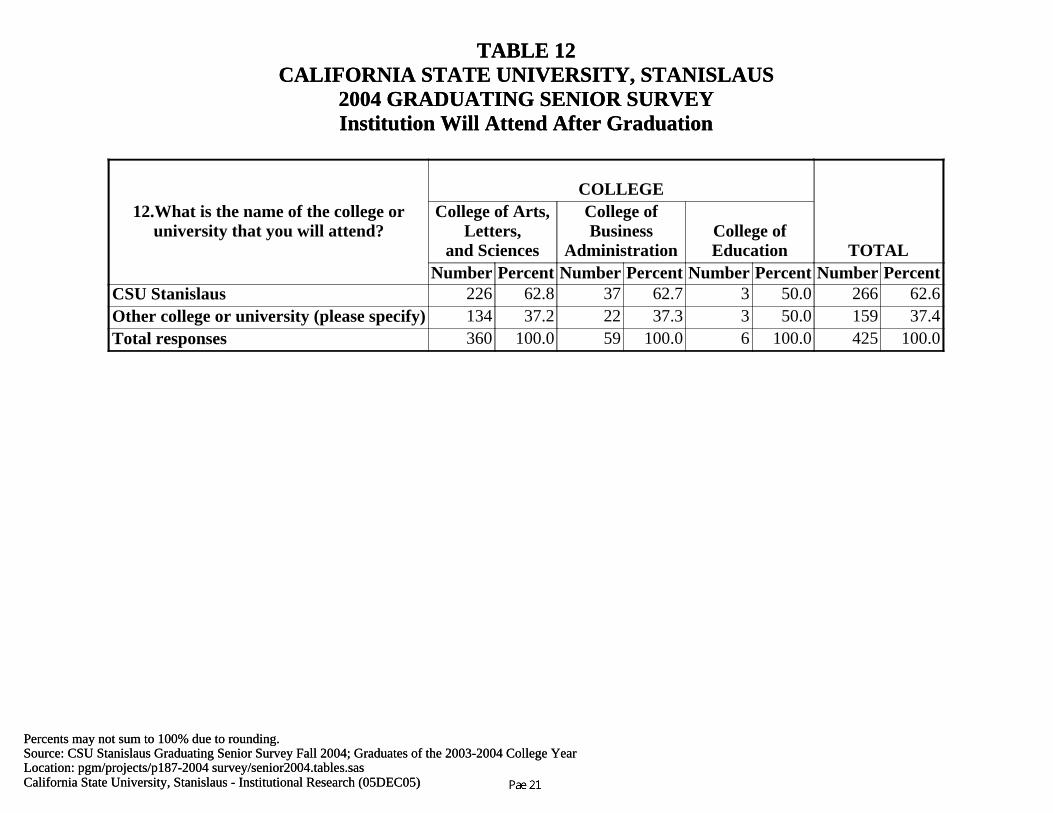
• Nearly sixty-three percent of students with post-baccalaureate goals indicated they will or
have continued their educations at California State University, Stanislaus. (Table 12) PART D: STUDENT SERVICES AND ACTIVITIES
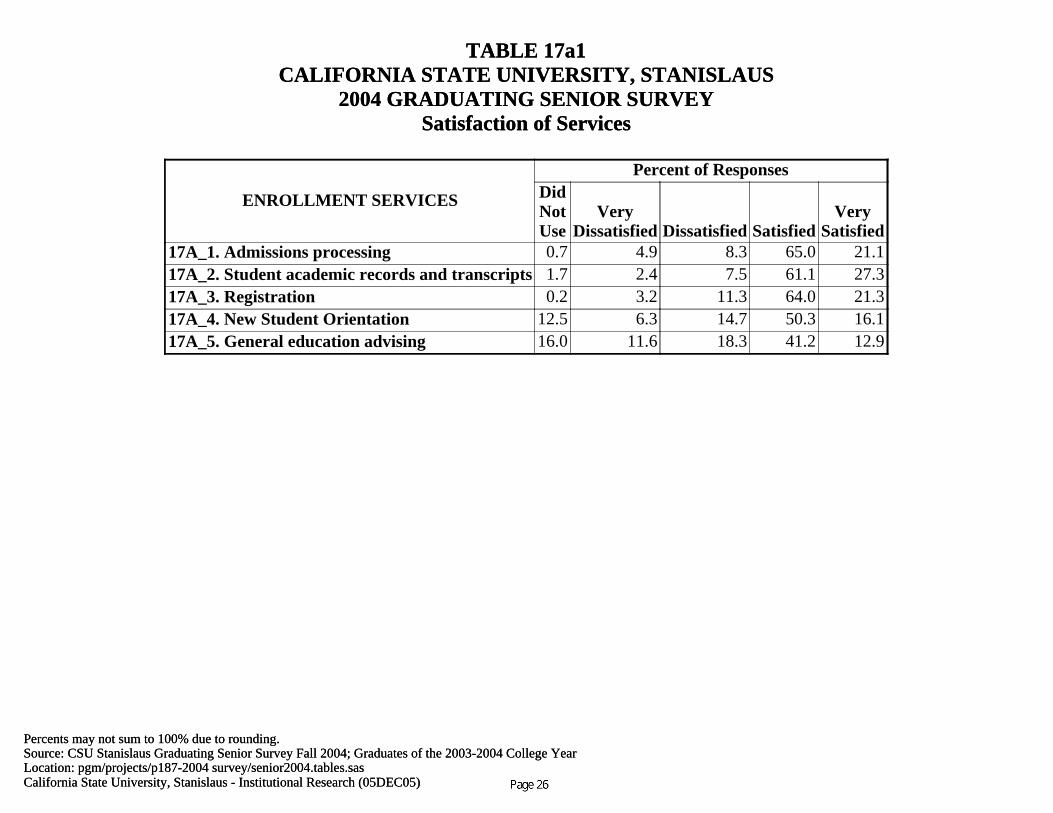
• Most graduating seniors rated all listed areas of enrollment services favorably: admissions processing (86.1%), obtaining academic records and transcripts (88.5%), the registration process (85.3%), New Student Orientation (66.4%), and general education advising (54.1%). (Table 17a1)
Graduating Senior Survey Report, Class of 2003-2004 Office of Institutional Research, December 2005
Page 5
Executive Summary
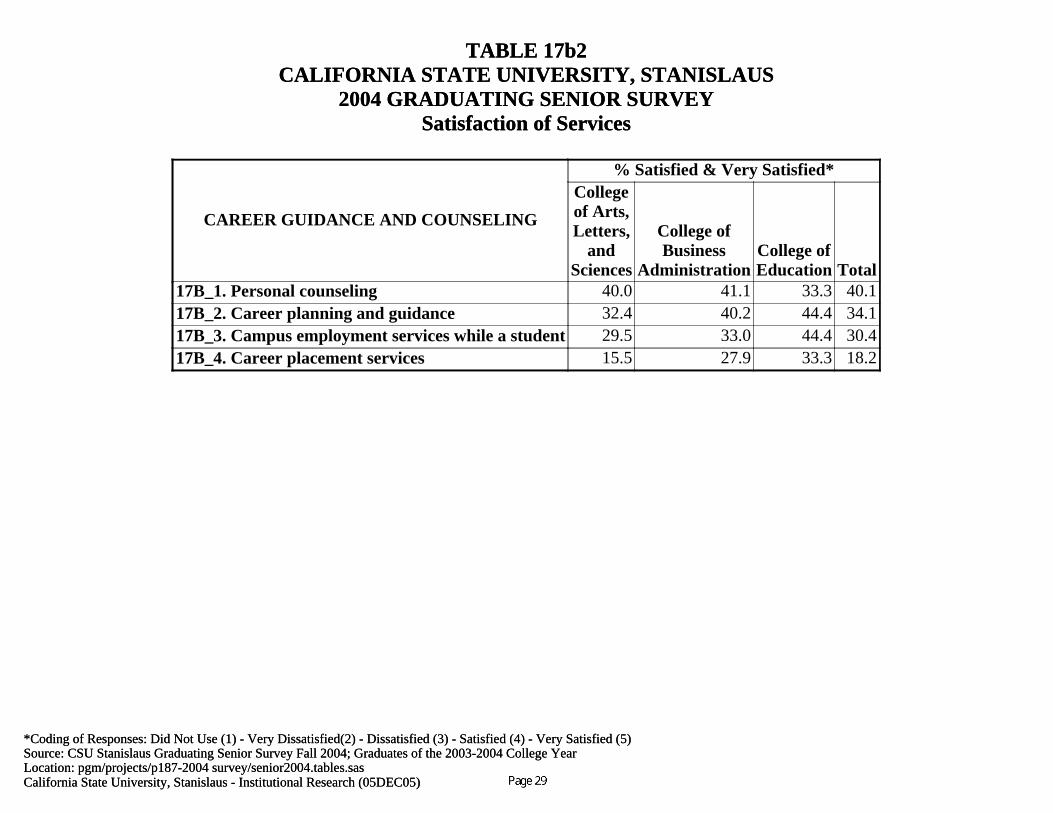
• The majority of students who utilized the career guidance and career counseling services expressed satisfaction in the following: personal counseling (40.1%), career planning and guidance (34.1%), campus employment services (30.4%), and career placement services (18.2%). (Table 17b1)
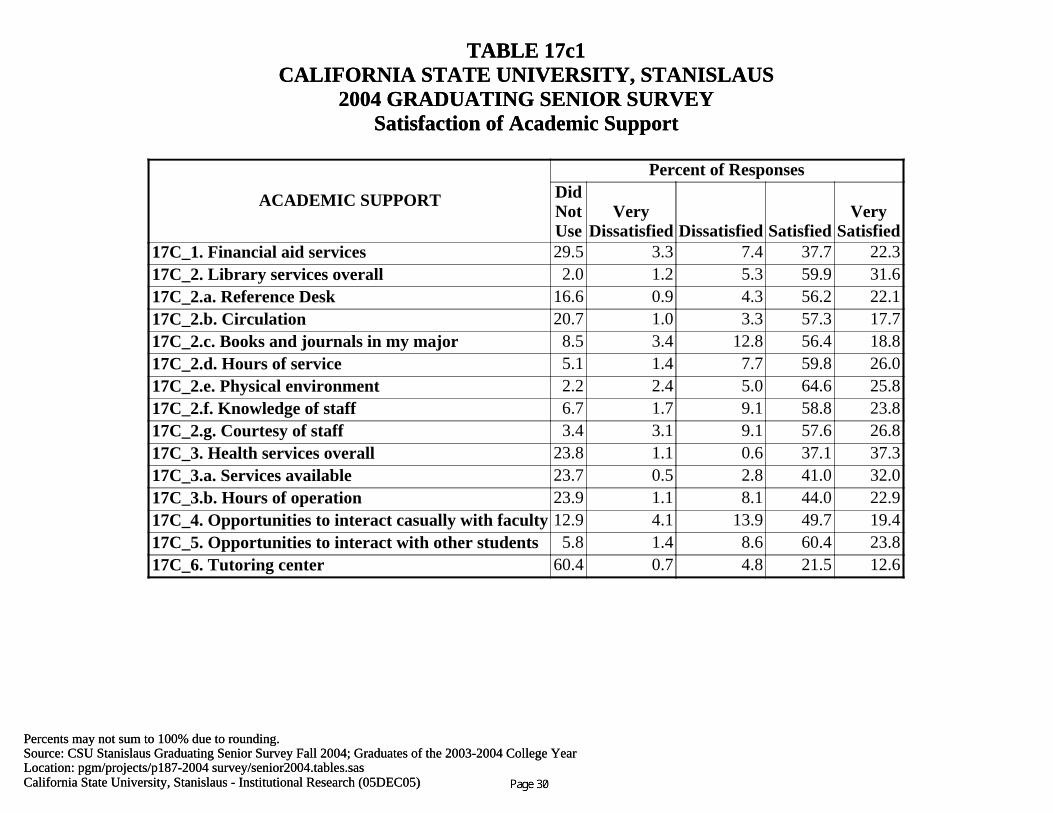
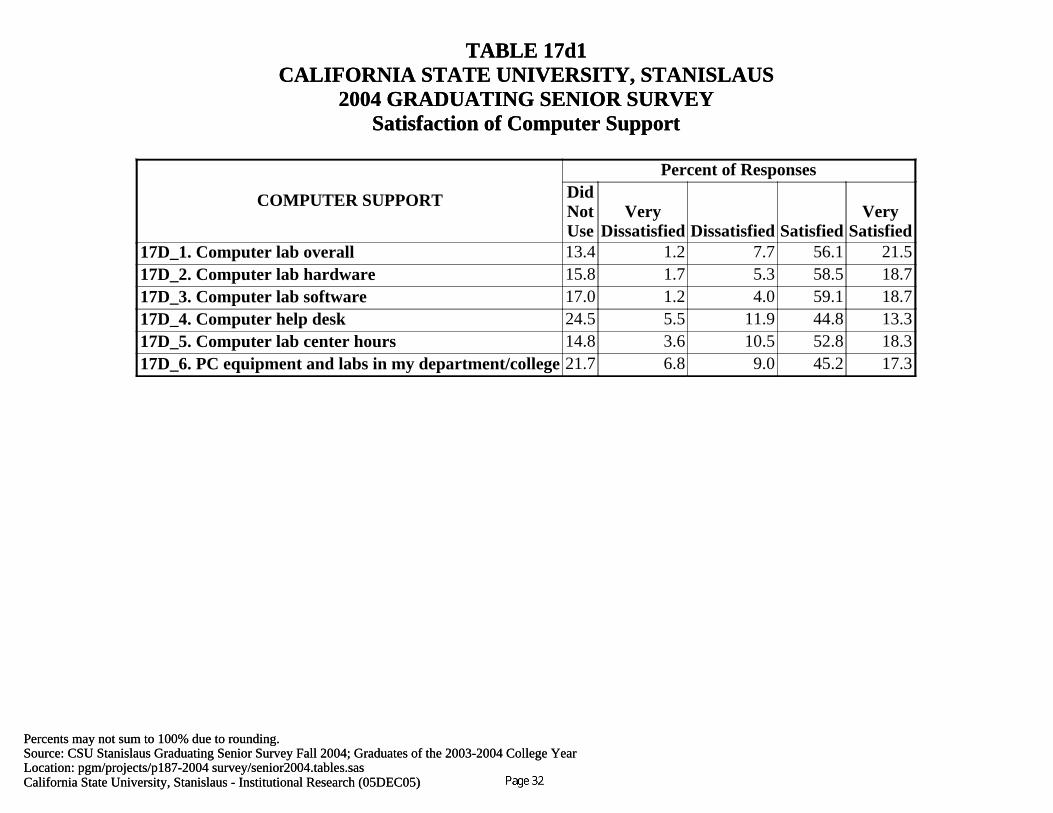
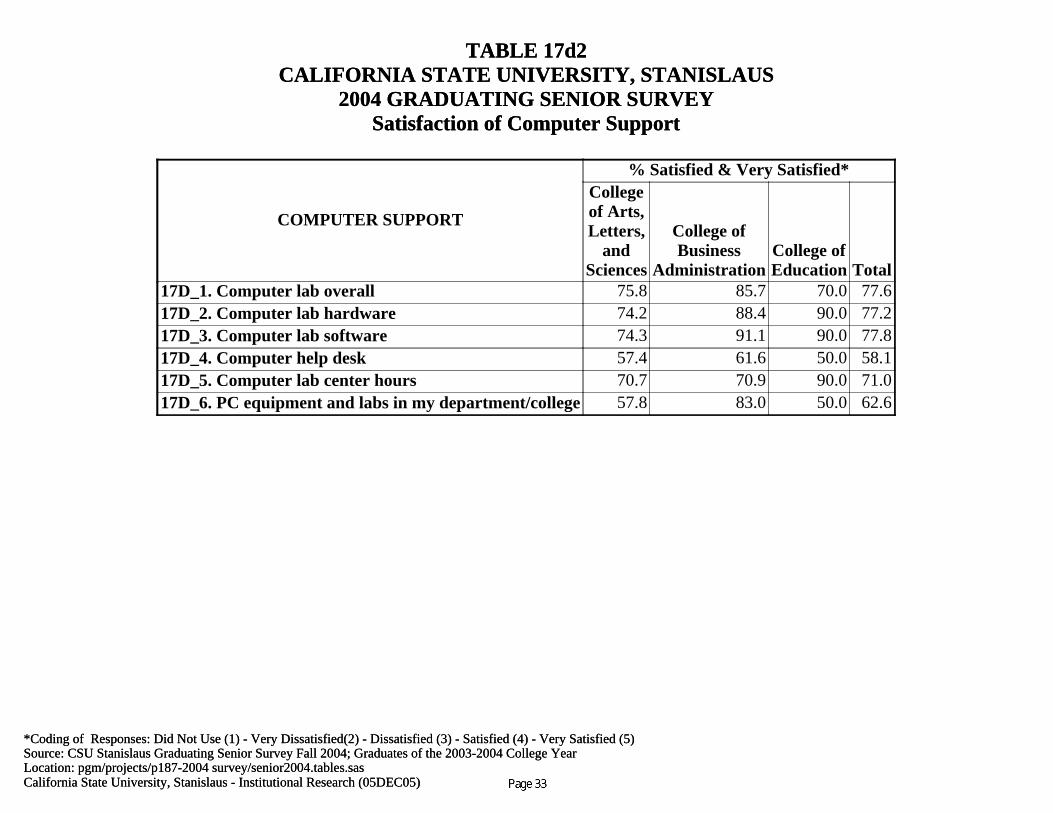
• The majority of graduating senior survey respondents were satisfied or very satisfied with
the following university services overall: library services (91.5%), computer labs (77.6%), health services (74.5%), and financial aid (59.9%). (Table 17c1 and 17d1)
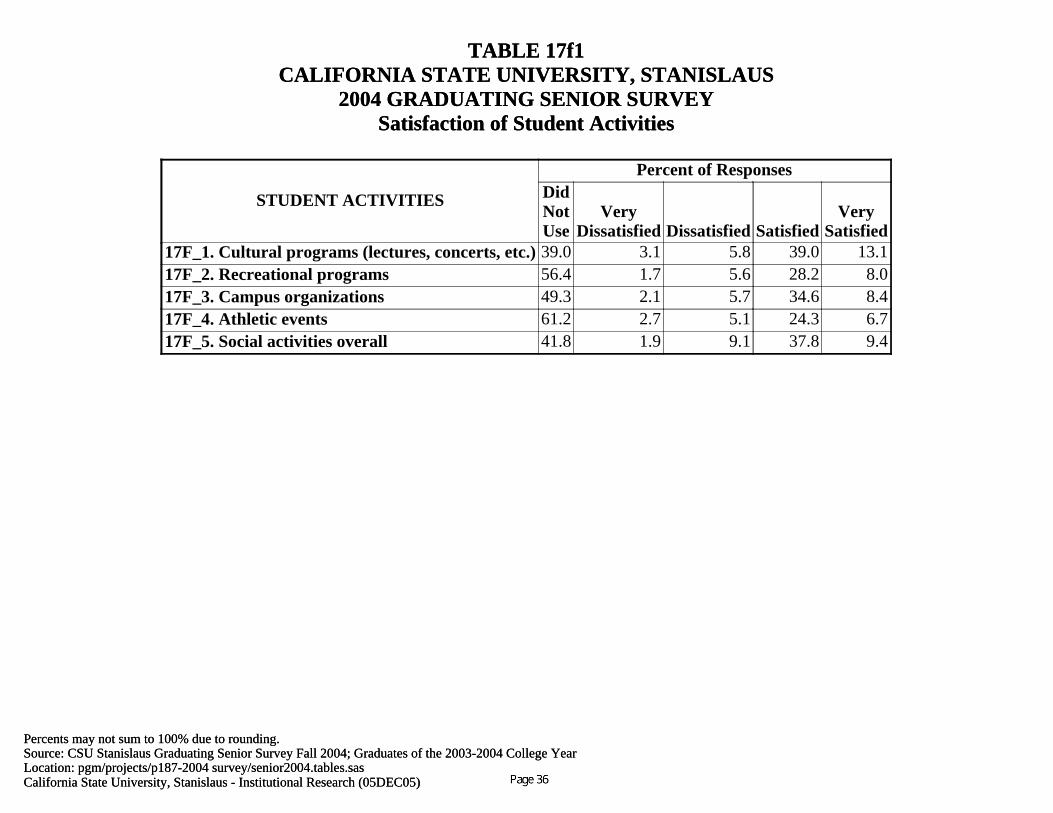
• Over 47.3% of survey respondents were satisfied or very satisfied with the university’s
overall social activities (cultural and recreational programs, campus organizations, and athletic events). (Table 17f1)
PART E: ACADEMIC AND SOCIAL CLIMATE
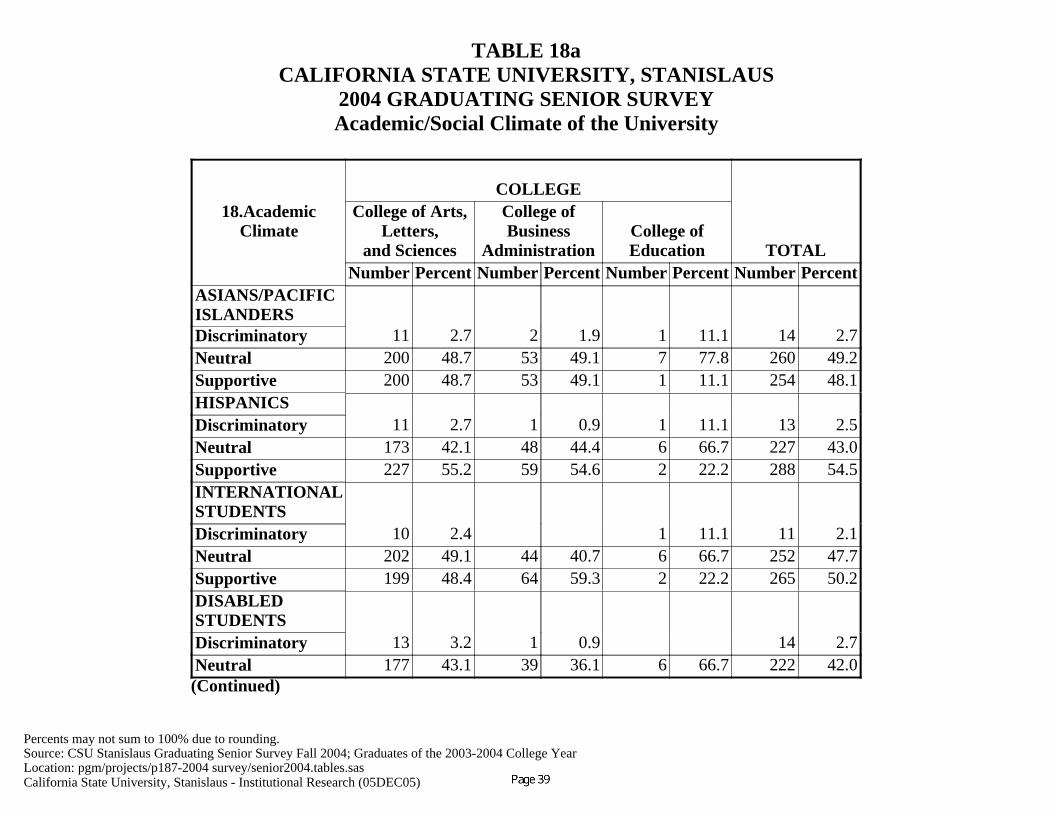
• The majority of survey respondents believe that the academic climate of the university is supportive to most groups of students: women (60.6%), men (55.9%), Hispanics (54.5%), disabled students (55.3%), international students (50.2%), and African Americans (49.1%). The majority of respondents rated the academic climate as neutral towards gay and lesbian students (52.7%), American Indians (50.8%) and Asians/Pacific Islanders (49.2). (Table 18a)
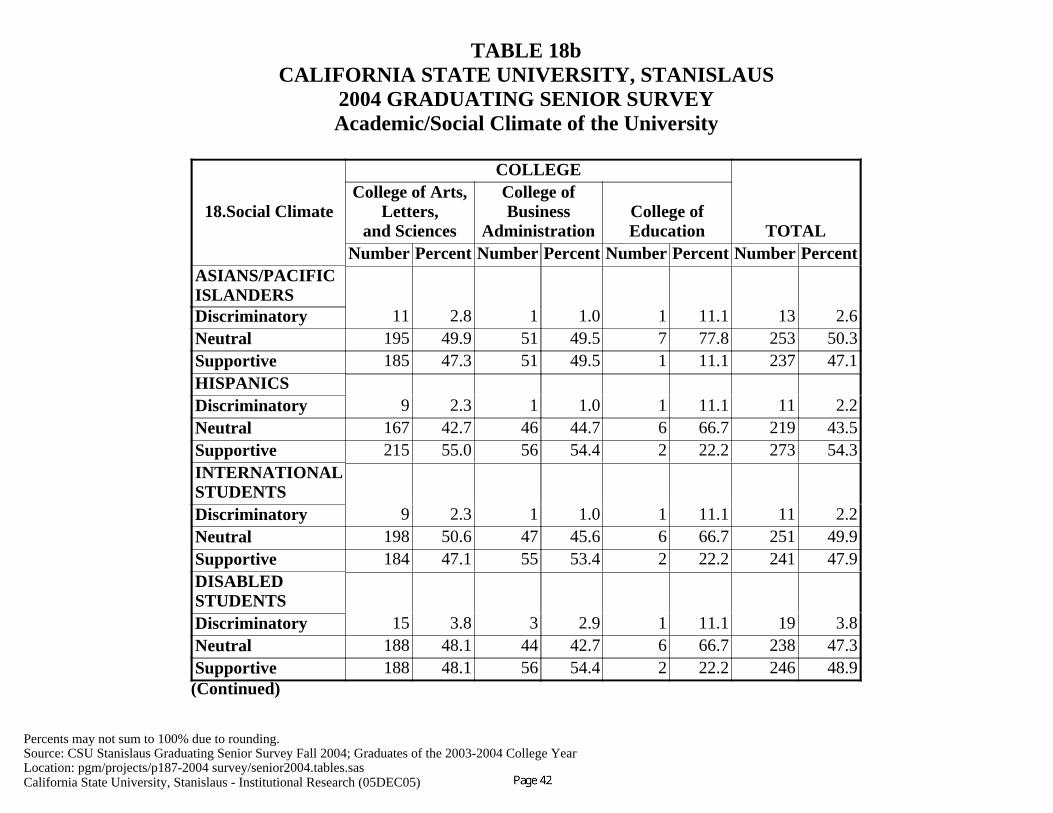
• The majority of survey respondents believe that the social climate of the university is
supportive to most groups of students: women (56.7%), men (55.7%), Hispanics (54.3%) and disabled students (48.9%). The majority of respondents rated the social climate as neutral towards gay and lesbian students (52.3%), American Indians (51.3%), Asian/Pacific Islanders (50.3%), international students (49.9%) and African Americans (49.3%). (Table 18b)
PART F: ADDITIONAL QUESTIONS AND COMMENTS
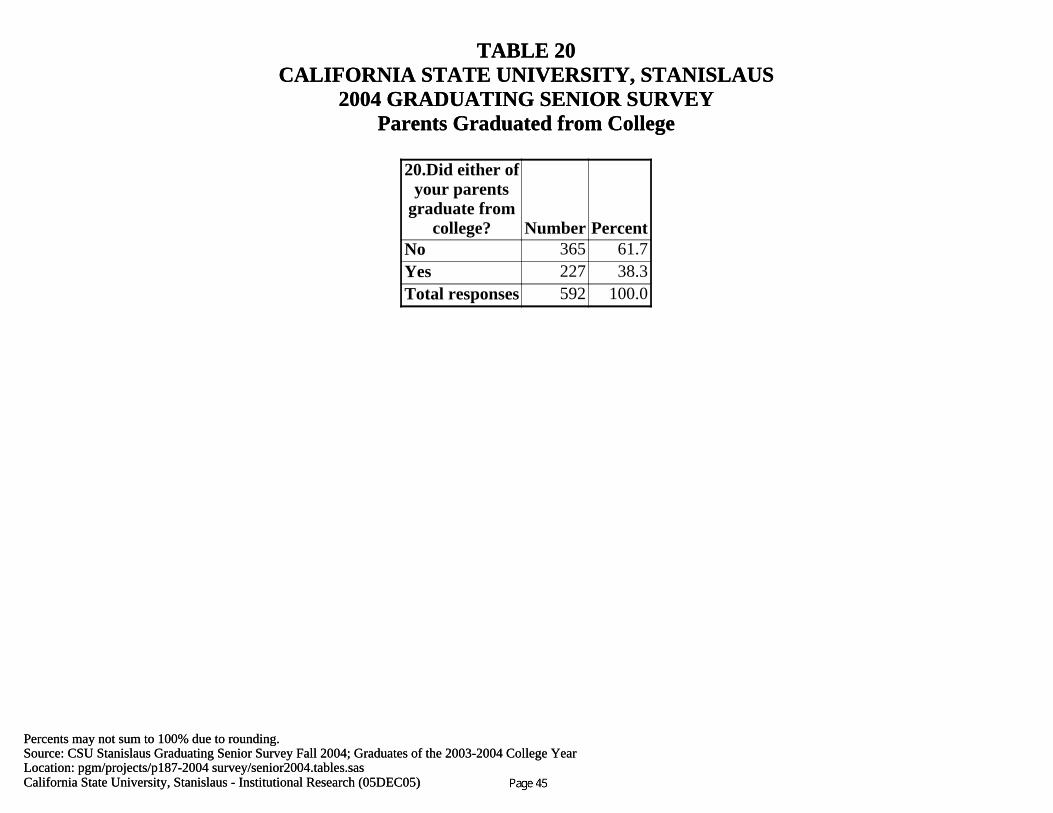
• Over 61% of survey respondents reported that they are first-generation college graduates. Additionally, most survey respondents (61.4%) reported that they are the first of their siblings to obtain a college degree. (Table 20 and 23)
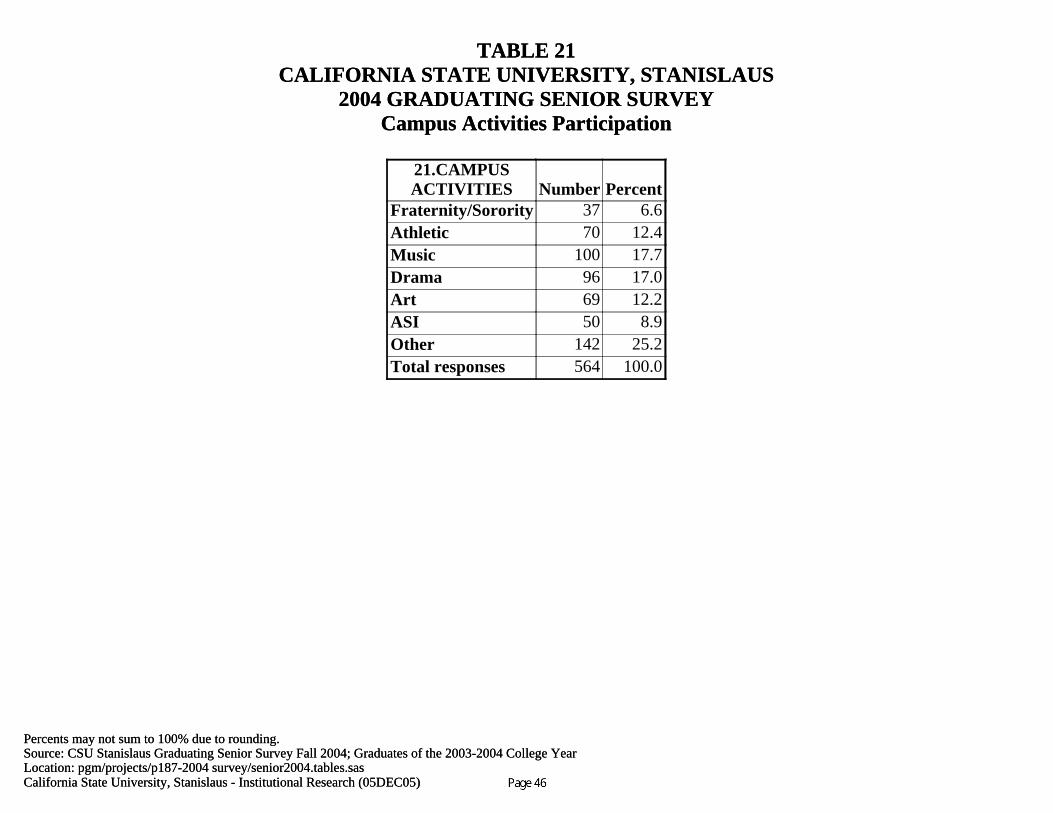
• Approximately 17% of respondents stated they participated in or attended music or drama
events, and about 12% participated in or attended athletic or art events. (Table 21)
Graduating Senior Survey Report, Class of 2003-2004 Office of Institutional Research, December 2005
Page 6
Executive Summary
• Over 32% (n=196 of 603) of respondents provided (volunteer) community service or participated in an internship. (Table 24)
• Thirty-eight percent of student comments on what they liked best about their education at
CSU Stanislaus mentioned a particular faculty member or members and 12.0% mentioned class size and/or course availability. (Appendix C, Question 25)
• Sixteen percent of student comments on areas they believed needed improvement
recommended increasing course availability, improving the quality of advising/orientation (11.6%), and improving the quality of instruction (10.0%). (Appendix C, Question 26)
California State University, Stanislaus - Institutional Research (05DEC05)Location: pgm/projects/p187-2004 survey/senior2004.tables.sasSource: CSU Stanislaus Graduating Senior Survey Fall 2004; Graduates of the 2003-2004 College YearPercents may not sum to 100% due to rounding.
TABLE 1CALIFORNIA STATE UNIVERSITY, STANISLAUS
2004 GRADUATING SENIOR SURVEYQuality of Overall University
QUALITY AT UNIVERSITYPercent of Responses
Poor(1)
Fair(2)
Good(3)
Excellent(4)
1a. Overall quality of instruction by faculty 0.8 9.6 63.5 26.11b. Quality of instruction by faculty in my major 2.2 9.6 40.3 47.91c. Individual attention from faculty 4.1 23.4 40.6 32.01d. Advising by faculty in my major 16.4 24.7 26.7 32.11e. Preparation for graduate or professional school 7.4 30.4 45.6 16.61f. Quality of library resources and services 4.7 14.7 51.3 29.31g. Quality of computing resources 1.9 17.0 54.2 26.91h. Preparation for my first career-related position 9.8 32.9 43.6 13.81i. Preparation to use technology and computers 4.1 31.3 46.2 18.51j. Preparation to conduct effective research 3.0 20.3 53.4 23.3
California State University, Stanislaus - Institutional Research (05DEC05)Location: pgm/projects/p187-2004 survey/senior2004.tables.sasSource: CSU Stanislaus Graduating Senior Survey Fall 2004; Graduates of the 2003-2004 College YearPercents may not sum to 100% due to rounding.
TABLE 2aCALIFORNIA STATE UNIVERSITY, STANISLAUS
2004 GRADUATING SENIOR SURVEYPreparation/Availability of the General Education Courses
GENERAL EDUCATION COURSES
Percent of ResponsesStronglyDisagree
(1)Disagree
(2)Agree
(3)StronglyAgree(4)
2a. I was prepared for upper division courses in my major. 0.7 4.5 55.7 39.22b. I was able to enroll in the courses I wanted to fulfill my GE requirements. 2.9 10.6 49.9 36.5
California State University, Stanislaus - Institutional Research (05DEC05)Location: pgm/projects/p187-2004 survey/senior2004.tables.sasSource: CSU Stanislaus Graduating Senior Survey Fall 2004; Graduates of the 2003-2004 College Year*Coding of Responses: Strongly Disagree (1) - Disagree(2) - Agree (3) - Strongly Agree (4)
TABLE 2bCALIFORNIA STATE UNIVERSITY, STANISLAUS
2004 GRADUATING SENIOR SURVEYPreparation/Availability of the General Education Courses
GENERAL EDUCATION COURSES
% Agree & Strongly Agree*Collegeof Arts,Letters,
andSciences
College ofBusiness
AdministrationCollege ofEducation Total
2a. I was prepared for upper division courses in my major. 95.7 92.0 90.0 94.92b. I was able to enroll in the courses I wanted to fulfill my GE requirements. 87.0 83.9 90.0 86.4
California State University, Stanislaus - Institutional Research (05DEC05)Location: pgm/projects/p187-2004 survey/senior2004.tables.sasSource: CSU Stanislaus Graduating Senior Survey Fall 2004; Graduates of the 2003-2004 College YearPercents may not sum to 100% due to rounding.
TABLE 3aCALIFORNIA STATE UNIVERSITY, STANISLAUS
2004 GRADUATING SENIOR SURVEYGeneral Education Courses Academic Perceptions
AS A RESULT OF GENERAL EDUCATION COURSES I TOOK AT CSU STANISLAUS,I LEARNED...
Percent of ResponsesStronglyDisagree
(1)Disagree
(2)Agree
(3)StronglyAgree(4)
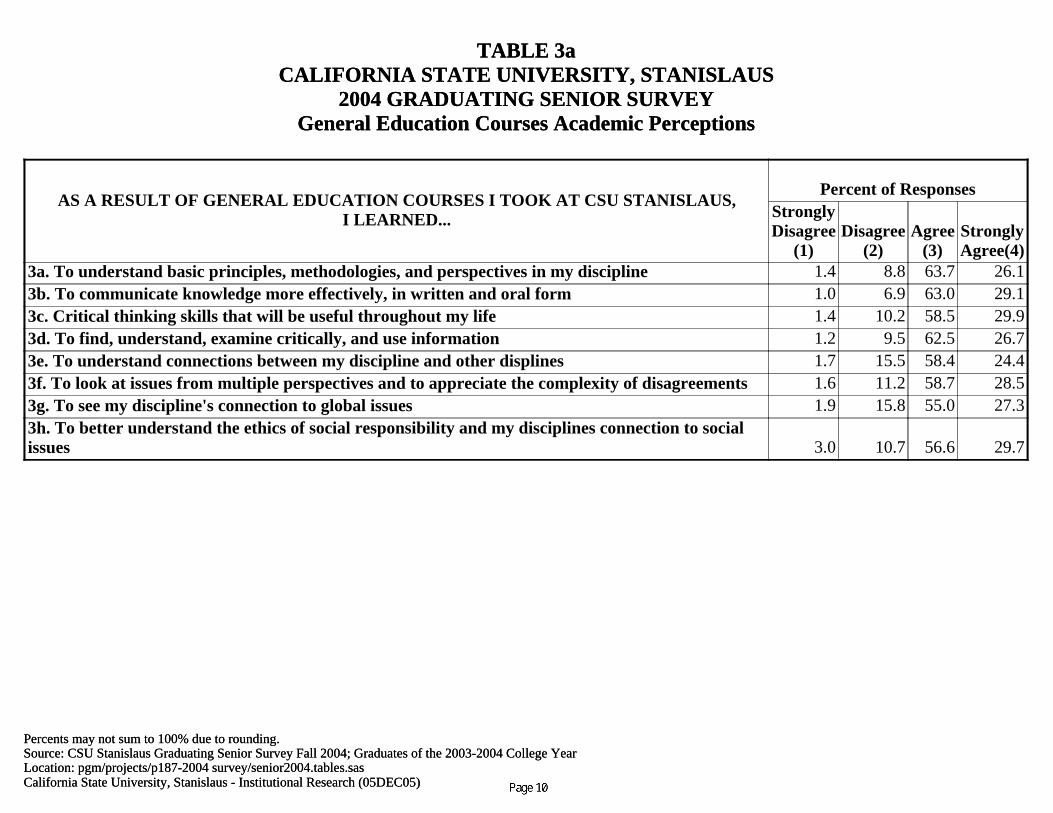
3a. To understand basic principles, methodologies, and perspectives in my discipline 1.4 8.8 63.7 26.13b. To communicate knowledge more effectively, in written and oral form 1.0 6.9 63.0 29.13c. Critical thinking skills that will be useful throughout my life 1.4 10.2 58.5 29.93d. To find, understand, examine critically, and use information 1.2 9.5 62.5 26.73e. To understand connections between my discipline and other displines 1.7 15.5 58.4 24.43f. To look at issues from multiple perspectives and to appreciate the complexity of disagreements 1.6 11.2 58.7 28.53g. To see my discipline's connection to global issues 1.9 15.8 55.0 27.33h. To better understand the ethics of social responsibility and my disciplines connection to socialissues 3.0 10.7 56.6 29.7
California State University, Stanislaus - Institutional Research (05DEC05)Location: pgm/projects/p187-2004 survey/senior2004.tables.sasSource: CSU Stanislaus Graduating Senior Survey Fall 2004; Graduates of the 2003-2004 College Year*Coding of Responses: Strongly Disagree (1) - Disagree(2) - Agree (3) - Strongly Agree (4)
TABLE 3bCALIFORNIA STATE UNIVERSITY, STANISLAUS
2004 GRADUATING SENIOR SURVEYGeneral Education Courses Academic Perceptions
AS A RESULT OF GENERAL EDUCATION COURSES I TOOK AT CSU STANISLAUS,I LEARNED...
% Agree & Strongly Agree*Collegeof Arts,Letters,
andSciences
College ofBusiness
AdministrationCollege ofEducation Total
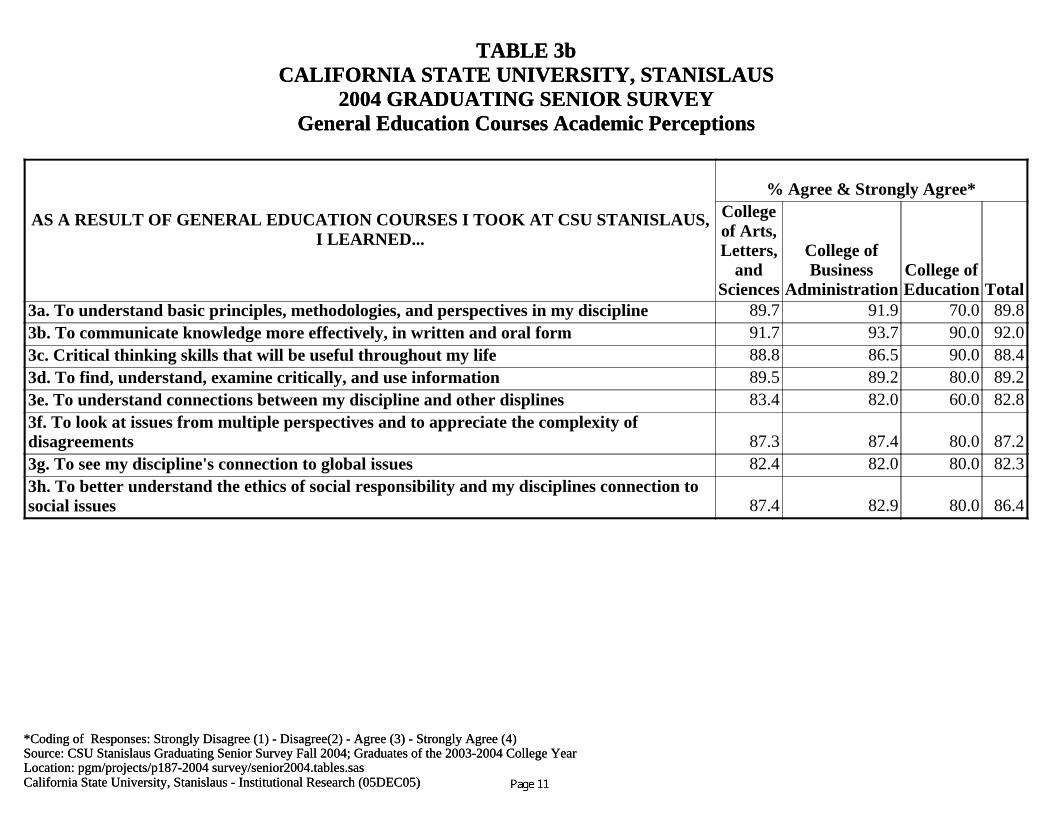
3a. To understand basic principles, methodologies, and perspectives in my discipline 89.7 91.9 70.0 89.83b. To communicate knowledge more effectively, in written and oral form 91.7 93.7 90.0 92.03c. Critical thinking skills that will be useful throughout my life 88.8 86.5 90.0 88.43d. To find, understand, examine critically, and use information 89.5 89.2 80.0 89.23e. To understand connections between my discipline and other displines 83.4 82.0 60.0 82.83f. To look at issues from multiple perspectives and to appreciate the complexity ofdisagreements 87.3 87.4 80.0 87.23g. To see my discipline's connection to global issues 82.4 82.0 80.0 82.33h. To better understand the ethics of social responsibility and my disciplines connection tosocial issues 87.4 82.9 80.0 86.4
California State University, Stanislaus - Institutional Research (05DEC05)Location: pgm/projects/p187-2004 survey/senior2004.tables.sasSource: CSU Stanislaus Graduating Senior Survey Fall 2004; Graduates of the 2003-2004 College YearPercents may not sum to 100% due to rounding.
TABLE 4aCALIFORNIA STATE UNIVERSITY, STANISLAUS
2004 GRADUATING SENIOR SURVEYPerception of Major Department
PERCEPTION OF MAJOR DEPARTMENT
Percent of ResponsesStronglyDisagree
(1)Disagree
(2)Agree
(3)StronglyAgree(4)
4a. Grading practices and other academic policies were administered fairly. 1.0 7.1 56.6 35.44b. Faculty members in my department were interested in my progress as a student. 5.4 20.9 40.7 33.04c. Faculty were available for assistance outside of the classroom. 3.0 12.3 47.7 36.94d. The courses required for my major were appropriate. 3.4 9.5 53.3 33.84e. My major courses were intellectually challenging. 2.2 8.1 49.6 40.14f. I had no difficulty getting courses I needed to meet my major requirements. 6.9 20.0 42.5 30.64g. I had no difficulty getting courses I needed at times that fit my schedule. 12.1 34.2 34.7 19.0

California State University, Stanislaus - Institutional Research (05DEC05)Location: pgm/projects/p187-2004 survey/senior2004.tables.sasSource: CSU Stanislaus Graduating Senior Survey Fall 2004; Graduates of the 2003-2004 College Year*Coding of Responses: Strongly Disagree (1) - Disagree(2) - Agree (3) - Strongly Agree (4)
TABLE 4bCALIFORNIA STATE UNIVERSITY, STANISLAUS
2004 GRADUATING SENIOR SURVEYPerception of Major Department
PERCEPTION OF MAJOR DEPARTMENT
% Agree & Strongly Agree*Collegeof Arts,Letters,
andSciences
College ofBusiness
AdministrationCollege ofEducation Total
4a. Grading practices and other academic policies were administered fairly. 91.5 94.7 80.0 91.94b. Faculty members in my department were interested in my progress as a student. 74.7 69.9 70.0 73.74c. Faculty were available for assistance outside of the classroom. 85.1 84.1 70.0 84.74d. The courses required for my major were appropriate. 87.0 88.4 77.8 87.14e. My major courses were intellectually challenging. 89.8 89.4 90.0 89.74f. I had no difficulty getting courses I needed to meet my major requirements. 73.5 70.8 80.0 73.14g. I had no difficulty getting courses I needed at times that fit my schedule. 54.4 51.3 50.0 53.7

California State University, Stanislaus - Institutional Research (05DEC05)Location: pgm/projects/p187-2004 survey/senior2004.tables.sasSource: CSU Stanislaus Graduating Senior Survey Fall 2004; Graduates of the 2003-2004 College YearPercents may not sum to 100% due to rounding.
TABLE 5CALIFORNIA STATE UNIVERSITY, STANISLAUS
2004 GRADUATING SENIOR SURVEYRecommendation of the University
5.I wouldrecommend CSU
Stanislaus to anotherstudent.
COLLEGE
TOTAL
College of Arts,Letters,
and Sciences
College ofBusiness
AdministrationCollege ofEducation
Number Percent Number Percent Number Percent Number PercentStrongly Disagree (1) 56 12.0 16 14.2 1 10.0 73 12.4Disagree (2) 29 6.2 11 9.7 4 40.0 44 7.5Agree (3) 229 49.1 53 46.9 4 40.0 286 48.6Strongly Agree(4) 152 32.6 33 29.2 1 10.0 186 31.6Total responses 466 100.0 113 100.0 10 100.0 589 100.0
California State University, Stanislaus - Institutional Research (05DEC05)Location: pgm/projects/p187-2004 survey/senior2004.tables.sasSource: CSU Stanislaus Graduating Senior Survey Fall 2004; Graduates of the 2003-2004 College YearPercents may not sum to 100% due to rounding.
TABLE 6CALIFORNIA STATE UNIVERSITY, STANISLAUS
2004 GRADUATING SENIOR SURVEYImmediate Employment Plans
6.What are your immediate employment plans?
COLLEGE
TOTAL
College of Arts,Letters,
and Sciences
College ofBusiness
AdministrationCollege ofEducation
Number Percent Number Percent Number Percent Number Percent(1). I will work at the job I had before I graduated. 95 21.6 26 23.9 2 20.0 123 22.0(2). I will work at a new job I recently obtained. 90 20.5 44 40.4 5 50.0 139 24.9(3). I am currently seeking employment. 104 23.7 27 24.8 1 10.0 132 23.7(4). I plan to continue my education before working. 131 29.8 9 8.3 2 20.0 142 25.4(5). Unknown. 19 4.3 3 2.8 22 3.9Total responses 439 100.0 109 100.0 10 100.0 558 100.0
California State University, Stanislaus - Institutional Research (05DEC05)Location: pgm/projects/p187-2004 survey/senior2004.tables.sasSource: CSU Stanislaus Graduating Senior Survey Fall 2004; Graduates of the 2003-2004 College YearPercents may not sum to 100% due to rounding.
TABLE 7CALIFORNIA STATE UNIVERSITY, STANISLAUS
2004 GRADUATING SENIOR SURVEYSalary Increment Due to Graduation
7.If you arecurrentlyemployed,
will you receivea raise in yourincome due to
yourgraduation?
COLLEGE
TOTAL
College of Arts,Letters,
and Sciences
College ofBusiness
AdministrationCollege ofEducation
Number Percent Number Percent Number Percent Number PercentNone 66 71.7 16 66.7 1 100.0 83 70.9$1,000 - 2,999 13 14.1 2 8.3 15 12.8$3,000 - 5,000 5 5.4 3 12.5 8 6.8Over $5,000 8 8.7 3 12.5 11 9.4Total responses 92 100.0 24 100.0 1 100.0 117 100.0

California State University, Stanislaus - Institutional Research (05DEC05)Location: pgm/projects/p187-2004 survey/senior2004.tables.sasSource: CSU Stanislaus Graduating Senior Survey Fall 2004; Graduates of the 2003-2004 College YearPercents may not sum to 100% due to rounding.
TABLE 8CALIFORNIA STATE UNIVERSITY, STANISLAUS
2004 GRADUATING SENIOR SURVEYJob Field
8.What field do you planto work in upon
graduation?
COLLEGE
TOTAL
College of Arts,Letters,
and Sciences
College ofBusiness
AdministrationCollege ofEducation
Number Percent Number Percent Number Percent Number PercentAccounting 3 1.7 15 22.7 18 7.2Computer Programming 1 1.5 1 0.4Counseling 5 2.8 1 1.5 6 2.4Law Enforcement 15 8.5 15 6.0Management 13 7.3 26 39.4 1 16.7 40 16.1Nursing 11 6.2 11 4.4Psychology 9 5.1 9 3.6Social Work 9 5.1 9 3.6Teaching 58 32.8 2 3.0 2 33.3 62 24.9Other (please specify) 54 30.5 21 31.8 3 50.0 78 31.3Total responses 177 100.0 66 100.0 6 100.0 249 100.0
California State University, Stanislaus - Institutional Research (05DEC05)Location: pgm/projects/p187-2004 survey/senior2004.tables.sasSource: CSU Stanislaus Graduating Senior Survey Fall 2004; Graduates of the 2003-2004 College YearPercents may not sum to 100% due to rounding.
TABLE 9CALIFORNIA STATE UNIVERSITY, STANISLAUS
2004 GRADUATING SENIOR SURVEYEmployment Sector
9.Which BEST describes the type of businessyou will be employed in?
COLLEGE
TOTAL
College of Arts,Letters,
and Sciences
College ofBusiness
AdministrationCollege ofEducation
Number Percent Number Percent Number Percent Number PercentGeneral Business (Retail/Wholesale; Service) 21 11.7 41 61.2 2 33.3 64 25.3Manufacturing 5 2.8 3 4.5 8 3.2School or university 69 38.3 4 6.0 2 33.3 75 29.6Government or non-profit organization 33 18.3 8 11.9 41 16.2Health care system 25 13.9 2 33.3 27 10.7Other 27 15.0 11 16.4 38 15.0Total responses 180 100.0 67 100.0 6 100.0 253 100.0
California State University, Stanislaus - Institutional Research (05DEC05)Location: pgm/projects/p187-2004 survey/senior2004.tables.sasSource: CSU Stanislaus Graduating Senior Survey Fall 2004; Graduates of the 2003-2004 College YearPercents may not sum to 100% due to rounding.
TABLE 10CALIFORNIA STATE UNIVERSITY, STANISLAUS
2004 GRADUATING SENIOR SURVEYAnnual Income
10.What is yourannual income?
COLLEGE
TOTAL
College of Arts,Letters,
and Sciences
College ofBusiness
AdministrationCollege ofEducation
Number Percent Number Percent Number Percent Number Percent(1). Less than $30,000 100 54.9 25 37.3 2 33.3 127 49.8(2). $30,000 - 40,000 48 26.4 23 34.3 2 33.3 73 28.6(3). $40,001 - 50,000 15 8.2 11 16.4 1 16.7 27 10.6(4). $50,001 - 60,000 4 2.2 1 1.5 5 2.0(5). $60,001 - 70,000 4 2.2 5 7.5 9 3.5(6). Over $70,000 11 6.0 2 3.0 1 16.7 14 5.5Total responses 182 100.0 67 100.0 6 100.0 255 100.0

California State University, Stanislaus - Institutional Research (05DEC05)Location: pgm/projects/p187-2004 survey/senior2004.tables.sasSource: CSU Stanislaus Graduating Senior Survey Fall 2004; Graduates of the 2003-2004 College YearPercents may not sum to 100% due to rounding.
TABLE 11CALIFORNIA STATE UNIVERSITY, STANISLAUS
2004 GRADUATING SENIOR SURVEYDegree Goals
11.What is the highest degree you wish to obtain?
COLLEGE
TOTAL
College of Arts,Letters,
and Sciences
College ofBusiness
AdministrationCollege ofEducation
Number Percent Number Percent Number Percent Number Percent(1). No degree goals 20 5.3 15 19.5 1 12.5 36 7.8(2). Master's in Education 71 18.9 2 2.6 2 25.0 75 16.3(3). Teaching Credential 97 25.8 3 3.9 1 12.5 101 21.9(4). Other Master's degree (M.A., M.S., M.B.A.) 113 30.1 45 58.4 4 50.0 162 35.1(5). Law Degree 9 2.4 1 1.3 10 2.2(6). Ph.D. 45 12.0 8 10.4 53 11.5(7). Other doctorate/professional degree (D.B.A., Ed.D.) 8 2.1 2 2.6 10 2.2(8). Other degree 13 3.5 1 1.3 14 3.0Total responses 376 100.0 77 100.0 8 100.0 461 100.0
California State University, Stanislaus - Institutional Research (05DEC05)Location: pgm/projects/p187-2004 survey/senior2004.tables.sasSource: CSU Stanislaus Graduating Senior Survey Fall 2004; Graduates of the 2003-2004 College YearPercents may not sum to 100% due to rounding.
TABLE 12CALIFORNIA STATE UNIVERSITY, STANISLAUS
2004 GRADUATING SENIOR SURVEYInstitution Will Attend After Graduation
12.What is the name of the college oruniversity that you will attend?
COLLEGE
TOTAL
College of Arts,Letters,
and Sciences
College ofBusiness
AdministrationCollege ofEducation
Number Percent Number Percent Number Percent Number PercentCSU Stanislaus 226 62.8 37 62.7 3 50.0 266 62.6Other college or university (please specify) 134 37.2 22 37.3 3 50.0 159 37.4Total responses 360 100.0 59 100.0 6 100.0 425 100.0
California State University, Stanislaus - Institutional Research (05DEC05)Location: pgm/projects/p187-2004 survey/senior2004.tables.sasSource: CSU Stanislaus Graduating Senior Survey Fall 2004; Graduates of the 2003-2004 College YearPercents may not sum to 100% due to rounding.
TABLE 13CALIFORNIA STATE UNIVERSITY, STANISLAUS
2004 GRADUATING SENIOR SURVEYProgram/Major Will Enroll in After Graduation
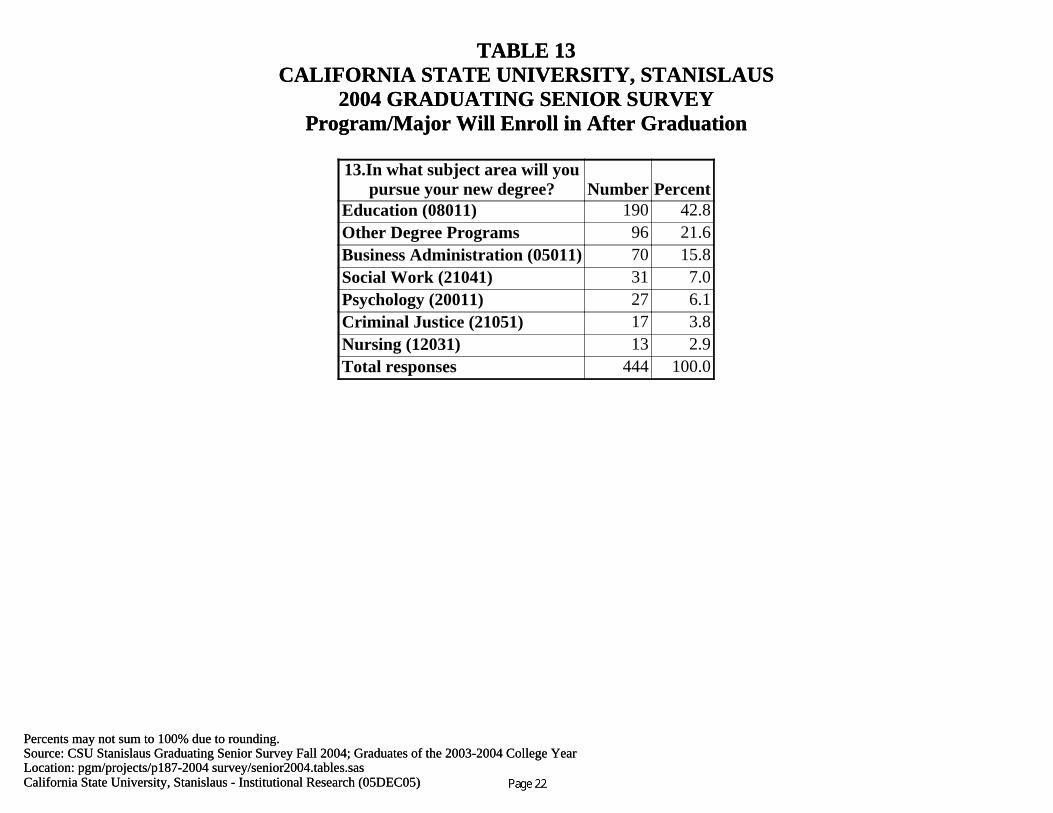
13.In what subject area will youpursue your new degree? Number Percent
Education (08011) 190 42.8Other Degree Programs 96 21.6Business Administration (05011) 70 15.8Social Work (21041) 31 7.0Psychology (20011) 27 6.1Criminal Justice (21051) 17 3.8Nursing (12031) 13 2.9Total responses 444 100.0
California State University, Stanislaus - Institutional Research (05DEC05)Location: pgm/projects/p187-2004 survey/senior2004.tables.sasSource: CSU Stanislaus Graduating Senior Survey Fall 2004; Graduates of the 2003-2004 College YearPercents may not sum to 100% due to rounding.
TABLE 14CALIFORNIA STATE UNIVERSITY, STANISLAUS
2004 GRADUATING SENIOR SURVEYLibrary Services
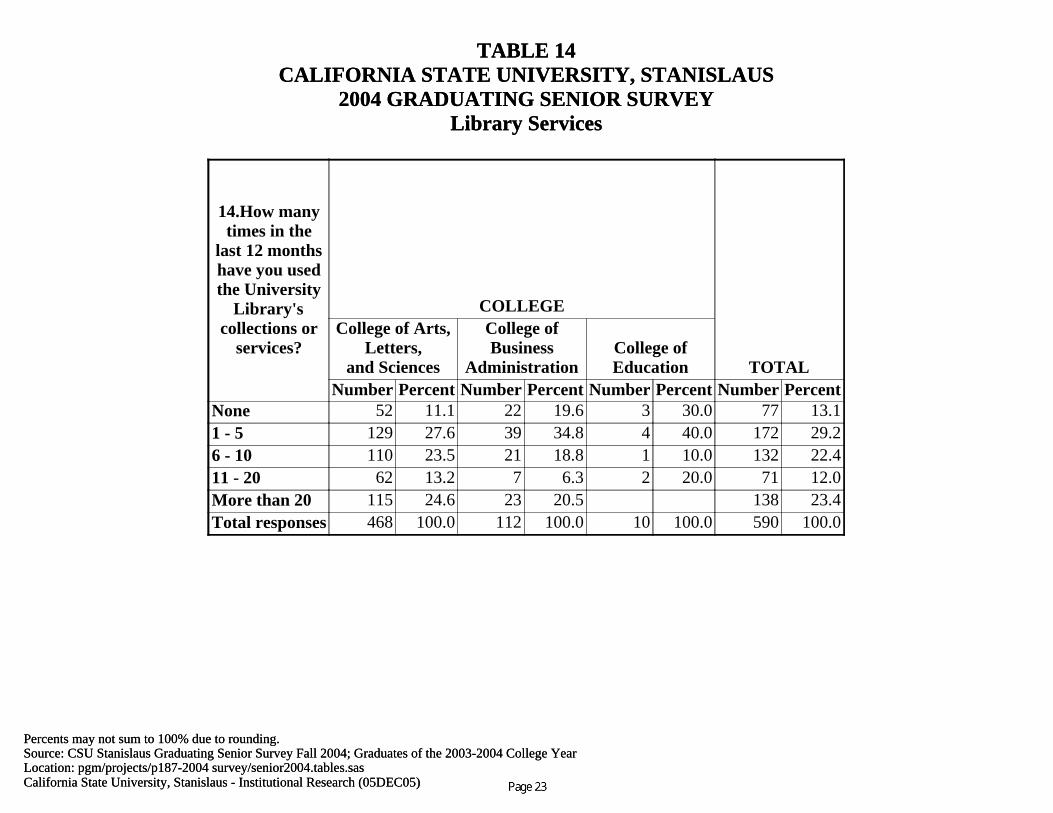
14.How manytimes in the
last 12 monthshave you usedthe University
Library'scollections or
services?
COLLEGE
TOTAL
College of Arts,Letters,
and Sciences
College ofBusiness
AdministrationCollege ofEducation
Number Percent Number Percent Number Percent Number PercentNone 52 11.1 22 19.6 3 30.0 77 13.11 - 5 129 27.6 39 34.8 4 40.0 172 29.26 - 10 110 23.5 21 18.8 1 10.0 132 22.411 - 20 62 13.2 7 6.3 2 20.0 71 12.0More than 20 115 24.6 23 20.5 138 23.4Total responses 468 100.0 112 100.0 10 100.0 590 100.0
California State University, Stanislaus - Institutional Research (05DEC05)Location: pgm/projects/p187-2004 survey/senior2004.tables.sasSource: CSU Stanislaus Graduating Senior Survey Fall 2004; Graduates of the 2003-2004 College Year*Coding of Responses: No (1) - Yes (2)
TABLE 15CALIFORNIA STATE UNIVERSITY, STANISLAUS
2004 GRADUATING SENIOR SURVEYLibrary Services
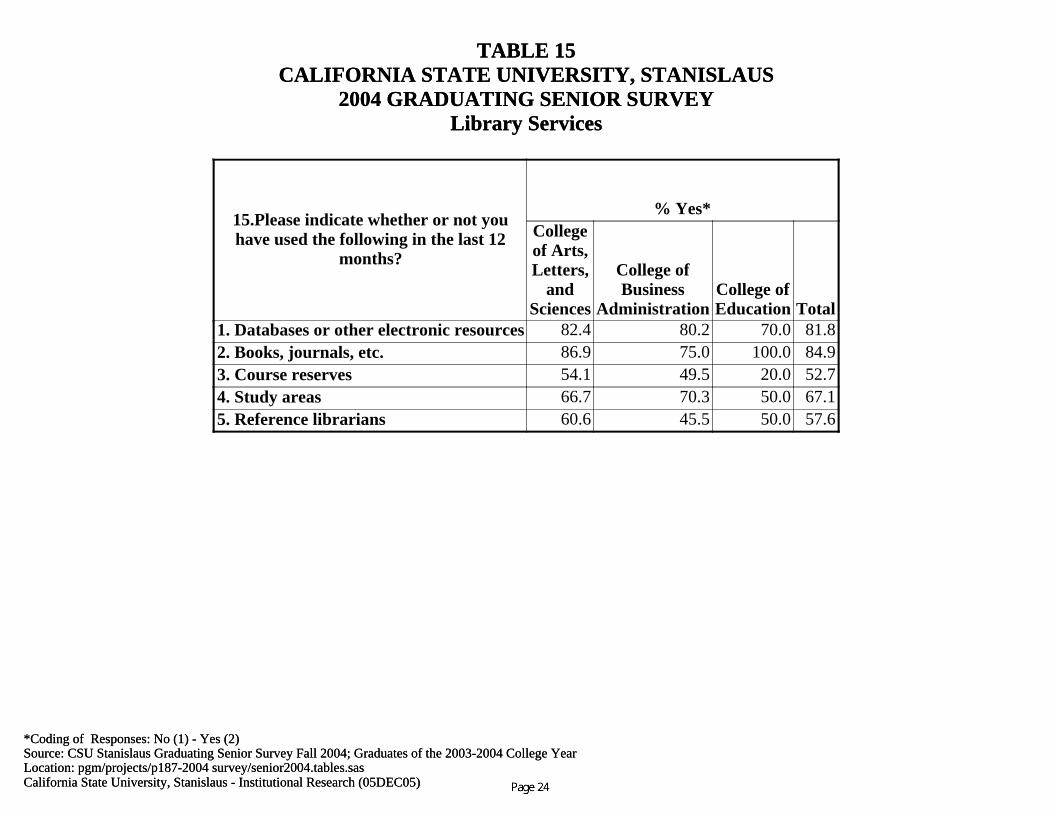
15.Please indicate whether or not youhave used the following in the last 12
months?
% Yes*Collegeof Arts,Letters,
andSciences
College ofBusiness
AdministrationCollege ofEducation Total
1. Databases or other electronic resources 82.4 80.2 70.0 81.82. Books, journals, etc. 86.9 75.0 100.0 84.93. Course reserves 54.1 49.5 20.0 52.74. Study areas 66.7 70.3 50.0 67.15. Reference librarians 60.6 45.5 50.0 57.6
California State University, Stanislaus - Institutional Research (05DEC05)Location: pgm/projects/p187-2004 survey/senior2004.tables.sasSource: CSU Stanislaus Graduating Senior Survey Fall 2004; Graduates of the 2003-2004 College Year*Coding of Responses: No (1) - Yes (2)
TABLE 16CALIFORNIA STATE UNIVERSITY, STANISLAUS
2004 GRADUATING SENIOR SURVEYLibrary Services
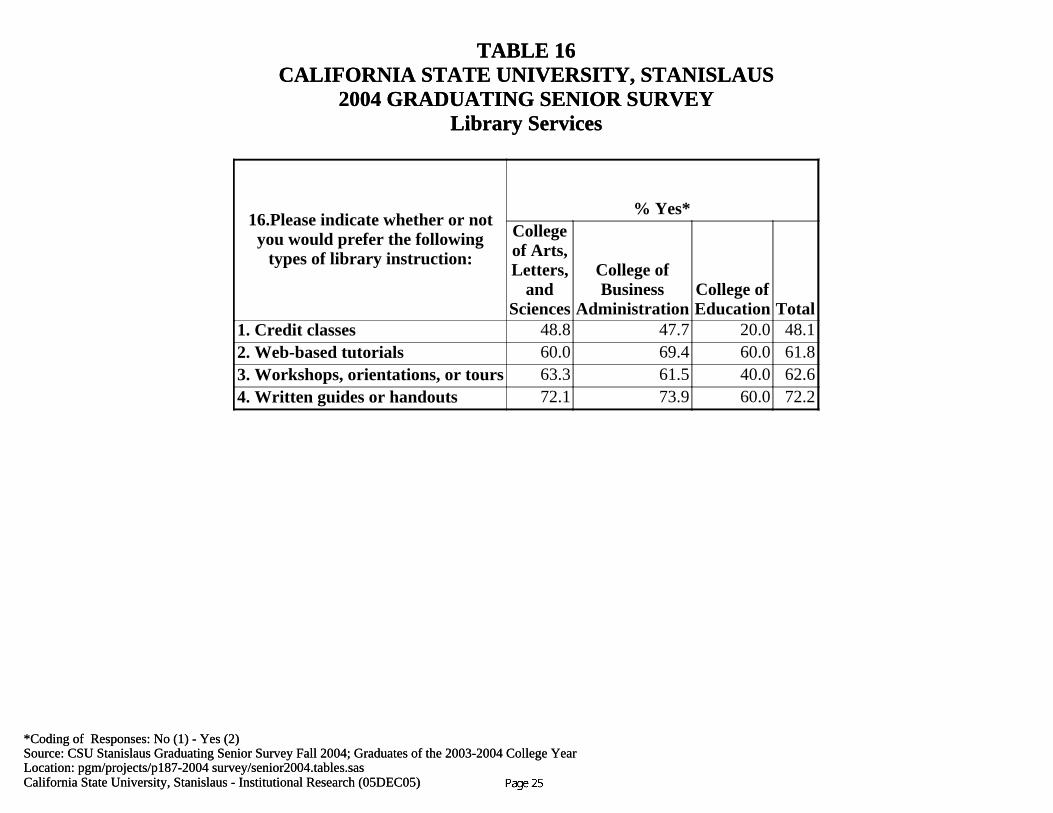
16.Please indicate whether or notyou would prefer the following
types of library instruction:
% Yes*Collegeof Arts,Letters,
andSciences
College ofBusiness
AdministrationCollege ofEducation Total
1. Credit classes 48.8 47.7 20.0 48.12. Web-based tutorials 60.0 69.4 60.0 61.83. Workshops, orientations, or tours 63.3 61.5 40.0 62.64. Written guides or handouts 72.1 73.9 60.0 72.2
California State University, Stanislaus - Institutional Research (05DEC05)Location: pgm/projects/p187-2004 survey/senior2004.tables.sasSource: CSU Stanislaus Graduating Senior Survey Fall 2004; Graduates of the 2003-2004 College YearPercents may not sum to 100% due to rounding.
TABLE 17a1CALIFORNIA STATE UNIVERSITY, STANISLAUS
2004 GRADUATING SENIOR SURVEYSatisfaction of Services
ENROLLMENT SERVICES
Percent of ResponsesDidNotUse
VeryDissatisfied Dissatisfied Satisfied
VerySatisfied
17A_1. Admissions processing 0.7 4.9 8.3 65.0 21.117A_2. Student academic records and transcripts 1.7 2.4 7.5 61.1 27.317A_3. Registration 0.2 3.2 11.3 64.0 21.317A_4. New Student Orientation 12.5 6.3 14.7 50.3 16.117A_5. General education advising 16.0 11.6 18.3 41.2 12.9

California State University, Stanislaus - Institutional Research (05DEC05)Location: pgm/projects/p187-2004 survey/senior2004.tables.sasSource: CSU Stanislaus Graduating Senior Survey Fall 2004; Graduates of the 2003-2004 College Year*Coding of Responses: Did Not Use (1) - Very Dissatisfied(2) - Dissatisfied (3) - Satisfied (4) - Very Satisfied (5)
TABLE 17a2CALIFORNIA STATE UNIVERSITY, STANISLAUS
2004 GRADUATING SENIOR SURVEYSatisfaction of Services
ENROLLMENT SERVICES
% Satisfied & Very Satisfied*Collegeof Arts,Letters,
andSciences
College ofBusiness
AdministrationCollege ofEducation Total
17A_1. Admissions processing 86.1 85.6 90.0 86.117A_2. Student academic records and transcripts 88.0 89.2 100.0 88.517A_3. Registration 86.9 78.6 90.0 85.317A_4. New Student Orientation 65.3 72.7 50.0 66.417A_5. General education advising 54.1 53.6 60.0 54.1

California State University, Stanislaus - Institutional Research (05DEC05)Location: pgm/projects/p187-2004 survey/senior2004.tables.sasSource: CSU Stanislaus Graduating Senior Survey Fall 2004; Graduates of the 2003-2004 College YearPercents may not sum to 100% due to rounding.
TABLE 17b1CALIFORNIA STATE UNIVERSITY, STANISLAUS
2004 GRADUATING SENIOR SURVEYSatisfaction of Services
CAREER GUIDANCE AND COUNSELING
Percent of ResponsesDidNotUse
VeryDissatisfied Dissatisfied Satisfied
VerySatisfied
17B_1. Personal counseling 42.4 6.3 11.1 28.0 12.217B_2. Career planning and guidance 40.3 9.0 16.7 27.2 6.917B_3. Campus employment services while a student 55.7 4.6 9.2 21.7 8.717B_4. Career placement services 62.3 8.7 10.9 14.9 3.3
California State University, Stanislaus - Institutional Research (05DEC05)Location: pgm/projects/p187-2004 survey/senior2004.tables.sasSource: CSU Stanislaus Graduating Senior Survey Fall 2004; Graduates of the 2003-2004 College Year*Coding of Responses: Did Not Use (1) - Very Dissatisfied(2) - Dissatisfied (3) - Satisfied (4) - Very Satisfied (5)
TABLE 17b2CALIFORNIA STATE UNIVERSITY, STANISLAUS
2004 GRADUATING SENIOR SURVEYSatisfaction of Services
CAREER GUIDANCE AND COUNSELING
% Satisfied & Very Satisfied*Collegeof Arts,Letters,
andSciences
College ofBusiness
AdministrationCollege ofEducation Total
17B_1. Personal counseling 40.0 41.1 33.3 40.117B_2. Career planning and guidance 32.4 40.2 44.4 34.117B_3. Campus employment services while a student 29.5 33.0 44.4 30.417B_4. Career placement services 15.5 27.9 33.3 18.2
California State University, Stanislaus - Institutional Research (05DEC05)Location: pgm/projects/p187-2004 survey/senior2004.tables.sasSource: CSU Stanislaus Graduating Senior Survey Fall 2004; Graduates of the 2003-2004 College YearPercents may not sum to 100% due to rounding.
TABLE 17c1CALIFORNIA STATE UNIVERSITY, STANISLAUS
2004 GRADUATING SENIOR SURVEYSatisfaction of Academic Support
ACADEMIC SUPPORT
Percent of ResponsesDidNotUse
VeryDissatisfied Dissatisfied Satisfied
VerySatisfied
17C_1. Financial aid services 29.5 3.3 7.4 37.7 22.317C_2. Library services overall 2.0 1.2 5.3 59.9 31.617C_2.a. Reference Desk 16.6 0.9 4.3 56.2 22.117C_2.b. Circulation 20.7 1.0 3.3 57.3 17.717C_2.c. Books and journals in my major 8.5 3.4 12.8 56.4 18.817C_2.d. Hours of service 5.1 1.4 7.7 59.8 26.017C_2.e. Physical environment 2.2 2.4 5.0 64.6 25.817C_2.f. Knowledge of staff 6.7 1.7 9.1 58.8 23.817C_2.g. Courtesy of staff 3.4 3.1 9.1 57.6 26.817C_3. Health services overall 23.8 1.1 0.6 37.1 37.317C_3.a. Services available 23.7 0.5 2.8 41.0 32.017C_3.b. Hours of operation 23.9 1.1 8.1 44.0 22.917C_4. Opportunities to interact casually with faculty 12.9 4.1 13.9 49.7 19.417C_5. Opportunities to interact with other students 5.8 1.4 8.6 60.4 23.817C_6. Tutoring center 60.4 0.7 4.8 21.5 12.6

California State University, Stanislaus - Institutional Research (05DEC05)Location: pgm/projects/p187-2004 survey/senior2004.tables.sasSource: CSU Stanislaus Graduating Senior Survey Fall 2004; Graduates of the 2003-2004 College Year*Coding of Responses: Did Not Use (1) - Very Dissatisfied(2) - Dissatisfied (3) - Satisfied (4) - Very Satisfied (5)
TABLE 17c2CALIFORNIA STATE UNIVERSITY, STANISLAUS
2004 GRADUATING SENIOR SURVEYSatisfaction of Academic Support
ACADEMIC SUPPORT
% Satisfied & Very Satisfied*Collegeof Arts,Letters,
andSciences
College ofBusiness
AdministrationCollege ofEducation Total
17C_1. Financial aid services 60.3 58.6 55.6 59.917C_2. Library services overall 91.6 91.9 80.0 91.517C_2.a. Reference Desk 77.8 80.4 77.8 78.317C_2.b. Circulation 75.2 75.0 66.7 75.017C_2.c. Books and journals in my major 76.3 72.1 60.0 75.217C_2.d. Hours of service 86.8 82.1 80.0 85.817C_2.e. Physical environment 90.7 90.1 80.0 90.417C_2.f. Knowledge of staff 82.8 83.0 66.7 82.617C_2.g. Courtesy of staff 84.2 84.7 88.9 84.417C_3. Health services overall 75.4 69.4 87.5 74.517C_3.a. Services available 74.3 67.6 77.8 73.017C_3.b. Hours of operation 68.2 62.7 55.6 66.917C_4. Opportunities to interact casually with faculty 69.4 67.9 66.7 69.117C_5. Opportunities to interact with other students 83.8 86.6 77.8 84.217C_6. Tutoring center 30.4 48.2 44.4 34.1
California State University, Stanislaus - Institutional Research (05DEC05)Location: pgm/projects/p187-2004 survey/senior2004.tables.sasSource: CSU Stanislaus Graduating Senior Survey Fall 2004; Graduates of the 2003-2004 College YearPercents may not sum to 100% due to rounding.
TABLE 17d1CALIFORNIA STATE UNIVERSITY, STANISLAUS
2004 GRADUATING SENIOR SURVEYSatisfaction of Computer Support
COMPUTER SUPPORT
Percent of ResponsesDidNotUse
VeryDissatisfied Dissatisfied Satisfied
VerySatisfied
17D_1. Computer lab overall 13.4 1.2 7.7 56.1 21.517D_2. Computer lab hardware 15.8 1.7 5.3 58.5 18.717D_3. Computer lab software 17.0 1.2 4.0 59.1 18.717D_4. Computer help desk 24.5 5.5 11.9 44.8 13.317D_5. Computer lab center hours 14.8 3.6 10.5 52.8 18.317D_6. PC equipment and labs in my department/college 21.7 6.8 9.0 45.2 17.3
California State University, Stanislaus - Institutional Research (05DEC05)Location: pgm/projects/p187-2004 survey/senior2004.tables.sasSource: CSU Stanislaus Graduating Senior Survey Fall 2004; Graduates of the 2003-2004 College Year*Coding of Responses: Did Not Use (1) - Very Dissatisfied(2) - Dissatisfied (3) - Satisfied (4) - Very Satisfied (5)
TABLE 17d2CALIFORNIA STATE UNIVERSITY, STANISLAUS
2004 GRADUATING SENIOR SURVEYSatisfaction of Computer Support
COMPUTER SUPPORT
% Satisfied & Very Satisfied*Collegeof Arts,Letters,
andSciences
College ofBusiness
AdministrationCollege ofEducation Total
17D_1. Computer lab overall 75.8 85.7 70.0 77.617D_2. Computer lab hardware 74.2 88.4 90.0 77.217D_3. Computer lab software 74.3 91.1 90.0 77.817D_4. Computer help desk 57.4 61.6 50.0 58.117D_5. Computer lab center hours 70.7 70.9 90.0 71.017D_6. PC equipment and labs in my department/college 57.8 83.0 50.0 62.6

California State University, Stanislaus - Institutional Research (05DEC05)Location: pgm/projects/p187-2004 survey/senior2004.tables.sasSource: CSU Stanislaus Graduating Senior Survey Fall 2004; Graduates of the 2003-2004 College YearPercents may not sum to 100% due to rounding.
TABLE 17e1CALIFORNIA STATE UNIVERSITY, STANISLAUS
2004 GRADUATING SENIOR SURVEYSatisfaction of Campus Facilities
CAMPUS FACILITIES
Percent of ResponsesDidNotUse
VeryDissatisfied Dissatisfied Satisfied
VerySatisfied
17E_1. Residence halls 71.4 1.0 2.6 17.0 8.017E_2. Campus security 32.9 2.1 7.7 44.2 13.117E_3. Cafeteria services 15.3 4.1 14.1 50.1 16.517E_4. Student center and lounges 22.4 1.0 4.6 50.9 21.217E_5. Recreational facilities and opportunities 44.8 2.1 5.5 34.9 12.717E_6. Bookstore facilities 1.0 4.4 12.3 62.6 19.7
California State University, Stanislaus - Institutional Research (05DEC05)Location: pgm/projects/p187-2004 survey/senior2004.tables.sasSource: CSU Stanislaus Graduating Senior Survey Fall 2004; Graduates of the 2003-2004 College Year*Coding of Responses: Did Not Use (1) - Very Dissatisfied(2) - Dissatisfied (3) - Satisfied (4) - Very Satisfied (5)
TABLE 17e2CALIFORNIA STATE UNIVERSITY, STANISLAUS
2004 GRADUATING SENIOR SURVEYSatisfaction of Campus Facilities
CAMPUS FACILITIES
% Satisfied & Very Satisfied*Collegeof Arts,Letters,
andSciences
College ofBusiness
AdministrationCollege ofEducation Total
17E_1. Residence halls 22.5 33.6 44.4 25.017E_2. Campus security 56.7 60.7 44.4 57.317E_3. Cafeteria services 65.4 69.6 88.9 66.617E_4. Student center and lounges 72.0 73.2 55.6 72.017E_5. Recreational facilities and opportunities 45.9 55.4 44.4 47.717E_6. Bookstore facilities 81.9 83.0 88.9 82.2
California State University, Stanislaus - Institutional Research (05DEC05)Location: pgm/projects/p187-2004 survey/senior2004.tables.sasSource: CSU Stanislaus Graduating Senior Survey Fall 2004; Graduates of the 2003-2004 College YearPercents may not sum to 100% due to rounding.
TABLE 17f1CALIFORNIA STATE UNIVERSITY, STANISLAUS
2004 GRADUATING SENIOR SURVEYSatisfaction of Student Activities
STUDENT ACTIVITIES
Percent of ResponsesDidNotUse
VeryDissatisfied Dissatisfied Satisfied
VerySatisfied
17F_1. Cultural programs (lectures, concerts, etc.) 39.0 3.1 5.8 39.0 13.117F_2. Recreational programs 56.4 1.7 5.6 28.2 8.017F_3. Campus organizations 49.3 2.1 5.7 34.6 8.417F_4. Athletic events 61.2 2.7 5.1 24.3 6.717F_5. Social activities overall 41.8 1.9 9.1 37.8 9.4

California State University, Stanislaus - Institutional Research (05DEC05)Location: pgm/projects/p187-2004 survey/senior2004.tables.sasSource: CSU Stanislaus Graduating Senior Survey Fall 2004; Graduates of the 2003-2004 College Year*Coding of Responses: Did Not Use (1) - Very Dissatisfied(2) - Dissatisfied (3) - Satisfied (4) - Very Satisfied (5)
TABLE 17f2CALIFORNIA STATE UNIVERSITY, STANISLAUS
2004 GRADUATING SENIOR SURVEYSatisfaction of Student Activities
STUDENT ACTIVITIES
% Satisfied & Very Satisfied*Collegeof Arts,Letters,
andSciences
College ofBusiness
AdministrationCollege ofEducation Total
17F_1. Cultural programs (lectures, concerts, etc.) 49.9 59.8 66.7 52.117F_2. Recreational programs 36.0 37.5 33.3 36.217F_3. Campus organizations 41.9 46.4 55.6 43.017F_4. Athletic events 29.5 33.9 66.7 30.917F_5. Social activities overall 46.7 50.0 44.4 47.3

California State University, Stanislaus - Institutional Research (05DEC05)Location: pgm/projects/p187-2004 survey/senior2004.tables.sasSource: CSU Stanislaus Graduating Senior Survey Fall 2004; Graduates of the 2003-2004 College YearPercents may not sum to 100% due to rounding.
TABLE 18aCALIFORNIA STATE UNIVERSITY, STANISLAUS
2004 GRADUATING SENIOR SURVEYAcademic/Social Climate of the University
18.AcademicClimate
COLLEGE
TOTAL
College of Arts,Letters,
and Sciences
College ofBusiness
AdministrationCollege ofEducation
Number Percent Number Percent Number Percent Number PercentWOMENDiscriminatory 6 1.5 1 0.9 7 1.3Neutral 156 38.0 42 38.9 3 33.3 201 38.1Supportive 249 60.6 65 60.2 6 66.7 320 60.6MENDiscriminatory 7 1.7 1 11.1 8 1.5Neutral 172 41.8 48 44.4 5 55.6 225 42.6Supportive 232 56.4 60 55.6 3 33.3 295 55.9AFRICANAMERICANSDiscriminatory 15 3.6 1 0.9 1 11.1 17 3.2Neutral 192 46.7 54 50.0 6 66.7 252 47.7Supportive 204 49.6 53 49.1 2 22.2 259 49.1AMERICANINDIANSDiscriminatory 11 2.7 1 0.9 1 11.1 13 2.5Neutral 207 50.4 55 50.9 6 66.7 268 50.8Supportive 193 47.0 52 48.1 2 22.2 247 46.8(Continued)
California State University, Stanislaus - Institutional Research (05DEC05)Location: pgm/projects/p187-2004 survey/senior2004.tables.sasSource: CSU Stanislaus Graduating Senior Survey Fall 2004; Graduates of the 2003-2004 College YearPercents may not sum to 100% due to rounding.
TABLE 18aCALIFORNIA STATE UNIVERSITY, STANISLAUS
2004 GRADUATING SENIOR SURVEYAcademic/Social Climate of the University
18.AcademicClimate
COLLEGE
TOTAL
College of Arts,Letters,
and Sciences
College ofBusiness
AdministrationCollege ofEducation
Number Percent Number Percent Number Percent Number PercentASIANS/PACIFICISLANDERSDiscriminatory 11 2.7 2 1.9 1 11.1 14 2.7Neutral 200 48.7 53 49.1 7 77.8 260 49.2Supportive 200 48.7 53 49.1 1 11.1 254 48.1HISPANICSDiscriminatory 11 2.7 1 0.9 1 11.1 13 2.5Neutral 173 42.1 48 44.4 6 66.7 227 43.0Supportive 227 55.2 59 54.6 2 22.2 288 54.5INTERNATIONALSTUDENTSDiscriminatory 10 2.4 1 11.1 11 2.1Neutral 202 49.1 44 40.7 6 66.7 252 47.7Supportive 199 48.4 64 59.3 2 22.2 265 50.2DISABLEDSTUDENTSDiscriminatory 13 3.2 1 0.9 14 2.7Neutral 177 43.1 39 36.1 6 66.7 222 42.0(Continued)

California State University, Stanislaus - Institutional Research (05DEC05)Location: pgm/projects/p187-2004 survey/senior2004.tables.sasSource: CSU Stanislaus Graduating Senior Survey Fall 2004; Graduates of the 2003-2004 College YearPercents may not sum to 100% due to rounding.
TABLE 18aCALIFORNIA STATE UNIVERSITY, STANISLAUS
2004 GRADUATING SENIOR SURVEYAcademic/Social Climate of the University
18.AcademicClimate
COLLEGE
TOTAL
College of Arts,Letters,
and Sciences
College ofBusiness
AdministrationCollege ofEducation
Number Percent Number Percent Number Percent Number PercentDISABLEDSTUDENTSSupportive 221 53.8 68 63.0 3 33.3 292 55.3GAY/LESBIANSTUDENTSDiscriminatory 25 6.1 2 1.9 1 11.1 28 5.3Neutral 211 51.3 61 56.5 6 66.7 278 52.7Supportive 175 42.6 45 41.7 2 22.2 222 42.0Total responses 411 100.0 108 100.0 9 100.0 528 100.0

California State University, Stanislaus - Institutional Research (05DEC05)Location: pgm/projects/p187-2004 survey/senior2004.tables.sasSource: CSU Stanislaus Graduating Senior Survey Fall 2004; Graduates of the 2003-2004 College YearPercents may not sum to 100% due to rounding.
TABLE 18bCALIFORNIA STATE UNIVERSITY, STANISLAUS
2004 GRADUATING SENIOR SURVEYAcademic/Social Climate of the University
18.Social Climate
COLLEGE
TOTAL
College of Arts,Letters,
and Sciences
College ofBusiness
AdministrationCollege ofEducation
Number Percent Number Percent Number Percent Number PercentWOMENDiscriminatory 8 2.0 8 1.6Neutral 161 41.2 44 42.7 5 55.6 210 41.7Supportive 222 56.8 59 57.3 4 44.4 285 56.7MENDiscriminatory 7 1.8 1 11.1 8 1.6Neutral 167 42.7 43 41.7 5 55.6 215 42.7Supportive 217 55.5 60 58.3 3 33.3 280 55.7AFRICANAMERICANSDiscriminatory 11 2.8 1 1.0 1 11.1 13 2.6Neutral 193 49.4 50 48.5 5 55.6 248 49.3Supportive 187 47.8 52 50.5 3 33.3 242 48.1AMERICANINDIANSDiscriminatory 13 3.3 1 1.0 1 11.1 15 3.0Neutral 200 51.2 52 50.5 6 66.7 258 51.3Supportive 178 45.5 50 48.5 2 22.2 230 45.7(Continued)
California State University, Stanislaus - Institutional Research (05DEC05)Location: pgm/projects/p187-2004 survey/senior2004.tables.sasSource: CSU Stanislaus Graduating Senior Survey Fall 2004; Graduates of the 2003-2004 College YearPercents may not sum to 100% due to rounding.
TABLE 18bCALIFORNIA STATE UNIVERSITY, STANISLAUS
2004 GRADUATING SENIOR SURVEYAcademic/Social Climate of the University
18.Social Climate
COLLEGE
TOTAL
College of Arts,Letters,
and Sciences
College ofBusiness
AdministrationCollege ofEducation
Number Percent Number Percent Number Percent Number PercentASIANS/PACIFICISLANDERSDiscriminatory 11 2.8 1 1.0 1 11.1 13 2.6Neutral 195 49.9 51 49.5 7 77.8 253 50.3Supportive 185 47.3 51 49.5 1 11.1 237 47.1HISPANICSDiscriminatory 9 2.3 1 1.0 1 11.1 11 2.2Neutral 167 42.7 46 44.7 6 66.7 219 43.5Supportive 215 55.0 56 54.4 2 22.2 273 54.3INTERNATIONALSTUDENTSDiscriminatory 9 2.3 1 1.0 1 11.1 11 2.2Neutral 198 50.6 47 45.6 6 66.7 251 49.9Supportive 184 47.1 55 53.4 2 22.2 241 47.9DISABLEDSTUDENTSDiscriminatory 15 3.8 3 2.9 1 11.1 19 3.8Neutral 188 48.1 44 42.7 6 66.7 238 47.3Supportive 188 48.1 56 54.4 2 22.2 246 48.9(Continued)

California State University, Stanislaus - Institutional Research (05DEC05)Location: pgm/projects/p187-2004 survey/senior2004.tables.sasSource: CSU Stanislaus Graduating Senior Survey Fall 2004; Graduates of the 2003-2004 College YearPercents may not sum to 100% due to rounding.
TABLE 18bCALIFORNIA STATE UNIVERSITY, STANISLAUS
2004 GRADUATING SENIOR SURVEYAcademic/Social Climate of the University
18.Social Climate
COLLEGE
TOTAL
College of Arts,Letters,
and Sciences
College ofBusiness
AdministrationCollege ofEducation
Number Percent Number Percent Number Percent Number PercentGAY/LESBIANSTUDENTSDiscriminatory 32 8.2 5 4.9 1 11.1 38 7.6Neutral 201 51.4 55 53.4 7 77.8 263 52.3Supportive 158 40.4 43 41.7 1 11.1 202 40.2Total responses 391 100.0 103 100.0 9 100.0 503 100.0

California State University, Stanislaus - Institutional Research (05DEC05)Location: pgm/projects/p187-2004 survey/senior2004.tables.sasSource: CSU Stanislaus Graduating Senior Survey Fall 2004; Graduates of the 2003-2004 College YearPercents may not sum to 100% due to rounding.
TABLE 19CALIFORNIA STATE UNIVERSITY, STANISLAUS
2004 GRADUATING SENIOR SURVEYHigh School
19.What high school didyou graduate from? Number Percent
Primary Service Areas 412 72.0Other California Counties 104 18.2Other States 38 6.6Other Countries 18 3.1Total responses 572 100.0
California State University, Stanislaus - Institutional Research (05DEC05)Location: pgm/projects/p187-2004 survey/senior2004.tables.sasSource: CSU Stanislaus Graduating Senior Survey Fall 2004; Graduates of the 2003-2004 College YearPercents may not sum to 100% due to rounding.
TABLE 20CALIFORNIA STATE UNIVERSITY, STANISLAUS
2004 GRADUATING SENIOR SURVEYParents Graduated from College
20.Did either ofyour parents
graduate fromcollege? Number Percent
No 365 61.7Yes 227 38.3Total responses 592 100.0
California State University, Stanislaus - Institutional Research (05DEC05)Location: pgm/projects/p187-2004 survey/senior2004.tables.sasSource: CSU Stanislaus Graduating Senior Survey Fall 2004; Graduates of the 2003-2004 College YearPercents may not sum to 100% due to rounding.
TABLE 21CALIFORNIA STATE UNIVERSITY, STANISLAUS
2004 GRADUATING SENIOR SURVEYCampus Activities Participation
21.CAMPUSACTIVITIES Number Percent
Fraternity/Sorority 37 6.6Athletic 70 12.4Music 100 17.7Drama 96 17.0Art 69 12.2ASI 50 8.9Other 142 25.2Total responses 564 100.0
California State University, Stanislaus - Institutional Research (05DEC05)Location: pgm/projects/p187-2004 survey/senior2004.tables.sasSource: CSU Stanislaus Graduating Senior Survey Fall 2004; Graduates of the 2003-2004 College YearPercents may not sum to 100% due to rounding.
TABLE 22CALIFORNIA STATE UNIVERSITY, STANISLAUS
2004 GRADUATING SENIOR SURVEYHigh School Class Size
California State University, Stanislaus - Institutional Research (05DEC05)Location: pgm/projects/p187-2004 survey/senior2004.tables.sasSource: CSU Stanislaus Graduating Senior Survey Fall 2004; Graduates of the 2003-2004 College YearPercents may not sum to 100% due to rounding.
TABLE 22CALIFORNIA STATE UNIVERSITY, STANISLAUS
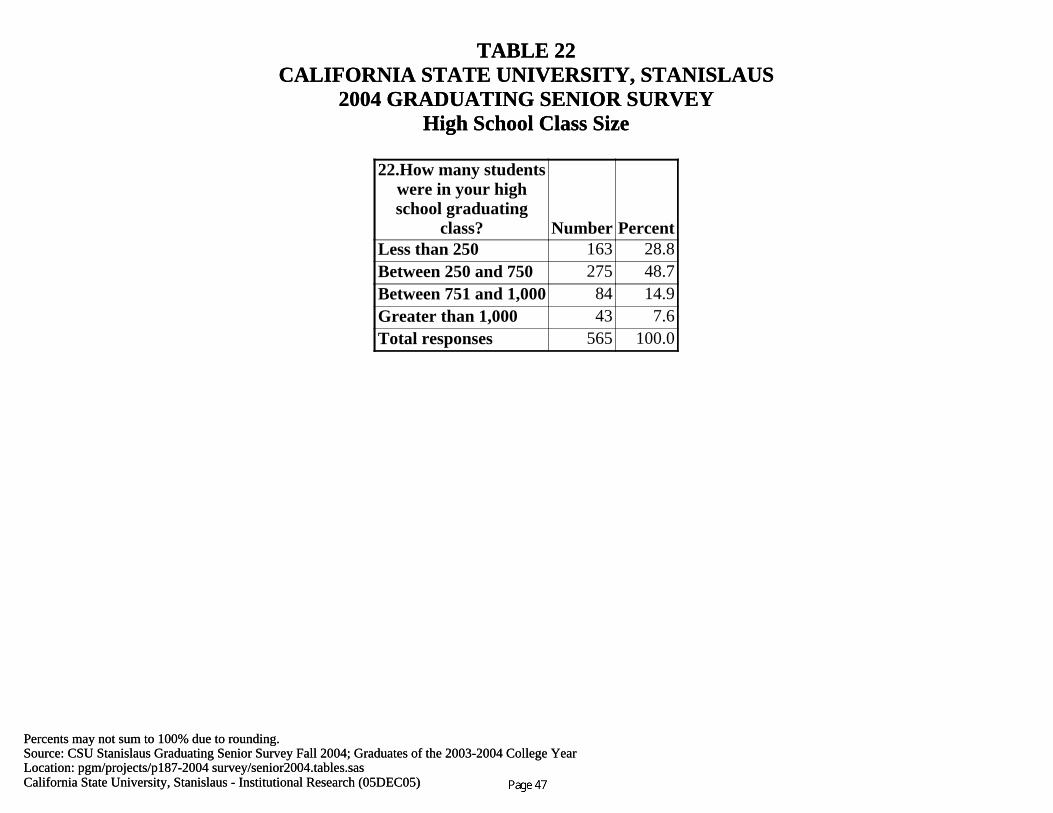
2004 GRADUATING SENIOR SURVEYHigh School Class Size
22.How many studentswere in your highschool graduating
class? Number PercentLess than 250 163 28.8Between 250 and 750 275 48.7Between 751 and 1,000 84 14.9Greater than 1,000 43 7.6Total responses 565 100.0

California State University, Stanislaus - Institutional Research (05DEC05)Location: pgm/projects/p187-2004 survey/senior2004.tables.sasSource: CSU Stanislaus Graduating Senior Survey Fall 2004; Graduates of the 2003-2004 College YearPercents may not sum to 100% due to rounding.
TABLE 23CALIFORNIA STATE UNIVERSITY, STANISLAUS
2004 GRADUATING SENIOR SURVEYSiblings Graduated from College
23.Do you haveany siblingswho havegraduated
from college? Number PercentNo 364 61.4Yes 229 38.6Total responses 593 100.0

California State University, Stanislaus - Institutional Research (05DEC05)Location: pgm/projects/p187-2004 survey/senior2004.tables.sasSource: CSU Stanislaus Graduating Senior Survey Fall 2004; Graduates of the 2003-2004 College YearPercents may not sum to 100% due to rounding.
TABLE 24CALIFORNIA STATE UNIVERSITY, STANISLAUS
2004 GRADUATING SENIOR SURVEYCommunity Service/Internship Participation
24.ACTIVITIES
COLLEGE
TOTAL
College of Arts,Letters,
and Sciences
College ofBusiness
AdministrationCollege ofEducation
Number Percent Number Percent Number Percent Number PercentVolunteer Community Service 113.0 57.7 26.0 13.3 2.0 1.0 141.0 71.9Internship 48.0 24.5 7.0 3.6 55.0 28.1Total responses 161.0 82.1 33.0 16.8 2.0 1.0 196.0 100.0
Appendix A:Demographics of All Graduates and Respondents
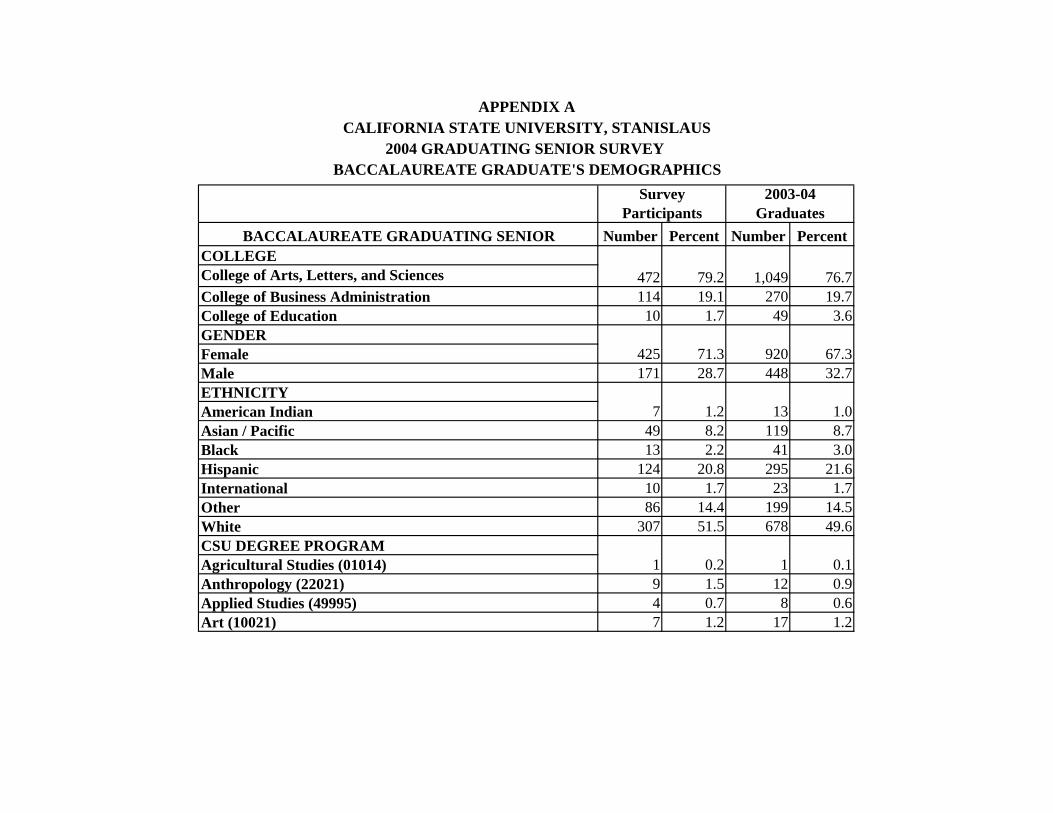
BACCALAUREATE GRADUATING SENIOR Number Percent Number PercentCOLLEGECollege of Arts, Letters, and SciencesCollege of Business Administration 114 19.1 270 19.7College of Education 10 1.7 49 3.6GENDERFemaleMale 171 28.7 448 32.7ETHNICITYAmerican IndianAsian / Pacific 49 8.2 119 8.7Black 13 2.2 41 3.0Hispanic 124 20.8 295 21.6International 10 1.7 23 1.7Other 86 14.4 199 14.5White 307 51.5 678 49.6CSU DEGREE PROGRAMAgricultural Studies (01014)Anthropology (22021) 9 1.5 12 0.9Applied Studies (49995) 4 0.7 8 0.6Art (10021) 7 1.2 17 1.2
13 1.0
1 0.1
APPENDIX A
7 1.2
472 79.2
425 71.3
1,049
Survey Participants
2003-04 Graduates
2004 GRADUATING SENIOR SURVEY CALIFORNIA STATE UNIVERSITY, STANISLAUS
BACCALAUREATE GRADUATE'S DEMOGRAPHICS
1 0.2
76.7
920 67.3

BACCALAUREATE GRADUATING SENIOR Number Percent Number Percent
APPENDIX A
Survey Participants
2003-04 Graduates
2004 GRADUATING SENIOR SURVEY CALIFORNIA STATE UNIVERSITY, STANISLAUS
BACCALAUREATE GRADUATE'S DEMOGRAPHICS
Biology (04011) 22 3.7 50 3.7Business Administration (05011) 99 16.6 231 16.9Chemistry (19051) 3 0.5 7 0.5Child Development/Early Childhood Education (08231) 12 2.0 18 1.3Communications (06011) 25 4.2 69 5.0Computer Science (07011) 2 0.3 10 0.7Criminal Justice (21051) 36 6.0 97 7.1Economics (22041) 9 1.5 13 1.0English (15011) 19 3.2 41 3.0French (11021) 1 0.2 1 0.1Geography (22061) 3 0.5 4 0.3Geology (19141) 4 0.7 4 0.3History (22051) 9 1.5 30 2.2Information Systems (07021) 15 2.5 39 2.9Interdisciplinary Studies/Special Major (49993) 1 0.2 2 0.1Kinesiology/Physical Education (08351) 9 1.5 47 3.4Liberal Studies (49012) 166 27.9 377 27.6Mathematics (17011) 3 0.5 12 0.9Music (10051) 2 0.3 5 0.4Music (Professional Performance) (10041) 2 0.3 8 0.6Nursing (12031) 12 2.0 26 1.9
BACCALAUREATE GRADUATING SENIOR Number Percent Number Percent
APPENDIX A
Survey Participants
2003-04 Graduates
2004 GRADUATING SENIOR SURVEY CALIFORNIA STATE UNIVERSITY, STANISLAUS
BACCALAUREATE GRADUATE'S DEMOGRAPHICS
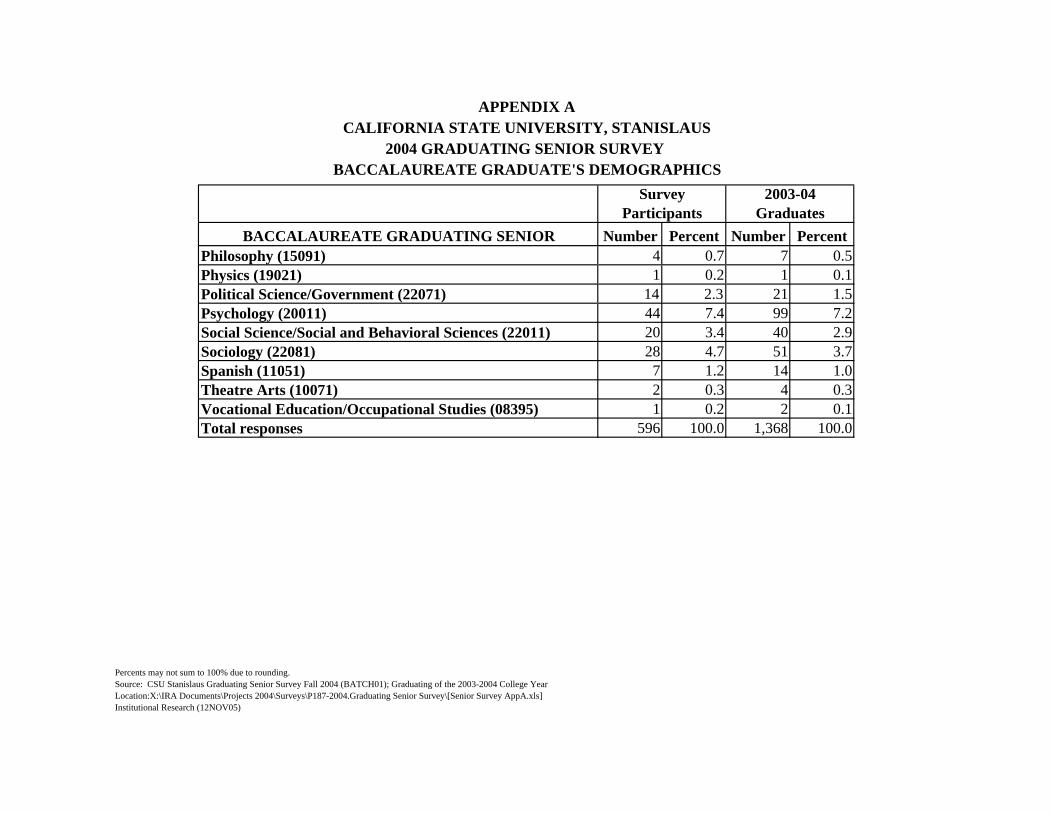
Philosophy (15091) 4 0.7 7 0.5Physics (19021) 1 0.2 1 0.1Political Science/Government (22071) 14 2.3 21 1.5Psychology (20011) 44 7.4 99 7.2Social Science/Social and Behavioral Sciences (22011) 20 3.4 40 2.9Sociology (22081) 28 4.7 51 3.7Spanish (11051) 7 1.2 14 1.0Theatre Arts (10071) 2 0.3 4 0.3Vocational Education/Occupational Studies (08395) 1 0.2 2 0.1Total responses 596 100.0 1,368 100.0
Location:X:\IRA Documents\Projects 2004\Surveys\P187-2004.Graduating Senior Survey\[Senior Survey AppA.xls]Institutional Research (12NOV05)
Percents may not sum to 100% due to rounding.Source: CSU Stanislaus Graduating Senior Survey Fall 2004 (BATCH01); Graduating of the 2003-2004 College Year
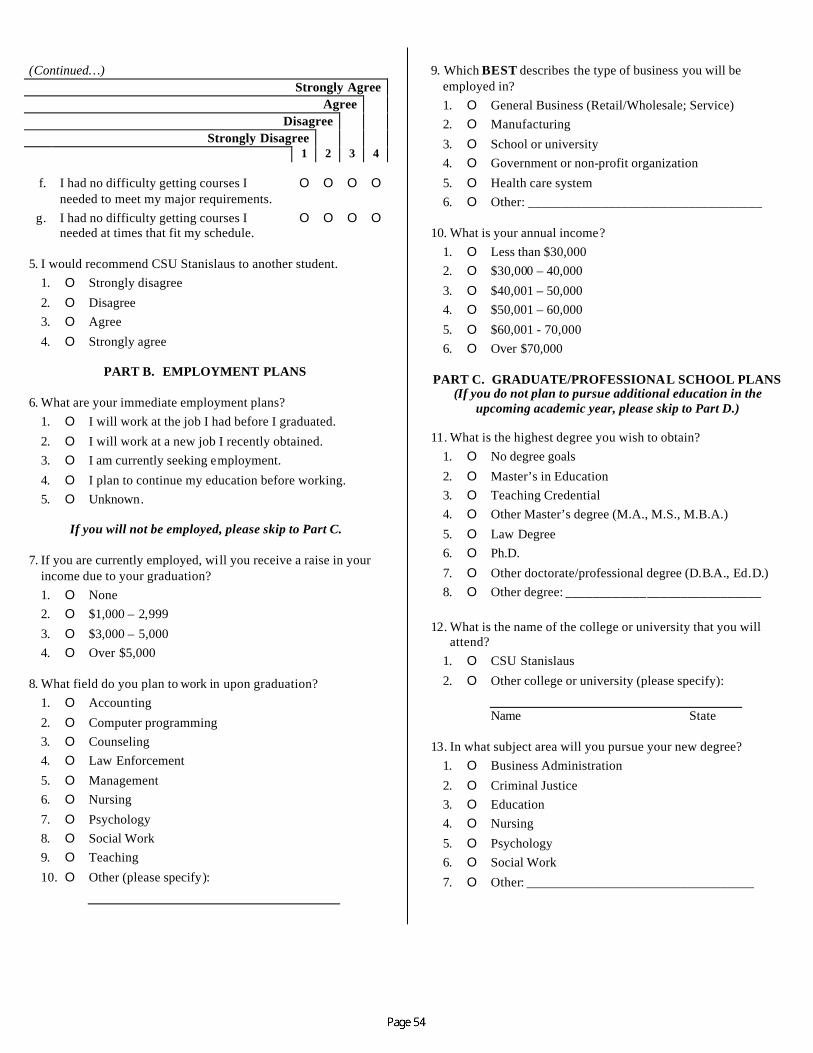
Appendix B:Graduating Senior Survey, 2003-2004

CALIFORNIA STATE UNIVERSITY, STANISLAUS GRADUATING SENIOR SURVEY
This survey is designed to help us reflect and improve upon our programs and services. Your responses will provide an important source of information for our evaluation and planning efforts. Please respond to all of the questions. All answers are confidential and will not be associated with your name. Thank you for your help.
PART A. EVALUATION OF EXPERIENCES AT CSU STANISLAUS
1. How would you rate the quality of each of the following aspects
of your education at CSU Stanislaus? Excellent Good
Fair Poor
1 2 3 4
a. Overall quality of instruction by faculty O O O O b. Quality of instruction by faculty in my
major O O O O
c. Individual attention from faculty O O O O d. Advising by faculty in my major O O O O e. Preparation for graduate or professional
school O O O O
f. Quality of library resources and services O O O O g. Quality of computing resources O O O O
h. Preparation for my first career-related position
O O O O
i. Preparation to use technology and computers
O O O O
j. Preparation to conduct effective research O O O O 2. Please indicate the extent of your agreement or disagreement
with the following statements as they describe the general education courses you completed at CSU Stanislaus.
Strongly Agree Agree
Disagree Strongly Disagree
1 2 3 4
a. I was prepared for upper division courses in my major.
O O O O
b. I was able to enroll in the courses I wanted to fulfill my GE requirements.
O O O O
3. As a result of the general education courses I took at CSU Stanislaus, I learned…
Strongly Agree Agree
Disagree Strongly Disagree
1 2 3 4
a. to understand basic principles, methodologies, and perspectives in my dis cipline.
O O O O
b. to communicate knowledge more effectively, in written and oral form.
O O O O
c. critical thinking skills that will be useful throughout my life.
O O O O
d. to find, understand, examine critically, and use information.
O O O O
e. to understand connections between my discipline and other disciplines.
O O O O
f. to look at issues from multiple perspectives and to appreciate the complexity of disagreements.
O O O O
g. to see my discipline’s connection to global issues.
O O O O
h. to better understand the ethics of social responsibility and my disciplines connection to social issues.
O O O O
4. Please answer the following questions as they relate to your
courses and experience in your major department: Strongly Agree
Agree Disagree
Strongly Disagree 1 2 3 4
a. Grading practices and other academic policies were administered fairly.
O O O O
b. Faculty members in my department were interested in my progress as a student.
O O O O
c. Faculty were available for assistance outside of the classroom.
O O O O
d. The courses required for my major were appropriate.
O O O O
e. My major courses were intellectually challenging.
O O O O
(Continued…)
Strongly Agree Agree
Disagree Strongly Disagree
1 2 3 4
f. I had no difficulty getting courses I needed to meet my major requirements.
O O O O
g. I had no difficulty getting courses I needed at times that fit my schedule.
O O O O
5. I would recommend CSU Stanislaus to another student. 1. O Strongly disagree
2. O Disagree 3. O Agree
4. O Strongly agree
PART B. EMPLOYMENT PLANS 6. What are your immediate employment plans? 1. O I will work at the job I had before I graduated.
2. O I will work at a new job I recently obtained. 3. O I am currently seeking employment.
4. O I plan to continue my education before working. 5. O Unknown.
If you will not be employed, please skip to Part C. 7. If you are currently employed, will you receive a raise in your
income due to your graduation? 1. O None 2. O $1,000 – 2,999
3. O $3,000 – 5,000 4. O Over $5,000 8. What field do you plan to work in upon graduation? 1. O Accounting
2. O Computer programming 3. O Counseling 4. O Law Enforcement
5. O Management 6. O Nursing
7. O Psychology 8. O Social Work 9. O Teaching
10. O Other (please specify):
9. Which BEST describes the type of business you will be
employed in? 1. O General Business (Retail/Wholesale; Service) 2. O Manufacturing
3. O School or university 4. O Government or non-profit organization
5. O Health care system 6. O Other: ___________________________________ 10. What is your annual income? 1. O Less than $30,000 2. O $30,000 – 40,000
3. O $40,001 – 50,000 4. O $50,001 – 60,000
5. O $60,001 - 70,000 6. O Over $70,000 PART C. GRADUATE/PROFESSIONAL SCHOOL PLANS
(If you do not plan to pursue additional education in the upcoming academic year, please skip to Part D.)
11. What is the highest degree you wish to obtain? 1. O No degree goals
2. O Master’s in Education 3. O Teaching Credential 4. O Other Master’s degree (M.A., M.S., M.B.A.)
5. O Law Degree 6. O Ph.D.
7. O Other doctorate/professional degree (D.B.A., Ed.D.) 8. O Other degree: _____________________________ 12. What is the name of the college or university that you will attend? 1. O CSU Stanislaus
2. O Other college or university (please specify):
Name State 13. In what subject area will you pursue your new degree? 1. O Business Administration
2. O Criminal Justice 3. O Education 4. O Nursing
5. O Psychology 6. O Social Work
7. O Other: __________________________________

PART D. STUDENT SERVICES & ACTIVITIES
14. How many times in the last 12 months have you used the University Library’s collections or services?
1. O None 2. O 1 – 5 3. O 6 – 10
4. O 11 – 20 5. O More than 20 15. Please indicate whether or not you have used the following in the last 12 months:
No 1
Yes 2
1. Databases or other electronic resources O O 2. Books, journals, etc. O O 3. Course reserves O O 4. Study areas O O 5. Reference librarians O O 16. Please indicate whether or not you would prefer the following types of library instruction:
No 1
Yes 2
1. Credit classes O O 2. Web-based tutorials O O 3. Workshops, orientations, or tours O O 4. Written guides or handouts O O 17. How satisfied were you with each of the following services:
Very Satisfied Satisfied
Dissatisfied Very Dissatisfied Did Not Use
1 2 3 4 5 A. Enrollment Services
1. Admissions processing O O O O O 2. Student academic records and
transcripts O O O O O
3. Registration O O O O O 4. New Student Orientation O O O O O
5. General education advising
O O O O O
B. Career Guidance and Counseling 1. Personal counseling O O O O O 2. Career planning and guidance O O O O O 3. Campus employment services
while a student O O O O O
4. Career placement services
O O O O O
C. Academic Support 1. Financial aid services O O O O O 2. Library services overall O O O O O
(Continued…)
Very Satisfied Satisfied
Dissatisfied Very Dissatisfied Did Not Use
1 2 3 4 5
a. Reference desk O O O O O b. Circulation O O O O O c. Books and journals in my
major O O O O O
d. Hours of service O O O O O e. Physical environment O O O O O f. Knowledge of staff O O O O O g. Courtesy of staff O O O O O 3. Health services overall O O O O O a. Services available O O O O O b. Hours of operation O O O O O 4. Opportunities to interact
casually with faculty O O O O O
5. Opportunities to interact with other students
O O O O O
6. Tutoring center
O O O O O
D. Computer Support 1. Computer lab overall O O O O O 2. Computer lab hardware O O O O O 3. Computer lab software O O O O O 4. Computer help desk O O O O O 5. Computer lab center hours O O O O O
6. Computer equipment and labs in my department/college
O O O O O
E. Campus Facilities 1. Residence halls O O O O O
2. Campus security O O O O O
3. Cafeteria services O O O O O
4. Student center and lounges O O O O O
5. Recreational facilities and their availability
O O O O O
6. Bookstore facilities
O O O O O
F. Student Activities 1. Cultural programs (lectures,
concerts, etc.) O O O O O
2. Recreational programs O O O O O 3. Campus organizations O O O O O
4. Athletic events O O O O O 5. Social activities overall O O O O O
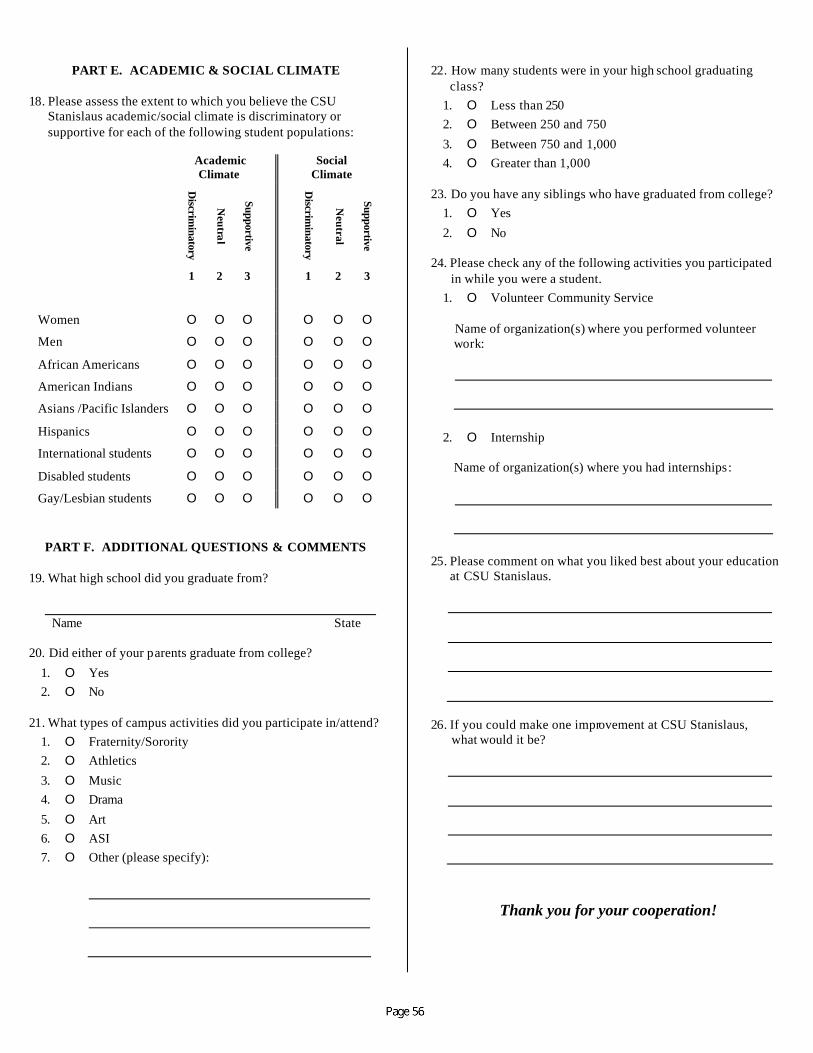
PART E. ACADEMIC & SOCIAL CLIMATE
18. Please assess the extent to which you believe the CSU Stanislaus academic/social climate is discriminatory or supportive for each of the following student populations:
Academic Climate
Social Climate
Discrim
inatory
Neutral
Supportive
Discrim
inatory
Neutral
Supportive
1 2 3 1 2 3
Women O O O O O O
Men O O O O O O
African Americans O O O O O O
American Indians O O O O O O
Asians /Pacific Islanders O O O O O O
Hispanics O O O O O O
International students O O O O O O
Disabled students O O O O O O
Gay/Lesbian students O O O O O O
PART F. ADDITIONAL QUESTIONS & COMMENTS 19. What high school did you graduate from?
Name State 20. Did either of your parents graduate from college?
1. O Yes 2. O No 21. What types of campus activities did you participate in/attend? 1. O Fraternity/Sorority 2. O Athletics
3. O Music 4. O Drama
5. O Art 6. O ASI 7. O Other (please specify):
22. How many students were in your high school graduating class? 1. O Less than 250 2. O Between 250 and 750
3. O Between 750 and 1,000 4. O Greater than 1,000 23. Do you have any siblings who have graduated from college? 1. O Yes
2. O No 24. Please check any of the following activities you participated in while you were a student. 1. O Volunteer Community Service Name of organization(s) where you performed volunteer work:
2. O Internship Name of organization(s) where you had internships:
25. Please comment on what you liked best about your education at CSU Stanislaus.
26. If you could make one improvement at CSU Stanislaus, what would it be?
Thank you for your cooperation!

Appendix C:Comments

Graduating Senior Survey Report, Class of 2003-2004 Office of Institutional Research, December 2005
Page 57
Comments
Question 25. Please comment on what you liked best about your education at CSU Stanislaus.
6.9% Generalized Affirmation. Expressions of Satisfaction and Praise. 2.1% Generalized Critique. Expressions of Disappointment and Blame.
38.3% Academic Experience - Faculty and Teaching 12.0% Academic Experience - Class Size, Availability and Access to Courses 9.2% Campus Size and Appearance 6.5% Classmates, Interactions, Friendships 4.6% Campus Location and Accessibility 4.6% Campus Climate 3.4% Academic Experience - Experience with Departments 2.1% Campus - Stockton Center 1.9% Academic Experience - Support Services, Counseling, Advising, Tutoring, Orientation 1.9% Op-Ed Pieces, Personal Reflections, Advice to Others 1.6% Student Services - Employment, Programs 1.8% Cost of Attendance 1.0% Academic Experience - Library 0.6% Academic Experience - Preparation for Grad School 0.6% Distance Learning 0.6% Student Activities - ASI, clubs, sports, etc. 0.6% Academic Experience - Research, Internships, etc. 0.4% Student Services - Housing
1.38 Average number coded categories per response 491 Number of coded responses

Graduating Senior Survey Report, Class of 2003-2004 Office of Institutional Research, December 2005
Page 58
Comments Question 26. If you could make one improvement at CSU Stanislaus, what would it be?
16.1% Increase the availability of classes 11.6% Improve the quality of advising/orientation 10.0% Improve the quality of instruction 9.0% Parking and transportation 8.8% Improve administrative services 5.8% Career placement assistance 5.6% Stockton Campus issues 4.4% Improve classroom facilities/technology 4.2% Social activities 3.8% Library 3.6% Greater effort to support diversity/outreach 3.6% Improve entire degree program 3.2% Change general education or other academic requirements 3.2% More hands-on classes, internships, research opportunities 3.0% Keep fees/costs down, other financial issues 2.8% Encourage student involvement 2.0% Increase/improve faculty availability, interaction, involvement 1.6% Bookstore 1.6% Cafeteria/food service 1.4% Online/distance learning courses 1.0% Computer lab 0.8% Create a more positive environment 0.8% Football team 0.6% Public Safety issues 0.4% Reduce class size 0.4% Have less campus construction, reduce noise and disruption 0.4% Improve services for transfer/older/disabled students 0.2% Increase the availability of tutoring services 0.2% Student housing issues
1.10 Average number coded categories per response 498 Number of coded responses
California State University, Stanislaus Institutional Research
801 West Monte Vista Avenue Turlock, California 95382
209.667.3281 [email protected]
http://ir.csustan.edu
Acting Manager Gary Lowe
Research Technician
Ling Zhao
Administrative Analyst Lisa Saucedo
Administrative Coordinator
Nancy Marchbanks
Cover and interior photographs provided by University Communications.