gotsch, sybil
TRANSCRIPT

Life in the treetops: Ecophysiological strategies in canopy epiphyte communities along a microclimate gradient in the tropical montane cloud forest
Sybil G. Gotsch1, Nalini Nadkarni2, Alexander Darby1, Andrew Glunk1, Mackenzie
Dix1, Kenneth Davidson1, Todd Dawson3
1Department of Biology, Franklin and Marshall College, Lancaster, PA, USA 2 Department of Biology, University of Utah, Salt Lake City, UT, USA 3 Department of Integrative Biology, University of California at Berkeley, CA, USA

Tropical Montane Cloud Forests (TMCF) • Highland forests in the tropics that are frequently
covered in clouds or mist • Exceedingly high biodiversity and endemism • Important role in local and regional hydrology

Role of Epiphyte Community in Ecosystem Processes in the TMCF
• 5-20% of water inputs due to water stripping from clouds • Epiphytes play major role in interception of cloud water • Up to half total nutrient pool in canopy may be due to
epiphytes • Dependence on cloud water may make these
communities very vulnerable to changes in climate
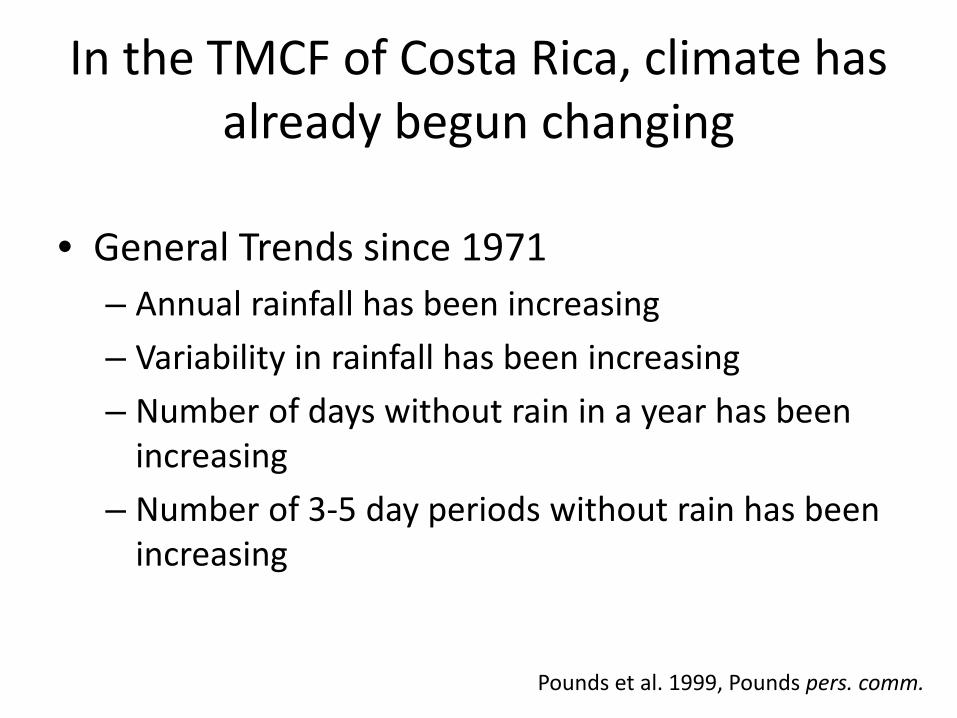
In the TMCF of Costa Rica, climate has already begun changing
• General Trends since 1971 – Annual rainfall has been increasing – Variability in rainfall has been increasing – Number of days without rain in a year has been
increasing – Number of 3-5 day periods without rain has been
increasing
Pounds et al. 1999, Pounds pers. comm.
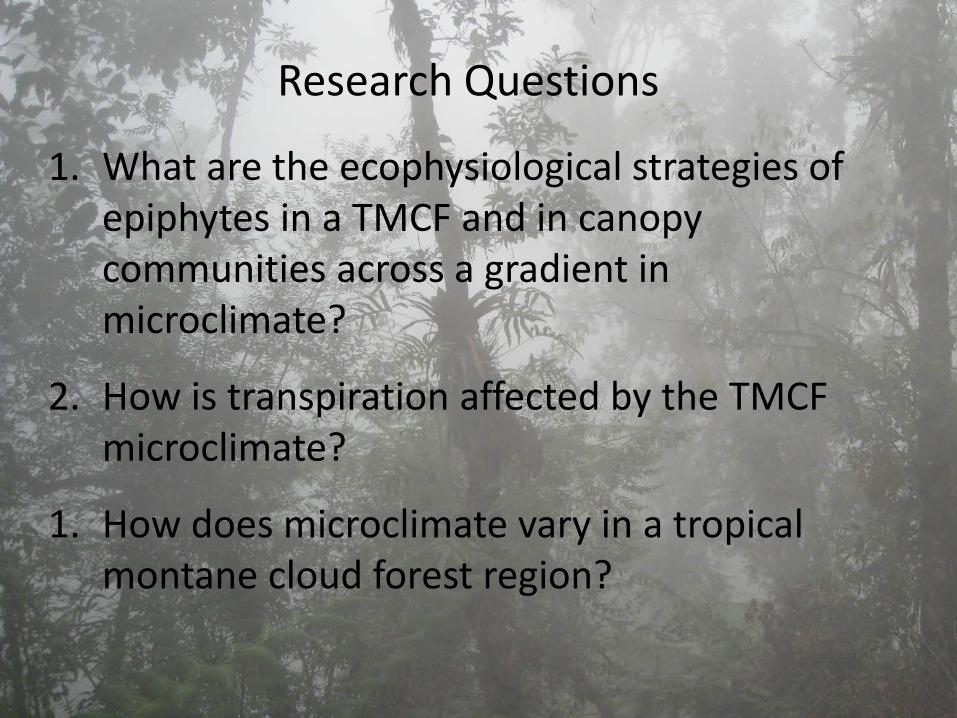
1. What are the ecophysiological strategies of
epiphytes in a TMCF and in canopy communities across a gradient in microclimate?
2. How is transpiration affected by the TMCF microclimate?
1. How does microclimate vary in a tropical montane cloud forest region?
Research Questions

The TMCF of Monteverde, Costa Rica
• Elevation 1480-1500 m • Rainfall 3000-5000mm • 500-2000mm of cloud
water inputs
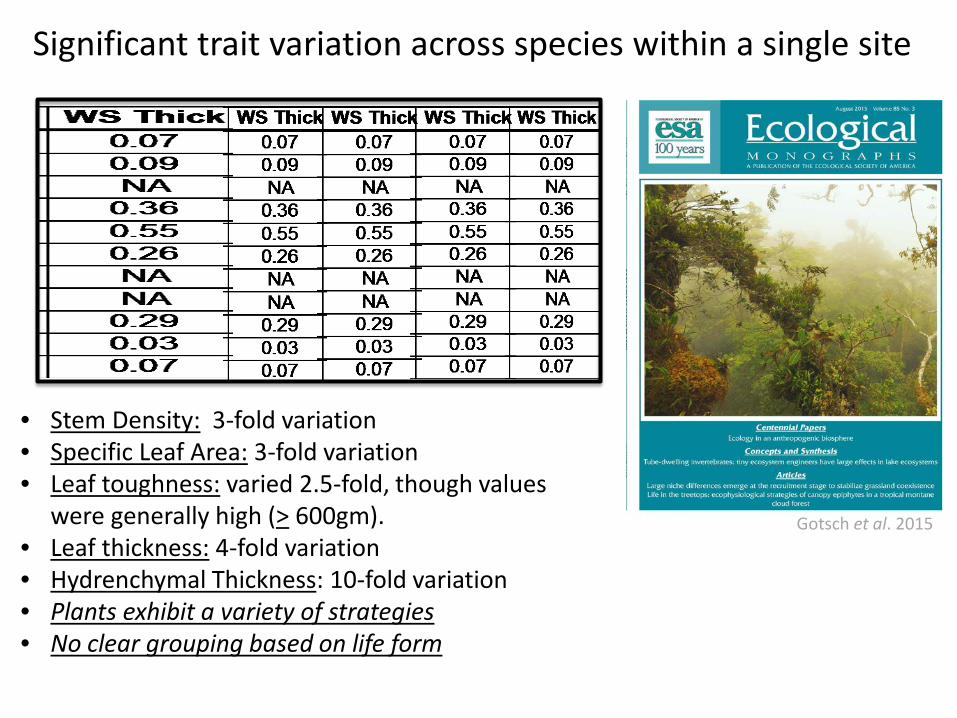
Significant trait variation across species within a single site
• Stem Density: 3-fold variation • Specific Leaf Area: 3-fold variation • Leaf toughness: varied 2.5-fold, though values
were generally high (> 600gm). • Leaf thickness: 4-fold variation • Hydrenchymal Thickness: 10-fold variation • Plants exhibit a variety of strategies • No clear grouping based on life form
Gotsch et al. 2015

• Clear diurnal patterns during sunny periods following rain
• FWU occurs
when leaves are wet
• Variation
across species

Dry Season Foliar Water Uptake in the Monteverde Cloud Forest Reserve
What are the drivers of sap flow in epiphytes??
Hierarchical linear model, parameters included: vapor pressure deficit, air temperature, leaf wetness, wind speed, soil moisture, soil temperature, visibility and solar radiation 1. Overall Transpiration: Canopy soil water most important driver
• More transpiration when soil well hydrated 2. Foliar water uptake: Precipitation most important driver
• More FWU during rainy periods 3. Nighttime flow: Visibility most important driver.
• Less NF during clear nights, more NF during cloudy nights • NF likely refilling in epiphytes rather than transpiration Darby et al. in prep

How do epiphyte communities under, in and above the clouds function differently?

Measurements Microclimate: Canopy station-air temp/RH, leaf wetness, soil moisture/temp, wind speed/direction
Plant-based measures (1425 samples to date) • Functional Trait Analysis: stem density,
specific leaf area, leaf dry matter content, leaf toughness, stomatal density
• Anatomical measures: Leaf thickness, cuticle thickness, hydrenchymal thickness
• Water relations: turgor loss point, bulk elastic modulus, relative water content at the TLP, etc.
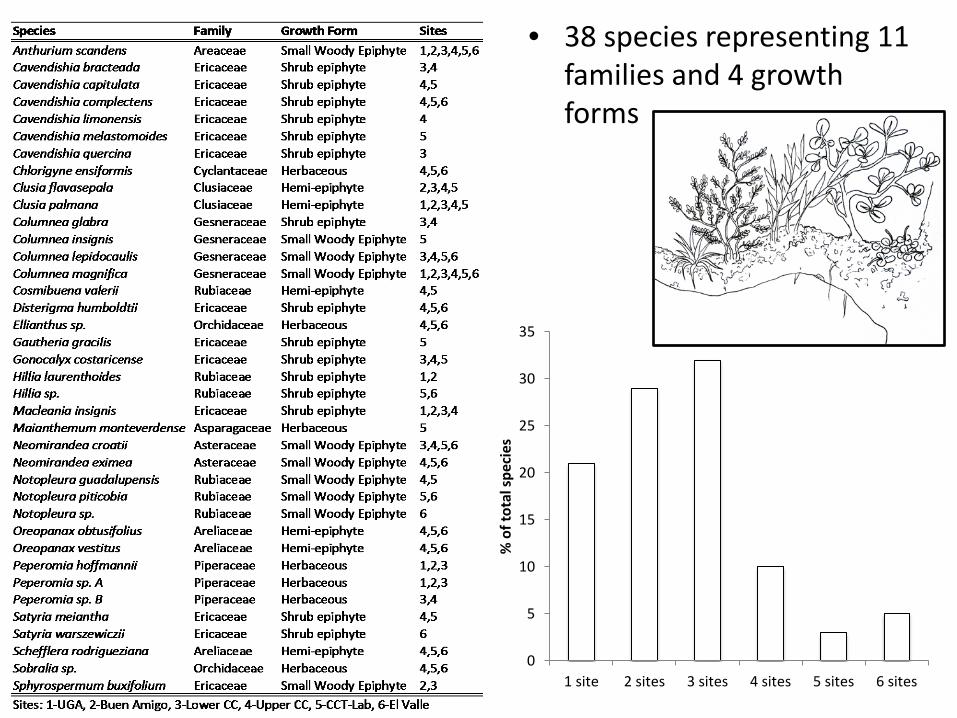
• 38 species representing 11 families and 4 growth forms
0
5
10
15
20
25
30
35
1 site 2 sites 3 sites 4 sites 5 sites 6 sites
% o
f tot
al sp
ecie
s

Variation in Microclimate

Variation in Traits
• Functional Traits: – Toughness, generally high (>
750 g) but no clear trend in variation
– SLA/LDMC/WD little variation across sites
• Water Relations Traits – Many traits tend to vary in a
predictable pattern across the gradient
Photo Credit: Eric Stearley

0
20
40
60
80
100
120
140
UGA BuenAmigo
Lower CC Upper CC CCT-Lab El Valle
Sto
mat
al D
ensit
y (s
tom
./m
m^2
)
-1.8
-1.6
-1.4
-1.2
-1
-0.8
-0.6
-0.4
-0.2
0UGA Buen
AmigoLower CC Upper CC CCT-Lab El Valle
ΨTL
P (M
Pa)
74
76
78
80
82
84
86
88
90
92
UGA BuenAmigo
Lower CC Upper CC CCT-Lab El Valle
RWC
at th
e TL
P (%
)
0
0.1
0.2
0.3
0.4
0.5
0.6
0.7
UGA BuenAmigo
Lower CC Upper CC CCT-Lab El Valle
Hydr
ench
ymal
thic
knes
s (m
m)
Interspecific Variation in Water Relations Traits
Plants in drier sites are more succulent AND have lower turgor loss points

0
10
20
30
40
50
60
70
80
90
100
UGA Buen Amigo Lower CC
Mea
n St
omat
al D
ensit
y (S
tom
ata/
mm
^2)
0
0.1
0.2
0.3
0.4
0.5
0.6
0.7
0.8
UGA Buen Amigo Lower CC
Mea
n To
tal H
ydro
(mm
)
Intraspecific variation across the three driest sites (Anthurium scandens, Clusia palmana, Peperomia sp, Macleanea insignis, Peperomia hoffmannii)
In the wettest three sites, no clear pattern across sites. SD generally higher.
-1.8
-1.6
-1.4
-1.2
-1
-0.8
-0.6
-0.4
-0.2
0
UGA Buen Amigo Lower CC
ΨTL
P (M
Pa)
76
78
80
82
84
86
88
90
UGA Buen Amigo Lower CC
Rela
tive
Wat
er C
onte
nt a
t th
e TL
P (%
)
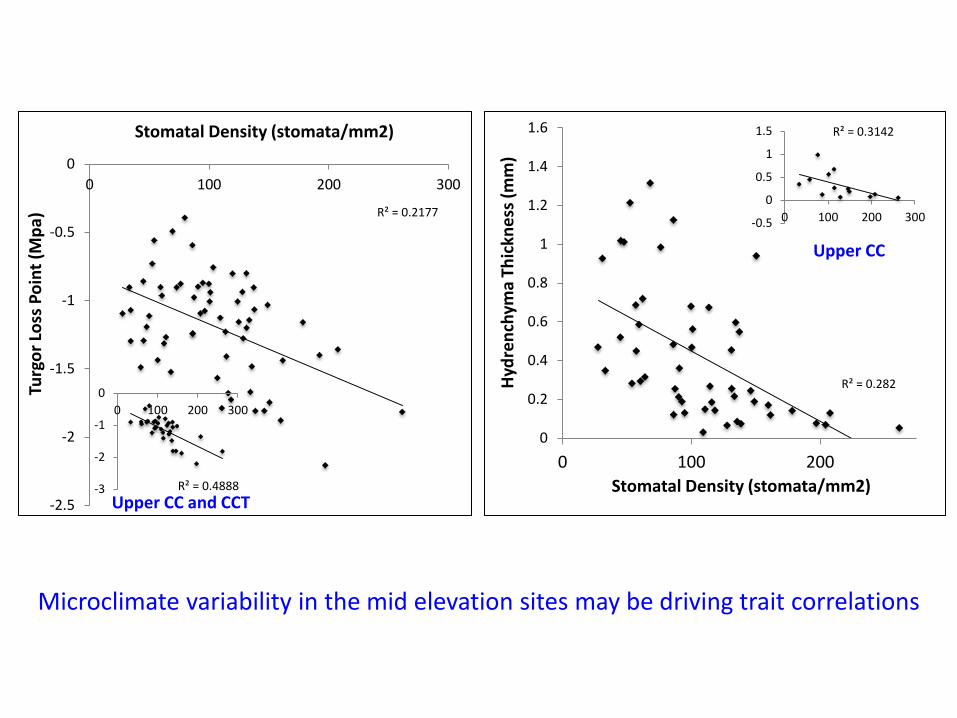
R² = 0.2177
-2.5
-2
-1.5
-1
-0.5
00 100 200 300
Turg
or Lo
ss P
oint
(Mpa
)
Stomatal Density (stomata/mm2)
R² = 0.282
0
0.2
0.4
0.6
0.8
1
1.2
1.4
1.6
0 100 200
Hydr
ench
yma
Thic
knes
s (m
m)
Stomatal Density (stomata/mm2) R² = 0.4888 -3
-2
-1
00 100 200 300
R² = 0.3142
-0.5
0
0.5
1
1.5
0 100 200 300
Upper CC and CCT
Upper CC
Microclimate variability in the mid elevation sites may be driving trait correlations

What have we learned from the epiphyte community?
• Transpiration is very responsive to changes in atmospheric conditions
• Foliar uptake occurs frequently and comprises a significant portion of whole plant water balance
• Parameters that relate to habitat moisture are the most important drivers of sap flow.
• Variation in water relations traits indicate that the epiphyte community in drier sites can both avoid and withstand drought better than in wetter sites.
• Trait relationships maybe driven by variation in microclimate in the mid-elevation sites
Next Steps
• Dry season sap flow in three sites along the gradient • Dry season leaf water potentials • Quantification of abundance via biomass in all six sites • Dry-down experiment on common species from three
sites to link traits with drought resilience


0
20
40
60
80
100
120
UGA BuenAmigo
Lower CC Upper CC Reserve El Valle
Epip
hyte
Abu
ndan
ce (%
)
UGA
Lower CC Reserve