gosat data products generated in collaborative effort with ... · gosat data products generated in...
TRANSCRIPT

0
NOAA ESRL GLOBAL MONITORING ANNUAL CONFERENCE 2015
@ NOAA ESRL, Boulder, CO USA, May 19, 2015
Dec. 17, 2008
GOSAT Data Products Generated in Collaborative Effort with
NOAA/GMD
Tatsuya Yokota*, Y. Yoshida*, M. Inoue*, I. Morino*, O. Uchino*, H. Takagi*, H. Kim*, M. Saito*, S. Maksyutov*, M. Ajiro*, TCCON
Partners and CONTRAIL Members*National Institute for Environmental Studies (NIES), Japan
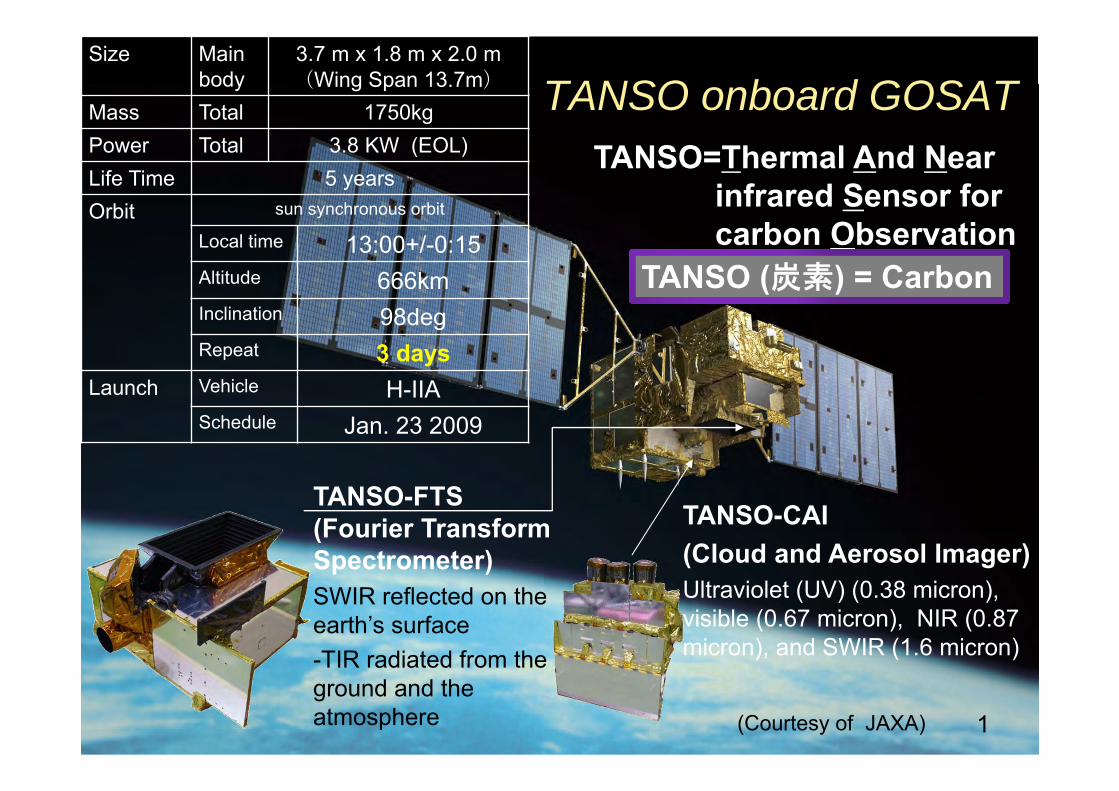
TANSO onboard GOSAT TANSO=Thermal And Near
infrared Sensor for carbon Observation
Size Main body
3.7 m x 1.8 m x 2.0 m(Wing Span 13.7m)
Mass Total 1750kgPower Total 3.8 KW (EOL)Life Time 5 yearsOrbit sun synchronous orbit
Local time 13:00+/-0:15Altitude 666kmInclination 98degRepeat 3 days
Launch Vehicle H-IIASchedule Jan. 23 2009
TANSO-CAI(Cloud and Aerosol Imager)Ultraviolet (UV) (0.38 micron), visible (0.67 micron), NIR (0.87 micron), and SWIR (1.6 micron)
TANSO-FTS(Fourier Transform Spectrometer)SWIR reflected on the earth’s surface-TIR radiated from the ground and the atmosphere (Courtesy of JAXA) 1
TANSO (炭素) = Carbon

2
Objectives of the GOSAT Project
1. To obtain the global distributions of greenhouse gas (GHG) concentrations (CO2 and CH4) and their temporal variations To visualize changing GHG global distributions To fill out the gaps in the network of ground monitoring
stations2. To improve accuracy (decrease uncertainty) of
the carbon flux (net sources and sinks) estimation on a sub-continental scale
3. To develop technologies for future GHG observing satellite ⇒ GOSAT-2

3
GOSAT Project –present status -
GOSAT was launched on January 23, 2009 and has been in operation for more than five years.
GOSAT observations successfully filled out the gaps in the ground-based monitoring network, except for around the equator and the high-latitude regions.
Uncertainties in monthly regional flux estimates of CO2and CH4 have been decreased by using GOSAT data.
Initial Check-out
PeriodInitial Cal./Val.
Operation Nominal Operation Extended Operation
Critical Operation(2 days)
Launch (L)2009.1.23
L+3 mo. L+6 mo. L+5 yrs2014.1.23
Nominal Operation Period
present 3

4
Records of the GOSAT Observation Locations for Valid Data Retrieved
Locations of GHG monitoring stations (from WDCGG, as of May. 11, 2015)Total: 330CO2 measurement: 226CH4 measurement: 213
The number of GOSAT Level2 (Ver. 2) XCO2data in a year (2009.6-2010.5).Red-white : 200 – 1000 data/yearGreen-orange: 20 – 100 data/yearBlue : 0 – 10 data/year
Satellites can fill the gaps in the ground-based monitoring network with several exceptions.
Takagi et al (2011).(by H/ Takagi (NIES))

5
TANSO-FTS SWIR Level 2 (V02.21) XCO2 & XCH4
XCO2
XCH4
(by Y. Yoshida (NIES))
April 2009 - May 2014

6
55-month-long GOSAT XCO2 and XCH4(June 2009 – December 2013)
Above movies are 1-month-moving average GOSAT XCO2 and XCH4with three-day interval. The mesh size is 2.5 degree.
Various interesting features are shown in these movies such as annual and seasonal variations of XCO2 and localized anomalies of XCH4.
GOSAT obtained XCO2 and XCH4 data for more than 6 years. Validation results suggest that relative accuracies (variations) of XCO2 and XCH4are ≈ 2 ppm (≈ 0.5%) and 12 ppb (≈ 0.7%), respectively.

A worldwide network of ground-based FTS
(TCCON; over 20 sites in the world)
Tsukuba, Rikubetsu, Saga
Aircraft measurements
7
Ground-based high-resolution FTS
in NIES (Tsukuba)
Schematic illustration of the GOSAT validationMorino et al. (2011, AMT)Yoshida et al. (2013, AMT)

8
Observation sites used in this study
CONTRAIL: continuous measurementsNOAA, DOE, NIES, NIES‐JAXA: Flask sampling
・ CONTRAIL data (Machida et al., 2008): 20 sites (2007 - 2010)
・ NOAA/DOE data: 17 sites (2007 - 2011)・ NIES data: 4 sites (2008 - 2010)・ HIPPO data: 5-6 sites (2009 - 2010)・ NIES-JAXA campaign data: 1 site (2010)
Aircraft measurement by CONTRAIL, NOAA, DOE, NIES, HIPPO and NIES-JAXA
A paper for basic parts on profiles to derive X : Araki et al. (2010, ACP) Miyamoto et al. (2013, ACP)
Uncertainty in calculating XCO2 ~ 1 ppm
Uncertainty in calculating XCH4 ~ 15 ppbMeasurement uncertainty in CH4 ~ 2 ppb
CO2 (47 sites)
CH4 (28 sites)
Inoue et al. (2013, ACP)
Measurement uncertainty in CO2 ~ 0.2 ppm
CONTRAIL (JAL project)

XCO2 and XCH4 calculation from aircraft data
Alt.
Ground
85 km
tropopause(NCEP)
observation
constant
CO2 or CH4 mixing ratio
Tower data or constant
0.1~0.5km
6~12km
ACTM (CO2)ACE/HALOE (CH4)
PBL (NCEP)
Stratospheric and mesospheric profileFor XCO2, ACTM* model outputs (Patra et al., 2009) were used. For XCH4, Atmospheric Chemistry Experiment (ACE, Jones et al., 2011) and Halogen Occultation Experiment (HALOE, Grooß and Russell, 2005) are used.
Near the surfaceComplemented by meteorological tower data or extrapolated as a constant value to ground.
km
km
kair
km
km
iair
i
N
NCOXCO 85
0
)(
85
0
)()(2
2
][ [CO2](i) : CO2 ratio of i‐th layer[CH4](i) : CH4 ratio of i‐th layerNair
(i) : Dry air number density of i‐th layer
km
km
kair
km
km
iair
i
N
NCHXCH 85
0
)(
85
0
)()(4
4
][
Miyamoto et al. (2013, ACP); Inoue et al. (2014, AMT) 9
Below tropopauseIf observing range below tropopause, the value measured at highest altitude was extended to the tropopause.
*ACTM: AGCM-based Chemistry Transport Model (by I. Morino & O. Uchino (NIES))

10
GOSAT vs Aircraft
Land: 74 Ocean: 11-0.68±2.56 ppm -1.82±1.04 ppm
Aircraft XCO2 (ppm)
GO
SAT
XCO
2 (p
pm)
GO
SAT
XCO
2 (p
pm)
±2 deg. ±5 deg.
GO
SAT
XCO
2 (p
pm)
GO
SAT
XCO
2 (p
pm)
r=0.85 r=0.96
r=0.86 r=0.82
XCO2
Land: 182 Ocean: 40-0.99±2.51 ppm -2.27±1.79 ppm
Aircraft XCO2 (ppm)Inoue et al. (2013, ACP)
XCH4
Aircraft XCH4 (ppb)
GO
SAT
XCH
4 (p
pb)
Aircraft XCH4 (ppb)
GO
SAT
XCH
4 (p
pb)
Land: 102 Ocean: 102.0±16.0 ppb 6.5±8.8 ppb
Land: 43 Ocean: 31.5±14.9 ppb 4.1±9.4 ppb
r=0.61 r=0.64 r=0.93
Inoue et al. (2014, AMT)
GOSAT
Aircraft site
(by I. Morino & O. Uchino (NIES))

11
Contribution of satellite data to carbon flux
estimation

12
Input to GOSAT Level 4 regional flux estimation (CO2 v02.03 released in Jan. 2015)
GOSAT Level 2 XCO2 v02.11 GLOBALVIEW-CO2 2013 (GV)
Biases were corrected based on validation result
XCO2 retrievals were gridded to 5×5 cells and monthly-averaged
Cells with N<3 per month were not used
Data from 212 sites were monthly-averaged
Input to inverse modeling
Combined
GOSAT XCO2 retrievals compliment GV data

July 2012July 2011July 2010
Monthly CO2 Flux Estimates and Uncertainties
13
Top: monthly-mean CO2 data (input to flux estimation)Squares: GOSAT XCO2 gridded to 5°×5° cellsCircles: GLOBALVIEW data (212 sites)
Middle: Monthly flux estimate (GOSAT Level 4A CO2), Bottom: Flux uncertainty
(by H. Takagi (NIES))

14
Time series of monthly regional flux estimates Jun. 2009 – Oct. 2012 (41 months)
Green: Prior estimate Red: Posterior estimate by GV onlyBlue:Posterior estimate by GV + GOSATUnit: gC m-2 day-1
Gray bar: Flux uncertainty reduction (%)
Upp
er
Low
er Red: Flux unc. (GV-only estimate)Blue: Flux unc. (GV +GOSAT estimate)
(by H. Takagi (NIES))

1515
GOSAT CH4 inverse modeling, H. Kim & S. Maksyutov, NIES
cf). GOSAT L4 CH4 product release note (http://data.gosat.nies.go.jp)
WDCGG
The World Data Centre for Greenhouse Gases (WDCGG)

16
Location of CH4 measurement sites used in GOSAT L4 CH4 (v01.02)
●NOAA× Others
●
●
●
●
●
●
●
● ● ●●
●●
●●●
●●●
●●
●●
●
●
●
●
●
●
●
●
●
●
●●
●
●
●
●
●
●
●
●●
●
●
●
●
●●
●●
●●
●●
●
●
●
●
●
We are using CH4 monitoring data via the World Data Centre for Greenhouse Gases (WDCGG) site. Many of them are originated from the NOAA ESRL/GMD.

January 2012January 2011January 2010
Monthly CH4 Flux Estimates and Uncertainties
17
Top: monthly-mean GOSAT XCH4 data gridded to 2.5º×2.5º mesh (input to flux estimation)Middle: Monthly flux estimates (GOSAT Level 4A CH4) Bottom: Flux uncertainty * Anthropogenic, natural, and biomass burning
emissions are estimated separately for each region.

18
Concluding Remarks
GOSAT Project has released almost all of its standard data products to registered researchers and the general public.
The GOSAT Level 2 XCO2 and XCH4 data products have been validated with TCCON FTS data, NOAA and DOE airborne data, CONTRAIL data, and other reference data.
The Level 4A CO2 and CH4 data product (monthly regional source-sink estimates) have been generated with GOSAT Level 2 data, selected GlobalView data, and NOAA ESRL/GMD observational data provided via the WDCGG.
In this way, the six-year-long GHG observation by GOSAT have been performed by collaborative effort with the ESRL/GMD groups in data validation and surface flux estimation. We express special thanks to the NOAA ESRL/GMD members.