goldman stanley goldman stanley, inc. confidential draft project jaguar presentation to the board of...
TRANSCRIPT

Goldman Stanley
Goldman Stanley, Inc.
Confidential Draft
Project Jaguar
Presentation to the Board of Directors
May 10, 2014

Goldman Stanley
Table Of Contents
Executive Summary 3
Jaguar Valuation 5
Potential Strategic Partners 19
Process Recommendations 22
Appendix 25
2
Goldman Stanley
Executive Summary
3

Goldman Stanley
Executive Summary
• As of May 9, 2014, Jaguar’s share price and valuation multiples have more than doubled over the last twelve months
• Even at its current levels, however, Jaguar is still undervalued relative to peer specialty pharmaceutical companies, and on an intrinsic, cash flow basis
• Given its prominence in the market, the record healthcare M&A activity in the first half of this year, and the soaring interest in “tax inversion” deals, Jaguar could make for an attractive acquisition candidate
• Such a strategy would allow Jaguar to maximize shareholder value, expand its geographic reach and distribution channels, and acquire more resources for future research & development efforts and/or M&A activity
• Given Jaguar’s unique attributes, we believe a purchase premium above 50%, implying a share price of ~$200+, is possible with the proper positioning and process
• We recommend a highly targeted process focused on the most likely (“Tier 1”) potential partners, along with an outreach to Tier 2 potential partners while discussions with Tier 1 partners are ongoing
4
Goldman Stanley
Jaguar Valuation
5
Goldman Stanley
Valuation Summary
• Since management’s view of Jaguar differs significantly from the “Street” view (research analyst consensus), we considered two scenarios in this analysis:
“Base Case”: Closely matches consensus view of Jaguar; Xyrem revenue grows to $2.0 billion in FY 20 before declining to $300 million thereafter
Management Case: Xyrem revenue grows to $4.2 billion in FY 21 before declining to $400 million thereafter
Key Differences: Xyrem generics entrance in FY 21, 50% lower annual price increases, and 20% lower market penetration assumed in Base Case
Other Notes: EBITDA margin steady at 48-52% in both cases; CapEx and Working Capital are similar percentages of revenue/expense line items
• Under the Management Case projections, Jaguar appears to be undervalued by 50%+; under the Base Case projections, it might be undervalued by 20-30%
• Comparable public companies and the discounted cash flow (DCF) analysis imply largely the same result
• Precedent Transactions imply a much lower implied valuation, but the multiples there are less relevant because of a number of older / less comparable deals
6

Goldman Stanley
ProjectedIncome Statement: FY14 FY15 FY16 FY17 FY18 FY19 FY20 FY21 FY22 FY23
Revenue:Existing Products:
Xyrem Sales: 578.6$ 766.6$ 975.1$ 1,205.9$ 1,447.1$ 1,709.4$ 1,975.3$ 276.3$ 301.4$ 301.4$ Erwinaze Sales: 203.4 234.2 266.6 300.7 336.7 346.8 385.8 397.3 439.6 452.7 Defitelio Sales: 57.8 79.8 107.1 140.7 182.0 209.3 240.7 276.9 318.4 366.1 Other Sales and Royalties: 142.0 156.2 168.7 182.1 193.1 204.7 214.9 225.6 234.7 244.0
Risk-Adjusted Pipeline Drug Sales:JZP-110 Sales: - - - 18.1 43.4 76.9 88.9 135.6 152.3 196.1 JZP-386 Sales: - - - - - - - - - -
Total Revenue: 981.8 1,236.7 1,517.4 1,847.6 2,202.3 2,547.1 2,905.6 1,311.7 1,446.4 1,560.5 Revenue Growth: 12.5% 26.0% 22.7% 21.8% 19.2% 15.7% 14.1% (54.9%) 10.3% 7.9%
Operating Income (EBIT): 248.4 529.2 663.1 812.5 971.9 1,134.6 1,281.1 518.0 576.4 624.9 Operating (EBIT) Margin: 25.3% 42.8% 43.7% 44.0% 44.1% 44.5% 44.1% 39.5% 39.9% 40.0%
Net Income: 163.8$ 402.7$ 512.5$ 651.4$ 782.1$ 930.2$ 1,050.5$ 424.8$ 472.7$ 512.4$ Effective Tax Rate: 18.0% 18.0% 18.0% 18.0% 18.0% 18.0% 18.0% 18.0% 18.0% 18.0%
Weighted Average Diluted Shares Outstanding: 61.6 61.6 61.6 61.6 61.6 61.6 61.6 61.6 61.6 61.6Diluted Earnings Per Share (EPS): 2.66$ 6.54$ 8.32$ 10.58$ 12.70$ 15.11$ 17.06$ 6.90$ 7.68$ 8.32$
EBITDA: 508.8$ 661.6$ 794.0$ 947.2$ 1,107.7$ 1,258.2$ 1,410.8$ 633.1$ 694.4$ 745.9$ EBITDA Margin: 51.8% 53.5% 52.3% 51.3% 50.3% 49.4% 48.6% 48.3% 48.0% 47.8%
Base Case Financial Projections
7
($ in Millions Except Per Share Data)

Goldman Stanley
ProjectedIncome Statement: FY14 FY15 FY16 FY17 FY18 FY19 FY20 FY21 FY22 FY23
Revenue:Existing Products:
Xyrem Sales: 773.7$ 1,083.1$ 1,455.7$ 1,902.2$ 2,391.3$ 2,959.2$ 3,551.1$ 4,218.7$ 376.8$ 376.8$ Erwinaze Sales: 203.4 234.2 266.6 300.7 336.7 346.8 385.8 397.3 439.6 452.7 Defitelio Sales: 57.8 79.8 107.1 140.7 182.0 209.3 240.7 276.9 318.4 366.1 Other Sales and Royalties: 142.0 156.2 168.7 182.1 193.1 204.7 214.9 225.6 234.7 244.0
Risk-Adjusted Pipeline Drug Sales:JZP-110 Sales: - - - 28.5 71.7 133.2 159.8 253.1 292.7 387.8 JZP-386 Sales: - - - - - - - - - -
Total Revenue: 1,176.9 1,553.3 1,998.0 2,554.3 3,174.8 3,853.2 4,552.3 5,371.6 1,662.1 1,827.6 Revenue Growth: 34.9% 32.0% 28.6% 27.8% 24.3% 21.4% 18.1% 18.0% (69.1%) 10.0%
Operating Income (EBIT): 348.7 697.0 911.7 1,169.9 1,453.2 1,768.0 2,064.2 2,432.8 677.4 749.1 Operating (EBIT) Margin: 29.6% 44.9% 45.6% 45.8% 45.8% 45.9% 45.3% 45.3% 40.8% 41.0%
Net Income: 246.0$ 540.3$ 716.3$ 944.5$ 1,176.8$ 1,449.6$ 1,692.6$ 1,994.9$ 555.5$ 614.3$ Effective Tax Rate: 18.0% 18.0% 18.0% 18.0% 18.0% 18.0% 18.0% 18.0% 18.0% 18.0%
Weighted Average Diluted Shares Outstanding: 61.6 61.6 61.6 61.6 61.6 61.6 61.6 61.6 61.6 61.6Diluted Earnings Per Share (EPS): 4.00$ 8.78$ 11.63$ 15.34$ 19.11$ 23.54$ 27.49$ 32.40$ 9.02$ 9.98$
EBITDA: 609.9$ 830.9$ 1,045.5$ 1,309.5$ 1,596.8$ 1,903.3$ 2,210.4$ 2,592.5$ 798.0$ 873.5$ EBITDA Margin: 51.8% 53.5% 52.3% 51.3% 50.3% 49.4% 48.6% 48.3% 48.0% 47.8%
Management Case Financial Projections
8
($ in Millions Except Per Share Data)

Goldman Stanley 9
($ in Millions Except Per Share Data)
Valuation Summary – Base Case
$0.00 $50.00 $100.00 $150.00 $200.00 $250.00
7.0% - 9.0% Discount Rate, (1.0%) - 1.0% Terminal FCF Growth Rate:
LTM EV / EBITDA:LTM EV / Revenue:
12/31/2015E Reported P / E:12/31/2014E Reported P / E:
LTM Reported P / E:12/31/2015E EV / EBITDA:12/31/2014E EV / EBITDA:
LTM EV / EBITDA:12/31/2015E EV / Revenue:12/31/2014E EV / Revenue:
LTM EV / Revenue:
25th to MedianMedian to 75th
Public Company Comparables:
Discounted Cash Flow Analysis:
Jaguar Current Share Price
Precedent Transactions:
• All market data as of May 9, 2014
• Given that Jaguar’s revenue growth, EBITDA growth, and EBITDA margins exceed those of its peer companies, we believe a valuation in the 75th percentile to maximum of the set is justified

Goldman Stanley 10
($ in Millions Except Per Share Data)
Valuation Summary – Management Case
7.0% - 9.0% Discount Rate, (1.0%) - 1.0% Terminal FCF Growth Rate:
LTM EV / EBITDA:LTM EV / Revenue:
12/31/2015E Reported P / E:12/31/2014E Reported P / E:
LTM Reported P / E:12/31/2015E EV / EBITDA:12/31/2014E EV / EBITDA:
LTM EV / EBITDA:12/31/2015E EV / Revenue:12/31/2014E EV / Revenue:
LTM EV / Revenue:Public Company Comparables:
Discounted Cash Flow Analysis:
Jaguar Current Share Price
Precedent Transactions:
• All market data as of May 9, 2014
• The rest of this discussion will utilize the Management Case projections; here, these figures imply a valuation closer to $200 per share
$0.00 $50.00 $100.00 $150.00 $200.00 $250.00 $300.00
Implied Share Price
25th to MedianMedian to 75th

Goldman Stanley
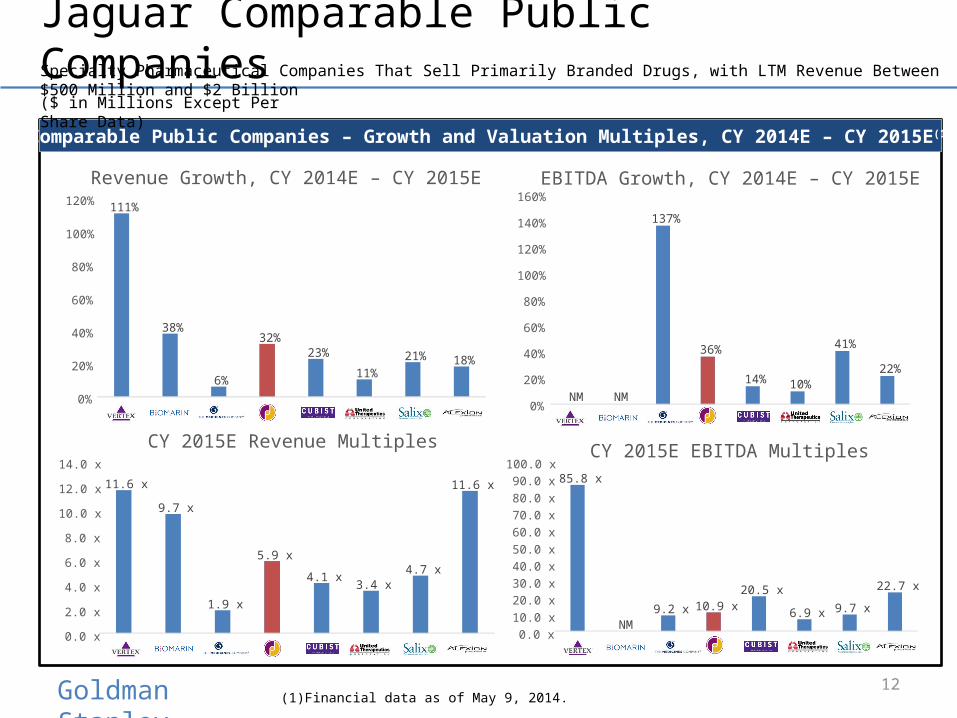
Jaguar Comparable Public Companies
Comparable Public Companies – Revenue and EBITDA, CY 2014E – CY 2015E
11
($ in Millions Except Per Share Data)
Specialty Pharmaceutical Companies That Sell Primarily Branded Drugs, with LTM Revenue Between $500 Million and $2 Billion
CY 2014E Revenue
CY 2015E Revenue
$0.0 B
$0.5 B
$1.0 B
$1.5 B
$2.0 B
$2.5 B
$3.0 B
($0.6 B)
($0.4 B)
($0.2 B)
$0.0 B
$0.2 B
$0.4 B
$0.6 B
$0.8 B
$1.0 B
$1.2 B
$1.4 B
CY 2014E EBITDA
CY 2015E EBITDA
Goldman Stanley
Jaguar Comparable Public Companies
Comparable Public Companies – Growth and Valuation Multiples, CY 2014E – CY 2015E (1)
12(1) Financial data as of May 9, 2014.
($ in Millions Except Per Share Data)
Specialty Pharmaceutical Companies That Sell Primarily Branded Drugs, with LTM Revenue Between $500 Million and $2 Billion
111%
38%
6%
32%23%
11%21% 18%
0%
20%
40%
60%
80%
100%
120%
Revenue Growth, CY 2014E – CY 2015E
11.6 x
9.7 x
1.9 x
5.9 x
4.1 x3.4 x
4.7 x
11.6 x
0.0 x
2.0 x
4.0 x
6.0 x
8.0 x
10.0 x
12.0 x
14.0 x
CY 2015E Revenue Multiples
NM NM
137%
36%
14% 10%
41%
22%
0%
20%
40%
60%
80%
100%
120%
140%
160%EBITDA Growth, CY 2014E – CY 2015E
85.8 x
NM9.2 x 10.9 x
20.5 x
6.9 x 9.7 x
22.7 x
0.0 x10.0 x20.0 x30.0 x40.0 x50.0 x60.0 x70.0 x80.0 x90.0 x
100.0 xCY 2015E EBITDA Multiples
Goldman Stanley
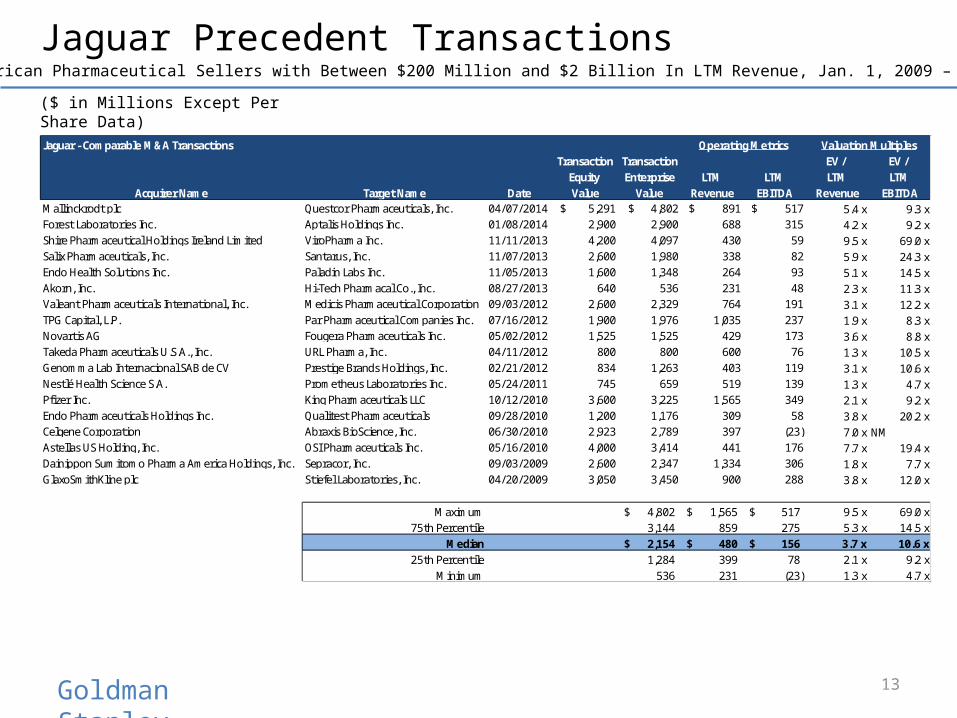
Jaguar Precedent Transactions
13
North American Pharmaceutical Sellers with Between $200 Million and $2 Billion In LTM Revenue, Jan. 1, 2009 – May 9, 2014
($ in Millions Except Per Share Data)
Jaguar - Comparable M&A Transactions Operating Metrics Valuation MultiplesTransaction Transaction EV / EV /
Equity Enterprise LTM LTM LTM LTMAcquirer Name Target Name Date Value Value Revenue EBITDA Revenue EBITDA
Mallinckrodt plc Questcor Pharmaceuticals, Inc. 04/07/2014 $ 5,291 $ 4,802 $ 891 $ 517 5.4 x 9.3 xForest Laboratories Inc. Aptalis Holdings Inc. 01/08/2014 2,900 2,900 688 315 4.2 x 9.2 xShire Pharmaceutical Holdings Ireland Limited ViroPharma Inc. 11/11/2013 4,200 4,097 430 59 9.5 x 69.0 xSalix Pharmaceuticals, Inc. Santarus, Inc. 11/07/2013 2,600 1,980 338 82 5.9 x 24.3 xEndo Health Solutions Inc. Paladin Labs Inc. 11/05/2013 1,600 1,348 264 93 5.1 x 14.5 xAkorn, Inc. Hi-Tech Pharmacal Co., Inc. 08/27/2013 640 536 231 48 2.3 x 11.3 xValeant Pharmaceuticals International, Inc. Medicis Pharmaceutical Corporation 09/03/2012 2,600 2,329 764 191 3.1 x 12.2 xTPG Capital, L.P. Par Pharmaceutical Companies Inc. 07/16/2012 1,900 1,976 1,035 237 1.9 x 8.3 xNovartis AG Fougera Pharmaceuticals Inc. 05/02/2012 1,525 1,525 429 173 3.6 x 8.8 xTakeda Pharmaceuticals U.S.A., Inc. URL Pharma, Inc. 04/11/2012 800 800 600 76 1.3 x 10.5 xGenomma Lab Internacional SAB de CV Prestige Brands Holdings, Inc. 02/21/2012 834 1,263 403 119 3.1 x 10.6 xNestlé Health Science S.A. Prometheus Laboratories Inc. 05/24/2011 745 659 519 139 1.3 x 4.7 xPfizer Inc. King Pharmaceuticals LLC 10/12/2010 3,600 3,225 1,565 349 2.1 x 9.2 xEndo Pharmaceuticals Holdings Inc. Qualitest Pharmaceuticals 09/28/2010 1,200 1,176 309 58 3.8 x 20.2 xCelgene Corporation Abraxis BioScience, Inc. 06/30/2010 2,923 2,789 397 (23) 7.0 x NMAstellas US Holding, Inc. OSI Pharmaceuticals Inc. 05/16/2010 4,000 3,414 441 176 7.7 x 19.4 xDainippon Sumitomo Pharma America Holdings, Inc. Sepracor, Inc. 09/03/2009 2,600 2,347 1,334 306 1.8 x 7.7 xGlaxoSmithKline plc Stiefel Laboratories, Inc. 04/20/2009 3,050 3,450 900 288 3.8 x 12.0 x
Maximum 4,802$ 1,565$ 517$ 9.5 x 69.0 x75th Percentile 3,144 859 275 5.3 x 14.5 x
Median 2,154$ 480$ 156$ 3.7 x 10.6 x25th Percentile 1,284 399 78 2.1 x 9.2 x
Minimum 536 231 (23) 1.3 x 4.7 x

Goldman Stanley
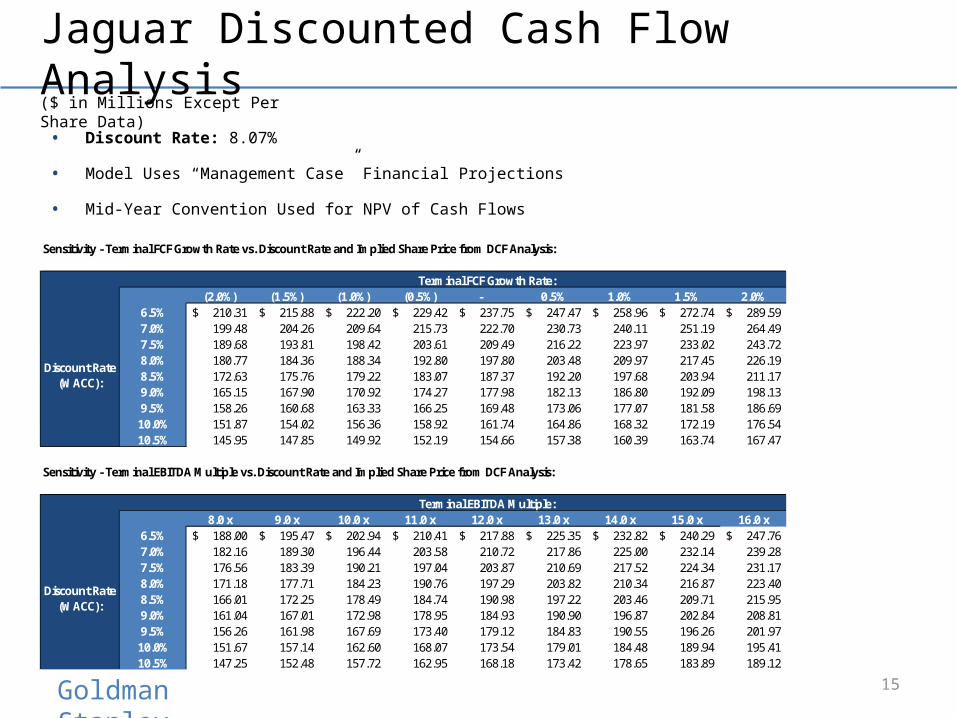
Jaguar Discounted Cash Flow Analysis
14
($ in Millions Except Per Share Data)
ProjectedUnlevered Free Cash Flow Projections: FY14 FY15 FY16 FY17 FY18 FY19 FY20 FY21 FY22 FY23
Revenue: 1,176.9$ 1,553.3$ 1,998.0$ 2,554.3$ 3,174.8$ 3,853.2$ 4,552.3$ 5,371.6$ 1,662.1$ 1,827.6$ Annual / Annualized Revenue Growth Rate: 34.9% 32.0% 28.6% 27.8% 24.3% 21.4% 18.1% 18.0% (69.1%) 10.0%
Operating Income (EBIT): 348.7 697.0 911.7 1,169.9 1,453.2 1,768.0 2,064.2 2,432.8 677.4 749.1 Annual / Annualized Operating Margin: 29.6% 44.9% 45.6% 45.8% 45.8% 45.9% 45.3% 45.3% 40.8% 41.0%
Less: Taxes, Excluding Effect of Interest: (62.8) (125.5) (164.1) (210.6) (261.6) (318.2) (371.6) (437.9) (121.9) (134.8)
Net Operating Profit After Tax (NOPAT): 285.9 571.5 747.6 959.3 1,191.6 1,449.8 1,692.6 1,994.9 555.5 614.3
Total Adjustments for Non-Cash Charges: 328.1 221.0 244.6 280.1 317.3 345.3 393.4 450.8 213.5 226.1
Total Changes in Operating Assets & Liabilities: (29.8) (55.4) (50.6) (63.1) (71.0) (79.1) (80.6) (97.0) 423.6 (20.4)
Less: Capital Expenditures: (14.1) (20.2) (28.0) (38.3) (50.8) (65.5) (81.9) (102.1) (33.2) (38.4)
Annual Unlevered Free Cash Flow: 570.1 717.0 913.6 1,138.0 1,387.1 1,650.4 1,923.5 2,246.6 1,159.3 781.6 Unlevered Free Cash Flow for Remaining Quarters: 489.9 717.0 913.6 1,138.0 1,387.1 1,650.4 1,923.5 2,246.6 1,159.3 781.6 Net Present Value of Free Cash Flow: 477.8 655.9 773.4 891.5 1,005.5 1,107.0 1,193.9 1,290.3 616.1 384.3
Normal Discount Period: 0.647 1.647 2.647 3.647 4.647 5.647 6.647 7.647 8.647 9.647Mid-Year Discount Period: 0.323 1.147 2.147 3.147 4.147 5.147 6.147 7.147 8.147 9.147
Annual Free Cash Flow Growth Rate: 67.5% 25.8% 27.4% 24.6% 21.9% 19.0% 16.5% 16.8% (48.4%) (32.6%)
Annual EBITDA: 609.9 830.9 1,045.5 1,309.5 1,596.8 1,903.3 2,210.4 2,592.5 798.0 873.5 Annual EBITDA Growth Rate: 43.0% 36.3% 25.8% 25.3% 21.9% 19.2% 16.1% 17.3% (69.2%) 9.5%
Goldman Stanley
Jaguar Discounted Cash Flow Analysis
15
($ in Millions Except Per Share Data)
Sensitivity - Terminal FCF Growth Rate vs. Discount Rate and Implied Share Price from DCF Analysis:
Terminal FCF Growth Rate:19954.0% (2.0%) (1.5%) (1.0%) (0.5%) - 0.5% 1.0% 1.5% 2.0%
6.5% 210.31$ 215.88$ 222.20$ 229.42$ 237.75$ 247.47$ 258.96$ 272.74$ 289.59$ 7.0% 199.48 204.26 209.64 215.73 222.70 230.73 240.11 251.19 264.49 7.5% 189.68 193.81 198.42 203.61 209.49 216.22 223.97 233.02 243.72 8.0% 180.77 184.36 188.34 192.80 197.80 203.48 209.97 217.45 226.19 8.5% 172.63 175.76 179.22 183.07 187.37 192.20 197.68 203.94 211.17 9.0% 165.15 167.90 170.92 174.27 177.98 182.13 186.80 192.09 198.13 9.5% 158.26 160.68 163.33 166.25 169.48 173.06 177.07 181.58 186.69
10.0% 151.87 154.02 156.36 158.92 161.74 164.86 168.32 172.19 176.54 10.5% 145.95 147.85 149.92 152.19 154.66 157.38 160.39 163.74 167.47
Sensitivity - Terminal EBITDA Multiple vs. Discount Rate and Implied Share Price from DCF Analysis:
Terminal EBITDA Multiple:19640.2% 8.0 x 9.0 x 10.0 x 11.0 x 12.0 x 13.0 x 14.0 x 15.0 x 16.0 x
6.5% 188.00$ 195.47$ 202.94$ 210.41$ 217.88$ 225.35$ 232.82$ 240.29$ 247.76$ 7.0% 182.16 189.30 196.44 203.58 210.72 217.86 225.00 232.14 239.28 7.5% 176.56 183.39 190.21 197.04 203.87 210.69 217.52 224.34 231.17 8.0% 171.18 177.71 184.23 190.76 197.29 203.82 210.34 216.87 223.40 8.5% 166.01 172.25 178.49 184.74 190.98 197.22 203.46 209.71 215.95 9.0% 161.04 167.01 172.98 178.95 184.93 190.90 196.87 202.84 208.81 9.5% 156.26 161.98 167.69 173.40 179.12 184.83 190.55 196.26 201.97
10.0% 151.67 157.14 162.60 168.07 173.54 179.01 184.48 189.94 195.41 10.5% 147.25 152.48 157.72 162.95 168.18 173.42 178.65 183.89 189.12
Discount Rate (WACC):
Discount Rate (WACC):
• Discount Rate: 8.07%
• Model Uses “Management Case” Financial Projections
• Mid-Year Convention Used for NPV of Cash Flows
Goldman Stanley
Other Valuation Considerations
• Jaguar’s corporate status in Ireland makes it an attractive candidate for a “tax inversion” deal
• Effective tax rate of 18% vs. statutory US rate of 35-40% could effectively add billions in value for the right acquirer
Salix Pharmaceuticals: Reduced tax rate would increase CY2015E Net Income from ~$450 million to ~$567 million, and at the same P / E multiple would add $2 billion in value to company’s Equity Value and Enterprise Value
$2 billion represents $31.52 per share for Jaguar in a potential sale
• Premiums Paid analysis for comparable transactions also indicates per-share premium of 30-40% in recent deals:
Actavis / Forest Labs: 31% premium paid over average 10-day price prior to deal
Mallinckrodt / Cadence: 32% premium paid over average 30-day price
Salix / Santarus: 39% premium paid over average 30-day price
16
Goldman Stanley
Other Valuation Considerations
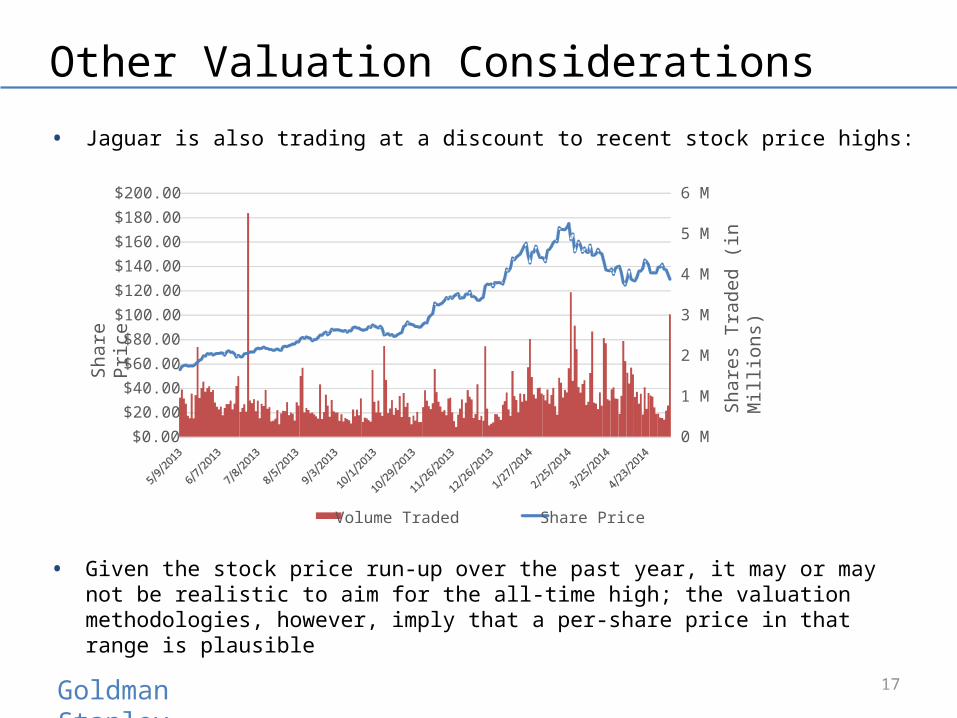
• Jaguar is also trading at a discount to recent stock price highs:
• Given the stock price run-up over the past year, it may or may not be realistic to aim for the all-time high; the valuation methodologies, however, imply that a per-share price in that range is plausible
17
0 M
1 M
2 M
3 M
4 M
5 M
6 M
$0.00
$20.00$40.00
$60.00
$80.00$100.00
$120.00
$140.00$160.00
$180.00
$200.00
Shar
es T
rade
d (in
Mill
ions
)
Shar
e Pr
ice
Volume Traded Share Price

Goldman Stanley
Valuation Conclusions
• Given Jaguar’s attractive tax status, its historical and projected financial performance, and the potential of Xyrem, we believe a premium valuation is justified
• The company’s margins and growth rates exceed those of its peer companies, and it has a lower tax rate than many of them, indicating that it should be valued in-line with, or above, the 75th percentile of the comparable company set
• A price of $200 / share (50%+ premium to the current price) should be the goal, with greater potential upside for a US-based partner and/or a partner with a complementary portfolio
• The DCF analysis also confirms that a value between $170 / share and $240 / share is reasonable, based on conservative Discount Rate and Terminal Value estimates and Management Case financial projections
• Premiums Paid analysis for recent deals indicates a median 30-day average price premium of ~40%; this implies a per share value of $190 for Jaguar
18

Goldman Stanley
Potential Strategic Partners
19

Goldman Stanley
Potential Strategic Partners
• Size, ability to pay, tax/corporate headquarters status, product/pipeline, and strategic fit should all be considered
• US-headquartered partners are ideal since tax rates are highest there; several Canadian and Israeli companies could also qualify since tax rates are also higher than rates in the UK or Ireland
• Both branded and generics companies should be considered, in light of recent M&A activity
• Tier 1 Potential Strategic Partners
“Tier 1” acquisition candidates are significantly larger than Jaguar, are US-based with US corporate tax rates, and have a solid product/pipeline fit
• Tier 2 Potential Strategic Partners
“Tier 2” acquisition candidates are closer to Jaguar’s size and therefore have a lower ability to pay, but are still US-based with US corporate taxes and a solid product/pipeline fit
20

Goldman Stanley
Potential Partners
Tier 1 Potential Partners
Tier 2 Potential Partners
21

Goldman Stanley
Process Recommendations
22

Goldman Stanley
Key Recommendations
• We recommend engaging in targeted discussions with the Tier 1 candidates and assessing their receptiveness to M&A discussions
• At the same time, Goldman Stanley will reach out to Tier 2 candidates and introduce Jaguar as a potential partner
• M&A process with Tier 1 candidates will take significantly longer due to the scale of the companies, so we recommend conducting both processes simultaneously
• Depending on responses from Tier 1 and Tier 2 candidates, Goldman Stanley and Jaguar may do additional research to determine other potential partners and then approach them
Targeted Sell-Side M&A Broad Sell-Side M&A
< 5 potential partners 10 – 100 potential partners
6 – 12 months Time required is highly variable
Close-ended Iterative process
Higher success probability Lower success probability
23

Goldman Stanley
Specialized Negotiations With One
Party
Highly TargetedProcess
• Combination of targeted discussions plus broader search conducted in background maximizes success probability and minimizes disruption to Jaguar
• Additional parties contacted depend on responsiveness of Tier 1 and Tier 2 partners
• Interested parties would sign NDAs and then proceed into due diligence and valuation discussions with Jaguar
RECOMMENDED
Process Recommendation
BroadMarketing
Broad M&A ProcessTargeted
Discussions + Broader Search
24

Goldman Stanley
Appendix
25

Goldman Stanley
Xyrem and Erwinaze Projections – Management
26
($ in Millions Except Per Share Data)Projected
Revenue Assumptions: FY14 FY15 FY16 FY17 FY18 FY19 FY20 FY21 FY22 FY23
Xyrem Assumptions:
Total Market Size (# Potential Patients) - Xyrem: 157,000 157,000 157,000 157,000 157,000 157,000 157,000 157,000 157,000 157,000# Patients On Medication at End of Year:Average # of Patients Throughout the Year: 12,560 15,700 18,840 21,980 25,120 28,260 31,400 34,540 37,680 37,680
Growth Rate in # of Patients: 18.2% 25.0% 20.0% 16.7% 14.3% 12.5% 11.1% 10.0% 9.1% –
% of Market on Xyrem Medication: 8.0% 10.0% 12.0% 14.0% 16.0% 18.0% 20.0% 22.0% 24.0% 24.0%Post-Toggle % of Market on Xyrem Medication: 8.0% 10.0% 12.0% 14.0% 16.0% 18.0% 20.0% 22.0% 24.0% 24.0%
Annual Price Per Patient - Xyrem: 61,598$ 68,990$ 77,269$ 86,541$ 95,195$ 104,715$ 113,092$ 122,139$ 10,000$ 10,000$ Growth Rate in Price per Patient: 15.0% 12.0% 12.0% 12.0% 10.0% 10.0% 8.0% 8.0% 6.0% 6.0%Post-Toggle Growth Rate in Price per Patient: 15.0% 12.0% 12.0% 12.0% 10.0% 10.0% 8.0% 8.0% 6.0% 6.0%
Xyrem - Revenue: 773.7$ 1,083.1$ 1,455.7$ 1,902.2$ 2,391.3$ 2,959.2$ 3,551.1$ 4,218.7$ 376.8$ 376.8$ Annual Growth Rate: 35.9% 40.0% 34.4% 30.7% 25.7% 23.8% 20.0% 18.8% (91.1%) –
Erwinaze Assumptions:
Total Market Size (# Potential Patients) - Erwinaze: 3,600 3,600 3,600 3,600 3,600 3,600 3,600 3,600 3,600 3,600Average # of Patients on Erwinaze: 612 684 756 828 900 900 972 972 1,044 1,044
Growth Rate in # of Patients: 13.3% 11.8% 10.5% 9.5% 8.7% – 8.0% – 7.4% –
% of Market on Erwinaze Medication: 17.0% 19.0% 21.0% 23.0% 25.0% 25.0% 27.0% 27.0% 29.0% 29.0%
Annual Price Per Patient - Erwinaze: 332,368$ 342,339$ 352,609$ 363,187$ 374,083$ 385,305$ 396,864$ 408,770$ 421,033$ 433,664$ Growth Rate in Price per Patient: 3.0% 3.0% 3.0% 3.0% 3.0% 3.0% 3.0% 3.0% 3.0% 3.0%
Erwinaze - Revenue: 203.4$ 234.2$ 266.6$ 300.7$ 336.7$ 346.8$ 385.8$ 397.3$ 439.6$ 452.7$ Annual Growth Rate: 16.7% 15.1% 13.8% 12.8% 12.0% 3.0% 11.2% 3.0% 10.6% 3.0%

Goldman Stanley
Jaguar Income Statement – Management Case
27
($ in Millions Except Per Share Data)
ProjectedIncome Statement: FY14 FY15 FY16 FY17 FY18 FY19 FY20 FY21 FY22 FY23
Revenue:Existing Products:
Xyrem Sales: 773.7$ 1,083.1$ 1,455.7$ 1,902.2$ 2,391.3$ 2,959.2$ 3,551.1$ 4,218.7$ 376.8$ 376.8$ Erwinaze Sales: 203.4 234.2 266.6 300.7 336.7 346.8 385.8 397.3 439.6 452.7 Defitelio Sales: 57.8 79.8 107.1 140.7 182.0 209.3 240.7 276.9 318.4 366.1 Other Sales and Royalties: 142.0 156.2 168.7 182.1 193.1 204.7 214.9 225.6 234.7 244.0
Risk-Adjusted Pipeline Drug Sales:JZP-110 Sales: - - - 28.5 71.7 133.2 159.8 253.1 292.7 387.8 JZP-386 Sales: - - - - - - - - - -
Total Revenue: 1,176.9 1,553.3 1,998.0 2,554.3 3,174.8 3,853.2 4,552.3 5,371.6 1,662.1 1,827.6 Revenue Growth: 34.9% 32.0% 28.6% 27.8% 24.3% 21.4% 18.1% 18.0% (69.1%) 10.0%
Total Cost of Product Sales: 111.8 147.6 189.9 242.8 301.7 366.2 432.6 510.5 158.0 173.7 Gross Profit: 1,065.0 1,405.6 1,808.1 2,311.5 2,873.1 3,487.0 4,119.6 4,861.1 1,504.2 1,653.9
Gross Margin: 90.5% 90.5% 90.5% 90.5% 90.5% 90.5% 90.5% 90.5% 90.5% 90.5%
Operating Expenses:Selling, General, and Administrative: 376.6 466.0 614.8 802.8 1,015.9 1,252.3 1,499.6 1,790.5 559.9 621.4 Research and Development: 83.3 116.5 159.8 217.1 285.7 366.1 455.2 537.2 166.2 182.8 Acquired In-Process Research & Development: 127.0 - - - - - - - - - Intangible Asset Amortization: 129.5 126.2 121.8 121.7 118.2 100.7 100.7 100.7 100.7 100.7
Total Operating Expenses: 716.3 708.6 896.4 1,141.6 1,419.9 1,719.0 2,055.5 2,428.4 826.7 904.8
Operating Income (EBIT): 348.7 697.0 911.7 1,169.9 1,453.2 1,768.0 2,064.2 2,432.8 677.4 749.1 Operating (EBIT) Margin: 29.6% 44.9% 45.6% 45.8% 45.8% 45.9% 45.3% 45.3% 40.8% 41.0%
Other Income / (Expense):Interest Expense, Net: (48.6) (38.1) (38.1) (18.1) (18.1) (0.2) - - - - Losses and Other Items: - - - - - - - - - - Goodwill Impairment: - - - - - - - - - -
Total Other Income / (Expense): (48.6) (38.1) (38.1) (18.1) (18.1) (0.2) - - - -
Income From Continuing Operations (Before Taxes): 300.0 658.9 873.6 1,151.8 1,435.1 1,767.8 2,064.2 2,432.8 677.4 749.1 Tax Provision / (Benefit): 54.0 118.6 157.2 207.3 258.3 318.2 371.6 437.9 121.9 134.8
Income From Continuing Operations: 246.0 540.3 716.3 944.5 1,176.8 1,449.6 1,692.6 1,994.9 555.5 614.3
Income from Discontinued Operations: - - - - - - - - - -
Net Income: 246.0$ 540.3$ 716.3$ 944.5$ 1,176.8$ 1,449.6$ 1,692.6$ 1,994.9$ 555.5$ 614.3$ Effective Tax Rate: 18.0% 18.0% 18.0% 18.0% 18.0% 18.0% 18.0% 18.0% 18.0% 18.0%
Weighted Average Diluted Shares Outstanding: 61.6 61.6 61.6 61.6 61.6 61.6 61.6 61.6 61.6 61.6Diluted Earnings Per Share (EPS): 4.00$ 8.78$ 11.63$ 15.34$ 19.11$ 23.54$ 27.49$ 32.40$ 9.02$ 9.98$
EBITDA: 609.9$ 830.9$ 1,045.5$ 1,309.5$ 1,596.8$ 1,903.3$ 2,210.4$ 2,592.5$ 798.0$ 873.5$ EBITDA Margin: 51.8% 53.5% 52.3% 51.3% 50.3% 49.4% 48.6% 48.3% 48.0% 47.8%
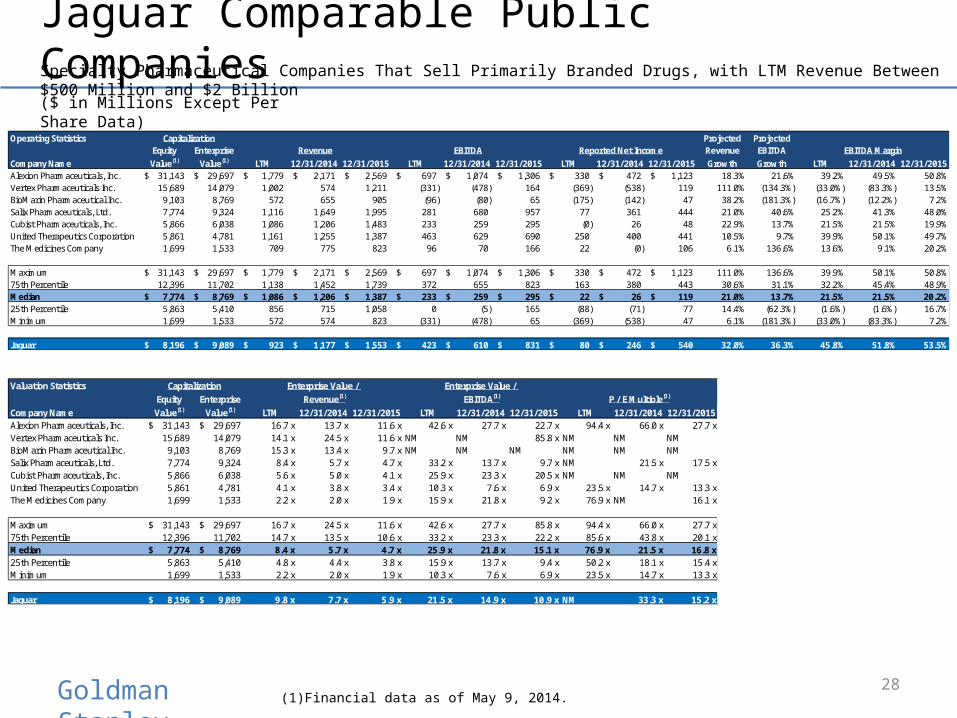
Goldman Stanley 28
Jaguar Comparable Public Companies ($ in Millions Except Per Share Data)
Specialty Pharmaceutical Companies That Sell Primarily Branded Drugs, with LTM Revenue Between $500 Million and $2 Billion
(1) Financial data as of May 9, 2014.
Operating Statistics Capitalization Projected ProjectedEquity Enterprise Revenue EBITDA Reported Net Income Revenue EBITDA EBITDA Margin
Company Name Value(1) Value(1) LTM 12/31/2014 12/31/2015 LTM 12/31/2014 12/31/2015 LTM 12/31/2014 12/31/2015 Growth Growth LTM 12/31/2014 12/31/2015Alexion Pharmaceuticals, Inc. 31,143$ 29,697$ 1,779$ 2,171$ 2,569$ 697$ 1,074$ 1,306$ 330$ 472$ 1,123$ 18.3% 21.6% 39.2% 49.5% 50.8%Vertex Pharmaceuticals Inc. 15,689 14,079 1,002 574 1,211 (331) (478) 164 (369) (538) 119 111.0% (134.3%) (33.0%) (83.3%) 13.5%BioMarin Pharmaceutical Inc. 9,103 8,769 572 655 905 (96) (80) 65 (175) (142) 47 38.2% (181.3%) (16.7%) (12.2%) 7.2%Salix Pharmaceuticals, Ltd. 7,774 9,324 1,116 1,649 1,995 281 680 957 77 361 444 21.0% 40.6% 25.2% 41.3% 48.0%Cubist Pharmaceuticals, Inc. 5,866 6,038 1,086 1,206 1,483 233 259 295 (0) 26 48 22.9% 13.7% 21.5% 21.5% 19.9%United Therapeutics Corporation 5,861 4,781 1,161 1,255 1,387 463 629 690 250 400 441 10.5% 9.7% 39.9% 50.1% 49.7%The Medicines Company 1,699 1,533 709 775 823 96 70 166 22 (0) 106 6.1% 136.6% 13.6% 9.1% 20.2%
Maximum 31,143$ 29,697$ 1,779$ 2,171$ 2,569$ 697$ 1,074$ 1,306$ 330$ 472$ 1,123$ 111.0% 136.6% 39.9% 50.1% 50.8%75th Percentile 12,396 11,702 1,138 1,452 1,739 372 655 823 163 380 443 30.6% 31.1% 32.2% 45.4% 48.9%Median 7,774$ 8,769$ 1,086$ 1,206$ 1,387$ 233$ 259$ 295$ 22$ 26$ 119$ 21.0% 13.7% 21.5% 21.5% 20.2%25th Percentile 5,863 5,410 856 715 1,058 0 (5) 165 (88) (71) 77 14.4% (62.3%) (1.6%) (1.6%) 16.7%Minimum 1,699 1,533 572 574 823 (331) (478) 65 (369) (538) 47 6.1% (181.3%) (33.0%) (83.3%) 7.2%
Jaguar 8,196$ 9,089$ 923$ 1,177$ 1,553$ 423$ 610$ 831$ 80$ 246$ 540$ 32.0% 36.3% 45.8% 51.8% 53.5%
Valuation Statistics Capitalization Enterprise Value / Enterprise Value / Equity Enterprise Revenue(1) EBITDA(1) P / E Multiple(1)
Company Name Value(1) Value(1) LTM 12/31/2014 12/31/2015 LTM 12/31/2014 12/31/2015 LTM 12/31/2014 12/31/2015Alexion Pharmaceuticals, Inc. 31,143$ 29,697$ 16.7 x 13.7 x 11.6 x 42.6 x 27.7 x 22.7 x 94.4 x 66.0 x 27.7 xVertex Pharmaceuticals Inc. 15,689 14,079 14.1 x 24.5 x 11.6 x NM NM 85.8 x NM NM NMBioMarin Pharmaceutical Inc. 9,103 8,769 15.3 x 13.4 x 9.7 x NM NM NM NM NM NMSalix Pharmaceuticals, Ltd. 7,774 9,324 8.4 x 5.7 x 4.7 x 33.2 x 13.7 x 9.7 x NM 21.5 x 17.5 xCubist Pharmaceuticals, Inc. 5,866 6,038 5.6 x 5.0 x 4.1 x 25.9 x 23.3 x 20.5 x NM NM NMUnited Therapeutics Corporation 5,861 4,781 4.1 x 3.8 x 3.4 x 10.3 x 7.6 x 6.9 x 23.5 x 14.7 x 13.3 xThe Medicines Company 1,699 1,533 2.2 x 2.0 x 1.9 x 15.9 x 21.8 x 9.2 x 76.9 x NM 16.1 x
Maximum 31,143$ 29,697$ 16.7 x 24.5 x 11.6 x 42.6 x 27.7 x 85.8 x 94.4 x 66.0 x 27.7 x75th Percentile 12,396 11,702 14.7 x 13.5 x 10.6 x 33.2 x 23.3 x 22.2 x 85.6 x 43.8 x 20.1 xMedian 7,774$ 8,769$ 8.4 x 5.7 x 4.7 x 25.9 x 21.8 x 15.1 x 76.9 x 21.5 x 16.8 x25th Percentile 5,863 5,410 4.8 x 4.4 x 3.8 x 15.9 x 13.7 x 9.4 x 50.2 x 18.1 x 15.4 xMinimum 1,699 1,533 2.2 x 2.0 x 1.9 x 10.3 x 7.6 x 6.9 x 23.5 x 14.7 x 13.3 x
Jaguar 8,196$ 9,089$ 9.8 x 7.7 x 5.9 x 21.5 x 14.9 x 10.9 x NM 33.3 x 15.2 x

Goldman Stanley
Jaguar DCF Analysis – WACC Calculation
29
($ in Millions Except Per Share Data)
Discount Rate Calculations - Assumptions(1)
Risk-Free Rate: 2.62%Equity Risk Premium: 7.00%Pre-Tax Cost of Debt: 3.42%Cost of Preferred Stock: –
Comparable Companies - Unlevered Beta CalculationLevered Preferred Equity Unlevered
Name Beta(1) Debt(1) % Debt Stock(1) % Preferred Value(1) % Equity Tax Rate BetaAlexion Pharmaceuticals, Inc. 0.64 93.5$ 0.3% -$ – 31,142.6$ 99.7% 17.0% 0.64Vertex Pharmaceuticals Inc. 0.35 473.4 2.9% - – 15,689.4 97.1% 20.0% 0.34BioMarin Pharmaceutical Inc. 0.92 828.4 8.3% - – 9,102.5 91.7% 27.0% 0.86Salix Pharmaceuticals, Ltd. 1.18 1,944.4 20.0% - – 7,774.0 80.0% 35.0% 1.01Cubist Pharmaceuticals, Inc. 0.65 945.2 13.9% - – 5,865.8 86.1% 27.0% 0.58United Therapeutics Corporation 1.44 70.3 1.2% - – 5,861.1 98.8% 35.0% 1.43The Medicines Company 0.79 263.0 13.4% - – 1,699.3 86.6% 36.0% 0.72
Median: 0.79 473.4$ 8.3% -$ – 7,774.0$ 91.7% 27.0% 0.72
Jaguar 1.05
Jaguar - Levered Beta & WACC CalculationUnlevered Preferred Equity Levered
Beta Debt(1) % Debt Stock(1) % Preferred Value(1) % Equity Tax Rate BetaCurrent Capital Structure: 0.72 1,198.6$ 12.8% -$ – 8,196.0$ 87.2% 18.0% 0.81 "Optimal" Capital Structure: 0.72 783.6 8.3% - – 8,611.0 91.7% 18.0% 0.77
Cost of Equity Based on Comparables, Current Capital Structure: 8.26%Cost of Equity Based on Comparables, "Optimal" Capital Structure: 8.03%Cost of Equity Based on Historical Beta: 9.97%
WACC = Cost of Equity * % Equity + Cost of Debt * % Debt * (1 - Tax Rate) + Cost of Preferred Stock * % Preferred Stock
WACC, Current Capital Structure: 7.56%WACC, Current Capital Structure and Historical Cost of Equity: 9.06%WACC, "Optimal" Capital Structure: 7.59%
Average WACC Produced by All Methods: 8.07%
(1) Financial data as of May 9, 2014.