
Goldman Stanley
Goldman Stanley, Inc.
Confidential Draft
Project Jaguar
Presentation to the Board of Directors
May 10, 2014

Goldman Stanley
Table Of Contents
Executive Summary 3
Jaguar Valuation 5
Potential Strategic Partners 19
Process Recommendations 22
Appendix 25
2
Goldman Stanley
Executive Summary
3

Goldman Stanley
Executive Summary
• As of May 9, 2014, Jaguar’s share price and valuation multiples have more than doubled over the last twelve months
• Even at its current levels, however, Jaguar is still undervalued relative to peer specialty pharmaceutical companies, and on an intrinsic, cash flow basis
• Given its prominence in the market, the record healthcare M&A activity in the first half of this year, and the soaring interest in “tax inversion” deals, Jaguar could make for an attractive acquisition candidate
• Such a strategy would allow Jaguar to maximize shareholder value, expand its geographic reach and distribution channels, and acquire more resources for future research & development efforts and/or M&A activity
• Given Jaguar’s unique attributes, we believe a purchase premium above 50%, implying a share price of ~$200+, is possible with the proper positioning and process
• We recommend a highly targeted process focused on the most likely (“Tier 1”) potential partners, along with an outreach to Tier 2 potential partners while discussions with Tier 1 partners are ongoing
4
Goldman Stanley
Jaguar Valuation
5
Goldman Stanley
Valuation Summary
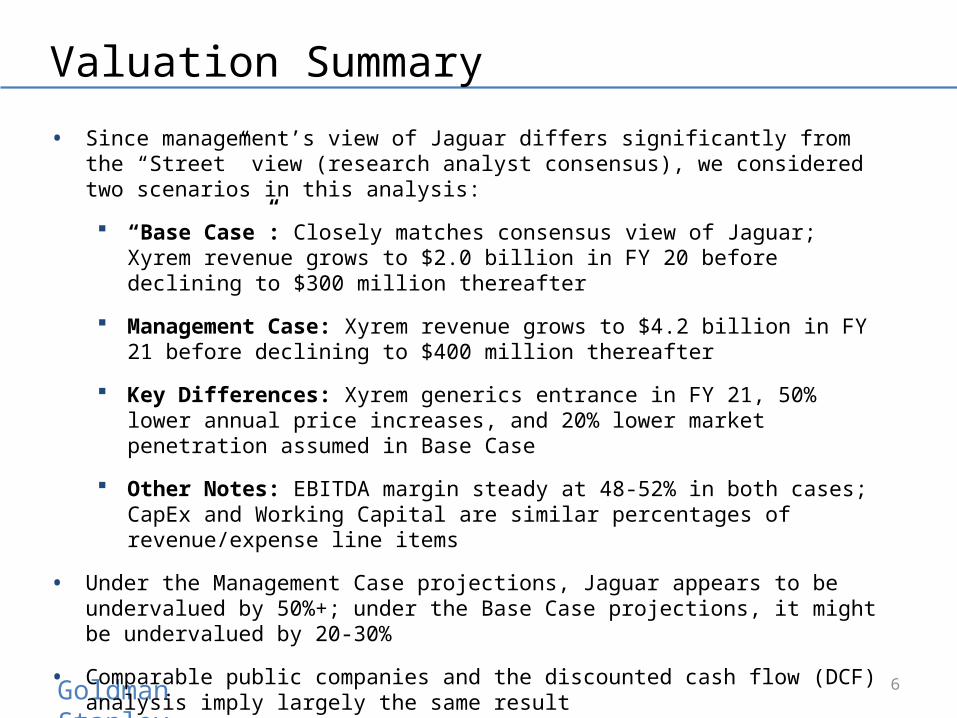
• Since management’s view of Jaguar differs significantly from the “Street” view (research analyst consensus), we considered two scenarios in this analysis:
“Base Case”: Closely matches consensus view of Jaguar; Xyrem revenue grows to $2.0 billion in FY 20 before declining to $300 million thereafter
Management Case: Xyrem revenue grows to $4.2 billion in FY 21 before declining to $400 million thereafter
Key Differences: Xyrem generics entrance in FY 21, 50% lower annual price increases, and 20% lower market penetration assumed in Base Case
Other Notes: EBITDA margin steady at 48-52% in both cases; CapEx and Working Capital are similar percentages of revenue/expense line items
• Under the Management Case projections, Jaguar appears to be undervalued by 50%+; under the Base Case projections, it might be undervalued by 20-30%
• Comparable public companies and the discounted cash flow (DCF) analysis imply largely the same result
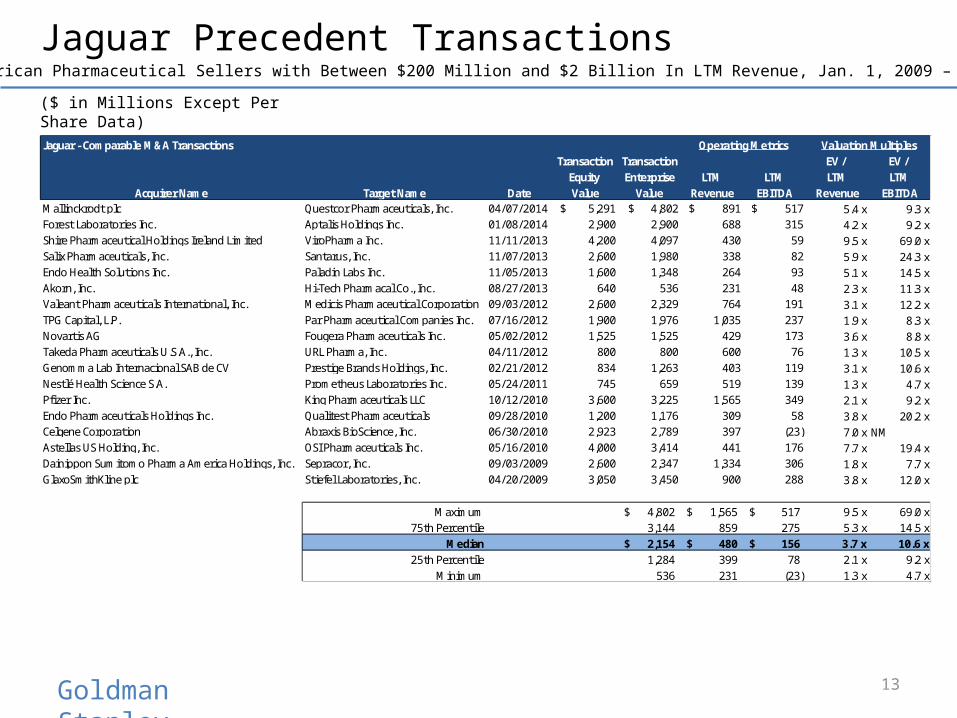
• Precedent Transactions imply a much lower implied valuation, but the multiples there are less relevant because of a number of older / less comparable deals
6

Goldman Stanley
ProjectedIncome Statement: FY14 FY15 FY16 FY17 FY18 FY19 FY20 FY21 FY22 FY23
Revenue:Existing Products:
Xyrem Sales: 578.6$ 766.6$ 975.1$ 1,205.9$ 1,447.1$ 1,709.4$ 1,975.3$ 276.3$ 301.4$ 301.4$ Erwinaze Sales: 203.4 234.2 266.6 300.7 336.7 346.8 385.8 397.3 439.6 452.7 Defitelio Sales: 57.8 79.8 107.1 140.7 182.0 209.3 240.7 276.9 318.4 366.1 Other Sales and Royalties: 142.0 156.2 168.7 182.1 193.1 204.7 214.9 225.6 234.7 244.0
Risk-Adjusted Pipeline Drug Sales:JZP-110 Sales: - - - 18.1 43.4 76.9 88.9 135.6 152.3 196.1 JZP-386 Sales: - - - - - - - - - -
Total Revenue: 981.8 1,236.7 1,517.4 1,847.6 2,202.3 2,547.1 2,905.6 1,311.7 1,446.4 1,560.5 Revenue Growth: 12.5% 26.0% 22.7% 21.8% 19.2% 15.7% 14.1% (54.9%) 10.3% 7.9%
Operating Income (EBIT): 248.4 529.2 663.1 812.5 971.9 1,134.6 1,281.1 518.0 576.4 624.9 Operating (EBIT) Margin: 25.3% 42.8% 43.7% 44.0% 44.1% 44.5% 44.1% 39.5% 39.9% 40.0%
Net Income: 163.8$ 402.7$ 512.5$ 651.4$ 782.1$ 930.2$ 1,050.5$ 424.8$ 472.7$ 512.4$ Effective Tax Rate: 18.0% 18.0% 18.0% 18.0% 18.0% 18.0% 18.0% 18.0% 18.0% 18.0%
Weighted Average Diluted Shares Outstanding: 61.6 61.6 61.6 61.6 61.6 61.6 61.6 61.6 61.6 61.6Diluted Earnings Per Share (EPS): 2.66$ 6.54$ 8.32$ 10.58$ 12.70$ 15.11$ 17.06$ 6.90$ 7.68$ 8.32$
EBITDA: 508.8$ 661.6$ 794.0$ 947.2$ 1,107.7$ 1,258.2$ 1,410.8$ 633.1$ 694.4$ 745.9$ EBITDA Margin: 51.8% 53.5% 52.3% 51.3% 50.3% 49.4% 48.6% 48.3% 48.0% 47.8%
Base Case Financial Projections
7
($ in Millions Except Per Share Data)

Goldman Stanley
ProjectedIncome Statement: FY14 FY15 FY16 FY17 FY18 FY19 FY20 FY21 FY22 FY23
Revenue:Existing Products:
Xyrem Sales: 773.7$ 1,083.1$ 1,455.7$ 1,902.2$ 2,391.3$ 2,959.2$ 3,551.1$ 4,218.7$ 376.8$ 376.8$ Erwinaze Sales: 203.4 234.2 266.6 300.7 336.7 346.8 385.8 397.3 439.6 452.7 Defitelio Sales: 57.8 79.8 107.1 140.7 182.0 209.3 240.7 276.9 318.4 366.1 Other Sales and Royalties: 142.0 156.2 168.7 182.1 193.1 204.7 214.9 225.6 234.7 244.0
Risk-Adjusted Pipeline Drug Sales:JZP-110 Sales: - - - 28.5 71.7 133.2 159.8 253.1 292.7 387.8 JZP-386 Sales: - - - - - - - - - -
Total Revenue: 1,176.9 1,553.3 1,998.0 2,554.3 3,174.8 3,853.2 4,552.3 5,371.6 1,662.1 1,827.6 Revenue Growth: 34.9% 32.0% 28.6% 27.8% 24.3% 21.4% 18.1% 18.0% (69.1%) 10.0%
Operating Income (EBIT): 348.7 697.0 911.7 1,169.9 1,453.2 1,768.0 2,064.2 2,432.8 677.4 749.1 Operating (EBIT) Margin: 29.6% 44.9% 45.6% 45.8% 45.8% 45.9% 45.3% 45.3% 40.8% 41.0%
Net Income: 246.0$ 540.3$ 716.3$ 944.5$ 1,176.8$ 1,449.6$ 1,692.6$ 1,994.9$ 555.5$ 614.3$ Effective Tax Rate: 18.0% 18.0% 18.0% 18.0% 18.0% 18.0% 18.0% 18.0% 18.0% 18.0%
Weighted Average Diluted Shares Outstanding: 61.6 61.6 61.6 61.6 61.6 61.6 61.6 61.6 61.6 61.6Diluted Earnings Per Share (EPS): 4.00$ 8.78$ 11.63$ 15.34$ 19.11$ 23.54$ 27.49$ 32.40$ 9.02$ 9.98$
EBITDA: 609.9$ 830.9$ 1,045.5$ 1,309.5$ 1,596.8$ 1,903.3$ 2,210.4$ 2,592.5$ 798.0$ 873.5$ EBITDA Margin: 51.8% 53.5% 52.3% 51.3% 50.3% 49.4% 48.6% 48.3% 48.0% 47.8%
Management Case Financial Projections
8
($ in Millions Except Per Share Data)

Goldman Stanley 9
($ in Millions Except Per Share Data)
Valuation Summary – Base Case
$0.00 $50.00 $100.00 $150.00 $200.00 $250.00
7.0% - 9.0% Discount Rate, (1.0%) - 1.0% Terminal FCF Growth Rate:
LTM EV / EBITDA:LTM EV / Revenue:
12/31/2015E Reported P / E:12/31/2014E Reported P / E:
LTM Reported P / E:12/31/2015E EV / EBITDA:12/31/2014E EV / EBITDA:
LTM EV / EBITDA:12/31/2015E EV / Revenue:12/31/2014E EV / Revenue:
LTM EV / Revenue:
25th to MedianMedian to 75th
Public Company Comparables:
Discounted Cash Flow Analysis:
Jaguar Current Share Price
Precedent Transactions:
• All market data as of May 9, 2014
• Given that Jaguar’s revenue growth, EBITDA growth, and EBITDA margins exceed those of its peer companies, we believe a valuation in the 75th percentile to maximum of the set is justified

Goldman Stanley 10
($ in Millions Except Per Share Data)
Valuation Summary – Management Case
7.0% - 9.0% Discount Rate, (1.0%) - 1.0% Terminal FCF Growth Rate:
LTM EV / EBITDA:LTM EV / Revenue:
12/31/2015E Reported P / E:12/31/2014E Reported P / E:
LTM Reported P / E:12/31/2015E EV / EBITDA:12/31/2014E EV / EBITDA:
LTM EV / EBITDA:12/31/2015E EV / Revenue:12/31/2014E EV / Revenue:
LTM EV / Revenue:Public Company Comparables:
Discounted Cash Flow Analysis:
Jaguar Current Share Price
Precedent Transactions:
• All market data as of May 9, 2014
• The rest of this discussion will utilize the Management Case projections; here, these figures imply a valuation closer to $200 per share
$0.00 $50.00 $100.00 $150.00 $200.00 $250.00 $300.00
Implied Share Price
25th to MedianMedian to 75th

Goldman Stanley
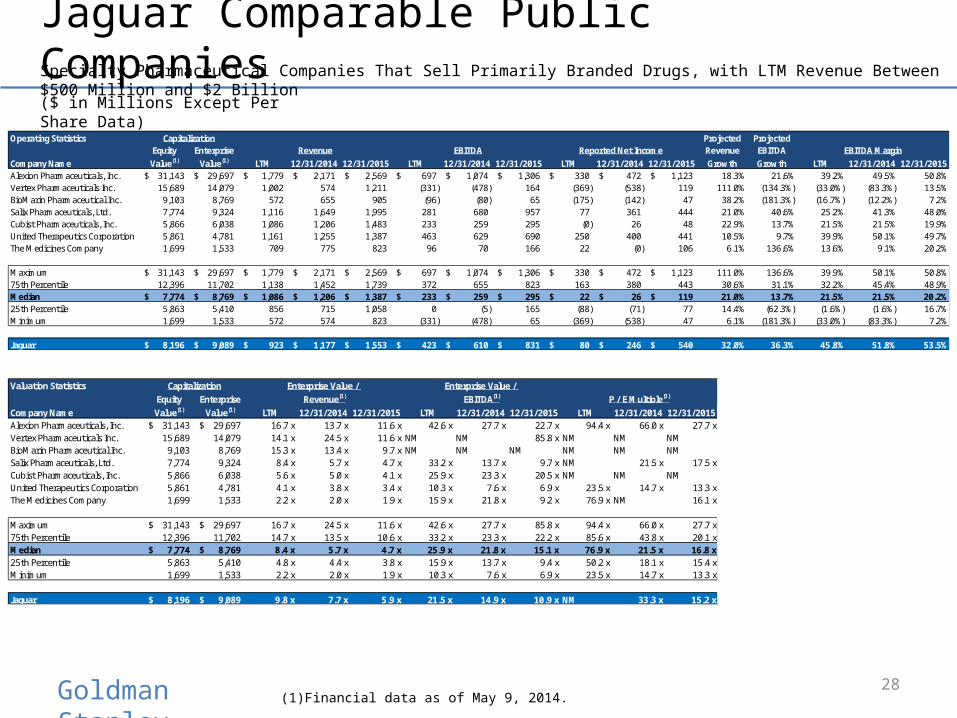
Jaguar Comparable Public Companies
Comparable Public Companies – Revenue and EBITDA, CY 2014E – CY 2015E
11
($ in Millions Except Per Share Data)
Specialty Pharmaceutical Companies That Sell Primarily Branded Drugs, with LTM Revenue Between $500 Million and $2 Billion
CY 2014E Revenue
CY 2015E Revenue
$0.0 B
$0.5 B
$1.0 B
$1.5 B
$2.0 B
$2.5 B
$3.0 B
($0.6 B)
($0.4 B)
($0.2 B)
$0.0 B
$0.2 B
$0.4 B
$0.6 B
$0.8 B
$1.0 B
$1.2 B
$1.4 B
CY 2014E EBITDA
CY 2015E EBITDA
Goldman Stanley
Jaguar Comparable Public Companies
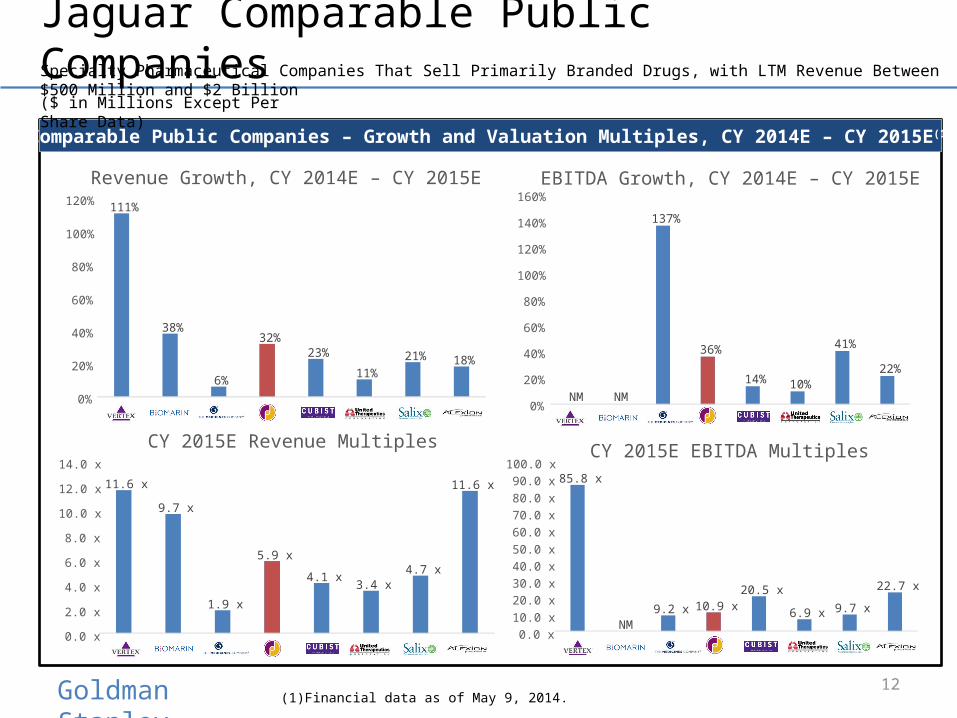
Comparable Public Companies – Growth and Valuation Multiples, CY 2014E – CY 2015E (1)
12(1) Financial data as of May 9, 2014.
($ in Millions Except Per Share Data)
Specialty Pharmaceutical Companies That Sell Primarily Branded Drugs, with LTM Revenue Between $500 Million and $2 Billion
111%
38%
6%
32%23%
11%21% 18%
0%
20%
40%
60%
80%
100%
120%
Revenue Growth, CY 2014E – CY 2015E
11.6 x
9.7 x
1.9 x
5.9 x
4.1 x3.4 x
4.7 x
11.6 x
0.0 x
2.0 x
4.0 x
6.0 x
8.0 x
10.0 x
12.0 x
14.0 x
CY 2015E Revenue Multiples
NM NM
137%
36%
14% 10%
41%
22%
0%
20%
40%
60%
80%
100%
120%
140%
160%EBITDA Growth, CY 2014E – CY 2015E
85.8 x
NM9.2 x 10.9 x
20.5 x
6.9 x 9.7 x
22.7 x
0.0 x10.0 x20.0 x30.0 x40.0 x50.0 x60.0 x70.0 x80.0 x90.0 x
100.0 xCY 2015E EBITDA Multiples
Goldman Stanley
Jaguar Precedent Transactions
13
North American Pharmaceutical Sellers with Between $200 Million and $2 Billion In LTM Revenue, Jan. 1, 2009 – May 9, 2014
($ in Millions Except Per Share Data)
Jaguar - Comparable M&A Transactions Operating Metrics Valuation MultiplesTransaction Transaction EV / EV /
Equity Enterprise LTM LTM LTM LTMAcquirer Name Target Name Date Value Value Revenue EBITDA Revenue EBITDA
Mallinckrodt plc Questcor Pharmaceuticals, Inc. 04/07/2014 $ 5,291 $ 4,802 $ 891 $ 517 5.4 x 9.3 xForest Laboratories Inc. Aptalis Holdings Inc. 01/08/2014 2,900 2,900 688 315 4.2 x 9.2 xShire Pharmaceutical Holdings Ireland Limited ViroPharma Inc. 11/11/2013 4,200 4,097 430 59 9.5 x 69.0 xSalix Pharmaceuticals, Inc. Santarus, Inc. 11/07/2013 2,600 1,980 338 82 5.9 x 24.3 xEndo Health Solutions Inc. Paladin Labs Inc. 11/05/2013 1,600 1,348 264 93 5.1 x 14.5 xAkorn, Inc. Hi-Tech Pharmacal Co., Inc. 08/27/2013 640 536 231 48 2.3 x 11.3 xValeant Pharmaceuticals International, Inc. Medicis Pharmaceutical Corporation 09/03/2012 2,600 2,329 764 191 3.1 x 12.2 xTPG Capital, L.P. Par Pharmaceutical Companies Inc. 07/16/2012 1,900 1,976 1,035 237 1.9 x 8.3 xNovartis AG Fougera Pharmaceuticals Inc. 05/02/2012 1,525 1,525 429 173 3.6 x 8.8 xTakeda Pharmaceuticals U.S.A., Inc. URL Pharma, Inc. 04/11/2012 800 800 600 76 1.3 x 10.5 xGenomma Lab Internacional SAB de CV Prestige Brands Holdings, Inc. 02/21/2012 834 1,263 403 119 3.1 x 10.6 xNestlé Health Science S.A. Prometheus Laboratories Inc. 05/24/2011 745 659 519 139 1.3 x 4.7 xPfizer Inc. King Pharmaceuticals LLC 10/12/2010 3,600 3,225 1,565 349 2.1 x 9.2 xEndo Pharmaceuticals Holdings Inc. Qualitest Pharmaceuticals 09/28/2010 1,200 1,176 309 58 3.8 x 20.2 xCelgene Corporation Abraxis BioScience, Inc. 06/30/2010 2,923 2,789 397 (23) 7.0 x NMAstellas US Holding, Inc. OSI Pharmaceuticals Inc. 05/16/2010 4,000 3,414 441 176 7.7 x 19.4 xDainippon Sumitomo Pharma America Holdings, Inc. Sepracor, Inc. 09/03/2009 2,600 2,347 1,334 306 1.8 x 7.7 xGlaxoSmithKline plc Stiefel Laboratories, Inc. 04/20/2009 3,050 3,450 900 288 3.8 x 12.0 x
Maximum 4,802$ 1,565$ 517$ 9.5 x 69.0 x75th Percentile 3,144 859 275 5.3 x 14.5 x
Median 2,154$ 480$ 156$ 3.7 x 10.6 x25th Percentile 1,284 399 78 2.1 x 9.2 x
Minimum 536 231 (23) 1.3 x 4.7 x

Goldman Stanley
Jaguar Discounted Cash Flow Analysis
14
($ in Millions Except Per Share Data)
ProjectedUnlevered Free Cash Flow Projections: FY14 FY15 FY16 FY17 FY18 FY19 FY20 FY21 FY22 FY23
Revenue: 1,176.9$ 1,553.3$ 1,998.0$ 2,554.3$ 3,174.8$ 3,853.2$ 4,552.3$ 5,371.6$ 1,662.1$ 1,827.6$ Annual / Annualized Revenue Growth Rate: 34.9% 32.0% 28.6% 27.8% 24.3% 21.4% 18.1% 18.0% (69.1%) 10.0%
Operating Income (EBIT): 348.7 697.0 911.7 1,169.9 1,453.2 1,768.0 2,064.2 2,432.8 677.4 749.1 Annual / Annualized Operating Margin: 29.6% 44.9% 45.6% 45.8% 45.8% 45.9% 45.3% 45.3% 40.8% 41.0%
Less: Taxes, Excluding Effect of Interest: (62.8) (125.5) (164.1) (210.6) (261.6) (318.2) (371.6) (437.9) (121.9) (134.8)
Net Operating Profit After Tax (NOPAT): 285.9 571.5 747.6 959.3 1,191.6 1,449.8 1,692.6 1,994.9 555.5 614.3
Total Adjustments for Non-Cash Charges: 328.1 221.0 244.6 280.1 317.3 345.3 393.4 450.8 213.5 226.1
Total Changes in Operating Assets & Liabilities: (29.8) (55.4) (50.6) (63.1) (71.0) (79.1) (80.6) (97.0) 423.6 (20.4)
Less: Capital Expenditures: (14.1) (20.2) (28.0) (38.3) (50.8) (65.5) (81.9) (102.1) (33.2) (38.4)
Annual Unlevered Free Cash Flow: 570.1 717.0 913.6 1,138.0 1,387.1 1,650.4 1,923.5 2,246.6 1,159.3 781.6 Unlevered Free Cash Flow for Remaining Quarters: 489.9 717.0 913.6 1,138.0 1,387.1 1,650.4 1,923.5 2,246.6 1,159.3 781.6 Net Present Value of Free Cash Flow: 477.8 655.9 773.4 891.5 1,005.5 1,107.0 1,193.9 1,290.3 616.1 384.3
Normal Discount Period: 0.647 1.647 2.647 3.647 4.647 5.647 6.647 7.647 8.647 9.647Mid-Year Discount Period: 0.323 1.147 2.147 3.147 4.147 5.147 6.147 7.147 8.147 9.147
Annual Free Cash Flow Growth Rate: 67.5% 25.8% 27.4% 24.6% 21.9% 19.0% 16.5% 16.8% (48.4%) (32.6%)
Annual EBITDA: 609.9 830.9 1,045.5 1,309.5 1,596.8 1,903.3 2,210.4 2,592.5 798.0 873.5 Annual EBITDA Growth Rate: 43.0% 36.3% 25.8% 25.3% 21.9% 19.2% 16.1% 17.3% (69.2%) 9.5%
Goldman Stanley
Jaguar Discounted Cash Flow Analysis
15
($ in Millions Except Per Share Data)
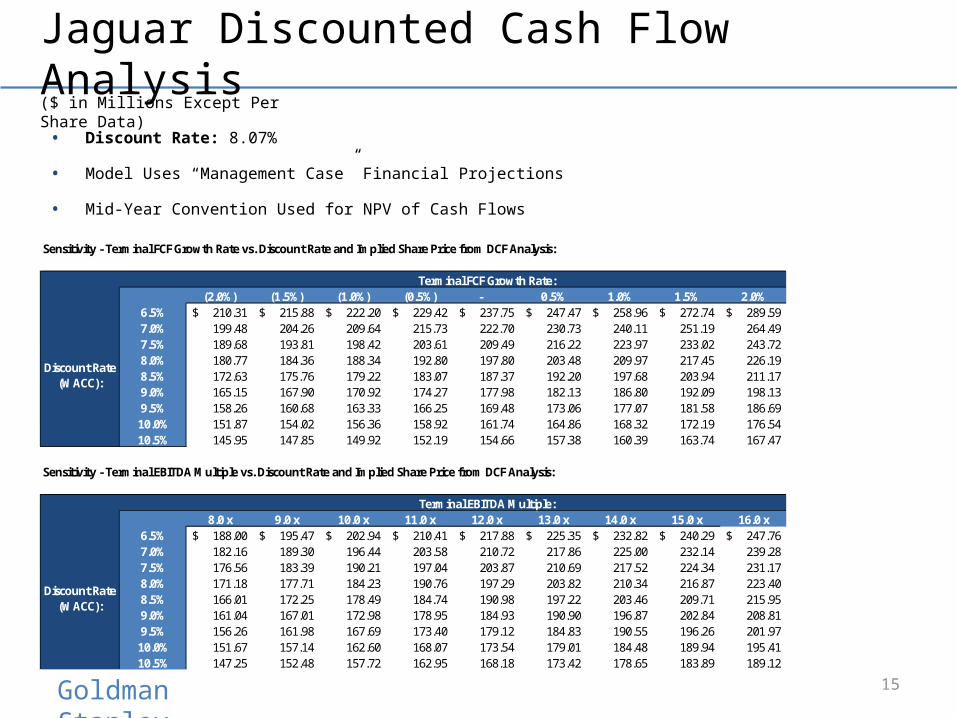
Sensitivity - Terminal FCF Growth Rate vs. Discount Rate and Implied Share Price from DCF Analysis:
Terminal FCF Growth Rate:19954.0% (2.0%) (1.5%) (1.0%) (0.5%) - 0.5% 1.0% 1.5% 2.0%
6.5% 210.31$ 215.88$ 222.20$ 229.42$ 237.75$ 247.47$ 258.96$ 272.74$ 289.59$ 7.0% 199.48 204.26 209.64 215.73 222.70 230.73 240.11 251.19 264.49 7.5% 189.68 193.81 198.42 203.61 209.49 216.22 223.97 233.02 243.72 8.0% 180.77 184.36 188.34 192.80 197.80 203.48 209.97 217.45 226.19 8.5% 172.63 175.76 179.22 183.07 187.37 192.20 197.68 203.94 211.17 9.0% 165.15 167.90 170.92 174.27 177.98 182.13 186.80 192.09 198.13 9.5% 158.26 160.68 163.33 166.25 169.48 173.06 177.07 181.58 186.69
10.0% 151.87 154.02 156.36 158.92 161.74 164.86 168.32 172.19 176.54 10.5% 145.95 147.85 149.92 152.19 154.66 157.38 160.39 163.74 167.47
Sensitivity - Terminal EBITDA Multiple vs. Discount Rate and Implied Share Price from DCF Analysis:
Terminal EBITDA Multiple:19640.2% 8.0 x 9.0 x 10.0 x 11.0 x 12.0 x 13.0 x 14.0 x 15.0 x 16.0 x
6.5% 188.00$ 195.47$ 202.94$ 210.41$ 217.88$ 225.35$ 232.82$ 240.29$ 247.76$ 7.0% 182.16 189.30 196.44 203.58 210.72 217.86 225.00 232.14 239.28 7.5% 176.56 183.39 190.21 197.04 203.87 210.69 217.52 224.34 231.17 8.0% 171.18 177.71 184.23 190.76 197.29 203.82 210.34 216.87 223.40 8.5% 166.01 172.25 178.49 184.74 190.98 197.22 203.46 209.71 215.95 9.0% 161.04 167.01 172.98 178.95 184.93 190.90 196.87 202.84 208.81 9.5% 156.26 161.98 167.69 173.40 179.12 184.83 190.55 196.26 201.97
10.0% 151.67 157.14 162.60 168.07 173.54 179.01 184.48 189.94 195.41 10.5% 147.25 152.48 157.72 162.95 168.18 173.42 178.65 183.89 189.12
Discount Rate (WACC):
Discount Rate (WACC):
• Discount Rate: 8.07%
• Model Uses “Management Case” Financial Projections
• Mid-Year Convention Used for NPV of Cash Flows
Goldman Stanley
Other Valuation Considerations
• Jaguar’s corporate status in Ireland makes it an attractive candidate for a “tax inversion” deal
• Effective tax rate of 18% vs. statutory US rate of 35-40% could effectively add billions in value for the right acquirer
Salix Pharmaceuticals: Reduced tax rate would increase CY2015E Net Income from ~$450 million to ~$567 million, and at the same P / E multiple would add $2 billion in value to company’s Equity Value and Enterprise Value
$2 billion represents $31.52 per share for Jaguar in a potential sale
• Premiums Paid analysis for comparable transactions also indicates per-share premium of 30-40% in recent deals:
Actavis / Forest Labs: 31% premium paid over average 10-day price prior to deal
Mallinckrodt / Cadence: 32% premium paid over average 30-day price
Salix / Santarus: 39% premium paid over average 30-day price
16
Goldman Stanley
Other Valuation Considerations
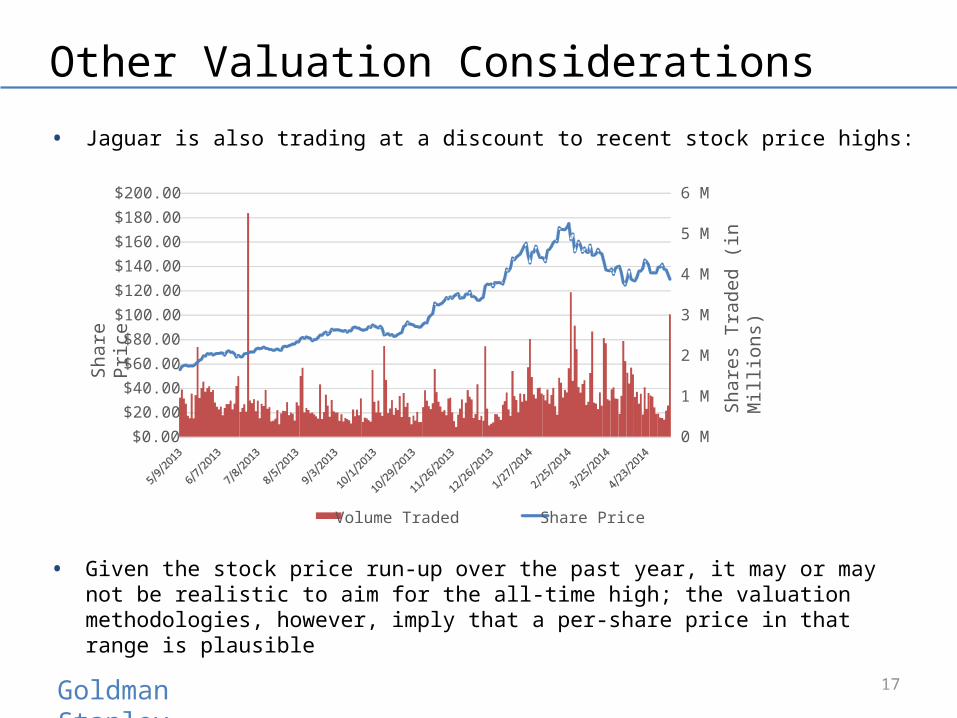
• Jaguar is also trading at a discount to recent stock price highs:
• Given the stock price run-up over the past year, it may or may not be realistic to aim for the all-time high; the valuation methodologies, however, imply that a per-share price in that range is plausible
17
0 M
1 M
2 M
3 M
4 M
5 M
6 M
$0.00
$20.00$40.00
$60.00
$80.00$100.00
$120.00
$140.00$160.00
$180.00
$200.00
Shar
es T
rade
d (in
Mill
ions
)
Shar
e Pr
ice
Volume Traded Share Price

Goldman Stanley
Valuation Conclusions
• Given Jaguar’s attractive tax status, its historical and projected financial performance, and the potential of Xyrem, we believe a premium valuation is justified
• The company’s margins and growth rates exceed those of its peer companies, and it has a lower tax rate than many of them, indicating that it should be valued in-line with, or above, the 75th percentile of the comparable company set
• A price of $200 / share (50%+ premium to the current price) should be the goal, with greater potential upside for a US-based partner and/or a partner with a complementary portfolio
• The DCF analysis also confirms that a value between $170 / share and $240 / share is reasonable, based on conservative Discount Rate and Terminal Value estimates and Management Case financial projections
• Premiums Paid analysis for recent deals indicates a median 30-day average price premium of ~40%; this implies a per share value of $190 for Jaguar
18

Goldman Stanley
Potential Strategic Partners
19

Goldman Stanley
Potential Strategic Partners
• Size, ability to pay, tax/corporate headquarters status, product/pipeline, and strategic fit should all be considered
• US-headquartered partners are ideal since tax rates are highest there; several Canadian and Israeli companies could also qualify since tax rates are also higher than rates in the UK or Ireland
• Both branded and generics companies should be considered, in light of recent M&A activity
• Tier 1 Potential Strategic Partners
“Tier 1” acquisition candidates are significantly larger than Jaguar, are US-based with US corporate tax rates, and have a solid product/pipeline fit
• Tier 2 Potential Strategic Partners
“Tier 2” acquisition candidates are closer to Jaguar’s size and therefore have a lower ability to pay, but are still US-based with US corporate taxes and a solid product/pipeline fit
20

Goldman Stanley
Potential Partners
Tier 1 Potential Partners
Tier 2 Potential Partners
21

Goldman Stanley
Process Recommendations
22

Goldman Stanley
Key Recommendations
• We recommend engaging in targeted discussions with the Tier 1 candidates and assessing their receptiveness to M&A discussions
• At the same time, Goldman Stanley will reach out to Tier 2 candidates and introduce Jaguar as a potential partner
• M&A process with Tier 1 candidates will take significantly longer due to the scale of the companies, so we recommend conducting both processes simultaneously
• Depending on responses from Tier 1 and Tier 2 candidates, Goldman Stanley and Jaguar may do additional research to determine other potential partners and then approach them
Targeted Sell-Side M&A Broad Sell-Side M&A
< 5 potential partners 10 – 100 potential partners
6 – 12 months Time required is highly variable
Close-ended Iterative process
Higher success probability Lower success probability
23

Goldman Stanley
Specialized Negotiations With One
Party
Highly TargetedProcess
• Combination of targeted discussions plus broader search conducted in background maximizes success probability and minimizes disruption to Jaguar
• Additional parties contacted depend on responsiveness of Tier 1 and Tier 2 partners
• Interested parties would sign NDAs and then proceed into due diligence and valuation discussions with Jaguar
RECOMMENDED
Process Recommendation
BroadMarketing
Broad M&A ProcessTargeted
Discussions + Broader Search
24

Goldman Stanley
Appendix
25

Goldman Stanley
Xyrem and Erwinaze Projections – Management
26
($ in Millions Except Per Share Data)Projected
Revenue Assumptions: FY14 FY15 FY16 FY17 FY18 FY19 FY20 FY21 FY22 FY23
Xyrem Assumptions:
Total Market Size (# Potential Patients) - Xyrem: 157,000 157,000 157,000 157,000 157,000 157,000 157,000 157,000 157,000 157,000# Patients On Medication at End of Year:Average # of Patients Throughout the Year: 12,560 15,700 18,840 21,980 25,120 28,260 31,400 34,540 37,680 37,680
Growth Rate in # of Patients: 18.2% 25.0% 20.0% 16.7% 14.3% 12.5% 11.1% 10.0% 9.1% –
% of Market on Xyrem Medication: 8.0% 10.0% 12.0% 14.0% 16.0% 18.0% 20.0% 22.0% 24.0% 24.0%Post-Toggle % of Market on Xyrem Medication: 8.0% 10.0% 12.0% 14.0% 16.0% 18.0% 20.0% 22.0% 24.0% 24.0%
Annual Price Per Patient - Xyrem: 61,598$ 68,990$ 77,269$ 86,541$ 95,195$ 104,715$ 113,092$ 122,139$ 10,000$ 10,000$ Growth Rate in Price per Patient: 15.0% 12.0% 12.0% 12.0% 10.0% 10.0% 8.0% 8.0% 6.0% 6.0%Post-Toggle Growth Rate in Price per Patient: 15.0% 12.0% 12.0% 12.0% 10.0% 10.0% 8.0% 8.0% 6.0% 6.0%
Xyrem - Revenue: 773.7$ 1,083.1$ 1,455.7$ 1,902.2$ 2,391.3$ 2,959.2$ 3,551.1$ 4,218.7$ 376.8$ 376.8$ Annual Growth Rate: 35.9% 40.0% 34.4% 30.7% 25.7% 23.8% 20.0% 18.8% (91.1%) –
Erwinaze Assumptions:
Total Market Size (# Potential Patients) - Erwinaze: 3,600 3,600 3,600 3,600 3,600 3,600 3,600 3,600 3,600 3,600Average # of Patients on Erwinaze: 612 684 756 828 900 900 972 972 1,044 1,044
Growth Rate in # of Patients: 13.3% 11.8% 10.5% 9.5% 8.7% – 8.0% – 7.4% –
% of Market on Erwinaze Medication: 17.0% 19.0% 21.0% 23.0% 25.0% 25.0% 27.0% 27.0% 29.0% 29.0%
Annual Price Per Patient - Erwinaze: 332,368$ 342,339$ 352,609$ 363,187$ 374,083$ 385,305$ 396,864$ 408,770$ 421,033$ 433,664$ Growth Rate in Price per Patient: 3.0% 3.0% 3.0% 3.0% 3.0% 3.0% 3.0% 3.0% 3.0% 3.0%
Erwinaze - Revenue: 203.4$ 234.2$ 266.6$ 300.7$ 336.7$ 346.8$ 385.8$ 397.3$ 439.6$ 452.7$ Annual Growth Rate: 16.7% 15.1% 13.8% 12.8% 12.0% 3.0% 11.2% 3.0% 10.6% 3.0%

Goldman Stanley
Jaguar Income Statement – Management Case
27
($ in Millions Except Per Share Data)
ProjectedIncome Statement: FY14 FY15 FY16 FY17 FY18 FY19 FY20 FY21 FY22 FY23
Revenue:Existing Products:
Xyrem Sales: 773.7$ 1,083.1$ 1,455.7$ 1,902.2$ 2,391.3$ 2,959.2$ 3,551.1$ 4,218.7$ 376.8$ 376.8$ Erwinaze Sales: 203.4 234.2 266.6 300.7 336.7 346.8 385.8 397.3 439.6 452.7 Defitelio Sales: 57.8 79.8 107.1 140.7 182.0 209.3 240.7 276.9 318.4 366.1 Other Sales and Royalties: 142.0 156.2 168.7 182.1 193.1 204.7 214.9 225.6 234.7 244.0
Risk-Adjusted Pipeline Drug Sales:JZP-110 Sales: - - - 28.5 71.7 133.2 159.8 253.1 292.7 387.8 JZP-386 Sales: - - - - - - - - - -
Total Revenue: 1,176.9 1,553.3 1,998.0 2,554.3 3,174.8 3,853.2 4,552.3 5,371.6 1,662.1 1,827.6 Revenue Growth: 34.9% 32.0% 28.6% 27.8% 24.3% 21.4% 18.1% 18.0% (69.1%) 10.0%
Total Cost of Product Sales: 111.8 147.6 189.9 242.8 301.7 366.2 432.6 510.5 158.0 173.7 Gross Profit: 1,065.0 1,405.6 1,808.1 2,311.5 2,873.1 3,487.0 4,119.6 4,861.1 1,504.2 1,653.9
Gross Margin: 90.5% 90.5% 90.5% 90.5% 90.5% 90.5% 90.5% 90.5% 90.5% 90.5%
Operating Expenses:Selling, General, and Administrative: 376.6 466.0 614.8 802.8 1,015.9 1,252.3 1,499.6 1,790.5 559.9 621.4 Research and Development: 83.3 116.5 159.8 217.1 285.7 366.1 455.2 537.2 166.2 182.8 Acquired In-Process Research & Development: 127.0 - - - - - - - - - Intangible Asset Amortization: 129.5 126.2 121.8 121.7 118.2 100.7 100.7 100.7 100.7 100.7
Total Operating Expenses: 716.3 708.6 896.4 1,141.6 1,419.9 1,719.0 2,055.5 2,428.4 826.7 904.8
Operating Income (EBIT): 348.7 697.0 911.7 1,169.9 1,453.2 1,768.0 2,064.2 2,432.8 677.4 749.1 Operating (EBIT) Margin: 29.6% 44.9% 45.6% 45.8% 45.8% 45.9% 45.3% 45.3% 40.8% 41.0%
Other Income / (Expense):Interest Expense, Net: (48.6) (38.1) (38.1) (18.1) (18.1) (0.2) - - - - Losses and Other Items: - - - - - - - - - - Goodwill Impairment: - - - - - - - - - -
Total Other Income / (Expense): (48.6) (38.1) (38.1) (18.1) (18.1) (0.2) - - - -
Income From Continuing Operations (Before Taxes): 300.0 658.9 873.6 1,151.8 1,435.1 1,767.8 2,064.2 2,432.8 677.4 749.1 Tax Provision / (Benefit): 54.0 118.6 157.2 207.3 258.3 318.2 371.6 437.9 121.9 134.8
Income From Continuing Operations: 246.0 540.3 716.3 944.5 1,176.8 1,449.6 1,692.6 1,994.9 555.5 614.3
Income from Discontinued Operations: - - - - - - - - - -
Net Income: 246.0$ 540.3$ 716.3$ 944.5$ 1,176.8$ 1,449.6$ 1,692.6$ 1,994.9$ 555.5$ 614.3$ Effective Tax Rate: 18.0% 18.0% 18.0% 18.0% 18.0% 18.0% 18.0% 18.0% 18.0% 18.0%
Weighted Average Diluted Shares Outstanding: 61.6 61.6 61.6 61.6 61.6 61.6 61.6 61.6 61.6 61.6Diluted Earnings Per Share (EPS): 4.00$ 8.78$ 11.63$ 15.34$ 19.11$ 23.54$ 27.49$ 32.40$ 9.02$ 9.98$
EBITDA: 609.9$ 830.9$ 1,045.5$ 1,309.5$ 1,596.8$ 1,903.3$ 2,210.4$ 2,592.5$ 798.0$ 873.5$ EBITDA Margin: 51.8% 53.5% 52.3% 51.3% 50.3% 49.4% 48.6% 48.3% 48.0% 47.8%
Goldman Stanley 28
Jaguar Comparable Public Companies ($ in Millions Except Per Share Data)
Specialty Pharmaceutical Companies That Sell Primarily Branded Drugs, with LTM Revenue Between $500 Million and $2 Billion
(1) Financial data as of May 9, 2014.
Operating Statistics Capitalization Projected ProjectedEquity Enterprise Revenue EBITDA Reported Net Income Revenue EBITDA EBITDA Margin
Company Name Value(1) Value(1) LTM 12/31/2014 12/31/2015 LTM 12/31/2014 12/31/2015 LTM 12/31/2014 12/31/2015 Growth Growth LTM 12/31/2014 12/31/2015Alexion Pharmaceuticals, Inc. 31,143$ 29,697$ 1,779$ 2,171$ 2,569$ 697$ 1,074$ 1,306$ 330$ 472$ 1,123$ 18.3% 21.6% 39.2% 49.5% 50.8%Vertex Pharmaceuticals Inc. 15,689 14,079 1,002 574 1,211 (331) (478) 164 (369) (538) 119 111.0% (134.3%) (33.0%) (83.3%) 13.5%BioMarin Pharmaceutical Inc. 9,103 8,769 572 655 905 (96) (80) 65 (175) (142) 47 38.2% (181.3%) (16.7%) (12.2%) 7.2%Salix Pharmaceuticals, Ltd. 7,774 9,324 1,116 1,649 1,995 281 680 957 77 361 444 21.0% 40.6% 25.2% 41.3% 48.0%Cubist Pharmaceuticals, Inc. 5,866 6,038 1,086 1,206 1,483 233 259 295 (0) 26 48 22.9% 13.7% 21.5% 21.5% 19.9%United Therapeutics Corporation 5,861 4,781 1,161 1,255 1,387 463 629 690 250 400 441 10.5% 9.7% 39.9% 50.1% 49.7%The Medicines Company 1,699 1,533 709 775 823 96 70 166 22 (0) 106 6.1% 136.6% 13.6% 9.1% 20.2%
Maximum 31,143$ 29,697$ 1,779$ 2,171$ 2,569$ 697$ 1,074$ 1,306$ 330$ 472$ 1,123$ 111.0% 136.6% 39.9% 50.1% 50.8%75th Percentile 12,396 11,702 1,138 1,452 1,739 372 655 823 163 380 443 30.6% 31.1% 32.2% 45.4% 48.9%Median 7,774$ 8,769$ 1,086$ 1,206$ 1,387$ 233$ 259$ 295$ 22$ 26$ 119$ 21.0% 13.7% 21.5% 21.5% 20.2%25th Percentile 5,863 5,410 856 715 1,058 0 (5) 165 (88) (71) 77 14.4% (62.3%) (1.6%) (1.6%) 16.7%Minimum 1,699 1,533 572 574 823 (331) (478) 65 (369) (538) 47 6.1% (181.3%) (33.0%) (83.3%) 7.2%
Jaguar 8,196$ 9,089$ 923$ 1,177$ 1,553$ 423$ 610$ 831$ 80$ 246$ 540$ 32.0% 36.3% 45.8% 51.8% 53.5%
Valuation Statistics Capitalization Enterprise Value / Enterprise Value / Equity Enterprise Revenue(1) EBITDA(1) P / E Multiple(1)
Company Name Value(1) Value(1) LTM 12/31/2014 12/31/2015 LTM 12/31/2014 12/31/2015 LTM 12/31/2014 12/31/2015Alexion Pharmaceuticals, Inc. 31,143$ 29,697$ 16.7 x 13.7 x 11.6 x 42.6 x 27.7 x 22.7 x 94.4 x 66.0 x 27.7 xVertex Pharmaceuticals Inc. 15,689 14,079 14.1 x 24.5 x 11.6 x NM NM 85.8 x NM NM NMBioMarin Pharmaceutical Inc. 9,103 8,769 15.3 x 13.4 x 9.7 x NM NM NM NM NM NMSalix Pharmaceuticals, Ltd. 7,774 9,324 8.4 x 5.7 x 4.7 x 33.2 x 13.7 x 9.7 x NM 21.5 x 17.5 xCubist Pharmaceuticals, Inc. 5,866 6,038 5.6 x 5.0 x 4.1 x 25.9 x 23.3 x 20.5 x NM NM NMUnited Therapeutics Corporation 5,861 4,781 4.1 x 3.8 x 3.4 x 10.3 x 7.6 x 6.9 x 23.5 x 14.7 x 13.3 xThe Medicines Company 1,699 1,533 2.2 x 2.0 x 1.9 x 15.9 x 21.8 x 9.2 x 76.9 x NM 16.1 x
Maximum 31,143$ 29,697$ 16.7 x 24.5 x 11.6 x 42.6 x 27.7 x 85.8 x 94.4 x 66.0 x 27.7 x75th Percentile 12,396 11,702 14.7 x 13.5 x 10.6 x 33.2 x 23.3 x 22.2 x 85.6 x 43.8 x 20.1 xMedian 7,774$ 8,769$ 8.4 x 5.7 x 4.7 x 25.9 x 21.8 x 15.1 x 76.9 x 21.5 x 16.8 x25th Percentile 5,863 5,410 4.8 x 4.4 x 3.8 x 15.9 x 13.7 x 9.4 x 50.2 x 18.1 x 15.4 xMinimum 1,699 1,533 2.2 x 2.0 x 1.9 x 10.3 x 7.6 x 6.9 x 23.5 x 14.7 x 13.3 x
Jaguar 8,196$ 9,089$ 9.8 x 7.7 x 5.9 x 21.5 x 14.9 x 10.9 x NM 33.3 x 15.2 x

Goldman Stanley
Jaguar DCF Analysis – WACC Calculation
29
($ in Millions Except Per Share Data)
Discount Rate Calculations - Assumptions(1)
Risk-Free Rate: 2.62%Equity Risk Premium: 7.00%Pre-Tax Cost of Debt: 3.42%Cost of Preferred Stock: –
Comparable Companies - Unlevered Beta CalculationLevered Preferred Equity Unlevered
Name Beta(1) Debt(1) % Debt Stock(1) % Preferred Value(1) % Equity Tax Rate BetaAlexion Pharmaceuticals, Inc. 0.64 93.5$ 0.3% -$ – 31,142.6$ 99.7% 17.0% 0.64Vertex Pharmaceuticals Inc. 0.35 473.4 2.9% - – 15,689.4 97.1% 20.0% 0.34BioMarin Pharmaceutical Inc. 0.92 828.4 8.3% - – 9,102.5 91.7% 27.0% 0.86Salix Pharmaceuticals, Ltd. 1.18 1,944.4 20.0% - – 7,774.0 80.0% 35.0% 1.01Cubist Pharmaceuticals, Inc. 0.65 945.2 13.9% - – 5,865.8 86.1% 27.0% 0.58United Therapeutics Corporation 1.44 70.3 1.2% - – 5,861.1 98.8% 35.0% 1.43The Medicines Company 0.79 263.0 13.4% - – 1,699.3 86.6% 36.0% 0.72
Median: 0.79 473.4$ 8.3% -$ – 7,774.0$ 91.7% 27.0% 0.72
Jaguar 1.05
Jaguar - Levered Beta & WACC CalculationUnlevered Preferred Equity Levered
Beta Debt(1) % Debt Stock(1) % Preferred Value(1) % Equity Tax Rate BetaCurrent Capital Structure: 0.72 1,198.6$ 12.8% -$ – 8,196.0$ 87.2% 18.0% 0.81 "Optimal" Capital Structure: 0.72 783.6 8.3% - – 8,611.0 91.7% 18.0% 0.77
Cost of Equity Based on Comparables, Current Capital Structure: 8.26%Cost of Equity Based on Comparables, "Optimal" Capital Structure: 8.03%Cost of Equity Based on Historical Beta: 9.97%
WACC = Cost of Equity * % Equity + Cost of Debt * % Debt * (1 - Tax Rate) + Cost of Preferred Stock * % Preferred Stock
WACC, Current Capital Structure: 7.56%WACC, Current Capital Structure and Historical Cost of Equity: 9.06%WACC, "Optimal" Capital Structure: 7.59%
Average WACC Produced by All Methods: 8.07%
(1) Financial data as of May 9, 2014.


