glutaminase isoforms expression switches microrna levels
TRANSCRIPT

de los Santos‑Jiménez et al. J Biomed Sci (2021) 28:14 https://doi.org/10.1186/s12929‑021‑00712‑y
RESEARCH
Glutaminase isoforms expression switches microRNA levels and oxidative status in glioblastoma cellsJuan de los Santos‑Jiménez1, José A. Campos‑Sandoval1, Clara Márquez‑Torres1, Nieves Urbano‑Polo1, David Brøndegaard1, Mercedes Martín‑Rufián1, Carolina Lobo1, Ana Peñalver1, María C. Gómez‑García1, Janet Martín‑Campos1, Carolina Cardona1, Laura Castilla1, Felipe da Costa Souza2, Tzuling Cheng3, Juan A. Segura1, Francisco J. Alonso1, Rui Curi4, Alison Colquhoun2, Ralph J. DeBerardinis5,6,7, Javier Márquez1 and José M. Matés1*
Abstract
Background: Glutaminase isoenzymes GLS and GLS2 play apparently opposing roles in cancer: GLS acts as an onco‑protein, while GLS2 (GAB isoform) has context specific tumour suppressive activity. Some microRNAs (miRNAs) have been implicated in progression of tumours, including gliomas. The aim was to investigate the effect of GLS and GAB expression on both miRNAs and oxidative status in glioblastoma cells.
Methods: Microarray profiling of miRNA was performed in GLS‑silenced LN229 and GAB‑transfected T98G human glioblastoma cells and their wild‑type counterparts. Results were validated by real‑time quantitative RT‑PCR. Oxida‑tive status and antioxidant enzymes were determined by spectrophotometric or fluorescence assays in GLS‑silenced LN229 and T98G, and GAB‑transfected LN229 and T98G.
Results: MiRNA‑146a‑5p, miRNA‑140‑3p, miRNA‑21‑5p, miRNA‑1260a, and miRNA‑92a‑3p were downregulated, and miRNA‑1246 was upregulated when GLS was knocked down. MiRNA‑140‑3p, miRNA‑1246, miRNA‑1260a, miRNA‑21‑5p, and miRNA‑146a‑5p were upregulated when GAB was overexpressed. Oxidative status (lipid peroxidation, protein carbonylation, total antioxidant capacity, and glutathione levels), as well as antioxidant enzymes (catalase, superoxide dismutase, and glutathione reductase) of silenced GLS glioblastoma cells and overexpressed GAB glio‑blastoma cells significantly changed versus their respective control glioblastoma cells. MiRNA‑1246, miRNA‑1260a, miRNA‑146a‑5p, and miRNA‑21‑5p have been characterized as strong biomarkers of glioblastoma proliferation linked to both GLS silencing and GAB overexpression. Total glutathione is a reliable biomarker of glioblastoma oxidative status steadily associated to both GLS silencing and GAB overexpression.
Conclusions: Glutaminase isoenzymes are related to the expression of some miRNAs and may contribute to either tumour progression or suppression through certain miRNA‑mediated pathways, proving to be a key tool to switch cancer proliferation and redox status leading to a less malignant phenotype. Accordingly, GLS and GAB expression are especially involved in glutathione‑dependent antioxidant defence.
© The Author(s) 2021. Open Access This article is licensed under a Creative Commons Attribution 4.0 International License, which permits use, sharing, adaptation, distribution and reproduction in any medium or format, as long as you give appropriate credit to the original author(s) and the source, provide a link to the Creative Commons licence, and indicate if changes were made. The images or other third party material in this article are included in the article’s Creative Commons licence, unless indicated otherwise in a credit line to the material. If material is not included in the article’s Creative Commons licence and your intended use is not permitted by statutory regulation or exceeds the permitted use, you will need to obtain permission directly from the copyright holder. To view a copy of this licence, visit http://creat iveco mmons .org/licen ses/by/4.0/. The Creative Commons Public Domain Dedication waiver (http://creat iveco mmons .org/publi cdoma in/zero/1.0/) applies to the data made available in this article, unless otherwise stated in a credit line to the data.
Open Access
*Correspondence: [email protected] Departamento de Biología Molecular y Bioquímica and Instituto de Investigación de Biomedicina de Málaga (IBIMA), Universidad de Málaga, Málaga, SpainFull list of author information is available at the end of the article
Page 2 of 16de los Santos‑Jiménez et al. J Biomed Sci (2021) 28:14
BackgroundAlthough metabolic profiles of tumours depend on both the genotype and tissue of origin, cancer cells have a very different metabolic profile compared to normal cells [1]. Glutaminase (GA; EC 3.5.1.2) catalyses the first step of glutaminolysis transforming glutamine into glutamate. Glutamate is one of the precursor amino acids for glu-tathione, which is present within the cell in a reduced (GSH) and an oxidized form (GSSG) [2]. The ratio of GSH/GSSG is the most important regulator of the cel-lular redox status, which together with metabolic stress switched by glutamine and GA can be a key regulatory tool to determine cell fate, leading to normal or tumour proliferation [3]. In humans, the GA family consists of two genes, GLS and GLS2, located in chromosome 2 and 12, respectively [2]. The GLS gene encodes two iso-forms, known as kidney (K-type) glutaminase or KGA, and a shorter spliced form named glutaminase C or GAC [4]. These two isoenzymes are usually referred to as GLS [3]. On the other hand, the GLS2 gene codes for the liver (L-type) isozymes, named LGA, as well as for a longer isoform named GAB originally described in breast cancer cells [2]. Both isoenzymes are collectively designated as GLS2 [3].
MiRNAs are a family of 19- to 25-nucleotides noncod-ing small RNAs that primarily function as gene regulators suppressing mRNA translation. Aberrant miRNA expres-sion has been described for several human malignancies, and this new class of small regulatory RNAs can have both oncogenic and tumour suppressor functions [5]. MiRNAs may interact with the 3’-UTRs of target mRNA molecules through partial sequence homology. They form an important class of regulators that participate in diverse biological functions including cell prolifera-tion, differentiation and apoptosis. In fact, recent studies have shown that some miRNAs regulate the expression of several tumour suppressors and oncogenes and their dysregulation contributes to carcinogenesis [6]. It is now evident that changes in miRNA are involved in cancer progression, but the mechanisms of transcriptional regu-lation of miRNAs remain unknown [5]. To test if GLS iso-enzyme expression is essential for miRNA regulation in glioblastoma (GBM) cells, an independent GLS-targeted shRNA was expressed in LN229 cells. We chose this cell line because it uses glutamine as the preferred ana-plerotic precursor when given access to a physiological mixture of nutrients [7]. Furthermore, this cell line does not express appreciable amounts of the GLS2 isoforms LGA or GAB, increasing the likelihood of reducing cell
growth by targeting GLS [7]. Additionally, stable trans-fection of GBM T98G cells with a vector carrying human full-length GAB sequence, T98G-GAB(+) [3], was car-ried out to ascertain the role of GAB in GBM cells, which has been linked to p53 pathway and antioxidant function [2, 3]. Hence, GLS2 increased cellular levels of GSH and NADH and decreases reactive oxygen species (ROS) lev-els in hepatocarcinoma cells [8]. Consistently, GLS2 pro-tected these cells from DNA oxidation and ROS-sensitive apoptosis [9]. On the other hand, miRNA-200c induced ROS generation in ischemic cardiomyocytes through GA as GLS has been characterized as a direct target of miR-200c in this cell model [10]. Interestingly, long non-coding ribonucleic acid (lncRNA) urothelial carcinoma-associated 1 (UCA1) was highly expressed in bladder cancer cells. UCA1 regulates the expression of GLS2 by interfering with miR-16, and blocked ROS formation in bladder cancer [11]. In this study, we aim to elucidate whether some miRNAs can be modulated either by inhi-bition of GLS or by overexpression of GAB, impacting the redox state of cancer cells and contributing to the alterations in the markers of oxidative stress.
MethodsCell lines, culture conditions and stable transfectionsGLS-silenced LN229 and its control LN229 cells were established and characterized as described [7]. Both GLS isoforms KGA and GAC have been silenced as previ-ously published by authors [3, 7]. Those cells were cul-tured in Dulbecco’s Modified Eagle Medium (DMEM) supplemented with 10 % foetal bovine serum (FBS), 100 I.U./mL penicillin, 100 µg/mL streptomycin, and 6 mM L-glutamine as previously described by authors [7]. In all stable knockdown experiments, very few detached cells were noted in the culture, and these were not included in growth and viability counts. T98G human GBM cell line was purchased from American Type Culture Collection (ATCC, Rockville, MD, USA). T98G-GAB(+) and control cells T98G-pcDNA were maintained in minimum essen-tial medium supplemented with 10 % FBS, 1 % non-essen-tial amino acids, and 100 I.U./mL penicillin and 100 µg/mL streptomycin. LN229-GAB(+) and control LN229-pcDNA human GBM cell lines were kindly provided by Monika Szeliga, Department of Neurotoxicology, Mossakowski Medical Research Centre, Polish Acad-emy of Sciences, Warsaw, Poland. LN229-GAB(+) and LN229-pcDNA cell lines were maintained in DMEM as previously described for other LN229 cell lines [7]. GLS-silenced T98G and its control T98G were generated by
Keywords: Antioxidant enzymes, Cancer, Glioblastoma, Glutaminase, microRNA, Oxidative stress
Page 3 of 16de los Santos‑Jiménez et al. J Biomed Sci (2021) 28:14
transient silencing, using GLS-targeted small interferent RNAs (siRNAs) and a negative control siRNA transfec-tion, respectively. Cells were cultured in DMEM as previ-ously described for other T98G models. All cultures were maintained at 37 °C in a humidified atmosphere with 95 % air and 5 % CO2. T98G-GAB(+), T98G-pcDNA, LN229-GAB(+) and LN229-pcDNA cell lines were obtained by stable transfection of T98G or LN229 cells with the full-length cDNA sequence encoding human GAB isoform or empty pcDNA3 vector, respectively, as described pre-viously [3, 12]. The culture medium for the polyclonal populations of T98G-GAB(+) and its control T98G-pcDNA, and for LN229-GAB(+) and its control LN229-pcDNA cells containing the neomycin-resistance gene was supplemented with 0.5 and 0.75 mg/mL geneticin, respectively. All cell lines were authenticated by both microscopic cellular morphology and growth curve anal-ysis. All cell lines were also checked to be free of myco-plasma contamination.
Protein expressionKGA and GAC downregulation was confirmed in the newly prepared cell line, T98G-GLS(−) by Western-blot (Additional file 1: Fig. S1). Cells were washed in PBS and harvested in lysis buffer (1 % NP-40, 150 mM NaCl, 50 mM Tris-HCl pH 8.0, supplemented with cOmplete™ Mini Protease Inhibitor, Roche, Indianapolis, IN, USA). Lysates were centrifuged at 12,000 g, 15 min at 4 °C. Supernatants were collected and stored at -80 °C. Pro-tein quantification was performed using Pierce™ BCA Protein Assay Kit (ThermoFisher Scientific, Waltham, MA, USA). After heating 5 min at 95 °C, twenty micro-grams of protein was resolved on 10 % polyacrylamide-SDS gels and then electrotransferred to nitrocellulose membranes. Membranes were blocked for 1 h at RT with 5 % non-fat milk in TBST. For GLS detection, two primary antibodies targeting specifically KGA or GAC isoforms were used, diluted in 5 % BSA in TBST and incubated overnight at 4 °C in agitation. These two GLS-targeted antibodies were kindly donated by Prof. Nor-man P. Curthoys (Colorado State University, CO, USA), both were generated in Rabbit again peptides containing the 20 C-terminal aminoacids of human KGA or GAC, respectively. Both antibodies were demonstrated to react specifically with its GLS isoform (KGA or GAC), and not to react with other glutaminase isoforms [3]. After incubation with respective primary antibodies, the mem-branes were washed in TBST and incubated 1 h RT with a commercial secondary HRP-conjugated Goat anti rabbit antibody (A0545, Merck) in 5 % BSA in TBST, and visu-alized in a ChemiDoc™ Gel Imaging System (Bio-Rad, Hercules, CA, USA), using an enhanced chemiluminis-cence (ECL) detection system (SuperSignal™ West Pico,
ThermoFisher Scientific). A commercial antibody target-ing β-Actin (MAB1501, Merck) was used as a loading control, following the same procedure described before for the GLS antibodies, but using a Rabbit anti Mouse secondary HRP-conjugated antibody (A9044, Merck) in 5 % BSA in TBST (Additional file 1: Fig. S1a, c). For data quantification, Image Lab Software (Bio-Rad) was used, following the manufacturer’s instructions. In brief, each band was detected and selected, and background signal was descarted. After that, net values corresponding to the signal of each KGA or GAC band was normalized to β-Actin signal. For a more clear representation, the values obtained for T98G-GLS(−) and its T98G control were referred to the T98G control values, and the result-ing ratio was represented (Additional file 1 : Fig. S1b, d).
RNA interference and miRNA array experimentsAll RNA interference (RNAi) experiments used pools of cells. Vectors for RNAi, lentiviral particles and details to obtain GLS knockdown LN229 cells have been described previously by authors [7]. Stably infected pools with ade-quate silencing were maintained with 1 µg/mL puromy-cin. LN229-GLS (−) express an shRNA targeting GLS, while its control LN229 cells contain the same construct but expressing green fluorescent protein (GFP) (LN229-GFP) instead of the GLS-targeted shRNA. GLS silenc-ing in T98G cells were carried out by transfection using Lipofectamine™ 3000 reagent (Invitrogen, Grand Island, NY, USA) with GLS-targeted siRNAs, using a 1:1 mixture of two commercial siRNAs targeting GLS (NM_014905, sequence start around 1072 and 780, Merck KGaA, Darmstadt, Germany).
For miRNA expression analysis of different GBM cell lines, RNA was extracted using standard RNA extraction protocols (Trizol™, Invitrogen, Grand Island, NY, USA) according to manufacturer’s instructions. Four vials con-taining the GBM cell samples were shipped to Miltenyi Biotec, Bergisch Gladbach (Germany), on dry ice. RNA quality was assessed with the Agilent 2100 Bioanalyser (Agilent Technologies, Palo Alto, CA). Samples included in the present analysis had RNA Integrity Numbers (RIN) between 9.8 and 10.0 (Additional file 2: Fig. S2a, b). Labelling and hybridization were performed according to user manuals of the miRXplore™ instrument (Miltenyi Biotec). In brief, 1.2 µg/sample total RNA were labelled with the red fluorescent Hy5 using the miRNA/LNA labelling Exiqon kit. A pool of synthetic miRNAs in equi-molar concentrations was designed by Miltenyi based on sequences of miRBase 9.2 and labelled with Hy3 (Addi-tional file 3: Table S1). Subsequently, the labelled material was hybridized overnight to miRXplore™ microarrays using the a-Hyb™ Hybridization Station (Miltenyi Bio-tec). Fluorescence signals of the hybridized miRXplore™
Page 4 of 16de los Santos‑Jiménez et al. J Biomed Sci (2021) 28:14
microarrays were detected using ImaGene® software (Biodiscovery, Hawthorne, CA, USA) and raw data were acquired with PIQOR™ analyser software (Miltenyi Bio-tec), as detailed in Additional file 2: Fig. S2c, d.
RNA isolation and real‐time quantitative reverse transcription‑PCRTotal RNA was isolated from cultured cells, using miR-CURY RNA isolation kit (Qiagen, Hilden, Germany) according to the manufacturer’s instructions. Twelve miRNAs were selected from the miRNA microar-ray analysis (see Table 1). Only the RNA samples with 260/280 ratios of 1.8–2.0 were used for further investi-gation. cDNA was generated from 1 µg total RNA using the miRCURY LNA Universal RT microRNA PCR, Uni-versal cDNA Synthesis Kit II (Qiagen). Real-time quan-titative reverse transcriptase-polymerase chain reaction (real-time qRT-PCR) was performed using the miRCURY LNA Universal RT microRNA PCR, ExiLENT SYBR® Green PCR Kit (Qiagen) according to the manufactur-er’s instructions, using CFX96 Real-Time System C1000 Thermal Cycler (Bio-Rad). Oligonucleotides sequences are shown in Table 1. Samples that lacked either a tem-plate or reverse transcriptase were used as controls. To normalize the data for quantification of miRNAs, U6 small nuclear RNA was selected as the best endog-enous control. Control LN229 and T98G cell lines were used as the miRNA expression level references. Real-time qRT-PCR amplifications for the miRNAs and U6 snRNA were performed after an initial denaturation step of 10 min at 95 °C followed by 40 cycles of 10-sec
denaturation at 95 °C and 1-min annealing/extension at 60 °C. The relative expression of each miRNA was cal-culated according to the comparative 2−ΔΔCt quantifica-tion method where ΔCt=Ct(sample) − Ct(normaliser) and ΔΔCt = ΔCt(sample)−ΔCt(calibrator). The control U6 reactions were implemented with 5′-CTC GCT TCG GCA GCACA-3′ as the forward primer and 5′-AAC GCT TCA CGA ATT TGC GT-3′ as the reverse primer. Stand-ard deviation (SD) was incorporated into fold change by expressing the fold change as a range. This is done by incorporating the SD into the formula: 2 − ΔΔCt + SD and 2 − ΔΔCt – SD.
GSH assaysThe level of total GSH in every cell line was determined by using glutathione assay kit obtained from Cell Biolabs INC, San Diego, California, USA (#STA-312-T), accord-ing to the manufacturer’s instructions. Briefly, approxi-mately 3.5 × 10⁶ cells were resolved. Supernatant samples were transferred to a microplate and added 25 µL of glu-tathione reductase (GR), 25 µL of NADPH solution, 100 µL of cell lysate, and 50 µL of assay buffer with 5,5′-dith-iobis-(2-nitrobenzoic acid) (DTNB), reading every 60 s, during 10 min, at 405 nm. Absorbance was determined using a microplate spectrophotometer Eon, Biotek Instruments, Inc. (Winooski, VT, USA). All samples were run in duplicate. Total GSH amounts were normalized by the protein content (Bradford) in each sample, and a ratio was calculated by dividing the experimental values by the control values for each independent experiment.
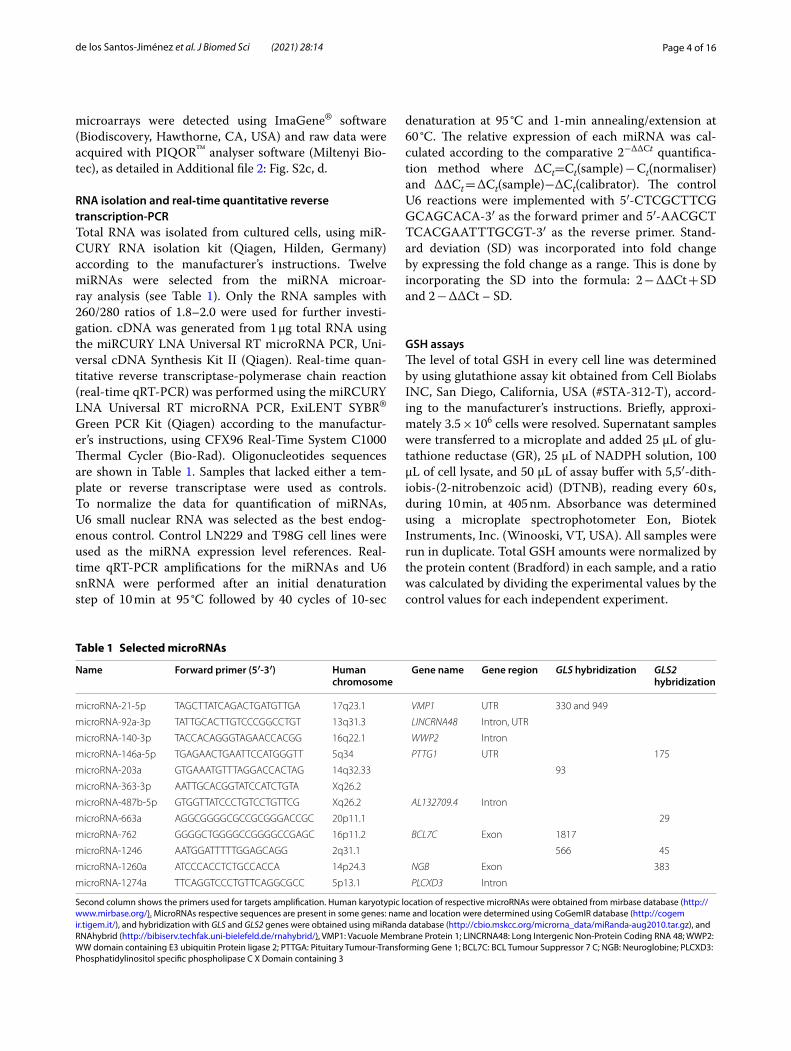
Table 1 Selected microRNAs
Second column shows the primers used for targets amplification. Human karyotypic location of respective microRNAs were obtained from mirbase database (http://www.mirba se.org/). MicroRNAs respective sequences are present in some genes: name and location were determined using CoGemIR database (http://cogem ir.tigem .it/), and hybridization with GLS and GLS2 genes were obtained using miRanda database (http://cbio.mskcc .org/micro rna_data/miRan da‑aug20 10.tar.gz), and RNAhybrid (http://bibis erv.techf ak.uni‑biele feld.de/rnahy brid/). VMP1: Vacuole Membrane Protein 1; LINCRNA48: Long Intergenic Non‑Protein Coding RNA 48; WWP2: WW domain containing E3 ubiquitin Protein ligase 2; PTTGA: Pituitary Tumour‑Transforming Gene 1; BCL7C: BCL Tumour Suppressor 7 C; NGB: Neuroglobine; PLCXD3: Phosphatidylinositol specific phospholipase C X Domain containing 3
Name Forward primer (5′‑3′) Human chromosome
Gene name Gene region GLS hybridization GLS2 hybridization
microRNA‑21‑5p TAG CTT ATC AGA CTG ATG TTGA 17q23.1 VMP1 UTR 330 and 949
microRNA‑92a‑3p TAT TGC ACT TGT CCC GGC CTGT 13q31.3 LINCRNA48 Intron, UTR
microRNA‑140‑3p TAC CAC AGG GTA GAA CCA CGG 16q22.1 WWP2 Intron
microRNA‑146a‑5p TGA GAA CTG AAT TCC ATG GGTT 5q34 PTTG1 UTR 175
microRNA‑203a GTG AAA TGT TTA GGA CCA CTAG 14q32.33 93
microRNA‑363‑3p AAT TGC ACG GTA TCC ATC TGTA Xq26.2
microRNA‑487b‑5p GTG GTT ATC CCT GTC CTG TTCG Xq26.2 AL132709.4 Intron
microRNA‑663a AGG CGG GGC GCC GCG GGA CCGC 20p11.1 29
microRNA‑762 GGG GCT GGG GCC GGG GCC GAGC 16p11.2 BCL7C Exon 1817
microRNA‑1246 AAT GGA TTT TTG GAG CAG G 2q31.1 566 45
microRNA‑1260a ATC CCA CCT CTG CCA CCA 14p24.3 NGB Exon 383
microRNA‑1274a TTC AGG TCC CTG TTC AGG CGCC 5p13.1 PLCXD3 Intron

Page 5 of 16de los Santos‑Jiménez et al. J Biomed Sci (2021) 28:14
GR activity was measured using the Glutathione Reductase Assay kit from Cell Biolabs, INC. (#STA-812), as described by suppliers. In brief, approximately 3.5 × 10⁶ cells were used for each experiment. Then, 25 µL of NADPH solution was added to a well in the 96 well plate and then 100 µL of cell lysate, 25 µL of GSSG, and 50 µL of assay buffer containing DTNB were added to each well. The absorbance was read at 405 nm every 1 min for 10 min in a microplate spectrophotometer Eon, Biotek Instruments, Inc. to calculate the activ-ity. All samples were run in duplicate. GR activities were normalized by the protein content (Bradford) in each sample, and a ratio was calculated by dividing the experimental values by the control values for each inde-pendent experiment.
Measurement of antioxidant activitiesCatalase (CAT) activity was measured using the Cata-lase Assay kit from Cell Biolabs, INC (#STA-341-T), according to the manufacturer’s instructions. In brief, approximately 3.5 × 10⁶ cells were used for each experi-ment. Then, 20 µL of cytosolic lysate was mixed with 50 µL of 12 mM H2O2 solution and incubated for 1 min at room temperature. The reaction was stopped by adding 50 µL of stop solution (containing sodium azide). Then, 5 µL out of the 120 µL reaction mixture was mixed with 250 µL of the colour reagent in a new microplate. After 50 min of incubation for colour development, the absorbance was measured at 520 nm in a micro-plate spectrophotometer Eon, Biotek Instruments, Inc. All samples were run in duplicate. CAT activities were normalized by the protein content (Bradford) in each sample, and a ratio was calculated by dividing the experimental values by the control values for each inde-pendent experiment.
Superoxide dismutase (SOD) activity was measured using a SOD assay kit (Cell Biolabs, INC, #STA-340-T), as described by suppliers. Approximately 3.5 × 10⁶ cells were used for each experiment. SOD activity was meas-ured by assessing the degree of inhibition of the reduc-tion of nitroblue tetrazolium by xanthine oxidase. One unit of activity was considered as the amount of pro-tein that gives 50 % inhibition of the reaction. Briefly, the cell lysates were incubated in a 96-well plate and the absorbance at 490 nm was measured kinetically at 37 °C for 30 min. Absorbance was determined using a micro-plate spectrophotometer Eon, Biotek Instruments, Inc. All samples were run in duplicate. SOD activities were normalized by the protein content (Bradford) in each sample, and a ratio was calculated by dividing the experi-mental values by the control values for each independent experiment.
Oxidative stress assessmentTotal antioxidant capacity (TAC) was determined using Cell Biolabs, INC kit (#STA-360-T), evaluating cupric reducing antioxidant capacity, based on the complex equilibria between Cu(II)–bathocuproinedisulfonic acid and Cu(I)–bathocuproinedisulfonic acid. Briefly, 3.5 × 10⁶ cells were used for each experiment. Then, 20 µL of cell lysate was loaded into a well in the 96 well plate and added 180 µL of reaction mix. Absorbance was quan-tified at 490 nm before adding 50 µL of Cu(II) solution to each well. Samples were incubated 5 min at RT; then, redox reactions were halted with 50 µL of a stop solu-tion and final absorbance was measured. Absorbance was determined using a microplate spectrophotometer Eon, Biotek Instruments, Inc. All samples were run in duplicate. TAC values were calculated as nmol Copper Reducing Equivalents (CRE) and normalized by the pro-tein content (Bradford) in each sample, and then a ratio was calculated by dividing the experimental values by the control values for each independent experiment.
Lipid peroxidation was evaluated by thiobarbituric acid reactive substances (TBARS) method, using Cell Biolabs, INC kit (#STA-330-T), which is based on malondial-dehyde (MDA) reaction with TBARS, producing a pink complex with a peak absorbance at 532 nm. To ensure that no lipid oxidation occurs during the assay, butylated hydroxytoluene was added to the sample prior to lysis. Approximately 3.5 × 10⁶ cells were used for each experi-ment. Cell lysates were used to measure lipid peroxida-tion level according to the manufacturer’s instruction. Briefly, 100 µL of cell lysate were treated with reagents during 1 h at 95 °C, cooled on ice for 5 min, centrifuged at 1000 g for 15 min and used for measurement in a 96-well plate. Absorbance was determined at 532 nm using a microplate spectrophotometer Eon, Biotek Instruments, Inc. All samples were run in duplicate. TBARS values were normalized by the protein content (Bradford) in each sample and a ratio was calculated by dividing the experimental values by the control values for each inde-pendent experiment.
Protein carbonylation was performed as described by Cell Biolabs, INC kit (#STA-307-T) using a fluorescein 5-thiosemicarbazide (FTC)-based method. Approxi-mately 7 × 10⁶ cells were used for each experiment. In brief, 50 µL of cell lysate was mixed with 50 µL of FCT solution. Proteins were precipitated by the addition of 4-volumes of cold 20 % trichloroacetic acid. Follow-ing 10 min incubation on ice, tubes were centrifuged at 9000 g for 10 min at 4 °C. Supernatants were decanted; precipitates were washed 3 times by vortexing with 1 mL of acetone. Finally, acetone supernatant was carefully decanted out and protein precipitates were air dried, sol-ubilized with 50 µL of 6 M guanidine hydrochloride and
Page 6 of 16de los Santos‑Jiménez et al. J Biomed Sci (2021) 28:14
diluted by the addition of 450 µL of pH 7.0 buffer. Protein concentration in each of these samples was measured by Bradford assay. The samples were aliquoted 100 µL per well in triplicate, and fluorescence measured in a micro-plate fluorescence reader FL600, Biotek Instruments, Inc., with excitation at 480 nm and emission at 530 nm. Fluorescence readings from 6 wells for each sample (3 for each of the duplicates) were averaged and nanomoles of FTC-reacted carbonyls were calculated using a standard curve generated from the readings of various concentra-tions of FTC prepared in a medium similar to that of the samples. Values were normalized to the protein content and expressed as pmol carbonyl/mg protein, and finally a ratio was calculated by dividing the experimental values by the control values for each independent experiment.
Statistical analysisFor array and real-time qRT–PCR experiments, miRNAs with > 10 % undetectable expression values were excluded from the study. Statistical analysis was performed using software Statgraphics. Values were expressed as means ± SEM. Differences between groups were cal-culated with the Student’s t-test or Mann–Whitney U test. In addition, Spearman’s rank-order correlation test was performed. All results were considered significantly as p < 0.05. Experiments were performed at least three times.
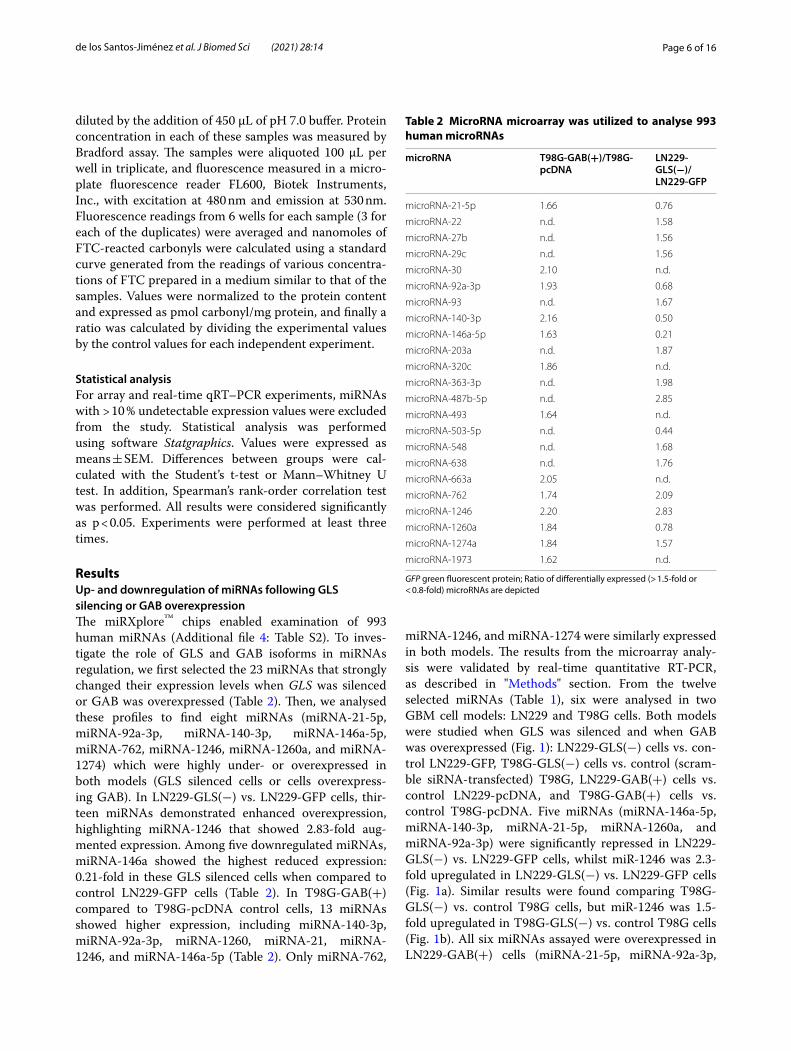
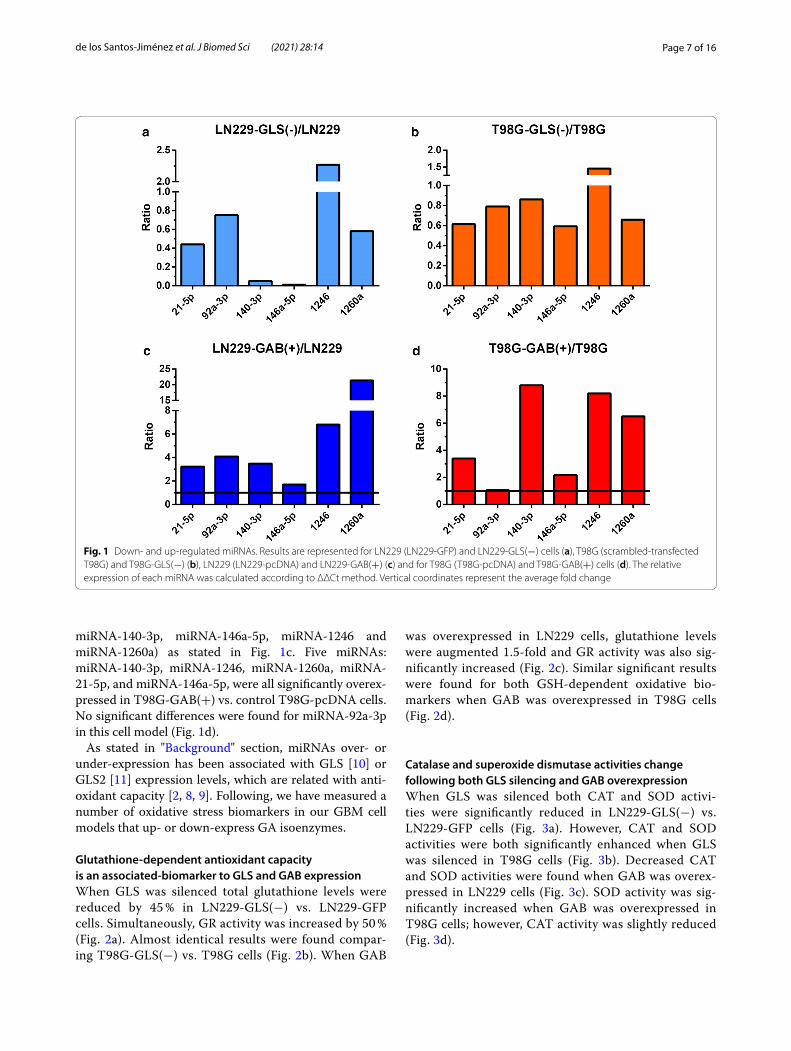
ResultsUp‑ and downregulation of miRNAs following GLS silencing or GAB overexpressionThe miRXplore™ chips enabled examination of 993 human miRNAs (Additional file 4: Table S2). To inves-tigate the role of GLS and GAB isoforms in miRNAs regulation, we first selected the 23 miRNAs that strongly changed their expression levels when GLS was silenced or GAB was overexpressed (Table 2). Then, we analysed these profiles to find eight miRNAs (miRNA-21-5p, miRNA-92a-3p, miRNA-140-3p, miRNA-146a-5p, miRNA-762, miRNA-1246, miRNA-1260a, and miRNA-1274) which were highly under- or overexpressed in both models (GLS silenced cells or cells overexpress-ing GAB). In LN229-GLS(−) vs. LN229-GFP cells, thir-teen miRNAs demonstrated enhanced overexpression, highlighting miRNA-1246 that showed 2.83-fold aug-mented expression. Among five downregulated miRNAs, miRNA-146a showed the highest reduced expression: 0.21-fold in these GLS silenced cells when compared to control LN229-GFP cells (Table 2). In T98G-GAB(+) compared to T98G-pcDNA control cells, 13 miRNAs showed higher expression, including miRNA-140-3p, miRNA-92a-3p, miRNA-1260, miRNA-21, miRNA-1246, and miRNA-146a-5p (Table 2). Only miRNA-762,
miRNA-1246, and miRNA-1274 were similarly expressed in both models. The results from the microarray analy-sis were validated by real-time quantitative RT-PCR, as described in "Methods" section. From the twelve selected miRNAs (Table 1), six were analysed in two GBM cell models: LN229 and T98G cells. Both models were studied when GLS was silenced and when GAB was overexpressed (Fig. 1): LN229-GLS(−) cells vs. con-trol LN229-GFP, T98G-GLS(−) cells vs. control (scram-ble siRNA-transfected) T98G, LN229-GAB(+) cells vs. control LN229-pcDNA, and T98G-GAB(+) cells vs. control T98G-pcDNA. Five miRNAs (miRNA-146a-5p, miRNA-140-3p, miRNA-21-5p, miRNA-1260a, and miRNA-92a-3p) were significantly repressed in LN229-GLS(−) vs. LN229-GFP cells, whilst miR-1246 was 2.3-fold upregulated in LN229-GLS(−) vs. LN229-GFP cells (Fig. 1a). Similar results were found comparing T98G-GLS(−) vs. control T98G cells, but miR-1246 was 1.5-fold upregulated in T98G-GLS(−) vs. control T98G cells (Fig. 1b). All six miRNAs assayed were overexpressed in LN229-GAB(+) cells (miRNA-21-5p, miRNA-92a-3p,
Table 2 MicroRNA microarray was utilized to analyse 993 human microRNAs
GFP green fluorescent protein; Ratio of differentially expressed (> 1.5‑fold or < 0.8‑fold) microRNAs are depicted
microRNA T98G‑GAB(+)/T98G‑pcDNA
LN229‑GLS(−)/LN229‑GFP
microRNA‑21‑5p 1.66 0.76
microRNA‑22 n.d. 1.58
microRNA‑27b n.d. 1.56
microRNA‑29c n.d. 1.56
microRNA‑30 2.10 n.d.
microRNA‑92a‑3p 1.93 0.68
microRNA‑93 n.d. 1.67
microRNA‑140‑3p 2.16 0.50
microRNA‑146a‑5p 1.63 0.21
microRNA‑203a n.d. 1.87
microRNA‑320c 1.86 n.d.
microRNA‑363‑3p n.d. 1.98
microRNA‑487b‑5p n.d. 2.85
microRNA‑493 1.64 n.d.
microRNA‑503‑5p n.d. 0.44
microRNA‑548 n.d. 1.68
microRNA‑638 n.d. 1.76
microRNA‑663a 2.05 n.d.
microRNA‑762 1.74 2.09
microRNA‑1246 2.20 2.83
microRNA‑1260a 1.84 0.78
microRNA‑1274a 1.84 1.57
microRNA‑1973 1.62 n.d.
Page 7 of 16de los Santos‑Jiménez et al. J Biomed Sci (2021) 28:14
miRNA-140-3p, miRNA-146a-5p, miRNA-1246 and miRNA-1260a) as stated in Fig. 1c. Five miRNAs: miRNA-140-3p, miRNA-1246, miRNA-1260a, miRNA-21-5p, and miRNA-146a-5p, were all significantly overex-pressed in T98G-GAB(+) vs. control T98G-pcDNA cells. No significant differences were found for miRNA-92a-3p in this cell model (Fig. 1d).
As stated in "Background" section, miRNAs over- or under-expression has been associated with GLS [10] or GLS2 [11] expression levels, which are related with anti-oxidant capacity [2, 8, 9]. Following, we have measured a number of oxidative stress biomarkers in our GBM cell models that up- or down-express GA isoenzymes.
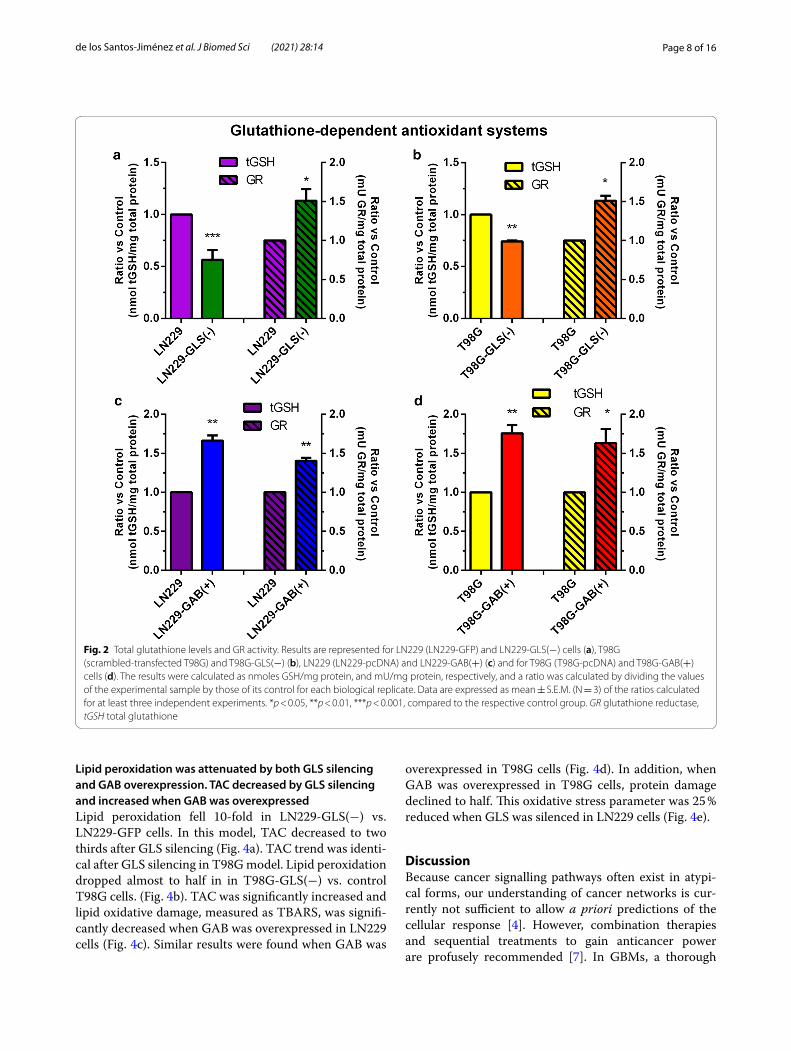
Glutathione‑dependent antioxidant capacity is an associated‑biomarker to GLS and GAB expressionWhen GLS was silenced total glutathione levels were reduced by 45 % in LN229-GLS(−) vs. LN229-GFP cells. Simultaneously, GR activity was increased by 50 % (Fig. 2a). Almost identical results were found compar-ing T98G-GLS(−) vs. T98G cells (Fig. 2b). When GAB
was overexpressed in LN229 cells, glutathione levels were augmented 1.5-fold and GR activity was also sig-nificantly increased (Fig. 2c). Similar significant results were found for both GSH-dependent oxidative bio-markers when GAB was overexpressed in T98G cells (Fig. 2d).
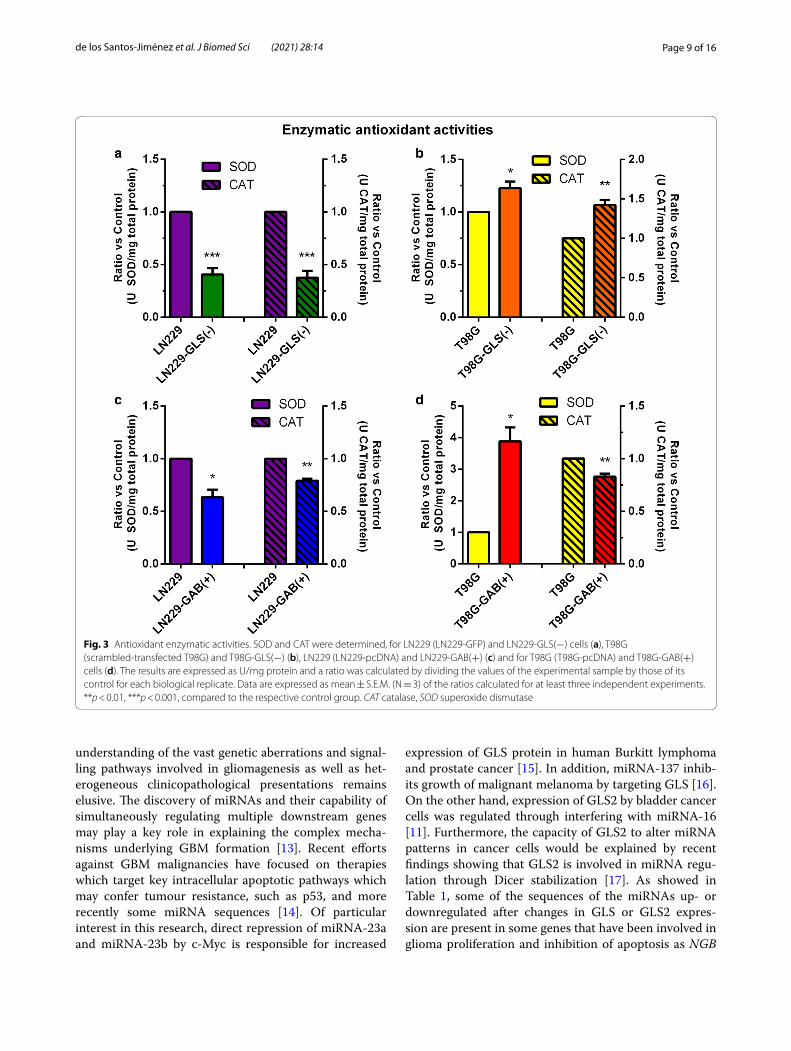
Catalase and superoxide dismutase activities change following both GLS silencing and GAB overexpressionWhen GLS was silenced both CAT and SOD activi-ties were significantly reduced in LN229-GLS(−) vs. LN229-GFP cells (Fig. 3a). However, CAT and SOD activities were both significantly enhanced when GLS was silenced in T98G cells (Fig. 3b). Decreased CAT and SOD activities were found when GAB was overex-pressed in LN229 cells (Fig. 3c). SOD activity was sig-nificantly increased when GAB was overexpressed in T98G cells; however, CAT activity was slightly reduced (Fig. 3d).
Fig. 1 Down‑ and up‑regulated miRNAs. Results are represented for LN229 (LN229‑GFP) and LN229‑GLS(−) cells (a), T98G (scrambled‑transfected T98G) and T98G‑GLS(−) (b), LN229 (LN229‑pcDNA) and LN229‑GAB(+) (c) and for T98G (T98G‑pcDNA) and T98G‑GAB(+) cells (d). The relative expression of each miRNA was calculated according to ΔΔCt method. Vertical coordinates represent the average fold change
Page 8 of 16de los Santos‑Jiménez et al. J Biomed Sci (2021) 28:14
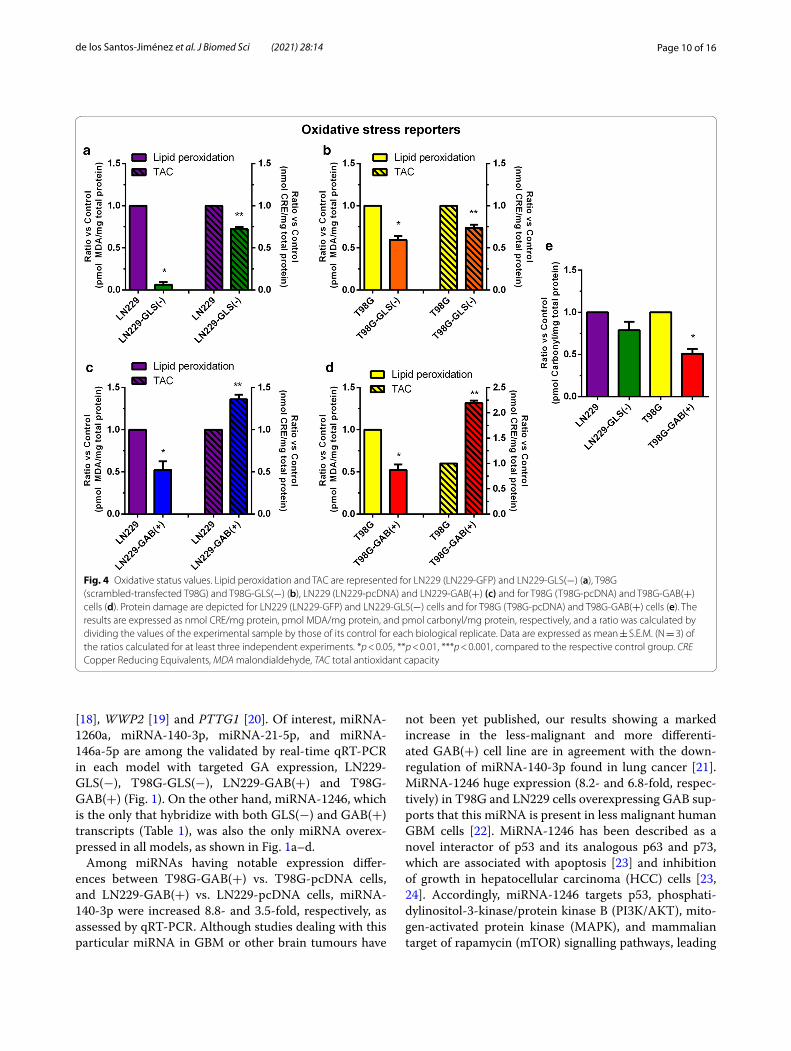
Lipid peroxidation was attenuated by both GLS silencing and GAB overexpression. TAC decreased by GLS silencing and increased when GAB was overexpressedLipid peroxidation fell 10-fold in LN229-GLS(−) vs. LN229-GFP cells. In this model, TAC decreased to two thirds after GLS silencing (Fig. 4a). TAC trend was identi-cal after GLS silencing in T98G model. Lipid peroxidation dropped almost to half in in T98G-GLS(−) vs. control T98G cells. (Fig. 4b). TAC was significantly increased and lipid oxidative damage, measured as TBARS, was signifi-cantly decreased when GAB was overexpressed in LN229 cells (Fig. 4c). Similar results were found when GAB was
overexpressed in T98G cells (Fig. 4d). In addition, when GAB was overexpressed in T98G cells, protein damage declined to half. This oxidative stress parameter was 25 % reduced when GLS was silenced in LN229 cells (Fig. 4e).
DiscussionBecause cancer signalling pathways often exist in atypi-cal forms, our understanding of cancer networks is cur-rently not sufficient to allow a priori predictions of the cellular response [4]. However, combination therapies and sequential treatments to gain anticancer power are profusely recommended [7]. In GBMs, a thorough
Fig. 2 Total glutathione levels and GR activity. Results are represented for LN229 (LN229‑GFP) and LN229‑GLS(−) cells (a), T98G (scrambled‑transfected T98G) and T98G‑GLS(−) (b), LN229 (LN229‑pcDNA) and LN229‑GAB(+) (c) and for T98G (T98G‑pcDNA) and T98G‑GAB(+) cells (d). The results were calculated as nmoles GSH/mg protein, and mU/mg protein, respectively, and a ratio was calculated by dividing the values of the experimental sample by those of its control for each biological replicate. Data are expressed as mean ± S.E.M. (N = 3) of the ratios calculated for at least three independent experiments. *p < 0.05, **p < 0.01, ***p < 0.001, compared to the respective control group. GR glutathione reductase, tGSH total glutathione
Page 9 of 16de los Santos‑Jiménez et al. J Biomed Sci (2021) 28:14
understanding of the vast genetic aberrations and signal-ling pathways involved in gliomagenesis as well as het-erogeneous clinicopathological presentations remains elusive. The discovery of miRNAs and their capability of simultaneously regulating multiple downstream genes may play a key role in explaining the complex mecha-nisms underlying GBM formation [13]. Recent efforts against GBM malignancies have focused on therapies which target key intracellular apoptotic pathways which may confer tumour resistance, such as p53, and more recently some miRNA sequences [14]. Of particular interest in this research, direct repression of miRNA-23a and miRNA-23b by c-Myc is responsible for increased
expression of GLS protein in human Burkitt lymphoma and prostate cancer [15]. In addition, miRNA-137 inhib-its growth of malignant melanoma by targeting GLS [16]. On the other hand, expression of GLS2 by bladder cancer cells was regulated through interfering with miRNA-16 [11]. Furthermore, the capacity of GLS2 to alter miRNA patterns in cancer cells would be explained by recent findings showing that GLS2 is involved in miRNA regu-lation through Dicer stabilization [17]. As showed in Table 1, some of the sequences of the miRNAs up- or downregulated after changes in GLS or GLS2 expres-sion are present in some genes that have been involved in glioma proliferation and inhibition of apoptosis as NGB
Fig. 3 Antioxidant enzymatic activities. SOD and CAT were determined, for LN229 (LN229‑GFP) and LN229‑GLS(−) cells (a), T98G (scrambled‑transfected T98G) and T98G‑GLS(−) (b), LN229 (LN229‑pcDNA) and LN229‑GAB(+) (c) and for T98G (T98G‑pcDNA) and T98G‑GAB(+) cells (d). The results are expressed as U/mg protein and a ratio was calculated by dividing the values of the experimental sample by those of its control for each biological replicate. Data are expressed as mean ± S.E.M. (N = 3) of the ratios calculated for at least three independent experiments. **p < 0.01, ***p < 0.001, compared to the respective control group. CAT catalase, SOD superoxide dismutase
Page 10 of 16de los Santos‑Jiménez et al. J Biomed Sci (2021) 28:14
[18], WWP2 [19] and PTTG1 [20]. Of interest, miRNA-1260a, miRNA-140-3p, miRNA-21-5p, and miRNA-146a-5p are among the validated by real-time qRT-PCR in each model with targeted GA expression, LN229-GLS(−), T98G-GLS(−), LN229-GAB(+) and T98G-GAB(+) (Fig. 1). On the other hand, miRNA-1246, which is the only that hybridize with both GLS(−) and GAB(+) transcripts (Table 1), was also the only miRNA overex-pressed in all models, as shown in Fig. 1a–d.
Among miRNAs having notable expression differ-ences between T98G-GAB(+) vs. T98G-pcDNA cells, and LN229-GAB(+) vs. LN229-pcDNA cells, miRNA-140-3p were increased 8.8- and 3.5-fold, respectively, as assessed by qRT-PCR. Although studies dealing with this particular miRNA in GBM or other brain tumours have
not been yet published, our results showing a marked increase in the less-malignant and more differenti-ated GAB(+) cell line are in agreement with the down-regulation of miRNA-140-3p found in lung cancer [21]. MiRNA-1246 huge expression (8.2- and 6.8-fold, respec-tively) in T98G and LN229 cells overexpressing GAB sup-ports that this miRNA is present in less malignant human GBM cells [22]. MiRNA-1246 has been described as a novel interactor of p53 and its analogous p63 and p73, which are associated with apoptosis [23] and inhibition of growth in hepatocellular carcinoma (HCC) cells [23, 24]. Accordingly, miRNA-1246 targets p53, phosphati-dylinositol-3-kinase/protein kinase B (PI3K/AKT), mito-gen-activated protein kinase (MAPK), and mammalian target of rapamycin (mTOR) signalling pathways, leading
Fig. 4 Oxidative status values. Lipid peroxidation and TAC are represented for LN229 (LN229‑GFP) and LN229‑GLS(−) (a), T98G (scrambled‑transfected T98G) and T98G‑GLS(−) (b), LN229 (LN229‑pcDNA) and LN229‑GAB(+) (c) and for T98G (T98G‑pcDNA) and T98G‑GAB(+) cells (d). Protein damage are depicted for LN229 (LN229‑GFP) and LN229‑GLS(−) cells and for T98G (T98G‑pcDNA) and T98G‑GAB(+) cells (e). The results are expressed as nmol CRE/mg protein, pmol MDA/mg protein, and pmol carbonyl/mg protein, respectively, and a ratio was calculated by dividing the values of the experimental sample by those of its control for each biological replicate. Data are expressed as mean ± S.E.M. (N = 3) of the ratios calculated for at least three independent experiments. *p < 0.05, **p < 0.01, ***p < 0.001, compared to the respective control group. CRE Copper Reducing Equivalents, MDA malondialdehyde, TAC total antioxidant capacity
Page 11 of 16de los Santos‑Jiménez et al. J Biomed Sci (2021) 28:14
to apoptosis in paclitaxel-treated HCC cells [23]. Of note, GAB has shown context-dependent tumour suppression activity as a target of the p53 family of tumour suppres-sors [2], and a recent work linked this GAB function with the negative regulation of PI3K/AKT pathway in hepato-cellular carcinoma [25]. Thus, induction of miRNA-1246 after GAB overexpression may be one key mechanism to inhibit cancer progression through p53 and PI3K/AKT dependent pathways.
T98G and LN229 GAB overexpressing cells showed respectively a 6.5- and 21.4-fold overexpression of miRNA-1260a. Correspondingly, miRNA-1260a was up-regulated in the less proliferative atypical Spitz lesions relative to Spitz skin tumours [26]. MiRNA-21-5p was 3.4- and 3.2-fold expressed respectively in T98G and LN229 GBM cells overexpressing GAB. This miRNA tar-gets the gene for p-21 protein, which is correlated with the anti-proliferative and cell death effects in T98G cells [27]. The tumour suppressing function of this miRNA was also characterized in thyroid papillary carcinoma via downregulation of Bcl-2 [28]. On the other hand, miRNA-146a-5p was 2.2- and 1.7-fold overexpressed in T98-GAB(+) and LN229-GAB(+) models, respec-tively. This is in accordance with its function as tumour suppressor in GBM by negatively regulating epider-mal growth factor receptor (EGFR) and platelet-derived growth factor receptor beta (PDGFRB) genes [29]. MiRNA-146a-5p has been described as a native molecu-lar brake for oncogenesis in aggressive and deadly brain tumours via NOTCH1 signalling [30]. It also functions as a tumour-suppressive miRNA targeting NOTCH2, inhibiting the epithelial-mesenchymal transition (EMT) progression of oesophageal squamous cell carcinoma (ESCC) [31]. Similarly, functional studies showed that this miRNA is a negative regulator of tumourigenic gene expression in microglia via its target SMAD4 [32]. On the other hand, miRNA-146a-5p inhibits cervical cancer cell proliferation, migration and invasion, repressing the expression of histone demethylase [33]. Of note, miRNA-146a-5p has been found downregulated in prostate can-cer cells treated with the anticancer agent metformin [34]. Finally, concerning miRNA-92a-3p, although no dif-ferences were found in T98G-GAB(+) vs. T98G-pcDNA cells, it was 4.1-fold overexpressed in LN229-GAB(+) vs. LN229-pcDNA cells. This data agrees with a very recent publication showing that miRNA-92a-3p overexpression is a potential biomarker of favourable outcome of chronic lymphocytic leukaemia patients [35]. Importantly, miRNA-92a-3p profile was markedly different (even or upregulated) from that downregulation described below for both LN229-GLS(−) vs. LN229-GFP cells and T98G-GLS(−) vs. control T98G cells (0.75-fold and 0.79-fold, respectively).
GBM LN229-GLS(−) cells dramatically repressed expression of miRNA-146a-5p. Its expression in T98G-GLS(−) was also decreased (0.6-fold). Although it is currently unknown whether miRNA-146a-5p possesses oncogenic properties in GBM cells, results obtained in breast cancer tissue and MCF-7 cell line support this role through the BRCA1 pathways [36]. These findings are in agreement with the role of miRNA-146a as an inflammatory miRNA that regulates the NF-κB pathway, transforming growth factor-β (TGF-β), and induces angi-ogenesis [37]. Noteworthy, miRNA-146a-5p has been recognized as a positive biomarker in lung cancer [38] and as an oncogenic factor in oral squamous cell carci-noma (OSCC). Diverse investigations have pointed out that miRNA-146a-5p affects proliferation and apoptosis in a cellular context-dependent manner, defining to this miRNA as a pleiotropic regulator of carcinogenesis [39].
LN229-GLS(−) showed 0.05-fold expression of miRNA-140-3p vs. LN229-GFP cells. However, in T98G-GLS(−) vs. control T98G cells its expression was only decreased 0.85-fold. Although not previous results have been published in GBM cells, miRNA-140-3p was up-regulated in other malignancies [40]. Versus LN229 and T98G, in both LN229-GLS(−) and T98G-GLS(−) miRNA-21-5p was underexpressed vs. their controls (0.44-fold and 0.60-fold, respectively). The oncogenic function of miRNA-21 in GBM cells was associated to the p53 circuit, targeting TGF-β, modulating cell growth, and repressing p53-mediated apoptosis in response to anticancer drugs like doxorubicin [41]. MiRNA-21-5p is also linked to tumour development in colorectal can-cer, modulating Wnt circuit, RAS-MAPK-PI3K-AKT signalling pathways, as well as TGF-β and p53 compo-nents [42]. MiRNA-21 regulated cell proliferation and apoptosis in ESCC through the AKT signalling pathway via targeting cell adhesion molecules [43]. MiRNA-21 has oncogenic properties that play important roles in many cancers, including leukaemia [44]. Multiple data show that miRNA-21 may be an independent prognostic marker for glioma proliferation and invasion, especially those gliomas with high pathological grades, and thus could also be a potential therapeutic target for molecu-lar glioma therapy [45]. MiRNA-21 target sites include a number of genes involved in apoptosis, i.e.: expression of programmed cell death four gene (PDCD4) corre-lates inversely with expression of miRNA-21 in a num-ber of human GBM cell lines such as T98G. Inhibition of miRNA-21 increases endogenous levels of PDCD4 in cell line T98G and overexpression miRNA-21 inhibits PDCD4-dependent apoptosis, functioning as an anti-apoptotic factor [46]. MiRNA-21 exerts its oncogenic function in gliomas through its post-transcriptional targets and downstream signal pathways: PDCD4,
Page 12 of 16de los Santos‑Jiménez et al. J Biomed Sci (2021) 28:14
phosphatase and tensin homolog (PTEN), tumour pro-tein 63 (TP63), tropomyosin 1 (TPM1), and tissue inhibi-tor of metalloproteases 3 (TIMP3) [47]. MiRNA-1260a was 0.58-fold and 0.65-fold underexpressed in LN229-GLS(−) and T98G-GLS(−) GBM cells. This data agrees with significant increase in the expression of miRNA-1260a in metastatic tumours as compared to the non-metastatic neuroblastoma in vivo [48]. MiRNA-92a was 0.74-fold and 0.80-fold underexpressed when GLS was silenced in LN229 and T98G cells. Properly, deplet-ing endogenous miRNA-92a-3p inhibits the rate of cell viability, cell migration, and metastasis of U87 and U251 glioma cells in vitro while diminishing tumour volume and weight of xenograft in vivo [49]. Interest-ingly, miRNA-92a is overexpressed in human GBM cells, including 6-fold in LN229 cells. This research showed that Bim is a direct functional target of miRNA-92a and that high grade gliomas show augmented miRNA-92a levels [50]. MiRNA-92a-3p has showed oncogenic prop-erties, i.e.: increasing cell proliferation, migration and invasion and inhibited cell apoptosis in vitro, as well as augmenting xenograft tumour formation in vivo, in a variety of cancers including leukaemia [44] and gastric [51] cancer. MiRNA-1246 was 2.2-fold and 1.5-fold over-expressed in GLS silenced LN229 and T98G cells, respec-tively, when compared with control LN229 and T98G cells. These results agree with findings in T98G-GAB(+) vs. T98G-pcDNA cells. In addition, upregulation of miRNA-1246 in prostate cancer significantly decreased growth, augmented apoptosis and inhibited prolifera-tion, invasiveness, and migration in vitro and in vivo [52]. Similar conclusions were obtained in lung cancer [53]. Conversely, miRNA-1246 was overexpressed in MDA-MB-231 breast cancer cells [54].
Concerning antioxidant defence systems, although not similar studies have been found in literature, discordant results have been described, i.e.: antioxidant phenethyl isothiocyanate decreases SOD activity and GSH lev-els, inducing oxidative stress and repressing LN229 cell growth [55]; but apoptosis induced by cisplatin treatment diminished SOD to impair cancer growth [56]. It has been also reported differences between SOD and CAT responses to oxidative stress and apoptosis in LN229 cells, increasing SOD but decreasing CAT activity [57]. Accordingly, not concluding results were found in our models with reference to SOD and CAT activities (Addi-tional file 5: Fig. S3c, d). Although ROS and antioxidant enzymes show a complex regulation [2], why a different tendency in SOD activity upon GAB overexpression in LN229 as compared to T98G cells is an open question. Impressive, total GSH was established as a clear bio-marker of GA-mediated redox regulation: when GLS was silenced GSH levels declined and when GAB was
overexpressed GSH content was increased (Additional file 5: Fig. S3a). Similarly, GR activity was another positive biomarker because rose following both GLS silencing and GAB overexpression (Additional file 5: Fig. S3b). Interest-ingly, GR has been associated to drug resistance in GBM cells, being a potential target for ameliorating GBM treat-ment [58]. In all models studied in this research, a reduc-tion in both lipid peroxidation and protein damage was found (Additional file 5: Fig. S3e, g), supporting the anti-oxidant effect of altering GLS and GAB expression and subsequently increasing GR activity (Additional file 5: Fig. S3b). Results depicted in Additional file 5: Fig. S3f strengthen these conclusions: when GLS is silenced in both LN229 and T98G cells TAC is significantly dipped but when GAB was overexpressed in one and the other, LN229 and T98G cells, TAC climbed significantly. There-fore, in spite of scarce studies in GBM cells, changes in oxidative status and antioxidant capacity linked to dif-ferential GA expression [3] emerge as promising support against GBM aggressiveness.
In several GBM cell lines, including T98G and LN229, GAB increased the sensitivity towards ROS through-out downregulation of the PI3K/AKT cascade [12]. Changes in oxidative stress through PI3K/AKT linked to miRNA expression levels support our results [59]. Of note, upregulation of miRNA-34a, which is induced by GLS2 through Dicer [17], suppresses antioxidant circuits (SIRT1/PGC-1α/NRF2 pathway) and enhances suscepti-bility of wild-type p53 cancer cells to ROS [60]. Sirtuin 1 (SIRT1) is involved in the redox balance and carcinogen-esis, including the proliferation of GBM cells [61]. Per-oxisome proliferator-activated receptor γ coactivator1α (PGC-1α) regulates energy metabolism and oxidative stress, evoking a more aggressive behaviour of GBM cells [62]. Nuclear erythroid factor 2-related factor 2 (NRF2) is a redox-sensitive transcription factor regulating the expression of antioxidant enzymes such as SOD [60].
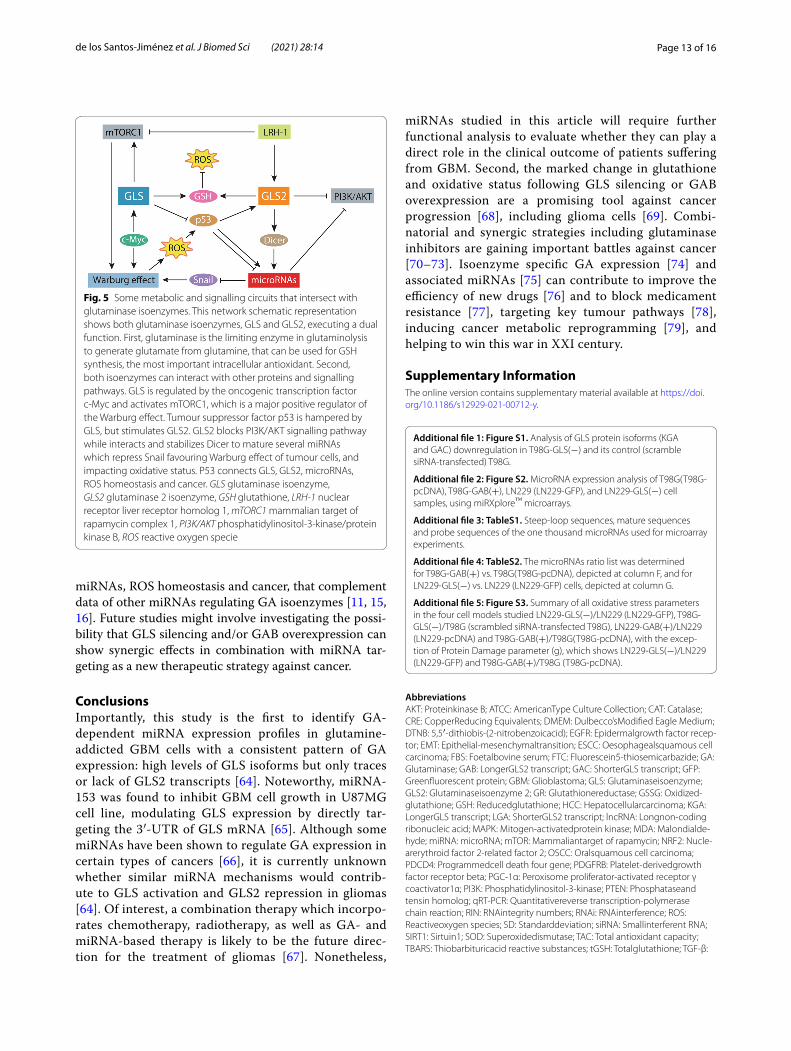
On the other hand, GLS2 displays a novel non-meta-bolic mechanism interacting and stabilizing Dicer protein to thrust miRNA maturation and inhibit Snail expression. These results indicate that GLS2 can act as a suppres-sor for migration and invasion of cancer cells, repress-ing EMT [17]. Appropriately, GLS and GLS2 target the expression of Snail through p53 regulation linking GAs to some microRNA expression, which translationally can repress Snail and oncogenic phenotype (Fig. 5). In fact, Snail induces a glycolytic switch to Warburg effect (higher glucose uptake and lactate production) by sup-pressing mitochondrial oxidative phosphorylation that may contribute to metastasis and tumour progression in breast, colon and ovary cancer [63]. Thus, GA can regu-late the expression of some miRNAs, uncovering a previ-ously unsuspected link between glutamine metabolism,
Page 13 of 16de los Santos‑Jiménez et al. J Biomed Sci (2021) 28:14
miRNAs, ROS homeostasis and cancer, that complement data of other miRNAs regulating GA isoenzymes [11, 15, 16]. Future studies might involve investigating the possi-bility that GLS silencing and/or GAB overexpression can show synergic effects in combination with miRNA tar-geting as a new therapeutic strategy against cancer.
ConclusionsImportantly, this study is the first to identify GA-dependent miRNA expression profiles in glutamine-addicted GBM cells with a consistent pattern of GA expression: high levels of GLS isoforms but only traces or lack of GLS2 transcripts [64]. Noteworthy, miRNA-153 was found to inhibit GBM cell growth in U87MG cell line, modulating GLS expression by directly tar-geting the 3′-UTR of GLS mRNA [65]. Although some miRNAs have been shown to regulate GA expression in certain types of cancers [66], it is currently unknown whether similar miRNA mechanisms would contrib-ute to GLS activation and GLS2 repression in gliomas [64]. Of interest, a combination therapy which incorpo-rates chemotherapy, radiotherapy, as well as GA- and miRNA-based therapy is likely to be the future direc-tion for the treatment of gliomas [67]. Nonetheless,
miRNAs studied in this article will require further functional analysis to evaluate whether they can play a direct role in the clinical outcome of patients suffering from GBM. Second, the marked change in glutathione and oxidative status following GLS silencing or GAB overexpression are a promising tool against cancer progression [68], including glioma cells [69]. Combi-natorial and synergic strategies including glutaminase inhibitors are gaining important battles against cancer [70–73]. Isoenzyme specific GA expression [74] and associated miRNAs [75] can contribute to improve the efficiency of new drugs [76] and to block medicament resistance [77], targeting key tumour pathways [78], inducing cancer metabolic reprogramming [79], and helping to win this war in XXI century.
Supplementary InformationThe online version contains supplementary material available at https ://doi.org/10.1186/s1292 9‑021‑00712 ‑y.
Additional file 1: Figure S1. Analysis of GLS protein isoforms (KGA and GAC) downregulation in T98G‑GLS(−) and its control (scramble siRNA‑transfected) T98G.
Additional file 2: Figure S2. MicroRNA expression analysis of T98G(T98G‑pcDNA), T98G‑GAB(+), LN229 (LN229‑GFP), and LN229‑GLS(−) cell samples, using miRXplore™ microarrays.
Additional file 3: TableS1. Steep‑loop sequences, mature sequences and probe sequences of the one thousand microRNAs used for microarray experiments.
Additional file 4: TableS2. The microRNAs ratio list was determined for T98G‑GAB(+) vs. T98G(T98G‑pcDNA), depicted at column F, and for LN229‑GLS(−) vs. LN229 (LN229‑GFP) cells, depicted at column G.
Additional file 5: Figure S3. Summary of all oxidative stress parameters in the four cell models studied LN229‑GLS(−)/LN229 (LN229‑GFP), T98G‑GLS(−)/T98G (scrambled siRNA‑transfected T98G), LN229‑GAB(+)/LN229 (LN229‑pcDNA) and T98G‑GAB(+)/T98G(T98G‑pcDNA), with the excep‑tion of Protein Damage parameter (g), which shows LN229‑GLS(−)/LN229 (LN229‑GFP) and T98G‑GAB(+)/T98G (T98G‑pcDNA).
AbbreviationsAKT: Proteinkinase B; ATCC : AmericanType Culture Collection; CAT : Catalase; CRE: CopperReducing Equivalents; DMEM: Dulbecco’sModified Eagle Medium; DTNB: 5,5′‑dithiobis‑(2‑nitrobenzoicacid); EGFR: Epidermalgrowth factor recep‑tor; EMT: Epithelial‑mesenchymaltransition; ESCC: Oesophagealsquamous cell carcinoma; FBS: Foetalbovine serum; FTC: Fluorescein5‑thiosemicarbazide; GA: Glutaminase; GAB: LongerGLS2 transcript; GAC : ShorterGLS transcript; GFP: Greenfluorescent protein; GBM: Glioblastoma; GLS: Glutaminaseisoenzyme; GLS2: Glutaminaseisoenzyme 2; GR: Glutathionereductase; GSSG: Oxidized‑glutathione; GSH: Reducedglutathione; HCC: Hepatocellularcarcinoma; KGA: LongerGLS transcript; LGA: ShorterGLS2 transcript; lncRNA: Longnon‑coding ribonucleic acid; MAPK: Mitogen‑activatedprotein kinase; MDA: Malondialde‑hyde; miRNA: microRNA; mTOR: Mammaliantarget of rapamycin; NRF2: Nucle‑arerythroid factor 2‑related factor 2; OSCC: Oralsquamous cell carcinoma; PDCD4: Programmedcell death four gene; PDGFRB: Platelet‑derivedgrowth factor receptor beta; PGC‑1α: Peroxisome proliferator‑activated receptor γ coactivator1α; PI3K: Phosphatidylinositol‑3‑kinase; PTEN: Phosphataseand tensin homolog; qRT‑PCR: Quantitativereverse transcription‑polymerase chain reaction; RIN: RNAintegrity numbers; RNAi: RNAinterference; ROS: Reactiveoxygen species; SD: Standarddeviation; siRNA: Smallinterferent RNA; SIRT1: Sirtuin1; SOD: Superoxidedismutase; TAC : Total antioxidant capacity; TBARS: Thiobarbituricacid reactive substances; tGSH: Totalglutathione; TGF‑β:
Fig. 5 Some metabolic and signalling circuits that intersect with glutaminase isoenzymes. This network schematic representation shows both glutaminase isoenzymes, GLS and GLS2, executing a dual function. First, glutaminase is the limiting enzyme in glutaminolysis to generate glutamate from glutamine, that can be used for GSH synthesis, the most important intracellular antioxidant. Second, both isoenzymes can interact with other proteins and signalling pathways. GLS is regulated by the oncogenic transcription factor c‑Myc and activates mTORC1, which is a major positive regulator of the Warburg effect. Tumour suppressor factor p53 is hampered by GLS, but stimulates GLS2. GLS2 blocks PI3K/AKT signalling pathway while interacts and stabilizes Dicer to mature several miRNAs which repress Snail favouring Warburg effect of tumour cells, and impacting oxidative status. P53 connects GLS, GLS2, microRNAs, ROS homeostasis and cancer. GLS glutaminase isoenzyme, GLS2 glutaminase 2 isoenzyme, GSH glutathione, LRH-1 nuclear receptor liver receptor homolog 1, mTORC1 mammalian target of rapamycin complex 1, PI3K/AKT phosphatidylinositol‑3‑kinase/protein kinase B, ROS reactive oxygen specie
Page 14 of 16de los Santos‑Jiménez et al. J Biomed Sci (2021) 28:14
Transforminggrowth factor‑β; TIMP3: Tissueinhibitor of metalloproteases 3; TP63: Tumourprotein 63; TPM1: Tropomyosin 1; UCA1: Urothelialcarcinoma‑associated 1.
AcknowledgementsThanks are due to Monika Szeliga, Department of Neurotoxicology, Mossa‑kowski Medical Research Centre, Polish Academy of Sciences, Warsaw, Poland. She kindly provided LN229‑GAB(+) GBM cell model.
Authors’ contributionsJMM designed research and wrote the paper. JDSJ, JACS, CMT, NUP, DB, JMC and FCS: performed experiments. JDSJ, MMR, AP, MCGG, CC, LC: cultures of cancer cells and supervised experiments. TC and RJDB: provided LN229 and LN229‑GLS(−) cells. CL, FJA and JAS: supervised microarray experiments. JDSJ, JACS, JM and JMM: analysed data. JDSJ and JACS prepared the figures. JDSJ, JACS, FJA, JAS, RC, AC, RJD and JM: advised the design and reviewed the paper. All authors read and approved the finalmanuscript.
FundingThis work was financially supported by Ministerio de Ciencia y Tecnología of Spain, RTI2018‑096866‑B‑I00 (to JMM and JM) and Ministerio de Educación of Spain PHB2010‑0014‑PC (to JMM). RJD is supported by the Howard Hughes Medical Institute, the National Cancer Institute, the Cancer Prevention and Research Institute of Texas, and the Moody Foundation. Thanks are also due to CAPES/DGU 250/11, Brazil (to FCS, RC and AC). JDSJ is granted by FPU17/04084, Ministerio de Ciencia, Innovación y Universidades.
Availability of data and materialsAll data generated in this study are available from the corresponding author on reasonable request.
Ethics approval and consent to participateNot applicable since no patients subjects were used in this study.
Consent for publicationNot applicable. All authors read and approved the manuscript.
Competing interestsRJD is an advisor for Agios Pharmaceuticals.
Author details1 Departamento de Biología Molecular y Bioquímica and Instituto de Inves‑tigación de Biomedicina de Málaga (IBIMA), Universidad de Málaga, Málaga, Spain. 2 Department of Cell and Developmental Biology, Biomedical Sciences Institute, University of São Paulo, São Paulo, Brazil. 3 IDEAYA Biosciences, South San Francisco, CA, USA. 4 Interdisciplinary Post‑Graduate Program in Health Sciences, Cruzeiro do Sul University, São Paulo, Brazil. 5 Children’s Medical Center Research Institute, University of Texas Southwestern Medical Center (UTSMC), Dallas, TX, USA. 6 Department of Pediatrics, UTSMC, TX, Dallas, USA. 7 McDermott Center for Human Growth and Development, UTSMC, Dallas, TX, USA.
Received: 3 October 2020 Accepted: 5 February 2021
References 1. Yuneva MO, Fan TW, Allen TD, Higashi RM, Ferraris DV, Tsukamoto T,
et al. The metabolic profile of tumors depends on both the responsible genetic lesion and tissue type. Cell Metab. 2012;15:157–70.
2. Matés JM, Segura JA, Martín‑Rufián M, Campos‑Sandoval JA, Alonso FJ, Márquez J. Glutaminase isoenzymes as key regulators in metabolic and oxidative stress against cancer. Curr Mol Med. 2013;4:514–34.
3. Martín‑Rufián M, Nascimento‑Gomes R, Higuero A, Crisma AR, Campos‑Sandoval JA, Gómez‑García MC, et al. Both GLS silencing and GLS2 over‑expression synergize with oxidative stress against proliferation of glioma cells. J Mol Med (Berl). 2014;92:277–90.
4. Márquez J, Tosina M, de la Rosa V, Segura JA, Alonso FJ, Matés JM, et al. New insights into brain glutaminases: beyond their role on glutamatergic transmission. Neurochem Int. 2009;55:64–70.
5. Kashyap D, Tuli HS, Garg VK, Goel N, Bishayee A. Oncogenic and tumor‑suppressive roles of microRNAs with special reference to apoptosis: molecular mechanisms and therapeutic potential. Mol Diagn Ther. 2018;22:179–201.
6. Beyer S, Fleming J, Meng W, Singh R, Haque SJ, Chakravarti A. The role of miRNAs in angiogenesis, invasion and metabolism and their therapeutic implications in gliomas. Cancers (Basel). 2017;9:pii:E85.
7. Cheng T, Sudderth J, Yang C, Mullen AR, Jin ES, Matés JM, et al. Pyruvate carboxylase is required for glutamine‑independent growth of tumor cells. Proc Natl Acad Sci U S A. 2011;108:8674–9.
8. Hu W, Zhang C, Wu R, Sun Y, Levine A, Feng Z. Glutaminase 2, a novel p53 target gene regulating energy metabolism and antioxidant function. Proc Natl Acad Sci U S A. 2010;107:7455–60.
9. Suzuki S, Tanaka T, Poyurovsky MV, Nagano H, Mayama T, Ohkubo S, et al. Phosphate‑activated glutaminase (GLS2), a p53‑inducible regulator of glutamine metabolism and reactive oxygen species. Proc Natl Acad Sci U S A. 2010;107:7461–6.
10. Liu F, Li Y, Liu G. MicroRNA‑200c exacerbates the ischemia/reperfusion injury of heart through targeting the glutaminase (GLS)‑mediated glu‑tamine metabolism. Eur Rev Med Pharmacol Sci. 2017;21:3282–9.
11. Li HJ, Li X, Pang H, Pan JJ, Xie XJ, Chen W. Long non‑coding RNA UCA1 promotes glutamine metabolism by targeting miR‑16 in human bladder cancer. Jpn J Clin Oncol. 2015;45:1055–63.
12. Majewska E, Márquez J, Albrecht J, Szeliga M. Transfection with GLS2 glutaminase (GAB) sensitizes human glioblastoma cell lines to oxidative stress by a common mechanism involving suppression of the PI3K/AKT pathway. Cancers (Basel). 2019;11:115.
13. Mercatelli N, Galardi S, Ciafrè SA. MicroRNAs as multifaceted players in glioblastoma multiforme. Int Rev Cell Mol Biol. 2017;333:269–323.
14. Liu J, Albrecht AM, Ni X, Yang J, Li M. Glioblastoma tumor initiating cells: therapeutic strategies targeting apoptosis and microRNA pathways. Curr Mol Med. 2013;13:352–7.
15. Gao P, Tchernyshyov I, Chang TC, Lee YS, Kita K, Ochi T, et al. c‑Myc sup‑pression of miR‑23a/b enhances mitochondrial glutaminase expression and glutamine metabolism. Nature. 2009;458:762–5.
16. Luan W, Zhou Z, Zhu Y, Xia Y, Wang J, Xu B. miR‑137 inhibits glutamine catabolism and growth of malignant melanoma by targeting glutami‑nase. Biochem Biophys Res Commun. 2018;495:46–52.
17. Kuo TC, Chen CK, Hua KT, Yu P, Lee WJ, Chen MW, et al. Glutaminase 2 sta‑bilizes Dicer to repress Snail and metastasis in hepatocellular carcinoma cells. Cancer Lett. 2016;383:282–94.
18. Zhang B, Liu Y, Li Y, Zhe X, Zhang S, Zhang L. Neuroglobin promotes the proliferation and suppresses the apoptosis of glioma cells by activating the PI3K/AKT pathway. Mol Med Rep. 2018;17:2757–63.
19. Liang J, Qi WF, Xie S, Wang WF, Zhang XL, Zhou XP, et al. Expression of WW domain‑containing protein 2 is correlated with pathological grade and recurrence of glioma. J Cancer Res Ther. 2017;13:1032–7.
20. Su X, Chen J, Ni L, Shi W, Shi J, Liu X, et al. Inhibition of PTTG1 expression by microRNA suppresses proliferation and induces apoptosis of malig‑nant glioma cells. Oncol Lett. 2016;12:3463–71.
21. Dong W, Yao C, Teng X, Chai J, Yang X, Li B. MiR‑140‑3p suppressed cell growth and invasion by downregulating the expression of ATP8A1 in non‑small cell lung cancer. Tumour Biol. 2016;37:2973–85.
22. Ames HM, Yuan M, Vizcaíno MA, Yu W, Rodriguez FJ. MicroRNA profiling of low‑grade glial and glioneuronal tumors shows an independent role for cluster 14q32.31 member miR‑487b. Mod Pathol. 2017;30:204–16.
23. Yan H, Wang S, Yu H, Zhu J, Chen C. Molecular pathways and functional analysis of miRNA expression associated with paclitaxel‑induced apopto‑sis in hepatocellular carcinoma cells. Pharmacology. 2013;92:167–74.
24. Zhang Q, Cao LY, Cheng SJ, Zhang AM, Jin XS, Li Y. p53‑induced micro‑RNA‑1246 inhibits the cell growth of human hepatocellular carcinoma cells by targeting NFIB. Oncol Rep. 2015;33:1335–41.
25. Liu J, Zhang C, Lin M, Zhu W, Liang Y, Hong X, et al. Glutaminase 2 nega‑tively regulates the PI3K/AKT signaling and shows tumor suppression activity in human hepatocellular carcinoma. Oncotarget. 2014;5:2635–47.
26. Latchana N, Regan K, Howard JH, Aldrink JH, Ranalli MA, Peters SB, et al. Global microRNA profiling for diagnostic appraisal of melanocytic Spitz tumors. J Surg Res. 2016;205:350–8.
27. Paolini A, Curti V, Pasi F, Mazzini G, Nano R, Capelli E. Gallic acid exerts a protective or an anti‑proliferative effect on glioma T98G cells via
Page 15 of 16de los Santos‑Jiménez et al. J Biomed Sci (2021) 28:14
dose‑dependent epigenetic regulation mediated by miRNAs. Int J Oncol. 2015;46:1491–7.
28. Zhang H, Cai Y, Zheng L, Zhang Z, Lin X, Jiang N. LncRNA BISPR promotes the progression of thyroid papillary carcinoma by regulating miR‑21‑5p. Int J Immunopathol Pharmacol. 2018;32:2058738418772652.
29. Xu G, Li JY. Differential expression of PDGFRB and EGFR in microvascular proliferation in glioblastoma. Tumour Biol. 2016;37:10577–86.
30. Hu HQ, Sun LG, Guo WJ. Decreased miRNA‑146a in glioblastoma multi‑forme and regulation of cell proliferation and apoptosis by target Notch1. Int J Biol Markers. 2016;31:e270–5.
31. Wang C, Zhang W, Zhang L, Chen X, Liu F, Zhang J, et al. miR‑146a‑5p mediates epithelial‑mesenchymal transition of oesophageal squamous cell carcinoma via targeting Notch2. Br J Cancer. 2016;115:1548–54.
32. Karthikeyan A, Gupta N, Tang C, Mallilankaraman K, Silambarasan M, Shi M, et al. Microglial SMAD4 regulated by microRNA‑146a promotes migration of microglia which support tumor progression in a glioma environment. Oncotarget. 2018;9:24950–69.
33. Peta E, Sinigaglia A, Masi G, Di Camillo B, Grassi A, Trevisan M, et al. HPV16 E6 and E7 upregulate the histone lysine demethylase KDM2B through the c‑MYC/miR‑146a‑5p axys. Oncogene. 2018;37:1654–68.
34. Avci CB, Harman E, Dodurga Y, Susluer SY, Gunduz C. Therapeutic poten‑tial of an anti‑diabetic drug, metformin: alteration of miRNA expression in prostate cancer cells. Asian Pac J Cancer Prev. 2013;14:765–8.
35. Papageorgiou SG, Diamantopoulos MA, Kontos CK, Bouchla A, Vasilatou D, Bazani E, et al. MicroRNA‑92a‑3p overexpression in peripheral blood mononuclear cells is an independent predictor of prolonged overall survival of patients with chronic lymphocytic leukemia. Leuk Lymphoma. 2019;60:658–67.
36. Gao W, Hua J, Jia Z, Ding J, Han Z, Dong Y, et al. Expression of miR‑146a‑5p in breast cancer and its role in proliferation of breast cancer cells. Oncol Lett. 2018;15:9884–8.
37. Simanovich E, Brod V, Rahat MM, Rahat MA. Function of miR‑146a‑5p in tumor cells as a regulatory switch between cell death and angiogenesis: macrophage therapy revisited. Front Immunol. 2018;8:1931.
38. Lv S, Xue J, Wu C, Wang L, Wu J, Xu S, et al. Identification of a panel of serum microRNAs as biomarkers for early detection of lung adenocarci‑noma. J Cancer. 2017;8:48–56.
39. Min SK, Jung SY, Kang HK, Park SA, Lee JH, Kim MJ, et al. Functional diversity of miR‑146a‑5p and TRAF6 in normal and oral cancer cells. Int J Oncol. 2017;51:1541–52.
40. Asano M, Umezu T, Katagiri S, Kobayashi C, Tauchi T, Gotoh M, et al. Up‑regulated exosomal miRNA‑140‑3p in CML patients with musculoskeletal pain associated with discontinuation of tyrosine kinase inhibitors. Int J Hematol. 2017;105:419–22.
41. Papagiannakopoulos T, Shapiro A, Kosik KS. MicroRNA‑21 targets a network of key tumor‑suppressive pathways in glioblastoma cells. Cancer Res. 2008;68:8164–72.
42. Falzone L, Scola L, Zanghì A, Biondi A, Di Cataldo A, Libra M, et al. Inte‑grated analysis of colorectal cancer microRNA datasets: identification of microRNAs associated with tumor development. Aging. 2018;10:1000–14.
43. Li X, Chen D, Li M, Gao X, Shi G, Zhao H. The CADM2/Akt pathway is involved in the inhibitory effect of miR‑21‑5p downregulation on proliferation and apoptosis in esophageal squamous cell carcinoma cells. Chem Biol Interact. 2018;288:76–82.
44. Cui J, Li Q, Luo M, Zhong Z, Zhou S, Jiang L, et al. Leukemia cell‑derived microvesicles induce T cell exhaustion via miRNA delivery. Oncoimmu‑nology. 2018;7:e1448330.
45. Wu L, Li G, Feng D, Qin H, Gong L, Zhang J, et al. MicroRNA‑21 expression is associated with overall survival in patients with glioma. Diagn Pathol. 2013;8:200.
46. Chen Y, Liu W, Chao T, Zhang Y, Yan X, Gong Y, et al. MicroRNA‑21 down‑regulates the expression of tumor suppressor PDCD4 in human glioblas‑toma cell T98G. Cancer Lett. 2008;272:197–205.
47. Li C, Sun J, Xiang Q, Liang Y, Zhao N, Zhang Z, et al. Prognostic role of microRNA‑21 expression in gliomas: a meta‑analysis. J Neurooncol. 2016;130:11–7.
48. Khan FH, Pandian V, Ramraj S, Aravindan S, Herman TS, Aravindan N. Reorganization of metastamiRs in the evolution of metastatic aggressive neuroblastoma cells. BMC Genom. 2015;16:501.
49. Song H, Zhang Y, Liu N, Zhao S, Kong Y, Yuan L. miR‑92a‑3p exerts vari‑ous effects in glioma and glioma stem‑like cells specifically targeting
CDH1/β‑catenin and notch‑1/akt signaling pathways. Int J Mol Sci. 2016;17:pii: E1799.
50. Niu H, Wang K, Zhang A, Yang S, Song Z, Wang W, et al. miRNA‑92a is a critical regulator of the apoptosis pathway in glioblastoma with inverse expression of BCL2L11. Oncol Rep. 2012;28:1771–7.
51. Zhang G, Li S, Lu J, Ge Y, Wang Q, Ma G, et al. LncRNA MT1JP functions as a ceRNA in regulating FBXW7 through competitively binding to miR‑92a‑3p in gastric cancer. Mol Cancer. 2018;17:87.
52. Bhagirath D, Yang TL, Bucay N, Sekhon K, Majid S, Shahryari V, et al. microRNA‑1246 is an exosomal biomarker for aggressive prostate cancer. Cancer Res. 2018;78:1833–44.
53. Xu X, Cao L, Zhang Y, Lian H, Sun Z, Cui Y. MicroRNA‑1246 inhibits cell invasion and epithelial mesenchymal transition process by targeting CXCR4 in lung cancer cells. Cancer Biomark. 2018;21:251–60.
54. Li XJ, Ren ZJ, Tang JH, Yu Q. Exosomal microRNA MiR‑1246 promotes cell proliferation, invasion and drug resistance by targeting CCNG2 in breast cancer. Cell Physiol Biochem. 2017;44:1741–8.
55. Su JC, Lin K, Wang Y, Sui SH, Gao ZY, Wang ZG. In vitro studies of phene‑thyl isothiocyanate against the growth of LN229 human glioma cells. Int J Clin Exp Pathol. 2015;8:4269–76.
56. Duan L, Aoyagi M, Tamaki M, Yoshino Y, Morimoto T, Wakimoto H, et al. Impairment of both apoptotic and cytoprotective signalings in glioma cells resistant to the combined use of cisplatin and tumor necrosis factor alpha. Clin Cancer Res. 2004;10:234–43.
57. Kusaczuk M, Krętowski R, Naumowicz M, Stypułkowska A, Cechowska‑Pasko M. Silica nanoparticle‑induced oxidative stress and mitochondrial damage is followed by activation of intrinsic apoptosis pathway in glioblastoma cells. Int J Nanomedicine. 2018;13:2279–94.
58. Zhu Z, Du S, Du Y, Ren J, Ying G, Yan Z. Glutathione reductase mediates drug resistance in glioblastoma cells by regulating redox homeostasis. J Neurochem. 2018;144:93–104.
59. Docrat TF, Nagiah S, Krishnan A, Naidoo DB, Chuturgoon AA. Atorvastatin induces MicroRNA‑145 expression in HEPG2 cells via regulation of the PI3K/AKT signalling pathway. Chem Biol Interact. 2018;287:32–40.
60. Do MT, Kim HG, Choi JH, Jeong HG. Metformin induces microRNA‑34a to downregulate the Sirt1/Pgc‑1α/Nrf2 pathway, leading to increased susceptibility of wild‑type p53 cancer cells to oxidative stress and thera‑peutic agents. Free Radic Biol Med. 2014;74:21–34.
61. Li Q, Wang C, Cai L, Lu J, Zhu Z, Wang C, et al. miR–34a derived from mes‑enchymal stem cells stimulates senescence in glioma cells by inducing DNA damage. Mol Med Rep. 2019;19:1849–57.
62. Bruns I, Sauer B, Burger MC, Eriksson J, Hofmann U, Braun Y, et al. Disrup‑tion of peroxisome proliferator‑activated receptor γ coactivator (PGC)‑1α reverts key features of the neoplastic phenotype of glioma cells. J Biol Chem. 2019;294:3037–50.
63. Lee SY, Jeon HM, Ju MK, Jeong EK, Kim CH, Park HG, et al. Dlx‑2 and glutaminase upregulate epithelial‑mesenchymal transition and glycolytic switch. Oncotarget. 2016;7:7925–39.
64. Márquez J, Alonso FJ, Matés JM, Segura JA, Martín‑Rufián M, Campos‑Sandoval JA. Glutamine addiction in gliomas. Neurochem Res. 2017;42:1735–46.
65. Liu Z, Wang J, Li Y, Fan J, Chen L, Xu R. MicroRNA‑153 regulates glutamine metabolism in glioblastoma through targeting glutaminase. Tumour Biol. 2017;39:1010428317691429.
66. Ortiz‑Pedraza Y, Muñoz‑Bello JO, Olmedo‑Nieva L, Contreras‑Paredes A, Martínez‑Ramírez I, Langley E, et al. Non‑coding RNAs as key regulators of glutaminolysis in cancer. Int J Mol Sci. 2020;21:2872.
67. McBrayer SK, Mayers JR, DiNatale GJ, Shi DD, Khanal J, Chakraborty AA, et al. Transaminase inhibition by 2‑hydroxyglutarate impairs glutamate biosynthesis and redox homeostasis in glioma. Cell. 2018;175:101–16.
68. Matés JM, Campos‑Sandoval JA, de los Santos‑Jiménez J, Márquez J. Glutaminases regulate glutathione and oxidative stress in cancer. Arch Toxicol. 2020;94:2603–23.
69. Meng G, Xia M, Xu C, Yuan D, Schnurr M, Wei J. Multifunctional antitumor molecule 5’‑triphosphate siRNA combining glutaminase silencing and RIG‑I activation. Int J Cancer. 2014;134:1958–71.
70. Song M, Kim SH, Im CY, Hwang HJ. Recent development of small mol‑ecule glutaminase inhibitors. Curr Top Med Chem. 2018;18:432–43.
71. Akins NS, Nielson TC, Le HV. Inhibition of glycolysis and glutaminolysis: an emerging drug discovery approach to combat cancer. Curr Top Med Chem. 2018;18:494–504.
Page 16 of 16de los Santos‑Jiménez et al. J Biomed Sci (2021) 28:14
• fast, convenient online submission
•
thorough peer review by experienced researchers in your field
• rapid publication on acceptance
• support for research data, including large and complex data types
•
gold Open Access which fosters wider collaboration and increased citations
maximum visibility for your research: over 100M website views per year •
At BMC, research is always in progress.
Learn more biomedcentral.com/submissions
Ready to submit your researchReady to submit your research ? Choose BMC and benefit from: ? Choose BMC and benefit from:
72. Wu C, Jin S, Chen L, Li H. Glutaminase inhibitors: a patent review. Expert Opin Ther Pat. 2018;28:823–35.
73. Matés JM, Campos‑Sandoval JA, de los Santos‑Jiménez J, Segura JA, Alonso FJ, Márquez J. Metabolic reprogramming of cancer by chemicals that target glutaminase isoenzymes. Curr Med Chem. 2020;27:5317–39.
74. Márquez J, Matés JM, Campos‑Sandoval JA. Glutaminases Adv Neurobiol. 2016;13:133–71.
75. Xia HL, Lv Y, Xu CW, Fu MC, Zhang T, Yan XM, et al. MiR‑513c suppresses neuroblastoma cell migration, invasion, and proliferation through direct targeting glutaminase (GLS). Cancer Biomark. 2017;20:589–96.
76. Xu X, Meng Y, Li L, Xu P, Wang J, Li Z, et al. Overview of the development of glutaminase inhibitors: achievements and future directions. J Med Chem. 2019;62:1096–115.
77. Shukla SK, Purohit V, Mehla K, Gunda V, Chaika NV, Vernucci E, et al. MUC1 and HIF‑1alpha signaling crosstalk induces anabolic glucose metabo‑lism to impart gemcitabine resistance to pancreatic cancer. Cancer Cell. 2017;32:71–87.
78. Herranz D, Ambesi‑Impiombato A, Sudderth J, Sánchez‑Martín M, Belver L, Tosello V, et al. Metabolic reprogramming induces resistance to anti‑NOTCH1 therapies in T cell acute lymphoblastic leukemia. Nat Med. 2015;21:1182–9.
79. Matés JM, Campos‑Sandoval JA, Márquez J. Glutaminase isoenzymes in the metabolic therapy of cancer. Biochim Biophys Acta Rev Cancer. 2018;1870:158–64.
Publisher’s noteSpringer Nature remains neutral with regard to jurisdictional claims in pub‑lished maps and institutional affiliations.