the role of glutaminase 1 in hiv-1 associated
TRANSCRIPT
University of Nebraska Medical Center University of Nebraska Medical Center
DigitalCommons@UNMC DigitalCommons@UNMC
Theses & Dissertations Graduate Studies
Summer 8-14-2015
The Role of Glutaminase 1 in HIV-1 Associated Neurocognitive The Role of Glutaminase 1 in HIV-1 Associated Neurocognitive
Disorders and in Brain Development Disorders and in Brain Development
Yi Wang University of Nebraska Medical Center
Follow this and additional works at: https://digitalcommons.unmc.edu/etd
Part of the Biological Phenomena, Cell Phenomena, and Immunity Commons, Medical Cell Biology
Commons, Medical Immunology Commons, Medical Neurobiology Commons, and the Neurosciences
Commons
Recommended Citation Recommended Citation Wang, Yi, "The Role of Glutaminase 1 in HIV-1 Associated Neurocognitive Disorders and in Brain Development" (2015). Theses & Dissertations. 22. https://digitalcommons.unmc.edu/etd/22
This Dissertation is brought to you for free and open access by the Graduate Studies at DigitalCommons@UNMC. It has been accepted for inclusion in Theses & Dissertations by an authorized administrator of DigitalCommons@UNMC. For more information, please contact [email protected].

The Role of Glutaminase 1 in HIV-1 Associated Neurocognitive Disorders
and in Brain Development
By
Yi Wang
A DISSERTATION
Presented to the Faculty of
The Graduate College in the University of Nebraska
In Partial Fulfillment of the Requirements
For the Degree of Doctor of Philosophy
Department of
Pharmacology and Experimental Neuroscience
Under the Supervision of Dr. Jialin Zheng
Medical Center
Omaha, Nebraska
July, 2015

The Role of Glutaminase 1 in HIV-1 Associated Neurocognitive Disorders
and in Brain Development
Yi Wang, Ph.D.
University of Nebraska, 2015
Advisor: Jialin Zheng, M.D.
Glutaminase is the enzyme that converts glutamine into glutamate, which
serves as a key excitatory neurotransmitter and one of the energy providers for
cellular metabolism. Glutamate is essential for proper brain functioning but at
excess levels, it is neurotoxic and has a key role in the pathogenesis of various
neurodegenerative diseases, including HIV-1 associated neurocognitive
disorders (HAND). However, the detailed mechanism of glutamate-mediated
neurotoxicity remains unclear. In part I, we identified the regulation of
glutaminase 1 (GLS1) in the central nervous system (CNS) of HAND animal
models including HIV-Tat transgenic (Tg) mouse and HIVE-SCID mouse, since
GLS1 is the dominant isoform of glutaminase in mammalian brains. Interestingly,
examinations of both animals revealed an upregulation of GLS1 in correlation
with the increase of brain inflammation and cognitive impairment. As our previous
data revealed an upregulation of glutaminase C (GAC) in the postmortem brain
tissues of patients with HIV dementia by protein analysis, suggesting a critical
role of GAC in the instigation of primary dysfunction and subsequent neuronal
damage in HAND, thus in part II we hypothesize that GAC dysregulation in brain
is sufficient to induce brain inflammation and dementia in relevance to HAND.

Using a brain GAC overexpression mouse model (which has the overexpression
of GAC confined in the brain), we found that the expressions of the marker for
brain inflammation, the glial fibrillary acidic protein (GFAP), were increased in the
brains of GAC-overexpression mice, suggesting increased reactive astrogliosis.
To study the functional impact of GAC overexpression, we performed Morris
Water Maze (MWM) test and Contextual Fear Conditioning (CFC) test to
determine the learning and memory of mice. GAC-overexpression mice
perfomed poorer in both tests, indicating that overexpressing GAC in mouse
brain impaired the learning and memory of the animals. Moreover, pathological
and physiologial examinations revealed synaptic damage and increased
apoptosis in Nestin-GAC mouse brain. Together, these data suggest that
dysregulated GAC has a causal relationship with prolonged inflammation and
dementia relevant to HAND. In part III, we evaluated the feasibility of genetically
knocking down GLS1 in CNS to treat HAND using human primary neural
progenitor cell (NPC) culture. However, we have found that GLS1 is essential for
the survival, proliferation and differentiation of human NPC. This suggests that
more-advanced genetic methods capable of targeting GLS1 in specific cell types
of CNS ought to be developed for the therapeutic purpose.
In summary, we report that GLS1 is dysregulated in the brains of HAND
murine models in correlation with increased brain inflammation and cognitive
impairment. Moreover, overexpressed GAC in mouse brains has a causal
relationship to prolonged brain inflammation and dementia of these animals,

suggesting a pathologenic role of dysregulated brain GLS1 in relevance to
HAND.

i
TABLE OF CONTENTS
List of tables and figures .................................................................................... iii
Abbreviations ...................................................................................................... v
Chapter 1: Introduction
1.1 HIV-1 associated neurocognitive disorders ................................................. 2
1.1.1 Clinical manifestations ............................................................................... 3
1.1.2 Pathobiology of HAND .............................................................................. 3
1.2 Excitotoxicity ................................................................................................ 4
1.3 Glutaminase 1 .............................................................................................. 6
1.4 Glutamate-glutamine cycle in the brain ........................................................ 7
1.5 The possible pathological role of GLS1 in HAND ......................................... 9
1.6 Conclusion .................................................................................................... 12
1.7 Figures.......................................................................................................... 14
Chapter 2: Glutaminase 1 is aberrantly upregulated in CNS of HAND murine
models and is associated with brain inflammation and cognitive
impairment
2.1 Abstract ........................................................................................................ 17
2.2 Introduction ................................................................................................... 18
2.3 Materials and Methods ................................................................................. 21
2.4 Results.......................................................................................................... 25
2.5 Discussion .................................................................................................... 28
2.6 Tables and Figures ....................................................................................... 31

ii
Chapter 3: Brain-specific Overexpression of Glutaminase C Induces
Neuroinflammation, Synaptic Damage and Dementia in Mice: Relevance to
HAND
3.1 Abstract ........................................................................................................ 39
3.2 Introduction ................................................................................................... 41
3.3 Materials and Methods ................................................................................. 44
3.4 Results.......................................................................................................... 51
3.5 Discussion .................................................................................................... 56
3.6 Tables and Figures ....................................................................................... 60
Chapter 4: GLS1 is Essential for the Differentiation, Survival and
Proliferation of Human Neural Progenitor Cells
4.1 Abstract ........................................................................................................ 73
4.2 Introduction ................................................................................................... 74
4.3 Materials and Methods ................................................................................. 76
4.4 Results.......................................................................................................... 81
4.5 Discussion .................................................................................................... 85
4.6 Figures.......................................................................................................... 89
Chapter 5: General summary and future directions
5.1 Summary and General Discussion ............................................................. 101
5.2 Future Directions ........................................................................................ 107
5.3 Figures........................................................................................................ 109
Acknowledgments .......................................................................................... 110
References ...................................................................................................... 112

iii
List of Tables and Figures
Figure 1.1 Proposed model for the pathogenic role of dysregulated GLS1
in HAND .............................................................................................................. 15
Table 2.1 Primers used for the genotyping of HIV-Tat Tg mouse ...................... 31
Figure 2.1 HIV-Tat Tg mice had upregulated GLS1 isoforms KGA and
GAC in the brain ................................................................................................. 32
Figure 2.2 HIV-Tat Tg mice had increased astrogliosis in correlation with
the upregulation of GLS1 and elevation of brain glutamate ............................... 34
Figure 2.3 HIV-Tat Tg mice exhibited impairment in spatial learning and
memory ............................................................................................................... 35
Figure 2.4 HIVE-SCID mice exhibited impairment in spatial learning and
memory ............................................................................................................... 36
Figure 2.5 GLS1 and glutamate levels were in correlation with MWM
performances of HIV-Tat Tg mice ...................................................................... 37
Table 3.1 Primers used for the genotyping of Nestin-GAC mouse .................... 60
Figure 3.1 Schematic picture of Nestin-GAC mouse generation ........................ 61
Figure 3.2 GAC overexpression was specific to brain in Nestin-GAC mice ....... 62
Figure 3.3 GAC overexpression was confirmed in different areas of
Nestin-GAC mouse brain ................................................................................... 63
Figure 3.4 Nestin-GAC mice exhibited impairments in learning and
memory ............................................................................................................... 65
iv
Figure 3.5 Brain-specific GAC overexpression led to synaptic damage in
mice .................................................................................................................... 67
Figure 3.6 Nestin-GAC mice showed marked reduction in LTP ......................... 68
Figure 3.7 Brain-specific GAC overexpression increased apoptosis in
mouse brain ........................................................................................................ 69
Figure 3.8 Brain-specific GAC overexpression led to reactive astrogliosis
in mice ................................................................................................................ 71
Figure 4.1 Transcript levels of GLS1 isoforms, KGA and GAC, were
upregulated during NPC differentiation to neurons ............................................ 89
Figure 4.2 Protein levels of GLS1 isoforms, KGA and GAC, were
upregulated during NPC differentiation to neurons ............................................ 90
Figure 4.3 Lack of GLS1 impaired the expression of MAP-2 mRNA during
neuronal differentiation ....................................................................................... 91
Figure 4.4 Lack of GLS1 impaired the expression of MAP-2 protein during
neuronal differentiation ....................................................................................... 93
Figure 4.5 Lack of GLS1 impaired neuronal differentiation ................................ 94
Figure 4.6 GLS1 silencing reduced NPC proliferation ........................................ 96
Figure 4.7 GLS1 silencing increased NPC apoptosis ........................................ 98
Figure 5.1 Summary of the pathogenic role of GLS1 dysregulation in
HAND ................................................................................................................. 109
v
Abbreviations
Human immunodeficiency virus (HIV)
HIV-1 associated neurocognitive disorders (HAND)
HIV-1 associated dementia (HAD)
Mild neurocognitive disorders (MND)
Asymptomatic neurocognitive impairment (ANI)
Highly active antiretroviral therapy (HAART)
Blood brain barrier (BBB)
HIV-1 encephalitis (HIVE)
Monocyte-derived Macrophages (MDM)
Central nervous system (CNS)
Tumor necrosis factor-α (TNF-α)
Interleukin-1 β (IL-1β)
Glycoprotein 120 (gp120)
HIV trans activator of transcription (HIV-Tat)
N-Methyl-D-aspartic acid (NMDA)
Glutaminase 1 (GLS1)
Glutaminase C (GAC)
Kidney-type glutaminase (KGA)
Tricarboxylic acid (TCA)
α-amino-3-hydroxy-5-methyl-4-isoxazolepropionic acid (AMPA)
Macrophage-conditioned medium (MCM)
Transgenic (Tg)
vi
Severe combined immunodeficient (SCID)
Simian immunodeficiency virus (SIV)
Combined antiretroviral therapy (cART)
Cerebrospinal fluid (CSF)
Glial fibrillary acidic protein (GFAP)
Institutional Animal Care and Use Committee (IACUC)
Dulbecco’s modified Eagles medium (DMEM)
Macrophage colony stimulating factor (M-CSF)
Morris-Water-Maze (MWM)
Sodium dodecyl sulfate-polyacrylamide gel electrophoresis (SDS-PAGE)
Polyvinyldifluoridene (PVDF)
Analysis of variance (ANOVA)
Wide-type (WT)
Contextual fear conditioning (CFC)
Standard error (SEM)
Green fluorescent protein (GFP)
Polymerase chain reaction (PCR)
Phosphate-buffered saline (PBS)
Paraformaldehyde (PFA)
Terminal deoxynucleotidyl transferase dUTP Nick-end labeling (TUNEL)
Artifical cerebrospinal fluid (ACSF)
Field excitatory postsynaptic potentials (fEPSPs)
Long-term potentiation (LTP)

vii
High-frequency stimulus (HFS)
Reverse transcription polymerase chain reaction (RT-PCR)
Poly ADP ribose polymerase (PARP)

1
Chapter 1
Introduction
2
1.1 HIV-1 associated neurocognitive disorders
1.1.1 Clinical manifestations
HIV infection continues to cause substantial morbidities worldwide. Till
2013, 35 million people are living with HIV around the world. HIV-1 infection
accounts for more than 90% of the global HIV pandemic, with the fact that fewer
than 3 million of the 35 million infections are caused by HIV-2 [1].
HIV-1 associated neurocognitive disorders (HAND) represent a spectrum
of cognitive disorders caused by HIV infection. These disorders are
characterized by cognitive deteriorations, behavioral disorders and potential
progressive motor impairments as a consequence of neuronal damage [2].
These disorders affect up to 50% of HIV-1 infected individuals [3]. HAND
comprise three categories based on standardized measures of dysfunction: HIV-
1 associated dementia (HAD), mild neurocognitive disorder (MND), and
asymptomatic neurocognitive impairment (ANI) [4]. With the effective treatment
by highly active antiretroviral therapy (HAART), the occurrence of HAD, the
most severe and devastating form of HAND, has dramatically fallen [5].
However, even the incidence of moderate or severe form of HAND, MND and
HAD, has largely declined since the introdction of HAART in 1996, the
prevalence of HAND remains high (15-50%) [5, 6] with the increase of the life
span of HIV-infected individuals [7], emergence of drug-resistant viral mutants
[8, 9], compromised blood-brain barrier (BBB) penetration of HAART [10], and
sustained HIV infection and virus production in mononuclear phagocytes
(macrophages and microglia) of the brain [5, 11]. The high prevalence of the

3
milder forms of HAND is still significant because cognitive impairment continues
to be a commonplace and interferes with everday functioning like employment,
finance management, driving, housekeeping and adherence to medications of
HIV-infected individuals.
1.1.2 Pathobiology of HAND
The most severe form of HAND, HAD, is a synonym of HIV
encephalopathy or AIDS dementia complex [5]. Its pathological correlate is
termed HIV-1 encephalitis (HIVE). The pathological characteristics of HIVE
include progressive infection within perivascular monocyte-derived
macrophages (MDM), the infiltration of MDM into the brain, and often the
formation of multinucleated giant cells due to the fusion of HIV-infected MDM
[12, 13]. Other pathological features include reactive astrogliosis, diffuse
rarefaction of white matter, BBB breakdown, simplification and decrease of
synaptic dendrites, and neuronal loss [14-16].
Cognitive impairment in HAND is a consequence of synaptic network
damage in basal ganglia, cerebral cortex and hippocampus of HAND patients.
Morphometric studies have revealed approximately 40% decreases in the
densities of neurons in the frontotemporal cortex [14, 17], and 50% - 90%
decreases of neuronal densities in hippocampus [18] before the HAART era.
Previous studies with in situ hybridization have confirmed that productive HIV-1
infections occur almost exclusively in perivascular MDM [19]. Brain microglia are
infected by HIV-1 to a lesser degree while astrocytes are only non-productively
4
or restrictively infected due to the fact that CD4 is not present on them [20-25].
Neurons are not infected by HIV-1 [20]. Since neurons have the lowest
susceptibility to HIV infection among all cells in the central nervous system
(CNS), their dysfucntion largely results from HIV infection of nerboring cells.
Initially, HIV-infected perivascular macrophages enter into CNS via the broken
BBB, bringing HIV that has the ability to infect brain macrophages and microglia.
Infection of macrophages and microglia results in production of viral proteins
and neurotoxins [26-29] that start to damage synapses, thus disrupt the
connections of neuronal network and neurotransmission at first stage. HIV-
infected macrophages and microglia can serve as long-lived reservior for the
virus production in the brain, leading to progressive neuronal damage [14, 30].
And importantly, those viral proteins released by infected macrophages and
microglia activate uninfected macrophages, microglial and astrocytes, resulting
in the production of more viral proteins, a variety of proinflammatory molecules
and neurotoxins [28, 29, 31, 32], leading to prolonged brain inflammation and
further damage to neurons at the second stage [33-37]. Studies have shown
that the severity of HAND is significantly associated with the densities of
activated brain macrophages, microglia, and astrocytes, and with the expression
levels of the neurotoxins secreted by those activated brain cells [38].
1.2 Excitotoxicity
Chronic neuroinflammation is a hallmark of HAND and a constitutive
component of the pathogenesis of neurodegenerative diseases including HAND,
5
multiple sclerosis, amyotrophic lateral sclerosis, Parkinson’s disease and
Alzheimer’s disease [33-35]. Literature have suggested a close link between
brain inflammation and neuronal injury [36, 39]. HIV-infected and activated
microglia and macrophages instigate brain inflammation and induce neuronal
injury through the production and release of various soluble neurotoxic factors
including viral proteins [30], platelet activating factor [40-43], proinflammatory
cytokines and chemokines [37, 44-47], nitric oxide [48, 49], and excess
glutamate [32, 50-52]. Apart from brain macrophages, microglia and astrocytes,
neurons play a critical role in the progress of brain inflammation as well.
Specifically, proinflammatory cytokines TNF-α and IL-1β, which are typically
elevated during neurodegenerative diseases, induced neuronal loss via the
production and release of excess glutamate in neuronal culture [53].
Glutamate is the most important excitatory neurotransmitter in
mammalian CNS [54, 55]. It is essential for vital physiologic processes including
neural development, synaptic plasticity, learning and memory [55-57]. However
at excess levels, glutamate has the potential to induce extensive neuronal injury,
which is termed excitotoxicity. Excess glutamate causes neuronal damage via
overactivation of glutamate receptors. Studies of the neurotoxic effects of viral
proteins like HIV-1 coat protein glycoprotein 120 (Gp120) and HIV trans-acting
protein Tat have revealed that viral proteins induced modification of the kinectics
of NMDA receptors located on postsynaptic neruons via stimulating the release
of arachidonic acid from infected glial cells [58]. The combination of the
increased pool of extracellular glutamate and overactivated NMDA receptors
6
results in calcium overload within neurons [59]. Calcium is one the most
important second messagers in neural signal transduction. Deregulated calcium
leads to oxidative stress including production of free radicals and disruption of
redox balance, and results in mitochondrial dysfunction, caspase activation and
cellular death [60]. Besides, lipid imbalance in neurons has also been
associated with calcium overload-induced neuronal dysfunction or death in
HAND [59, 61]. The moderate-affinity glutamate receptor antagonist memantine
has been reported to have successfully reversed HIV viral protein-induced
calcium overload in neurons and substantially protected neurons from apoptosis
[62-64].
Therefore, elevated glutamate has been linked to the pathogenic
processes of various CNS disorders [65-68] and neurodegenerative diseases
including HAND [50, 69, 70].
1.3 Glutaminase 1
In mammalian CNS, glutamate is typically derived from glutamine by the
action of an phosphate-activated amidohydrolase named glutaminase (EC
3.5.1.2) [71]. Two different kinds of glutaminase are found in mammals. The
predominant glutamine-utilizing and glutamate-producing enzyme in CNS is
glutaminase 1 (GLS1), a mitochondrial hetero-tetramer localized on the inner
membrane of mitochondria, whereas the isozyme glutaminase 2 (GLS2) is
expressed at lower levels [72] in the brain.
7
GLS1 and GLS2 are encoded by separate genes on different
chromosomes [73]. The human Gls1 gene is on chromosome 2 [74] and has
several isoforms due to tissue-specific alternative splicing. Two splice variants of
GLS1, glutaminase C (GAC) and kidney-type glutaminase (KGA), are found in
mammalian brain tissues [75]. GAC shares the same functional region of KGA
and possesses a unique C-terminal [76]. Glutaminase catalyzes the following
reaction: Glutamine + H2O → Glutamate + NH3. Glutamate is subsequently
converted to α-ketoglutarate with the catalysis by glutamate dehydrogenase.
The end-product α-ketoglutarate enters into the tricarboxylic acid (TCA) cycle
that maintains the energy generation. Therefore, GLS1 plays an essential role in
generating neurotransmitter and brain bioenergetics.
In the brain under physiological conditions, GLS1 is expressing at highest
levels in neurons and to relatively lesser extents in astrocytes, microglia and
macrophages. The expression profile of GLS1 in different cells of the brain is in
agreement with the compartmentation of the glutamate-glutamine cycle that is
critial for neural signal transmission in CNS.
1.4 Glutamate - glutamine cycle in the brain
There is not a clearly-defined starting point of the glutamate-glutamine
cycle. We begin with events that occurred in the presynaptic neurons. In
presynaptic neurons, glutamine is converted to glutamate by GLS1 and the
newly-produced glutamate is packaged into presynaptic vesicles. The
glutamate-filled vesicles are recruited and docked to specialized release sites
8
that are dense electron regions termed the active zones of presynaptic neurons
[77]. Intracellular calcium influxes trigger the release of glutamate-containing
vesicles from presynaptic nerve terminals into synaptic cleft via exocytosis [77,
78]. Afterwards, glutamate diffuses across the synaptic cleft and binds to
glutamate receptors located on postsynaptic neurons. The binding of glutamate
with its receptors alters membrane potential of the postsynaptic neurons and
triggers downstream signal transduction cascades. There are two major types of
glutamate receptors: the ionotropic glutamate receptors that are ligand-gated ion
channels including AMPA, NMDA, kainate and Delta receptors [79]; and the
metabotropic glutamate receptors that are G protein-coupled receptors including
metaotropic glutamate receptor 1-8 [80].
Glutamate that resides in the synaptic cleft is utilized or removed rapidly
via three major ways. First, glutamate is uptaken by postsynaptic neurons for
neural signal transmission. Second, some glutamate is reuptaken by
presynaptic neurons via glutamate transporters located on neurons. Third, a
substantial amount of extra glutamate in synaptic cleft is transported to
neighboring astrocytes by glutamate transporters located on astrocytes. As the
resting membrane potential of astrocytes is relatively low compared to that of
neurons, extracellular glutamate is favorably efficiently uptaken by astrocytes
through a sodium-dependent mechanism [81]. Within astrocytes, where the
enzyme glutamine synthase is expressing at high levels, the majority of
glutamate is converted back to glutamine [82]. The newly-synthesized glutamine
is released extracellularly and transported back to neurons by glutamine

9
transporters [83]. Then in neurons, glutamine is converted to glutamate. With
the regeneration of glutamate in neurons, the glutamate-glutamine cycle has
“closed”.
Importantly, the reaction of deaminating glutamine to produce glutamate
by GLS1 is energetically favorable. So GLS1 must be tightly regulated to
prevent excess glutamate generation and excitotoxicity [73].
1.5 The possible pathological role of GLS1 in HAND
Although the exact way in which HIV causes HAND remains incompletely
understood, GLS1 has been reported to have a crucial role in mediating
excitotoxicity. In the past decade our laboratory and others have helped with
defining the excitotoxic profile of brain macrophages and microglia. We have
developed molecular and chemical tools with explicit intent to understand HAND
pathogenesis and to find an effective treatment for HAND. Along with others, we
identified that human macrophages and microglia infected by HIV-1 were
substantially involved in the generation of excess extracellular glutamate [50,
84]. This generation of excess glutamate represents a major component of
macrophage –, or microglia – mediated neurotoxicity [85]. Notably, we have
demonstrated that the neuroinflammatory and neurotoxic events of
macrophages and microglia infected by HIV-1 are augmented by GLS1 in vitro
[71, 84, 86]. And importantly, we have determined that GLS1 dysregulation is a
key event in neuroinflammation required for excess glutamate generation in
10
HIV-1 infection – induced neurotoxicity [87, 88]. And interestingly, GLS1 release
is involved in extracellular glutamate production [85, 89, 90].
So together we have documented roles of GLS1 in microglia and
macrophages in brain injury, infection and inflammation [50, 86, 90] and more
recently the regulation and function of GLS1 in neurons under inflammation [53].
1.5.1 Pathogenic role of macrophage GLS1 in HAND
HIV-1-infected macrophages have been reported to be a critial cellular
source of extracellular glutamate. In the past decade, we have reported an HIV-
1-mediated increase of glutamate generation by MDM [50]. The examination of
GLS1 regulation in HIV-1-infected MDM has revealed an isoform-specific
upregulation of GAC expression, while the expression of KGA remains largely
unchanged. The siRNA targeting GAC in HIV-1-infected MDM has substantially
decreased the production of glutamate [90]. In addition, rat cortical neurons
treated by macrophage-conditioned medium (MCM) from HIV-1-infected MDM
have shown significant toxicity, which, can be largely reversed by removing
glutamine from the MCM, antagonizing NMDA receptor, inhibiting GLS1 activity
with pharmacological inhibitors, or targeting GAC with siRNA [85]. Together,
these studies demonstrate a pathogenic role of macrophage GAC in mediating
excitotoxicity and disease progressions of HAND [90].
1.5.2 Pathogenic role of microglial GLS1 in HAND

11
Microglia are the main cellular targets of HIV-1 infection in CNS. The HIV-
1-infected- or immune-activated microglia have been reported to play an
important pathogenic role in HAND. Specifically, our laboratory has
demonstrated that HIV-1-infected microglia have substantially-increased
glutamate production and are largely more neurotoxic than uninfected microglia
using a human microglia primary culture system. Consistent with the findings in
HIV-1-infected MDM, the examinations of GLS1 RNA and protein levels in HIV-
1-infected microglia have revealed an isoform-specific upregulation of GAC. And
importantly, targeting GAC by siRNA and inhibiting GLS1 using pharmacological
inhibitors have successfully reversed the excess glutamate production and the
neurotoxic effects of HIV-1-infected microglia [84]. Again, these findings support
that glutaminase as an important component of the pathogenic process of
HAND.
1.5.3 Pathogenic role of neuronal GLS1 in HAND
Despite the fact that neurons having the highest expression levels of
GLS1 in CNS, little is known about the role of neuronal GLS1 in mediating
excitotoxcity of HAND until recently. In 2013, our laboratory has reported that
both human and rat primary neurons treated by two proinflammatory cytokines
that are typically elevated in neurodegenerative conditions, interleukin-1β (IL-1β)
and tumor necrosis factor-α (TNF-α), produce substantially-increased
intracellular and extracellular glutamate. The increase in glutamate production
by those neurons under inflammation has induced toxic effects as the viability of

12
other neurons treated by the conditioned medium from inflammtory cytokines-
treated neurons is largely decreased. GLS1 isoform KGA has been found to be
significantly upregulated in both human and rat primary neurons under
inflammation. And importantly, the neurotoxic effects are reversed by inhibiting
GLS1 activity with pharmacological inhibitors or by antagolizing NMDA receptors
[53]. Taken together, these results demonstrate a critical role of dysregulated
GLS1 in neurons in mediating the progresses of brain inflammation and
excitotoxicity in HAND.
1.6 Conclusion
Excitotoxicity mediated by excess glutamate production and
overactivation of NMDA receptor is a basic componenet of various
neurodegenerative disorders [50, 69, 70]. Specifically in HAND, excess
glutamate generation seems to be a critical contributor although a number of
factors clearly affect the pathogenesis of HAND. Glutamine, the substrate for the
production of glutamate by GLS1 in the brain, is abundantly available at the
millimolar range. In CNS, GLS1 catalyzes the deamination of glutamine to
produce glutamate in an energetically favorable process. It is important to
identify the specific cell type accounting for excess glutamate generation and
understand the underlying mechanisms. With explicit effort, our laboratory with
others have demonstrated that increased glutamate generation and release,
decreased glutamate reuptake by presynaptic neurons, and reduced glutamate
uptake by astrocytes all contribute to excess extracellular level of glutamate [91-

13
93]. We have documented the ciritcal roles of GLS1 dysregulation in brain
macrophages, microglia, and inflammatory neurons, in excess glutamate
production and augmentation of brain inflammation and neurotoxicity in vitro [50,
86, 90] [53].
To verify the clinical relevance of these findings, we investigated the
expression levels of GLS1 in the postmortem brain tissues of HIV-1-infected
patients with dementia. Importantly, we have identified an isoform-specific
upregulation of GAC levels in the postmortem brain tissue of HAND patients
comparing with that of HIV serum-negative controls, and the increased levels of
GAC are correlated with elevated concentrations of glutamate in HAND patients’
postmortem brain tissues [84, 90].
These results suggest that in a disease involving progressive
neuroinflammation and excitoxicity as HAND, the aberrantly upregulated or
released GLS1 plays a pathogenic role. Even more importantly, the findings that
by targeting the dysregulated GLS1 with pharmacological inhibitors or siRNA
reversed neuroinflammation or neurotoxicity strongly indicate that GLS1 can be
a potentially valuable therapeutic target for treating HAND.
In order to further determine the pathogenic role of aberrantly regulated
GLS1 and further investigate GLS1 as a new therapeutic target for HAND, we
have started to utilize integral animal models to study the role of aberrantly
regulated GLS1 in HAND pathogenesis and the underlying mechanisms in vivo.
We hypothesize that there is strong association between GLS1 dysregulation
and brain inflammation or cognitive impairment of HAND animals, and the brain-

14
specific overexpression of GLS1 will have a causal effect on inducing
neurotoxicity.
15
1.7 Figures
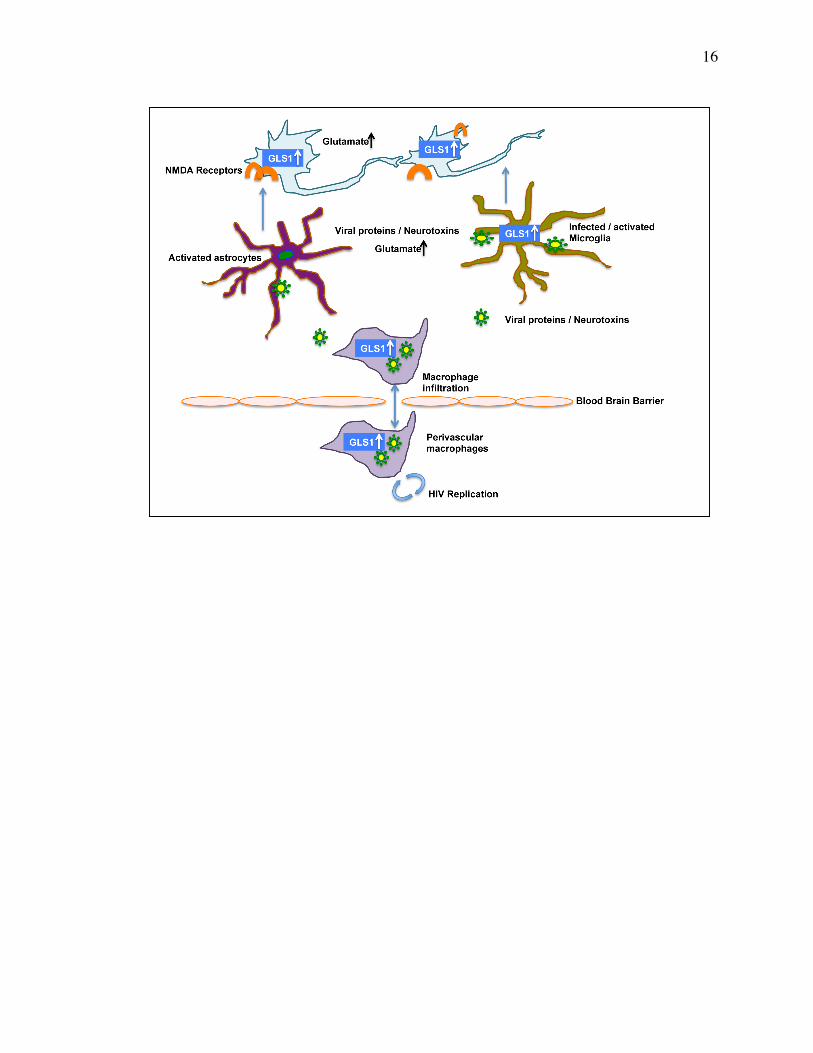
Figure 1.1 Proposed model for the pathogenic role of dysregulated
GLS1 in HAND. Previous studies revealed that GLS1 levels are increased in
the HIV-1-infected macrophages and microglia. Viral proteins and neurotoxins
secreted by infected brain macrophages and microglia activate uninfected
microglia, macrophages, and astrocytes. Activated microglia, macrophages, and
astrocytes release more neurotoxins and inflammatory molecules that damage
neurons via overactivation of NMDA receptors. Neurons treated by
proinflammatory cytokines have increased levels of GLS1. Inflammatory
neurons secrete excess glutamate extracellularly and cause further damage to
neurons.
16

17
CHAPTER 2
Glutaminase 1 is Aberrantly Upregulated in CNS of HAND murine models
and is Associated with Brain Inflammation and Cognitive Impairment

18
2.1 Abstract
Glutaminase is the enzyme that converts glutamine into glutamate, which
serves as a key excitatory neurotransmitter and one of the energy providers for
cellular metabolism. Glutamate is essential for proper brain functioning but at
excess levels, it is neurotoxic and has a key role in the pathogenesis of various
neurodegenerative diseases, including HIV-1 associated neurocognitive
disorders (HAND). However, the detailed mechanism of glutamate-mediated
neurotoxicity remains incompletely understood. Our previous data revealed that
GLS1 dysregulation is a key event in neuroinflammation and excess glutamate
production in HIV-1-infected macrophages and microglia, and in neurons treated
by inflammatory cytokines in vitro. But the regulation of GLS1 and its association
with the progressions of neuroinflammation and neurotoxicity in vivo remains
unknown. Using the well-established HAND murine models, the HIV trans-
activator of transcription (HIV-Tat) transgenic (Tg) mouse and HIVE-severe
combined immunodeficient (SCID) mouse, we identified that GLS1 isoforms
were upregulated in whole brain tissues of HIV-Tat Tg mouse and in the
neuroinflammatory areas of HIVE-SCID mouse brains. The elevated GLS1
expression levels were correlated with increased CNS astrogliosis and impaired
spatial learning and memory of HIV-Tat Tg mouse, suggesting that GLS1
dysregulation is strongly associated with the pathogenesis of HAND. Together,
these data imply a pathogenic role of GLS1 dysregulation for HAND in vivo.

19
2.2 Introduction
Non-human primates infected by the simian immunodeficiency virus (SIV)
or by chimeric SIV/HIV viruses best mimic human HIV disease among all animal
models. However, murine models possess notable advantages in consideration
of advanced and easy-to-handle genetic methods for mouse genome
manipulation, comparably low cost of maintaining animals and less difficulty of
handling animals.
Given the fact that HIV is not infectious to murine species, generating
small animal models to mimic the human pathology of HAND is a very
challeging job. To date, the well-established and accepted murine models for
HAND include: HIV-1 glycoprotien 120 (gp120) Tg mouse, HIV-Tat Tg mouse,
the humanized mouse, and HIVE-SCID mouse [94]. HIV-Tat Tg mouse and
HIVE-SCID mouse represnet two major different approaches of making murine
models for HAND.
Generating Tg mouse models was among the very first endeavors for the
study of HAND pathology in vivo. But it was not until recently that HIV-Tat Tg
mouse has been well-accepted and extensively used as a HAND murine model.
Tat is the first protein produced by HIV-1-infected cells. Upon secreted, Tat can
invade and enter into most cell types of the human body via its arginie-rich
domain. Importantly, Tat production is not significantly affected by the combined
antiretroviral therapy (cART) as recent studies demonstrate that Tat is present in
the cerebrospinal fluid (CSF) of HIV-1-infected individuals virologically controlled
under cART [95]. This makes HIV-Tat Tg mouse the most popular HAND Tg

20
murine model in the post-HAART era [96, 97] because although gp120 is the
most prominent viral antigen found in the lysates of HIV-1-infected cells [98] and
gp120 can be shed by infected macrophages and activated astrocytes in CNS to
cause neuronal damage, its production is largely reduced by sustained cART.
Several HIV-Tat Tg mouse models have been created to understand the
contribution of Tat protein to HAND progressions [96, 99-101], among which, the
brain-specific HIV Tat Tg mouse under the control of the GFAP promoter with
doxycycline-inducible system (GFAP-Tat) is one of the best characterized and
most widely used [96, 101]. In this study, we utilized the GFAP-Tat Tg mouse.
This line of mouse will be referred to as HIV-Tat Tg mouse in the rest of text.
Besides Tg mouse, another major approach for generating HAND murine
models is by transplanting human cells or tissues into genetically modified
immunodeficient mice. The HIVE-SCID mouse is created by implanting HIV-1-
infected macrophages directly into the basil ganglia of SCID mice [102]. These
mice persistently express HIV p24 antigen in the brain and can survive up to 5
weeks following cell implantation [103].
Neuroinflammation, excitotoxicity, synaptic damage and cognitive
impairments have been found in both HIV-Tat Tg mouse and HIVE-SCID
mouse. However, the regulation of GLS1 in CNS of these animals and the
asssociation of GLS1 regulation with brain inflammation and neuronal damage
remains unknown. In this chapter, we report that the GLS1 isoforms were
upregulated in whole brain tissues of HIV-Tat Tg mouse and in the
neuroinflammatory areas of HIVE-SCID mouse brains. The elevated GLS1

21
expression levels were correlated with increased CNS astrogliosis and impaired
spatial learning and memory of HIV-Tat Tg mouse.

22
2.3 Materials and methods
Animals
C.B.-17-SCID mice of four weeks of age were purchased from Jackson
Laboratory (Bar Harbor, ME). The GFAP-Tat Tg mice were generously provided
to us by Dr. Kurt Hauser from Virginia Commonwealth University. The GFAP-Tat
Tg mouse model was originally developed by Dr. Avindra Nath. Distribution of
this model was allowed by Dr. Nath. All animals were housed and bred in the
Comparative Medicine facilities of the University of Nebraska Medical Center. All
procedures were conducted according to protocols approved by the Institutional
Animal Care and Use Committee (IACUC) of the University of Nebraska Medical
Center. All Tg mice were genotyped through PCR reactions. DNA of embryonic
tissue or adult mouse-tail tissue was extracted with phenol/chloroform, and
purified by isopropanol and ethanol for PCR reactions. The primers used for
genotyping are listed in Table 2.1.
MDM isolation, culture, HIV-1 infection and implantation to SCID mice
Human monocytes recovered from peripheral blood mononuclear cells of
healthy donors (HIV-1, 2 and hepatitis B seronegative donors) after
leukopheresis and counter current centrifugal elutration [104] were cultured as
adherent monolayers at the density of 1.1 x 10⁶ cells / well in the 24-well plates
for 7 days. The medium for cultivating monocytes is Dulbecco’s modified Eagles
medium (DMEM, GIBCO Invitrogen Corp, Carlsbad, CA) with 10% heat-
inactivated pooled human serum (Cambrex Bio Science, Walkersville, MD), 50
µg/ml gentamicin, 10 µg/ml ciprofloxacin (Sigma-Aldrich, St. Louis, IL) and 1000
23
U/ml highly purified recombinant human macrophage colony stimulating factor
(M-CSF) (Generously provided to us by Wyeth Institute, Cambridge, MA).
One week after being plated, MDM were infected by the laboratory HIV-
1ADA strain at a multiplicity of infection (MOI) of 0.1 virus per cell. On day after
infection, HIV-1ADA-infected MDM (5 x 10⁵ cells in 5 µl per mouse) were
intracranially injected into the basil ganglia of SCID mice by stereotactic
methods [103]. Duplicate SCID mice receiving intracranial injections of
uninfected MDM (5 x 10⁵ cells in 5 µl per mouse) served as controls.
Morris-Water-Maze (MWM) Test
One week after the intracranial injection of MDM, HIVE-SCID mice were
subjected to MWM test for behavior characterization. MWM test consists two
parts, the training phase and probe test. Mice were introduced into a circular,
water-filled tank, 91 cm in diameter and 110 cm in height. The tank was equally
divided into four quadrants. Visual cues were placed around the pool in plain
sight of the mouse to flag the submerged platform (10 cm in diameter). Various
parameters of mouse movement were recorded, including the time spent in
each quadrant of the pool, the time taken to reach the platform (escape latency),
and the total distance traveled. For each trial, the mouse was allowed no more
than 60 seconds to find the submerged platform before they were guided to the
platform, removed from water, towel dried and returned to their cage. Each
mouse will complete 4 trials per day during the 5-day training phase.
Immediately after the training, the probe test was conducted. For the probe test,
the platform was removed and each mouse was still given 60 seconds to swim

24
in the water. The swimming was videotaped analyzed by Ethovision XT (Noldus,
Netherlands). The same test was done in HIV-Tat mice.
Brain-tissue protein extraction and Western-blot
After behavior tests, a set of animals were sacrificed and the whole
brains were removed. The dissected tissues were homogenized by M-PER
Protein Extraction Buffer (Pierce, Rockford, IL) containing 1× protease inhibitor
cocktail (Roche Diagnostics, Indianapolis, IN). Protein concentrations were
determined using a BCA Protein Assay Kit (Pierce). Proteins (5-10 µg) from
tissue lysates were separated by sodium dodecyl sulfate-polyacrylamide gel
electrophoresis (SDS-PAGE). After electrophoretic transfer to
polyvinyldifluoridene (PVDF) membranes (Millipore and Bio-Rad), proteins were
treated with purified primary antibodies for KGA (rabbit, Dr. N. Curthoys,
Colorado State University, 1:1000), GAC (rabbit, Dr. N. Curthoys, Colorado
State University, 1:500), GFAP (mouse, cat#3670S, cell signaling, 1:1000), or β-
actin (mouse, Sigma-Aldrich, 1:10,000) overnight at 4 oC followed by a
horseradish peroxidase-linked secondary anti-rabbit or anti-mouse antibody
(Cell Signaling Technologies, 1:10,000). Antigen-antibody complexes were
visualized by Pierce ECL Western Blotting Substrate (Pierce). For data
quantification, films were scanned with a CanonScan 9950F scanner; the
acquired images were then analyzed on a Macintosh computer using the public
domain NIH Image J program (at http://rsb.info.nih.gov/nih-image/).
Analyses of glutamate concentrations
25
The intracellular glutamate levels in whole brain lysates of mice were
determined by Amplex Red Glutamic acid / Gutamate oxidase Assay Kit
(invitrogen) based on the manufacturer’s instruction. Brain tissue lysates were
diluted to the same protein concentration before entering the assay.
Statistical analyses
Data were analyzed as means ± SEM. The data were evaluated
statistically by the analysis of variance (ANOVA) followed by Tukey-test for
pairwise comparisons by using GraphPad Prism software. The two-tailed
Student’s t test was used to compare means of two groups. Correlations were
determined by Spearman correlation. Significance was considered when P <
0.05. All experiments were performed with at least three mice in each group to
account for any individual animal-specific differences. Assays were performed at
least three times in triplicate or quadruplicate.
26
2.4 Results
GLS1 isoforms are upregulated in HIV-Tat Tg mice brains
Our previous data revealed an upregulation of GLS1 in the
neuroinflammatory areas of HIVE-SCID mouse brain [53]. To validate and
further study the upregulation of GLS1 isoforms in CNS of HAND murine
models, we examined the expression levels of GLS1 isoforms KGA and GAC in
the whole brain tissue lysates of HIV-Tat Tg mice. In agreement of the
upregulation of GLS1 in HIVE-SCID mouse brains, protein analyses by
Western-blot revealed that the protein levels of both KGA and GAC were
elevated in HIV-Tat Tg mice brains compared to that in wide-type (WT)
littermate controls (Figure 2.1A-B). In parallel with the upregulation of GLS1
isoforms KGA and GAC, analysis of glutamate levels in the whole brain tissue
lysates revealed a significant increase of glutamate production in HIV-Tat Tg
mice brains (Figure 2.1C). Together, these data demonstrate that GLS1
isoforms were aberrantly upregulated in CNS of HIV-Tat mice and the
upregulated GLS1 produced more glutamate.
HIV-Tat Tg mice have increased astrogliosis in correlation with the
elevated GLS1 isoform expression levels and brain glutamate levels
Protein analysis by Western-blot confirmed a significant increase of
GFAP expression levels in HIV-Tat Tg mice brain tissue lysates, demonstrating
for an increased ongoing astrogliosis in these animals (Figure 2.2A-B).
Importantly, the elevations of KGA protein levels and glutamate levels in the
whole brain tissue lysates of HIV-Tat Tg mice were significantly correlated with

27
the increase of the expression levels of GFAP (Figure 2.2C,E), and the
elevations of GAC protein levels is marginally correlated (P = 0.09) with the
increase of the expression levels of GFAP (Figure 2.2D). Together, these data
suggest a significant association between GLS1 dysregulation and increased
brain inflammation.
HIV-Tat Tg mice and HIVE-SCID mice displayed impairments in spatial
learning and memory
Previous studies have reported behavior deficits in learning and memory
of HAND patients and animals. To behaviorally characterize and validate the
cognitive deficits of HIV-Tat Tg mouse and HIVE-SCID mouse, we carried out
the MWM test to determine the spatial learning and memory of these animals.
During the training phase of MWM test, HIV-Tat Tg mice displayed longer
escape latency (time spent to reach the submerged platform) (Figure 2.3A) and
travelled longer distance to escape (Figure 2.3B), indicating that HIV-Tat mice
had impaired capabilities in learning to escape from water. Meanwhile, HIV-Tat
Tg mice had similar swimming velocities comparing with that of WT control
littermates (Figure 2.3C). This demonstrates that the impairment of learning in
HIV-Tat Tg mice is not due to deficits in motor functions. Likewise, HIV-Tat Tg
mice spent significantly less time in the target quadrant (Q2, where the escape
platform was during the training phase) in the probe test than that spent by WT
control littermates (Figure 2.3D). These results indicate that Nestin-GAC mice
are impaired in spatial learning and memory.

28
Importantly, HIVE-SCID mice also exhibited longer escape latency during
the training phase (Figure 2.4A) and had significantly less time spent in the
target quadrant Q2 in the probe test (Figure 2.4B) comparing to SCID mice
injected with infected MDM. Together, these results demonstrate that HIV-Tat
Tg mice and HIVE-SCID have deficits in learning and memory related to
hippocampal and cortical functions.
Elevations of the expression levels of GLS1 isoforms and brain glutamate
levels are in correlation with the behavior impairments in spatial learning and
memory of HIV-Tat Tg mice
Correlation analyses were made to determine the associations between
GLS1 dysregulation and behavior deficits in spatial learning and memory of HIV-
Tat Tg mice. Correlation analyses revealed that GAC protein levels and brain
glutamate levels were positively correlated with the escape latencies on the last
day of MWM training phase (Figure 2.5B-C), and KGA protein levels were
marginally positively correlated with the escape latencies (Figure 2.5A). Also,
the elevation of brain glutamate levels was negatively correlated with the times
that animals spent in the target quadrant Q2 of MWM probe test (Figure 2.5D).
Therefore, these data indicate a strong association between GLS1 dysregulation
and the spatial learning and memory impairments of HIV-Tat Tg mice.

29
2.5 Discussion
Understanding the regulation GLS1 and its association with brain
inflammation, neurotoxicity, and cognitive impairments in HAND animal models
will give the first clue towards the identifcation of whether GLS1 dysregulation
has a pathogenic role and whether GLS1 can be a potential therapeutic target
for HAND. In this chapter, we studied the regulation of GLS1 isoforms and the
production of glutamate by GLS1 in HAND murine models. We report that the
GLS1 isoforms were upregulated in the whole brain tissues of HIV-Tat Tg
mouse and in the neuroinflammatory areas of HIVE-SCID mouse brains. The
elevated GLS1 expression levels were correlated with increased CNS
astrogliosis and impaired spatial learning and memory of HIV-Tat Tg mouse.
These data support our central hypothesis that GLS1 dysregulation contributes
to HAND pathogenesis via mediating brain inflammation and excitotoxicity.
Aberrant GLS1 upregulation and excess glutamate production in HIV-1-
infected macrophages [73, 85, 86, 90], microglia [84-86] and in neurons under
inflammation [53] has been well-characterized in vitro, and increased glutamate
and upregulated GLS1 levels were found in HAND patients [84, 105]. The
current study is the first to report an aberrant upregulation of GLS1 isoforms in
the well-accepted and widely used HAND murine model, HIV-Tat Tg mouse;
and the first to link GLS1 dysreuglation with neuroinflammation and cognitive
impairments of HAND animals in vivo.
At current stage, we have determined the aberrant upregulation of GLS1
isoforms KGA and GAC in the whole brain tissues of HIV-Tat Tg mice. It will be

30
interesting and important to document the expression profiles of KGA and GAC
in different areas of HIV-Tat Tg mice brains. Unlike HIVE-SCID mice which have
the HIV-1-infected MDM injected into the basil ganglia thus displaying most of
the neuroinflammatory and neurotoxic responses there, HIV-Tat Tg mice carry
the expression of Tat almost globally in CNS [96, 97]. Therefore, the spatial
pattern of GLS1 dysregulation in HIV-Tat Tg mouse CNS is expected to be
different from that in HIVE-SCID mouse CNS. Our previous data revealed that
the majority of GLS1 aberrant upregulation in HIVE-SCID mouse CNS was
found in neurons of the inflammatory area [53]. One study reported that the
neuronal damage is largely localized in the cerebellum and cortex of HIV-Tat Tg
mouse [101]. Other studies reported relatively subtle neural damages including
reductions in spine density and malformations of dendrites of neurons [106]. It is
important to locate the specific cell type and possibly the specific brain area that
has the majority of GLS1 dysregulation in HIV-Tat Tg mouse.
Besides the spatial profile of GLS1 dysregulation, to know the temporal
regulation profile of GLS1 in HIV-Tat Tg mouse is equally important. This will
help to determine the sequence of inflammatory and neurotoxic events occuring
in HIV-Tat Tg mouse brain. It is interesting to know whether the aberrant
upregulation of GLS1 occurs prior to brain inflammatory responses. This will be
critical to determine the pathogenic role of GLS1 dysregulation in HAND. It could
be challenging to distinguish sequence of events as multiple events could have
occurred within a very short time frame thus making it difficult for investigators to
tell them apart. In consideration of this, using genetical tools to modify GLS1

31
regulation in mouse CNS will be a helpful approach towards the determination of
the cause-effect relationship.
32
2.6 Tables and Figures
TAT 1 GCGGATCCATGGAGCCAGTAGATCCTAG
TAT 2 GCGAATTCTCATTGCTTTGATAGAGAAACTTG
RTTA 1 AATCGAAGGTTTAACCCG
RTTA 2 TTGATCTTCCAATACGCAACC
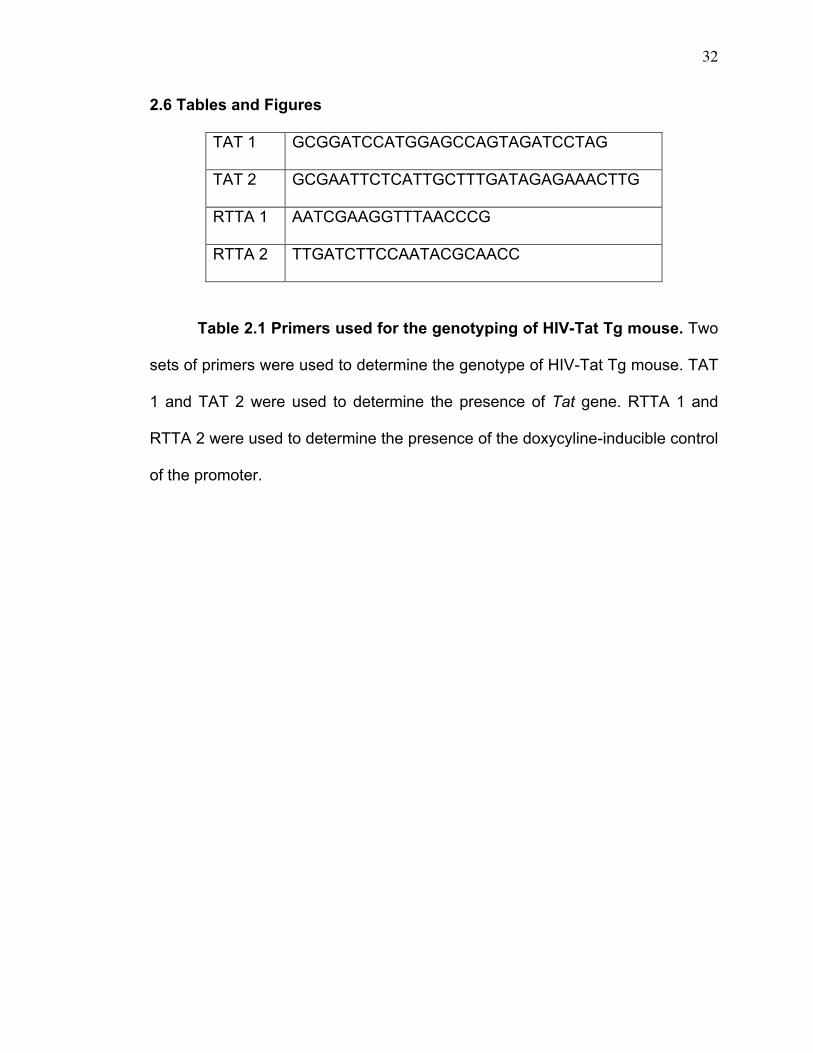
Table 2.1 Primers used for the genotyping of HIV-Tat Tg mouse. Two
sets of primers were used to determine the genotype of HIV-Tat Tg mouse. TAT
1 and TAT 2 were used to determine the presence of Tat gene. RTTA 1 and
RTTA 2 were used to determine the presence of the doxycyline-inducible control
of the promoter.

33
Figure 2.1 HIV-Tat Tg mice had upregulated GLS1 isoforms KGA and
GAC in the brain. A-B). Whole brain lysates from HIV-Tat Tg and their WT
control littermates were collected and the expression levels of KGA and GAC
were determined by Western blot. Representative blots of GAC expression are
shown (A). Quantification data were normalized to beta-actin and presented as
fold changes compared to control mice (B). C). Intracellular glutamate levels of
whole brain lysates were determined using the Amplex Red Glutamic acid /
Gutamate oxidase Assay Kit. Data are shown as the means ± SEM. * P < 0.05,
compared with control mice, N = 6 for WT controls and HIV-Tat Tg mice.

34
35
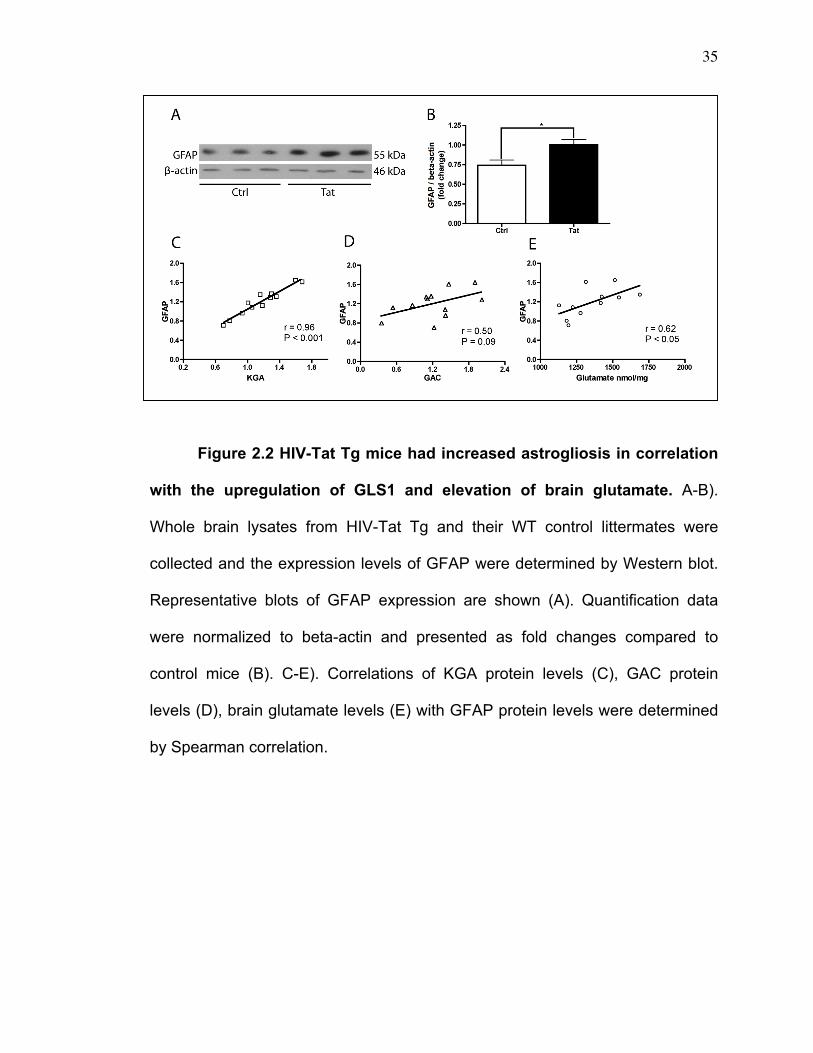
Figure 2.2 HIV-Tat Tg mice had increased astrogliosis in correlation
with the upregulation of GLS1 and elevation of brain glutamate. A-B).
Whole brain lysates from HIV-Tat Tg and their WT control littermates were
collected and the expression levels of GFAP were determined by Western blot.
Representative blots of GFAP expression are shown (A). Quantification data
were normalized to beta-actin and presented as fold changes compared to
control mice (B). C-E). Correlations of KGA protein levels (C), GAC protein
levels (D), brain glutamate levels (E) with GFAP protein levels were determined
by Spearman correlation.

36
Figure 2.3 HIV-Tat Tg mice exhibited impairment in spatial learning
and memory. A-D). Morris-Water-Maze test was utilized to examine the spatial
learning of memory of HIV-Tat Tg mice. During the training phase, HIV-Tat Tg
mice exhibited longer escape latency (A), travelled longer distance to reach
platform (B), but exhibited similar swimming velocities (C). During probe test,
HIV-Tat Tg mice spent less time in the target quadrant (D). Data are shown as
the means ± SEM. * P < 0.05, *** P < 0.001, compared with control mice, N = 6
for WT controls and HIV-Tat Tg mice.

37
Figure 2.4 HIVE-SCID mice exhibited impairment in spatial learning
and memory. A-B). Morris-Water-Maze test was utilized to examine the spatial
learning of memory of HIVE-SCID mice. During the training phase, HIVE-SCID
mice exhibited longer escape latency (A). During probe test, HIVE-SCID mice
spent significantly less time in the target quadrant (B). Data are shown as the
means ± SEM. * P < 0.05, *** P < 0.001, compared with control mice, N = 6 for
uninfected-MDM controls and HIVE-SCID mice.
38
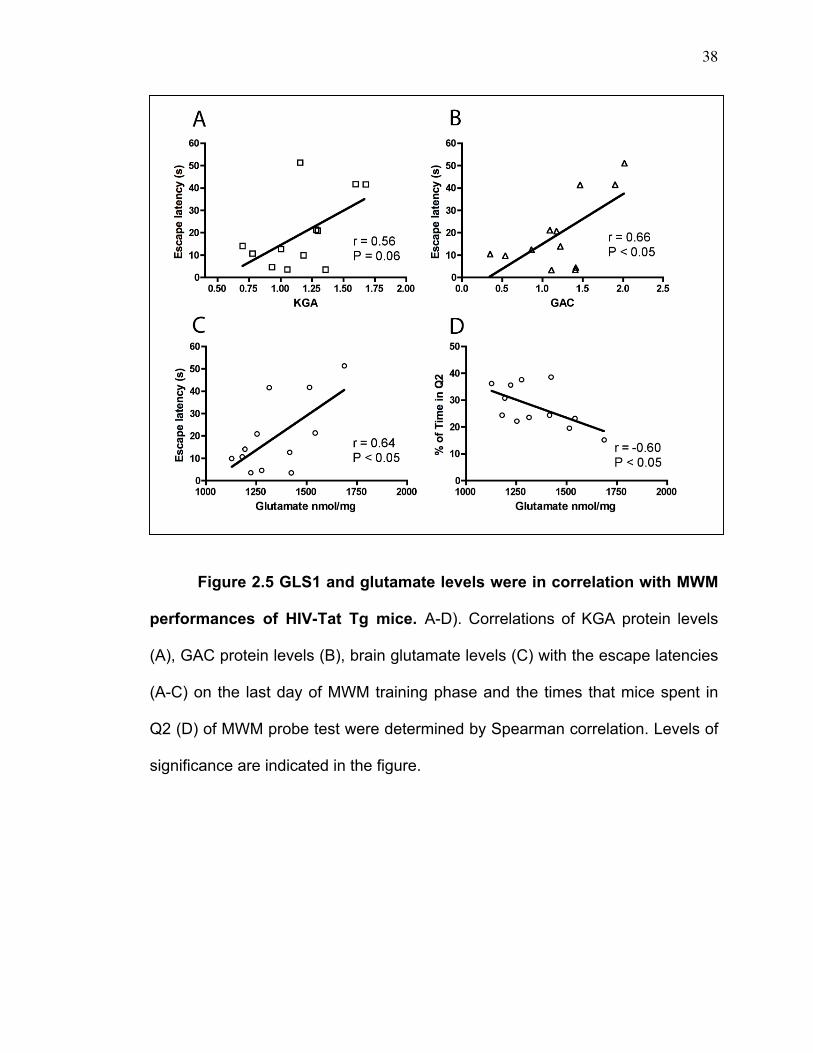
Figure 2.5 GLS1 and glutamate levels were in correlation with MWM
performances of HIV-Tat Tg mice. A-D). Correlations of KGA protein levels
(A), GAC protein levels (B), brain glutamate levels (C) with the escape latencies
(A-C) on the last day of MWM training phase and the times that mice spent in
Q2 (D) of MWM probe test were determined by Spearman correlation. Levels of
significance are indicated in the figure.

39
CHAPTER 3
Brain-specific Overexpression of Glutaminase C Induces
Neuroinflammation, Synaptic Damage and Dementia in Mice: Relevance to
HAND
40
3.1 Abstract
Glutaminase is the enzyme that converts glutamine into glutamate, which
serves as a key excitatory neurotransmitter and one of the energy providers for
cellular metabolism. Glutamate is essential for proper brain functioning but at
excess levels, it is neurotoxic and has a key role in the pathogenesis of various
neurodegenerative diseases, including HIV-1 associated neurocognitive
disorders (HAND). However, the detailed mechanism of glutamate-mediated
neurotoxicity remains unclear. Our previous data revealed upregulation of
glutaminase C (GAC) in the postmortem brain tissues of patients with HIV
dementia by protein analysis, suggesting a critical role of GAC in the instigation
of primary dysfunction and subsequent neuronal damage in HAND. Therefore,
we hypothesize that GAC dysregulation in brain is sufficient to induce brain
inflammation and dementia in relevance to HAND. Using a brain GAC
overexpression mouse model (which has the overexpression of GAC confined in
the brain), we found that the expression of the marker for brain inflammation, the
glial fibrillary acidic protein (GFAP), was increased in the brains of GAC-
overexpression mice, suggesting increased reactive astrogliosis. To study the
functional impact of GAC overexpression, we performed Morris Water Maze
(MWM) test and Contextual Fear Conditioning (CFC) test to determine the
learning and memory of mice. GAC-overexpression mice exhibited longer
escape latency during the training and lower percentage of time spent in the
target quadrant during the probe test, indicating that overexpressing GAC in
mouse brain impaired the learning and memory of the animals. Together, these

41
data suggest that dysregulated GAC in mouse brain causes prolonged
inflammation and dementia.

42
3.2 Introduction
Neurological disorders develop during progressive HIV-1 infection and are
characterized by cognitive deteriorations, behavioral disorders and potential
progressive motor impairments as a consequence of neuronal damage [107].
These disorders affect up to 50% of HIV-1 infected individuals and are termed
as HIV-1 associated neurocognitive disorders (HAND) [3]. HAND comprise three
categories based on standardized measures of dysfunction [2]: HIV-1
associated dementia (HAD), minor cognitive motor disorder (MCMD), and
asymptomatic neurocognitive impairment (ANI) [2]. With the effective treatment
by highly active antiretroviral therapy (HAART), the occurrence of HAD, the
most severe and devastating form of HAND, has dramatically fallen [4].
However, HAART fails to prevent the milder neurocognitive disorders, thus
cognitive impairment continues to be a commonplace associated with HIV-1
infection. It is critical to develop new therapeutic approaches to prevent
neurocognitive impairment, as it is affecting the everyday life of patients
including driving, employment and medication management.
Chronic neuroinflammation is a hallmark of HAND and a constitutive
component of the pathogenesis of neurodegenerative diseases including HAND,
multiple sclerosis, amyotrophic lateral sclerosis, Parkinson’s disease and
Alzheimer’s disease [33-35]. Literature have suggested a close link between
brain inflammation and neuronal injury [36, 39]. HIV-infected and activated
microglia or macrophages instigate brain inflammation and induce neuronal
injury through the production and release of various soluble neurotoxic factors

43
including glutamate [51, 52, 108]. Apart from glia cells, neurons play a role in the
progress of brain inflammation as well. Specifically, proinflammatory cytokines
TNF-α and IL-1β, which are typically elevated during neurodegenerative
diseases, induced neuronal loss via the production and release of glutamate in
neuronal culture [53].
Glutamate is the most abundant neurotransmitter in CNS [55]. It is
essential for vital physiologic processes including neural development, synaptic
plasticity, learning and memory [56, 57]. However at excess levels, glutamate
has the potential to induce extensive neuronal injury, which is termed
excitotoxicity. Therefore, elevated glutamate has been linked to the pathogenic
processes of various CNS disorders [65-68] and neurodegenerative diseases
including HAND [50, 69, 70]. In CNS, glutamate is typically derived from
glutamine by the action of mitochondrial enzyme glutaminase. The predominant
glutamine-utilizing and glutamate-producing enzyme in CNS is glutaminase 1
(GLS1), whereas the isozyme glutaminase 2 is expressed at lower levels [72].
Furthermore, GLS1 has two alternative splicing isoforms, which include
glutaminase C (GAC) and kidney-type glutaminase (KGA). GAC shares the
same functional region of KGA and possesses a unique C-terminal [76].
Glutaminase catalyzes the following reaction: Glutamine + H2O → Glutamate +
NH3. This reaction is energetically favorable so glutaminase must be tightly
regulated to prevent excess glutamate generation and excitotoxicity [73]. In the
past decade our laboratory developed molecular and chemical tools with explicit
intent to understand glutaminase activity and functions in the brain. Along with

44
others, we have documented roles of GLS1 in microglia and macrophages in
brain injury, infection and inflammation [50, 84, 85] and more recently the
regulation and function of GLS1 in neurons [53]. Importantly, we have identified
a specific upregulation of GAC levels in the postmortem brain tissue of HAND
patients [84, 90], suggesting that GAC might play a pathogenic role in HAND.
The currently available murine models for HAND include: HIV-1
glycoprotien 120 (gp120) transgenic mouse, HIV-Tat transgenic mouse, the
humanized mouse, and the HIV-1 encephalitis (HIVE) mouse [94]. While all
these models contribute to revealing the neuropathology of HAND, none of them
study the role of glutaminase. In order to unravel it, we generated a brain GAC
overexpression mouse model (which has the GAC overexpression confined in
the brain) and found prolonged brain inflammation and dementia in brain-
specific GAC overexpression animals.

45
3.3 Materials and methods
Generation of CAG-loxp-GAC and Nestin-GAC mice
The mouse Gac gene was cloned from a C57 mouse cDNA library and
was inserted into the pCAG-Loxp-STOP-Loxp-IRES-LacZ plasmid at restriction
enzyme site XhoI. The constructed plasmid was sequenced to ensure that only
plasmids with Gac forwardly inserted. The selected plasmid was linearized and
the linearized plasmid was microinjected into the fertilized egg for implantation
into a pseudopregnant female to create CAG-loxp-GAC mouse in the Mouse
Genome Engineering Core Facility of UNMC. GFP expressions in the brains of
CAG-loxp-GAC mice were examined to ensure the stable expressions of the
constructed plasmid. The CAG-loxp-GAC mice were then mated with a nestin
promoter-driven cre transgenic mouse (Nestin-Cre mouse) line (in which the cre
activity is confined to CNS) [109] to produce Nestin-GAC mice (Figure 3.1).
Animals
Nestin-Cre mice of four weeks of age were purchased from Jackson
Laboratory (Bar Harbor, ME). All mice were housed and bred in the
Comparative Medicine facilities of the University of Nebraska Medical Center. All
procedures were conducted according to protocols approved by the Institutional
Animal Care and Use Committee of the University of Nebraska Medical Center.
All transgenic mice were genotyped through PCR reactions. DNA of embryonic
tissue or adult mouse-tail tissue was extracted with phenol/chloroform, and
purified by isopropanol and ethanol for PCR reactions. The primers used for
genotyping are listed in Table 3.1.
46
Morris Water Maze (MWM) test
MWM test consists two parts, the training phase and probe test. Mice
were introduced into a circular, water-filled tank, 91 cm in diameter and 110 cm
in height. The tank was equally divided into four quadrants. Visual cues were
placed around the pool in plain sight of the mouse to flag the submerged
platform (10 cm in diameter). Various parameters of mouse movement were
recorded, including the time spent in each quadrant of the pool, the time taken
to reach the platform (escape latency), and the total distance traveled. For each
trial, the mouse was allowed no more than 60 seconds to find the submerged
platform before they were guided to the platform, removed from water, towel
dried and returned to their cage. Each mouse will complete 4 trials per day
during the 5-day training phase. Immediately after the training, the probe test
was conducted. For the probe test, the platform was removed and each mouse
was still given 60 seconds to swim in the water. The swimming was videotaped
analyzed by Ethovision XT (Noldus, Netherlands).
Contextual Fear Conditioning (CFC) Test
Fear conditioning was performed following standard procedures in the
light- and sound-attenuated chambers for mouse (Coulbourn Tru Scan Activity
Monitoring System for mouse). Mouse behavior was evaluated under ambient
illumination (room light) and was recorded by a SAMSUNG digital videocamera
set above the mouse arena chamber. The recorded behavior videos were
analyzed by Ethovision XT (Noldus), which assesses the time of freezing by
measuring changes in pixel intensities of video frames. The fear conditioning

47
procedure was conducted over 3 days. On 1st day, mice were given 300
seconds to be habituated to the arena chamber and no shock was administered.
The mouse chamber was cleaned with 70% ethanol before the introduction of
each mouse to the arena chamber. On 2nd day, the mouse chamber was
scented with 0.1% acetic acid and the mice were given two electric shocks at
170 s and 290 s during the 300 s through the automated Tru Scan Stimulus.
Chamber was cleaned with a non-alcohol disinfectant. On 3rd day, the chamber
was also scented with 0.1% acetic acid but no shock was given. Mice in the
mouse chamber were recorded for 180 s on the third day. The mouse chamber
was cleaned with a non-alcohol disinfectant. The freezing behavior was
analyzed by Ethovision XT (Noldus) and the percent of freezing was calculated
for each day.
Tissue protein extraction and Western-blot
The animals were sacrificed and the brains were removed. The
hippocampi, cortices, striatum, and kidneys were dissected free. The dissected
tissues were homogenized by M-PER Protein Extraction Buffer (Pierce,
Rockford, IL) containing 1× protease inhibitor cocktail (Roche). Protein
concentrations were determined using a BCA Protein Assay Kit (Pierce).
Proteins (5-10 µg) from tissue lysates were separated by sodium dodecyl
sulfate-polyacrylamide gel electrophoresis (SDS-PAGE). After electrophoretic
transfer to polyvinyldifluoridene (PVDF) membranes (Millipore and Bio-Rad),
proteins were treated with purified primary antibodies for MAP-2 (mouse,
cat#MAB3418, Millipore, 1:1000), GAC (rabbit, Dr. N. Curthoys, Colorado State

48
University, 1:500), Synaptophysin (rabbit, cat#ab32127, Abcam, 1:25,000),
GFAP (mouse, cat#3670S, cell signaling, 1:1000), PARP (rabbit, cat# 9542s,
Cell Signaling Technologies, Beverly, MA, 1:1000), Caspase 3 (rabbit,
cat#9662s, Cell Signaling, 1:1000) or β-actin (Sigma-Aldrich) overnight at 4 oC
followed by a horseradish peroxidase-linked secondary anti-rabbit or anti-mouse
antibody (Cell Signaling Technologies, 1:10,000). Antigen-antibody complexes
were visualized by Pierce ECL Western Blotting Substrate (Pierce). For data
quantification, films were scanned with a CanonScan 9950F scanner; the
acquired images were then analyzed on a Macintosh computer using the public
domain NIH Image J program (at http://rsb.info.nih.gov/nih-image/).
Free-floating immunohischemistry and image analyses
Animals were sacrificed and perfused with phosphate-buffered saline
(PBS) and then with depolymerized 4% paraformaldehyde (PFA). The brains
were rapidly removed and immersed in freshly depolymerized 4% PFA for 48
hours and then cryoprotected by 30% sucrose for 48 hours. The fixed,
cryoprotected brains were frozen and sectioned in the coronal plane at 30 µM
using a Cryostat (Leica Microsystems Inc., Bannockburn, IL), with sections
collected serially in PBS as previously described [110]. Brain sections were then
incubated overnight at 4 oC with primary antibodies, followed by goat anti-mouse
IgG Alexa Fluor 488 secondary antibodies (Molecular Probes, Eugene, OR,
1:1000) for 1 hour at 25 oC. Primary antibodies included rabbit GLS1 (Dr. N.
Curthoys, Colorado State University, 1:500), rabbit Synaptophysin (Abcam,
cat#ab32127, 1:500), and rabbit GFAP (Dako, Carpinteria CA, 1: 2000). All

49
antibodies were diluted in 0.1% Triton X-100, 5% goat serum in PBS. Cells were
counterstained with DAPI (Sigma-Aldrich, 1:1000) to identify nuclei. Images
were taken using a Zeiss Meta 710 confocal microscope (Carl Zeiss
MicroImaging, LLC) (20X object, tile scan 4X4 mode). Eight brain section
images from three mice were imported into Image-ProPlus, version 7.0 (Media
Cybernetics, Silver Spring, MD) for quantifying levels of either GFAP / DAPI, or
Synaptophysin / DAPI double positive staining.
In situ TUNEL assay
Brain sections were stained with an in situ TUNEL assay (Roche
Diagnostics, Indianapolis, IN) according to the manufacturer’s protocol. The
fluorescence intensity of TUNEL was quantified after acquiring random images
from immunostained fields using a Nikon Eclipse TE2000E microscope. Eight
brain section images from four mice were imported into Image-ProPlus, version
7.0 (Media Cybernetics, Silver spring, MD) for quantifying levels of fluorescence
intensity.
Hippocampal electrophysiology
Mouse hippocampal electrophysiology was perfomed as previously
described [111, 112]. mouse hippocampi were dissected free and live sagittal
hippocampal slices (300 µM in thickness) were prepared using a tissue chopper.
The hippocampal slices were incubated in the artificial cerebrospinal fluid
(ACSF, containing 124mM NaCl, 26mM NaHCO3, 1.25 mM NaH2PO4, 2.5 mM
KCl, 2 mM CaCl2, 2 mM MgCl2, and 10 mM glucose equilibrated with 95% O2
and 5% CO2, pH 7.3-7.4). The temperature of the perfusate was maintained at
50
30 + 1 oC with an automatic temperature controller (Warner Instrument,
Hamden, CT). The slices were incubated in the ACSF for 1-2 hours, and then
transferred to a recording chamber mounted on the stage of a dissection
microscope. Field excitatory postsynaptic potentials (fEPSPs) were evoked by a
low-frequency orthodromic stimulation (0.05 Hz) with constant current of
Schaffer collateral / Schaffer collateral commissural axons using an insulated
(excluding the tip) bipolar tungsten electrode. The intensity of stimulation was
selected to generate nearly 50% of a maximal response. The elicited fEPSPs
were recorded with an Axopatch-1D amplifier (Axon Instruments, CA) in the CA1
dendrites area (stratum radiatum). The recording microelectrodes were made
from borosiliacate glass capillaries with inner filaments enabling quick
backfilling. The diameter of the tip of the microelectrode was 5.0 µm with a
resistance of 1-5 MΩ when filled by ACSF.
The frequency facilitation tests were performed at 50% maximal fEPSP
for each hippocampal slice. A stimulation burst consisting 10 pulses was applied
to the slice after a 20 minute acclimation. The responses were recorded. Then
the slice was given a 20 minute recovery time before another stimulation burst
was given. The initial slopes of the recorded fEPSPs were measured and
analyzed as the percent of the first pulse (taking the first as 100%). Recordings
from the same group at the same time were averaged.
The ability of the high-frequency stimulation (HFS: 100 Hz, 500msec X 2)
to induce long-term potentiation (LTP) in CA1 of hippocampus was studied. The
high-frequency stimulus (HFS) was delivered to each hippocampal slical after

51
the 30 minute baseline recording and LTP was evoked. The initial slopes of
fEPSPs were measured and expressed as a percent of the baseline. LTP were
determined at 45-55 minutes after HFS.
Analyses of glutamate concentrations
The intracellular glutamate levels in brain lysates of mice were
determined by Amplex Red Glutamic acid / Gutamate oxidase Assay Kit
(invitrogen) based on the manufacturer’s instruction. Brain tissue lysates were
diluted to the same protein concentration before entering the assay.
Statistical analyses
Data were analyzed as means ± SEM. The data were evaluated
statistically by the analysis of variance (ANOVA) followed by Tukey-test for
pairwise comparisons by using GraphPad Prism software. The two-tailed
Student’s t test was used to compare means of two groups. Correlations were
determined by Spearman correlation. Significance was considered when P <
0.05. All experiments were performed with at least three mice in each group to
account for any individual animal-specific differences. Assays were performed at
least three times in triplicate or quadruplicate.
52
3.4 Results
GAC overexpression is specific to brains of Nestin-GAC mice
Lysates from the whole brain and kidney of both Nestin-GAC mice and
their wide-type (WT) control mice littermates prepared. Total protein was
extracted from either the whole brain lysates or kidney lysates. The gene
expression levels of GAC were determined by Western-blot and were found to
be higher in the whole brain lysate of Nestin-GAC mice than that of WT control
littermates (Figure 3.2A-B). Meanwhile, the total amount of intracellular
glutamate in the whole brain lysates was measured. In parallel to the increase of
GAC protein levels in the whole brain lysates of Nestin-GAC mice, the glutamate
levels were found to be higher in Nestin-GAC mice brains than that in WT
control littermates brains (Figure 3.2C), indicating higher enzymatic activity of
glutaminase in Nestin-GAC mouse brains. In contrast to the differences of GAC
protein levels in the whole brain lysates, Nestin-GAC mice and their WT control
littermates were found to have similar protein expression levels of GAC in the
kidney lysates (Figure 3.2D-E). Likewise, Nestin-GAC mice and their WT control
littermates had similar amount of glutamate in the kidney lysates (Figure 3.2F).
Therefore, these results demonstrate that the overexpression of GAC is specific
to brains in Nestin-GAC mice.
GAC overexpression is confirmed in different areas of Nestin-GAC
mouse brain
Whole brains of Nestin-GAC mice and their WT control littermates were
dissected and protein lysates were prepared from the hippocampi, cortices,

53
midbrains and cerebellums. The expression levels of GAC in different areas of
mouse brains were determined by Western-blot. Nestin-GAC mice had higher
expression levels of GAC in hippocampal, cortical, midbrain and cerebellar
lysates than that in lysates of WT control littermates (Figure 3.3A-B). In parallel
to the increase of GAC protein levels in different areas of Nestin-GAC mouse
brains, the amount of glutamate was found to be higher in hippocampal, cortical,
midbrain and cerebellar lysates (Figure 3.3C), indicating increased glutaminase
enzymatic activity in these brain areas of Nestin-GAC mice. To visualize the
increase of glutaminase protein levels in hippocampi of Nestin-GAC mouse
brains, we applied the anti-GLS1 antibody to brain slices of Nestin-GAC mice
and their WT control littermates. The fluorescence intensities of GLS1 were
quantified. Nestin-GAC mouse brain slices clearly had higher expression levels
of GLS1 in hippocampi (Figure 3.3D-E). These results confirm that GAC is
overexpressed in different areas of Nestin-GAC mouse brains.
Nestin-GAC mice exhibited deficits in learning and memory
To study the functional impact of the brain-specific GAC overexpression,
we utilized MWM test and CFC test to study the learning and memory of Nestin-
GAC mice and their WT control littermates. During the training phase of MWM
test, Nestin-GAC mice displayed longer escape latency (time spent to reach the
escape platform) (Figure 3.4A) and travelled longer distance to escape (Figure
3.4B), indicating that Nestin-GAC mice had impaired capabilities in learning to
escape from water. Meanwhile, Nestin-GAC mice had similar swimming
velocities comparing with that of WT control littermates (Figure 3.4C). This

54
demonstrates that the impairment of learning in Nestin-GAC mice is not due to
deficits in motor functions. Likewise, Nestin-GAC mice spent significantly less
time in the target quadrant (Q2, where the escape platform was during the
training phase) in the probe test than that spent by WT control littermates
(Figure 3.4D), and Nestin-GAC mice had significantly fewer times of crossings
through the platform area (Figure 3.4E). These results indicate that Nestin-GAC
mice are impaired in spatial learning and memory. Importantly, Nestin-GAC
mice apparently had lower percentage of freezing than that of WT control
littermates on the last day of CFC test (Figure 3.4F), indicating again that these
mice are impaired in hippocampus-related memory. Together, these results
demonstrate that Nestin-GAC mice have deficits in learning and memory related
to hippocampal and cortical functions.
Brain-specific overexpression of GAC leads to synaptic damage in mice
To identify ongoing changes in the hippocampi and cortices relating to
memory impairment of Nestin-GAC mice, we examined the synaptic network in
the brains of these animals. The expression levels of synapses marker,
Synaptophysin, were determined by Western blot in the hippocampal and
cortical lysates of Nestin-GAC mice and their WT control littermates.
Interestingly, the expression levels of Synaptophysin were found to be
dramatically decreased in the hippocampal (Figure 3.5A-B) and cortical (Figure
3.5C-D) lysates of Nestin-GAC mouse brains compared to that of WT control
littermates. This dramatic decrease indicates synaptic damage in the
hippocampal and cortical neuronal network of Nestin-GAC mouse brains. To

55
visualize the changes of the expression levels of Synaptophysin, we applied the
anti-Synaptophysin antibody to brain slices of Nestin-GAC mice and WT control
littermates. The fluorescence intensity of Synaptophysin was quantified.
Apparently, Nestin-GAC mice had lower expression levels of Synatophysin in
hippocampus as implied by lower fluorescence intensity (Figure 3.5E-F).
Together, these results suggest that the brain-specific GAC overexpression
leads to hippocampal and cortical synaptic damage in mice.
To determine whether synaptic injury leads to loss of hippocampal
synaptic function, we recorded long-term potentiation (LTP) in the CA1 region of
hippocampal brain slices. Nestin-GAC Tg mice exhibited diminished initiation
and maintenance of LTP (Figure. 3.6A-B), indicating GAC overexpression leads
to marked impairment of hippocampal synaptic transmission in vivo.
Brain-specific GAC overexpression leads to increased apoptosis in
mouse brains.
To explore of the specific reasons that cause the synaptic network
damage, we examined the expression levels of important proteins in the
apoptosis cascade. The expression levels of activated Caspase 3 (cleaved-
Caspase 3) and cleaved-PARP were determined by Western blot. Interestingly,
both the expression levels of cleaved-Caspase 3 and cleaved-PARP were found
to be dramatically increased in the hippocampal (Figure 3.7A-B) and cortical
(Figure 3.7C-D) lysates of Nestin-GAC mice compared to that of WT control
littermates. This indicates that there is increased apoptosis ongoing in Nestin-
GAC mouse brains. Importantly, the number of TUNEL positive cells in the
56
hippocampus was found to be increased as well in brain slices of Nestin-GAC
mice compared to WT control littermates as revealed by the in-situ TUNEL
assay (Figure 3.7E-F). These results together suggest that there is increased
ongoing apoptosis in the Nestin-GAC mouse hippocampi and cortices that may
account for the synaptic network damage in these animals.
Brain-specific GAC overexpression leads to reactive astrogliosis in
mouse brains.
Brain inflammation is a hallmark of HAND and a constitutive component
in the pathogenesis of HAND. To identify whether there is existing brain
inflammation of Nestin-GAC mice, we examined the expression levels of the
astrogliosis marker, glial fibrillary acidic protein (GFAP), by western blot and
immunohistochemistry. We found a significant increase of GFAP protein
expressions in the hippocampal (Figure 3.8A-B) and cortical (Figure 3.8C-D)
lysates of Nestin-GAC mice compared with that of WT control littermates.
Consistently, the fluorescence intensity of GFAP was found to be significantly
higher in hippocampi of Nestin-GAC mouse brain slices than that of WT control
littermate brain slices (Figure 3.8E-F). These results suggest ongoing reactive
astrogliosis in the Nestin-GAC mouse brains which implies prolonged brain
inflammation of Nestin-GAC mice.

57
3.5 Discussion
Despite the encouraging progresses made by HAART, HAND is still
significantly affecting the quality of life of HIV-1-infected individuals [3].
Identification of the key pathogenic components and understanding the
mechanisms underlying the development of neurological disorders during HIV-1
infection will largely contribute to the allevation, treatment or even prevention of
cognitive deteriorations and behavioral disorders [107]. Despite the important
discovery of the specific upregulation of GAC in the post mortem brain tissues of
HAND patients and the implied association of GAC with the pathogenesis of
HAND, the causal relationship of GAC upregulation and the disease
progressions of HAND remains to be identified. In this chapter, we generate the
Nestin-GAC transgenic mouse which has GAC overexpression confined in
brain. We report that the brain-specific GAC overexpression results in learning
and memory impairment in mice. Furthermore, we report that the brain-specific
overexpression of GAC leads to hippocampal and cortical synaptic network
damage, increased apoptosis and reactive astrogliosis in the hippocampi and
cortices of mice. Importantly, we have observed impairment of LTP in Nestin-
GAC mice, further demonstrating for the synaptic damage in hippocampi of
these animals. Together, these results suggest for the first time that the
overexpressed GAC in brain has a causal relationship with prolonged brain
inflammation and increased apoptosis, which, lead to neural network damage
and finally result in the impairment of cognitive functions of animals.

58
The identification of the pathogenic role of GAC in HAND has an
important clinical implication. Glutaminase dysregulation has long been
implicated in the pathogenesis or pathology of HAND. However, this is the first
time that we show that the dysregulation of the specific isoform of glutaminase
1, GAC, in the brain may be one of the major components that cause HAND
disease progressions through prolonged brain inflammation and increased
apoptosis that then result in synaptic network damage. Hippocampal – cortical
synaptic networking is well known to be essential for proper cognitive functions
like learning and memory [113-121]. Hippocampal and hippocampal-cortical
signaling has been studied for decades because of its crucial role in memory
[121-131]. Among that, glutamate signaling is well known to affect synaptic
plasticity [121, 127, 130, 132-134]. Specifically, a strong association between
the memory loss due to aging or disease and the disruption of NMDA receptor-
mediated neurotransmission has been revealed [127, 130, 134]. Glutamate is an
essential and vital neurotransmitter, but it is neurotoxic at excess levels.
Because the reaction of deamination of glutamine to produce glutamate is
energetically favorable, glutaminase as the primary enzyme catalyzing this
reaction ought to be finely regulated to prevent excess production of glutamate.
Although neighboring astrocytes of neurons are able to take up extra glutamate
by glutamate transporters and convert it back to glutamine with the catalysis by
glutamine synthase [81, 82], the present study suggests that the neural network
damage caused by dysregulated GAC in the brain cannot be overcome.
59
Whether there are alterations or dysregulations of glutamate receptors in
Nestin-GAC mouse brains is an interesting and important question to be
answered. Excitotoxicity common to various neurodegenerative diseases
including HAND involves overactivation of NMDA receptors. High-affinity NMDA
receptor antagonist MK801 has successfully blocked the toxicity from neurons
treated by inflammatory cytokines TNF-α and IL-1β [53]. More importantly, a
low-to-moderate-affinity NMDA receptor antagonist memantine has substantially
abrogated neurotoxicity and largely recovered the impaired synaptic
transmission and LTP [111]. Determining whether or not the neurotoxicity
observed in Nestin-GAC mouse brains is via the overactivation of NMDA
receptors will greatly help to further validate the resemblance of Nestin-GAC
mouse as a novel HAND murine model.
Apart from glutamate receptors, to study whether there are alterations or
dysregulations of glutamate transporters in Nestin-GAC mouse is of equal
importance. Glutamate transporters are of prominence for glutamate uptake and
regulating glutamate homeostasis [135]. Therefore, they serve as critical buffer
against excitotoxicity in the brain. Previous studies have revealed that
deregulation or loss of function of glutamate transporters EAAT1 and EAAT2
located on astrocytes augments neural inflammation and neurotoxicity [136,
137]. Enhancing EAAT1 activity is able to diminish neural damage and recover
cognitive impairment [138, 139].
Taken together, the study in this chapter suggests that dysregulated
glutaminase under pathological conditions can be an important novel

60
therapeutic target for reversing HAND progressions and HAND-related
complications. Because of that, to develop glutaminase inhibitors that target
specific isoform of the enzyme and target specific cell types are one of the
promising approaches for next step. Likewise, genetic approaches aiming to
knock down the expression levels of glutaminase in specific types of cells have
also been proposed as a promising therapeutic approach.
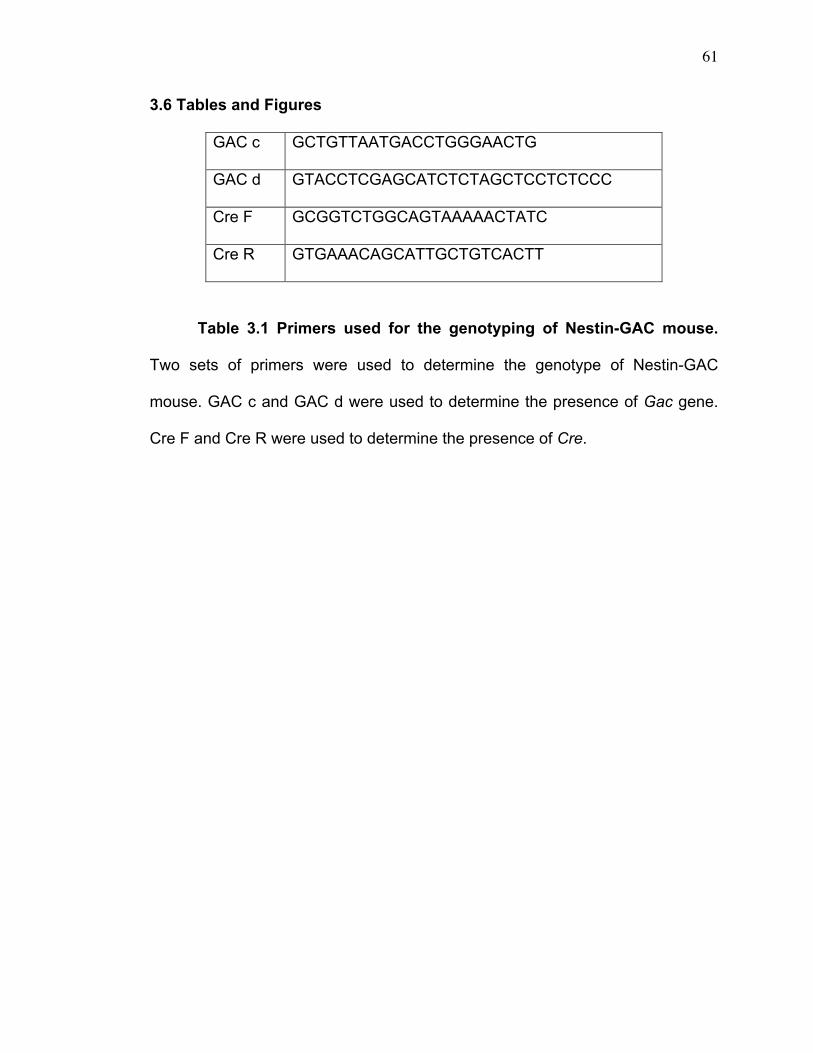
61
3.6 Tables and Figures
GAC c GCTGTTAATGACCTGGGAACTG
GAC d GTACCTCGAGCATCTCTAGCTCCTCTCCC
Cre F GCGGTCTGGCAGTAAAAACTATC
Cre R GTGAAACAGCATTGCTGTCACTT
Table 3.1 Primers used for the genotyping of Nestin-GAC mouse.
Two sets of primers were used to determine the genotype of Nestin-GAC
mouse. GAC c and GAC d were used to determine the presence of Gac gene.
Cre F and Cre R were used to determine the presence of Cre.
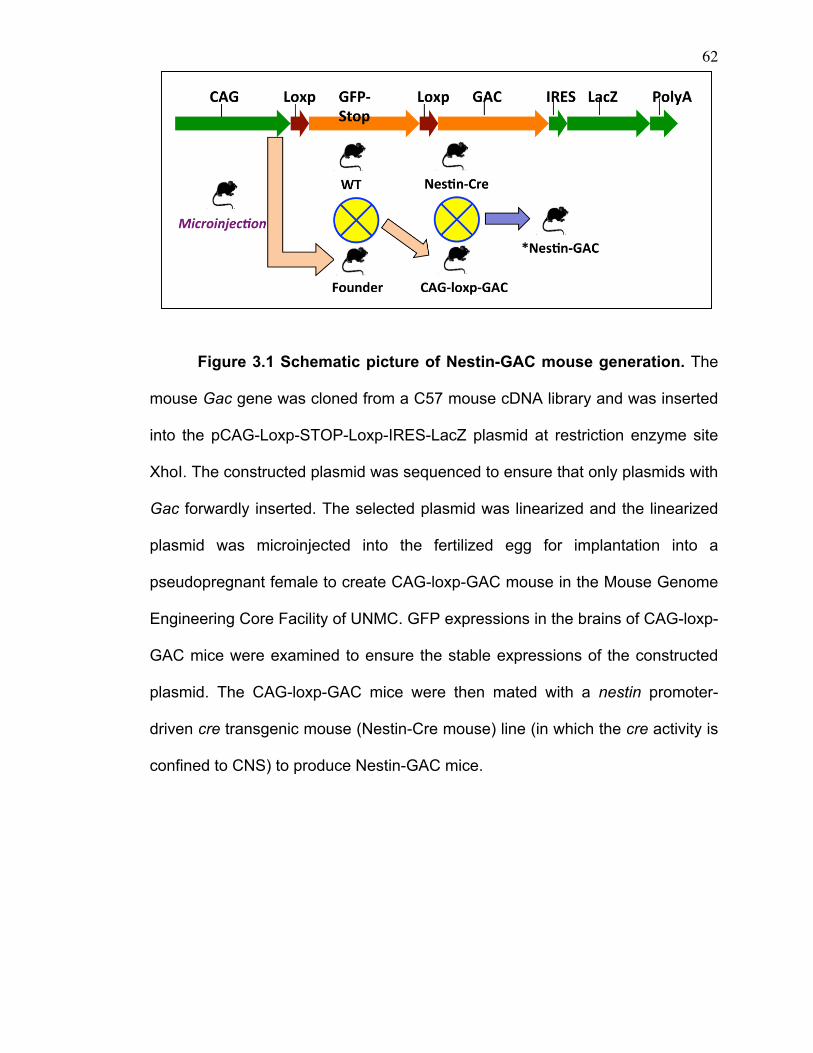
62
Figure 3.1 Schematic picture of Nestin-GAC mouse generation. The
mouse Gac gene was cloned from a C57 mouse cDNA library and was inserted
into the pCAG-Loxp-STOP-Loxp-IRES-LacZ plasmid at restriction enzyme site
XhoI. The constructed plasmid was sequenced to ensure that only plasmids with
Gac forwardly inserted. The selected plasmid was linearized and the linearized
plasmid was microinjected into the fertilized egg for implantation into a
pseudopregnant female to create CAG-loxp-GAC mouse in the Mouse Genome
Engineering Core Facility of UNMC. GFP expressions in the brains of CAG-loxp-
GAC mice were examined to ensure the stable expressions of the constructed
plasmid. The CAG-loxp-GAC mice were then mated with a nestin promoter-
driven cre transgenic mouse (Nestin-Cre mouse) line (in which the cre activity is
confined to CNS) to produce Nestin-GAC mice.

63
Figure 3.2 GAC overexpression was specific to brain in Nestin-GAC
mice. A-B). Whole brain lysates from Nestin-GAC and their control littermates
were collected and the expression levels of GAC were determined by Western
blot. Representative blots of GAC expression are shown (A). Quantification data
were normalized to beta-actin and presented as fold changes compared to
control mice (B). C). Intracellular glutamate levels of whole brain lysates were
determined using the Amplex Red Glutamic acid / Gutamate oxidase Assay Kit.
D-E). Protein lysates from kidneys were collected and the expressions of GAC
were determined by Western blot. Representative blots of kidney GAC
expressions are shown (D). Quantification data were normalized to beta-actin
and presented as fold changes compared to control mice (E). F). Intracellular
glutamate levels of kidney lysates were tested using the Amplex Red Glutamic
acid / Gutamate oxidase Assay Kit. Data are shown as the means ± SEM. * P <
0.05, ** P < 0.01, compared with control mice, N = 4.
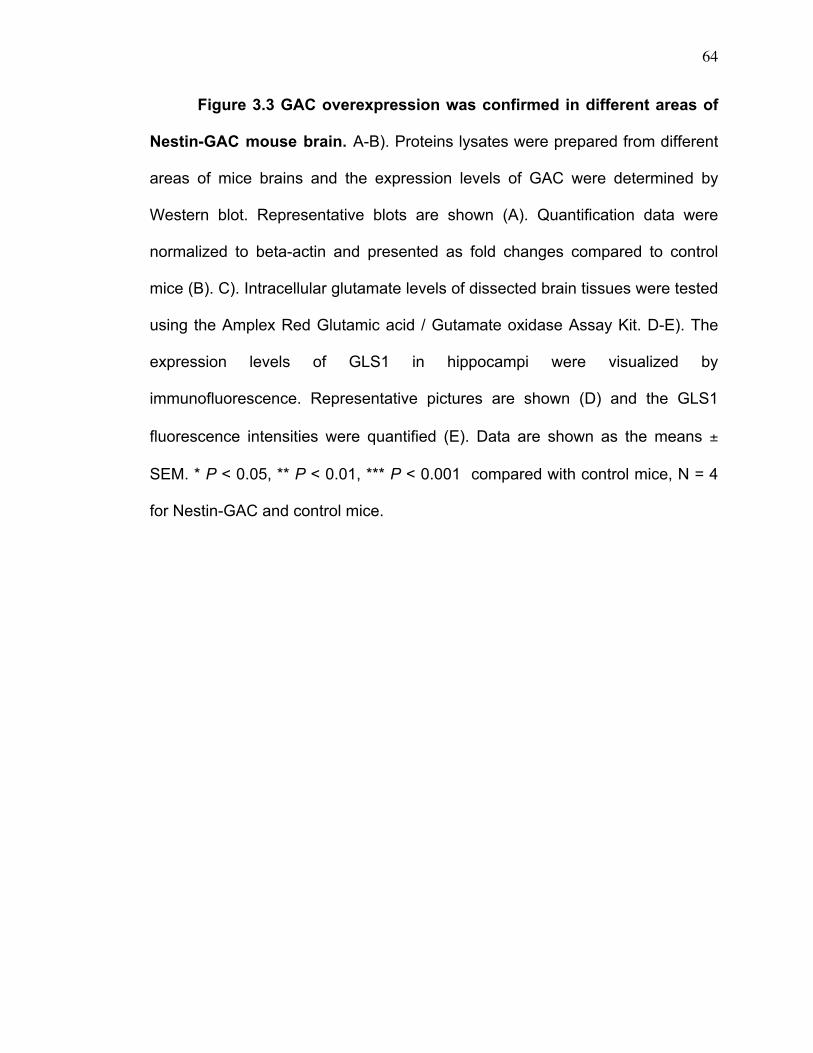
64
Figure 3.3 GAC overexpression was confirmed in different areas of
Nestin-GAC mouse brain. A-B). Proteins lysates were prepared from different
areas of mice brains and the expression levels of GAC were determined by
Western blot. Representative blots are shown (A). Quantification data were
normalized to beta-actin and presented as fold changes compared to control
mice (B). C). Intracellular glutamate levels of dissected brain tissues were tested
using the Amplex Red Glutamic acid / Gutamate oxidase Assay Kit. D-E). The
expression levels of GLS1 in hippocampi were visualized by
immunofluorescence. Representative pictures are shown (D) and the GLS1
fluorescence intensities were quantified (E). Data are shown as the means ±
SEM. * P < 0.05, ** P < 0.01, *** P < 0.001 compared with control mice, N = 4
for Nestin-GAC and control mice.
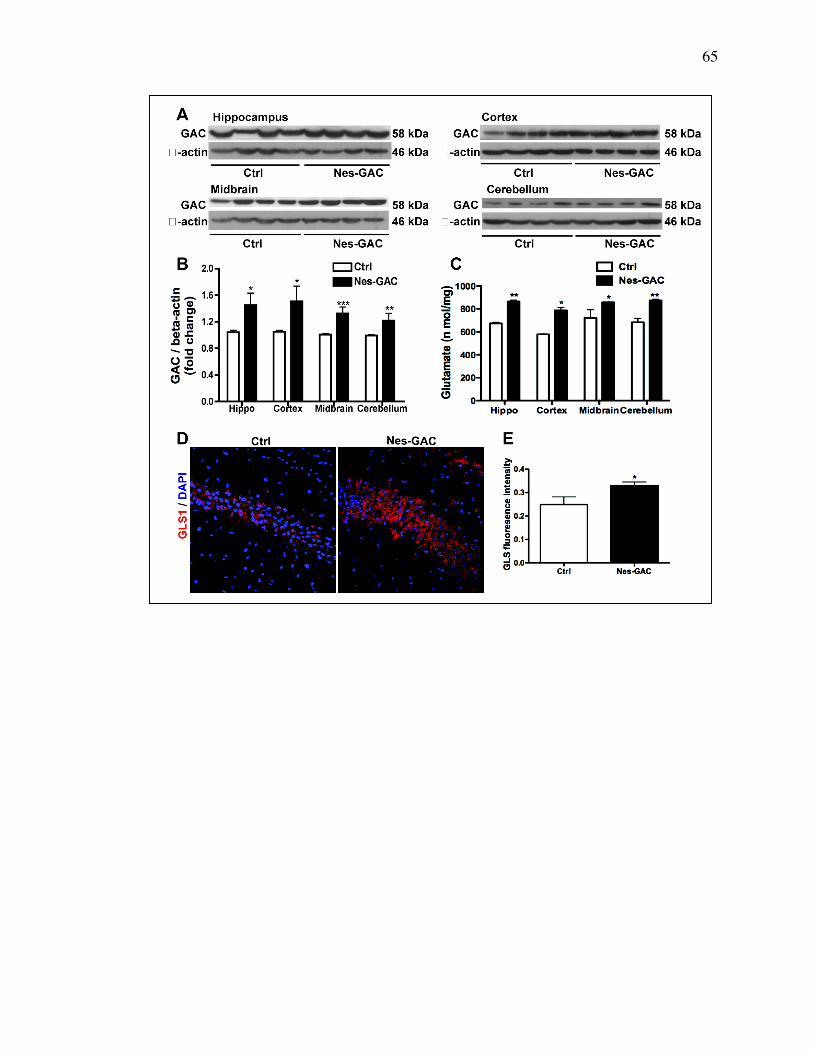
65
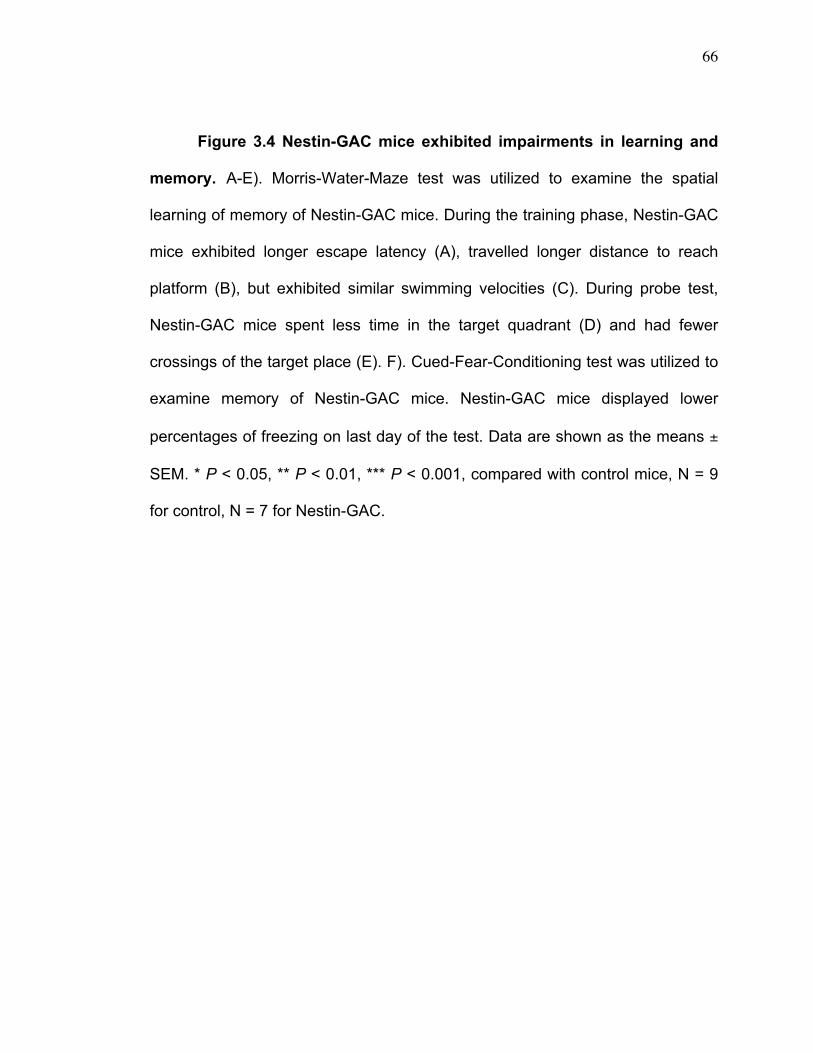
66
Figure 3.4 Nestin-GAC mice exhibited impairments in learning and
memory. A-E). Morris-Water-Maze test was utilized to examine the spatial
learning of memory of Nestin-GAC mice. During the training phase, Nestin-GAC
mice exhibited longer escape latency (A), travelled longer distance to reach
platform (B), but exhibited similar swimming velocities (C). During probe test,
Nestin-GAC mice spent less time in the target quadrant (D) and had fewer
crossings of the target place (E). F). Cued-Fear-Conditioning test was utilized to
examine memory of Nestin-GAC mice. Nestin-GAC mice displayed lower
percentages of freezing on last day of the test. Data are shown as the means ±
SEM. * P < 0.05, ** P < 0.01, *** P < 0.001, compared with control mice, N = 9
for control, N = 7 for Nestin-GAC.
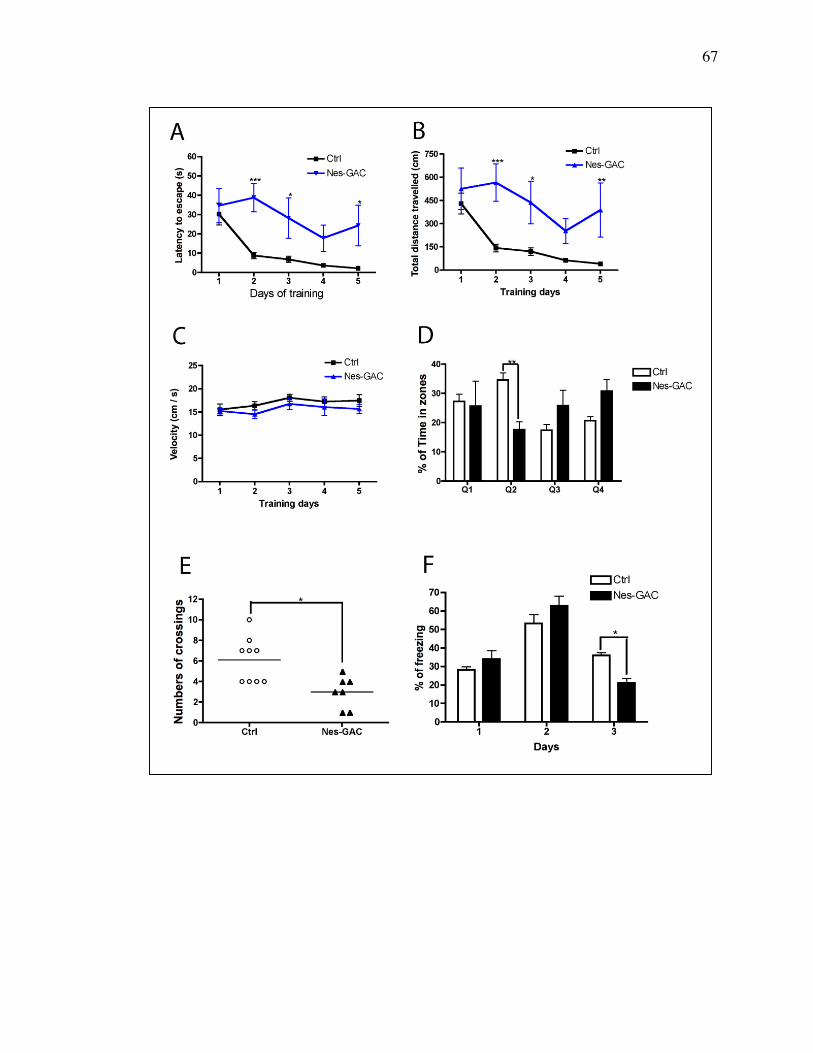
67

68
Figure 3.5 Brain-specific GAC overexpression led to synaptic
damage in mice. A-D). Expression levels of synaptic marker Synaptophysin
(Synap) were determined by Western blot. Nestin-GAC mice exhibited
decreased protein levels of Synap in hippocampus (A, B) and in cortex (C, D).
E-F). Expression levels of Synaptophysin in hippocampus were visualized and
analyzed by immunofluorescence. Representative pictures are shown (E) and
the fluorescence intensities of Synaptophysin were quantified (F). Data are
shown as means ± SEM of 3 brain slices in each of the 4 control or Nestin-GAC
mice. * P < 0.05, ** P < 0.01, *** P < 0.001, compared with control mice, N = 4
for both Nestin-GAC and control mice.
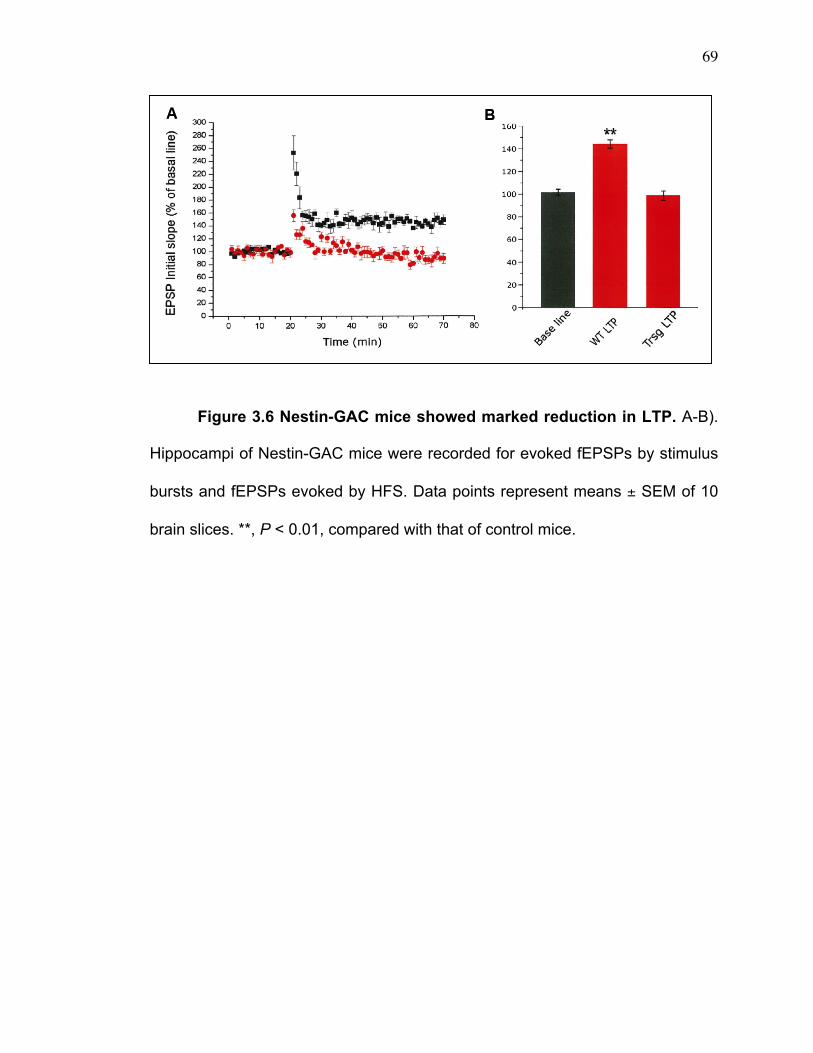
69
Figure 3.6 Nestin-GAC mice showed marked reduction in LTP. A-B).
Hippocampi of Nestin-GAC mice were recorded for evoked fEPSPs by stimulus
bursts and fEPSPs evoked by HFS. Data points represent means ± SEM of 10
brain slices. **, P < 0.01, compared with that of control mice.
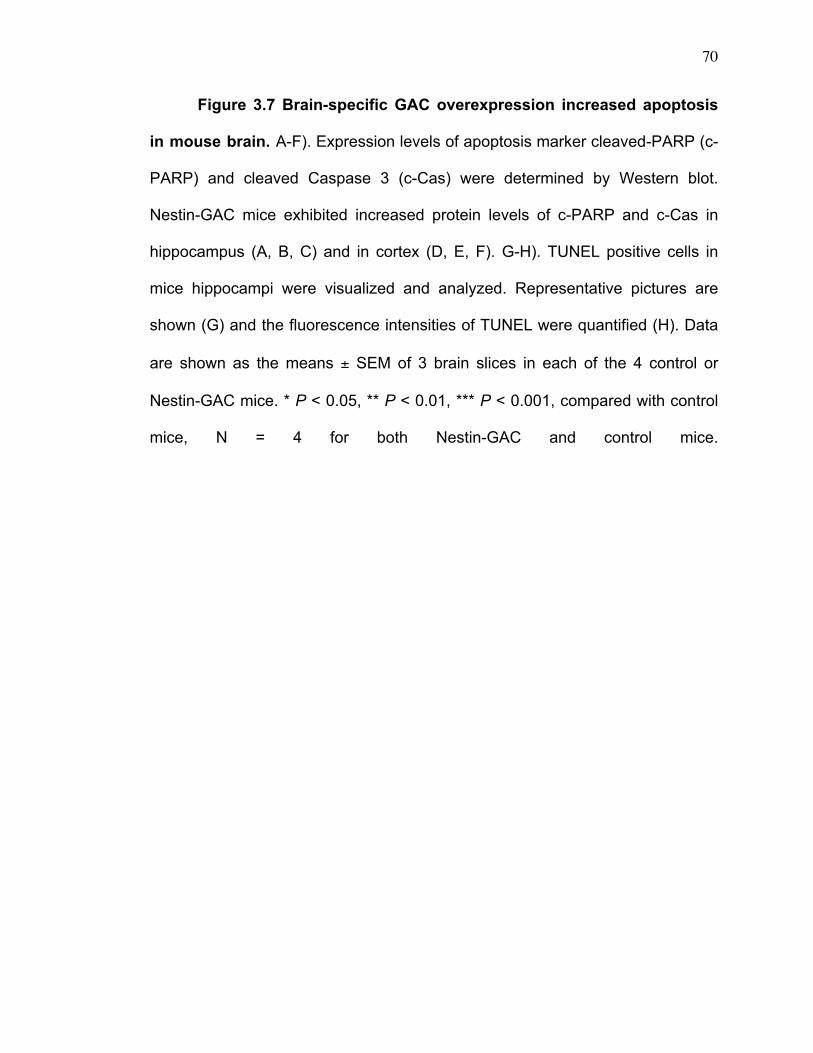
70
Figure 3.7 Brain-specific GAC overexpression increased apoptosis
in mouse brain. A-F). Expression levels of apoptosis marker cleaved-PARP (c-
PARP) and cleaved Caspase 3 (c-Cas) were determined by Western blot.
Nestin-GAC mice exhibited increased protein levels of c-PARP and c-Cas in
hippocampus (A, B, C) and in cortex (D, E, F). G-H). TUNEL positive cells in
mice hippocampi were visualized and analyzed. Representative pictures are
shown (G) and the fluorescence intensities of TUNEL were quantified (H). Data
are shown as the means ± SEM of 3 brain slices in each of the 4 control or
Nestin-GAC mice. * P < 0.05, ** P < 0.01, *** P < 0.001, compared with control
mice, N = 4 for both Nestin-GAC and control mice.
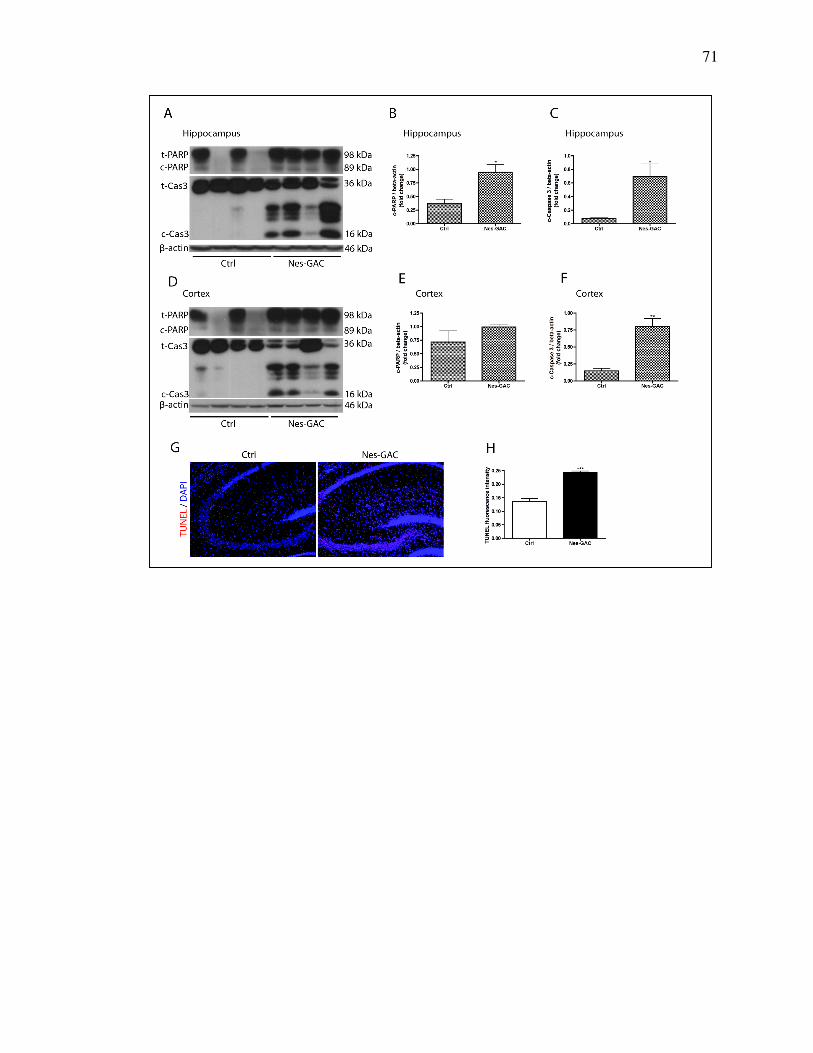
71
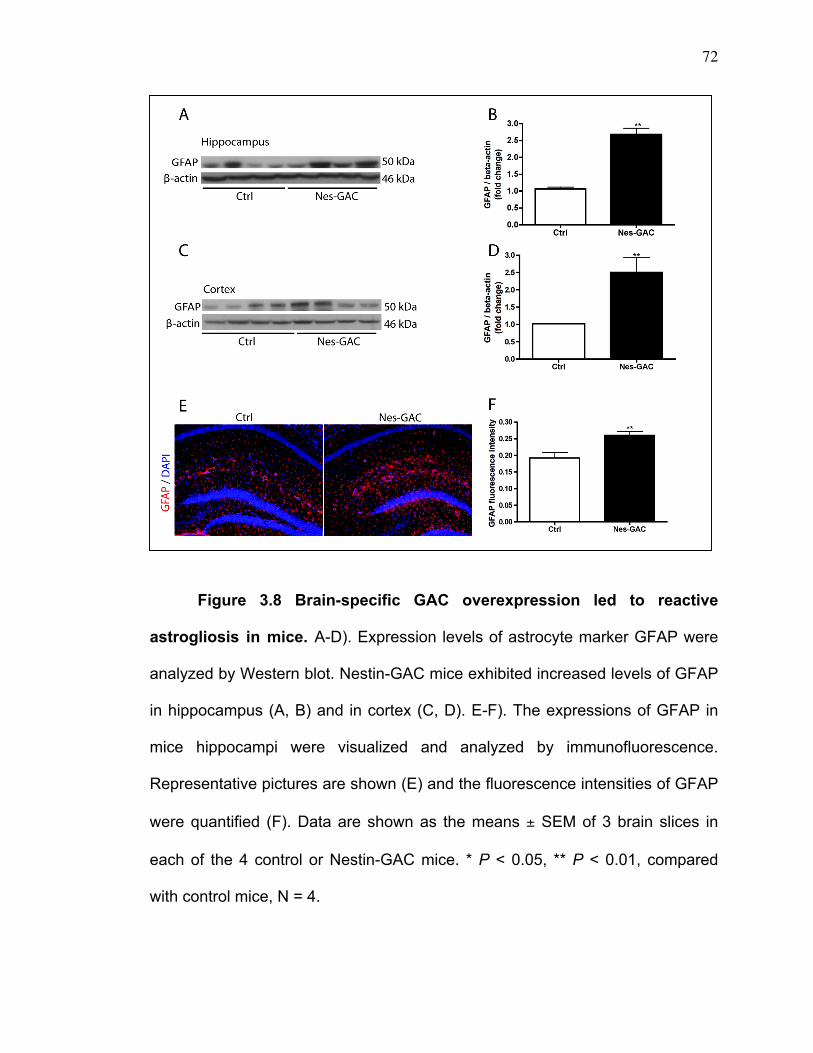
72
Figure 3.8 Brain-specific GAC overexpression led to reactive
astrogliosis in mice. A-D). Expression levels of astrocyte marker GFAP were
analyzed by Western blot. Nestin-GAC mice exhibited increased levels of GFAP
in hippocampus (A, B) and in cortex (C, D). E-F). The expressions of GFAP in
mice hippocampi were visualized and analyzed by immunofluorescence.
Representative pictures are shown (E) and the fluorescence intensities of GFAP
were quantified (F). Data are shown as the means ± SEM of 3 brain slices in
each of the 4 control or Nestin-GAC mice. * P < 0.05, ** P < 0.01, compared
with control mice, N = 4.

73
Chapter 4
GLS1 is Essential for the Differentiation, Survival and Proliferation of
Human Neural Progenitor Cells
Portions of this chapter are excerpted from STEM CELLS AND
DEVELOPMENT, Nov. 15, 2014, pp. 2782-2790
74
4.1 Abstract
Glutaminase is the enzyme that converts glutamine into glutamate, which
serves as a key excitatory neurotransmitter and one of the energy providers for
cellular metabolism. Previous studies have revealed that dysregulation of
glutaminase 1 (GLS1), the dominant isoform in brain and kidney, has a causal
effect on brain inflammation, neurotoxicity, and cognitive impairment. Therefore,
we hypothesize that knocking down GLS1 will reduce toxicity and moderate the
pathogenic progress. Using a human neural progenitor cell (NPC) model, we
found that both GLS1 isotypes, kidney-type glutaminase (KGA) and glutaminase
C (GAC), were upregulated during neuronal differentiation, which were
correlated with the expression of neuronal marker microtubule-associated
protein 2 (MAP-2). To study the functional impact of GLS1, we used small
interference RNA targeting GLS1 and determined the expressions of neuronal
genes by Western blot, Real-time PCR and immunocytochemistry. However,
siRNA silencing of GLS1 significantly reduced the expression of MAP-2,
indicating that GLS1 is essential for neurogenesis. To unravel the specific
process(es) of neurogenesis being affected, we further studied the proliferation
and survival of NPCs in vitro. siRNA silencing of GLS1 significantly reduced the
Ki67+ and increased the TUNEL+ cells, suggesting a critical roles of GLS1 for
the proliferation and survival of NPCs. Together, these data suggest that GLS1
is critical for proper functions of NPC, including neuronal differentiation,
proliferation, and survival, thus complete knockdown of GLS1 in CNS to reduce
toxicity is not applicable.
75
4.2 Introduction
Neural stem/progenitor cells (NPCs) are multipotent self-renewal cells
with the capabilities of differentiation into neurons, astrocytes, and
oligodendrocytes [140]. Neurogenesis, the process by which new neurons are
generated, is a coordination of NPC self-renewal, survival, migration,
proliferation, cell fate commitment, neuronal differentiation, and finally the
integration of the newborn neurons into the existing networks [141, 142].
Neurogenesis is vigorous throughout embryonic brain but confined to specific
brain areas in adulthood [142-144]. Attenuated neurogenesis leads to brain
malformations, disruption of neural signal transduction and cognitive impairment
[145-147]. This suggests that neurogenesis is indispensable to brain
development, homeostasis and activity. Restricted neurogenesis in the adult
brain has posted a big challenge for the brain regeneration after injuries,
damage and diseases [148-153]. Therefore, extensive research is being
conducted to identify endogenous factor(s) involved in neurogenesis.
Glutaminase 1 (GLS1) is an enzyme that catalyzes the deamination of
glutamine to produce glutamate [154]. In the central nervous system (CNS),
glutaminase 1 (GLS1) is expressed at predominant levels, especially in neurons
[74] when compared with GLS2 [72]. In mouse, GLS1 begins to express at
embryonic day 11.5 (E11.5) revealed by in situ hybridization
(http://developingmouse.brain-map.org/gene/show/14436). The expression of
GLS1 gose higher during brain development and reaches the plateau before
birth (at E18.5). GLS1’s expression remains high in postnatal mouse brain.

76
Kidney-type glutaminase (KGA) and glutaminase C (GAC) are two splice
variants of GLS1 [76].
The product of glutaminase-modulated glutamine deamination is
glutamate, a classical and the most abundantly used excitatory
neurotransmitter. Glutamate has long been implicated in the generation and
maturation of neurons [155-158]. Particularly, in vitro study on NPC has
revealed the crucial role of glutamate in neuronal differentiation via the
mediation of AMPA receptors [157]. However, the in vivo effect of glutamate on
neurogenesis remains incompletely understood. Glutamate has been indicated
to be beneficial for neurogenesis [159, 160], but studies on different anatomical
areas in mammalian brain and using different experimental approaches yielded
discrepant results [155]: moderate dose of glutamate (50 µM) applied to mouse
brain slice cultures increased cellular proliferation in the ventricular zone but
decreased NPC proliferation in the subventricular zone [158]. However, high
dose of glutamate (300 µM) applied to brain slice culture decreased cellular
proliferation and survival in the ventricular zone [159].
Our previous data revealed a pathogenic role of overexpressed brain
GLS1 in brain inflammation, neurotoxicity and cognitive impairment. Thus we
hypothesize that by knocking down GLS1 in the brain cells we will be able to
reduce brain inflammation and reduce neurotoxicity. However in this study, we
report that GLS1 is an essential enzyme for the neuronal differentiation,
proliferation, and survival of human neural progenitor cells in vitro, thus
complete knockdown of GLS1 in the brain is not applicable.

77
4.3 Materials and methods
Culture of human NPC
Human fetal brain tissue (12-16 weeks post-conception) was obtained
from elective abortions done at the University of Washington in complete
compliance with National Institute of Health (NIH), University of Nebraska
Medical Center (UNMC) and University of Washington ethical guidelines.
Human cortical NPCs were isolated from human fetal brain tissue as previously
described [161]. Briefly, isolated NPCs were cultured in substrate-free tissue
culture flasks and grown to neurospheres in the neurosphere initiation medium
(NPIM), which is composed of X-Vivo 15 (BioWhittaker, Walkersville, ME) with
N2 supplement (Gibco BRL, Carlsbad, CA), neural cell survival factor-1 (NSF-1,
Bio Whittaker), basic fibroblast growth factor (bFGF, 20 ng/ml, Sigma-Aldrich,
St. Louis, MO), epidermal growth factor (EGF, 20 ng/ml, Sigma-Aldrich),
leukemia inhibitory factor (LIF, 10 ng/ml, EMD Millipore Corporation, Billerica,
MA), and 60 ng/ml N-acetylcysteine (Sigma-Aldrich). Cells were passaged every
two weeks as previously described [161].
Neuronal differentiation of NPC
Differentiation of NPCs to neurons was performed according to the
standard procotol as previously described [161]. Briefly, mechanically- and
trypsin-dissociated NPCs were plated on poly-D-lysine-coated 24-well plates in
NPIM for 24 hours. Cells were then changed to serum-free Neurobasal medium
(Gibco BRL) supplemented with B27 (NB27 medium, Gibco BRL) and glutamine
(Sigma-Aldrich). Cells were subsequently collected for RNA or protein analyses,

78
or fixed for immunocytochemistry after neuronal differentiation for specific days
as indicated in the figure legends.
siRNA silencing of GLS1
siRNA silencing of GLS1 in NPCs was performed according to the
standard protocol as previously described [162]. Briefly, siRNA targeting GLS1
(ID# s5840) was purchased from Applied Biosystems Inc. (Foster City, CA,
USA). Before plated-NPCs were changed into serum-free Neurobasal medium
for neuronal differentiation, cells were transfected by 100 nM siRNA duplexes
for 24 hours with the presence of siIMPORTER (Upstate Cell Signaling
Solutions, Charlottesville, VA) according to the manufacturer’s instructions. Non-
specific control siRNA from Applied Biosystems Inc. (ID# AM4635) was
transfected with the same concentration as controls to GLS1 siRNA.
Protein extraction and Western blot
Cells were rinsed twice with 1 X PBS and subsequently lysed by M-PER
Protein Extraction Buffer (Pierce, Rockford, IL) containing 1× protease inhibitor
cocktail (Roche). Protein concentrations were determined by the BCA Protein
Assay Kit (Pierce). Proteins (20-30 µg) from cell lysates were separated by
sodium dodecyl sulfate-polyacrylamide gel electrophoresis (SDS-PAGE). After
being electrophoreticly transferred to the polyvinyldifluoridene (PVDF)
membranes (Millipore and Bio-Rad), proteins were incubated with purified
primary antibodies for MAP-2 (mouse, cat#MAB3418, Millipore, 1:1000), KGA
(rabbit, Dr. N. Curthoys, Colorado State University, Fort Collins, CO, 1:1000),
GAC (rabbit, Dr. N. Curthoys, Colorado State University, 1:500), GAD67

79
(mouse, cat#MAB5406, Millipore, 1:500), PARP (rabbit, cat# 9542s, Cell
Signaling Technologies, Beverly, MA, 1:1000), or β-actin (Sigma-Aldrich)
overnight at 4 oC followed by a horseradish peroxidase-linked secondary anti-
rabbit or anti-mouse antibody (Cell Signaling Technologies, 1:10,000). Antigen-
antibody complexes were visualized by Pierce ECL Western Blotting Substrate
(Pierce). For data quantification, films were scanned with a CanonScan 9950F
scanner; the acquired images were then analyzed on a Macintosh computer
using the public domain NIH Image J program (at http://rsb.info.nih.gov/nih-
image/).
RNA extraction and TaqMan real-time quantitative RT-PCR
RNA was extracted with TRIzol Reagent (Invitrogen Corp, Carlsbad, CA,
USA) and RNeasy Kit according to the manufacturer’s protocol (Qiagen Inc.,
Valencia, CA, USA). Primers used for real-time reverse-transcription
polymerase chain reaction (real-time RT-PCR) were KGA (ID# 489954: forward
sequence 5-CGAAGATTTGCTTTGTCAGCTATGG-3, reverse sequence 5-
CTCTGCAGCAGCTACATGGA-3, probe sequence 5-
CAGCGGGACTATGATTC-3), GAC (ID# 528445: forward sequence 5-
TATGGAAAAAAGTGTCACCTGAGTCA-3, reverse sequence 5-
GCTTTTCTCTCCCAGACTTTCCATT-3, probe sequence 5’-
AATGAGGACATCTCTACAACTGTA-3), microtubule-associated protein 2
(MAP-2) (ID# hs00258900) and GAPDH (ID# 4310884E) were commercially
available at Applied Biosystems Inc. Real-time RT-PCR was completed using
the One-step quantitative TaqMan assay in a StepOneTM Real-Time PCR

80
system (Applied Biosystems Inc.). Relative MAP-2, KGA and GAC mRNA levels
were determined and standardized with a GAPDH internal control using the
comparative ∆∆CT method. All primers used in the study were previously tested
for amplification efficiencies and the results were confirmed similar.
Immunocytochemistry
Cells were fixed in 4% PFA and washed in PBS as previously described
[161]. Cells were subsequently incubated overnight at 4 oC with primary
antibodies, followed by goat anti-mouse IgG Alexa Fluor 488 secondary
antibodies (Molecular Probes, Eugene, OR, 1:1000) for 1 hour at room
temperature. Primary antibodies included mouse MAP-2 (Millipore, 1:500),
rabbit GFAP (Dako, Carpinteria CA, 1: 2000) and mouse anti-Ki67 (BD
Biosciences, San Diego, CA, 1:500). All of the antibodies were diluted in in PBS
containing 0.1% Triton X-100 and 2% BSA. Cells were counterstained with DAPI
(Sigma-Aldrich, 1:1000) to identify the nuclei. Morphological changes of cells
were visualized and captured with a Nikon Eclipse E800 microscope equipped
with a digital imaging system, or a Zeiss META 510 confocal microscope (Carl
Zeiss MicroImaging, LLC). Images were imported into Image-Pro Plus, version
7.0 (Media Cybernetics, Sliver Spring, MD) for quantification purpose. A total of
500-1000 immunostained cells from 10 random fields per well were manually
counted using magnifications of 20X objective lens.
Glutamate analyses
The glutamate levels in the cells were determined using the Amplex Red
Glutamic acid / Gutamate oxidase Assay Kit (invitrogen) based on the
81
manufacturer’s instruction. Cell lysates were diluted to the same protein
concentration before starting the assay.
In situ TUNNEL assay
Primary human NPCs were transfected by control siRNA or GLS1 siRNA.
Three days after transfection, cells were fixed and stained with an in situ TUNEL
assay (Roche Diagnostics, Indianapolis, IN). TUNEL positive NPCs and total
cell numbers were counted after acquiring 10 random images from
immunostained fields using a Nikon Eclipse TE2000E microscope. A minimum
of 10 fields was counted for each group of treatment.
Statistical analyses
Data were shown as means ± SEM and analyzed. The data were
evaluated statistically by the analysis of variance (ANOVA) followed by Tukey-
test for pairewise comparisons. Two-tailed Student’s t test was used to compare
means of two treatment groups. Significance was considered when P < 0.05. All
experiments were performed with at least three donors to account for any
individual-specific differences. Assays were performed at least three times in
triplicate or quadruplicate.
82
4.4 Results
GLS1 variants KGA and GAC are upregulated after neuronal
differentiation
Human NPC were differentiated to neurons in adherent cultures for 2
weeks. Total protein and RNA were extracted at multiple time points, including
day 0, 4, 7 and 13 after differentiation. The mRNA levels of the neuronal marker
MAP-2 continued to increase throughout this period of time (Figure 4.1A),
suggesting successful and continuous neuronal differentiation of the cultured
cells. Interestingly, the mRNA levels of both KGA and GAC were upregulated
during neuronal differentiation (Figure 4.1B-C). The mRNA levels of KGA were
positively correlated with the MAP-2 levels (Figure 4.1D). Similarly, there were
significant correlation between the mRNA levels of GAC and MAP-2 (Figure
4.1E).
In parallel to mRNA levels, the protein levels of MAP-2 continuously
increased throughout the period of neuronal differentiation, confirming
successful ongoing neuronal differentiation of the cultured cells (Figure 4.2A-B).
Likewise, both KGA and GAC were upregulated during neuronal differentiation
(Figure 4.2A, C-D). KGA protein had 3-fold and 4.5-fold upregulation at 7 days
and 13 days after differentiation, respectively (Figure 4.2C). Similarly, GAC
protein had 2-fold and 3.5-fold upregulation at 4 days and 7 days after
differentiation, respectively (Figure 4.2D). The protein levels of KGA were
positively correlated with the MAP-2 levels (Figure 4.2E). Similarly, there were
significant positive correlation between the protein levels of GAC and MAP-2
83
(Figure 4.2F). Together, the upregulation of KGA and GAC and their correlation
with MAP-2 during neuronal differentiation suggests that KGA and GAC may be
required for NPC to differentiate into neurons.
siRNA silencing of GLS1 impairs neuronal differentiation
To test whether KGA and GAC were required for neuronal differentiation,
we used siRNA to specifically silence GLS1 expression in NPC. The GLS1
siRNA-transfected NPCs were induced to differentiate in neuronal media for 6
days. The knockdown of GLS1 was confirmed firstly through Real-time PCR,
which demonstrated significant decreases of the mRNA levels of both KGA
(Figure 4.3A) and GAC (Figure 4.3B) compared with the control siRNA group.
The knockdown was further confirmed by Western blot as the protein levels of
both KGA (Figure 4.4A-B) and GAC (Figure 4.4A, C) were significantly
decreased in siGLS1 group. In addition, the glutamate levels were also found
reduced in siGLS1 groups (Figure 4.4D). After siRNA knockdown of GLS1,
MAP-2 mRNA and protein levels were reduced to greater than 50% of that in
control siRNA-transfected cells (Figure 4.3C, Figure 4.4E). The reduction of the
mature neuronal marker MAP-2 in GLS1-deficient cells indicates that GLS1 is
required for neuronal differentiation.
To further characterize the morphological changes of neurons transfected
by GLS1 siRNA, we labeled MAP-2 in the differentiated cultures through
immunocytochemistry (Figure 4.5A). Human NPCs transfected with random
control siRNA had approximately 70% of the cells positive for MAP-2 (Figure
4.5B) at 6 days after differentiation. However, NPCs transfected with siRNA
84
targeting GLS1 had significantly lower percentage (40%) of cells positive for
MAP-2 (Figure 4.5B). The impairment was specific to neuronal differentiation
because the astrocytes differentiation, as determined by GFAP immunostaining,
did not appear to alter after GLS1 knockdown when compared with control
siRNA group (Figure 4.5C). These data suggest that GLS1 is required for the
formation of mature neurons.
siRNA silencing of GLS1 impairs NPC proliferation
NPC proliferation is also a key step of neurogenesis. To determine
whether deficiency of GLS1 affected NPC proliferation, we transfected NPCs
with siRNA targeting GLS1 and kept the culture in NPIM for 3 days. The
decreases of KGA and GAC mRNA levels by GLS1 siRNA transfection in NPCs
were confirmed by Real-time RT-PCR (Figure. 4.6A-B). Via
immunocytochemistry that labeled the Ki67+ cells, we were able to determine the
levels of NPC proliferation in the culture. The percentage of Ki67-positive cells
was significantly decreased when GLS1 was knocked down (Figure 4.6C-D).
This suggests a critical role of GLS1 in the NPC pool expansion.
siRNA silencing of GLS1 impairs NPC survival
Next, we determined NPC survival after GLS1 was knocked down by
siRNA. The levels of apoptosis were identified by Terminal deoxynucleotidyl
transferase dUTP nick end labeling (TUNEL) assay. DNA fragmentation was
detected by TUNEL through the labeling of the terminal end of nucleic acids. We
applied TUNEL assay to undifferentiated NPCs kept in NPIM. siGLS1
significantly increased the percentage of TUNEL positive cells in the human

85
NPC culture, compared with siRNA control group (Figure 4.7A-B). Therefore,
the TUNEL assay identified the existence of more cellular apoptosis when GLS1
was deficient. To further confirm the apoptosis, we examined poly ADP ribose
polymerase (PARP) cleavage in the NPCs that are GLS1-deficient. PARP is
deactivated and cleaved by activated caspase 3 (cleaved caspase 3) in the
apoptosis cascade, thus cleaved PARP represents ongoing apoptosis. Western
blot analysis revealed the presence of cleaved PARP in both control and GLS1
siRNA groups. However, Cleaved PARP was apparently at higher levels in
GSL1 siRNA group compared with control siRNA group (Figure 4.7C-D). These
data demonstrate the occurrence of cellular apoptosis after GLS1 was knocked
down.
86
4.5 Discussion
Neurogenesis is a finely tuned and highly orchestrated process that
includes maintaining and expansing the pool of neural stem/progenitor cells
(NPC), migration of NPC, differentiation of NPC to neurons, neuronal survival
and integration of newly-born neurons to the existing synaptic networks [145].
As a result, hindered or impaired neurogenesis often causes malformations of
brain, disruptions of neural signal transduction, difficulties and deterioration of
cognitive functions, as reviewed by Jessel and Sanes [141] [145-147]. Given the
fundamental importance of neurogenesis to human health and diseases, factors
involved in this process remain to be further illustrated. In the present study of
this chapter, we show that GLS1 isoforms were upregulated and correlated with
MAP-2 during neuronal differentiation (Figures 4.1-4.2). siRNA silencing of
GLS1 in NPCs impaired their subsequent neuronal differentiation, suggesting
GLS1 is critical for neuronal differentiation (Figures 4.3-4.5). Furthermore, we
show reduced proliferation and increased apoptosis in GLS1-deficient cells,
suggesting that GLS1 is required for NPC proliferation and survival (Figures 4.6-
4.7). Collectively, we characterized GLS1 regulation in NPCs and identified
GLS1 as a one of the essential factors for neurogenesis. Therefore, globally
knocking down GLS1 is not applicable. The initial hypothesis that by knocking
down GLS1 in brain will we be able to reduce brain inflammation and
neurotoxicity relating to HAND needs even more detailed and comprehensive
examinations.

87
GLS1 is an important mitochondrial enzyme for cell metabolism. Its
expression increases during mammalian neural development and remains high
in postnatal CNS, implying an essential role of GLS1 for neurogenesis. We
report for the first time that deficiency of GLS1 leads to hindered NPC
differentiation, impaired proliferation and undermined survival. This finding cross
confirms the function of glutaminase on neurogenesis with the report that GLS2
contributes to neuronal differentiation [163]. Due to the fact that GLS1 is the
dominant glutaminase isoform expressed in mammalian CNS compared with
GLS2, tight-regulation of GLS1 is of critical importance to brain development.
The identification of GLS1’s involvement in neurogenesis has an
important clinical implication. GLS1, especially the GAC variant, has been
revealed to regulate oncogenic transformation [164-166] or the progressions of
excitotoxicity in HIV-1-associated neurocognitive disorders [84]. Therefore,
inhibiting GLS1 may serve for therapeutic purpose in cancer treatment or
neurodegenerative diseases. Indeed, inhibition of GLS1 by either a potent small-
molecule pharmacological inhibitor or by siRNA knockdown slowed the growth
of glioma cells [166], or prevented the oncogenic transformation of human
breast cancer cells and B lymphoma cells [165]. Lack of one copy of Gls1 has
blunted the tumorigenesis in an immune-competent mouse model of
hepatocellular carcinoma [167]. Also, knocking down GAC in HIV-infected
microglia or macrophages alleviated the damage to neurons co-cultured [84].
However, although knocking down GLS1 by siRNA apparently provides benefits
in cancer or neurodegerative diseases’ therapies, our studies with NPC suggest

88
that it may have unintended consequences on neurogenesis and brain
development as the properties and functions of NPCs were altered or impaired
when GLS1 was deficient. Therefore, directing the GLS1 inhibitors or siRNA to
the right area and specific cell type, and applying the inhibitors with right dose is
of critical importance and requires further investigation. Moreover, Gls1 KO mice
were lethal at postnatal day 1 due to glutamatergic synaptic transmission
disruptions [168], and Gls1+/- mice exhibited reduced hippocampal activity and
developed schizophrenia-like symptoms [169]. These studies on GLS1 knockout
(Gls1 KO) mice are in agreement with our evaluation of the critical role of GLS1
on neurogenesis, particularly on the formation of neuronal maturation and neural
connections.
Neuronal differentiation, NPC proliferation, and NPC survival, are three
components of neurogenesis examined in the study of this chapter. How GLS1
functions to affect each of those components is currently unclear. However,
there are some potential underlying pathways that GLS1 may take to assert its
influential role. First, the product of GLS1-mediated deamination of glutamine,
glutamate, is known to regulate neurogenesis. Interestingly, glutamate has been
shown to possess dichotomous effects on neurogenesis, depending on its
concentrations. Low-to-moderate concentrations of exogenous glutamate (10
µM) introduced to cell or brain slice culture led to increased NPC proliferation
and neurogenic potentials [156-158], whereas high concentrations of exogenous
glutamate (300 µM) introduction to culture resulted in impeded DNA synthesis
and reduced cellular proliferation [170]. Second, excess glutamate has a direct

89
toxic effect on mature neurons [171-174]. Excess glutamate produced by
immune-ativated macrophages and microglia has been documented in several
neurodegenerative diseases, including Parkinson’s disease, Alzheimer’s
disease, stroke, and HIV-associated neurocognitive dementia [84, 90]. Third,
glutamate can serve as an alternative energy substrate for the TCA cycle.
Therefore, GLS1 deficiency might have led NPC into a starvation-like state
under which the normal activities like cellular proliferation and differentiation are
weakened. In addition, cells lacking energy are known to switch to the apoptosis
signaling cascade. It is likely that more than one pathway cross talks and plays
out in the NPCs that are deficient of GLS1. More studies on glutamate signaling
pathways leading to the impairment of NPC functions are needed.
In summary, our study demonstrated that GLS1 is essential for
neurogenesis in vitro. These data suggest that globally knocking down GLS1 is
not application and great caution should be taken when targeting GLS1 in
cancer or neurogenerative disease therapy.

90
4.6 Figures
Figure 4.1 Transcript levels of GLS1 isoforms, KGA and GAC, were
upregulated during NPC differentiation to neurons. (A-C) Human NPCs
were exposed to neuron differentiation medium for differentiation. At 0, 4, 7, and
13 days after differentiation, mRNA was collected and expressions of MAP-2
(A), KGA (B), and GAC (C) were analyzed using Real-time RT-PCR. Data were
normalized to GAPDH and presented as fold change compared to NPC. Data
are shown as the means ± SEM of three independent experiments with three
different donors. (D-E) Correlation of the gene mRNA levels of KGA (D) and
GAC (E) with MAP-2 was determined by Spearman correlation. * denotes P <
0.05, *** denotes P < 0.001 compared with NPC, N = 3.

91
Figure 4.2 Protein levels of GLS1 isoforms, KGA and GAC, were
upregulated during NPC differentiation to neurons. (A-D) Human NPCs
were exposed to neuron differentiation medium for differentiation. At 0, 4, 7, and
13 days after differentiation, protein was extracted and expressions of MAP-2
(A-B), KGA (D), and GAC (D) were analyzed using Western blot. Data were
normalized to beta-actin and presented as fold change compared to NPC. Data
are shown as the means ± SEM of three independent experiments with three
different donors. (E-F) Correlation of the protein levels of KGA (E) and GAC (F)
with MAP-2 was determined by Spearman correlation. * denotes P < 0.05, ***
denotes P < 0.001 compared with NPC, N = 3.
92
Figure 4.3 Lack of GLS1 impaired the expression of MAP-2 mRNA
during neuronal differentiation. (A-C) Human NPCs were transfected by
control siRNA or GLS1 siRNA and then exposed to neuron differentiation
medium for 4 days and 6 days. mRNA was collected and the expressions of
KGA at 4 days and 6 days (A), GAC at 4 days and 6 days (B), and MAP-2 at 4
days and 6 days (C) were analyzed using Real-time RT-PCR. Data were
normalized to GAPDH and presented as fold changes. Data are shown as the
means ± SEM of three different donors. * P < 0.05, ** P < 0.01, *** P < 0.001,
compared with control siRNA group, N = 3.

93

94
Figure 4.4 Lack of GLS1 impaired the expression of MAP-2 protein
during neuronal differentiation. (A-E) Human NPCs were transfected by
control siRNA or GLS1 siRNA and then exposed to neuron differentiation
medium for 4 days and 6 days. Total protein was collected and the expressions
of KGA at 4 days and 6 days (A-B), GAC at 4 days and 6 days (A, C), and MAP-
2 at 4 days and 6 days (A, D) were analyzed using Western blot. Data were
normalized to beta-actin and presented as fold changes. Intracellular glutamate
levels were tested using the Amplex Red Glutamic acid / Gutamate oxidase
Assay Kit (E). Data are shown as the means ± SEM of three different donors. *
P < 0.05, ** P < 0.01, *** P < 0.001, compared with control siRNA group, N = 3.
95
Figure 4.5 Lack of GLS1 impaired neuronal differentiation. Human
NPCs were transfected by control siRNA or GLS1 siRNA and then exposed to
neuron differentiation medium for 6 days. The cultured cells were fixed and
stained with MAP-2 to determine the levels of neuronal differentiation. (A)
Representative pictures of MAP-2+ (green) and GFAP+ (red) were shown. Nuclei
were labeled with DAPI (blue). (B-C) The percentages of MAP-2+ cells (B) and
GFAP+ cells (C) were determined by counting the number of MAP-2+ or GFAP+
cells over the number of DAPI+ cells in each microscopic field. Images were
acquired from a Zeiss META 510 confocal microscope. Magnifications: 20X
objective lens. Scale bar = 50 µm. Data are shown as means ± SEM of 10 fields
in each experimental group for the three donors. *** P < 0.001, compared with
control siRNA group, N = 3.
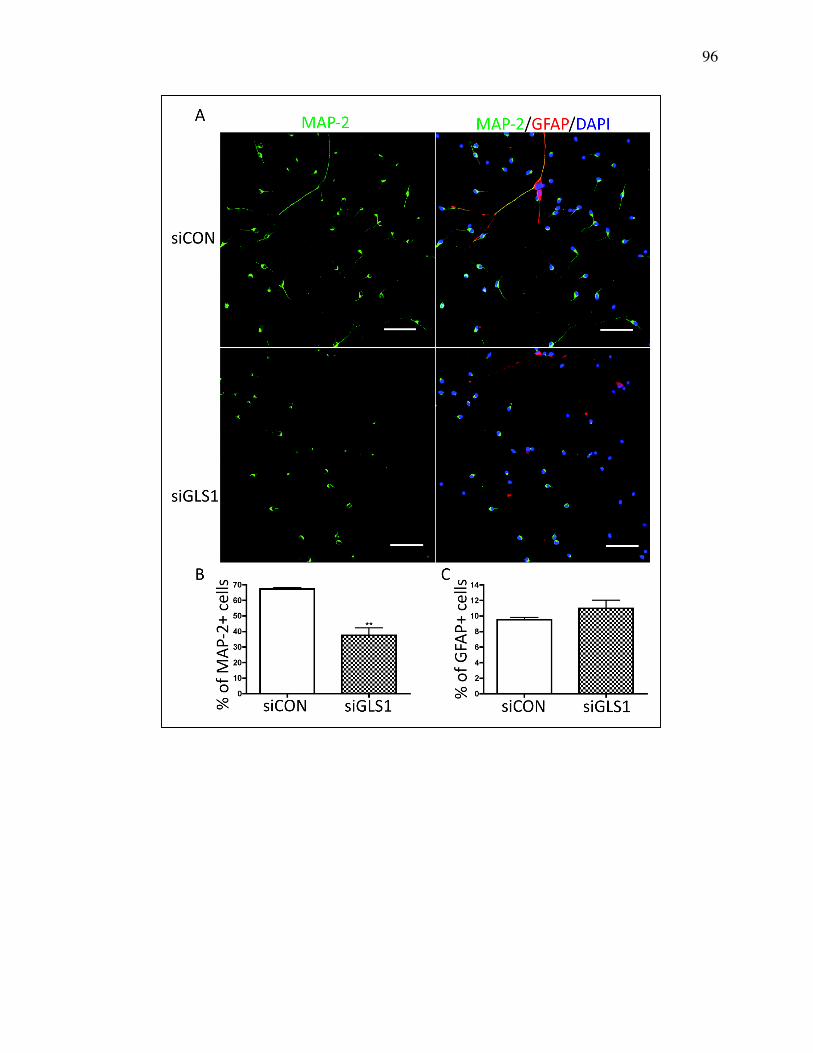
96
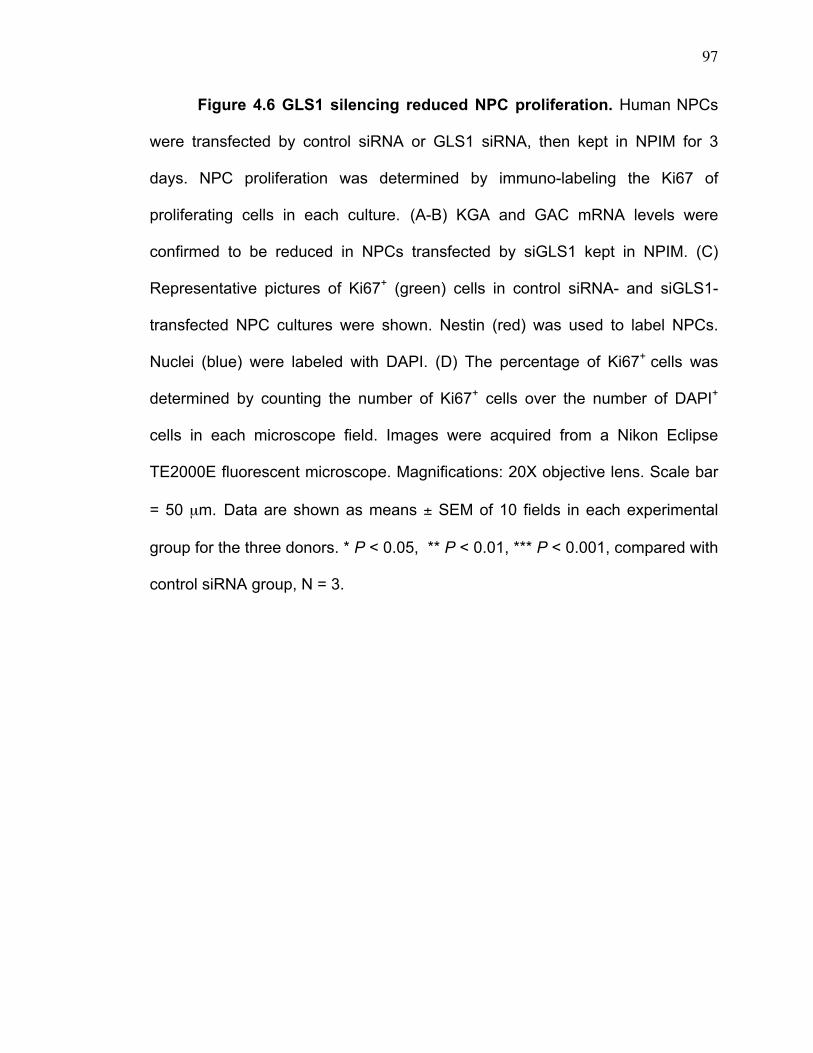
97
Figure 4.6 GLS1 silencing reduced NPC proliferation. Human NPCs
were transfected by control siRNA or GLS1 siRNA, then kept in NPIM for 3
days. NPC proliferation was determined by immuno-labeling the Ki67 of
proliferating cells in each culture. (A-B) KGA and GAC mRNA levels were
confirmed to be reduced in NPCs transfected by siGLS1 kept in NPIM. (C)
Representative pictures of Ki67+ (green) cells in control siRNA- and siGLS1-
transfected NPC cultures were shown. Nestin (red) was used to label NPCs.
Nuclei (blue) were labeled with DAPI. (D) The percentage of Ki67+ cells was
determined by counting the number of Ki67+ cells over the number of DAPI+
cells in each microscope field. Images were acquired from a Nikon Eclipse
TE2000E fluorescent microscope. Magnifications: 20X objective lens. Scale bar
= 50 µm. Data are shown as means ± SEM of 10 fields in each experimental
group for the three donors. * P < 0.05, ** P < 0.01, *** P < 0.001, compared with
control siRNA group, N = 3.
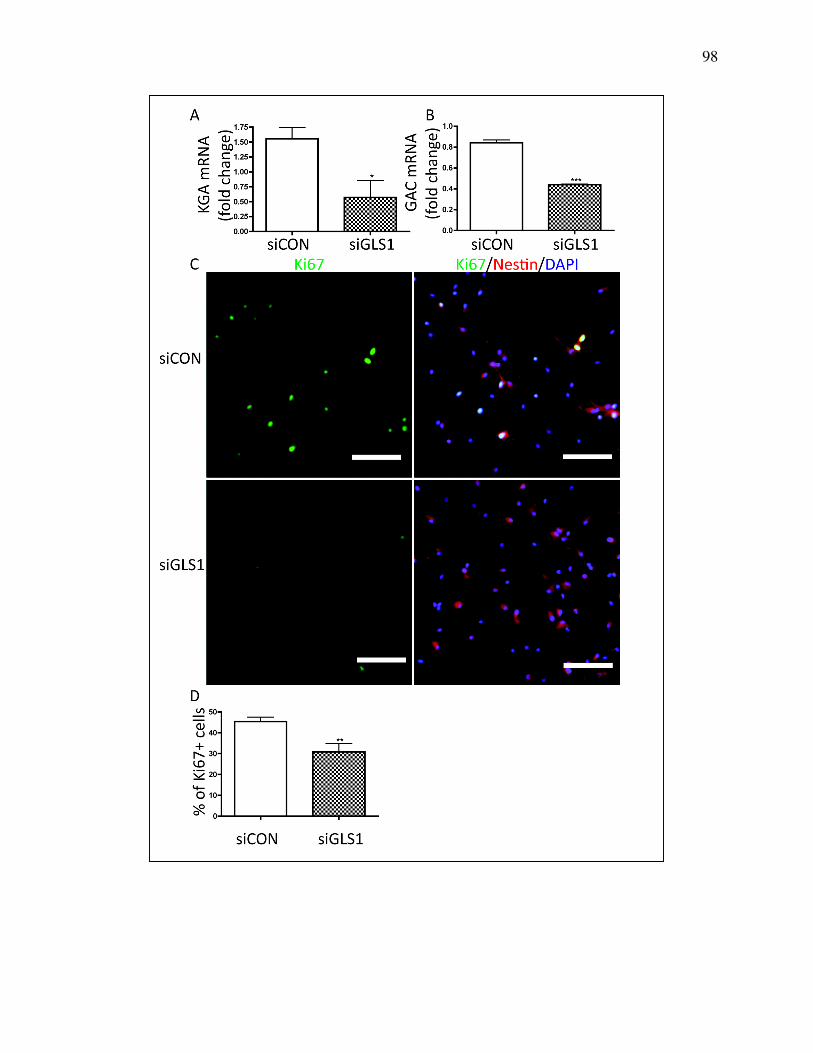
98

99
Figure 4.7 GLS1 silencing increased NPC apoptosis. Human NPCs
were transfected by control siRNA or GLS1 siRNA, then kept in growth media
for 3 days. NPC apoptosis was determined by TUNEL assay and PARP
cleavage. (A) Representative pictures of TUNEL+ (green) cells in control siRNA-
and siGLS1-transfected NPC cultures were shown. Nestin (red) was used to
label NPCs. Nuclei (blue) were labeled with DAPI. (B) The percentage of
TUNEL+ cells was determined by counting the number of TUNEL+ cells over the
number of DAPI+ cells in each microscope field. (C) Whole cell lysates were
collected and NPC apoptosis was analyzed by Western blot for PARP cleavage.
Beta-actin was used as loading control. (D) PARP cleavage levels were
normalized as a ratio of cleaved PARP to actin after densitometric quantification
of panel C and shown as fold change relative to control siRNA group. Images
were acquired from a Nikon Eclipse TE2000E fluorescent microscope.
Magnifications: 20X objective lens. Scale bar = 50 µm. Data are shown as
means ± SEM of 10 fields in each experimental group for the three donors. * P <
0.05, compared with control siRNA group, N = 3.

100

101
Chapter 5
General Summary and Future Directions

102
5.1 Summary and General Discussion
Cognitive impairment in HAND is a consequence of synaptic network
damage in basal ganglia, cerebral cortex and hippocampus of HAND patients.
Chronic neuroinflammation is a hallmark of HAND and a constitutive component
of the pathogenesis of various neurodegenerative diseases including HAND.
HIV-infected and immune-activated microglia and macrophages instigate brain
inflammation and induce neuronal injury [27, 175, 176] through the production
and release of various soluble neurotoxic factors including glutamate [30, 32,
37, 40-52]. Excess glutamate has the potential to induce extensive neuronal
injury. Apart from microglial and macrophages, neurons play a critical role in the
progression of brain inflammation as well. Proinflammatory cytokines TNF-α and
IL-1β, which are typically elevated during neurodegenerative diseases, induced
neuronal loss via the production and release of excess glutamate from neurons
treated by the inflammatory cytokines [53]. Therefore, apart from the
macrophage- and microglial-neuronal interaction, the neuronal-neuronal
interaction has a major pathogenic role in the progressions of excitotoxicity and
neuroinflammation through excess glutamate.
Our central objective focuses on the in vivo investigations of the primary
glutamate-producing enzyme in CNS, GLS1, in the neuropathogenesis of
HAND. Our laboratory has documented the abberant upregulation of GLS1 as a
key pathogenic event in excess glutamate production and augmentation of brain
inflammation and neurotoxicity in macrophages, microglia, and inflammatory
neurons in vitro [50, 86, 90] [53]. This suggests that GLS1 may be a novel
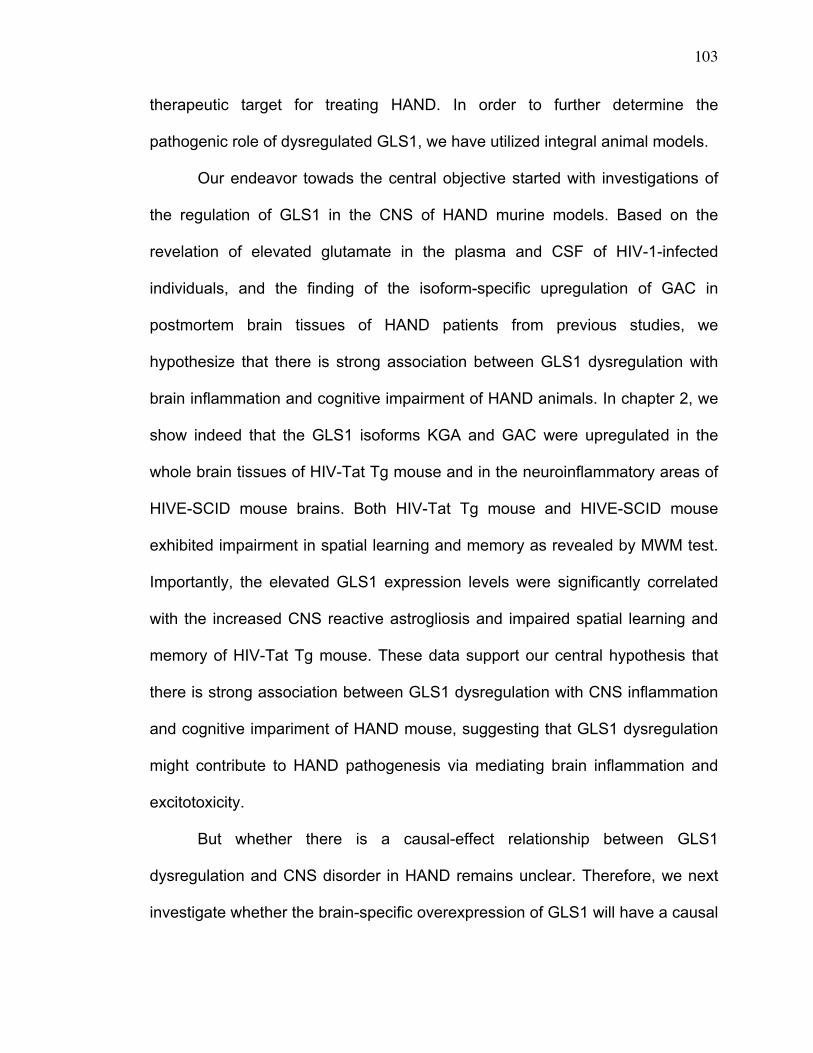
103
therapeutic target for treating HAND. In order to further determine the
pathogenic role of dysregulated GLS1, we have utilized integral animal models.
Our endeavor towads the central objective started with investigations of
the regulation of GLS1 in the CNS of HAND murine models. Based on the
revelation of elevated glutamate in the plasma and CSF of HIV-1-infected
individuals, and the finding of the isoform-specific upregulation of GAC in
postmortem brain tissues of HAND patients from previous studies, we
hypothesize that there is strong association between GLS1 dysregulation with
brain inflammation and cognitive impairment of HAND animals. In chapter 2, we
show indeed that the GLS1 isoforms KGA and GAC were upregulated in the
whole brain tissues of HIV-Tat Tg mouse and in the neuroinflammatory areas of
HIVE-SCID mouse brains. Both HIV-Tat Tg mouse and HIVE-SCID mouse
exhibited impairment in spatial learning and memory as revealed by MWM test.
Importantly, the elevated GLS1 expression levels were significantly correlated
with the increased CNS reactive astrogliosis and impaired spatial learning and
memory of HIV-Tat Tg mouse. These data support our central hypothesis that
there is strong association between GLS1 dysregulation with CNS inflammation
and cognitive impariment of HAND mouse, suggesting that GLS1 dysregulation
might contribute to HAND pathogenesis via mediating brain inflammation and
excitotoxicity.
But whether there is a causal-effect relationship between GLS1
dysregulation and CNS disorder in HAND remains unclear. Therefore, we next
investigate whether the brain-specific overexpression of GLS1 will have a causal

104
effect on neurotoxicity and synaptic damage leading to cognitive deteriorations
in relevance to HAND pathogenesis. In chapter 3, we have generated the
Nestin-GAC mouse which has the overexpression of GAC specific to brain. By
characterizing the pathology and behaviors of Nestin-GAC mouse, we report
that the brain-specific overexpression of GAC leads to hippocampal and cortical
synaptic network damage, increased apoptosis and reactive astrogliosis in the
hippocampi and cortices of mice. Importantly, we have found impairment of LTP
in Nestin-GAC mice, further demonstrating the synaptic damage in hippocampi
of these animals. Together, these results indicate for the first time that the
overexpressed GAC in brain has a causal-effect relationship with prolonged
brain inflammation and increased apoptosis, leading to neural network damage
and finally resulting in the impairment of cognitive functions of animals. Many of
these pathological changes including reactive astrogliosis, neuronal injury, and
cognitive impairment of learning and memory are in parallel to those seen in
HIV-Tat Tg mouse.
There are two major issues of the CNS pathological profiles of Nestin-
GAC mouse remainning to be addressed. First, the regulation of glutamate
receptors in Nestin-GAC mouse brains is an interesting and important question
to be answered. Excitotoxicity is a commonplace in various neurodegenerative
diseases including HAND. Overactivation of NMDA receptors is a major
component of excitotoxicity. High-affinity NMDA receptor antagonist MK801 has
blocked the toxicity from neurons treated by inflammatory cytokines TNF-α and
IL-1β [53]. And more importantly, a low-to-moderate-affinity NMDA receptor
105
antagonist memantine has substantially abrogated neurotoxicity and largely
mitigated the impairment of synaptic transmission and LTP [111]. Determining
whether or not the neurotoxicity observed in Nestin-GAC mouse brains is via the
overactivation of NMDA receptors will greatly facilitate our endeavor to further
validate the resemblance of Nestin-GAC mouse as a novel HAND murine
model.
Apart from the alterations of glutamate receptors, to study whether there
are dysregulations or dysfunctions of glutamate transporters in Nestin-GAC
mouse is of equal importance. Glutamate transporters are crucial for glutamate
uptake and regulating glutamate homeostasis [135]. Therefore, they are
important for buffering against excess glutamate-mediated excitotoxicity in the
brain. Previous studies have revealed that deregulation or loss of function of
glutamate transporters EAAT1 and EAAT2 on astrocytes are involved in neural
inflammation and neurotoxicity [91, 136, 137]. EAAT2 expression levels were
largely reduced on inflammatory cytokines-treated astrocytes via the
upregulation of EAAT2 repressors by astrocyte-elevated gene 1 (AEG-1) [91].
Importantly, by enhancing EAAT1 activity the investigators are able to diminish
neural damage and recover cognitive impairment [138, 139]. Therefore, we
speculate that there can be dysregulations or loss-of-function of certain
important glutamate transporters in Nestin-GAC mouse brain and the
dysfunction of glutamate transporters exaggerate neuroinflammation and
neuronal injury.
106
At current stage, we have determined the aberrant upregulation of GLS1
isoforms KGA and GAC in the whole brain tissues of HIV-Tat Tg mice, and we
have found causality between GLS1 dysreulgation and neurotoxicity. One
important question to be answered next is to document the expression profiles
of KGA and GAC in different areas of HIV-Tat Tg mice brains. Unlike HIVE-
SCID mice which have the HIV-1-infected MDM injected into the basil ganglia
thus displaying most of the neuroinflammatory and neurotoxic responses there,
HIV-Tat Tg mice carry the expression of Tat almost globally in CNS [96, 97].
Therefore, the spatial profile of GLS1 dysregulation in HIV-Tat Tg mouse CNS is
expected to be discrepant from that in HIVE-SCID mouse CNS. Our previous
data revealed that the majority of GLS1 aberrant upregulation in HIVE-SCID
mouse CNS was found in neurons of the inflammatory area [53]. Studies on the
brain areas that display most extensive and severe neural injury revealed that
the neuronal damage is largely localized in the cerebellum and cortex of HIV-Tat
Tg mouse [101]. Besides, relatively subtle neural damages including reductions
in spine density and malformations of dendrites of neurons were found in the
whole brain of HIV-Tat Tg mouse [106]. In consideration of developing GLS1
inhibitors for therapeutic purpose, it is important to locate the specific cell type
and possibly the specific brain area that has the majority of GLS1 dysregulation
in HIV-Tat Tg mouse.
Besides the spatial profile of GLS1 dysregulation, to know the temporal
regulation profile of GLS1 in HIV-Tat Tg mouse is equally important. This will
help to determine the sequence of inflammatory and neurotoxic events occuring

107
in HIV-Tat Tg mouse brain. It is interesting to dissect the effect of GLS1
dysregulation on brain excitotoxcity during different life stage. To achieve this, a
tamoxifen-controlled temporal Tg mouse model is of great help.
Taken together, these results so far demonstrate the pathogenic role of
the aberrantly-overexpressed brain GLS1 in vivo and suggest that dysregulated
GLS1 under pathological conditions can be a novel therapeutic target for
slowing or reversing HAND progressions and diminishing HAND-related
complications. Because of that, to develop glutaminase inhibitors that target
specific isoform of the enzyme and target specific cell types are one of the
promising approaches for next step. Likewise, genetic approaches aiming to
knock down the expression levels of glutaminase in specific types of cells have
also been proposed as a promising therapeutic approach. However, great
caution should be taken when targeting GLS1 in HAND therapy by genetical
methods as we have identified an essential role of GLS1 in NPC functions. In
chapter 4, we show that GLS1 isoforms were upregulated and correlated with
MAP-2 during neuronal differentiation. siRNA silencing of GLS1 in NPCs
impaired their subsequent neuronal differentiation. And we report reduced
proliferation and increased apoptosis in GLS1-deficient cells. These results
suggest that GLS1 is essential for the differentiation, proliferation and survival of
NPC. Therefore, knocking down GLS1 globally in the brain is not applicable for
therapeutic purpose. We will need to develop conditional knockout (cKO) mouse
model with the expression of GLS1 temporally controlled in specific cell types.

108
5.2 Future directions
First, a lack of GLS1 cKO murine model has hindered further
investigations of GLS1 functions in disease and in adult CNS due to early
lethality of GLS1 KO mouse on the first day after birth. To establish GLS1 as a
therapeutic target in HAND and further elucidate the underlying mechanisms,
we will generate GLS1 cKO mouse with tamoxifen-inducible temporal control
and GLS1 specifically deleted in macrophages and microglia by crossing the
GLS1-floxed mice with Csf1R-CreER mice. The resulting Csf1R-GLS1-/- mouse
will have GLS1 knocked out only in macrophages and microglia with the
temporal control of tamoxifen. To investigate whether the deletion of GLS1 in
macrophages and microglia can diminish or reverse the destructive effects of
HIV-Tat expression in mouse brain, we will cross the Csf1R-GLS1-/- mouse with
HIV-Tat Tg mouse. Behavioral assessment will be performed and subsequent
pathological and electrophysiological characterizations will be done.
Second, we will evaluate the neuroprotective effect of GLS1 inhibitors in
the HIV-Tat Tg mouse and GLS1-overexpression Tg mouse. Immediately after
the induction of Tat or the GLS1 overexpression, GLS1 inhibitors will be
continuously administered via intraperitoneal injection daily. Behavioral
evaluations will be performed. Subsequently, brain tissues of HIV-Tat Tg mice or
GLS1-overexpression Tg mice will be collected for pathological or physiological
characterizations.
Third, we will carry out the genomic and proteomic analyses of
regulations on glutamate transporters and the subunits of glutamate receptors in

109
our GLS1-overexpression Tg mouse and compare with that in HIV-Tat Tg
mouse. Although NMDA receptors are known to be the major player in
excitotoxicity and the resultant neurological disorders, alterations in glutamate
transporters and other glutamate receptors also clearly have a role in it [91, 136,
137] [138, 139]. This will be of great help to expand the regulation profiles of key
molecules involved in HAND progressions and identify new potential therapeutic
targets apart from GLS1 itself and NMDA receptors. And next to that, the effort
will be put on the evaluations of the neuroprotective potential by normalizing
these newly-defined dysregulated molecuels.

110
5.3 Figures
Figure 5.1 Summary of the pathogenic role of GLS1 dysregulation in
HAND. GLS1 isoforms KGA and GAC were upregulated in the whole brain
tissues of HIV-Tat Tg mouse. HIV-Tat Tg mouse exhibited impairment in spatial
learning and memory as revealed by MWM test. Importantly, the elevated GLS1
expression levels were significantly correlated with the increased CNS reactive
astrogliosis and impaired spatial learning and memory of HIV-Tat Tg mouse.
Brain-specific overexpression of GAC leads to hippocampal and cortical
synaptic network damage, increased apoptosis and reactive astrogliosis in the
hippocampi and cortices of mice. We have found impairment of LTP in Nestin-
GAC mice, further demonstrating the synaptic damage in hippocampi of these
animals.

111
Acknowledgments
Sincerely, I would like to thank my advisor Dr. Jialin Zheng. Over the 5
years of PhD study, I have learned a lot from him. Without the generous support
and encouraging guidance from him, I can hardly imagine the completion of my
study or any possible achievement. He has helped me to cope numerous
obstacles and difficulties during these years. His enthusiam, generosity, and
perseverance have inspired me to not giving up and keep trying toward my goal.
Specially, I would like to thank the direct supervisor of my projects, Dr. Yunlong
Huang. Dr. Huang has provided me with terrific scientific guidance in every
project of my study and has spent a great deal of time teaching me important
technology or trouble shooting of problems. And I want to give thanks to Dr.
Anna Dunaevsky, Dr. Jyothi Arikkath, Dr. Huangui Xiong and Dr. Wallace
Thoreson for their valuable suggestions and continuous support to my carrer
development.
Special thanks go to our collaborators. Dr. Norman Curthoys, Dr. Kurt
Hauser and Dr. Yong Zhao have given us great suggestions and provided us
with critical research tools. Their expertise are of great value to me and other
members of our lab.
Many thanks go to current and former lab members of Zheng laboratory.
Special thanks to Yuju Li and Dr. Lixia Zhao for being the first teachers when I
started my lab work. They helped me from basic techniques, literature selection
to presentation and writing skills. Many thanks to Dr. Qiang Chen, Dr.
Yongxiang Wang, Dr. Hui Peng, Dr. Changhai Tian, Dr. Dongsheng Xu, Beiqing

112
Wu, Dr. Zenghan Tong, Runze Zhao, Miao He, Fang Liu, Dr. Dapeng Chen, Dr.
Bing Zhu and Dr. Kangmu Ma for giving me good suggestions. We have had a
lot of fun together and helped each other through these years.
I woule like to thank UNMC Advanced-Microscope Core, UNMC Mouse
Genome Engineering Core and UNMC Comparative Medicine for providing
fantastic technical support. And many thanks go to the Department of
Pharmacology and Experimental Neuroscience, the China Scholarship Council,
and the Asia Pacific Rim Development Program. Without their support, I would
not be able to pursue my goal and complete my PhD study in UNMC.
Finally, I would like to thank my family, particularly to my beloved
husband Xiaohuan Xia,. We were classmates in college and went to UNMC
together five years ago. Life will be much harder if without his love and support.
Also, I want to give thanks to my family in China, for their unconditional support
through all these years. I do wish they could come to join my graduation
ceremony.

113
Reference
1. Tan, I.L., et al., HIV-associated opportunistic infections of the CNS. Lancet
Neurol, 2012. 11(7): p. 605-17.
2. Antinori, A., et al., Updated research nosology for HIV-associated
neurocognitive disorders. Neurology, 2007. 69(18): p. 1789-99.
3. McArthur, J.C., B.J. Brew, and A. Nath, Neurological complications of HIV
infection. Lancet Neurol, 2005. 4(9): p. 543-55.
4. McArthur, J.C., et al., Human immunodeficiency virus-associated dementia: an
evolving disease. J Neurovirol, 2003. 9(2): p. 205-21.
5. McArthur, J.C., et al., Human immunodeficiency virus-associated neurocognitive
disorders: Mind the gap. Ann Neurol, 2010. 67(6): p. 699-714.
6. Letendre, S., et al., Neurologic complications of HIV disease and their treatment.
Top HIV Med, 2007. 15(2): p. 32-9.
7. Boisse, L., M.J. Gill, and C. Power, HIV infection of the central nervous system:
clinical features and neuropathogenesis. Neurol Clin, 2008. 26(3): p. 799-819, x.
8. Michaud, V., et al., The dual role of pharmacogenetics in HIV treatment:
mutations and polymorphisms regulating antiretroviral drug resistance and
disposition. Pharmacol Rev, 2012. 64(3): p. 803-33.
9. Roquebert, B., et al., Role of HIV-1 minority populations on resistance
mutational pattern evolution and susceptibility to protease inhibitors. AIDS,
2006. 20(2): p. 287-9.

114
10. Varatharajan, L. and S.A. Thomas, The transport of anti-HIV drugs across
blood-CNS interfaces: summary of current knowledge and recommendations for
further research. Antiviral Res, 2009. 82(2): p. A99-109.
11. Persidsky, Y. and L. Poluektova, Immune privilege and HIV-1 persistence in the
CNS. Immunol Rev, 2006. 213: p. 180-94.
12. Sharer, L.R., E.S. Cho, and L.G. Epstein, Multinucleated giant cells and HTLV-
III in AIDS encephalopathy. Hum Pathol, 1985. 16(8): p. 760.
13. Budka, H., Multinucleated giant cells in brain: a hallmark of the acquired
immune deficiency syndrome (AIDS). Acta Neuropathol, 1986. 69(3-4): p. 253-8.
14. Masliah, E., et al., Spectrum of human immunodeficiency virus-associated
neocortical damage. Ann Neurol, 1992. 32(3): p. 321-9.
15. Persidsky, Y., et al., An analysis of HIV-1-associated inflammatory products in
brain tissue of humans and SCID mice with HIV-1 encephalitis. J Neurovirol,
1997. 3(6): p. 401-16.
16. Zink, W.E., et al., Impaired spatial cognition and synaptic potentiation in a
murine model of human immunodeficiency virus type 1 encephalitis. J Neurosci,
2002. 22(6): p. 2096-105.
17. Ketzler, S., et al., Loss of neurons in the frontal cortex in AIDS brains. Acta
Neuropathol, 1990. 80(1): p. 92-4.
18. Masliah, E., et al., Selective neuronal vulnerability in HIV encephalitis. J
Neuropathol Exp Neurol, 1992. 51(6): p. 585-93.

115
19. Williams, K., X. Alvarez, and A.A. Lackner, Central nervous system
perivascular cells are immunoregulatory cells that connect the CNS with the
peripheral immune system. Glia, 2001. 36(2): p. 156-64.
20. Takahashi, K., et al., Localization of HIV-1 in human brain using polymerase
chain reaction/in situ hybridization and immunocytochemistry. Ann Neurol,
1996. 39(6): p. 705-11.
21. Thompson, K.A., et al., Astrocyte specific viral strains in HIV dementia. Ann
Neurol, 2004. 56(6): p. 873-7.
22. Ma, M., J.D. Geiger, and A. Nath, Characterization of a novel binding site for
the human immunodeficiency virus type 1 envelope protein gp120 on human fetal
astrocytes. J Virol, 1994. 68(10): p. 6824-8.
23. Di Rienzo, A.M., et al., Virological and molecular parameters of HIV-1 infection
of human embryonic astrocytes. Arch Virol, 1998. 143(8): p. 1599-615.
24. Tornatore, C., et al., HIV-1 infection of subcortical astrocytes in the pediatric
central nervous system. Neurology, 1994. 44(3 Pt 1): p. 481-7.
25. Conant, K., et al., In vivo and in vitro infection of the astrocyte by HIV-1. Adv
Neuroimmunol, 1994. 4(3): p. 287-9.
26. Koenig, S., et al., Detection of AIDS virus in macrophages in brain tissue from
AIDS patients with encephalopathy. Science, 1986. 233(4768): p. 1089-93.
27. Gendelman, H.E., et al., The neuropathogenesis of the AIDS dementia complex.
AIDS, 1997. 11 Suppl A: p. S35-45.
28. Nath, A. and J. Geiger, Neurobiological aspects of human immunodeficiency
virus infection: neurotoxic mechanisms. Prog Neurobiol, 1998. 54(1): p. 19-33.

116
29. Zheng, J. and H.E. Gendelman, The HIV-1 associated dementia complex: a
metabolic encephalopathy fueled by viral replication in mononuclear
phagocytes. Curr Opin Neurol, 1997. 10(4): p. 319-25.
30. Li, W., et al., NMDA receptor activation by HIV-Tat protein is clade dependent.
J Neurosci, 2008. 28(47): p. 12190-8.
31. Conant, K., et al., Induction of monocyte chemoattractant protein-1 in HIV-1
Tat-stimulated astrocytes and elevation in AIDS dementia. Proc Natl Acad Sci U
S A, 1998. 95(6): p. 3117-21.
32. Giulian, D., et al., The envelope glycoprotein of human immunodeficiency virus
type 1 stimulates release of neurotoxins from monocytes. Proc Natl Acad Sci U S
A, 1993. 90(7): p. 2769-73.
33. Huang, Y., et al., The role of TNF related apoptosis-inducing ligand in
neurodegenerative diseases. Cell Mol Immunol, 2005. 2(2): p. 113-22.
34. Viviani, B., et al., Cytokines role in neurodegenerative events. Toxicol Lett,
2004. 149(1-3): p. 85-9.
35. Smith, J.A., et al., Role of pro-inflammatory cytokines released from microglia in
neurodegenerative diseases. Brain Res Bull, 2012. 87(1): p. 10-20.
36. Takikita, S., et al., Neuronal apoptosis mediated by IL-1 beta expression in viral
encephalitis caused by a neuroadapted strain of the mumps virus (Kilham Strain)
in hamsters. Exp Neurol, 2001. 172(1): p. 47-59.
37. Sui, Z., et al., Functional synergy between CD40 ligand and HIV-1 Tat
contributes to inflammation: implications in HIV type 1 dementia. J Immunol,
2007. 178(5): p. 3226-36.

117
38. Glass, J.D. and R.T. Johnson, Human immunodeficiency virus and the brain.
Annu Rev Neurosci, 1996. 19: p. 1-26.
39. Boutin, H., et al., Role of IL-1alpha and IL-1beta in ischemic brain damage. J
Neurosci, 2001. 21(15): p. 5528-34.
40. Eggert, D., et al., Development of a platelet-activating factor antagonist for HIV-
1 associated neurocognitive disorders. J Neuroimmunol, 2009. 213(1-2): p. 47-
59.
41. Perry, S.W., et al., Platelet-activating factor receptor activation. An initiator step
in HIV-1 neuropathogenesis. J Biol Chem, 1998. 273(28): p. 17660-4.
42. Tong, N., et al., Activation of glycogen synthase kinase 3 beta (GSK-3beta) by
platelet activating factor mediates migration and cell death in cerebellar granule
neurons. Eur J Neurosci, 2001. 13(10): p. 1913-22.
43. Nishida, K., et al., Increased brain levels of platelet-activating factor in a murine
acquired immune deficiency syndrome are NMDA receptor-mediated. J
Neurochem, 1996. 66(1): p. 433-5.
44. Matusevicius, D., et al., Multiple sclerosis: the proinflammatory cytokines
lymphotoxin-alpha and tumour necrosis factor-alpha are upregulated in
cerebrospinal fluid mononuclear cells. J Neuroimmunol, 1996. 66(1-2): p. 115-
23.
45. Navikas, V., et al., Increased interleukin-6 mRNA expression in blood and
cerebrospinal fluid mononuclear cells in multiple sclerosis. J Neuroimmunol,
1996. 64(1): p. 63-9.

118
46. Meda, L., et al., Proinflammatory profile of cytokine production by human
monocytes and murine microglia stimulated with beta-amyloid[25-35]. J
Neuroimmunol, 1999. 93(1-2): p. 45-52.
47. Genis, P., et al., Cytokines and arachidonic metabolites produced during human
immunodeficiency virus (HIV)-infected macrophage-astroglia interactions:
implications for the neuropathogenesis of HIV disease. J Exp Med, 1992. 176(6):
p. 1703-18.
48. Dawson, V.L. and T.M. Dawson, Nitric oxide in neurodegeneration. Prog Brain
Res, 1998. 118: p. 215-29.
49. Adamson, D.C., et al., Immunologic NO synthase: elevation in severe AIDS
dementia and induction by HIV-1 gp41. Science, 1996. 274(5294): p. 1917-21.
50. Zhao, J., et al., Mitochondrial glutaminase enhances extracellular glutamate
production in HIV-1-infected macrophages: linkage to HIV-1 associated
dementia. J Neurochem, 2004. 88(1): p. 169-80.
51. Giulian, D., K. Vaca, and C.A. Noonan, Secretion of neurotoxins by
mononuclear phagocytes infected with HIV-1. Science, 1990. 250(4987): p.
1593-6.
52. Kaul, M., G.A. Garden, and S.A. Lipton, Pathways to neuronal injury and
apoptosis in HIV-associated dementia. Nature, 2001. 410(6831): p. 988-94.
53. Ye, L., et al., IL-1beta and TNF-alpha induce neurotoxicity through glutamate
production: a potential role for neuronal glutaminase. J Neurochem, 2013.
125(6): p. 897-908.
119
54. Erecinska, M. and I.A. Silver, Metabolism and role of glutamate in mammalian
brain. Prog Neurobiol, 1990. 35(4): p. 245-96.
55. Komuro, H. and P. Rakic, Intracellular Ca2+ fluctuations modulate the rate of
neuronal migration. Neuron, 1996. 17(2): p. 275-85.
56. LoTurco, J.J., M.G. Blanton, and A.R. Kriegstein, Initial expression and
endogenous activation of NMDA channels in early neocortical development. J
Neurosci, 1991. 11(3): p. 792-9.
57. McEntee, W.J. and T.H. Crook, Glutamate: its role in learning, memory, and the
aging brain. Psychopharmacology (Berl), 1993. 111(4): p. 391-401.
58. Lipton, S.A., M. Yeh, and E.B. Dreyer, Update on current models of HIV-related
neuronal injury: platelet-activating factor, arachidonic acid and nitric oxide.
Adv Neuroimmunol, 1994. 4(3): p. 181-8.
59. Haughey, N.J. and M.P. Mattson, Calcium dysregulation and neuronal apoptosis
by the HIV-1 proteins Tat and gp120. J Acquir Immune Defic Syndr, 2002. 31
Suppl 2: p. S55-61.
60. Foga, I.O., et al., Antioxidants and dipyridamole inhibit HIV-1 gp120-induced
free radical-based oxidative damage to human monocytoid cells. J Acquir
Immune Defic Syndr Hum Retrovirol, 1997. 16(4): p. 223-9.
61. Haughey, N.J., et al., Perturbation of sphingolipid metabolism and ceramide
production in HIV-dementia. Ann Neurol, 2004. 55(2): p. 257-67.
62. Lipton, S.A., Memantine prevents HIV coat protein-induced neuronal injury in
vitro. Neurology, 1992. 42(7): p. 1403-5.

120
63. Muller, W.E., et al., gp120 of HIV-1 induces apoptosis in rat cortical cell
cultures: prevention by memantine. Eur J Pharmacol, 1992. 226(3): p. 209-14.
64. Nath, A., et al., Synergistic neurotoxicity by human immunodeficiency virus
proteins Tat and gp120: protection by memantine. Ann Neurol, 2000. 47(2): p.
186-94.
65. Rao, V.L., et al., Traumatic brain injury down-regulates glial glutamate
transporter (GLT-1 and GLAST) proteins in rat brain. J Neurochem, 1998.
70(5): p. 2020-7.
66. Benveniste, H., Glutamate, microdialysis, and cerebral ischemia: lost in
translation? Anesthesiology, 2009. 110(2): p. 422-5.
67. Xu, G.Y., et al., Concentrations of glutamate released following spinal cord
injury kill oligodendrocytes in the spinal cord. Exp Neurol, 2004. 187(2): p. 329-
36.
68. Kanellopoulos, G.K., et al., White matter injury in spinal cord ischemia:
protection by AMPA/kainate glutamate receptor antagonism. Stroke, 2000.
31(8): p. 1945-52.
69. Zoia, C.P., et al., Fibroblast glutamate transport in aging and in AD:
correlations with disease severity. Neurobiol Aging, 2005. 26(6): p. 825-32.
70. Killestein, J., N.F. Kalkers, and C.H. Polman, Glutamate inhibition in MS: the
neuroprotective properties of riluzole. J Neurol Sci, 2005. 233(1-2): p. 113-5.
71. Holcomb, T., et al., Isolation, characterization and expression of a human brain
mitochondrial glutaminase cDNA. Brain Res Mol Brain Res, 2000. 76(1): p. 56-
63.

121
72. Marquez, J., et al., Mammalian glutaminase isozymes in brain. Metab Brain Dis,
2013. 28(2): p. 133-7.
73. Erdmann, N.B., N.P. Whitney, and J. Zheng, Potentiation of Excitotoxicity in
HIV-1 Associated Dementia and the Significance of Glutaminase. Clin Neurosci
Res, 2006. 6(5): p. 315-328.
74. Mock, B., et al., A glutaminase (gis) gene maps to mouse chromosome 1, rat
chromosome 9, and human chromosome 2. Genomics, 1989. 5(2): p. 291-7.
75. Elgadi, K.M., et al., Cloning and analysis of unique human glutaminase isoforms
generated by tissue-specific alternative splicing. Physiol Genomics, 1999. 1(2):
p. 51-62.
76. Porter, L.D., et al., Complexity and species variation of the kidney-type
glutaminase gene. Physiol Genomics, 2002. 9(3): p. 157-66.
77. Chua, J.J., et al., The architecture of an excitatory synapse. J Cell Sci, 2010.
123(Pt 6): p. 819-23.
78. Boyken, J., et al., Molecular profiling of synaptic vesicle docking sites reveals
novel proteins but few differences between glutamatergic and GABAergic
synapses. Neuron, 2013. 78(2): p. 285-97.
79. Karakas, E., M.C. Regan, and H. Furukawa, Emerging structural insights into
the function of ionotropic glutamate receptors. Trends Biochem Sci, 2015. 40(6):
p. 328-337.
80. Golubeva, A.V., et al., Metabotropic Glutamate Receptors in Central Nervous
System Diseases. Curr Drug Targets, 2015.

122
81. Gegelashvili, G. and A. Schousboe, Cellular distribution and kinetic properties
of high-affinity glutamate transporters. Brain Res Bull, 1998. 45(3): p. 233-8.
82. Rose, C.F., A. Verkhratsky, and V. Parpura, Astrocyte glutamine synthetase:
pivotal in health and disease. Biochem Soc Trans, 2013. 41(6): p. 1518-24.
83. Chaudhry, F.A., et al., Glutamine uptake by neurons: interaction of protons with
system a transporters. J Neurosci, 2002. 22(1): p. 62-72.
84. Huang, Y., et al., Glutaminase dysregulation in HIV-1-infected human microglia
mediates neurotoxicity: relevant to HIV-1-associated neurocognitive disorders. J
Neurosci, 2011. 31(42): p. 15195-204.
85. Tian, C., et al., Mitochondrial glutaminase release contributes to glutamate-
mediated neurotoxicity during human immunodeficiency virus-1 infection. J
Neuroimmune Pharmacol, 2012. 7(3): p. 619-28.
86. Tian, C., et al., HIV-infected macrophages mediate neuronal apoptosis through
mitochondrial glutaminase. J Neurochem, 2008. 105(3): p. 994-1005.
87. Zhao, L., et al., Interferon-alpha regulates glutaminase 1 promoter through
STAT1 phosphorylation: relevance to HIV-1 associated neurocognitive
disorders. PLoS One, 2012. 7(3): p. e32995.
88. Zhao, L., Y. Huang, and J. Zheng, STAT1 regulates human glutaminase 1
promoter activity through multiple binding sites in HIV-1 infected macrophages.
PLoS One, 2013. 8(9): p. e76581.
89. Murry, C.E. and G. Keller, Differentiation of embryonic stem cells to clinically
relevant populations: lessons from embryonic development. Cell, 2008. 132(4):
p. 661-80.

123
90. Erdmann, N., et al., In vitro glutaminase regulation and mechanisms of
glutamate generation in HIV-1-infected macrophage. J Neurochem, 2009.
109(2): p. 551-61.
91. Vartak-Sharma, N., et al., Astrocyte elevated gene-1 is a novel modulator of
HIV-1-associated neuroinflammation via regulation of nuclear factor-kappaB
signaling and excitatory amino acid transporter-2 repression. J Biol Chem,
2014. 289(28): p. 19599-612.
92. Emdad, L., et al., Astrocyte elevated gene-1: recent insights into a novel gene
involved in tumor progression, metastasis and neurodegeneration. Pharmacol
Ther, 2007. 114(2): p. 155-70.
93. Aoyama, K. and T. Nakaki, Neuroprotective properties of the excitatory amino
acid carrier 1 (EAAC1). Amino Acids, 2013. 45(1): p. 133-42.
94. Jaeger, L.B. and A. Nath, Modeling HIV-associated neurocognitive disorders in
mice: new approaches in the changing face of HIV neuropathogenesis. Dis
Model Mech, 2012. 5(3): p. 313-22.
95. Johnson, T.P., et al., Induction of IL-17 and nonclassical T-cell activation by
HIV-Tat protein. Proc Natl Acad Sci U S A, 2013. 110(33): p. 13588-93.
96. Fitting, S., et al., Synaptic dysfunction in the hippocampus accompanies learning
and memory deficits in human immunodeficiency virus type-1 Tat transgenic
mice. Biol Psychiatry, 2013. 73(5): p. 443-53.
97. Bruce-Keller, A.J., et al., Morphine causes rapid increases in glial activation
and neuronal injury in the striatum of inducible HIV-1 Tat transgenic mice. Glia,
2008. 56(13): p. 1414-27.

124
98. Schneider, J., et al., Shedding and interspecies type sero-reactivity of the
envelope glycopolypeptide gp120 of the human immunodeficiency virus. J Gen
Virol, 1986. 67 ( Pt 11): p. 2533-8.
99. Garza, H.H., Jr., O. Prakash, and D.J. Carr, Aberrant regulation of cytokines in
HIV-1 TAT72-transgenic mice. J Immunol, 1996. 156(10): p. 3631-7.
100. Choi, J., et al., Molecular mechanism of decreased glutathione content in human
immunodeficiency virus type 1 Tat-transgenic mice. J Biol Chem, 2000. 275(5):
p. 3693-8.
101. Kim, B.O., et al., Neuropathologies in transgenic mice expressing human
immunodeficiency virus type 1 Tat protein under the regulation of the astrocyte-
specific glial fibrillary acidic protein promoter and doxycycline. Am J Pathol,
2003. 162(5): p. 1693-707.
102. Eggert, D., et al., Neuroprotective activities of CEP-1347 in models of
neuroAIDS. J Immunol, 2010. 184(2): p. 746-56.
103. Persidsky, Y., et al., Human immunodeficiency virus encephalitis in SCID mice.
Am J Pathol, 1996. 149(3): p. 1027-53.
104. Gendelman, H.E., et al., Efficient isolation and propagation of human
immunodeficiency virus on recombinant colony-stimulating factor 1-treated
monocytes. J Exp Med, 1988. 167(4): p. 1428-41.
105. Ferrarese, C., et al., Increased glutamate in CSF and plasma of patients with HIV
dementia. Neurology, 2001. 57(4): p. 671-5.

125
106. Fitting, S., et al., Interactive comorbidity between opioid drug abuse and HIV-1
Tat: chronic exposure augments spine loss and sublethal dendritic pathology in
striatal neurons. Am J Pathol, 2010. 177(3): p. 1397-410.
107. Kraft-Terry, S.D., et al., A coat of many colors: neuroimmune crosstalk in human
immunodeficiency virus infection. Neuron, 2009. 64(1): p. 133-45.
108. Jiang, Z.G., et al., Glutamate is a mediator of neurotoxicity in secretions of
activated HIV-1-infected macrophages. J Neuroimmunol, 2001. 117(1-2): p. 97-
107.
109. Lin, T., et al., A central nervous system specific mouse model for thanatophoric
dysplasia type II. Hum Mol Genet, 2003. 12(21): p. 2863-71.
110. Zhu, B., et al., CXCL12 enhances human neural progenitor cell survival through
a CXCR7- and CXCR4-mediated endocytotic signaling pathway. Stem Cells,
2012. 30(11): p. 2571-83.
111. Anderson, E.R., H.E. Gendelman, and H. Xiong, Memantine protects
hippocampal neuronal function in murine human immunodeficiency virus type 1
encephalitis. J Neurosci, 2004. 24(32): p. 7194-8.
112. Anderson, E.R., et al., Hippocampal synaptic dysfunction in a murine model of
human immunodeficiency virus type 1 encephalitis. Neuroscience, 2003. 118(2):
p. 359-69.
113. Lesburgueres, E., et al., Early tagging of cortical networks is required for the
formation of enduring associative memory. Science, 2011. 331(6019): p. 924-8.
114. Kingwell, K., Memory: Tagging in the cortex. Nat Rev Neurosci, 2011. 12(4): p.
188.

126
115. Frey, U. and R.G. Morris, Synaptic tagging: implications for late maintenance of
hippocampal long-term potentiation. Trends Neurosci, 1998. 21(5): p. 181-8.
116. Frey, U. and R.G. Morris, Synaptic tagging and long-term potentiation. Nature,
1997. 385(6616): p. 533-6.
117. Ross, R.S. and H. Eichenbaum, Dynamics of hippocampal and cortical
activation during consolidation of a nonspatial memory. J Neurosci, 2006.
26(18): p. 4852-9.
118. Clark, R.E., et al., Anterograde amnesia and temporally graded retrograde
amnesia for a nonspatial memory task after lesions of hippocampus and
subiculum. J Neurosci, 2002. 22(11): p. 4663-9.
119. Alvarez, P., et al., Differential effects of damage within the hippocampal region
on memory for a natural, nonspatial Odor-Odor Association. Learn Mem, 2001.
8(2): p. 79-86.
120. Sweatt, J.D., Neuroscience. Creating stable memories. Science, 2011.
331(6019): p. 869-70.
121. Yeckel, M.F. and T.W. Berger, Spatial distribution of potentiated synapses in
hippocampus: dependence on cellular mechanisms and network properties. J
Neurosci, 1998. 18(1): p. 438-50.
122. O'Mara, S.M., S. Commins, and M. Anderson, Synaptic plasticity in the
hippocampal area CA1-subiculum projection: implications for theories of
memory. Hippocampus, 2000. 10(4): p. 447-56.
127
123. Song, D., et al., Nonlinear dynamic modeling of spike train transformations for
hippocampal-cortical prostheses. IEEE Trans Biomed Eng, 2007. 54(6 Pt 1): p.
1053-66.
124. Kobayashi, M., et al., Hippocalcin-deficient mice display a defect in cAMP
response element-binding protein activation associated with impaired spatial
and associative memory. Neuroscience, 2005. 133(2): p. 471-84.
125. Zelcer, I., et al., A cellular correlate of learning-induced metaplasticity in the
hippocampus. Cereb Cortex, 2006. 16(4): p. 460-8.
126. Zhao, M.G., et al., Deficits in trace fear memory and long-term potentiation in a
mouse model for fragile X syndrome. J Neurosci, 2005. 25(32): p. 7385-92.
127. Delint-Ramirez, I., P. Salcedo-Tello, and F. Bermudez-Rattoni, Spatial memory
formation induces recruitment of NMDA receptor and PSD-95 to synaptic lipid
rafts. J Neurochem, 2008. 106(4): p. 1658-68.
128. Zhang, Z., et al., Bell-shaped D-serine actions on hippocampal long-term
depression and spatial memory retrieval. Cereb Cortex, 2008. 18(10): p. 2391-
401.
129. Nakashiba, T., et al., Transgenic inhibition of synaptic transmission reveals role
of CA3 output in hippocampal learning. Science, 2008. 319(5867): p. 1260-4.
130. Magnusson, K.R., et al., Age-related declines in a two-day reference memory
task are associated with changes in NMDA receptor subunits in mice. BMC
Neurosci, 2007. 8: p. 43.
131. Rolls, E.T., Hippocampo-cortical and cortico-cortical backprojections.
Hippocampus, 2000. 10(4): p. 380-8.
128
132. Naie, K. and D. Manahan-Vaughan, Regulation by metabotropic glutamate
receptor 5 of LTP in the dentate gyrus of freely moving rats: relevance for
learning and memory formation. Cereb Cortex, 2004. 14(2): p. 189-98.
133. Manahan-Vaughan, D. and K.H. Braunewell, The metabotropic glutamate
receptor, mGluR5, is a key determinant of good and bad spatial learning
performance and hippocampal synaptic plasticity. Cereb Cortex, 2005. 15(11):
p. 1703-13.
134. Brim, B.L., et al., Memory in aged mice is rescued by enhanced expression of the
GluN2B subunit of the NMDA receptor. Behav Brain Res, 2013. 238: p. 211-26.
135. Tzingounis, A.V. and J.I. Wadiche, Glutamate transporters: confining runaway
excitation by shaping synaptic transmission. Nat Rev Neurosci, 2007. 8(12): p.
935-47.
136. Masliah, E., et al., Deficient glutamate transport is associated with
neurodegeneration in Alzheimer's disease. Ann Neurol, 1996. 40(5): p. 759-66.
137. Blasco, H., et al., The glutamate hypothesis in ALS: pathophysiology and drug
development. Curr Med Chem, 2014. 21(31): p. 3551-75.
138. Liang, J., et al., Excitatory amino acid transporter expression by astrocytes is
neuroprotective against microglial excitotoxicity. Brain Res, 2008. 1210: p. 11-9.
139. Sulkowski, G., et al., Modulation of glutamate transport and receptor binding by
glutamate receptor antagonists in EAE rat brain. PLoS One, 2014. 9(11): p.
e113954.
140. McKay, R., Stem cells in the central nervous system. Science, 1997. 276(5309):
p. 66-71.

129
141. Jessell, T.M. and J.R. Sanes, Development. The decade of the developing brain.
Curr Opin Neurobiol, 2000. 10(5): p. 599-611.
142. Kintner, C., Neurogenesis in embryos and in adult neural stem cells. J Neurosci,
2002. 22(3): p. 639-43.
143. Lie, D.C., et al., Neurogenesis in the adult brain: new strategies for central
nervous system diseases. Annu Rev Pharmacol Toxicol, 2004. 44: p. 399-421.
144. Alvarez-Buylla, A., B. Seri, and F. Doetsch, Identification of neural stem cells in
the adult vertebrate brain. Brain Res Bull, 2002. 57(6): p. 751-8.
145. Bergstrom, T. and K. Forsberg-Nilsson, Neural stem cells: brain building blocks
and beyond. Ups J Med Sci, 2012. 117(2): p. 132-42.
146. Nogues, X., et al., Functions for adult neurogenesis in memory: an introduction
to the neurocomputational approach and to its contribution. Behav Brain Res,
2012. 227(2): p. 418-25.
147. Ming, G.L. and H. Song, Adult neurogenesis in the mammalian central nervous
system. Annu Rev Neurosci, 2005. 28: p. 223-50.
148. Parent, J.M., Injury-induced neurogenesis in the adult mammalian brain.
Neuroscientist, 2003. 9(4): p. 261-72.
149. Arvidsson, A., et al., Neuronal replacement from endogenous precursors in the
adult brain after stroke. Nat Med, 2002. 8(9): p. 963-70.
150. Nakatomi, H., et al., Regeneration of hippocampal pyramidal neurons after
ischemic brain injury by recruitment of endogenous neural progenitors. Cell,
2002. 110(4): p. 429-41.

130
151. Whitney, N.P., et al., Inflammation mediates varying effects in neurogenesis:
relevance to the pathogenesis of brain injury and neurodegenerative disorders. J
Neurochem, 2009. 108(6): p. 1343-59.
152. Doetsch, F. and C. Scharff, Challenges for brain repair: insights from adult
neurogenesis in birds and mammals. Brain Behav Evol, 2001. 58(5): p. 306-22.
153. Limke, T.L. and M.S. Rao, Neural stem cells in aging and disease. J Cell Mol
Med, 2002. 6(4): p. 475-96.
154. Kvamme, E., B. Roberg, and I.A. Torgner, Phosphate-activated glutaminase and
mitochondrial glutamine transport in the brain. Neurochem Res, 2000. 25(9-10):
p. 1407-19.
155. Schlett, K., Glutamate as a modulator of embryonic and adult neurogenesis.
Curr Top Med Chem, 2006. 6(10): p. 949-60.
156. Suzuki, M., et al., Glutamate enhances proliferation and neurogenesis in human
neural progenitor cell cultures derived from the fetal cortex. Eur J Neurosci,
2006. 24(3): p. 645-53.
157. Whitney, N.P., et al., Calcium-permeable AMPA receptors containing Q/R-
unedited GluR2 direct human neural progenitor cell differentiation to neurons.
FASEB J, 2008. 22(8): p. 2888-900.
158. Luk, K.C., T.E. Kennedy, and A.F. Sadikot, Glutamate promotes proliferation of
striatal neuronal progenitors by an NMDA receptor-mediated mechanism. J
Neurosci, 2003. 23(6): p. 2239-50.
131
159. Cameron, H.A., B.S. McEwen, and E. Gould, Regulation of adult neurogenesis
by excitatory input and NMDA receptor activation in the dentate gyrus. J
Neurosci, 1995. 15(6): p. 4687-92.
160. Haydar, T.F., et al., Differential modulation of proliferation in the neocortical
ventricular and subventricular zones. J Neurosci, 2000. 20(15): p. 5764-74.
161. Peng, H., et al., Stromal cell-derived factor 1-mediated CXCR4 signaling in rat
and human cortical neural progenitor cells. J Neurosci Res, 2004. 76(1): p. 35-
50.
162. Peng, H., et al., HIV-1-infected and/or immune activated macrophages regulate
astrocyte SDF-1 production through IL-1beta. Glia, 2006. 54(6): p. 619-29.
163. Velletri, T., et al., GLS2 is transcriptionally regulated by p73 and contributes to
neuronal differentiation. Cell Cycle, 2013. 12(22): p. 3564-73.
164. Erickson, J.W. and R.A. Cerione, Glutaminase: a hot spot for regulation of
cancer cell metabolism? Oncotarget, 2010. 1(8): p. 734-40.
165. Wang, J.B., et al., Targeting mitochondrial glutaminase activity inhibits
oncogenic transformation. Cancer Cell, 2010. 18(3): p. 207-19.
166. Seltzer, M.J., et al., Inhibition of glutaminase preferentially slows growth of
glioma cells with mutant IDH1. Cancer Res, 2010. 70(22): p. 8981-7.
167. Xiang, Y., et al., Targeted inhibition of tumor-specific glutaminase diminishes
cell-autonomous tumorigenesis. J Clin Invest, 2015. 125(6): p. 2293-306.
168. Masson, J., et al., Mice lacking brain/kidney phosphate-activated glutaminase
have impaired glutamatergic synaptic transmission, altered breathing,

132
disorganized goal-directed behavior and die shortly after birth. J Neurosci,
2006. 26(17): p. 4660-71.
169. Gaisler-Salomon, I., et al., Glutaminase-deficient mice display hippocampal
hypoactivity, insensitivity to pro-psychotic drugs and potentiated latent
inhibition: relevance to schizophrenia. Neuropsychopharmacology, 2009.
34(10): p. 2305-22.
170. LoTurco, J.J., et al., GABA and glutamate depolarize cortical progenitor cells
and inhibit DNA synthesis. Neuron, 1995. 15(6): p. 1287-98.
171. Olney, J.W., Glutamate-induced neuronal necrosis in the infant mouse
hypothalamus. An electron microscopic study. J Neuropathol Exp Neurol, 1971.
30(1): p. 75-90.
172. Choi, D.W., Glutamate neurotoxicity and diseases of the nervous system.
Neuron, 1988. 1(8): p. 623-34.
173. McCall, A., et al., Monosodium glutamate neurotoxicity, hyperosmolarity, and
blood-brain barrier dysfunction. Neurobehav Toxicol, 1979. 1(4): p. 279-83.
174. Newcomb, R., et al., Increased production of extracellular glutamate by the
mitochondrial glutaminase following neuronal death. J Biol Chem, 1997.
272(17): p. 11276-82.
175. Bredesen, D.E., Neural apoptosis. Ann Neurol, 1995. 38(6): p. 839-51.
176. Yuan, J. and B.A. Yankner, Apoptosis in the nervous system. Nature, 2000.
407(6805): p. 802-9.