globalization, divergence and stagnation
TRANSCRIPT
Globalization, Divergence and Stagnation�
Gino A. Ganciay
CREI
First draft: May 2003
This version: February 2005
Abstract
In a world where poor countries provide weak protection for intellectual property
rights, market integration shifts technical change in favor of rich nations. Through
this channel, free trade may amplify international income di¤erences. At the same
time, integration with countries where intellectual property rights are weakly protected
can slow down the world growth rate. A crucial implication of these results is that
protection of intellectual property is most bene�cial in open countries. This prediction,
which is novel in the literature, �nds support in the data on a panel of 53 countries
observed in the years 1965-1990.
JEL classi�cation: F14, F43, O33, O34, O41.
Keywords: Economic Growth, North-South Trade, Intellectual Property Rights,
Cross-Country Income Di¤erences.
�I am very grateful to Daron Acemoglu, Torsten Persson, Jaume Ventura and Fabrizio Zilibotti foradvice. I also thank Philippe Aghion, Pol Antràs, Alessandra Bon�glioli, Paolo Epifani, Renato Flo-res, Omar Licandro, Paul Segerstrom, Bob Staiger, Dan Tre�er and seminar participants at MIT, IIES,Stockholm University, Stockholm School of Economics, University of British Columbia, Toronto, Wiscon-sin, Rochester, CREI, Pompeu Fabra, UCL, LSE, Bocconi, the NBER Summer Institute (2004), ESSIM(2004), the SED Annual Meeting (2004), the EEA Meetings (2004) and the European Winter Meetingof the Econometric Society (2002). The usual caveat applies. Financial support from the Wallander andHedelius Foundation is gratefully acknowledged. The �rst version of this paper was written while visitingthe MIT Economics Department. I thank MIT for its hospitality.
yCREI, Universitat Pompeu Fabra, Ramon Trias Fargas, 25-27, 08005, Barcelona (Spain). E-mail:[email protected]
1
1 Introduction
The past decades have witnessed a dramatic rise in the degree of economic integration
across the globe. This phenomenon has been marked by an increasingly important role
played by less developed countries (LDCs) in world markets. Although trade between the
US and non-OECD countries is still relatively small, its share in US GDP increased by
more than fourfold between 1970 and 1995. In the same years, unprecedented episodes
of economic liberalization took place in countries like China, Mexico and India. As a
result, North-South trade is now the fastest growing component of world trade. This
rapid process of economic integration has been accompanied by the concerns expressed by
developed countries regarding the economic losses due to weak protection of intellectual
property rights (IPRs) in less developed countries. The issue has become one of the most
debated in international negotiations and led to the inclusion of the Agreement on Trade
Related Intellectual Property Rights (TRIPs) in the statute of the WTO in 1994.1 After
more than ten years, the extent to which LDCs should protect intellectual property is still
controversial. Moreover, despite the close connection between IPRs and trade negotiations,
the relationship between market integration and the protection of intellectual property
remains largely unclear.
This paper studies how North-South trade a¤ects technology, growth and relative in-
come in a model where less developed countries provide weak protection for intellectual
property and technology reacts to market incentives. Although it does not address the
question of how to design an optimal system of international IPRs regulations, it shows
that the e¤ect of trade opening on income growth and its distribution depends crucially on
the degree of protection of intellectual property worldwide. In particular, whenever poor
countries do not provide adequate protection for IPRs, North-South trade shifts technical
change in favor of rich nations. By making the sectors in which poor countries are spe-
cialized relatively less productive, trade may thus amplify North-South wage di¤erences.
Moreover, the paper shows that market integration with countries where intellectual prop-
erty rights are weakly protected may lower the incentives to innovate, leading eventually
to a slowdown in the growth rate of productivity.
To obtain these results, the paper builds a Ricardian model with a continuum of goods
and endogenous, sector speci�c, technical change. It describes a world economy composed
by two sets of countries, the North and the South, distinguished by an exogenous pattern
1The TRIPs agreement establishes minimum standards of protection for several categories of IPRs anda schedule for developing countries to adopt them.
2
of comparative advantage. Except for these Ricardian di¤erences and given that nowadays
barriers to the �ow of ideas are low, all countries have access to the same stock of technical
knowledge, that can be expanded by investing in innovation. As in R&D-driven models of
endogenous growth, innovation is �nanced by the monopoly rents it generates. However,
the key assumption of the paper is that innovators can only appropriate a fraction of the
rents from the Southern markets because of weak protection of IPRs.
The model is solved both in autarky and free trade and the equilibria are compared. In
both cases, the equilibrium has a number of desirable properties: the world income distri-
bution is stable, growth rates are equalized across sectors, countries with higher exogenous
productivity levels are relatively richer. But the world income distribution depends cru-
cially on the trade regime. Without commodity trade, each country produces all goods
and the South can free ride on innovation performed for the Northern markets. Under free
trade, instead, the two countries specialize in the sectors of comparative advantage and
bene�t from di¤erent innovations because they produce di¤erent goods. In this case, weak
IPRs imply that rents from the South are smaller so that the Southern sectors attract less
innovation. Thus, by making the sectors in which poor countries are specialized relatively
less productive, trade can amplify North-South wage di¤erences. At the same time, the
paper shows that trade with weak IPRs countries may reduce the growth rate of the world
economy. The intuition is that, in the long run, trade equalizes the returns to innovation
across sectors and countries. Hence, the disincentive to innovate due to imperfect IPRs
enforcement in the South spills over to the North.
The results of the paper are based on four assumptions: specialization driven by trade,
sector-speci�c technical progress, imperfect appropriability of pro�ts from innovation in
developing countries and an elasticity of substitution between goods higher than one. All
of them seem plausible and are shared by several models. That countries specialize in
di¤erent sets of products, at least to some extent, appears reasonable.2 More speci�cally,
the Ricardian model has proven to be useful in the literature on trade and technology
and the absence of factor price equalization makes it particularly suitable for analyzing
the world income distribution. Several observations suggest that technical progress has
a strong sectoral dimension. For example, R&D is mainly performed by large companies
and therefore directed to their range of activities. Although innovation certainly gener-
ates spillovers, Ja¤e et al. (1993) show that these are generally limited to products in
similar technological categories. Infringements of IPRs in developing countries is indeed
2Ohlin went as far as to say that trade means specialization.
3
a signi�cant phenomenon, as proven by the many complaints of large companies based in
industrial countries. In this respect, the US Chamber of Commerce estimated a pro�t loss
for US �rms of about $24 billion in 1988. Finally, gross substitutability between goods
seem realistic, as it yields the sensible prediction that fast growing sectors and countries
become relatively richer. Evidence on gross substitutability between internationally traded
goods is also provided, among others, by Acemoglu and Ventura (2002).
Although the main contribution of the paper is theoretical, it is nonetheless desirable
to assess the empirical plausibility of the mechanism it proposes. This is done in the
�nal part of the paper, which is a �rst attempt to test a key prediction of the model:
that protection of IPRs is most bene�cial in open countries. To this end, measures of
protection for IPRs and other macroeconomic variables have been collected for a panel of
53 countries observed in the years 1965-1990. The main �nding is that, consistent with the
model, the correlation between IPRs protection and GDP is higher among open countries.
This result is robust to the econometric speci�cation and the inclusion of controls.
This paper is related to various strands of literature. First, it is part of the literature
on North-South trade and endogenous growth. A common theme of some of these works
(e.g., Young, 1991 and Galor and Mountford, 2003) is that trade opening may be less
bene�cial for LDCs if they specialize in the �wrong�sectors (i.e., those with low growth
potential or low human capital intensity). The result of this paper is in a way more
general because it shows that trade induces a shift of innovation in favor of rich countries
irrespective of the characteristics of the sectors of specialization. Other works (Acemoglu
et al., 2004, and Aghion et al. 2003) suggest instead that the e¤ects of trade may depend
on characteristics such as the level of technological backwardness of a country or a sector.
In comparison, this paper shows that the e¤ect of trade may also depend on the level of
protection of IPRs. In particular, the fact that trade leads to a shift of innovation in favor
of countries where IPRs are better enforced is novel.
Next, the paper is related to the line of research on �appropriate technologies�. Diwan
and Rodrik (1991), Acemoglu and Zilibotti (2001) and Saint-Paul (2004) argue that,
whenever countries di¤er in terms of technological needs or preferences, the enforcement of
IPRs can be instrumental to stimulate the most appropriate innovations. The contribution
of this paper is to show that specialization in production due to trade opening makes the
technological need of countries more diverse and may thus exacerbate the problem of
inappropriate technologies.
The paper is also related to the literature on imitation and innovation in a trading
world. Some contributions, including Helpman (1993), Glass and Saggi (1995), Dinopou-
4
los and Segerstrom (2004), highlight the potential downsides of strong IPRs protection, as
it restricts the e¢ cient allocation of resources across countries. Others, such as Lai (1998),
Yang and Maskus (2001), suggest instead that IPRs can foster growth and promote the
di¤usion of technology. Another group of papers, including Grossman and Lai (2004),
Goh and Oliver (2002) and Chin and Grossman (1989), study the incentives that gov-
ernments have to protect intellectual property in a trading economy. Although all these
papers made important contributions, they generally neglect the idea that technologies
can be inappropriate for developing countries and that IPRs protection can play a role
in attracting better technologies. More fundamentally, they do not study the e¤ect of
trade under di¤erent IPRs regimes, which is the focus here,3 while this paper is not on
the welfare implications of IPRs.
The rest of the paper is organized as follows. Section 2 presents the basic model,
solves for the equilibrium under autarky and free trade and derives the two main results:
that trade integration with countries where IPRs are weakly protected can amplify income
di¤erences and slow down the world growth rate. The model is then extended to study
imperfect market integration in the presence of non-traded goods. Section 3 shows some
supportive empirical evidence. Section 4 concludes.
2 The Model
This section describes �rst the simplest case of a single economy with full IPRs protection
(the North). The analysis is then extended by adding a second economy (the South) with
imperfect IPRs protection. Then, three distinct equilibria are compared: autarky, with
and without IPRs protection in the South, and free trade in goods with imperfect IPRs
protection. Finally, non-traded goods are introduced to study a case of imperfect trade
integration.
2.1 Basic Setup: the North
Consider �rst a group of advanced countries, called the North, taken in isolation. The
North is assumed to be a collection of perfectly integrated economies with similar charac-
3Dinopoulos and Segerstrom (2004) is perhaps an exception in that they study the e¤ect of �global-ization�in a model with innovation and imitation. However, they de�ne �globalization�as an increase inthe size of the open South and do not consider any autarkic regime. Thus, they perform a very di¤erentexercise from the one attempted here.
5
teristics and full protection of IPRs. Consumers have identical isoelastic preferences:
U =
Z 1
0ln c (t) e��tdt:
The time index, t, is omitted when this causes no confusion. There is a continuum [0; 1] of
sectors, indexed by i. Output of each sector, y (i), is costlessly aggregated into a basket
Y used both for consumption and investment:
Y =
�Z 1
0y (i)
��1� di
� ���1; (1)
where � > 1 is the elasticity of substitution between any two goods. The relative demand
obtained by maximizing (1) is:
p (i)
p (j)=
�y (i)
y (j)
��1=�: (2)
The basket Y is taken as the numeraire and its price index is therefore set equal to one:
P =
�Z 1
0p (i)1�� di
� 11��
= 1: (3)
Each good y (i) is homogeneous and produced by competitive �rms using a range N (i) of
machines and labor, l (i):
y (i) = [� (i) l (i)]�Z N(i)
0x (i; j)1�� dj; � 2 (0; 1) (4)
where � (i) is an exogenous index of labor productivity and x (i; j) is the quantity used
of machine j 2 [0; N(i)] available in sector i. Machines are sector-speci�c, non tradeableand depreciate fully after use. Demand for machine x (i; j) derived from (4) is:
x (i; j) =
�(1� �) p (i)� (i; j)
�1=�� (i) l (i) ; (5)
where � (i; j) is the price of machine x(i; j). Each machine in each sector is produced
by a monopolist. The unit cost of producing any machine is normalized to (1� �)2.Together with isoelastic demand (2), this implies that all monopolists charge the same
price, � (i; j) = � = (1� �). Substituting � and (5) into (4), yields the quantity producedin sector i as a linear function of the level of technology A(i) � �(i)N (i) and employed
6
labor l (i):
y (i) = p (i)(1��)=� A (i) l(i): (6)
Given the Cobb-Douglas speci�cation in (4), the wage bill in each sector is a fraction �
of sectoral output. Therefore, equation (6) can be used to �nd a relationship between
equilibrium prices and the wage rate:
w = �p (i)1=� A (i) : (7)
Since there is perfect mobility of labor across sectors, the wage rate has to be equalized in
the economy. Dividing equation (7) by its counterpart in sector j yields the relative price
of any two varieties:p (i)
p (j)=
�A (j)
A (i)
��: (8)
Intuitively, sectors with higher productivity have lower prices. Using (7), integrating over
the interval [0; 1] and making use of (3) shows that the equilibrium wage rate is a CES
function of sectoral productivity:
w = �
�Z 1
0A (i)� di
�1=�: (9)
where � � � (�� 1), to simplify notation. Using (6) and (8) in (2) yields the optimalallocation of workers across sectors. Integrating over the interval [0; 1] gives:
l (i) = LA (i)�R 1
0 A (j)� dj
; (10)
Note that more productive sectors attract more workers (as long as � > 1) because the
value of marginal productivity of labor has to be equalized. Pro�ts from the sale of single
type of machine in sector i are a fraction � (1� �) =N(i) of the value of sectoral output:
� (i) = � (1� �) p (i)1=� � (i) l (i) : (11)
Its now time to discuss the characteristics of technology. As already stated, overall
productivity in each sector, A (i), is the product of two components: an exogenously given
productivity parameter, � (i), and the level of technical knowledge in sector i, represented
by the number of machines N (i). While � (i) is �xed and determined by purely exogenous
factors, such as geography, N (i) can be increased through innovation as in models of
7
endogenous growth with expanding variety of products (see Gancia and Zilibotti, 2004,
for a survey). More speci�cally, innovation is coslty and sector speci�c: i.e., a new machine
in sector i cannot be used in any other sector j. To design a new variety of machines, the
innovator has to pay a cost of � units of the numeraire. Once a new machine is discovered,
the innovator is granted a patent that entails a perpetual monopoly over its use. The
patent is then sold to a �rm that becomes the sole producer of that type of machine.
Free-entry in the R&D sector implies that the present discounted value of pro�ts from
innovation cannot exceed the entry cost �. Along a balanced growth path with positive
innovation, in which � (i) and r are constant, the free-entry condition can be written as:
� (i)
r= �:
Using (11), (10), (7) and normalizing � = (1� �)�, the above expression reduces to:4
L� (i)
�w
�A (i)
�1��= r: (12)
For the remainder of the paper, assume � 2 (0; 1). On the one hand, the assumption� > 0 (equivalent to � > 1) rules out immiserizing growth: the fact that a sector (later
on a country) growing faster than the others would become poorer in relative terms. On
the other hand, the restriction � < 1 is required to have a stable income distribution
across sectors: it implies that if a sector grows more than another, its pro�tability falls,
discouraging further innovation. If this condition was violated, it would be pro�table to
innovate in one sector only and all the others would disappear asymptotically. This case
does not seem very realistic and is thus ruled out.5 From this discussion, it should be
clear that along a balanced growth path R&D must be performed in all sectors so that
they all grow at the same rate. For this to be the case, the incentive to innovate has to
be equalized across sectors. Imposing condition (12) for all i, it is possible to characterize
the long-run relative productivity across sectors:
A (i)
A (j)=
�� (i)
� (j)
� 11��
: (13)
4This normalization is meant to simplify the algebra only. It is innocuous, since the paper does notstudy the e¤ects of changes in the cost of innovation �.
5When trade is allowed, this assumption yields a stable distribution of income across countries. Evidenceon this is provided by Acemoglu and Ventura (2002). In particular, they estimate � = 2:3 which, togetherwith a labor share � = 0:66, implies � = 0:85. Thus, the restriction � 2 (0; 1) seem empirically plausible.
8
Equation (13) shows that, as long as � > 0 (i.e., � > 1), innovation ampli�es the exoge-
nously given productivity di¤erences � (i) =� (j). As for labor mobility, in order to equalize
the returns to innovation, exogenously more productive sectors need to have a higher than
average N(i).
Finally, using (12), (9) and the Euler equation for consumption growth g = r � �, thegrowth rate of the economy can be found as:
g = L
�Z 1
0� (i)�=(1��) di
�(1��)=�� �: (14)
2.2 Imitation and the South
Consider now a set S of less developed countries, called the South. From now on, the sub-
scripts N and S will be used whenever necessary to distinguish the North and the South
respectively. The South is assumed to have a schedule of exogenous labor productivity,
�S = (�S (i)), di¤erent from that of the North, �N = (�N (i)). This Ricardian di¤erences
captures the fact that geographic, institutional and economic di¤erences (taken as given)
make the South relatively more productive in some sectors than the North, even when
technological knowledge is common. Following Dornbusch et al. (1977), sectors are con-
veniently ordered in such a way that the index i 2 [0; 1] is decreasing in the comparativeadvantage of the North, i.e., �N (i) =�S (i) > �N (j) =�S (j) if and only if i < j.
The way imitation is modeled emphasizes the quasi public good nature of knowledge,
according to which ideas can �ow rapidly across borders. For simplicity, protection of
IPRs is modeled as in Acemoglu (2003) and Acemoglu and Zilibotti (2001). They assume
that �rms in the South can copy any machine at a small cost � and sell them to �rms in
the South.6 This means that the endogenous component of technology, N(i), is identical
in all countries and that all machines are sold by local monopolists. In fact, no two �rms
have an incentive to copy the same machine because price competition would lead them
to negative pro�ts. The role of IPRs protection is simply to determine how much of
the revenue from the sale of machines in the South accrues to the original innovator. In
particular, the original innovator receives royalties from the imitator in the South equal to
a fraction � 2 [0; 1] of the pro�ts he makes.7 Therefore, � can be interpreted as an index
6Consistent with most patent laws, �rms in the South are never allowed to re-export copied machinesto the Northern market, so that there is no competition between technology �rms in the North and theSouth.
7The obvious limit of this approach to IPRs is that the monopoly distortion in the South does notdepend on �. This simpli�cation is innocuous except for welfare analysis, which is not in the scope of
9
of the strength of IPRs protection.
Innovation, in turn, is global: the R&D sector produces for the world economy and the
cross-country distribution of R&D costs is assumed to be proportional to the net revenue
accruing to the innovator in each country. This assumption is not essential, but it does
simplify the analysis by making the localization of the R&D industry irrelevant.8 Note
that, despite the fact that the North and the South have access to the same innovations,
their productivity will generally di¤er for two reasons: �rst, because of the exogenous
di¤erences in labor productivity �N and �S , and second, as it will be shown soon, because
innovations may be more appropriate for a country than the other.
2.3 Case I: no International Trade and � = 0
Consider �rst the simplest case in which there is no IPRs protection in the South (i.e.,
� = 0) and no trade in goods. Under this conditions, the equilibrium in the North is
the one described in section 2.1 and is una¤ected by the presence of other countries.
In particular, the state of technology across sectors, N(i), is given by (13) according to
the exogenous labor productivity of the North, �N (i). The equilibrium in the South is
characterized by a set of equations analogous to those that apply to the North, with the
di¤erence that machines are copied and thus N(i) is taken as given. Then, using equations
(9) and (13) it is possible to solve for the North-South relative wage, ! � wN=wS :
! =
" R 10 �N (i)
�=(1��) diR 10 �N (i)
�2=(1��) �S (i)� di
#1=�: (15)
First, note that @!=@�N (i) > 0 and @!=@�S (i) < 0. Intuitively, the relative wage is pro-
portional to the exogenous productivity of the two regions, �N and �S . More important,
the Appendix shows that the sectoral pro�le of technology is appropriate for the North, in
the sense that it maximizes YN , while it is appropriate for the South only in the limit case
in which �N and �S are proportional to each other so that there is no comparative advan-
the paper. Alternatively, one could assume that imitated products are sold at marginal cost and modelIPRs protection as an additional per-unit cost that must be paid to the original innovator in the form ofroyalties. For example, the unit cost inclusive of royalties could be de�ned as (1� �) (1 + �� � �), so that�S = �N = (1� �) if � = 1 and �S = (1� �)
2 < �N if � = 0. The qualitative results of the paper wouldcarry over because such a modi�cation a¤ects both the autarky and free trade equilibrium in the sameway.
8Equivalently, the localization of R&D could be studied by allowing pro�t transfers between countriesin terms of Y . In any case, given the small size of the R&D sector, about 2% of GDP in advanced countriesand much less in the rest of the world, this simpli�cation seems innocuous.
10
tage (i.e., �S (i) = ��N (i) ;8i, with � > 0 equal to a constant of proportionality).9 Thisresult extends the �nding of Acemoglu and Zilibotti (2001) that technologies developed in
advanced countries may be inappropriate for the economic conditions of LDCs.10 The Ap-
pendix also shows that 8� 2 (0; 1) ! is bounded by max f�N (i) =�S (i)g = �N (0) =�S (0).Lastly, since growth is due to the expansion of N(i) that are identical across countries,
equation (14) for the North gives also the growth rate of the South.
2.4 Case II: no International Trade and � � 0
Consider now the more general case of imperfect protection of IPRs in the South: � 2 [0; 1].In this case, pro�tability of an innovation is given by the sum of the rents from both the
markets in the North and in the South. Then, the free-entry condition according to which
the value of innovation must be equal to its cost becomes:
[�N (i) + ��S (i)]
r= �:
Note that an innovator can extract only a fraction � of the pro�ts from the Southern
market. Substituting the expressions for pro�ts and solving for N (i) yields:
N (i) =
"LN�N (i)
� (wN )1�� + �LS�S (i)
� (wS)1��
r
#1=(1��): (16)
The endogenous component of productivity, N (i), is now proportional to a weighted
average of the two exogenous indexes �N (i) and �S (i), with weights that depend on
country size, the strength of property rights and relative income. The implicit formula for
the relative wage is:
! =
8><>:R 10 �N (i)
�hLN�N (i)
� + �LS�S (i)� (!)��1
i�=(1��)diR 1
0 �S (i)�hLN�N (i)
� + �LS�S (i)� (!)��1
i�=(1��)di
9>=>;1=�
: (17)
9 In fact, it is optimal to have a relatively high level of technology N(i) in sectors where the exogenouslabor productivity �(i) is already high. Copying the technology from the North, the South is using toomany machines in sectors that are originally not very productive. This ine¢ ciency lowers the wage in theSouth.10 In their model, this happens because of a skill-technology mismatch: the Northern technology is too
skill-biased for the skill-endowment of the South. Here, any source of comparative advantage captured by�N and �S implies that the North and the South have di¤erent technological needs.
11
Whether technology is closer to the Northern or Southern optimum, depends on which
of the two markets for innovations is larger (see the Appendix for further details). As
�LS=LN ! 0, equations (17) approaches from below (15). Therefore, the case of no IPRs
protection de�nes an upper bound for ! in autarky.
Finally, using (16), (9) and the Euler equation g = r� �, the growth rate of the worldeconomy for the general case when � 2 [0; 1] can be found as:
g =
�Z 1
0
hLN�N (i) + �LS�S (i)
� (�N (i) =!)1��
i�=(1��)di
�(1��)=�� �: (18)
Note that the world growth rate is increasing in � because stronger IPRs protection trans-
late into higher rewards to innovation. As � ! 0, the growth rate declines to (14), de�ning
a lower bound for the growth rate in autarky.
2.5 Case III: Free Trade with � � 0
Consider now the possibility to trade y(i) internationally. The exchange of goods between
the North and the South is pro�table because of Ricardian comparative advantage. Even
if technological progress is endogenous, sectoral productivity di¤erences across countries
are �xed exogenously by �N and �S , and so is the pattern of comparative advantage.11
Recall that the ordering of sectors i 2 [0; 1] is decreasing in the comparative advantage ofthe North, so that �N (i) =�S (i) > �N (j) =�S (j) if and only if i < j. This means that the
North is better at producing goods with a low-index i. Further, for analytical tractability,
the comparative advantage schedule, �N (i) =�S (i), is assumed to be continuous. As in
Dornbusch et al. (1977), the equilibrium under free trade and for a given technology can
be found imposing two conditions. The �rst is that each good is produced only in the
country where it would have a lower price. This implies that the North specializes in
the sectors [0; z) where its comparative advantage is stronger and the South produces the
remaining range of goods (z; 1]. Given the continuity of �N (i) =�S (i), the North and the
South must be equally good at producing the cut-o¤ commodity z: pN (z) = pS (z).12
Using (7), this condition identi�es the cut-o¤ sector z as a function of the relative wage
11This is of course a simpli�cation. Saint-Paul (2004) makes the same assumption, while Taylor (1994)builds a model where comparative advantage is endogenous and may depend on IPRs policies.12Since goods y(i) are produced by competitive �rms, no one can undercut the price in face of foreign
competition. Further, given that each monopolist is in�nitesimal, it has no incentive to undercut the priceof its machine to make an industry more competitive.
12
under free trade !:�N (z)
�S (z)= !: (19)
For a given relative wage, (19) gives the pattern of specialization between the two countries.
Since comparative advantage of the North is decreasing in z, (19) traces a downward
sloping curve, �, in the space (z; !). The second equilibrium condition is trade balance,
i.e., imports and exports have to be equal in value. Since total output in a country is
proportional to the wage bill and the share of consumption allocated to a set [0; z] of
goods isR z0 p (i)
1�� di, trade balance can be written as:
wNLN
Z 1
zp (i)1�� di = wSLS
Z z
0p (i)1�� di;
where the left hand side is the value of imports in the North and the right hand side is
the value of imports in the South. Note that, by homogeneity of tastes, the location of
demand (and R&D spending) is irrelevant. Using (7), the trade balance condition can be
rewritten as:
w1+�N LN
Z 1
zA (i)� di = w1+�S LS
Z z
0A (i)� di: (20)
Along a balanced growth path, pro�ts from innovation in any pair of sectors must be
equal. In particular, considering innovations for goods i and j produced in the North and
in the South respectively, the following research-arbitrage condition must hold: �N (i) =
��S(j). Substituting (11) for pro�ts, noting that under free trade the optimal allocation
of labor (10) is lN (i) = LNAN (i)� =R z0 AN (v)
� dv and lS (j) = LSAS (j)� =R 1z AS (v)
� dv
and using (20), yields the relative productivity compatible with balanced growth:
AN (i)
AS (j)=
��N (i)
��S (j)
�1=(1��)(!)�=(��1) ; (21)
8i; j 2 [0; 1] with i < z < j: Compared to the case without trade, the relative productivityof sectors still depends on the exogenous component � (i), but also on the IPRs regime
of the country where the innovation is used. Technology is still biased towards more
productive sectors (as � 2 (0; 1), original di¤erences �N (i) =�S (j) are ampli�ed) but alsoagainst the Southern sectors where rents from innovation are lost (as long as � < 1).
Hence, this important equation shows that, under free trade, weak protection of IPRs in
the South shifts technology in favor of the goods produced by the North.
Integrating i over [0; z] and j over [z; 1] in (21) and using (20), the trade balance
condition (TB), incorporating the research arbitrage condition that must hold along the
13
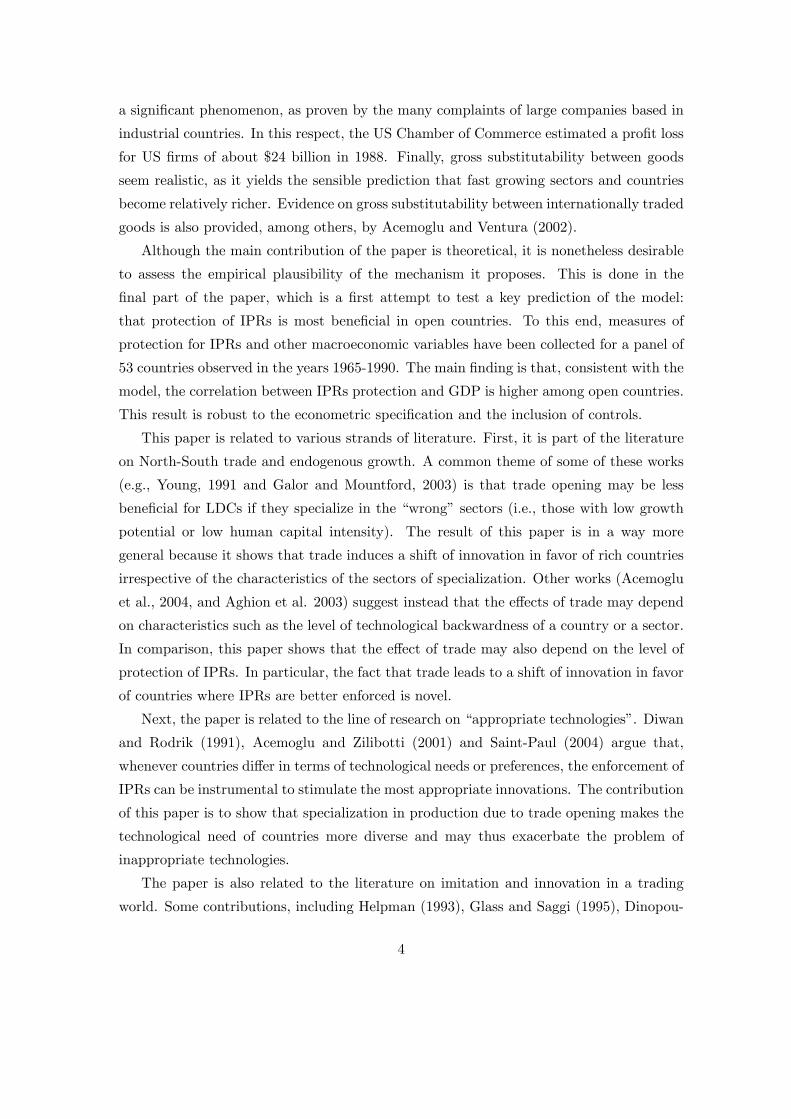
z
ω
1
TB
Φ
ω’
z’Produced in N Produced in S
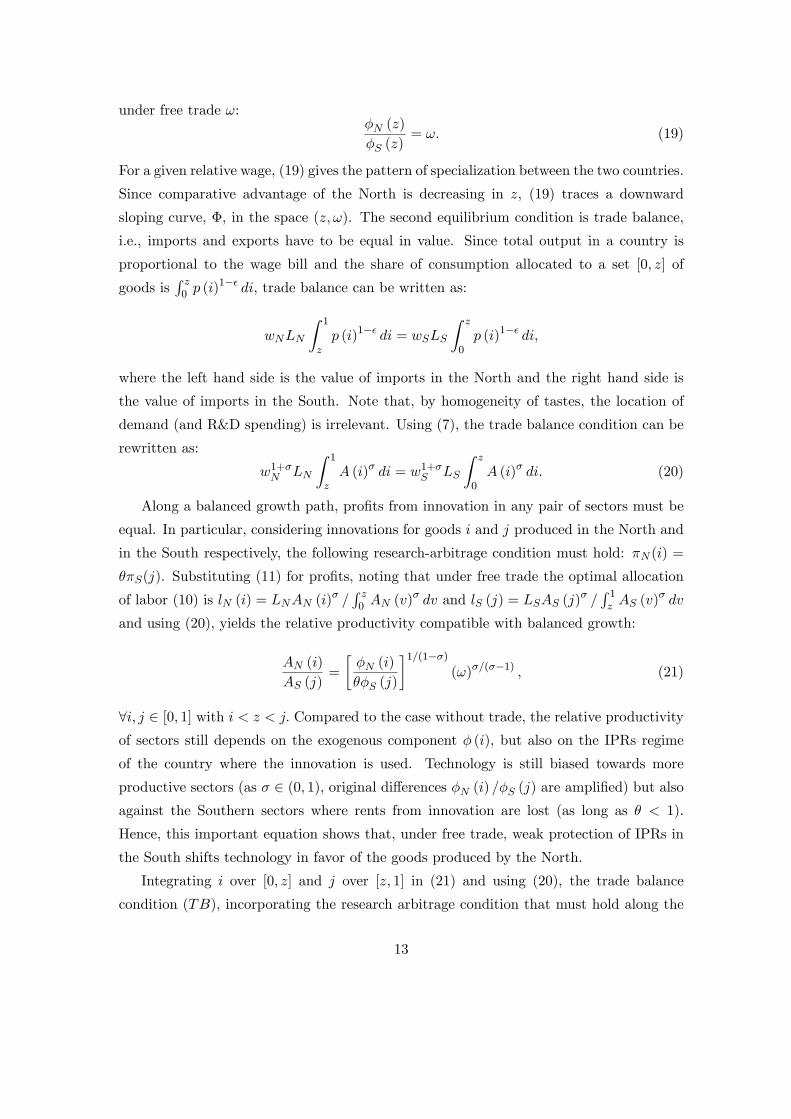
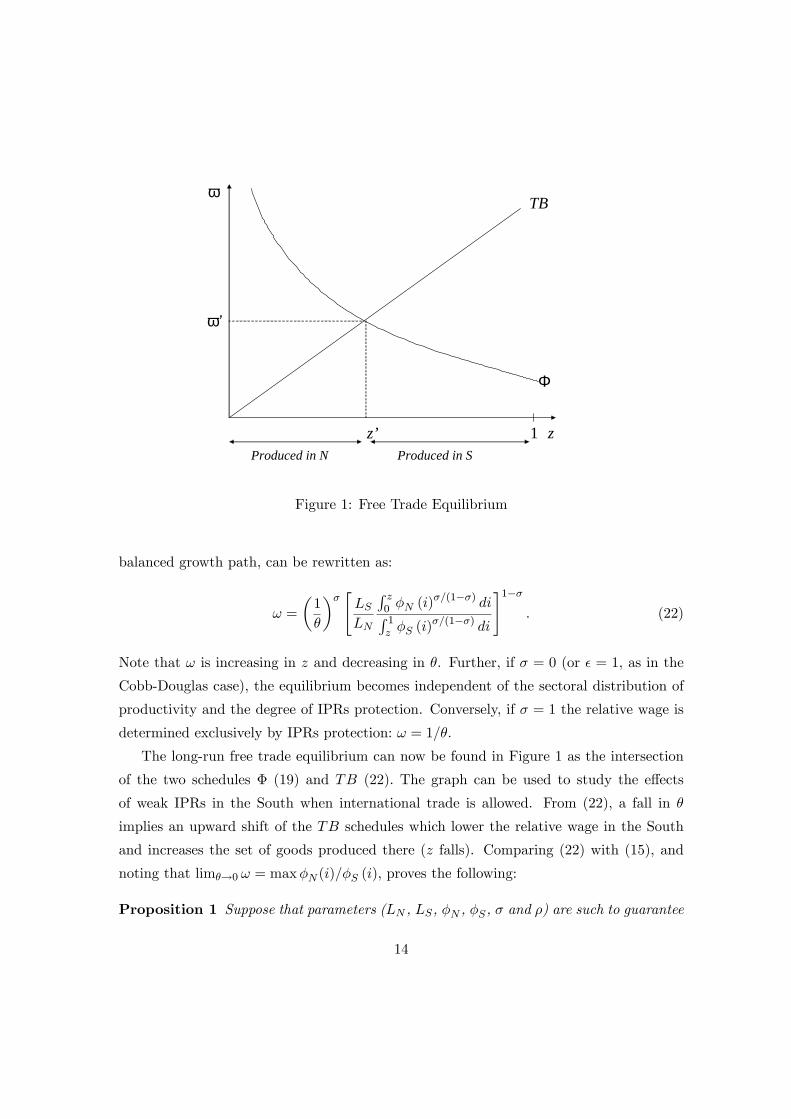
Figure 1: Free Trade Equilibrium
balanced growth path, can be rewritten as:
! =
�1
�
�� "LSLN
R z0 �N (i)
�=(1��) diR 1z �S (i)
�=(1��) di
#1��: (22)
Note that ! is increasing in z and decreasing in �. Further, if � = 0 (or � = 1, as in the
Cobb-Douglas case), the equilibrium becomes independent of the sectoral distribution of
productivity and the degree of IPRs protection. Conversely, if � = 1 the relative wage is
determined exclusively by IPRs protection: ! = 1=�.
The long-run free trade equilibrium can now be found in Figure 1 as the intersection
of the two schedules � (19) and TB (22). The graph can be used to study the e¤ects
of weak IPRs in the South when international trade is allowed. From (22), a fall in �
implies an upward shift of the TB schedules which lower the relative wage in the South
and increases the set of goods produced there (z falls). Comparing (22) with (15), and
noting that lim�!0 ! = max�N (i)=�S (i), proves the following:
Proposition 1 Suppose that parameters (LN , LS, �N , �S, � and �) are such to guarantee
14
positive long-run growth and � 2 (0; 1). Then, there exists a level �� such that if � < ��
income di¤erences in free trade, as measured by !, are larger than income di¤erences
without international trade.
This is one of the main results of the paper: that trade can amplify income and produc-
tivity di¤erences if protection of IPRs in less developed countries is too low. Proposition
1 is based on the interplay between specialization and weak IPRs in developing countries.
First, trade and specialization imply that the North and South bene�t directly from dif-
ferent sets of innovations. Second, weak IPRs make innovations directed to the South less
pro�table. Hence, trade may shift technology in favor of rich nations. As � ! 0, R&D
would be directed towards Northern sectors only and the income gap would grow up to its
maximum (�N (0)=�S (0)), irrespective of any other country characteristics.13 In autarky,
instead, even with � = 0, the South still bene�ts from the innovations performed in all
sectors for the Northern market.
Another interesting result can be found by calculating the long-run growth rate of the
world economy in free trade (see the Appendix for the derivation):
gFT = LN
�Z z
0�N (i)
�(1��) di
� 1����1 +
LSLN
1
!
�1=�� �: (23)
Note that the growth rate of the world economy is increasing in �: a higher � expands
the range z of goods produced in the North and decreases !, all e¤ects that contribute
to raising the growth rate in (23). The intuition is simple and is the common argument
in favor of IPRs protection: better enforcement of IPRs strengthens the incentives to
innovate and therefore fosters growth. What is more surprising is that the growth rate
of the world economy approaches zero if � is low enough. This is in contrast to the case
without international trade, where the growth rate is bounded from below by the growth
rate of the North economy taken in isolation (14).
The reason behind this result is that weak IPRs in the South spills over to North-
ern sectors because trade equalizes the long-run returns to innovation across sectors and
countries (i.e., �N (i) = ��S(j)). In turn, this is possible because returns to innovation in
a given sector fall asymptotically to zero as the sector grows faster then the rest of the
economy (a consequence of � 2 (0; 1)). Thus, balanced growth is achieved by expanding
13Acemoglu and Zilibotti (2001) show instead that trade leads to skill-biased technical change. However,in their model trade generates productivity convergence and has ambiguous e¤ects on relative income,even when � = 0 (the only case they study). The main reason for these di¤erent results is that they use aHeckscher-Ohlin trade model with factor price equalization.
15
the Northern sectors up to the point where further investment in innovation for the North
is no more pro�table than it is for the South.14
Comparing the growth rate in free trade, (23), and autarky, (14), and noting that (23)
is a continuous function of � with lim�!b�>0 gFT = 0, proves the following:
Proposition 2 For any � 2 (0; 1), there exists a level ��� such that, if � < ���, the longrun world growth rate is lower when international trade is allowed.
In summary, Propositions 1 and 2 imply that if protection of intellectual property is
too low in less developed countries, trade integration can either amplify income di¤erences,
slow down the world growth rate, or both.
2.6 Non-Traded Goods
The introduction of non-traded goods gives rise to a regime the combines the free-trade
and autarky equilibrium. Following Dornbusch et al. (1977), assume that a fraction t
of income is everywhere spent on internationally traded goods and a fraction (1� t) onnon-traded goods.15 In particular, de�ne consumption over two baskets of goods:
C = (Y )t (Y �)1�t ;
where Y , representing the traded component of consumption, is still given by (1), while
Y � is a basket of non-traded good. In this section, all variables related to the non-traded
sectors are denoted by an asterisk. To preserve symmetry, output of the non-traded good,
Y �, is de�ned by a CES function over a new [0; 1] interval of (non-traded) commodities
as in (1). In fact, it is convenient to model the two sectors, traded and non-traded, as
similar in all respects and independent from each other, in that each sector uses its own
output as the only input to produce its machines and innovation. As before, the price
index of the traded good Y is set equal to one, while the price of Y � is P �. Under these
assumptions and for given wages and technology, the equilibrium conditions in the traded
sector are almost unchanged. The only di¤erence is that, due to Cobb-Douglas preferences
14Note that sector-speci�c technical process is needed for Proposition 2 to hold. In a setup with factor-speci�c innovations, as in Acemoglu and Zilibotti (2001), the market size for any innovation depends onexogenous endowments that are una¤ected by specialization and trade: for this reason, incentives to investin R&D would never go to zero even if � = 0. As a consequence, in Acemolgu and Zilibotti (2001) tradeopening has no e¤ect on the world growth rate.15Non-traded goods can also arise endogenously in the presence of a trade cost. See Dornbusch et al.
(1977) for more details.
16
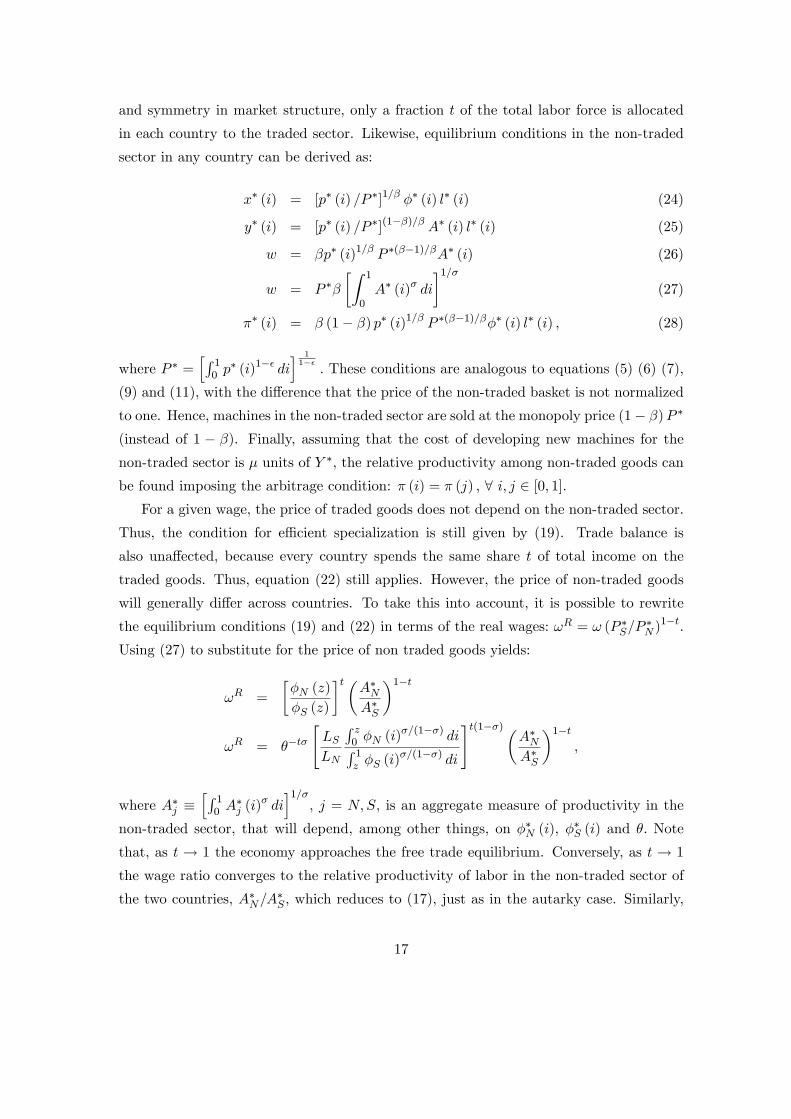
and symmetry in market structure, only a fraction t of the total labor force is allocated
in each country to the traded sector. Likewise, equilibrium conditions in the non-traded
sector in any country can be derived as:
x� (i) = [p� (i) =P �]1=� �� (i) l� (i) (24)
y� (i) = [p� (i) =P �](1��)=� A� (i) l� (i) (25)
w = �p� (i)1=� P �(��1)=�A� (i) (26)
w = P ��
�Z 1
0A� (i)� di
�1=�(27)
�� (i) = � (1� �) p� (i)1=� P �(��1)=��� (i) l� (i) ; (28)
where P � =hR 10 p
� (i)1�� dii 11��: These conditions are analogous to equations (5) (6) (7),
(9) and (11), with the di¤erence that the price of the non-traded basket is not normalized
to one. Hence, machines in the non-traded sector are sold at the monopoly price (1� �)P �
(instead of 1 � �). Finally, assuming that the cost of developing new machines for the
non-traded sector is � units of Y �, the relative productivity among non-traded goods can
be found imposing the arbitrage condition: � (i) = � (j) ; 8 i; j 2 [0; 1].For a given wage, the price of traded goods does not depend on the non-traded sector.
Thus, the condition for e¢ cient specialization is still given by (19). Trade balance is
also una¤ected, because every country spends the same share t of total income on the
traded goods. Thus, equation (22) still applies. However, the price of non-traded goods
will generally di¤er across countries. To take this into account, it is possible to rewrite
the equilibrium conditions (19) and (22) in terms of the real wages: !R = ! (P �S=P�N )
1�t.
Using (27) to substitute for the price of non traded goods yields:
!R =
��N (z)
�S (z)
�t�A�NA�S
�1�t!R = ��t�
"LSLN
R z0 �N (i)
�=(1��) diR 1z �S (i)
�=(1��) di
#t(1��)�A�NA�S
�1�t;
where A�j �hR 10 A
�j (i)
� dii1=�
, j = N;S, is an aggregate measure of productivity in the
non-traded sector, that will depend, among other things, on ��N (i), ��S (i) and �. Note
that, as t ! 1 the economy approaches the free trade equilibrium. Conversely, as t ! 1
the wage ratio converges to the relative productivity of labor in the non-traded sector of
the two countries, A�N=A�S , which reduces to (17), just as in the autarky case. Similarly,
17
it is possible to show that the growth rate is given by a combination of the formulas valid
in autarky and in free trade.
At this point, it is instructive to isolate the mechanism emphasized in the paper by
considering a simple case in which the two countries are perfectly symmetric except for
the degree of protection of IPRs, �. In particular, assume that the two countries have
the same size, LN = LS , the same productivity in the non-traded sectors, ��N (i) = ��S (i)
implying A�N = A�S , and the same average productivity in the traded sectors. However,
the North and the South still di¤er in how the exogenous component of labor productivity
is distributed across the traded sectors. For example, assume that �N (i) = �S (1� i). Insuch a situation, no country is inherently better than the other.16 Then, it easy to show
that the relative wage in autarky is one and that the following inequalities hold:
@!R
@t� 0; @!R
@�� 0; @!R
@�@t< 0;
i.e., the North-South wage ratio increases with the extent of trade (t) whenever IPRs are
not fully protected in the South. Further, the North-South wage ratio falls with IPRs
protection in the South (�), the more so the higher the extent of trade (t). Moving back
to the general case, it is straightforward to use Proposition 1 to show that, if � is low
enough, real wage di¤erences will increase with the extent of trade (t).
2.7 Why Are IPRs Not Protected in the South?
The previous analysis suggests that Southern countries may bene�t from the enforcement
of IPRs. It is then interesting to ask why these policies are often not adopted. Although
this question goes beyond the scope of the paper, a number of possible answer come
to mind. First of all, enforcing IPRs can be costly, particularly in countries with weak
legal institutions. A second reason might be that a tightening of IPRs implies a pro�t
loss. Therefore, it may be optimal from the point of view of the South not to have full
protection of IPRs. Even when strong protection of IPRs is in the interest of the South,
the government might fail to implement the optimal policy for political reasons: if the
group of monopolists that enjoy the rents from imitation has more political power than the
16The assumption that there is a pattern of comparative advantage in traded sectors (i.e., �N (i) 6= �S (i))while there is none in non-traded sectors (i.e., ��N (i) = �
�S (i)) is a simpli�cation that captures, albeit in
an extreme fashion, what would be a general result if non-traded goods arose endogenously due to thepresence of a trade cost: that comparative advantage would be stronger among traded goods. The reason isthat non traded goods would be precisely those for which comparative advantage (i.e., the price di¤erencebetween the two countries) is not strong enough to justify spending the trade cost.
18
workers, it may prefer to defend pro�ts at the expenses of the rest of the economy. Further,
if the Southern policy makers behave myopically (due to, say, electoral uncertainty) and
fail to consider the e¤ect of their policies on world innovation, then they would set an
ine¢ ciently low level of IPRs protection. Finally, in implementing IPRs protection, there
might be a coordination problem among Southern governments: each of them prefers
the others to enforce IPRs, in order to attract innovation, but has an incentive to free
ride not enforcing these property rights itself. However, this depends on the pattern of
specialization and on the size of each country. If each Southern country specialized in a
di¤erent set of commodities, then the coordination problem would disappear. Similarly, a
large country would have a higher incentive to protect IPRs because of its larger impact
on world innovation and its limited ability to bene�t from others�policies.
3 Empirical Evidence
The key mechanism of the model is the interaction between trade-driven specialization and
the ability of a country to attract better technologies by changing the level of protection
of IPRs. While a country in autarky can free ride on innovation, trade-induced special-
ization implies that the North and the South bene�t from di¤erent innovations so that
the scope for free-riding is limited.17 More precisely, specialization has two e¤ects. First,
by increasing a country�s share of world production (and pro�ts) in the sectors of com-
parative advantage, it increases the impact of country-speci�c policies on pro�tability of
innovations directed to those sectors, thereby increasing the ability of a country to attract
technologies tailored to its needs. Second, by reducing the number of countries producing
a speci�c good, it limits the bene�ts of innovations directed to that good on the rest of
the world. For these reasons, the model suggests the positive e¤ect of increasing IPRs
protection of a country, �i, on its income to be higher under free trade than in autarky
or, more generally, the larger the extent of trade. Further, since the ability of a country
to attract innovation for its own sectors depends on its share in world production of those
sectors, which in turn depends on country size, the model suggests that the impact of �i
on productivity should be higher in larger countries. This is the case in autarky, but also
under free trade whenever there are countries specialized in the same products. These
17Yet, free riding may still arise between the governments of similar LDCs specialized in the same typeof products.
19
implications can be summarized as:
@�Yi=Y
�@�i@ti
> 0 and@�Yi=Y
�@�i@Li
> 0; (29)
where Yi is the real GDP per worker in country i, Y is the world average, Li is the size of
country i and ti the size of its traded sector. Since the results of the paper hinge on (29),
testing them provides a way to assess its empirical plausibility.
To this end, measures of GDP per worker, IPRs protection, openness to trade and
size have been collected for a panel of countries from 1965 to 1995. GDP per worker
(GPDW) is taken from the Penn World Table 6.0 (PWT6.0). Two important determinants
of productivity are also included in the analysis to capture some of the cross-country
di¤erences in the �: the stock of physical capital per worker (KL), from PWT6.0, and
the fraction of working age population with at least secondary schooling as a proxy for
human capital (HL), from Barro-Lee. As for trade openness, two di¤erent measures are
considered: the Sachs and Warner (1995) index, which is a dummy taking value one if a
country is classi�ed as open, and the trade share in total GDP form PWT6.0.18 Although
the �rst is useful to distinguish countries under di¤erent trade regimes, it exhibits almost
no time variation in the given sample and is therefore appropriate for the cross-section.
The second measure, instead, captures well the increase in market integration over time.
Country size is measured by total population (POP), as reported in PWT6.0. The last
challenge is to �nd data on the degree of protection of intellectual property. In this respect,
this study uses the index of patent rights built by Ginarte and Park (1995). Although
patents are only a component of IPRs, they are likely to be correlated with the overall
level of protection for intellectual property. This index has also the advantage of being
available for a large number of countries with quinquennial observation since 1965. The
index (IPR) ranges from 0 to 5.19 In summary, the overall dataset comprises a cross-
section of 53 countries and 6 time observations, from 1965 to 1990 at 5 year intervals.20
18According to Sachs and Warner, an economy is classi�ed as open if satis�es all of the following criteria:(1) nontari¤ barriers cover less than 40 percent of trade (2) average tari¤ rates are less than 40 percent(3) any black market premium was less than 20 percent during the 1970s and 1980s (4) the country is notclassi�ed as socialist and (5) the government does not monopolize major exports.19This index is based on an assessment of �ve aspects of patent laws: (1) extent of coverage, (2) member-
ship in international patent agreements, (3) provision for loss of protection, (4) enforcement mechanismsand (5) duration of protection. An alternative, but time-invariant, measure of IPRs is provided by Rappand Rozek (1990). On the cross-section, the two proxies yield very similar results.20Data are available for the following countries: Argentina, Australia, Austria, Belgium, Bolivia,
Botswana, Canada, Chile, Colombia, Denmark, Dominican Rep., Ecuador, Finland, France, Greece,Guatemala, Honduras, Hong Kong, Iceland�, India, Iran, Ireland, Israel, Italy, Jamaica, Japan, Kenya,
20
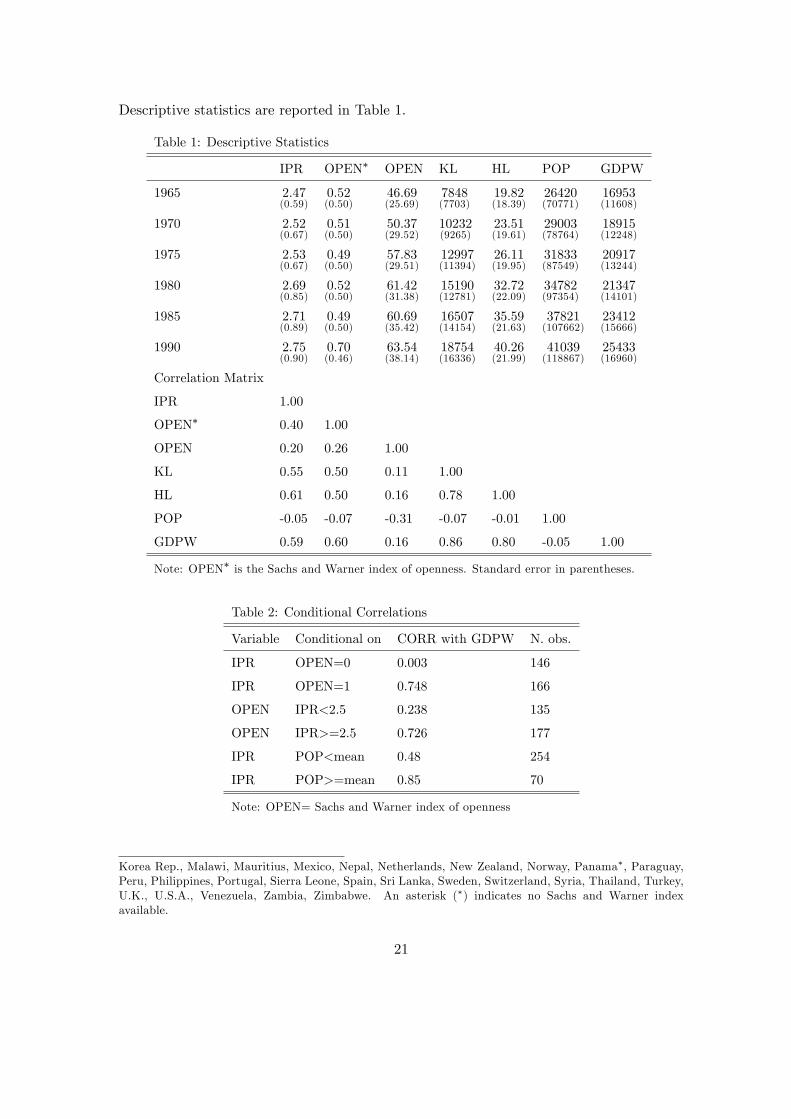
Descriptive statistics are reported in Table 1.
Table 1: Descriptive Statistics
IPR OPEN� OPEN KL HL POP GDPW
1965 2.47(0.59)
0.52(0.50)
46.69(25.69)
7848(7703)
19.82(18.39)
26420(70771)
16953(11608)
1970 2.52(0.67)
0.51(0.50)
50.37(29.52)
10232(9265)
23.51(19.61)
29003(78764)
18915(12248)
1975 2.53(0.67)
0.49(0.50)
57.83(29.51)
12997(11394)
26.11(19.95)
31833(87549)
20917(13244)
1980 2.69(0.85)
0.52(0.50)
61.42(31.38)
15190(12781)
32.72(22.09)
34782(97354)
21347(14101)
1985 2.71(0.89)
0.49(0.50)
60.69(35.42)
16507(14154)
35.59(21.63)
37821(107662)
23412(15666)
1990 2.75(0.90)
0.70(0.46)
63.54(38.14)
18754(16336)
40.26(21.99)
41039(118867)
25433(16960)
Correlation Matrix
IPR 1.00
OPEN� 0.40 1.00
OPEN 0.20 0.26 1.00
KL 0.55 0.50 0.11 1.00
HL 0.61 0.50 0.16 0.78 1.00
POP -0.05 -0.07 -0.31 -0.07 -0.01 1.00
GDPW 0.59 0.60 0.16 0.86 0.80 -0.05 1.00
Note: OPEN� is the Sachs and Warner index of openness. Standard error in parentheses.
Table 2: Conditional Correlations
Variable Conditional on CORR with GDPW N. obs.
IPR OPEN=0 0.003 146
IPR OPEN=1 0.748 166
OPEN IPR<2.5 0.238 135
OPEN IPR>=2.5 0.726 177
IPR POP<mean 0.48 254
IPR POP>=mean 0.85 70
Note: OPEN= Sachs and Warner index of openness
Korea Rep., Malawi, Mauritius, Mexico, Nepal, Netherlands, New Zealand, Norway, Panama�, Paraguay,Peru, Philippines, Portugal, Sierra Leone, Spain, Sri Lanka, Sweden, Switzerland, Syria, Thailand, Turkey,U.K., U.S.A., Venezuela, Zambia, Zimbabwe. An asterisk (�) indicates no Sachs and Warner indexavailable.
21
To get a �rst sense for the patterns in the data, Table 2 presents a set of conditional
correlations. The results are encouraging. As predicted by the model, IPRs protection
is associated with higher productivity only for countries classi�ed as open by Sachs and
Warner. The correlation is zero for closed economies. Likewise, being open has a much
higher correlation with productivity in countries with strong patent rights. Also the second
prediction in (29) seems broadly consistent with the data, as IPRs protection is found to
have a higher correlation with productivity in larger countries.
A better way to display these correlations is through simple least-square regressions
on the pooled data. Throughout, all the variables are in logs, except for dummies; further,
to alleviate simultaneity concerns, all the right-hand side variables are lagged �ve years.21
Column (1) of Table 3 reports the results of regressing real output per worker (GDPW) on
patent rights (IPR) the Sachs and Warner openness index (OPEN), an interaction term
between IPR and OPEN, an interaction term between IPR and country size (POP) and
country size itself (POP). The regression also controls for the two important determinants
of productivity, physical (KL) and human (HL) capital per worker. According to (29) the
two interaction terms should have a positive sign. Consistently, column (1) shows that the
coe¢ cient on both interactions is positive and precisely estimated.
Although the pooled OLS regression is a useful way to summarize partial correlations in
the data, it may place too much weight on cross-sectional variation and su¤er from omitted
variables, particularly given the small number of covariates. In this respect, a LSDV
regression with country �xed-e¤ects has the advantage of controlling for omitted variables
that change very little over time and that may be correlated with other regressors, such as
institutional and geographical characteristics of countries. However, since this estimator
uses only within-country variation, the Sachs and Warner index of openness, with its
almost nil time variation, is inadequate. The analysis therefore continues using the trade
share in GDP as a measure of openness. Before moving to the �xed-e¤ects regression,
Column (2) shows again the pooled OLS estimates with the new trade measure and it
con�rms the previous �ndings: the two interaction terms are positive and signi�cant at
the 1% level.
21To avoid losing observations by using lagged values, the dependent variable, available for 1995, isforwarded 5 years in the remainder of the empirical analysis.
22
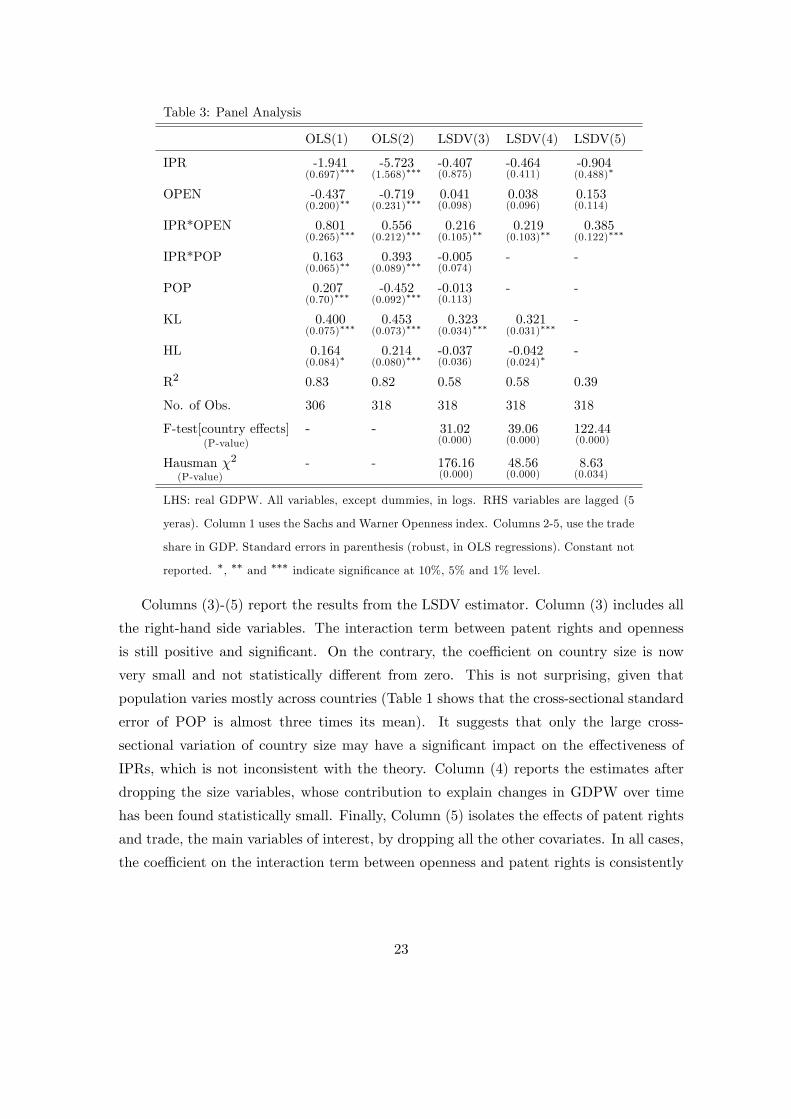
Table 3: Panel Analysis
OLS(1) OLS(2) LSDV(3) LSDV(4) LSDV(5)
IPR -1.941(0.697)���
-5.723(1.568)���
-0.407(0.875)
-0.464(0.411)
-0.904(0.488)�
OPEN -0.437(0.200)��
-0.719(0.231)���
0.041(0.098)
0.038(0.096)
0.153(0.114)
IPR*OPEN 0.801(0.265)���
0.556(0.212)���
0.216(0.105)��
0.219(0.103)��
0.385(0.122)���
IPR*POP 0.163(0.065)��
0.393(0.089)���
-0.005(0.074)
- -
POP 0.207(0.70)���
-0.452(0.092)���
-0.013(0.113)
- -
KL 0.400(0.075)���
0.453(0.073)���
0.323(0.034)���
0.321(0.031)���
-
HL 0.164(0.084)�
0.214(0.080)���
-0.037(0.036)
-0.042(0.024)�
-
R2 0.83 0.82 0.58 0.58 0.39
No. of Obs. 306 318 318 318 318
F-test[country e¤ects](P-value)
- - 31.02(0.000)
39.06(0.000)
122.44(0.000)
Hausman �2(P-value)
- - 176.16(0.000)
48.56(0.000)
8.63(0.034)
LHS: real GDPW. All variables, except dummies, in logs. RHS variables are lagged (5
yeras). Column 1 uses the Sachs and Warner Openness index. Columns 2-5, use the trade
share in GDP. Standard errors in parenthesis (robust, in OLS regressions). Constant not
reported. �, �� and ��� indicate signi�cance at 10%, 5% and 1% level.
Columns (3)-(5) report the results from the LSDV estimator. Column (3) includes all
the right-hand side variables. The interaction term between patent rights and openness
is still positive and signi�cant. On the contrary, the coe¢ cient on country size is now
very small and not statistically di¤erent from zero. This is not surprising, given that
population varies mostly across countries (Table 1 shows that the cross-sectional standard
error of POP is almost three times its mean). It suggests that only the large cross-
sectional variation of country size may have a signi�cant impact on the e¤ectiveness of
IPRs, which is not inconsistent with the theory. Column (4) reports the estimates after
dropping the size variables, whose contribution to explain changes in GDPW over time
has been found statistically small. Finally, Column (5) isolates the e¤ects of patent rights
and trade, the main variables of interest, by dropping all the other covariates. In all cases,
the coe¢ cient on the interaction term between openness and patent rights is consistently
23
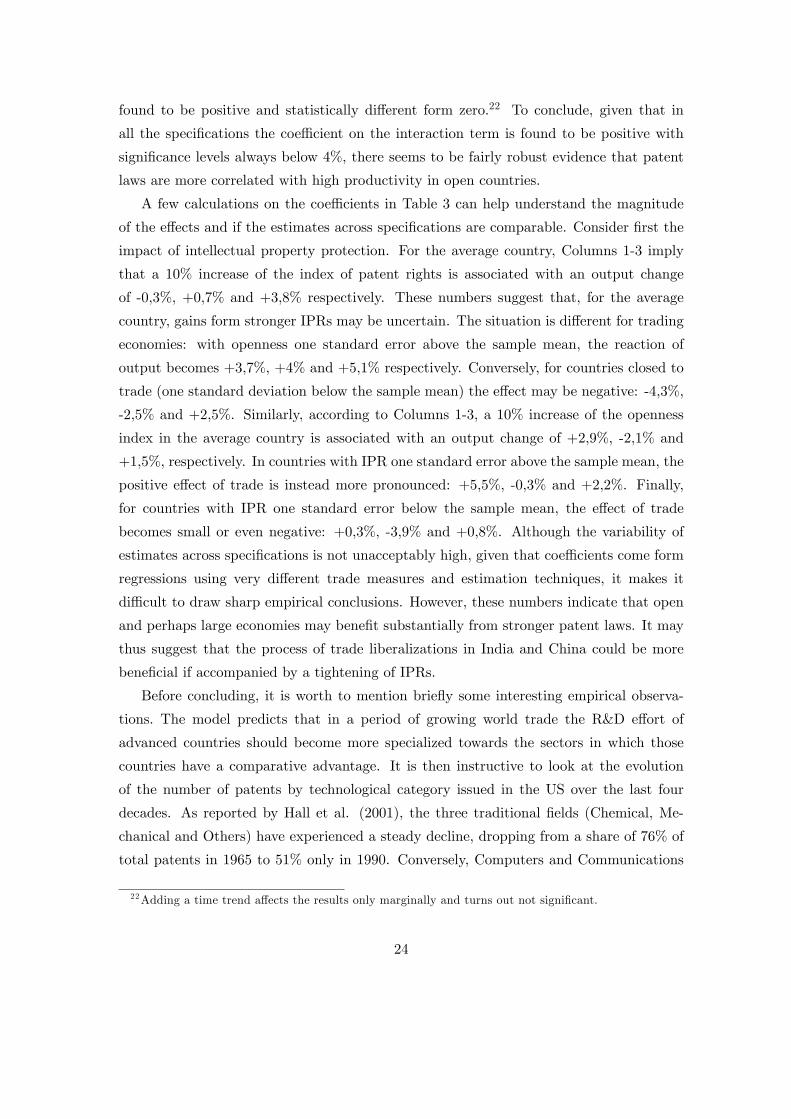
found to be positive and statistically di¤erent form zero.22 To conclude, given that in
all the speci�cations the coe¢ cient on the interaction term is found to be positive with
signi�cance levels always below 4%, there seems to be fairly robust evidence that patent
laws are more correlated with high productivity in open countries.
A few calculations on the coe¢ cients in Table 3 can help understand the magnitude
of the e¤ects and if the estimates across speci�cations are comparable. Consider �rst the
impact of intellectual property protection. For the average country, Columns 1-3 imply
that a 10% increase of the index of patent rights is associated with an output change
of -0,3%, +0,7% and +3,8% respectively. These numbers suggest that, for the average
country, gains form stronger IPRs may be uncertain. The situation is di¤erent for trading
economies: with openness one standard error above the sample mean, the reaction of
output becomes +3,7%, +4% and +5,1% respectively. Conversely, for countries closed to
trade (one standard deviation below the sample mean) the e¤ect may be negative: -4,3%,
-2,5% and +2,5%. Similarly, according to Columns 1-3, a 10% increase of the openness
index in the average country is associated with an output change of +2,9%, -2,1% and
+1,5%, respectively. In countries with IPR one standard error above the sample mean, the
positive e¤ect of trade is instead more pronounced: +5,5%, -0,3% and +2,2%. Finally,
for countries with IPR one standard error below the sample mean, the e¤ect of trade
becomes small or even negative: +0,3%, -3,9% and +0,8%. Although the variability of
estimates across speci�cations is not unacceptably high, given that coe¢ cients come form
regressions using very di¤erent trade measures and estimation techniques, it makes it
di¢ cult to draw sharp empirical conclusions. However, these numbers indicate that open
and perhaps large economies may bene�t substantially from stronger patent laws. It may
thus suggest that the process of trade liberalizations in India and China could be more
bene�cial if accompanied by a tightening of IPRs.
Before concluding, it is worth to mention brie�y some interesting empirical observa-
tions. The model predicts that in a period of growing world trade the R&D e¤ort of
advanced countries should become more specialized towards the sectors in which those
countries have a comparative advantage. It is then instructive to look at the evolution
of the number of patents by technological category issued in the US over the last four
decades. As reported by Hall et al. (2001), the three traditional �elds (Chemical, Me-
chanical and Others) have experienced a steady decline, dropping from a share of 76% of
total patents in 1965 to 51% only in 1990. Conversely, Computers and Communications
22Adding a time trend a¤ects the results only marginally and turns out not signi�cant.
24
rose from 5% to over 20%, Drugs and Medical form 2% to 10%, whereas Electrical and
Electronics is the only stable �eld (16-18% of total). Albeit consistent with the theory,
this evidence may also re�ect technology cycles or changes in demand. On this respect,
note that the model generates something resembling a product cycle, whereby sectors be-
come less technology intensive after they move to the South. Distinguishing empirically
between this prediction and the traditional view, according to which goods become less
technology intensive before moving to LDCs, seem an interesting challenge for future work.
Next, the model suggests that trade opening may trigger a transition in which innovation
is mostly directed towards Northern sectors (to satisfy equation 21) and, at the same time,
economic activity is relocated from the North to the South (z falls as ! rise). Although
collecting speci�c evidence on these phenomena goes beyond the scope of this section,
evidence of skill-biased technical change and outsourcing seems broadly consistent with
these predictions. Finally, the model suggests that market integration may have increased
the income gap between poor and rich nations. While the impact of trade on di¤erent
countries is still a controversial issue, there are empirical works showing that trade may
have contributed to a widening in the world income distribution.23
4 Concluding Remarks
This paper has presented a simple model where market integration may amplify income
di¤erences between rich and poor countries and may lower the world growth rate. Rather
than raising warnings against globalization, the analysis has identi�ed a speci�c market
failure, weak protection of intellectual property in developing countries, under which trade
can have undesirable e¤ects. Its main lesson is that, in a world of integrated economies,
pro�ts from innovations play a crucial role in directing technical progress towards the
needs of all countries and in sustaining long-run growth. Even though the analysis hints
at potential gains from global IPRs regulations, it abstracts from the fact that enforcing
worldwide standards may be costly for LDCs and that the pro�ts from their markets
may fail to provide the proper incentives for such reasons as high transaction costs or
expropriation risk. Given these imperfections, promoting research aimed at the needs of
the less developed countries appears to be a key element for reducing income di¤erences
and fostering world economic growth.
Before concluding, it is worth to mention some limitations and possible extensions of
this paper. The �rst is the lack of welfare analysis. Although the main goal was to illus-
23See, for example, Beaudry et al. (2002) and DeJong and Ripoll (2004).
25
trate a novel mechanism through which North-South trade may a¤ect the world income
distribution and economic growth, it would be in principle desirable to study its e¤ect on
welfare as well. Unfortunately, such an exercise poses serious di¢ culties.24 Second, the
paper is built on the hypothesis that ideas can �ow rapidly across borders and technolog-
ical knowledge (but not productivity) is the same across countries. While this view is not
uncommon and has empirical merits (see, for instance, Acemoglu and Zilibotti, 2001), it
is nonetheless possible that trade itself contributes to technology transfer between coun-
tries.25 Third, infringements of intellectual property rights and �rms�structure have been
modeled in a stylized way. As a consequence, the model is silent on the role played by
multinationals or other organizational forms of production. Incorporating these elements
into the analysis would certainly help understand the complex interactions between inno-
vation, imitation and growth in a global economy and seems a fruitful direction for future
research.
References
[1] Acemoglu, Daron (2003). �Patterns of Skill Premia,�Review of Economic Studies 70,
199-230.
[2] Acemoglu, Daron, Philippe Aghion and Fabrizio Zilibotti (2004). �Distance to Fron-
tier, Selection and Economic Growth�mimeo.
[3] Acemoglu, Daron and Jaume Ventura (2002). �The World Income Distribution�
Quarterly Journal of Economics 117, 659-694.
[4] Acemoglu, Daron and Fabrizio Zilibotti (2001). �Productivity Di¤erences,�Quarterly
Journal of Economics 116, 563-606.
[5] Aghion, Philippe, Robin Burgess, Stephen Redding and Fabrizio Zilibotti (2003).
�The Unequal E¤ects of Liberalization: Theory and Evidence from India� UCL,
mimeo.
24 In this model, welfare comparison across trade regimes would tend to be arbitrary because it is hardto measure comparative advantage and thus the gains from trade. Moreover, a more realistic descriptionof IPRs would be required. Finally, the analysis would be complicated by the need to compute welfarealong non-trivial transitional dynamics. A way to circumvent these problems could be to use a simplertwo-good model along the lines of Saint-Paul (2004).25Evidence on the role of trade in promoting technology transfer is mixed. See Keller (2004) for a survey.
26
[6] Beaudry, Paul, Fabrice Collard and David A. Green (2002). �Decomposing the Twin-
peaks in the World Distribution of Output-per-worker�mimeo, University of British
Columbia
[7] Chin, Judith C. and Gene M. Grossman (1990) �Intellectual Property Rights and
North-South Trade� in The Political Economy of International Trade: Essays in
Honor of Robert E. Baldwin, ed. by R.W. Jones and A.O. Krueger. Cambridge, MA,
Basil Blackwell.
[8] David M. DeJong and Marla Ripoll (2004). �Tari¤s and Growth: an Empirical Ex-
ploration of a Contingent Relationship�mimeo.
[9] Dinopoulos, Elias and Paul Segerstrom (2004). �A Theory of North-South Trade and
Globalization,�Stockholm School of Economics, mimeo
[10] Diwan, Ishac and Dani Rodrik (1991). �Patents, Appropriate Technology, and North-
South Trade,�Journal of International Economics 30, 27-48.
[11] Dornbusch, Rudi, Stanley Fischer and Paul A. Samuelson, (1977) �Comparative Ad-
vantage, Trade and Payments in a Ricardian Model with a Continuum of Goods,�
American Economic Review 67, 823-839.
[12] Galor, Oded and Andrew Mountford (2003). �Trading Population for Productivity�
mimeo, Brown University.
[13] Gancia, Gino and Fabrizio Zilibotti (2004). �Horizontal Innovation in the Theory of
Growth and Development�forthcoming in: Handbook of Economic Growth, P. Aghion
and S. Durlauf editors.
[14] Ginarte, Juan C. and Walter G. Park (1997). �Determinants of Patent Rights: A
Cross-National Study,�Research Policy 26, 283-301.
[15] Goh, Ai-Ting and Jacques Olivier (2002). �Free Trade and Protection of Intellectual
Property Rights: Can We Have One Without the Other?� CEPR Discussion Paper
No. 3127.
[16] Gould, M. David and William C. Gruben (1996). �The Role of Intellectual Property
Rights in Economic Growth,�Journal of Development Economics 48, 323-350.
[17] Grossman, Gene M. and Edwin L. C. Lai (2004). �International Protection of Intel-
lectual Property,�American Economic Review, 94.
27
[18] Hall, Bronwyn H., Adam B. Ja¤e and Manuel Trajtenberg (2001). �The NBER Patent
Citations Data File: Lessons, insights and Methodological Tools,�NBER WP8498.
[19] Helpman, Elhanan (1993). �Innovation, Imitation and Intellectual Property Rights,�
Econometrica 61, 1247-1280
[20] Ja¤e, Adam B., Manuel Trajtenberg and Rebecca Henderson (1993). �Geographic
Localization of Knowledge Spillovers as Evidenced by Patent Citations,�Quarterly
Journal of Economics 108 577-598.
[21] Keller, Wolfgang (2004). �International Technology Di¤usion,�Journal of Economic
Literature 42, 752-782.
[22] Lai, Edwin L. C. (1998). �International Intellectual Property Rights Protection and
the Rate of Product Innovation,�Journal of Development Economics 55, 115-130.
[23] Rapp, Richard T. and Richard P. Rozek (1990).�Bene�ts and Costs of Intellectual
Property Protection in Developing Countries�Journal of World Trade 24, 74-102.
[24] Sachs, Je¤rey D. and Andrew Warner (1995). �Economic Reform and the Process of
Global Integration,�Brookings Papers on Economic Activity 1995, 1-95.
[25] Saint-Paul, Gilles (2004). �Welfare E¤ects of Intellectual Property in a North-South
Model of Endogenous Growth with Comparative Advantage�University of Toulouse,
mimeo.
[26] Taylor, Scott M. (1994) �TRIPs Trade and Growth,�International Economic Review
35, 361-381.
[27] Yang, Guifang and Keith E. Maskus (2001). �Intellectual property rights, licensing
and innovation in an endogenous product-cycle model�Journal of International Eco-
nomics 53, 169-187.
[28] Young, Alwyn (1991) �Learning by Doing and the Dynamic E¤ects of International
Trade,�Quarterly Journal of Economics 101, 396-405.
28
5 Appendix
5.1 Optimality of technologies
Consider �rst the case of no IPRs protection in S, (� = 0). Total production in the North
is equal to YN = wNLN=�. Using (9):
Maxfa(i)gYN = LN
�Z 1
0[N (i)�N (i)]
� di
�1=�s:t:
Z 1
0N (i) di = N
The solution to this program has to satisfy the following �rst order conditions (FOCs),
8i 2 [0; 1]:
LN
�Z 1
0[N (i)�N (i)]
� di
� 1���
[N (i)�N (i)]��1 �N (i) = �
where � is the lagrange multiplier associated to the constraint. Taking the ratio of any two
FOCs and using AN (i) = N (i)�N (i) yields equation (13). This proves that the sectoral
pro�le of the endogenous technology maximizes Northern output and wage and hence it
is optimal for the North.
Consider now the case of imperfect protection of IPRs in S, (� 6= 0).
Maxfa(i)gYN + �YS = LN
�Z 1
0[N (i)�N (i)]
� di
�1=�+ �LS
�Z 1
0[N (i)�S(i)]
� di
�1=�s:t:
Z 1
0NN (i) di = a
the FOCs for a maximum are, 8i 2 [0; 1]:
LN
nR 10 [N (i)�N (i)]
� dio 1��
�[N (i)�N (i)]
��1 �N (i)+
�LS
nR 10 [N (i)�S(i)]
� dio 1��
�[N (i)�S(i)]
��1 �S(i) = �
where � is the lagrange multiplier associated to the constraint. Using (9) and solving for
N (i):
a (i) =
"LN�N (i)
� (wN )1�� + �LS�S (i)
� (wS)1��
��
#1=(1��)Comparing this condition with equation (16) in the text shows that the sectoral distribu-
tion of the endogenous technology maximizes a weighted sum of Northern and Southern
aggregate output, with a weight of � on the South. As LN= (�LS) ! 0, technologies
maximize wS , whereas as LN= (�LS)!1 they maximize wN .
29
5.2 Properties of the wage ratio in autarky
To show that the North-South wage ratio in autarky is bounded by max f�N (i) =�S (i)g =�N (0) =�S (0), �rst note that @!=@�N (i) > 0 and @!=@�S (i) < 0. Therefore, by con-
struction:
! =
" R 10 �N (i)
�=(1��) diR 10 �N (i)
�2=(1��) �S (i)� di
#1=��" R 1
0 max�N�=(1��)diR 1
0 max�N�2=(1��)min�S
�di
#1=�=�N (0)
�S (0)
5.3 The growth rate under free-trade
Rewrite the free entry condition in R&D for a Northern sector (�N (i) =r = �) as:
wN�N (i)LNAN (i)��1
�R z0 AN (j)
� dj= r
use (7) to substitute for wN . Rearrange it to get:
p(i)1�� =
��N (i)LNAN (i)
�
rR z0 AN (j)
� dj
��
use AN (j) = AN (i)h�N (j)�N (i)
i1=(1��)to eliminate AN (i). Integrate i over the interval [0; 1],
use (3) and rearrange:
r =
((LN )
�
�Z z
0�N (i)
�1�� di
�1��+ (�LS)
�
�Z 1
z�S (i)
�1�� di
�1��)1=�
Finally, use (22) to substitute forR 1z �S (i)
�=(1��) di. The Euler equation g = r � � thenyields equation (23) in the text.
30