global sustainability report 2016 - abbott …...detailed co environmental performance 2 e emissions...
TRANSCRIPT

GLOBALSUSTAINABILITY
REPORT 2016
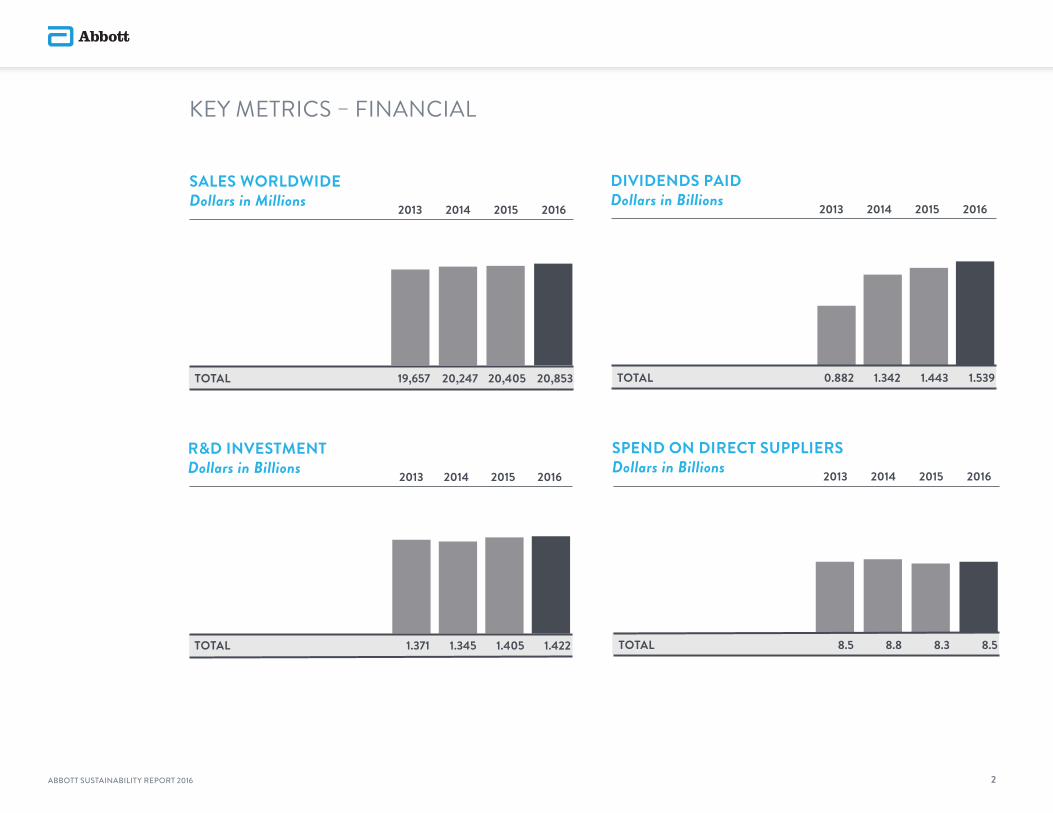
KEY METRICS – FINANCIAL
2016
DIVIDENDS PAIDDollars in Billions 2013 2014 2015
TOTAL 0.882 1.5391.342 1.443
SALES WORLDWIDEDollars in Millions 2013 2014 2015 2016
TOTAL 19,657 20,247 20,405 20,853
2016
R&D INVESTMENTDollars in Billions 2013 2014 2015
TOTAL 1.371 1.345 1.405 1.422
2016
SPEND ON DIRECT SUPPLIERSDollars in Billions 2013 2014 2015
TOTAL 8.5 8.8 8.3 8.5
ABBOTT SUSTAINABILITY REPORT 2016 2

U.S. EMPLOYEE GIVING CAMPAIGN RESULTSDollars in Millions 2013 2014 2015
TOTAL $4.1 $4.1 $4.1 $5.6
2016
KEY METRICS – SOCIAL
SOCIAL INVESTINGDollars in Millions 2013 2014
TOTAL $56.6 $49.5
2015
$37.0 $36.9
2016
EMPLOYEES2013 2014
TOTAL
45%
27%
46%
27%
46% 47%
29% 31%
69,000 73,000
2015 2016
74,000 94,000
% of Women in Management (U.S.)
% of Minorities in Management (U.S.)
ABBOTT SUSTAINABILITY REPORT 2016 3
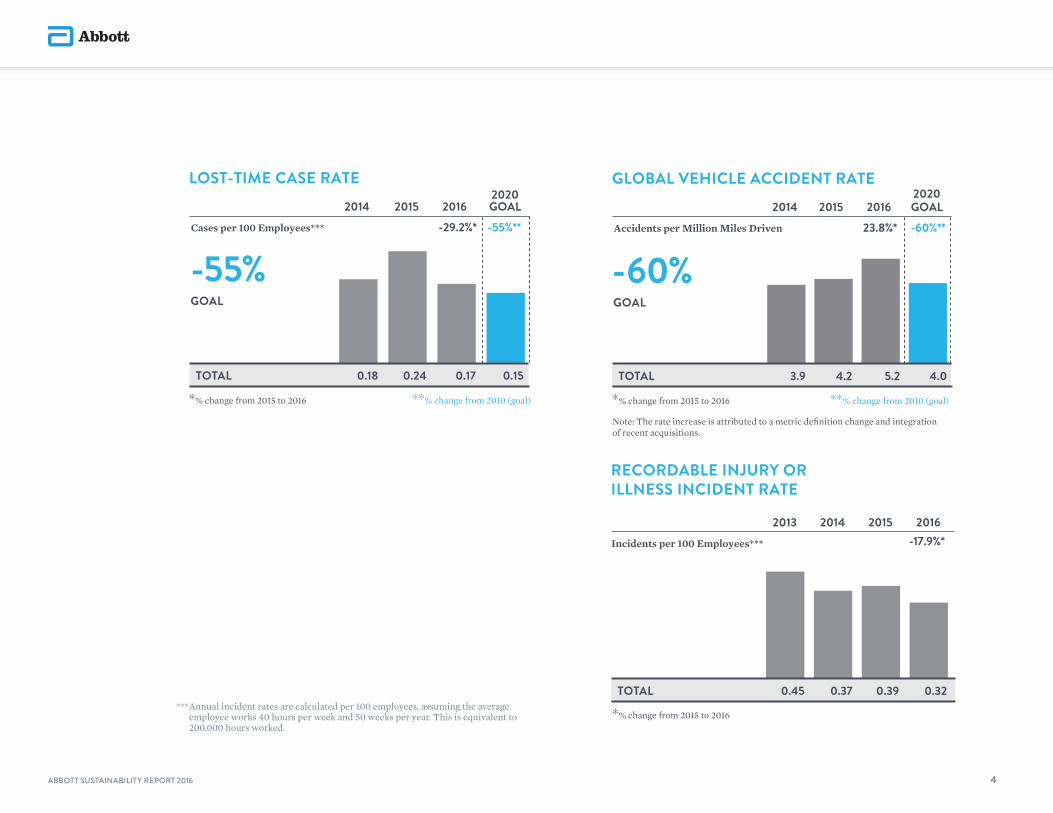
LOST-TIME CASE RATE
GOAL
2014 2015 20162020GOAL
TOTAL 0.18 0.24 0.17 0.15
Cases per 100 Employees***
-55%-29.2%* -55%**
*% change from 2015 to 2016 **% change from 2010 (goal)
GLOBAL VEHICLE ACCIDENT RATE20152014 2016
2020GOAL
TOTAL 3.9 4.2 5.2 4.0
Accidents per Million Miles Driven 23.8%* -60%**
GOAL
-60%
*% change from 2015 to 2016
Note: The rate increase is attributed to a metric definition change and integrationof recent acquisitions.
**% change from 2010 (goal)
RECORDABLE INJURY OR ILLNESS INCIDENT RATE
2013 2014 2015 2016
TOTAL 0.45 0.37 0.39 0.32
Incidents per 100 Employees*** -17.9%*
*% change from 2015 to 2016*** Annual incident rates are calculated per 100 employees, assuming the average
employee works 40 hours per week and 50 weeks per year. This is equivalent to 200,000 hours worked.
ABBOTT SUSTAINABILITY REPORT 2016 4

KEY METRICS – ENVIRONMENTAL
CO2e EMISSIONS (Region-Based Emission Factors)
2010† 2014 2015 2016
1,164 1,033 1,000TOTAL (Scope 1 and Scope 2) CO2e Emissions 1,002
0.20%*
531 471Purchased Fuels (Scope 1) CO2e Emissions(1)
Refrigerant (Scope 1) CO2e Emissions(3)
Total Direct (Scope 1) CO2e Emissions
Total Purchased Energy (Scope 2) CO2e Emissions(2)
8 9
539 480
626 554
465
11 14
476
524
471
485
517
*% change from 2015 to 2016†Baseline year
Purchased Energy (Scope 2) CO2e Emissions Utilizing Scope 2 Market-Based Method NA NA 554 547Total (Scope 1 and Scope 2) CO2e Emissions Utilizing Scope 2 Market-Based Method NA NA 1,030 1,032
1,000 Metric Tons
Direct (Scope 1) CO2e Emissions
26 26
CO2e EMISSIONS
2010† 2014 20152020GOAL2016
23 23
TOTAL (Scope 1 and Scope 2) CO2e Emissions
Purchased Energy (Scope 2) CO2e Emissions
49
36
31
67 49
25
23
48 39
-1.95%* -40%**
*% change from 2015 to 2016†Baseline year
**% change from 2010 (goal)
Metric Tons per $ Million Sales
-40%Normalized by Sales
GOAL
ABBOTT SUSTAINABILITY REPORT 2016 5
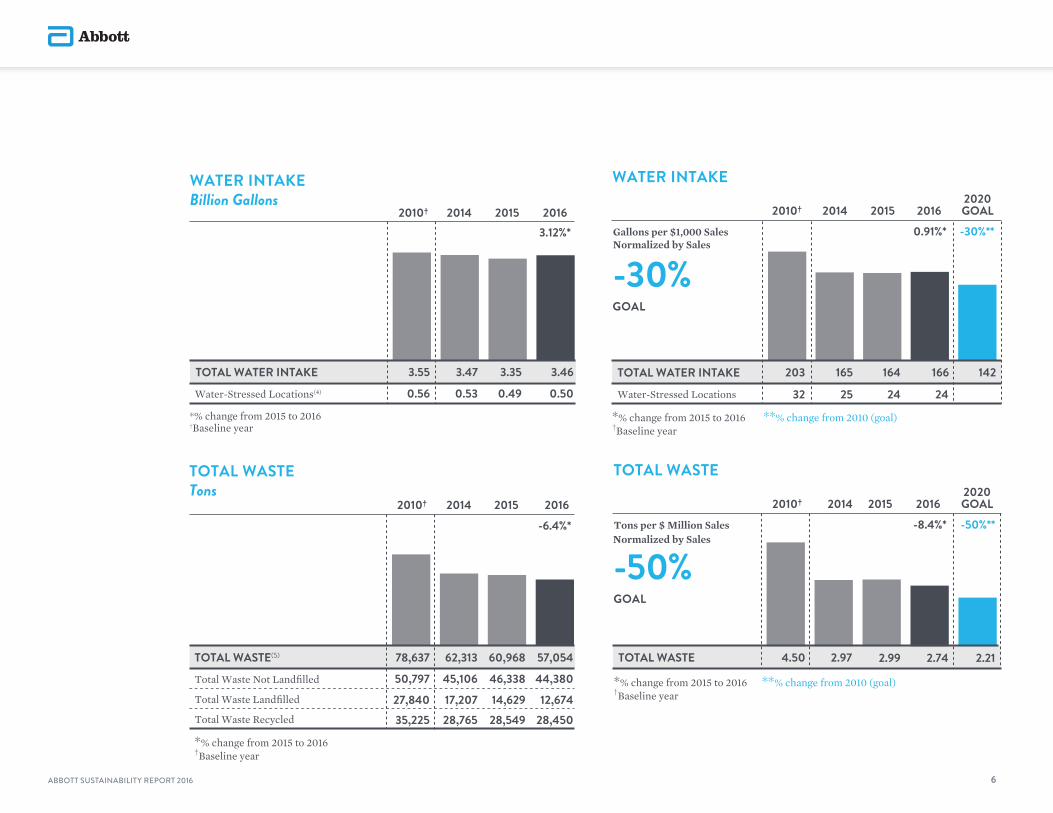
2014 2015
TOTAL WATER INTAKE
0.56 0.53 0.49Water-Stressed Locations(4)
*% change from 2015 to 2016†Baseline year
3.55 3.47 3.35
0.50
3.46
20163.12%*
2010†
WATER INTAKEBillion Gallons
TOTAL WASTETons
2010† 2014 2015 2016
50,797 45,106Total Waste Not Landfilled
27,840 17,207Total Waste Landfilled
35,225 28,765Total Waste Recycled
*% change from 2015 to 2016†Baseline year
78,637 62,313
46,338
14,62928,549
60,968
44,380
12,67428,450
57,054
-6.4%*
TOTAL WASTE(5)
TOTAL WATER INTAKE
Water-Stressed Locations
*% change from 2015 to 2016†Baseline year
**% change from 2010 (goal)
203 165 164 166
WATER INTAKE
20142010† 2015 20162020GOAL
32 25 24 24
142
Gallons per $1,000 SalesNormalized by Sales
0.91%* -30%**
GOAL
-30%
2.974.50 2.99 2.74 2.21
TOTAL WASTE
2010† 2014 2015 20162020GOAL
Tons per $ Million Sales
-50%-8.4%* -50%**
Normalized by Sales
GOAL
*% change from 2015 to 2016†Baseline year
**% change from 2010 (goal)
TOTAL WASTE
ABBOTT SUSTAINABILITY REPORT 2016 6
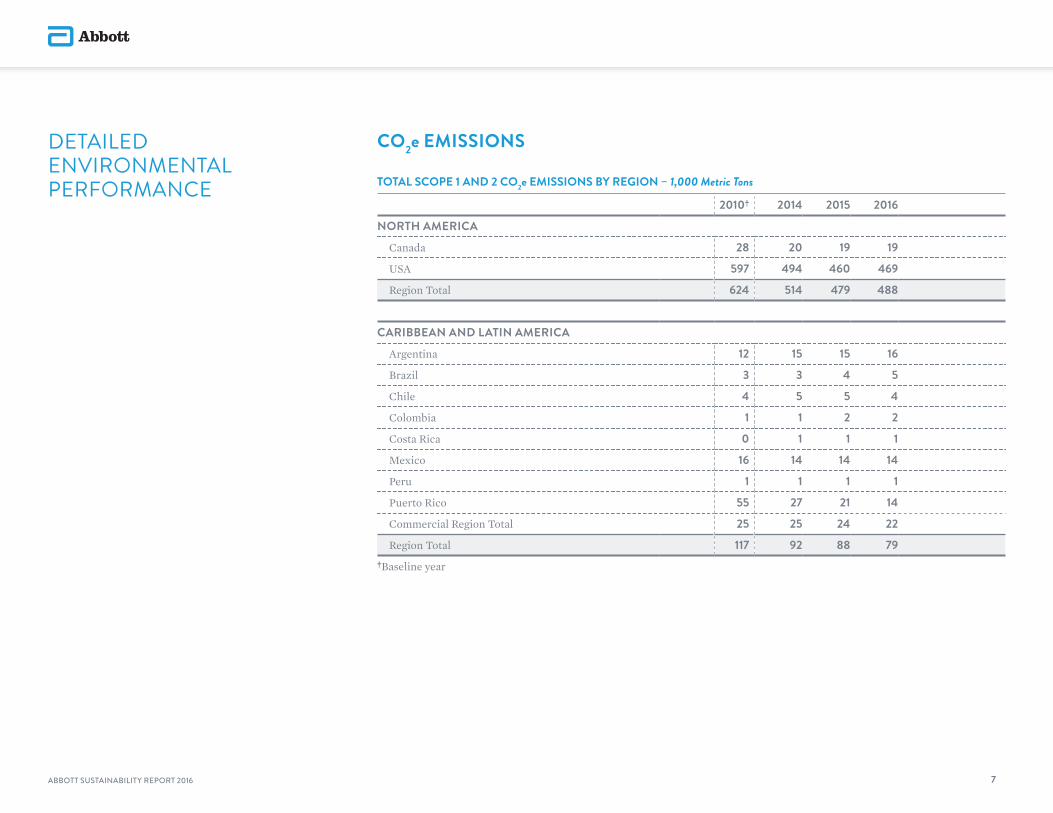
DETAILED ENVIRONMENTAL PERFORMANCE
CO2e EMISSIONS
TOTAL SCOPE 1 AND 2 CO2e EMISSIONS BY REGION – 1,000 Metric Tons
2010† 2014 2015 2016
NORTH AMERICA
Canada 28 20 19 19
USA 597 494 460 469
Region Total 624 514 479 488
CARIBBEAN AND LATIN AMERICA
Argentina 12 15 15 16
Brazil 3 3 4 5
Chile 4 5 5 4
Colombia 1 1 2 2
Costa Rica 0 1 1 1
Mexico 16 14 14 14
Peru 1 1 1 1
Puerto Rico 55 27 21 14
Commercial Region Total 25 25 24 22
Region Total 117 92 88 79†Baseline year
ABBOTT SUSTAINABILITY REPORT 2016 7
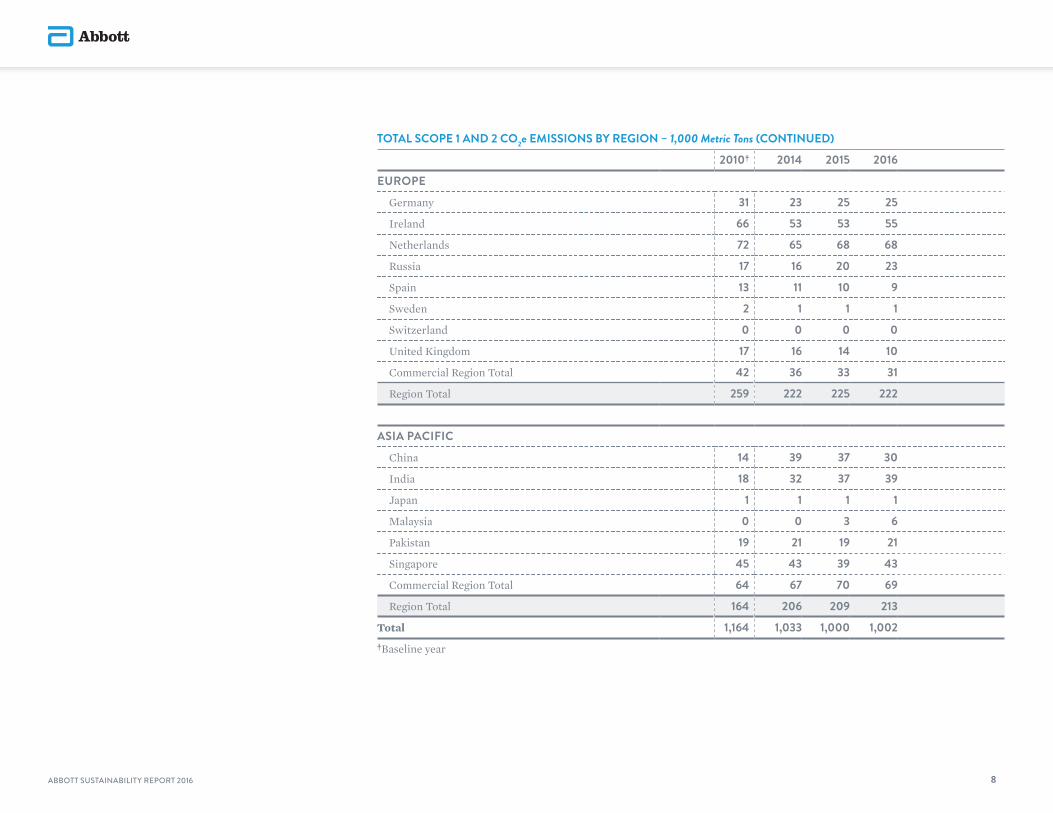
TOTAL SCOPE 1 AND 2 CO2e EMISSIONS BY REGION – 1,000 Metric Tons (CONTINUED)
2010† 2014 2015 2016
EUROPE
Germany 31 23 25 25
Ireland 66 53 53 55
Netherlands 72 65 68 68
Russia 17 16 20 23
Spain 13 11 10 9
Sweden 2 1 1 1
Switzerland 0 0 0 0
United Kingdom 17 16 14 10
Commercial Region Total 42 36 33 31
Region Total 259 222 225 222
ASIA PACIFIC
China 14 39 37 30
India 18 32 37 39
Japan 1 1 1 1
Malaysia 0 0 3 6
Pakistan 19 21 19 21
Singapore 45 43 39 43
Commercial Region Total 64 67 70 69
Region Total 164 206 209 213
Total 1,164 1,033 1,000 1,002†Baseline year
ABBOTT SUSTAINABILITY REPORT 2016 8

CO2e EMISSIONS – DIRECT EMISSIONS (SCOPE 1) BY REGION – 1,000 Metric Tons
2010† 2014 2015 2016
NORTH AMERICA
Canada 14 11 11 11
USA 270 224 214 218
Region Total 285 235 225 229
CARIBBEAN AND LATIN AMERICA
Argentina 6 7 7 7
Brazil 2 2 2 2
Chile 1 1 1 0
Colombia 0 0 0 0
Costa Rica 0 0 0 0
Mexico 15 14 14 14
Peru 0 0 0 0
Puerto Rico 2 1 0 0
Commercial Region Total 23 23 22 21
Region Total 49 48 47 45†Baseline year
ABBOTT SUSTAINABILITY REPORT 2016 9

CO2e EMISSIONS – DIRECT EMISSIONS (SCOPE 1) BY REGION – 1,000 Metric Tons (CONTINUED)
2010† 2014 2015 2016
EUROPE
Germany 11 9 10 13
Ireland 38 27 30 31
Netherlands 41 33 34 32
Russia 13 10 12 14
Spain 5 4 5 6
Sweden 0 0 0 0
Switzerland 0 0 0 0
United Kingdom 5 5 4 3
Commercial Region Total 26 26 25 24
Region Total 139 114 119 123
ASIA PACIFIC
China 1 13 13 9
India 1 4 9 11
Indonesia 0 1 1 1
Japan 0 0 0 0
Malaysia 0 0 0 0
Pakistan 16 18 17 18
Singapore 18 18 17 21
Commercial Region Total 29 29 29 28
Region Total 66 84 85 88
Total 539 480 476 485†Baseline year
ABBOTT SUSTAINABILITY REPORT 2016 10

CO2e EMISSIONS – PURCHASED ENERGY (SCOPE 2) BY REGION – 1,000 Metric Tons
2010† 2014 2015 2016
NORTH AMERICA
Canada 13 9 8 8
USA 327 271 245 251
Region Total 340 280 254 259
CARIBBEAN AND LATIN AMERICA
Argentina 6 8 8 9
Brazil 1 1 2 2
Chile 3 4 4 3
Colombia 1 1 2 2
Costa Rica 0 1 1 1
Mexico 0 0 0 0
Peru 1 1 1 1
Puerto Rico 53 26 20 14
Commercial Region Total 2 2 2 1
Region Total 68 44 41 34†Baseline year
ABBOTT SUSTAINABILITY REPORT 2016 11
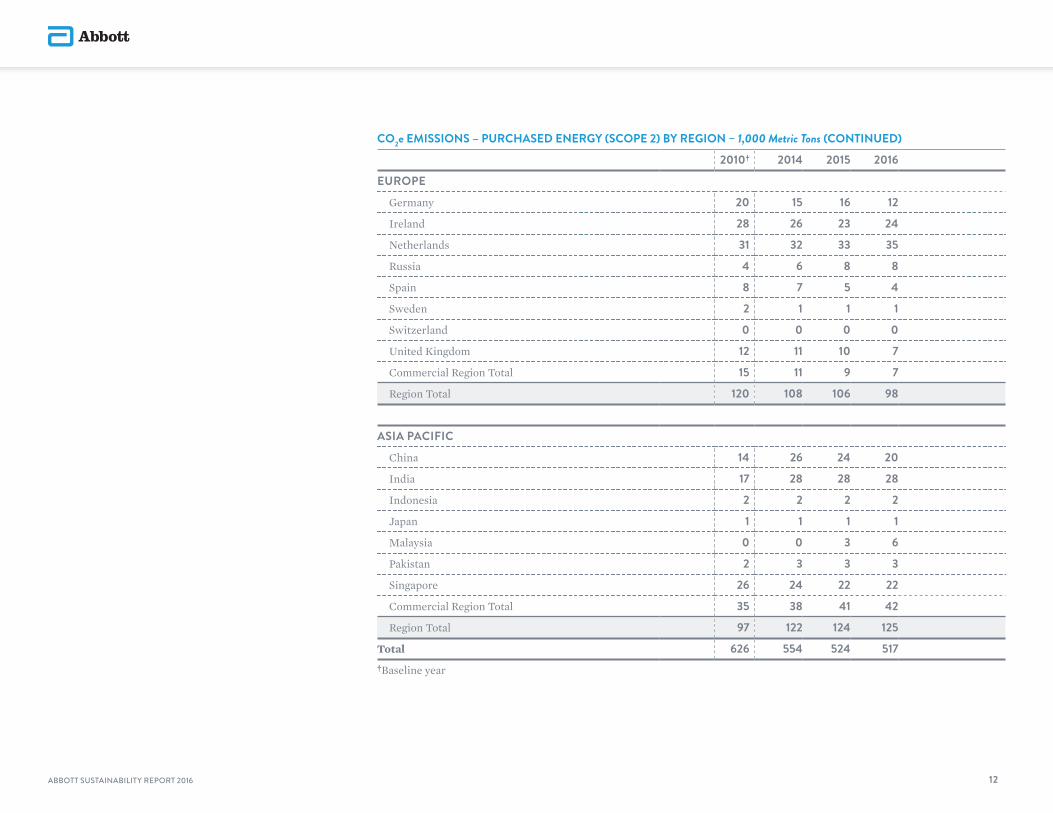
CO2e EMISSIONS – PURCHASED ENERGY (SCOPE 2) BY REGION – 1,000 Metric Tons (CONTINUED)
2010† 2014 2015 2016
EUROPE
Germany 20 15 16 12
Ireland 28 26 23 24
Netherlands 31 32 33 35
Russia 4 6 8 8
Spain 8 7 5 4
Sweden 2 1 1 1
Switzerland 0 0 0 0
United Kingdom 12 11 10 7
Commercial Region Total 15 11 9 7
Region Total 120 108 106 98
ASIA PACIFIC
China 14 26 24 20
India 17 28 28 28
Indonesia 2 2 2 2
Japan 1 1 1 1
Malaysia 0 0 3 6
Pakistan 2 3 3 3
Singapore 26 24 22 22
Commercial Region Total 35 38 41 42
Region Total 97 122 124 125
Total 626 554 524 517†Baseline year
ABBOTT SUSTAINABILITY REPORT 2016 12

WATER INTAKE
WATER INTAKE BY REGION – Billion Gallons
2010† 2014 2015 2016
NORTH AMERICA
Canada 0.22 0.16 0.17 0.16
USA 1.81 1.75 1.66 1.81
Region Total 2.04 1.91 1.83 1.98
CARIBBEAN AND LATIN AMERICA
Argentina 0.08 0.09 0.09 0.09
Brazil 0.01 0.01 0.01 0.01
Chile 0.02 0.02 0.02 0.02
Colombia 0.01 0.01 0.01 0.02
Costa Rica 0.00 0.01 0.01 0.01
Mexico 0.04 0.03 0.03 0.02
Peru 0.01 0.01 0.01 0.01
Puerto Rico 0.15 0.08 0.05 0.04
Region Total 0.32 0.27 0.23 0.22†Baseline year
ABBOTT SUSTAINABILITY REPORT 2016 13
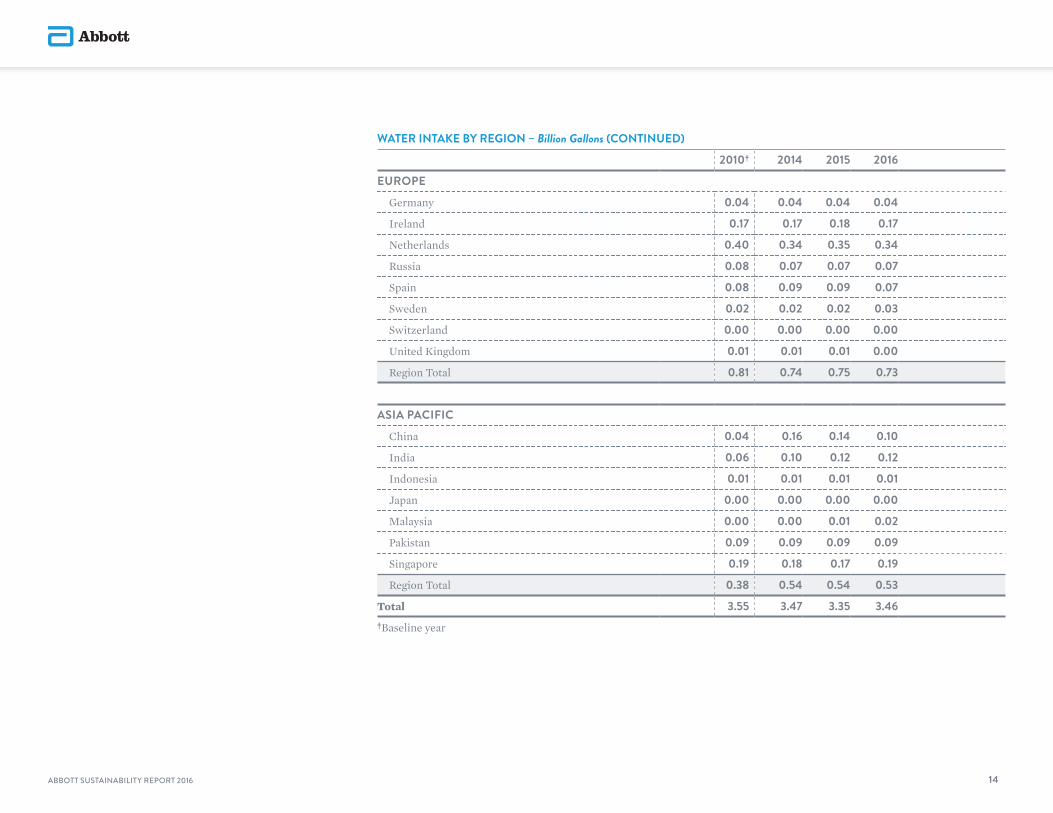
WATER INTAKE BY REGION – Billion Gallons (CONTINUED)
2010† 2014 2015 2016
EUROPE
Germany 0.04 0.04 0.04 0.04
Ireland 0.17 0.17 0.18 0.17
Netherlands 0.40 0.34 0.35 0.34
Russia 0.08 0.07 0.07 0.07
Spain 0.08 0.09 0.09 0.07
Sweden 0.02 0.02 0.02 0.03
Switzerland 0.00 0.00 0.00 0.00
United Kingdom 0.01 0.01 0.01 0.00
Region Total 0.81 0.74 0.75 0.73
ASIA PACIFIC
China 0.04 0.16 0.14 0.10
India 0.06 0.10 0.12 0.12
Indonesia 0.01 0.01 0.01 0.01
Japan 0.00 0.00 0.00 0.00
Malaysia 0.00 0.00 0.01 0.02
Pakistan 0.09 0.09 0.09 0.09
Singapore 0.19 0.18 0.17 0.19
Region Total 0.38 0.54 0.54 0.53
Total 3.55 3.47 3.35 3.46†Baseline year
ABBOTT SUSTAINABILITY REPORT 2016 14
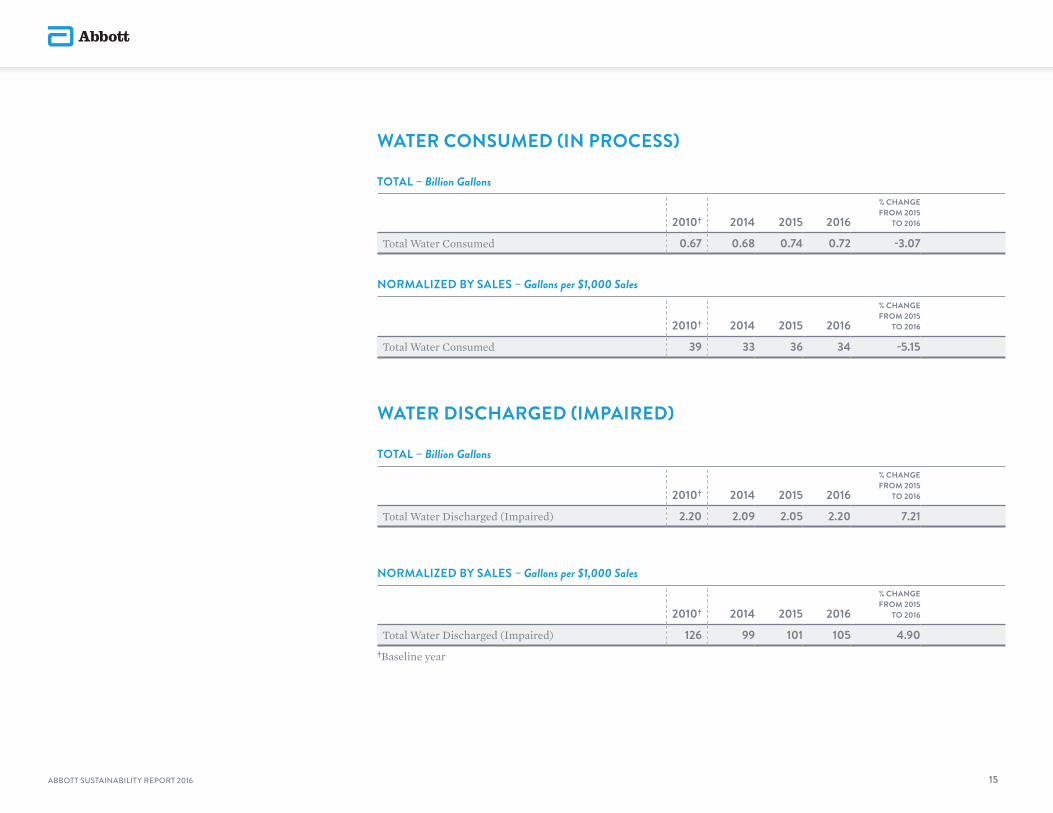
WATER CONSUMED (IN PROCESS)
TOTAL – Billion Gallons
2010† 2014 2015 2016
% CHANGE FROM 2015
TO 2016
Total Water Consumed 0.67 0.68 0.74 0.72 -3.07
NORMALIZED BY SALES – Gallons per $1,000 Sales
2010† 2014 2015 2016
% CHANGE FROM 2015
TO 2016
Total Water Consumed 39 33 36 34 -5.15
WATER DISCHARGED (IMPAIRED)
TOTAL – Billion Gallons
2010† 2014 2015 2016
% CHANGE FROM 2015
TO 2016
Total Water Discharged (Impaired) 2.20 2.09 2.05 2.20 7.21
NORMALIZED BY SALES – Gallons per $1,000 Sales
2010† 2014 2015 2016
% CHANGE FROM 2015
TO 2016
Total Water Discharged (Impaired) 126 99 101 105 4.90†Baseline year
ABBOTT SUSTAINABILITY REPORT 2016 15
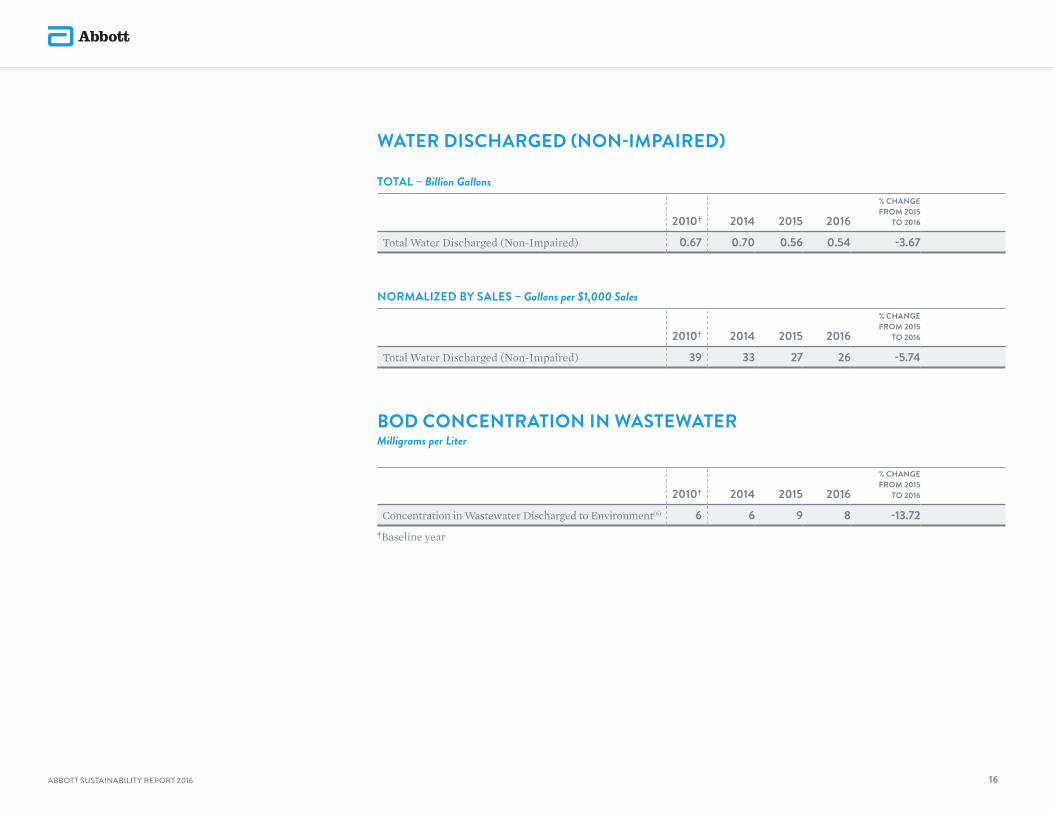
WATER DISCHARGED (NON-IMPAIRED)
TOTAL – Billion Gallons
2010† 2014 2015 2016
% CHANGE FROM 2015
TO 2016
Total Water Discharged (Non-Impaired) 0.67 0.70 0.56 0.54 -3.67
NORMALIZED BY SALES – Gallons per $1,000 Sales
2010† 2014 2015 2016
% CHANGE FROM 2015
TO 2016
Total Water Discharged (Non-Impaired) 39 33 27 26 -5.74
BOD CONCENTRATION IN WASTEWATER Milligrams per Liter
2010† 2014 2015 2016
% CHANGE FROM 2015
TO 2016
Concentration in Wastewater Discharged to Environment(6) 6 6 9 8 -13.72†Baseline year
ABBOTT SUSTAINABILITY REPORT 2016 16
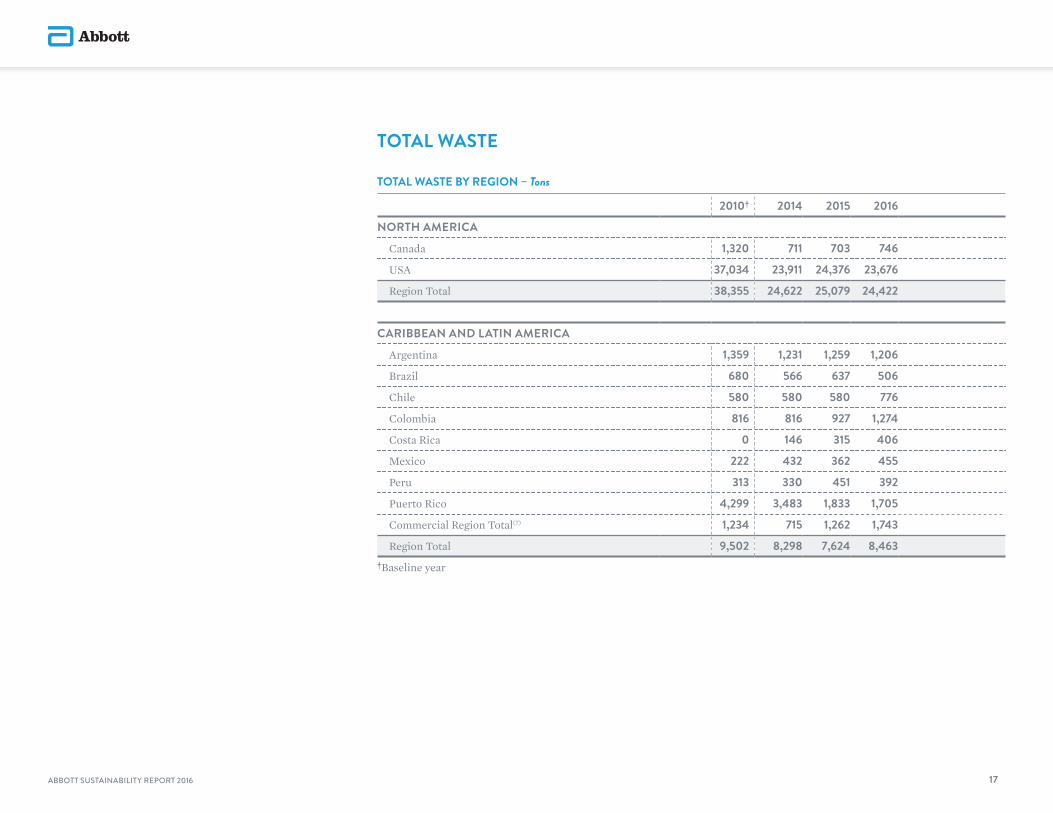
TOTAL WASTE
TOTAL WASTE BY REGION – Tons
2010† 2014 2015 2016
NORTH AMERICA
Canada 1,320 711 703 746
USA 37,034 23,911 24,376 23,676
Region Total 38,355 24,622 25,079 24,422
CARIBBEAN AND LATIN AMERICA
Argentina 1,359 1,231 1,259 1,206
Brazil 680 566 637 506
Chile 580 580 580 776
Colombia 816 816 927 1,274
Costa Rica 0 146 315 406
Mexico 222 432 362 455
Peru 313 330 451 392
Puerto Rico 4,299 3,483 1,833 1,705
Commercial Region Total(7) 1,234 715 1,262 1,743
Region Total 9,502 8,298 7,624 8,463†Baseline year
ABBOTT SUSTAINABILITY REPORT 2016 17

TOTAL WASTE BY REGION – Tons (CONTINUED)
2010† 2014 2015 2016
EUROPE
Germany 2,158 2,360 2,310 2,693
Ireland 5,216 4,529 3,990 4,511
Netherlands 8,724 7,734 4,933 4,593
Russia 1,206 979 901 1,003
Spain 1,038 891 1,520 1,305
Sweden 407 406 464 112
Switzerland 79 92 36 40
United Kingdom 1,260 1,050 1,044 1,195
Commercial Region Total(7) 1,464 1,434 1,876 1,225
Region Total 21,552 19,476 17,074 16,677
ASIA PACIFIC
China 446 2,146 2,163 1,040
India 2,063 3,145 4,147 2,244
Indonesia 205 29 23 16
Japan 498 383 486 400
Malaysia 0 0 0 85
Pakistan 1,257 842 658 647
Singapore 3,993 2,068 3,090 2,654
Commercial Region Total(7) 766 1,305 625 405
Region Total 9,227 9,917 11,191 7,491
Total 78,637 62,313 60,968 57,054†Baseline year
ABBOTT SUSTAINABILITY REPORT 2016 18

HAZARDOUS WASTE
TOTAL – Tons
2010† 2014 2015 2016
% CHANGE FROM 2015
TO 2016
Hazardous Waste Not Landfilled 9,605 8,400 5,646 5,576 -1.2
Hazardous Waste Landfilled 723 951 839 643 -23.4
Total Hazardous Waste 10,328 9,350 6,485 6,220 -4.1
NORMALIZED BY SALES – Tons per $ Million Sales
2010† 2014 2015 2016
% CHANGE FROM 2015
TO 2016
Total Hazardous Waste 0.59 0.45 0.32 0.30 -6.2†Baseline year
ABBOTT SUSTAINABILITY REPORT 2016 19

HAZARDOUS WASTE BY REGION – Tons
2010† 2014 2015 2016
NORTH AMERICA
Canada 150 151 141 145
USA 1,111 821 723 656
Region Total 1,262 972 863 800
CARIBBEAN AND LATIN AMERICA
Argentina 603 615 661 564
Brazil 117 113 167 121
Chile 237 237 237 330
Colombia 198 198 231 181
Costa Rica 0 25 53 42
Mexico 33 67 66 116
Peru 79 96 150 113
Puerto Rico 1,605 1,436 93 82
Commercial Region Total(7) 163 56 216 187
Region Total 3,034 2,844 1,874 1,736†Baseline year
ABBOTT SUSTAINABILITY REPORT 2016 20

HAZARDOUS WASTE BY REGION – Tons (CONTINUED)
2010† 2014 2015 2016
EUROPE
Germany 486 491 517 967
Ireland 536 405 379 447
Netherlands 3,284 3,092 1,432 1,418
Russia 294 294 225 177
Spain 15 11 14 7
Sweden 308 316 348 13
Switzerland 2 3 0 0
United Kingdom 481 208 189 84
Commercial Region Total(7) 198 315 227 94
Region Total 5,604 5,135 3,330 3,207
ASIA PACIFIC
China 9 26 15 27
India 264 183 236 286
Indonesia 7 7 11 8
Japan 18 8 10 14
Malaysia 0 0 0 8
Pakistan 65 27 79 105
Singapore 24 47 51 12
Commercial Region Total(7) 41 101 16 16
Region Total 428 399 418 476
Total 10,328 9,350 6,485 6,220†Baseline year
ABBOTT SUSTAINABILITY REPORT 2016 21

NON-HAZARDOUS WASTE
TOTAL – Tons
2010† 2014 2015 2016
% CHANGE FROM 2015
TO 2016
Non-Hazardous Waste Not Landfilled 41,192 36,706 40,692 38,803 -4.6
Non-Hazardous Waste Landfilled 27,117 16,256 13,790 12,031 -12.8
Total Non-Hazardous Waste 68,309 52,962 54,482 50,834 -6.7
NORMALIZED BY SALES – Tons per $ Million Sales
2010† 2014 2015 2016
% CHANGE FROM 2015
TO 2016
Total Non-Hazardous Waste 3.91 2.52 2.67 2.44 -8.7†Baseline year
ABBOTT SUSTAINABILITY REPORT 2016 22
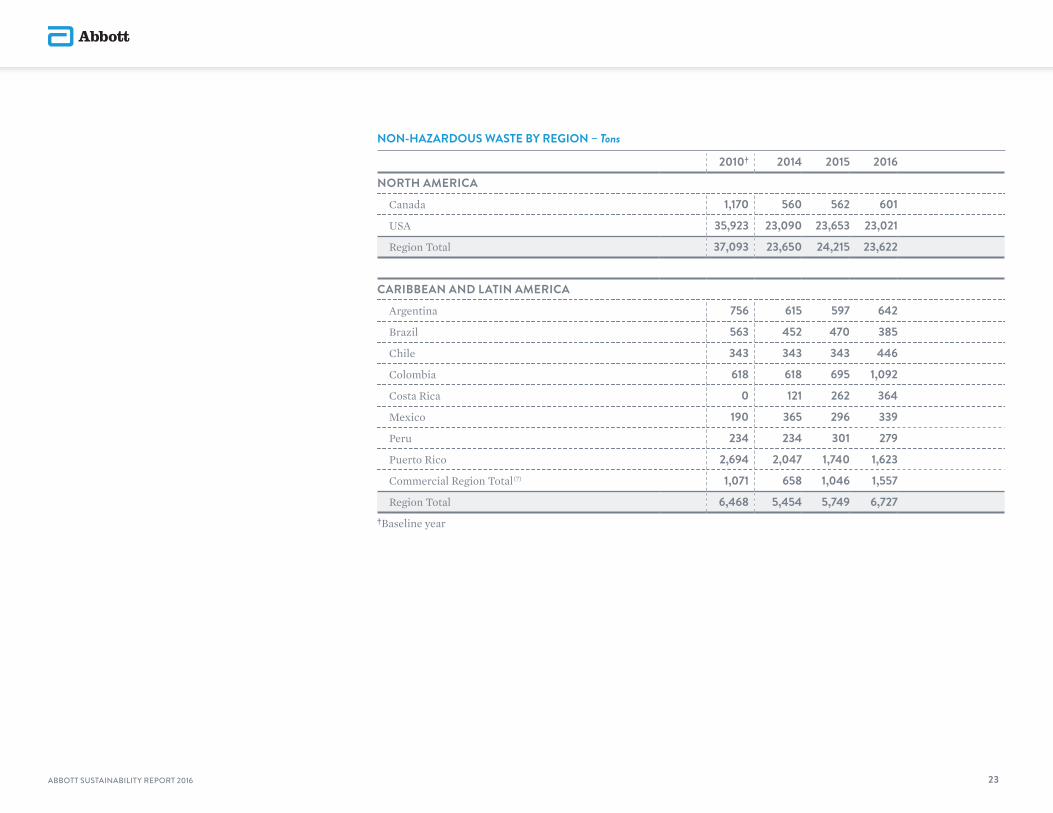
NON-HAZARDOUS WASTE BY REGION – Tons
2010† 2014 2015 2016
NORTH AMERICA
Canada 1,170 560 562 601
USA 35,923 23,090 23,653 23,021
Region Total 37,093 23,650 24,215 23,622
CARIBBEAN AND LATIN AMERICA
Argentina 756 615 597 642
Brazil 563 452 470 385
Chile 343 343 343 446
Colombia 618 618 695 1,092
Costa Rica 0 121 262 364
Mexico 190 365 296 339
Peru 234 234 301 279
Puerto Rico 2,694 2,047 1,740 1,623
Commercial Region Total(7) 1,071 658 1,046 1,557
Region Total 6,468 5,454 5,749 6,727†Baseline year
ABBOTT SUSTAINABILITY REPORT 2016 23
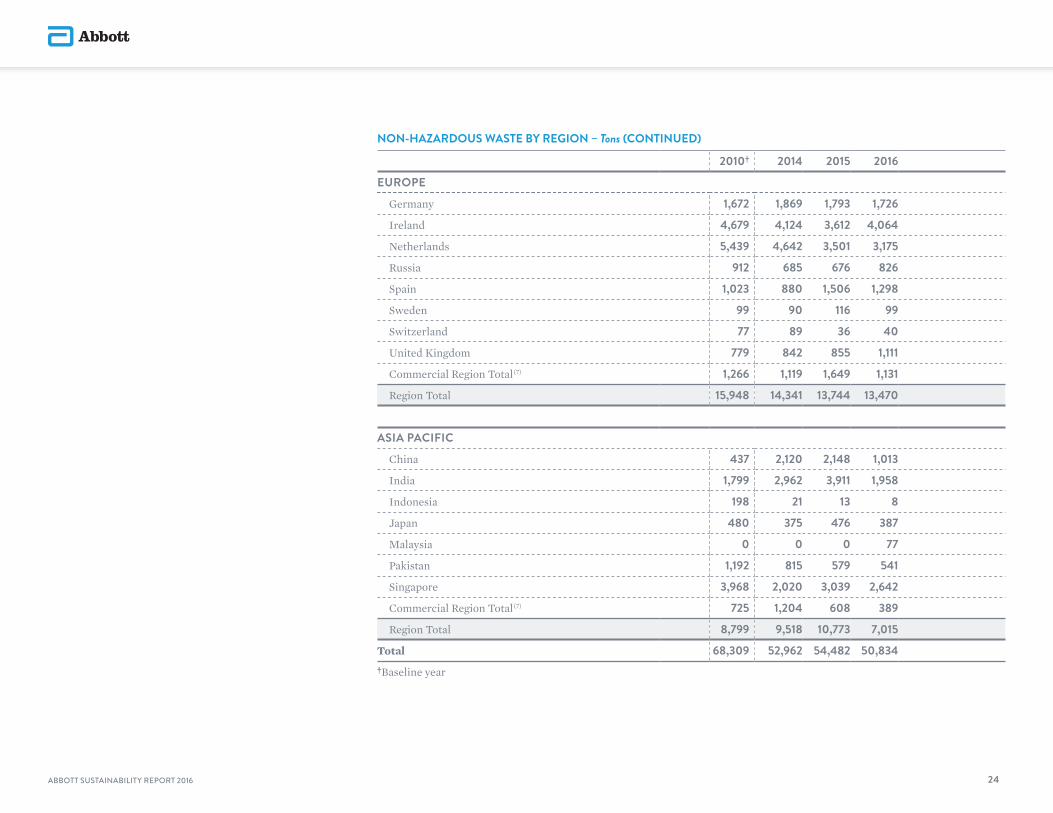
NON-HAZARDOUS WASTE BY REGION – Tons (CONTINUED)
2010† 2014 2015 2016
EUROPE
Germany 1,672 1,869 1,793 1,726
Ireland 4,679 4,124 3,612 4,064
Netherlands 5,439 4,642 3,501 3,175
Russia 912 685 676 826
Spain 1,023 880 1,506 1,298
Sweden 99 90 116 99
Switzerland 77 89 36 40
United Kingdom 779 842 855 1,111
Commercial Region Total(7) 1,266 1,119 1,649 1,131
Region Total 15,948 14,341 13,744 13,470
ASIA PACIFIC
China 437 2,120 2,148 1,013
India 1,799 2,962 3,911 1,958
Indonesia 198 21 13 8
Japan 480 375 476 387
Malaysia 0 0 0 77
Pakistan 1,192 815 579 541
Singapore 3,968 2,020 3,039 2,642
Commercial Region Total(7) 725 1,204 608 389
Region Total 8,799 9,518 10,773 7,015
Total 68,309 52,962 54,482 50,834†Baseline year
ABBOTT SUSTAINABILITY REPORT 2016 24

ENERGY CONSUMPTION 1,000 Gigajoules
2010† 2014 2015 2016
% CHANGE FROM 2015
TO 2016
Purchased Fuels (Scope 1)(1) 8,717 8,436 8,305 8,404 1.19
Purchased Energy (Scope 2)(2) 4,800 4,200 4,079 3,916 -4.01
Total (Scope 1 and Scope 2) Energy Consumption 13,517 12,636 12,384 12,319 -0.53
NORMALIZED BY SALES – Gigajoules per $ Million Sales
2010† 2014 2015 2016
% CHANGE FROM 2015
TO 2016
Purchased Fuels (Scope 1) 499 402 407 403 -0.99
Purchased Energy (Scope 2) 275 200 200 188 -6.08
Total (Scope 1 and Scope 2) Energy Consumption 773 602 607 591 -2.66
ELECTRICITY GENERATED ON SITE Million Kilowatt Hours
2010† 2014 2015 2016
% CHANGE FROM 2015
TO 2016
From Cogeneration 35.3 37.6 37.9 45.3 19.67
From Renewables 0.05 0.33 0.32 0.31 -2.90†Baseline year
ABBOTT SUSTAINABILITY REPORT 2016 25

TOTAL SCOPE 1 AND 2 ENERGY CONSUMPTION BY REGION – 1,000 Gigajoules
2010† 2014 2015 2016
NORTH AMERICA
Canada 489 367 364 360
USA 6,425 5,940 5,704 5,746
Region Total 6,914 6,308 6,067 6,106
CARIBBEAN AND LATIN AMERICA
Argentina 109 136 141 141
Brazil 81 64 70 72
Chile 40 41 48 36
Colombia 33 35 40 45
Costa Rica 0 49 41 40
Mexico 275 245 255 246
Peru 19 19 21 18
Puerto Rico 636 315 206 127
Commercial Region Total 378 377 367 339
Region Total 1,571 1,282 1,189 1,064†Baseline year
ABBOTT SUSTAINABILITY REPORT 2016 26

TOTAL SCOPE 1 AND 2 ENERGY CONSUMPTION BY REGION – 1,000 Gigajoules (CONTINUED)
2010† 2014 2015 2016EUROPE
Germany 360 259 268 291
Ireland 728 677 703 741
Netherlands 973 851 872 839
Russia 261 226 280 331
Spain 169 161 159 155
Sweden 39 35 34 32
Switzerland 5 1 2 2
United Kingdom 175 165 153 109
Commercial Region Total 564 509 470 441
Region Total 3,274 2,884 2,941 2,941
ASIA PACIFIC
China 90 377 349 277
India 140 229 286 283
Indonesia 15 21 20 20
Japan 10 7 7 8
Malaysia 0 0 14 33
Pakistan 306 319 305 313
Singapore 515 511 470 556
Commercial Region Total 679 697 737 719
Region Total 1,758 2,162 2,188 2,209
Total 13,517 12,636 12,384 12,319†Baseline year
ABBOTT SUSTAINABILITY REPORT 2016 27

ENERGY CONSUMPTION – PURCHASED FUELS (SCOPE 1) BY REGION – 1,000 Gigajoules
2010† 2014 2015 2016
NORTH AMERICA
Canada 253 189 190 188
USA 4,426 4,217 4,045 4,119
Region Total 4,679 4,406 4,235 4,307
CARIBBEAN AND LATIN AMERICA
Argentina 47 59 60 57
Brazil 25 17 17 18
Chile 13 13 15 7
Colombia 7 7 7 7
Costa Rica 0 1 1 1
Mexico 272 243 253 244
Peru 3 3 3 3
Puerto Rico 21 18 2 3
Commercial Region Total 338 344 336 314
Region Total 726 705 693 653†Baseline year
ABBOTT SUSTAINABILITY REPORT 2016 28
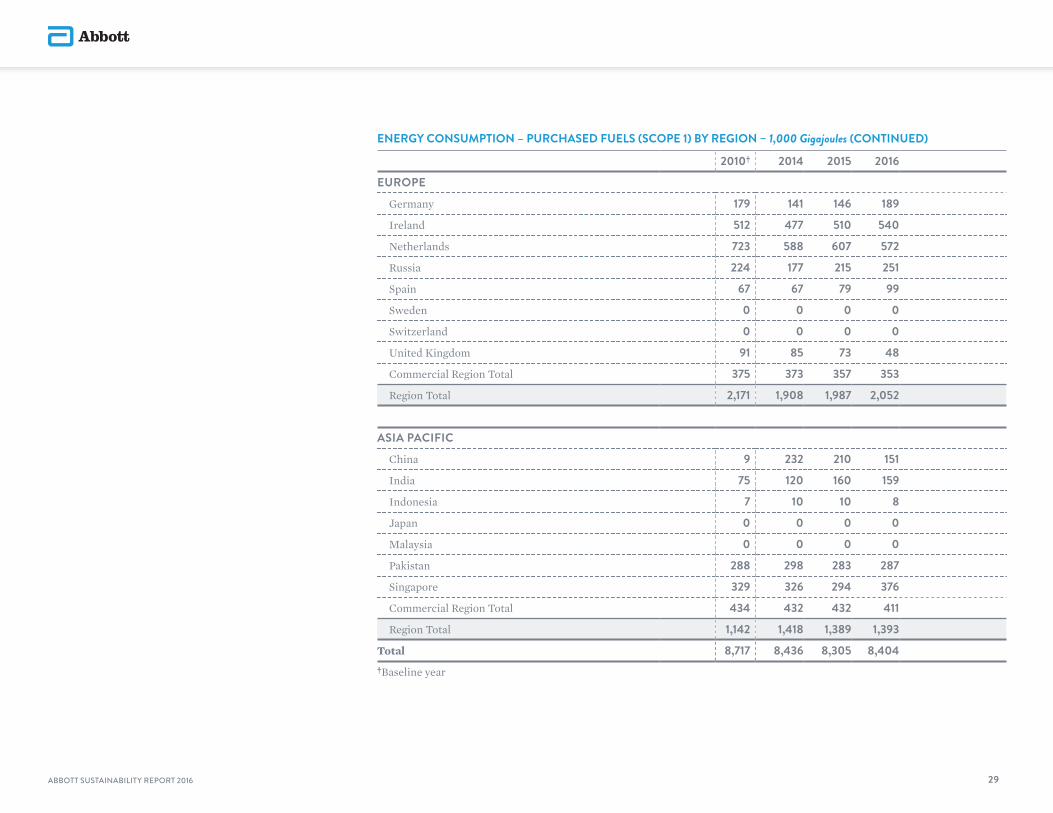
ENERGY CONSUMPTION – PURCHASED FUELS (SCOPE 1) BY REGION – 1,000 Gigajoules (CONTINUED)
2010† 2014 2015 2016
EUROPE
Germany 179 141 146 189
Ireland 512 477 510 540
Netherlands 723 588 607 572
Russia 224 177 215 251
Spain 67 67 79 99
Sweden 0 0 0 0
Switzerland 0 0 0 0
United Kingdom 91 85 73 48
Commercial Region Total 375 373 357 353
Region Total 2,171 1,908 1,987 2,052
ASIA PACIFIC
China 9 232 210 151
India 75 120 160 159
Indonesia 7 10 10 8
Japan 0 0 0 0
Malaysia 0 0 0 0
Pakistan 288 298 283 287
Singapore 329 326 294 376
Commercial Region Total 434 432 432 411
Region Total 1,142 1,418 1,389 1,393
Total 8,717 8,436 8,305 8,404†Baseline year
ABBOTT SUSTAINABILITY REPORT 2016 29

ENERGY CONSUMPTION – PURCHASED ENERGY (SCOPE 2) BY REGION – 1,000 Gigajoules
2010† 2014 2015 2016
NORTH AMERICA
Canada 236 179 174 172
USA 1,999 1,723 1,659 1,627
Region Total 2,235 1,902 1,832 1,799
CARIBBEAN AND LATIN AMERICA
Argentina 62 77 81 84
Brazil 56 47 53 53
Chile 26 29 33 30
Colombia 26 29 33 38
Costa Rica 0 48 40 39
Mexico 3 2 2 2
Peru 16 16 18 15
Puerto Rico 614 297 204 125
Commercial Region Total 41 33 31 26
Region Total 846 578 495 411†Baseline year
ABBOTT SUSTAINABILITY REPORT 2016 30

ENERGY CONSUMPTION – PURCHASED ENERGY (SCOPE 2) BY REGION – 1,000 Gigajoules (CONTINUED)
2010† 2014 2015 2016
EUROPE
Germany 180 119 122 102
Ireland 217 201 194 201
Netherlands 251 262 265 267
Russia 37 49 65 80
Spain 102 94 80 56
Sweden 39 35 34 32
Switzerland 5 1 2 2
United Kingdom 84 79 80 61
Commercial Region Total 189 136 113 88
Region Total 1,103 976 954 889
ASIA PACIFIC
China 81 146 139 125
India 65 109 125 123
Indonesia 9 11 10 12
Japan 10 7 7 8
Malaysia 0 0 14 33
Pakistan 18 22 22 27
Singapore 187 185 176 180
Commercial Region Total 246 265 305 308
Region Total 616 744 799 816
Total 4,800 4,200 4,079 3,916†Baseline year
ABBOTT SUSTAINABILITY REPORT 2016 31
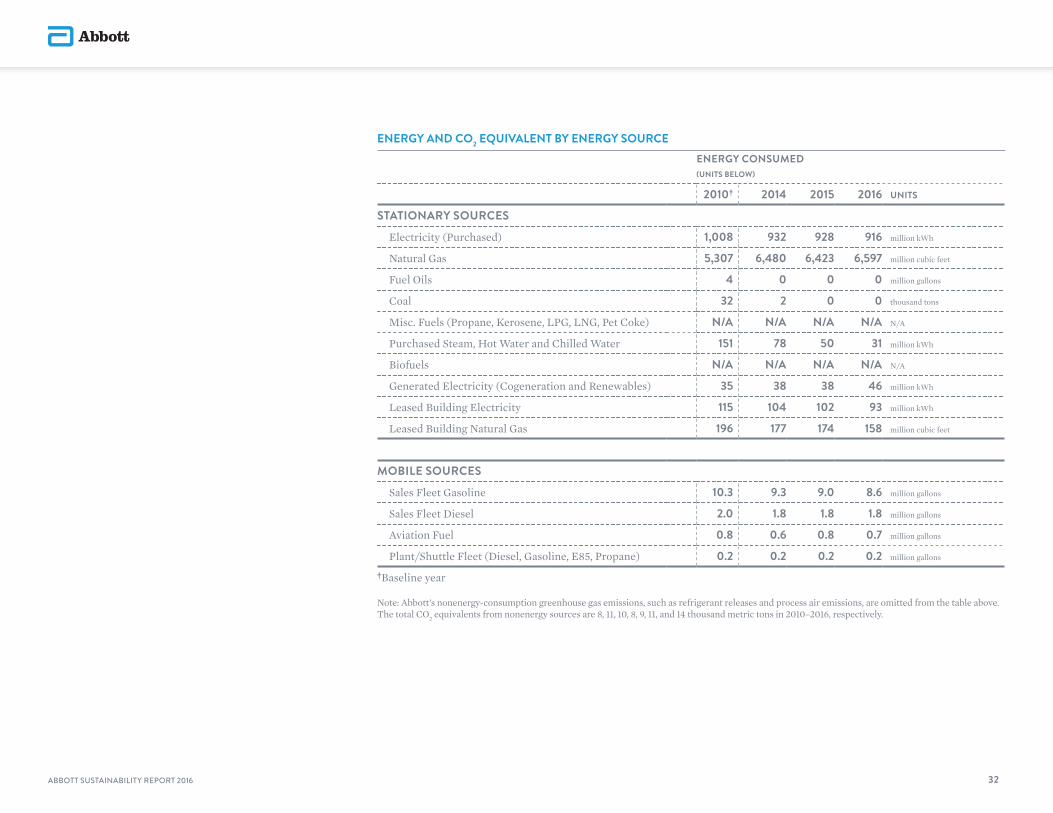
ENERGY AND CO2 EQUIVALENT BY ENERGY SOURCEENERGY CONSUMED (UNITS BELOW)
2010† 2014 2015 2016 UNITS
STATIONARY SOURCES
Electricity (Purchased) 1,008 932 928 916 million kWh
Natural Gas 5,307 6,480 6,423 6,597 million cubic feet
Fuel Oils 4 0 0 0 million gallons
Coal 32 2 0 0 thousand tons
Misc. Fuels (Propane, Kerosene, LPG, LNG, Pet Coke) N/A N/A N/A N/A N/A
Purchased Steam, Hot Water and Chilled Water 151 78 50 31 million kWh
Biofuels N/A N/A N/A N/A N/A
Generated Electricity (Cogeneration and Renewables) 35 38 38 46 million kWh
Leased Building Electricity 115 104 102 93 million kWh
Leased Building Natural Gas 196 177 174 158 million cubic feet
MOBILE SOURCES
Sales Fleet Gasoline 10.3 9.3 9.0 8.6 million gallons
Sales Fleet Diesel 2.0 1.8 1.8 1.8 million gallons
Aviation Fuel 0.8 0.6 0.8 0.7 million gallons
Plant/Shuttle Fleet (Diesel, Gasoline, E85, Propane) 0.2 0.2 0.2 0.2 million gallons
†Baseline year
Note: Abbott’s nonenergy-consumption greenhouse gas emissions, such as refrigerant releases and process air emissions, are omitted from the table above. The total CO2 equivalents from nonenergy sources are 8, 11, 10, 8, 9, 11, and 14 thousand metric tons in 2010–2016, respectively.
ABBOTT SUSTAINABILITY REPORT 2016 32

ENERGY AND CO2 EQUIVALENT BY ENERGY SOURCE (CONTINUED)
ENERGY CONSUMED (1,000 GIGAJOULES)
2010† 2014 2015 2016
STATIONARY SOURCES
Electricity (Purchased) 3,630 3,353 3,341 3,298
Natural Gas 5,401 6,618 6,548 6,727
Fuel Oils 555 45 33 36
Coal 935 50 0 0
Misc. Fuels (Propane, Kerosene, LPG, LNG, Pet Coke) 15 75 104 130
Purchased Steam, Hot Water and Chilled Water 543 280 180 110
Biofuels 58 52 34 8
Generated Electricity (Cogeneration and Renewables) 0 1 1 1
Leased Building Electricity 413 373 368 334
Leased Building Natural Gas 213 192 190 172
Stationary Total 11,763 11,040 10,798 10,815
MOBILE SOURCES
Sales Fleet Gasoline 1,358 1,224 1,188 1,131
Sales Fleet Diesel 291 267 263 258
Aviation Fuel 76 83 110 93
Plant/Shuttle Fleet (Diesel, Gasoline, E85, Propane) 29 22 26 22
Mobile Total 1,754 1,596 1,587 1,504†Baseline year
ABBOTT SUSTAINABILITY REPORT 2016 33

ENERGY AND CO2 EQUIVALENT BY ENERGY SOURCE(8)
GREENHOUSE GAS EMISSIONS (1,000 METRIC TON CO2 EQUIVALENT)
2010† 2014 2015 2016
STATIONARY SOURCES
Electricity (Purchased) 532 477 454 454
Natural Gas 286 350 347 356
Fuel Oils 41 3 2 3
Coal 83 4 0 0
Misc. Fuels (Propane, Kerosene, LPG, LNG, Pet Coke) 1 5 8 11
Purchased Steam, Hot Water and Chilled Water 24 14 9 6
Biofuels 0.1 0.1 0.1 0.0
Generated Electricity (Cogeneration and Renewables) 0 0 0 0
Leased Building Electricity 58 54 52 49
Leased Building Natural Gas 10 9 9 8
Stationary Total 1,038 916 881 886
MOBILE SOURCES
Sales Fleet Gasoline 91 82 80 76
Sales Fleet Diesel 20 19 18 18
Aviation Fuel 5 6 8 6
Plant/Shuttle Fleet (Diesel, Gasoline, E85, Propane) 2 2 2 2
Mobile Total 118 108 107 102†Baseline year
ABBOTT SUSTAINABILITY REPORT 2016 34
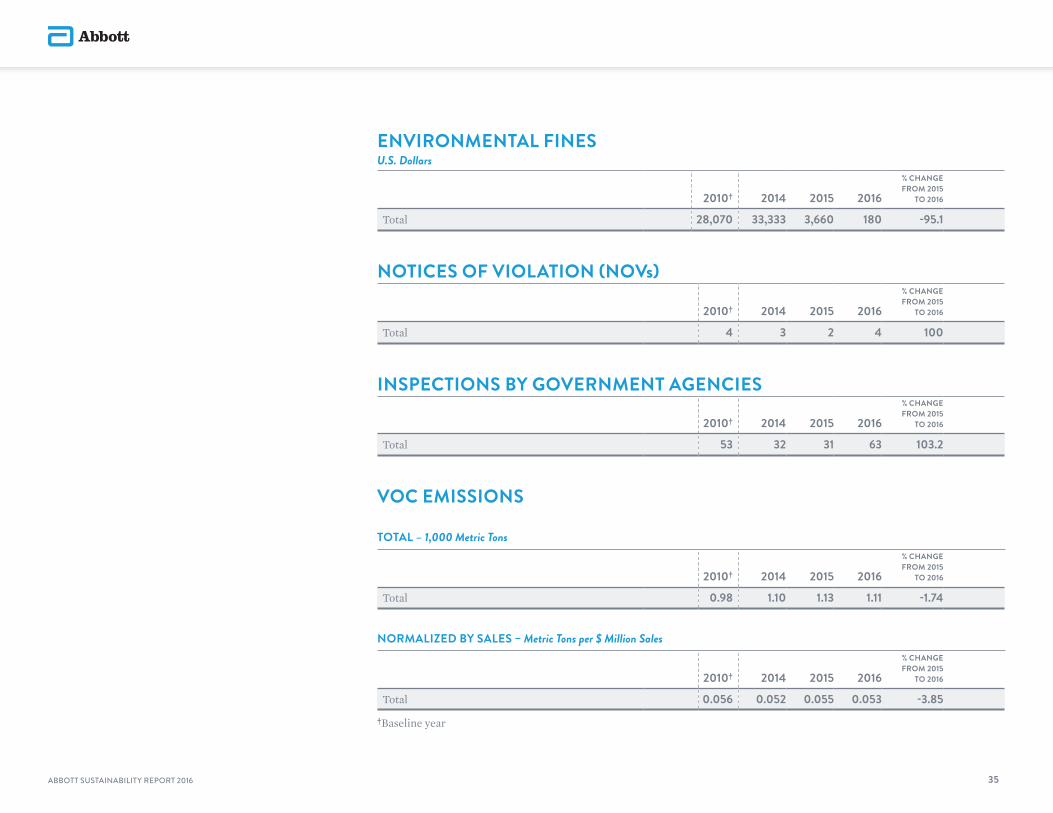
ENVIRONMENTAL FINES U.S. Dollars
2010† 2014 2015 2016
% CHANGE FROM 2015
TO 2016
Total 28,070 33,333 3,660 180 -95.1
NOTICES OF VIOLATION (NOVs)
2010† 2014 2015 2016
% CHANGE FROM 2015
TO 2016
Total 4 3 2 4 100
INSPECTIONS BY GOVERNMENT AGENCIES
2010† 2014 2015 2016
% CHANGE FROM 2015
TO 2016
Total 53 32 31 63 103.2
VOC EMISSIONS
TOTAL – 1,000 Metric Tons
2010† 2014 2015 2016
% CHANGE FROM 2015
TO 2016
Total 0.98 1.10 1.13 1.11 -1.74
NORMALIZED BY SALES – Metric Tons per $ Million Sales
2010† 2014 2015 2016
% CHANGE FROM 2015
TO 2016
Total 0.056 0.052 0.055 0.053 -3.85†Baseline year
ABBOTT SUSTAINABILITY REPORT 2016 35

SOX FROM COMBUSTION(9)
1,000 Metric Tons
2010† 2014 2015 2016
% CHANGE FROM 2015
TO 2016
Total 0.58 0.03 0.03 0.04 52.79
NORMALIZED BY SALES – Metric Tons per $ Million Sales
2010† 2014 2015 2016
% CHANGE FROM 2015
TO 2016
Total 0.033 0.002 0.001 0.002 49.51
NOX FROM COMBUSTION(9)
1,000 Metric Tons
2010† 2014 2015 2016
% CHANGE FROM 2015
TO 2016
Total 0.405 0.308 0.303 0.314 3.85
NORMALIZED BY SALES – Metric Tons per $ Million Sales
2010† 2014 2015 2016
% CHANGE FROM 2015
TO 2016
Total 0.023 0.015 0.015 0.015 1.62†Baseline year
All environmental data has been adjusted to account for acquisitions and divestitures, in accordance with the methodology prescribed in the WRI/WBCSD Greenhouse Gas Protocol. We report data from acquisitions as soon as practical, generally after collecting one full year’s financial data; therefore, CFR and Veropharm acquisitions are included in our 2016 environmental data sets above, and Glomed is not included.(1) Reported Purchased Fuel Scope 1 sources consist of fuel consumed by manufacturing facilities, sales fleet and Abbott-owned aviation.(2) Reported Scope 2 sources consist of energy directly purchased by Abbott, such as electricity and steam, as well as emissions from leased locations. Unless specified otherwise, emissions are calculated according to the WRI/WBCSD Greenhouse Gas Protocol Scope 2 Location-Based Method.(3) Per WRI GHG protocol, Scope 1 refrigerant CO2e emissions include only those covered in the Kyoto Protocol.(4) Water-stressed locations have been determined using the World Resource Institute Aqueduct Global Water Risk Mapping Tool and the World Business Council for Sustainable Development Global Water Tool. (5) Waste-generation data does not include materials that are reused beneficially, which were roughly 67 thousand tons in 2016.(6) BOD data provided is a flow-weighted average of sampled concentrations for water directly discharged to the environment only. Water discharged to the environment represents about 12% of total water discharged.(7) Waste Commercial Region Total data collection and calculation methodology was updated to better quantify years 2011–2016. Data from 2011 was used to provide the best estimate for 2010.(8) Note: Abbott’s nonenergy-consumption greenhouse gas emissions, such as refrigerant releases and process air emissions, are omitted from the table above. The total CO2 equivalents from nonenergy sources are 8, 11, 10, 8, 9, 11 and 14 thousand metric tons in 2010–2016, respectively.(9) Reflects emissions from fuel combusted at manufacturing facilities only.ABBOTT SUSTAINABILITY REPORT 2016 36

WWW. ABBOTT.COM/SUSTAINABILITY
Please contact us with your questions and comments: Abbott Sustainability 100 Abbott Park Road, Department 0383, Abbott Park, IL 60064-6048 [email protected]
Copyright © 2017 Abbott. All rights reserved.