global status report on local renewable energy policies
TRANSCRIPT

Global Status Report
on Local Renewable Energy Policies
Working Draft, 12 June 2009
Comments and Additional Information Invited
This report complements the REN21 Renewables Global Status Report by providing more detailed information at the city and local levels about policies and activities to promote renewable energy. It is intended to facilitate dialogue and illuminate pathways for future policies and actions at the local level. This “working draft” version is intended to solicit comments and additional information. Data in this
draft are not necessarily complete or accurate.
A Collaborative Report by:REN21 Renewable Energy Policy Network for the 21st Century
Institute for Sustainable Energy Policies (ISEP)ICLEI–Local Governments for Sustainability
2
Additions and corrections: please address to Eric Martinot, [email protected] New researchers, contributors, and reviewers will be acknowledged in the next edition. ABOUT REPORT COLLABORATORS REN21 convenes international multi-stakeholder leadership to enable a rapid global transition to renewable energy. It promotes appropriate policies that increase the wise use of renewable energies in developing and industrialized economies. Open to a wide variety of dedicated stakeholders, REN21 connects governments, international institutions, nongovernmental organizations, industry associations, and other partnerships and initiatives. REN21 leverages their successes and strengthens their influence for the rapid expansion of renewable energy worldwide. See www.ren21.net. ISEP is an independent, non-profit research organization, founded in 2000 by energy experts and climate change campaigners. ISEP aims to provide resources and services to realize sustainable energy policies. Activities include promotion of renewable energy, improvement of energy efficiency, and restructuring energy markets. ISEP provides policy analysis and advice for national and local governments, brings together stakeholders worldwide, and facilitates renewable energy activities by local groups. See www.isep.or.jp. ICLEI is an international association of local governments and locally-oriented organizations at national and regional levels that have made a commitment to sustainable development. Established in 1990, ICLEI works with its members and other local governments through performance-based, results-oriented campaigns and programs, such as the Cities for Climate Protection Campaign, the Local Government Climate Roadmap, and the Local Renewables Initiative. See details on all initiatives at www.iclei.org. ACKNOWLEDGMENTS Lead Author and Research Director Eric Martinot (Institute for Sustainable Energy Policies) Collaborating Authors Monika Zimmermann (ICLEI International Training Center); Maryke van Staden (ICLEI European Secretariat); Noriaki Yamashita (Institute for Sustainable Energy Policies) Researchers Katie Burns (Town of Markham), Jose Etcheverry (York University), Shota Furuya (ISEP), Emmanuel Gómez , Risa Irie (ISEP), Coreen Jones (York University), Kei Kawaguchi (ISEP), Sandi MacPherson (York University), Ana Maria Gómez (National Autonomous University of Mexico), Noriko Nakao (ISEP), Lynda O Malley (ICLEI Intl. Training Center), Viive Sawler (Town of Markham), Patrick Schroeder (Victoria University), Laura Serrano Mendoza (ICLEI Europe), Erin Shapero (Town of Markham). Contributors and Reviewers D.H. Brahmbhatt (City of Rajkot), Stuart Conerly (ISEP), Emani Kumar (ICLEI South Asia), Lee Yujin (Green Korea), Christine Lins (EREC), Jan Logie (Otago University), Monica Oliphant (ISES), Lily Riahi (ICLEI Europe), Wilson Rickerson (Rickerson Energy), Holger Robrecht (ICLEI Europe), Ian Schearer (ICLEI New Zealand).

3
CONTENTS 1. The Promise of Local Action for Renewable Energy .............................................................. 4
2. International, Regional and National Influences on Local Renewables.................................. 5
3. Types of Local Policies and Activities to Promote Renewable Energy................................... 8
4. Survey of Local Renewable Energy Policies Around the World ........................................... 11
5. Local Policy Case Summaries for 30 Cities.......................................................................... 21
6. Further Research ................................................................................................................. 28
TABLES Policy Framework
Table 1: Local Government Policies/Activities that Can Influence Renewable Energy ........... 10 Surveys of Local Renewable Energy Policies
Table 2: Europe....................................................................................................................... 15 Table 3: United States ............................................................................................................. 16 Table 4: Canada...................................................................................................................... 17 Table 5: Japan......................................................................................................................... 18 Table 6: Australia and New Zealand ....................................................................................... 18 Table 7: China, India, and Asia/Other ..................................................................................... 19 Table 8: Latin America ............................................................................................................ 20 Local Policy Examples
Table P1: Targets for CO2 Emissions Reductions ................................................................... 29 Table P2: Targets for Share of Renewable Electricity.............................................................. 30 Table P3: Targets for Share or Amount of Renewable Energy ................................................ 30 Table P4: Targets for Installed Capacity of Renewable Energy ............................................... 31 Table P5: Targets for Local Government Own-Use Purchases of Renewable Energy ............ 32 Table P6: Targets for Share of Buildings with Renewable Energy........................................... 32 Table P7: Urban Planning ........................................................................................................ 33 Table P8: Building Codes and Mandates ................................................................................. 34 Table P9: Tax Credits and Exemptions.................................................................................... 35 Table P10: Transport Infrastructure and Fuel Mandates, Operation, Investment, Subsidies .. 35 Table P11: Carbon Cap-and-Trade Schemes .......................................................................... 35 Table P12: Promotion and Market-Facilitation Agencies and Departments ............................. 35 Table P13: Electric Utility Policies ............................................................................................ 36 Table P14: Subsidies, Grants, and Loans................................................................................ 36 Table P15: Local Government Funds and Investments .......................................................... 37 Table P16: Support for Private and Community Initiative......................................................... 37 Disclaimer: The views expressed in this report do not necessarily reflect the positions or views of REN21 or any associated organization. Although the information given in this report is the best available to the authors at the time, REN21 and its participants cannot be held liable for its accuracy and correctness.

4
1. THE PROMISE OF LOCAL ACTION FOR RENEWABLE ENERGY City and local governments can play a key role in encouraging renewable energy at the local level.
The multiple roles of these local governments–as decision-makers, planning authorities, managers
of municipal infrastructure, and role models for citizens and businesses–are crucial to the global
transition to renewable energy now underway. It is their political mandate that makes local
governments ideal drivers of change–to govern and guide their communities, provide services, and
manage municipal assets.
Most significantly, local governments have legislative and purchasing power that they can use to
implement change in their own operations and in the wider community. With such capacity, local
governments can become beacons for change in their region or country, demonstrating the
effectiveness of policies and local action. And as early leaders among local governments take
initiative, others can follow and improve upon the early efforts, replicating and scaling-up good-
practice and successful examples.
Local governments can also play a key role as facilitators of change, particularly in terms of raising
awareness and facilitating community and business actions by a range of stakeholders. Often the
participation of many different local, regional, and even national stakeholders is important to
achieving planned outcomes. For example, “model cities” in India and Brazil have been designed
to involve local craftspeople, schools, scientists, and regional and national agencies.
While cities are beginning to include renewable energy in urban planning, there are still relatively
few explicit local renewable energy policies. Rather, renewable energy is often addressed
indirectly, within other themes such as sustainability, climate change, clean transportation, and
“green” or “eco” programs. Often, energy savings and energy efficiency are the main priorities,
which makes sense due to the enormous opportunities for reducing demand. Reduced demand
also enables renewables to meet a larger share of the remaining demand. However, it is also true
that the potential for renewable energy is often overlooked, shortchanged, or needlessly postponed
within these broader themes and programs.
The “energy system of tomorrow,” a system that could enable the realization of a 100% renewable
future, will consist of a partially distributed, decentralized energy system with embedded energy
storage, demand side management, and modern communications technologies. It also will likely
include a large role for electric vehicles charged from local renewable energy sources. The role of
local governments in shepherding and managing these transitions is highly significant. The future
will likely reveal an interesting and multi-faceted interplay between local policies and these future
energy transitions.

5
Local renewable energy targets and policies across the globe vary extensively. One common
theme for many communities, whether metropolitan regions, cities, towns, villages, or counties, is
the importance of renewable energy in local climate action plans–from both mitigation and
adaptation perspectives. This is particularly true for many developed countries, where the
importance of climate action at the local level is translating more and more into action to promote
renewable energy. In developing countries, access to energy, energy security, and industrial
development can be key motivators for renewable energy policy and action. In all communities, a
focus on local job creation often shapes policies.
This report makes clear that there are many different approaches to renewable energy policy.
Many factors influence the approaches that local governments choose. Some of these include
geographic resource availability, financing availability, relationship to state and national
governments, local regulatory authority and legal jurisdiction, social and cultural conditions,
existence of stakeholder groups, local business interests, climate, type of building stock, and
housing density and transport patterns. Since there are large variations in the types of local
targets and policies, both within and between countries, it is difficult to generalize trends for
renewable energy policies. Yet this report attempts to portray an overall “policy landscape.”
More and more cities and local governments are addressing renewable energy in some way, and
are also becoming more ambitious in their targets and in policies designed to meet these targets.
Local leaders increasing look to renewable energy to produce energy locally; to secure the local
energy supply and improve community resilience; to save energy and money; to create local jobs;
to involve local stakeholders; to contribute to climate protection; to support national and
international CO2 reduction goals, and to promote sustainable urban development. Among many
local leaders, there is broad agreement on these benefits and the promise of renewable energy.
2. INTERNATIONAL, REGIONAL AND NATIONAL INFLUENCES ON LOCAL RENEWABLES
In recent years, international, regional, national, and state/provincial policies for energy and climate
have been increasingly affecting local government policies and actions for renewable energy.
Europe is a good example at the regional level. European Union (EU) regional policy and national
policies have fostered local renewable energy goals and actions, particularly among a number of
local governments in Austria, Finland, Germany, Sweden, and the United Kingdom. Since 2007,
many European cities have been considering renewable energy targets and policies in support of
the 2008 European Climate and Energy package. That package established an EU-wide target for
20% share of final energy consumption from renewables by 2020 and 10% share of transport
energy, with individual national targets contributing to the EU-wide target. Also in 2008, the
Covenant of Mayors was launched by the European Commission to bring together interested

6
Box: Emerging Lessons from Implementing Local Renewables The experience of ICLEI in working with cities on a variety of projects is beginning to illuminate some emerging lessons for implementing local renewables. 1. Community size determines approaches and possibilities. There are clear differences between the policies enacted and implemented by smaller versus larger communities. Smaller communities are enacting targets for 100% renewable energy, or have even reached this level already, whereas larger cities would find this impossible in the short and medium term. Smaller communities also tend to be motivated and supported in a regional context and cooperate with other municipalities in their region. Among those pioneers, many see a “early adopter” advantage and aim at competitive advantages from innovation. Larger cities, in contrast, tend to start by targeting specific renewable energy opportunities, such as solar, wind, or bio-energy. Larger cities may then use these opportunities to portray the city as progressive (for example, as a “solar city”) and to explore business ventures that will benefit the city. 2. Mid-sized cities can start easier then large cities. As observed in other local policy sectors as well, cities and towns of between 100,000–-500,000 inhabitants tend to be pioneers and among the most active. Innovation and implementation is often much easier for these mid-size cities than for larger cities, although international attention may focus more on the larger cities. 3. Renewable energy policies often follow sustainability goals. Among the advanced local governments in developed countries (especially among the cities), there are many governments that have started some type of sustainability policy, sometimes following past “Local Agenda 21” programs. Promoting renewable energy can become a natural continuation of past sustainability policies, as understanding and policy sophistication increase. 4. Early innovators can produce a “snowball effect.” In some countries, pioneering local governments have taken initiative and then other local governments have followed. This is why “model cities” are so relevant and why city-to-city transfer of information and motivation are key. One of the best examples is Barcelona s Solar Ordinance mandating solar hot water in new construction, which was then copied by dozens of local governments in Spain and elsewhere. 5. Local governments react to national enabling (framework) conditions. National and state/provincial energy policies and mandates create enabling (framework) conditions to which local governments react. Such enabling conditions could be national or state targets for renewable energy, incentive programs, funds for demonstrations, electric utility policies like feed-in tariffs, competitions and awards, or funding for urban development that explicitly incorporates renewables, to name some. 6. Awards and competitions motivate and create practitioner-communities. In some countries, awards are given for “solar cities”, “solar towns” and “solar villages,” often on a regular or annual basis. This creates communities of motivated and like-minded individuals and local officials, who can then serve as mentors and resources for those who wish to start similar activities in their own community. 7. Renewable energy demonstration centers provide training and “critical mass.” Come, see, touch and learn – this is the best way for people to acquaint themselves with new technologies. Many “model cities” have established information and demonstration centers for renewable energy and energy efficiency to provide training and expertise, and to bring together a critical mass of experts, small businesses, and stakeholders to move local innovation.

7
European cities in a voluntary effort to go beyond those EU targets. By April 2009, the Covenant
involved almost 500 local governments, and continues to grow.
At the international level, local governments are increasingly involved in climate change
discussions and meetings associated with the United Nations Framework Convention on Climate
Change (UNFCCC). Local governments expanded their participation at the 13th Conference of the
Parties (COP-13) in Bali in December 2007 and at COP-14 in Poznan in December 2008. In Bali,
an association of local governments launched the “Local Government Climate Roadmap.” This
roadmap calls for greater recognition of the crucial role that local governments play in achieving
energy and climate goals, explicitly recognizes the role of renewable energy, and also highlights
the need for proper enabling (framework) conditions for local governments. The roadmap also is
mobilizing local governments towards preparations for COP-15 in Copenhagen in December 2009.
Plans for COP-15 feature a decision “Cities and Climate”, which has been brought to UNFCCC
negotiations by local governments. Also coming from COP-13 is the World Mayors and Local
Government Climate Protection Agreement, in which signatories agree to measure and report on
annual reductions of greenhouse gas emissions and act to reduce emissions consistent with a
60% global reduction in greenhouse gas emissions by 2050 (from 1990 levels).
At national levels, groupings of cities and local governments continue to form, expand, plan, and
take collective action, sometimes through a national initiative. For example, India is establishing 60
“solar cities” that would reduce conventional energy demand by at least 10 percent with
renewables and efficiency by 2012. National funds are supporting urban planning and policy
development in these 60 cities to establish policy roadmaps and local resource centers as
catalysts for change. In the United States, the U.S. Mayors Climate Protection Agreement grew to
include over 930 mayors from all 50 states in 2008, representing an urban population of over 83
million people. That agreement targets a 7% reduction in greenhouse gas emissions by 2012 from
efficiency and renewables (from 1990 levels). The U.S. Department of Energy s Solar America
Partnership likewise grew in 2008, doubling to 25 participating cities in 2008. In Germany, a
publicly-funded research and facilitation network is working with over 50 small municipal
governments around the country to develop and implement plans for becoming “100% renewable
energy regions.” In Australia, there are six “solar cities” supported by a national government
program. And in Japan, more than 300 municipalities continue to provide solar photovoltaic (PV)
subsidies and support green power purchasing and other renewables policies in concert with a
national policy and networking platform “Japan Regional New Energy Vision.”
State/provincial level policies and targets for renewable energy are also affecting local
governments. By early 2009, there were over 55 states/provinces worldwide with renewable energy
targets, mostly in the United States and Canada based on renewable portfolio standards, and also
in India and other sub-national jurisdictions like Scotland. Canada is a good example of targets
and policies at the province level that encourage local action. As such “enabling conditions”

8
improve at state/provincial levels, local communities find more support to become active toward
renewable energy.
Finally, there are a number of international collaborative associations that support local action.
Most well-known are several initiatives by ICLEI that bring together local stakeholders from around
the world, including a local renewables “model communities” network linked to ICLEI s Local
Renewables Initiative. Other examples include the C40 Cities Climate Leadership Group (which
has focused on energy efficiency improvements in 40 major cities); the European Green Cities
Network (which provides analysis and training on sustainable urban housing); and the International
Solar Cities Initiative (which convenes biennial conferences). There are also national and regional
awards and recognition programs emerging, such as the European Commission s “European
Green Capital” awards, which have already recognized cities as “capital of the year” for 2010 and
2011. (Note: a comprehensive list of associations, programs and resources is planned for future
editions of this report.)
3. TYPES OF LOCAL POLICIES AND ACTIVITIES TO PROMOTE RENEWABLE ENERGY Local policies and activities to promote renewable energy can be grouped into five main categories
(see Table 1 and indicated policy example tables P1–P16). (Note: Only some policies in Table 1
may be relevant to a given situation, depending on local jurisdiction. And not all possible policies
are shown in Table 1.) These five categories are:
1. Target setting. The local government establishes a target (goal) for some future level of
renewable energy. The target can be for government-only consumption or investment, or apply to
all or some classes of energy consumers within the local government s jurisdiction. This is a
voluntary activity that is often the starting point for adopting policies and actions. There are many
different types of targets that cities can adopt. Many targets are for future emissions reductions of
CO2, to be met by a combination of energy conservation, energy efficiency, changes in energy
demand patterns (such as transport modal shifts), and investment in or purchase of renewable
energy. (Note: most commonly, the proportion of the CO2 reduction to be met by renewables is
unspecified, so CO2 reduction targets are considered “partial” targets for renewable energy. In
most cases, CO2 reduction targets alone, without a corresponding explicit renewable energy
target, imply a larger proportion of reductions from energy savings and efficiency than from
renewable energy.)
2. Regulation based on legal responsibilities and jurisdiction. These policies and activities are
regulatory in nature, based upon the legal responsibilities and jurisdiction of the local government
that are provided by charters or similar articles of incorporation, and by national and state laws.
Primary examples are urban planning, building codes, and local taxes.

9
3. Operation of municipal infrastructure. These policies and activities modify the ongoing operation
of municipal infrastructure to incorporate renewable energy, for example government energy
purchases or infrastructure investment, or policies or activities by public utility companies
(particularly electric utilities) that can be controlled or regulated by the local government. (Note:
public utility policies may depend upon utility infrastructure being under local control or jurisdiction.)
This category also includes renewable energy policies by private local utilities that may be enacted
independently of government control.
4. Voluntary actions and government serving as role model. These policies and activities go
beyond legal responsibilities and jurisdiction to take advantage of the various possible roles of a
local government as market facilitator, promoter, and role model. Many of these policies and
activities may also contribute to raising general awareness.
5. Information, promotion and raising awareness. These policies and activities target the general
public, specific stakeholders or groups, and/or private businesses, with the aim of facilitating or
enabling support for renewable energy. Activities may also include informational and media
campaigns, support for education and training programs, analysis of renewable energy potentials,
building-specific audits, and geographic information system (GIS) databases.

10
Table 1: Local Government Policies/Activities that Can Influence Renewable Energy Policy/ Activity Category
Key for Tables 2–8
Descriptions of Policies/Activities by Sub-Category
Policy Tables
(a) CO2 reduction targets P1 (b) Future shares/amounts of renewable electricity or energy for all consumers in city
P2– P4
(c) Future shares/amounts of renewable electricity or energy for government operations and/or buildings
P5
(d) Future shares or absolute numbers of buildings or homes with renewable energy installations
P6
(e) Future shares/amounts of biofuels for the government vehicle fleet and/or for public transport
P10
1. Target setting
Target setting
(f) Other types of targets, for example to become fossil-fuel free or “carbon neutral”
P1
Urban (a) Urban planning and zoning that encourages and integrates the local generation, distribution and use of renewable sources of power in the local jurisdiction--including planning and zoning for public transportation and electric vehicle infrastructure.
P7
Building (b) Building codes and/or permitting that applies to, or incorporates renewable energy in some manner. Examples: mandates for solar hot water and solar PV installations, zero-net-energy homes, shading legislation, and mandated design review/scoping of opportunities and potentials for renewable energy.
P8
Taxes (c) Tax credits and exemptions within tax systems: for example, sales, property and fuel taxes, permitting fees, and carbon taxes.
P9
2. Regulation based on legal responsi-bilities and jurisdiction
Other (d) Other regulation, including municipal departments mandated to promote or plan for renewable energy, mandates for biofuels use in vehicles or biofuels blending, and mandatory carbon cap-and-trade.
P10– P12
Purch (a) Local government purchasing (and joint-purchasing with other municipalities or with private sector) to integrate renewable energy into government operations. Includes renewable electricity, biofuels, and bulk purchasing for market transformation programs.
---
Invest (b) Local government investment in renewable energy for government buildings, schools, vehicle fleets, and public transport.
---
3. Operation of municipal infrastructure
Utility (c) Public utility regulation, including tariff regulation, renewable energy targets, feed-in tariffs, interconnection standards, net metering, and portfolio standards; also designates private utility policies of these types.
P13
Demo (a) Demonstration projects, including participation in national pilot and demonstration projects. Often done with private sector.
---
Grants (b) Grants, subsidies, and loans for investments in renewable energy by homeowners or businesses
P14
Land (c) Using local government land/property for renewable energy installations (leasing/selling/permitting). Can also include deals that require developer promises for renewables and efficiency.
---
4. Voluntary actions and government serving as a role model
Other (d) Examples: joint ownership of private projects, city-financed investment funds, bond issues, and green certificates and trading.
P15– P16
5.Information promotion, and raising awareness
Info/ promo
Includes public media campaigns and programs; recognition activities and awards; organization of stakeholders; forums and working groups; training programs; enabling access to finance by local stakeholders; enabling stakeholder-owned projects; removing barriers to community participation; energy audits and GIS databases; analysis of renewable energy potentials; information centers; and initiation and support for demonstration projects.
---

11
4. SURVEY OF LOCAL RENEWABLE ENERGY POLICIES AROUND THE WORLD Policies and activities to promote renewable energy at the local level by 160 selected cities and
local governments worldwide are shown in Tables 2–8. Columns correspond to the categories and
sub-categories from Table 1.
(Notes: There are many more cities and hundreds of smaller local governments that could be
shown in these tables. The cities and local governments shown in these tables are based on data
availability and well-known cases, but have not been selected according to any formal criteria.
Check-boxes for specific policies in specific cities are based on judgment of the lead author, given
available information. Further drafts of this report will include more cities and local governments
and may establish criteria for inclusion in some categories. For details of state and national policies
for renewable energy that often underlie and support local policies, see the global “Policy
Landscape” section of the REN21 Renewables Global Status Report, available at www.ren21.net,
and also links to a wide variety of policy references and databases at
www.martinot.info/policies.htm.)
The most common type of policy is target setting. (See examples in Tables P1–P6.) Almost all
cities working to promote renewable energy at the local level have established some type of
renewable energy or CO2 reduction target. Of the 160 cities and local governments in Tables 2–8,
at least 125 have some type of future target for renewable energy and/or CO2. Often, cities set
targets based on analysis of energy consumption and reduction potentials. Some of the pioneering
cities in target setting have even met their goals, or are now setting stronger targets based on
accumulated experience.
CO2 or greenhouse gas reduction targets are common for the years 2010–2012, similar to Kyoto
Protocol targets at the national level, and typically for 10–20% reduction of emissions from 1990
levels. CO2 targets for 2020 and beyond have appeared in recent years and are typically for 20–
40% reductions by 2020, with some CO2 targets now even extending to 2050. Other cities have
targets to become fully or partially “carbon neutral” (zero net emissions) by a future year. One
novel type of CO2 target is emissions per-capita, with several cities targeting a reduction in this
indicator over time.
There are several types of renewable-energy-specific targets. One type is for the renewable share
of total electricity consumption, with several cities in the range 10–30%. Some cities target the
share of electricity consumed by the government itself, for its own buildings, vehicle fleets, and
operations. Such “own-use” targets can range from 10% to 100%. Another type of target is total
share of energy from renewables (e.g., including transport and heating, not just electricity), or
share of energy just for a specific sector like buildings. Some targets are for total amounts of

12
installed renewable energy capacity, such as megawatts of solar PV or wind power, or the number
or total surface area of solar hot water collectors.
Another common policy is urban planning that incorporates renewable energy. (See examples in
Table P7.) Urban plans take many forms and titles, ranging from “vision” to “strategy” to “plan” but
the essential feature is that a plan call for integrating renewable energy in some systematic and
long-term fashion into city development. The first element of a plan is often the targets mentioned
above, followed by elaboration of specific policies or activities. Some plans are relatively short-
term, for example 5 years or less, while many others extend to 2020, 2030, or even 2050. Of the
160 cities and local governments in Tables 2–8, at least half have some type of urban planning that
incorporates renewable energy.
One type of policy emerging in recent years is incorporation of renewable energy in building
codes or permitting. (See examples in Table P8.) Barcelona, Spain, was one of the pioneers
with this type of policy, and mandated solar hot water in all new construction above a certain size
threshold (the threshold was later eliminated). Barcelona s ordinance was then followed by over 70
other municipalities in Spain, and also by the national government. (See Barcelona case
description in Section 5.) Other types of mandates are for design reviews prior to construction that
reveal the opportunities for integrating solar into building designs, or for building designs to include
“stub-outs” or other features that allow for future installation of renewables. A number of cities in
China have mandated solar hot water in new multi-family apartment buildings, and 12 stories in
height appears to be the cut-off point for such mandates (with more stories, roof area becomes
inadequate). Of the 160 cities and local governments in Tables 2–8, at least 28 have some type of
building code or permitting policy that incorporates renewable energy.
In contrast to renewable energy policy at the state and national levels in many countries around the
world, tax credits and exemptions for renewable energy at the local level are not very common.
(See examples in Table P9.) Of the 160 cities and local governments in Tables 2–8, only 12 were
found to have some form of these policies. Property tax credits or abatement for residential
installations appear to be the most common.
Many other regulatory measures for renewable energy are possible. There are just a few
examples identified so far, however. One example is a mandate for blending biofuels with all
gasoline and/or diesel fuel sold within city limits (see Portland example in Table P10). Another
example is mandating that all taxis use biofuels (see Betim example in Table P10). A third
example is mandating a carbon cap-and-trade system on large businesses within city jurisdiction
(see Tokyo example in Table P11).
Related to regulatory measures are a number of cases where local governments have established
city departments or public market-facilitation agencies that are planning, regulating, and/or
promoting renewable energy. (See examples in Table P12.) These agencies may have a

13
regulatory function, or they may be “market facilitation” agencies that provide information, training,
finance, stakeholder convening, public outreach, etc. (The later are best categorized under the
“information/promotion” policy category #5 of Table 1.) Often, government departments or agencies
tasked with promoting renewable energy take both roles.
Incorporation of renewable energy into municipal infrastructure and operations takes many
forms. A number of cities have decided to purchase green power for municipal buildings and
operations (see examples in Table P5). Others are purchasing biofuels for municipal fleet vehicles
and/or public transit vehicles (see examples in Table P10). Associated with biofuels purchases
may be investment in alternative-fuel vehicles that may use richer mixtures of biofuels than is
possible with conventional vehicles. Many cities also invest in renewable energy installations for
municipal buildings, schools, hospitals, recreation facilities, and other public facilities. Cities with
community- or district-scale heating systems may also invest in renewable heating infrastructure,
for example biomass co-generation plants. Of the 160 cities and local governments in Tables 2–8,
at least 81 have some type of policy related to municipal infrastructure and operations.
For electric utility operations, there are few local governments worldwide that have direct
jurisdiction over the electric utility that serves their populations. But in cases where full or partial
jurisdiction exists, or where local regulation can be achieved indirectly through regional or state
government, a number of electric utility policies for renewable energy are possible. (See examples
in Table P13.) These include feed-in tariffs, renewable portfolio standards, net metering, a carbon
tax on fossil-fuel electricity purchases, and green power sales by the utility. (Note: the “Utility”
category in Tables 2–8 also includes cases where a private or non-mandated utility adopts one or
more of these policies voluntarily, motivated by its own interest to promote renewable energy.)
Feed-in tariffs are very common around the world at national levels and in a few cases at
state/provincial levels, but not at local levels (see REN21 Renewables Global Status Report for
2007 and 2009 for more details). However, a new trend in 2008 was for cities and local
governments to consider electric utility feed-in policies and explore how to implement these
policies. The first two cities to adopt a local feed-in tariff in the United States were Gainesville,
Florida, and Los Angeles, both in 2008.
Many cities undertake voluntary actions to promote renewable energy and to serve as a role
model for the private sector and other groups. Demonstration projects are very common; of the
160 cities and local governments in Tables 2–8, more than 50 have conducted demonstrations,
although the number is probably higher. Subsidies, grants, and loans for end-users to install
renewable energy are very common in some specific countries or regions; of the 160 cities and
local governments in Tables 2–8, at least 45 have these policies (see examples in Table P14).
Other voluntary actions include government investment funds that often solicit proposals and invest
in public or private projects (see examples in Table P15), and a wide variety of ways to support or
facilitate private and community initiative (see examples in Table P16). Also in the category of
voluntary actions, a few cities provide municipal land or building rooftops for projects, or sell land

14
with sustainability conditions for its development. Finally, some cities choose to subsidize public-
access biofuels stations, including conversion costs for conventional tanks and pumps, and also
biofuels production and distribution (see examples in Table P10).
Voluntary information and promotion activities are very diverse. Activities among many of the
160 cities and local governments in Tables 2–8 include public media campaigns and programs;
recognition activities and awards; organization of stakeholders; forums and working groups;
training programs; enabling access to finance by local stakeholders; enabling stakeholder-owned
projects; removing barriers to community participation; energy audits and GIS databases; analysis
of renewable energy potentials; information centers; and initiation and support for demonstration
projects.

15
Table 2: Europe – Selected Local Renewable Energy Policies
Regulation based on legal responsibility and jurisdiction
Operation of muni infrastructure
Voluntary actions and government as role model
Target setting
Urban Building Taxes Other Purch Invest Utility Demo Grants Land Other
Info/ promo
Barcelona X X X X X X Berlin X X X X X Bologna X X X Bristol X X X X X X Copenhagen X Cremona X X Edinburgh X X X Frederikshavn X X X X X Freiburg X X X X X Gelsenkirchen X X X X Göteborg X X X Grenoble X X X Hamburg X X X X X X Languedoc reg X X X Lausanne X X X Leister X Linz X X London X X X X X Madrid X X X X X Malmö X X X Milagro X Münster X X Oslo X X X X X Oxford X X X X Paris X X Ponferrada X X X Rhône-Alpes r. X X Rome X X X Rovigo prov. X X X X X Samsø X X X Seville X X Stockholm X X X X X X The Hague X X X Växjö X X X Walloon region X X X X Woking Boro. X X X X X X X X Zaragoza X X X X X

16
Table 3: United States – Selected Local Renewable Energy Policies
Regulation based on legal responsibility and jurisdiction
Operation of muni infrastructure
Voluntary actions and government as role model
Target setting
Urban Building Taxes Other Purch Invest Utility Demo Grants Land Other
Info/ promo
X X X X X X X X
X X X X X X
X X X X X X
X X X X X X
X X
X X X
X X X X
X
X X X
X X X X X
X X X
X X X X X
X X X X X X X
X X X X X X
X X X X X X
X X X X X
X X X X X X X
X X X
X X X X X X
X X X X
X X X X X X X
X X X X X
X X X X
X X X X X
X X X X X X
X X X X X X X
X X X X
X X X X
X X X X X
X X X X X X
X X X X X X X

17
Table 4: Canada – Selected Local Renewable Energy Policies
Regulation based on legal responsibility and jurisdiction
Operation of muni infrastructure
Voluntary actions and government as role model
Target setting
Urban Building Taxes Other Purch Invest Utility Demo Grants Land Other
Info/ promo
Caledon ON X X X X X X Calgary AB X X X X Craik SK X X X Edmonton AB X X Guelph ON X X X X Halifax NS X X X X Hamilton ON X X X X Markham ON X X X X X Mississauga ON X X X Montreal QC X X X Oakville ON X X X Okotoks AB X X X X X Ottawa ON X X X X Richmond Hill ON
X X X X
Sudbury ON X X Surrey BC X X Toronto ON X X X X X X X X Vancouver BC X X X X Winnipeg MB X X Whitehorse YT X X X

18
Table 5: Japan – Selected Local Renewable Energy Policies
Regulation based on legal responsibility and jurisdiction
Operation of muni infrastructure
Voluntary actions and government as role model
Target setting
Urban Building Taxes Other Purch Invest Utility Demo Grants Land Other
Info/ promo
Chiba X X Fukuoka X Hamamatsu X X Hiroshima X X Hokuto X X X X Iida X X X X X X X Kanagawa pr X X X X X X X Kawasaki X X X X X X Kitakyushu X X X X Kobe X X X Kyotango X X Kyoto X X X X X X Matsuyama X X Nagoya X X Niigata X X Osaka X Saitama X X Sakai X X X Sapporo X X X X X X Sendai X Shizuoka X Tokyo X X X X X X X X X X Tsuru X X X X Yokohama X X X X X X X X
Table 6: Australia and New Zealand – Selected Local Renewable Energy Policies
Regulation based on legal responsibility and jurisdiction
Operation of muni infrastructure
Voluntary actions and government as role model
Target setting
Urban Building Taxes Other Purch Invest Utility Demo Grants Land Other
Info/ promo
Adelaide X X X X X X X Alice Springs X X X X X Ballarat X X X Blacktown X X X Brisbane X X X Clarence Vly. X X Hepburn Sh. X X X X Melbourne X X X X X Moreland X X X Nelson (NZ) X X X X X New Castle X X X X Perth X X X X Sydney X X X X X Townsville X X X X
19
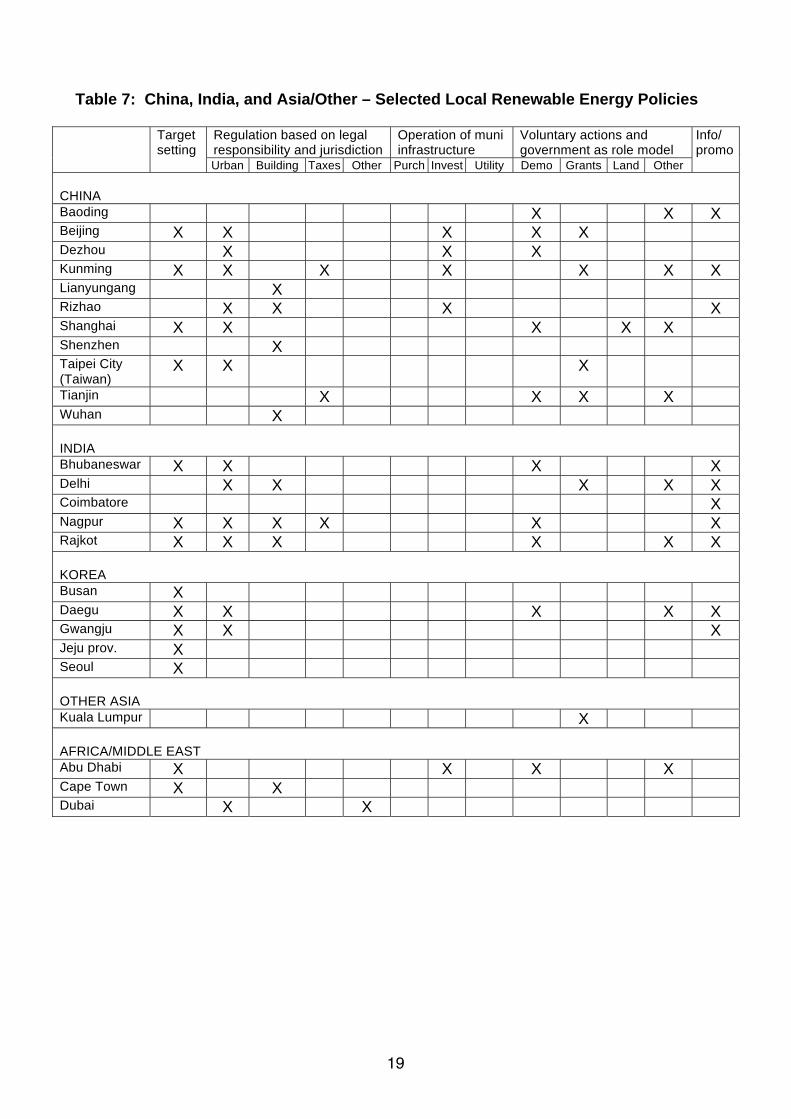
Table 7: China, India, and Asia/Other – Selected Local Renewable Energy Policies
Regulation based on legal responsibility and jurisdiction
Operation of muni infrastructure
Voluntary actions and government as role model
Target setting
Urban Building Taxes Other Purch Invest Utility Demo Grants Land Other
Info/ promo
CHINA Baoding X X X Beijing X X X X X Dezhou X X X Kunming X X X X X X X Lianyungang X Rizhao X X X X Shanghai X X X X X Shenzhen X Taipei City (Taiwan)
X X X
Tianjin X X X X Wuhan X INDIA Bhubaneswar X X X X Delhi X X X X X Coimbatore X Nagpur X X X X X X Rajkot X X X X X X KOREA Busan X Daegu X X X X X Gwangju X X X Jeju prov. X Seoul X OTHER ASIA Kuala Lumpur X AFRICA/MIDDLE EAST Abu Dhabi X X X X Cape Town X X Dubai X X

20
Table 8: Latin America – Selected Local Renewable Energy Policies
Regulation based on legal responsibility and jurisdiction
Operation of muni infrastructure
Voluntary actions and government as role model
Target setting
Urban Building Taxes Other Purch Invest Utility Demo Grants Land Other
Info/ promo
BRAZIL Belo Horizonte X Betim X X X X X X Curitiba X Porto Alegre X X X Rio de Janeiro X São Paulo X MEXICO Cuautitlán Izcalli
X
Mexico City X X X Toluca X X

21
5. LOCAL POLICY CASE SUMMARIES FOR 30 CITIES Note: the following local policy case summaries are unedited and many are not yet reviewed by local experts or officials. In contrast to the policy lists and examples in Tables 2–8 and P1–P16, these cases are intended to show integrated pictures of local policy and action for individual cities. Case summaries from more countries and regions will be included in future editions. Additional cases and reviews of these existing cases are invited. Adelaide, Australia (population 1.2 million). Adelaide s sustainable development planning dates back to the early 2000s when visionaries engaged the community and the city adopted its “green city program” with many new policies. Adelaide also became one of six cities participating in Australia s national “solar cities” program. The Adelaide City Development Plan promotes green buildings and renewable energy technologies. The plan includes targets to make the entire transport sector carbon-neutral by 2012 and the entire building sector carbon-neutral by 2020. There is also a greenhouse gas emissions reduction target for municipal own-use operations of 20% by 2010, compared to 1994. Many renewable energy projects are underway. The city offers $1000 subsidies for solar PV systems larger than 1-kilowatt (kW), and subsidies of $1/watt up to $3000 to install solar PV for lighting in common areas of apartment buildings. In transportation, the city plans to operate solar-electric public buses charged with 100% solar power. Adelaide s green-city program takes place within the context of a ten-year sustainability plans at the state level. Barcelona, Spain (population 1.6 million). Barcelona enacted a city ordinance in 2000 that required solar hot water in all new buildings and major renovations above a size threshold (typically all commercial buildings, and residential buildings of 16 or more households). In 2005, the city eliminated the size requirement so the ordinance now applies to all construction. The ordinance requires 60% of hot water energy to come from solar. This ordinance proved very popular and Barcelona s model was followed by over 70 municipalities and cities throughout Spain enacting similar ordinances. Then, following the local ordinances, Spain enacted a national building code requiring both solar hot water and solar PV in new construction and renovation for larger buildings. Barcelona promotes renewable energy through its 2002–2010 “Plan for Energy Improvement in Barcelona,” which aims to reduce CO2 emissions by 20% by 2010 (compared to 1999), reduce per-capita CO2 emission to 3.15 tonnes/person, and increase renewable energy to 1.1% of total energy consumption. The plan is being implemented and monitored by the Energy Agency of Barcelona. There are also informational and public awareness programs. Betim, Brazil (population 440,000). Betim is one of Brazil's first "model communities" for renewable energy, as part of a six-cities network that also includes Belo Horizonte, Porto Alegre, Salvadore, São Paulo, and Volta Redonda. Betim has established a number of policies to promote biofuels use in transportation. The city mandates biofuels in public buses and taxis, and also gives preference to flex-fuel vehicles for municipal vehicle fleet purchases. The city is also facilitating the addition of solar hot water systems to a low-income housing project being built under a national program. A number of demonstration projects on municipal buildings have been carried out. Betim has also established a "Renewable Energy Reference Center" that raises public awareness; provides information; brings together diverse stakeholders from local, state, and national levels; conducts training and workshops; and conducts outreach to other local communities in Brazil to share Betim's experience. Beijing, China (population 17 million). Beijing s 11th Five-Year Plan (2006-2010) targets a 4% share of electric power capacity from renewable energy by 2010, up from 1% in 2005, and a 6% share of heating capacity by 2010. To achieve these goals, the city allocated 13 billion RMB ($2 billion) over the five-year period. The city is promoting geothermal heat pumps and provides

22
subsidies of 35 RMB/m2 for water-source pumps and 50 RMB/m2 for ground-source pumps. The city has also been installing renewable energy in municipal infrastructure, including 57,000 solar street lamps. The 2008 Beijing Olympic Games boosted renewable energy development with a number of projects—during the games, one-quarter of all energy consumed at event venues was renewable. And Beijing is also supporting renewable energy development in surrounding rural districts. In 2008, Beijing received 2% of its total energy consumption from renewables, and had 3.8 million m2 of solar water heaters and 1.2 megawatts (MW) of grid-tied solar PV installed. There were also biogas digesters in use by 50,000 households, 113 small hydro power plants, and 10 million m2 of heating capacity from water-source geothermal heat pump facilities. Bristol, UK (population 420,000). Bristol is targeting 20% renewable energy use in all new buildings. Bristol also plans to exceed the national plan that all new residential buildings will be carbon-neutral by 2016 and all new commercial buildings will be carbon-neutral by 2019. Bristol has a climate action plan that includes energy management and efficiency, and renewable energy demonstrations. Among the demonstrations are biomass power and heat for schools and hospitals. The city is also planning a public-private venture to develop 20 MW of wind power. Daegu, Korea (population 2.5 million). Daegu declared itself a “solar city” in 2004 and pledged to integrate renewable energy into city development and gradually reduce per-capita greenhouse gas emissions by 2050 “consistent with long-term climate stabilization.” The original plan called for 5% of total energy consumption to come from renewables by 2012. Following that, the city adopted energy-reduction targets for 2015 and 2030. There have also been a number of demonstration projects in public buildings, schools, and universities, and public information campaigns. The city was working on a comprehensive “solar city” ordinance that would establish policy approaches. Frederikshavn, Denmark (population 25,000). This city plans to be 100% renewable by 2015, including the transportation sector. The target emerged in 2006 with national plans to make Frederikshavn a model demonstration city for Denmark, to showcase a diversity of renewable energy technologies, energy management practices, and distributed energy system models. Currently, the city receives 24% of its energy from renewables. The city established the Energy City Frederikshavn Foundation to be responsible for implementing the 100% target, in partnership with major stakeholders (companies, educational institutions, energy planners, and key industry players like steel mills). The expected investment cost to achieve the target is 1 billion Danish kroner. Funds will come from investors, and the city has established a fund for this target with private sector investment. The city also plans to adjust some taxes. Freiburg (i. BR), Germany (population 220,000). Support for renewable energy and climate protection dates back to the 1970s in Freiburg when opposition to nuclear power emerged as a public issue. In 1986, Freiburg developed a new energy supply concept that incorporated renewables, along with energy saving and efficient technologies. The first climate protection concept was established in 1996, which resulted in a number of initiatives. One example of an early policy was the sale of municipal land to developers with the requirement that housing built on the land incorporate renewable energy and exceed national energy efficiency standards–which led to several renewables-intensive low-energy housing districts. In 2007, a new climate protection action plan was created including energy saving, energy efficiency, and renewables. As part of the new plan, an on-line database has been established listing all building roofs in the city and their size and suitability for solar panels. By 2008, all public trams were running entirely on renewable energy, and there existed five wind turbines, a biomass co-generation plant for one city district, 12.3 MW of solar PV, and 15,000 m2 of SHW. Success with renewable energy has been attributed to a shared vision of sustainable development, a multi-stakeholder network, participation and commitment of citizens, and political consensus across parties.

23
Göteborg, Sweden (population 500,000). The city of Göteborg has established a long-term commitment to sustainable energy, including energy-efficient buildings, renewable energy, energy-efficient urban planning, and local energy storage. The project "Göteborg 2050" is developing long-term visions of a future city and region. The project is a collaborative effort between universities, the city government, and the city's energy utility (Göteborg Energi AB). It includes research, scenario development, support for strategic planning, dialogue with the public, and demonstration projects. Göteborg has also pioneered the design and construction of a number of demonstration homes that use only solar energy for heating and hot water, even in the winter. Hamburg, Germany (population 1.8 million). Hamburg was designated by the European Commission as “European Green Capital” of the year for 2011. Hamburg has committed 25 million for new climate change programs and aspires to become a “model region” for climate action. Hamburg s targets are for 40% reduction in CO2 emissions by 2020 and 80% reduction by 2050 (relative to 1990). Hamburg s policy includes several programs, including a solar PV roof-space exchange program; a public-private solar hot water/heating program; designation of additional locations for wind turbines; repowering of existing wind turbines, funding for use of biofuels; and a new university-level research and training program designated “competence cluster renewables.” The city is also planning to develop a model urban district (Wilhelmsburg) that will be supplied entirely from renewable energy by converting existing infrastructure. Kitakyushu, Japan (population 1.0 million). Kitakyushu has a long history of environmental policy, and was selected #1 among environmentally-advanced cities in Japan for both 2006 and 2007, according to a non-governmental competition. The city has also been selected as an “eco-model” city in Japan. In 2007, the city adopted a “Low-Carbon City Vision” that calls for a 50% reduction in greenhouse gas emissions by 2050 (base 2005). The vision focuses on urban structure and sustainable energy and transport. Plans are being developed for a low-carbon city district and future development of the energy system, as well as policies to implement the vision. Currently, subsidies are provided for household solar PV. Kunming, China (population 4.7 million). Kunming aspires to be a “solar capital” of China. In 2008, the city adopted a policy framework “advice on renewable energy development and use” which calls for a 50% share of all buildings in the city to have solar hot water and solar PV by 2010. The framework also established a designated development zone within the city to reach a 70% share, and for new construction to reach a 90% share. Further targets for 2015 include 6 million m2 of solar panels city-wide (both hot water and PV), and solar PV capacity of 100 MW. Other policies to promote renewable energy include low-interest loans, tax exemptions, and a special fund to encourage private investment. The city has also incorporated solar investments into its own procurement. And the city is providing support for R&D, industry development, university education, and a solar hot water equipment testing center. Outside the city, construction of the 166-MW Kunming Shilin solar PV power plant began in late 2008 and will become the largest such plant in China, at a cost of almost $1.5 billion. Linz, Austria (population 190,000). The "Linz Solar City Project" is an integrated solar village for 1300 households on the outskirts of Linz. Construction was to be completed in 2005 and was to include other infrastructure, including shops, schools, and a 7-km tram rail line to the city center. The solar village is made of 2-4 storey buildings with south-facing facades, energy-efficient construction, passive solar heating, and solar electricity. The village includes a network of pedestrian and cycle paths, open space, and underground parking to keep cars separate from living areas. The village design has won several awards and was a joint effort between the city and 12 separate building contractors. Energy heating intensities for the residential buildings in the solar village were expected to be 37 kWh/m2/year, below other low-energy construction in Austria (44 kWh/m2/year) and well below the average in Austria (65 kWh/m2/yr). Similarly, heating

24
intensities for the school buildings were expected to be 30 kWh/m2/yr, much less than the 125 kWh/m2/yr average for other schools in Linz. Münster, Germany (population 270,000). Münster established a climate action plan and advisory council in the early 1990s, along with a CO2 reduction target of 25% by 2005. Through various measures, the city achieved a 21% reduction by 2006. Most of the reduction was from various energy efficiency measures in buildings and in heat and power generation (including district heating), with small contributions from renewables (20 MW of wind power, 4 MW of solar PV, and 13,000 m2 of SHW). In 2008, two new targets were introduced: 40% reduction in CO2 by 2020 (relative to 1990), and 20% of total energy consumption from renewables by 2020. The “Department of Green Spaces and Environmental Protection” was given the mandate to establish activities to meet these targets. Melbourne, Australia (population 3.9 million). Melbourne joined International Cities for Climate Protection in 1998 and Australia s Greenhouse Challenge program in 2000. The City has been investing in demonstration projects for solar power, solar hot water, and green buildings. For example, solar panels installed on the Queen Victoria Market in 2003 generate 250 MWh per year, making this project the largest urban grid-connected solar PV project in the Southern Hemisphere. In 2003, the city adopted the goal of carbon neutrality in its “Zero Net Emissions by 2020” strategy. The intermediate goal is a 20% reduction over 1996 levels by 2010. The strategy plans to achieve carbon neutrality through green building design, energy efficiency, renewable energy, and sequestration through tree planting. The strategy calls for halving energy use in residential and commercial buildings, achieving 45% renewable energy, and halving emissions from non-renewable power generation, all by 2020. In the shorter-term, the “Greenhouse Action Plan 2006-2010” calls for 25% renewable energy in the building sector and 50% of public lighting by 2010. The City Council has also set goals for its own operations: 50% emissions reductions over 1996 levels by 2010 and net zero emissions by 2020. As of 2004/2005, the City Council s operations had reduced emissions 26% over 1996 levels, with the bulk of the reductions achieved in the public lighting and buildings sectors. Nagpur, India (population 2.1 million). Nagpur participated in a local renewables “model communities” program from 2005–2008, paid partly through foreign donor assistance. In 2008, Nagpur was selected as one of the first cities in India s national Solar Cities Program. (Nagpur has also been one of the leading cities implementing the national government s “Jawaharlal Nehru National Urban Renewal Mission.”) Nagpur prepared a city energy report as the baseline for urban energy policy and planning, which analyzed the energy and emissions balance. The city also issued an ordinance mandating solar water heaters for all new residential buildings with more than 1500 m2, with a 10% rebate on property tax as an incentive. Various demonstration projects are underway or planned. And a Renewable Energy Resource Center was established to facilitate dialogue with local stakeholders, to identify and collect various forms of information, and to publish newsletters and brochures. Awareness campaigns include a mobile van, formation of “energy clubs” in schools, and training for students and school teachers. Nagpur is actively seeking political support for policy changes, engaging citizens in awareness activities and consulting diverse stakeholder groups with an interest in local renewables, and aims for further policies to increase the use of renewable energy and energy efficiency. The city is targeting a 20% reduction in conventional energy consumption of municipal buildings and services by 2012. Nelson, New Zealand (population 59,000). Nelson aims to become New Zealand s first “solar city” and is engaged in a range of activities for solar hot water and renewable electricity. The city s overall goal is to reduce greenhouse gas emissions by 40% by 2020, relative to 2001. Starting with a pilot phase for solar hot water as a collaboration of businesses and non-profits with the city, at least 1400 installations are targeted over four years. The program benefits from national solar hot water subsidies of NZ$1000/system for households and $500/m2 for public buildings. The city

25
plans to involve local banks in end-user financing, and is also hoping to establish a revolving fund for household credit and to engage in bulk purchasing with tenders to lower costs. The city is promoting renewable energy in public buildings and in urban design protocols, and further efforts are planned to develop the local market for distributed solar power. Oslo, Norway (population 580,000). In 2005, Oslo adopted a 50% CO2 reduction target by 2030. Oslo plans to increase use renewable energy in its transport system and to entirely phase-out fossil-fuels for heating buildings by 2020. It plans to procure vehicles for municipal use that will be low-carbon or electric, and to improve facilities and incentives for electric vehicles, such as free parking and exemption from road tolls. An energy-efficiency fund operated from 1997-2007 and provided up to 20% of capital costs, including replacement of oil-fired heating boilers with renewable energy, and installation of wood-pellet heaters. A new project plans to produce biogas from organic household waste and sewage sludge. (In 2008, 62% of public transport journeys were made by rail using renewable energy.) Oxford, UK (population 150,000). The "Oxford Solar Initiative" began in 2002 as a partnership between the city, Oxford Brooks University, and the local community. Officially launched in July 2003, it has three main goals: (1) to add a sustainable energy element to urban planning strategies; (2) to set targets, conduct baseline studies, and develop long-term scenarios; and (3) to develop sustainable urban energy technologies. The primary target of the initiative is for 10% of all homes in the city to have solar energy by 2010. There are also two-year targets for installation of specific numbers of energy efficiency measures, solar hot water systems, and solar electric systems. The two-year targets are visible to the public, lending a community participation element to achieving the targets. The initiative also includes CO2 reduction targets and capacity building for the local government. An extensive array of subsidies and incentives are available to homeowners for improving the energy efficiency of their homes and installing solar hot water and solar electricity, including 50% of the full cost of solar PV systems and up to £500 for solar hot water systems. The Oxford Solar Initiative web site explains the basics of energy efficiency, solar hot water, and solar electric technologies, and explains the various subsidies and incentives available to homeowners and how to apply for them. As part of the initiative, Oxford has been conducting analyses of the CO2 emissions of its built environment using geographic information systems. Portland OR, USA (population 580,000). Portland has an extensive history of land-use and transportation planning dating back 30 years. Portland first adopted a local energy policy in 1979, the first in the United States. Portland's first greenhouse gas reduction plan was adopted in 1993 (also a U.S. first), and then updated in 2001 with a goal of reducing greenhouse gas emissions to 10% below 1990 levels by 2010. The plan also calls for 100% of the municipal government's electricity to come from renewable energy by 2010. In 2006, the city adopted the first local renewable fuels standard in the United States, which mandates 5% biodiesel and 10% ethanol blending with all diesel and gasoline sold within the city limits. The city purchases biofuels for municipal fleet vehicles and also established a $450,000 Biofuels Investment Fund that supports various biofuels production and distribution projects, including projects to install or convert fueling equipment. The city also launched a five-year $2.5 million Green Investment Fund with private partners that is investing in renewable energy projects, and the city facilitates business partnerships for renewable energy investment and green power sales. The Bureau of Planning and Sustainability oversees these efforts. Rizhao, China (population 2.8 million). Rizhao, in Shandong Province, has been promoting solar hot water for the past 15 years. Currently, 99% of households in central Rizhao use solar hot water and most traffic signals, street lights, and park lights are solar powered. In the surrounding suburbs, more than 30% of households use solar hot water. The provincial government of Shandong has a policy to support research and development in the solar industry, and this policy helped lower the cost of a solar hot water heater to the level of an ordinary electric heater. The city

26
capitalized on this development with policies to promote solar hot water among the public. All new buildings are required to include solar hot water, and the government oversees construction to ensure that this regulation is enforced and the panels are properly installed. The government has also run educational campaigns to encourage people to install solar in their homes, and some government bodies and businesses have provided solar installations to their employees for free. Partly due to the widespread use of solar energy, Rizhao is consistently among the top 10 cities in China in terms of air quality. Samsø, Denmark (population 4,200). This off-shore island community has already become “carbon-negative” and 100% renewable-electricity powered. Wind turbines provide power, with three-quarters of the generated power sold to mainland Denmark. The exported power more than offsets vehicle emissions and a small number of furnaces burning fossil fuels. The community began the task in 1998 of becoming 100% renewable by 2008, inspired by a national competition by the Danish government. No funding was obtained from outside the community. Rather, local citizens invested in renewable energy projects by buying shares. The investments were marketed as business opportunities, secured by revenue guarantees based on the national feed-in-tariff policy. Stockholm, Sweden (population 810,000). Stockholm was designated by the European Commission as “European Green Capital” of the year for 2010. Stockholm has developed a series of climate action plans over time, first in 1996, then in 2000, and again in 2008. Stockholm s ultimate goal is to become fossil-fuel free by 2050. The current plan include a wide range of energy efficiency and energy-related measures, including green electricity purchases, solar hot water, and use of biofuels in public transit buses. The city plans that 50% of all buses should run on biogas or ethanol by 2011, and 100% of buses by 2025. Metro and commuter trains already run on renewable electricity. The city is promoting biofuels in private vehicles, including new filling stations and free parking for biofuel-using vehicles. The city is also promoting greater use of biomass for district heating and co-generation. And information campaigns are educating households, employees, and school children about their emissions. From 1990 to 2005, per-capita CO2 emissions were reduced from 5.5 tonnes to 4.0 tonnes. The target for per-capita emissions by 2015 is 3.0 tonnes. Tokyo, Japan (population 13 million). Tokyo s main targets are to reduce CO2 emissions by 25% by 2020, and to increase the share of renewable energy to 20% of total energy consumption by 2020. These targets were established in 2006 with the Tokyo Renewable Energy Strategy and a climate change action plan that called for emissions trading and was subsequently merged into the Tokyo Environmental Master Plan (2008). Those plans contained a further target for 1 GW of solar PV within city limits. The city provides subsidies to households for solar PV (JPY 100,000/kW) and solar hot water (up to JPY 33,000/m2), on condition that the resulting green-electricity and “green-heat” certificates become the property of the city government for trading. That trading is due to get a large boost starting in 2010 when a mandatory carbon cap-and-trade system will be imposed on large businesses. Obligated businesses will meet obligations by reducing emissions or by trading green-electricity certificates and green-heat certificates derived from solar hot water. The city is also facilitating a “Green Energy Purchasing Forum” for trading of green-electricity and green-heat certificates by all consumers and buyers that is designed to encourage “demand-pull” for renewable energy. The city also mandates that public and some other facilities must purchase green certificates equal to 5% of electricity use and also purchases biodiesel for public buses. Toronto, Canada (population 2.5 million). Toronto currently has several municipal representatives and a mayor that campaigned to prioritize environmental protection. The city targets greenhouse gas emissions reductions of 6% by 2012, 30% by 2020, and 80% by 2050. The city also targets local pollutant emissions reductions of 20% by 2012. To help achieve these targets, the city plans to obtain 25% of electricity for municipal operations and buildings from renewable energy, by 2012.
27
The city purchases biodiesel for its entire municipal vehicle fleet, and has established a $20 million Sustainable Energy Fund to provide low-interest financing for renewable energy projects. Toronto has installed solar PV on public buildings and is also facilitating “solar neighborhood” initiatives that promote innovative modes of community ownership. Woking Borough, UK (population 91,000). The borough has installed combined heat-and-power in city council offices, as well as scattered mini-power stations, solar rooftop PV, and district heating. The town centre is energy self-sufficient and exports any surplus power. Diurnal and seasonal differences in solar and combined heat and power (CHP) are managed comprehensively. The borough has mandated that 10% of the energy required by all commercial and residential development must be generated by on-site RE and if this development is large, CHP is required. The borough has developed 20–30 year business/investment plans for renewable energy, requiring minimum internal rate of return (IRR) of 8% and expected revenue from both energy sales and green certificates. Money from energy savings through energy efficiency investments is used for further energy savings and renewable energy infrastructure development. Woking has partnered with the council energy company, Thamesway Energy Limited, and receives income from energy savings derived from the Council s Housing energy conservation, renewable energy, and CHP programs in the residential sector. Future priorities are to expand the number of CHP/renewable energy stations in the borough; to ensure that private power developers are connecting to Woking s local (private wire) distributed generation system, or supplying power for their own uses; and to build external partnerships and encourage private wire distributed generation systems elsewhere. Yokohama, Japan (population 3.6 million). Yokohama adopted a comprehensive urban plan “Yokohama Energy Vision” in 2008 that includes promotion of renewable energy. Central to this plan are targets to reduce greenhouse gas emissions by 30% by 2025 and by 60% by 2050 (base 2004). Two-thirds of the emissions reduction will come from energy efficiency and one-third from renewable energy, which implies a ten-fold increase in renewable energy use by 2025. To achieve the target, a number of renewable-energy-related measures have been adopted: a requirement that large commercial buildings formulate CO2 reduction plans; installations of solar PV on government buildings and schools; subsidies for household solar PV; promotion of green-power certificate trading and purchases; use of city building rooftops for private renewable energy installations; and implementation of city-owned renewable energy projects that are financed by businesses and citizen-investors. The city is also considering solar hot water requirements for new construction. In the transport sector, the city is promoting a long-term roadmap for electric vehicles and ultimately a zero-emission transport system.

28
6. FURTHER RESEARCH This report is still a work in progress. The ultimate purpose of this report is to
• Give an understanding to the global energy/environment community of the importance of cities for renewables and show how much is being done.
• Inform and inspire people in cities (especially decision-makers and local government staff) to do more and give them basic knowledge to understand opportunities and possibilities.
• Show how communities are influenced by local governments (and vice-versa) in investing in renewable energy.
• Give insight into potentials -- how much renewables are possible at the local level given specific conditions and policies.
There are at least seven basic types of information that can be collected about local renewable energy around the world. This working draft report is only addressing type #1, but future editions should consider the other categories as well. 1. Policies and targets: Which policies exist? What are future targets? 2. Indicators: Which indicators best show the extent to which renewables are used or possible (actual and potentials), and what do those indicators show for cities worldwide? 3. Enabling (framework) conditions: What factors and conditions most influence (enable/inhibit) city action or inaction? For example:
What legal authorities exist that allow city action? Do national or state policies help the city in its goals? Do they hinder? Have city policies keyed off the national or state policies? Who are key stakeholders in regard to renewable energy and how do they participate? Is there a “renewable energy champion” within the city government?
4. Influence on national policies: How are national policies affected by local policies? Are there mechanisms by which local policy initiative eventually translates into national policy? 5. Policy-making processes: What are the historical and ongoing policy-making processes related to renewables? Who has shaped, led, and/or hindered those processes? 6. Results: Have policies been effective? What are the impacts and outcomes? Evidence? 7. Associations: How does the city participate with national or global associations related to renewable energy or climate change? Which associations and what benefits result?

29
POLICY EXAMPLES Table P1: Targets for CO2 Emissions Reductions Austin TX, USA Zero net emissions (“carbon-neutral”) by 2020 Adelaide, Australia Zero net emissions in transport (by 2012) and buildings (by 2020), and
reduce 20% by 2010 for government own-use emissions (base 1994) Ballarat, Australia Reduce 30% by 2010 (base 2000) and zero net emissions by 2020 Barcelona, Spain Reduce 20% by 2010 (base 1999); also reduce per-capita emissions
to 3.15 tonnes equivalent CO2/person by 2010 Berlin, Germany Reduce 25% by 2010 (base 1990) Berkeley CA, USA Reduce 80% in government own-use emissions by 2050 Bologna, Italy Reduce 6.5% by 2012 Busan, Korea Reduce 10% by 2015 (base 2005) Calgary AB, Canada Reduce 20% by 2020; 50% by 2050 (base 2005) Chicago IL, USA Reduce 25% by 2020 (base 1990) Copenhagen, Denmark Reduce 20% by 2015; zero net emissions by 2025 Edmonton AB, Canada Reduce 20% by 2020 (base 1990) Freiburg i. BR, Germany Reduce 40% by 2030 (base 1992) Guelph ON, Canada Reduce 6% by 2010; 20% by 2010 for businesses (base 1994) Gwangju, Korea Reduce 20% by 2020 (base 1990) Halifax NS, Canada Reduce 20% by 2012 (base 1997) Hamburg, Germany Reduce 40% by 2020 and 80% by 2050 (base 1990) Hamilton ON, Canada Reduce 20% by 2020 (base 1990); 10% by 2012 and 20% by 2020 for
businesses (base 2005) Hepburn Shire, Australia Reduce 20% by 2010 for government own-use Iida City, Japan Reduce 40-50% by 2030 for households and 70% by 2050 (base
2005) Kawasaki, Japan Reduce 6% by 2010 (base 1990) Kitakyushu, Japan Reduce 50% by 2050 (base 2005) Kyoto, Japan Reduce 10% by 2010 London, UK Reduce 20% by 2010 and 60% by 2050 (base 1990) Madrid, Spain Reduce 14% by 2012 and 50% by 2050 Malmö, Sweden Reduce 25% by 2012 (base 1990) Melbourne, Australia Reduce 30% by 2010 and zero net emissions by 2020; reduce street
lighting 50% by 2010 (base 1996) Montreal QC, Canada Reduce 20% by 2012 Moreland, Australia Zero net emissions by 2030; zero net emissions by government own-
use by 2020 Münster, Germany Reduce 40% by 2020 (base 1990) Nelson, New Zealand Reduce 40% by 2020 (base 2001) New Castle, Australia Reduce 25% below 2008 BAU scenario; 30% for government own-use
emissions (base 1995) New York City, USA Reduce 7% by 2012 (base 1990) Oakville ON, Canada Reduce 6% by 2014; 20% for businesses (base 2004) Oslo, Norway Reduce 50% by 2030 (base 1991) Ottawa ON, Canada Reduce 20% by 2012 (base 1990) Portland OR, USA Reduce 10% by 2010 (base 1990) Rhône-Alpes, France Reduce 20% by 2020 Seoul, Korea Reduce 25% by 2020 (base 1990) Stockholm, Sweden Reduce per-capita CO2 to 3.0 tonnes/person by 2015 (base 5.5
tonnes/person in 1990)

30
Table P1: Targets for CO2 Emissions Reductions (continued) Saitama, Japan Reduce 6% per-capita by 2010 (base 1990) Sapporo, Japan Reduce 6% per-capita by 2010 (base 1990); reduce 10% total by 2017
(base 1990) Sendai, Japan Reduce 7% per-capita by 2010 (base 1990) Sydney, Australia Reduce 70% by 2030 (base 2006); reduce 70% by 2050 (base 1990);
reduce 20% by 2012 for government own-use (base 2006) Tokyo, Japan Reduce 25% by 2020 (base 2000) Toronto ON, Canada Reduce 6% by 2012; 30% by 2020; 80% by 2050 Winnipeg MB, Canada Reduce 20% by 2018 (base 1998) Whitehorse YT, Canada Reduce 6% by 2013 (base 2001); 20% for municipal own-use (base
1990) Vancouver BC, Canada Reduce 6% by 2012 (base 2007); 33% by 2020; 80% by 2050; and all
new buildings should be carbon-neutral by 2030 Växjö, Sweden Reduce 50% per-capita by 2010 and 70% by 2025 Yokohama, Japan Reduce 30% per-capita by 2025; 60% per-capita by 2050 Table P2: Targets for Share of Renewable Electricity Austin TX, USA 30% by 2020 Adelaide, Australia 15% by 2014 Ann Arbor MI, US 20% by 2015 Cape Town, S. Africa 10% by 2020 Freiburg i. BR, Germany 10% by 2010 Taipei City, Taiwan 12% by 2020 Sydney, Australia 25% by 2020 Table P3: Targets for Share or Amount of Renewable Energy Ballarat, Australia 10% of total energy by 2016 Beijing, China 4% of electric power capacity by 2010 and 6% of heating capacity Bhubaneswar, India 2% reduction in conventional energy consumption by 2012 (compared
to 2005) Bristol, UK 20% of energy used by new buildings Calgary AB, Canada 30% of total energy by 2036 Cape Town, South Africa 10% of total energy by 2020 Daegu, Korea 5% of total energy by 2012; 15% reduction in (total/conventional)
energy consumption by 2030 Guelph ON, Canada 25% of total energy by 2023 Grenoble, France 21% of total energy (currently 8%) Gwangju, Korea 2% of total energy by 2020 Halifax NS, Canada 30% of energy for commercial buildings Kawasaki, Japan 8 PJ by 2010 Kobe, Japan 3-4% of energy by 2010 Leicester, UK 10% of total energy by 2010 and 20% by 2020 London, UK 665 GWh of electricity and 280 GWh of heat by 2010 Lübow-Krassow district, Germany
100% of total energy by 2030
Lüchow-Dannenberg district, Germany
100% of total energy by 2010-2015

31
Table P3: Targets for Share or Amount of Renewable Energy (continued) Madrid, Spain 20% reduction in fossil-fuel use by 2020 Münster, Germany 20% of total energy by 2020 Melbourne, Australia 25% of electricity for residential buildings and 50% of public lighting by
2010 Nagpur, India 3% reduction in conventional energy consumption by 2012 (compared
to 2005) Niigata, Japan 3 PJ by 2012 Rajkot, India 10% reduction in conventional energy consumption by 2013 Rhône-Alpes, France 23% of total energy by 2020 Saitama, Japan 6.7% of total energy by 2012 Salt Lake City, USA 10% of energy used for new buildings Shanghai, China 5% of energy (capacity) by 2010 Subury ON, Canada 50% of energy from “local sources” Taipei City, Taiwan 12% of total power generating capacity by 2020 Tokyo, Japan 20% of total energy by 2020 Växjö, Sweden 100% of total energy (fossil-fuel free) Yokohama, Japan 10-fold expansion of renewable energy by 2025 Table P4: Targets for Installed Capacity of Renewable Energy Adelaide, Australia 2 MW of solar PV on residential and commercial buildings Barcelona, Spain 100,000 m2 of solar hot water by 2010 Kunming, China 6 million m2 surface area covered by of solar PV and solar hot water,
with at least 100 MW solar PV Leister, UK 1000 buildings with solar hot water by 2010 Los Angeles, USA 1.3 GW of solar PV by 2020, though a combination of residential and
commercial programs and city-owned facilities Nagoya, Japan solar PV for 23,000 households and 13,000 businesses Philadelphia, USA 58 MW of solar PV by 2021 Rovigo prov., Italy 13,000 m2 of solar hot water and 1.3 MW of solar PV by 2010 Sakai, Japan solar PV for 10,000 households by 2013 and 100,000 by 2030 Shanghai, China 200-300 MW of wind and 10 MW of solar PV by 2010 Sudbury ON, Canada 150 MW of wind and 10 MW small-hydro Tokyo, Japan 1 GW of added solar PV by 2010 Walloon region, Belgium
200,000 m2 of solar hot water/heating collectors by 2010

32
Table P5: Targets for Local Government Own-Use Purchases of Renewable Energy Austin TX, USA 100% of own-use electricity by 2012 Boston, USA 11% of own-use electricity (currently) Bhubaneswar, India reduce by 15% own-use conventional energy by 2012 Bristol, UK 15% of own-use electricity (14% currently) Calgary AB, Canada 100% of own-use electricity by 2012 Chicago, USA 20% of own-use electricity by 2006 Hepburn Shire, Australia 100% for own-use in buildings, 8% for public lighting Houston TX, USA 50% of own-use electricity (currently) Kawasaki, Japan 5% of own-use electricity (currently) Mississauga ON, Canada 100% of own-use electricity for city center (currently) Nagpur, India reduce by 20% own-use conventional energy by 2012 New York City, USA 20 MW of wind power for own-use by 2008 Okotoks AB, Canada 80% of own-use electricity (currently) Philadelphia PA, USA 15% of electricity for city buildings by 2015 Portland OR USA 100% of own-use electricity by 2010 Santa Monica CA, USA 100% of own-use electricity (currently) Sydney, Australia 100% of own-use energy Woking Borough, UK 20% of own-use electricity by 2011 Tokyo, Japan 5% of electricity by 2020 for public facilities Toronto ON, Canada 25% of own-use electricity by 2012 Sydney, Australia 100% of own-use electricity for buildings; 20% for street lighting Table P6: Targets for Share of Buildings with Renewable Energy Cape Town, S. Africa 10% of homes with solar hot water by 2010 Dezhou, China 50% of buildings with solar hot water by 2010 Iida City, Japan 30% of homes with solar PV by 2010 Kunming, China 50% of buildings with solar hot water and/or solar PV by 2010; 90% of
new construction Oxford, UK 10% of homes with solar hot water and/or solar PV by 2010

33
Table P7: Urban Planning Adelaide, Australia “Adelaide City Development Plan” calls for green buildings and
renewable energy technologies Barcelona, Spain “Plan for Energy Improvement in Barcelona (2002-2010)” includes
increasing the share of renewable energy used Berlin, Germany “Berlin Energy Action Plan” Dubai, UAE Sustainable Development Policy Guelph ON, Canada “Community Energy Plan” Göteborg, Sweden “Göteborg 2050” envisions being fossil-fuel-free by 2050 Halifax NS, Canada “Community Energy Plan” Hamburg, Germany Developing Wilhelmsburg model urban district supplied entirely from
renewables Hokuto, Japan “Hokuto New Energy Vision” Kawasaki, Japan “Kawasaki City New Energy Vision” Kobe, Japan “Kobe City New Energy Vision” London, UK “London Energy Strategy” calls for “sustainable energy system” by 2050 Melbourne, Australia “Zero Net Emissions by 2020” calls for green building design, energy
efficiency, renewable energy, and tree planting. Mexico City, Mexico “Proaire 2002-2010” targets reduced reduced air pollution and
greenhouse gas emissions. Projects include energy efficiency and solar hot water in the residential sector.
New York City, USA “PlaNYC 2030” encourages solar and distributed generation, pilot projects
Ottawa ON, Canada “Ottawa 2020” and “Air Quality and Climate Change Management Plan” Porto Alegre, Brazil “Program to Encourage the Use of Solar Energy in Buildings” Saitama, Japan “Saitama City New Energy Vision” Salt Lake City, USA "Salt Lake City Green" environmental plan includes wind power
purchases Shanghai, China “Regulations of Renewable Energy Development in Shanghai” Stockholm, Sweden Climate action plan to become fossil-fuel free by 2050, including greater
use of biomass for district heating and cogeneration and biofuels for public transit
Taipei City, Taiwan “Renewable Energy Promotion Plan” Tokyo, Japan “Tokyo Renewable Energy Strategy” (2006); “Tokyo Environment
Master Plan” (2008); “Tokyo Climate Change Action Plan” (2007) Toronto ON, Canada “Sustainable Energy Action Plan” Tsuru, Japan “Tsuru Regional New Energy Vision” Växjö, Sweden “Fossil Fuel Free Växjö” to reduce per-capita CO2 emissions Yokohama, Japan "Yokohama Energy Vision" targets commercial and public buildings,
electric vehicles, solar PV subsidies, green power certificates, and solar hot water mandates
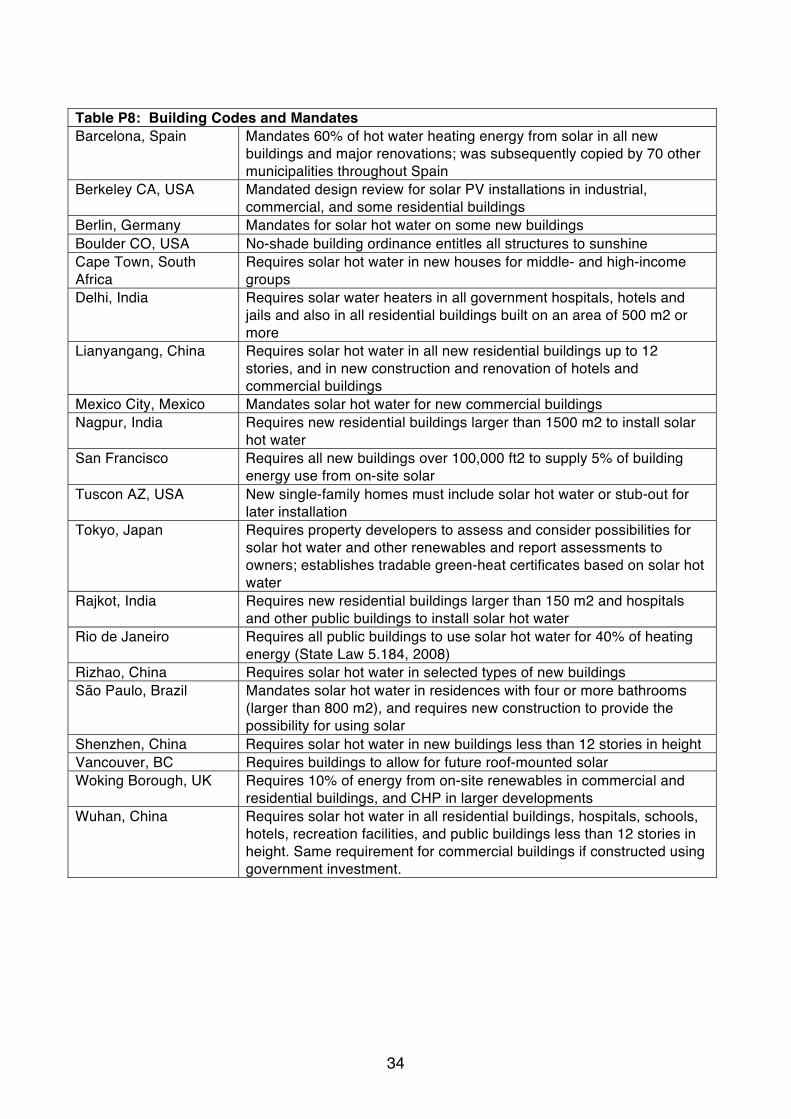
34
Table P8: Building Codes and Mandates Barcelona, Spain Mandates 60% of hot water heating energy from solar in all new
buildings and major renovations; was subsequently copied by 70 other municipalities throughout Spain
Berkeley CA, USA Mandated design review for solar PV installations in industrial, commercial, and some residential buildings
Berlin, Germany Mandates for solar hot water on some new buildings Boulder CO, USA No-shade building ordinance entitles all structures to sunshine Cape Town, South Africa
Requires solar hot water in new houses for middle- and high-income groups
Delhi, India Requires solar water heaters in all government hospitals, hotels and jails and also in all residential buildings built on an area of 500 m2 or more
Lianyangang, China Requires solar hot water in all new residential buildings up to 12 stories, and in new construction and renovation of hotels and commercial buildings
Mexico City, Mexico Mandates solar hot water for new commercial buildings Nagpur, India Requires new residential buildings larger than 1500 m2 to install solar
hot water San Francisco Requires all new buildings over 100,000 ft2 to supply 5% of building
energy use from on-site solar Tuscon AZ, USA New single-family homes must include solar hot water or stub-out for
later installation Tokyo, Japan Requires property developers to assess and consider possibilities for
solar hot water and other renewables and report assessments to owners; establishes tradable green-heat certificates based on solar hot water
Rajkot, India Requires new residential buildings larger than 150 m2 and hospitals and other public buildings to install solar hot water
Rio de Janeiro Requires all public buildings to use solar hot water for 40% of heating energy (State Law 5.184, 2008)
Rizhao, China Requires solar hot water in selected types of new buildings São Paulo, Brazil Mandates solar hot water in residences with four or more bathrooms
(larger than 800 m2), and requires new construction to provide the possibility for using solar
Shenzhen, China Requires solar hot water in new buildings less than 12 stories in height Vancouver, BC Requires buildings to allow for future roof-mounted solar Woking Borough, UK Requires 10% of energy from on-site renewables in commercial and
residential buildings, and CHP in larger developments Wuhan, China Requires solar hot water in all residential buildings, hospitals, schools,
hotels, recreation facilities, and public buildings less than 12 stories in height. Same requirement for commercial buildings if constructed using government investment.

35
Table P9: Tax Credits and Exemptions Belo Horizonte, Brazil Tax credits for residential solar Caledon ON, Canada Property development fee discount of 5% if projects include some
form of on-site renewable energy Nagpur, India Property tax credit of 10% for solar hot water in new residential
buildings New York, USA Property tax abatement for solar PV (35% first three years; 20%
years four and five) Table P10: Transport Infrastructure and Fuels Mandates, Operation, Investment, and Subsidies Adelaide, Australia Operate solar-electric public buses and charge using 100% solar
electricity Ann Arbor MI, USA Subsidies for public-access biofuels stations Ballarat, Australia Plan to use biodiesel in municipal fleet vehicles Betim, Brazil Mandates for biofuels in public transport and taxis (plan through
2017); also preference to flex-fuel vehicles for municipal vehicle fleet purchases.
Calgary AB, Canada B5 and B20 used in municipal fleet vehicles Curitiba, Brazil Plan to use biofuels in all municipal buses Halifax NS, Canada B5 used in municipal fleet vehicles and public transit; target of 15%
biofuels in fleet Markam ON, Canada Biofuels used in municipal fleet vehicles Mississauga ON, Canada B5 used in municipal fleet vehicles and public transit New Castle, Australia B20 used in public vehicles Ottawa ON, Canada B5 and E10 fuels used in municipal fleet vehicles Portland OR, USA Mandate for biofuels blending B5 and E10 for all diesel and gasoline
sold within city limits; biofuels investment fund to enhance production, storage, distribution; biofuels infrastructure grants for conversion of fueling stations; use of biofuels in municipal fleet vehicles
Stockholm, Sweden Plan to have 50% of all public transit buses run on biogas or ethanol by 2011, and 100% of buses by 2025; also investment in additional biofuels filling stations and promotion of private use of biofuels, for example with free parking.
Table P11: Carbon Cap-and-Trade Schemes Tokyo, Japan Carbon cap-and-trade system imposed on large businesses starting
in 2010. Obligated businesses will trade green-electricity certificates and green-heat certificates derived from solar hot water.
Table P12: Promotion and Market-Facilitation Agencies and Departments Barcelona, Spain Energy Agency of Barcelona Betim, Brazil Renewable Energy Reference Center Dubai, UAE Renewable Energy Division Gelsenkirchen, Germany Solar City Gelsenkirchen Münster, Germany Department of Green Spaces and Environmental Protection Nagpur, India Renewable Energy and Energy Efficiency Resource Center Portland OR, USA Bureau of Planning and Sustainability Tokyo, Japan Division of Global Urban Environment

36
Table P13: Electric Utility Policies Austin TX, USA Renewable portfolio standard 30% by 2020 Boulder CO, USA Carbon tax on fossil-fuel electricity purchases Gainesville FL, USA Feed-in tariff for solar PV (32 cents/kWh for 20 years) Los Angeles, USA Feed-in tariff for solar PV Mexico City, Mexico Net metering for solar PV Minneapolis MN, USA Renewable portfolio standard 30% by 2020 (for Xcel Energy) New York City, USA Net metering up to 2 MW capacity Oakville ON, Canada Local utility voluntary green power sales Table P14: Subsidies, Grants, and Loans Adelaide, Australia Subsidy for solar PV, A$1000/watt for systems > 1kW Alice Springs, Australia Subsidies for solar hot water (35%) Austin TX, USA Subsidies for solar PV and solar hot water in homes and businesses,
and low-interest loans for solar PV Beijing, China Subsidies for ground-source heat pumps (50 RMB/m2) and water-
source heat pumps (35 RMB/m2) Berkeley CA, USA Loans to households for solar PV, repaid through property tax bills Berlin, Germany Subsidies for solar PV (40%) and solar hot water (30%) on apartment
buildings Delhi, India Subsidies to non-commercial institutions for solar hot water on
buildings of system size 100–6000 liters hot water per day (6,000–60,000 rupees/system)
Kanagawa, Japan Loans to households for solar PV, solar hot water, and wind Kawasaki, Japan Subsidies for solar PV for households (JPY 70,000/kW up to 3.5 kW) Kyoto, Japan Subsidies for solar PV for households (JPY 50,000/kW up to 4 kW) Honolulu HI, USA Solar Roofs Loan Program provides 7-year low-interest loans (0-2%)
and installation in partnership with local electric utility, for low-income residents
Matsuyama, Japan 12.5% of solar PV cost for systems less than 10 kW; JPY 1 million for systems larger than 10 kW
New York NY, USA Property tax abatement for solar PV (35% first three years; 20% years four and five)
Ototoks AB, Canada Revolving fund provides finance for solar Orlando FL, USA Subsidy for solar PV in commercial buildings Porto Alegre, Brazil Grants for installation of solar hot water in buildings (fixed grant per
installation) Rome, Italy Subsidies for solar hot water (up to 30%) and solar PV (up to 60%) Sapporo, Japan Subsidies for solar PV for households (10%) Taipei City, Taiwan Subsidies for solar hot water Tianjin, China Subsidies, discounted loans, and tax rebates Tokyo, Japan Subsidies for solar PV in 2009 and 2010 (JPY 100,000/kW) and solar
hot water (up to JPY 33,000/m2 based on type) Toronto ON, Canada Sustainable energy fund provides low interest loans for renewables Yokohama, Japan Subsidies for solar PV (JPY 65,000/kW, up to 4 kW)
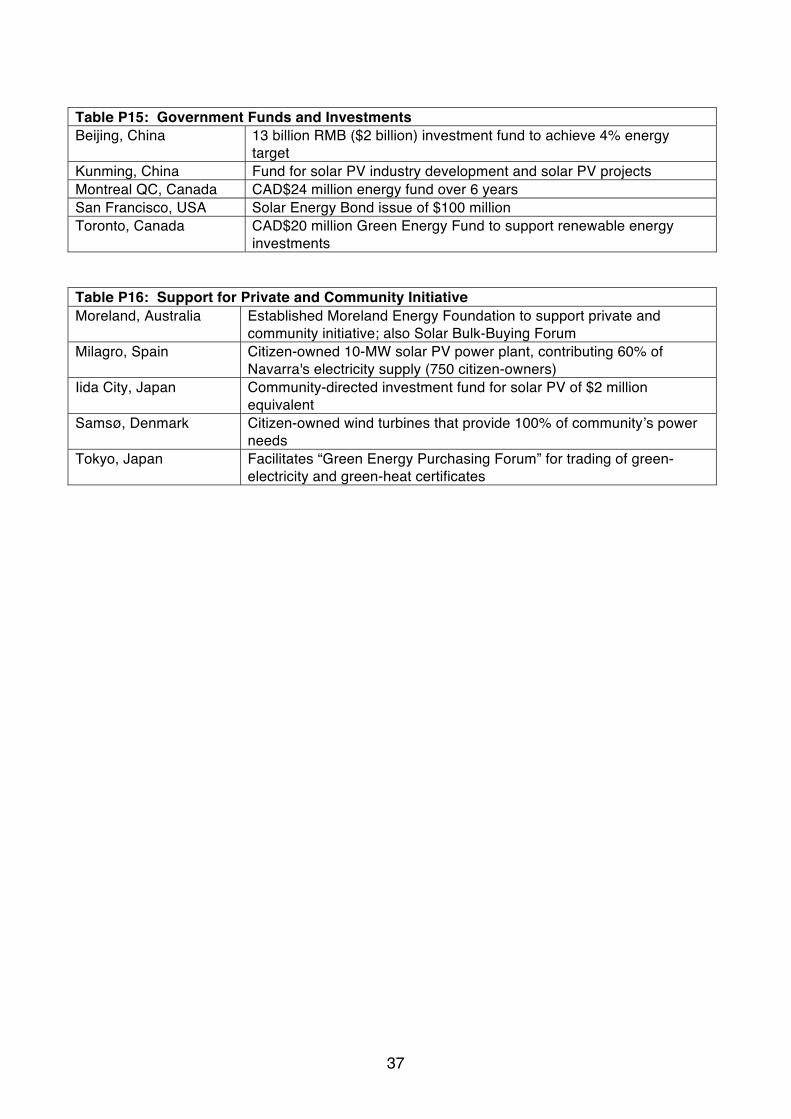
37
Table P15: Government Funds and Investments Beijing, China 13 billion RMB ($2 billion) investment fund to achieve 4% energy
target Kunming, China Fund for solar PV industry development and solar PV projects Montreal QC, Canada CAD$24 million energy fund over 6 years San Francisco, USA Solar Energy Bond issue of $100 million Toronto, Canada CAD$20 million Green Energy Fund to support renewable energy
investments Table P16: Support for Private and Community Initiative Moreland, Australia Established Moreland Energy Foundation to support private and
community initiative; also Solar Bulk-Buying Forum Milagro, Spain Citizen-owned 10-MW solar PV power plant, contributing 60% of
Navarra's electricity supply (750 citizen-owners) Iida City, Japan Community-directed investment fund for solar PV of $2 million
equivalent Samsø, Denmark Citizen-owned wind turbines that provide 100% of community s power
needs Tokyo, Japan Facilitates “Green Energy Purchasing Forum” for trading of green-
electricity and green-heat certificates