global market outlook - solarpowereurope.org · associations, of the gw+ scale solar markets, to...
TRANSCRIPT

Global Market OutlookFor Solar Power / 2018 - 2022
Supported by:
Caption to image. © SPE
www.africa-eu-renewables.orgThe RECP is a programme of the Africa-EU Energy Partnership (AEEP),
a partnership between the European Union and the African Union
Finance CatalystThe Finance Catalyst links projects to finance opportunities targeting small- and medium-scale renewable energy projects in Africa.
EventsOur matchmaking and information events provide insights into African RE markets and link European and African entrepreneurs and financiers.
Funding DatabaseRECP has developed a database on funding instruments financing private sector projects on renewable energy in Africa.
Market InformationRECP offers a variety of products to give your business an overview on the energy markets of selected African countries.
CONNECTING AFRICAN AND EUROPEAN DEVELOPERS AND INVESTORS
Africa-EU Renewable Energy Cooperation Programme (RECP)
SolarPower Europe / GLOBAL MARkET OUTLOOk fOR SOLAR POWER 2018-2022 / 3
FOREWORD
Thanks to our Sponsor Members:
JAMES WATSONCEO
MICHAEL SCHMELAEXECUTIVE ADVISOR
Welcome to SolarPower Europe’s Global Market Outlook 2018 – 2022. We are very proud that our market intelligence teamhas been awarded the ‘Winner for Best Provision of Industry Information and Intelligence’ at the European AssociationAwards 2018. This award truly recognises the skill and value of this report for the solar sector, and the capabilities of ourmarket intelligence team. Winning the award gives us the motivation to provide you with an even more comprehensiveedition. We have again cooperated with the Global Solar Council (GSC) to address the development of solar in many newemerging markets. As the number, size and importance of solar markets is quickly increasing, we have invited partner solarassociations, of the GW+ scale solar markets, to provide insights on their home countries.
The speed of current solar developments is truly amazing. It was only in 2016, that we celebrated Europe reaching the importantmilestone of 100 GW of grid connected solar power capacity. At that time, nobody had anticipated that only a year later, in 2017,the world would add nearly 100 GW of solar in just 12 months.
2017 was also a very special year, because solar deployed nearly twice as much capacity as wind. Solar also out performedtraditional energy generation technologies, with almost 3 times as much solar compared to gas and coal, and around a factorof 9 times more than nuclear additions. Solar alone installed more generation capacity than all fossil fuels and nuclear together.
The reason for solar’s popularity are manifold – it’s unique in its flexible and distributed clean nature, which allows innumerableapplications. It is now also increasingly the lowest-cost power generation technology. Researchers and industry have been doinga tremendous job of reducing solar costs.
Another record solar bid took place in 2017 in Saudi Arabia, bringing the tariff record down to 2.34 US cents/kWh. Even more impressiveis that in that tender, 7 of the technical bids were below 2.9 US cents/kWh. In other words, a low 2 US cent tariff range is the newnormal, when you want to win a solar tender under ideal conditions, with high irradiation and a stable policy framework.
This Saudi tender also included one bid that was as low as 1.79 US cents, which was disqualified in the end. This bid reportedlyincluded bifacial technology, which enables power generation on both sides of a solar module and promises yield improvements of10 to 30%. Bifacial solar is a simple and outstanding technology, though just one of many fascinating innovations in the solar field.
The solar industry has done its homework in bringing cost down and providing the facilities to deploy solar rapidly (in 2017,China alone installed 53 GW in one year). Now it’s key that policy makers embrace this opportunity by quickly creating the rightregulatory frameworks for solar and storage, and other relevant technologies, to help speedily accomplish the energy transition.
We are very glad that just before we went to print with this report, the European Union’s three legislative institutions – theCommission, Parliament and Council – agreed on a 32% 2030 renewables target and empowered citizens, companies andcommunities with the right to produce, consume, store and sell power without being subject to punitive taxes or excessive redtape. That’s the right direction – and what we’ve been lobbying for. A new solar dawn is breaking in Europe and SolarPowerEurope are at the forefront of shaping the new framework for solar and delivering its potential for our members.
If you would like to get an idea of the manifold solar business opportunities, or the regulatory environment controlling solardeployment in Europe, please check the Trends chapter. Here we outline the key issues that SolarPower Europe is working onto enable solar to play the core role in the clean energy transition.
Enjoy reading our Global Market Outlook 2018 – 2022.

Project manager & lead author: Michael Schmela, SolarPower Europe.
Market intelligence: Zubair Aslam, Thomas Döring, Raffaele Rossi, Michael Schmela, SolarPower Europe.
Internal co-authors: Aurélie beauvais, Naomi Chevillard, Mariano Guillén Paredes, Máté Heisz, Raffaele Rossi, Michael Schmela, SolarPower Europe.
External co-authors: China Photovoltaic Industry Association (CPIA); Dan Whitten & Justin baca, US Solar Industries Association (SEIA); Japan Photovoltaic EnergyAssociation (JPEA); Faruk Telemcioglu, Günder Turkish Solar Energy Society (GÜNDER); Steve blume, Smart Energy Council; Rodrigo Lopes Sauaia & Stephanie betz,brazilian Photovoltaic Solar Energy Association (AbSOLAR).
External contributors: AbSOLAR, American University of beirut, APESF, APREN, borzen, bPVA, bSA, bSW-Solar, CPIA, EDORA, Elettricità Futura, ENERPLAN, ENR,ENS, ERU, European Energy, Finnish Clean Energy Association, Green Energy Association of Israel, GIZ, GSC, GÜNDER, HELAPCO, IRENA, JPEA, MANAP, Multiconsult,OEb, Photovoltaic Austria, PV POLAND, RPIA, SAPI, SAPVIA, SEIA, Smart Energy Council, Solar Trade Association, Solární Asociace, Svensk Solenergi, Swissolar,TrendForce, UARE, UNEF.
Design: Onehemisphere, Sweden.
Supported by: Intersolar Europe, Global Solar Council (GSC).
Disclaimer: Please note that all historical figures provided in this brochure are valid at the time of publication and will be revised when new and proven figures areavailable. All forecast figures are based on SolarPower Europe knowledge at the time of publication. Please also note that forecast figures have been rounded.
SolarPower Europe’s methodology includes only grid-connected systems.
4 / SolarPower Europe / GLObAL MARkET OUTLOOk FOR SOLAR POWER 2018-2022
TABLE OF CONTENTS
FOREWORD 3
EXECUTIVE SUMMARY 5
1 GLOBAL SOLAR MARKET 7UPDATE 2000 - 2017 7PROSPECTS 2018 - 2022 15PROSPECTS 2018 - 2022 / SEGMENTS 22
TRENDS WHAT’S HOT IN SOLAR 23
1 Small is beautiful: Small-scale installations and the European energy transition 24
2 Solar smart cities: A great match 263 Solar mobility: Choosing solar for the driver’s seat 274 Solar & storage: Unleashing the potential for the
perfect partner 295 Sustainability and environmental footprint:
Taking care – solar generating truly green power 336 O&M: Long-term high solar system performance
with a little help from a friend 357 Solar power purchase agreements: Increasing leadership
from private sector looking for green power procurement 378 Tenders: Controlling solar growth & cost 409 Solar in emerging markets - so much untapped potential 4210 Technology update - how to cut cost even further 43
2 GW-SCALE SOLAR POWER MARKETS IN 2017 47
3 THE EUROPEAN SOLAR MARKET 692000 - 2018 UPDATE 692000 - 2018 UPDATE / SEGMENTATION 72PROSPECTS 2018 - 2022 73
4 GLOBAL MARKET OUTLOOK FOR SOLAR POWER 78
SolarPower Europe / GlOBAl MARKET OUTlOOK FOR SOlAR pOWER 2018-2022/ 5
The boost in solar is to a large extent a result of its spectacular costdevelopment. In February 2018, a 300 MW tender in Saudi Arabia was won at anew world record low solar power price of 2.34 US cents/kWh. Due to technicalimprovements, solar power cost and price will continue to quickly improve.
Global solar market demand in 2017 was driven by China. For the firsttime, China installed more than half of the world’s solar capacity in one year– to be exact, 53.3%. But the low cost of solar has been attracting manycountries to look seriously into this unique, flexible and distributed cleanpower technology. While in 2016, only seven countries installed over 1 GW,in 2017, the number has increased to nine (see p. 47, Chapter on GW-scalemarket overviews from national associations of these countries).
Europe has left its several-year long downward trend in 2017, adding 9.2GW, a 30% increase compared to the 7 GW installed the year before. TheEuropean growth is primarily a result of Turkey’s gigantic growth. Whenlooking at the 28 members of the European Union, there was hardly anygrowth at all: the EU-28 added 5.91 GW in 2017, compared to 5.89 GW in 2016.This result still stems from the UK’s ‘solar exit’ in 2016, which again halvednew installations in 2017. Even though 21 of the 28 EU markets added moresolar than the year before, the overall market performance was still sluggish.
Our Medium Scenario expects about 3.5% market growth to 102.6 GWnew PV capacity additions in 2018, despite the recent subsidy cutannouncement from China to restructure its solar incentive programmes.
Again, all Global Market Outlook 2018 scenarios show stronger growththan in the previous GMO edition. In 2017, we assumed a cumulativeinstalled capacity of 471.2 GW for the Medium Scenario in 2018, this year weestimate 505.2 GW, which is about 7% higher. In the GMO 2018, weanticipate a range between 714.6 and 1,042.1 GW, with 871.3 GW forecastedfor the most likely scenario in 2021 – that’s about 13% higher.
Under optimal conditions, the world’s solar generation plant capacitycould reach up to 1,270.5 GW by the end of 2022, but we consider 1,026.2GW more likely. Still, that means solar would reach the terawattproduction capacity level in 2022.
Despite remarkable growth rates in recent years, there is still a long way togo for solar and renewables – RES total share reached 12.1% of total globalpower output in 2017.
The report and all figures can be downloaded at:
www.solarpowereurope.org
EXECUTIVE SUMMARY
2017 was another historic year forthe solar power sector. More solarPV capacities were installedglobally than any other powergeneration technology. Solar alonesaw more new capacity deployedthan fossil fuels and nuclearcombined. Solar added almosttwice as much capacity as itsrenewable peer, wind power.
A total of 99.1 GW of grid-connectedsolar was installed in 2017. That’salmost a 30% year-on-year growthover the 76.6 GW added in 2016.
In 2017, almost as much solar wasinstalled in one year as the worldhad installed in total capacity in2012 (100.9 GW). This led to a totalglobal solar power capacity of over400 GW in 2017, after solar exceededthe 300 GW mark in 2016 and the200 GW level in 2015.

JOIN 200+SolarPower EuropeMembers
SolarPower Europe is an association representing over 200 members activealong the whole solar value chain. Find more information:
www.solarpowereurope.org
Influence Intelligence Network Discounts Visibility/ / / /
SolarPower Europe / GLOBAL MARkET OUTLOOk fOR SOLAR POWER 2018-2022 / 7
GlObal SOlaR MaRKETUPDATE 2000 - 2017
1© ENEL
Solar is the fastest growing power generation source
Diego de Almagor, Chile.
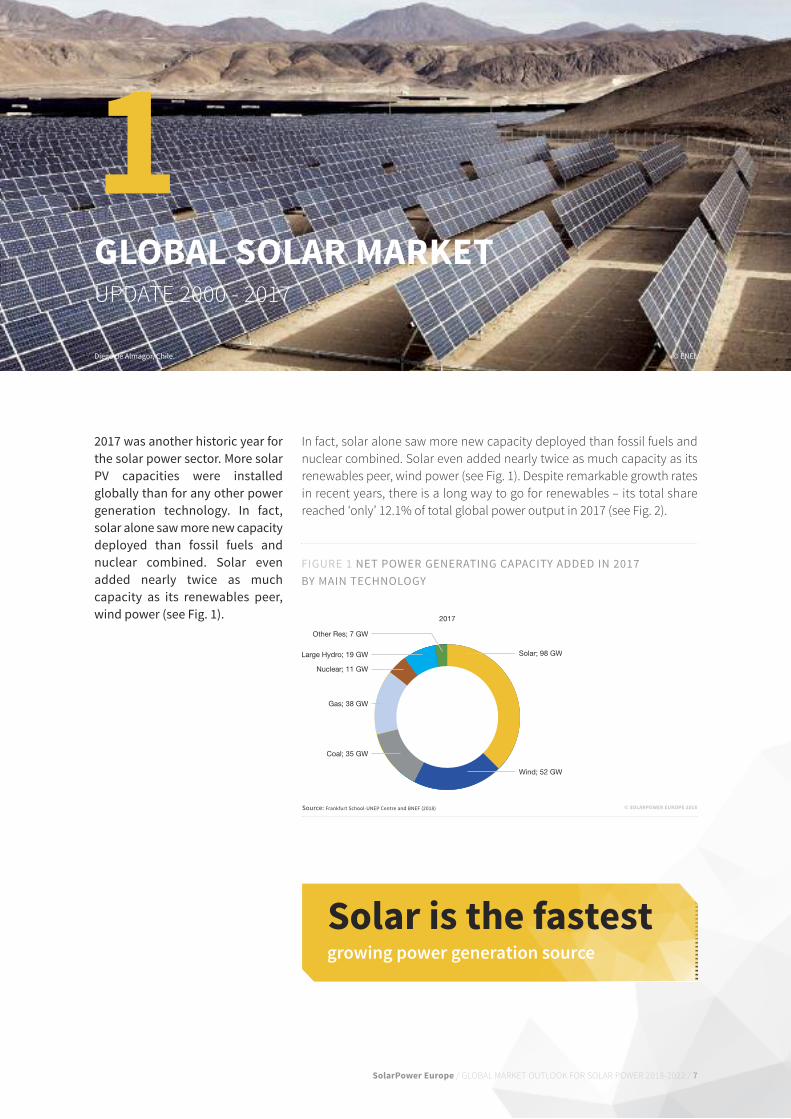
2017 was another historic year forthe solar power sector. More solarPV capacities were installedglobally than for any other powergeneration technology. In fact,solar alone saw more new capacitydeployed than fossil fuels andnuclear combined. Solar evenadded nearly twice as muchcapacity as its renewables peer,wind power (see Fig. 1).
In fact, solar alone saw more new capacity deployed than fossil fuels andnuclear combined. Solar even added nearly twice as much capacity as itsrenewables peer, wind power (see fig. 1). Despite remarkable growth ratesin recent years, there is a long way to go for renewables – its total sharereached ‘only’ 12.1% of total global power output in 2017 (see fig. 2).
FIGURE 1 NET POWER GENERATING CAPACITY ADDED IN 2017 BY MAIN TECHNOLOGY
Wind; 52 GW
Solar; 98 GWLarge Hydro; 19 GW
Other Res; 7 GW
Coal; 35 GW
Gas; 38 GW
Nuclear; 11 GW
2017
© SOlaRPOWER EUROPE 2018Source: Frankfurt School-UNEP Centre and BNEF (2018)

8 / SolarPower Europe / GLOBAL MARkET OUTLOOk fOR SOLAR POWER 2018-2022
1 GlObal SOlaR MaRKETUPDATE 2000 - 2017 / CONTINUED
FIGURE 2 RENEWABLE POWER GENERATION AND CAPACITY AS A SHARE OF GLOBAL POWER, 2007-2017
© SOlaRPOWER EUROPE 2018Source: Frankfurt School-UNEP Centre and BNEF (2018)
© SOlaRPOWER EUROPE 2018
FIGURE 3 TOP 8 TECHNICAL BIDS FOR 300 MW SAKAKA PV PROJECT IN SAUDI ARABIA
0
1
2
3
4
US c
ents
/kW
h
Masdar/EDF ACWA Marubeni Engie JGC/Trina Mitsui & Co. Total Cobra
1.79
2.342.66 2.77 2.78 2.86 2.86
3.37
0
10
20
30
40
50
60
70
%
Renewable capacity change as a % of global capacity change (net)
Renewable power as a % of global capacity
Renewable power as a % of global power generation
2007 2008 2009 2010 2011 2012 2013 2014 2015 2016 2017
20%
27%
42%
32%
40%
49%
39% 41%
47%
57%
61%
7.5% 8.2% 9.2% 10.2% 11.4% 11.9% 13.0% 14.3% 15.7%17.%
19%
5.2% 5.3% 5.9% 6.1% 6.9% 8.0% 8.6% 9.2% 10.0% 11.0% 12.1%
The boost in solar is to a large extent a result of itsspectacular cost development (see fig. 3). The record lowsolar prices that were achieved in 2016 had caught manyenergy experts by surprise. That year, bids awarded in severaltenders were below the 3 US cent per kWh level (2.95 UScents for a 800 MW project in Dubai, 2.91 US cents for a powersupply contract in Chile, 2.42 US cents for the ‘winter’ supply
part of the 1.18 GW plant PPA in Abu Dhabi). Discussionsabout sustainability of such low price levels became quicklyobsolete as the price spiral has continued its waydownwards. In february 2018, a 300 MW tender in SaudiArabia was won by local company ACWA Power at a newworld record low price of 2.34 US cents/kWh, while the firstseven shortlisted bids were all below 2.90 US cents/kWh.
SolarPower Europe / GLOBAL MARKET OUTLOOK FOR SOLAR POWER 2018-2022 / 9
© SOLARPOWER EUROPE 2018Source: Lazard (2017)
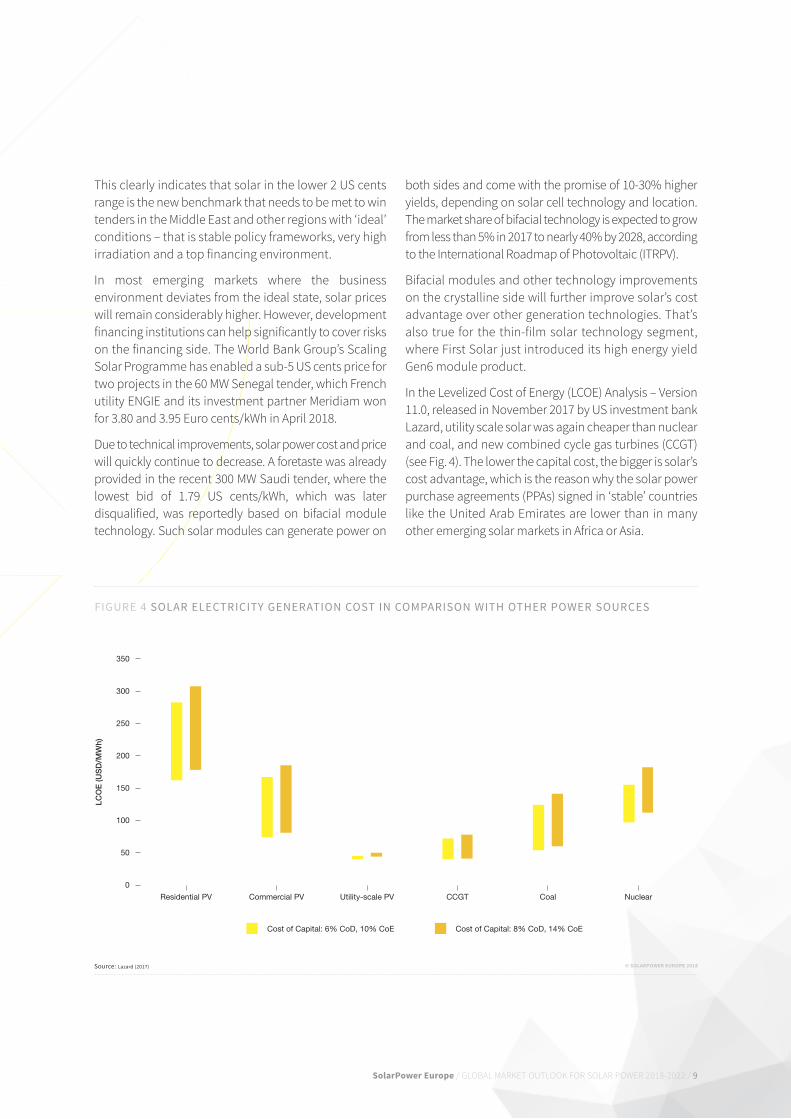
FIGURE 4 SOLAR ELECTRICITY GENERATION COST IN COMPARISON WITH OTHER POWER SOURCES
0
50
100
150
200
250
300
350
LCOE
(USD
/MW
h)
Cost of Capital: 6% CoD, 10% CoE Cost of Capital: 8% CoD, 14% CoE
Residential PV Commercial PV Utility-scale PV CCGT Coal Nuclear
This clearly indicates that solar in the lower 2 US centsrange is the new benchmark that needs to be met to wintenders in the Middle East and other regions with ‘ideal’conditions – that is stable policy frameworks, very highirradiation and a top financing environment.
In most emerging markets where the businessenvironment deviates from the ideal state, solar priceswill remain considerably higher. However, developmentfinancing institutions can help significantly to cover riskson the financing side. The World Bank Group’s ScalingSolar Programme has enabled a sub-5 US cents price fortwo projects in the 60 MW Senegal tender, which Frenchutility ENGIE and its investment partner Meridiam wonfor 3.80 and 3.95 Euro cents/kWh in April 2018.
Due to technical improvements, solar power cost and pricewill quickly continue to decrease. A foretaste was alreadyprovided in the recent 300 MW Saudi tender, where thelowest bid of 1.79 US cents/kWh, which was laterdisqualified, was reportedly based on bifacial moduletechnology. Such solar modules can generate power on
both sides and come with the promise of 10-30% higheryields, depending on solar cell technology and location.The market share of bifacial technology is expected to growfrom less than 5% in 2017 to nearly 40% by 2028, accordingto the International Roadmap of Photovoltaic (ITRPV).
Bifacial modules and other technology improvementson the crystalline side will further improve solar’s costadvantage over other generation technologies. That’salso true for the thin-film solar technology segment,where First Solar just introduced its high energy yieldGen6 module product.
In the Levelized Cost of Energy (LCOE) Analysis – Version11.0, released in November 2017 by US investment bankLazard, utility scale solar was again cheaper than nuclearand coal, and new combined cycle gas turbines (CCGT)(see Fig. 4). The lower the capital cost, the bigger is solar’scost advantage, which is the reason why the solar powerpurchase agreements (PPAs) signed in ‘stable’ countrieslike the United Arab Emirates are lower than in manyother emerging solar markets in Africa or Asia.

10 / SolarPower Europe / GLOBAL MARkET OUTLOOk fOR SOLAR POWER 2018-2022
In 2017, a total of 99.1 GW of grid-connected solar wasinstalled in 2017 (see fig. 5). That’s almost a 30% year-on-year growth over the 76.6 GW added in 2016. This ismuch lower than the 49% growth rate recorded in 2016,but much higher than the expectations of any solaranalysts. After the exceptionally strong growth in 2016,most solar analysts had initially forecasted no growthat all. Our Medium Scenario, estimating a slight 5%growth rate to 80.5 GW was among the most optimisticforecasts for 2018. The actual 99.1 GW installation figureturned out be close to the upper end of our GMO 2017High Scenario estimate of 103.6 GW.
Global solar market demand in 2017 was dominatedmore than ever by China. for the first time, Chinainstalled more than half of the world’s solar capacity inone year – to be exact, 53.3%. This 52.8 GW of newlyadded capacity means a 53% increase over the 34.5 GWinstalled in 2016, when the Chinese market grew by128% compared to the 15.1 GW deployed in 2015. Whilethe huge growth in 2017 stunned almost everyone, inhindsight, the explanation is very simple: China’s feedin tariff program was basically un-capped, the tarifflevels for solar power plants were higher than in mostother places in the world, and companies wanted tobeat upcoming scheduled subsidy cuts. That’s why
Chinese module producers again prioritized thedomestic market over demand from abroad.
Like the year before, the United States was the world’ssecond largest PV market in 2017. It installed 10.6 GW,which falls 42% short of the record level of 15.1 GWreached in 2016. While utility-scale solar remained thelargest segment, nearly the entire downturn stems fromthat part. However, this decline was largely expected, asmany projects were finalized in 2016 to beat anexpected expiration of the 30% federal Investment TaxCredit (ITC), which did not materialize in the end. On top,several projects were shelved due to uncertaintysurrounding the Section 201 import tariffs.
2017 has been a record year for PV in India. Cumulativeinstalled capacity exceeded 19 GW, with net yearlyadditions of 9.6 GW – a staggering 127% market growthfrom last year’s 4.3 GW. Growth could have been evenstronger, if it were not for price hikes of modules from Chinaover the course of the year, a lagging rooftop segment anduncertainty regarding import taxes. However, in 2017 solarwas the largest source of new capacity additions,constituting 45% of new added capacity. India tookJapan’s place as the third largest market worldwide and ison trajectory to become #2 in 2018.
1 GlObal SOlaR MaRKETUPDATE 2000 - 2017 / CONTINUED
FIGURE 5 EVOLUTION OF GLOBAL ANNUAL SOLAR PV INSTALLED CAPACITY 2000-2017
0
10
20
30
40
50
60
70
80
90
100
GW
99.1
2000 2001 2002 2003 2004 2005 2006 2007 2008 2009 2010 2011 2012 2013 2014 2015 2016 2017
RoWMEACHINAAMERICA APAC*EUROPE
© SOlaRPOWER EUROPE 2018* APAC excl. China
SolarPower Europe / GLOBAL MARKET OUTLOOK FOR SOLAR POWER 2018-2022 / 11
The Middle East region not only made headlines withrecord-low tariff solar tariffs, there were also newcountries joining the local ‘solar tenders club.’ Next toSaudi Arabia, also Oman started to tender its first solarcapacity, while the region’s PV pioneers Abu Dhabi andDubai have continued on their solar path. The biggestsolar country in the region in 2017 was the United ArabEmirates, adding 262 MW.
The biggest surprise in 2017 in Africa took place in thecontinent’s north – in Egypt. Although the actualinstallation volume was still below 100 MW, afterchanges for its FIT progamme and delays, the first PVpower plant was installed. Egypt managed to win backconfidence with the financial sector, with many banksnow having given green light to support multipleprojects for the 1.8 GW Benban Solar Park. As in the past,the continent’s largest market was South Africa. But at172 MW, it was much smaller than in the prior years, dueto the solar pipeline logjam caused by national utilityEskom, which refused to sign PPAs with the winners ofthe latest RE programme bidding rounds. That has beensolved in the meantime – and even a new bidding roundwas announced. However, the low cost of solar isattracting many African countries to look into on-gridsolar as well. As financing is often an issue, the WorldBank Group has established the Scaling Solar Program,which started in Zambia in 2017 and is quicklyprogressing and expanding in African countries. In 2017,in Zambia a second round was launched, Ethiopiaannounced two tenders for 125 MW each, Madagascarissued a tender for a solar plus storage system last year,and Senegal tendered 100 MW capacity.
In brief, in 2017, solar was even more dominated byChina than ever. But the low cost of solar has beenattracting many countries to look seriously into thisunique flexible and distributed clean power technology.While in 2016, only seven countries installed over 1 GW,in 2017, the number has increased to nine. Details onthe leading solar markets can be found in Chapter 2,which provides overviews on those nine countriesthat installed more than 1 GW in 2017 (see p. 47).
The Japanese market continued its downturn, adding7.2 GW in 2017, which is 9% less than the 7.9 GWinstalled the year before. The solar market is in themiddle of a transition from its lucrative FIT scheme toauctions and self-consumption. But with a huge FITpipeline waiting for installation, the 490 MW AC capacitycompanies bid for was lower than the 500 MW on offer.In the end, only 141 MW AC was awarded. The JapanesePV Energy Association (JPEA) expect the country’s solardownturn to continue until 2024, before market designand infrastructure will be ready for further growth.
Unlike Japan, Europe has left its several-year longdownward trend in 2017, adding 9.2 GW, a 30% increasecompared to the 7 GW installed the year before. TheEuropean growth is primarily a result of Turkey’s giganticgrowth, adding 2.6 GW, from less than 1 GW in 2016.When looking at the 28 members of the EuropeanUnion, there was hardly any growth at all: the EU-28added only 5.91 GW in 2017, compared to 5.89 GW in2016. This result still stems from the UK’s ‘solar exit’ in2016, which again halved new installations in 2017. Eventhough 21 of the 28 EU markets showed growth, thiswasn’t enough to compensate for the British losses.
Beyond Asia’s solar leaders China, Japan and India, theregion counts several fast growing solar markets, butonly one other Asian country, South Korea, exceededthe gigawatt-level in 2017.
In Latin America, in particular Brazil stood out in 2017,which for the first time installed over 1 GW of solar,mostly from systems awarded in auctions. The region’sNo. 2 is Chile, where the market slightly decreased by4% to 788 MW. While Mexico grew by 39% to 539 GW, thebulk of systems awarded in recent auctions are beinggrid-connected as of this year. Also Latin America isseeing emerging solar markets, like Colombia, whichinstalled its first PV power plant in 2017.
After Australiadropped by 15% to 867 MW in 2016, it hasshown a strong come back in 2017, when it exceededthe 1 GW level of new PV additions. The 1.3 GW installedcapacity, mostly stems from residential self-consumption systems. With solar LCOE’s now beingincreasingly competitive, commercial and ground-mounted systems are seeing huge interest. Whilecommercial installations covered around 30% of thedemand in 2017, the ground-mounting segment isstarting as well – around 80 MW was installed – and isexcepted to strongly grow in the next few years.

12 / SolarPower Europe / GLOBAL MARkET OUTLOOk fOR SOLAR POWER 2018-2022
1 GlObal SOlaR MaRKETUPDATE 2000 - 2017 / CONTINUED
30% solar global marketgrowth Now at 100 GW a year
In 2017, almost as much solar was installed in oneyear (99.1 GW) as the world had installed in total in2012 (100.9 GW). This led to a total global solar powercapacity of over 400 GW in 2017, after solar exceededthe 300 GW mark in 2016 and the 200 GW level in 2015.
The cumulative installed solar PV power capacity grewby 32% to 404.5 GW by the end of 2017, up from 306.4GW in 2016 (see fig. 6). In only 10 years, the world’s totalPV capacity increased by over 4,300% – from 9.2 GW in2007. from the beginning of the century, when the grid-connected solar era began with the start of Germany’sfeed-in tariff scheme, total solar power has grown bynearly 255 times.
The Asia-Pacific region expanded its solar marketleadership in 2017. After adding 73.7 GW in 2017, it had221,3 GW of total installed capacity, equal to a 55%global market share (see fig. 7). After Asia-Pacific hadbecome the largest solar-powered region in the world
in 2016, it now even owns more than half of the globalpower generation capacity. The European solarpioneers are still ranked second, but its share slipped to28% based on a cumulative PV capacity of 114 GW. TheAmerican Continent remained on the third position –with a total installed capacity of 59.2 GW and a 15%stake. The Middle East and Africa lost again marketshare. After adding 2.1 GW in 2017, the total solarcapacity of 6.9 GW equals a world market share of 1.7%.
China alone operates now nearly 1/3 of the world’s solarpower generation capacities (see fig. 8). This 32.3% is astrong uptick from 2016, when China’s share was 25% andit had taken over the No. 1 position as the country hostingthe world’s largest solar power generation fleet for the firsttime. Like in the previous year, China was trailed by theUS and Japan. While the US overtook Japan, both lostmarket shares in 2017. The US’ total installed capacityreached 51.5 GW, equal to a market share of 12.7%;
FIGURE 6 EVOLUTION OF GLOBAL TOTAL SOLAR PV INSTALLED CAPACITY 2000-2017
0
50
100
150
200
250
300
350
400
450
GW
404.5
2000 2001 2002 2003 2004 2005 2006 2007 2008 2009 2010 2011 2012 2013 2014 2015 2016 2017
RoWMEACHINAAMERICA APAC*EUROPE
© SOlaRPOWER EUROPE 2018* APAC excl. China
SolarPower Europe / GLOBAL MARkET OUTLOOk fOR SOLAR POWER 2018-2022 / 13
© SOlaRPOWER EUROPE 2018
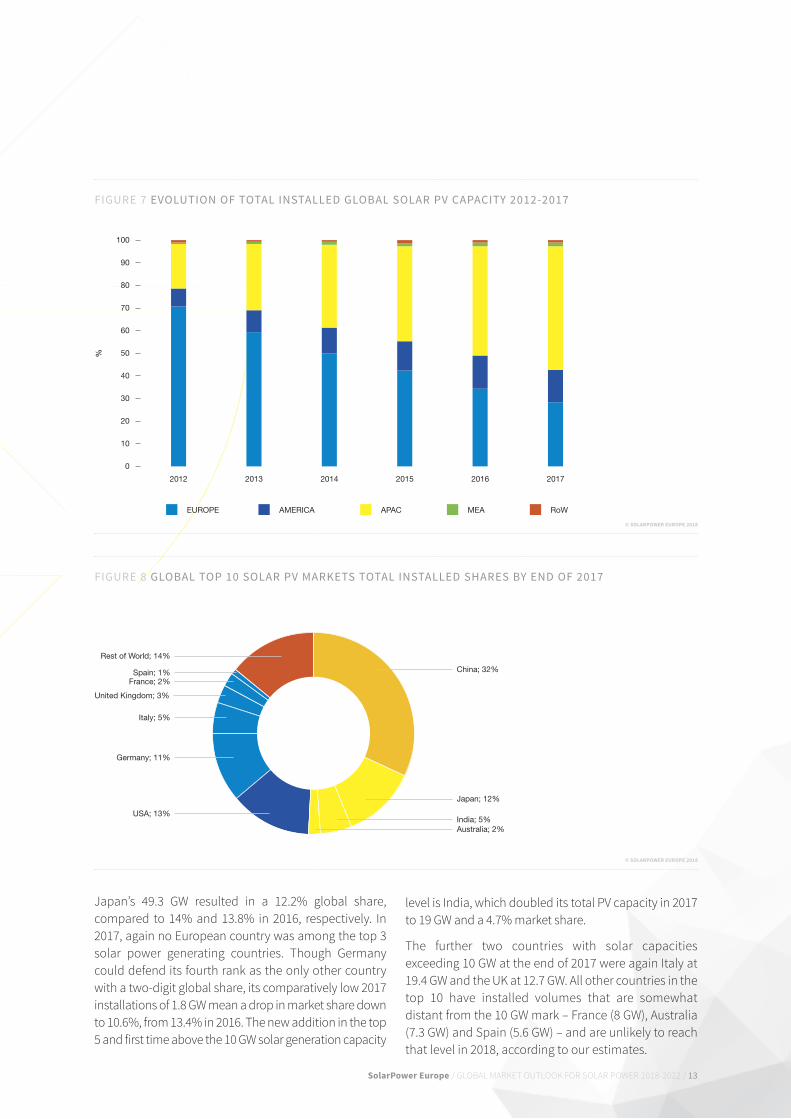
FIGURE 7 EVOLUTION OF TOTAL INSTALLED GLOBAL SOLAR PV CAPACITY 2012-2017
0
10
20
30
40
50
60
70
80
90
100
%
2012 2013 2014 2015 2016 2017
RoWMEAAMERICA APACEUROPE
Japan’s 49.3 GW resulted in a 12.2% global share,compared to 14% and 13.8% in 2016, respectively. In2017, again no European country was among the top 3solar power generating countries. Though Germanycould defend its fourth rank as the only other countrywith a two-digit global share, its comparatively low 2017installations of 1.8 GW mean a drop in market share downto 10.6%, from 13.4% in 2016. The new addition in the top5 and first time above the 10 GW solar generation capacity
level is India, which doubled its total PV capacity in 2017to 19 GW and a 4.7% market share.
The further two countries with solar capacitiesexceeding 10 GW at the end of 2017 were again Italy at19.4 GW and the Uk at 12.7 GW. All other countries in thetop 10 have installed volumes that are somewhatdistant from the 10 GW mark – france (8 GW), Australia(7.3 GW) and Spain (5.6 GW) – and are unlikely to reachthat level in 2018, according to our estimates.
FIGURE 8 GLOBAL TOP 10 SOLAR PV MARKETS TOTAL INSTALLED SHARES BY END OF 2017
Japan; 12%
India; 5%Australia; 2%
China; 32%
USA; 13%
Germany; 11%
United Kingdom; 3%
France; 2%
Italy; 5%
Spain; 1%
Rest of World; 14%
© SOlaRPOWER EUROPE 2018


SolarPower Europe / GLOBAL MARkET OUTLOOk fOR SOLAR POWER 2018-2022 / 15
© SOlaRPOWER EUROPE 2018
FIGURE 9 WORLD ANNUAL SOLAR PV MARKET SCENARIOS 2018 - 2022
0
50
100
150
200
250
GW
20222011 2012 2013 2014 2015 2016 2017 2018 2019 2020 2021
129.2
232.6
100.699.1
72.6
3% 5%
17%
12%
12%
Historical data Low Scenario High Scenario Medium Scenario
1 GlObal SOlaR MaRKETPROSPECTS 2018 - 2022
In mid-May, all solar analysts were expecting further marketgrowth in 2018, even in their conservative scenarios. Thischanged abruptly after China’s National EnergyAdministration (NEA) pulled the brake in early June,announcing strong subsidy cuts to slow down domesticsolar demand that had been much larger than originallyplanned in 2016 and 2017. While several solar experts werequick to revise their forecasts from strong growth in 2018to no growth at all, we still see a high probability for furtherglobal solar market expansion in 2018.
Our Medium Scenario expects about 102.6 GW new PVcapacity additions in 2018 (see fig 9). That wouldrepresent a 3.5% market growth compared to the 99.1 GWinstalled in 2017. The Low Scenario, which models majormarkets to withdraw their solar support, assumes a dropin demand as low as 72.6 GW, that’s basically the 2016level. This outcome is very improbable, when taking intoaccount preliminary installation numbers for the firstquarter in leading markets. The High Scenario, forecastingup to 129.2 GW of newly installed PV in 2018, this timeappears extremely optimistic, but we already said that inthe last GMO, and then it came true. It is too early to sayhow the market will develop in the second half – in Chinaand the rest of the world. But price elasticity could play abig role this year to take up some of the capacitiesoriginally destined for China. While several projects weredelayed in 2017 due to scarcity of low cost modules
resulting from the China rush, the anticipated price dropsfollowing NEA’s solar program ‘restructuring’announcement could trigger installation of much biggerproject volumes than planned to be built this year.
In any case, China’s market size will define global solardeployment in 2018. However, after the world’s largestsolar market registered 22% YoY growth in Q1/2018,installing 9.65 GW compared to 7.1 GW in Q1/2017 andthe lowest bid in the latest auction-based Top RunnerProgramme round reaching 0.31 RMB compared tomuch higher fIT levels ranging from 0.55 to 0.75 RMB,the Chinese administration’s reacted quickly. On June1, it announced a restructuring of its solar incentiveprogram, which includes an immediate halt of furtherutility-scale power plant installations for the reminderof the year, a status change for full fIT distributed powergeneration systems, which are now reimbursed at thesame levels as utility-scale power plants, and an fIT cut.However, our Medium Scenario assumes that themarket will be still 39 GW, which would be a 26%decrease over 2017, but a 13% YoY growth compared to2016. The simple rationale: China is a very large countrywith many administrational layers – and it will take awhile until the message from Beijing will be heardeverywhere, let aside that regions have their ownagenda when it comes to supporting local players andjobs. Moreover, the Poverty Alleviation Programme
16 / SolarPower Europe / GLOBAL MARkET OUTLOOk fOR SOLAR POWER 2018-2022
1 GlObal SOlaR MaRKETPROSPECTS 2018 - 2022 / CONTINUED
Over
1 TWsolar power by 2022
continues untouched and local support for rooftop solarhas triggered strong demand, which could result inseveral GW this year.
In the US, our medium scenario expects the market todecrease slightly to 10.1 GW in 2018, taking into accountthe impact of tariffs on system pricing from import tariffsand the impacts of the corporate tax reform oncustomers, developers and financing institutions.However, according to SEIA almost two thirds of the2018 utility PV pipeline consist of relatively less-price-sensitive renewable portfolio standard projects, whileprojects currently in construction have already securedtariff-free modules, so that import tariff impacts will besomewhat mitigated that year.
India officially targets 11 GW, including 10 GW ground-mount and 1 GW rooftop systems, for its fiscal year 2018-19, which will end in March 2019. After the steepyear-over-year 2017 growth, India is expected to take abreath in 2018. SolarPower Europe’s medium scenarioexpects slight growth to 10.5 GW of newly installedcapacity in calendar year 2018. The current projectpipeline is lower, after fewer tenders were issued in thepast year. Moreover, the first months of 2018, weregoverned by uncertainty stemming from a discussionon a 70% safeguard tax on imported solar cells,although this seems off the table for now. On the otherhand, India’s Ministry of New and Renewable Energy(MNRE) laid out its roadmap for future tenders to boostdemand, announcing end of last year, to tender 20 GWin fY 2017/18 and 30 GW each in fY 2018/19 and fY2090/20, which explains the very high tender activityover the first months of 2018.
In both Europe and the EU, we anticipate strong growthfor 2018. While demand in the EU will be driven by thenational binding 2020 renewables targets and lowprices, the non-EU part of Europe will be propelled byTurkey’s solar program and solar’s attractive costs (fordetails, see Chapter 3).
However, in our Medium Scenario, we see the numberof solar GW-level markets to increase by nearly 50% to14 in 2018 and with new solar markets emerging, furtherglobal growth is possible this year.
As of 2020, the global solar market is expected to showagain 2-digit growth rates. By then China will have fullyrestructured its solar market, which will enable theadministration to have much better control of solardeployment through low-cost auctions and cappedincentive schemes. There will be also a notable volume
of bilateral PPA-based systems. In our Medium Scenario,we expect China to significantly increase its solardemand again to around 40 GW in 2020, 45 GW in 2021and 55 GW in 2022. These numbers are much higherthan the targets formulated in the early 2017 publishedPhotovoltaic Industry Roadmap of the China PVIndustry Association (CPIA), which was looking for 10-20GW additions between 2018 and 2020 and 20-30 GW in2022. But the new tools to command incentive schemeson the one hand, and solar combined with storagebeing the cheapest flexible solution to reduce CO2
emissions and fight air pollution on the other hand, willboost solar in China again.
Despite China’s anticipated next strong growth cycle forthe 2020-2022 period, the rest of the world will continueto play a stronger role in the solar sector. While the USis expected to win on speed post 2020, seeing doubledigit-growth rates, due in 2023, Europe might see anopposite development. After a strong growth phasetriggered by tenders in a number of countries to meetthe EU national binding targets in 2020, unambitiousfinal agreements for the ‘Clean Energy for AllEuropeans’ Legislative Package might lead to anotherstandstill for solar in the EU post 2020, which will impactglobal growth rates during that period of time (seechapter 3). However, our Medium Scenario assumesglobal demand to increase 17% to 125.2 GW in 2020,12% to 140.4 GW in 2021 and 12% to 157.8 GW in 2022.If the leading and most promising emerging market areable to change energy market design to the needs offlexible renewables, and electrification of transport andheat sector speeds up, the High Scenario assumptionscould come true, resulting in an annual market size ofup to 232.6 GW in 2022.

SolarPower Europe / GLObAL MArKET OUTLOOK FOr SOLAr pOWEr 2018-2022 / 17
Again, all Global Market Outlook 2018 scenarios showstronger growth than in the previous GMO edition. In2017, we assumed a cumulative installed capacity of471.2 GW for the Medium Scenario in 2018, this year weestimate 505.2 GW, which is about 7% higher (see Fig.10). The final year of the 5-year forecast in the GMO 2017,ranged between 623.2 and 935.5 GW with the most likelyMedium Scenario resulting in 772.1 GW of cumulativeoperating solar power in 2021. In the GMO 2018, weanticipate a range between 714.6 and 1,042.1 GW, with871.3 GW forecasted for the most likely scenario in 2021– that’s about 13% higher.
Under optimal conditions, the world’s solargeneration plant capacity could reach up to 1,270.5GW by the end of 2022, but we consider 1,026.2 GWmore likely. Still, that means solar would reach theterawatt production capacity level in 2022.
Reaching the 400 MW milestone already in 2017, we nowexpect in our Medium Scenarios the total global installedPV capacity to exceed 500 GW in 2018, 600 GW in 2019,700 GW in 2020, 800 GW in 2021 and 1 TW in 2022.
Although solar is increasingly becoming the lowest costpower generation source in many regions, it needs alevel playing field with the right market design tounleash its cost and technical advantages over inflexiblepower plants. Today, many barriers are still in the wayfor solar to tap its potential: Functioning emissionstrading schemes for fossil fuels are usually missing, likein the EU; investments and operation of inflexiblecentralized power generation technology are often stillbeing strongly over-subsidized, like the UK’s Hinkley Cnuclear plant; while self-consumed solar power is beinginappropriately high taxed, like in Germany.
The solar sector’s dependency on few markets is anotherissue that needs to be addressed: In 2017, only onecountry, China, was responsible for over half of globaldemand; the top 3 solar markets (China, US, India) evencovered 74%. As we mentioned last year, it “needs onlyone major market making the wrong policy decisions todisrupt the entire solar sector.” There is a reason why thesolar sector is reacting very nervous on China’sannouncement to restructure its solar incentive program.When taking all these risks into consideration, our LowScenario assumes a very unlikely development that resultsin an annual global market of only 100.6 GW in 2022, whichwould mean stagnation compared to 2017 additions.
© SOLARPOWER EUROPE 2018
FIGURE 10 WORLD TOTAL SOLAR PV MARKET SCENARIOS 2018 - 2022
0
200
400
600
800
1,000
1,200
1,400
GW
Historical data Low Scenario High Scenario Medium Scenario
20222011 2012 2013 2014 2015 2016 2017 2018 2019 2020 2021
1,270.5
404.5475.8
813.3
25% 21%
19%
18%
20%531.3
18 / SolarPower Europe / GLOBAL MARkET OUTLOOk fOR SOLAR POWER 2018-2022
1 GlObal SOlaR MaRKETPROSPECTS 2018 - 2022 / CONTINUED
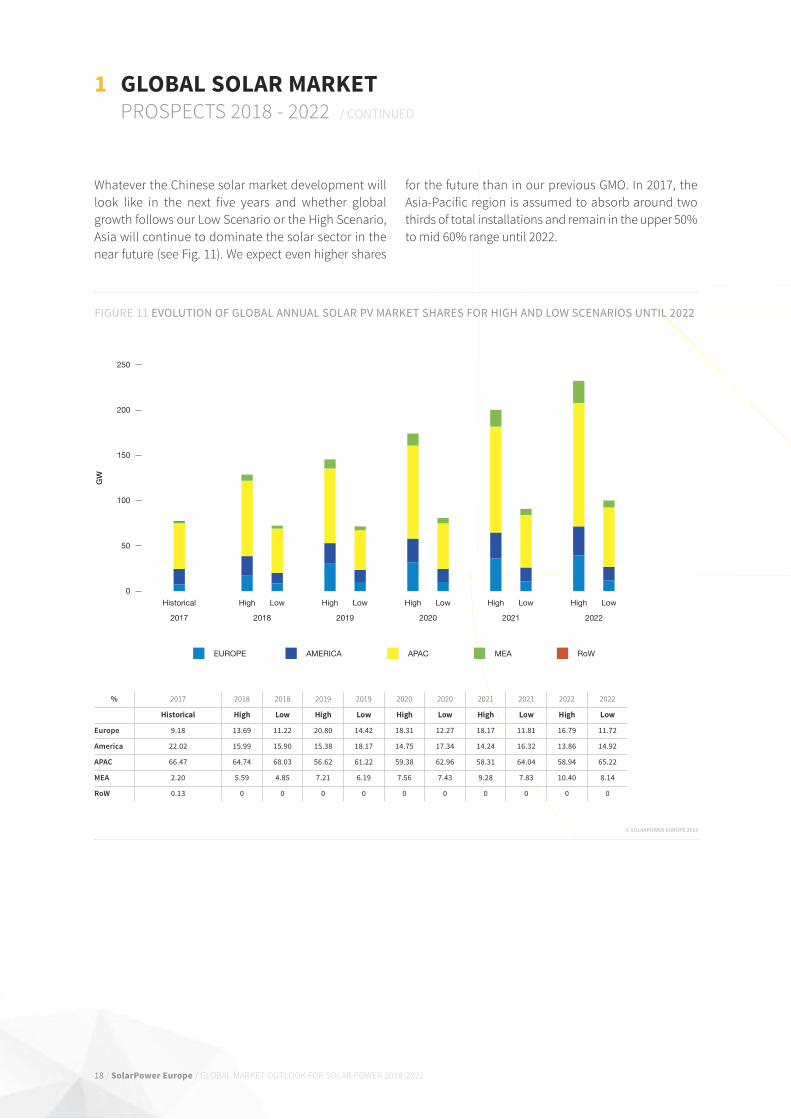
Whatever the Chinese solar market development willlook like in the next five years and whether globalgrowth follows our Low Scenario or the High Scenario,Asia will continue to dominate the solar sector in thenear future (see fig. 11). We expect even higher shares
for the future than in our previous GMO. In 2017, theAsia-Pacific region is assumed to absorb around twothirds of total installations and remain in the upper 50%to mid 60% range until 2022.
© SOlaRPOWER EUROPE 2018
FIGURE 11 EVOLUTION OF GLOBAL ANNUAL SOLAR PV MARKET SHARES FOR HIGH AND LOW SCENARIOS UNTIL 2022
0
50
100
150
200
250
GW
2017 2018 2019 2020 2021 2022
Historical High High High High HighLow Low Low Low Low
RoWMEAAMERICA APACEUROPE
% 2017 2018 2018 2019 2019 2020 2020 2021 2021 2022 2022
Historical High Low High Low High Low High Low High Low
Europe 9.18 13.69 11.22 20.80 14.42 18.31 12.27 18.17 11.81 16.79 11.72
America 22.02 15.99 15.90 15.38 18.17 14.75 17.34 14.24 16.32 13.86 14.92
APAC 66.47 64.74 68.03 56.62 61.22 59.38 62.96 58.31 64.04 58.94 65.22
MEA 2.20 5.59 4.85 7.21 6.19 7.56 7.43 9.28 7.83 10.40 8.14
RoW 0.13 0 0 0 0 0 0 0 0 0 0

20 / SolarPower Europe / GLOBAL MARkET OUTLOOk fOR SOLAR POWER 2018-2022
1 GlObal SOlaR MaRKETPROSPECTS 2018 - 2022 / CONTINUED
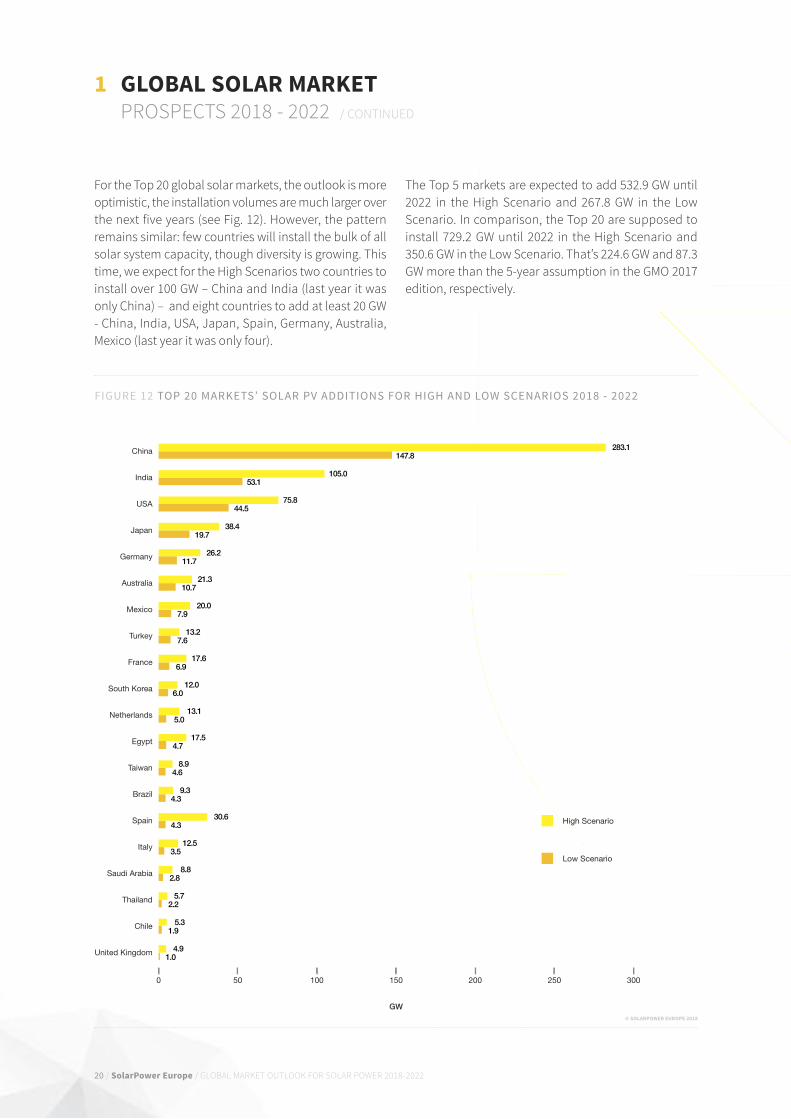
for the Top 20 global solar markets, the outlook is moreoptimistic, the installation volumes are much larger overthe next five years (see fig. 12). However, the patternremains similar: few countries will install the bulk of allsolar system capacity, though diversity is growing. Thistime, we expect for the High Scenarios two countries toinstall over 100 GW – China and India (last year it wasonly China) – and eight countries to add at least 20 GW- China, India, USA, Japan, Spain, Germany, Australia,Mexico (last year it was only four).
The Top 5 markets are expected to add 532.9 GW until2022 in the High Scenario and 267.8 GW in the LowScenario. In comparison, the Top 20 are supposed toinstall 729.2 GW until 2022 in the High Scenario and350.6 GW in the Low Scenario. That’s 224.6 GW and 87.3GW more than the 5-year assumption in the GMO 2017edition, respectively.
FIGURE 12 TOP 20 MARKETS’ SOLAR PV ADDITIONS FOR HIGH AND LOW SCENARIOS 2018 - 2022
Thailand
Spain
United Kingdom
Italy
Saudi Arabia
Chile
Germany
Netherlands
Brazil
Taiwan
France
Turkey
Egypt
Mexico
Australia
South Korea
Japan
USA
India
China
0 50 100 150 200 250 300
GW
Low Scenario
High Scenario
283.1
105.0
75.8
38.4
12.0
21.3
20.0
17.5
13.2
8.9
17.6
9.3
13.1
26.2
5.3
8.8
12.5
4.9
30.6
5.7
147.8
53.1
44.5
19.7
6.0
10.7
7.9
4.7
7.6
4.6
6.9
4.3
5.0
11.7
1.9
2.8
3.5
1.0
4.3
2.2
© SOlaRPOWER EUROPE 2018
SolarPower Europe / GLOBAL MARkET OUTLOOk fOR SOLAR POWER 2018-2022 / 21
FIGURE 13 TOP GLOBAL SOLAR PV MARKETS’ PROSPECTS
2022Total Capacity Medium Scenario by 2022 (MW)
339,751
114,170
97,431
78,551
63,237
26,924
22,969
19,702
15,252
14,742
14,497
14,460
14,320
11,750
11,430
8,442
8,386
7,070
6,159
5,787
2017Total Capacity
(MW)
130,751
51,527
19,047
49,251
42,973
19,392
7,308
7,999
1,174
12,676
5,480
5,627
3,420
80
2,681
1,147
1,733
19
2,697
894
2018 - 2022Compound Annual Growth Rate (%)
21%
17%
39%
10%
8%
7%
26%
20%
67%
3%
21%
21%
33%
171%
34%
49%
37%
227%
18%
45%
2018 - 2022New Capacity
(MW)
209,000
62,643
78,384
29,300
20,264
7,533
15,662
11,703
14,078
2,065
9,017
8,833
10,900
11,670
8,750
7,295
6,653
7,051
3,462
4,892
Political supportprospects
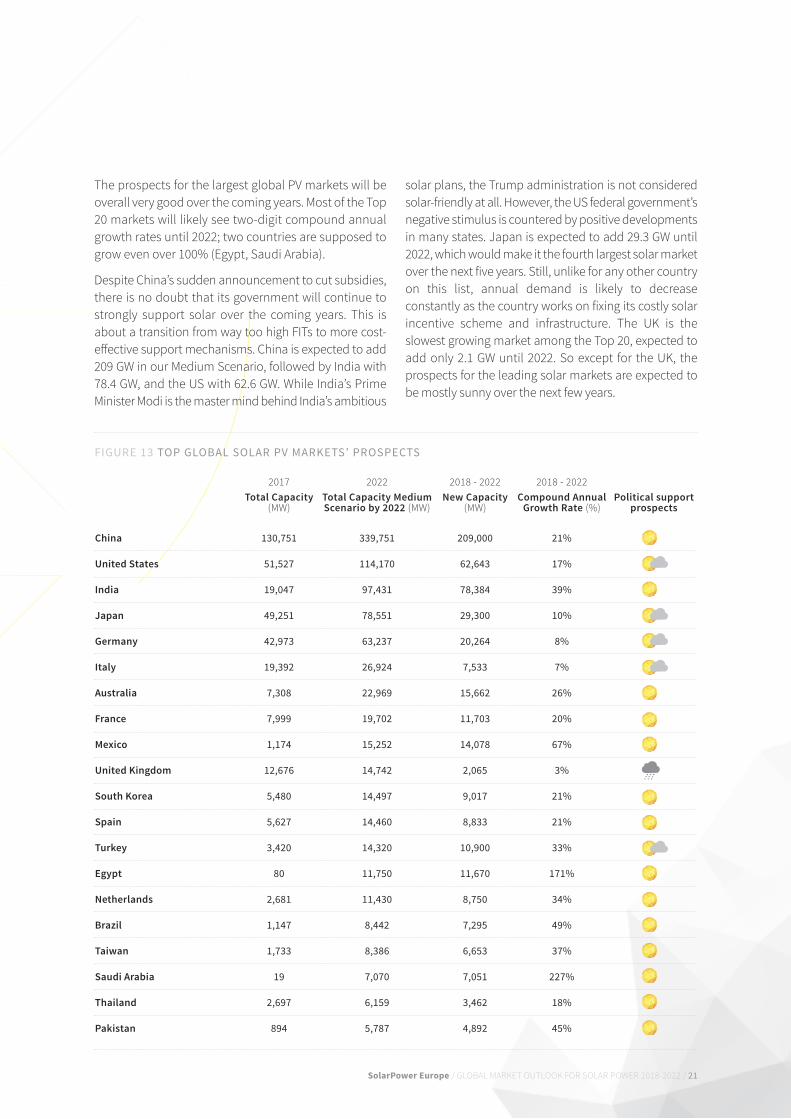
The prospects for the largest global PV markets will beoverall very good over the coming years. Most of the Top20 markets will likely see two-digit compound annualgrowth rates until 2022; two countries are supposed togrow even over 100% (Egypt, Saudi Arabia).
Despite China’s sudden announcement to cut subsidies,there is no doubt that its government will continue tostrongly support solar over the coming years. This isabout a transition from way too high fITs to more cost-effective support mechanisms. China is expected to add209 GW in our Medium Scenario, followed by India with78.4 GW, and the US with 62.6 GW. While India’s PrimeMinister Modi is the master mind behind India’s ambitious
solar plans, the Trump administration is not consideredsolar-friendly at all. However, the US federal government’snegative stimulus is countered by positive developmentsin many states. Japan is expected to add 29.3 GW until2022, which would make it the fourth largest solar marketover the next five years. Still, unlike for any other countryon this list, annual demand is likely to decreaseconstantly as the country works on fixing its costly solarincentive scheme and infrastructure. The Uk is theslowest growing market among the Top 20, expected toadd only 2.1 GW until 2022. So except for the Uk, theprospects for the leading solar markets are expected tobe mostly sunny over the next few years.
China
United States
India
Japan
Germany
Italy
Australia
France
Mexico
United Kingdom
South Korea
Spain
Turkey
Egypt
Netherlands
Brazil
Taiwan
Saudi Arabia
Thailand
Pakistan

22 / SolarPower Europe / GLOBAL MARkET OUTLOOk fOR SOLAR POWER 2018-2022
Ground-mounted utility scale solar power systemscontinue to clearly dominate the solar space – and thiswon’t change much for the next five years. In 2017, thelarge-scale ground-mounted segment increased itsshares along with the top markets expanding theirglobal footprints. The growth of the major solarmarkets is primarily based on ground-mounted PVpower, even though there are efforts to foster therooftop segment as well. With electric vehicles andsmart cities making stronger inroads after 2020, thereis a lot of upside potential.
China not only strongly expanded its output to 52.8 GWin 2017 from 34.5 GW in 2016, but also its global marketshare to 53% from 45%. Its total installed capacity evenincreased to over 130 GW of which around 100.6 GW areutility scale plants. The other around 29.7 GW are whatChina calls distributed solar systems (now < 30 MW, earlier<50 MW), which are actually also mostly ground mountedsystems, but installed closer to demand centres. The rateof distributed systems strongly increased over the lastyear, and we will see in the short run also a stronger runfor rooftop systems after the Chinese governmentrecently halted the utility-scale fIT programme.
However, deploying large volumes of utility-scale solar ismuch easier to establish than a distributed PV rooftopmarket, which requires a substantial period of time and
a lot of effort to educate consumers, while setting up aneffective platform with the right financing mechanismsand technical standards. That’s why emerging marketsusually begin their solar chapter with tenders for utility-scale solar and frequently struggle to set up thedistributed rooftop segment, even if politicians generallyprefer PV on roofs which they consider the natural placefor the technology as it avoids any potential conflicts onland use. A good example for such a development isIndia. Its National Solar Mission officially targets 100 GWof solar by 2022, with 40 GW coming from rooftop solar.But of the 19 GW installed by end of 2017, only 1 to 2 GWare ground-mounted PV power plants.
Even in developed solar markets in Europe, the recenttrend to tenders is triggering a new wave of ground-mounted PV power plants that will be installed in Spain,for example. The low cost of solar enabling the beginningof a merchant PPA based market will also push theground-mount segment. On the other hand, consumerswill evolve increasingly into prosumers, solar panels willturn into building materials, and smart cities will want toemploy the advantages of distributed small-scale solar incombination with storage and digital solutions. Inaddition, more cities, states or even countries mightfollow the example of California to make it mandatoryhaving solar as part of newly built homes – though all thisis likely to happen after 2020.
1 GlObal SOlaR MaRKETPROSPECTS 2018 - 2022 / SEGMENTS
FIGURE 14 SCENARIOS FOR GLOBAL SOLAR PV ROOFTOP AND UTILITY SCALE SEGMENTS DEVELOPMENT 2018 - 2022
0
20
40
60
80
100
120
GW
Roo�op solar
2017 2018 2019 2020 2021 2022
27.9
40.2
83.7
Historical data Low Scenario High Scenario
0
20
40
60
80
100
120
140
160
GW
Utility-scale solar
71.260.3
148.8
2017 2018 2019 2020 2021 2022
© SOlaRPOWER EUROPE 2018
© SMA
TRENDSWHaT’S HOT IN SOlaR 10 TRENDS THAT WILL SHAPE THE SOLAR POWER SECTOR IN THE COMING YEARS
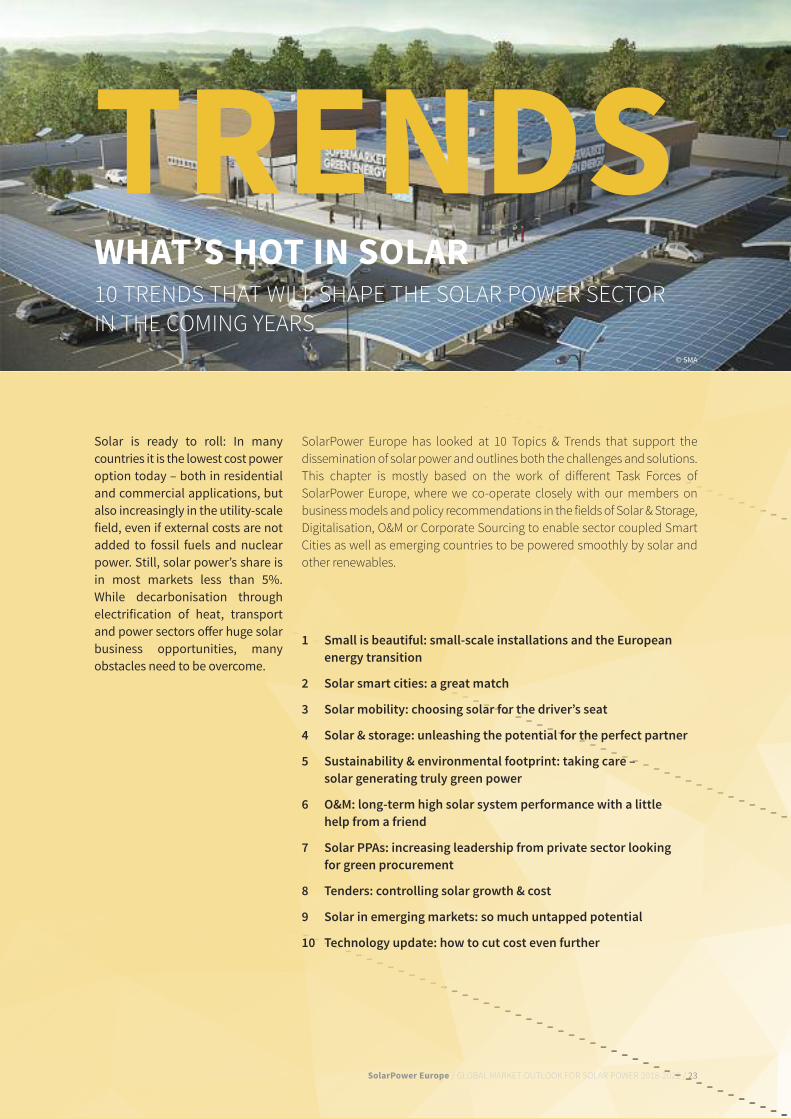
Solar is ready to roll: In manycountries it is the lowest cost poweroption today – both in residentialand commercial applications, butalso increasingly in the utility-scalefield, even if external costs are notadded to fossil fuels and nuclearpower. Still, solar power’s share isin most markets less than 5%. While decarbonisation throughelectrification of heat, transportand power sectors offer huge solarbusiness opportunities, manyobstacles need to be overcome.
SolarPower Europe has looked at 10 Topics & Trends that support thedissemination of solar power and outlines both the challenges and solutions.This chapter is mostly based on the work of different Task forces ofSolarPower Europe, where we co-operate closely with our members onbusiness models and policy recommendations in the fields of Solar & Storage,Digitalisation, O&M or Corporate Sourcing to enable sector coupled SmartCities as well as emerging countries to be powered smoothly by solar andother renewables.
1 Small is beautiful: small-scale installations and the Europeanenergy transition
2 Solar smart cities: a great match
3 Solar mobility: choosing solar for the driver’s seat
4 Solar & storage: unleashing the potential for the perfect partner
5 Sustainability & environmental footprint: taking care – solar generating truly green power
6 O&M: long-term high solar system performance with a little help from a friend
7 Solar PPAs: increasing leadership from private sector looking for green procurement
8 Tenders: controlling solar growth & cost
9 Solar in emerging markets: so much untapped potential
10 Technology update: how to cut cost even further
SolarPower Europe / GLOBAL MARkET OUTLOOk fOR SOLAR POWER 2018-2022 / 23

24 / SolarPower Europe / GLOBAL MARkET OUTLOOk fOR SOLAR POWER 2018-2022
TRENDS WHaT’S HOT IN SOlaR / CONTINUED
1. SMall IS bEaUTIFUl: SMall-ScalEINSTallaTIONS aND THE EUROPEaN ENERGYTRaNSITION
Solar is quickly becoming the cheapest source ofelectricity, outcompeting conventional powergeneration plants in several parts of the world. But it willonly reach its full potential in a real decentralized energysystem that enables integration of major shares ofvariable sources of electricity and recognizesappropriately the benefits of small scale, clean and localsolar installations. These solar rooftop systems cancompete on retail price with grid power at most placesin the world; still only few countries, like Australia, havebeen truly tapping this attractive solar solution.
Small solar systems are the backbone of a digitalized,decarbonized, distributed and democratized energysystem (4D), which empowers consumers and territories(e.g. households, hospitals, public buildings, hotels, etc.)with cleaner, cheaper and local electricity. They havethe potential to support the competitiveness of localbusinesses, revive rural areas and foster sector-couplingsynergies at all levels of society. Last but not least, small-scale solar provides three times more jobs than ground-mounted installations, as shown by the “Solar JobsStudy”, published by SolarPower Europe and Ernst &Young (EY) in November 2017.
Today, there is no level playing field for small solarplayers in the energy world. Many obstacles hinderinvestors in rooftop solar solutions to reach their full
economic potential in a smarter and cleaner energysystem. In the European Union, a global pioneer inrooftop solar, the Clean Energy for All Europeanspackage, a set of legislative proposals currently in thefinal discussion stages in Brussels, could make thedifference, but political leadership is lacking.
What is at risk? No less than the EU missing on the“renewable industrial revolution”, a more complex yetmuch smarter energy system, building on the synergiesprovided by digital solar & storage to penetrate allsectors of the economy (sector coupling). from local tonational level, small-scale solar is already today capableof reducing significantly CO2 emissions, provide cheapand controllable energy and flexibility sources, andgenerate new business opportunities – if politicalframework conditions are set appropriately.
What’s Next?
The epilogue for small-scale installations in theEuropean Union isn’t so far away, as negotiationsbetween European institutions and nationalgovernments could be finalized by the end of 2018, withthe enactment of a new EU legislation beginning 2019.Some of the following challenges remain crucial toensuring a cost-efficient transition towards a cleanerand more decentralized electricity system that willunlock the economic and social potential of small-scalesolar installations:
The most validated satellite-based
solar irradiation data source
solardata.3e.eu
SolarPower Europe / GLOBAL MARkET OUTLOOk fOR SOLAR POWER 2018-2022 / 25
• Markets “Fit-for-RES”: More liquid and short-termmarkets are needed to create a level-playing fieldbetween smaller and bigger power generators inEurope and integrate the participation of newplayers through storage and aggregation services.The implementation of markets fit for PVinstallations below 500 kW will be a crucial featureto develop new solar business models.
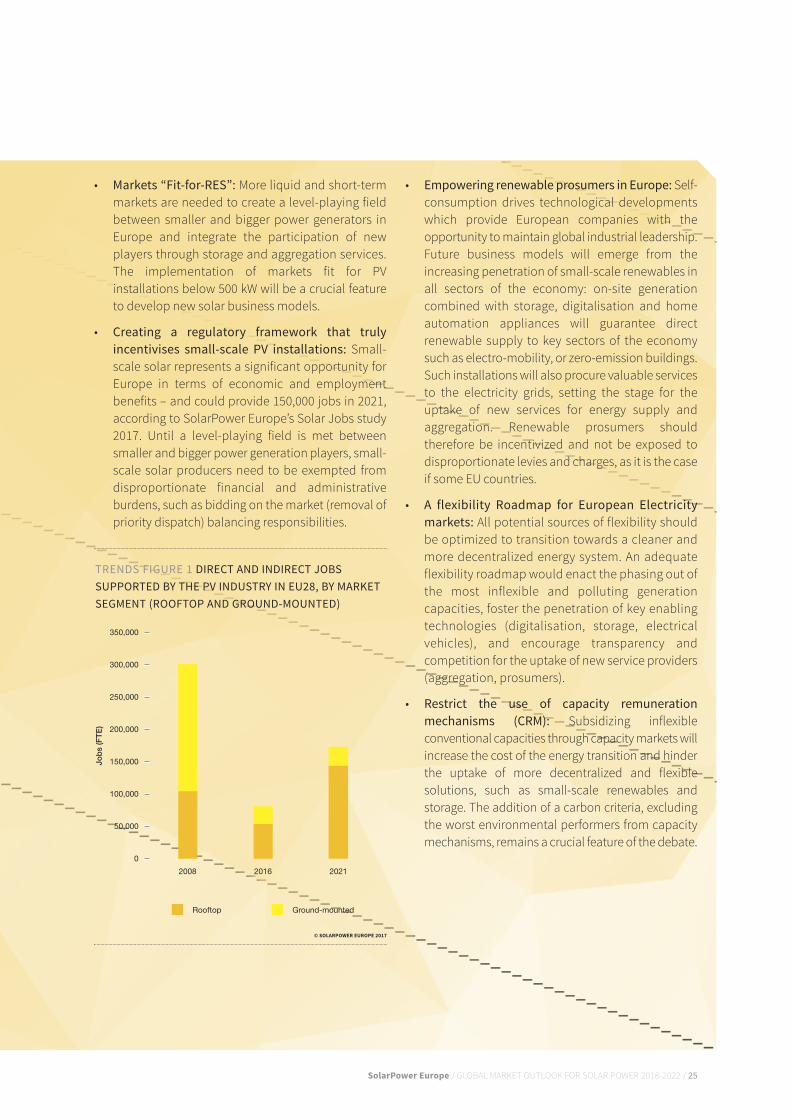
• Creating a regulatory framework that trulyincentivises small-scale PV installations: Small-scale solar represents a significant opportunity forEurope in terms of economic and employmentbenefits – and could provide 150,000 jobs in 2021,according to SolarPower Europe’s Solar Jobs study2017. Until a level-playing field is met betweensmaller and bigger power generation players, small-scale solar producers need to be exempted fromdisproportionate financial and administrativeburdens, such as bidding on the market (removal ofpriority dispatch) balancing responsibilities.
• Empowering renewable prosumers in Europe: Self-consumption drives technological developmentswhich provide European companies with theopportunity to maintain global industrial leadership.future business models will emerge from theincreasing penetration of small-scale renewables inall sectors of the economy: on-site generationcombined with storage, digitalisation and homeautomation appliances will guarantee directrenewable supply to key sectors of the economysuch as electro-mobility, or zero-emission buildings.Such installations will also procure valuable servicesto the electricity grids, setting the stage for theuptake of new services for energy supply andaggregation. Renewable prosumers shouldtherefore be incentivized and not be exposed todisproportionate levies and charges, as it is the caseif some EU countries.
• A flexibility Roadmap for European Electricitymarkets: All potential sources of flexibility shouldbe optimized to transition towards a cleaner andmore decentralized energy system. An adequateflexibility roadmap would enact the phasing out ofthe most inflexible and polluting generationcapacities, foster the penetration of key enablingtechnologies (digitalisation, storage, electricalvehicles), and encourage transparency andcompetition for the uptake of new service providers(aggregation, prosumers).
• Restrict the use of capacity remunerationmechanisms (CRM): Subsidizing inflexibleconventional capacities through capacity markets willincrease the cost of the energy transition and hinderthe uptake of more decentralized and flexiblesolutions, such as small-scale renewables andstorage. The addition of a carbon criteria, excludingthe worst environmental performers from capacitymechanisms, remains a crucial feature of the debate.
TRENDS FIGURE 1 DIRECT AND INDIRECT JOBSSUPPORTED BY THE PV INDUSTRY IN EU28, BY MARKETSEGMENT (ROOFTOP AND GROUND-MOUNTED)
0
50,000
100,000
150,000
200,000
250,000
300,000
350,000
Jobs
(FTE
)
Rooftop Ground-mounted
2008 2016 2021
© SOlaRPOWER EUROPE 2017

26 / SolarPower Europe / GLOBAL MARkET OUTLOOk fOR SOLAR POWER 2018-2022
TRENDS WHaT’S HOT IN SOlaR / CONTINUED
2. SOlaR SMaRT cITIES: a GREaT MaTcH
Smart Cities are becoming a major trend in Europe andbeyond. In Europe, the Covenant of Mayors, a Europeaninitiative to promote innovative energy transition in citiesnow gathers more than 7,755 European cities, coveringaround 250 million inhabitants. Worldwide, more than9,000 cities have joined the Global Covenant of Mayors.
Today cities are responsible for around 75% of globalenergy consumption and 80% of greenhouse emissions.Urban areas will also face some of the most significantimpacts of rising GHG emissions and air pollution,bearing much of the costs for adaptation and mitigation.
for the future, cities want to increasingly become smart,clean, sustainable - and solar appears as the perfectmatch to make this happen.
• first, solar is the most agile renewable technology.It is heavily decentralized and can basically beadded to or integrated into each component of asustainable urban area: carports, solar-poweredurban lighting, solar-powered charging points, largebuildings to single houses or sound barriers. Nameit – solar offers a solution. Its ability to be installedvery close to consumption points also avoidssignificant grid losses. This also includes large-scaledistributed solar power plants to provide electricityfor community solar solutions, for example.
• Then, solar is also already smart and quickly gettingsmarter. While digital solar & storage businessmodels are taking off for residential and commercialconsumers, smart building technologies reveal theirpotential to optimise self-consumption rates of thebuilding stock and smoothen grid feed-in, whichenables a cleaner yet reliable electricity supply.
A REAL SMART CITY MAKES USE OF SOLAR’S DISTRIBUTED AND FLExIBLE NATURE BASICALLY ALMOST EVERYWHERE
© DlR, cc-bY 3.0
SolarPower Europe / GLOBAL MARkET OUTLOOk fOR SOLAR POWER 2018-2022 / 27
1 IMPACT ASSESSMENT Accompanying the document Proposal for aDirective of the European Parliament and of the Council amendingDirective 2010/31/EU on the energy performance of buildings.
What’s Next?
According to the EU Covenant of Mayors, cities could beready for creative actions when it comes to reducingtheir CO2 emissions – if they have the will. Computedaction plans show that over 49% of actions would becovering the buildings sector, while 20% would bedevoted to increase local energy production and 23%for transport to develop cleaner transports. This all playsinto the hands of solar.
• Solar urban mobility: While solar mobility businessmodels are kicking off (see p. 27), solar will beparticularly relevant to cover electrical consumptionof low distance vehicles. This is a good thing, as citiesplan to increase significantly their share of electricpublic transport and shared vehicles for theirconstituents. Solar again appears like a perfect match.
• Solar smart buildings: The modularity andversatility of building integrated solar solutionsconstitute a great chance for cities aiming atpreserving their architectural identity, yet leading byexample by developing not only passive but energypositive buildings. Covering all untapped buildingfacades and rooftops spaces with solar coulddefinitely help decarbonise Europe’s building stock,still accounting for 36% of EU’s total CO2 emissions,according to the European Commission.1
• Solar sector-coupling: Solar is part of what will turnout to be a true energy revolution: enablingtechnologies, such as storage, digitalisation, smarthomes and smart grids will play a key role in fosteringsolar’s establishment as the main power source in oursociety. Sector coupling comes at the heart of everycitizen’s home - the keywords are on-site generation,EVs, smart home appliances. The more solarprosumers the better to foster the advent of thetransformation towards a clean urban energy system.
• Digital peer-to-peer trading: While the policyframeworks for peer-to-peer power trading are oftenstill missing, urban solar prosumers will soonincreasingly be able to supply also neighbours,generating extra value from their PV installations.Tomorrow, cryptocurrencies based on blockchaintechnologies, such as SolarCoin, GenerCoin,EnergyCoin or others, might develop into the newvector to ‘share’ solar energy in urban areas.
3. SOlaR MObIlITY: cHOOSING SOlaR FOR THE DRIVER’S SEaT
Electro-mobility is a quickly emerging global trend that willopen a world of new and exciting opportunities for solar.
The business case is strong as transport constitutestoday around 1/3 of Europe’s CO2 emissions. Togetherwith heating, it is the most emitting sector beyond thepower sector itself, where the road towards renewableshas been already paved unlike in transport. With theworld now starting to engage seriously in e-mobility, itis key to ensure these increasing electricity volumes willbe satisfied by additional renewable capacities.
2016 forecasts published by the European EnvironmentAgency suggest that Europe’s total electricityconsumption by electric vehicles will increase fromapproximately 0.03 % in 2014 to 9.5 % in 2050. With EVsshare supposed to grow much faster, it is crucial to addgreen power supply capacities quickly as well.
The Solar Mobility case is striking, when looking atsector coupling – solar is the perfect answer toelectrification of transport.
The ‘Residential Prosumers in the European EnergyUnion’ study, carried out by a consortium includingCambridge Econometrics (CE) in 2017, found that anincrease in the number of households with electricvehicles will lead to a projected 5% to 40% increase ininstalled solar PV capacity by 2030. But the potentialgoes far beyond the residential sector: while solargenerates power over the day, equipping all public andprivate office buildings with solar and EV infrastructurecould enhance even more the flexibility potential for theelectricity system. On-site solar combined with digitalsoftware and smart battery charging can provide thesystem with ancillary services all day-long, while fellowcitizens spend their day at work, and come back homewith a fully solar-charged car.
Car manufacturers and utilities are increasinglybeginning to engage in innovative solar mobilitybusiness models. from solar powered vehicles andsolar powered charging stations to the development ofinnovative solar powered supply offers - solar will be akey for the electric mobility revolution.

28 / SolarPower Europe / GLOBAL MARkET OUTLOOk fOR SOLAR POWER 2018-2022
TRENDS WHaT’S HOT IN SOlaR / CONTINUED
GlObal DEVElOPMENTS SUPPORTINGSOlaR aND STORaGE
baRRIERS FOR DEPlOYMENT SOlUTIONS
• E-mobility could increase globalelectricity demand by 10% by2050, according to theEnvironmental Agency Bureau.
• Major European cities such asParis, London Oslo or Romehave decided to ban diesel by 2040
• European smart cities pioneerthe development of solar-powered offers, like in theNetherlands (Wedrivesolar.nl)
• No concrete regulatoryrequirement linking the uptake of EVs with higher renewablecapacities
• Technical complexity to ensurethat the electricity sourced “at the plug” effectivelycorresponds to injected solar energy
• Accompanying the electricitydemand stemming from EVswith solar electricity wouldrequire significant amounts ofadditional capacity at EU level
• Key enabling technologieslinked to the uptake of SolarMobility (smart charging, vehicleto grid, high-efficiency cells) are still under development
• Development of Solar-poweredvehicles building on high-efficiency and next-genflexible cells
• Mainstreaming of solar-powered infrastructureaccompanying the uptake of EVs in Europe (carports,charging stations, roads)
• Development of innovativeoffers combining on-site solar & storage and EVs
• Developing a tracking system(certification of origin) for the electricity supplied toelectric vehicles
In the future, you could even think about cars with ‘solarskin.’ While solar-power sunroofs are commerciallyavailable today, why not have more ambitious visions:If a typical car surface would be covered with today’ssolar module technology, this would result in anaverage of around 800 W per car and reduce 64% of CO2
emissions from passenger cars in Japan, according to astudy from Toyota.
What’s Next?
• Solar and cars: EVs and solar through its fullydistributed nature are a great fit – solar will contributeto higher shares of renewables in transport.
• Sector coupling: EVs will become part of a systemcombining decentralized generation with digital &storage technologies. Solar-powered vehicles andbatteries will foster the integration of solar in theenergy system, providing new flexibility services.
• Scaling up solar: The development of solar-powered charging infrastructure and solar supplyoffers will constitute a huge opportunity for thedevelopment of solar power in Europe.
• Innovation and industrial leadership: Thecombination of solar and electro-mobility willunlock new business models and value creation.Solar-powered hydrogen and batteries, solarpowered cars, high-efficiency cells, next gen flexiblesolar cells for product integrations – the industrialopportunities are countless.
SolarPower Europe / GLOBAL MARkET OUTLOOk fOR SOLAR POWER 2018-2022 / 29
4. SOlaR & STORaGE: UNlEaSHING THEPOTENTIal FOR THE PERFEcT PaRTNER
While solar covers around 5% of the European Union’selectricity demand today, its contribution could easilyincrease up to 15% by 2030; it would only take around20 GW of newly installed PV capacity per year. A majortrend linked to the deployment of solar is its co-locationwith battery storage. Storage adds flexibility and allowsincreasing system integration of solar PV. Europeanexamples can be found in the Uk, where the first subsidyfree utility solar & storage installations are beingdeveloped. Or in Germany, where around 50% of allresidential solar installations in 2016/2017 were coupledto battery storage.
From an energy system perspective, storagerepresents an important flexibility tool, since it:
• injects and absorbs electricity very fast and with veryhigh accuracy;
• smoothens short-term variability;
• eliminates production and load peaks;
• makes solar fully dispatchable.
In addition, solar & storage bring economicadvantages: Storing solar electricity when prices arehigh and using it when prices are low allows stabilizingenergy prices to reduce future grid upgrades andexpansion cost.
Finally, solar & storage bring social benefits, such as:
• local job creation;
• avoided CO2 emissions;
• true consumer empowerment.
To capture the full potential of solar & storage in thefuture, politics must set the right conditions now.SolarPower Europe’s Solar & Storage Task force iscalling on the EU institutions to ensure that thefollowing policy asks are strengthened and fullyreflected in the new Market Design Directive (whereasthese points need to be addressed similarly anywherein the world for solar & storage to thrive):
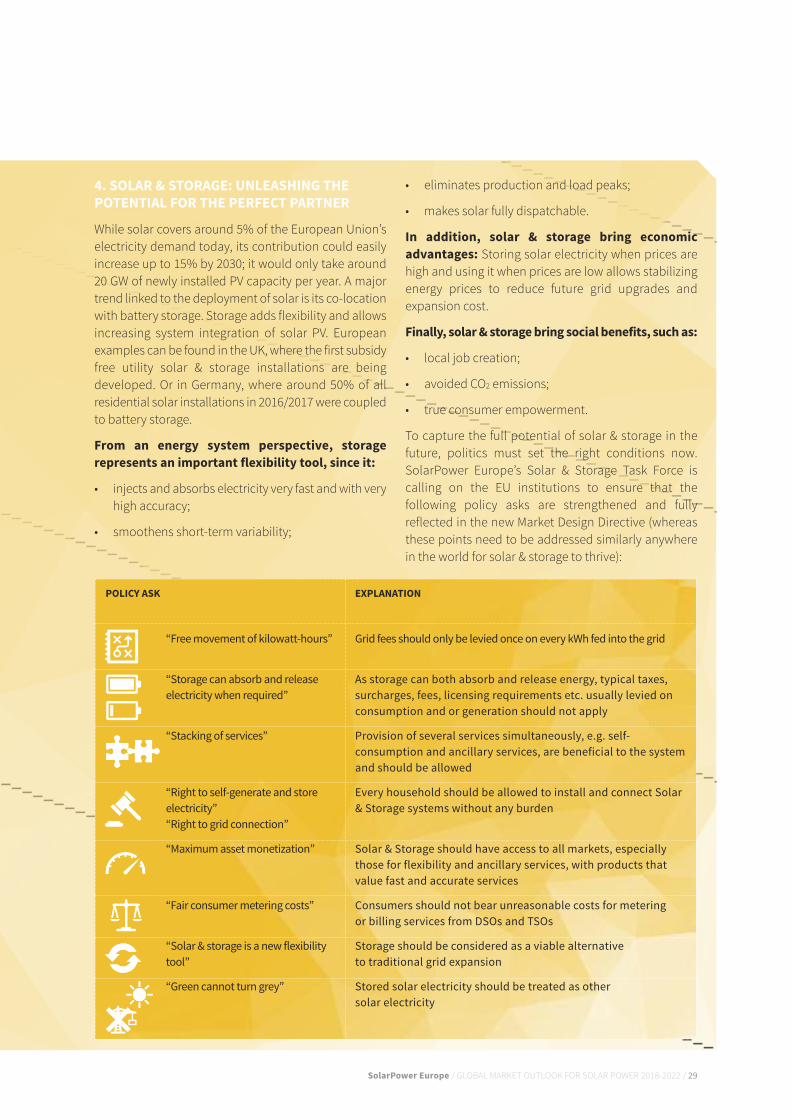
POlIcY aSK EXPlaNaTION
“Free movement of kilowatt-hours”
“Storage can absorb and releaseelectricity when required”
“Stacking of services”
“Right to self-generate and storeelectricity”“Right to grid connection”
“Maximum asset monetization”
“Fair consumer metering costs”
“Solar & storage is a new flexibility tool”
“Green cannot turn grey”
Grid fees should only be levied once on every kWh fed into the grid
As storage can both absorb and release energy, typical taxes,surcharges, fees, licensing requirements etc. usually levied onconsumption and or generation should not apply
Provision of several services simultaneously, e.g. self-consumption and ancillary services, are beneficial to the systemand should be allowed
Every household should be allowed to install and connect Solar& Storage systems without any burden
Solar & Storage should have access to all markets, especiallythose for flexibility and ancillary services, with products thatvalue fast and accurate services
Consumers should not bear unreasonable costs for metering or billing services from DSOs and TSOs
Storage should be considered as a viable alternative to traditional grid expansion
Stored solar electricity should be treated as other solar electricity
30 / SolarPower Europe / GLOBAL MARkET OUTLOOk fOR SOLAR POWER 2018-2022
TRENDS WHaT’S HOT IN SOlaR / CONTINUED
Solar & Storage provides several benefits:
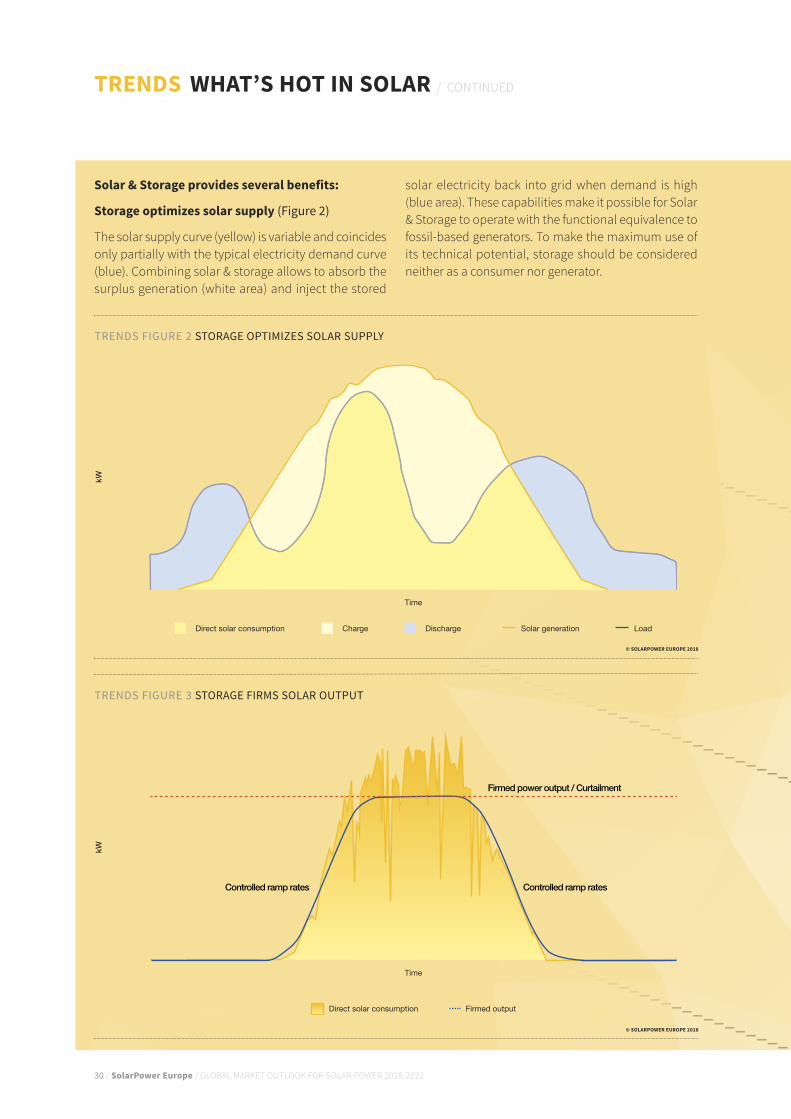
Storage optimizes solar supply (Figure 2)
The solar supply curve (yellow) is variable and coincidesonly partially with the typical electricity demand curve(blue). Combining solar & storage allows to absorb thesurplus generation (white area) and inject the stored
solar electricity back into grid when demand is high(blue area). These capabilities make it possible for Solar& Storage to operate with the functional equivalence tofossil-based generators. To make the maximum use ofits technical potential, storage should be consideredneither as a consumer nor generator.
TRENDS FIGURE 2 STORAGE OPTIMIzES SOLAR SUPPLY
kW
Direct solar consumption Charge Discharge
Time
Solar generation Load
© SOlaRPOWER EUROPE 2018
TRENDS FIGURE 3 STORAGE FIRMS SOLAR OUTPUT
kW
Time
Firmed outputDirect solar consumption
Firmed power output / Curtailment
Controlled ramp ratesControlled ramp rates
© SOlaRPOWER EUROPE 2018

SolarPower Europe / GLOBAL MARkET OUTLOOk fOR SOLAR POWER 2018-2022 / 31
Storage firms solar output (Figure 3)
firming means that a PV system’s output does notincrease or decrease too quickly. The advantage ofhaving a solar & battery system working in synergy isthat short-term supply and demand variations can bestabilized. Storage can even make the PV system’soutput completely dispatchable, i.e. available ondemand. Solar & Storage must be recognized as a newflexibility tool that makes solar fully dispatchable.
Storage provides ancillary services (Figure 4)
Ancillary services allow the energy system to cope withvariability up to an hour. To provide such services,generators must respond quickly to signals to helpcorrecting fluctuations in frequency. The high flexibilityof Solar & Storage allows to provide much faster andmore accurate services to TSOs and DSOs than otherflexibility sources. Solar & Storage must be recognizedas a new flexibility tool that can stack services andaccess all markets for maximum asset monetization.
TRENDS FIGURE 4 STORAGE PROVIDES ANCILLARY SERVICES
Power Frequency-10 -49.90
-8
-649.95
-4
-2
0 50.00
2
4
650.05
8
10 50.10
© SOlaRPOWER EUROPE 2018
TRENDS FIGURE 5 STORAGE REDUCES NETWORK COST
Time
Peak load before
Peak load a�erkW
Charge Discharge Load
© SOlaRPOWER EUROPE 2018

32 / SolarPower Europe / GLOBAL MARkET OUTLOOk fOR SOLAR POWER 2018-2022
TRENDS WHaT’S HOT IN SOlaR / CONTINUED
Storage reduces network costs (Figure 5)
Historically grids are designed to only deal with demandpeaks. However, with increasing variable generationgrids face both: peaks in demand and peaks ingeneration. Solar & Storage systems allow to reducepeak generation significantly. In Germany, a marketintroduction program for residential storage systemslimits the feed-in behaviour of PV systems to 40% of itsmaximum output. Due to this limitation, the feed-induring peak generation is reduced. Applying anoptimized generation and storing strategy allows toincrease the existing grid capacity for PV power. Thisallows to integrate more renewable electricity within thesame grid design, avoiding network upgrades. Solar &Storage shall have a right for grid connection and fair,consumer contract level metering costs.
Solar & Storage provide more stable energy prices(Figure 6)
Arbitrage can be provided with Solar & Storage systemsby using storage systems to absorb power from the gridat times of overproduction and low power prices. Byinjecting this electricity back into the grid when pricesare high, overall price fluctuations can be reduced whilesystem reliability and operation are improved. This isfeasible on system and residential level. Regarding thelatter, different types of ‘Time of Use’ tariffs areapplicable, e.g. i) fixed, depending on hours of the dayor ii) variable, depending on intraday marketdevelopments. To make this a viable business case onits own, power prices must fluctuate more, but moreimportantly, grid fees should only be levied once onevery kWh fed into the grid.
TRENDS FIGURE 6 SOLAR & STORAGE PROVIDE MORE STABLE ENERGY PRICES
kW
Charge Discharge
Time
Load
© SOlaRPOWER EUROPE 2018
SolarPower Europe / GLOBAL MARkET OUTLOOk fOR SOLAR POWER 2018-2022 / 33
5. SUSTaINabIlITY aND ENVIRONMENTalFOOTPRINT: TaKING caRE – SOlaRGENERaTING TRUlY GREEN POWER
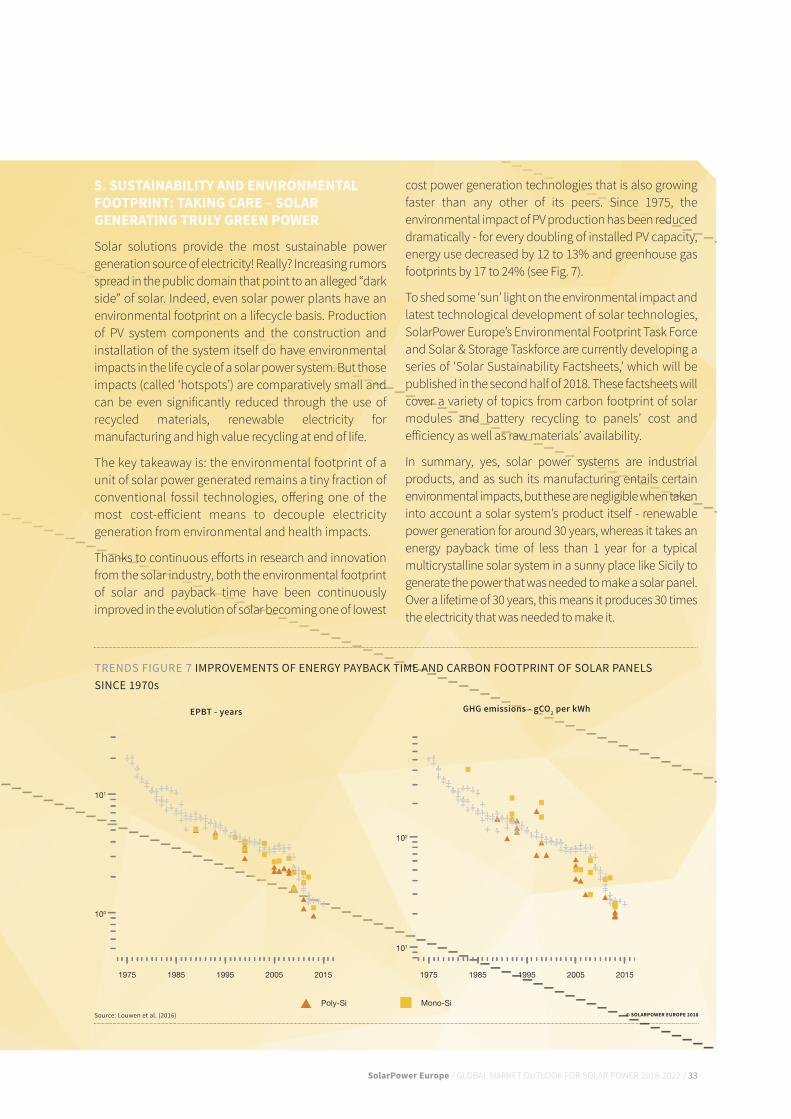
Solar solutions provide the most sustainable powergeneration source of electricity! Really? Increasing rumorsspread in the public domain that point to an alleged “darkside” of solar. Indeed, even solar power plants have anenvironmental footprint on a lifecycle basis. Productionof PV system components and the construction andinstallation of the system itself do have environmentalimpacts in the life cycle of a solar power system. But thoseimpacts (called ‘hotspots’) are comparatively small andcan be even significantly reduced through the use ofrecycled materials, renewable electricity formanufacturing and high value recycling at end of life.
The key takeaway is: the environmental footprint of aunit of solar power generated remains a tiny fraction ofconventional fossil technologies, offering one of themost cost-efficient means to decouple electricitygeneration from environmental and health impacts.
Thanks to continuous efforts in research and innovationfrom the solar industry, both the environmental footprintof solar and payback time have been continuouslyimproved in the evolution of solar becoming one of lowest
cost power generation technologies that is also growingfaster than any other of its peers. Since 1975, theenvironmental impact of PV production has been reduceddramatically - for every doubling of installed PV capacity,energy use decreased by 12 to 13% and greenhouse gasfootprints by 17 to 24% (see fig. 7).
To shed some ‘sun’ light on the environmental impact andlatest technological development of solar technologies,SolarPower Europe’s Environmental footprint Task forceand Solar & Storage Taskforce are currently developing aseries of ‘Solar Sustainability factsheets,’ which will bepublished in the second half of 2018. These factsheets willcover a variety of topics from carbon footprint of solarmodules and battery recycling to panels’ cost andefficiency as well as raw materials’ availability.
In summary, yes, solar power systems are industrialproducts, and as such its manufacturing entails certainenvironmental impacts, but these are negligible when takeninto account a solar system’s product itself - renewablepower generation for around 30 years, whereas it takes anenergy payback time of less than 1 year for a typicalmulticrystalline solar system in a sunny place like Sicily togenerate the power that was needed to make a solar panel.Over a lifetime of 30 years, this means it produces 30 timesthe electricity that was needed to make it.
TRENDS FIGURE 7 IMPROVEMENTS OF ENERGY PAYBACK TIME AND CARBON FOOTPRINT OF SOLAR PANELS SINCE 1970s
101
101
100
102
Poly-Si Mono-Si
1985 19851975 19751995 19952005 20052015 2015
EPBT - years GHG emissions - gCO2 per kWh
© SOlaRPOWER EUROPE 2018Source: Louwen et al. (2016)
34 / SolarPower Europe / GLOBAL MARkET OUTLOOk fOR SOLAR POWER 2018-2022
TRENDS WHaT’S HOT IN SOlaR / CONTINUED
Outlook
The solar industry is constantly improving its costefficiency and is strongly committed to enhancing itsenvironmental performance.
Globally, the industry-led NSf 457 SustainabilityLeadership Standard for Photovoltaic Modules, launchedin December 2017, promotes voluntary internationalstandards to track and improve a set of sustainabilityperformance objectives for solar panel manufacturers.
In the EU, the European Commission’s Joint Research Centrelaunched in October 2017 a preparatory study to assess thenecessity of sustainable product policy tools - includingEcodesign and Ecolabel - for solar panels, inverters andsystems. These tools might have a decisive impact onEurope’s solar industrial policies and business models:
• Products covered by the EU Ecodesign Directive canonly access the European market if they fulfil
minimum requirements related to energy efficiencyand circular economy.
• The EU Ecolabel is a voluntary label promotingenvironmental excellence by identifying productsand services with reduced environmental impact.
The overall objective of the initiative is to increase generalawareness on the environmental performance of PVsystems and support the further decarbonisation of theEU energy system in line with the Paris Agreement.
Whether a sustainable product policy will be introducedfor solar in the EU is currently under discussion, andtherefore subject to the outcome of a preparatory studyexpected in late 2019. from the beginning of theconsultation process, SolarPower Europe’sEnvironmental footprint Task force has been activelyinvolved and will keep providing insights andrecommendations to the European Commission onbehalf of the solar industry.
GlObal DEVElOPMENTS OF SOlaR SUSTaINabIlITY & ENVIRONMENTal FOOTPRINT
cHallENGES SOlUTIONS
• Constantly improving costefficiency and environmentalperformance are making solar oneof the cheapest and lowestenvironmental impact powergeneration source
• Increasing demand forenvironmentally friendly andsustainable power generationsources, such as solar, in light ofthe Paris Agreement
• Decision makers are increasinglyexploring options forenvironmental performancerequirements related to solar andother renewable products
• With battery technology quicklymaturing, they will play a key rolein future energy systems
• Tackle emerging mythsabout solar’senvironmental “dark side”
• Assess the need for environmentalperformancerequirements for solar,while the impact on solarindustrial policy needs tobe thoroughly considered
• Necessity to decoupleelectricity generationfrom environmental and health impacts
• Assess the effect of batteries on solarsystems’ environmentalperformance
• Communication and pedagogy toraise awareness of the environmentalimpact of solar and other sources of power generation
• Consultation with stakeholders beforeintroducing environmentalperformance requirements
• A new market design that takesenvironmental aspects of powergeneration sources into account
• Solar module recycling solutions are available
• The automotive industry is driving the development of lithium batterytechnology and is working on using second-life batteries forstationary storage
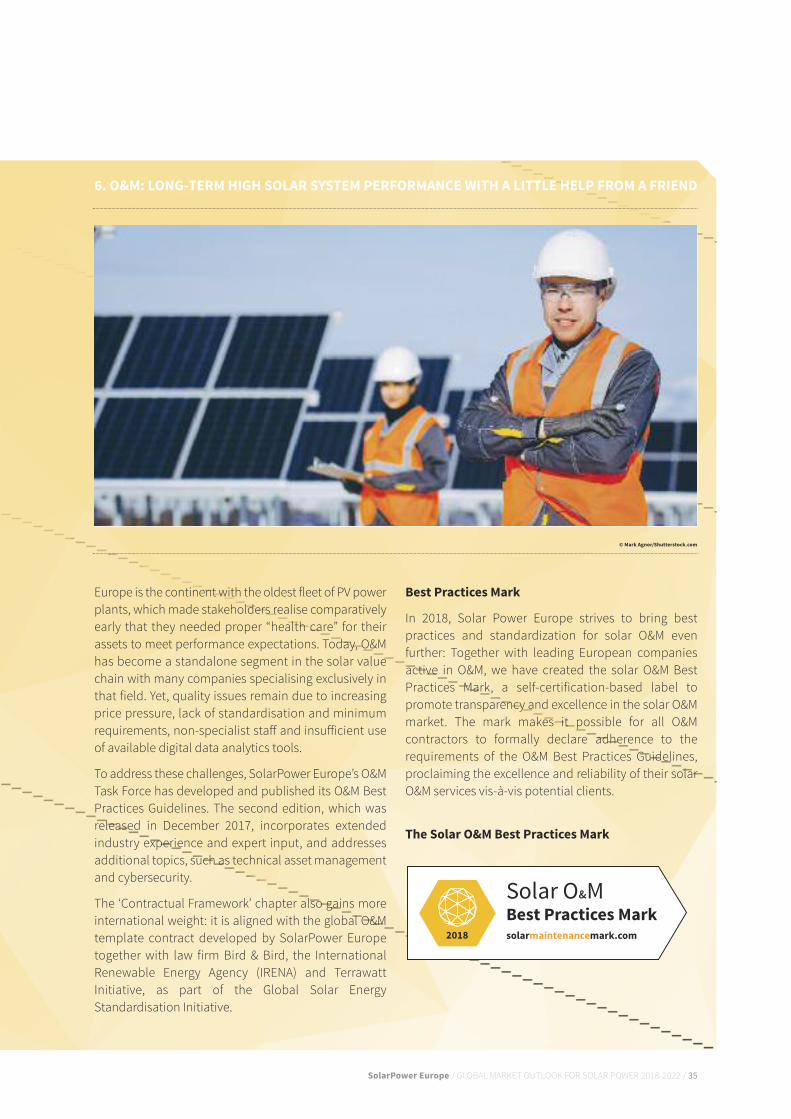
SolarPower Europe / GLOBAL MARkET OUTLOOk fOR SOLAR POWER 2018-2022 / 35
Europe is the continent with the oldest fleet of PV powerplants, which made stakeholders realise comparativelyearly that they needed proper “health care” for theirassets to meet performance expectations. Today, O&Mhas become a standalone segment in the solar valuechain with many companies specialising exclusively inthat field. Yet, quality issues remain due to increasingprice pressure, lack of standardisation and minimumrequirements, non-specialist staff and insufficient useof available digital data analytics tools.
To address these challenges, SolarPower Europe’s O&MTask force has developed and published its O&M BestPractices Guidelines. The second edition, which wasreleased in December 2017, incorporates extendedindustry experience and expert input, and addressesadditional topics, such as technical asset managementand cybersecurity.
The ‘Contractual framework’ chapter also gains moreinternational weight: it is aligned with the global O&Mtemplate contract developed by SolarPower Europetogether with law firm Bird & Bird, the InternationalRenewable Energy Agency (IRENA) and TerrawattInitiative, as part of the Global Solar EnergyStandardisation Initiative.
6. O&M: lONG-TERM HIGH SOlaR SYSTEM PERFORMaNcE WITH a lITTlE HElP FROM a FRIEND
best Practices Mark
In 2018, Solar Power Europe strives to bring bestpractices and standardization for solar O&M evenfurther: Together with leading European companiesactive in O&M, we have created the solar O&M BestPractices Mark, a self-certification-based label topromote transparency and excellence in the solar O&Mmarket. The mark makes it possible for all O&Mcontractors to formally declare adherence to therequirements of the O&M Best Practices Guidelines,proclaiming the excellence and reliability of their solarO&M services vis-à-vis potential clients.
The Solar O&M best Practices Mark
© Mark agnor/Shutterstock.com

36 / SolarPower Europe / GLOBAL MARKET OUTLOOK FOR SOLAR POWER 2018-2022
TRENDS WHAT’S HOT IN SOLAR / CONTINUED
GLOBAL DEVELOPMENTS SUPPORTING O&M
CHALLENGES SOLUTIONS
• Aging of solar PV installations
• Increasing number of solar PVinstallations with expiringperformance guarantee from the EPC Contractor
• Maturing of regulatory environments:moving away from high andfavourable feed-in tariffs towardsmarket-based mechanisms requiringlonger-term optimum output
• Accumulating O&M experience andconsolidating the O&M servicesmarket in Europe, the market with thelargest and oldest fleet of solar PV
• The largest and fastest growingmarkets rely mostly on large utility-scale solar plants, which needO&M contracts
• Fragmented markets: Significantdifferences between the qualityand scope of O&M servicesoffered by different O&M service providers.
• Some discrepancies betweenexpectations of Owners/Lendersand actual services provided
• Absence of commonly acceptedand known industry standardsand minimum requirements
• In developed markets: Increasingprice pressure, that may interferewith service quality
• In emerging markets: Ambitiousnational solar programmes with few experienced O&Mservice providers
• Dissemination of industrybest practices such as in theSolarPower Europe O&MBest Practices Guidelines
• Publication anddissemination of a globallyand freely available,bankable O&M contract template
• Deepening ourunderstanding of O&Mrequirements for solarsystems of all sized, by developing specificguidelines for distributed solar

SolarPower Europe / GLOBAL MARkET OUTLOOk fOR SOLAR POWER 2018-2022 / 37
bright future in Europe as well: Bloomberg New Energyfinance estimates that RE100 companies - a group ofglobal corporates targeting to source their power from100% RES - would need at least 67 TWh of additionalrenewable energy production to meet their 2030renewable supply commitment (see fig. 9).
To unlock this potential, it is for EU countries toacknowledge the value of PPA contracts, providing theirbusinesses with clean and competitive energy supply,and complementing public investments in clean energytechnologies. The main obstacles to further renewablecorporate PPAs in the European Union is the lack of an“enabling framework” to clarify the conditions underwhich corporate PPAs and self-consumption arepossible, existing regulatory barriers, and the lack ofguidance on subsidy compatibility with corporate PPAs.A key problem in the EU is that in particular Germanyand france are not willing to let corporates get accessto the so-called “guarantees of origins” (GO) forsubsidized green power.
Despite these obstacles, an important milestone forcorporate green power sourcing in Europe, is theEuropean Commission’s newly created first EuropeanIndustry Platform dedicated to the uptake of corporaterenewable PPAs in Europe, the Re-Source platform,which was launched in early June 2018.
7. SOlaR POWER PURcHaSE aGREEMENTS:INcREaSING lEaDERSHIP FROM PRIVaTESEcTOR lOOKING FOR GREEN POWERPROcUREMENT
2017 was another record year for renewable corporatePPAs, with over 5.4 GW installed globally (see fig. 8). In2018, the cumulative volume of corporate renewablePPAs could reach 20 GW.
The US is still leading the game, by having developedmore than 3.1 GW of renewable corporate PPA volumesin 2017. However, the new trade restrictions for solarproducts by the Trump government will slow downexpansion in the world’s most promising market – towhat extent remains to be seen once the exactmeasures are all in place.
Will Europe be ready to take over?
The potential for corporate sourcing of renewableenergy is significant and largely untapped in Europe,despite some progress in the past two years, mainlyreflected in the Nordic countries, the Uk, and theNetherlands. As predicted, the scalability and everfalling costs of solar started to pay off, with 1.1 GWcontracted in 2017 . With the right regulatory frameworkin place, renewable corporate sourcing should have a
TRENDS FIGURE 8 GLOBAL CORPORATE PPAs, BY REGION
0 0
4.0
8.0
12.0
16.0
20.0
24.0
1.0
2.0
3.0
4.0
5.0
6.0
Annu
al V
olum
e (G
W)
Cumulative Volum
e (GW)
AMER EMEA APAC
2008 2009 2010 2011 2012 2013 2014 2015 2016 2017 2018
Medium Scenario
0.2 0.30.1 0.3 0.3
1.0
2.2
4.64.2
5.4
4.1
© bNEF, May 2018

38 / SolarPower Europe / GLOBAL MARkET OUTLOOk fOR SOLAR POWER 2018-2022
TRENDS WHaT’S HOT IN SOlaR / CONTINUED
What’s next for corporate sourcing at EU / global level?
• The future EU-wide rules on the issuance ofguarantees of origin could have a decisive impact onthe development of solar corporate procurementmarket in Europe. Despite the new EU Re-Sourceindustry platform, a strong political will at EU levelis generally missing. The European renewablecorporate PPA boom is more likely to emerge fromthe increasing use of tenders correlated with publicsupport, as it has been seen in recent auctions in EUmember states. Clarifying regulatory andadministrative conditions for project developers andcorporates remains crucial.
• US contributions to the global renewable corporatePPA volumes could decrease in the coming years.Trade measures could have a strong negative impacton the world’s leading renewables PPA market, andthe underlying uncertainty will likely also influencebusiness decisions to procure more renewable energy.
• While new business models are cooking, the lack ofmarket integration and reluctance to develop acommon energy tracking system at EU level stillconstitute a major barrier to the scaling up ofcorporate PPAs in Europe. As digital technologiesmake a striking entrance in all sectors of theeconomy, blockchain is identified by leadingcorporates as a promising technology to bringcorporate PPAs to the next level.
TRENDS FIGURE 9 EUROPE-DOMICILED RE100 SUPPLY-DEMAND FUNDAMENTALS
0
50
100
TWh
Wind (contracted)
Solar (contracted)
Certificate purchases
Onsite generation
Renewable shortfall
2017 2018 2019 2020 2021 2022 2023 2024 2025 2026 2027 2028 2029 2030
Renewable electricity demand
Electricity demand
13 19 25 30 34 39 43 48 52 56 59 63 67
© bNEF MaRcH 2018 WEbINaR WITH SOlaRPOWER EUROPE

SolarPower Europe / GLOBAL MARkET OUTLOOk fOR SOLAR POWER 2018-2022 / 39
GlObal DEVElOPMENTSSUPPORTING cORPORaTERES SOURcING
cHallENGES SOlUTIONS
• 5.5 GW RES corporatePPAs were developedin 2017
• Corporates and SME’sexpress a growinginterest for bilateralpower sourcingcontracts
• Smart cities in Europeand beyond look atopportunities forsourcing their ownrenewable power
• The EuropeanCommission hasproposed to developcross borderrenewable PPAs in the EU
• Scaling-up
• Corporate PPAs in Europe are limitedto a selected group of countries
• Inclusive market barriers for smalland medium sized enterprises toimplement corporate PPAs:
• Standardisation and harmonizationof processes to contract renewablepower purchase agreements in Europe
• Regulatory constraints or legalrestrictions (ie Restrictions on thirdparty ownership of onsite renewableinstallations, on the number ofbuyers per installation or the numberof suppliers per metering point)
• Compatibility of support schemeswith corporate PPAs
• Traceability of renewable electricity
• Find innovative formulas to involvemedium and small corporates (improvebankability, aggregation, financing…)
• Harmonize administrative and legalprocesses to facilitate the development ofrenewable PPAs in all EU countries
• Remove regulatory barriers from thedevelopment of corporate renewablePPAs in Europe
• Implement a functioning and harmonisedEU-wide Guarantees of Origin system, toensure the traceability of green electricityfor corporate renewable PPA contracts
• Free market following well establishedpower market rules
• Pursue more flexible PPA contracts to caterthe different needs of SMEs and account forthe fact that many businesses may havedifficulty forecasting their energy demand10 or more years into the future.
Wacker Chemie AG, Hanns-Seidel-Platz 4, 81737 München, GermanyTel. +49 89 6279-0, [email protected], www.wacker.com, www.wacker.com/socialmedia

40 / SolarPower Europe / GLOBAL MARkET OUTLOOk fOR SOLAR POWER 2018-2022
TRENDS WHaT’S HOT IN SOlaR / CONTINUED
8. TENDERS: cONTROllING SOlaR GROWTH& cOST
Tenders or auctions have been gaining popularity in thesolar sector all around the world in recent years. The keydrivers are usually two-fold: controlling growth whilekeeping expenditure as low as possible. This is in starkcontrast to traditional uncapped feed-in tariffs (fiT),which have been the preferred means of incentivisingsolar in the past, but bear the risk of unlimited expansionand high costs, if not properly designed. This was shownin China in 2017, when nearly 53 GW were installed, whilethe country was looking for a range between 20 and 30GW. While China was offering feed-in tariffs for utility-scale plant between 0.65 and 0.85 RMB/kWh in 2017 (inJune 2018, the fITs were cut to 0.4 to 0.6 RMB), its thirdTop Runners Programme auction round resulted in alowest winning price of 0.31 RMB/kWh.
By mid-2016, 67 countries across the globe were usingtenders to develop renewable energy capacities,according to IRENA.3 This number has increased in themeantime. While in Sub-Saharan Africa, Ghana,Mauritius, Uganda, South Africa and Zambia have all runrenewable energy auctions, at least 15 more countriesin that region are developing such programmes forcompetitive procurement.4 The World Bank Group’sScaling Solar Programme is a helpful tool to implementtenders in new markets.
Probably the most prominent solar market entering thefield of tenders in 2017 was Japan. One of the world’slargest PV markets mostly due to its lucrative feed-intariffs, Japan held a first pilot PV tender in October 2017,with two more trials scheduled for August andDecember 2018. The lowest awarded bid of 17.20Yen/kWh was significantly lower than the 21 Yen/kWhfIT level at the time. But with a huge fIT pipeline waitingfor installation, the 490 MW AC capacity companies bidfor was lower than the 500 MW on offer. The takeaway:as long as there are more attractive fIT schemesavailable, companies are primarily opting for thesealternatives, which offer higher returns and avoid therisk of not being awarded a PPA.
Without doubt solar auctions have been the major toolto drive down LCOEs over the last few years. 2017/2018have been again remarkable years in this regard so far.While bid prices have been decreasing all around theworld, the 300 MW tender in Saudi Arabia stood out, as itwas won for a new record low 2.34 US cents per kWh infebruary 2018. In fact, it could have been even lower, butthe lowest $1.79 US cents per kWh bid from Masdar/Edfwas disqualified. Reportedly, this bid was based on newbifacial module technology, which promises to increaseyield by 10-30% and shows what solar record price levelare to be expected in the near future.
In Europe, the requirement stemming from theEuropean Commission’s ‘State Aid Guidelines’ to usetenders as of January 2017 for plants above 1 MWprovided the framework for changes in national supportschemes. first, Germany, france and the Netherlandshave successfully implemented regular solar tenders. InGermany, the December 2017 round led to anotherrecord level, bringing down the average winning priceby over 50% since the start of the solar tender programin April 2015. The average level of the winning bids was4.33 Euro cents per kWh, while the lowest successful bidwas even 3.86 Euro cents. In Spain, solar won 3.9 GW ina technology neutral renewables tender in mid 2017,outcompeting wind, which only secured 1.1 GW. In atechnology neutral RES tender in Germany, solar evenscored 100% in April 2018. While technology neutralrenewable tenders are preferred by the EuropeanCommission, SolarPower Europe is in favour oftechnology specific tenders, as only this offers visibilityfor the solar sector on upcoming tendered volumes, andoffers the regulator a clear planning horizon for thedifferent flexible RES technologies that have alldistinctive features.
3 IRENA (6/2017), ‘Renewable Energy Auctions: Analysing 2016’.
4 IRENA (4/2018), ‘Renewable Energy Auctions: Cases from Sub-SaharanAfrica.
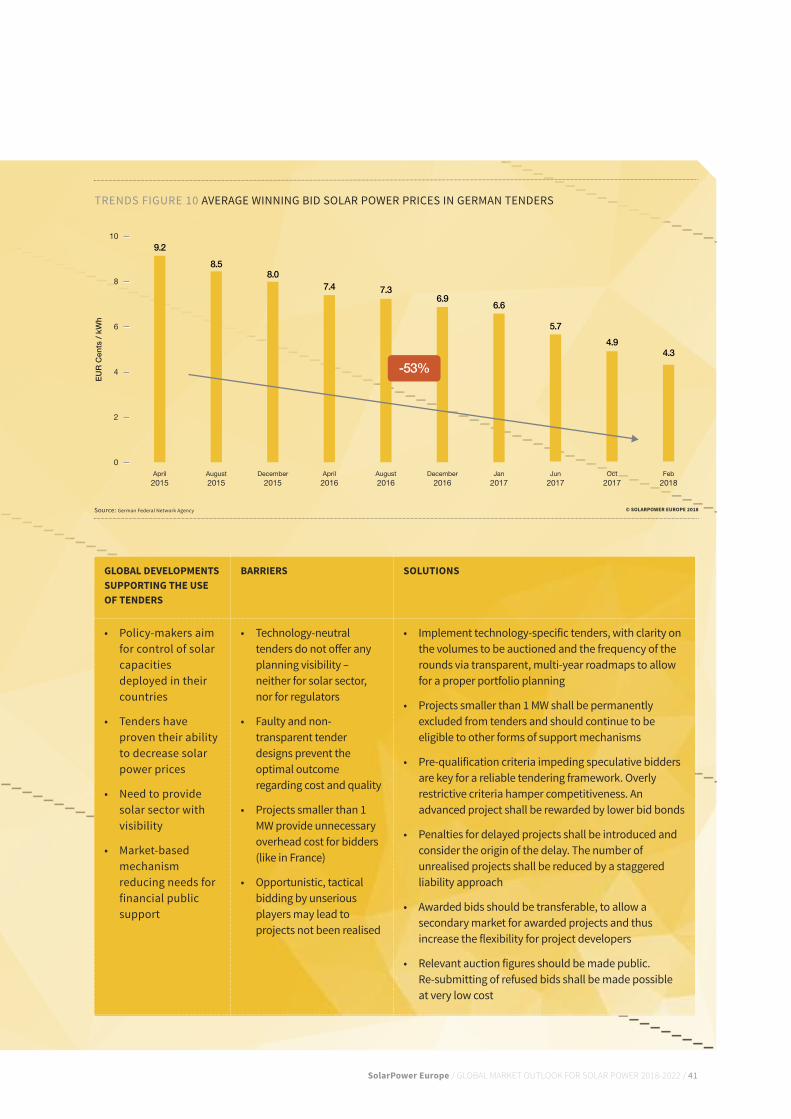
SolarPower Europe / GLOBAL MARkET OUTLOOk fOR SOLAR POWER 2018-2022 / 41
GlObal DEVElOPMENTSSUPPORTING THE USEOF TENDERS
baRRIERS SOlUTIONS
• Policy-makers aimfor control of solarcapacitiesdeployed in theircountries
• Tenders haveproven their abilityto decrease solarpower prices
• Need to providesolar sector withvisibility
• Market-basedmechanismreducing needs forfinancial publicsupport
• Technology-neutraltenders do not offer anyplanning visibility –neither for solar sector,nor for regulators
• Faulty and non-transparent tenderdesigns prevent theoptimal outcomeregarding cost and quality
• Projects smaller than 1MW provide unnecessaryoverhead cost for bidders(like in France)
• Opportunistic, tacticalbidding by unseriousplayers may lead toprojects not been realised
• Implement technology-specific tenders, with clarity onthe volumes to be auctioned and the frequency of therounds via transparent, multi-year roadmaps to allowfor a proper portfolio planning
• Projects smaller than 1 MW shall be permanentlyexcluded from tenders and should continue to beeligible to other forms of support mechanisms
• Pre-qualification criteria impeding speculative biddersare key for a reliable tendering framework. Overlyrestrictive criteria hamper competitiveness. Anadvanced project shall be rewarded by lower bid bonds
• Penalties for delayed projects shall be introduced andconsider the origin of the delay. The number ofunrealised projects shall be reduced by a staggeredliability approach
• Awarded bids should be transferable, to allow asecondary market for awarded projects and thusincrease the flexibility for project developers
• Relevant auction figures should be made public. Re-submitting of refused bids shall be made possible at very low cost
TRENDS FIGURE 10 AVERAGE WINNING BID SOLAR POWER PRICES IN GERMAN TENDERS
0
2
4
6
8
10
EUR
Cent
s / k
Wh
9.28.5
8.07.4 7.3
6.9 6.6
5.74.9
4.3
April2015
August2015
December2015
April2016
August2016
December2016
Jan2017
Jun2017
Oct2017
Feb2018
-53%
© SOlaRPOWER EUROPE 2018Source: German Federal Network Agency

42 / SolarPower Europe / GlobAl MArkET oUTlook For SolAr PoWEr 2018-2022
TRENDS WHAT’S HOT IN SOLAR / CoNTINUED
9. SOLAR IN EMERGING MARKETS - SO MUCHUNTAPPED POTENTIAL
Solar is one of the cheapest sources of electricity and thisis especially true for emerging solar markets, many ofwhich are located in the sunniest regions on this planet.Solar is also one of the most equitably distributed energyresources in the world. Contrary to fossil fuels, allcountries in the world have access to sunlight regardlessof population, land or economic wealth.
Solar therefore is a key enabler to contribute to theenergy transition of emerging markets and regions. Thisis not a scoop, as many emerging markets are alreadyon their way to outpace developed solar markets suchas Europe and the US – just look at India, which hasbecome the third largest PV market in the world in onlya few years. Many other solar newcomers are followingon the heels of India.
PV additions in emerging markets could reach 207 GWof total installed capacity within 5 years - with thehighest potential in South Asia (112 GW) and in theMiddle East and Africa (51 GW) (see Fig. 11). This offers ahuge business opportunity for solar companies toexport their know-how and scale up investments inthese new markets.
Several challenges stand in the way from tapping intothese new “Solar Eldorado’s”, including policy andregulatory stability, administrative and proceduralprocesses in developing countries, as well as financial
and bankability challenges. Industry-led initiatives, suchas the French Terrawatt initiative and the Global SolarCouncil, are working on concrete standardisation andmarket facilitation projects to unlock the investmentpotential in the most promising regions.
Under the initiative of its member ENI, Solar PowerEurope has launched a Solar Emerging Markets Taskforcein March 2018, aiming at developing market specificapproaches and tailor-made recommendations broughtby major solar stakeholders to local governments.
Recommendations
• Developed countries should continue workingtogether with emerging countries’ and use theknow-how of the Solar industry to unlock theuntapped potential, and make sure Solar will playits full part in contributing to socio-economicdevelopment around the world
• Developed countries’ decision makers should makesure, in consultation with the solar industry, thatpublic money flowing into financing facilities is usedin the most effective way possible: fosteringindustrial synergies and cooperation between localand international companies
• Public sector and industry should cooperate onawareness raising about existing financing facilitiesand initiatives, one of the core objectives of SolarPower Europe’s Emerging Markets Task Force
TRENDS FIGURE 11 SOLAR POTENTIAL IN EMERGING MARKETS, 2018 - 2022
South Asia; 55.78 GW
South Asia; 111.56 GW
LATAM; 14.65 GW
Southeast Asia; 7.74 GW
MEA; 50.59 GW
LATAM; 35.56 GW
MEA; 17.39 GW
Southeast Asia; 2.91 GW
Low Scenario91 GW
High Scenario
205 GW
© SOLARPOWER EUROPE 2018
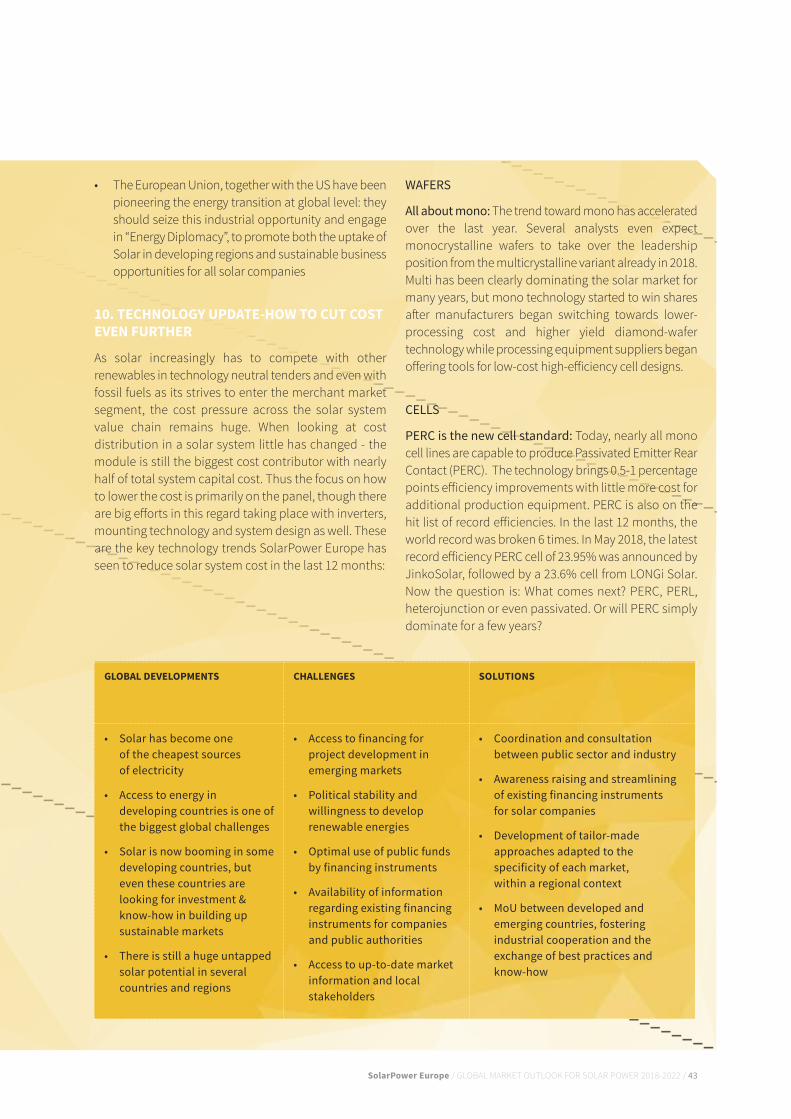
SolarPower Europe / GlobAl MArkET oUTlook For SolAr PoWEr 2018-2022 / 43
• The European Union, together with the US have beenpioneering the energy transition at global level: theyshould seize this industrial opportunity and engagein “Energy Diplomacy”, to promote both the uptake ofSolar in developing regions and sustainable businessopportunities for all solar companies
10. TECHNOLOGY UPDATE-HOW TO CUT COSTEVEN FURTHER
As solar increasingly has to compete with otherrenewables in technology neutral tenders and even withfossil fuels as its strives to enter the merchant marketsegment, the cost pressure across the solar systemvalue chain remains huge. When looking at costdistribution in a solar system little has changed - themodule is still the biggest cost contributor with nearlyhalf of total system capital cost. Thus the focus on howto lower the cost is primarily on the panel, though thereare big efforts in this regard taking place with inverters,mounting technology and system design as well. Theseare the key technology trends SolarPower Europe hasseen to reduce solar system cost in the last 12 months:
WAFERS
All about mono:The trend toward mono has acceleratedover the last year. Several analysts even expectmonocrystalline wafers to take over the leadershipposition from the multicrystalline variant already in 2018.Multi has been clearly dominating the solar market formany years, but mono technology started to win sharesafter manufacturers began switching towards lower-processing cost and higher yield diamond-wafertechnology while processing equipment suppliers beganoffering tools for low-cost high-efficiency cell designs.
CELLS
PERC is the new cell standard: Today, nearly all monocell lines are capable to produce Passivated Emitter rearContact (PErC). The technology brings 0.5-1 percentagepoints efficiency improvements with little more cost foradditional production equipment. PErC is also on thehit list of record efficiencies. In the last 12 months, theworld record was broken 6 times. In May 2018, the latestrecord efficiency PErC cell of 23.95% was announced byJinkoSolar, followed by a 23.6% cell from loNGi Solar.Now the question is: What comes next? PErC, PErl,heterojunction or even passivated. or will PErC simplydominate for a few years?
GLOBAL DEVELOPMENTS CHALLENGES SOLUTIONS
• Solar has become one of the cheapest sources of electricity
• Access to energy indeveloping countries is one ofthe biggest global challenges
• Solar is now booming in somedeveloping countries, buteven these countries arelooking for investment &know-how in building upsustainable markets
• There is still a huge untappedsolar potential in severalcountries and regions
• Access to financing forproject development inemerging markets
• Political stability andwillingness to developrenewable energies
• Optimal use of public fundsby financing instruments
• Availability of informationregarding existing financinginstruments for companiesand public authorities
• Access to up-to-date marketinformation and localstakeholders
• Coordination and consultationbetween public sector and industry
• Awareness raising and streamliningof existing financing instruments for solar companies
• Development of tailor-madeapproaches adapted to thespecificity of each market, within a regional context
• MoU between developed andemerging countries, fosteringindustrial cooperation and theexchange of best practices andknow-how

44 / SolarPower Europe / GLOBAL MARkET OUTLOOk fOR SOLAR POWER 2018-2022
TRENDS WHaT’S HOT IN SOlaR / CONTINUED
MODULES
Half cells – less is more: Half cut cells is a simple butvery effective means to increase module power. Bycutting a fully processed cell into two parts, resistancelosses can be reduced, providing a power boost ofabout 5 to 6 W on the module level. first used in Chinaas part of the Top Runner Programme, which requirespanels with high power ratings, such half-cell modulesare now starting to be seen more and more outsideChina as well.
The shingle connection: Shingle style modules are, likehalf-cut cells, also based on cell slicing – not into twopieces but several strips. The process completelychanges cell interconnection of the solar module byeliminating traditionally used ribbon. Here, cell stripsare connected in as shingle manner, similar to roof tiles,which can improve module efficiency by up to nearly 2%absolute compared to standard ribbon interconnectedpanels. On the heels of two US pioneers, SunPower andSolaria, several Chinese companies have presentedshingled modules at recent trade shows as well.
Going thin: Thin film technology has shownconsiderable improvements with first Solar introducingits Series 6 of its CdTe solar modules, which comes witha much larger form factor and offers superiortemperature coefficients, better spectral response, andreduced soiling - all resulting in superior energy yields.
Bifacial – power from both sides: Bifacial technologyunveils the rear side of a PV module for sunlightabsorption. The gain varies between 5 and 30%,depending on various aspects, such as device design,site albedo, mounting conditions. With the newgeneration of high-efficiency cells being capable ofbifacial power generation, this technology is expectedto gain quickly market shares.
Glass cover all around: Glass-glass modules have beenaround for a while – and advertised with 30-yearperformance warranties, but their share is for a numberof reasons still very small compared to glass-backsheetmodules. That might change with the advent of bifacialmodules, which need transparent back covers togenerate power on the rear side. A glass cover seems tobe the natural fit, though newly developed transparentbacksheets are an option for bifacial modules as well.
INVERTERS
Going digital: Inverters are the brain of a solar system –and with storage coming increasingly into play, the O&Mmarket under cost pressure, and houses & citiesexpected to become smarter – their importance willsignificantly grow. The advent of bifacial modules inpower plants and a larger rooftop market with a focuson safety will provide the grounds for stronger growthof module-level power electronics.
TRACKING
Following the sun: Single-axis tracking systems havebecome basically a standard for utility-scale PV plantsin southern regions. They operate reliably, and the littlehigher investment over fixed mounting systems is morethan compensated by lower LCOEs.
SOLAR SYSTEMS
Storage: Stationary battery storage is quicklyestablishing itself in an increasing number of markets,where the technology already supports thedissemination of solar, and soon will be crucial to bringit to the next penetration level. According to a recentstudy from consultancy EuPD, in Austria andSwitzerland, for example, already around 95% of solarinstallers are offering battery storage systems as part oftheir product portfolio.
Floating Solar: Water bodies and solar power plants areoften good fits. While the water keeps the modules cool,which has a positive effect on power yields, the solarpanels can protect the surface of drinking waterreservoirs from air pollutants or evaporation. Moreover,there is often no competition on space usage on waterbodies. While still very small, there is huge interest infloating PV, in particular in Asia. Installed systemcapacity doubled to around 200 MW in 2017. The world’slargest floating system - a 40 MW plant - was installed inChina in 2017.

SolarPower Europe / GLOBAL MARkET OUTLOOk fOR SOLAR POWER 2018-2022 / 45
Towards higher voltages: The move towards higher DCvoltages of up to 1,500 Volts for modules and othercomponents for solar system is taking longer thananticipated. However, this solution for large rooftop andutility-scale installations will come as it offers asignificant cost reduction potential for solar systems,because it allows to decrease the number or combinerboxes and simplifies installation.
BIPV – integral thinking: We are still waiting and hopingfor building-integrated photovoltaics to becomemainstream. But except for a few lighthouse projects,solar is still an add on product. The presentation of Tesla’sSolar Roof in the fall of 2016, caused a huge response inglobal media, but even this very aesthetic product hasn’tkick started the BIPV market so far. With California’sdecision to make it mandatory for all new houses toinclude solar power systems as of 2020, there is a goodchance this will mark the start of the BIPV era in solar.
HIGHER ENERGY YIELD. LOWER LCOE.
SUPERIOR RETURN.First Solar Series 6™ thin film modules
Visit �rstsolar.com/Series6 to learn more!

46 / SolarPower Europe / GLOBAL MARkET OUTLOOk fOR SOLAR POWER 2018-2022
Join the world‘s leading exhibition series for the solar industry
AUGUST 28–30, 2018, SÃO PAULO, BRAZIL SOUTH AMERICA’S LARGEST EXHIBITION & CONFERENCE FOR THE SOLAR INDUSTRY www.intersolar.net.br
APRIL 4–5, 2019, MUMBAI, INDIA INDIA’S MOST PIONEERING EXHIBITION AND CONFERENCE FOR THE SOLAR INDUSTRY www.intersolar.in
DECEMBER 11–13, 2018, BANGALORE, INDIAINDIA’S MOST PIONEERING EXHIBITION AND CONFERENCE FOR THE SOLAR INDUSTRY www.intersolar.in
MAY 15–17, 2019, MUNICH, GERMANYTHE WORLD’S LEADING EXHIBITION FOR THE SOLAR INDUSTRY www.intersolar.de
JULY 10–12, 2018, SAN FRANCISCO, USANORTH AMERICA’S PREMIER EXHIBITION & CONFERENCE FOR THE SOLAR INDUSTRY www.intersolar.us
MARCH 5–7, 2019, DUBAI, UAEINTERSOLAR@MIDDLE EAST ELECTRICITY: MENA‘S MOST COMPREHENSIVE SOLAR EVENT www.intersolar.ae
FOLLOW US
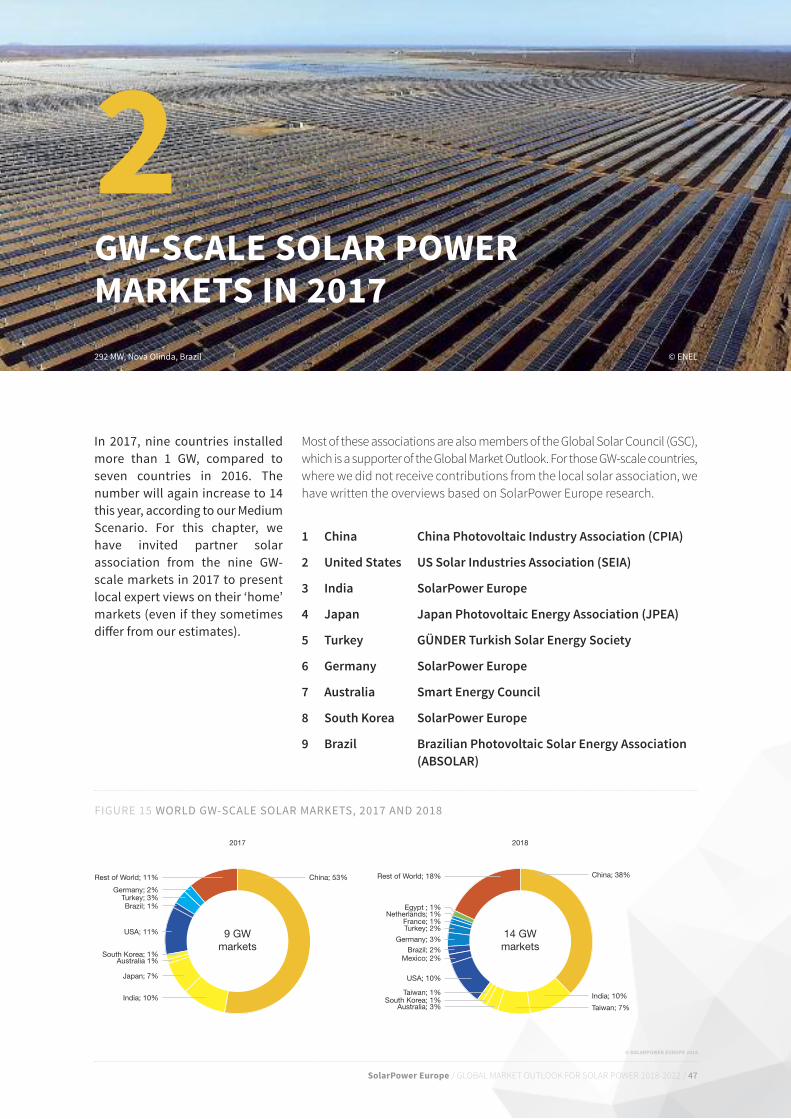
SolarPower Europe / GlObal MarkEt OutlOOk FOr SOlar POWEr 2018-2022 / 47
in 2017, nine countries installedmore than 1 gW, compared toseven countries in 2016. Thenumber will again increase to 14this year, according to our MediumScenario. For this chapter, wehave invited partner solarassociation from the nine gW-scale markets in 2017 to presentlocal expert views on their ‘home’markets (even if they sometimesdiffer from our estimates).
Most of these associations are also members of the Global Solar Council (GSC),which is a supporter of the Global Market Outlook. For those GW-scale countries,where we did not receive contributions from the local solar association, wehave written the overviews based on SolarPower Europe research.
1 China China Photovoltaic Industry Association (CPIA)
2 United States US Solar Industries Association (SEIA)
3 India SolarPower Europe
4 Japan Japan Photovoltaic Energy Association (JPEA)
5 Turkey GÜNDER Turkish Solar Energy Society
6 Germany SolarPower Europe
7 Australia Smart Energy Council
8 South Korea SolarPower Europe
9 Brazil Brazilian Photovoltaic Solar Energy Association (ABSOLAR)
GW-SCALE SOLAR POWER MARKETS IN 2017
2© eNeL292 MW, Nova Olinda, Brazil
Figure 15 WOrLD gW-SCALe SOLAr MArKeTS, 2017 AND 2018
China; 53% China; 38%
India; 10%
Taiwan; 7%
Brazil; 1%Netherlands; 1%
USA; 11%
Australia; 3%
Japan; 7%
Germany; 2%
USA; 10%
South Korea; 1%
Taiwan; 1%
France; 1%
Rest of World; 11% Rest of World; 18%
India; 10% South Korea; 1%
Turkey; 3%
Germany; 3%
Egypt ; 1%
Mexico; 2%Brazil; 2%
Australia 1%
Turkey; 2%
2017
9 GWmarkets
2018
14 GWmarkets
© SOLARPOWER EUROPE 2018
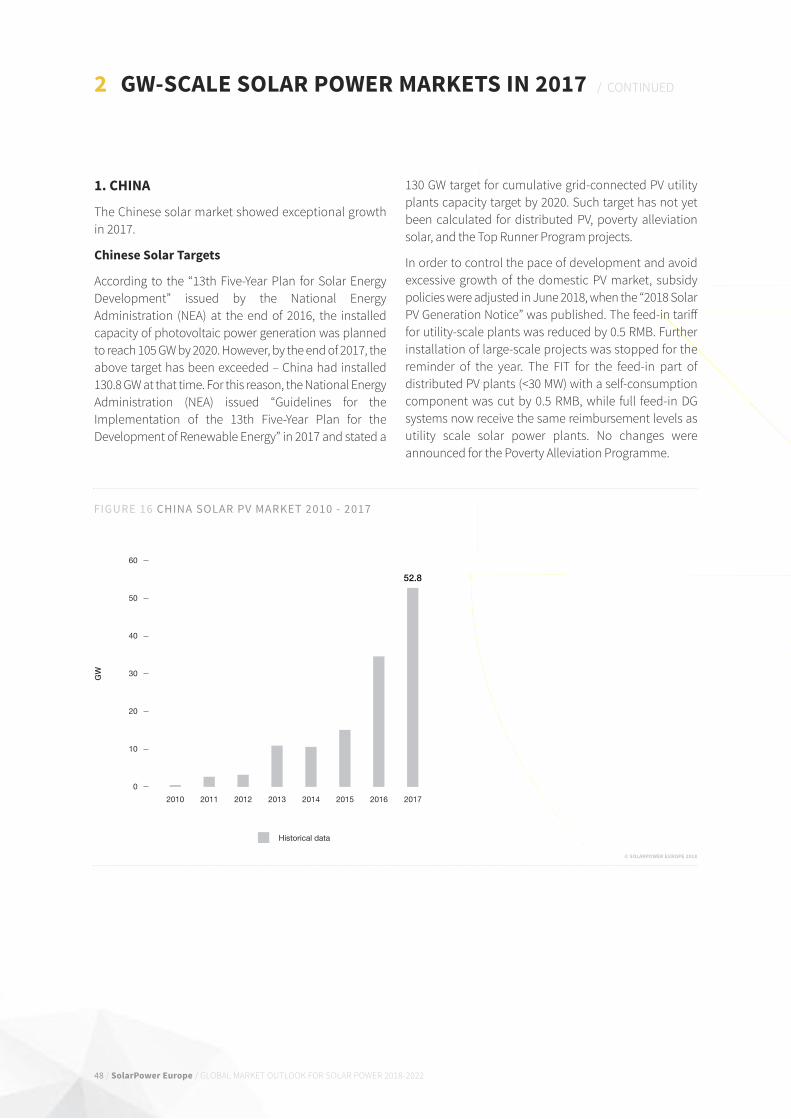
48 / SolarPower Europe / GloBAl MARkET ouTlook FoR SolAR PoWER 2018-2022
2 GW-SCALE SOLAR POWER MARKETS IN 2017 / CoNTINuED
© SOLARPOWER EUROPE 2018
FIGURE 16 CHINA SOLAR PV MARKET 2010 - 2017
0
10
20
30
40
50
60
GW
Historical data
52.8
2010 2011 2012 2013 2014 2015 2016 2017
1. CHINA
The Chinese solar market showed exceptional growthin 2017.
Chinese Solar Targets
According to the “13th Five-Year Plan for Solar EnergyDevelopment” issued by the National EnergyAdministration (NEA) at the end of 2016, the installedcapacity of photovoltaic power generation was plannedto reach 105 GW by 2020. However, by the end of 2017, theabove target has been exceeded – China had installed130.8 GW at that time. For this reason, the National EnergyAdministration (NEA) issued “Guidelines for theImplementation of the 13th Five-Year Plan for theDevelopment of Renewable Energy” in 2017 and stated a
130 GW target for cumulative grid-connected PV utilityplants capacity target by 2020. Such target has not yetbeen calculated for distributed PV, poverty alleviationsolar, and the Top Runner Program projects.
In order to control the pace of development and avoidexcessive growth of the domestic PV market, subsidypolicies were adjusted in June 2018, when the “2018 SolarPV Generation Notice” was published. The feed-in tarifffor utility-scale plants was reduced by 0.5 RMB. Furtherinstallation of large-scale projects was stopped for thereminder of the year. The FIT for the feed-in part ofdistributed PV plants (<30 MW) with a self-consumptioncomponent was cut by 0.5 RMB, while full feed-in DGsystems now receive the same reimbursement levels asutility scale solar power plants. No changes wereannounced for the Poverty Alleviation Programme.

SolarPower Europe / GLOBAL MARkET OUTLOOk fOR SOLAR POWER 2018-2022 / 49
Solar Market in china 2017
In 2017, China new installed photovoltaic grid-connected capacity reached 53.06 GW, 54% year-on-year growth. The cumulative photovoltaic installationcapacity reached 130.25 GW, an increase of 69% over thesame period of last year. Among them, the cumulativeutility plants scale is 100.59 GW, the distributed plantsis 29.66 GW, The annual photovoltaic power generationamounted to 118.2 billion kWh, accounting for 1.8% ofChina’s total annual power generation.
In the first quarter of 2018, China installed 9.65 GW, a22% year-on-year growth. While utility scale PV capacityreached 1.97 GW, which was a drop of 64% year-on-year,the volume of distributed PV installations, comprisingsystems up to 30 MW, increased by 217% to 7.69 GWyear-on-year. Photovoltaic power generation improvedby 64% to 35.1 billion kWh.
challenges
The challenges lying ahead of the Chinese photovoltaicplayers are late fIT payments, curtailment, missingtransmission, and uncertainties regarding the newsubsidy policy guidelines. The Chinese government isworking on addressing all these issues.
Author: China Photovoltaic Industry Association (CPIA)
Drivers for Photovoltaic Growth in china
• Feed-in Tariff: The feed-in tariff is the main driver forsolar in China. In early June, NEA adjusted the tariffswith immediate effect (see Table 1):
• Top Runner Program: In 2015, the National EnergyAdministration (NEA), the Ministry of Industry andInformation Technology (MIIT) and the NationalCertification and Accreditation Administration jointlyissued the “Opinions on Promoting the Applicationand Industrial Upgrade of Advanced PhotovoltaicTechnology Products”, and implemented the “TopRunner Program"- on the one hand to promoteapplication of advanced PV products and on theother hand resulting in the closing of outdatedproduction facilities. By the end of 2017, a total of 3"Top Runner Program" plans were approved, with atotal scale of 12.5 GW. The lowest bid was awardedin Qinghai province at a level of 0.31 RMB/kWh.
In 2017, a Technology Top Runner DemonstrationProject for innovative products was launched, andthe total scale of the first phase of the project was1.5 GW; that aims to create a market place for ultra-efficient cells.
• Poverty Alleviation: At the end of 2017, the firstbatch of PV poverty alleviation projects under the“13th five-Year Plan” was issued with a total scale ofapproximately 4.18 GW. In 2018, the second batch ofphotovoltaic poverty alleviation plans will be issuedin due course.
RESOURcE zONE PV UTIlITY PlaNTS bENcHMaRK ON-GRID PRIcE DISTRIbUTED GENERaTION FIT STaNDaRD
ORDINaRY UTIlITYPlaNTS
VIllaGE POVERTYallEVIaTION PlaNTS
ORDINaRY PROjEcTS DISTRIbUTED POVERTYallEVIaTION PROjEcTS
Class 1 Resource zone
0.5 (0.55) RMB 0.65 RMB
Class 1 Resource zone
0.6 (0.65) RMB 0.75 RMB 0.032 (0.37) RMB 0.42 RMB
Class 3 Resource zone
0.7 (0.75) RMB 0.85 RMB
TABLE 1 2018 NATIONAL PHOTOVOLTAIC POWER GENERATION ON-GRID FIT PRICE LIST

50 / SolarPower Europe / GLOBAL MARkET OUTLOOk fOR SOLAR POWER 2018-2022
2 GW-ScalE SOlaR POWER MaRKETS IN 2017 / CONTINUED
Meanwhile, the year-over-year downturn for utility PV in2017 was largely expected, due to the massive influx ofprojects trying to leverage the 30 % federal InvestmentTax Credit (ITC) in 2016. However, uncertaintysurrounding the Section 201 tariffs caused manyprojects to be shelved in 2017, while PURPA projectcancellation and interconnection delays resulted inmany projects spilling over into 2018.
finally, both closing regulatory windows and therealization of a robust community-solar pipeline drovesubstantial growth in non-residential solar in 2017. Thisis the second consecutive year for such growth after thespace essentially remained flat from 2012-2015.
With President Trump’s decision to impose tariffs onimports of cells and panels now final, GTM Researchreduced its forecasts to account for the impact of tariffs onsystem pricing, in tandem with the impacts of corporatetax reform on customers, developers and financiers.
2. UNITED STaTES
In 2017, the US solar market installed 10.6 GW of solarPV capacity, or about the equivalent of the amount ofelectricity used by 2 million homes. Despite installing30% less solar than was installed in a record-breaking2016, the market still exceeded 2015 levels by 40%.
In line with previous years, 59% of the installed capacitylast year came from the utility PV segment, whiledistributed solar accounted for 41% of installations.
Last year bucked many historical trends in what provedto be a transitional year for the solar market. Allsegments experienced role reversal, as residential andutility PV – long the growth segments of the solar market– both saw installations fall on an annual basis for thefirst time since 2010, marking a “reset” year for bothsegments. Meanwhile, the long-beleaguered non-residential PV segment was the only market toexperience growth in 2017.
for residential PV, the downturn in 2017 stems fromsegment-wide customer acquisition challenges that areconstraining growth across most major state markets.
FIGURE 17 USA SOLAR PV MARKET SCENARIOS 2018 - 2023
0
2
4
6
8
10
12
14
16
GW
10.710.6
15.1
201220112010 2013 2014 2015 2016 2017 2018 2019 2020 2021 2022 2023
Historical Utility
Forecast Residential
Historical Non-residentialHistorical Residential
Forecast Non-Residential Forecast Utility
© SOlaRPOWER EUROPE 2018Source: SEIA / GTM Research
SolarPower Europe / GLOBAL MARkET OUTLOOk fOR SOLAR POWER 2018-2022 / 51
installers scaling back expensive sales channels andtransitioning to lower-cost customer-acquisitionstrategies in pursuit of profitability. These challenges areexpected to continue in the near-term for large nationalinstallers, though 2017-2018 is expected to be thebottoming out of this trend as national installers exertless influence on the market 2018 than they did in 2017.
Growth is therefore expected to remain in the sub-10%range through 2020 as the market aligns to theexpectations of small and medium-sized installersleveraging less expensive customer-acquisitionchannels, with upside contingent on the extent to whichnational installers can sustainably scale new customeracquisition strategies and sales channels.
Next 2-Digit Growth Period Expected as of 2020
Growth rates exceeding 10% are expected to resume inthe early 2020s as emerging markets begin to accountfor a larger share of the residential market.
Meanwhile, the non-residential PV market is expectedto experience two consecutive down years as thegrandfathered project pipeline wanes in 2018 and themarket acclimates to a reduced incentive environmentacross major state markets in 2019.
However, this will be incrementally offset in 2020 as thenext wave of states with robust community solarmandates – New York, Maryland, Illinois – begin to seethe realization of those pipelines while the viability ofsolar-plus-storage spreads beginning in the next decade.
By 2020, growth will resume across all segments, with28 states in the US expected to be 100+ MW annual solarmarkets, and with 25 of those states being home tomore than 1 GW of operating solar PV.
Authors: Dan Whitten & Justin Baca, US Solar EnergyIndustries Association (SEIA)
Flat Demand in 2018, Slight Growth in 2019
With that in mind, SEIA with the support of GTMResearch forecasts US solar to be essentially flat in 2018.With nearly two-thirds of the 2018 utility PV pipelineconsisting of relatively less-price-sensitive renewableportfolio standard projects and projects currently inconstruction that secured tariff-free modules (eithercrystalline-silicon PV delivered before the tariffs wentinto effect or non-subject thin-film modules), tariffimpacts on 2018 will be somewhat mitigated.
The non-residential market will fall as a pipeline ofprojects grandfathered in under a more favorable policyand incentive environment wanes in 2018.
Residential PV will see a slight rebound after falling 16%in 2017, with a more robust rebound blunted somewhatby the tariffs. This is especially true in major marketsthat faced higher costs of customer acquisition in 2017,which on net see essentially no growth in 2018.
In the medium term, the post-2018 utility pipeline hasbeen reduced as more price-sensitive procurementdrivers such as PURPA (Public Utility Regulatory PoliciesAct) and voluntary procurement (i.e., projects madeviable due to their economic competitiveness) are unableto pencil out under increased price assumptions.
Though the utility segment is still expected to grow 17%in 2019, growth will be relatively flat from 2020-2022 astariffs push out projects that were initially slated forcompletion in 2020-2021. Going forward, utility PV’srecovery will continue to be driven by procurementoutside renewable portfolio standards, with more than75% of the current pipeline coming from voluntaryprocurement, PURPA, off-site corporate procurement,and California-based community-choice aggregators.
for residential PV, the widespread customer-acquisitionissues in major state markets that afflicted the segmentin 2017 are only exacerbated in an increased pricingenvironment. This is especially true for large national

52 / SolarPower Europe / GLOBAL MARkET OUTLOOk fOR SOLAR POWER 2018-2022
3. INDIa
2017 has been a record year for solar photovoltaics inIndia. Cumulative installed capacity exceeded 19 GW,with net yearly additions of 9.63 GW – a staggering+127% market growth from last year’s 4.25 GW. TheIndian market took Japan’s place as the third largestmarket worldwide and is on trajectory to become thesecond largest, perhaps already in 2018. The IndianGovernment’s strong commitment to solar has itseffects on other power sources: In 2017, solar was thelargest source of new power generation capacityadditions, constituting a 45% share.
After the steep year-over-year 2017 growth, India isexpected to take a breath in 2018. SolarPower Europe’smedium scenario expects slight growth to 10.5 GW ofnewly installed capacity this year. The current projectpipeline is lower, after fewer tenders were issued in thepast year. Moreover, the first months of 2018, weregoverned by uncertainty stemming from a discussionon a 70% safeguard tax on imported solar cells,although this seems off the table for now.
2 GW-ScalE SOlaR POWER MaRKETS IN 2017 / CONTINUED
© SOlaRPOWER EUROPE 2018
FIGURE 18 INDIA SOLAR PV MARKET SCENARIOS 2018 - 2022
0
5
10
15
20
25
30
35
GW
Historical data Low Scenario High Scenario
9.6
2010 2011 2012 2013 2014 2015 2016 2017 2018 2019 2020 2021 2022
13.5
28.6
12.1
7.8
In November 2017, India’s Ministry of New andRenewable Energy (MNRE) laid out its roadmap forfuture tenders to boost demand and make sure its 2022National Solar Mission goals are met. MNRE plans totender 20 GW in fY 2017/18 and 30 GW each in fY2018/19 and fY 2090/20. This explains the extraordinaryhigh tender activity over the first months of 2018.
Indian Solar/RE Targets
A profound transformation of the energy sector in mind,the Indian government has set out ambitious renewableenergy targets in which solar plays a paramount role. In2015, India announced a RE target of 175 GW by 2022, anet growth of 150 GW from the installed RE capacity atthat time. Solar installed capacity was planned to total100 GW by 2022, while wind power was supposed tocontribute 60 GW. Rooftop PV is targeted to contribute40% to the solar total. While several experts have haddoubts if these targets can be reached, in early June2018, India’s minister of power and renewables evenannounced to up the 2022 RE goal by 52 GW to 227 GW.
SolarPower Europe / GLOBAL MARkET OUTLOOk fOR SOLAR POWER 2018-2022 / 53
Drivers for Solar Growth
A number of policy measures have been set in placeby MNRE to support the achievement of India’s 2022solar goals.
An amendment to the National Tariff Policy includesprovisions for Renewable Generation Obligations (RGO)and Renewable Purchase Obligations (RPO). The policyrequires state-owned power distribution companies topurchase 8% of their energy from solar by 2022, andmandates thermal power plant operators to have acertain amount of renewable components in newinstalled capacity.
Besides these quota obligations, several economicincentives such as generation-based incentives,viability gap funding, capital and interest subsidies,concessional finance and fiscal incentives have beenset in place. India is supporting large-scale solarthrough the development of industrial solar parks,which has resulted in PV projects that belong to thelargest in the world. A key tool to push solar in Indiaare competitive tenders, which have pushed tariffsdown to 0.031 €/kWh.
In order to match increased generation capacity withadequate network expansion and to establish smartgrids that integrate renewable energy into the nationalgrid, the government has planned a growth of networkinfrastructure with the support of the Green EnergyCorridor project. Through the project, financial andtechnical assistance is provided to the power gridcorporation and state transmission utilities.
Under the Sustainable Rooftop Implementation forSolar Transfiguration of India (SRISTI), the residential,commercial, industrial and institutional sectors areprovided financial assistance for their rooftopinstallations. This subsidy scheme, allocating morefinancial resources and covering more customers thanthe previous version, is expected to play a central rolein the achievement of the target of 40 GW of rooftopsolar capacity by 2022. A “rent a roof” policy is alsobeing planned by the government, allowingdevelopers to take rooftops on rent, freeinghouseholds from responsibilities of installation andmaintenance of the system.
Utility-scale vs Distributed Solar Development
The bulk of installations added in 2017 consisted ofutility-scale systems. In particular, industrial solar parksconstitute the backbone of Indian PV expansion. Ultramega power plant (UMPP) construction is facilitated bystate governments or local distribution companiesbearing the risks for land acquisition and benefittingfrom economies of scale.
Installed rooftop capacity is between 1 and 2 GW, fallingsignificantly short of the originally 5 GW target by March2018. Under the current trajectory, the goal of reaching40 GW of rooftop solar installations seems out of range.However, growth prospects are bright, as solar hasbecome cheaper than grid power for most ofcommercial and industrial users. In combination withbatteries, solar is also able to provide a solar powerback-up solution, which all companies use anyway.
challenges
While the Indian market expansion follows anexponential trajectory, lagging behind schedule can beexplained by a number of factors beyond financing:
• first, the goals are very ambitious. India started fromscratch and had to move quickly on many fronts toestablish infrastructure and energy policy frameworks.
• Local content and trade protection measures havebeen looming over solar expansion and createdlarge uncertainties across the market.
• Many Indian utilities have been having financialdifficulties. Solar has not been high on their agenda,unless pushed through obligations to purchaserenewable electricity.
• Rooftop solar, especially in the residential sector,needs more policy support to tap its huge growthpotential. Policy harmonisation across states andclearing ambiguity related to net metering or othersupport policies is necessary for further rooftopdevelopment. Otherwise the 40 GW rooftop targetwill not be reached by 2022.
Authors: Raffaele Rossi, Michael Schmela, SolarPower Europe
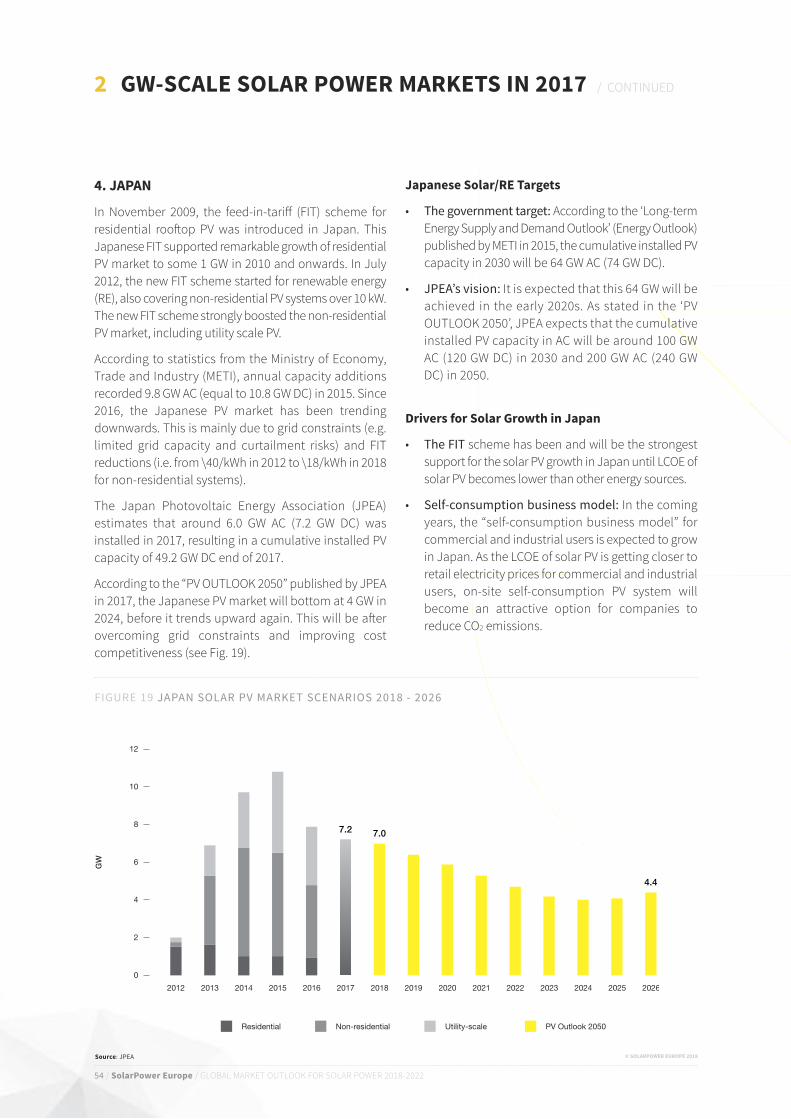
54 / SolarPower Europe / GLOBAL MARkET OUTLOOk fOR SOLAR POWER 2018-2022
2 GW-ScalE SOlaR POWER MaRKETS IN 2017 / CONTINUED
4. jaPaN
In November 2009, the feed-in-tariff (fIT) scheme forresidential rooftop PV was introduced in Japan. ThisJapanese fIT supported remarkable growth of residentialPV market to some 1 GW in 2010 and onwards. In July2012, the new fIT scheme started for renewable energy(RE), also covering non-residential PV systems over 10 kW.The new fIT scheme strongly boosted the non-residentialPV market, including utility scale PV.
According to statistics from the Ministry of Economy,Trade and Industry (METI), annual capacity additionsrecorded 9.8 GW AC (equal to 10.8 GW DC) in 2015. Since2016, the Japanese PV market has been trendingdownwards. This is mainly due to grid constraints (e.g.limited grid capacity and curtailment risks) and fITreductions (i.e. from \40/kWh in 2012 to \18/kWh in 2018for non-residential systems).
The Japan Photovoltaic Energy Association (JPEA)estimates that around 6.0 GW AC (7.2 GW DC) wasinstalled in 2017, resulting in a cumulative installed PVcapacity of 49.2 GW DC end of 2017.
According to the “PV OUTLOOk 2050” published by JPEAin 2017, the Japanese PV market will bottom at 4 GW in2024, before it trends upward again. This will be afterovercoming grid constraints and improving costcompetitiveness (see fig. 19).
FIGURE 19 JAPAN SOLAR PV MARKET SCENARIOS 2018 - 2026
0
2
4
6
8
10
12
GW
Utility-scaleNon-residentialResidential PV Outlook 2050
7.07.2
4.4
2012 2013 2014 2015 2016 2017 2018 2019 2020 2021 2022 2023 2024 2025 2026
© SOlaRPOWER EUROPE 2018Source: JPEA
japanese Solar/RE Targets
• The government target: According to the ‘Long-termEnergy Supply and Demand Outlook’ (Energy Outlook)published by METI in 2015, the cumulative installed PVcapacity in 2030 will be 64 GW AC (74 GW DC).
• JPEA’s vision: It is expected that this 64 GW will beachieved in the early 2020s. As stated in the ‘PVOUTLOOk 2050’, JPEA expects that the cumulativeinstalled PV capacity in AC will be around 100 GWAC (120 GW DC) in 2030 and 200 GW AC (240 GWDC) in 2050.
Drivers for Solar Growth in japan
• The FIT scheme has been and will be the strongestsupport for the solar PV growth in Japan until LCOE ofsolar PV becomes lower than other energy sources.
• Self-consumption business model: In the comingyears, the “self-consumption business model” forcommercial and industrial users is expected to growin Japan. As the LCOE of solar PV is getting closer toretail electricity prices for commercial and industrialusers, on-site self-consumption PV system willbecome an attractive option for companies toreduce CO2 emissions.

SolarPower Europe / GLOBAL MARkET OUTLOOk fOR SOLAR POWER 2016-2020 / 55
• Net-zero Energy House: Promotion of net-zeroenergy house (ZEH) by the government is expectedto support the growth of residential PV markettowards 2030. According to the ‘ZEH Roadmap’, thegovernment’s ambitious target is to achieve net-zeroenergy on average for newly built houses by 2030.
challenges
• Expiry of FIT for residential roof-top users: InJapan, the fIT for residential PV system (less than 10kW) is set for 10 years from its first on-grid day. As ofNovember 2019, this 10-year fIT will expire for thefirst residential systems installed as part of thissupport scheme. By the end of 2020, the cumulativePV capacity dropped out of the fIT will be around 3GW, which means some 700,000 users will need tobecome smart prosumers to maximize the value oftheir assets, e.g. to increase self-consumptionand/or to find reliable aggregators. This challengewill provide business opportunities for solutionproviders in the residential market segment.
• Grid constraints: Limited grid capacity andcurtailment risks are the primary causes of thedownward market trend in Japan. These issues needto be overcome with the highest priority. TheJapanese government has started several mitigationmeasures, such as the “connect and manage”programme to maximize grid capacity with existingassets by learning good practices from Europe.
• Cost competitiveness: The cost of solar PV in Japanis higher compared to average international levels,mainly due to expensive construction and soft costs.The fIT for non-residential PV (10 kW to 2 MW) wasset in fiscal year 2018 at \18/kWh. To achieve gridparity in Japan, solar LCOE needs to be reduced tothe level of electricity wholesale market prices thatis currently around \10/kWh. Although, this is a realbig challenge for the PV industry in Japan, JPEAexpects that grid parity will be achieved by 2030. Thegovernment targets PV LCOE of \7/kWh in 2030.
Author: Japan Photovoltaic Energy Association (JPEA)
When adding more busbars, it makes your choice of PV ribbon even more important. Choose wisely.
Choosing to go with four, five or more busbars is no small decision
bywww.luvata.com/sunwire

56 / SolarPower Europe / GlobAl mArkeT ouTlook for solAr poWer 2018-2022
5. TURKEY
Turkey is one of the fastest growing energy markets in theworld. Turkey’s total energy demand has been increasingrapidly. imported fossil fuels dominate Turkey’s totalprimary energy consumption by 75%. However, one of thegovernment’s priorities is to increase the ratio of renewableenergy resources to 30 % of total energy generation by 2023.
2 GW-SCALE SOLAR POWER MARKETS IN 2017 / conTinued
POWER RESOURCES INSTALLED CAPACITY(MW) (2016)
INSTALLED CAPACITY(MW) (2017)
ADDED CAPACITY(MW) (2016-2017)
INCREASE (%)(2016-2017)
Fossil fuels based thermal power plants 44,411.7 46,926.5 2,514.8 5.7
Hydroelectric 26,681.1 27,273.1 592 2.2
Wind 5,751.3 6,516.2 764.9 13.3
Solar PV 832.5 3,420.7 2,588.2 310.9
Geothermal 820.9 1,063.7 242.8 29.6
Total 78,497.5 85,200.2 6,207.7 8.5
TABLE 2 BREAKDOWN OF INSTALLED CAPACITY BY ENERGY RESOURCES IN 2016 AND 2017
As seen in Table 2, Turkey had 85.2 GW of installedelectricity generation capacity end of 2017. The breakdownby generation sources is as follows: 55.08% fossil fuels(natural gas, coal, liquid fuels etc.), 32.01% hydro, 7.65%wind, 4.01% solar and 1.25% geothermal. Almost allnatural gas and around 40% of coal were imported.Therefore, Turkey needs to boost its power self-sufficiencyby handling its rich potential of renewable energy sources.
www.plantpredict.com |
SOLAR MODELING MADE SIMPLE.PlantPredict is a cloud-based web application that allows users to develop solar energy estimates for utility-scale PV applications.
> 75% faster prediction turnaround time> Transparent, industry-recognized models > Robust, utility-scale features – Sub-hourly predictions – Hundreds of simulations in one-click
Contact us to request an account for your company or email:
Powered by:
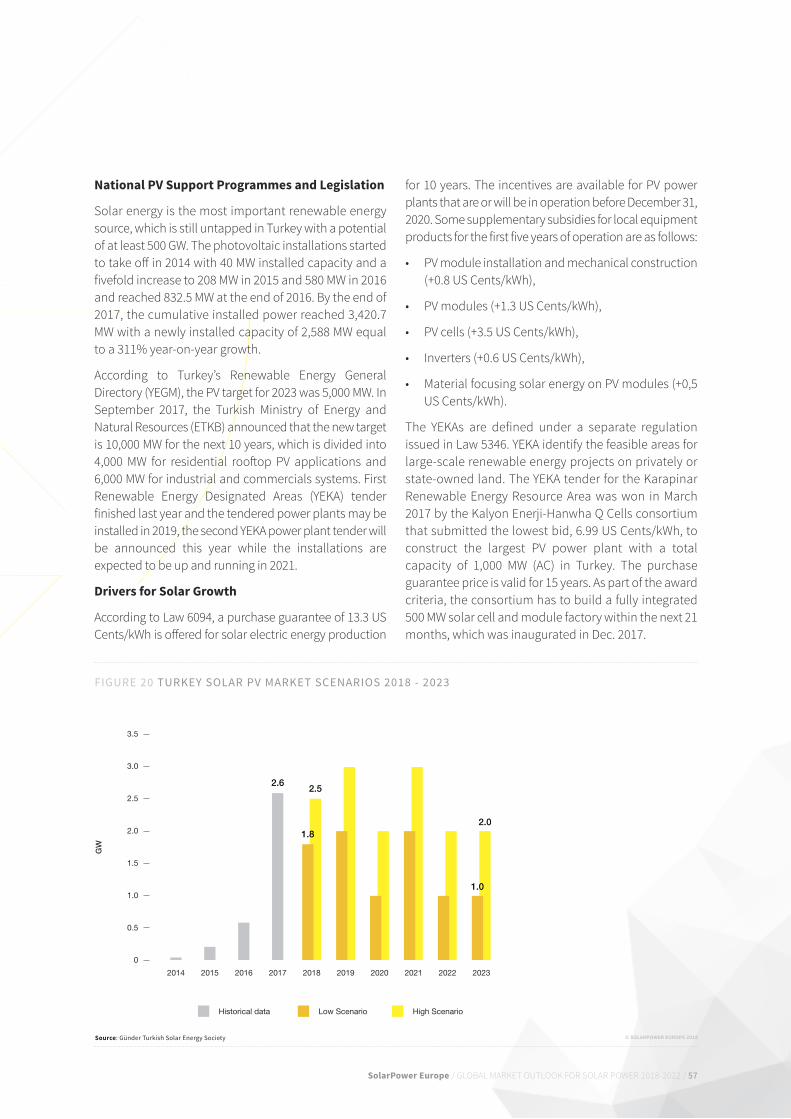
SolarPower Europe / GLOBAL MARkET OUTLOOk fOR SOLAR POWER 2018-2022 / 57
for 10 years. The incentives are available for PV powerplants that are or will be in operation before December 31,2020. Some supplementary subsidies for local equipmentproducts for the first five years of operation are as follows:
• PV module installation and mechanical construction(+0.8 US Cents/kWh),
• PV modules (+1.3 US Cents/kWh),
• PV cells (+3.5 US Cents/kWh),
• Inverters (+0.6 US Cents/kWh),
• Material focusing solar energy on PV modules (+0,5US Cents/kWh).
The YEkAs are defined under a separate regulationissued in Law 5346. YEkA identify the feasible areas forlarge-scale renewable energy projects on privately orstate-owned land. The YEkA tender for the karapinarRenewable Energy Resource Area was won in March2017 by the kalyon Enerji-Hanwha Q Cells consortiumthat submitted the lowest bid, 6.99 US Cents/kWh, toconstruct the largest PV power plant with a totalcapacity of 1,000 MW (AC) in Turkey. The purchaseguarantee price is valid for 15 years. As part of the awardcriteria, the consortium has to build a fully integrated500 MW solar cell and module factory within the next 21months, which was inaugurated in Dec. 2017.
FIGURE 20 TURKEY SOLAR PV MARKET SCENARIOS 2018 - 2023
0
0.5
1.0
1.5
2.0
2.5
3.0
3.5
GW
Historical data Low Scenario High Scenario
1.8
2.5
20152014 2016 2017 2018 2019 2020 2021 2022 2023
2.6
2.0
1.0
© SOlaRPOWER EUROPE 2018Source: Günder Turkish Solar Energy Society
National PV Support Programmes and legislation
Solar energy is the most important renewable energysource, which is still untapped in Turkey with a potentialof at least 500 GW. The photovoltaic installations startedto take off in 2014 with 40 MW installed capacity and afivefold increase to 208 MW in 2015 and 580 MW in 2016and reached 832.5 MW at the end of 2016. By the end of2017, the cumulative installed power reached 3,420.7MW with a newly installed capacity of 2,588 MW equalto a 311% year-on-year growth.
According to Turkey’s Renewable Energy GeneralDirectory (YEGM), the PV target for 2023 was 5,000 MW. InSeptember 2017, the Turkish Ministry of Energy andNatural Resources (ETkB) announced that the new targetis 10,000 MW for the next 10 years, which is divided into4,000 MW for residential rooftop PV applications and6,000 MW for industrial and commercials systems. firstRenewable Energy Designated Areas (YEkA) tenderfinished last year and the tendered power plants may beinstalled in 2019, the second YEkA power plant tender willbe announced this year while the installations areexpected to be up and running in 2021.
Drivers for Solar Growth
According to Law 6094, a purchase guarantee of 13.3 USCents/kWh is offered for solar electric energy production
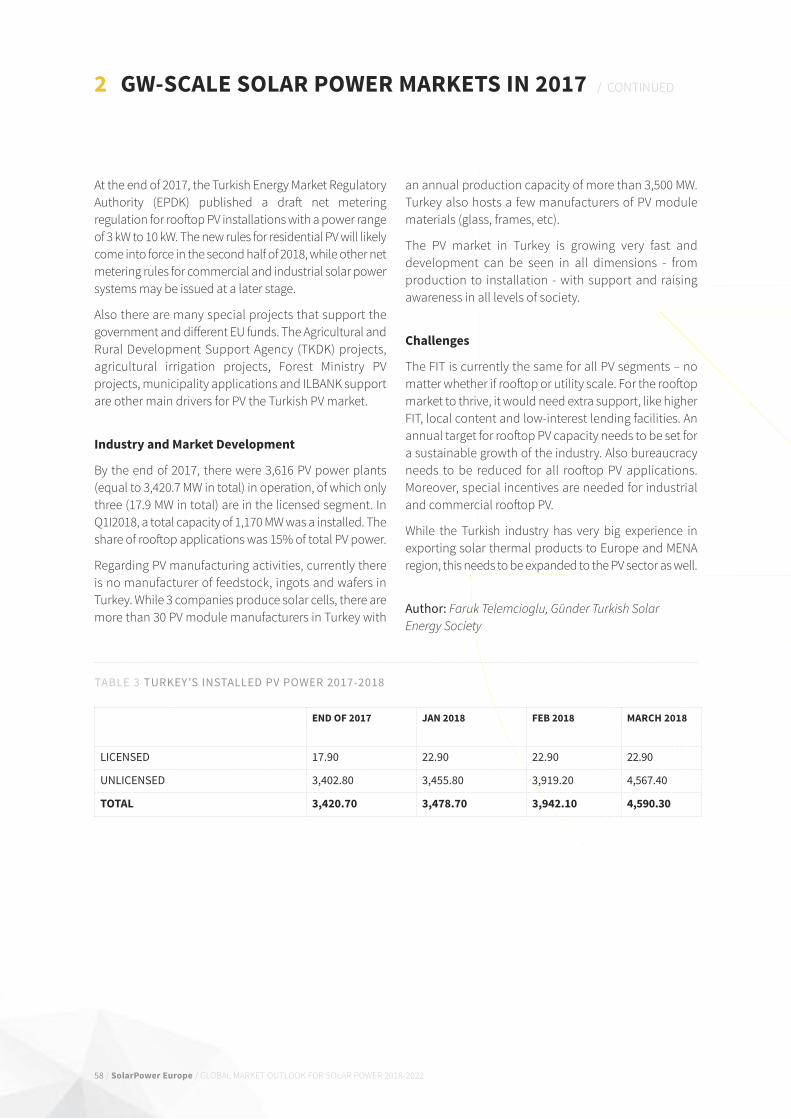
58 / SolarPower Europe / GLOBAL MARkET OUTLOOk fOR SOLAR POWER 2018-2022
At the end of 2017, the Turkish Energy Market RegulatoryAuthority (EPDk) published a draft net meteringregulation for rooftop PV installations with a power rangeof 3 kW to 10 kW. The new rules for residential PV will likelycome into force in the second half of 2018, while other netmetering rules for commercial and industrial solar powersystems may be issued at a later stage.
Also there are many special projects that support thegovernment and different EU funds. The Agricultural andRural Development Support Agency (TkDk) projects,agricultural irrigation projects, forest Ministry PVprojects, municipality applications and ILBANk supportare other main drivers for PV the Turkish PV market.
Industry and Market Development
By the end of 2017, there were 3,616 PV power plants(equal to 3,420.7 MW in total) in operation, of which onlythree (17.9 MW in total) are in the licensed segment. InQ1I2018, a total capacity of 1,170 MW was a installed. Theshare of rooftop applications was 15% of total PV power.
Regarding PV manufacturing activities, currently thereis no manufacturer of feedstock, ingots and wafers inTurkey. While 3 companies produce solar cells, there aremore than 30 PV module manufacturers in Turkey with
an annual production capacity of more than 3,500 MW.Turkey also hosts a few manufacturers of PV modulematerials (glass, frames, etc).
The PV market in Turkey is growing very fast anddevelopment can be seen in all dimensions - fromproduction to installation - with support and raisingawareness in all levels of society.
challenges
The fIT is currently the same for all PV segments – nomatter whether if rooftop or utility scale. for the rooftopmarket to thrive, it would need extra support, like higherfIT, local content and low-interest lending facilities. Anannual target for rooftop PV capacity needs to be set fora sustainable growth of the industry. Also bureaucracyneeds to be reduced for all rooftop PV applications.Moreover, special incentives are needed for industrialand commercial rooftop PV.
While the Turkish industry has very big experience inexporting solar thermal products to Europe and MENAregion, this needs to be expanded to the PV sector as well.
Author: Faruk Telemcioglu, Günder Turkish SolarEnergy Society
2 GW-ScalE SOlaR POWER MaRKETS IN 2017 / CONTINUED
END OF 2017 jaN 2018 FEb 2018 MaRcH 2018
LICENSED 17.90 22.90 22.90 22.90
UNLICENSED 3,402.80 3,455.80 3,919.20 4,567.40
TOTal 3,420.70 3,478.70 3,942.10 4,590.30
TABLE 3 TURKEY’S INSTALLED PV POWER 2017-2018
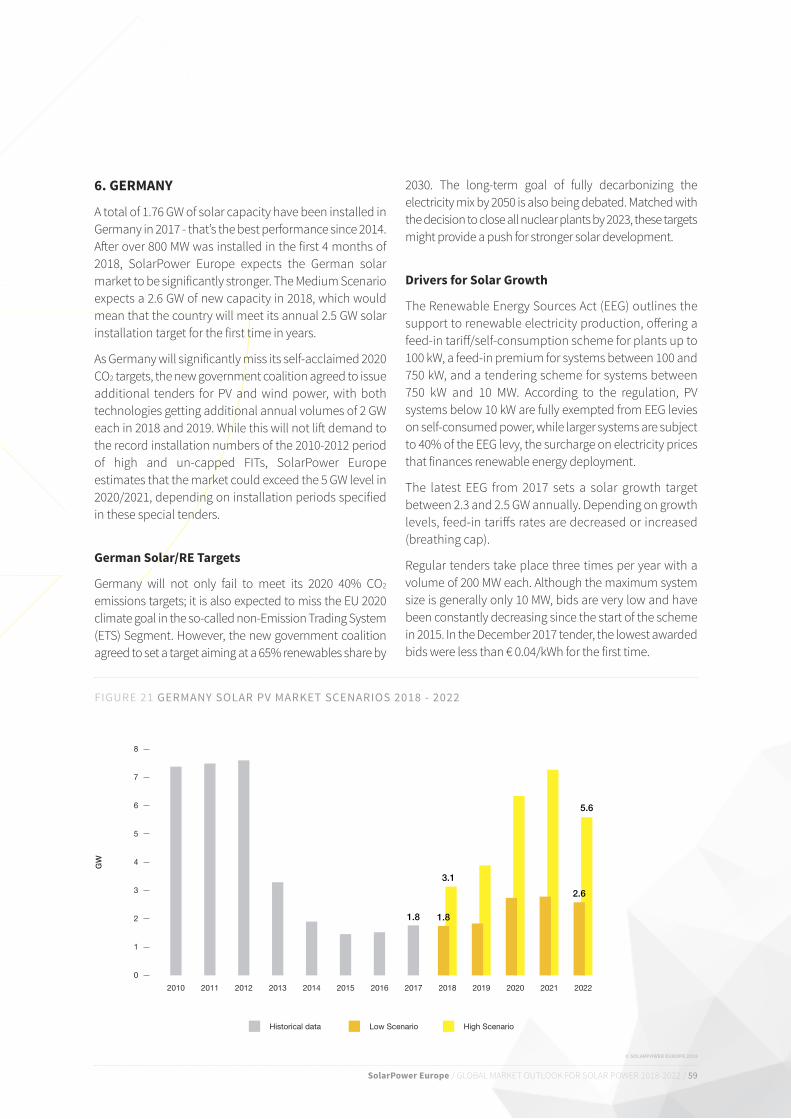
SolarPower Europe / GLOBAL MARkET OUTLOOk fOR SOLAR POWER 2018-2022 / 59
© SOlaRPOWER EUROPE 2018
FIGURE 21 GERMANY SOLAR PV MARKET SCENARIOS 2018 - 2022
0
1
2
3
4
5
6
7
8
GW
Historical data Low Scenario High Scenario
1.8
2010 2011 2012 2013 2014 2015 2016 2017 2018 2019 2020 2021 2022
3.1
5.6
2.6
1.8
6. GERMaNY
A total of 1.76 GW of solar capacity have been installed inGermany in 2017 - that’s the best performance since 2014.After over 800 MW was installed in the first 4 months of2018, SolarPower Europe expects the German solarmarket to be significantly stronger. The Medium Scenarioexpects a 2.6 GW of new capacity in 2018, which wouldmean that the country will meet its annual 2.5 GW solarinstallation target for the first time in years.
As Germany will significantly miss its self-acclaimed 2020CO2 targets, the new government coalition agreed to issueadditional tenders for PV and wind power, with bothtechnologies getting additional annual volumes of 2 GWeach in 2018 and 2019. While this will not lift demand tothe record installation numbers of the 2010-2012 periodof high and un-capped fITs, SolarPower Europeestimates that the market could exceed the 5 GW level in2020/2021, depending on installation periods specifiedin these special tenders.
German Solar/RE Targets
Germany will not only fail to meet its 2020 40% CO2
emissions targets; it is also expected to miss the EU 2020climate goal in the so-called non-Emission Trading System(ETS) Segment. However, the new government coalitionagreed to set a target aiming at a 65% renewables share by
2030. The long-term goal of fully decarbonizing theelectricity mix by 2050 is also being debated. Matched withthe decision to close all nuclear plants by 2023, these targetsmight provide a push for stronger solar development.
Drivers for Solar Growth
The Renewable Energy Sources Act (EEG) outlines thesupport to renewable electricity production, offering afeed-in tariff/self-consumption scheme for plants up to100 kW, a feed-in premium for systems between 100 and750 kW, and a tendering scheme for systems between750 kW and 10 MW. According to the regulation, PVsystems below 10 kW are fully exempted from EEG levieson self-consumed power, while larger systems are subjectto 40% of the EEG levy, the surcharge on electricity pricesthat finances renewable energy deployment.
The latest EEG from 2017 sets a solar growth targetbetween 2.3 and 2.5 GW annually. Depending on growthlevels, feed-in tariffs rates are decreased or increased(breathing cap).
Regular tenders take place three times per year with avolume of 200 MW each. Although the maximum systemsize is generally only 10 MW, bids are very low and havebeen constantly decreasing since the start of the schemein 2015. In the December 2017 tender, the lowest awardedbids were less than € 0.04/kWh for the first time.

60 / SolarPower Europe / GLOBAL MARkET OUTLOOk fOR SOLAR POWER 2018-2022
2 GW-ScalE SOlaR POWER MaRKETS IN 2017 / CONTINUED
www.kippzonen.com/energy
Designed to Optimize Solar Energy
The amount of solar radiation reaching your power plant cannot be changed; however, you can make the most of it by choosing high
quality equipment. Not only by selecting efficient generating technologies, but by installing the industry’s best instruments to monitor
the environmental parameters affecting your solar energy project performance.
Whether it is to optimize yield, manage your assets, make investment decisions, schedule plant maintenance or to forecast the energy
output reliably, we offer the instruments you need. From Kipp & Zonen smart pyranometers and Lufft weather stations, to the unique new
DustIQ for continuous monitoring of module soiling, we have it all.
Looking at the financial aspects, a number of investmentsupport options in the form of grants and low-interestloans are provided by German Development Bank (kfW),which also offers a special scheme for energy storage. In2017, nearly half of all newly built residential PV systemswere built with battery storage systems.
Ground-mount versus Rooftop Solar Development
As the maximum PV system size is generally 10 MW inGermany, it is fair to say that the country doesn’t reallysupport ‘utility-scale’ systems today. However, around onefourth of solar capacity added in 2017 were ground-mounted systems above 750 kW, with the remaining shareevenly distributed between residential, commercial andindustrial installations. Looking at cumulative figures,almost half of the total capacity stems from commercialsystems. Self-consumption and neighbor on-site tenantpower schemes (Mieterstrommodelle) are encouragedthrough fiscal and regulatory schemes.
challenges
The EEG law stipulates that further feed-in tariff systemswon’t be allowed once total PV installations in the countryreach 52 GW. At the end of April 2018, Germany had 43.8 GWPV installed. Under the current trajectory and with the‘special tenders’ for PV, this cap could be reached already in2020. The German Solar Industry Association (BSW) warnedin a position paper published in April 2018, that reaching thecap would result in an immediate collapse of PV demandfrom the rooftop segment, as new systems operators wouldnot get a premium tariff for the not self-consumed poweranymore, but only the very low wholesale prices. for thisreason, removing the 52 GW cap is the most crucial actionto ensure further solar growth in the German market.
BSW also asks for a 5 GW target per year and an exemptionfor rooftop systems larger 750 kW from the tender system.The new Mieterstrommodel, the scheme governingsolar supply and sales between neighbours, is onlyattracting little interest so far.
Authors: Raffaele Rossi, Michael Schmela, SolarPower Europe
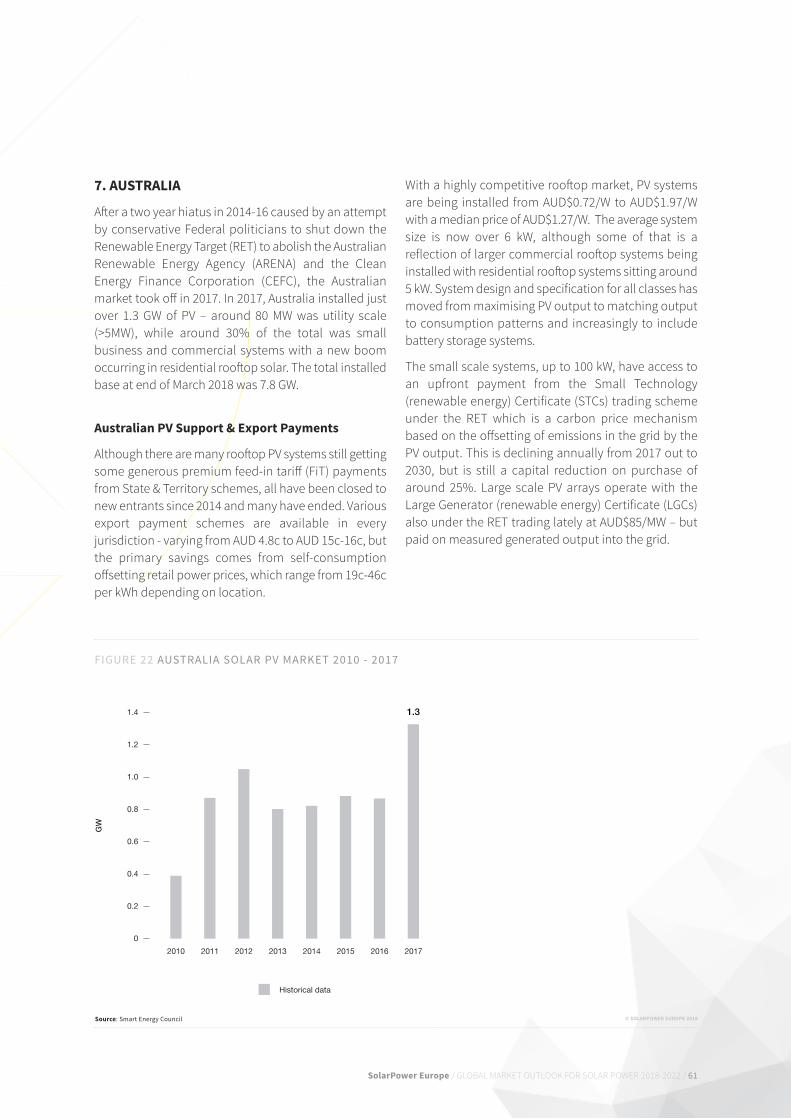
SolarPower Europe / GLObAL MARkET OUTLOOk FOR SOLAR POWER 2018-2022 / 61
With a highly competitive rooftop market, PV systemsare being installed from AUD$0.72/W to AUD$1.97/Wwith a median price of AUD$1.27/W. The average systemsize is now over 6 kW, although some of that is areflection of larger commercial rooftop systems beinginstalled with residential rooftop systems sitting around5 kW. System design and specification for all classes hasmoved from maximising PV output to matching outputto consumption patterns and increasingly to includebattery storage systems.
The small scale systems, up to 100 kW, have access toan upfront payment from the Small Technology(renewable energy) Certificate (STCs) trading schemeunder the RET which is a carbon price mechanismbased on the offsetting of emissions in the grid by thePV output. This is declining annually from 2017 out to2030, but is still a capital reduction on purchase ofaround 25%. Large scale PV arrays operate with theLarge Generator (renewable energy) Certificate (LGCs)also under the RET trading lately at AUD$85/MW – butpaid on measured generated output into the grid.
FIGURE 22 AUSTRALIA SOLAR PV MARKET 2010 - 2017
0
0.2
0.4
0.6
0.8
1.0
1.2
1.4
GW
Historical data
1.3
2010 2011 2012 2013 2014 2015 2016 2017
© SOLARPOWER EUROPE 2018Source: Smart Energy Council
7. AUSTRALIA
After a two year hiatus in 2014-16 caused by an attemptby conservative Federal politicians to shut down theRenewable Energy Target (RET) to abolish the AustralianRenewable Energy Agency (ARENA) and the CleanEnergy Finance Corporation (CEFC), the Australianmarket took off in 2017. In 2017, Australia installed justover 1.3 GW of PV – around 80 MW was utility scale(>5MW), while around 30% of the total was smallbusiness and commercial systems with a new boomoccurring in residential rooftop solar. The total installedbase at end of March 2018 was 7.8 GW.
Australian PV Support & Export Payments
Although there are many rooftop PV systems still gettingsome generous premium feed-in tariff (FiT) paymentsfrom State & Territory schemes, all have been closed tonew entrants since 2014 and many have ended. Variousexport payment schemes are available in everyjurisdiction - varying from AUD 4.8c to AUD 15c-16c, butthe primary savings comes from self-consumptionoffsetting retail power prices, which range from 19c-46cper kWh depending on location.
62 / SolarPower Europe / GLObAL MARkET OUTLOOk FOR SOLAR POWER 2018-2022
2 GW-SCALE SOLAR POWER MARKETS IN 2017 / CONTINUED
Potential for Growth & Risks in Australia
Critically the primary national support scheme, the RET,ends in 2020 for new entry large scale systems andalready the signs are that the LGC prices will falldramatically before then. There is currently no nationalreplacement policy that would support large scale PV, orother renewable energy deployment beyond 2020. Thereare major policy changes being considered the primaryone of which is the proposed National Energy Guarantee(NEG) – a significant policy risk for proposed large scaledeployment after 2020 and being planned now.
The NEG is an attempt to link emissions policy withenergy policy that had a fraught start with little detail, buthas made some improvements in its design. The majorsticking points remain unresolved: the lack of robustscience based emissions reduction targets; the low levelof the target for the electricity sector at 26-28% by 2030;and the lack of the States to have higher targets and theirown renewable energy programs. The consequences ifthe NEG is agreed as it now drafted are that Australianemissions goals are unambitious and unaligned with theParis less than 2 degrees aim and the low electricity sectortarget means that no large scale new generation of anytype is likely to be built out to 2030.
The Small Scale Emissions Reduction (SRES)component of the RET, due to end in 2030 was saved bythe action of the Smart Energy Council and other civilsociety participants in 2014 and is unlikely to be underany new political threat, although the value of the STCsis an unknown. The strong interest of consumers, largelydrive by increasing retail prices for electricity, and thehigh efficiency of the Australian approvals andinstallation processes along with continued componentprice drops has the rooftop market booming.
Outlook 2018
The Australian market remains bullish for rooftop PVwith more than 1.8 million homes having solar PV withthe highest per capita penetration in in the world. Thefirst few months of 2018 have again broken records notseen since the sunny days of premium FiTs in 2011-12.This suggests a possible 1.4 GW rooftop PV install thisyear with ~30% being businesses, >46,000 of whichalready have > 1GW installed and opportunity increasingin that space.
The future beyond 2020 has some uncertainty, but theexisting RET is driving some massive deployments ofutility scale PV with around 800 MW already commencedin 2018 and another tranche of around 1 GW for 2019. Wehave two State renewable energy programs that mightdrive the roll-out even higher. Victoria has already run itsfirst reverse auction for its Renewable Energy AuctionScheme which sought up to 550 MW of large scale,technology neutral renewable energy, and up to 100 MWof large scale solar-specific renewable energy. This firstround had more than 15 proposals come through thedoor, offering 3,500 MW of new wind and solar projects!The Queensland government is proposing a similarscheme for solar only of an initial 400 MW due out thisyear. It is worth noting that these are opportunities forPV industry players with no single large player or playersin the market – the top 20% of companies have just 30%of sales – so come down under!
Author: Steve Blume, Smart Energy Council
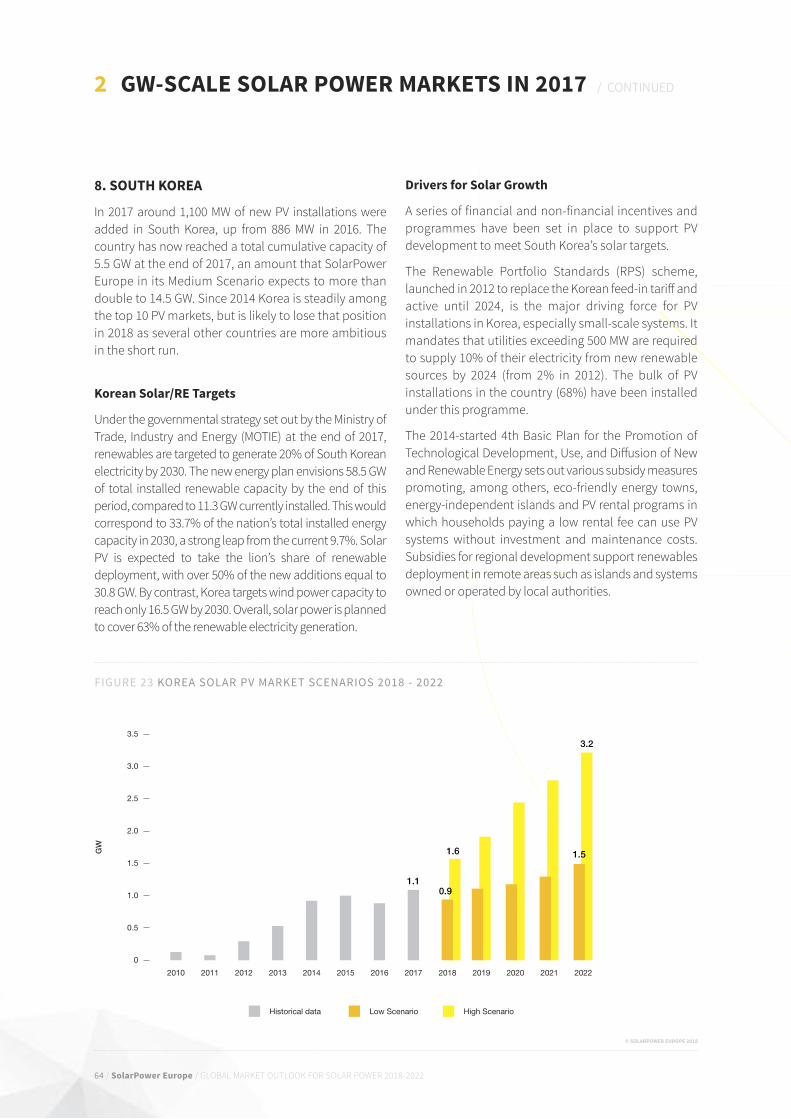
64 / SolarPower Europe / GLOBAL MARkET OUTLOOk fOR SOLAR POWER 2018-2022
2 GW-ScalE SOlaR POWER MaRKETS IN 2017 / CONTINUED
8. SOUTH KOREa
In 2017 around 1,100 MW of new PV installations wereadded in South korea, up from 886 MW in 2016. Thecountry has now reached a total cumulative capacity of 5.5 GW at the end of 2017, an amount that SolarPowerEurope in its Medium Scenario expects to more thandouble to 14.5 GW. Since 2014 korea is steadily amongthe top 10 PV markets, but is likely to lose that positionin 2018 as several other countries are more ambitiousin the short run.
Korean Solar/RE Targets
Under the governmental strategy set out by the Ministry ofTrade, Industry and Energy (MOTIE) at the end of 2017,renewables are targeted to generate 20% of South koreanelectricity by 2030. The new energy plan envisions 58.5 GWof total installed renewable capacity by the end of thisperiod, compared to 11.3 GW currently installed. This wouldcorrespond to 33.7% of the nation’s total installed energycapacity in 2030, a strong leap from the current 9.7%. SolarPV is expected to take the lion’s share of renewabledeployment, with over 50% of the new additions equal to30.8 GW. By contrast, korea targets wind power capacity toreach only 16.5 GW by 2030. Overall, solar power is plannedto cover 63% of the renewable electricity generation.
Drivers for Solar Growth
A series of financial and non-financial incentives andprogrammes have been set in place to support PVdevelopment to meet South korea’s solar targets.
The Renewable Portfolio Standards (RPS) scheme,launched in 2012 to replace the korean feed-in tariff andactive until 2024, is the major driving force for PVinstallations in korea, especially small-scale systems. Itmandates that utilities exceeding 500 MW are requiredto supply 10% of their electricity from new renewablesources by 2024 (from 2% in 2012). The bulk of PVinstallations in the country (68%) have been installedunder this programme.
The 2014-started 4th Basic Plan for the Promotion ofTechnological Development, Use, and Diffusion of Newand Renewable Energy sets out various subsidy measurespromoting, among others, eco-friendly energy towns,energy-independent islands and PV rental programs inwhich households paying a low rental fee can use PVsystems without investment and maintenance costs.Subsidies for regional development support renewablesdeployment in remote areas such as islands and systemsowned or operated by local authorities.
© SOlaRPOWER EUROPE 2018
FIGURE 23 KOREA SOLAR PV MARKET SCENARIOS 2018 - 2022
0
0.5
1.0
1.5
2.0
2.5
3.0
3.5
GW
Historical data Low Scenario High Scenario
1.1
2010 2011 2012 2013 2014 2015 2016 2017 2018 2019 2020 2021 2022
1.6
3.2
1.5
0.9

SolarPower Europe / GLOBAL MARkET OUTLOOk fOR SOLAR POWER 2018-2022 / 65
Incentives for solar PV in buildings exist under the HomeSubsidy Programme, the Building Subsidy Programme andthe Public Building Obligation Programme. The first hasthe goal of equipping one million homes with renewablesources; 60 to 100% of the upfront costs are covered for PVsystems with a capacity up to 3 kW. The Building SubsidyProgramme targets PV installations in large buildings(below 50 kW) through grants that cover up to 50% ofinstallation costs. Lastly, the Public Building ObligationProgramme sets out sustainability requirements for largepublic buildings stating that more than 15% of their energyconsumption has to come from renewable sources in 2016,with the target reaching 30% by 2020.
Focus on Distributed Solar Generation
facing an issue with its mountainous terrain that makesit difficult to find areas for real large utility-scale PV plants,the South korean government has identified distributedpower production as one of the key policy goals for itsenergy planning. According to the national energy plan,distributed power generation should contribute to 15%
Staubli is a trademark of Stäubli International AG, registered in Switzerland and other countries.© Stäubli 8 | Photocredits: Stäubli
Attention to precision and reliability. In every detail.
As a pioneer and global market leader for connectors, Stäubli
Electrical Connectors has amassed over 20 years of experience
in the photovoltaics industry. To date, 200 GW or 50% of the PV
power worldwide has been successfully installed using over 1 billion
original MC4 connectors.
As of January 2017, original MC4 inventor Multi-Contact conducts
its business and services as Stäubli Electrical Connectors.
Your bankable partner
www.staubli.com
Our experience is your advantage
of total generation by 2035 compared to the current 5%.Due to its characteristics, solar will play a central role inthe development of distributed generation. Currently,small utility-scale installations account for roughly 90%of the total cumulative installed capacity, with distributedPV systems slightly above 10% of total installations. Thegovernment’s commitment to developing smart gridtechnologies, including smart meters, energy storagesystems and infrastructure for electric vehicles is anotherreason for the focus on distributed solar.
challenges
korea Electric Power Corporation (kEPCO) still enjoys amonopoly over transmission, distribution and alsoremains the sole purchaser in the power sales business.Given this structure, there are no mechanisms availablefor private companies to purchase renewable energypower directly from independent solar power producers.
Authors: Raffaele Rossi, Michael Schmela, SolarPower Europe
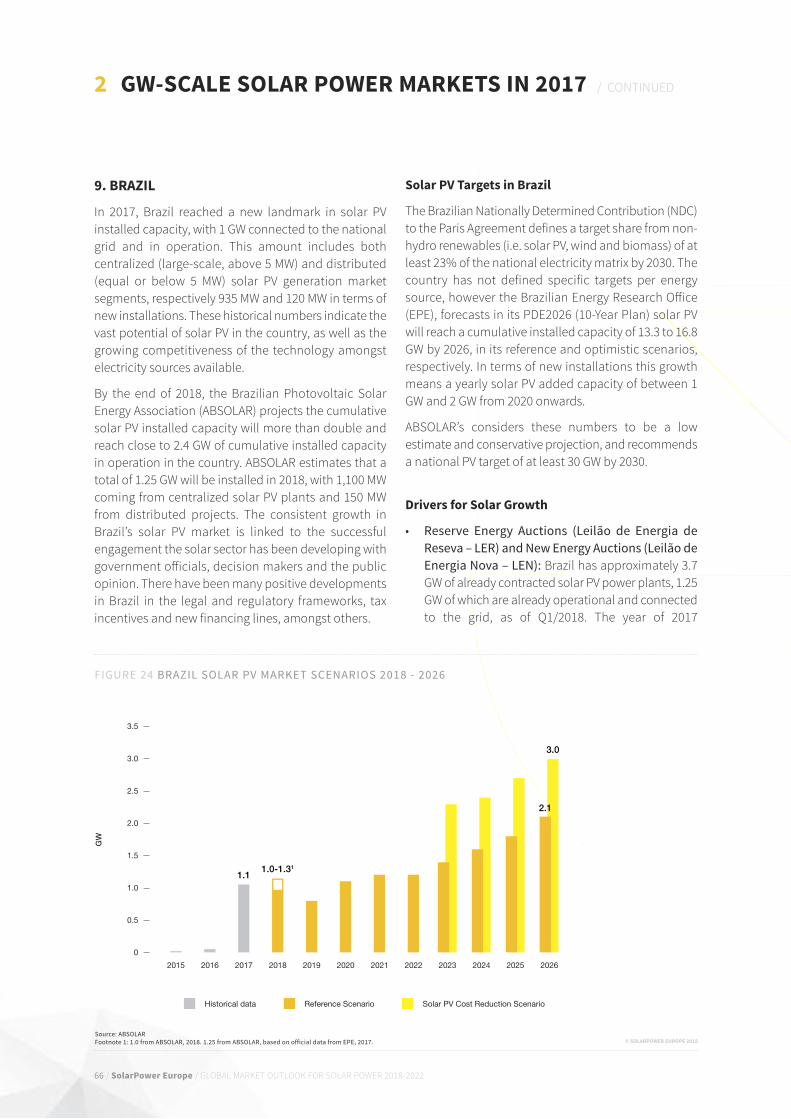
66 / SolarPower Europe / GLOBAL MARkET OUTLOOk fOR SOLAR POWER 2018-2022
2 GW-ScalE SOlaR POWER MaRKETS IN 2017 / CONTINUED
FIGURE 24 BRAzIL SOLAR PV MARKET SCENARIOS 2018 - 2026
© SOlaRPOWER EUROPE 2018Source: ABSOLARFootnote 1: 1.0 from ABSOLAR, 2018. 1.25 from ABSOLAR, based on official data from EPE, 2017.
9. bRazIl
In 2017, Brazil reached a new landmark in solar PVinstalled capacity, with 1 GW connected to the nationalgrid and in operation. This amount includes bothcentralized (large-scale, above 5 MW) and distributed(equal or below 5 MW) solar PV generation marketsegments, respectively 935 MW and 120 MW in terms ofnew installations. These historical numbers indicate thevast potential of solar PV in the country, as well as thegrowing competitiveness of the technology amongstelectricity sources available.
By the end of 2018, the Brazilian Photovoltaic SolarEnergy Association (ABSOLAR) projects the cumulativesolar PV installed capacity will more than double andreach close to 2.4 GW of cumulative installed capacityin operation in the country. ABSOLAR estimates that atotal of 1.25 GW will be installed in 2018, with 1,100 MWcoming from centralized solar PV plants and 150 MWfrom distributed projects. The consistent growth inBrazil’s solar PV market is linked to the successfulengagement the solar sector has been developing withgovernment officials, decision makers and the publicopinion. There have been many positive developmentsin Brazil in the legal and regulatory frameworks, taxincentives and new financing lines, amongst others.
Solar PV Targets in brazil
The Brazilian Nationally Determined Contribution (NDC)to the Paris Agreement defines a target share from non-hydro renewables (i.e. solar PV, wind and biomass) of atleast 23% of the national electricity matrix by 2030. Thecountry has not defined specific targets per energysource, however the Brazilian Energy Research Office(EPE), forecasts in its PDE2026 (10-Year Plan) solar PVwill reach a cumulative installed capacity of 13.3 to 16.8GW by 2026, in its reference and optimistic scenarios,respectively. In terms of new installations this growthmeans a yearly solar PV added capacity of between 1GW and 2 GW from 2020 onwards.
ABSOLAR’s considers these numbers to be a lowestimate and conservative projection, and recommendsa national PV target of at least 30 GW by 2030.
Drivers for Solar Growth
• Reserve Energy Auctions (Leilão de Energia deReseva – LER) and New Energy Auctions (Leilão deEnergia Nova – LEN): Brazil has approximately 3.7GW of already contracted solar PV power plants, 1.25GW of which are already operational and connectedto the grid, as of Q1/2018. The year of 2017
0
0.5
1.0
1.5
2.0
2.5
3.0
3.5
GW
Historical data Reference Scenario Solar PV Cost Reduction Scenario
1.1
2015 2016 2017 2018 2019 2020 2021 2022 2023 2024 2025 2026
1.0-1.31
3.0
2.1
SolarPower Europe / GLOBAL MARkET OUTLOOk fOR SOLAR POWER 2018-2022 / 67
National Solar PV Value chain
The PV value chain in Brazil also shows signs ofstrengthening. There are currently more than 30 locally-established manufacturers in the country (includingnational companies and international subsidiaries),more than 400 companies supplying raw materials,components, equipment and services to manufacturers,as well as more than 2,750 companies directly servingthe end consumers, the majority of which are smallinstallers operating in the distributed generation solarPV market segment. Regarding the local industrialenvironment, Brazil currently hosts manufacturers of PVmodules, inverters, fixed-tilt racking structures, trackers,cables and batteries. Since 2013, with the gradualconstruction and activation of new PV module factories,Brazil has increased its national production capacity toapproximately 1 GW/year as of the end of 2017.
challenges
Despite the positive growth, the cumulative solar PVinstalled capacity currently represents less than 1% ofthe national electricity matrix. In order to become a"solar PV superpower", as its potential would certainlyallow it to be, Brazil has to strengthen its legal andregulatory frameworks, accelerating new investmentsfrom the end consumers, as well as new national andinternational players, in this vast and promisingemerging market. To that end, ABSOLAR has beenworking to bring forward strategic propositions andrecommendations from the solar PV sector to keydecision makers of the federal, state and municipalgovernments, in segments such as centralizedgeneration, distributed generation and local value chain,directly contributing to the establishment of progressiveregulatory, financing and tax programs capable ofbringing the Brazilian solar PV market and sector to thenext level in terms of scale, competitiveness,professionalism and market opportunities.
Authors: Dr. Rodrigo Lopes Sauaia, CEO; M.Sc.Stephanie Betz, Technical and Regulatory Analyst,ABSOLAR
represented an important year for the delivery ofnew projects, as well as execution of investmentsplanned by the sector, as several solar PV powerplants contracted by the federal Governmentthorough electricity auctions during 2014 and 2015reached completion and started operations. TheNew Energy Auction held at the end of 2017 (LEN A-4/2017) was a milestone for the Brazilian PV market,as solar PV projects were contracted for the first timeat an average selling price lower (US$ 44.31/MWh)than that of hydro, biomass and fossil fuel powerplants. This brought solar PV to a new level ofcompetitiveness compared to other electricitysources in Brazil. Solar PV’s competitive pricing wasreinforced in the following auction, held in April2018, when the technology reached a record-lowaverage selling price of US$ 35.25/MWh.
• The Brazilian Net-Metering (Sistema deCompensação de Energia Elétrica – SCEE): allowsnet-metering of renewable electricity produceddirectly by the end consumer (99.3% of which aresolar PV systems up to 5 MW), and has experiencedfast growth of more than 100% per year for the last4 years, driven by an increase of more than 50% inelectricity tariffs in recent years. Brazil’s net-meteringmodel was improved in 2015 with the directengagement of ABSOLAR representing the PV sector,currently allowing not only local electricitygeneration and consumption, but also virtual net-metering and community solar mechanisms. As aresult, this market segment is seeing thedevelopment of several innovative business modelsfor distributed generation PV, such as direct sales,solar communities, cooperatives, leasing, third-partyownership, amongst others.

68 / SolarPower Europe / GLOBAL MARkET OUTLOOk fOR SOLAR POWER 2018-2022
Turnkey large-scale PV SolutionsDeveloped and delivered – worldwide.
Working together with local partners to deliver bankable PV Projects.
www.ibvogt.com
Multi-sourcing financing solutions including DFIs and ECGs
Engineering “Made in Germany” applied to latest high-performance technologies and specific regional requirements
Multi-GWp development pipeline in OECD and Developing Markets
Strong local development network
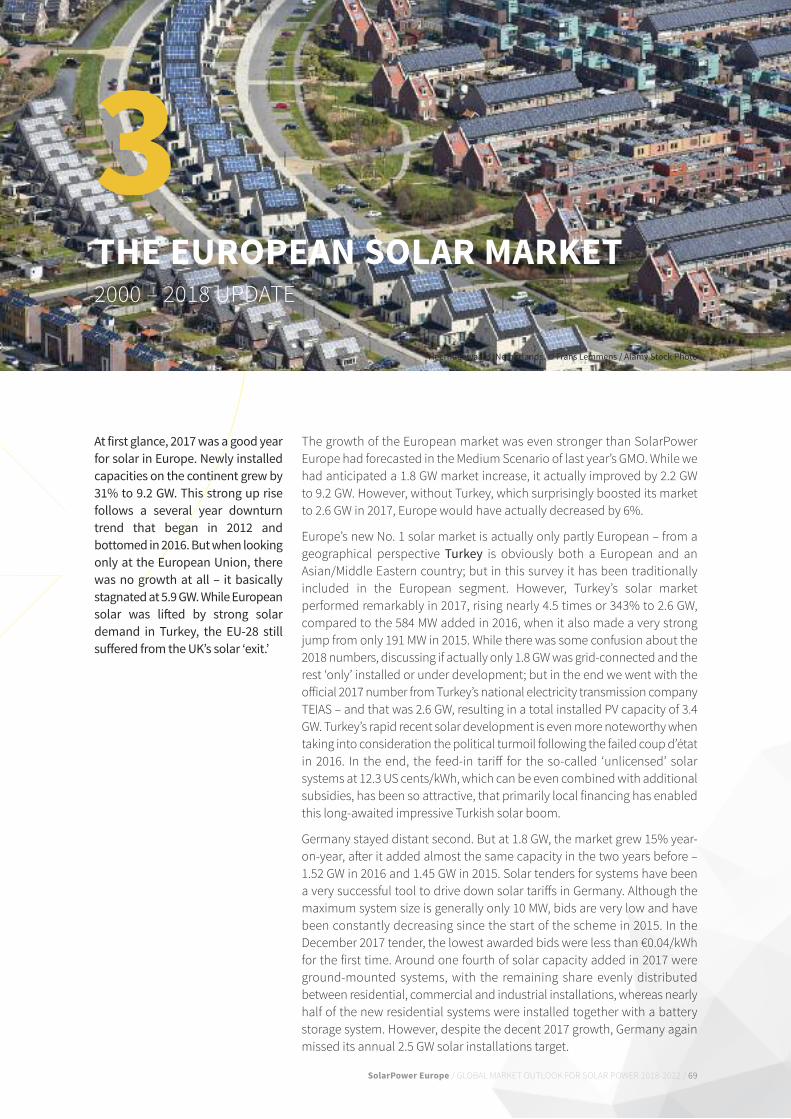
SolarPower Europe / GLOBAL MARkET OUTLOOk fOR SOLAR POWER 2018-2022 / 69
THE EUROPEaN SOlaR MaRKET 2000 – 2018 UPDATE
3Heerhugowaard, Netherlands. © Frans Lemmens / Alamy Stock Photo
At first glance, 2017 was a good yearfor solar in Europe. Newly installedcapacities on the continent grew by31% to 9.2 GW. This strong up risefollows a several year downturntrend that began in 2012 andbottomed in 2016. But when lookingonly at the European Union, therewas no growth at all – it basicallystagnated at 5.9 GW. While Europeansolar was lifted by strong solardemand in Turkey, the EU-28 stillsuffered from the UK’s solar ‘exit.’
The growth of the European market was even stronger than SolarPowerEurope had forecasted in the Medium Scenario of last year’s GMO. While wehad anticipated a 1.8 GW market increase, it actually improved by 2.2 GWto 9.2 GW. However, without Turkey, which surprisingly boosted its marketto 2.6 GW in 2017, Europe would have actually decreased by 6%.
Europe’s new No. 1 solar market is actually only partly European – from ageographical perspective Turkey is obviously both a European and anAsian/Middle Eastern country; but in this survey it has been traditionallyincluded in the European segment. However, Turkey’s solar marketperformed remarkably in 2017, rising nearly 4.5 times or 343% to 2.6 GW,compared to the 584 MW added in 2016, when it also made a very strongjump from only 191 MW in 2015. While there was some confusion about the2018 numbers, discussing if actually only 1.8 GW was grid-connected and therest ‘only’ installed or under development; but in the end we went with theofficial 2017 number from Turkey’s national electricity transmission companyTEIAS – and that was 2.6 GW, resulting in a total installed PV capacity of 3.4GW. Turkey’s rapid recent solar development is even more noteworthy whentaking into consideration the political turmoil following the failed coup d’étatin 2016. In the end, the feed-in tariff for the so-called ‘unlicensed’ solarsystems at 12.3 US cents/kWh, which can be even combined with additionalsubsidies, has been so attractive, that primarily local financing has enabledthis long-awaited impressive Turkish solar boom.
Germany stayed distant second. But at 1.8 GW, the market grew 15% year-on-year, after it added almost the same capacity in the two years before –1.52 GW in 2016 and 1.45 GW in 2015. Solar tenders for systems have beena very successful tool to drive down solar tariffs in Germany. Although themaximum system size is generally only 10 MW, bids are very low and havebeen constantly decreasing since the start of the scheme in 2015. In theDecember 2017 tender, the lowest awarded bids were less than €0.04/kWhfor the first time. Around one fourth of solar capacity added in 2017 wereground-mounted systems, with the remaining share evenly distributedbetween residential, commercial and industrial installations, whereas nearlyhalf of the new residential systems were installed together with a batterystorage system. However, despite the decent 2017 growth, Germany againmissed its annual 2.5 GW solar installations target.
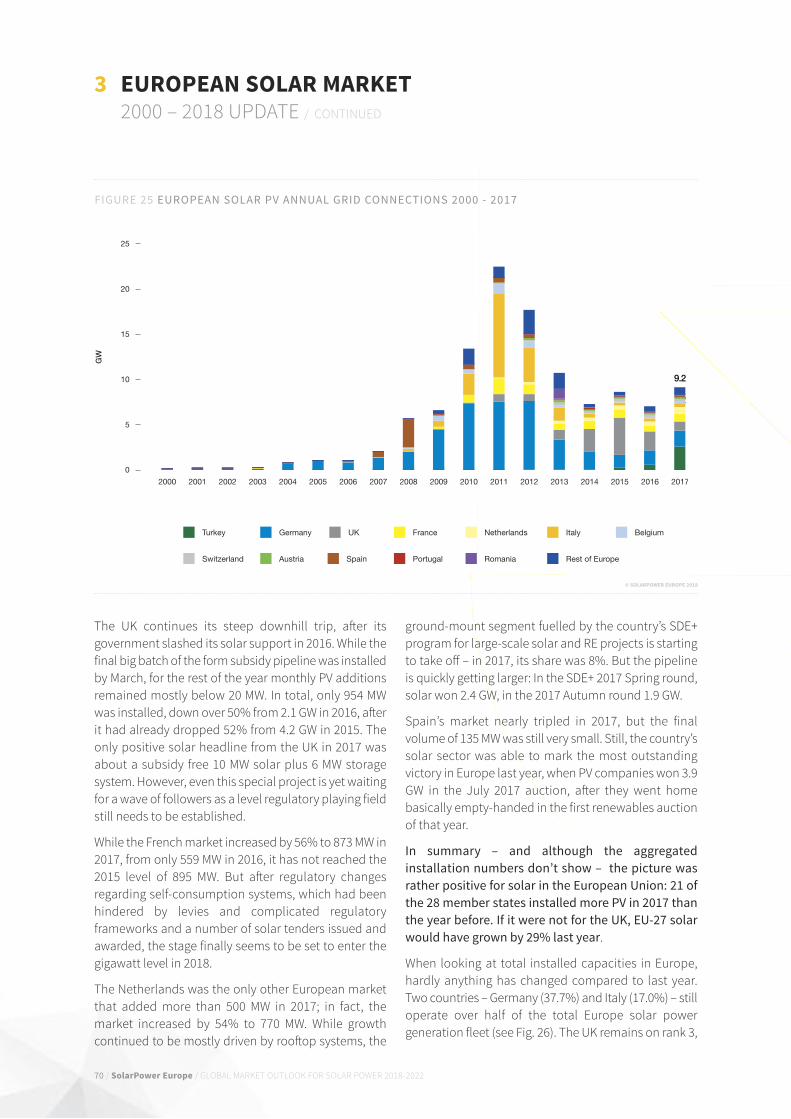
70 / SolarPower Europe / GloBAl MARKET oUTlooK FoR SolAR PoWER 2018-2022
The UK continues its steep downhill trip, after itsgovernment slashed its solar support in 2016. While thefinal big batch of the form subsidy pipeline was installedby March, for the rest of the year monthly PV additionsremained mostly below 20 MW. in total, only 954 MWwas installed, down over 50% from 2.1 GW in 2016, afterit had already dropped 52% from 4.2 GW in 2015. Theonly positive solar headline from the UK in 2017 wasabout a subsidy free 10 MW solar plus 6 MW storagesystem. However, even this special project is yet waitingfor a wave of followers as a level regulatory playing fieldstill needs to be established.
While the French market increased by 56% to 873 MW in2017, from only 559 MW in 2016, it has not reached the2015 level of 895 MW. But after regulatory changesregarding self-consumption systems, which had beenhindered by levies and complicated regulatoryframeworks and a number of solar tenders issued andawarded, the stage finally seems to be set to enter thegigawatt level in 2018.
The netherlands was the only other European marketthat added more than 500 MW in 2017; in fact, themarket increased by 54% to 770 MW. While growthcontinued to be mostly driven by rooftop systems, the
ground-mount segment fuelled by the country’s SDE+program for large-scale solar and RE projects is startingto take off – in 2017, its share was 8%. But the pipelineis quickly getting larger: in the SDE+ 2017 Spring round,solar won 2.4 GW, in the 2017 Autumn round 1.9 GW.
Spain’s market nearly tripled in 2017, but the finalvolume of 135 MW was still very small. Still, the country’ssolar sector was able to mark the most outstandingvictory in Europe last year, when PV companies won 3.9GW in the July 2017 auction, after they went homebasically empty-handed in the first renewables auctionof that year.
In summary – and although the aggregatedinstallation numbers don’t show – the picture wasrather positive for solar in the European Union: 21 ofthe 28 member states installed more PV in 2017 thanthe year before. If it were not for the UK, EU-27 solarwould have grown by 29% last year.
When looking at total installed capacities in Europe,hardly anything has changed compared to last year.Two countries – Germany (37.7%) and italy (17.0%) – stilloperate over half of the total Europe solar powergeneration fleet (see Fig. 26). The UK remains on rank 3,
3 EUROPEAN SOLAR MARKET 2000 – 2018 UPDATE / conTinUED
FIGURE 25 EUROPEAN SOLAR PV ANNUAL GRID CONNECTIONS 2000 - 2017
© SOLARPOWER EUROPE 2018
0
5
10
15
20
25
GW
20042003200220012000 2005 2006 2007 2008 2009 2010 2011 2012 2013 2014 2015 2016 2017
UKGermanyTurkey France Netherlands Italy Belgium
Switzerland Austria Portugal RomaniaSpain Rest of Europe
9.2
9.2

SolarPower Europe / GLOBAL MARkET OUTLOOk fOR SOLAR POWER 2018-2022 / 71
though quite some distance away from the leading duo(11.1%), while france keeps the fourth spot (7.0%).Spain stays on position five (4.9%) although it addedless than 750 MW in the last 6 years. No wonder thatTurkey’s stellar 2017 performance was enough to get the
country rank 6 (3.0%) The big solar picture of Europe for2017 hasn’t changed: the European solar power sectorcontinues its transition phase, but is getting ready forthe next growth phase.
Do ub l e � - � s i d e d � p owe r � g e n e r a t i o n
E ag l e � P E RC � B i f a c i a l � � �3 8 5W ��
www.jinkosolar.eu�
FIGURE 26 EUROPEAN TOTAL SOLAR PV GRID-CONNECTED CAPACITY 2000 - 2017
© SOlaRPOWER EUROPE 2018
0
20
40
60
80
100
120
GW
20042003200220012000 2005 2006 2007 2008 2009 2010 2011 2012 2013 2014 2015 2016 2017
UKGermanyTurkey France Netherlands Italy Belgium
Switzerland Austria Portugal RomaniaSpain Rest of Europe
114.0
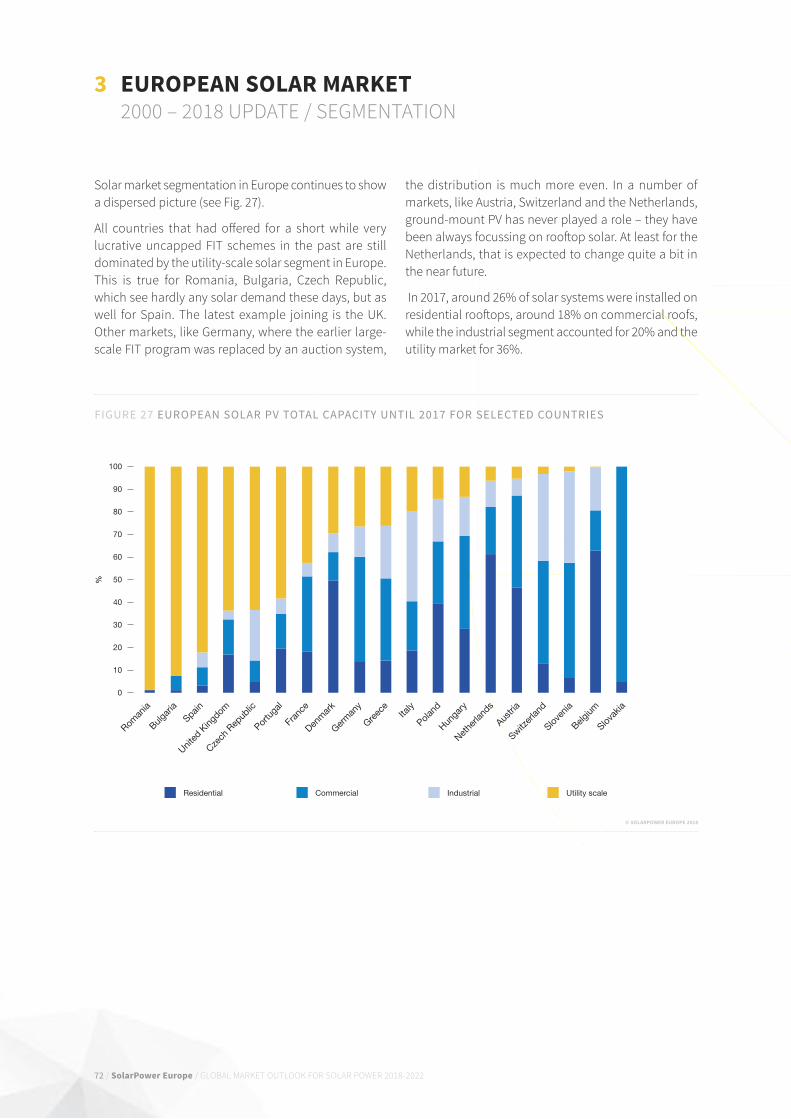
72 / SolarPower Europe / GLOBAL MARkET OUTLOOk fOR SOLAR POWER 2018-2022
FIGURE 27 EUROPEAN SOLAR PV TOTAL CAPACITY UNTIL 2017 FOR SELECTED COUNTRIES
© SOlaRPOWER EUROPE 2018
3 EUROPEaN SOlaR MaRKET 2000 – 2018 UPDATE / SEGMENTATION
Solar market segmentation in Europe continues to showa dispersed picture (see fig. 27).
All countries that had offered for a short while verylucrative uncapped fIT schemes in the past are stilldominated by the utility-scale solar segment in Europe.This is true for Romania, Bulgaria, Czech Republic,which see hardly any solar demand these days, but aswell for Spain. The latest example joining is the Uk.Other markets, like Germany, where the earlier large-scale fIT program was replaced by an auction system,
the distribution is much more even. In a number ofmarkets, like Austria, Switzerland and the Netherlands,ground-mount PV has never played a role – they havebeen always focussing on rooftop solar. At least for theNetherlands, that is expected to change quite a bit inthe near future.
In 2017, around 26% of solar systems were installed onresidential rooftops, around 18% on commercial roofs,while the industrial segment accounted for 20% and theutility market for 36%.
%
0
10
20
30
40
50
60
70
80
90
100
Roman
ia
Bulgar
iaSpain
United
King
dom
Czech
Rep
ublic
Portu
gal
Fran
ce
Hunga
ry
Denm
ark
Greec
e
Germ
any
Italy
Poland
Austri
a
Nethe
rland
s
Sloven
ia
Switzer
land
Belgium
Slovak
ia
Residential Commercial Industrial Utility scale
SolarPower Europe / GLOBAL MARkET OUTLOOk fOR SOLAR POWER 2018-2022 / 73
3 EUROPEaN SOlaR MaRKET PROSPECTS 2018- 2022
The writings on the wall are clear: as of 2018, PV willgrow very strong both in Europe and EU-28 for the nextfew years. There are several reasons for this next solargrowth phase:
• EU 2020 targets: A number of EU governments,which still have some way to go to meet theirindividual RES targets, have been strengthening theirsupport for solar as they have realized that thetechnology is very popular and one of the lowest-cost means to increase their renewables share andreduce CO2 emissions. Germany’s new government,for example, has announced to issue additional‘special’ tenders for both solar and wind (2 x 2 GWeach) in 2019/20.
• Tenders: Solar tender tools have shown to the publicthe low cost of solar power and have been embracedby several European countries, substitutingtraditional uncapped feed-in tariff schemes.Moreover, solar has proven that it can wintechnology-neutral tenders even against on-shorewind power when the boundary conditions areproperly set. While solar was awarded nearly 3/4 ofthe tender volume in the second Spanish renewablestender in 2017, a pilot solar/wind tender in Germanywas won 100% by solar bidders in 2018.
• Self-consumption: Solar is much cheaper than retailelectricity in most European markets and will quicklycontinue to reduce in cost, which will be a key driverfor people and companies to invest in on-site powergeneration. Moreover, in developed European PV
markets consumers are more and more starting tounderstand that solar often makes economic senseeven without high feed-in tariffs or other subsidyprogrammes. The quickly falling cost of batteryenergy storage combined with the benefits of digitaland smart energy products supports the sales casefor solar, as many consumers prefer to have bettercontrol over their energy bill.
• Emerging & Reawakening Markets: The low cost ofsolar is attracting European countries that haven’t beenvery active in the field in the past, like Belarus andRussia. European solar pioneers are turning to low-costsolar again, such as Spain.
• Corporate sourcing: In a number of Europeanmarkets, we are now starting to see direct bilateralPPAs with solar increasingly competing withwholesale power markets. This development will beseen primarily in those European countries with thewidest spreads between solar and wholesale powerprices. While there has been talk about pure PPAbased projects for a while in Spain, in 2018 the firstare being built. However, the pipeline for theseprojects has quickly ballooned to over 30 GW.
• Regulation: The European Commission and nationalgovernments have been addressing the needs for aflexible renewable energy system, working on a newelectricity market design framework andimplementing new tools and regulations toovercome barriers that have inhibited solar’s growthpossibilities in recent years.
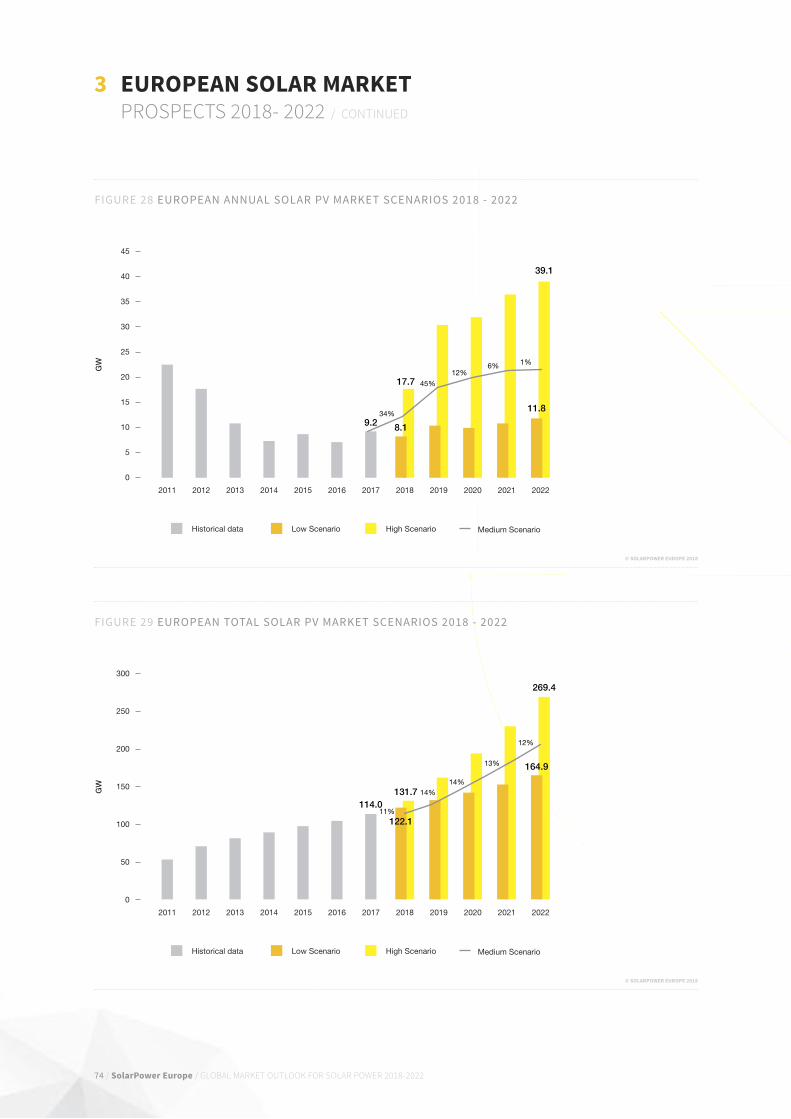
74 / SolarPower Europe / GLOBAL MARkET OUTLOOk fOR SOLAR POWER 2018-2022
3 EUROPEaN SOlaR MaRKET PROSPECTS 2018- 2022 / CONTINUED
© SOlaRPOWER EUROPE 2018
FIGURE 29 EUROPEAN TOTAL SOLAR PV MARKET SCENARIOS 2018 - 2022
0
50
100
150
200
250
300
GW
Historical data Low Scenario High Scenario Medium Scenario
114.0
2011 2012 2013 2014 2015 2016 2017 2018 2019 2020 2021 2022
131.7
269.4
164.9
122.111%
14%14%
13%
12%
© SOlaRPOWER EUROPE 2018
FIGURE 28 EUROPEAN ANNUAL SOLAR PV MARKET SCENARIOS 2018 - 2022
0
5
10
15
20
25
30
35
40
45
GW
Historical data Low Scenario High Scenario Medium Scenario
9.2
2011 2012 2013 2014 2015 2016 2017 2018 2019 2020 2021 2022
17.7
39.1
11.8
8.134%
45%
12%6% 1%
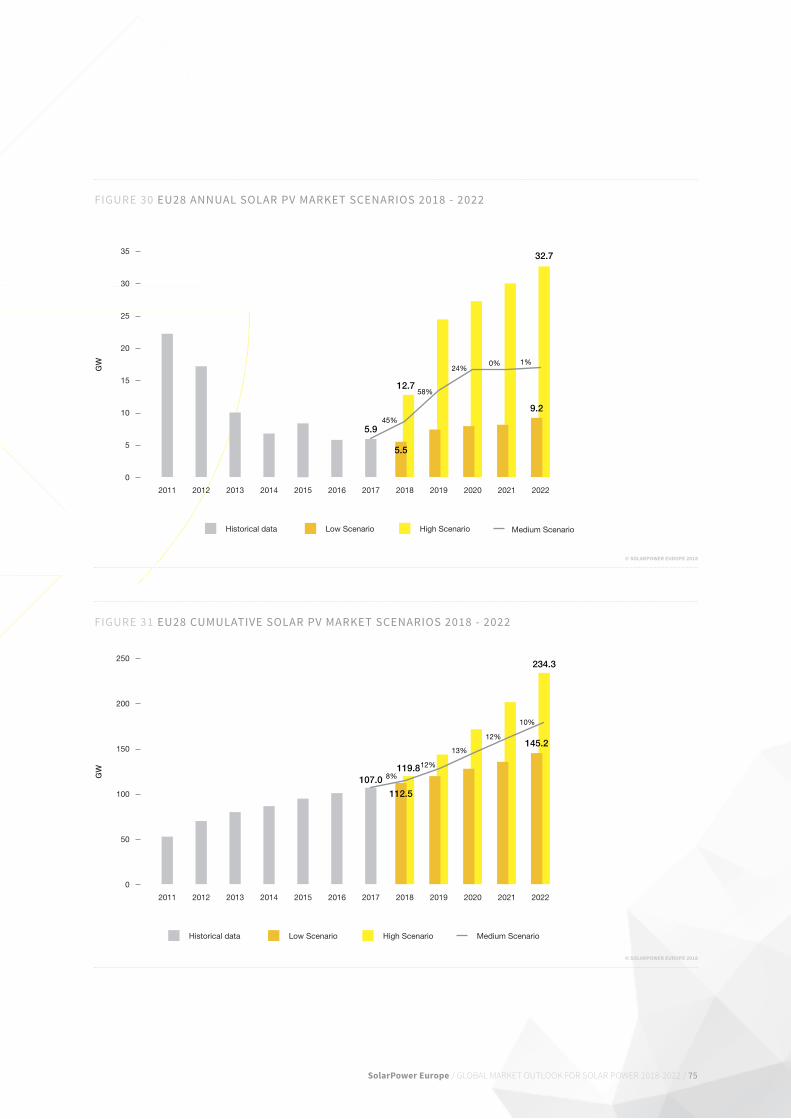
SolarPower Europe / GLOBAL MARkET OUTLOOk fOR SOLAR POWER 2018-2022 / 75
© SOlaRPOWER EUROPE 2018
FIGURE 30 EU28 ANNUAL SOLAR PV MARKET SCENARIOS 2018 - 2022
0
5
10
15
20
25
30
35
GW
Historical data Low Scenario High Scenario Medium Scenario
5.9
2011 2012 2013 2014 2015 2016 2017 2018 2019 2020 2021 2022
12.7
32.7
9.2
5.5
45%
58%
24%0% 1%
© SOlaRPOWER EUROPE 2018
FIGURE 31 EU28 CUMULATIVE SOLAR PV MARKET SCENARIOS 2018 - 2022
0
50
100
150
200
250
GW
Historical data Low Scenario High Scenario Medium Scenario
20222011 2012 2013 2014 2015 2016 2017 2018 2019 2020 2021
119.8
234.3
145.2
107.0112.5
8%
12%
13%
12%
10%
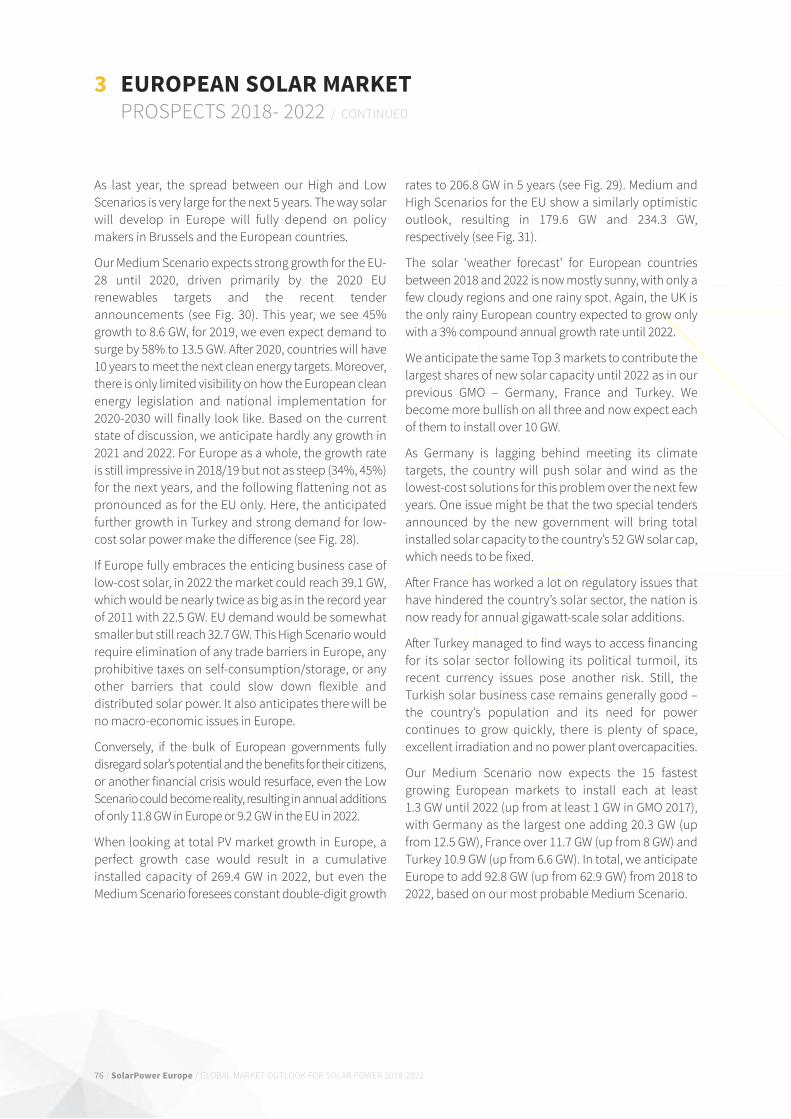
76 / SolarPower Europe / GlObal MarkEt OutlOOk FOr SOlar POWEr 2018-2022
3 EUROPEAN SOLAR MARKET PrOSPECtS 2018- 2022 / COntInuEd
as last year, the spread between our High and lowScenarios is very large for the next 5 years. the way solarwill develop in Europe will fully depend on policymakers in brussels and the European countries.
Our Medium Scenario expects strong growth for the Eu-28 until 2020, driven primarily by the 2020 Eurenewables targets and the recent tenderannouncements (see Fig. 30). this year, we see 45%growth to 8.6 GW, for 2019, we even expect demand tosurge by 58% to 13.5 GW. after 2020, countries will have10 years to meet the next clean energy targets. Moreover,there is only limited visibility on how the European cleanenergy legislation and national implementation for2020-2030 will finally look like. based on the currentstate of discussion, we anticipate hardly any growth in2021 and 2022. For Europe as a whole, the growth rateis still impressive in 2018/19 but not as steep (34%, 45%)for the next years, and the following flattening not aspronounced as for the Eu only. Here, the anticipatedfurther growth in turkey and strong demand for low-cost solar power make the difference (see Fig. 28).
If Europe fully embraces the enticing business case oflow-cost solar, in 2022 the market could reach 39.1 GW,which would be nearly twice as big as in the record yearof 2011 with 22.5 GW. Eu demand would be somewhatsmaller but still reach 32.7 GW. this High Scenario wouldrequire elimination of any trade barriers in Europe, anyprohibitive taxes on self-consumption/storage, or anyother barriers that could slow down flexible anddistributed solar power. It also anticipates there will beno macro-economic issues in Europe.
Conversely, if the bulk of European governments fullydisregard solar’s potential and the benefits for their citizens,or another financial crisis would resurface, even the lowScenario could become reality, resulting in annual additionsof only 11.8 GW in Europe or 9.2 GW in the Eu in 2022.
When looking at total PV market growth in Europe, aperfect growth case would result in a cumulativeinstalled capacity of 269.4 GW in 2022, but even theMedium Scenario foresees constant double-digit growth
rates to 206.8 GW in 5 years (see Fig. 29). Medium andHigh Scenarios for the Eu show a similarly optimisticoutlook, resulting in 179.6 GW and 234.3 GW,respectively (see Fig. 31).
the solar ‘weather forecast’ for European countriesbetween 2018 and 2022 is now mostly sunny, with only afew cloudy regions and one rainy spot. again, the uk isthe only rainy European country expected to grow onlywith a 3% compound annual growth rate until 2022.
We anticipate the same top 3 markets to contribute thelargest shares of new solar capacity until 2022 as in ourprevious GMO – Germany, France and turkey. Webecome more bullish on all three and now expect eachof them to install over 10 GW.
as Germany is lagging behind meeting its climatetargets, the country will push solar and wind as thelowest-cost solutions for this problem over the next fewyears. One issue might be that the two special tendersannounced by the new government will bring totalinstalled solar capacity to the country’s 52 GW solar cap,which needs to be fixed.
after France has worked a lot on regulatory issues thathave hindered the country’s solar sector, the nation isnow ready for annual gigawatt-scale solar additions.
after turkey managed to find ways to access financingfor its solar sector following its political turmoil, itsrecent currency issues pose another risk. Still, theturkish solar business case remains generally good –the country’s population and its need for powercontinues to grow quickly, there is plenty of space,excellent irradiation and no power plant overcapacities.
Our Medium Scenario now expects the 15 fastestgrowing European markets to install each at least 1.3 GW until 2022 (up from at least 1 GW in GMO 2017),with Germany as the largest one adding 20.3 GW (upfrom 12.5 GW), France over 11.7 GW (up from 8 GW) andturkey 10.9 GW (up from 6.6 GW). In total, we anticipateEurope to add 92.8 GW (up from 62.9 GW) from 2018 to2022, based on our most probable Medium Scenario.

SolarPower Europe / GLOBAL MARkET OUTLOOk fOR SOLAR POWER 2018-2022 / 77
In 2022, Germany is expected to be Europe’s largestsolar market again, ahead of france and Turkey, whichis the same order as in our GMO 2017, according to theMedium Scenario (see fig. 33).
FIGURE 33 CAPACITY ADDITIONS AND SHARES OF TOP 10 EUROPEAN SOLAR PV MARKETS IN 2017 AND 2022
Germany 19%; 1,760 MW
France15%; 3,240 MW
Turkey10%; 2,250 MW
Netherlands9%; 1,912 MW
Turkey28%; 2,588 MW
Germany19%; 3,992 MWUkraine 2%; 211 MW
United Kingdom 3%; 587 MW
France 10%; 873 MW
Spain 7%; 1,849 MW
Netherlands 8%; 770 MW
Switzerland 3%; 260 MW
Belgium 3%; 285 MW Greece 3%; 543 MW
Rest of Europe 10%; 876 MW
Rest of Europe 18%; 3,954 MW
United Kingdom 10%; 954 MW
Ukraine 4%; 751 MW
Italy 4%; 409 MW
Italy 9%; 1,824 MW
Austria 2%; 170 MW
Poland 3%; 551 MW
2017 2022
9.2 GW 21.5 GW
© SOlaRPOWER EUROPE 2018
FIGURE 32 TOP EUROPEAN SOLAR PV MARKETS’ PROSPECTS
2022Total Capacity Medium Scenario by 2022 (MW)
63,237
19,702
14,320
14,460
11,430
26,924
4,435
2,361
14,742
3,957
1,988
2,922
5,325
4,210
1,601
14,172
2017Total Capacity
(MW)
42,973
7,999
3,420
5,627
2,681
19,392
1,152
261
12,676
1,955
158
1,263
3,708
2,623
317
7,651
2018 - 2022Compound Annual Growth Rate (%)
8%
20%
33%
21%
34%
7%
31%
55%
3%
15%
66%
18%
8%
10%
38%
13%
2018 - 2022New Capacity
(MW)
20,264
11,703
10,900
8,833
8,750
7,533
3,283
2,099
2,065
2,003
1,830
1,659
1,617
1,587
1,284
6,521
Political supportprospects
Germany
France
Turkey
Spain
Netherlands
Italy
Ukraine
Poland
United Kingdom
Switzerland
Russia
Austria
Belgium
Greece
Sweden
Rest of Europe

78 / SolarPower Europe / GLOBAL MARkET OUTLOOk fOR SOLAR POWER 2018-2022
GlObal MaRKET OUTlOOK FOR SOlaR POWER
4© First Solar130 MW, California, USA.
Solar developments havepositively surprised everyoneagain last year – and they willcontinue to do so in the future.While no one believed the marketwould grow in 2017 after the stellar50% growth rate the year before,we have again seen marketdemand surge by over 30%. For2018 some experts in the sectorare concerned about China’srecent announcement to cut solarsubsidies, with some analystspredicting a market contraction.SolarPower Europe estimates inour most realistic Market Scenariothat the global solar market willgrow in 2018 and the years tocome. In fact, we are significantlymore optimistic than in our GMO2017 (see Fig. 34).
While the world can be thankful to China that they have financed the growthof the global solar sector in the last few years, it is high time for the globalmarket leader to reform its solar sector and transition from overpriceduncapped feed-in tariffs to more sustainable incentive schemes. There is nodoubt China will stay committed to solar – it is one of the few countries thathas a clear vison about the technology’s potential and considers solar a keytool to fight air pollution and climate change. Solar is a major pillar ofChina’s future energy system as it quickly pushes for electrification of itstransport sector. While we expect the Chinese solar market to decrease thisand the next year, it will grow strongly again as of 2020, once the Chineseadministration has restructured its solar market. On a positive note – wewill now see more diversification of solar demand. While in 2016, only sevencountries installed over 1 GW, in 2017, the number increased to nine, andthis should be 14 in 2018.
While there is so much to be positive about in relation to solar, SolarPowerEurope continues to see four major topics that need to be addressed toenable an even faster and more sustainable growth for solar:
It is key for regions and countries to establish reliable governanceframeworks to navigate their economies towards clean energy withambitious and binding renewables targets. This provides investor securityand transparency on ambition. Subsidies for inflexible power technologiesmust be eliminated and phase out plans set up to manage communitiestransitioning from the most polluting forms of energy.

SolarPower Europe / GLOBAL MARkET OUTLOOk fOR SOLAR POWER 2018-2022 / 79
It is of utmost importance to have an electricity marketdesign that enables profitable investments and theoperation of flexible renewable energy sources, takinginto account rules for storage, demand response andaggregation to provide new services. A cross sectoraldecarbonisation and electrification approach,increasingly based on renewable energy, is required forthe power, heating and transport sectors.
We need modern energy frameworks that allow newbusiness models for solar and storage to be created andwhich put active consumers at the heart of the energytransition. Allowing self-consumption without the
burden of prohibitive taxes or other barriers is vital andsomething the EU has just provided for the decade post2020. While tenders are good mechanisms for efficientplanning and deployment of utility-scale solar plants,their design is crucial to guarantee long-lasting, high-quality power generation – and technology specifictenders are key here.
finally, we need to overcome trade barriers for solar.Import tariffs as we see them in Europe, the US andother countries are detrimental to the deployment ofsolar today and simply add unnecessary cost withoutbenefitting society.
© SOlaRPOWER EUROPE 2018
FIGURE 34 COMPARISON MEDIUM SCENARIO GMO 2017 VS 2018
0
20
40
60
80
100
120
140
160
180
GW
GMO 2017 GMO 2018
80.5 84.191.8 97.6
111.5
99.1 102.6 107.5
125.3
140.41
157.80
2017 2018 2019 2020 2021 2022

More info at: resource-event.eu
Connecting renewableenergy buyers and sellers
JOIN US AT THE OKURA HOTEL IN AMSTERDAM, 20-21 NOVEMBER
TOPICS INCLUDE:
Corporate sourcing strategiesand business models
Markets and regulation
Demand growth and diversification:How to turn 50 corporates into 50,000?
Innovation
Standardisation
Additionality
Cities and local authorities
Organised by: In collaboration with:

9 789082 714319
SolarPower Europerue d’arlon 69-71, 1040 brussels, belgiumt +32 2 709 55 20 / F +32 2 725 32 [email protected] / www.solarpowereurope.org
ISBN NUMBER 9789082714319