global m&a market review - data.bloomberglp.com · global m&a heat map deal volume and...
TRANSCRIPT

GLOBALM&A MARKET REVIEWFINANCIAL RANKINGS
1H 2017
CONTENTS
1. Introduction2. Global M&A Heat Map3. Global M&A Regional Review4. Global M&A League Tables5. Americas M&A Regional Review6. Americas M&A League Tables8. EMEA M&A Regional Review9. EMEA M&A League Tables12. APAC M&A Regional Review13. APAC M&A League Tables16. Disclaimer
DATA SUBMISSIONS AND QUERIES
Contact Phone Email
North America Meaghan Burke +1-646-324-1537 [email protected]
EMEA Madeeha Ahmad +44-20-3525-3754 [email protected]
Asia Pacific Ee Wen Tay +65-6231-3404 [email protected]
General M&A queries may be submitted to: [email protected], [email protected], [email protected]
The Bloomberg M&A Advisory League Tables are the definitive publication of M&A advisory rankings. The tables represent the top financial and legal advisors across a broad array of deal types, regions, and industry sectors. The rankings data is comprised of mergers, acquisitions, divestitures, spin-offs, debt-for-equity-swaps, joint ventures, private placements of common equity and convertible securities, and the cash injection component of recapitalization according to Bloomberg standards.
Bloomberg M&A delivers real-time coverage of the M&A market from nine countries around the world. We provide a global perspective and local insight into unique deal structures in various markets through a network of over 800 financial and legal advisory firms, ensuring an accurate reflection of key market trends. Our quarterly league table rankings are a leading benchmark for legal and financial advisory performance, and our Bloomberg Brief newsletter provides summary highlights of weekly M&A activity and top deal trends.
Visit {NI LEAG CRL <GO>} to download copies of the final release and a full range of market specific league table results. On the web, visit: http://www.bloomberg.com/professional/solutions/investment-banking/.
Due to the dynamic nature of the Professional Service product, league table rankings may vary between this release and data found on the Bloomberg Professional Service.
1H 2017
GLOBAL M&A FINANCIAL ADVISORY RANKINGS
©2017 Bloomberg Finance L.P. All rights r eserved.

Global M&A Heat Map
Deal volume and adviser market share for any regional involvement (target, seller, or acquirer) for 1H 2017.
North AmericaUSD 878.1B1. Goldman Sachs & Co 25.7%2. Morgan Stanley 21.0%3. Citigroup Inc 19.5%
Latin AmericaUSD 69.7B1. Morgan Stanley 26.6%2. Citigroup Inc 23.8%3. UBS AG 22.5%
Western Europe USD 546.25B1. Goldman Sachs & Co 27.3%2. Citigroup Inc 27.1%3. Bank of America Merri l l Lynch 22.5%
Eastern Europe USD 20.7B1. Morgan Stanley 15.2%2. Rothschi ld & Co 11.4%3. VTB Capita l JSE 9.2%
Asia PacificUSD 526.0B1. Morgan Stanley 11.1%2. Goldman Sachs & Co 11.1%3. UBS AG 9.8%
Middle East & AfricaUSD 44.7B1. UBS AG 18.5%2. Macquarie Group Ltd 12.6%3. Deutsche Bank AG 12.6%
2
Date
Total Value
(Mln.)
Amount
(Bln.) % of Total
% YoY
Change
Number of deals 20,027 Financial $409.0 26.2% 21.4%
Volume (Bln.) $1,536.4 Consumer Non-cyclical $340.4 21.8% 19.3%
Avg Deal Size (Mln.) $76.7 Consumer Cyclical $185.5 11.9% -2.3%
Energy $172.6 11.1% 57.6%
Industrial $140.4 9.0% -5.4%
Goldman Sachs & Co Communications $113.1 7.2% -18.3%
Number of deals 151 Technology $80.8 5.2% -39.4%
Volume (Bln.) $318.0 Utilities $65.3 4.2% -14.8%
Avg Deal Size (Bln.) $2.1 Basic Materials $45.5 2.9% -75.0%
Diversified $8.9 0.6% -58.6%
Amount
(Bln.)
% Change
Deal Count
% Change
Volume
Company Takeover $863.0 -6.4% -9.3%
Cross Border $665.5 -0.7% -3.1%
Private Equity $406.4 3.2% 16.1%
Asset Sale $304.6 7.4% 21.0%
Tender Offer $197.8 17.0% 39.7%
Venture Capital $61.3 3.3% -16.3%
Spin-off $7.5 -5.2% -89.1%
Minority Purchase $198.0 4.0% 4.3%
Majority Purchase $121.2 17.9% 13.4%
Quarterly Volume represents any involvement (target, seller, or acquirer).
Global M&A: Industry Breakdown
Glo
bal
M&
A R
evie
w |
1H
20
17
Global M&A Regional Review Global M&A: Premium Breakdown
Global M&A: Highlights of 1H 2017
Summary IndustryAcquirerTarget Seller
Abertis Infraestructuras SA Atlantia SpA -
Global M&A: Quarterly Volume
2/1/2017
Top Adviser
$17,377.7ONEOK Partners LP ONEOK Inc -
-Mead Johnson Nutrition Co
4/23/2017 $24,195.8
2/10/2017 $17,809.8
CR Bard Inc Becton Dickinson and Co
5/15/2017 $34,388.4
1/26/2017 $29,762.2Actelion Ltd Johnson & Johnson -
Deal Type
Global M&A: Deal Type Breakdown
Reckitt Benckiser Group PLC
-
0
2,000
4,000
6,000
8,000
10,000
12,000
$0
$200
$400
$600
$800
$1,000
$1,200
$1,400
2012 Q2 2013 Q2 2014 Q2 2015 Q2 2016 Q2 2017 Q2
Volume $(Bln.) Deal Count
22%
42%
33%
1%2%
0%0-10%
10-25%
25-50%
50-75%
75-100%
100%+
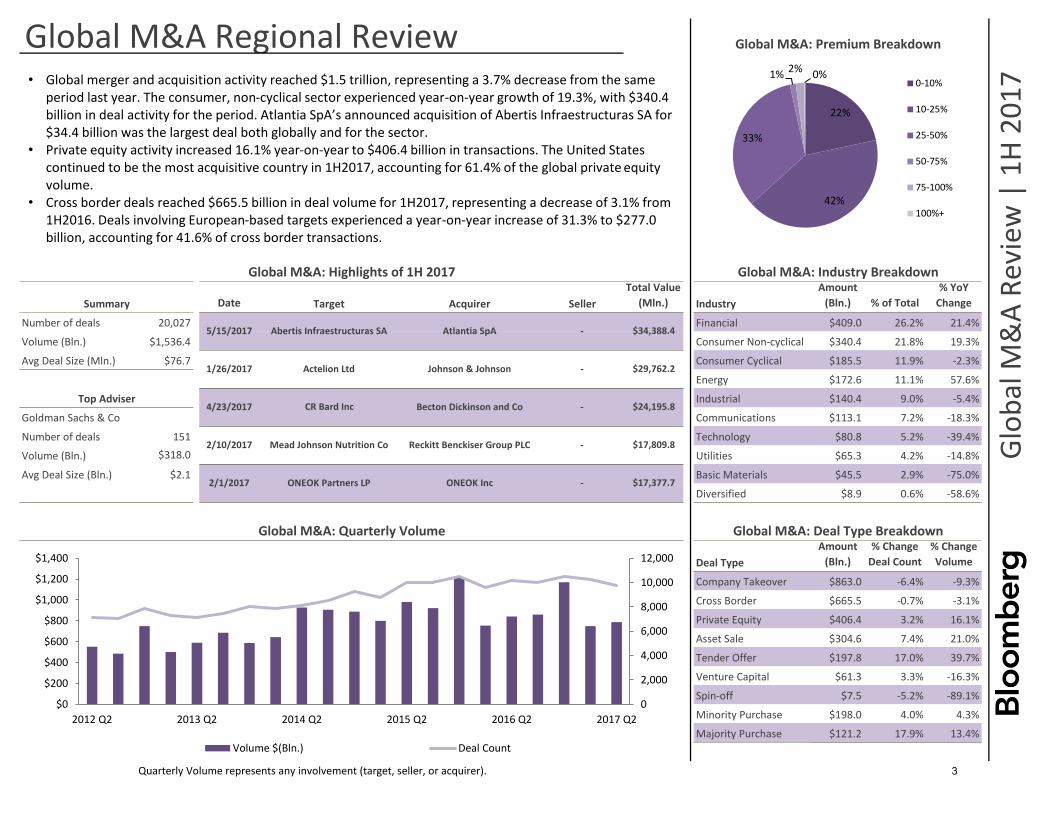
• Global merger and acquisition activity reached $1.5 trillion, representing a 3.7% decrease from the same period last year. The consumer, non-cyclical sector experienced year-on-year growth of 19.3%, with $340.4 billion in deal activity for the period. Atlantia SpA’s announced acquisition of Abertis Infraestructuras SA for $34.4 billion was the largest deal both globally and for the sector.
• Private equity activity increased 16.1% year-on-year to $406.4 billion in transactions. The United States continued to be the most acquisitive country in 1H2017, accounting for 61.4% of the global private equityvolume.
• Cross border deals reached $665.5 billion in deal volume for 1H2017, representing a decrease of 3.1% from 1H2016. Deals involving European-based targets experienced a year-on-year increase of 31.3% to $277.0 billion, accounting for 41.6% of cross border transactions.
3
Global Announced Deals 01/01/2017 - 06/30/2017 Cross Border Announced Deals 01/01/2017 - 06/30/2017
Goldman Sachs & Co LLC 1 20.7 318,030 151 1 25.8 -5.1 Goldman Sachs & Co LLC 1 26.7 177,658 86 2 27.3 -0.6
Citigroup Inc 2 17.1 262,427 114 7 11.6 5.5 Citigroup Inc 2 23.1 153,440 63 8 12.5 10.6
Morgan Stanley 3 15.3 235,657 146 2 23.8 -8.5 Bank of America Merrill Lynch 3 19.3 128,497 47 5 17.4 1.9
Bank of America Merrill Lynch 4 13.7 210,342 88 3 16.3 -2.6 Morgan Stanley 4 18.3 121,939 74 1 34.3 -16.0
JPMorgan Chase & Co 5 12.2 188,048 135 4 14.9 -2.7 JPMorgan Chase & Co 5 16.0 106,595 66 4 17.6 -1.6
Credit Suisse Group AG 6 10.6 162,567 89 5 14.7 -4.1 Credit Suisse Group AG 6 15.2 101,126 45 3 25.2 -10.0
Rothschild & Co 7 8.2 126,334 149 10 8.3 -0.1 Deutsche Bank AG 7 12.7 84,701 32 10 10.7 2.1
Barclays PLC 8 7.7 118,329 77 6 12.2 -4.5 Lazard Ltd 8 11.8 78,538 71 7 15.1 -3.3
Lazard Ltd 9 7.5 115,876 119 8 9.6 -2.0 Rothschild & Co 9 10.3 68,493 95 6 16.6 -6.3
Deutsche Bank AG 10 7.0 107,917 54 9 8.8 -1.7 UBS AG 10 8.3 55,223 41 9 11.0 -2.7
UBS AG 11 6.7 102,654 76 12 7.1 -0.4 Mediobanca SpA 11 7.9 52,447 4 305 - 7.9
Evercore Partners Inc 12 4.8 73,053 72 11 7.6 -2.9 BNP Paribas SA 12 6.6 43,836 32 31 1.6 5.0
Moelis & Co 13 3.8 57,807 40 32 1.2 2.6 Barclays PLC 13 5.3 35,394 29 11 10.5 -5.1
RBC Capital Markets 14 3.7 57,251 64 15 4.4 -0.7 ALANTRA 14 5.0 33,503 16 52 0.6 4.5
BNP Paribas SA 15 3.7 57,054 50 36 1.1 2.7 RBC Capital Markets 15 4.8 31,904 24 24 1.9 2.9
Mediobanca SpA 16 3.4 52,447 4 57 0.6 2.9 TD Securities Inc 16 4.7 31,406 14 75 0.2 4.5
HSBC Bank PLC 17 2.9 44,421 25 14 5.0 -2.1 Robey Warshaw LLP 17 4.7 31,082 3 - - 4.7
Perella Weinberg Partners LP 18 2.8 42,420 13 59 0.5 2.3 HSBC Bank PLC 18 4.3 28,766 19 14 9.1 -4.8
Centerview Partners LLC 19 2.5 38,422 26 17 3.5 -1.0 Evercore Partners Inc 19 3.0 20,202 32 17 6.3 -3.3
TD Securities Inc 20 2.2 34,473 23 56 0.6 1.7 PJT Partners Inc 20 2.9 19,089 7 95 0.1 2.8
TOTAL 1,536,621 20,031 TOTAL 665,471 7,270
Global Private Equity Announced Deals 01/01/2017 - 06/30/2017
Morgan Stanley 1 23.1 94,540 59 9 10.3 12.8
Goldman Sachs & Co LLC 2 19.9 81,516 65 1 24.3 -4.4
Bank of America Merrill Lynch 3 16.0 65,495 30 6 11.9 4.1
Credit Suisse Group AG 4 14.7 60,270 40 4 14.3 0.4
Citigroup Inc 5 13.6 55,845 42 3 14.3 -0.7
JPMorgan Chase & Co 6 12.3 50,382 51 2 14.8 -2.5
UBS AG 7 11.6 47,435 31 11 7.7 3.9
Barclays PLC 8 10.0 41,024 34 5 12.5 -2.5
Deutsche Bank AG 9 6.6 26,981 21 8 10.4 -3.8
Wells Fargo & Co 10 6.0 24,356 15 17 2.5 3.5
Moelis & Co 11 5.9 23,946 14 20 2.0 3.8
Rothschild & Co 12 5.8 23,808 62 13 4.9 0.9
Centerview Partners LLC 13 5.6 22,942 13 27 1.1 4.5
RBC Capital Markets 14 5.5 22,662 28 7 10.4 -4.9
PJT Partners Inc 15 4.1 16,646 4 61 0.3 3.8
Lazard Ltd 16 3.4 14,001 48 10 7.7 -4.3
Macquarie Group Ltd 17 3.2 13,126 13 14 4.4 -1.2
BNP Paribas SA 18 2.4 9,773 14 58 0.3 2.1
Ernst & Young 19 2.3 9,259 55 19 2.2 0.0
Evercore Partners Inc 20 2.2 9,126 25 22 1.7 0.5
TOTAL 409,511 5,915
686,989
FIRM
2017 2016MKT SHR
CHANGE
FIRM
RANK
MKT SHR
(%)VOLUME USD
(Mln)
DEAL
COUNT RANK
MKT SHR
(%)
1,595,243
2016MKT SHR
CHANGERANK
MKT SHR
(%)VOLUME USD
(Mln)
DEAL
COUNT RANK
MKT SHR
(%) RANK
2017 2016MKT SHR
CHANGE FIRM
2017MKT SHR
(%)VOLUME USD
(Mln)
DEAL
COUNT RANK
MKT SHR
(%)
352,304
4

Country
United States $602.0 85.7% -22.4%
Canada $64.2 9.1% 59.5%
Brazil $19.8 2.8% 133.8%
British Virgin Islands $4.3 0.6% 59.1%
Mexico $3.6 0.5% -22.8%
Chile $1.9 0.3% -85.6%
Colombia $1.0 0.1% -79.9%
Bermuda $0.8 0.1% 1642.7%
Date
Total Value
(Mln.)
Amount
(Bln.) % of Total
% YoY
Change
Number of deals 8,386 Consumer Non-cyclical $173.3 24.5% -6.5%
Volume (Bln.) $702.5 Financial $150.4 21.3% 8.1%
Avg Deal Size (Mln.) $83.8 Energy $119.2 16.9% 63.6%
Consumer Cyclical $72.2 10.2% -23.2%
Communications $52.4 7.4% -32.7%
Goldman Sachs & Co Industrial $43.6 6.2% 6.0%
Number of deals 81 Technology $37.5 5.3% -55.2%
Volume (Bln.) $194.4 Utilities $36.2 5.1% -38.5%
Avg Deal Size (Bln.) $2.4 Basic Materials $21.3 3.0% -79.1%
Diversified $0.1 0.0% -95.3%
Amount
(Bln.)
% Change
Deal Count
% Change
Volume
Company Takeover $460.2 -8.8% -24.0%
Cross Border $245.0 1.6% -23.9%
Private Equity $207.2 -0.1% 6.7%
Asset Sale $150.7 9.0% 16.0%
Tender Offer $55.2 13.9% 49.0%
Venture Capital $30.8 -0.8% -3.6%
Spin-off $5.1 -11.6% -87.6%
Minority Purchase $51.6 0.2% -0.9%
Majority Purchase $14.1 8.8% -21.5%
Quarterly Volume represents any involvement (target, seller, or acquirer).
Americas M&A: Quarterly Volume Americas M&A: Deal Type Breakdown
Deal Type
6/2/2017 Logicor Europe Ltd China Investment CorpBlackstone Group
LP/The$13,805.8
3/13/2017 Mobileye NV Intel Corp - $14,132.0
Amount
(Bln.) % of Total
% YoY
Change
Top Adviser2/1/2017 ONEOK Partners LP ONEOK Inc - $17,377.7
2/10/2017 Mead Johnson Nutrition Co Reckitt Benckiser Group PLC - $17,809.8
Glo
bal
M&
A R
evi
ew |
1H
20
17
4/23/2017 CR Bard Inc Becton Dickinson and Co - $24,195.8
Americas M&A Regional Review Americas M&A: Country Breakdown
Americas M&A: Highlights of 1H 2017
Summary Target Acquirer Seller Industry
Americas M&A: Industry Breakdown
0
1000
2000
3000
4000
5000
6000
$0
$200
$400
$600
$800
$1,000
2012 Q2 2013 Q2 2014 Q2 2015 Q2 2016 Q2 2017 Q2
Volume $(Bln.) Deal Count
• Deal activity in the Americas reached a volume of $702.5 billion in 1H2017, representing a 17.8% decrease compared to the same period last year. The United States contributed to 85.7% of the region’s total and continued to be most targeted country for M&A transactions.
• Deals exceeding $1.0 billion in value accounted for 66.2% of the region’s total deal volume in 1H2017. The average transaction value for megadeals experienced a year-on-year decrease of 24.5%. Becton Dickinson and Co’s announced acquisition of CR Bard Inc for $24.2 billion was the largest deal within the region for the period.
• Private equity activity in 1H2017 for Americas-based targets increased 6.7% from the same period last year to $207.2 billion. United States-based companies were the most sought-after for private equity buyouts with $62.2 billion in transactions. JAB Holding Co Sarl’s announced acquisition of Panera Bread Co for $7.5 billion was the largest buyout for the period.
5
US Announced Deals (Any Involvement) 01/01/2017 - 06/30/2017 US Announced Deals (Target or Seller) 01/01/2017 - 06/30/2017
Goldman Sachs & Co LLC 1 27.4 224,539 106 1 33.8 -6.5 Goldman Sachs & Co LLC 1 38.4 204,876 84 1 42.5 -4.1
Morgan Stanley 2 22.5 184,360 93 2 26.9 -4.4 Morgan Stanley 2 32.4 173,287 82 2 35.1 -2.6
Citigroup Inc 3 20.7 170,140 76 6 16.5 4.2 Citigroup Inc 3 23.4 124,951 63 5 21.7 1.7
Bank of America Merrill Lynch 4 19.9 163,500 58 3 25.2 -5.3 JPMorgan Chase & Co 4 22.7 121,298 78 6 20.6 2.1
JPMorgan Chase & Co 5 17.0 139,483 88 5 17.2 -0.2 Bank of America Merrill Lynch 5 22.7 121,266 51 3 33.1 -10.4
Barclays PLC 6 12.3 101,151 62 4 19.4 -7.1 Barclays PLC 6 17.8 95,326 55 4 25.5 -7.7
Credit Suisse Group AG 7 12.3 100,777 59 7 16.2 -3.9 Evercore Partners Inc 7 11.7 62,664 53 9 16.6 -4.9
Evercore Partners Inc 8 8.3 68,150 60 9 12.7 -4.4 UBS AG 8 10.3 54,845 28 17 4.8 5.4
Lazard Ltd 9 8.3 67,972 60 8 13.3 -5.0 Credit Suisse Group AG 9 8.6 46,180 48 7 19.0 -10.4
UBS AG 10 7.6 62,640 37 17 5.0 2.6 RBC Capital Markets 10 7.7 41,222 37 13 8.1 -0.4
Moelis & Co 11 6.6 54,523 33 23 1.9 4.8 Moelis & Co 11 7.4 39,723 31 22 2.4 5.0
RBC Capital Markets 12 5.7 47,002 44 13 6.4 -0.7 Deutsche Bank AG 12 7.4 39,439 25 10 16.5 -9.2
Deutsche Bank AG 13 5.6 45,828 31 10 12.5 -6.9 Centerview Partners LLC 13 7.2 38,422 26 16 6.8 0.4
Perella Weinberg Partners LP 14 5.1 42,132 11 40 0.9 4.3 Lazard Ltd 14 6.5 34,798 50 8 16.9 -10.4
Centerview Partners LLC 15 4.7 38,422 26 14 6.3 -1.6 Perella Weinberg Partners LP 15 6.2 33,049 6 33 1.1 5.1
ALANTRA 16 4.0 33,088 10 203 - 4.0 Wells Fargo & Co 16 5.4 28,604 21 15 7.1 -1.8
Rothschild & Co 17 3.9 31,865 44 11 9.3 -5.4 Rothschild & Co 17 5.0 26,720 26 11 10.8 -5.8
HSBC Bank PLC 18 3.6 29,383 14 25 1.6 2.0 HSBC Bank PLC 18 4.8 25,869 8 24 2.1 2.8
Wells Fargo & Co 19 3.5 28,604 21 16 5.4 -1.9 PJT Partners Inc 19 4.3 23,146 8 31 1.4 2.9
PJT Partners Inc 20 2.8 23,276 9 34 1.1 1.8 Jefferies LLC 20 4.2 22,518 46 18 4.1 0.1
TOTAL 821,120 8,801 TOTAL 534,236 1,059
Canada Announced Deals (Any Involvement) 01/01/2017 - 06/30/2017 Canada Announced Deals (Target or Seller) 01/01/2017 - 06/30/2017
JPMorgan Chase & Co 1 31.9 45,839 16 2 25.2 6.8 JPMorgan Chase & Co 1 35.3 28,725 9 8 11.2 24.1
TD Securities Inc 2 23.7 33,939 22 17 6.7 17.0 TD Securities Inc 2 34.0 27,649 19 4 15.9 18.1
Goldman Sachs & Co LLC 3 22.4 32,182 17 1 39.7 -17.3 RBC Capital Markets 3 25.5 20,723 16 2 27.5 -2.0
RBC Capital Markets 4 21.9 31,441 27 11 12.3 9.6 Goldman Sachs & Co LLC 4 23.6 19,204 8 7 12.4 11.2
Barclays PLC 5 16.5 23,631 11 6 15.7 0.8 Bank of Nova Scotia/The 5 22.4 18,240 10 5 13.8 8.7
Bank of Nova Scotia/The 6 12.7 18,240 10 9 13.6 -0.9 Barclays PLC 6 17.7 14,394 5 6 13.2 4.5
Citigroup Inc 7 11.3 16,225 13 18 6.4 4.9 CIBC 7 13.4 10,885 10 1 28.6 -15.2
Morgan Stanley 8 10.5 15,036 10 5 17.4 -7.0 Citigroup Inc 8 12.5 10,201 7 12 4.5 8.0
Lazard Ltd 9 10.1 14,539 5 3 19.0 -8.9 Lazard Ltd 9 10.1 8,249 4 44 0.2 9.9
CIBC 10 9.0 12,904 12 8 15.0 -6.0 Bank of America Merrill Lynch 10 7.6 6,168 3 27 1.3 6.3
Bank of America Merrill Lynch 11 8.4 11,980 8 12 10.7 -2.3 Morgan Stanley 11 6.5 5,280 4 15 2.8 3.7
Credit Suisse Group AG 12 7.1 10,202 9 7 15.3 -8.2 BMO Capital Markets 12 6.0 4,871 15 3 18.1 -12.1
BMO Capital Markets 13 6.2 8,945 21 10 12.9 -6.6 Evercore Partners Inc 13 5.9 4,772 5 36 0.5 5.3
Macquarie Group Ltd 14 5.6 7,968 8 13 9.4 -3.9 Credit Suisse Group AG 14 4.5 3,626 4 10 6.5 -2.1
UBS AG 15 5.4 7,770 4 16 8.5 -3.1 National Bank Financial Inc 15 4.2 3,434 10 9 10.6 -6.4
Centerview Partners LLC 16 4.9 7,003 4 - - 4.9 Macquarie Group Ltd 16 2.5 2,018 3 26 1.3 1.2
Deutsche Bank AG 17 4.5 6,415 3 20 5.7 -1.2 Wells Fargo & Co 17 1.8 1,478 2 66 - 1.8
Rothschild & Co 18 4.5 6,395 7 26 2.3 2.1 Haywood Securities Inc 18 1.2 1,002 6 37 0.5 0.8
HSBC Bank PLC 19 3.8 5,472 3 28 2.0 1.8 Maxit Capital LP 19 1.0 850 2 - - 1.0
Evercore Partners Inc 20 3.6 5,218 11 40 0.7 3.0 PricewaterhouseCoopers LLP 20 1.0 833 3 66 - 1.0
TOTAL 143,502 1,604 TOTAL 81,398 1,128
FIRM
2017 2016MKT SHR
CHANGE FIRM
2017 2016MKT SHR
CHANGERANK
MKT SHR
(%)VOLUME USD
(Mln)
DEAL
COUNT RANK
MKT SHR
(%) RANK
MKT SHR
(%)VOLUME USD
(Mln)
DEAL
COUNT RANK
MKT SHR
(%)
RANK
MKT SHR
(%)VOLUME USD
(Mln)
DEAL
COUNT RANK
MKT SHR
(%) RANK
MKT SHR
(%)
DEAL
COUNT RANK
MKT SHR
(%)FIRM
2017 2016MKT SHR
CHANGE FIRM
2017 2016
VOLUME USD
(Mln)
MKT SHR
CHANGE
901,283 682,612
133,644 49,843
6
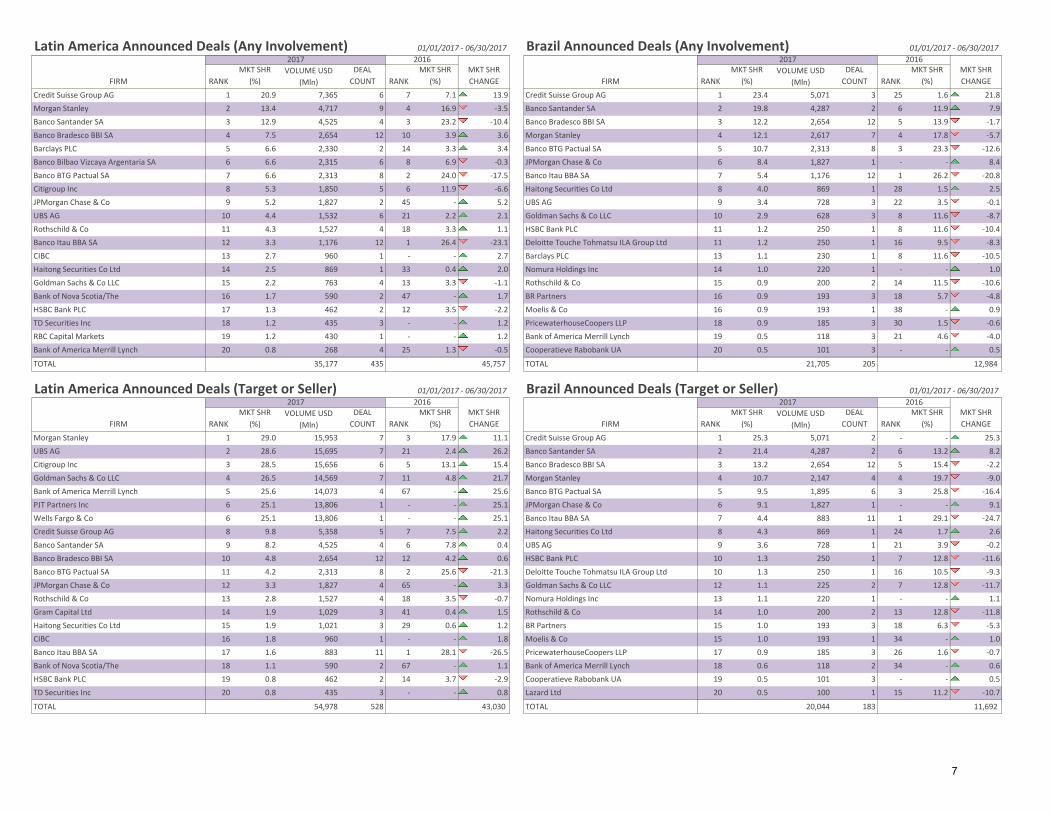
Latin America Announced Deals (Any Involvement) 01/01/2017 - 06/30/2017 Brazil Announced Deals (Any Involvement) 01/01/2017 - 06/30/2017
Credit Suisse Group AG 1 20.9 7,365 6 7 7.1 13.9 Credit Suisse Group AG 1 23.4 5,071 3 25 1.6 21.8
Morgan Stanley 2 13.4 4,717 9 4 16.9 -3.5 Banco Santander SA 2 19.8 4,287 2 6 11.9 7.9
Banco Santander SA 3 12.9 4,525 4 3 23.2 -10.4 Banco Bradesco BBI SA 3 12.2 2,654 12 5 13.9 -1.7
Banco Bradesco BBI SA 4 7.5 2,654 12 10 3.9 3.6 Morgan Stanley 4 12.1 2,617 7 4 17.8 -5.7
Barclays PLC 5 6.6 2,330 2 14 3.3 3.4 Banco BTG Pactual SA 5 10.7 2,313 8 3 23.3 -12.6
Banco Bilbao Vizcaya Argentaria SA 6 6.6 2,315 6 8 6.9 -0.3 JPMorgan Chase & Co 6 8.4 1,827 1 - - 8.4
Banco BTG Pactual SA 7 6.6 2,313 8 2 24.0 -17.5 Banco Itau BBA SA 7 5.4 1,176 12 1 26.2 -20.8
Citigroup Inc 8 5.3 1,850 5 6 11.9 -6.6 Haitong Securities Co Ltd 8 4.0 869 1 28 1.5 2.5
JPMorgan Chase & Co 9 5.2 1,827 2 45 - 5.2 UBS AG 9 3.4 728 3 22 3.5 -0.1
UBS AG 10 4.4 1,532 6 21 2.2 2.1 Goldman Sachs & Co LLC 10 2.9 628 3 8 11.6 -8.7
Rothschild & Co 11 4.3 1,527 4 18 3.3 1.1 HSBC Bank PLC 11 1.2 250 1 8 11.6 -10.4
Banco Itau BBA SA 12 3.3 1,176 12 1 26.4 -23.1 Deloitte Touche Tohmatsu ILA Group Ltd 11 1.2 250 1 16 9.5 -8.3
CIBC 13 2.7 960 1 - - 2.7 Barclays PLC 13 1.1 230 1 8 11.6 -10.5
Haitong Securities Co Ltd 14 2.5 869 1 33 0.4 2.0 Nomura Holdings Inc 14 1.0 220 1 - - 1.0
Goldman Sachs & Co LLC 15 2.2 763 4 13 3.3 -1.1 Rothschild & Co 15 0.9 200 2 14 11.5 -10.6
Bank of Nova Scotia/The 16 1.7 590 2 47 - 1.7 BR Partners 16 0.9 193 3 18 5.7 -4.8
HSBC Bank PLC 17 1.3 462 2 12 3.5 -2.2 Moelis & Co 16 0.9 193 1 38 - 0.9
TD Securities Inc 18 1.2 435 3 - - 1.2 PricewaterhouseCoopers LLP 18 0.9 185 3 30 1.5 -0.6
RBC Capital Markets 19 1.2 430 1 - - 1.2 Bank of America Merrill Lynch 19 0.5 118 3 21 4.6 -4.0
Bank of America Merrill Lynch 20 0.8 268 4 25 1.3 -0.5 Cooperatieve Rabobank UA 20 0.5 101 3 - - 0.5
TOTAL 35,177 435 TOTAL 21,705 205
Latin America Announced Deals (Target or Seller) 01/01/2017 - 06/30/2017 Brazil Announced Deals (Target or Seller) 01/01/2017 - 06/30/2017
Morgan Stanley 1 29.0 15,953 7 3 17.9 11.1 Credit Suisse Group AG 1 25.3 5,071 2 - - 25.3
UBS AG 2 28.6 15,695 7 21 2.4 26.2 Banco Santander SA 2 21.4 4,287 2 6 13.2 8.2
Citigroup Inc 3 28.5 15,656 6 5 13.1 15.4 Banco Bradesco BBI SA 3 13.2 2,654 12 5 15.4 -2.2
Goldman Sachs & Co LLC 4 26.5 14,569 7 11 4.8 21.7 Morgan Stanley 4 10.7 2,147 4 4 19.7 -9.0
Bank of America Merrill Lynch 5 25.6 14,073 4 67 - 25.6 Banco BTG Pactual SA 5 9.5 1,895 6 3 25.8 -16.4
PJT Partners Inc 6 25.1 13,806 1 - - 25.1 JPMorgan Chase & Co 6 9.1 1,827 1 - - 9.1
Wells Fargo & Co 6 25.1 13,806 1 - - 25.1 Banco Itau BBA SA 7 4.4 883 11 1 29.1 -24.7
Credit Suisse Group AG 8 9.8 5,358 5 7 7.5 2.2 Haitong Securities Co Ltd 8 4.3 869 1 24 1.7 2.6
Banco Santander SA 9 8.2 4,525 4 6 7.8 0.4 UBS AG 9 3.6 728 1 21 3.9 -0.2
Banco Bradesco BBI SA 10 4.8 2,654 12 12 4.2 0.6 HSBC Bank PLC 10 1.3 250 1 7 12.8 -11.6
Banco BTG Pactual SA 11 4.2 2,313 8 2 25.6 -21.3 Deloitte Touche Tohmatsu ILA Group Ltd 10 1.3 250 1 16 10.5 -9.3
JPMorgan Chase & Co 12 3.3 1,827 4 65 - 3.3 Goldman Sachs & Co LLC 12 1.1 225 2 7 12.8 -11.7
Rothschild & Co 13 2.8 1,527 4 18 3.5 -0.7 Nomura Holdings Inc 13 1.1 220 1 - - 1.1
Gram Capital Ltd 14 1.9 1,029 3 41 0.4 1.5 Rothschild & Co 14 1.0 200 2 13 12.8 -11.8
Haitong Securities Co Ltd 15 1.9 1,021 3 29 0.6 1.2 BR Partners 15 1.0 193 3 18 6.3 -5.3
CIBC 16 1.8 960 1 - - 1.8 Moelis & Co 15 1.0 193 1 34 - 1.0
Banco Itau BBA SA 17 1.6 883 11 1 28.1 -26.5 PricewaterhouseCoopers LLP 17 0.9 185 3 26 1.6 -0.7
Bank of Nova Scotia/The 18 1.1 590 2 67 - 1.1 Bank of America Merrill Lynch 18 0.6 118 2 34 - 0.6
HSBC Bank PLC 19 0.8 462 2 14 3.7 -2.9 Cooperatieve Rabobank UA 19 0.5 101 3 - - 0.5
TD Securities Inc 20 0.8 435 3 - - 0.8 Lazard Ltd 20 0.5 100 1 15 11.2 -10.7
TOTAL 54,978 528 TOTAL 20,044 183
FIRM
2017 2016MKT SHR
CHANGE FIRM
2017 2016MKT SHR
CHANGERANK
MKT SHR
(%)VOLUME USD
(Mln)
DEAL
COUNT RANK
MKT SHR
(%) RANK
MKT SHR
(%)VOLUME USD
(Mln)
DEAL
COUNT RANK
MKT SHR
(%)
45,757 12,984
43,030 11,692
FIRM
2017 2016MKT SHR
CHANGE FIRM
2017 2016MKT SHR
CHANGERANK
MKT SHR
(%)VOLUME USD
(Mln)
DEAL
COUNT RANK
MKT SHR
(%) RANK
MKT SHR
(%)VOLUME USD
(Mln)
DEAL
COUNT RANK
MKT SHR
(%)
7

Country
United Kingdom $101.3 23.5% 89.0%
France $73.8 17.1% 95.9%
Spain $51.5 12.0% 188.9%
Italy $37.7 8.8% 49.9%
Germany $34.9 8.1% 13.9%
Switzerland $32.6 7.6% -43.9%
Netherlands $16.4 3.8% 25.6%
Finland $4.8 1.1% -62.6%
Date
Total
Value
Amount
(Bln.) % of Total
% YoY
Change
Number of deals 5,391 Consumer Non-cyclical $128.5 29.8% 140.1%
Volume (Bln.) $430.2 Financial $106.1 24.6% 37.8%
Avg Deal Size (Mln.) $79.8 Consumer Cyclical $67.4 15.6% 96.6%
Industrial $42.0 9.7% 2.1%
Energy $33.1 7.7% 71.5%
Citigroup Inc Utilities $16.9 3.9% 81.4%
Number of deals 42 Communications $13.8 3.2% -12.4%
Volume (Bln.) $132.7 Technology $12.3 2.9% -44.9%
Avg Deal Size (Bln.) $3.2 Basic Materials $6.5 1.5% -88.5%
Diversified $4.7 1.1% -8.9%
Amount
(Bln.)
% Change
Deal Count
% Change
Volume
Company Takeover $240.0 -10.5% 39.0%
Cross Border $291.0 -2.3% 27.0%
Private Equity $114.3 5.5% 40.5%
Asset Sale $88.0 6.0% 29.0%
Tender Offer $117.5 18.2% 39.6%
Venture Capital $8.9 11.4% 20.0%
Spin-off $0.7 -15.0% -94.6%
Minority Purchase $43.8 5.6% 10.4%
$48.1 3.8% 76.3%
EMEA M&A: Industry Breakdown
Amount
(Bln.) % of Total
% YoY
Change
Multiple Acquirers
EMEA M&A: Quarterly Volume EMEA M&A: Deal Type Breakdown
Deal Type
4/25/2017 Christian Dior SE Groupe Arnault SE - $13,213.9
$34,388.4
United Kingdom of
Great Britain and
Northern Ireland
$14,799.6
Top Adviser1/16/2017 Luxottica Group SpA Essilor International SA Delfin Sarl $16,608.8
1/26/2017 Actelion Ltd Johnson & Johnson - $29,762.2
3/31/2017 Bradford & Bingley assets
Quarterly Volume represents any involvement (target, seller, or acquirer).
Glo
bal
M&
A R
evi
ew |
1H
20
17
Majority Purchase
EMEA M&A Regional Review EMEA M&A: Country Breakdown
EMEA M&A Highlights of 1H 2017
Summary Target Acquirer Seller Industry
5/15/2017 Abertis Infraestructuras SA Atlantia SpA -
0
1000
2000
3000
4000
$0
$100
$200
$300
$400
$500
2012 Q2 2013 Q2 2014 Q2 2015 Q2 2016 Q2 2017 Q2
Volume $(Bln.) Deal Count
• Deal volume for EMEA-based targets increased 30.4% from the same period last year to $430.2 billion. The United Kingdom was the most sought-after country in 1H2017, with $101.3 billion in transactions.
• Capital flow from North America to EMEA reached a volume of $123.2 billion in 1H2017, a year-on-year increase of 113.6%. The EMEA consumer, non-cyclical industry proved to be the most attractive to North American buyers, accounting for 47.4% of the transactions for the period.
• Private equity activity for EMEA-based targets reached a volume of $114.3 billion in 1H2017, representing a 40.5% increase from the same period last year. The pending acquisition of Bradford & Bingley assets by the consortium consisting of Prudential PLC and The Blackstone Group LP Ltd for $11.8 billion was the largest private equity deal announced this year.
8

Europe Announced Deals (Any Involvement) 01/01/2017 - 06/30/2017 Europe Announced Deals (Target or Seller) 01/01/2017 - 06/30/2017
Goldman Sachs & Co LLC 1 26.9 149,309 64 3 26.3 0.6 Citigroup Inc 1 29.4 133,930 43 14 8.2 21.2
Citigroup Inc 2 26.7 148,121 47 8 14.2 12.5 Goldman Sachs & Co LLC 2 23.6 107,491 50 2 25.8 -2.2
Bank of America Merrill Lynch 3 22.1 122,814 40 5 21.3 0.8 Credit Suisse Group AG 3 22.0 100,247 25 3 23.3 -1.3
Credit Suisse Group AG 4 18.5 102,560 30 2 30.7 -12.2 Rothschild & Co 4 20.5 93,318 110 7 17.7 2.8
Rothschild & Co 5 17.4 96,449 124 4 24.8 -7.4 Bank of America Merrill Lynch 5 18.6 84,695 32 12 10.7 7.9
Morgan Stanley 6 16.0 88,777 61 1 40.6 -24.6 Lazard Ltd 6 17.7 80,816 64 11 12.0 5.7
Lazard Ltd 7 15.4 85,654 76 6 16.7 -1.2 JPMorgan Chase & Co 7 14.1 64,195 49 4 19.7 -5.6
JPMorgan Chase & Co 8 14.8 82,110 59 7 14.7 0.1 Deutsche Bank AG 8 13.8 62,808 27 13 9.7 4.1
Deutsche Bank AG 9 14.6 81,064 29 9 14.2 0.4 Morgan Stanley 9 12.1 55,293 50 1 28.5 -16.4
BNP Paribas SA 10 10.0 55,383 43 19 3.1 6.9 BNP Paribas SA 10 12.0 54,602 42 17 4.6 7.4
Mediobanca SpA 11 9.5 52,447 4 30 1.8 7.7 Mediobanca SpA 11 11.5 52,447 4 24 2.7 8.8
UBS AG 12 7.8 43,009 33 13 12.0 -4.2 ALANTRA 12 7.4 33,615 17 38 1.2 6.2
HSBC Bank PLC 13 7.1 39,636 18 12 12.3 -5.2 UBS AG 13 7.0 31,943 29 6 17.7 -10.7
ALANTRA 14 6.1 33,615 17 42 0.8 5.3 Credit Agricole Corporate & Investment Bank SA 14 4.7 21,340 14 16 5.9 -1.2
Moelis & Co 15 5.9 32,435 6 39 0.8 5.0 Barclays PLC 15 4.0 17,985 17 15 6.4 -2.4
Robey Warshaw LLP 16 5.6 31,082 3 71 0.2 5.4 Moelis & Co 16 3.9 17,611 3 54 0.4 3.5
Credit Agricole Corporate & Investment Ba 17 3.9 21,772 15 18 4.0 0.0 Societe Generale SA 17 3.6 16,200 23 22 2.9 0.6
Societe Generale SA 18 3.5 19,572 24 24 1.9 1.6 HSBC Bank PLC 18 3.5 15,838 12 5 18.6 -15.1
Barclays PLC 19 3.4 18,980 21 11 12.5 -9.1 Ernst & Young 19 3.2 14,760 115 28 2.4 0.9
Ernst & Young 20 2.7 14,826 118 25 1.9 0.8 Kotak Mahindra Bank Ltd 20 3.0 13,811 3 - - 3.0
TOTAL 554,840 6,381 TOTAL 455,659 5,214
UK Announced Deals (Any Involvement) 01/01/2017 - 06/30/2017 Germany Announced Deals (Any Involvement) 01/01/2017 - 06/30/2017
Goldman Sachs & Co LLC 1 32.7 64,038 31 1 21.3 11.4 Deutsche Bank AG 1 15.8 9,653 9 6 11.4 4.4
Morgan Stanley 2 26.8 52,511 28 5 10.4 16.4 Morgan Stanley 2 14.1 8,619 6 1 62.9 -48.7
Bank of America Merrill Lynch 3 24.3 47,683 16 7 10.1 14.2 Citigroup Inc 3 13.8 8,428 7 8 9.7 4.2
JPMorgan Chase & Co 4 16.4 32,083 24 8 9.9 6.5 JPMorgan Chase & Co 4 12.5 7,615 9 10 7.8 4.7
Robey Warshaw LLP 5 15.9 31,082 3 32 1.1 14.8 Bank of America Merrill Lynch 5 10.9 6,676 5 3 56.3 -45.3
Credit Suisse Group AG 6 14.5 28,431 7 15 4.3 10.2 Ernst & Young 6 10.6 6,455 23 20 1.3 9.3
Rothschild & Co 7 12.7 24,852 47 2 16.9 -4.2 Goldman Sachs & Co LLC 7 8.5 5,206 8 9 9.5 -1.0
Deutsche Bank AG 8 12.7 24,789 6 4 11.7 0.9 Moelis & Co 8 7.9 4,839 1 54 - 7.9
HSBC Bank PLC 9 12.5 24,556 6 10 8.3 4.2 UBS AG 9 6.2 3,809 7 18 1.9 4.4
UBS AG 10 11.0 21,475 13 12 5.1 5.9 Credit Suisse Group AG 10 5.9 3,624 4 2 57.7 -51.7
Citigroup Inc 11 10.4 20,421 17 9 9.3 1.1 Rothschild & Co 11 4.2 2,587 15 4 53.0 -48.7
Moelis & Co 12 9.0 17,611 4 26 1.4 7.6 Lazard Ltd 12 3.2 1,955 6 7 11.0 -7.8
Barclays PLC 13 7.1 13,852 11 6 10.2 -3.2 Banco BTG Pactual SA 13 2.7 1,645 1 - - 2.7
Axis Bank Ltd 14 6.8 13,272 2 - - 6.8 Jefferies LLC 14 2.3 1,384 4 25 0.8 1.5
Kotak Mahindra Bank Ltd 14 6.8 13,272 2 - - 6.8 Nomura Holdings Inc 15 1.5 888 1 54 - 1.5
Lazard Ltd 16 6.6 12,913 18 3 14.0 -7.4 Joh Berenberg Gossler & Co KG 16 1.4 878 2 13 3.1 -1.6
BNP Paribas SA 17 5.5 10,683 11 96 0.1 5.4 Macquarie Group Ltd 17 1.4 855 2 28 0.5 0.9
RBC Capital Markets 18 4.2 8,308 10 17 3.8 0.4 Victoria Partners GmbH 18 1.4 847 1 32 0.2 1.2
Zaoui & Co LLP 19 3.7 7,220 2 - - 3.7 Barclays PLC 19 1.1 642 3 11 4.0 -2.9
Deloitte Touche Tohmatsu ILA Group Ltd 20 3.1 6,074 11 56 0.3 2.8 BNP Paribas SA 20 1.0 620 3 19 1.6 -0.6
TOTAL 195,954 2,428 TOTAL 61,009 1,086
FIRM
2017 2016MKT SHR
CHANGE FIRM
2017 2016MKT SHR
CHANGERANK
MKT SHR
(%)VOLUME USD
(Mln)
DEAL
COUNT RANK
MKT SHR
(%) RANK
MKT SHR
(%)VOLUME USD
(Mln)
DEAL
COUNT RANK
MKT SHR
(%)
FIRM
2017 2016MKT SHR
CHANGE FIRM
2017 2016MKT SHR
CHANGERANK
MKT SHR
(%)VOLUME USD
(Mln)
DEAL
COUNT RANK
MKT SHR
(%) RANK
MKT SHR
(%)VOLUME USD
(Mln)
DEAL
COUNT RANK
MKT SHR
(%)
505,337 334,373
102,422 129,164
9

France Announced Deals (Any Involvement) 01/01/2017 - 06/30/2017 Italy Announced Deals (Any Involvement) 01/01/2017 - 06/30/2017
Rothschild & Co 1 50.7 65,111 50 1 40.9 9.8 Citigroup Inc 1 79.4 62,172 6 4 18.3 61.1
BNP Paribas SA 2 41.7 53,479 30 7 14.6 27.1 Mediobanca SpA 2 65.1 50,997 3 2 28.0 37.1
Citigroup Inc 3 36.5 46,796 15 17 5.4 31.1 Goldman Sachs & Co LLC 3 47.6 37,232 6 8 10.5 37.0
Lazard Ltd 4 23.0 29,572 29 11 10.5 12.6 Deutsche Bank AG 4 46.7 36,603 7 10 7.2 39.5
Goldman Sachs & Co LLC 5 19.7 25,232 10 6 16.0 3.7 Credit Suisse Group AG 5 46.0 35,998 3 - - 46.0
Credit Agricole Corporate & Investment Ba 6 17.0 21,772 15 3 27.1 -10.1 Rothschild & Co 6 36.3 28,393 11 6 13.8 22.5
Societe Generale SA 7 14.5 18,638 17 8 13.9 0.6 BNP Paribas SA 7 33.7 26,392 8 19 2.6 31.1
Mediobanca SpA 8 12.9 16,609 1 - - 12.9 Bank of America Merrill Lynch 8 5.7 4,430 5 3 19.5 -13.9
HSBC Bank PLC 9 12.7 16,328 4 14 8.2 4.5 Morgan Stanley 9 3.6 2,843 4 17 4.3 -0.6
Morgan Stanley 10 12.2 15,661 11 2 38.6 -26.3 JPMorgan Chase & Co 10 2.8 2,197 5 15 4.9 -2.1
Deutsche Bank AG 11 9.2 11,766 5 13 8.7 0.5 Banco Santander SA 11 2.5 1,948 3 - - 2.5
Bank of America Merrill Lynch 12 8.5 10,957 4 4 24.5 -16.0 Barclays PLC 12 1.2 952 1 7 12.7 -11.4
JPMorgan Chase & Co 13 7.5 9,654 7 12 8.9 -1.3 Lazard Ltd 13 1.2 933 12 1 30.1 -28.9
Credit Suisse Group AG 14 6.5 8,313 5 5 22.5 -16.0 Guotai Junan Securities Co Ltd 14 1.0 792 1 - - 1.0
Zaoui & Co LLP 15 5.6 7,220 2 - - 5.6 Ernst & Young 15 0.6 461 26 25 1.5 -0.9
Barclays PLC 16 2.9 3,745 4 20 4.0 -1.0 Centerview Partners LLC 16 0.5 400 1 - - 0.5
Natixis SA 17 2.1 2,733 4 15 7.0 -4.9 Jefferies LLC 16 0.5 400 1 22 2.5 -2.0
Evercore Partners Inc 18 1.7 2,119 3 16 6.6 -5.0 Robert W Baird & Co Inc 18 0.5 353 1 - - 0.5
Nomura Holdings Inc 19 0.6 785 3 60 - 0.6 Greentech Capital Advisors LLC 19 0.4 282 1 45 - 0.4
RBC Capital Markets 20 0.5 680 2 18 5.2 -4.6 PricewaterhouseCoopers LLP 20 0.3 207 9 13 6.2 -5.9
TOTAL 128,325 956 TOTAL 78,307 388
Benelux Announced Deals (Any Involvement) 01/01/2017 - 06/30/2017 Iberia Announced Deals (Any Involvement) 01/01/2017 - 06/30/2017
Citigroup Inc 1 34.9 27,838 9 15 3.0 31.9 Citigroup Inc 1 60.0 39,349 12 7 7.5 52.5
JPMorgan Chase & Co 2 30.0 23,956 11 19 1.8 28.2 Deutsche Bank AG 2 58.0 38,038 6 5 9.8 48.2
Rothschild & Co 3 30.0 23,953 16 7 13.4 16.5 Goldman Sachs & Co LLC 3 56.2 36,861 4 4 11.5 44.7
BNP Paribas SA 4 21.6 17,229 3 12 4.7 16.9 Mediobanca SpA 4 54.6 35,838 2 - - 54.6
Mediobanca SpA 5 20.8 16,609 1 - - 20.8 Credit Suisse Group AG 5 52.4 34,388 2 36 - 52.4
Lazard Ltd 6 20.5 16,367 20 5 15.2 5.3 Rothschild & Co 6 9.6 6,274 11 23 0.8 8.8
Goldman Sachs & Co LLC 7 15.0 11,997 12 8 10.6 4.4 JPMorgan Chase & Co 7 9.1 5,958 8 10 5.0 4.1
Morgan Stanley 8 14.5 11,612 11 1 21.5 -7.0 Morgan Stanley 8 7.3 4,765 5 2 13.3 -6.0
Bank of Nova Scotia/The 9 13.4 10,662 2 - - 13.4 Ernst & Young 9 7.2 4,706 24 26 0.5 6.6
TD Securities Inc 9 13.4 10,662 2 - - 13.4 UBS AG 10 7.0 4,588 6 15 1.3 5.7
Bank of America Merrill Lynch 11 12.9 10,302 7 2 18.2 -5.3 Banco Santander SA 11 5.5 3,581 4 1 30.1 -24.7
BMO Capital Markets 12 5.4 4,277 2 60 0.0 5.3 Abu Dhabi Investment Co 12 4.3 2,815 1 - - 4.3
Credit Suisse Group AG 13 5.2 4,160 6 6 13.7 -8.5 Swiss Life AG 12 4.3 2,815 1 - - 4.3
ING Groep NV 14 4.4 3,538 15 33 0.7 3.8 Natixis SA 12 4.3 2,815 3 - - 4.3
ALANTRA 15 4.2 3,326 2 - - 4.2 BNP Paribas SA 15 3.7 2,435 6 8 7.3 -3.6
Quayle Munro Holdings Ltd 16 4.1 3,292 1 - - 4.1 Lazard Ltd 16 2.6 1,702 8 11 4.7 -2.1
UBS AG 17 3.9 3,073 2 11 5.2 -1.4 TAP Advisors LLC 17 2.1 1,344 1 - - 2.1
PricewaterhouseCoopers LLP 18 3.7 2,971 14 58 0.1 3.7 HSBC Bank PLC 17 2.1 1,344 1 21 0.9 1.2
Deutsche Bank AG 19 3.5 2,813 5 9 8.6 -5.1 Stifel Financial Corp 19 1.6 1,022 1 - - 1.6
Houlihan Lokey Inc 20 2.8 2,252 2 54 0.1 2.7 Barclays PLC 20 1.5 952 2 17 1.3 0.2
TOTAL 79,891 740 TOTAL 65,589 390
RANK
MKT SHR
(%)
FIRM
2017 2016
RANK
FIRM RANK
MKT SHR
(%)VOLUME USD
(Mln)
DEAL
COUNT RANK
MKT SHR
(%) RANK
MKT SHR
(%)
FIRM
2017 2016MKT SHR
CHANGERANK
MKT SHR
(%)VOLUME USD
(Mln)
DEAL
COUNT RANK
MKT SHR
(%)
MKT SHR
(%)VOLUME USD
(Mln)
DEAL
COUNT RANK
MKT SHR
(%)
2017 2016MKT SHR
CHANGE FIRM
2017
VOLUME USD
(Mln)
DEAL
COUNT
70,485 31,858
48,515 26,551
MKT SHR
CHANGE
2016MKT SHR
CHANGE
10
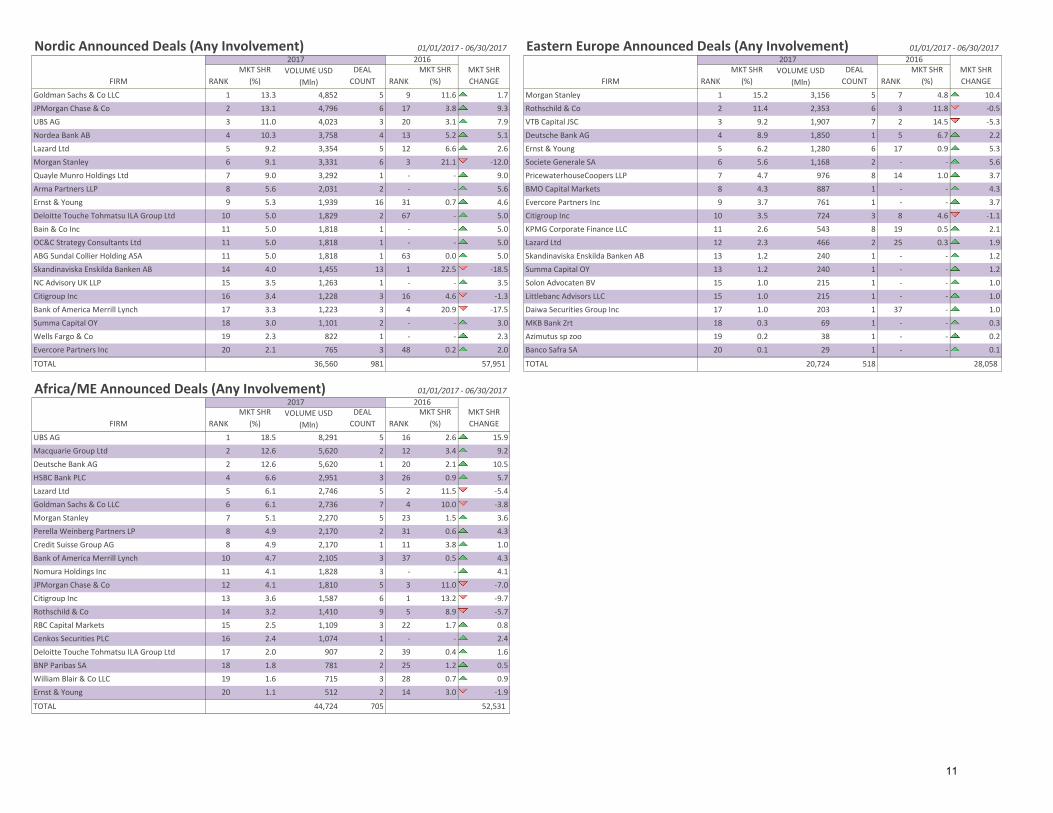
Nordic Announced Deals (Any Involvement) 01/01/2017 - 06/30/2017 Eastern Europe Announced Deals (Any Involvement) 01/01/2017 - 06/30/2017
Goldman Sachs & Co LLC 1 13.3 4,852 5 9 11.6 1.7 Morgan Stanley 1 15.2 3,156 5 7 4.8 10.4
JPMorgan Chase & Co 2 13.1 4,796 6 17 3.8 9.3 Rothschild & Co 2 11.4 2,353 6 3 11.8 -0.5
UBS AG 3 11.0 4,023 3 20 3.1 7.9 VTB Capital JSC 3 9.2 1,907 7 2 14.5 -5.3
Nordea Bank AB 4 10.3 3,758 4 13 5.2 5.1 Deutsche Bank AG 4 8.9 1,850 1 5 6.7 2.2
Lazard Ltd 5 9.2 3,354 5 12 6.6 2.6 Ernst & Young 5 6.2 1,280 6 17 0.9 5.3
Morgan Stanley 6 9.1 3,331 6 3 21.1 -12.0 Societe Generale SA 6 5.6 1,168 2 - - 5.6
Quayle Munro Holdings Ltd 7 9.0 3,292 1 - - 9.0 PricewaterhouseCoopers LLP 7 4.7 976 8 14 1.0 3.7
Arma Partners LLP 8 5.6 2,031 2 - - 5.6 BMO Capital Markets 8 4.3 887 1 - - 4.3
Ernst & Young 9 5.3 1,939 16 31 0.7 4.6 Evercore Partners Inc 9 3.7 761 1 - - 3.7
Deloitte Touche Tohmatsu ILA Group Ltd 10 5.0 1,829 2 67 - 5.0 Citigroup Inc 10 3.5 724 3 8 4.6 -1.1
Bain & Co Inc 11 5.0 1,818 1 - - 5.0 KPMG Corporate Finance LLC 11 2.6 543 8 19 0.5 2.1
OC&C Strategy Consultants Ltd 11 5.0 1,818 1 - - 5.0 Lazard Ltd 12 2.3 466 2 25 0.3 1.9
ABG Sundal Collier Holding ASA 11 5.0 1,818 1 63 0.0 5.0 Skandinaviska Enskilda Banken AB 13 1.2 240 1 - - 1.2
Skandinaviska Enskilda Banken AB 14 4.0 1,455 13 1 22.5 -18.5 Summa Capital OY 13 1.2 240 1 - - 1.2
NC Advisory UK LLP 15 3.5 1,263 1 - - 3.5 Solon Advocaten BV 15 1.0 215 1 - - 1.0
Citigroup Inc 16 3.4 1,228 3 16 4.6 -1.3 Littlebanc Advisors LLC 15 1.0 215 1 - - 1.0
Bank of America Merrill Lynch 17 3.3 1,223 3 4 20.9 -17.5 Daiwa Securities Group Inc 17 1.0 203 1 37 - 1.0
Summa Capital OY 18 3.0 1,101 2 - - 3.0 MKB Bank Zrt 18 0.3 69 1 - - 0.3
Wells Fargo & Co 19 2.3 822 1 - - 2.3 Azimutus sp zoo 19 0.2 38 1 - - 0.2
Evercore Partners Inc 20 2.1 765 3 48 0.2 2.0 Banco Safra SA 20 0.1 29 1 - - 0.1
TOTAL 36,560 981 TOTAL 20,724 518
Africa/ME Announced Deals (Any Involvement) 01/01/2017 - 06/30/2017
UBS AG 1 18.5 8,291 5 16 2.6 15.9
Macquarie Group Ltd 2 12.6 5,620 2 12 3.4 9.2
Deutsche Bank AG 2 12.6 5,620 1 20 2.1 10.5
HSBC Bank PLC 4 6.6 2,951 3 26 0.9 5.7
Lazard Ltd 5 6.1 2,746 5 2 11.5 -5.4
Goldman Sachs & Co LLC 6 6.1 2,736 7 4 10.0 -3.8
Morgan Stanley 7 5.1 2,270 5 23 1.5 3.6
Perella Weinberg Partners LP 8 4.9 2,170 2 31 0.6 4.3
Credit Suisse Group AG 8 4.9 2,170 1 11 3.8 1.0
Bank of America Merrill Lynch 10 4.7 2,105 3 37 0.5 4.3
Nomura Holdings Inc 11 4.1 1,828 3 - - 4.1
JPMorgan Chase & Co 12 4.1 1,810 5 3 11.0 -7.0
Citigroup Inc 13 3.6 1,587 6 1 13.2 -9.7
Rothschild & Co 14 3.2 1,410 9 5 8.9 -5.7
RBC Capital Markets 15 2.5 1,109 3 22 1.7 0.8
Cenkos Securities PLC 16 2.4 1,074 1 - - 2.4
Deloitte Touche Tohmatsu ILA Group Ltd 17 2.0 907 2 39 0.4 1.6
BNP Paribas SA 18 1.8 781 2 25 1.2 0.5
William Blair & Co LLC 19 1.6 715 3 28 0.7 0.9
Ernst & Young 20 1.1 512 2 14 3.0 -1.9
TOTAL 44,724 705
FIRM
DEAL
COUNT RANK
MKT SHR
(%)
MKT SHR
(%) RANK
MKT SHR
(%)VOLUME USD
(Mln)
DEAL
COUNTRANK
MKT SHR
CHANGE
2017 2016MKT SHR
CHANGERANK
MKT SHR
(%)VOLUME USD
(Mln)
RANK
MKT SHR
(%)FIRM
2017 2016MKT SHR
CHANGE FIRM
2017 2016
RANK
MKT SHR
(%)VOLUME USD
(Mln)
DEAL
COUNT
57,951 28,058
52,531
11
Date
Total
Value
Number of deals 6,233
Volume (Bln.) $406.8
Avg Deal Size (Mln.) $65.3
UBS AG
Number of deals 24
Volume (Bln.) $33.5
Avg Deal Size (Bln.) $1.4
Deal Type
Amount
(Bln.)
% Change
Deal Count
% YoY
Change
Company Takeover $166.7 6.0% -4.4%
Cross Border $132.0 -0.6% -5.1%
Private Equity $85.8 9.1% 13.5%
Asset Sale $65.1 4.1% 20.3%
Tender Offer $25.1 17.2% 23.4%
Venture Capital $21.6 2.9% -36.2%
Spin-off $1.7 9.1% -88.6%
Minority Purchase $102.5 7.0% 3.6%
Majority Purchase $59.4 29.9% -4.8%
Graphs represent any regional involvement (target, seller, or acquirer).
Multiple Targets
Japan M&A: Quarterly Volume
$5,724.84/28/2017Belle International
Holdings LtdMultiple Acquirers -
Vodafone Group PLC
-
APAC M&A: Breakdown
Greater China M&A: Quarterly Volume
6/1/2017Hengda Real Estate
Group Co LtdMultiple Acquirers - $5,806.4
Top Adviser6/29/2017 Multiple Targets China Vanke Co Ltd
Guangdong
International Trust &
Investment Corp
$8,109.5
4/26/2017
$12,679.0
Lotte Confectionery Co Ltd $8,855.5
APAC M&A Regional Review
Glo
bal
M&
A R
evi
ew |
1H
20
17
APAC M&A: Quarterly Volume
Australia/NZ M&A: Quarterly Volume
APAC M&A: Highlights of 1H 2017
Summary Target Acquirer Seller
3/20/2017 Vodafone India Ltd Idea Cellular Ltd
36%
13%11%
11%
9%
7%
5%4% 3%
1%
APAC Industry Breakdown Financial
Industrial
Communications
Consumer Cyclical
Consumer Non-cyclical
Technology
Energy
Basic Materials
Utilities
Diversified
0
2000
4000
6000
$0
$200
$400
$600
Volume $(Bln.) Deal Count
0
200
400
600
$0
$20
$40
$60
Volume $(Bln.) Deal Count
0
500
1000
1500
2000
$0
$100
$200
$300
Volume $(Bln.) Deal Count
0
500
1000
$0
$50
$100
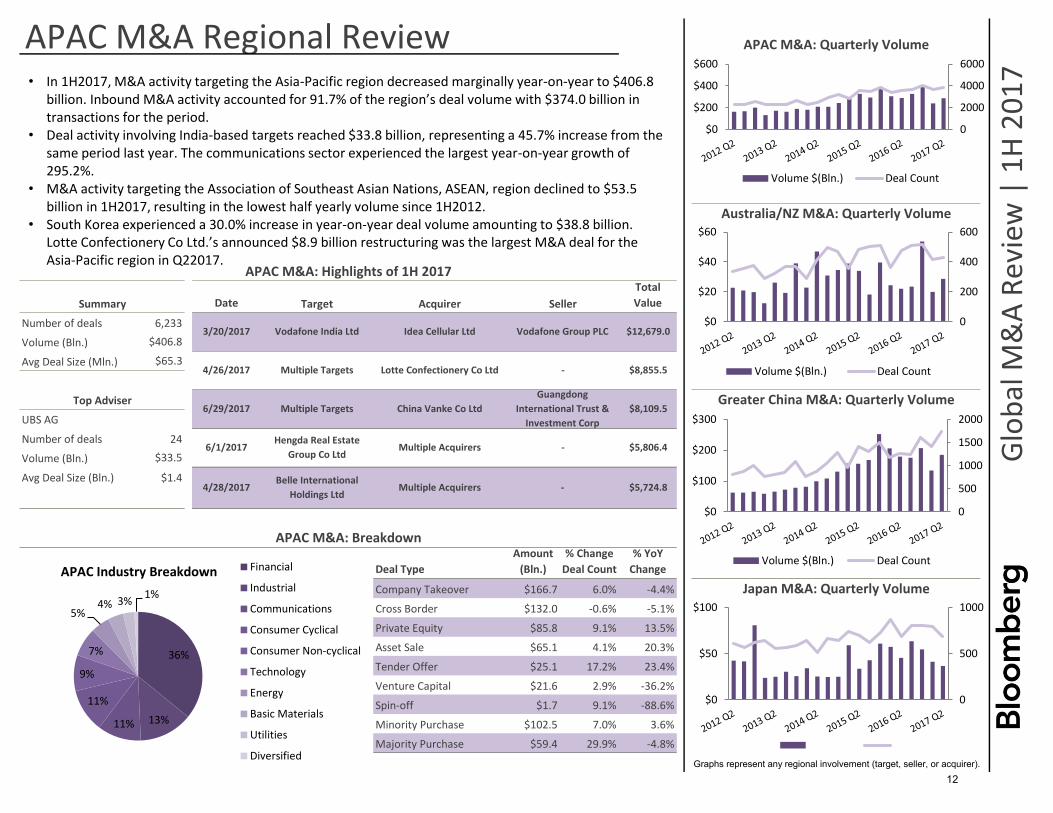
• In 1H2017, M&A activity targeting the Asia-Pacific region decreased marginally year-on-year to $406.8billion. Inbound M&A activity accounted for 91.7% of the region’s deal volume with $374.0 billion intransactions for the period.
• Deal activity involving India-based targets reached $33.8 billion, representing a 45.7% increase from thesame period last year. The communications sector experienced the largest year-on-year growth of295.2%.
• M&A activity targeting the Association of Southeast Asian Nations, ASEAN, region declined to $53.5billion in 1H2017, resulting in the lowest half yearly volume since 1H2012.
• South Korea experienced a 30.0% increase in year-on-year deal volume amounting to $38.8 billion.Lotte Confectionery Co Ltd.’s announced $8.9 billion restructuring was the largest M&A deal for theAsia-Pacific region in Q22017.
12

APAC Ex-Japan Announced Deals (Any Involvement) 01/01/2017 - 06/30/2017 APAC Ex-Japan Announced Deals (Target or Seller) 01/01/2017 - 06/30/2017
Goldman Sachs & Co LLC 1 10.9 51,723 35 1 20.3 -9.3 UBS AG 1 8.6 33,397 24 6 6.5 2.1
UBS AG 2 10.9 51,682 29 6 14.2 -3.3 Goldman Sachs & Co LLC 2 7.9 30,877 23 1 11.8 -3.9
Morgan Stanley 3 10.5 49,781 32 2 20.2 -9.7 Morgan Stanley 3 7.5 29,214 22 5 7.2 0.3
Bank of America Merrill Lynch 4 9.2 43,456 23 11 5.2 4.0 Bank of America Merrill Lynch 4 5.8 22,474 14 13 3.1 2.7
Citigroup Inc 5 5.1 24,301 25 10 5.3 -0.2 Rothschild & Co 5 5.0 19,356 19 21 1.6 3.3
Rothschild & Co 6 4.7 22,266 27 19 2.2 2.6 CITIC Securities Co Ltd 6 3.8 14,952 9 9 3.6 0.2
Credit Suisse Group AG 7 3.7 17,253 28 4 16.7 -13.1 China International Capital Corp Ltd 7 3.5 13,726 16 4 7.4 -3.9
Wells Fargo & Co 8 3.2 15,204 2 124 0.1 3.2 Kotak Mahindra Bank Ltd 8 3.5 13,437 5 81 0.1 3.3
CITIC Securities Co Ltd 9 3.2 14,952 9 14 3.4 -0.2 Axis Bank Ltd 9 3.4 13,315 5 66 0.3 3.1
China International Capital Corp Ltd 10 3.0 14,321 18 5 16.2 -13.2 Robey Warshaw LLP 10 3.4 13,272 2 - - 3.4
PJT Partners Inc 11 3.0 14,252 2 92 0.1 2.9 Deutsche Bank AG 11 3.3 12,902 10 43 0.8 2.6
Deutsche Bank AG 12 2.9 13,728 11 23 1.8 1.1 Credit Suisse Group AG 12 2.4 9,253 19 2 9.6 -7.2
Kotak Mahindra Bank Ltd 13 2.8 13,437 5 97 0.1 2.7 Macquarie Group Ltd 13 2.2 8,653 14 8 4.1 -1.8
Axis Bank Ltd 14 2.8 13,315 5 81 0.2 2.6 China Securities Co Ltd 14 2.1 8,167 14 16 2.6 -0.5
Robey Warshaw LLP 15 2.8 13,272 2 - - 2.8 Somerley Group Ltd 15 1.9 7,382 24 25 1.3 0.6
Macquarie Group Ltd 16 2.4 11,277 17 15 3.0 -0.6 Gram Capital Ltd 16 1.9 7,354 24 42 0.8 1.1
Lazard Ltd 17 2.3 11,021 17 16 2.7 -0.4 Haitong Securities Co Ltd 17 1.8 6,972 23 23 1.6 0.2
Ernst & Young 18 1.9 9,053 39 26 1.4 0.5 Ernst & Young 18 1.7 6,483 30 19 1.8 -0.1
China Securities Co Ltd 19 1.7 8,167 14 22 1.9 -0.1 Lazard Ltd 19 1.6 6,188 7 17 2.2 -0.6
Haitong Securities Co Ltd 20 1.7 7,841 24 32 1.2 0.4 Anglo Chinese Corporate Finance 20 1.5 5,725 1 80 0.2 1.3
TOTAL 473,324 6,313 TOTAL 388,884 5,387
APAC Private Equity (Any Involvement) 01/01/2017 - 06/30/2017
Goldman Sachs & Co LLC 1 22.2 30,079 19 1 23.3 -1.2
UBS AG 2 20.9 28,311 9 4 11.8 9.0
Morgan Stanley 3 20.7 28,037 16 10 6.1 14.6
Bank of America Merrill Lynch 4 17.9 24,339 9 25 1.0 17.0
Citigroup Inc 5 14.9 20,162 14 8 8.7 6.2
Wells Fargo & Co 6 11.2 15,204 2 - - 11.2
PJT Partners Inc 7 10.2 13,806 1 35 0.6 9.6
Macquarie Group Ltd 8 7.0 9,494 6 5 10.2 -3.2
Lazard Ltd 9 6.3 8,551 9 11 6.1 0.3
Ernst & Young 10 5.3 7,214 14 15 2.6 2.8
Credit Suisse Group AG 11 5.2 7,092 11 3 15.3 -10.1
Sumitomo Mitsui Financial Group Inc 12 4.5 6,061 12 41 0.3 4.2
Anglo Chinese Corporate Finance 13 4.2 5,725 1 50 0.2 4.0
Deutsche Bank AG 14 4.1 5,620 1 - - 4.1
Barclays PLC 15 3.6 4,859 3 17 2.2 1.4
Rothschild & Co 16 3.5 4,791 5 20 1.8 1.8
Nomura Holdings Inc 17 3.5 4,747 8 22 1.6 1.9
JPMorgan Chase & Co 18 3.1 4,211 7 2 15.8 -12.7
RBC Capital Markets 19 3.1 4,187 5 - - 3.1
Highbury Partnership Pty Ltd 20 2.3 3,080 1 - - 2.3
TOTAL 135,636 1,413
2016MKT SHR
(%)VOLUME USD
(Mln)
DEAL
COUNT RANK
MKT SHR
(%) RANK
MKT SHR
(%)VOLUME USD
(Mln)
FIRM
2017 2016MKT SHR
CHANGE
528,713
FIRM
2017 2016MKT SHR
CHANGE FIRM
2017
RANK
RANK
MKT SHR
(%)VOLUME USD
(Mln)
DEAL
COUNT RANK
MKT SHR
(%)
375,465
125,437
MKT SHR
CHANGE
DEAL
COUNT RANK
MKT SHR
(%)
13
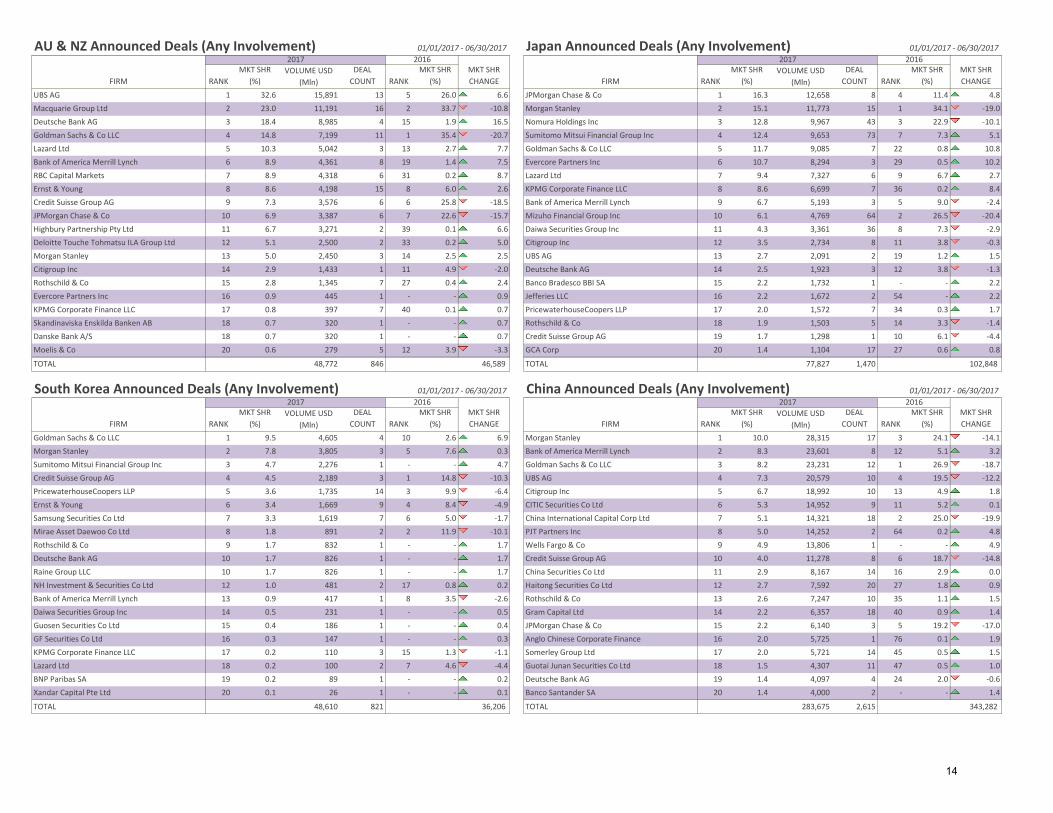
AU & NZ Announced Deals (Any Involvement) 01/01/2017 - 06/30/2017 Japan Announced Deals (Any Involvement) 01/01/2017 - 06/30/2017
UBS AG 1 32.6 15,891 13 5 26.0 6.6 JPMorgan Chase & Co 1 16.3 12,658 8 4 11.4 4.8
Macquarie Group Ltd 2 23.0 11,191 16 2 33.7 -10.8 Morgan Stanley 2 15.1 11,773 15 1 34.1 -19.0
Deutsche Bank AG 3 18.4 8,985 4 15 1.9 16.5 Nomura Holdings Inc 3 12.8 9,967 43 3 22.9 -10.1
Goldman Sachs & Co LLC 4 14.8 7,199 11 1 35.4 -20.7 Sumitomo Mitsui Financial Group Inc 4 12.4 9,653 73 7 7.3 5.1
Lazard Ltd 5 10.3 5,042 3 13 2.7 7.7 Goldman Sachs & Co LLC 5 11.7 9,085 7 22 0.8 10.8
Bank of America Merrill Lynch 6 8.9 4,361 8 19 1.4 7.5 Evercore Partners Inc 6 10.7 8,294 3 29 0.5 10.2
RBC Capital Markets 7 8.9 4,318 6 31 0.2 8.7 Lazard Ltd 7 9.4 7,327 6 9 6.7 2.7
Ernst & Young 8 8.6 4,198 15 8 6.0 2.6 KPMG Corporate Finance LLC 8 8.6 6,699 7 36 0.2 8.4
Credit Suisse Group AG 9 7.3 3,576 6 6 25.8 -18.5 Bank of America Merrill Lynch 9 6.7 5,193 3 5 9.0 -2.4
JPMorgan Chase & Co 10 6.9 3,387 6 7 22.6 -15.7 Mizuho Financial Group Inc 10 6.1 4,769 64 2 26.5 -20.4
Highbury Partnership Pty Ltd 11 6.7 3,271 2 39 0.1 6.6 Daiwa Securities Group Inc 11 4.3 3,361 36 8 7.3 -2.9
Deloitte Touche Tohmatsu ILA Group Ltd 12 5.1 2,500 2 33 0.2 5.0 Citigroup Inc 12 3.5 2,734 8 11 3.8 -0.3
Morgan Stanley 13 5.0 2,450 3 14 2.5 2.5 UBS AG 13 2.7 2,091 2 19 1.2 1.5
Citigroup Inc 14 2.9 1,433 1 11 4.9 -2.0 Deutsche Bank AG 14 2.5 1,923 3 12 3.8 -1.3
Rothschild & Co 15 2.8 1,345 7 27 0.4 2.4 Banco Bradesco BBI SA 15 2.2 1,732 1 - - 2.2
Evercore Partners Inc 16 0.9 445 1 - - 0.9 Jefferies LLC 16 2.2 1,672 2 54 - 2.2
KPMG Corporate Finance LLC 17 0.8 397 7 40 0.1 0.7 PricewaterhouseCoopers LLP 17 2.0 1,572 7 34 0.3 1.7
Skandinaviska Enskilda Banken AB 18 0.7 320 1 - - 0.7 Rothschild & Co 18 1.9 1,503 5 14 3.3 -1.4
Danske Bank A/S 18 0.7 320 1 - - 0.7 Credit Suisse Group AG 19 1.7 1,298 1 10 6.1 -4.4
Moelis & Co 20 0.6 279 5 12 3.9 -3.3 GCA Corp 20 1.4 1,104 17 27 0.6 0.8
TOTAL 48,772 846 TOTAL 77,827 1,470
South Korea Announced Deals (Any Involvement) 01/01/2017 - 06/30/2017 China Announced Deals (Any Involvement) 01/01/2017 - 06/30/2017
Goldman Sachs & Co LLC 1 9.5 4,605 4 10 2.6 6.9 Morgan Stanley 1 10.0 28,315 17 3 24.1 -14.1
Morgan Stanley 2 7.8 3,805 3 5 7.6 0.3 Bank of America Merrill Lynch 2 8.3 23,601 8 12 5.1 3.2
Sumitomo Mitsui Financial Group Inc 3 4.7 2,276 1 - - 4.7 Goldman Sachs & Co LLC 3 8.2 23,231 12 1 26.9 -18.7
Credit Suisse Group AG 4 4.5 2,189 3 1 14.8 -10.3 UBS AG 4 7.3 20,579 10 4 19.5 -12.2
PricewaterhouseCoopers LLP 5 3.6 1,735 14 3 9.9 -6.4 Citigroup Inc 5 6.7 18,992 10 13 4.9 1.8
Ernst & Young 6 3.4 1,669 9 4 8.4 -4.9 CITIC Securities Co Ltd 6 5.3 14,952 9 11 5.2 0.1
Samsung Securities Co Ltd 7 3.3 1,619 7 6 5.0 -1.7 China International Capital Corp Ltd 7 5.1 14,321 18 2 25.0 -19.9
Mirae Asset Daewoo Co Ltd 8 1.8 891 2 2 11.9 -10.1 PJT Partners Inc 8 5.0 14,252 2 64 0.2 4.8
Rothschild & Co 9 1.7 832 1 - - 1.7 Wells Fargo & Co 9 4.9 13,806 1 - - 4.9
Deutsche Bank AG 10 1.7 826 1 - - 1.7 Credit Suisse Group AG 10 4.0 11,278 8 6 18.7 -14.8
Raine Group LLC 10 1.7 826 1 - - 1.7 China Securities Co Ltd 11 2.9 8,167 14 16 2.9 0.0
NH Investment & Securities Co Ltd 12 1.0 481 2 17 0.8 0.2 Haitong Securities Co Ltd 12 2.7 7,592 20 27 1.8 0.9
Bank of America Merrill Lynch 13 0.9 417 1 8 3.5 -2.6 Rothschild & Co 13 2.6 7,247 10 35 1.1 1.5
Daiwa Securities Group Inc 14 0.5 231 1 - - 0.5 Gram Capital Ltd 14 2.2 6,357 18 40 0.9 1.4
Guosen Securities Co Ltd 15 0.4 186 1 - - 0.4 JPMorgan Chase & Co 15 2.2 6,140 3 5 19.2 -17.0
GF Securities Co Ltd 16 0.3 147 1 - - 0.3 Anglo Chinese Corporate Finance 16 2.0 5,725 1 76 0.1 1.9
KPMG Corporate Finance LLC 17 0.2 110 3 15 1.3 -1.1 Somerley Group Ltd 17 2.0 5,721 14 45 0.5 1.5
Lazard Ltd 18 0.2 100 2 7 4.6 -4.4 Guotai Junan Securities Co Ltd 18 1.5 4,307 11 47 0.5 1.0
BNP Paribas SA 19 0.2 89 1 - - 0.2 Deutsche Bank AG 19 1.4 4,097 4 24 2.0 -0.6
Xandar Capital Pte Ltd 20 0.1 26 1 - - 0.1 Banco Santander SA 20 1.4 4,000 2 - - 1.4
TOTAL 48,610 821 TOTAL 283,675 2,61536,206 343,282
FIRM
2017 2016MKT SHR
CHANGE FIRM
2017 2016MKT SHR
CHANGERANK
MKT SHR
(%)VOLUME USD
(Mln)
DEAL
COUNT RANK
MKT SHR
(%) RANK
MKT SHR
(%)VOLUME USD
(Mln)
DEAL
COUNT RANK
MKT SHR
(%)
DEAL
COUNT RANK
MKT SHR
(%) RANK
MKT SHR
(%)VOLUME USD
(Mln)
DEAL
COUNT RANK
MKT SHR
(%)
46,589 102,848
FIRM
2017 2016MKT SHR
CHANGE FIRM
2017 2016MKT SHR
CHANGERANK
MKT SHR
(%)VOLUME USD
(Mln)
14

Hong Kong Announced Deals (Any Involvement) 01/01/2017 - 06/30/2017 Taiwan Announced Deals (Any Involvement) 01/01/2017 - 06/30/2017
Goldman Sachs & Co LLC 1 15.6 11,142 11 5 11.1 4.5 Somerley Group Ltd 1 16.3 881 1 - - 16.3
Morgan Stanley 2 8.1 5,823 5 2 19.4 -11.3 BNP Paribas SA 1 16.3 881 1 - - 16.3
Anglo Chinese Corporate Finance 3 8.0 5,725 1 27 0.8 7.2 Yuanta Securities Co Ltd 3 6.6 356 5 8 3.8 2.8
Bank of America Merrill Lynch 3 8.0 5,725 1 1 20.0 -12.0 KGI Securities Co Ltd 4 5.3 287 3 5 17.3 -12.0
UBS AG 5 6.2 4,430 5 44 0.3 5.9 Citigroup Inc 5 4.8 257 1 6 16.9 -12.1
Barclays PLC 6 6.1 4,392 3 26 0.9 5.2 Harpeth Capital LLC 6 3.1 167 1 - - 3.1
Nomura Holdings Inc 7 5.7 4,067 5 34 0.4 5.3 Lincoln International LLC 7 1.0 53 1 - - 1.0
Ernst & Young 8 5.1 3,680 2 15 2.5 2.7 Nomura Holdings Inc 8 0.6 30 1 17 0.0 0.5
Lazard Ltd 9 4.7 3,344 3 - - 4.7 Sangyo Sosei Advisory Inc 8 0.6 30 2 - - 0.6
Highbury Partnership Pty Ltd 10 4.3 3,080 1 - - 4.3 Banco Bilbao Vizcaya Argentaria SA 10 0.4 22 1 - - 0.4
JPMorgan Chase & Co 11 3.7 2,615 2 19 2.2 1.4 PricewaterhouseCoopers LLP 11 0.0 0 1 9 1.7 -1.7
Rothschild & Co 12 3.6 2,564 1 20 1.8 1.8 KPMG Corporate Finance LLC 12 - - 1 14 0.8 -0.8
Somerley Group Ltd 13 3.2 2,289 14 9 6.9 -3.7
China International Capital Corp Ltd 14 3.2 2,284 2 31 0.5 2.7
CIBC 15 3.0 2,120 1 17 2.4 0.6
CITIC Securities Co Ltd 16 2.9 2,080 1 - - 2.9
Cooperatieve Rabobank UA 17 2.5 1,787 1 - - 2.5
Credit Suisse Group AG 17 2.5 1,787 2 13 2.8 -0.3
Optima Capital Ltd 19 2.4 1,711 7 39 0.3 2.1
Gram Capital Ltd 20 2.2 1,573 19 36 0.4 1.9
TOTAL 71,528 787 TOTAL 5,408 83
SE Asia Announced Deals (Any Involvement) 01/01/2017 - 06/30/2017 India Announced Deals (Any Involvement) 01/01/2017 - 06/30/2017
Morgan Stanley 1 11.0 5,813 12 7 14.4 -3.5 Morgan Stanley 1 38.2 14,767 5 12 3.7 34.6
Lazard Ltd 2 6.6 3,518 4 31 0.7 6.0 UBS AG 2 38.0 14,693 5 7 5.3 32.7
CIMB 3 6.3 3,327 18 24 1.7 4.6 Bank of America Merrill Lynch 3 35.9 13,876 3 20 1.5 34.4
DBS Group Holdings Ltd 4 5.9 3,135 3 29 0.7 5.2 Rothschild & Co 4 35.5 13,715 9 3 10.2 25.3
Credit Suisse Group AG 5 5.6 2,956 13 2 24.6 -19.0 Kotak Mahindra Bank Ltd 5 34.8 13,437 5 18 1.7 33.0
Barclays PLC 6 5.4 2,865 2 38 0.5 4.9 Axis Bank Ltd 6 34.5 13,315 5 13 3.6 30.8
Citigroup Inc 7 4.6 2,434 7 10 7.3 -2.7 Goldman Sachs & Co LLC 7 34.3 13,272 2 14 2.9 31.4
Ernst & Young 8 4.2 2,239 6 35 0.6 3.7 Robey Warshaw LLP 7 34.3 13,272 2 - - 34.3
Maybank 9 3.9 2,049 19 9 7.4 -3.5 Citigroup Inc 9 4.6 1,760 4 15 2.5 2.1
Oriental Patron Securities Ltd 10 3.6 1,914 1 - - 3.6 Valence Group LLC/The 10 3.7 1,421 1 - - 3.7
Banco Santander SA 11 3.6 1,904 1 - - 3.6 RBC Capital Markets 10 3.7 1,421 1 24 0.8 2.9
Deloitte Touche Tohmatsu ILA Group Ltd 12 3.4 1,818 1 39 0.4 3.0 Deutsche Bank AG 10 3.7 1,421 1 - - 3.7
Bain & Co Inc 12 3.4 1,818 1 - - 3.4 JPMorgan Chase & Co 13 2.1 802 2 26 0.6 1.5
OC&C Strategy Consultants Ltd 12 3.4 1,818 1 - - 3.4 Nordea Bank AB 14 1.6 604 1 - - 1.6
Arma Partners LLP 12 3.4 1,818 1 - - 3.4 Motilal Oswal Investment Advisors Pvt Ltd 14 1.6 604 1 - - 1.6
ABG Sundal Collier Holding ASA 12 3.4 1,818 1 - - 3.4 Lavin y Cia Enrique y Nelson CBL 16 1.5 593 1 - - 1.5
Bank of America Merrill Lynch 17 2.6 1,403 5 15 4.8 -2.2 Avendus Capital Pvt Ltd 17 1.3 492 11 25 0.8 0.5
Deutsche Bank AG 18 2.5 1,311 2 23 2.8 -0.3 JM Financial Ltd 18 1.2 475 3 1 15.2 -13.9
Rothschild & Co 19 1.7 900 2 14 5.0 -3.3 Ernst & Young 19 1.1 425 6 17 1.9 -0.8
Goldman Sachs & Co LLC 20 1.6 865 7 1 25.5 -23.8 Jefferies LLC 20 1.0 387 2 22 1.1 -0.1
TOTAL 53,058 1,093 TOTAL 38,646 789
RANK
MKT SHR
(%)FIRM
2017 2016MKT SHR
CHANGE FIRM
2017 2016
RANK
MKT SHR
(%)VOLUME USD
(Mln)
DEAL
COUNT RANK
MKT SHR
(%) RANK
MKT SHR
(%)VOLUME USD
(Mln)
FIRM
2017 2016MKT SHR
CHANGE FIRM
2017 2016MKT SHR
CHANGERANK
MKT SHR
(%)VOLUME USD
(Mln)
DEAL
COUNT RANK
MKT SHR
(%) RANK
MKT SHR
(%)VOLUME USD
(Mln)
DEAL
COUNT RANK
MKT SHR
(%)
59,048 19,930
82,690 30,883
MKT SHR
CHANGE
DEAL
COUNT
15

Bloomberg League Criteria
Announced Global League Tables are based upon announced total values, unless otherwise stated in the title. Non-US dollar values are converted to US dollars at the time of announcement.
Credit will be given to transactions in which Bloomberg classifies as mergers, acquisitions, divestitures, self-tenders, or spin-offs.
Regional and industry League Tables will be based on the country of risk and industry of the ultimate publicly traded parent of a privately held company where applicable.
Advisors to any member of an investor group, consortium, or joint venture are eligible for full credit.
Advisory fees hold no weight over advisory credit.
General Database Criteria
A transaction is considered to have been announced upon the release of terms offered by the acquirer, and acknowledgement of the offer by the target company.
Deals that are considered to be in proposed status will not be granted credit.
Full versions of Bloomberg’s League Tables Standards & Guidelines can be accessed on Bloomberg Professional:
{LPHP MA:0:1 2841628<GO>}.
Bloomberg L.P. reserves the right of final decision concerning league eligibility and requires adequate documentation for the same. Bloomberg L.P. and its suppliers believe the information herein was obtained from reliable sources, but they do not guarantee its accuracy. Neither the information nor the opinion expressed constitutes a solicitation of the purchase or sale of securities or commodities. Due to the dynamic nature of the Professional Service product, League Table rankings may vary between the quarterly/year-end publications and data found on the Bloomberg Professional Service.
16